
UNITED STATES
SECURITIES AND EXCHANGE COMMISSION
Washington, D.C. 20549
FORM 10-K
(Mark One)
☒ ANNUAL REPORT PURSUANT TO SECTION 13 OR 15(d) OF THE SECURITIES EXCHANGE ACT OF 1934
For the fiscal year ended December 31, 20172019
Oror
☐ TRANSITION REPORT PURSUANT TO SECTION 13 OR 15(d) OF THE SECURITIES EXCHANGE
ACT OF 1934
For the transition period from to
Commission File Number: 000-02040
CARBON NATURAL GAS COMPANYENERGY CORPORATION
(Exact Name of Registrant as Specified in Its Charter)
| State of incorporation:Delaware | I.R.S. Employer Identification No.26-0818050 | |
| 1700 Broadway, Suite 1170, Denver, Colorado | 80290 | |
| (Address of Principal Executive Offices) | (Zip Code) |
Registrant’s telephone number, including area code:(720) 407-7030
Securities registered pursuant to Section 12(b) of the Act:None
| Title of each class | Trading symbol(s) | Name of each exchange on which registered | ||
| None |
Securities registered pursuant to Section 12(g) of the Act:
Common Stock, Par Value $0.01 Per Share
(Title of Class)
Indicate by check mark if the registrant is a well-known seasoned issuer, as defined in Rule 405 of the Securities Act. Yes ☐ No ☒
Indicate by check mark if the registrant is not required to file reports pursuant to Section 13 or Section 15(d) of the Act. Yes ☐ No ☒
Indicate by check mark whether the registrant (1) has filed all reports required to be filed by Section 13 or 15(d) of the Securities Exchange Act of 1934 during the preceding 12 months (or for such shorter period that the registrant was required to file such reports), and (2) has been subject to such filing requirements for the past 90 days. Yes ☒ No ☐
Indicate by check mark whether the registrant has submitted electronically and posted on its corporate Web site, if any, every Interactive Data File required to be submitted and posted pursuant to Rule 405 of Regulation S-T (§232.405 of this chapter) during the preceding 12 months (or for such shorter period that the registrant was required to submit and post such files). Yes ☒ No ☐
Indicate by check mark if disclosure of delinquent filers pursuant to Item 405 of Regulation S-K (§229.405 of this chapter) is not contained herein, and will not be contained, to the best of registrant’s knowledge, in definitive proxy or information statements incorporated by reference in Part III of this Form 10-K or any amendment to this Form 10-K. ☐
Indicate by check mark whether the registrant is a large accelerated filer, an accelerated filer, a non-accelerated filer, a smaller reporting company, or an emerging growth company. See the definitions of “large accelerated filer,” “accelerated filer,” “smaller reporting company,” and “emerging growth company” in Rule 12b-2 of the Exchange Act.
| Large accelerated filer | ☐ | Accelerated filer | ☐ |
| Non-accelerated filer | Smaller reporting company | ☒ | |
| Emerging growth company | ☐ | ||
If an emerging growth company, indicate by check mark if the registrant has elected not to use the extended transition period for complying with any new or revised financial accounting standards provided pursuant to Section 13(a) of the Exchange Act. ☐
Indicate by check mark whether the registrant is a shell company (as defined in Rule 12b-2 of the Act). Yes ☐ No ☒
The aggregate market value of the registrant’s voting and non-voting common stock held by non-affiliates of the registrant asof June 30, 2017,28, 2019, the last business day of the registrant’s most recently completed second fiscal quarter, was $10.0approximately $19.2 million (based on the closing price of such common stock of $10.50$8.00 as reported on otcmarkets.com on such date).
As ofMarch 23, 2018, there were 7,533,411 issued and outstanding16, 2020, the registrant had 7,816,420 shares of the Company’s common stock $0.01 par value.outstanding.
Documents incorporated by reference: None
Certain information required by Part III of Form 10-K is incorporated by reference to the Registrant’s definitive information statement for the 2020 Annual Meeting of Stockholders, which will be filed within 120 days of December 31, 2019.
CARBON NATURAL GAS COMPANYENERGY CORPORATION
TABLE OF CONTENTS
i
Forward-Looking Statements
The information in this Annual Report on Form 10-K includes “forward-looking statements” within the meaning of Section 27A of the Securities Act of 1933, as amended (the “1933 Act”“Securities Act”), and Section 21E of the Securities Exchange Act of 1934, as amended (the “1934 Act”“Exchange Act”). Forward-looking statements are statements other than statements of historical or present facts, that address activities, events, outcomes, and other matters that Carbonthe Company (as defined herein) plans, expects, intends, assumes, believes, budgets, predicts, forecasts, projects, estimates, or anticipates (and other similar expressions) will, should, or may occur in the future. Generally, the words “expects,” “anticipates,” “targets,” “goals,” “projects,” “intends,” “plans,” “believes,” “seeks,” “estimates,” “may,” “will,” “could,” “should,” “future,” “potential,” “continue,” variations of such words, and similar expressions identify forward-looking statements. These forward-looking statements are based on our current expectations and assumptions about future events and are based on currently available information as to the outcome and timing of future events.
These forward-looking statements appear in a number ofseveral places in this Annual Report on Form 10-K and include statements with respect to, among other things:
| ● | estimates of our oil, natural gas liquids, and natural gas reserves; |
| ● | estimates of our future oil, natural gas liquids, and natural gas production, including estimates of any increases or decreases in our production; |
| ● | our future financial condition and results of operations; |
| ● | our future revenues, cash flows, and expenses; |
| ● | our access to capital and our anticipated liquidity; |
| ● | our future business strategy and other plans and objectives for future operations and acquisitions; |
| ● | our outlook on oil, natural gas liquids, and natural gas prices; |
| ● | the amount, nature, and timing of future capital expenditures, including future development costs; |
| ● | our ability to access the capital markets to fund capital and other expenditures; |
| ● | our assessment of our counterparty risk and the ability of our counterparties to perform their future obligations; and |
| ● | the impact of federal, state and local political, regulatory, and environmental developments in the United |
We believe the expectations and forecasts reflected in our forward-looking statements are reasonable, but we can give no assurance that they will prove to be correct. We caution you that these forward-looking statements can be affected by inaccurate assumptions and are subject to all of the risks and uncertainties, most of which are difficult to predict and many of which are beyond our control, incident to the exploration for and development, production, and sale of oil, natural gas and natural gas.gas liquids. SeePart I, Item 1 —-“Business—CompetitionBusiness-Competition” and —“- “Business—RegulationBusiness-Regulation,” as well asPart I, Item 1A—1A -" “Risk Factors,” andPart II, Item 7—7 -" “Management'sManagement’s Discussion and Analysis of Financial Condition and Results of Operations-Liquidity and Capital Resources” for a description of various, but by no means all, factors that could materially affect our ability to achieve the anticipated results described in the forward-looking statements.
We caution you not to place undue reliance on these forward-looking statements, which speak only as of the date of this report, and we undertake no obligation to update this information to reflect events or circumstances after the filing of this report with the Securities and Exchange Commission (“SEC”), except as required by law. All forward-looking statements, expressed or implied, included in this Annual Report on Form 10-K and attributable to us are expressly qualified in their entirety by this cautionary statement. This cautionary statement should also be considered in connection with any subsequent written or oral forward-looking statements that we may make or persons acting on our behalf may issue.
ii
Throughout this Annual Report on Form 10-K, we use the terms “Carbon,” “Company,” “we,” “our,” and “us” to refer to Carbon Natural Gas CompanyEnergy Corporation and our wholly-owned and majority-owned subsidiaries. Additionally, we refer to Carbon Appalachian Company, LLC as “Carbon Appalachia” and Carbon California Company, LLC as “Carbon California,” and we refer to Carbon Appalachia and Carbon California, togetherwith our proportionate share of 53.92%, as our “equity investees.“majority-owned subsidiary.” We refer to Carbon Appalachian Company, LLC as “Carbon Appalachia”. In the following discussion, we make statements that may be deemed “forward-looking” statements within the meaning of Section 27A of the Securities Act, of 1933, as amended (the “Securities Act”), and Section 21E of the Securities Exchange Act of 1934, as amended (the “Exchange Act”).Act. See “Forward-Looking Statements,” above, for more details. We also use a number of terms used in the oil and gas industry. See “Glossary of Oil and Gas Terms” for the definition of certain terms.
Item 1. Business.Items 1 and 2. Business and Properties
GeneralOverview
Carbon Natural Gas Company,Energy Corporation, a Delaware corporation formed in 2007, is an independent oil and natural gas company engaged in the acquisition, exploration, development and production of oil, natural gas and natural gas liquids (“NGLs”) properties located in the United States. We currently develop and operate oil and gas properties in the Appalachian Basin in Kentucky, Ohio, Tennessee, Virginia and West Virginia, andin the Illinois Basin in Illinois and Indiana, and in the Ventura Basin in California through our wholly-owned and majority-owned subsidiaries. We own 100% of the outstanding sharesinterests of Carbon Appalachia, and Nytis Exploration (USA) Inc., a Delaware corporation (“Nytis USA”USA”), which in turn owns 98.1%98.11% of Nytis Exploration Company LLC, a Delaware limited liability company (“Nytis LLC”LLC”). Nytis LLC holds interests in our operating subsidiaries, which include 46 consolidated partnerships and 18 non-consolidated partnerships.
subsidiaries. We also develop and operate oil and gas properties in the Appalachian Basin in Kentucky, Tennessee, Virginia and West Virginia and the Ventura Basin in California through our investments in Carbon Appalachia andown 53.92% of Carbon California respectively.which we consolidate for financial reporting purposes as a majority-owned subsidiary. We focus on conventional and unconventional reservoirs, including shale, tight sands and coalbed methane.
As of December 31, 2017, we held a 17.81% and 27.24% proportionate share of the profits interests of Carbon California and Carbon Appalachia, respectively. This proportionate share amount reflects our aggregated sharing percentage based on all classes of ownership interests held in each equity investee. These proportionate share amounts assume each equity investee is operating as a going concern, and no adjustments have been made that could be required based on priority of units and hurdle rates upon liquidation or distributions.
As of December 31, 2017,2019, directly and through our 53.92% proportionate share in our equity investees,of Carbon California, we own working interests in approximately 7,7007,200 gross wells (6,600 net) and, royalty interests in approximately 6001,100 wells and have leasehold positions in approximately 995,700314,000 net developed acres and approximately 590,6001,257,000 net undeveloped acres.
The chart belowfollowing table shows a summary of reserve and production data as of and for the year ended December 31, 2017 for us and our 17.81% and 27.24% proportionate share in Carbon California and Carbon Appalachia, respectively:2019:
| Estimated Total Proved Reserves | Average Net Daily | Average | ||||||||||||||||||||||
| Oil (MMBbls) | NGLs (MMBbls) | Natural Gas (Bcf) | Total (Bcfe) | Production (Mcfe/D) | Reserve Life (years) | |||||||||||||||||||
| Carbon | 0.9 | - | 78.7 | 84.2 | 14,559 | 17.6 | ||||||||||||||||||
| Carbon Appalachia | 0.1 | - | 90.8 | 91.2 | 13,196 | 20.7 | ||||||||||||||||||
| Carbon California (1) | 1.6 | 0.2 | 3.0 | 14.1 | 5,286 | 30.4 | ||||||||||||||||||
| Total | 2.6 | 0.2 | 172.5 | 189.4 | 33,041 | 21.2 | ||||||||||||||||||
| Estimated Total Proved Reserves(1) | Average Production (Mcfe/D) | Average Reserve Life (years) | ||||||||||||||||||||
| Oil (MMBbls) | NGLs (MMBbls) | Natural Gas (Bcf) | Total (Bcfe) | |||||||||||||||||||
| 17.7 | 1.3 | 450.4 | 564.9 | 68,993 | 22.8 | |||||||||||||||||
| (1) |
An illustrative organizational chart as of December 31, 2017 is below:
Recent DevelopmentsAcquisition Highlights
InvestmentsWe pursue acquisitions for investment which meet our criteria for investment returns, and which are consistent with our field development strategy. The acquisition of properties in Affiliatesour existing operating areas enable us to leverage our cost control abilities, technical expertise and existing land and infrastructure positions. Our acquisition program is focused on acquisitions of properties which have relatively low base decline, field development opportunities and undeveloped acreage.
Carbon Appalachia
Carbon Appalachia was formed in 2016 by us, entities managed by Yorktown Energy Partners XI, L.P. (“Yorktown”), a majority stockholder of ours, and entities managed by Old Ironsides Energy, LLC (“Old Ironsides”), to acquire producing assets in the Appalachian Basin in Kentucky, Tennessee, Virginia and West Virginia. Substantial operations commenced in April 2017. Prior to November 1, 2017, Yorktown held 7.95% of the voting interest and 7.87% of the profits interest in Carbon Appalachia. On November 1, 2017, Yorktown exercised a warrant, pursuant to which Yorktown obtained additional shares of common stock in us in exchange for the transfer and assignment by Yorktown of all of its rights in Carbon Appalachia. Following the exercise of this warrant by Yorktown, we ownowned 26.50% of the voting interest and 27.24% of the profits interest, and Old Ironsides holdsheld the remainder of the interests in Carbon Appalachia.
Carbon Appalachia’s board
On December 31, 2018, we acquired all of directors is composed of four members. We have the right to appoint one member to the board of directors, and Patrick R. McDonald, our Chief Executive Officer, is our designee to the board of directors. We currently serve as the managerClass A Units of Carbon Appalachia and operate its day-to-day administration, pursuantowned by Old Ironsides for a purchase price of $58.2 million, subject to the termspurchase price adjustments (“OIE Membership Acquisition”). As a result of the limited liability company agreementOIE Membership Acquisition, we now own 100% of the voting and profit interests of Carbon Appalachia, along with its direct and indirect subsidiaries. The acquisition was funded with cash, debt and the management services agreement between Carbon Appalachia and us, subjectissuance of notes to certain approval rights held byOld Ironsides. See Note 3 to the board of directors of Carbon Appalachia.consolidated financial statements.
As of December 31, 2017, Carbon Appalachia owns working interests in approximately 4,400 gross well (3,800 net) and has leasehold positions in approximately 804,400 net developed acres and approximately 360,200 net undeveloped acres.
Carbon California
Carbon California was formed in 2016 by us, Yorktown and Prudential Capital Energy Partners, L.P. (“Prudential”), to acquire producing assets in the Ventura Basin in California. Prior to February 1, 2018, we held 17.81% of the voting and profits interests, Yorktown held 38.59% of the voting and profits interests and Prudential held 43.59% of the voting and profits interests in Carbon California. On February 1, 2018, Yorktown exercised a warrant, pursuant to which Yorktown obtained additional shares of common stock in us in exchange for the transfer and assignment by Yorktown of all of its rights in Carbon California. Following the exercise of this warrant by Yorktown, we own 56.41% of the voting and profits interests, and Prudential holds the remainder of the interests, in Carbon California.
Carbon California’s board of directors is composed of five members. We have the right to appoint one member to the board of directors, and Patrick R. McDonald, our Chief Executive Officer, is our designee. We currently serve as the manager of Carbon California and operate its day-to-day administration, pursuant to the terms of the limited liability company agreement of Carbon California and the management services agreement between Carbon California and us, subject to certain approval rights held by the board of directors of Carbon California.
Prior to February 1, 2018, we held 17.81% of the voting and profits interests, Yorktown held 38.59% of the voting and profits interests and Prudential Capital Energy Partners, L.P. held 43.59% of the voting and profits interests in Carbon California. On February 1, 2018, Yorktown exercised a warrant, pursuant to which Yorktown obtained additional shares of common stock in us in exchange for the transfer and assignment by Yorktown of all of its rights in Carbon California (the “California Warrant”). As of December 31, 2017,February 1, 2018, we consolidate Carbon California owns working interests approximately 200 gross wells (200 net) and has leasehold positions in approximately 2,300 net developed acres and approximately 8,000 net undeveloped acres.
Following the transactions described above, Yorktown currently owns 64.6% of the outstanding shares of our common stock.for financial reporting purposes.
Pending and Recent Acquisitions
We, through our equity investees, have made, or entered into definitive agreements to make, numerous acquisitions during 2017. When Carbon Appalachia andIn May 2018, but effective as of October 1, 2017, Carbon California make acquisitions, we contribute our pro rata portion ofacquired 309 operated and one non-operated oil wells covering approximately 6,800 gross acres (6,600 net), and fee interests in and to certain lands, situated in the Ventura Basin, together with associated wells, pipelines, facilities, equipment and other property rights for a purchase price to fund such acquisitions. In 2017 and 2016, we contributed an aggregate of $15.9$43.0 million to Carbon Appalachia, Carbon California and Nytis USA in connection with our and our equity investees’ acquisition activities. While Carbon Appalachia and Carbon California made other insignificant acquisitions that are not specifically listed, the acquisitions described below most meaningfully affect the financial condition of Carbon Appalachia and Carbon California, and, therefore, us. Seefrom Seneca Resources Corporation (the “—Seneca Acquisition and Divestiture Activities” for more information about our acquisitions and divestitures.
Reverse Stock Split
Our shareholders and board of directors approved a reverse stock split of our common stock, effective March 15, 2017, pursuant to which every 20 shares of issued and outstanding common stock became one share of common stock and no fractional shares were issued. All references to the number of shares of common stock and per share amounts give retroactive effect to the reverse stock split for all periods presented. In connection with the reverse stock split, the number of authorized shares of our common stock was decreased from 200,000,000 to 10,000,000.
Preferred Stock Issuance to Yorktown
In connection with the anticipated closing of the 2018 Ventura Acquisition, Yorktown expects to make a contribution to us in an amount equal to our portion of the purchase price forwith the 2018 Ventura Acquisition in exchange for preferred stock in us. The Yorktown contribution is subjectremainder funded by debt. We raised the $5.0 million through the issuance of 50,000 shares of Series B Convertible Preferred Stock, par value $0.01 per share (the “Preferred Stock”), to negotiation and preparation of definitive transaction documents pending closingYorktown.
Following the exercise of the 2018 Ventura Acquisition.California Warrant by Yorktown and the Seneca Acquisition, we own 53.92% of the voting and profits interests and Prudential Legacy Insurance Company of New Jersey and Prudential Insurance Company of America or its affiliates (“Prudential”) owns 46.08% voting and profits interest in Carbon California.
Strategy
We continuously evaluate our portfolio of oil and gas assets and make acquisitions, investments and divestitures as part of our strategic plan. In the current environment, we are actively analyzing options such as selling assets, including potentially our Appalachian business, primarily in order to reduce indebtedness and, to a lesser extent, to fund higher value acquisition or development opportunities. Any decision to divest would be made based upon several criteria, including but not limited to the value we could obtain for such assets, the outlook for commodity prices, our expected return on invested capital and the impact on our overall leverage.
Our primary business objective is to create stockholder value through consistent growth in cash flows, production and reserves through drilling ondevelopment of our existing oil and gas properties and through the acquisition of complementary properties. We focus on the development of our existing leaseholds, which consist primarily of low risk, repeatable resource plays. We invest significantly in technical staff and geological and engineering technology to enhance the value of our properties.
We intend to accomplish our objective by executing the following strategies:
| ● | Capitalize on the development of our oil and gas properties. Our |
| ● | Acquire complementary |
| ● | Reduce operating costs |
| ● | Replace reserves and production through |
Some of our estimated proved reserves and resources are classified as unconventional, including fractured shale formations, tight gas sands, and coalbed methane. Our technical team has significant experience in drilling vertical, horizontal and directional wells, as well as fracture stimulation of unconventional formations.wells. We utilize geological, drilling and completion technologies that enhance the predictability and repeatability of finding and recovering hydrocarbons in these unconventional plays.throughout our asset base.
| ● | Maintain financial flexibility.We expect to fund |
| ● | Acquire and develop reserves |
| ● | Control operating decisions and capital program. At December 31, |
| ● | Manage commodity price exposure through an active hedging program. We maintain a hedging program designed to reduce exposure to fluctuations in commodity prices. |
In addition to our hedging program, we also maintain active hedging programs at Carbon California and Carbon Appalachia.
| ● | Manage midstream assets, storage facilities and |
Operational Areas
Our oilAppalachian and gas properties and those of our equity investees are located in the Appalachia, Illinois and Ventura Basins.
Appalachian BasinBasins
As of December 31, 2017,2019, we directly own working interests in approximately 3,0006,650 gross wells (2,600(6,070 net) and royalty interests located in Illinois, Indiana, Kentucky, Ohio, Tennessee, Virginia and West Virginia, and have leasehold positions in approximately 189,000304,700 net developed acres and approximately 222,4001,249,000 net undeveloped acres. As of December 31, 2017, net production was approximately 13,100 Mcfe per day. These interests are located in the Berea Sandstone, Devonian Shale, Seelyville Coal Seam and Lower Huron Shale formations and other zones which produce oil and natural gas.
As of December 31, 2017, Carbon Appalachia owns working interests in approximately 4,400 gross wells (3,800 net) located in Kentucky, Tennessee, Virginia and West Virginia, and has leasehold positions in approximately 804,400 net developed acres and approximately 360,200 net undeveloped acres. As of December 31, 2017, net oil and natural gas sales were approximately 12,100 Mcfe per day. These interests are located in the Devonian Shale, Chattanooga Shale, Lower Huron Shale, Monteagle and Big Line formations and other zones which produce oil and natural gas.
The chart below showsfollowing table is a summary of our and our 27.24% proportionate share in Carbon Appalachia’s reserve and production data in the Appalachian Basinand Illinois Basins as of and for the year ended December 31, 2017:2019:
| Estimated Total Proved Reserves | Average Net Daily | Average | ||||||||||||||||||
| Oil (MMBbls) | Natural Gas (Bcf) | Total (Bcfe) | Production (Mcfe/D) | Reserve Life (years) | ||||||||||||||||
| Carbon | 0.9 | 78.7 | 84.2 | 14,559 | 17.6 | |||||||||||||||
| Carbon Appalachia | 0.1 | 90.8 | 91.2 | 13,196 | 20.7 | |||||||||||||||
| Total | 1.0 | 169.5 | 175.4 | 27,755 | 20.0 | |||||||||||||||
| Estimated Total Proved Reserves | Average Net Daily | Average | ||||||||||||||||
| Oil (MMBbls) | Natural Gas (Bcf) | Total (Bcfe) | Production (Mcfe/D) | Reserve Life (years) | ||||||||||||||
| 1.2 | 430.3 | 437.8 | 59,399 | 20.7 | ||||||||||||||
Ventura Basin
As of December 31, 2017,2019, Carbon California owns working interests in approximately 200550 gross wells (200(530 net) located in the Ventura Basin of California and has leasehold positions in approximately 2,3009,200 net developed acres and approximately 8,0007,900 net undeveloped acres. As of December 31, 2017, net oil and natural gas sales were approximately 7,100 Mcfe per day. These interests are located in the Miocene-Age formation and other zones which produce oil and natural gas.
The chart below showsfollowing table is a summary of our 17.81% proportionate share in Carbon California’s reserve and production data in the Ventura Basin as of and for the year ended December 31, 2017:
| Estimated Total Proved Reserves | Average Net Daily | Average | ||||||||||||||||||||||
| Oil (MMBbls) | NGLs (MMBbls) | Natural Gas (Bcf) | Total (Bcfe) | Production (Mcfe/D) | Reserve Life (years) | |||||||||||||||||||
| Carbon California (1) | 1.6 | 0.2 | 3.0 | 14.1 | 941 | 30.4 | ||||||||||||||||||
Illinois Basin
As of December 31, 2017, we directly own working interests in 58 gross (29 net) coalbed methane wells in the Illinois Basin and have a leasehold position in approximately 1,900 net developed acres and approximately 58,000 net undeveloped acres. As of December 31, 2017, net natural gas sales were approximately 500 Mcf per day. These interests are located in the Seelyville Coal Seam formation and other zones which produce oil and natural gas.2019:
The chart below shows a summary of our reserve and production data in the Illinois Basin as of and for the year ended December 31, 2017:
| Estimated Total Proved Reserves | Average Net Daily | Average | ||||||||||||||||||
| Oil (MMBbls) | Natural Gas (Bcf) | Total (Bcfe) | Production (Mcfe/D) | Reserve Life (years) | ||||||||||||||||
| Carbon | - | 0.4 | 0.4 | 465 | 3 | |||||||||||||||
| Estimated Total Proved Reserves(1) | Average Net Daily | Average | ||||||||||||||||||||
| Oil (MMBbls) | NGLs (MMBbls) | Natural Gas (Bcf) | Total (Bcfe) | Production (Mcfe/D) | Reserve Life (years) | |||||||||||||||||
| 16.5 | 1.3 | 20.1 | 127.1 | 9,594 | 35.3 | |||||||||||||||||
Acquisition and Divestiture Activities
We pursue acquisitions for investment by us or our equity investees which meet our criteria for investment returns and which are consistent with our field development strategy. The acquisition of properties in our or our equity investees’ existing operating areas enable us to leverage our cost control abilities, technical expertise and existing land and infrastructure positions. Our acquisition program is focused on acquisitions of properties which have relatively low base decline, preferable field development opportunities and undeveloped acreage. The following is a summary of our acquisitions and divestitures for 2017 and 2016. See “Management’s Discussion and Analysis of Financial Condition and Results of Operations” and Note 4 to the consolidated financial statements for more information on our acquisitions.
Acquisitions – Appalachian Basin
Cabot Acquisition. On September 29, 2017, but effective April 1, 2017 for oil and gas properties and September 29, 2017 for the corporate entity, a wholly-owned subsidiary of Carbon Appalachia completed the acquisition of natural gas producing properties, including associated mineral interests, certain gathering system assets, associated vehicles and equipment, and all of the outstanding shares of Cranberry Pipeline, which operates certain pipeline assets, located predominantly in the state of West Virginia from Cabot Oil & Gas Corporation. The purchase price was $41.3 million, subject to normal and customary adjustments. We contributed approximately $2.9 million to Carbon Appalachia to fund this acquisition. The acquired assets consisted of the following:
Enervest Acquisition. On August 15, 2017, but effective as of May 1, 2017, a wholly-owned subsidiary of Carbon Appalachia completed the acquisition of natural gas producing properties, the associated mineral interests, gas wells and associated facilities and vehicles and equipment located predominantly in the state of West Virginia from Enervest Energy Institutional Fund XII-A, L.P., Enervest Energy Institutional Fund XII-WIB, L.P., Enervest Energy Institutional Fund XII-WIC, L.P. and Enervest Operating, L.L.C. The purchase price was $21.5 million, subject to normal and customary adjustments. We contributed approximately $3.7 million to Carbon Appalachia to fund this acquisition. The acquired assets consisted of the following:
CNX Acquisition. On April 3, 2017, but effective as of February 1, 2017 for oil and gas properties and April 3, 2017 for the corporate entity, a wholly-owned subsidiary of Carbon Appalachia completed the acquisition of all of the issued and outstanding shares of Coalfield Pipeline and all of the membership interest in Knox Energy from CNX Gas Company, LLC. Coalfield Pipeline and Knox Energy own producing assets in Tennessee. The purchase price for the acquired assets was $20.0 million. We contributed approximately $0.2 million to Carbon Appalachia to fund this acquisition. The acquired assets consisted of the following:Commodity Price Risk Management
EXCO Acquisition. In October 2016, Nytis LLC completed an acquisition consisting of producing natural gas wells and natural gas gathering facilities. The purchase price for the acquired assets was $9.0 million, subject to customary closing adjustments, plus certain assumed obligations, from Exco Production Company (WV), LLC, BG Production Company (WV), LLC and Exco Resources (PA) LLC (the “EXCO Acquisition”). We contributed approximately $9.0 million to Nytis USA for it to fund its portion of the purchase price to Nytis LLC to fund this acquisition. The acquired assets consisted of the following:
Acquisitions – Ventura Basin
2018 Ventura Acquisition. On October 20, 2017, Carbon California entered into a Purchase and Sale Agreement to acquire operated and non-operated oil and gas leases covering lands, and fee interests in and to certain lands situated in the Ventura Basin, together with associated wells, pipelines, facilities, equipment and other property rights. The purchase price is $42.0 million, subject to customary and standard purchase price adjustments. We expect to contribute approximately $5.0 million to Carbon California to fund our portion of the purchase price, which amount Yorktown will contribute to us in exchange for preferred stock in us. The remainder of the purchase price is expected to be funded with contributions from other equity members and debt. The transaction is expected to close on May 1, 2018, subject to negotiation and preparation of definitive transaction documents and other customary closing conditions.
Mirada Acquisition.On February 15, 2017, but effective as of January 1, 2017, Carbon California completed the acquisition of oil and gas leases, the associated mineral interests and gas wells and vehicles and equipment from Mirada Petroleum, Inc. The purchase price was $4.5 million. We were not required to contribute any cash to Carbon California to fund this acquisition. The acquired assets consisted of the following:
CRC Acquisition.On February 15, 2017 Carbon California also completed the acquisition of oil and gas leases, the associated mineral interests, oil and gas wells and associated facilities, a field office building, land and vehicles and equipment from California Resources Petroleum Corporation and California Resources Production Corporation. The purchase price was $34.0 million. We were not required to contribute any cash to Carbon California to fund this acquisition. The acquired assets consisted of the following:
Equity Investments in Affiliates
Carbon Appalachia
Our Carbon Appalachia Ownership Interests
We own 26.50% of the voting interest and 27.24% of the profits interest in Carbon Appalachia through our ownership of Class A Units and Class C Units in Carbon Appalachia. In addition, we own 100% of the Class B Units in Carbon Appalachia, which do not currently participate in distributions from Carbon Appalachia. Pursuant to the terms of the Amended and Restated Limited Liability Company Agreement of Carbon Appalachia, once the holders of the Class A Units have received a full return of their aggregate capital contributions plus an internal rate of return of 10%, the Class B Units begin participating in distributions from Carbon Appalachia, with 80% of distributions allocated to the holders of the Class A Units and Class C Units and 20% of the distributions allocated to the holders of Class B Units. Carbon Appalachia does not currently pay distributions to its members, including us.
Carbon Appalachia Credit Facility
In connection and concurrently with the CNX Acquisition, Carbon Appalachia Enterprises, LLC, a Delaware limited liability company and indirect subsidiary of Carbon Appalachia (“Carbon Appalachia Enterprises”), entered into a 4-year $100.0 million senior secured asset-based revolving credit facility with LegacyTexas Bank, which has been used to partially fund each of Carbon Appalachia’s acquisitions. The current borrowing base under the credit facility is $50.0 million. We are not a guarantor of this credit facility. As of December 31, 2017, there was approximately $38.0 million outstanding under the credit facility. The ability of Carbon Appalachia to make distributions to its owners, including us, is dependent upon the terms of Carbon Appalachia Enterprises’ credit facility, which currently prohibits distributions unless they are agreed to by the lender. See Note 5 to the Carbon Appalachia consolidated financial statements.
Carbon Appalachia Accounting Treatment
Based on our ownership of 26.50% of the voting interest and 27.24% of the profits interest, our ability to appoint a member to the board of directors and our role as manager of Carbon Appalachia, we account for our investment in Carbon Appalachia under the equity method of accounting as we believe we can exert significant influence on Carbon Appalachia. We use the hypothetical liquidation at book value (“HLBV”) method to determine our share of profits or losses in Carbon Appalachia and adjust the carrying value of our investment accordingly. The HLBV method is a balance-sheet approach that calculates the amount each member of an entity would receive if the entity were liquidated at book value at the end of each measurement period. The change in the allocated amount to each member during the period represents the income or loss allocated to that member. From the commencement of operations on April 3, 2017 through December 31, 2017, Carbon Appalachia generated net income, of which our share is approximately $1.1 million.
Carbon California
Our Carbon California Ownership Interests
As of December 31, 2017, we own 17.81% of the voting and profits interests in Carbon California through our ownership of Class A Units and Class B Units in Carbon California. The Class A Units and Class B Units participate pro rata in distributions from Carbon California.Carbon California does not currently pay distributions to its members, including us.
Carbon California Senior Revolving Notes and Subordinated Notes
In connection with the CRC Acquisition, Carbon California (i) entered into a Note Purchase Agreement (the “Note Purchase Agreement”) for the issuance and sale of Senior Secured Revolving Notes to Prudential Legacy Insurance Company of New Jersey and Prudential Insurance Company of America with a revolving borrowing capacity of $25.0 million (the “Senior Revolving Notes”) which mature on February 15, 2022 and (ii) entered into a Securities Purchase Agreement (the “Securities Purchase Agreement”) with Prudential for the issuance and sale of $10.0 million of Senior Subordinated Notes (the “Subordinated Notes”) due February 15, 2024. We are not a guarantor of the Senior Revolving Notes or the Subordinated Notes. The closing of the Note Purchase Agreement and the Securities Purchase Agreement on February 15, 2017, resulted in the sale and issuance by Carbon California of (i) Senior Revolving Notes in the principal amount of $10.0 million and (ii) Subordinated Notes in the original principal amount of $10.0 million. The maximum principal amount available under the Senior Revolving Notes is based upon the borrowing base attributable to Carbon California’s proved oil and gas reserves which is to be determined at least semi-annually. The current borrowing base is $15.0 million, of which $11.0 million is outstanding as of December 31, 2017. The ability of Carbon California to make distributions to its owners, including us, is dependent upon the terms of the Note Purchase Agreement and Securities Purchase Agreement, which currently prohibit distributions unless they are agreed to by Prudential Legacy Insurance Company of New Jersey and Prudential Insurance Company of America.
Borrowings under the Senior Revolving Notes and net proceeds from the Subordinated Notes issuances were used to fund the Mirada Acquisition and the CRC Acquisition. Additional borrowings from the Senior Revolving Notes may be used to fund field development projects and to fund future complementary acquisitions and for general working capital purposes of Carbon California. See Note 5 to the Carbon California financial statements.
As of December 31, 2017, Carbon California was in breach of its covenants; however, it obtained a waiver for the December 31, 2017 and March 31, 2018 covenants. It is anticipated that covenants will be met in the future. SeeLiquidity and Management’s Plans within Note 1 to the Carbon California financial statements.
Carbon California Accounting Treatment
Based on our ownership of 17.81% of the voting and profits interests as of December 31, 2017, our ability to appoint a member to the board of directors and our role of manager of Carbon California, we account for our investment in Carbon California under the equity method of accounting as we believe we can exert significant influence. We use the HLBV method to determine our share of profits or losses in Carbon California and adjust the carrying value of our investment accordingly. From February 15, 2017 (inception) through December 31, 2017, Carbon California incurred a net loss, of which our share (as a holder of Class B units for that period) is zero. Should Carbon California generate net income in future periods, we will not record income (or losses) until our share of such income exceeds the amount of our share of losses not previously reported.
Crawford County Gas Gathering Company
We have a 50% interest in Crawford County Gas Gathering Company, LLC (“CCGGC”) which owns and operates pipelines and related gathering and treatment facilities which service our natural gas production in the Illinois Basin. We account for our investment in CCGGC under the equity method of accounting, and our share of income or loss is recognized in our consolidated statement of operations. During the twelve months ended December 31, 2017 and 2016, we recorded equity method income of approximately $37,000 and equity method loss of approximately $17,000, respectively, related to this investment. In addition, during the years ended December 31, 2017 and 2016, we received cash distributions from CCGGC of approximately $68,000 and $340,000, respectively.
Risk Management
We and our equity investees hedge a portion of forecasted oil and gas production to reduce exposure to fluctuations in the prices of oil and natural gas and provide long-term cash flow predictability to pay dividends or distributions, respectively, service debt and manage our and their businesses.predictability. By removing a portion of the price volatility associated with future production, we and our equity investees expect to mitigate, but not eliminate, the potential effects of variability in cash flow from operations due to adverse fluctuations in commodity prices.
While there are many different types of derivatives available, we and our equity investeesWe generally utilize swaps and collars designed to manage price risk more effectively.
The following tables reflect our and our equity investees’ outstanding derivative hedges as of December 31, 2017:
��
Carbon Natural Gas Company
| Natural Gas Swaps | Natural Gas Collars | Oil Swaps | ||||||||||||||||||||||
| Weighted | Weighted | Weighted | ||||||||||||||||||||||
| Average | Average Price | Average | ||||||||||||||||||||||
| Year | MMBtu | Price (a) | MMBtu | Range (a) | Bbl | Price (b) | ||||||||||||||||||
| 2018 | 3,390,000 | $ | 3.01 | 90,000 | $3.00 - $3.48 | 63,000 | $ | 53.55 | ||||||||||||||||
| 2019 | 2,596,000 | $ | 2.86 | - | - | 48,000 | $ | 53.76 | ||||||||||||||||
Carbon Appalachia(1)
| Natural Gas Swaps | Natural Gas Collars | Oil Swaps | ||||||||||||||||||||||
| Weighted | Weighted | Weighted | ||||||||||||||||||||||
| Average | Average Price | Average | ||||||||||||||||||||||
| Year | MMBtu | Price (a) | MMBtu | Range (a) | Bbl | Price (b) | ||||||||||||||||||
| 2018 | 9,100,000 | $ | 2.99 | 3,630,000 | $2.96 - $3.85 | 15,000 | $ | 51.74 | ||||||||||||||||
| 2019 | 11,515,000 | $ | 2.86 | 960,000 | $2.85 - $3.19 | 12,000 | $ | 50.35 | ||||||||||||||||
| 2020 | 3,792,000 | $ | 2.83 | - | - | - | $ | - | ||||||||||||||||
Carbon California(1)
| Natural Gas Swaps | Natural Gas Collars | Oil Swaps | ||||||||||||||||||||||
| Weighted | Weighted | Weighted | ||||||||||||||||||||||
| Average | Average Price | Average | ||||||||||||||||||||||
| Year | MMBtu | Price (a) | MMBtu | Range (a) | Bbl | Price (b) | ||||||||||||||||||
| 2018 | 360,000 | $ | 3.03 | - | - | 149,247 | $ | 53.12 | ||||||||||||||||
| 2019 | - | - | 360,000 | $2.60 - $3.03 | 139,797 | $ | 51.96 | |||||||||||||||||
| 2020 | - | - | - | - | 73,147 | $ | 50.12 | |||||||||||||||||
Reserves
The tables below summarize our estimated proved oil and gas reserves and the estimated proved oil and gas reserves of our equity investees as of December 31, 2017. Our estimated proved reserves increased in 2017 primarily due to revisions of previous estimates.risk.
Carbon Natural Gas CompanyReserves
The following table summarizes our estimated quantities of proved reserves as of December 31, 20172019 and 2016 after consolidating the 46 partnerships in which we have a controlling interest through our subsidiaries.2018, inclusive of all non-controlling interests:
Carbon Natural Gas CompanyEnergy Corporation
Estimated Consolidated Proved Reserves
Including Non-Controlling Interests of Consolidated Partnerships
| December 31, | December 31, | |||||||||||||||
| 2017 | 2016 | 2019 | 2018 | |||||||||||||
| Proved developed reserves: | ||||||||||||||||
| Natural gas (MMcf) | 81,702 | 74,265 | 444,104 | 450,424 | ||||||||||||
| Oil and liquids (MBbl) | 903 | 851 | 13,908 | 15,808 | ||||||||||||
| Total proved developed reserves (MMcfe) | 87,120 | 79,371 | 527,555 | 545,272 | ||||||||||||
| Proved undeveloped reserves: | ||||||||||||||||
| Natural gas (MMcf) | - | - | 6,261 | 4,976 | ||||||||||||
| Oil and liquids (MBbl) | 16 | 31 | 5,180 | 5,013 | ||||||||||||
| Total proved undeveloped reserves (MMcfe) | 96 | 186 | 37,338 | 35,054 | ||||||||||||
| Total proved reserves (MMcfe) | 87,216 | 79,557 | 564,893 | 580,326 | ||||||||||||
| Percent developed | 99.9 | % | 99.8 | % | 93.4 | % | 94.0 | % | ||||||||
| Average natural gas price used (per Mcf) | $ | 2.93 | $ | 2.41 | $ | 2.58 | $ | 3.24 | ||||||||
| Average oil and liquids price used (per Bbl) | $ | 48.94 | $ | 40.40 | $ | 55.69 | $ | 69.20 | ||||||||
The estimated quantities of proved developed reserves for the non-controlling interest of Carbon California as of December 31, 2019 and 2018 are approximately 58.6 Bcfe and 47.8 Bcfe, respectively, which is approximately 10.4% and 8.2%, respectively, of total consolidated proved reserves. The estimated quantities of proved undeveloped reserves for the non-controlling interest of Carbon California as of December 31, 2019 and 2018 are approximately 17.2 Bcfe and 16.2 Bcfe, respectively, which is approximately 3.1% and 2.8%, respectively, of total consolidated proved reserves.
The estimated quantities of proved developed reserves for the non-controlling interests of the consolidated partnerships (not including Carbon California) as of December 31, 20172019 and 2018 are approximately 3.03.4 Bcfe and 3.3 Bcfe, respectively, which is approximately 3%1.0% of total consolidated proved reserves. There were no proved undeveloped reserves associated with the non-controlling interests of the consolidated partnerships (not including Carbon California) as of December 31, 2019 and 2018.
The following table summarizes our estimated quantities of proved reserves, excluding the non-controlling interests, of the consolidated partnerships, as of December 31, 20172019 and 2016.2018:
Carbon Natural Gas CompanyEnergy Corporation
Estimated Consolidated Proved Reserves
Excluding Non-Controlling Interests of Consolidated Partnerships
| December 31, | ||||||||
| 2017 | 2016 | |||||||
| Proved developed reserves: | ||||||||
| Natural gas (MMcf) | 78,665 | 71,125 | ||||||
| Oil and liquids (MBbl) | 903 | 851 | ||||||
| Total proved developed reserves (MMcfe) | 84,802 | 76,231 | ||||||
| Proved undeveloped reserves: | ||||||||
| Natural gas (MMcf) | - | - | ||||||
| Oil and liquids (MBbl) | 16 | 31 | ||||||
| Total proved undeveloped reserves (MMcfe) | 94 | 186 | ||||||
| Total proved reserves (MMcfe) | 84,176 | 76,417 | ||||||
| Percent developed | 99.9 | % | 99.7 | % | ||||
| Average natural gas price used (per Mcf) | $ | 2.93 | $ | 2.41 | ||||
| Average oil and liquids price used (per Bbl) | $ | 48.94 | $ | 40.40 | ||||
| December 31, | ||||||||
| 2019 | 2018 | |||||||
| Proved developed reserves: | ||||||||
| Natural gas (MMcf) | 431,498 | 439,234 | ||||||
| Oil and liquids (MBbl) | 5,687 | 9,161 | ||||||
| Total proved developed reserves (MMcfe) | 465,618 | 494,199 | ||||||
| Proved undeveloped reserves: | ||||||||
| Natural gas (MMcf) | 3,376 | 2,684 | ||||||
| Oil and liquids (MBbl) | 2,793 | 2,703 | ||||||
| Total proved undeveloped reserves (MMcfe) | 20,133 | 18,901 | ||||||
| Total proved reserves (MMcfe) | 485,751 | 513,100 | ||||||
| Percent developed | 95.9 | % | 96.3 | % | ||||
| Average natural gas price used (per Mcf) | $ | 2.58 | $ | 3.24 | ||||
| Average oil and liquids price used (per Bbl) | $ | 55.69 | $ | 69.20 | ||||
The following table shows a summary of the changes in quantities of our estimated proved oil and gas reserves for the year ended December 31, 2017.2019:
| 2017 | ||||||||||||||||||||||||
| Oil | Natural Gas | Total | Oil & Liquids | Natural Gas | Total | |||||||||||||||||||
| MBbls | MMcf | MMcfe | MBbls | MMcf | MMcfe | |||||||||||||||||||
| Proved reserves, beginning of year | 882 | 74,265 | 79,557 | 20,821 | 455,400 | 580,326 | ||||||||||||||||||
| Revisions of previous estimates | 107 | 12,195 | 12,835 | (1,713 | ) | 69,295 | 59,019 | |||||||||||||||||
| Extensions and discoveries | 16 | 138 | 232 | 2,194 | 22,218 | 35,380 | ||||||||||||||||||
| Production | (86 | ) | (4,896 | ) | (5,414 | ) | (625 | ) | (21,436 | ) | (25,182 | ) | ||||||||||||
| Purchases of reserves in-place | - | - | - | |||||||||||||||||||||
| Demotions from proved | (1,544 | ) | (63,980 | ) | (73,247 | ) | ||||||||||||||||||
| Sales of reserves in-place | - | - | - | (45 | ) | (11,132 | ) | (11,403 | ) | |||||||||||||||
| Proved reserves, end of year | 919 | 81,702 | 87,210 | 19,088 | 450,365 | 564,893 | ||||||||||||||||||
Carbon Appalachia
The following table summarizes Carbon Appalachia’s estimated quantities of proved reserves and our 27.24% proportionate share in Carbon Appalachia’s estimated quantities of proved reserves as of December 31, 2017.
Carbon Appalachia
Estimated Proved Reserves
| December 31, 2017 | ||||||||
| Carbon Appalachia | Carbon’s Share | |||||||
| Proved developed reserves: | ||||||||
| Natural gas (MMcf) | 333,175 | 90,757 | ||||||
| Oil and liquids (MBbl) | 264 | 72 | ||||||
| Total proved developed reserves (MMcfe) | 334,759 | 91,189 | ||||||
| Proved undeveloped reserves: | ||||||||
| Natural gas (MMcf) | - | - | ||||||
| Oil and liquids (MBbl) | - | - | ||||||
| Total proved undeveloped reserves (MMcfe) | - | - | ||||||
| Total proved reserves (MMcfe) | 334,759 | 91,189 | ||||||
| Percent developed | 100 | % | 100 | % | ||||
| Average natural gas price used (per Mcf) | $ | 2.96 | $ | 2.96 | ||||
| Average oil and liquids price used (per Bbl) | $ | 48.60 | $ | 48.60 | ||||
The following table shows a summary of the changes in quantities of estimated proved oil and gas reserves for the period from April 3, 2017 (inception) through December 31, 2017.
| 2017 | ||||||||||||
| Oil | Natural Gas | Total | ||||||||||
| MBbls | MMcf | MMcfe | ||||||||||
| Proved reserves, inception | - | - | - | |||||||||
| Purchases of reserves in-place (1) | 278 | 338,479 | 340,147 | |||||||||
| Production | (14 | ) | (5,304 | ) | (5,388 | ) | ||||||
| Proved reserves, end of year | 264 | 333,175 | 334,759 | |||||||||
Carbon California
The following table summarizes Carbon California’s estimated quantities of proved reserves and our 17.81% proportionate share in Carbon California’s estimated quantities of proved reserves as of December 31, 2017.
Carbon California
Estimated Proved Reserves
| December 31, 2017 | ||||||||
| Carbon California | Carbon’s Share | |||||||
| Proved developed reserves: | ||||||||
| Natural gas (MMcf) | 12,319 | 2,194 | ||||||
| Oil and liquids (MBbl) | 6,563 | 1,169 | ||||||
| Total proved developed reserves (MMcfe) | 51,697 | 9,208 | ||||||
| Proved undeveloped reserves: | ||||||||
| Natural gas (MMcf) | 4,590 | 818 | ||||||
| Oil and liquids (MBbl) | 3,827 | 682 | ||||||
| Total proved undeveloped reserves (MMcfe) | 27,554 | 4,908 | ||||||
| Total proved reserves (MMcfe) | 79,251 | 14,117 | ||||||
| Percent developed | 65 | % | 65 | % | ||||
| Average natural gas price used (per Mcf) | $ | 3.07 | $ | 3.07 | ||||
| Average oil and liquids price used (per Bbl) | $ | 50.98 | $ | 50.98 | ||||
The following table shows a summary of the changes in quantities of estimated proved oil and gas reserves for the period of February 15, 2017 (inception) through December 31, 2017.
| 2017 | ||||||||||||||||
| Oil | Natural Gas | NGL | Total | |||||||||||||
| MBbls | MMcf | MBbls | MMcfe | |||||||||||||
| Proved reserves, inception | - | - | - | - | ||||||||||||
| Purchases of reserves in-place | 9,260 | 17,260 | 1,294 | 80,586 | ||||||||||||
| Production | (141 | ) | (351 | ) | (23 | ) | (1,335 | ) | ||||||||
| Proved reserves, end of year | 9,119 | 16,909 | 1,271 | 79,251 | ||||||||||||
Preparation of Reserves Estimates
Our estimates of proved oil, and natural gas and NGL reserves as of December 31, 20172019 and 2016 and our equity investees’ estimates of proved oil and natural gas reserves as of December 31, 20172018, were based on the average fiscal-year prices for oil, and natural gas and NGL (calculated as the unweighted arithmetic average of the first-day-of-the month price for each month within the 12-month period ended December 31, 20172019 and 2016,2018, respectively). Proved developed oil, gas and gasNGL reserves are reserves that can be expected to be recovered through existing wells with existing equipment and operating methods. Proved undeveloped oil, gas and gasNGL reserves are reserves that are expected to be recovered from new wells on undrilled acreage, or from existing wells where a relatively major expenditure is required for recompletion. Proved undeveloped reserves on undrilled acreage are limited to those locations on development spacing areas that are offsetting economic producers that are reasonably certain of economic production when drilled. Proved undeveloped reserves for other undrilled development spacing areas are claimed only where it can be demonstrated with reasonable certainty that there is continuity of economic production from the existing productive formation. Proved undeveloped reserves are included when they are scheduled to be drilled within five years.
SEC rules dictate the types of technologies that a company may use to establish reserve estimates including the extraction of non-traditional resources, such as natural gas extracted from shales as well as bitumen extracted from oil sands. See Note 1817 to the consolidated financial statements in Item 8 for additional information regarding our estimated proved reserves.
Uncertainties are inherent in estimating quantities of proved reserves, including many factors beyond our control. Reserve engineering is a subjective process of estimating subsurface accumulations of oil and natural gas that cannot be measured in an exact manner, and the accuracy of any reserve estimate is a function of the quality of available data and its interpretation. As a result, estimates by different engineers often vary, sometimes significantly. In addition, physical factors such as the results of drilling, testing, and production subsequent to the date of an estimate, as well as economic factors such as changes in product prices or development and production expenses, may require revision of such estimates. Accordingly, quantities of oil and natural gas ultimately recovered will vary from reserve estimates. See “Risk Factors,” for a description of some of the risks and uncertainties associated with our business and reserves.
Reserve estimates are based on production performance, data acquired remotely or in wells, and are guided by petrophysical, geologic, geophysical and reservoir engineering models. Estimates of our proved reserves were based on deterministic methods. In the case of mature developed reserves, reserve estimates are determined by decline curve analysis and in the case of immature developed and undeveloped reserves, by analogy, using proximate or otherwise appropriate examples in addition to volumetric analysis. The technologies and economic data used in estimating our proved reserves include empirical evidence through drilling results and well performance, well logs and test data, geologic maps and available downhole and production data. Further, the internal review process of our wells and related reserve estimates includes but is not limited to the following:
| ● | A comparison is made and documented of actual data from our accounting system to the data utilized in the reserve database. Current production, revenue and expense information obtained from our accounting records is subject to external quarterly reviews, annual audits and additional internal controls over financial reporting. This process is designed to create assurance that production, revenues and expenses are accurately reflected in the reserve database. |
| ● | A comparison is made and documented of land and lease records to ownership interest data in the reserve database. This process is designed to create assurance that the costs and revenues utilized in the reserves estimation match actual ownership interests. |
| ● | A comparison is made of property acquisitions, disposals, retirements or transfers to the property records maintained in the reserve database to verify that all are accounted for accurately. |
| ● | Natural gas pricing for the first flow day of every month is obtained from Platts Gas Daily. Oil pricing for the first flow day of every month is obtained from the U.S. Energy Information Administration. At the reporting date, 12-month average prices are determined. Regional variations in pricing and related deductions are similarly obtained and a 12-month average is calculated at year end. |
For the years ended December 31, 20172019 and 2016 for us and the year ended December 31, 2017 for our equity investees,2018, the independent engineering firm, Cawley, Gillespie & Associates, Inc. (“CGA”) reviewed with us, technical personnel field performance and future development plans. Following these reviews, we furnished our internal reserve database and supporting data to CGA in order for them to prepare their independent reserve estimates and final report. We restrict access to our database containing reserve information to select individuals from our engineering department.and corporate development departments. CGA’s independent reserve estimates and final report are for our and our equity investees’ interests in the respective oil and gas properties and represents 100% of the total proved hydrocarbon reserves owned by us and our equity investees or 96%99% of the consolidated proved hydrocarbon reserves presented in our consolidated financial statements. CGA’s report does not include the hydrocarbon reserves owned by the non-controlling interests of our consolidated partnerships. We calculated the estimated reserves of the non-controlling interests of the consolidated partnerships’ oil and gas properties by multiplying CGA’s independent reserve estimates for such properties by the respective non-controlling interests in those properties.
Our Vice PresidentDirector of Engineering, Richard Finucane,Corporate Planning and our manager of Acquisitions and Divestitures,Development, Todd Habliston, areis responsible for overseeing the preparation of the reserve estimates with consultations from our internal technical and accounting staff. Mr. FinucaneHabliston started his career with ARCO Oil and Gas in 1983, has been involved in reservoir engineering inserved as Adjunct Professor of Economics at the Appalachian Basin since 1982Colorado School of Mines, and has worked as an oil and natural gas engineer since 1978 and holds a B.S. in Civil Engineering from the University of Tennessee (highest honors) and is admitted as an expert in oil and natural gas matters in civil and regulatory proceedings in Kentucky, Virginia and West Virginia. Mr. Habliston has over 3035 years of oil and gas experience in all aspects of reservoir and has served as Adjunct Professor at the Colorado School of Mines.production engineering. Mr. Habliston earned a B.S. in Chemical and Petroleum Refining Engineering from the Colorado School of Mines and an MBA from Purdue University. He is a registered Professional Engineer and is a member of SPE, SPEE, AAPG API and IPAA.API.
Drilling Activities
Based on oilDuring 2019, we drilled two oil-related wells associated with our Carbon California assets. One well was completed in the fourth quarter of 2019 and natural gas prices during 2017, we reduced our and our equity investees’the other well was completed in the first quarter of 2020. We completed no drilling activities to manage and optimizein the utilization of our and our equity investees’ capital resources. During 2017, ourAppalachian or Illinois Basins. Our 2019 capital expenditures consisted principally of oil-related drilling, remediation, return to production and recompletion projects in California and the optimization and streamlining of our natural gas gathering and compression facilities in Appalachia to provide more efficient and lower cost operations and greater flexibility in moving our production to markets with more favorable pricing.
Carbon Natural Gas Company
The following table summarizes the number of wells drilled for the years ended December 31, 2017, 20162019, 2018 and 2015.2017. Gross wells reflect the sum of all wells in which we own an interest. Net wells reflect the sum of our working interests in gross wells.
| Year Ended December 31, | ||||||||||||||||||||||||
| 2017 | 2016 | 2015 | ||||||||||||||||||||||
| Gross | Net | Gross | Net | Gross | Net | |||||||||||||||||||
| Development wells: | ||||||||||||||||||||||||
| Productive (1) | 2 | 1.2 | - | - | - | - | ||||||||||||||||||
| Non-productive (2) | - | - | - | - | - | - | ||||||||||||||||||
| Total development wells | 2 | 1.2 | - | - | - | - | ||||||||||||||||||
| Exploratory wells: | ||||||||||||||||||||||||
| Productive (1) | - | - | - | - | - | - | ||||||||||||||||||
| Non-productive (2) | - | - | - | - | - | - | ||||||||||||||||||
| Total exploratory wells | - | - | - | - | - | - | ||||||||||||||||||
| Year Ended December 31, | ||||||||||||||||||||||||
| 2019 | 2018 | 2017 | ||||||||||||||||||||||
| Gross | Net | Gross | Net | Gross | Net | |||||||||||||||||||
| Development wells: | ||||||||||||||||||||||||
| Productive (1) | 1 | 1 | - | - | 2 | 1.2 | ||||||||||||||||||
| Non-productive (2) | - | - | - | - | - | - | ||||||||||||||||||
| Total development wells | 1 | 1 | - | - | 2 | 1.2 | ||||||||||||||||||
Exploratory wells: | ||||||||||||||||||||||||
| Productive (1) | - | - | - | - | - | - | ||||||||||||||||||
| Non-productive (2) | - | - | - | - | - | - | ||||||||||||||||||
| Total exploratory wells | - | - | - | - | - | - | ||||||||||||||||||
| (1) | A well classified as productive does not always provide economic levels of activity. |
| (2) | A non-productive well is a well found to be incapable of producing either oil or natural gas in sufficient quantities to justify completion as an oil or natural gas well; also known as a dry well (or dry hole). |
Carbon Appalachia
No wells were drilled for the year ended December 31, 2017.
Carbon California
The following table summarizes our 17.81% proportionate share in the number of wells drilled for the year ended December 31, 2017. Gross wells reflect the sum of all wells in which Carbon California owns an interest. Net wells reflect the sum of Carbon California’s working interests in gross wells.
| Year Ended December 31, | ||||||||
| 2017 | ||||||||
| Gross | Net | |||||||
| Development wells: | ||||||||
| Productive (1) | 1 | 1 | ||||||
| Non-productive (2) | - | - | ||||||
| Total development wells | 1 | 1 | ||||||
| Exploratory wells: | ||||||||
| Productive (1) | - | - | ||||||
| Non-productive (2) | - | - | ||||||
| Total exploratory wells | - | - | ||||||
Oil and Natural Gas Wells and Acreage
Productive Wells
Productive wells consist of producing wells and wells capable of production, including shut-in wells. A well bore with multiple completions is counted as only one well. The following table summarizes our and our proportionate share in our equity investees’ productive wells as of December 31, 2017.2019:
| December 31, 2017 | December 31, 2019 | |||||||||||||||
| Gross | Net | Gross | Net | |||||||||||||
| Carbon Natural Gas Company | ||||||||||||||||
| Gas | 2,555 | 2,165 | 6,696 | 5,275 | ||||||||||||
| Oil | 474 | 420 | 901 | 843 | ||||||||||||
| Total | 3,029 | 2,585 | 7,597 | 6,118 | ||||||||||||
| Carbon Appalachia | ||||||||||||||||
| Gas | 4,378 | 3,802 | ||||||||||||||
| Oil | 33 | 24 | ||||||||||||||
| Total | 4,411 | 3,826 | ||||||||||||||
| Carbon California | ||||||||||||||||
| Gas | - | - | ||||||||||||||
| Oil | 208 | 207 | ||||||||||||||
| Total | 208 | 207 | ||||||||||||||
Acreage
Carbon Natural Gas Company
The following table summarizes our gross and net developed and undeveloped acreage by state as of December 31, 2017.2019. Acreage related to royalty, overriding royalty and other similar interests is excluded from this summary, as well as acreage related to any options held by us to acquire additional leasehold interests.
| December 31, 2017 | December 31, 2019 | |||||||||||||||||||||||||||||||||||||||||||||||
| Developed Acres | Undeveloped Acres | Total Acres | Developed Acres | Undeveloped Acres(1) | Total Acres | |||||||||||||||||||||||||||||||||||||||||||
| Gross | Net | Gross | Net | Gross | Net | Gross | Net | Gross | Net | Gross | Net | |||||||||||||||||||||||||||||||||||||
| California | 11,476 | 9,148 | 8,013 | 7,896 | 19,489 | 17,044 | ||||||||||||||||||||||||||||||||||||||||||
| Indiana | - | - | 43,364 | 43,364 | 43,364 | 43,364 | - | - | 9,079 | 9,079 | 9,079 | 9,079 | ||||||||||||||||||||||||||||||||||||
| Illinois | 3,758 | 1,879 | 24,216 | 14,608 | 27,974 | 16,487 | 3,758 | 1,879 | 20,225 | 12,613 | 23,983 | 14,492 | ||||||||||||||||||||||||||||||||||||
| Kentucky | 10,778 | 9,710 | 95,159 | 69,333 | 105,937 | 79,043 | 10,540 | 10,415 | 78,172 | 76,881 | 88,712 | 87,296 | ||||||||||||||||||||||||||||||||||||
| Ohio | 338 | 338 | 6,703 | 6,703 | 7,041 | 7,041 | 3,103 | 374 | 6,703 | 7,366 | 9,806 | 7,740 | ||||||||||||||||||||||||||||||||||||
| Tennessee | 160 | 40 | 45,904 | 45,896 | 46,064 | 45,936 | 69,095 | 65,847 | 115,883 | 115,761 | 184,978 | 181,608 | ||||||||||||||||||||||||||||||||||||
| Virginia | 732 | 679 | - | - | 732 | 679 | 10,541 | 1,385 | 117,768 | 124,569 | 128,309 | 125,954 | ||||||||||||||||||||||||||||||||||||
| West Virginia | 187,858 | 176,326 | 54,021 | 42,497 | 241,879 | 218,823 | 1,093,266 | 224,837 | 240,103 | 902,748 | 1,333,369 | 1,127,585 | ||||||||||||||||||||||||||||||||||||
| Total | 203,624 | 188,972 | 269,367 | 222,401 | 472,991 | 411,373 | 1,201,779 | 313,885 | 595,946 | 1,256,913 | 1,797,725 | 1,570,798 | ||||||||||||||||||||||||||||||||||||
| (1) | As of December 31, 2019, approximately 16,000, 3,000 and 2,000 net acres of undeveloped acreage are scheduled to expire by December 31, 2020, 2021 and 2022, respectively. |
Carbon Appalachia
The following table summarizes our 27.24% proportionate share in Carbon Appalachia’s gross and net developed and undeveloped acreage by state as of December 31, 2017. Acreage related to royalty, overriding royalty and other similar interests is excluded from this summary, as well as acreage related to any options held by Carbon Appalachia to acquire additional leasehold interests.
| December 31, 2017 | ||||||||||||||||||||||||
| Developed Acres | Undeveloped Acres | Total Acres | ||||||||||||||||||||||
| Gross | Net | Gross | Net | Gross | Net | |||||||||||||||||||
| Ohio | 986 | 290 | - | - | 986 | 290 | ||||||||||||||||||
| Virginia | 2,212 | 2,045 | 32,113 | 32,113 | 34,325 | 34,159 | ||||||||||||||||||
| West Virginia | 230,817 | 198,863 | 46,448 | 45,070 | 277,265 | 243,932 | ||||||||||||||||||
| Tennessee | 18,778 | 17,926 | 20,977 | 20,925 | 39,755 | 38,851 | ||||||||||||||||||
| Total | 252,793 | 219,124 | 99,538 | 98,108 | 352,331 | 317,232 | ||||||||||||||||||
Carbon California
The following table summarizes our 17.81% proportionate share in Carbon California’s gross and net developed and undeveloped acreage by state as of December 31, 2017. Acreage related to royalty, overriding royalty and other similar interests is excluded from this summary, as well as acreage related to any options held by Carbon California to acquire additional leasehold interests.
| December 31, 2017 | ||||||||||||||||||||||||
| Developed | Undeveloped | Total | ||||||||||||||||||||||
| Acres | Acres | Acres | ||||||||||||||||||||||
| Gross | Net | Gross | Net | Gross | Net | |||||||||||||||||||
| California | 415 | 415 | 1,427 | 1,425 | 1,842 | 1,840 | ||||||||||||||||||
| Total | ||||||||||||||||||||||||
Undeveloped Acreage Expirations
Carbon Natural Gas Company
The following table sets forth our gross and net undeveloped acres by state as of December 31, 2017 which are scheduled to expire through December 31, 2020 unless production is established within the spacing unit covering the acreage prior to the expiration date or we extend the terms of a lease by paying delay rentals to the lessor.
| December 31, 2017 | ||||||||||||||||||||||||
| 2018 | 2019 | 2020 | ||||||||||||||||||||||
| Gross | Net | Gross | Net | Gross | Net | |||||||||||||||||||
| Indiana | - | - | 34,285 | 34,285 | - | - | ||||||||||||||||||
| Illinois | 6,143 | 3,071 | 2,908 | 1,454 | 3,099 | 1,549 | ||||||||||||||||||
| Kentucky | 8,471 | 5,083 | 10,223 | 6,290 | 9,648 | 8,175 | ||||||||||||||||||
| West Virginia | - | - | 3,625 | 3,625 | 11,574 | 11,574 | ||||||||||||||||||
| Total | 14,614 | 8,154 | 51,041 | 45,654 | 24,321 | 21,298 | ||||||||||||||||||
Carbon Appalachian
The following table sets forth our 27.24% proportionate share in Carbon Appalachia’s gross and net undeveloped acres by state as of December 31, 2017 which are scheduled to expire through December 31, 2020 unless production is established within the spacing unit covering the acreage prior to the expiration date or Carbon Appalachia extends the terms of a lease by paying delay rentals to the lessor.
| December 31, 2017 | ||||||||||||||||||||||||
| 2018 | 2019 | 2020 | ||||||||||||||||||||||
| Gross | Net | Gross | Net | Gross | Net | |||||||||||||||||||
| Ohio | - | - | - | - | - | - | ||||||||||||||||||
| Tennessee | 1,416 | 1,416 | 478 | 457 | 58 | 48 | ||||||||||||||||||
| Virginia | 2 | 2 | - | - | - | - | ||||||||||||||||||
| West Virginia | 3,790 | 3,255 | 1,422 | 1,362 | 1,793 | 1,793 | ||||||||||||||||||
| Total | 5,207 | 4,673 | 1,901 | 1,819 | 1,851 | 1,851 | ||||||||||||||||||
Carbon California
Carbon California does not have any scheduled undeveloped acres to expire from December 31, 2017 through December 31, 2020.
Production, Average Sales Prices and Production Costs
Carbon Natural Gas Company
The following table reflects our production, average sales price, and production cost information for the years ended December 31, 2017, 20162019, 2018 and 2015.2017:
| Year Ended December 31, | Year Ended December 31, | |||||||||||||||||||||||
| 2017 | 2016 | 2015 | 2019 | 2018(1) | 2017(1) | |||||||||||||||||||
| Production data: | ||||||||||||||||||||||||
| Natural gas (MMcf) | 4,896 | 2,823 | 2,040 | 21,436 | 5,320 | 4,896 | ||||||||||||||||||
| Oil and condensate (Bbl) | 86,277 | 79,044 | 101,255 | |||||||||||||||||||||
| Oil (MBbl) | 589 | 451 | 86 | |||||||||||||||||||||
| Natural gas liquids (MBbl) | 36 | 33 | - | |||||||||||||||||||||
| Combined (MMcfe) | 5,414 | 3,297 | 2,646 | 25,182 | 8,223 | 5,414 | ||||||||||||||||||
| Gas and oil production revenue (in thousands) | $ | 19,511 | $ | 10,443 | $ | 10,708 | ||||||||||||||||||
| Commodity derivative (loss) gain (in thousands) | $ | 2,928 | $ | (2,259 | ) | $ | 852 | |||||||||||||||||
| Gas, oil and natural gas liquids production revenue (in thousands) | $ | 93,841 | $ | 48,052 | $ | 19,511 | ||||||||||||||||||
| Commodity derivative gain (in thousands) | $ | 3,044 | $ | 4,894 | $ | 2,928 | ||||||||||||||||||
| Prices: | ||||||||||||||||||||||||
| Average sales price before effects of hedging; | ||||||||||||||||||||||||
| Natural gas (per Mcf) | $ | 2.53 | $ | 2.53 | $ | 2.78 | $ | 2.63 | $ | 3.01 | $ | 3.12 | ||||||||||||
| Oil and condensate (per Bbl) | $ | 41.95 | $ | 41.95 | $ | 49.83 | ||||||||||||||||||
| Average sale price after effects of hedging: | ||||||||||||||||||||||||
| Oil (per Bbl) | $ | 62.50 | $ | 68.53 | $ | 48.83 | ||||||||||||||||||
| Natural gas liquids (per Bbl) | $ | 16.18 | $ | 34.55 | $ | - | ||||||||||||||||||
| Average sale price after effects of hedging(2): | ||||||||||||||||||||||||
| Natural gas (per Mcf) | $ | 3.12 | $ | 1.89 | $ | 3.01 | $ | 2.80 | $ | 2.96 | $ | 3.25 | ||||||||||||
| Oil and condensate (per Bbl) | $ | 48.84 | $ | 36.14 | $ | 53.48 | ||||||||||||||||||
| Oil (per Bbl) | 62.38 | $ | 60.65 | $ | 50.38 | |||||||||||||||||||
| Natural gas liquids (per Bbl) | $ | 16.18 | $ | 34.55 | $ | - | ||||||||||||||||||
| Average costs per Mcfe: | ||||||||||||||||||||||||
| Lease operating costs | $ | 1.13 | $ | 0.96 | $ | 1.10 | $ | 1.18 | $ | 1.94 | $ | 1.13 | ||||||||||||
| Transportation costs | $ | 0.40 | $ | 0.50 | $ | 0.65 | $ | 0.24 | $ | 0.54 | $ | 0.40 | ||||||||||||
| Production and property taxes | $ | 0.24 | $ | 0.25 | $ | 0.33 | $ | 0.22 | $ | 0.22 | $ | 0.24 | ||||||||||||
| (1) | The 2018 and 2017 activity shown above includes only that which is included in the consolidated financial statements. Therefore, the above represents all of Carbon’s activities for the years ended December 31, 2018 and 2017 and only the activity of Carbon California for the period February 1, 2018 through December 31, 2018. It does not include any activity for Carbon Appalachia as the OIE Membership Acquisition, which resulted in consolidation of Carbon Appalachia, did not occur until December 31, 2018. |
| (2) | Includes effect of settled commodity derivative gains and losses. |
10
Carbon Appalachia
Present Activities
The following table reflects our 27.24% proportionate share in Carbon Appalachia’s production, average sales price, and production cost information for the period endedAt December 31, 2017.
| Period from Inception Through December 31, | ||||
| 2017 | ||||
| Production data: | ||||
| Natural gas (MMcf) | 5,304 | |||
| Oil and NGLs (Bbl) | 14 | |||
| Combined (MMcfe) | 5,390 | |||
| Gas, oil and NGL production revenue (in thousands) | $ | 16,813 | ||
| Commodity derivative (loss) gain (in thousands) | $ | 2,545 | ||
| Prices: | ||||
| Average sales price before effects of hedging; | ||||
| Natural gas (per Mcf) | $ | 3.04 | ||
| Oil and NGLs (per Bbl) | $ | 47.94 | ||
| Average sale price after effects of hedging: | ||||
| Natural gas (per Mcf) | $ | 3.14 | ||
| Oil and NGLs (per Bbl) | $ | 47.41 | ||
| Average costs per Mcfe: | ||||
| Lease operating costs | $ | 0.98 | ||
| Transportation costs | $ | 0.35 | ||
| Production and property taxes | $ | 0.27 | ||
Carbon California2019, we have successfully drilled and completed one well and we were actively completing a second well in the Ventura Basin.
The following table reflects our 17.81% proportionate share in Carbon California’s production, average sales price, and production cost information for the year ended December 31, 2017.
| Period Inception Through December 31, | ||||
| 2017 | ||||
| Production data: | ||||
| Natural gas (MMcf) | 351 | |||
| Oil and condensate (Bbl) | 165 | |||
| Combined (MMcfe) | 1,339 | |||
| Gas and oil production revenue (in thousands) | $ | 8,616 | ||
| Commodity derivative (loss) gain (in thousands) | $ | (1,382 | ) | |
| Prices: | ||||
| Average sales price before effects of hedging; | ||||
| Natural gas (per Mcf) | $ | 2.95 | ||
| Oil and condensate (per Bbl) | $ | 46.04 | ||
| Average sale price after effects of hedging: | ||||
| Natural gas (per Mcf) | $ | 3.26 | ||
| Oil and condensate (per Bbl) | $ | 35.18 | ||
| Average costs per Mcfe: | ||||
| Lease operating costs | $ | 16.70 | ||
| Transportation costs | $ | 6.46 | ||
| Production and property taxes | $ | 2.37 | ||
Present Activities
Our current focus is on growth through acquisition of producing wells, rather than drilling wells.
Our current drilling program includes only those wells required to be drilled under certain agreements.
Marketing and Delivery Commitments
Our and our equity investees’ oil andAs of December 31, 2019, we have delivery commitments of approximately 1,289,000 Btu of natural gas production is generally sold onthrough February 2020 as part of a month-to-month basis in the spot market, priced in referencestorage contract. These delivery commitments were fulfilled subsequent to published indices. We believe that the loss of one or more of our or our equity investees’ purchasers would not have a material adverse effect on our or our equity investees’ ability to sell our production, because any individual purchaser could be readily replaced by another purchaser, absent a broad market disruption.
We currently do not have any delivery commitments.year-end.
We and Carbon AppalachiaThrough our acquisition activities, we acquired long-term firm transportation contracts that were entered into to ensure the transport of certain gas production to purchasers. Any shortfall of capacity use upon acquisition was recorded as a liability and is included in firm transportation obligations on the consolidated balance sheetsheets of each entity.
Total firm transportation volumes and related demand charges for the remaining term of these contracts at December 31, 20172019 related to us are summarized in the table below.following table:
Carbon Natural Gas Company
| Period | Dekatherms per day | Demand Charges | ||||||
| Jan 2020 – Mar 2020 | 58,871 | $ | 0.20 - 0.62 | |||||
| Apr 2020 – May 2020 | 57,791 | $ | 0.20 - 0.56 | |||||
| Jun 2020 – Oct 2020 | 56,641 | $ | 0.20 - 0.56 | |||||
| Nov 2020 – Aug 2022 | 50,341 | $ | 0.20 - 0.56 | |||||
| Sep 2022 – May 2027 | 30,990 | $ | 0.20 - 0.21 | |||||
| Jun 2027 – May 2036 | 1,000 | $ | 0.20 | |||||
| Period | Dekatherms per day | Demand Charges (per Dth) | ||||||
| Jan 2018 – Apr 2018 | 5,530 | $ | 0.20 - $0.65 | |||||
| May 2018 – Mar 2020 | 3,230 | $ | 0.20 - $0.62 | |||||
| Apr 2020 – May 2020 | 2,150 | $ | 0.20 | |||||
| Jun 2020 – May 2036 | 1,000 | $ | 0.20 | |||||
Carbon Appalachia(1)Major Purchasers
Total firm transportation volumes
Our oil and related demand charges fornatural gas production are generally sold on a month-to-month basis in the remaining termspot market, or in accordance with negotiated purchase contracts, and are priced in reference to published indices. We believe that the loss of these contracts atone or more of our purchasers would not have a material adverse effect on our ability to sell our production, because any individual purchaser could be readily replaced by another purchaser, absent a broad market disruption.
For the year ended December 31, 2017 related2019, approximately 29.0% of our revenue was generated from sales to Carbon Appalachia are summarized in the table below.two purchasers.
| Period | Dekatherms per day | Demand Charges (per Dth) | ||||||
| Jan 2018 – Oct 2020 | 6,300 | $ | 0.21 | |||||
| Jan 2018 – May 2027 | 29,900 | $ | 0.21 | |||||
| Jan 2018 – Aug 2022 | 19,441 | $ | 0.56 | |||||
Competition
We and our equity investees encounter competition in all aspects of business, including acquisition of properties and oil and natural gas leases, marketing oil and natural gas, obtaining services and labor, and securing drilling rigs and other equipment and materials necessary for drilling and completing wells. Our and our equity investees’ ability to increase reserves in the future will depend on our and our equity investees’ ability to generate successful prospectsprojects on existing properties, execute development drilling programs, and acquire additional producing properties and leases for future development and exploration. Competitors include independent oil and gas companies, major oil and gas companies and individual producers and operators within and outside of the Appalachian, Illinois and Ventura Basins. A number of the companies with which we and our equity investees compete with have larger staffs and greater financial and operational resources than we and our equity investees have. Because of the nature of our and our equity investees’ oil and natural gas assets and management’s experience in developing reserves and acquiring properties, we believe that we and our equity investees effectively compete in our and their markets. See—-“Risk Factors –-Competition in the oil and natural gas industry is intense, making it more difficult for us to acquire properties, market oil and natural gas and secure trained personnel.”
Regulation
Federal, state and local agencies have extensive rules and regulations applicable to oil and natural gas exploration, production and related operations. These laws and regulations may change in response to economic or political conditions. Matters subject to current governmental regulation and/or pending legislative or regulatory changes include the discharge or other release into the environment of wastes and other substances in connection with drilling and production activities (including fracture stimulation operations), bonds or other financial responsibility requirements to cover drilling risks and well plugging and abandonment, reclamation or restoration costs, reports concerning our and our equity investees’ operations, the spacing of wells, unitization and pooling of properties, taxation, and the use of derivative hedging instruments. Failure to comply with laws and regulations may result in the assessment of administrative, civil and criminal penalties, the imposition of remedial obligations and the issuance of injunctions that could delay, limit or prohibit certain of our or our equity investees’ operations. In the past, regulatory agencies have imposed price controls and limitations on production. In order to conserve supplies of oil and gas, oil and gas conservation commissions and other agencies may restrict the rates of flow of wells below actual production capacity, generally prohibit the venting or flaring of natural gas, and may impose certain requirements regarding the ratability or fair apportionment of production from fields and individual wells. Further, a significant spill from one of our or our equity investees’ facilities could have a material adverse effect on our or our equity investees’ results of operations, competitive position or financial condition. The laws regulate, among other things, the production, handling, storage, transportation and disposal of oil and natural gas, by-products from each and other substances and materials produced or used in connection with our and our equity investees’ operations. Although we believe we and our equity investees are in substantial compliance with applicable laws and regulations, such laws and regulations may be amended or reinterpreted. In addition, unforeseen environmental incidents may occur or past non-compliance with environmental laws or regulations may be discovered. Therefore, we cannot predict the ultimate cost of compliance with these requirements or their effect on our and our equity investees’ operations.
Most states require drilling permits, drilling and operating bonds and the filing of various reports and impose other requirements relating to the exploration and production of oil and natural gas. Many states also have statutes or regulations regarding conservation matters including rules governing the size of drilling and spacing units, the density of wells and the unitization of oil and natural gas properties. The federal and state regulatory burden on the oil and natural gas industry increases our and our equity investees’ cost of doing business and affects our and our equity investees’ profitability.
Federal legislation and regulatory controls have historically affected the prices received for natural gas production. The Federal Energy Regulatory Commission (“FERC”) has jurisdiction over the transportation and sale or resale of natural gas in interstate commerce under the Natural Gas Act of 1938 (“NGA”), the Natural Gas Policy Act of 1978 (“NGPA”), and the regulations promulgated under those statutes. Carbon Appalachia ownsWe own an intrastate natural gas pipeline through itsour ownership of the Cranberry Pipeline, that provides interstate transportation and storage services pursuant to Section 311 of the NGPA, as well as intrastate transportation and storage services that are regulated by the West Virginia Public Service Commission. For qualified intrastate pipelines, FERC allows interstate transportation service “on behalf of” interstate pipelines or local distribution companies served by interstate pipelines without subjecting the intrastate pipeline to the more comprehensive NGA jurisdiction of FERC. We provide Section 311 service in accordance with a publicly available Statement of Operating Conditions filed with FERC under rates that are subject to approval by the FERC. By Letter Order issued May 15, 2013, the FERC approved the current Cranberry Pipeline rates. The May 15, 2013 Letter Order required Cranberry Pipeline to file a renewed rate petition by December 18, 2017. On November 21, 2017, FERC extended this filing deadline to December 18, 2018 in recognition of potential rate impacts of the September 2017 Acquisition. On December 12, 2018, FERC extended this filing deadline to February 19, 2019. We filed the renewed rate petition on February 19, 2019 proposing rates that were higher than the existing rates. Following settlement discussions with FERC staff, we submitted an updated rate petition on April 17, 2019 proposing to re-adopt the rates that had been in effect prior to February 19, 2019. No protests were filed, and the rates became effective on April 18, 2019.
In 2005, Congress enacted the Energy Policy Act of 2005 (“EPAct 2005”), which amends the NGA to make it unlawful for any entity, including non-jurisdictional producers such as Carbon, Carbon Appalachia and Carbon California, to use any deceptive or manipulative device or contrivance in connection with the purchase or sale of natural gas or the purchase or sale of transportation services subject to regulation by the FERC, or contravention of rules prescribed by FERC. EPAct 2005 also gives FERC authority to impose civil penalties for violations of the NGA up to approximately $1,200,000$1,300,000 per day per violation, and this amount is adjusted for inflation on an annual basis. The anti-manipulation rule does not apply to activities that relate only to intrastate or other non-jurisdictional sales or gathering, but does apply to activities of otherwise non-jurisdictional entities to the extent the activities are conducted “in connection with” natural gas sales, purchases or transportation subject to FERC jurisdiction. It therefore reflects a significant expansion of FERC’s enforcement authority. We do not anticipate we or our equity investees will be affected any differently than other producers of natural gas in respect of EPAct 2005.
In 2007, FERC issued rules requiring that any market participant including a producer such as Carbon, Carbon Appalachia or Carbon California, that engages in physical sales for resale or purchases for resale of natural gas that equal or exceed 2.2 million MMBtus during a calendar year, must annually report such sales or purchases to FERC, beginning on May 1, 2009. These rules are intended to increase the transparency of the wholesale natural gas markets and to assist FERC in monitoring such markets and in detecting market manipulation. In 2008, FERC issued its order on rehearing, which largely approved the existing rules, except FERC exempted from the reporting requirement certain types of purchases and sales, including purchases and sales of unprocessed natural gas and bundled sales of natural gas made pursuant to state regulated retail tariffs. In addition, FERC clarified that other end use purchases and sales are not exempt from the reporting requirements. The monitoring and reporting required by the rules have increased our and our equity investees’ administrative costs. We do not anticipate we Carbon Appalachia or Carbon California will be affected any differently than other producers of natural gas.
Gathering service, which occurs on pipeline facilities located upstream of jurisdictional transmission services, is regulated by the states onshore and in state waters. Section 1(b) of the NGA exempts natural gas gathering facilities from regulation by FERC as a natural gas company under the NGA. Although FERC has set forth a general test for determining whether facilities perform a nonjurisdictional gathering function or a jurisdictional transmission function, FERC’s determinations as to the classification of facilities are done on a case-by-case basis. To the extent that FERC issues an order that reclassifies certain non-jurisdictional gathering facilities as FERC-jurisdictional transportation facilities, and depending on the scope of that decision, the costs of getting gas to point of sale locations may increase. We believe that the natural gas pipelines in our and our equity investees’ gathering systems meet the traditional tests FERC has used to establish a pipeline’s status as a gatherer not subject to regulation as a natural gas company. However, the distinction between FERC-regulated transmission services and federally unregulated gathering services is often the subject of ongoing litigation, so the classification and regulation of our and our equity investees’ gathering facilities is subject to change based on future determinations by FERC, the courts or Congress. In addition, state regulation of natural gas gathering facilities generally includes various occupational safety, environmental and, in some circumstances, nondiscriminatory-take requirements. Although such regulation has not generally been affirmatively applied by state agencies, natural gas gathering may receive greater regulatory scrutiny in the future.
Additional proposals and proceedings that might affect the oil and natural gas industry are regularly considered by Congress, the states, FERC and the courts. For instance, legislation has previously been introduced in Congress to amend the federal Safe Drinking Water Act to subject hydraulic fracturing operations—anoperations-an important process used in the completion of our and our equity investees’ oil and natural gas wells—towells-to regulation under the Safe Drinking Water Act. If adopted, this legislation could establish an additional level of regulation, and impose additional cost, on our and our equity investees’ operations. We cannot predict when or whether any such proposal, or any additional new legislative or regulatory proposal, may become effective. No material portion of our or our equity investees’ business is subject to renegotiation of profits or termination of contracts or subcontracts at the election of the federal government.
Our and our equity investees’ sales of oil and natural gas are affected by the availability, terms and cost of transportation. Interstate transportation of oil and natural gas by pipelines is regulated by FERC pursuant to the Interstate Commerce Act, the NGA, the Energy Policy Act of 1992 and the rules and regulations promulgated under those laws. Intrastate oil and natural gas pipeline transportation rates may also be subject to regulation by state regulatory commissions. We do not believe that the regulation of oil transportation rates will affect our or our equity investees’ operations in any way that is materially different that those of our and our equity investees’ competitors who are similarly situated.
Regulation of Pipeline Safety and Maintenance
The Pipeline and Hazardous Materials Safety Administration (“PHMSA”) has established safety requirements pertaining to the design, installation, testing, construction, operation and maintenance of gas pipeline facilities, including requirements that pipeline operators develop a written qualification program for individuals performing covered tasks on pipeline facilities and implement pipeline integrity management programs. PHMSA has the statutory authority to impose civil penalties for pipeline safety violations up to a maximum of approximately $200,000 per day for each violation and approximately $2 million for a related series of violations. This maximum penalty authority established by statute will continue to be adjusted periodically to account for inflation.
The Protecting Our Infrastructure of Pipelines and Enhancing Safety Act of 2016 (“PIPES 2016 Act”), extended PHMSA’s statutory mandate under prior legislation through 2019. Congress did not pass a reauthorization bill in 2019 and the PHMSA is operating under a continuing resolution until a new bill is passed. In addition, the PIPES 2016 Act empowered PHMSA to address imminent hazards by imposing emergency restrictions, prohibitions and safety measures on owners and operators of gas or hazardous liquid pipeline facilities without prior notice or an opportunity for a hearing. Additionally, in April 2016, PHMSA proposed rules that would, if adopted, strengthen existing integrity management requirements, expand assessment and repair requirements to pipelines in areas with medium population densities and extend regulatory requirements to onshore gas gathering lines that are currently exempt. The issuance of a final rule is uncertain at this time. The extension of regulatory requirements to our or our equity investees’ gathering pipelines would impose additional obligations on us and our equity investees and could add material costs to our and their operations. States are largely preempted by federal law from regulating pipeline safety for interstate lines, but most states are certified by the U.S. Department of Transportation to assume responsibility for enforcing federal intrastate pipeline regulations and inspection of intrastate pipelines. In practice, because states can adopt stricter standards for intrastate pipelines than those imposed by the federal government for interstate lines, states vary considerably in their authority and capacity to address pipeline safety. However, we do not expect that any such costs would be material to our or our equity investees’ financial condition or results of operations. The adoption of new or amended regulations by PHMSA or the states that result in more stringent or costly pipeline integrity management or safety standards could have a significant adverse effect on us and similarly situated midstream operators. We cannot predict what future action the DOT will take, but we do not believe that any regulatory changes will affect us or our equity investees in a way that materially differs from the way they will affect our or their competitors.
We believe our and our equity investees’ operations are in substantial compliance with all existing federal, state and local pipeline safety laws and regulations.
Environmental
As an operator of oil and natural gas properties in the U.S., we are subject to federal, state and local laws and regulations relating to environmental protection as well as the manner in which various substances, including wastes generated in connection with exploration, production, and transportation operations, are released into the environment. Compliance with these laws and regulations can affect the location or size of wells and facilities, prohibit or limit the extent to which exploration and development may be allowed, and require proper closure of wells and restoration of properties when production ceases. Failure to comply with these laws and regulations may result in the assessment of administrative, civil, or criminal penalties, imposition of remedial obligations, incurrence of capital or increased operating costs to comply with governmental standards, and even injunctions that limit or prohibit exploration and production activities or that constrain the disposal of substances generated by oil field operations.
The most significant of these environmental laws that may apply to our and our equity investees’ operations are as follows:
| ● | The Comprehensive Environmental Response, Compensation and Liability Act, as amended (“CERCLA”) and comparable state statutes which impose liability on owners and operators of certain sites and on persons who dispose of or arrange for the disposal of hazardous substances at sites where hazardous substances releases have occurred or are threatening to occur. Parties responsible for the release or threatened release of hazardous substances under CERCLA may by subject to joint and several liability for the cost of cleaning up those substances and for damages to natural resources; |
| ● | The Oil Pollution Act of 1990 (“OPA”) subjects owners and operators of facilities to strict, joint and several liability for containment and cleanup costs and certain other damages arising from oil spills, including the government’s response costs. Spills subject to the OPA may result in varying civil and criminal penalties and liabilities; |
| ● | The Resource Conservation and Recovery Act, as amended (“RCRA”), and comparable state statues which govern the treatment, storage and disposal of solid nonhazardous and hazardous waste and authorize the imposition of substantial fines and penalties for noncompliance; |
| ● | The Federal Water Pollution Control Act, as amended, also known as the Clean Water Act (“CWA”), and analogous state laws that govern the discharge of pollutants, including natural gas wastes, into federal and state waters, including spills and leaks of hydrocarbons and produced water. These controls have become more stringent over the years, and it is possible that additional restrictions will be imposed in the future. Permits are required to discharge pollutants into certain state and federal waters and to conduct construction activities in those waters and wetlands. The CWA and comparable state statutes provide for civil, criminal and administrative penalties for any unauthorized discharges of oil and other pollutants and impose liability for the costs of removal or remediation of contamination resulting from such discharges; |
| ● | The Safe Drinking Water Act (“SDWA”), which governs the disposal of wastewater in underground injection wells; and |
| ● | The Clean Air Act (“CAA”) and similar state and local requirements which govern the emission of pollutants into the air. Greenhouse gas record keeping and reporting requirements under the CAA took effect in 2011 and impose increased administrative and control costs. In recent years, the Environmental Protection Agency (“EPA”) issued final rules to subject oil and natural gas operations to regulation under the New Source Performance Standards, or NSPS, and National Emission Standards for Hazardous Air Pollutants, or NESHAPS, programs under the CAA, and to impose new and amended requirements under both programs. The EPA rules include NSPS standards for completions of hydraulically fractured oil and natural gas wells, compressors, controllers, dehydrators, storage tanks, natural gas processing plants and certain other equipment. In addition, the EPA finalized a more stringent National Ambient Air Quality Standard (“NAAQS”) for ozone in October 2015. This more stringent ozone NAAQS could result in additional areas being designated as non-attainment, which may result in an increase in costs for emission controls and requirements for additional monitoring and testing, as well as a more cumbersome permitting process. EPA anticipates promulgating final area designations under the new standard in the first half of 2018. |
Changes in environmental laws and regulations occur frequently, and any changes that result in more stringent and costly waste handling, storage, transport, disposal, cleanup or operating requirements could materially adversely affect our and our equity investees’ operations and financial condition, as well as those of the oil and natural gas industry in general. For instance, recent scientific studies have suggested that emissions of certain gases, commonly referred to as “greenhouse gases,” and including carbon dioxide and methane, may be contributing to the warming of the Earth’s atmosphere. Based on these findings, the EPA has begun adopting and implementing a comprehensive suite of regulations to restrict emissions of greenhouse gases under existing provisions of the CAA. Legislative and regulatory initiatives related to climate change and greenhouse gas emissions could, and in all likelihood would, require us and our equity investees to incur increased operating costs adversely affecting our and our equity investees’ profits and could adversely affect demand for the oil and natural gas we and they produce, depressing the prices we and they receive for oil and natural gas. In addition to the regulatory efforts described above, there have also been efforts in recent years in the investment community promoting the divestment of fossil fuel equities as well as to pressure lenders and other financial services companies to limit or curtail activities with companies engaged in the extraction of fossil fuel reserves. Members of the investment community have recently increased their focus on sustainability practices, including practices related to GHGs and climate change, in the oil and natural gas industry. As a result of these efforts, our ability to access capital markets may be limited and our stock price may be negatively impacted. See “The adoption of climate change legislation or regulations restricting emissions of “greenhouse gases” could result in increased operating costs and reduced demand for the oil and natural gas we produceproduce.”
We and our equity investees currently operate or lease, and have in the past operated or leased, a number of properties that have been subject to the exploration and production of oil and natural gas. Although we and our equity investees have utilized operating and disposal practices that were standard in the industry at the time, hydrocarbons or other wastes may have been disposed of or released on or under the properties operated or leased by us or our equity investees or on or under other locations where such wastes have been taken for disposal. In addition, these properties may have been operated by third parties whose treatment and disposal or release of hydrocarbons or other wastes was not under our or their control. These properties and the wastes disposed thereon may be subject to laws and regulations imposing joint and several liability and strict liability without regard to fault or the legality of the original conduct that could require us or our equity investees to remove previously disposed wastes or remediate property contamination, or to perform well or pit closure or other actions of a remedial nature to prevent future contamination.
Oil and natural gas deposits exist in shale and other formations. It is customary in our industry to recover oil and natural gas from these formations through the use of hydraulic fracturing, combined with horizontal drilling. Hydraulic fracturing is the process of injecting substances such as water, sand, and other additives under pressure into subsurface formations to create or expand fractures, thus creating a passageway for the release of oil and natural gas.
Most of our and Carbon Appalachia’s Appalachian Basin oil and natural gas reserves are subject to or have been subjected to hydraulic fracturing and we expect to continue to employ hydraulic fracturing extensively in future wells that we drill and complete. The reservoir rock in these areas, in general, has insufficient permeability to flow enough oil or natural gas to be economically viable without stimulation. The controlling regulatory agencies for well construction have standards that are designed specifically in anticipation of hydraulic fracturing. The cost of the stimulation process varies according to well location and reservoir.
We and our equity investees contract with established service companies to conduct our hydraulic fracturing. The personnel of these service companies are trained to handle potentially hazardous materials and possess emergency protocols and equipment to deal with potential spills and carry Safety Data Sheets for all chemicals. We require these service companies to carry insurance covering incidents that could occur in connection with their activities. In addition, these service companies are responsible for obtaining any regulatory permits necessary for them to perform their service in the relevant geographic location. We and our equity investees have not had any incidents, citations or lawsuits resulting from hydraulic fracture stimulation and we are not presently aware of any such matters.stimulation.
In the well completion and production process, an accidental release could result in possible environmental damage. All wells have manifolds with escape lines to containment areas. High pressure valves for flow control are on the wellhead. Valves and piping are designed for higher pressures than are typically encountered. Piping is tested prior to any procedure and regular safety inspections and incident drill records are kept on those tests.
All fracturing is designed with the minimum water requirements necessary since there is a cost of accumulating, storing and disposing of the water recovered from fracturing. Water is drawn from nearby streams that are tributaries to the Ohio River and flow 365 days per year. Water recovered from the fracturing is injected into EPA or state approved underground injection wells. In some instances, the operation of underground injection wells has been alleged to cause earthquakes (induced seismicity) as a result of flawed well design or operation. This has resulted in stricter regulatory requirements in some jurisdictions relating to the location and operation of underground injection wells. In addition, the California Division of Oil, Gas & Geothermal Resources (“DOGGR”), renamed the Geologic Energy Management Division, or CalGEM, effective January 1, 2020, adopted regulations intended to bring California’s Class II Underground Injection Control (“UIC”) program into compliance with the federal Safe Drinking Water Act, under which some wells may require an aquifer exemption. DOGGR began reviewingreviewed all active UIC projects, regardless of whether an exemption is required. DOGGR has obtained aquifer exemptions for UIC wells identified as requiring an aquifer exemption. In addition, DOGGR, now CalGEM, has undertaken a comprehensive examination of existing regulations and plans to issueis in the process of issuing additional regulations with respect to certain oil and gas activities, in 2018, such as management of idle wells, pipelines, and underground fluid injection.injection and well construction. CalGEM announced in November 2019 that these rule updates would include public health and safety protections for communities near oil and gas production and independent reviews of permitting processes for hydraulic fracturing and other well stimulation practices. The potential adoption of federal, state and local legislation and regulations in the areas in which we and our equity investees operate could restrict our or their ability to dispose of produced water gathered from drilling and production activities, which could result in increased costs and additional operating restrictions or delays.
While hydraulic fracturing historically has been regulated by state and natural gas commissions, the practice has become increasingly controversial in certain parts of the country, resulting in increased scrutiny and regulation from federal agencies. The EPA has asserted federal regulatory authority pursuant to the federal SDWA over hydraulic fracturing involving fluids that contain diesel fuel and published permitting guidance in February 2014 for hydraulic fracturing operations that use diesel fuel in fracturing fluids in those states in which EPA is the permitting authority. In recent years, the EPA has issued final regulations under the federal CAA establishing performance standards for completions of hydraulically fractured oil and natural gas wells, compressors, controllers, dehydrators, storage tanks, natural gas processing plants and certain other equipment, and also finalized rules in June 2016 that prohibit the discharge of wastewater from hydraulic fracturing operations to publicly owned wastewater treatment plants. Many producing states, cities and counties have adopted, or are considering adopting, regulations that could impose more stringent permitting, public disclosure and well construction requirements on hydraulic fracturing operations or otherwise seek to ban fracturing activities altogether. In addition, separate and apart from the referenced potential connection between injection wells and seismicity, concerns have been raised that hydraulic fracturing activities may be correlated to induced seismicity. The scientific community and regulatory agencies at all levels are studying the possible linkage between oil and gas activity and induced seismicity, and some state regulatory agencies have modified their regulations or guidance to mitigate potential causes of induced seismicity. If legislation or regulations are adopted at the federal, state or local level imposing any restrictions on the use of hydraulic fracturing, this could have a significant impact on our financial condition, results of operations and cash flows. Additional burdens upon hydraulic fracturing, such as reporting or permitting requirements, will result in additional expense and delay in our operations. Restrictions on hydraulic fracturing could also reduce the amount of oil and natural gas that we or our equity investees are ultimately able to produce from our or their reserves. See “Environmental legislation and regulatory initiatives, including those relating to hydraulic fracturing and underground injection could result in increased costs and additional operating restrictions or delays.”
Any of the above factors could have a material adverse effect on our financial position, results of operations or cash flows and could make it more difficult or costly for us to perform hydraulic fracturing.
We and our equity investees are subject to the requirements of OSHA and comparable state statutes. The OSHA Hazard Communication Standard, the “community right-to-know” regulations under Title III of the federal Superfund Amendments and Reauthorization Act and similar state statutes require us to organize information about hazardous materials used, released or produced in our operations. Certain of this information must be provided to employees, state and local governmental authorities and local citizens. We and our equity investees are also subject to the requirements and reporting set forth in OSHA workplace standards.
We believe that it is reasonably likely that the trend in environmental legislation and regulation will continue toward stricter standards. While we believe that we and our equity investees are in substantial compliance with applicable environmental laws and regulations in effect at the present time and that continued compliance with existing requirements will not have a material adverse impact on us, or our equity investees, we cannot give any assurance that we or our equity investees will not be adversely affected in the future. We and our equity investees have established internal guidelines to be followed in order to comply with environmental laws and regulations in the U.S. Although we and our equity investees maintain pollution insurance against the costs of cleanup operations, public liability, and physical damage, there is no assurance that such insurance will be adequate to cover all such costs or that such insurance will continue to be available in the future.
Employees
As of December 31, 2017,2019, our workforce (including those employed by our subsidiaries Nytis LLC and CCOC) consisted of 168215 employees, all of which are full-time employees. None of the members of our workforce are represented by a union or covered by a collective bargaining agreement. We believe we have a good relationship with the members of our workforce.
Geographical DataOffices
We operate in one geographical area, the continental United States. See Note 1 to the consolidated financial statements.
Offices
Our executive offices are located at 1700 Broadway, Suite 1170, Denver, Colorado 80290. We maintain an officeoffices in Lexington, Kentucky and Santa Paula, California from which we conduct our and our equity investees’ oil and gas operations.
Title to Properties
Title to our and our equity investees’ oil and gas properties is subject to royalty, overriding royalty, carried, net profits, working, and similar interests customary in the oil and gas industry. Under the terms of our bank credit facility, we have granted the lenderour lenders a lien on a substantial majority of our properties. In addition, our properties may also be subject to liens incident to operating agreements, as well as other customary encumbrances, easements, and restrictions, and for current taxes not yet due. Our general practice is to conduct title examinations on material property acquisitions. Prior to the commencement of drilling operations, a title examination and, if necessary, curative work is performed. The methods of title examination that we have adopted are reasonable in the opinion of management and are designed to ensure that production from our properties, if obtained, will be salable by us.
Glossary of Oil and Gas Terms
Many of the following terms are used throughout this Annual Report on Form 10-K. The definitions of proved developed reserves, proved reserves, and proved undeveloped reserves have been abbreviated from the applicable definitions contained in Rule 4-10(a) of Regulation S-X adopted by the Securities and Exchange Commission (the “SEC”“SEC”). The entire definitions of those terms can be viewed on the SEC’s website at http://www.sec.gov.
Bblmeans one stock tank barrel, or 42 U.S. gallons liquid volume, of crude oil or liquid hydrocarbons.
Bcfmeans one billion cubic feet of natural gas.
Bcfemeans one billion cubic feet equivalent, determined using the ratio of six Mcf of natural gas to one bbl of crude oil, condensate, or natural gas liquids.
Bbtumeans one billion British Thermal Units.
Btumeans a British Thermal Unit, or the amount of heat necessary to raise the temperature of one pound of water one degree Fahrenheit.
CBMmeans coalbed methane.
Condensatemeans liquid hydrocarbons associated with the production of a primarily natural gas reserve.
Dekathermmeans one million British Thermal Units.
Developed acreagemeans the number of acres which are allocated or held by producing wells or wells capable of production.
Development wellsmeans a well drilled within the proved area of an oil or natural gas reservoir to the depth of a stratigraphic horizon known to be productive.
Equivalent volumesmeans equivalent volumes are computed with oil and natural gas liquid quantities converted to Mcf on an energy equivalent ratio of one barrel to six Mcf.
Exploitationmeans ordinarily considered to be a form of development within a known reservoir.
Exploratory wellmeans a well drilled to find a new field or to find a new reservoir in a field previously found to be productive of oil or natural gas in another reservoir. Generally, an exploratory well is any well that is not a development well or a service well.
Farmoutis an assignment of an interest in a drilling location and related acreage conditional upon the drilling of a well on that location or the undertaking of other work obligations.
Fieldmeans an area consisting of either a single reservoir or multiple reservoirs, all grouped on or related to the same individual geological structural feature and/or stratigraphic condition.
Full cost poolmeans the full cost pool consisting of all costs associated with property acquisition, exploration, and development activities for a company using the full cost method of accounting. Additionally, any internal costs that can be directly identified with acquisition, exploration, and development activities are included. Any costs related to production, general and administrative expense, or similar activities are not included.
Gross acres or gross wellsmeans the total acres or wells, as the case may be, in which a working interest is owned.
Henry Hubmeans the natural gas pipeline located in Erath, Louisiana that serves as the official delivery location for futures contracts on the NYMEX.
Lease operating expensesmeans the expenses of lifting oil or natural gas from a producing formation to the surface, constituting part of the current operating expenses of a working interest, and also including labor, superintendence, supplies, repairs, short-lived assets, maintenance, allocated overhead costs, and other expenses incidental to production, but not including lease acquisition or drilling or completion expenses.
Liquidsdescribes oil, condensate, and natural gas liquids.
MBblsmeans one thousand barrels of crude oil or other liquid hydrocarbons.
Mcfmeans one thousand cubic feet of natural gas.
Mcfemeans one thousand cubic feet equivalent determined using the ratio of six Mcf of natural gas to one bbl of crude oil, condensate, or natural gas liquids.
MMBbls means one million barrels of crude oil or other liquid hydrocarbons.
MMBtumeans one million British Thermal Units, a common energy measurement.
MMcfmeans one million cubic feet of natural gas.
MMcfemeans one million cubic feet equivalent determined using the ratio of six Mcf of natural gas to one bbl of crude oil, condensate, or natural gas liquids.
NGLmeans natural gas liquids.
Net acres or net wellsis the sum of the fractional working interest owned in gross acres or gross wells expressed in whole numbers and fractions of whole numbers.
Non-productive wellmeans a well found to be incapable of producing either oil or natural gas in sufficient quantities to justify completion as an oil or natural gas well.
NYMEXmeans New York Mercantile Exchange.
Productive wellsmeans producing wells and wells that are capable of production, and wells that are shut-in.
Proved developed reservesmeans estimated proved reserves that can be expected to be recovered through existing wells with existing equipment and operating methods.
Proved reservesmeans quantities of oil and natural gas, which, by analysis of geoscience and engineering data, can be estimated with reasonable certainty to be economically producible—producible from a given date forward, from known reservoirs, and under existing economic conditions, operating methods, and government regulations—regulations prior to the time at which contracts providing the right to operate expire, unless evidence indicates that renewal is reasonably certain, regardless of whether deterministic or probabilistic methods are used for the estimation. Existing economic conditions include prices that are the average price during the twelve-month period prior to the ending date of the period covered by the report, determined as an unweighted arithmetic average of the first-day-of-the-month price for each month within such period, unless prices are defined by contractual arrangements, excluding escalations based upon future conditions.
Proved undeveloped reservesmeans estimated proved reserves that are expected to be recovered from new wells on undrilled acreage or from existing wells where a relatively major expenditure is required for recovery to occur.
Reservoirmeans a porous and permeable underground formation containing a natural accumulation of producible natural gas and/or oil that is confined by impermeable rock or water barriers and is individual and separate from other reservoirs.
Royaltymeans an interest in an oil or natural gas lease that gives the owner of the interest the right to receive a portion of the production from the leased acreage (or of the proceeds of the sale thereof), but generally does not require the owner to pay any portion of the costs of drilling or operating the wells on the leased acreage. Royalties may be either landowner’s royalties, which are reserved by the owner of the leased acreage at the time the lease is granted, or overriding royalties, which are usually reserved by an owner of the leasehold in connection with a transfer to a subsequent owner.
Standardized measure of present value of estimated future net revenuesmeans an estimate of the present value of the estimated future net revenues from proved oil or natural gas reserves at a date indicated after deducting estimated production and ad valorem taxes, future capital costs, operating expenses and income taxes computed by applying year end statutory tax rates, with consideration of future tax rates already legislated. The estimated future net revenues are discounted at an annual rate of 10%10.0%, in accordance with the SEC’s practice, to determine their “present value.” The present value is shown to indicate the effect of time on the value of the revenue stream and should not be construed as being the fair market value of the properties. Estimates of future net revenues are made using oil and natural gas prices and operating costs at the estimation date and held constant for the life of the reserves.
Undeveloped acreagemeans acreage on which wells have not been drilled or completed to a point that would permit the production of economic quantities of oil or natural gas, regardless of whether such acreage contains proved reserves.
Working interestmeans an operating interest which gives the owner the right to drill, produce, and conduct operating activities on the property, and to receive a share of production.
Available Information
You may read without charge, and copy at prescribed rates, all or any portion of the registration statement or any reports, statements or other information in the files at the public reference room at the SEC’s principal office at 100 F Street NE, Washington, D.C., 20549. You may request copies of these documents, for a copying fee, by writing to the SEC. You may call the SEC at 1-800-SEC-0330 for further information on the operation of its public reference room. Our filings, including this Annual Report on Form 10-K, will also be available to you on the Internet website maintained by the SEC athttp://www.sec.gov or on our website athttp://www.carbonnaturalgas.com.
We are subject to the information and reporting requirements of the Securities Exchange Act and will file annual, quarterly and current reports, proxy statements and other information with the SEC.
Our SEC filings, including this Annual Report on Form 10-K, are available to you through our website at http://www.carbonenergycorp.com, free of charge, after we file them with the SEC. Our filings with the SEC are also available on the SEC’s website at http://www.sec.gov. You can request copies of these documents, for a copying fee, by writing to the SEC. These reports, proxy statements and other information will also be available on the Internet websites of the SEC and us referred to above. We intend to furnish our stockholders with annual reports containing financial statements audited by our independent auditors. We intend to use our website as a regular means of disclosing material non-public information and for complying with disclosure obligations under Regulation FD promulgated by the SEC. Such disclosures will be included on the website under the heading “Investor Relations.”
Information contained on our website is not incorporated by reference into this Annual Report on Form 10-K.
We are subject to certain risks and hazards due to the nature of the business activities we conduct, including the risks discussed below. Additionally, our equity investees are generally subject to the same business and regulatory risks as we are. Investing in our common stock involves a high degree of risk. If any of the following risks actually occur, they may materially and adversely affect our business, financial condition, cash flows, and results of operations. In this event, the trading price of our common stock could decline, and you could lose part or all of your investment. We may experience additional risks and uncertainties not currently known to us; or, as a result of developments occurring in the future, conditions that we currently deem to be immaterial may also materially and adversely affect our business, financial condition, cash flows, and results of operations.
Risks Related to Our Business
Oil, NGLnatural gas and natural gasNGL prices and differentials are highly volatile. Declines in commodity prices, especially steep declines in the price of oil and natural gas, have adversely affected, and in the future will adversely affect, our financial condition and results of operations, cash flow, access to the capital markets and ability to grow.
The oil, NGLnatural gas and natural gasNGL markets are highly volatile, and we cannot predict future oil, NGL and natural gas or NGL prices. Prices for oil, NGLnatural gas and natural gasNGLs may fluctuate widely in response to relatively minor changes in the supply of and demand for oil, NGLsnatural gas and natural gas,NGLs, market uncertainty and a variety of additional factors that are beyond our control, such as:
| ● | domestic and foreign supply of and demand for oil, |
| ● | market prices of oil, |
| ● | level of consumer product demand; |
| ● | overall domestic and global political and economic conditions; |
| ● | political and economic conditions in producing countries, including those in the Middle East, Russia, South America and Africa; |
| ● | global or national health concerns, including the outbreak of pandemic or contagious disease, such as the recent coronavirus, which may reduce demand for crude oil, natural gas and NGLs because of reduced global or national economic activity; |
| ● | actions of the Organization of Petroleum Exporting Countries and other state-controlled oil companies relating to oil price and production controls; |
| ● | weather conditions; |
| ● | impact of the U.S. dollar exchange rates on commodity prices; |
| ● | technological advances affecting energy consumption and energy supply; |
| ● | domestic and foreign governmental regulations and taxation; |
| ● | impact of energy conservation efforts; |
| ● | capacity, cost and availability of oil and natural gas pipelines, processing, gathering and other transportation facilities and the proximity of these facilities to our wells; |
| ● |
| ● | price and availability of alternative fuels. |
Oil, NGL and natural gas and NGL prices do not necessarily fluctuate in direct relationship to each other. Because oil, NGLnatural gas and natural gasNGL accounted for approximately 8%19%, 1%80% and 91%1% of our estimated proved reserves as of December 31, 2017,2019, respectively, and approximately 9.6%14%, 0.4%85% and 90%1% of our 20172019 production on an Mcfe basis, respectively, our financial results will be sensitive to movements in oil and natural gas prices.
In the past, prices of oil and natural gas have been extremely volatile, and we expect this volatility to continue. For example, during the year ended December 31, 2017,2019, the monthly average NYMEX WTI spot price ranged from a high of $61$66.30 per Bbl in DecemberApril to a low of $46$46.54 per Bbl in JuneJanuary while the monthly average Henry Hub natural gas price ranged from a high of $3.30$4.25 per MMBtu in JanuaryMarch to a low of $2.81$1.75 per MMBtu in December. During the year endedSince December 31, 2016,2019, prices have declined, with the monthly averageNYMEX WTI spot price ranged from a high of $52on March 16, 2020 at $28.70 per Bbl in December to a low of $30 per Bbl in February whileand the monthly average Henry Hub natural gas price ranged from a high of $3.59 per MMBtu in December to a low of $1.73 per MMBtu in March. As ofon March 19, 2018, the WTI spot price during 2018 has averaged $62.62 per Bbl and the natural gas spot price16, 2020 at Henry Hub has averaged approximately $3.14$1.82 per MMBtu. Price discounts or differentials between NYMEX WTI spot prices and what we actually receive are also historically very volatile.
In addition, the market price for natural gas in the Appalachian Basin continues to be lower relative to NYMEX Henry Hub as a result of the significant increases in the supply of natural gas in the Northeast region in recent years.
Due to the volatility of commodity prices, we are unable to predict future potential movements in the market prices for natural gas, including Appalachian and other market point basis, NGLs and oil and thus cannot predict the ultimate impact of prices on our operations.
Our production in the Ventura Basin received an approximate 9.7% premium to the NYMEX WTI benchmark price during 2019. A reduction in this premium would reduce the relative price advantage we receive for a substantial portion of our production in the Ventura Basin.
Our revenue, profitability and cash flow depend upon the prices and demand for oil, NGLs and natural gas. A drop in prices similar to in those observed in recent years would significantly affect our financial results and impede our growth. In particular, a significant or prolonged decline in oil, NGL or natural gas prices or a lack of related storage will negatively impact:
| ● | the value of our reserves, because declines in oil, NGL and natural gas prices would reduce the amount of oil, NGLs and natural gas that we can produce economically; |
| ● | the amount of cash flow available for capital expenditures; |
| ● | our ability to replace our production and future rate of growth; |
| ● | our ability to borrow money or raise additional capital and our cost of such capital; and |
| ● | our ability to meet our financial obligations. |
Historically, higher oil, NGL and natural gas prices generally stimulateresult in increased demand and result in increased prices for drilling equipment, crews and associated supplies, equipment and services, as well as higher lease operating expenses and increased end-user conservation or conversion to alternative fuels. However, commodity price declines do not result in similarly rapid declines of costs associated with drilling. Accordingly, a high cost environment could adversely affect our ability to pursue our drilling program and our results of operations.
The refining industry may be unable to absorb rising U.S. oil and condensate production; in such a case, the resulting surplus could depress prices and restrict the availability of markets, which could materially and adversely affect our results of operations.
Absent an expansion of U.S. refining and export capacity, rising U.S. production of oil and condensates could result in a surplus of these products in the U.S., which would likely cause prices for these commodities to fall and markets to constrict. Although U.S. law was changed in 2015 to permit the export of oil, exports may not occur if demand is lacking in foreign markets or the price that can be obtained in foreign markets does not support associated export capacity expansions, transportation and other costs. In such circumstances, the returns on our capital projects would decline, possibly to levels that would make execution of our drilling plans uneconomical, and a lack of market for our products could require that we shut in some portion of our production. If this were to occur, our production and cash flow could decrease, or could increase less than forecasted, which could have a material adverse effect on our cash flow and profitability.
Carbon Natural Gas CompanyEnergy Corporation is a holding company with no oil and gas operations of its own, and Carbon Natural Gas CompanyEnergy Corporation depends on equity investees andour subsidiaries for cash to fund allcertain of its operations and expenses.
Carbon Natural Gas Company’sEnergy Corporation’s operations are conducted entirely through equity investees andour subsidiaries, and itsour ability to generate cash to meet our debt serviceoperating obligations is dependent on the earnings and the receipt of funds from itsour subsidiaries and equity investees through distributions or intercompany loans. Carbon Natural Gas Company’s equity investees’ andEnergy Corporation’s subsidiaries’ ability to generate adequate cash depends on a number of factors, including development of reserves, successful acquisitions of complementary properties, advantageous drilling conditions, oil and natural gas prices, compliance with all applicable laws and regulations and other factors. See “—Risks Related to Our Business.”
We do not solely control certain equity investees.investments.
We have no significant assets other than our ownership interest in entities that own and operate oil, and natural gas, and oilNGLs interests. We do not fully own, and in many cases do not solely control, such entities. More specifically:
| ● | Carbon |
| ● | We do not control the amount of cash distributed by |
| ● | We may not have the ability to unilaterally require certain of the entities in which we own interests to make capital expenditures, and such entities may require us to make additional capital contributions to fund operating and maintenance expenditures, as well as to fund expansion capital expenditures, which would reduce the amount of cash otherwise available for dividend payments by us or require us to incur additional indebtedness; |
| ● | The entities in which we own interests may incur additional indebtedness without our consent, which debt payments would reduce the amount of cash that might otherwise be available for distributions; |
| ● |
| ● | The third-party operator of certain of the assets held by |
Our level of indebtedness may increase and reduce our financial flexibility.
We have a $100.0$500.0 million bank credit facility with Legacy TexasProsperity Bank with(formerly known as LegacyTexas Bank), as the administrative agent, and a syndicate of financial institutions, as lenders. The credit facility has a current borrowing base of $25.0$72.0 million, the outstanding balance of which was approximately $22.1$69.2 million at December 31, 20172019 and $23.1$71.2 million at March 16, 2020. We have $15.0 million associated with a term loan under the same facility, which balance was approximately $5.8 million at December 31, 2018. 2019 and $3.3 million at March 16, 2020. We have notes payable to Old Ironsides, the balance of which was approximately $25.7 million as of December 31, 2019 and March 16, 2020.
Carbon California sold certain Senior Secured Revolving Notes (the “Carbon California Senior Revolving Notes”) to Prudential Legacy Insurance Company of New Jersey and Prudential Insurance Company of America with a revolving borrowing capacity of $45.0 million. There was approximately $33.0 million of indebtedness outstanding thereunder as of December 31, 2019 and $36.0 million as of March 16, 2020. We are not a guarantor of the Senior Secured Revolving Notes.
Carbon California also issued subordinated notes (the “Subordinated Notes”) to Prudential Capital Energy Partners the balance of which was $13.0 million as of December 31, 2019 and March 16, 2020.
We may incur significant indebtedness in the future in order to make acquisitions (including through our equity investees) or to develop our properties.
Our level of indebtedness could affect our operations in several ways, including the following:
| ● | a significant portion of our cash flows could be used to service our indebtedness; |
| ● | a high level of debt would increase our vulnerability to general adverse economic and industry conditions; |
| ● | the covenants contained in the agreements governing our outstanding indebtedness limit our ability to borrow additional funds, dispose of assets, pay dividends, and make certain investments; |
| ● | a high level of debt may place us at a competitive disadvantage compared to our competitors that are less leveraged and therefore, may be able to take advantage of opportunities that our indebtedness would prevent us from pursuing; |
| ● | our debt covenants may also affect our flexibility in planning for, and reacting to, changes in the economy and in our industry; |
| ● | a high level of debt may make it more likely that a reduction in our borrowing base following a periodic redetermination could require us to repay a portion of our then-outstanding bank borrowings; and |
| ● | a high level of debt may impair our ability to obtain additional financing in the future for working capital, capital expenditures, acquisitions, general corporate, or other purposes. |
A high level of indebtedness increases the risk that we may default on our debt obligations. Our ability to meet our debt obligations and to reduce our level of indebtedness depends on our future performance. General economic conditions, commodity prices, and financial, business, and other factors affect our operations and our future performance. Many of these factors are beyond our control. We may not be able to generate sufficient cash flows to pay the interest on our debt and future working capital, borrowings, or equity financing may not be available to pay or refinance such debt. Factors that willmay affect our ability to raise cash through ana potential offering of our capital stock or a refinancing of our debt include financial market conditions, the value of our assets, and our performance at the time we need capital.
We may not be able to generate enough cash flow to meet our debt obligations or fund our other liquidity needs.
At MarchDecember 31, 2018,2019, our debt consisted of approximately $23.1$69.2 million in borrowings under our $25credit facility, $5.8 million borrowing baseassociated with a term loan, approximately $25.7 million associated with the Old Ironsides Notes, approximately $33.0 million outstanding under our credit facility.the Carbon California Senior Revolving Notes and approximately $13.0 million outstanding under the Subordinated Notes. In addition to interest expense and principal on our long-termnon-current debt, and the $750,000 minimum liquidity requirement under our credit agreement, we have demands on our cash resources including, among others, operating expenses and capital expenditures.
Our ability to pay the principal and interest on our long-termnon-current debt and to satisfy our other liabilities will depend upon future performance and our ability to repay or refinance our debt as it becomes due. Our future operating performance and ability to refinance will be affected by economic and capital market conditions, results of operations and other factors, many of which are beyond our control. Our ability to meet our debt service obligations also may be impacted by changes in prevailing interest rates, as borrowing under our existing revolving credit facility bears interest at floating rates.
We may not generate sufficient cash flow from operations. Without sufficient cash flow, there may not be adequate future sources of capital to enable us to service our indebtedness or to fund our other liquidity needs. If we are unable to service our indebtedness and fund our operating costs, we will be required to adopt alternative strategies that may include:
| ● | reducing or delaying capital expenditures; |
| ● | seeking additional debt financing or equity capital; |
| ● | selling assets; or |
| ● | restructuring or refinancing debt. |
We may not be able to complete such alternative strategies on satisfactory terms, if at all. Our inability to generate sufficient cash flows to satisfy our debt obligations and fund our liquidity needs, or to refinance our indebtedness on commercially reasonable terms, would materially and adversely affect our financial condition and results of operations.operations and may reduce our ability to pay dividends on our common stock. The formation of joint ventures or other similar arrangements to finance operations may result in dilution of our interest in the properties affected by such arrangements.
A deterioration in general economic, business or industry conditions would materially adversely affect our results of operations, financial condition and ability to pay dividends on our common stock.
In recent years, concerns over global economic conditions, energy costs, geopolitical issues, inflation, the availability and cost of credit, and slow economic growth in the United States have contributed to economic uncertainty and diminished expectations for the global economy. Meanwhile, continued hostilities in the Middle East and the occurrence or threat of terrorist attacks in the United States or other countries could adversely affect the economies of the United States and other countries. Concerns about global economic growth have had a significant adverse impact on global financial markets and commodity prices. With current global economic growth slowing, demand for oil, natural gas and natural gas liquid production has, in turn, softened. An oversupply of crude oil in 2015 led to a severe decline in worldwide oil prices.
If the economic climate in the United States or abroad deteriorates, further, worldwide demand for petroleum products could further diminish,materially decrease, which could impact the price at which oil, natural gas and natural gas liquidsNGLs from our properties are sold, affect the ability of vendors, suppliers and customers associated with our properties to continue operations and ultimately materially adversely impact our results of operations, financial condition and ability to pay dividends on our common stock.
Beginning in February 2020, oil and natural gas prices have experienced record declines and are currently at record low levels in response to dramatic supply and demand uncertainty caused by the coronavirus pandemic and the recent announcement of planned production increases by Saudi Arabia. For example, the price of oil fell approximately 20% on March 9, 2020 due to Saudi Arabia's decision to increase its production to record levels. As of March 16, 2020, the NYMEX WTI spot price was $28.70 per Bbl and the Henry Hub natural gas price was $1.82 per MMBtu. We cannot anticipate whether or when production will return to normalized levels, and oil and natural gas prices could remain at current levels or decline further, for an extended period of time.
The agreements governing our indebtedness contain restrictive covenants that may limit our ability to respond to changes in market conditions or pursue business opportunities.
Our credit agreement contains restrictive covenants that limit our ability to, among other things:
| ● | incur additional debt; |
| ● | incur additional liens; |
| ● | sell, transfer or dispose of assets; |
| ● | merge or consolidate, wind-up, dissolve or liquidate; |
| ● | make dividends and distributions on, or repurchases of, equity; |
| ● | make certain investments; |
| ● | enter into certain transactions with |
| ● | enter into sales-leaseback transactions; |
| ● | make optional or voluntary payment of debt; |
| ● | change the nature of |
| ● | change |
| ● | amend constituent documents; or |
| ● | enter into certain hedging transactions. |
In addition, our credit agreement requires us to maintain certain financial ratios and tests. The requirement that we comply with these provisions may materially adversely affect our ability to react to changes in market conditions, take advantage of business opportunities we believe to be desirable, obtain future financing, fund needed capital expenditures, or withstand a continuing or future downturn in our business.
If we are unable to comply with the restrictions and covenants in our credit agreement, there could be an event of default under the terms of such agreement, which could result in an acceleration of repayment.
If we are unable to comply with the restrictions and covenants in our credit agreement,agreements, there could be an event of default. Our ability to comply with these restrictions and covenants, including meeting the financial ratios and tests, may be affected by events beyond our control. As a result, we cannot assure you that we will be able to comply with these restrictions and covenants or meet such financial ratios and tests. In the event of a default under our credit agreement,agreements, the lenders could terminate their commitments to lend or accelerate the loans and declare all amounts borrowed due and payable. If any of these events occur, our assets might not be sufficient to repay in full all of our outstanding indebtedness and we may be unable to find alternative financing. Even if we could obtain alternative financing, it might not be on terms that are favorable or acceptable to us. Additionally, we may not be able to amend our credit agreementagreements or obtain needed waivers on satisfactory terms.
Our borrowings under our credit agreement and the Carbon California Senior Revolving Notes expose us to interest rate risk.
Our results of operations are exposed to interest rate risk associated with borrowings under our credit agreement, which bear interest at a rate elected by us that is based on the prime, LIBOR,London Interbank Offered Rate (“LIBOR”), or federal funds rate plus margins ranging from 0.50% to 4.50%3.75% depending on the type of loan used and the amount of the loan outstanding in relation to the borrowing base. As of March 31, 2018,16, 2020, there was approximately $23.1$71.2 million outstanding under our credit agreement. In addition, interest on borrowings under the Carbon California Senior Revolving Notes is payable quarterly and accrues at a rate per annum equal to either the prime rate plus an applicable margin of 4.00% or the LIBOR rate plus an applicable margin of 5.00% at our option. As of March 16, 2020, there was approximately $36.0 million outstanding under the Carbon California Senior Revolving Notes. If interest rates increase, so will our interest costs, which may have a material adverse effect on our results of operations and financial condition.
Any significant reduction in our borrowing base under our credit agreement or the Carbon California Senior Revolving Notes as a result of the periodic borrowing base redeterminations or otherwise may negatively impact our ability to fund our operations.
Under our credit agreement, which as of March 31, 2018,16, 2020, provides for a $25.0$72.0 million borrowing base, and the Carbon California Senior Revolving Notes, which as of March 16, 2020, provides for a $45.0 million borrowing base, we are subject to collateral borrowing base redeterminations based on our proved reserves. We agreed to monthly borrowing base reductions through May 1, 2020 in connection with the recent amendment to our credit agreement. Declines in oil and natural gas prices have in the past adversely impacted the value of our estimated proved developed reserves and, in turn, the market values used byour lenders to determine our borrowing base. Since December 31, 2019, prices have declined, with the NYMEX WTI spot price on March 16, 2020 at $28.70 per Bbl and the Henry Hub natural gas price on March 16, 2020 at $1.82 per MMBtu. Our next scheduled borrowing base redetermination is May 1, 2020, and if these lower prices persist, our borrowing base may be reduced materially. Furthermore, our lenders have the right at any time to request a special determination of the borrowing base. Any significant reduction in our borrowing base as a result of such borrowing base redeterminations or otherwise may require us to prepay a portion of our borrowings under the credit agreement and may otherwise negatively impact our liquidity and our ability to fund our operations and, as a result, may have a material adverse effect on our financial condition, results of operations, and cash flows.
Changes in the method of determining the LIBOR, or the replacement of LIBOR with an alternative reference rate, may adversely affect interest expense related to outstanding debt.
Amounts drawn under our current debt agreements, including our credit agreement, may bear interest at rates based on the LIBOR. On July 27, 2017, the Financial Conduct Authority in the United Kingdom announced that it would phase out LIBOR as a benchmark by the end of 2021. It is unclear whether new methods of calculating LIBOR will be established such that it continues to exist after 2021. We have not yet pursued any technical amendment to our credit agreement or other contractual alternative to address this matter and are currently evaluating the impact of the potential replacement of the LIBOR interest rate. In addition, the overall financial markets may be disrupted as a result of the phase-out or replacement of LIBOR. Uncertainty as to the nature of such potential phase-out and alternative reference rates or disruption in the financial market could have a material adverse effect on our financial condition, results of operations and cash flows.
Our estimates of proved reserves at December 31, 20172019 and 20162018 have been prepared under SEC rules which could limit our ability to book additional proved undeveloped reserves in the future.
Estimates of our proved reserves as of December 31, 20172019 and 20162018 have been prepared and presented under the SEC’s rules relating to the reporting of oil and natural gas exploration activities. These rules require that, subject to limited exceptions, proved undeveloped reserves may only be booked if they relate to wells scheduled to be drilled within five years of the date of booking. This rule has limited and may continue to limit our potential to book additional proved undeveloped reserves. Moreover, we may be required to write down any proved undeveloped reserves that are not developed within the required five-year timeframe. In addition, we based the discounted future net cash flows from our proved reserves on the twelve-month unweighted arithmetic average of the first-day-of-the-month price for the preceding twelve months without giving effect to derivative transactions. Actual future net cash flows from our properties will be affected by factors such as the actual prices we receive for oil, NGLs and natural gas, the amount, timing and cost of actual production and changes in governmental regulations or taxation.
Neither the estimated quantities of proved reserves nor the discounted present value of future net cash flows attributable to those reserves included in this annual report are intended to represent their fair, or current, market value.
Reserve estimates depend on many assumptions that may turn out to be inaccurate. Any material inaccuracies in these reserve estimates or underlying assumptions will materially affect the quantities and present value of our proved reserves.
Oil and natural gas reserve engineering is not an exact science and requires subjective estimates of underground accumulations of reserves and assumptions concerning future commodity prices, production levels, estimated ultimate recoveries, and operating and development costs. As a result, estimated quantities of proved reserves, projections of future production rates, and the timing of development expenditures may be incorrect. Our and our equity investees’ estimates of proved reserves and related valuations as of December 31, 20172019 and 20162018 are based on proved reserve reports prepared by CGA, an independent engineering firm. CGA conducted a well-by-well review of all our and our equity investees’ properties for the periods covered by its proved reserve reports using information provided by us or our equity investees.us. Over time, we may make material changes to proved reserve estimates taking into account the results of actual drilling, testing, and production. Also, certain assumptions regarding future commodity prices, production levels, and operating and development costs may prove incorrect. Any significant variance from these assumptions to actual figures could greatly affect our estimates of proved reserves, the economically recoverable quantities of reserves attributable to any particular group of properties, the classifications of reserves based on risk of recovery, and estimates of the future net cash flows. Numerous changes over time to the assumptions on which our reserve estimates are based, as described above, often result in the actual quantities of reserves we ultimately recover being different from our estimates.
The estimates of proved reserves as of December 31, 20172019 and 20162018 included in this annual report were prepared using an average price equal to the unweighted arithmetic average of hydrocarbon prices received on a field-by-field basis on the first day of each month within the 12 months ended December 31, 20172019 and 2016,2018, respectively, in accordance with the SEC guidelines applicable to reserve estimates for these periods. Reserve estimates do not include any value for probable or possible reserves that may exist, nor do they include any value for unproved acreage. The reserve estimates represent our or our equity investees’ net revenue interest in such properties.
The present value of future net cash flows from estimated proved reserves is not necessarily the same as the current market value of estimated proved oil and natural gas reserves. We and our equity investees base the current market value of estimated proved reserves on prices and costs in effect on the day of the estimate. However, actual future net cash flows from our and our equity investees’ oil and natural gas properties also will be affected by factors such as:
| ● | the actual prices we receive for oil and natural gas; |
| ● | our actual operating costs in producing oil and natural gas; |
| ● | the amount and timing of actual production; |
| ● | the amount and timing of our capital expenditures; |
| ● | supply of and demand for oil and natural gas; and |
| ● | changes in governmental regulations or taxation. |
The timing of both our and our equity investees’ production and incurrence of expenses in connection with the development and production of oil and natural gas properties will affect the timing of actual future net cash flows from proved reserves and thus their actual present value. In addition, the 10%10.0% discount factor we and our equity investees use when calculating discounted future net cash flows in compliance with accounting principles generally accepted in the FASB Accounting StandardsUnited States (“GAAP”) may not be the most appropriate discount factor based on interest rates in effect from time to time and risks associated with us or the oil and gas industry in general.
Lower oil and natural gas prices and other factors have resulted in, and in the future may result in, ceiling test write-downs and other impairments of our asset carrying values.
We use the full cost method of accounting to report our oil and natural gas operations. Under this method, we capitalize the cost to acquire, explore for, and develop oil and natural gas properties, including capitalizing the costs of abandoned properties, dry holes, geophysical costs, and annual lease rentals. All general and administrative corporate costs unrelated to drilling activities are expensed as incurred. Sales or other dispositions of oil and natural gas properties are accounted for as adjustments to capitalized costs, with no gain or loss recorded unless the ratio of cost to proved reserves would significantly change. Depletion of evaluated oil and natural gas properties is computed on the units of production method based on proved reserves. The average depletion rate per Mcfe of production associated with our reserves was $0.47$0.56 and $0.59$0.89 for 2017,2019 and 2016,2018, respectively. Total depletion expense for oil and natural gas properties was approximately $2.5$14.1 million and $2.0$7.3 million for 2017,2019, and 2016,2018, respectively.
Under full cost accounting rules, the net capitalized costs of proved oil and natural gas properties may not exceed a “ceiling limit,” which is based upon the present value of estimated future net cash flows from proved reserves, discounted at 10%10.0%. If net capitalized costs of proved oil and natural gas properties exceed the ceiling limit, we must charge the amount of the excess to earnings. This is called a “ceiling test write-down.” Under accounting principles generally accepted in the United States (“GAAP”)GAAP we are required to perform a ceiling test each quarter. Because the ceiling calculation requires a rolling 12-month average commodity price, due to the effect of lower prices in 2016, we recognized an impairment of approximately $4.3 million for the year ended December 31, 2016. We did not recognize an impairment for the yearyears ended December 31, 2017.2019 or 2018. Impairment charges do not affect cash flows from operating activities but do adversely affect earnings and stockholders’ equity.
Investments in unproved properties are assessed periodically to ascertain whether impairment has occurred. Unproved properties whose costs are individually significant are assessed individually by considering the primary lease terms of the properties, the holding period of the properties, and geographic and geologic data relating to the properties. The amount of impairment assessed, if any, is added to the costs to be amortized in the appropriate full cost pool. If an impairment of unproved properties results in a reclassification to proved reserves, the amount by which the ceiling limit exceeds the capitalized costs of proved reserves would be reduced.
In addition, GAAP requires us to write down, as a non-cash charge to earnings, the carrying value of our oil and natural gas properties for impairments, which may occur if we experience substantial downward adjustments to our estimated proved reserves or our unproved property values, or if estimated future development costs increase. We are required to perform impairment tests on our assets periodically and whenever events or changes in circumstances warrant a review of our assets. To the extent such tests indicate a reduction of the estimated useful life or estimated future cash flows of our assets, the carrying value may not be recoverable and therefore requires a write-down. Future write-downs of our full cost pool may be required if oil and natural gas prices decline, unproved property values decrease, estimated proved reserve volumes are revised downward or costs incurred in exploration, development, or acquisition activities in our full cost pool exceed the discounted future net cash flows from the additional reserves, if any, attributable to our cost pool. Any recorded impairment is not reversible at a later date.reversible.
Our and our equity investees’ exploration and development projects and acquisitions require substantial capital expenditures. We and our equity investees may be unable to obtain required capital or financing on satisfactory terms, which could lead to a decline in our or their reserves.
The oil and natural gas industry is capital intensive. We and our equity investees make and expect to continue to make substantial capital expenditures for the development, exploitation, production and acquisition of oil and natural gas reserves. Our cash used in investing activities related to acquisition, development and exploration expenditures was approximately $1.6$8.0 million and $8.8$70.4 million in 20172019 and 2016,2018, respectively. Carbon Appalachia’s cash used in investing activities related to acquisition, development and exploration expenditures was approximately $73.6 million in 2017. Carbon California’s cash used in investing activities related to acquisition, development and exploration expenditures was approximately $39.6 million in 2017. We contribute our proportionate share, as a holder of Class A unitsUnits that require capital contributions, of the capital expenditure obligations of Carbon Appalachia and Carbon California.contributions.
We anticipate thatDue to the budget for explorationrecent developments surrounding the COVID-19 virus and development work on existing acreage will range between $.5 million and $2.5 million for us in 2018, between $0 million and $2.0 million for Carbon Appalachia in 2018, and between $3.0 and $5.0 million for Carbon California in 2018.relative pricing volatility, we are currently evaluating the 2020 capital program. The budget will be highly dependent on prices that we receive for our and our equity investees’ oil and natural gas sales. We and our equity investees intend to finance future capital expenditures through cash on hand, cash flow from operations, and, fromto the extent available, borrowings under bank credit facilities. Our and our equity investees’ cash flows from operations and access to capital are subject to a number ofseveral variables, including:
| ● | proved reserves; |
| ● | the volume of hydrocarbons we |
| ● | the prices at which our |
| ● | the levels of our |
| ● | our |
However, our and our equity investees’Our financing needs, especially in regard toregarding potential acquisitions, may exceed those resources, and our and our equity investees’ actual capital expenditures in 2018 could exceed our or our equity investees’ budget. We currently expect an acquisition by Carbon California to close in May 2018 with a purchase price of $42.0 million, of which we anticipate our portion to be approximately $5.0 million. Other opportunities may arise during 2018 that could cause us and our equity investees’ capital expenditures to exceed the budget.resources. In the event our or our equity investees’ capital expenditure requirements at any time are greater than the amount of capital we or they have available, we or they may be required to seek additional sources of capital, which may include the issuance of debt or equity securities, sale of assets, delays in planned exploration, development and completion activities or the use of outside capital through equity investees or similar arrangements.
Our and our equity investees’ business and operating results can be harmed by factors such as the availability, terms, and cost of capital, increases in interest rates, or a reduction in our credit rating. Changes in any one or more of these factors could cause our or our equity investees’ cost of doing business to increase, limit our or our equity investees’ access to capital, limit our or our equity investees’ ability to pursue acquisition opportunities, reduce our or our equity investees’ cash flows available for drilling, and place us or our equity investees at a competitive disadvantage. In addition, our and our equity investees’ ability to access the private and public debt or equity markets is dependent upon a number ofseveral factors outside our or our equity investees’ control, including oil and natural gas prices as well as economic conditions in the financial markets. Continuing disruptionsDisruptions and volatility in the global financial markets may lead to an increase in interest rates or a contraction in credit availability impacting our and our equity investees’ ability to finance operations. We cannot assure you that we or our equity investees will be able to obtain debt or equity financing on terms favorable to us, or our equity investees, or at all.
If we or our equity investees are unable to fund our or their capital requirements, we or our equity investees may be required to curtail our or their operations relating to the exploration and development of our or their prospects, which in turn could lead to a possible loss of properties and a decline in our or our equity investees’ reserves and cash flow, or may be otherwise unable to implement our or our equity investees’ development plan, complete acquisitions, or otherwise take advantage of business opportunities or respond to competitive pressures, any of which could have a material adverse effect on our or our equity investees’ production, revenues, and results of operations. In addition, a delay in or the failure to complete proposed or future infrastructure projects could delay or eliminate potential efficiencies and related cost savings.
Our equity investeesCarbon California may require theirits members, including us, to make additional capital contributions to them. If we fail to make a required capital contribution to Carbon Appalachia, Old Ironsides could fund any deficiency resulting from our failure to make such capital contribution, which would result in the dilution of our interest in Carbon Appalachia.it. If we fail to make a required capital contribution to Carbon California, (i) we would be considered a defaulting member, (ii) we would lose our representative on the Board of Directors, and (iii) Prudential would have the option to pay our pro rata portion of the capital contribution and receive the pro rata share of Class A Units in Carbon California that we otherwise would have received.
Our identified drilling locationsfield development projects are scheduled for development only if oil and gas prices warrant drillingdevelopment over a substantial number of years, making them susceptible to uncertainties that could materially alter the occurrence or timing of their drilling.completion.
At an appropriate level of oil and natural gas prices, we have a multi-year drilling inventory of horizontal and vertical drilling locationsfield development projects on existing acreage These drilling locations, including those without PUDs, represent a significant part of our growth strategy.acreage. Our ability to drill and develop these locationsprojects depends on a number ofseveral uncertainties, including the availability of capital, construction of infrastructure, inclement weather, regulatory changes and approvals, commodity prices, lease expirations our ability to secure rights to drill at deeper formations, costs, and drilling results.expected capital costs.
Further, our identified potential drilling locationsprojects are in various stages of evaluation, ranging from locationsthose that are ready to drillcomplete to locationsthose that will require substantial additional analysis of data. We cannot predict in advance of drilling and testing whether any particular drilling location will yield oil or natural gas reserves in sufficient quantities to recover drilling or completion costs or to be economically viable or whether wells drilled on 20-acre spacing will produce at the same rates as those on 40-acre spacing.viable. The use of reliable technologies and the study of producing fields in the same area will not enable us to know conclusively prior to drilling whether oil or natural gas reserves will be present or, if present, whether oil or natural gas reserves will be present in sufficient quantities to be economically viable. Even if sufficient amounts of oil or natural gas reserves exist, we may damage the potentially productive hydrocarbon bearing formation or experience mechanical difficulties while drilling or completing the well, possibly resulting in a reduction in production from the well or abandonment of the well. If we drill dry holes in our current and future drilling locations, our drilling success rate may decline and materially harm our business. We cannot assure you that the analogies we draw from available data from other wells, more fully explored locations, or producing fields will be applicable to our drilling locations.projects. Further, initial production rates reported by us or other operators in the Appalachian Basin and Ventura Basin may not be indicative of future or long-term production rates.
Because of these uncertainties, we do not know if the potential drilling locationsprojects we have identified will ever be drilledcompleted or if we will be able to produce oil or natural gas reserves from these or any other potential drilling locations.projects. As such, our actual drillingdevelopment activities may materially differ from those presently identified, which could adversely affect our business, financial condition, and results of operations.
Our andCertain of our equity investees’ acreage must be drilled before lease expiration, generally within three to five years, in order to hold the acreage by production. In a highly competitive market for acreage, failureFailure to drill sufficient wells to hold acreage may result in a substantial lease renewal cost, or if renewal is not feasible, loss of our or our equity investees’ lease and prospective drilling opportunities.
Leases on oil and natural gas properties typically have a term of three to five years, after which they expire unless, prior to expiration, production is established within the spacing units covering the undeveloped acres. The cost to renew such leases may increase significantly, and we and our equity investees may not be able to renew such leases on commercially reasonable terms or at all. Any reduction in our or our equity investees’ current drilling program, either through a reduction in capital expenditures or the unavailability of drilling rigs, could result in the loss of acreage through lease expirations. We cannot assure you that we or our equity investees will have the liquidity to deploy these rigs when needed, or that commodity prices will warrant operating such a drilling program. Any such losses of leases could materially and adversely affect the growth of our asset base, cash flows, and results of operations.
Unless we replace our reserves, our reserves and production will decline, which would adversely affect our future cash flows and results of operations.
Producing oil and natural gas reservoirs generally are characterized by declining production rates that vary depending upon reservoir characteristics and other factors. As a result, we must locate, acquire and develop new reserves to replace those being depleted by production. Our business strategy is to grow production and reserves through acquisitions and through exploration and development drilling, including through our equity investees.drilling. Unless we conduct successful exploration, development and production activities or acquire properties containing proved reserves, our proved reserves will decline as our existing reserves are produced. Our future oil and natural gas reserves and production, and therefore our future cash flow and results of operations, are highly dependent on our success in efficiently developing our reserves and economically finding or acquiring additional recoverable reserves. We have made, and expect to make in the future, substantial capital expenditures in our business and operations for the development, production, exploration, and acquisition of reserves. We may not have sufficient resources to undertake our exploration, development, and production activities. In addition, we may not be able to develop, exploit, find or acquire sufficient additional reserves to replace our current and future production. If we are unable to replace our current and future production, the value of our reserves will decrease, and our business, financial condition and results of operations will be adversely affected.
Drilling for and producing oil and natural gas are high risk activities with many uncertainties that could adversely affect our business, financial condition and results of operations.
Our future financial condition and results of operations will depend on the success of our acquisition, exploration, development and production activities. These activities are subject to numerous risks beyond our control, including the risk that drilling will not result in commercially viable oil and natural gas production. Our decision to purchase, explore, develop or otherwise exploit prospects or properties will depend in part on the evaluation of data obtained through geophysical and geological analyses, production data and engineering studies, the results of which are often inconclusive or subject to varying interpretations. For a discussion of the uncertainty involved in these processes, see “—“Reserve estimates depend on many assumptions that may turn out to be inaccurate. Any material inaccuracies in these reserve estimates or underlying assumptions will materially affect the quantities and present value of our reserves.proved reserves.” The costs of exploration, exploitation, and development activities are subject to numerous uncertainties beyond our control and increases in those costs can adversely affect the economics of a project. In addition, drilling and completion costs may increase prior to completion of any particular project. Many factors may curtail, delay or cancel scheduled drilling and production projects, including:
| ● | high costs, shortages or delivery delays of drilling rigs, equipment, labor or other services; |
| ● | unexpected operational events and drilling conditions; |
| ● | sustained depressed oil and natural gas prices and further reductions in oil and natural gas prices; |
| ● | limitations in the market for oil and natural gas; |
| ● | problems in the delivery of oil and natural gas to market (see |
| ● | adverse weather conditions; |
| ● | facility or equipment malfunctions; |
| ● | equipment failures or accidents; |
| ● | title problems; |
| ● | pipe or cement failures; |
| ● | casing collapses; |
| ● | compliance with environmental and other governmental requirements; |
| ● | delays in obtaining, extending or renewing necessary permits or the inability to obtain, extend or renew such permits at all; |
| ● | environmental hazards, such as natural gas leaks, oil spills, pipeline ruptures and discharges of toxic gases; |
| ● | lost or damaged oilfield drilling and service tools; |
| ● | unusual or unexpected geological formations; |
| ● | loss of drilling fluid circulation; |
| ● | pressure or irregularities in formations; |
| ● | fires, blowouts, surface craterings and explosions; and |
| ● | uncontrollable flows of oil, natural gas or well fluids. |
Additionally, drilling, transportation and processing of hydrocarbons bear an inherent risk of loss of containment. Potential consequences include loss of reserves, loss of production, loss of economic value associated with an affected wellbore, contamination of soil, ground water, and surface water, as well as potential fines, penalties, or damages associated with any of the foregoing consequences.
Part of our strategy involves drilling in existing or emerging shale plays using the latest available horizontal drilling and completion techniques, which involve risks and uncertainties in their application.
Our operations involve utilizing the latest drilling and completion techniques as developed by us and our service providers. Risks that we may face while drilling include, but are not limited to, failing to land our wellbore in the desired drilling zone, not staying in the desired drilling zone while drilling horizontally through the formation, not running our casing the entire length of the wellbore, and not being able to run tools and other equipment consistently through the horizontal wellbore. Risks that we may face while completing our wells include, but are not limited to, not being able to fracture stimulate the planned number of stages, not being able to run tools the entire length of the wellbore during completion operations, and not successfully cleaning out the wellbore after completion of the final fracture stimulation stage. In addition, to the extent we engage in horizontal drilling, those activities may adversely affect our ability to successfully drill in one or more of our identified vertical drilling locations.
Our experience with horizontal drilling utilizing the latest drilling and completion techniques is limited. Ultimately, the success of these drilling and completion techniques can only be evaluated over time as more wells are drilled and production profiles are established over a sufficiently long time period. If our drilling results are less than anticipated or we are unable to execute our drilling program because of capital constraints, lease expirations, access to gathering systems, and/or commodity prices decline, the return on our investment in these areas may not be as attractive as we anticipate. Further, as a result of any of these developments we could incur material write-downs of our oil and natural gas properties and the value of our undeveloped acreage could decline in the future.
A significant portion of our and our equity investees’ business is conducted in basins with established production histories. The mature nature of these region could result in lower production.
The Appalachian and Ventura Basins are mature oil and natural gas production regions that have experienced substantial exploration and development activity for many years. Because a large number ofmany oil and natural gas prospects in this region have already been drilled, additional prospects of sufficient size and quality could be more difficult to identify. We cannot assure you that our or our equity investees’ future drillingdevelopment activities in these plays will be successful or, if successful, will achieve the potential reserve levels that we currently anticipate based on the drilling activities that have been completed, or that we will achieve the anticipated economic returns based on our current cost models.
Our operations are substantially dependent on the availability of water.water and electricity. Restrictions on our ability to obtain water, or increasing prices or shortages of electricity, particularly in California, may have an adverse effect on our financial condition, results of operations, and cash flows.
Water is anand electricity are essential componentcomponents of deep shale oil and natural gas production during both the drilling and hydraulic fracturing processes. Historically, we have been able to purchase water from local land owners for use in our operations. As a result of severe drought in parts of California, some local water districts have begun restricting the use of water subject to their jurisdiction for hydraulic fracturing to protect the availability of local water supply. Additionally, in recent years, shortages of electricity have resulted in increased costs for consumers and certain interruptions in service. California has experienced rolling blackouts due to excessive demand on the electrical grid or as precautionary measures against the risk of wildfire in the past because of unexpectedly high temperatures. If we are unable to obtain water to use in our operations from local sources or we experience electricity blackouts, we may be unable to economically produce our reserves or run our operations, which could have an adverse effect on our financial condition, results of operations, and cash flows.
We may face unanticipated water and other waste disposal costs.
We may be subject to regulation that restricts our ability to discharge water produced as part of our natural gas production operations. Productive zones frequently contain water that must be removed in order for the oil and natural gas to produce, and our ability to remove and dispose of sufficient quantities of water from the various zones will determine whether we can produce natural gas in commercial quantities. The produced water must be transported from the production site and injected into disposal wells. The capacity of the disposal wells we own may not be sufficient to receive all of the water produced from our wells and may affect our ability to produce our wells. Also, the cost to transport and dispose of that water, including the cost of complying with regulations concerning water disposal, may reduce our profitability.
Where water produced from our projects fails to meet the quality requirements of applicable regulatory agencies, our wells produce water in excess of the applicable volumetric permit limits, the disposal wells fail to meet the requirements of all applicable regulatory agencies, or we are unable to secure access to disposal wells with sufficient capacity to accept all of the produced water, we may be required to shut in wells, reduce drilling activities, or upgrade facilities for water handling or treatment. The costs to dispose of this produced water may increase if any of the following occur:
| ● | we cannot obtain future permits from applicable regulatory agencies; |
| ● | water of lesser quality or requiring additional treatment is produced; |
| ● | our wells produce excess water; |
| ● | new laws and regulations require water to be disposed in a different manner; or |
| ● | costs to transport the produced water to the disposal wells increase. |
Our and our equity investees’ insurance may not protect us or them against all of the operating risks to which our or our equity investees’ business is exposed.
The crude oil and natural gas business involves numerous operating hazards such as well blowouts, mechanical failures, explosions, uncontrollable flows of crude oil, natural gas or well fluids, fires, formations with abnormal pressures, hurricanes, flooding, pollution, releases of toxic gas and other environmental hazards and risks, which can result in (i) damage to or destruction of wells and/or production facilities, (ii) damage to or destruction of formations, (iii) injury to persons, (iv) loss of life, or (v) damage to property, the environment or natural resources. While we and our equity investees carry general liability, control of well, and operator’s extra expense coverage typical in our industry, we and our equity investees are not fully insured against all risks incidental to our and their business. Environmental incidents resulting from our operations could defer revenue, increase operating costs and/or increase maintenance and repair capital expenditures.
Many of our and our equity investees’ operations are currently conducted in locations that may be at risk of damage from fire, mudslides, earthquakes or other natural disasters.
One of our equity investeesCarbon California currently conducts operations in California near known wildfire and mudslide areas and earthquake fault zones. Certain of Carbon California’s operations were temporarily halted in December 2017 due to the wildfires in southern California. A future natural disaster, such as a fire, mudslide or an earthquake, could cause substantial delays in our or our equity investees’ operations, damage or destroy equipment, prevent or delay transport of production and cause us or our equity investees to incur additional expenses, which would adversely affect our or our equity investees’ business, financial condition and results of operations. In addition, our or our equity investees’ facilities would be difficult to replace and would require substantial lead time to repair or replace. The insurance we and our equity investees maintain against earthquakes, mudslides, fires and other natural disasters would not be adequate to cover a total loss of our or our equity investees’ facilities, may not be adequate to cover our or our equity investees’ losses in any particular case and may not continue to be available to us or our equity investees on acceptable terms, or at all.
We may suffer losses or incur environmental liability in hydraulic fracturing operations.
Oil and natural gas deposits exist in shale and other formations. It is customary in our industry to recover oil and natural gas from these shale formations through the use of hydraulic fracturing, combined with horizontal drilling. Hydraulic fracturing is the process of creating or expanding cracks, or fractures, underground where water, sand and other additives are pumped under high pressure into a shale formation. We contract with established service companies to conduct our hydraulic fracturing. The personnel of these service companies are trained to handle potentially hazardous materials and possess emergency protocols and equipment to deal with potential spills and carry Material Safety Data Sheetsmaterial safety data sheets for all chemicals.
In the fracturing process, an accidental release could result in possible environmental damage. All wells have manifolds with escape lines to containment areas. High pressure valves for flow control are on the wellheads. Valves and piping are designed for higher pressures than are typically encountered. Piping is tested prior to any procedure and regular safety inspections and incident drill records are kept on those tests. Despite all of these safety procedures, there are many risks involved in hydraulic fracturing that could result in liability to us. In addition, our liability for environmental hazards may include conditions created by the previous owner of properties that we purchase or lease.
We have entered into natural gas and oil derivative contracts and may in the future enter into additional commodity derivative contracts for a portion of our production, which may result in future cash payments or prevent us from receiving the full benefit of increases in commodity prices.
We use commodity derivative contracts to reduce price volatility associated with certain of our natural gas and oil sales. Under these contracts, we receive a fixed price per MMbtu of natural gas/Bbl of oil and pay a floating market price per MMbtu/Bbl of naturalgas/natural gas/oil to the counterparty based on Henry Hub/Hub, NYMEX WTI or Brent pricing. The fixed-price payment and the floating-price payment are offset, resulting in a net amount due to or from the counterparty. The extent of our commodity price exposure is related largely to the effectiveness and scope of our commodity derivative contracts. For example, our commodity derivative contracts are based on quoted market prices, which may differ significantly from the actual prices we realize in our operations for oil. In addition, our credit agreement limitsagreements limit the aggregate notional volume of commodities that can be covered under commodity derivative contracts we enter into and, as a result, we will continue to have direct commodity price exposure on the unhedged portion of our production volumes. Our policy has been to hedge a significant portion of our estimated oil and natural gas production. However, our price hedging strategy and future hedging transactions, beyond the requirement of our credit facilities, will be determined at our discretion. We are not under an obligation to hedge a specific portion of our production. The prices at which we hedge our production in the future will be dependent upon commodity prices at the time we enter into these transactions, which may be substantially higher or lower than current commodity prices. Accordingly, our price hedging strategy may not protect us from significant declines in commodity prices received for our future production, whether due to declines in prices in general or to widening differentials we experience with respect to our products. Conversely, our hedging strategy may limit our ability to realize cash flows from commodity price increases. It is also possible that a substantially larger percentage of our future production will not be hedged as compared with the nextlast few years, which would result in our revenues becoming more sensitive to commodity price changes.
In addition, our actual future production may be significantly higher or lower than we estimate at the time we enter into commodity derivative contracts for such period. If the actual amount is higher than we estimate, we will have greater commodity price exposure than we intended. If the actual amount is lower than the notional amount of our commodity derivative contracts, we might be forced to satisfy all or a portion of our commodity derivative contracts without the benefit of the cash flow from our sale or purchase of the underlying physical commodity, substantially diminishing our liquidity. There may be a change in the expected differential between the underlying commodity price in the commodity derivative contract and the actual price received, which may result in payments to our derivative counterparty that are not offset by our receipt of payments for our production in the field. Accordingly, our earnings may fluctuate significantly as a result of changes in the fair value of our commodity derivative contracts.
Our commodity derivative contracts expose us to counterparty credit risk.
Our commodity derivative contracts expose us to risk of financial loss if a counterparty fails to perform under a contract. Disruptions in the financial markets could lead to sudden decreases in a counterparty’s liquidity, which could make them unable to perform under the terms of the contract and we may not be able to realize the benefit of the contract. We are unable to predict sudden changes in a counterparty’s creditworthiness or ability to perform. Even if we do accurately predict sudden changes, our ability to negate the risk may be limited depending upon market conditions.
During periods of declining commodity prices, our derivative contract receivable positions generally increase, which increases our counterparty credit exposure. If the creditworthiness of our counterparties deteriorates and results in their nonperformance, we could incur a significant loss with respect to our commodity derivative contracts.
The inability of our derivative contract counterpartycounterparties to meet itstheir obligations may adversely affect our financial results.
We currently have onetwo derivative contract counterparty (BP Energy Company),counterparties and this concentration may impact our overall credit risk in that the counterpartycounterparties may be similarly affected by changes in economic or other conditions. The inability or failure of our derivative contract counterpartycounterparties to meet itstheir obligations to us or their insolvency or liquidation may materially adversely affect our financial condition and results of operations.
Our business depends in part on gathering and transportation facilities owned by others. Any limitation in the availability of those facilities would interfere with our ability to market natural gas we produce.
The marketability of our natural gas production depends in part on the availability, proximity and capacity of gathering and pipeline and processing systems owned by third parties. Since we do not own or operate these pipelines or other facilities, their continuing operation in their current manner is not within our control. The amount of natural gas that can be produced and sold is subject to curtailment in certain circumstances, such as pipeline interruptions due to scheduled and unscheduled maintenance, excessive pressure, physical damage to gathering, transportation or transportationprocessing systems, or lack of contracted transportation capacity on such systems. The curtailments arising from these and similar circumstances may last from a few days to several months. We may be provided with only minimal, if any, notice as to when these circumstances will arise, or their duration. If any of these third party pipelines and other facilities become partially or fully unavailable to transport natural gas or oil, or if the gas quality specifications for the natural gas gathering or transportation pipelines or facilities change so as to restrict our ability to transport natural gas on those pipelines or facilities, our revenues and cash available for distribution could be adversely affected.
In addition, properties may be acquired which are not currently serviced by gathering and transportation pipelines, or the gathering and transportation pipelines in the area may not have sufficient capacity to transport additional production. As a result, we may not be able to sell production from these properties until the necessary facilities are built.
We may incur losses as a result of title deficiencies.
We typically do not retain attorneys to examine title before acquiring leases or mineral interests. Rather, we rely upon the judgment of oil and natural gas lease brokers or landmen who perform the fieldwork in examining records in the appropriate governmental office before attempting to acquire a lease in a specific mineral interest. Prior to drilling a well, however, we (or the company that is the operator) obtain a preliminary title review to initially determine that no obvious title deficiencies are apparent. As a result of some such examinations, certain curative work may be required to correct deficiencies in title, and such curative work may be expensive. In some instances, curative work may not be feasible or possible. Our failure to cure any title defects may delay or prevent us from utilizing the associated mineral interest, which may adversely impact our ability in the future to increase production and reserves. Additionally, undeveloped acreage has greater risk of title defects than developed acreage. If there are any title defects or defects in assignment of leasehold rights in properties in which we hold an interest, we may suffer a financial loss. In addition, it is possible that certain interests could have been bought in error from someone who is not the owner. In that event, our interest would be worthless.
In addition, our reserve estimates assume that we have proper title for the properties we have acquired. In the event we are unable to perform curative work to correct deficiencies and our interest is deemed to be worthless, our reserve estimates and the financial information related thereto may be found to be inaccurate, which could have a material adverse effect on us.
Conservation measures and technological advances could reduce demand for oil and natural gas.
Fuel conservation measures, alternative fuel requirements, increasing consumer demand for alternatives to oil and natural gas, technological advances in fuel economy and energy-generation devices could reduce demand for oil and natural gas. The impact of the changing demand for oil and natural gas services and products may materially adversely affect our business, financial condition, results of operations and ability to pay dividends on our common stock.
Competition in the oil and natural gas industry is intense, making it more difficult for us to acquire properties, market oil and natural gas and secure trained personnel.
The oil and natural gas industry is intensely competitive, and we compete with other companies that have greater resources than us. Many of these companies not only explore for and produce oil and natural gas, but also carry on midstream and refining operations and market petroleum and other products on a regional, national, or international basis. These companies may be able to pay more for productive oil and natural gas properties and exploratory prospects or define, evaluate, bid for, and purchase a greater number of properties and prospects than our financial or human resources permit. In addition, these companies may have a greater ability to continue exploration activities during periods of low oil and natural gas market prices. Our larger competitors may be able to absorb the burden of present and future federal, state, local, and other laws and regulations more easily than we can, which would adversely affect our competitive position. Our ability to acquire additional properties and to discover reserves in the future will be dependent upon our ability to evaluate and select suitable properties and to consummate transactions in a highly competitive environment. In addition, because we have fewer financial and human resources than many companies in our industry, we may be at a disadvantage in bidding for exploratory prospects and producing reserves.
The oil and natural gas industry is characterized by rapid and significant technological advancements and introductions of new products and services using new technologies. As others use or develop new technologies, we may be placed at a competitive disadvantage or competitive pressures may force us to implement those new technologies at substantial costs. In addition, other oil and natural gas companies may have greater financial, technical, and personnel resources that allow them to enjoy technological advantages and may in the future allow them to implement new technologies before we can. We may not be able to respond to these competitive pressures and implement new technologies on a timely basis or at an acceptable cost. If one or more of the technologies we use now or in the future were to become obsolete or if we are unable to use the most advanced commercially available technology, our business, financial condition, and results of operations could be materially adversely affected.
The unavailability or high cost of drilling rigs, equipment, supplies, personnel and field services could adversely affect our ability to execute our exploration and development plans within our budget and on a timely basis.
The demand for qualified and experienced field personnel, geologists, geophysicists, engineers and other professionals in the industry can fluctuate significantly, often in correlation with oil and natural gas prices, causing periodic shortages. Historically, there have been shortages of qualified personnel, drilling and workover rigs, pipe and other equipment and materials as demand for rigs and equipment increased along with the number of wells being drilled. We cannot predict whether these conditions will exist in the future and, if so, what their timing and duration will be. Such shortages could delay or cause us to incur significant expenditures that are not provided for in our capital budget, which could have a material adverse effect on our business, financial condition and results of operations.
The loss of senior management or technical personnel could adversely affect operations.
We depend on the services of our senior management and technical personnel. The loss of the services of our senior management, including Patrick McDonald, our Chief Executive Officer, Mark Pierce, our President, and Kevin Struzeski, our Chief Financial Officer, Treasurer and Secretary, could have a material adverse effect on our operations. We do not maintain, nor do we plan to obtain, any insurance against the loss of any of these individuals.
In addition, there is competition within our industry for experienced technical personnel and certain other professionals, which could increase the costs associated with identifying, attracting and retaining such personnel. If we cannot identify, attract, develop and retain our technical and professional personnel or attract additional experienced technical and professional personnel, our ability to compete could be harmed.
Due to our lack of asset and geographic diversification, adverse developments in our operating areas would reduce our ability to pay dividends on shares of our common stock.
We derive substantially all of our revenues from sales of natural gas. Furthermore, aA substantial majority of our and our equity investees’ assets are located in the Ventura Basin in California and Appalachian Basin. Due to our lack of diversification in asset type and location, anAn adverse development in the oil and gas business of these geographic areas, including those resulting from the impact of regional supply and demand factors, delays or interruptions of production from wells in these areas caused by and costs associated with governmental regulation, processing or transportation capacity constraints, market limitations, water shortages or other weather related conditions, interruption of the processing or transportation of oil, NGLs or natural gas and changes in regional and local political regimes and regulations, would have a significantly greater impact on our results of operations and cash available for dividend payments on shares of our common stock than if we maintained more diverse assets and locations.
We may be subject to risks in connection with acquisitions of properties and may be unable to successfully integrate acquisitions.
There is intense competition for acquisition opportunities in our industry and we may not be able to identify attractive acquisition opportunities. Even if we do identify attractive acquisition opportunities, we may not be able to complete the acquisitions or do so on commercially acceptable terms. Competition for acquisitions may increase the cost of, or cause us to refrain from, completing acquisitions. Our ability to complete acquisitions is dependent upon, among other things, our ability to obtain debt and equity financing and, in some cases, regulatory approvals. Further, these acquisitions may be in geographic regions in which we do not currently operate, which could result in unforeseen operating difficulties and difficulties in coordinating geographically dispersed operations, personnel, and facilities. In addition, if we enter into new geographic markets, we may be subject to additional and unfamiliar legal and regulatory requirements. Compliance with these regulatory requirements may impose substantial additional obligations on us and our management, cause us to expend additional time and resources in compliance activities, and increase our exposure to penalties or fines for non-compliance with such additional legal requirements. Completed acquisitions could require us to invest further in operational, financial, and management information systems and to attract, retain, motivate, and effectively manage additional employees. The inability to effectively manage the integration of acquisitions could reduce our focus on subsequent acquisitions and current operations, which, in turn, could negatively impact our results of operations and growth. Our financial condition and results of operations may fluctuate significantly from period to period, based on whether or not significant acquisitions are completed in particular periods.
Any acquisition involves potential risks, including, among other things:
| ● | the validity of our assumptions about estimated proved reserves, future production, commodity prices, revenues, capital expenditures, operating expenses, and costs; |
| ● | an inability to obtain satisfactory title to the assets we acquire; |
| ● | a decrease in our liquidity by using a significant portion of our available cash or borrowing capacity to finance acquisitions; |
| ● | a significant increase in our interest expense or financial leverage if we incur additional debt to finance acquisitions; |
| ● | the assumption of unknown liabilities, losses, or costs for which we obtain no or limited indemnity or other recourse; |
| ● | the diversion of management’s attention from other business concerns; |
| ● | an inability to hire, train, or retain qualified personnel to manage and operate our growing assets; and |
| ● | the occurrence of other significant changes, such as impairment of oil and natural gas properties, goodwill, or other intangible assets, asset devaluation, or restructuring charges. |
Our ability to complete dispositions of assets, or interests in assets, may be subject to factors beyond our control, and in certain cases we may be required to retain liabilities for certain matters.
From time to time, we may sell an interest in a strategican asset for the purpose of assisting or accelerating the asset’s development. In addition, we regularly review our property base for the purpose of identifying nonstrategic assets, the disposition of which would increase capital resources available for other activities and create organizational and operational efficiencies. Various factors could materially affect our ability to dispose of such interests or nonstrategic assets or complete announced dispositions, including the receipt of approvals of governmental agencies or third parties and the availability of purchasers willing to acquire the interests or purchase the nonstrategic assets on terms and at prices acceptable us.
Sellers typically retain certain liabilities or indemnify buyers for certain pre-closing matters, such as matters of litigation, environmental contingencies, royalty obligations and income taxes. The magnitude of any such retained liability or indemnification obligation may be difficult to quantify at the time of the transaction and ultimately may be material. Also, as is typical in divestiture transactions, third parties may be unwilling to release us from guarantees or other credit support provided prior to the sale of the divested assets. As a result, after a divestiture, we may remain secondarily liable for the obligations guaranteed or supported to the extent that the buyer of the assets fails to perform these obligations.
Properties we acquire may not produce as projected, and we may be unable to determine reserve potential, identify liabilities associated with the properties that we acquire, or obtain protection from sellers against such liabilities.
Acquiring oil and natural gas properties requires us to assess reservoir and infrastructureoperating characteristics, including recoverable reserves, development and operating costs, and potential environmental and other liabilities. Such assessments are inexact and inherently uncertain. In connection with the assessments, we perform a review of the subject properties, but such a review will not reveal all existing or potential problems. In the course of our due diligence, we may not inspect every well or pipeline. We cannot necessarily observe structural and environmental problems, such as pipe corrosion, when an inspection is made. We may not be able to obtain contractual indemnities from the seller for liabilities created prior to our purchase of the property. We may be required to assume the risk of the physical condition of the properties in addition to the risk that the properties may not perform in accordance with our expectations.
Recently enacted tax legislation may impact our ability to fully utilize our interest expense deductions and net operating loss carryovers to fully offset our taxable income in future periods.
On December 22, 2017, tax legislation commonly known as the Tax Cuts and Jobs Act (the “TCJA”) was enacted. Beginning in 2018, the TCJA generally will (i) limit our annual deductions for interest expense to no more than 30% of our “adjusted taxable income” (plus 100% of our business interest income) for the year and (ii) permit us to offset only 80% (rather than 100%) of our taxable income with net operating losses we generate after 2017. Interest expense and net operating losses subject to these limitations may be carried forward by us for use in later years, subject to these limitations. Additionally, the TCJA repealed the domestic manufacturing tax deduction for oil and gas companies. These tax law changes could have the effect of causing us to incur income tax liability sooner than we otherwise would have incurred such liability or, in certain cases, could cause us to incur income tax liability that we might otherwise not have incurred, in the absence of these tax law changes. The TCJA also includes provisions that, beginning in 2018, reduce the maximum federal corporate income tax rate from 35% to 21% and eliminate the alternative minimum tax, which would lessen any adverse impact of the limitations described in the preceding sentences.
We may incur more taxes and certain of our projects may become uneconomic if certain federal income tax deductions currently available with respect to oil and natural gas exploration and development are eliminated as a result of future legislation.
Various proposals have been made recommending the elimination of certain key U.S. federal tax incentives that are currently available with respect to oil and natural gas exploration and development. Any such change could negatively impact our financial condition and results of operations by increasing the costs we incur which would in turn make it uneconomic to drill some prospects if commodity prices are not sufficiently high, resulting in lower revenues and decreases in production and reserves.
The recent spread of COVID-19, or the novel coronavirus, and measures taken to mitigate the impact of the COVID-19 pandemic, are adversely affecting our business, operations and financial condition.
Our business is being adversely affected by the COVID-19 pandemic and measures being taken to mitigate its impact. As the coronavirus pandemic and government responses are rapidly evolving, the extent of the impact on domestic exploration and production companies remains unknown. We are experiencing a sharp and rapid decline in the demand for the oil and natural gas we produce as the U.S. and global economy, as well as commodity prices, are being negatively impacted as economic activity is curtailed in response to the COVID-19 pandemic. Official restrictions on non-essential activities have recently been introduced in California, which may impact our production activities, and the introduction of similar measures elsewhere, including in the Appalachian Basin, may further adversely affect us. In addition, our reliance on third-party suppliers, contractors, and service providers exposes us to possibility of delay or interruption of our operations. We anticipate that our business, financial condition and results of operations may be materially and adversely impacted as a result of these developments.
A terrorist attack or armed conflict could harm our business.
Terrorist activities, anti-terrorist activities and other armed conflicts involving the United States or other countries may adversely affect the United States and global economies. If any of these events occur, the resulting political instability and societal disruption could reduce overall demand for oil and natural gas, potentially putting downward pressure on demand for our operators’ services and causing a reduction in our revenues. Oil and natural gas facilities, including those of our operators, could be direct targets of terrorist attacks, such as the September 2019 attacks on a Saudi Arabian crude oil processing plant, and if infrastructure integral to our operators is destroyed or damaged, they may experience a significant disruption in their operations. Our insurance may not protect us against such occurrences. Any such disruption could materially adversely affect our financial condition, results of operations and cash available to pay dividends on our common stock.
Our business could be materially and adversely affected by security threats, including cybersecurity threats, and other disruptions.
Our business has become increasingly dependent on digital technologies to conduct certain exploration, development and production activities. We depend on digital technology to estimate quantities of oil, natural gas and NGL reserves, process and record financial and operating data, analyze seismic and drilling information, and communicate with our customers, employees and third-party partners. As an oil and gas producer, we face various security threats, including cybersecurity threats to gain unauthorized access to sensitive information or to render data or systems unusable; threats to the security of our facilities and infrastructure or third party facilities and infrastructure, such as processing plants and pipelines; and threats from terrorist acts.acts and acts of war. The potential for such security threats has subjected our operations to increased risks that could have a material adverse effect on our business. In particular, our implementation of various procedures and controls to monitor and mitigate security threats and to increase security for our information, facilities and infrastructure may result in increased capital and operating costs. Costs for insurance may also increase as a result of security threats, and some insurance coverage may become more difficult to obtain, if available at all. Moreover, there can be no assurance that such procedures and controls will be sufficient to prevent security breaches from occurring. If any of these security breaches were to occur, they could lead to losses of sensitive information, critical infrastructure or capabilities essential to our operations and could have a material adverse effect on our reputation, financial position, results of operations and cash flows.
Cybersecurity attacks in particular are becoming more sophisticated.sophisticated and coordinated in their attempts to access other parties’ information technology systems and data, including those of cloud providers and third parties with which such other parties conduct business. We rely extensively onupon the capacity, reliability and security of our information technology systems, including Internet sites, computer software, data hosting facilities and other hardware and platforms, some of which are hosted by third parties, to assist in conducting our business. Our technologies systems and networks, and those of our business associates, may become the target of cybersecurity attacks, including without limitation malicious software, attempts to gain unauthorized access to data and systems, and other electronic security breaches that could lead to disruptions in critical systems and materially and adversely affect us in a variety of ways, including the following:
| ● | unauthorized access to and release of seismic data, reserves information, strategic information or other sensitive or proprietary information, which could have a material adverse effect on our ability to compete for oil and gas resources; |
| ● | data corruption, or other operational disruption during drilling or completion activities could result in failure to reach the intended target or a drilling or other operational incident, personal injury, damage to equipment or the subsurface or otherwise adversely affect our operations; |
| ● | data corruption or operational disruption of production infrastructure, which could result in loss of production, |
| ● | unauthorized access to and release of personal identifying information of royalty owners, employees and vendors, which could expose us to allegations that we did not sufficiently protect that information; |
| ● | a cybersecurity attack on a vendor or service provider, which could result in supply chain disruptions and could delay or halt operations; |
| ● | a cybersecurity attack on third-party gathering, transportation, processing, fractionation, refining or export facilities, which could delay or prevent us from transporting and marketing our production, resulting in a loss of |
| ● | a cybersecurity attack on our automated and surveillance systems could cause a loss in production, potential environmental hazards and other operational problems; and |
| ● | a corruption or loss of our financial or operating data could result in events of non-compliance which could then lead to regulatory fines or penalties. |
These events could damage our reputation and lead to financial losses from remedial actions, loss of business or potential liability. Additionally,In addition, certain cybercybersecurity incidents, such as surveillance, may remain undetected for an extended period. We may be the target of such attacks and, as cybersecurity threats continue to evolve, we may be required to expend significant additional resources to continue to modify or enhance our protective measures or to investigate and remediate any security vulnerabilities. Additionally, the growth of cybersecurity attacks has resulted in evolving legal and compliance matters which impose significant costs that are likely to increase over time.
We cannot assess the extent of either the threat or the potential impact of future terrorist or cybersecurity attacks on the energy industry in general, and on us in particular, either in the short-term or in the long-term. Uncertainty surrounding such attacks may affect our operations in unpredictable ways.
Failure to adequately protect critical data and technology systems and the impact of data privacy regulation could materially affect us.
Along with our own data and information in the normal course of business, we collect and retain significant volumes of certain types of data, some of which are subject to specific laws and regulations. The transfer and use of this data both domestically and across international borders is becoming increasingly complex. Information technology solution failures, network disruptions and breaches of data security could disrupt our operations by causing delays or canceling or impeding processing of transactions and reporting financial results, resulting in the unintentional disclosure of employee, royalty owner, or other third party or our information, or damage to our reputation. There can be no assurance that a system failure or data security breach will not have a material adverse effect on our operations, financial condition, results of operations or cash flows.
In addition, new laws and regulations governing data privacy at the federal, state, international, national, provincial and local levels, including recent Colorado legislation, the European Union General Data Protection Regulation (“GDPR”) and the California Consumer Privacy Act (“CCPA”), and the unauthorized disclosure of confidential information, pose increasingly complex compliance challenges and potentially elevate costs, and any failure to comply with these laws and regulations could result in significant penalties and legal liability. For example, the GDPR applies to activities regarding personal data that may be conducted by us, directly or indirectly through vendors and subcontractors, from an establishment in the European Union. Failure to comply could result in significant penalties of up to a maximum of 4.0% of our global turnover that may materially adversely affect our business, reputation, results of operations, and cash flows. Similarly, the CCPA, which came into effect on January 1, 2020, gives California residents specific rights in relation to their personal information, requires that companies take certain actions, including notifications for security incidents and may apply to activities regarding personal information that is collected by us, directly or indirectly, from California residents. As interpretation and enforcement of the CCPA evolves, it creates a range of new compliance obligations, which could cause us to change our business practices, with the costs and complexity of compliance, and possibility for significant financial penalties for noncompliance that may materially adversely affect our business, reputation, results of operations, and cash flows.
Increased costs of capital could materially adversely affect our business.
Our business, ability to make acquisitions and operating results could be harmed by factors such as the availability, terms and cost of capital or increases in interest rates. Changes in any one or more of these factors could cause our cost of doing business to increase, limit our access to capital, limit our ability to pursue acquisition opportunities, and place us at a competitive disadvantage. A significant reduction in the availability of credit could materially and adversely affect our ability to achieve our planned growth and operating results.
Increases in interest rates could adversely affect the demand for our common stock.
An increase in interest rates may cause a corresponding decline in demand for equity investments, in particular for yield-based equity investments such as our common stock. Any such reduction in demand for our common stock resulting from other more attractive investment opportunities may cause the trading price of our common stock to decline.
Provisions of our charter documents and Delaware law may inhibit a takeover, which could limit the price investors might be willing to pay in the future for our common stock.
Provisions in our certificate of incorporation and bylaws may have the effect of delaying or preventing an acquisition of us or a merger in which we are not the surviving company and may otherwise prevent or slow changes in our board of directors and management. In addition, because we are incorporated in Delaware, we are governed by the provisions of Section 203 of the Delaware General Corporation Law. These provisions could discourage an acquisition of us or other change in control transactions and thereby negatively affect the price that investors might be willing to pay in the future for our common stock.
Risks Related to Regulatory Requirements
We are subject to complex federal, state, local and other laws and regulations that could adversely affect the cost, manner or feasibility of conducting our operations or expose us to significant liabilities.
Our exploration, production and transportation operations are subject to complex and stringent laws and regulations. In order to conduct our operations in compliance with these laws and regulations, we must obtain and maintain numerous permits, approvals and certificates from various federal, state and local governmental authorities. We may incur substantial costs in order to maintain compliance with these existing laws and regulations. In addition, our costs of compliance may increase if existing laws and regulations are revised or reinterpreted, or if new laws and regulations become applicable to our operations. Such costs could have a material adverse effect on our business, financial condition and results of operations. For example, in California, there have been proposals at the legislative and executive levels in the past for tax increases which have included a severance tax as high as 12.5% on all oil production in California. Although the proposals have not passed the California legislature, the State of California could impose a severance tax on oil in the future. One of our equity investeesCarbon California has significant oil production in California and while we cannot predict the impact of such a tax without having more specifics, the imposition of such a tax could have severe negative impacts on both our equity investee’sCarbon California’s willingness and ability to incur capital expenditures in California to increase production, could severely reduce or completely eliminate our equity investee’sits California profit margins and would result in lower oil production in our equity investee’sits California properties due to the need to shut-in wells and facilities made uneconomic either immediately or at an earlier time than would have previously been the case.
Our business is subject to federal, state and local laws and regulations as interpreted and enforced by governmental authorities possessing jurisdiction over various aspects of the exploration for, and the production and transportation of, oil and natural gas. Failure to comply with such laws and regulations, including any evolving interpretation and enforcement by governmental authorities, could have a material adverse effect on our business, financial condition and results of operations.
Changes to existing or new regulations may unfavorably impact us, could result in increased operating costs, and could have a material adverse effect on our financial condition and results of operations. For example, over the last few years, several bills have been introduced in Congress that, if adopted, would subject companies involved in oil and natural gas exploration and production activities to, among other items, additional regulation of and restrictions on hydraulic fracturing of wells, the elimination of certain U.S. federal tax incentives and deductions available for such activities, and the prohibition or additional regulation of private energy commodity derivative and hedging activities. Additionally, the Bureau of Land Management (“BLM”), acting under its authority pursuant to the Mineral Leasing Act of 1920, finalized new regulations in November 2016 that aimed to reduce waste of natural gas from federal and tribal leasehold by imposing new venting, flaring, and leak detection and repair requirements. In December 2017, BLM issued a final rule suspending implementation of the November 2016 rule until January 2019. In February 2018, the suspension was overturned by the U.S. District Court for Northern California. Implementation of these regulations remains uncertain due to ongoing litigation. If these regulations, or other potential regulations, particularly at the local level, are implemented, they could increase our operating costs, reduce our liquidity, delay or halt our operations or otherwise alter the way we conduct our business, which could in turn have a material adverse effect on our financial condition, results of operations and cash flows.
Operations may be exposed to significant delays, costs and liabilities as a result of environmental, health and safety requirements applicable to our business activities.
We may incur significant delays, costs and liabilities as a result of environmental, health and safety requirements applicable to our exploration, development and production activities. These delays, costs and liabilities could arise under a wide range of federal, state and local laws and regulations and enforcement policies relating to protection of the environment, health and safety, which have tended to become increasingly stringent over time. Failure to comply with these laws and regulations may result in the assessment of administrative, civil and criminal penalties, imposition of cleanup and site restoration costs and liens, and, in some instances, issuance of orders or injunctions limiting or requiring discontinuation of certain operations. We are often required to prepare and present to federal, state or local authorities data pertaining to the effect or impact that a proposed project may have on the environment, threatened and endangered species, and cultural and archaeological artifacts. The public may comment on and otherwise engage in the permitting process, including through judicial intervention. As a result, the permits we need may not be issued, or if issued, may not be issued in a timely manner or may impose requirements that restrict our ability to conduct operations.
In addition, claims for damages to persons or property, including natural resources, may result from the environmental, health and safety impacts of our operations. Strict liability and joint and several liability may be imposed under certain environmental laws, which could cause us to become liable for the conduct of others or for consequences of our own actions that were in compliance with all applicable laws at the time those actions were taken.
New laws, regulations or enforcement policies could be more stringent and impose unforeseen liabilities or significantly increase compliance costs. If we are not able to recover the resulting costs through increased revenues, our business, financial condition or results of operations could be adversely affected.
The adoption of climate change legislation or regulations restricting emissions of “greenhouse gases” could result in increased operating costs and reduced demand for the oil and natural gas we produce.
In response to findings that emissions of carbon dioxide, methane and other “greenhouse gases” present an endangerment to public health and the environment, the EPA has issued regulations to restrict emissions of greenhouse gases under existing provisions of the federal Clean Air Act. These regulations include limits on tailpipe emissions from motor vehicles and preconstruction and operating permit requirements for certain large stationary sources. The EPA has also adopted rules requiring the reporting of greenhouse gas emissions from specified large greenhouse gas emission sources in the United States, as well as certain onshore oil and natural gas production facilities, on an annual basis. In December 2015, the EPA finalized rules that added new sources to the scope of the greenhouse gases monitoring and reporting rule. These new sources include gathering and boosting facilities as well as completions and workovers from hydraulically fractured oil wells. The revisions also include the addition of well identification reporting requirements for certain facilities. More recently, inIn June 2016, the EPA finalized rules that establish new air emission controls for methane emissions from certain new, modified or reconstructed equipment and processes in the oil and natural gas source category, including production, processing, transmission and storage activities. However, over the past year the EPA has taketaken several steps to delay implementation of the agency’s methane standards, and proposed rulemaking in June 2017August 2019 to stayremove sources in the transmission and storage segment from the regulated source category and rescind the methane-specific requirements for a period of two yearsfrom the production and revisit implementation of the agency’s methane standards in its entirety.processing segments. The EPA has not yet published a final rule but, as a result of these developments, future implementation of the 2016 rules is uncertain at this time. In addition, various industry and environmental groups have separately challenged both the original methane requirements and the EPA’s attempts to delay implementation of the rules. As a result, substantial uncertainty exists with respect to future implementation of the EPA’s methane rules. Compliance with rules to control methane emissions would likely require enhanced record-keeping practices, the purchase of new equipment such as optical gas imaging instruments to detect leaks and the increased frequency of maintenance and repair activities to address emissions leaks. The rules would also likelymay require hiring additional personnel to support these activities or the engagement of third partythird-party contractors to assist with and verify compliance with these new and proposed rules and could increase the cost of our operations. The future implementation of theseThese rules, or similar proposed rules could result in increased compliance costs for us.
In addition, Congress has from time to time considered adopting legislation to reduce emissions of greenhouse gases and many states have already established greenhouse gas cap and trade programs. Most of these cap and trade programs work by requiring major sources of emissions, such as electric power plants, or major producers of fuels, such as refineries and gas processing plants, to acquire and surrender emission allowances. The number of allowances available for purchase is reduced each year in an effort to achieve the overall greenhouse gas emission reduction goal. Internationally, the United Nations Framework Convention on Climate Change finalized an agreement among 195 nations at the 21st Conference of the Parties in Paris with an overarching goal of preventing global temperatures from rising more than 2 degrees Celsius. The agreement includes provisions that every country take some action to lower emissions, but there is no legal requirement for how or by what amount emissions should be lowered.
California has been one of the leading states in adopting greenhouse gas emission reduction requirements and has implemented a cap and trade program as well as mandates for renewable fuels sources. California’s cap and trade program requires our equity investeeCarbon California to report its greenhouse gas emissions and essentially sets maximum limits or caps on total emissions of greenhouse gases from all industrial sectors that are or become subject to the program. This includes the oil and natural gas extraction sector of which our equity investeeCarbon California is a part. Our equity investee’sCarbon California’s main sources of greenhouse gas emissions for its Southern California oil and gas operations are primarily attributable to emissions from internal combustion engines powering generators to produce electricity, flares for the disposal of excess field gas, and fugitive emission from equipment such as tanks and components. Under the California program, the cap declines annually from 2013 through 2020. In July 2017, California extended the cap and trade program to 2030. Under the cap and trade program, our equity investeeCarbon California is required to obtain authorizations for each metric ton of greenhouse gases that it emits, either in the form of allowances (each the equivalent of one ton of carbon dioxide) or qualifying offset credits. A portion of the allowance will be granted by the state, but any shortfall between the state-granted allowance and the facility’s emissions will have to be addressed through the purchase of additional allowances either from the state or a third party. The availability of allowances will decline over time in accordance with the declining cap, and the cost to acquire such allowances may increase over time. However, we do not expect the cost to be material to our equity investee’sCarbon California’s operations.
The adoption of legislation or regulatory programs to reduce emissions of greenhouse gases could require us to incur increased operating costs, such as costs to purchase and operate emissions control systems, to acquire emissions allowances or comply with new regulatory or reporting requirements, or they could promote the use of alternative fuels and thereby decrease demand for the oil and gas that we produce. Any such legislation or regulatory programs could also increase the cost of consuming, and thereby reduce demand for, the oil and natural gas we produced. Consequently, legislation and regulatory programs to reduce emissions of greenhouse gases could have an adverse effect on our business, financial condition and results of operations. In addition to the regulatory efforts described above, there have also been efforts in recent years in the investment community promoting the divestment of fossil fuel equities as well as to pressure lenders and other financial services companies to limit or curtail activities with companies engaged in the extraction of fossil fuel reserves. Members of the investment community have recently increased their focus on sustainability practices, including practices related to GHGs and climate change, in the oil and natural gas industry. As a result of these efforts, our ability to access capital markets may be limited and our stock price may be negatively impacted. Finally, it should be noted that some scientists have concluded that increasing concentrations of greenhouse gases in the Earth’s atmosphere may produce climate changes that have significant physical effects, such as increased frequency and severity of storms, droughts and floods and other climatic events. Our hydraulic fracturing operations require large amounts of water. Such climatic events could have an adverse effect on our financial condition and results of operations.
Environmental legislation and regulatory initiatives, including those relating to hydraulic fracturing and underground injection, could result in increased costs and additional operating restrictions or delays.
We are subject to extensive federal, state and local laws and regulations concerning environmental protection. Government authorities frequently add to those regulations. Both oil and gas development generally and hydraulic fracturing in particular, are receiving increased regulatory attention.
Essentially all of our reserves in the Appalachia Basin are subject to or have been subjected to hydraulic fracturing. The reservoir rock in these areas, in general, has insufficient permeability to flow enough oil or natural gas to be economically viable without stimulation. The controlling regulatory agencies for well construction have standards that are designed specifically in anticipation of hydraulic fracturing. The stimulation process cost varies according to well location and reservoir. The regulatory environment may change with respect to the use of hydraulic fracturing. Any increase in compliance costs could negatively impact our ability to conduct our business.
While hydraulic fracturing historically has been regulated by state and natural gas commissions, the practice has become increasingly controversial in certain parts of the country, resulting in increased scrutiny and regulation from federal and state agencies. The EPA has asserted federal regulatory authority pursuant to the federal SDWA over hydraulic fracturing involving fluids that contain diesel fuel and published permitting guidance in February 2014 for hydraulic fracturing operations that use diesel fuel in fracturing fluids in those states in which EPA is the permitting authority. In recent years, the EPA has issued final regulations under the federal CAA establishing performance standards for completions of hydraulically fractured oil and natural gas wells, compressors, controllers, dehydrators, storage tanks, natural gas processing plants and certain other equipment. EPA also finalized rules in June 2016 that prohibit the discharge of wastewater from hydraulic fracturing operations to publicly owned wastewater treatment plants. Federal agencies have also proposed limits onrequirements for hydraulic fracturing activities on federal lands and many producing states, cities and counties have adopted, or are considering adopting, regulations that impose more stringent permitting, public disclosure and well construction requirements on hydraulic fracturing operations or bans or moratoria on drilling that effectively prohibit further production of oil and natural gas through the use of hydraulic fracturing or similar operations. For example, several jurisdictions in California have proposed various forms of moratoria or bans on hydraulic fracturing and other hydrocarbon recovery techniques, including traditional waterflooding, acid treatments and cyclic steam injection.
Moreover, while the scientific community and regulatory agencies at all levels are continuing to study a possible linkage between oil and gas activity and induced seismicity, some state regulatory agencies have modified their regulations or guidance to regulate potential causes of induced seismicity including fluid injection or oil and natural gas extraction. In addition, the CaliforniaDOGGR, renamed the Geologic Energy Management Division, of Oil, Gas & Geothermal Resources (DOGGR)or CalGEM, effective January 1, 2020, adopted regulations intended to bring California’s Class II Underground Injection Control (UIC) program into compliance with the federal Safe Drinking Water Act, under which some wells may require an aquifer exemption. DOGGR began reviewingreviewed all active UIC projects, regardless of whether an exemption is required. DOGGR has obtained aquifer exemptions for UIC wells identified as requiring an aquifer exemption. In addition, DOGGR, now CalGEM, has undertaken a comprehensive examination of existing regulations and plans to issueis in the process of issuing additional regulations with respect to certain oil and gas activities, in 2018, such as management of idle wells, pipelines, and underground fluid injection.injection and well construction. CalGEM announced in November 2019 that these rule updates would include public health and safety protections for communities near oil and gas production and independent reviews of permitting processes for hydraulic fracturing and other well stimulation practices. If new regulatory initiatives are implemented that restrict or prohibit the use of underground injection wells in areas where we rely upon the use of such wells in our operations, our costs to operate may significantly increase and our ability to continue production may be delayed or limited, which could have an adverse effect on our results of operation and financial position.
Any of the above factors could have a material adverse effect on our financial position, results of operations or cash flows and could make it more difficult or costly for us to perform hydraulic fracturing or underground injection.
Should we fail to comply with all applicable FERC administered statutes, rules, regulations and orders, we could be subject to substantial penalties and fines.
FERC has civil penalty authority under the Natural Gas Act (“NGA”NGA”), the Natural Gas Policy Act, and the rules, regulations, restrictions, conditions and orders promulgated under those statutes, including regulations prohibiting market manipulation in connection with the purchase or sale of natural gas, to impose penalties for current violations of up to approximately $1.2$1.3 million per day for each violation and disgorgement of profits associated with any violation. This maximum penalty authority established by statute will continue to be adjusted periodically for inflation.
Section 1(b) of the NGA exempts certain natural gas gathering facilities from regulation by FERC. We believe that our natural gas gathering pipelines meet the traditional tests FERC has used to establish a pipeline’s status as an exempt gatherer not subject to regulation as a natural gas company. While our systems have not been regulated by FERC as a natural gas company under the NGA, we are required to report aggregate volumes of natural gas purchased or sold at wholesale to the extent such transactions utilize, contribute to, or may contribute to the formation of price indices. In addition, Congress may enact legislation, FERC may adopt regulations, or a court may make a determination that may subject certain of our otherwise non-FERC jurisdictional facilities to further regulation. Failure to comply with those regulations in the future could subject us to civil penalty liability.
The adoption of derivatives legislation could have an adverse impact on our ability to use derivatives as hedges against fluctuating commodity prices.
In July 2010, the Dodd-Frank Act was enacted, representing an extensive overhaul of the framework for regulation of U.S. financial markets. The Dodd-Frank Act called for various regulatory agencies, including the SEC and the Commodities Futures Trading Commission (“CFTC”CFTC”), to establish regulations for implementation of many of its provisions. The Dodd-Frank Act contains significant derivatives regulations, including requirements that certain transactions be cleared on exchanges and that cash collateral (margin) be posted for such transactions. The Dodd-Frank Act provides for an exemption from the clearing and cash collateral requirements for commercial end-users, such as Carbon, and includes a number ofseveral defined terms used in determining how this exemption applies to particular derivative transactions and the parties to those transactions. We have satisfied the requirements for the commercial end-user exception to the clearing requirement and intend to continue to engage in derivative transactions.
In December 2016, the CFTC proposed rules on capital requirements that may have an impact on our hedging counterparties, as the proposed rules would require certain swap dealers and major swap participants to calculate capital requirements inclusive of swaps with commercial end-users. The CFTC has not yet acted on this proposed rulemaking. Also, in December 2016, the CFTC re-proposed regulations regarding position limits for certain futures and option contracts in the major energy markets and for swaps that are their economic equivalents, subject to exceptions for certain bona fide hedging transactions. The CFTC has not acted on the re-proposed position limit regulations. As these new position limit rules are not yet final, the impact of those provisions on us is uncertain at this time. However, as proposed, Carbon anticipates that its swaps would qualify as exempt bona fide hedging transactions. The ultimate effect of these new rules and any additional regulations is uncertain. New rules and regulations in this area may result in significant increased costs and disclosure obligations as well as decreased liquidity as entities that previously served as hedge counterparties exit the market.
Risks Related to Our Common Stock
We have incurred and will continue to incur increased costs and demands upon management and accounting and finance resources as a result of complying with the laws and regulations affecting public companies; any failure to establish and maintain adequate internal control over financial reporting or to recruit, train and retain necessary accounting and finance personnel could have an adverse effect on our ability to accurately and timely prepare our financial statements.
As a public company, we incur significant administrative, legal, accounting and other burdens and expenses beyond those of a private company, including those associated with corporate governance requirements and public company reporting obligations. We have had to and will continue to expend resources to supplement our internal accounting and financial resources, to obtain technical and public company training and expertise, and to develop and expand our quarterly and annual financial statement closing process in order to satisfy such reporting obligations.
Our management team must comply with various requirements of being a public company. We have devoted, and will continue to devote, significant resources to address these public company-associated requirements, including compliance programs and investor relations, as well as our financial reporting obligations. Complying with these rules and regulations results in higher legal and financial compliance costs as compared to a public company. As we continue to acquire other properties and expand our business, we expect these costs to increase.
If we fail to maintain an effective system of internal controls, we may not be able to accurately report our financial results or prevent fraud. As a result, current and potential stockholders could lose confidence in our financial reporting, which would harm our business and the trading price of our common stock.
We are required to disclose material changes made in our internal control over financial reporting on a quarterly basis and we are required to assess the effectiveness of our controls annually. Effective internal controls are necessary for us to provide reliable financial reports, prevent fraud and operate successfully as a public company. We cannot be certain that our efforts to maintain our internal controls will be successful or that we will be able to comply with our obligations under Section 404 of the Sarbanes Oxley Act of 2002. We may incur significant costs in our efforts to comply with Section 404. As a smaller reporting company, we are exempt from the requirement to obtain an external audit on the effectiveness of internal controls over financial reporting provided in Section 404(b) of the Sarbanes-Oxley Act. Any failure to maintain effective internal controls, or difficulties encountered in implementing or improving our internal controls, could harm our operating results or cause us to fail to meet our reporting obligations. Ineffective internal controls could also cause investors to lose confidence in our reported financial information, which would likely have a negative effect on the trading price of our common stock. For a description of a significant deficiency in our internal controls as of December 31, 2017, please see Note 13 to our consolidated financial statements.
An active, liquid and orderly trading market for our common stock does not exist and may not develop, and the price of our stock may be volatile and may decline in value.
There currently is not an active public market for our common stock. An active trading market may not develop or, if developed, may not be sustained. The lack of an active market may impair your ability to sell your shares of common stock at the time you wish to sell them or at a price that you consider reasonable. An inactive market may also impair our ability to raise capital by selling shares of common stock and may impair our ability to acquire other companies or assets by using shares of our common stock as consideration.
Our common stock is not currently eligible for listing on a national securities exchange.
Our common stock is not currently listed on a national securities exchange, and we do not currently meet the initial listing standards of a national securities exchange. We cannot assure you that we will be able to meet the initial listing standards of any national securities exchange, or, if we do meet such initial listing standards, that we will be able to obtain any such listing. Until our common stock is listed on a national securities exchange, we expect that it will continue to be eligible to be quoted on the OTCQB.Over-The-Counter Electronic Bulletin Board (“OTCQB”). An investor may find it difficult to obtain accurate quotations as to the market value of our common stock. If we fail to meet the criteria set forth in SEC regulations, various requirements may be imposed on broker-dealers who sell our securities to persons other than established customers and accredited investors. Consequently, such regulations may deter broker-dealers from recommending or selling our common stock, which may further affect its liquidity. This also makes it more difficult for us to raise additional equity capital in the public market.
Our common stock may be considered a “penny stock.”
The SEC has adopted regulations which generally define “penny stock” to be an equity security that has a market price of less than $5.00 per share, subject to specific exemptions. Effective March 15, 2017 and pursuant to a reverse stock split, each 20 shares of issued and outstanding common stock became one share of common stock and no fractional shares were issued. As of March 17, 2017,16, 2020, the closing price for our common stock on the OTCQB was $10.62 per share. Despite this, in the future, the market price of our common stock may be less than $5.00$4.30 per share and therefore may beis considered a “penny stock.” Broker and dealers effecting transactions in “penny stock” must disclose certain information concerning the transaction, obtain a written agreement from the purchaser and determine that the purchaser is reasonably suitable to purchase the securities. These rules may restrict the ability of brokers or dealers to sell our common stock and may affect your ability to sell shares of our common stock in the future.
We are a “smaller reporting company” and the reduced disclosure requirements applicable to smaller reporting companies may make our common stock less attractive to investors.
We are considered a “smaller reporting company” (a company that has a public float of less than $75$250 million). We are therefore entitled to rely on certain reduced disclosure requirements, such as an exemption from providing selected financial data and executive compensation information. We have utilized this exemption for each year since the year ended March 31, 2009. These exemptions and reduced disclosures in our SEC filings due to our status as a smaller reporting company mean our auditors do not review our internal control over financial reporting and may make it harder for investors to analyze our results of operations and financial prospects. We cannot predict if investors will find our common stock less attractive because we may rely on these exemptions.
Increasing attention to environmental, social and governance matters may impact our business, financial results or stock price.
In recent years, increasing attention has been given to corporate activities related to environmental, social and governance (“ESG”) matters in public discourse and the investment community. A number of advocacy groups, both domestically and internationally, have campaigned for governmental and private action to promote change at public companies related to ESG matters, including through the investment and voting practices of investment advisers, public pension funds, universities and other members of the investing community. These activities include increasing attention and demands for action related to climate change, promoting the use of substitutes to fossil fuel products, and encouraging the divestment of companies in the fossil fuel industry. These activities could reduce demand for our products, reduce our profits, increase the potential for investigations and litigation, impair our brand and have negative impacts on the price of our common stock and access to capital markets.
In addition, organizations that provide information to investors on corporate governance and related matters have developed ratings systems for evaluating companies on their approach to ESG matters. These ratings are used by some investors to inform their investment and voting decisions. Unfavorable ESG ratings may lead to increased negative investor sentiment toward us and our industry and to the diversion of investment to other industries, which could have a negative impact on our stock price and our access to and costs of capital.
Control of our stock by current stockholders is expected to remain significant.
Currently, our key stockholders directly and indirectly beneficially own a majority of our outstanding common stock. As a result, these affiliates have the ability to exercise significant influence over matters submitted to our stockholders for approval, including the election and removal of directors, amendments to our certificate of incorporation and bylaws and the approval of any business combination. This concentration of ownership may also have the effect of delaying or preventing a change of control of our company or discouraging others from making tender offers for our shares, which could prevent our stockholders from receiving an offer premium for their shares.
Terms of subsequent financings may adversely impact stockholder equity.
We may raise additional capital through the issuance of equity or debt in the future. In that event, the ownership of our existing shareholdersstockholders would be diluted, and the value of the stockholders’ equity in common stock could be reduced. If we raise more equity capital from the sale of common stock, institutional or other investors may negotiate terms more favorable than the current prices of our common stock. If we issue debt securities, the holders of the debt would have a claim to our assets that would be prior to the rights of shareholdersstockholders until the debt is paid. Interest on these debt securities would increase costs and could negatively impact operating results.
Preferred stock could be issued from time to time with designations, rights, preferences, and limitations as needed to raise capital. The terms of preferred stock will be determined by our Board of Directors and could be more advantageous to those investors than to the holders of common stock.
The borrowing base under our secured lending facility presently is $25 million and all borrowings under the facility are secured by a majority of our oil and natural gas assets. Borrowings outside the facility may have to be unsecured, and such borrowings, if obtainable, may have a higher interest rate, which would increase debt service could negatively impact operating results.
Our Certificate of Incorporation does not provide shareholdersstockholders the pre-emptive right to buy shares from us. As a result, stockholders will not have the automatic ability to avoid dilution in their percentage ownership of us.
Item 1B. Unresolved Staff CommentsComments.
None.
Information on Properties is contained in Item 1 of this Annual Report on Form 10-K.
We are subject to legal claims and proceedings in the ordinary course of our business. Management believes that should the controversies be resolved against us, none of the current pending proceedings would have a material adverse effect on us.
Item 4. Mine Safety Disclosures.
Not applicable.
Item 5. Market for Registrant’s Common Equity, Related Stockholder Matters and Issuer Purchases of Equity Securities.
Common Stock
Market Information
Carbon has one class of common shares outstanding, which has a par value of $0.01 per share. Our common stock is quoted throughon the OTC Markets (“OTCQB”)OTCQB under the symbol CRBO.
The limited and sporadic quotations of our common stock maydoes not constitute an established trading market for our common stock. There can be no assurance that an active market will develop for our common stock in the future. Effective March 15, 2017 and pursuant to a reverse stock split approved by the shareholders and Board of Directors, each 20 shares of issued and outstanding common stock became one share of common stock and no fractional shares were issued.
The following table below sets forth the high and low bid pricesprice per share of our common stock for each quarter for the years ended December 31, 2019 and 2018, as quoted on the OTCQB for the periods indicated and gives retroactive effect to the reverse stock split for all periods presented. All OTCQB quotations included herein reflectOTCQB. The information reflects inter-dealer prices, without retail mark-up, mark-down or commissioncommissions and may not necessarily represent actual transactions.transactions:
| Year Ended December 31, | Quarter | High | Low | |||
| 2017 | First | $12.80 | $6.00 | |||
| Second | $12.00 | $9.00 | ||||
| Third | $10.60 | $10.50 | ||||
| Fourth | $13.25 | $8.00 | ||||
| 2016 | First | $14.00 | $3.60 | |||
| Second | $6.00 | $5.00 | ||||
| Third | $6.40 | $4.00 | ||||
| Fourth | $9.40 | $4.00 |
| Year Ended December 31, | Quarter | High | Low | |||||||
| 2019 | First | $ | 10.00 | $ | 9.25 | |||||
| Second | $ | 10.00 | $ | 5.00 | ||||||
| Third | $ | 8.00 | $ | 4.00 | ||||||
| Fourth | $ | 4.00 | $ | 3.15 | ||||||
| 2018 | First | $ | 11.00 | $ | 9.80 | |||||
| Second | $ | 12.00 | $ | 9.80 | ||||||
| Third | $ | 13.00 | $ | 9.50 | ||||||
| Fourth | $ | 9.25 | $ | 6.50 | ||||||
As of March 29, 2018,16, 2020, the closing price for our common stock on the OTCQB was $9.80$4.30 per share.
Holders
As of March 29, 2018,16, 2020, there were approximately 723349 holders of record of our common stock. The number of holders does not include the shareholdersstockholders for whom shares are held in a “nominee” or “street” name.
Dividend Policy and RestrictionsDividends
We have not to date paid any cash dividends on our common stock. The payment of dividends in the future will be contingent upon our revenue and earnings, capital requirements, if any, capital requirements and general financial condition, and will be within the discretion of our Board of Directors. We have historically retained our future earnings to support operations and to finance our business.
Our ability to pay dividends is currently limited by:
| ● | the terms of our credit facility | |
| ● | the terms of the Carbon | |
| ● | the Delaware General Corporation Law, which provides that a Delaware corporation may pay dividends either |
Any determination to pay dividends will depend on our financial condition, capital requirements, results of operations, contractual limitations, legal restrictions, our required payments of principal associated with the term loan under our credit facility and any other factors the Board of Directors deems relevant.
Securities Authorized for Issuance Under Equity Compensation Plans
The information relating to our equity compensation planplans required by Item 5 is incorporated by reference to such information as set forth inItem 12. Security Ownership of Certain Beneficial Owners and Management and Related Stockholder Matters of this report.
UnregisteredRecent Sales of EquityUnregistered Securities; Use of Proceeds from Registered Securities
All sales of unregistered equity securities that occurred during the period covered by this report, and through December 31, 2017, have been previously reported in a Quarterly Report on Form 10-Q or a Current Report on Form 8-K.None
Item 6. Selected Financial Data.
Not Applicable.As a smaller reporting company, we are not required to provide information for this item.
Item 7. Management’s Discussion and Analysis of Financial Condition and Results of Operations.
The following discussion includes forward-looking statements about our business, financial condition and results of operations, including discussions about management’s expectations for our business. These statements represent projections, beliefs and expectations based on current circumstances and conditions, and you should not construe these statements either as assurances of performance or as promises of a given course of action. Instead, various known and unknown factors may cause our actual performance and management’s actions to vary, and the results of these variances may be both material and adverse. A description of material factors known to us that may cause our results to vary or may cause management to deviate from its current plans and expectations is set forth under “Risk Factors.” The following discussion should be read in conjunction with “Forward-Looking Statements,” “Risk Factors” and our consolidated financial statements, including the notes thereto appearing elsewhere in this Annual Report on Form 10-K.
Overview
Carbon is an independent oil and natural gas company engaged in the acquisition, exploration, development and production of oil, natural gas and natural gas liquids properties located in the United States. We currently develop and operate oil and gas properties in the Appalachian Basin in Kentucky, Ohio, Tennessee, Virginia and West Virginia, andin the Illinois Basin in Illinois and Indiana, and in the Ventura Basin in California through our wholly-owned and majority-owned subsidiaries. We own 100% of the outstanding interests of Nytis USA, which in turn owns 98.11% of Nytis LLC. Nytis LLC holds interests in our operating subsidiaries. We own 53.92% of Carbon California which consolidates as a majority-owned subsidiary. We focus on conventional and unconventional reservoirs, including shale, tight sands and coalbed methane. Our executive offices are in Denver, Colorado and we maintain offices in Lexington, Kentucky, and Santa Paula, California from which we conduct our and our equity investees’ oil and gas operations.
We also develop and operate oil and gas properties in the Appalachian Basin in Kentucky, Tennessee, Virginia and West Virginia and the Ventura Basin in California through our investments in Carbon Appalachia and Carbon California, respectively.
For a description of our assets, please see Part I, “Business” of this report.
At December 31, 2017,2019, our proved developed reserves and our interest in our equity investees’ proved developed reserves were comprised of 6%18.8% oil, 1%79.8% natural gas liquids (“NGL”), and 93% natural gas.1.4% NGL. Our current capital expenditure program is focused on the acquisition and development of oil and natural gas properties in areas where we currently operate. We believe that our asset and lease position, combined with our low operating expense structure and technical expertise, provides us with a portfolio of opportunities for the development of our oil and natural gas properties. Our growth plan is centered on the following activities:
| ● | acquire and develop | |
| ● | develop, optimize and maintain a portfolio of low risk, long-lived oil and natural gas properties that provide stable cash flows and attractive risk adjusted rates of return. |
Factors That Significantly Affect Our Financial Condition and Results of Operations
Our revenue, profitability and future growth rate depend on many factors which are beyond our control, including but not limited to, economic, political and regulatory developments and competition from other industry participants. Our financial results are sensitive to fluctuations in oil and natural gas prices. Oil and gas prices historically have been volatile and may fluctuate widely in the future due to a variety of factors, including but not limited to, prevailing economic conditions, supply and demand of hydrocarbons in the marketplace, actions by speculators, and geopolitical events such as wars or natural disasters. In March 2020, in response to the failure of the Organization of the Petroleum Exporting Countries and the Russian Federation to agree on production quotas, the Kingdom of Saudi Arabia announced its intent to maximize near-term oil production, which, together with the decline in demand due to slowed economic conditions attributable to COVID-19, contributed to a decline in the price of crude oil from $61.14 per barrel on December 31, 2019 to $28.70 per Bbl on March 16, 2020. The following table highlights the quarterly average of NYMEX oil and natural gas prices for the last eight calendar quarters:
| 2016 | 2017 | 2019 | 2018 | |||||||||||||||||||||||||||||||||||||||||||||||||||||||||||||
| Q1 | Q2 | Q3 | Q4 | Q1 | Q2 | Q3 | Q4 | Q1 | Q2 | Q3 | Q4 | Q1 | Q2 | Q3 | Q4 | |||||||||||||||||||||||||||||||||||||||||||||||||
| Oil (Bbl) | $ | 33.51 | $ | 45.60 | $ | 44.94 | $ | 49.33 | $ | 51.86 | $ | 48.29 | $ | 48.19 | $ | 55.39 | $ | 54.90 | $ | 59.96 | $ | 56.43 | $ | 56.87 | $ | 62.89 | $ | 67.90 | $ | 69.50 | $ | 58.83 | ||||||||||||||||||||||||||||||||
| Natural Gas (MMBtu) | $ | 2.06 | $ | 1.98 | $ | 2.93 | $ | 2.98 | $ | 3.07 | $ | 3.09 | $ | 2.89 | $ | 2.87 | $ | 3.00 | $ | 2.57 | $ | 2.38 | $ | 2.40 | $ | 3.13 | $ | 2.77 | $ | 2.88 | $ | 3.62 | ||||||||||||||||||||||||||||||||
Low oil and natural gas prices may decrease our revenues, may reduce the amount of oil, natural gas and natural gas liquids that we can produce economically and potentially lower our oil and natural gas reserves. Our estimated proved reserves and our interest in our equity investees’ estimated proved reserves may decrease if the economic life of the underlying producing wells is shortened as a result of lower oil and natural gas prices. A substantial or extended decline in oil or natural gas prices may result in future impairments of our proved reserves and our equity investees’ proved reserves and may materially and adversely affect our future business, financial condition, cash flows, results of operations or liquidity. Lower oil and natural gas prices may also reduce the amount of borrowing base under our bank credit facility, which is determined at the discretion of our lenderlenders and may make it more difficult to comply with the covenants and other restrictions under our bank credit facility.
We use the full cost method of accounting for our oil and gas properties and perform a ceiling test quarterly. The ceiling calculation utilizes a rolling 12-month average commodity price. Due to the effect of lower commodity prices in 2016, we recognized an impairment of approximately $4.3 million for the year ended December 31, 2016. We did not recognize an impairment in 2017.2019 or 2018.
Future write downs or impairments, if any, are difficult to predict and will depend not only on commodity prices, but also other factors that include, but are not limited to, incremental proved reserves that may be added each period, revisions to previous reserve estimates, capital expenditures and operating costs. There are numerous uncertainties inherent in the estimation of proved reserves and accounting for oil and natural gas properties in subsequent periods.
We use commodity derivative instruments, such as swaps and costless collars, to manage and reduce price volatility and other market risks associated with our production. These arrangements are structured to reduce our exposure to commodity price decreases, but they can also limit the benefit we might otherwise receive from commodity price increases. Please read “Business—RiskBusiness-Risk Management” for additional discussion of our commodity derivative contracts.
Impairment charges do not affect cash flows from operating activities but do adversely affect net income and stockholders’ equity. An extended decline in oil or natural gas prices may materially and adversely affect our future business, financial condition, cash flows and liquidity.
Future property acquisitions or dispositions could have a material impact on our financial condition and results of operations by increasing or decreasing our reserves, production and revenues as well as expenses and future capital expenditures. We currently anticipate that we would finance any future acquisitions with available borrowings under our credit facility, sales of properties or the issuance of additional equity or debt.
Operational Highlights
Weakness in commodity prices has had an adverse impact on our results of operations and the amount of cash flow available to invest in exploration and development activities. Based on expected future prices for oil and natural gas and the resultant reduced rate of return on drilling projects, we reduced our drilling activity in 2016 and 2017 in order to manage and optimize the utilization of our capital resources.
During 20162019 and 2017,2018, we concentrated our efforts on the acquisition and enhancementdevelopment of producing properties through the EXCO Acquisitionacquisitions consummated by Carbon California and our equity investmentsCarbon Appalachia. On December 31, 2018, we completed the purchase of Old Ironsides’ interests in Carbon Appalachia, andresulting in ownership of 100% of Carbon California, which completed a number of acquisitions.Appalachia. Our and our equity investee’s field development activities have consisted principally of oil-related drilling, remediation and return to production and recompletion projects in California and the optimization and streamlining of our natural gas gathering and compression facilities in Appalachia to provide more efficient and lower cost operations and greater flexibility in moving our production to markets with more favorable pricing.California. Since closing these acquisitions, we have focused on theoperating efficiencies and reduction of operating expenses, optimization of natural gas gathering and compression facilities, greater flexibility in transporting our production to markets with more favorable pricing, and the identification of development project opportunities. In addition, since 2010,opportunities to provide more efficient and lower-cost operations. During the second half of 2019, we have drilled 56 horizontal wellsexecuted a two-well drilling program in California, and as a Berea sandstone oil formation locatedresult of such drilling program, one well was completed in Eastern Kentucky, including two wells in 2017. We have enhanced our well performance, improved well drillingthe fourth quarter of 2019 and completion performance, including reduced drilling days, increased horizontal lateral length, decreased cost per frac stage and reduced days from spudthe other was completed during the first quarter of 2020. Subject to first production. In addition, we have established an infrastructurethe recovery of oil and natural gas gathering and water handling and disposal facilities which will benefitpricing in the economicsremainder of future drilling.2020, we plan to execute a five-well drilling program in California in 2020.
As of December 31, 2017,2019, we ownowned working interests in 2,858approximately 7,200 gross wells (2,585(6,600 net) and, royalty interests located primarily in California, Illinois, Indiana, Kentucky, Ohio, Tennessee, Virginia, and West Virginia and havehad leasehold positions in approximately 189,000313,900 net developed acres and approximately 222,4001,256,900 net undeveloped acres. Approximately 46%75.0% of thisthe undeveloped acreage is held by production and of the remaining undeveloped acreage, approximately 55%88.0% have lease terms of greater than five years remaining in the primary term or contractual extension periods.
As of December 31, 2017, Carbon Appalachia owns working interests in 4,151 gross wells (3,826 net) located in Kentucky, Tennessee, Virginia and West Virginia, and has leasehold positions in approximately 804,418 net developed acres and approximately 360,162 net undeveloped acres. Approximately 46% of this acreage is held by production and of the remaining acreage, approximately 55% have lease terms of greater than five years remaining in the primary term or contractual extension periods. As described below, as of December 31, 2017, our proportionate share in Carbon Appalachia was 27.24%.
As of December 31, 2017, Carbon California owns working interests in 208 gross wells (207 net) located in California and has leasehold positions in approximately 2,328 net developed acres and approximately 8,002 net undeveloped acres. Approximately 46% of this acreage is held by production and of the remaining acreage, approximately 55% have lease terms of greater than five years remaining in the primary term or contractual extension periods. As described below, as of December 31, 2017, our proportionate share in Carbon California was 17.81%.
Our oil and natural gas assets and those of our equity investees contain an inventory of multi-year proved developed non-producing properties with multiple potential future drilling locationsfield development projects which willmay provide significant drilling and completiongrowth opportunities from multiple proven formations when oil and natural gas commodity prices make such opportunities economical.warrant capital investment to develop the properties.
Recent Developments and Factors Affecting Comparability
We are continually evaluating producing property and land acquisition opportunities in our operating area and our equity investees’ operating areas which would expand our or our equity investees’ operations and provide attractive risk adjusted rates of return on invested capital. The drilling of additional oil and natural gas wells is contingent on our expectation of future oil and natural gas prices.
Investment in Affiliates
Carbon Appalachia
Carbon Appalachia was formed in 2016 by us, Yorktown and Old Ironsides to acquire producing assets in the Appalachian Basin in Kentucky, Tennessee, Virginia and West Virginia. Substantial operations commenced in April 2017. Carbon Appalachia’s board of directors is composed of four members. We have the right to appoint one member to the board of directors, and Patrick R. McDonald, our Chief Executive Officer, is our designee to the board of directors.
We currently serve as the manager of Carbon Appalachia and operate its day-to-day administration, pursuant to the terms of the limited liability company agreement of Carbon Appalachia and the management services agreement between Carbon Appalachia and us, subject to certain approval rights held by the board of directors of Carbon Appalachia. Because Carbon Appalachia is managed by its governing board, our ability to influence decisions with respect to acquisitions, capital calls or capital expenditures is limited.
Our Capital Contributions to Carbon Appalachia
Outlined below is a summary of (i) our contributions to Carbon Appalachia since its formation, (ii) our resulting percent ownership of Class A Units, which represents the voting interest in Carbon Appalachia, and (iii) our proportionate share in Carbon Appalachia after giving effect of all classes of ownership interests. Each contribution is described in detail following the table.
| Timing | Capital Contribution | Resulting Class A Units (%) | Proportionate Share (%) | |||||||
| April 2017 | $0.24 million | 2.00 | % | 2.98 | % | |||||
| August 2017 | $3.71 million | 15.20 | % | 16.04 | % | |||||
| September 2017 | $2.92 million | 18.55 | % | 19.37 | % | |||||
| November 2017 | Warrant exercise | 26.50 | % | 27.24 | % | |||||
In connection with the entry into the Carbon Appalachia LLC Agreement, we acquired a 2.0% voting interest represented by Class A Units of Carbon Appalachia in exchange for a capital contribution to Carbon Appalachia of $0.2 million, and we made a capital commitment of $2.0 million to Carbon Appalachia. The aggregate capital commitments to Carbon Appalachia from all members was $100.0 million. We also received the right to earn up to an additional 20% of Carbon Appalachia distributions (represented by our ownership of 100% of the issued and outstanding Class B Units of Carbon Appalachia) after certain return thresholds to the holders of Class A Units are met. The Class B Units were acquired for no additional cash consideration. In addition, we acquired a 1.0% interest represented by Class C Units of Carbon Appalachia in connection with the contribution to Carbon Appalachia of a portion of our working interest in our undeveloped properties in Tennessee. If Carbon Appalachia drills wells on these properties, it will pay 100% of the cost of drilling and completion for the first 20 wells in exchange for a 75% working interest in such properties. We, through our subsidiary, Nytis LLC, retain a 25% working interest in the properties.
Our initial capital contribution to Carbon Appalachia constituted a portion of the purchase price for the CNX Acquisition.
On April 3, 2017, we issued to Yorktown a warrant to purchase approximately 408,000 shares of our common stock at an exercise price of $7.20 per share (the “Appalachia Warrant”). The exercise price for the Appalachia Warrant is payable exclusively with Class A Units of Carbon Appalachia held by Yorktown, and the number of shares of our common stock for which the Appalachia Warrant is exercisable is determined, as of the time of exercise, by dividing (a) the aggregate unreturned capital of Yorktown’s Class A Units of Carbon Appalachia plus a 10% internal rate of return by (b) the exercise price. The Appalachia Warrant had a term of seven years and included certain standard registration rights with respect to the shares of our common stock issuable upon exercise of the Appalachia Warrant.
On November 1, 2017, Yorktown exercised the Appalachia Warrant resulting in the issuance of 432,051 shares of our common stock in exchange for Class A Units representing approximately 7.95% of then outstanding Class A Units of Carbon Appalachia. We accounted for the exercise through extinguishment of the warrant liability associated with the Appalachia Warrant of approximately $1.9 million and the receipt of Yorktown’s Class A Units as an increase to investment in affiliates in the amount of approximately $2.9 million. After giving effect to the exercise on November 1, 2017, we owned 26.5% of Carbon Appalachia’s outstanding Class A Units, 100% of its Class B Units and 100% of its Class C Units.
The issuance of the Class B Units and the Appalachia Warrant were in contemplation of each other, and under non-monetary related party guidance, we accounted for the Appalachia Warrant, at issuance, based on the fair value of the Appalachia Warrant as of the date of grant (April 3, 2017) and recorded a long-term warrant liability with an associated offset to Additional Paid in Capital (“APIC”). Future changes to the fair value of the Appalachia Warrant are recognized in earnings. We accounted for the fair value of the Class B Units at their estimated fair value at the date of grant, which became our investment in Carbon Appalachia with an offsetting entry to APIC.
As of the grant date of the Appalachia Warrant, we estimated that the fair market value of the Appalachia Warrant was approximately $1.3 million and the fair value of the Class B Units was approximately $924,000. The difference in the fair value of the Appalachia Warrant from the grant date though its exercise on November 1, 2017, was approximately $1.9 million and was recognized in warrant derivative gain in our consolidated statement of operations for the year ended December 31, 2017.
We use the HLBV method to determine our share of profits or losses in Carbon Appalachia and adjust the carrying value of our investment accordingly. The HLBV method is a balance-sheet approach that calculates the amount each member of an entity would receive if the entity were liquidated at book value at the end of each measurement period. The change in the allocated amount to each member during the period represents the income or loss allocated to that member. In the event of liquidation of Carbon Appalachia, available proceeds are first distributed to holders of Class A and Class C units until their contributed capital is recovered with an internal rate of return of 10%. Any additional distributions would then be shared between holders of Class A, Class B and Class C Units, with the Class A Units and Class C Units sharing 80% of the proceeds pro rata and the Class B Units receiving 20% of the proceeds. For purposes of the HLBV, our membership interest in Carbon Appalachia is represented by our approximate $6.9 million contributed capital. From the commencement of substantial operations on April 3, 2017 through December 31, 2017, Carbon Appalachia incurred a net gain, of which our share is approximately $1.1 million, and accordingly we recorded this amount to investment in affiliates.
Carbon California
Carbon California was formed in 2016 by us, Yorktown and Prudential to acquire producing assets in the Ventura Basin in California. Substantial operations commenced in February 2017. Carbon California’s board of directors is composed of five members. We have the right to appoint one member to the board of directors, and Patrick R. McDonald, our Chief Executive Officer, is our designee.
We currently serve as the manager of Carbon California and operate its day-to-day administration, pursuant to the terms of the limited liability company agreement of Carbon California and the management services agreement between Carbon California and us, subject to certain approval rights held by the board of directors of Carbon California.
In connection with the entry into the Carbon California LLC Agreement, and Carbon California engaging in the transactions described above, we received Class B Units and issued to Yorktown a warrant to purchase approximately 1.5 million shares of our common stock at an exercise price of $7.20 per share (the “California Warrant”). The exercise price for the California Warrant is payable exclusively with Class A Units of Carbon California held by Yorktown and the number of shares of our common stock for which the California Warrant is exercisable is determined, as of the time of exercise, by dividing (a) the aggregate unreturned capital of Yorktown’s Class A Units of Carbon California by (b) the exercise price. The California Warrant had a term of seven years and included certain standard registration rights with respect to the shares of our common stock issuable upon exercise of the California Warrant. Yorktown exercised the California Warrant on February 1, 2018.
The issuance of the Class B Units and the warrant were in contemplation of each other, and under non-monetary related party guidance, we accounted for the California Warrant, at issuance, based on the fair value of the California Warrant as of the date of grant (February 15, 2017) and recorded a long-term warrant liability with an associated offset to APIC. Future changes to the fair value of the California Warrant are recognized in earnings. We accounted for the fair value of the Class B Units at their estimated fair value at the date of grant, which became our investment in Carbon California with an offsetting entry to APIC.
As of the grant date of the California Warrant, we estimated that the fair market value of the California Warrant was approximately $5.8 million and the fair value of the Class B Units was approximately $1.9 million. As of December 31, 2017, we estimated that the fair value of the California Warrant was approximately $2.0 million. The difference in the fair value of the California Warrant from the grant date though December 31, 2017 was approximately $3.8 million and was recognized in warrant derivative gain in our consolidated statements of operations for the year ended December 31, 2017.
On February 1, 2018, Yorktown exercised the California Warrant resulting in the issuance of 1,527,778 shares of our common stock in exchange for Yorktown’s Class A Units of Carbon California representing approximately 46.96% of the outstanding Class A Units of Carbon California and a profits interest of approximately 38.59%. After giving effect to the exercise on February 1, 2018, we own 56.41% of the voting and profits interests of Carbon California and Yorktown currently owns 64.6% of the outstanding shares of our common stock as of March 28, 2018.
We use the HLBV method to determine our share of profits or losses in Carbon California and adjust the carrying value of our investment accordingly. The HLBV method is a balance-sheet approach that calculates the amount each member of an entity would receive if the entity were liquidated at book value at the end of each measurement period. The change in the allocated amount to each member during the period represents the income or loss allocated to that member. In the event of liquidation of Carbon California, to the extent that Carbon California has net income, available proceeds are first distributed to members holding Class A and Class B Units and any remaining proceeds are then distributed to members holding Class A units. From the commencement of substantial operations on February 15, 2017 through December 31, 2017, Carbon California incurred a net loss, of which our share (as a holder of Class B units for that period) is zero. Should Carbon California generate net income in future periods, we will not record income (or losses) until our share of such income exceeds the amount of our share of losses not previously reported.
Pending and Recent Acquisitions
We, through our equity investees, have made, or entered into definitive agreements to make, numerous acquisitions during 2017. When Carbon Appalachia and Carbon California make acquisitions, we contribute our pro rata portion of the purchase price to fund such acquisitions based on our ownership percentage in classes required to participate in capital calls. In 2017 and 2016, we contributed an aggregate of $15.9 million to Carbon Appalachia, Carbon California and Nytis USA in connection with acquisitions. While Carbon Appalachia and Carbon California made other insignificant acquisitions that are not specifically listed, the acquisitions described below most meaningfully affect the financial condition of Carbon Appalachia and Carbon California, and, therefore, us. See “Acquisition and Divestiture Activities” for more information about our acquisitions and divestitures.
Reverse Stock Split
Our shareholders and board of directors approved a reverse stock split of our common stock, effective March 15, 2017, pursuant to which every 20 shares of issued and outstanding common stock became one share of common stock and no fractional shares were issued. All references to the number of shares of common stock and per share amounts give retroactive effect to the reverse stock split for all periods presented. In connection with the reverse stock split, the number of authorized shares of our common stock was decreased from 200,000,000 to 10,000,000.
Preferred Stock Issuance to Yorktown
In connection with the anticipated closing of the 2018 Ventura Acquisition, Yorktown expects to make a contribution to us in an amount equal to our portion of the purchase price for the 2018 Ventura Acquisition in exchange for preferred stock in us. The Yorktown contribution is subject to negotiation and preparation of definitive transaction documents pending closing of the 2018 Ventura Acquisition.
How We Evaluate Our Operations
In evaluating our financial results, we focus on the mix of our revenues from oil, natural gas, and NGLs, the average realized price from sales of our production, our production margins, and our capital expenditures.
We also evaluate our rates of return on invested capital in our wells. We believe the quality of our assets combined with the technical capabilities of our management team can generate attractive rates of return as we develop our extensive resource base. Additionally, by focusing on concentrated acreage positions, we can build and ownutilize centralized production infrastructure, which enable us to reduce reliance on outside service companies, minimize costs, and increase our returns.
Principal Components of Our Cost Structure
| ● | Lease operating expenses. |
| ● | Pipeline operating expenses. Pipeline operating expenses are costs incurred to accept, transport and deliver gas across our midstream assets. |
| ● | Transportation and gathering costs.Transportation and gathering costs are incurred to bring oil and natural gas to market. Gathering refers to |
| ● | Production and property taxes. Production and property taxes consist of severance, property and |
| ● | Marketing gas purchases. Marketing gas purchases consist of third-party purchases of gas associated with our midstream operations. |
| ● | Depreciation, amortization and impairment. We use the full cost method of accounting for oil and gas properties. All costs incidental to the acquisition, exploration and development of oil and gas properties, including costs of undeveloped leasehold, dry holes and leasehold equipment, are capitalized. We perform a quarterly ceiling |
We perform our ceiling tests based on average first-of-the-month prices during the twelve-month period prior to the reporting date. For the year ended December 31, 2017, we did not incur a ceiling test impairment. During the year ended December 31, 2016, we incurred ceiling test impairments of approximately $4.3 million.
| ● | Depletion.Depletion is calculated using capitalized costs in the full cost pool, including estimated asset retirement costs and estimated future expenditures to be incurred in developing proved reserves, net of estimated salvage values and depleted based on a unit-of-production method. |
| ● | General and administrative expense. |
| ● | Interest expense. We finance a portion of our working capital requirements for |
| ● | Income tax |
On December 22, 2017, the TCJA was enacted. The TCJA significantly changes the U.S. corporate tax law by, among other things, lowering the U.S. corporate income tax rate from 35% to 21% beginning in January 2018. FASB ASC Topic 740, Income Taxes, requires companies to recognize the impact of the changes in tax law in the period of enactment.
Amounts recorded during the year ended December 31, 2017, related to the TCJA principally relate to the reduction in the U.S. corporate income tax rate to 21%, which resulted in (i) income tax expense of approximately $6.0 million from the revaluation of our deferred tax assets and liabilities as of the date of enactment and (ii) an income tax benefit totaling $74,000 related to a reduction in our existing valuation allowances relating to refundable Alternative Minimum Tax credits. Reasonable estimates were made based on our analysis of the remeasurement of its deferred tax assets and liabilities and valuation allowances under tax reform. These provisional amounts may be adjusted in future periods if additional information is obtained or further clarification and guidance is issued by regulatory authorities regarding the application of the law.
Other provisions of the TCJA that do not apply during 2017, but may impact income taxes in future years include (i) a limitation on the current deductibility of net interest expense in excess of 30% of adjusted taxable income, (ii) a limitation on the usage of NOLs generated after 2017 to 80% of taxable income, (iii) the inclusion of performance based compensation in determining the excessive compensation limitation, and (iv) the unlimited carryforward of NOLs.
Factors Affecting Our Business and Outlook
The price we receive for our oil, natural gas and NGL production heavily influences our revenue, profitability, access to capital and future rate of growth. Our revenues, cash flow from operations, and future growth depend substantially on factors beyond our control, such as economic, political, and regulatory developments and competition from other sources of energy. Oil, natural gas and NGLs are commodities, and therefore, their prices are subject to wide fluctuations in response to relatively minor changes in supply and demand. Sustained periods of low prices for oil, natural gas, or NGLs could materially and adversely affect our financial condition, our results of operations, the quantities of oil and natural gas that we can economically produce, and our ability to access capital. See – “Risk Factors - Oil, NGL and natural gas prices and differentials are highly volatile. Declines in commodity prices, especially steep declines in the price of oil, have adversely affected, and in the future will adversely affect, our financial condition and results of operations, cash flow, access to the capital markets and ability to grow.”
We use commodity derivative instruments, such as swaps and collars, to manage and reduce price volatility and other market risks associated with our production. These arrangements are structured to reduce our exposure to commodity price decreases, but they can also limit the benefit we might otherwise receive from commodity price increases. We do not apply hedge accounting, and therefore designate our current portfolio of commodity derivative contracts as hedges for accounting purposes and all changes in commodity derivative fair values are immediately recorded to earnings.
Like all businesses engaged in the exploration and production of oil and natural gas, we face the challenge of natural production declines. As initial reservoir pressures are depleted, oil and natural gas production from a given well naturally decreases. Thus, an oil and natural gas exploration and production company depletes part of its asset base with each unit of oil or natural gas it produces. We attempt to overcome this natural decline by acquiring more reserves than we produce, conducting field development projects or drilling to find additional reserves. Our future growth will depend on our ability to continue to acquire reserves in a cost-effective manner and enhance production levels from our existing reserves. Our ability to continue to acquire reserves and to add reserves through drilling is dependent on our capital resources and commodity prices and can be limited by many factors, including our ability to access capital in a cost-effective manner and to timely obtain drilling permits and regulatory approvals.
As with our historical acquisitions, any future acquisitions could have a substantial impact on our financial condition and results of operations. In addition, funding future acquisitions may require us to incur additional indebtedness or issue additional equity.
Factors Affecting Comparability of Results of Operations
Acquisitions affect the comparability of our financial statements from period to period. In December 2018, we completed the OIE Membership Acquisition and as a result, we now hold all of the issued and outstanding ownership interests of Carbon Appalachia, along with its direct and indirect subsidiaries. As a result, we consolidate Carbon Appalachia for financial reporting purposes. As discussed in Note 3 – Acquisitions in the consolidated financial statements in Item 8, we completed several acquisitions during 2018 in addition to the OIE Membership Acquisition; therefore, the financial data for 2018 is not comparable in all respects to the financial data for 2019 and is not necessarily indicative of our future results.
Results of Operations
The following table sets forth for the periods presented our selected historical statements of operations and production data and does not include results of operations from Carbon Appalachia or Carbon California.data.
| Twelve Months Ended | ||||||||||||
| December 31, | Percent | |||||||||||
| (in thousands except per unit data) | 2017 | 2016 | Change | |||||||||
| Revenue: | ||||||||||||
| Natural gas sales | $ | 15,298 | $ | 7,127 | 115 | % | ||||||
| Oil sales | 4,213 | 3,316 | 27 | % | ||||||||
| Commodity derivative gain (loss) | 2,928 | (2,259 | ) | -230 | % | |||||||
| Other income | 34 | 11 | 209 | % | ||||||||
| Total revenues | 22,473 | 8,195 | 174 | % | ||||||||
| Expenses: | ||||||||||||
| Lease operating expenses | 6,141 | 3,175 | 93 | % | ||||||||
| Transportation costs | 2,172 | 1,645 | 32 | % | ||||||||
| Production and property taxes | 1,276 | 820 | 56 | % | ||||||||
| General and administrative | 9,528 | 8,645 | 10 | % | ||||||||
| General and administrative-related party reimbursement | (2,703 | ) | - | 100 | % | |||||||
| Depreciation, depletion and amortization | 2,544 | 1,953 | 30 | % | ||||||||
| Accretion of asset retirement obligations | 307 | 176 | 74 | % | ||||||||
| Impairment of oil and gas properties | - | 4,299 | -100 | % | ||||||||
| Total expenses | 19,265 | 20,713 | -7 | % | ||||||||
| Operating income (loss) | $ | 3,208 | $ | (12,518 | ) | -126 | % | |||||
| Other income and (expense): | ||||||||||||
| Interest expense, net | $ | (1,202 | ) | $ | (367 | ) | -228 | % | ||||
| Warrant derivative gain | 3,133 | - | * | |||||||||
| Investment in affiliates | 1,158 | 49 | -2,263 | % | ||||||||
| Other income | 28 | 17 | 65 | % | ||||||||
| Total other income (expense) | $ | 3,117 | $ | (301 | ) | -1135 | % | |||||
| Production data: | ||||||||||||
| Natural gas (MMcf) | 4,895 | 2,823 | 73 | % | ||||||||
| Oil and liquids (MBbl) | 86 | 79 | 9 | % | ||||||||
| Combined (MMcfe) | 5,414 | 3,297 | 64 | % | ||||||||
| Average prices before effects of hedges: | ||||||||||||
| Natural gas (per Mcf) | $ | 3.13 | $ | 2.53 | 23 | % | ||||||
| Oil and liquids (per Bbl) | $ | 48.99 | $ | 41.95 | 16 | % | ||||||
| Combined (per Mcfe) | $ | 3.61 | $ | 3.17 | 14 | % | ||||||
| Average prices after effects of hedges**: | ||||||||||||
| Natural gas (per Mcf) | $ | 3.72 | $ | 1.89 | 97 | % | ||||||
| Oil and liquids (per Bbl) | $ | 48.83 | $ | 36.14 | 35 | % | ||||||
| Combined (per Mcfe) | $ | 4.15 | $ | 2.48 | 67 | % | ||||||
| Average costs (per Mcfe): | ||||||||||||
| Lease operating expenses | $ | 1.13 | $ | 0.96 | 18 | % | ||||||
| Transportation costs | $ | 0.40 | $ | 0.50 | -20 | % | ||||||
| Production and property taxes | $ | 0.24 | $ | 0.25 | -4 | % | ||||||
| Depreciation, depletion and amortization | $ | 0.47 | $ | 0.59 | -20 | % | ||||||
| Year Ended | ||||||||||||
| December 31, | Percent | |||||||||||
| (in thousands except production and per unit data) | 2019 | 2018(1) | Change | |||||||||
| Revenue: | ||||||||||||
| Natural gas sales | $ | 56,468 | $ | 16,018 | 253 | % | ||||||
| Natural gas liquids sales | 578 | 1,143 | (49 | )% | ||||||||
| Oil sales | 36,795 | 30,891 | 19 | % | ||||||||
| Transportation and handling | 1,928 | - | * | |||||||||
| Marketing gas sales | 16,920 | - | * | |||||||||
| Commodity derivative gain | 3,044 | 4,894 | * | |||||||||
| Other income | 892 | 105 | * | |||||||||
| Total revenues | 116,625 | 53,051 | 120 | % | ||||||||
| Expenses: | ||||||||||||
| Lease operating expenses | 29,714 | 15,960 | 86 | % | ||||||||
| Pipeline operating expenses | 11,153 | - | * | |||||||||
| Transportation and gathering costs | 6,086 | 4,453 | 37 | % | ||||||||
| Production and property taxes | 5,507 | 1,813 | 204 | % | ||||||||
| Marketing gas purchases | 18,684 | - | * | |||||||||
| General and administrative | 16,342 | 13,779 | (19 | )% | ||||||||
| General and administrative–deferred fees write-down | - | 1,999 | * | |||||||||
| General and administrative–related party reimbursement | - | (4,547 | ) | * | ||||||||
| Depreciation, depletion and amortization | 15,757 | 8,108 | 94 | % | ||||||||
| Accretion of asset retirement obligations | 1,625 | 868 | 87 | % | ||||||||
| Total expenses | 104,868 | 42,433 | 147 | % | ||||||||
| Operating income | $ | 11,757 | $ | 10,618 | 11 | % | ||||||
| Other income and (expense): | ||||||||||||
| Interest expense | $ | (12,848 | ) | $ | (5,920 | ) | 117 | % | ||||
| Warrant derivative gain | - | 225 | * | |||||||||
| Gain on derecognized equity investment in affiliate-Carbon California | - | 5,390 | * | |||||||||
| Investment in affiliates | 90 | 2,469 | * | |||||||||
| Other income | - | (3 | ) | * | ||||||||
| Total other (expense) income | $ | (12,758 | ) | $ | 2,161 | * | ||||||
| Production data: | ||||||||||||
| Natural gas (MMcf) | 21,436 | 5,320 | 303 | % | ||||||||
| Oil (MBbl) | 589 | 451 | 31 | % | ||||||||
| Natural gas liquids (MBbl) | 36 | 33 | 8 | % | ||||||||
| Combined (MMcfe) | 25,182 | 8,223 | 206 | % | ||||||||
| Average prices before effects of hedges: | ||||||||||||
| Natural gas (per Mcf) | $ | 2.63 | $ | 3.01 | (13 | )% | ||||||
| Oil and liquids (per Bbl) | $ | 62.50 | $ | 68.53 | (9 | )% | ||||||
| Natural gas liquids (per Bbl) | $ | 16.18 | 34.55 | (53 | )% | |||||||
| Combined (per Mcfe) | $ | 3.73 | $ | 5.84 | (36 | )% | ||||||
| Average prices after effects of hedges**: | ||||||||||||
| Natural gas (per Mcf) | $ | 2.80 | $ | 2.96 | (5 | )% | ||||||
| Oil and liquids (per Bbl) | $ | 62.38 | $ | 60.65 | 3 | % | ||||||
| Natural gas liquids (per Bbl) | $ | 16.18 | 34.55 | (53 | )% | |||||||
| Combined (per Mcfe) | $ | 3.87 | $ | 5.38 | (28 | )% | ||||||
| Average costs (per Mcfe): | ||||||||||||
| Lease operating expenses | $ | 1.18 | $ | 1.94 | (39 | )% | ||||||
| Transportation costs | $ | 0.24 | $ | 0.54 | (56 | )% | ||||||
| Production and property taxes | $ | 0.22 | $ | 0.22 | 0 | % | ||||||
| Depreciation, depletion and amortization | $ | 0.63 | $ | 0.99 | (36 | )% | ||||||
| * | Not meaningful or applicable |
| ** | Includes |
| (1) | Includes Carbon California activity for the period of consolidation from February 1, 2018 through December 31, 2018, and other than investment in affiliates does not include Carbon Appalachia activity during 2018 as Carbon Appalachia did not consolidate until December 31, 2018 upon the closing of the OIE Membership Acquisition. As of December 31, 2019, Carbon owned 100% of Carbon Appalachia and holds a 53.92% proportionate share of Carbon California. SeeFactors Affecting Comparability of Results of Operations. |
63
20172019 Compared to 20162018
Oil and natural gas sales- Revenues from salesSales of oil and natural gas, natural gas liquids and oil increased 87%by approximately $46.0 million during 2019 as compared to approximately $19.5 million2018 primarily due to a 206% increase in natural gas, natural gas liquids and oil sales volumes, partially offset by a 36% decrease in combined product pricing. The increases in production were primarily due to the acquisitions of Carbon Appalachia and Carbon California and the resultant consolidation of the related activity for the year ended December 31, 2017 from approximately $10.4 million for the year ended December 31, 2016. Oil revenues for the year ended December 31, 2017 increased 27% compared to the year ended December 31, 2016, primarily due to a 16% increase in oil prices and a 9% increase in oil production. Natural gas revenues in the year ended December 31, 2017 increased 115% over the same period in 2016 primarily due to an increase in gas production of 73% and a 23% in natural gas prices. The increases in production were primarily attributable to properties acquired in the EXCO Acquisition, which occurred in the fourth quarter of 2016.2019.
Commodity derivative gains (loss)(losses)- To achieve more predictable cash flows and to reduce our exposure to downward price fluctuations, we enter into derivative contracts using fixed price swap contracts and costless collars. Because we do not designate these derivatives as cash flow hedges, they do not receive hedge accounting treatment and all mark-to-market gains or losses, as well as settlement gains or losses on the derivative instruments, are currently recognized in our results of operations. The unrealized gains and losses represent the changes in the fair value of these contracts as oil and natural gas futures prices fluctuate relative to the fixed price we will receive from these contracts. For the years ended December 31, 20172019 and 2016,2018, we had commodity derivative gains of approximately $2.9$3.0 million and losses of approximately $2.3$4.9 million, respectively.
Lease operating expenses- Lease operating expenses for the year ended December 31, 2017 increased 93%approximately $14.0 million during 2019 as compared to the year ended December 31, 2016. This increase is principally attributed2018, primarily due to the acquisition of properties acquired inOIE Membership Acquisition and the EXCO Acquisition. Onresultant increased production volumes. Lease operating expenses associated with oil production are generally higher on a per Mcfe basis lease operating expenses increased from $0.96 per Mcfe for the year ended December 31, 2016 to $1.13 per Mcfe, for the year ended December 31, 2017. This increase was primarily attributed to decrease in personnel related costs during 2016 attributed to cost reduction measures (including wage freezes, preventative maintenance operations only and vendor negotiations) implemented by us in response to lower commodity prices.versus gas production.
Transportation and gathering costs- Transportation and gathering costs increased by 32% from the year ended December 31, 201637% during 2019, as compared to the year ended December 31, 2017, primarily attributed to the increased production as a result of the properties acquired in the EXCO Acquisition. On a per Mcfe basis, transportation costs decreased from $0.50 per Mcfe for the year ended December 31, 2016 to $0.40 per Mcfe for the year ended December 31, 20172018 primarily due to lower transportation costs per unit for the property acquired in the EXCOOIE Membership Acquisition compared to our other natural gas properties.and a full year of Carbon California operations.
Production and property taxes- Production and property taxes increased 56% from approximately $820,000 for the year ended December 31, 2016204% during 2019 as compared to approximately $1.3 million for the year ended December 31, 2017. This increase is primarily attributed2018 due to increased oil and natural gas sales as a result of property acquired in the EXCO Acquisition.consolidation of Carbon Appalachia and a full year of Carbon California production, partially offset by decreased ad valorem estimated tax rates. Production taxes averageaveraged approximately 4.2%4% and 4.3%2% of oil and natural gasproduct sales for the yearyears ended December 31, 20172019 and 2016,2018, respectively. PropertyProduction taxes rates, which can fluctuate by year,associated with oil production are determined by individual counties where we havegenerally lower on a per Mcfe basis versus gas production. Oil production accounted for approximately 14% and are assessed on33% of our oilproduction mix for the years ended December 31, 2019 and natural gas revenues one or two years in arrears depending upon the location of the production.2018, respectively.
Depreciation, depletion and amortization (DD&A)- DD&A increased from approximately $2.0$8.0 million for the year ended December 31, 2016during 2019 as compared to approximately $2.5 million for the year ended December 31, 20172018, primarily due to increased oil and natural gas production offset,and the increase in part, by a decrease in the depletion rate. The decrease in the depletion rate is primarily attributable to the properties acquired in the EXCO Acquisition which reduced our blended depletion rate. On a per Mcfe basis, DD&A decreased from $0.59 per Mcfe for the year ended December 31, 2016 to $0.47 per Mcfe for the year ended December 31, 2017.
Impairment of oil and gas properties-Due to lower commodity prices in 2016, we had impairment expenses of approximately $4.3 million forproperties associated with the year ended December 31, 2016. We did not record an impairment for the year ended December 31, 2017. The ceiling limitation calculation is not intended to be indicative of the fair market value of our proved reserves or future results. Impairment charges do not affect cash flow from operating activities but do adversely affect our net income and various components of our balance sheet. Any recorded impairment is not reversible at a later date.OIE Membership Acquisition.
General and administrative expenses- Cash-based generalGeneral and administrative expenses increased from approximately $6.2decreased by 4% during 2019 as compared to 2018, primarily due to $2.0 million in financing costs written off during 2018 for an abandoned equity offering. Such financing costs were not incurred during 2019. As a result of the year ended December 31, 2016 to approximately $8.4 million for the year ended December 31, 2017. The increase was primarily attributed to personnel-related and other costs associated in connection with our role as managerconsolidation of Carbon Appalachia and Carbon California, and decreases in personnel related costs during the year ended December 31, 2016 attributable to cost reduction measures implemented by us as response to low commodity prices. This increase wasmanagement reimbursements which partially offset by reimbursements of approximately $2.7 million received from Carbon Appalachia and Carbon California in connection with our role as manager of them. Non-cash-based compensation decreased from approximately $2.4 million for the year ended December 31, 2016 to approximately $1.1 million for the year ended December 31, 2017. We estimated that it was probable that certain of the performance units granted in 2014 and 2015 would vest and compensation costs of approximately $442,000 and $1.1 million related to those performance units were recognized for the year ended December 31, 2017 and 2016. Non-cash stock-based compensation and other general and administrative expenses are now eliminated. These management reimbursements account for a decrease of approximately $4.6 million during 2019 as compared to 2018. On a per Mcfe basis, cash-based general and administrative expenses, net of related party reimbursements, decreased from $1.23 per Mcfe for 2018 to $0.59 per Mcfe for 2019. Cash-based general and administrative expenses for the years ended December 31, 20172019 and 20162018 are summarized in the following table:
| Year Ended December 31, | Increase/ | |||||||||||
| 2017 | 2016 | (Decrease) | ||||||||||
| General and administrative expenses | ||||||||||||
| (in thousands) | ||||||||||||
| Stock-based compensation | $ | 1,106 | $ | 2,440 | $ | (1,334 | ) | |||||
| Cash-based general and administrative expenses | 8,422 | 6,205 | 2,217 | |||||||||
| Related party reimbursements | (2,703 | ) | - | (2,703 | ) | |||||||
| Total general and administrative expenses, net of related party reimbursement | $ | 6,825 | $ | 8,645 | $ | (1,820 | ) | |||||
| General and administrative expenses | Year Ended December 31, | |||||||
| (in thousands) | 2019 | 2018 | ||||||
| General and administrative expenses | $ | 16,342 | $ | 15,778 | ||||
| Adjustments: | ||||||||
| Stock-based compensation | (1,448 | ) | (1,133 | ) | ||||
| General and administrative – related party reimbursement | - | (4,547 | ) | |||||
| Cash-based general and administrative expense | $ | 14,894 | $ | 10,098 | ||||
Interest expense- Interest expense increased from approximately $367,000 for the year ended December 31, 2016by 117% during 2019 as compared to approximately $1.2 million for the year ended December 31, 20172018, primarily due to higher outstanding debt balances related to borrowings (i) to complete the EXCO Acquisition and (ii) to fund our share of 2017 acquisitions in Carbon Appalachia. In addition, our effective interest rate was higher in 2017 as compared to 2016.OIE Membership Acquisition.
65
Transportation and handling, marketing gas sales, pipeline operating expenses and marketing gas purchases–
Subsequent to the OIE Membership Acquisition on December 31, 2018, we consolidate Carbon Appalachia operations. The associated revenues and expenses are presented within our consolidated statements of operations during the year ended December 31, 2019. These revenues and expenses were not presented in our consolidated statements of operations during the year ended December 31, 2018.
The following table sets forth selected historicalLiquidity and Capital Resources
Our primary sources of liquidity and capital resources are cash flows from operations, borrowings under our credit facility and Carbon California Senior Revolving Notes, and the sale of non-core assets. Borrowings under the credit facility and Carbon California Senior Revolving Notes may be used to fund field development projects, to fund future complementary acquisitions and for general working capital purposes. We may use other sources of capital, including the issuance of debt or equity securities, to fund acquisitions or maintain financial flexibility.
As of December 31, 2019, our liquidity was approximately $17.9 million, consisting of cash on hand of approximately $900,000 and approximately $17.0 million of available borrowing capacity on our credit facility and Carbon California Senior Revolving Notes. On February 14, 2020, we amended our credit facility, resulting in a borrowing base of $73.0 million with subsequent borrowing base reductions totaling $6.0 million scheduled through May 1, 2020.
On December 31, 2018, we closed the OIE Membership Acquisition. As a result, we now own 100% of all interests in Carbon Appalachia; therefore, we receive 100% of the cash flows associated with Carbon Appalachia.
Prior to the consolidation of Carbon California and Carbon Appalachia effective February 1, 2018 and December 31, 2018, respectively, we generated operating cash flow by providing management services to these unconsolidated subsidiaries. These management service reimbursements were included in general and administrative – related party reimbursement on our consolidated statement of operations. We also received reimbursements of operating expenses, our share of which were included in investments in affiliates on our consolidated statement of operations. As we now consolidate Carbon California and Carbon Appalachia, these management and operating reimbursements are eliminated in the consolidated statement of operations and production data for Carbon Appalachia.the year ended December 31, 2019.
| April 3, 2017 (Inception) through December 31, 2017 | ||||
| (in thousands except production data) | ||||
| Revenue: | ||||
| Natural gas sales | $ | 16,128 | ||
| Oil sales | 685 | |||
| Gas transportation | 911 | |||
| Marketing | 11,315 | |||
| Commodity derivative gain | 2,545 | |||
| Total revenues | 31,584 | |||
| Expenses: | ||||
| Lease operating expenses | 5,587 | |||
| Transportation, gathering and compression | 4,160 | |||
| Production and property taxes | 1,464 | |||
| Gas purchase-marketing | 9,290 | |||
| General and administration | 2,444 | |||
| Depreciation, depletion, and amortization | 2,439 | |||
| Accretion of asset retirement obligations | 198 | |||
| Management and operating fees, related party | 1,182 | |||
| Total expenses | 26,764 | |||
| Operating income | 4,820 | |||
| Other expense: | ||||
| Class B units issuance | 924 | |||
| Interest expense | 891 | |||
| Net income | $ | 3,005 | ||
| Production data: | ||||
| Natural gas (Mcf) | 4,377,617 | |||
| Oil (Bbl) | 3,368 | |||
| Combined (Mcfe) | 4,397,825 | |||
66
Carbon California
The following table sets forth selected historical statement of operations and production data for Carbon California.
| February 15, 2017 (Inception) through December 31, 2017 | ||||
| (in thousands except production data) | ||||
| Revenue: | ||||
| Natural gas sales | $ | 1,036 | ||
| Oil sales | 7,024 | |||
| Natural gas liquids sales | 556 | |||
| Commodity derivative loss | (1,381 | ) | ||
| Total revenues | 7,235 | |||
| Expenses: | ||||
| Lease operating expenses | 3,726 | |||
| Transportation costs | 1,442 | |||
| Production and property taxes | 527 | |||
| General and administrative | 2,177 | |||
| Depreciation, depletion and amortization | 1,304 | |||
| Accretion of asset retirement obligations | 192 | |||
| Management and operating fees, related party | 525 | |||
| Total operating expenses | 9,893 | |||
| Operating loss | (2,658 | ) | ||
| Other expense: | ||||
| Class B units issuance | 1,854 | |||
| Interest expense | 2,040 | |||
| Net loss | $ | (6,552 | ) | |
| Production data: | ||||
| Natural gas (Mcf) | 351,287 | |||
| Oil (Bbl) | 141,219 | |||
| NGLs (Bbl) | 23,410 | |||
| Combined (Mcfe) | 1,339,061 | |||
67
LiquidityWe continuously evaluate our portfolio of oil and Capital Resourcesgas assets and make acquisitions, investments and divestitures as part of our strategic plan. In the current environment, we are actively analyzing options such as selling assets, including potentially our Appalachian business, primarily in order to reduce indebtedness and, to a lesser extent, to fund higher value acquisition or development opportunities. Any decision to divest would be made based upon several criteria, including but not limited to the value we could obtain for such assets, the outlook for commodity prices, our expected return on invested capital and the impact on our overall leverage.
Commodity Derivatives
Our exploration, development and acquisition activities may require us to make significant operating and capital expenditures. Historically, we have used cash flow from operations and our bank credit facility as our primary sources of liquidity and on occasion, we have engaged in the sale of assets. Changes in the market prices for oil and natural gas directly impact our level of cash flow generated from operations. The prices we receive for our production are determined by prevailing market conditions and greatly influence our revenue, cash flow, profitability, access to capital and future rate of growth. We employ a commodity hedging strategy in an attempt to moderate the effects of commodity price fluctuations on our cash flow.
The following table reflects our outstanding derivative agreements as of December 31, 2017:
| Natural Gas Swaps | Natural Gas Collars | Oil Swaps | ||||||||||||||||||||||
| Weighted | Weighted | Weighted | ||||||||||||||||||||||
| Average | Average Price | Average | ||||||||||||||||||||||
| Year | MMBtu | Price (a) | MMBtu | Range (a) | Bbl | Price (b) | ||||||||||||||||||
| 2018 | 3,390,000 | $ | 3.01 | 90,000 | $3.00 - $3.48 | 63,000 | $ | 53.58 | ||||||||||||||||
| 2019 | 2,596,000 | $ | 2.86 | - | - | 48,000 | $ | 53.76 | ||||||||||||||||
This hedge program mitigates uncertainty regarding cash flow that we will receive with respect to a portion of our expected production through 2019.2022. Future hedging activities may result in reduced income or even financial losses to us.See“Risk Factors—TheFactors-The use of derivative instruments used in hedging arrangements could result in financial losses or reduce income,” in Part I, Item 1A—Risk Factors for further details of the risks associated with our hedging activities. In the future, we may determine to increase or decrease our hedging positions. See Note 14 – Commodity Derivatives in the consolidated financial statements in Item 8 for more information, including further details about our outstanding derivatives.
Credit Facilities and Notes Payable
We have derivative contracts with BP Energy Company pursuant to an ISDA Master Agreement. BP Energy Company is currently our only derivative contract counterparty.
We are the manager of both Carbon California and Carbon Appalachia, and in connection with our role as manager, certain general and administrative expenses will be reimbursed. The amount of reimbursement by Carbon California is $600,000 annually, payable quarterly. The amount of the reimbursement from Carbon Appalachia varies quarterly based upon the percentage of production of Carbon Appalachia as a percentage of the total volume of production from us and Carbon Appalachia. Total reimbursements from Carbon California and Carbon Appalachia were approximately $1.0$500.0 million and $1.6 million, respectively, during the year ended December 31, 2017.
Historically, the primary source of liquidity has been our credit facility (described below). We may use other sources of capital, including the issuance of debt or equity securities, to fund acquisitions or maintain our financial flexibility.
Bank Credit Facility
Our Credit Facility
In 2016, we entered into a 4-year $100.0 million senior secured asset-based revolvingbank credit facility with Prosperity Bank (formerly known as LegacyTexas Bank. LegacyTexas Bank isBank), as the initial lenderadministrative agent, and actsa syndicate of financial institutions, as administrative agent.
lenders. The credit facility has a maximum availability of $100.0 million (with a $500,000 sublimit for letters of credit), which availability is subject to the amount of the borrowing base. The initial borrowing base established under the credit facility was $17.0 million. The borrowing base is subject to semi-annual redeterminations in March and September. On March 30, 2017, the borrowing base was increased to $23.0 million. Our effective borrowing rateof $75.0 million at December 31, 20172019 and $72.0 million at March 16, 2020, the outstanding balance of which was approximately 5.67%. On$69.2 million at December 31, 2019 and $71.2 million at March 28, 2018,16, 2020. Additionally, we have $15.0 million associated with a term loan under the borrowing basesame facility, which balance was increasedapproximately $5.8 million at December 31, 2019 and $3.3 million at March 16, 2020. Finally, we have notes payable to $25.0 million,Old Ironsides, the balance of which was approximately $23.1$25.7 million was drawn as of March 31, 2018. Pursuant to the credit agreement amendment entered into on March 27, 2018, we are subject to a minimum liquidity covenant of $750,000.
The credit facility is guaranteed by each of our existing and future subsidiaries (subject to certain exceptions). Our obligations and those of our subsidiary guarantors under the credit facility are secured by essentially all of our tangible and intangible personal and real property (subject to certain exclusions).
Interest is payable quarterly and accrues on borrowings under the credit facility at a rate per annum equal to either (i) the base rate plus an applicable margin between 0.50% and 1.50% or (ii) the Adjusted LIBOR rate plus an applicable margin between 3.50% and 4.50% at our option. The actual margin percentage is dependent on the credit facility utilization percentage. We are obligated to pay certain fees and expenses in connection with the credit facility, including a commitment fee for any unused amounts of 0.50%.
The credit facility contains affirmative and negative covenants that, among other things, limit our ability to (i) incur additional debt; (ii) incur additional liens; (iii) sell, transfer or dispose of assets; (iv) merge or consolidate, wind-up, dissolve or liquidate; (v) make dividends and distributions on, or repurchases of, equity; (vi) make certain investments; (vii) enter into certain transactions with our affiliates; (viii) enter into sales-leaseback transactions; (ix) make optional or voluntary payments of debt; (x) change the nature of our business; (xi) change our fiscal year to make changes to the accounting treatment or reporting practices; (xii) amend constituent documents; and (xiii) enter into certain hedging transactions.
The affirmative and negative covenants are subject to various exceptions, including basket amounts and acceptable transaction levels. In addition, the credit facility requires our compliance, on a consolidated basis, with (i) a maximum Debt/EBITDA ratio of 3.5 to 1.0 and (ii) a minimum current ratio of 1.0 to 1.0.
In the third quarter of 2017, we contributed approximately $6.6 million to Carbon Appalachia to fund its share of producing oil and gas properties acquired during the third quarter. This funding was provided primarily with borrowings under the credit facility. The Debt/EBITDA and current ratio covenants negotiated at the time the credit facility was established did not contemplate our contribution for our investment in Carbon Appalachia and, as a result, we were not in compliance with financial covenants associated with the credit facility as of December 31, 2017. However, we have obtained a waiver of the Debt/EBITDA ratio2019 and the current ratio covenants as of December 31, 2017. On March 27, 2018, the credit facility was amended to revise the calculation of the Leverage Ratio from a Debt/EBITDA ratio to a Net Debt/Adjusted EBITDA ratio, reset the testing period used16, 2020.
For further information about our outstanding debt, see Note 7 – Credit Facilities and Notes Payable in the determination of Adjusted EBITDA, eliminate the minimum current ratio and substitute alternative liquidity requirements, including maximum allowed current liabilitiesconsolidated financial statements in relation to current assets, minimum cash balance requirements and maximum aged trade payable requirements.
We may at any time repay the loans under the credit facility, in whole or in part, without penalty. We must pay down borrowings under the credit facility or provide mortgages of additional oil and natural gas properties to the extent that outstanding loans and letters of credit exceed the borrowing base.
As required under the terms of the credit facility, we entered into derivative contracts with fixed pricing for a certain percentage of our production. We are a party to an ISDA Master Agreement with BP Energy Company that established standard terms for the derivative contracts and an inter-creditor agreement with LegacyTexas Bank and BP Energy Company whereby any credit exposure related to the derivative contracts entered into by us and BP Energy Company is secured by the collateral and backed by the guarantees supporting the credit facility.Item 8.
Carbon Appalachia’s Credit Facility
In connection and concurrently with the closing of the CNX Acquisition, Carbon Appalachia Enterprises, LLC, formerly known as Carbon Tennessee Company, LLC (“Carbon Appalachia Enterprises”), a subsidiary of Carbon Appalachia, entered into a 4-year $100.0 million (with a $1,500,000 sublimit for letters of credit) senior secured asset-based revolving credit facility with LegacyTexas Bank with an initial borrowing base of $10.0 million (the “CAE Credit Facility”).
In connection with and concurrently with the closing of the Enervest Acquisition, the borrowing base of the CAE Credit Facility increased to $22.0 million and Carbon Appalachia Enterprises borrowed $8.0 million. In connection with and concurrently with the closing of the Cabot Acquisition, Carbon Appalachia Enterprises borrowed $20.4 million under the CAE Credit Facility.
On September 29, 2017, Carbon Appalachia Enterprises amended the CAE Credit Facility, which increased the borrowing base to $50.0 million with redeterminations as of April 1 and October 1 each year. As of December 31, 2017, there was approximately $38.0 million outstanding under the CAE Credit Facility.
The CAE Credit Facility is guaranteed by each of CAE’s existing and future direct or indirect subsidiaries (subject to certain exceptions). CAE’s obligations and those of CAE’s subsidiary guarantors under the CAE Credit Facility are secured by essentially all of CAE’s tangible and intangible personal and real property (subject to certain exclusions).
Interest is payable quarterly and accrues on borrowings under the CAE Credit Facility at a rate per annum equal to either (i) the base rate plus an applicable margin between 0.00% and 1.00% or (ii) the Adjusted LIBOR rate plus an applicable margin between 3.00% and 4.00% at our option. The actual margin percentage is dependent on the CAE Credit Facility utilization percentage. CAE is obligated to pay certain fees and expenses in connection with the CAE Credit Facility, including a commitment fee for any unused amounts of 0.50%.
The CAE Credit Facility contains affirmative and negative covenants that, among other things, limit CAE’s ability to (i) incur additional debt; (ii) incur additional liens; (iii) sell, transfer or dispose of assets; (iv) merge or consolidate, wind-up, dissolve or liquidate; (v) make dividends and distributions on, or repurchases of, equity; (vi) make certain investments; (vii) enter into certain transactions with our affiliates; (viii) enter into sales-leaseback transactions; (ix) make optional or voluntary payments of debt; (x) change the nature of our business; (xi) change our fiscal year to make changes to the accounting treatment or reporting practices; (xii) amend constituent documents; and (xiii) enter into certain hedging transactions.
The affirmative and negative covenants are subject to various exceptions, including basket amounts and acceptable transaction levels. In addition, the CAE Credit Facility requires CAE’s compliance, on a consolidated basis, with (i) a maximum Debt/EBITDA ratio of 3.5 to 1.0 and (ii) a minimum current ratio of 1.0 to 1.0.
CAE may at any time repay the loans under the CAE Credit Facility, in whole or in part, without penalty. CAE must pay down borrowings under the CAE Credit Facility or provide mortgages of additional oil and natural gas properties to the extent that outstanding loans and letters of credit exceed the borrowing base.
Carbon California’s Private Placement Notes
In connection with the CRC Acquisition, Carbon California (i) entered into a Note Purchase Agreement (the “Note Purchase Agreement”) for the issuance and sale of Senior Secured Revolving Notes to Prudential Legacy Insurance Company of New Jersey and Prudential Insurance Company of America with a revolving borrowing capacity of $25.0 million (the “Senior Revolving Notes”) which mature on February 15, 2022 and (ii) entered into a Securities Purchase Agreement (the “Securities Purchase Agreement”) with Prudential for the issuance and sale of $10.0 million of Senior Subordinated Notes (the “Subordinated Notes”) due February 15, 2024. We are not a guarantor of the Senior Revolving Notes or the Subordinated Notes. The closing of the Note Purchase Agreement and the Securities Purchase Agreement on February 15, 2017, resulted in the sale and issuance by Carbon California of (i) Senior Revolving Notes in the principal amount of $10.0 million and (ii) Subordinated Notes in the original principal amount of $10.0 million. The maximum principal amount available under the Senior Revolving Notes is based upon the borrowing base attributable to Carbon California’s proved oil and gas reserves which is to be determined upon delivery of any reserve report. The current borrowing base is $15.0 million, of which $11.0 million is outstanding as of December 31, 2017. The ability of Carbon California to make distributions to its owners, including us, is dependent upon the terms of the Note Purchase Agreement and Securities Purchase Agreement, which currently prohibit distributions unless they are agreed to by Prudential.
Interest is payable quarterly and accrues on borrowings under the Senior Revolving Notes at a rate per annum equal to either (i) the prime rate plus an applicable margin of 4.00% or (ii) the LIBOR rate plus an applicable margin of 5.00% at our option. Carbon California is obligated to pay certain fees and expenses in connection with the Senior Revolving Notes, including a commitment fee for any unused amounts of 0.50%. Interest is payable quarterly and accrues on the Subordinated Notes at a fixed rate of 12.0% per annum.
The Senior Revolving Notes and the Subordinated Notes contain affirmative and negative covenants that, among other things, limit Carbon California’s ability to (i) incur additional debt; (ii) incur additional liens; (iii) sell, transfer or dispose of assets; (iv) merge or consolidate, wind-up, dissolve or liquidate; (v) make dividends and distributions on, or repurchases of, equity; (vi) make certain investments; (vii) enter into certain transactions with our affiliates; (viii) enter into sales-leaseback transactions; (ix) make optional or voluntary payments of debt; (x) change the nature of our business; (xi) change our fiscal year to make changes to the accounting treatment or reporting practices; (xii) amend constituent documents; and (xiii) enter into certain hedging transactions.
The affirmative and negative covenants are subject to various exceptions, including basket amounts and acceptable transaction levels. In addition, (i) the Senior Revolving Notes require Carbon California’s compliance, on a consolidated basis, with (A) a maximum Debt/EBITDA ratio of 4.0 to 1.0, stepping down to 3.5 to 1.0 starting with the quarter ending June 30, 2018, (B) a maximum Senior Revolving Notes/EBITDA ratio of 2.5 to 1.0, (C) a minimum interest coverage ratio of 3.0 to 1.0 and (D) a minimum current ratio of 1.0 to 1.0 and (ii) the Subordinated Notes require Carbon California’s compliance, on a consolidated basis, with (A) a maximum Debt/EBITDA ratio of 4.5 to 1.0, stepping down to 4.0 to 1.0 starting with the quarter ending June 30, 2018, (B) a maximum Senior Revolving Notes/EBITDA ratio of 3.0 to 1.0, (C) a minimum interest coverage ratio of 2.5 to 1.0, (D) an asset coverage test whereby indebtedness may not exceed the product of 0.65 times Adjusted PV-10 set forth in the most recent reserve report, (E) maintenance of a minimum borrowing base of $10,000,000 under the Senior Revolving Notes and (F) a minimum current ratio of 0.85 to 1.00.
Carbon California may at any time repay the Senior Revolving Notes, in whole or in part, without penalty. Carbon California must pay down Senior Revolving Notes or provide mortgages of additional oil and natural gas properties to the extent that outstanding loans and letters of credit exceed the borrowing base. Carbon California may not voluntarily prepay the Subordinated Notes prior to February 15, 2019, and thereafter may do so subject to a premium of 3% which reduces to 0% from and after February 17, 2020. In the event the Subordinated Notes are accelerated prior to February 15, 2019, Carbon California would owe a make-whole premium calculated using a discount rate of 1% over United States Treasury securities rates, and otherwise calculated as provided in the Securities Purchase Agreement.
Borrowings under the Senior Revolving Notes and net proceeds from the Subordinated Notes issuances were used to fund the Mirada Acquisition and the CRC Acquisition. Additional borrowings under the Senior Revolving Notes may be used to fund field development projects and to fund future complementary acquisitions and for general working capital purposes of Carbon California.
As of December 31, 2017, Carbon California was in breach of its covenants; however, it obtained a waiver for the December 31, 2017 and March 31, 2018 covenants. It is anticipated that covenants will be met in the future. SeeLiquidity and Management’s Plans within Note 1 to the Carbon California financial statements.
Sources and Uses of Cash
Our primary sources of liquidity and capital resources are operating cash flow and borrowings under our credit facility. Our primary uses of funds are expenditures for acquisition, exploration and development activities, leasehold and property acquisitions, other capital expenditures and debt service.
Low prices for our oil and natural gas production may adversely impact our operating cash flow and amount of cash available for development activities.
The following table presents net cash provided by or used in operating, investing and financing activities.activities:
| Years Ended | ||||||||
| December 31, | ||||||||
| (in thousands) | 2017 | 2016 | ||||||
| Net cash provided by (used in) operating activities | $ | 3,920 | $ | (3,142 | ) | |||
| Net cash used in investing activities | $ | (8,650 | ) | $ | (8,754 | ) | ||
| Net cash provided by financing activities | $ | 5,522 | $ | 12,449 | ||||
| Year Ended | ||||||||
| December 31, | ||||||||
| (in thousands) | 2019 | 2018 | ||||||
| Net cash provided by operating activities | $ | 18,856 | $ | 10,845 | ||||
| Net cash used in investing activities | $ | (6,570 | ) | $ | (70,436 | ) | ||
| Net cash (used in) provided by financing activities | $ | (17,118 | ) | $ | 63,677 | |||
Operating Activities
Net cash provided by or used in operating activities is primarily affected by production volumes and commodity prices, net of the effects of settlements of our derivative contracts, and changes in working capital. Operating cash flows increased approximately $7.1$8.0 million for the year ended December 31, 20172019 as compared to the same period in 2016.2018. This increase was primarily due to increased revenues from the acquisition of production of oil and natural gas properties in the Appalachia Basin in the fourth quarter of 2016 and higher oil and natural gas prices for the year ended December 31, 2017, as comparedattributable to the same period in 2016.OIE Membership Acquisition and Seneca Acquisition.
Investing Activities
Net cash provided by or used in investing activities is primarily comprised of the acquisition, exploration and development of oil and natural gas properties in addition to expenditures to fund our drilling program in Carbon California, net of dispositions of oil and natural gas properties in addition to expenditures to fund our equity investment in Carbon Appalachia.properties. Net cash used in investing activities decreased approximately $104,000$63.9 million for the year ended December 31, 20172019 as compared to the same period in 2016. In addition, we increased capital expenditures for2018, primarily due to the developmentOIE Membership Acquisition and acquisitionSeneca Acquisition consummated in 2018.
Financing Activities
Net cash provided by or used in financing activities is primarily comprised of propertiesactivities associated with our credit facility and equipment forthe Carbon California Senior Revolving Notes. During the year ended December 31, 20172019, the Company paid $2.0 million in principal associated with the Old Ironsides Notes, paid approximately $14.2 million in principal associated with our credit facility, and paid approximately $7.5 million in principal associated with the Carbon California Senior Revolving Notes. The payments were partially offset by borrowings under our credit facility and Senior Revolving Notes of approximately $592,000 compared to$7.0 million.
During the year ended December 31, 2016. In addition, for2018, the year ended December 31, 2017, we made an approximate $6.9Company borrowed approximately $28.0 million equity investmentto partially fund the Seneca Acquisition in Carbon Appalachia; whereas, duringMay 2018, borrowed approximately $3.0 million to partially fund the year ended December 31, 2016, we received a cash distribution of $275,000 from Crawford County Gas Gathering Company.
The decreaseLiberty Acquisition (as defined in financing cash flows of approximately $6.9 million for the year ended December 31, 2017 as comparedNote 3 to the year ended December 31, 2016 was primarily dueconsolidated financial statements in Item 8) in July 2018, and borrowed approximately $84.2 million, netted against approximately $64.2 million in repayments of the previous credit facility, to borrowings of $7.2 million topartially fund the purchaseOIE Membership Acquisition in December 2018. Also in 2018, the Company received $5.0 million in proceeds from the issuance of oilpreferred stock to Yorktown and gas wells inreceived an equity contribution of $5.0 million from Prudential related to the Appalachian Basin in 2017, compared to $16.9 million proceeds used to fund the purchase of Appalachian Basin producing properties and payoff our former credit facility in 2016.Seneca Acquisition.
Capital Expenditures
Capital expenditures for the years ended December 31, 2017 and 2016 are summarized in the following table:
| Years Ended December 31, | ||||||||
| (in thousands) | 2017 | 2016 | ||||||
| Acquisition of oil and gas properties: | ||||||||
| Unevaluated properties | $ | 1 | $ | 97 | ||||
| Oil and natural gas producing properties | 289 | 8,117 | ||||||
| Drilling and development | 952 | 360 | ||||||
| Pipeline and gathering | 43 | 42 | ||||||
| Other | 306 | 201 | ||||||
| Total capital expenditures | $ | 1,591 | $ | 8,817 | ||||
Capital expenditures reflected in the table abovebelow represent cash used for capital expenditures.expenditures:
| Year Ended December 31, | ||||||||
| (in thousands) | 2019 | 2018 | ||||||
| Acquisition of oil and gas properties: | ||||||||
| Unevaluated properties | $ | - | $ | 3,464 | ||||
| Oil and natural gas producing properties | - | 63,517 | ||||||
| Drilling and development | 7,676 | 2,074 | ||||||
| Pipeline and gathering | - | 460 | ||||||
| Other | 352 | 921 | ||||||
| Total capital expenditures | $ | 8,028 | $ | 70,436 | ||||
During the second half of 2019, we executed a two-well drilling program in California, and as a result of such drilling program, one well was completed in the fourth quarter of 2019 and the other was completed during the first quarter of 2020. Due to low commoditynatural gas prices, we havethe Company has focused its Appalachia operations on the optimization and streamlining of our natural gas gathering, compression and compressionstorage facilities and marketing arrangements to provide greater flexibility in moving natural gas production to markets with more favorable pricing. Other factors impacting the level of our capital expenditures include the cost and availability of oil field services, general economic and market conditions and weather disruptions. Due to the recent developments surrounding the COVID-19 virus and relative pricing volatility, we are currently evaluating our 2020 capital program.
Off-balance Sheet Arrangements
From time-to-time, we enter intoWe did not have any off-balance sheet arrangements and transactions that can give rise to off-balance sheet obligations. Asas of December 31, 2017, the off-balance sheet arrangements and transactions that we have entered into include (i) operating lease agreements, (ii) contractual obligations for which the ultimate settlement amounts are not fixed and determinable, such as natural gas transportation contracts, and (iii) oil and natural gas physical delivery contracts that are not expected to be net cash settled and are considered to be normal sales contracts and not derivatives. We do not believe that any of these arrangements are reasonably likely to materially affect our liquidity or availability of, or requirements for, capital resources.2019.
Critical Accounting Policies, Estimates, Judgments, and Assumptions
We prepare our financial statements and the accompanying notes in conformity with GAAP, which require management to make estimates and assumptions about future events that affect the reported amounts in the financial statements and the accompany notes. We identify certain accounting policies as critical based on, among other things, their impact on the portrayal of our financial condition, results of operations, or liquidity and the degree of difficulty, subjectivity, and complexity in their deployment. Critical accounting policies cover accounting matters that are inherently uncertain because the future resolution of such matters is unknown. The following is a discussion of our most critical accounting policies.policies that require management to make difficult, subjective or complex accounting estimates.
Full Cost Method of Accounting
The accounting for our business is subject to special accounting rules that are unique to the oil and natural gas industry. There are two allowable methods of accounting for oil and natural gas business activities: the full cost method and the successful efforts method. The differences between the two methods can lead to significant variances in the amounts reported in financial statements. We use the full cost method of accounting as defined by SEC Release No. 33-8995 and FASB ASC 932.932 because we believe it appropriately reports the costs of our exploration programs as part of an overall investment in discovering and developing proved reserves.
Under the full cost method, separate cost centers are maintained for each countrygeographic area in which we incur costs. All costs incurred in the acquisition, exploration, and development of properties (including costs of surrendered and abandoned leaseholds, delay lease rentals, dry holes, and overhead related to exploration and development activities) are capitalized. The fair value of estimated future costs of site restoration, dismantlement, and abandonment activities is capitalized, and a corresponding asset retirement obligation liability is recorded.
Capitalized costs applicable to each full cost center are depleted using the units-of-production method based on conversion to common units of measure using one barrel of oil as an equivalent to six thousand cubic feet of natural gas. Changes in estimates of reserves or future development costs are accounted for prospectively in the depletion calculations. Based on this accounting policy, our December 31, 20172019 and 20162018 reserve estimates were used for our respective period depletion calculations. These reserve estimates were calculated in accordance with SEC rules. See “Business—ReservesBusiness-Reserves” and Notes 12 and 317 to the consolidated financial statements for a more complete discussion of the rule and our estimated proved reserves as of December 31, 20172019 and 2016.2018.
Companies that use the full cost method of accounting for oil and natural gas exploration and development activities are required to perform a quarterly ceiling test for each cost center. The full cost ceiling test is a limitation on capitalized costs prescribed by SEC Regulation S-X Rule 4-10. The ceiling test is not a fair value-based measurement. Rather, it is a standardized mathematical calculation. The test determines a limit, or ceiling, on the book value of our oil and natural gas properties. That limit is basically the after taxafter-tax present value of the future net cash flows from proved oil and natural gas reserves. This ceiling is compared to the net book value of the oil and natural gas properties reduced by any related net deferred income tax liability. If the net book value reduced by the related deferred income taxes exceeds the ceiling, an impairment or non-cash write-down is required. Such impairments are permanent and cannot be recovered even if the sum of the components noted above exceeds capitalized costs in future periods. The two primary factors impacting this test are reserve levels and oil and natural gas prices and their associated impact on the present value of estimated future net revenues. In 2017,2019 and 2018, we did not recognize a ceiling test impairment. In 2016, we recognized an impairment of approximately $4.3 million. This impairment resulted primarily from the impact of a decrease in the 12-month average trailing price for oil and natural gas utilized in determining the future net cash flows from proved reserves. Lower oil and natural gas prices may not only decrease our revenues but may also reduce the amount of oil and natural gas that we can produce economically and potentially lower our oil and natural gas reserves. Negative revisions to estimates of oil and natural gas reserves and decreases in prices can have a material impact ofon the present value of estimated future net revenues which may require us to recognize additional impairments of our oil and natural gas properties in future periods.
In countries or areas where the existence of proved reserves has not yet been determined, leasehold costs, seismic costs, and other costs incurred during the exploration phase remain capitalized as unproved property costs until proved reserves have been established or until exploration activities cease. If exploration activities result in the establishment of proved reserves, amounts are reclassified as proved properties and become subject to depreciation, depletion and amortization and the application of the ceiling limitation. Unproved properties are assessed periodically to ascertain whether impairment has occurred. Unproved properties whose costs are individually significant are assessed individually by considering the primary lease terms of the properties, the holding period of the properties, and geographic and geologic data obtained relating to the properties. Where it is not practical to individually assess properties whose costs are not individually significant, such properties are grouped for purposes of assessing impairment. The amount of impairment assessed is added to the costs to be amortized in the appropriate full cost pool. Subject to industry conditions, evaluation of most of our unproved properties and inclusion of these costs in proved property costs subject to amortization are expected to be completed within five years.
Under the alternative successful efforts method of accounting, surrendered, abandoned, and impaired leases, delay lease rentals, exploratory dry holes, and overhead costs are expensed as incurred. Capitalized costs are depleted on a property-by-property basis. Impairments are also assessed on a property-by-property basis and are charged to expense when assessed.
The full cost method is used to account for our oil and natural gas exploration and development activities because we believe it appropriately reports the costs of our exploration programs as part of an overall investment in discovering and developing proved reserves.
Oil and Natural Gas Reserve Estimates
Our estimates of proved reserves are based on the quantities of oil and natural gas that geological and engineering data demonstrate, with reasonable certainty, to be recoverable in future years from known reservoirs under existing economic and operating conditions. The accuracy of any reserve estimate is a function of the quality of available data, engineering and geological interpretation, and judgment. For example, we must estimate the amount and timing of future operating costs, production and property taxes, development costs, and workover costs, all of which may in fact vary considerably from actual results. In addition, as prices and cost levels change from year to year, the estimate of proved reserves also changes. Any significant variance in these assumptions could materially affect the estimated quantity and value of our reserves. Despite the inherent uncertainty in these engineering estimates, our reserves are used throughout our financial statements. For example, since we use the units-of-production method to amortize our oil and natural gas properties, the quantity of reserves could significantly impact our DD&A expense. Our oil and natural gas properties are also subject to a “ceiling test” limitation based in part on the quantity of our proved reserves.
Reference should be made to “Business—ReservesBusiness-Reserves” and “Risk Factors—ReserveFactors-Reserve estimates depend on many assumptions that may turn out to be inaccurate. Any material inaccuracies in these reserve estimates or underlying assumptions will materially affect the quantities and present value of our proved reserves.”
Accounting for Derivative Instruments
We recognize all derivative instruments as either assets or liabilities at fair value. Under the provisions of authoritative derivative accounting guidance, we may or may not elect to designate a derivative instrument as a hedge against changes in the fair value of an asset or a liability (a “fair value hedge”) or against exposure to variability in expected future cash flows (a “cash flow hedge”). The accounting treatment for the changes in fair value of a derivative instrument is dependent upon whether or not a derivative instrument is a cash flow hedge or a fair value hedge, and upon whether or not the derivative is designated as a hedge. Changes in fair value of a derivative designated as a cash flow hedge are recognized, to the extent the hedge is effective, in other comprehensive income until the hedged item is recognized in earnings. Changes in the fair value of a derivative instrument designated as a fair value hedge, to the extent the hedge is effective, have no effect on the consolidated statement of operations, because changes in fair value of the derivative offsets changes in the fair value of the hedged item. Where hedge accounting is not elected or if a derivative instrument does not qualify as either a fair value hedge or a cash flow hedge, changes in fair value are recognized in earnings. We have elected not to use hedge accounting and as a result, all changes in the fair values of our derivative instruments are recognized in commodity derivative gain or loss in our consolidated statements of operations.
As of December 31, 2017 and 2016, theThe fair value of our derivative agreements was an asset of approximately $225,000 and a liability of approximately $1.9 million, respectively. The fair value measurement of commodity derivative assets and liabilities are measured based upon ourutilizing a third-party valuation model that considersspecialist. The valuations consider various inputs including (a) quoted forward prices for commodities, (b) time value, (c) notional quantities, (d) current market and contractual prices for the underlying instruments; and (e) the counterparty’s credit risk. We review these valuations and analyze changes in the fair value of the derivatives. Volatility in oil and natural gas prices could have a significant impact on the fair value of our derivative contracts. See Note 11 to the consolidated financial statements for further discussion. The values we report in our consolidated financial statements are as of a point in time and subsequently change as these estimates are revised to reflect actual results, changes in market conditions or other factors, many of which are beyond our control.
Due to the volatility of oil and natural gas prices, the estimated fair values of our commodity derivative instruments are subject to large fluctuations from period to period and we expect the volatility to continue. Actual gains or losses recognized related to our commodity derivative instruments will likely differ from those estimated at December 31, 20172019 and will depend exclusively on the price of the commodities on the specified settlement dates provided by the derivative contracts.
Valuation of Deferred Tax AssetsIncome Taxes
We use the asset and liability method of accounting for income taxes. Under this method, income tax assets and liabilities are determined based on differences between the financial statement carrying values of assets and liabilities and their respective income tax bases (temporary differences). Income tax assets and liabilities are measured using the tax rates expected to be in effect when the temporary differences are likely to reverse. The effect on income tax assets and liabilities of a change in tax rates is included in earnings in the period in which the change is enacted. With the passage of the TCJA, we are required to remeasure deferred income taxes at the lower 21% corporate rate as of the date the TCJA was signed into law even though the reduced rate is effective January 1, 2018. The book value of income tax assets is limited to the amount of the tax benefit that is more likely than not to be realized in the future.
In assessing the need for a valuation allowance on our deferred tax assets, management considers whether it is more likely than not that some portion or all of the deferred tax assets will be realized. The ultimate realization of deferred tax assets is dependent upon whether future book income is sufficient to reverse existing temporary differences that give rise to deferred tax assets, as well as whether future taxable income is sufficient to utilize net operating loss and credit carryforwards. Assessing the need for, or the sufficiency of, a valuation allowance requires the evaluation of all available evidence, both positive and negative. Positive evidence considered by management includes current book income in 2013, 20142017, 2018 and 2017,2019, and forecasted book income if commodity prices increase, and taxable proceeds from the Liberty participation agreements and the sale of our Deep Rights in leases in Kentucky and West Virginia in 2014.increase. Negative evidence considered by management includes book losses in certain years which were driven primarily from ceiling test write-downs, which are not fair value-based measurements and current commodity prices which will impact forecasted income or loss.
As of December 31, 2017,2019 and 2016,2018, management assessed the available positive and negative evidence to estimate if sufficient future taxable income would be generated to use our deferred tax assets and determined that it is more-likely-than-not that the deferred tax assets will not be realized in the near future. Based on this assessment, we recorded a net valuation allowance of approximately $13.3$13.1 million and $21.1$14.6 million on our deferred tax assets as of December 31, 20172019 and 2016,2018, respectively.
Asset Retirement Obligations
We have obligations to remove tangible equipment and restore locations at the end of oil and natural gas production operations. FASB ASC Topic 410,Asset Retirement and Environmental Obligations, requires that the discounted fair value of a liability for an asset retirement obligation (“ARO”ARO”) be recognized in the period in which it is incurred with the associated asset retirement cost capitalized as part of the carrying cost of the oil and natural gas asset. Estimating the future restoration and removal costs, or ARO, is difficult and requires management to make estimates and judgments, because most of the obligations are many years in the future, and contracts and regulations often have vague descriptions of what constitutes removal. Asset removal technologies and costs are constantly changing, as are regulatory, political, environmental, safety, and public relations considerations.
Inherent in the calculation of the present value of our ARO are numerous assumptions and judgments, including the ultimate settlement amounts, inflation factors, credit adjusted discount rates, timing of settlement, and changes in the legal, regulatory, environmental, and political environments. To the extent future revisions to these assumptions impact the present value of the existing ARO liability, a corresponding adjustment is made to the oil and natural gas property balance. Increases in the discounted ARO liability resulting from the passage of time are reflected as accretion expense in the consolidated statements of operations. See Note 6 – Asset Retirement Obligations in the consolidated financial statements in Item 8 for more information.
Purchase Price AllocationAccounting for Business Combinations
Accounting for the acquisition of a business requires the allocation of the purchase price to the various assets and liabilities acquired based on their estimated fair value as of the acquisition date. Various assumptions are made when estimating fair values assigned to proved and unproved oil and gas properties including: (i) reserves; (ii) production rates; (iii) future operating and development costs; (iv) future commodity prices, including price differentials; (v) future cash flows; and (vi) a market participant-based weighted average cost of capital rate. These inputs require significant judgement by management atWe may use the timecost, income, or market valuation approaches depending on the quality of the valuation.information available to support management’s assumptions. There is no assurance the underlying assumptions or estimates associated with the valuation will occur as initially expected.
Revenue Recognition
Oil and
We derive our revenue from the sale of oil, natural gas revenuesand NGLs. Revenues are recognized when we meet our performance obligations to deliver the production volumes are sold to a purchaser at a fixed or determinable price, delivery has occurred, title has transferred and collectabilitycontrol is reasonably assured. Naturaltransferred. Oil, natural gas and NGL revenues are recognized on the basis of our net working revenue interest. Net deliveries in excessPayment is received 30 to 90 days after the date of entitledproduction. At the end of each month, we make estimates of the amount of production delivered and the price we will receive. Variances between our estimated revenue and actual amounts received are recorded as a liability, while net deliveries lower than entitled amounts are recorded as a receivable.in the month payment is received.
Equity Method InvestmentsItem 7A. Quantitative and Qualitative Disclosures About Market Risk.
We accountAs a smaller reporting company, we are not required to provide information for investments where we have the ability to exercise significant influence, but not control, under the equity method of accounting. Income from equity method investments represents our proportionate share of net income generated by the equity method investees. Equity method investments are assessed for impairment whenever changes in the facts and circumstances indicate a loss in value has occurred, if the loss is deemed to be other than temporary. When the loss is deemed to be other than temporary, the carrying value of the equity method investment is written down to fair value. Differences in the basis of the investments and the separate net asset value of the investees, if any, are amortized into net income over the remaining useful lives of the underlying assets.this item.
Item 8. Financial Statements and Supplementary Data.
REPORT OF INDEPENDENT REGISTERED PUBLIC ACCOUNTING FIRMReport of Independent Public Accounting Firm
To the Stockholders and Board of Directors
Carbon Natural Gas Company
Denver, ColoradoEnergy Corporation
OPINION ON THE FINANCIAL STATEMENTSOpinion on the Financial Statements
We have audited the accompanying consolidated balance sheetssheet of Carbon Natural Gas CompanyEnergy Corporation (the “Company”) as of December 31, 20172019 and 2016, and2018, the related consolidated statements of operations, stockholders’stockholders' equity, and cash flows for each year in the two-year periodyears ended December 31, 2017,2019 and 2018, and the related notes (collectively, referred to as the “financial statements”).
In our opinion, the financial statements referred to above present fairly, in all material respects, the financial position of the Company as of December 31, 20172019 and 2016,2018 and the results of its operations and its cash flows for each year in the two-year periodyears then ended December 31, 2017, in conformity with accounting principles generally accepted in the United States of America.
BASIS FOR OPINIONBasis for Opinion
TheseThe Company's management is responsible for these financial statements are the responsibility of the Company’s management.statements. Our responsibility is to express an opinion on the Company’s financial statements based on our audits. We are a public accounting firm registered with the Public Company Accounting Oversight Board (United States) (“PCAOB”)(PCAOB) and are required to be independent with respect to the Company in accordance with the U.S. federal securities laws and the applicable rules and regulations of the Securities and Exchange Commission and the PCAOB.
We conducted our audits in accordance with the standards of the PCAOB. Those standards require that we plan and perform the auditaudits to obtain reasonable assurance about whether the financial statements are free of material misstatement, whether due to error or fraud. The Company is not required to have, nor were we engaged to perform, an audit of its internal control over financial reporting. As part of our audits we are required to obtain an understanding of internal control over financial reporting but not for the purpose of expressing an opinion on the effectiveness of the Company’sCompany's internal control over financial reporting. Accordingly, we express no such opinion.
Our audits included performing procedures to assess the risks of material misstatement of the financial statements, whether due to error or fraud, and performing procedures that respond to those risks. Such procedures included examining, on a test basis, evidence regarding the amounts and disclosures in the financial statements. Our audits also included evaluating the accounting principles used and significant estimates made by management, as well as evaluating the overall presentation of the financial statements. We believe that our audits provide a reasonable basis for our opinion.opinions.
March 31, 2018
Denver, Colorado/s/ Plante & Moran, PLLC
We have served as the Company’s auditor since 2005.
Denver, Colorado
March 30, 2020
CARBON NATURAL GAS COMPANYENERGY CORPORATION
Consolidated Balance Sheets
(In thousands)thousands, except share amounts)
| December 31, | December 31, | |||||||
| 2017 | 2016 | |||||||
| ASSETS | ||||||||
| Current assets: | ||||||||
| Cash and cash equivalents | $ | 1,650 | $ | 858 | ||||
| Accounts receivable: | ||||||||
| Revenue | 2,206 | 2,369 | ||||||
| Joint interest billings and other | 1,151 | 2,251 | ||||||
| Due from related parties | 2,075 | - | ||||||
| Commodity derivative asset | 215 | - | ||||||
| Prepaid expense, deposits, and other current assets | 783 | 305 | ||||||
| Total current assets | 8,080 | 5,783 | ||||||
| Property and equipment (Note 5) | ||||||||
| Oil and gas properties, full cost method of accounting: | ||||||||
| Proved, net | 34,178 | 33,212 | ||||||
| Unproved | 1,947 | 1,999 | ||||||
| Other property and equipment, net | 737 | 325 | ||||||
| Total property and equipment, net | 36,862 | 35,536 | ||||||
| Investments in affiliates (Note 6) | 14,267 | 668 | ||||||
| Other long-term assets | 800 | 725 | ||||||
| Total assets | $ | 60,009 | $ | 42,712 | ||||
| LIABILITIES AND STOCKHOLDERS’ EQUITY | ||||||||
| Current liabilities: | ||||||||
| Accounts payable and accrued liabilities (Note 10) | $ | 11,218 | $ | 9,121 | ||||
| Firm transportation contract obligations (Note 1) | 127 | 561 | ||||||
| Commodity derivative liability | - | 1,341 | ||||||
| Total current liabilities | 11,345 | 11,023 | ||||||
| Non-current liabilities: | ||||||||
| Firm transportation contract obligations (Note 1) | 134 | 261 | ||||||
| Commodity derivative liability | - | 591 | ||||||
| Production and property taxes payable | 520 | 628 | ||||||
| Warrant liability | 2,017 | - | ||||||
| Asset retirement obligations (Note 3) | 7,357 | 5,006 | ||||||
| Credit facility (Note 7) | 22,140 | 16,230 | ||||||
| Total non-current liabilities | 32,168 | 22,716 | ||||||
| Commitments and contingencies (Note 13) | ||||||||
| Stockholders’ equity: | ||||||||
| Preferred stock, $0.01 par value; authorized 1,000,000 shares, no shares issued and outstanding at December 31, 2017 and 2016 | - | - | ||||||
Common stock, $0.01 par value; authorized 10,000,000 shares, 6,005,633 and 5,482,673 shares issued and outstanding at | ||||||||
| December 31, 2017 and 2016, respectively | 60 | 1,096 | ||||||
| Additional paid-in capital | 58,813 | 56,548 | ||||||
| Accumulated deficit | (44,218 | ) | (50,536 | ) | ||||
| Total Carbon stockholders’ equity | 14,655 | 7,108 | ||||||
| Non-controlling interests | 1,841 | 1,865 | ||||||
| Total stockholders’ equity | 16,496 | 8,973 | ||||||
| Total liabilities and stockholders’ equity | $ | 60,009 | $ | 42,712 | ||||
| December 31, | ||||||||
| 2019 | 2018 | |||||||
| ASSETS | ||||||||
| Current assets: | ||||||||
| Cash and cash equivalents | $ | 904 | $ | 5,736 | ||||
| Accounts receivable: | ||||||||
| Revenue | 12,886 | 20,223 | ||||||
| Joint interest billings and other | 1,552 | 1,218 | ||||||
| Insurance receivable (Note 2) | - | 522 | ||||||
| Commodity derivative asset (Note 14) | 5,915 | 3,517 | ||||||
| Prepaid expenses, deposits, and other current assets | 2,500 | 1,645 | ||||||
| Inventory | 2,512 | 1,149 | ||||||
| Total current assets | 26,269 | 34,010 | ||||||
| Non-current assets: | ||||||||
| Property and equipment (Note 4) | ||||||||
| Oil and gas properties, full cost method of accounting: | ||||||||
| Proved, net | 242,144 | 248,455 | ||||||
| Unproved | 4,872 | 5,416 | ||||||
| Other property and equipment, net | 15,984 | 17,563 | ||||||
| Total property and equipment, net | 263,000 | 271,434 | ||||||
| Investments in affiliates | 625 | 598 | ||||||
| Commodity derivative asset – non-current (Note 14) | 1,164 | 3,505 | ||||||
| Right-of-use assets (Note 8) | 6,104 | - | ||||||
| Other non-current assets | 1,092 | 1,344 | ||||||
| Total non-current assets | 271,985 | 276,881 | ||||||
| Total assets | $ | 298,254 | $ | 310,891 | ||||
| LIABILITIES AND STOCKHOLDERS’ EQUITY | ||||||||
| Current liabilities: | ||||||||
| Accounts payable and accrued liabilities (Note 5) | $ | 35,157 | $ | 34,816 | ||||
| Firm transportation contract obligations (Note 15) | 5,679 | 6,129 | ||||||
| Lease liability – current (Note 8) | 1,625 | - | ||||||
| Commodity derivative liability (Note 14) | 469 | - | ||||||
| Credit facilities and notes payable (Note 7) | 5,788 | 11,910 | ||||||
| Total current liabilities | 48,718 | 52,855 | ||||||
| Non-current liabilities: | ||||||||
| Firm transportation contract obligations (Note 15) | 8,905 | 12,729 | ||||||
| Lease liability – non-current (Note 8) | 4,383 | - | ||||||
| Commodity derivative liability – non-current (Note 14) | 87 | - | ||||||
| Production and property taxes payable | 2,815 | 2,914 | ||||||
| Asset retirement obligations (Note 6) | 17,514 | 19,211 | ||||||
| Credit facilities and notes payable (Note 7) | 94,870 | 97,228 | ||||||
| Notes payable – related party (Note 7) | 44,741 | 49,919 | ||||||
| Total non-current liabilities | 173,315 | 182,001 | ||||||
| Commitments and contingencies (Note 15) | ||||||||
| Stockholders’ equity: | ||||||||
| Preferred stock, $0.01 par value; liquidation preference of $524 and $224 at December 31, 2019 and 2018, respectively; authorized 1,000,000 shares, 50,000 shares issued and outstanding at December 31, 2019 and 2018 | 1 | 1 | ||||||
| Common stock, $0.01 par value; authorized 35,000,000 shares, 7,796,085 and 7,655,759 shares issued and outstanding at December 31, 2019 and 2018, respectively | 78 | 77 | ||||||
| Additional paid-in capital | 85,834 | 84,612 | ||||||
| Accumulated deficit | (35,842 | ) | (36,939 | ) | ||||
| Total Carbon stockholders’ equity | 50,071 | 47,751 | ||||||
| Non-controlling interests | 26,150 | 28,284 | ||||||
| Total stockholders’ equity | 76,221 | 76,035 | ||||||
| Total liabilities and stockholders’ equity | $ | 298,254 | $ | 310,891 | ||||
See accompanying notesNotes to Consolidated Financial Statements.
CARBON NATURAL GAS COMPANYENERGY CORPORATION
Consolidated Statements of Operations
(In thousands, except per share amounts)
| Twelve months ended December 31, | ||||||||||||||||
| 2017 | 2016 | Year Ended December 31, | ||||||||||||||
| 2019 | 2018 | |||||||||||||||
| Revenue: | ||||||||||||||||
| Natural gas sales | $ | 15,298 | $ | 7,127 | 56,468 | 16,018 | ||||||||||
| Natural gas liquids sales | 578 | 1,143 | ||||||||||||||
| Oil sales | 4,213 | 3,316 | 36,795 | 30,891 | ||||||||||||
| Commodity derivative gain (loss) | 2,928 | (2,259 | ) | |||||||||||||
| Transportation and handling | 1,928 | - | ||||||||||||||
| Marketing gas sales | 16,920 | - | ||||||||||||||
| Commodity derivative gain | 3,044 | 4,894 | ||||||||||||||
| Other income | 34 | 11 | 892 | 105 | ||||||||||||
| Total revenue | 22,473 | 8,195 | 116,625 | 53,051 | ||||||||||||
| Expenses: | ||||||||||||||||
| Lease operating expenses | 6,141 | 3,175 | 29,714 | 15,960 | ||||||||||||
| Pipeline operating expenses | 11,153 | - | ||||||||||||||
| Transportation and gathering costs | 2,172 | 1,645 | 6,086 | 4,453 | ||||||||||||
| Production and property taxes | 1,276 | 820 | 5,507 | 1,813 | ||||||||||||
| Marketing gas purchases | 18,684 | - | ||||||||||||||
| General and administrative | 9,528 | 8,645 | 16,342 | 13,779 | ||||||||||||
| General and administrative-related party reimbursement | (2,703 | ) | - | |||||||||||||
| General and administrative – deferred fees write-down | - | 1,999 | ||||||||||||||
| General and administrative – related party reimbursement | - | (4,547 | ) | |||||||||||||
| Depreciation, depletion, and amortization | 2,544 | 1,953 | 15,757 | 8,108 | ||||||||||||
| Accretion of asset retirement obligations | 307 | 176 | 1,625 | 868 | ||||||||||||
| Impairment of oil and gas properties | - | 4,299 | ||||||||||||||
| Total expenses | 19,265 | 20,713 | 104,868 | 42,433 | ||||||||||||
| Operating income (loss) | 3,208 | (12,518 | ) | |||||||||||||
| Operating income | 11,757 | 10,618 | ||||||||||||||
| Other income and (expense): | ||||||||||||||||
| Interest expense | (1,202 | ) | (367 | ) | (12,848 | ) | (5,920 | ) | ||||||||
| Warrant derivative gain | 3,133 | - | - | 225 | ||||||||||||
| Investment in affiliates | 1,158 | 49 | ||||||||||||||
| Gain on derecognized equity investment in affiliate-Carbon California | - | 5,390 | ||||||||||||||
| Investments in affiliates | 90 | 2,469 | ||||||||||||||
| Other | 28 | 17 | - | (3 | ) | |||||||||||
| Total other income and (expense) | 3,117 | (301 | ) | |||||||||||||
| Total other (expense) income | (12,758 | ) | 2,161 | |||||||||||||
| Income (loss) before income taxes | 6,325 | (12,819 | ) | |||||||||||||
| (Loss) income before income taxes | (1,001 | ) | 12,779 | |||||||||||||
| Provision for income taxes | (74 | ) | - | - | - | |||||||||||
| Net income (loss) before non-controlling interest | 6,399 | (12,819 | ) | |||||||||||||
| Net (loss) income before non-controlling interests and preferred shares | (1,001 | ) | 12,779 | |||||||||||||
| Net income (loss) attributable to non-controlling interests | 81 | (413 | ) | |||||||||||||
| Net (loss) income attributable to non-controlling interests | (2,098 | ) | 4,375 | |||||||||||||
| Net income (loss) attributable to controlling interest | $ | 6,318 | $ | (12,406 | ) | |||||||||||
| Net income attributable to controlling interests before preferred shares | 1,097 | 8,404 | ||||||||||||||
| Net income (loss) per common share: | ||||||||||||||||
| Net income attributable to preferred shares – beneficial conversion feature | - | 1,125 | ||||||||||||||
| Net income attributable to preferred shares – preferred return | 300 | 224 | ||||||||||||||
| Net income attributable to common shares | $ | 797 | $ | 7,055 | ||||||||||||
| Net income per common share: | ||||||||||||||||
| Basic | $ | 1.12 | $ | (2.27 | ) | $ | 0.10 | $ | 0.94 | |||||||
| Diluted | $ | 0.49 | $ | (2.27 | ) | $ | 0.10 | $ | 0.87 | |||||||
| Weighted average common shares outstanding (in thousands): | ||||||||||||||||
| Weighted average common shares outstanding: | ||||||||||||||||
| Basic | 5,662 | 5,468 | 7,794 | 7,525 | ||||||||||||
| Diluted | 6,465 | 5,468 | 8,095 | 7,839 | ||||||||||||
See accompanying notesNotes to Consolidated Financial Statements.
60
CARBON NATURAL GAS COMPANYENERGY CORPORATION
Consolidated Statements of Stockholders’ Equity
(In thousands)
| Additional | Non- | Total | ||||||||||||||||||||||
| Common Stock | Paid-in | Controlling | Accumulated | Stockholders’ | ||||||||||||||||||||
| Shares | Amount | Capital | Interests | Deficit | Equity | |||||||||||||||||||
| Balances, December 31, 2015 | 5,383 | $ | 36 | $ | 55,434 | $ | 2,299 | $ | (38,130 | ) | $ | 19,640 | ||||||||||||
| Stock-based compensation | - | - | 2,440 | - | - | 2,440 | ||||||||||||||||||
| Restricted stock vested | 65 | 13 | (13 | ) | - | - | - | |||||||||||||||||
| Performance units vested | 84 | 17 | (17 | ) | - | - | - | |||||||||||||||||
| Restricted stock and performance units | - | - | ||||||||||||||||||||||
| exchanged for tax withholding | (50 | ) | (11 | ) | (256 | ) | - | - | (267 | ) | ||||||||||||||
| Non-controlling interests distributions, net | - | - | - | (14 | ) | - | (14 | ) | ||||||||||||||||
| Non-controlling interest purchase | - | - | - | (7 | ) | - | (7 | ) | ||||||||||||||||
| Net loss | - | - | - | (413 | ) | (12,406 | ) | (12,819 | ) | |||||||||||||||
| Balances, December 31, 2016 | 5,482 | $ | 55 | $ | 57,588 | $ | 1,865 | $ | (50,536 | ) | $ | 8,973 | ||||||||||||
| Stock-based compensation | - | - | 1,106 | - | - | 1,106 | ||||||||||||||||||
| Restricted stock vested | 67 | 1 | (1 | ) | - | - | - | |||||||||||||||||
| Performance units vested | 80 | 1 | (1 | ) | - | - | - | |||||||||||||||||
| Restricted stock and performance units | ||||||||||||||||||||||||
| exchanged for tax withholding | (55 | ) | (1 | ) | (398 | ) | - | - | (399 | ) | ||||||||||||||
| Shares issued for exercise of warrant (Note 6) | 432 | 4 | 2,787 | - | - | 2,791 | ||||||||||||||||||
| Warrant derivative extinguishment | - | - | 2,049 | - | - | 2,049 | ||||||||||||||||||
| Class B Fair Value (Note 6) | - | - | (4,317 | ) | (4,317 | ) | ||||||||||||||||||
| Non-controlling interests’ distributions, net | - | - | - | (105 | ) | - | (105 | ) | ||||||||||||||||
| Net income | - | - | - | 81 | 6,318 | 6,399 | ||||||||||||||||||
| Balances, December 31, 2017 | 6,006 | $ | 60 | $ | 58,813 | $ | 1,841 | $ | (44,218 | ) | $ | 16,496 | ||||||||||||
| Common Stock | Preferred Stock | Additional Paid-In | Non- controlling | Accumulated | Total Stockholders’ | |||||||||||||||||||||||||||
| Shares | Amount | Shares | Amount | Capital | Interests | Deficit | Equity | |||||||||||||||||||||||||
| Balance as of December 31, 2017 | 6,006 | $ | 60 | - | - | $ | 58,813 | $ | 1,841 | $ | (44,218 | ) | $ | 16,496 | ||||||||||||||||||
| Stock based compensation | - | - | - | - | 1,133 | - | - | 1,133 | ||||||||||||||||||||||||
| Vested restricted stock | 60 | 1 | - | - | (1 | ) | - | - | - | |||||||||||||||||||||||
| Vested performance units | 108 | 1 | - | - | (1 | ) | - | - | - | |||||||||||||||||||||||
| Restricted stock and performance units exchanged for tax withholding | (46 | ) | - | - | - | (197 | ) | - | - | (197 | ) | |||||||||||||||||||||
| Preferred share issuance | - | - | 50 | 1 | 4,999 | - | - | 5,000 | ||||||||||||||||||||||||
| Beneficial conversion feature | - | - | - | - | 1,125 | - | (1,125 | ) | - | |||||||||||||||||||||||
| California Warrant exercise - share issuance | 1,528 | 15 | - | - | 8,312 | 16,465 | - | 24,792 | ||||||||||||||||||||||||
| Majority control of Carbon California (Note 4) | - | - | - | - | 10,429 | - | - | 10,429 | ||||||||||||||||||||||||
| Units issued with 2018 Subordinated Notes, related party (Note 7) | - | - | - | - | - | 489 | 489 | |||||||||||||||||||||||||
| Non-controlling interest contributions, net | - | - | - | - | - | 5,114 | - | 5,114 | ||||||||||||||||||||||||
| Net income | - | - | - | - | - | 4,375 | 8,404 | 12,779 | ||||||||||||||||||||||||
| Balance as of December 31, 2018 | 7,656 | $ | 77 | 50 | $ | 1 | $ | 84,612 | $ | 28,284 | $ | (36,939 | ) | $ | 76,035 | |||||||||||||||||
| Stock based compensation | - | - | - | - | 1,448 | - | - | 1,448 | ||||||||||||||||||||||||
| Vested restricted stock | 106 | 1 | - | - | (1 | ) | - | - | - | |||||||||||||||||||||||
| Vested performance units | 95 | 1 | - | - | (1 | ) | - | - | - | |||||||||||||||||||||||
| Restricted stock and performance units exchanged for tax withholding | (61 | ) | (1 | ) | - | - | (224 | ) | - | - | (225 | ) | ||||||||||||||||||||
| Non-controlling interest distributions, net | - | - | - | - | - | (36 | ) | - | (36 | ) | ||||||||||||||||||||||
| Net (loss) income | - | - | - | - | - | (2,098 | ) | 1,097 | (1,001 | ) | ||||||||||||||||||||||
| Balance as of December 31, 2019 | 7,796 | $ | 78 | 50 | $ | 1 | $ | 85,834 | $ | 26,150 | $ | (35,842 | ) | $ | 76,221 | |||||||||||||||||
See accompanying notesNotes to Consolidated Financial Statements.
CARBON NATURAL GAS COMPANYENERGY CORPORATION
Consolidated Statements of Cash Flows
(In thousands)
| Twelve months ended December 31, | ||||||||
| 2017 | 2016 | |||||||
| Cash flows from operating activities: | ||||||||
| Net income (loss) | $ | 6,399 | $ | (12,819 | ) | |||
| Items not involving cash: | ||||||||
| Depreciation, depletion and amortization | 2,544 | 1,953 | ||||||
| Accretion of asset retirement obligations | 307 | 176 | ||||||
| Impairment of oil and gas properties | - | 4,299 | ||||||
| Unrealized commodity derivative (gain) loss | (2,158 | ) | 2,490 | |||||
| Warrant derivative gain | (3,133 | ) | - | |||||
| Stock-based compensation expense | 1,106 | 2,440 | ||||||
| Investment in affiliates gain | (1,128 | ) | 17 | |||||
| Amortization of debt issuance costs | 176 | - | ||||||
| Other | (109 | ) | (47 | ) | ||||
| Net change in: | ||||||||
| Accounts receivable | (812 | ) | (2,925 | ) | ||||
| Prepaid expenses, deposits and other current assets | (477 | ) | (93 | ) | ||||
| Accounts payable, accrued liabilities and firm transportation contracts | 1,205 | 1,367 | ||||||
| Net cash provided by (used in) operating activities | 3,920 | (3,142 | ) | |||||
| Cash flows from investing activities: | ||||||||
| Development and acquisition of properties and equipment | (1,591 | ) | (700 | ) | ||||
| Acquisition of oil and gas properties | - | (8,117 | ) | |||||
| Proceeds from sale of oil and gas properties and other assets | 16 | 8 | ||||||
| Other long-term assets | (161 | ) | (285 | ) | ||||
| Investment in affiliates | (6,797 | ) | 340 | |||||
| Net cash used in investing activities | (8,533 | ) | (8,754 | ) | ||||
| Cash flows from financing activities: | ||||||||
| Vested restricted stock exchanged for tax withholding | (399 | ) | (267 | ) | ||||
| Proceeds from credit facility | 7,210 | 16,937 | ||||||
| Payments on credit facility | (1,300 | ) | (4,207 | ) | ||||
| Distribution to non-controlling interests | (106 | ) | (14 | ) | ||||
| Net cash provided by financing activities | 5,405 | 12,449 | ||||||
| Net increase in cash and cash equivalents | 792 | 553 | ||||||
| Cash and cash equivalents, beginning of period | 858 | 305 | ||||||
| Cash and cash equivalents, end of period | $ | 1,650 | $ | 858 | ||||
| Year Ended December 31, | ||||||||
| 2019 | 2018 | |||||||
| Cash flows from operating activities: | ||||||||
| Net (loss) income | $ | (1,001 | ) | $ | 12,779 | |||
| Items not involving cash: | ||||||||
| Depreciation, depletion and amortization | 15,757 | 8,108 | ||||||
| Accretion of asset retirement obligations | 1,625 | 868 | ||||||
| Unrealized commodity derivative loss (gain) | 499 | (8,742 | ) | |||||
| Warrant derivative gain | - | (225 | ) | |||||
| Stock-based compensation expense | 1,448 | 1,133 | ||||||
| Investments in affiliates | (77 | ) | (7,734 | ) | ||||
| Amortization of debt costs | 846 | 966 | ||||||
| Interest expense paid-in-kind | 2,481 | - | ||||||
| Other | (57 | ) | - | |||||
| Net change in: | ||||||||
| Accounts receivable | 7,619 | 545 | ||||||
| Prepaid expenses, deposits and other current assets | (809 | ) | 1,067 | |||||
| Accounts payable, accrued liabilities and firm transportation contract obligations | (9,033 | ) | 2,472 | |||||
| Other non-current assets | (442 | ) | (392 | ) | ||||
| Net cash provided by operating activities | 18,856 | 10,845 | ||||||
| Cash flows from investing activities: | ||||||||
| Development and acquisition of properties and equipment | (8,028 | ) | (2,995 | ) | ||||
| Acquisition of oil and gas properties, asset acquisitions (Note 3) | - | (46,980 | ) | |||||
| Acquisition of oil and gas properties, business combinations, net of cash received (Note 3) | - | (20,461 | ) | |||||
| Distribution from affiliate | 50 | - | ||||||
| Proceeds received – disposition of oil and gas properties and other property and equipment | 1,408 | - | ||||||
| Net cash used in investing activities | (6,570 | ) | (70,436 | ) | ||||
| Cash flows from financing activities: | ||||||||
| Vested restricted stock and performance units exchanged for tax withholding | (225 | ) | (197 | ) | ||||
| Proceeds from credit facilities and notes payable | 7,000 | 118,628 | ||||||
| Proceeds from preferred shares | - | 5,000 | ||||||
| Payments on credit facilities and notes payable | (23,708 | ) | (64,150 | ) | ||||
| Payments of debt issuance costs | (149 | ) | (718 | ) | ||||
| (Distributions to) contributions from non-controlling interests, net | (36 | ) | 5,114 | |||||
| Net cash (used in) provided by financing activities | (17,118 | ) | 63,677 | |||||
| Net (decrease) increase in cash and cash equivalents | (4,832 | ) | 4,086 | |||||
| Cash and cash equivalents, beginning of period | 5,736 | 1,650 | ||||||
| Cash and cash equivalents, end of period | $ | 904 | $ | 5,736 | ||||
See Note 15 –16 - Supplemental Cash Flow Disclosure
See accompanying notesNotes to Consolidated Financial Statements.
Notes to Consolidated Financial Statements
Note 1 –- Organization
Carbon Energy Corporation (formerly known as Carbon Natural Gas Company’sCompany) is an independent oil and its subsidiaries’ (referred to herein asnatural gas company engaged in the acquisition, exploration, development and production of oil, natural gas and natural gas liquids properties located in the United States. The terms “we”, “us”, “our”, the “Company” or “Carbon”) business refer to Carbon Energy Corporation and our consolidated subsidiaries (described below). The following is comprisedan organization chart of the assets and propertieskey subsidiaries discussed in this report as of us and our subsidiaries as well as our equity investments in Carbon Appalachian Company, LLC (“Carbon Appalachia”) and Carbon California Company, LLC (“Carbon California”).December 31, 2019:
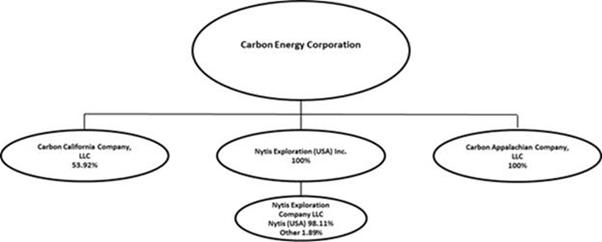
Appalachian and Illinois Basin Operations
In the Appalachian and Illinois Basins, operations are conducted by Nytis Exploration Company, LLC (“Nytis LLC”LLC”) conducts operations for us and Carbon Appalachia.. The following organizational chart illustrates this relationship as of December 31, 2017.2019:
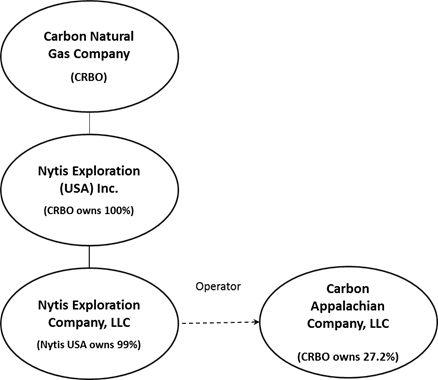
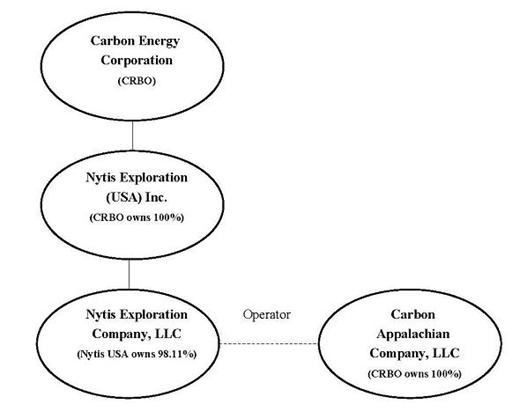
In December 2018, we completed the acquisition of all of the Class A Units of Carbon Appalachian Company, LLC, a Delaware limited liability company (“Carbon Appalachia”), owned by Old Ironside Fund II-A Portfolio Holding Company, LLC, a Delaware limited liability company, and Old Ironside Fund II-B Portfolio Holding Company, LLC, a Delaware limited liability company (collectively, “Old Ironsides”) for a purchase price of $58.2 million, subject to customary and standard purchase price adjustments (“OIE Membership Acquisition”). As a result of the OIE Membership Acquisition, we now hold all of the issued and outstanding ownership interests of Carbon Appalachia, along with its direct and indirect subsidiaries (Carbon Appalachia Group, LLC, Carbon Tennessee Mining Company, LLC, Carbon Appalachia Enterprises, LLC, Carbon West Virginia Company, LLC, Cranberry Pipeline Corporation, Knox Energy, LLC, Coalfield Pipeline Company and Appalachia Gas Services Company, LLC).
63
Ventura Basin Operations
In California, Carbon California Operating Company, LLC (“CCOC”), conducts operations on behalf of Carbon California’s operations. The following illustrates this relationship as of December 31, 2017.California Company, LLC, a Delaware limited liability company (“Carbon California”). On February 1, 2018, Yorktown Energy Partners XI, L.P. (“Yorktown”) exercised the California Warrant,a warrant, resulting in our aggregate sharing percentage in Carbon California increasing from 17.81% to 56.40% (the “California Warrant”). See Note 17.

Collectively, references to us include CCOC, Nytis Exploration (USA) Inc. (“Nytis USA”) and Nytis LLC.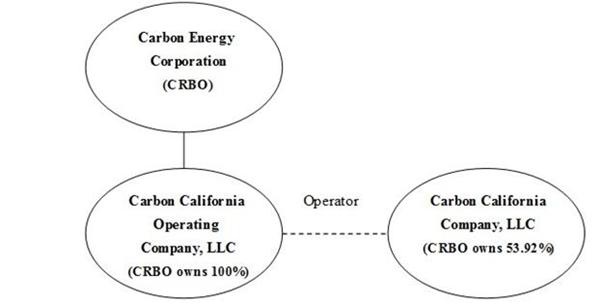
Note 2 – Reverse Stock Split
Effective March 15, 2017 and pursuant to a reverse stock split approved by the shareholders and Board of Directors, each 20 shares of our issued and outstanding common stock became one share of common stock and no fractional shares were issued. The accompanying financial statements and related disclosures give retroactive effect to the reverse stock split for all periods presented. In connection with the reverse stock split, the number of authorized shares of our common stock was decreased from 200,000,000 to 10,000,000.
Note 3 –2 - Summary of Significant Accounting Policies
Accounting policies used by us reflect industry practices and conform to accounting principles generally accepted in the United States of America (“GAAP”). The more significant of such accounting policies are briefly discussed below.
Principles of Consolidation
The consolidated financial statements include the accounts of usCarbon Energy Corporation and ourits consolidated subsidiaries. We own 100% of Nytis USA. Nytis USA owns approximately 99 % of Nytis LLC. Nytis LLC holds interestsIn addition to Carbon Appalachia and Carbon California, we consolidate 46 partnerships in various oil and gas partnerships.
For partnerships wherewhich we have a controlling interest, the partnerships are consolidated.interest. We are currently consolidating 46 partnerships, and we reflect the non-controlling ownership interest in partnershipsof the portion we do not own on our consolidated balance sheets within stockholders’ equity and subsidiaries as non-controlling interests on our consolidated statements of operations and also reflects the non-controlling ownership interest in the net assets of the partnerships as non-controlling interests within stockholders’ equity on our consolidated balance sheets. All significant intercompany accounts and transactions have been eliminated.operations.
In accordance with established practice in the oil and gas industry, our consolidated financial statements also include our pro-rata share of assets, liabilities, income, lease operating costs and general and administrative expenses of the oil and gas partnerships in which we have a non-controlling interest.
Non-majority ownedWe utilize the equity method to account for investments that do not meet the criteria for pro-ratapro rata consolidation are accounted for using the equity method when we have the ability to significantly influence the operating decisions of the investee. When we do not have the ability to significantly influence the operating decisions of an investee, the cost method is used.
All significant intercompany accounts and transactions if any, with investees have been eliminatedeliminated.
Use of Estimates in the accompanying consolidated financial statements.Preparation of Financial Statements
The preparation of financial statements in conformity with accounting principles generally accepted in the United States (“GAAP”) requires management to make estimates and assumptions that affect the reported amounts of assets, liabilities and expenses and disclosure of contingent assets and liabilities. Significant items subject to such estimates and assumptions include the carrying value of oil and gas properties, the estimate of proved oil and gas reserve volumes and the related depletion and present value of estimated future net cash flows and the ceiling test applied to capitalized oil and gas properties, determining the amounts recorded for deferred income taxes, fair value of commodity derivative instruments, fair value of assets acquired and liabilities assumed qualifying as business combinations and asset retirement obligations. Actual results could differ from the estimates and assumptions used.
Reclassifications
Certain prior period balances in the consolidated balance sheets and statements of operations have been reclassified to conform to the current year presentation. Specifically, a portion of credit facilities and notes payable balances as of December 31, 2018 were reclassified from non-current liabilities to current liabilities. The remaining reclassifications include certain immaterial balance sheet and expense accounts. These reclassifications had no impact on net income or stockholders’ equity previously reported.
Fair Value of Financial Instruments
The carrying value of our cash and cash equivalents, accounts receivables, prepaid expenses, deposits and other current assets and accounts payable and accrued liabilities approximate fair value due to the short maturity of these instruments. The carrying value of our notes payable and credit facilities approximate fair value based on the variable nature of interest rates and current market rates available to us. Commodity derivatives are recorded at fair value.
Cash and Cash Equivalents
Cash and cash equivalents if any, in excess of daily requirements have been generally invested in money market accounts, certificates of deposits and other cash equivalents with maturities of three months or less. Such investments are deemed to be cash equivalents for purposes of the consolidated financial statements. The carrying amount ofAt times, the Company may have cash equivalents approximates fair value because of the short maturity and high credit quality of these investments.cash equivalent balances more than federal insured amounts within their accounts.
Accounts Receivable
We grant credit to all qualified customers, which potentially subjects us to credit risk resulting from, among other factors, adverse changes in the industries in which we operate and the financial condition of our customers. We continuously monitor collections and payments from our customers and, maintainsif necessary, maintain an allowance for doubtful accounts based upon our historical experience and any specific customer collection issues that it haswe have identified.
At December 31, 20172019 and 2016,2018, we had not identified any collection issues related to our oil and gas operations and consequently no allowance for doubtful accounts was provided for on those dates. In addition, as of December 31, 2016, accounts receivable included a deposit of $1.7 million made by us on the purchase of assets in the Ventura Basin of California through Carbon California. The deposit was reimbursed to us upon the consummation of the acquisition by Carbon California on February 15, 2017. See Note 4 for additional information.
Revenue
Our accountsAccounts receivable - Revenue is comprised of oil, and natural gas and NGL revenues from producing activities.
Joint Interest Billings and Other
Our accounts receivable – joint interest billings and other is comprised of receivables due from other exploration and production companies and individuals who own working interests in the properties that we operate. For receivables from joint interest owners, we typically have the ability to withhold future revenues disbursements to recover any non-payment of joint-interest billings.
The Company recognizes an asset or a liability, whichever is appropriate, for revenues associated with over-deliveries or under-deliveries of natural gas to purchasers. As of December 31, 2017, there was an imbalance due to us in the amount of approximately $193,000.
Due from Related party
Our receivables – due from related party are comprised of receivables from Carbon California and Carbon Appalachia in our role as manager and operator of these entities. See Note 16.
Prepaid Expense, Deposits, and Other Current Assets
Our prepaid expense, deposit, and other current asset account is comprised of prepaid insurance, the current portion of unamortized Credit Facilities issuance costs and deposits.
Oil and Natural Gas Sales
We sell our oil and natural gas production to various purchasers in the industry. The table below presents purchasers that account for 10% or more of total oil and natural gas sales for the years ended December 31, 2017 and 2016. There are several purchasers in the areas where we sell our production. We do not believe that changing our primary purchasers or a loss of any other single purchaser would materially impact our business.
| For the years ended December 31, | ||||||||
| Purchaser | 2017 | 2016 | ||||||
| Purchaser A | 23 | % | 4 | % | ||||
| Purchaser B | 17 | % | 15 | % | ||||
| Purchaser C | 12 | % | 18 | % | ||||
| Purchaser D | 11 | % | 16 | % | ||||
| Purchaser E | 8 | % | 17 | % | ||||
We recognize an asset or a liability, whichever is appropriate, for revenues associated with over-deliveries or under-deliveries of natural gas to purchasers. A purchaser imbalance asset occurs when we deliver more natural gas than we nominated to deliver to the purchaser and the purchaser pays only for the nominated amount. Conversely, a purchaser imbalance liability occurs when we deliver less natural gas than we nominated to deliver to the purchaser and the purchaser pays for the amount nominated. As of December 31, 20172019, and 2016,2018, we had a purchaser imbalance receivable of $193,000 within trade receivables$956,000 and purchaser imbalance payable of approximately $25,000$551,000, respectively, within accounts payablereceivable-revenue.
Joint Interest Billings and accrued expenses, respectively, whichOther
Our accounts receivable - joint interest billings and other is comprised of receivables due from other exploration and production companies and individuals who own working interests in the properties that we operate. For receivables from joint interest owners, we typically have the ability to withhold future revenues disbursements to recover any non-payment of joint-interest billings.
Insurance Receivable
Insurance receivable is comprised of insurance claims for the loss of property as a result of wildfires that impacted Carbon California in December 2017. The Company filed claims with its insurance provider. In January 2019, we reached a settlement agreement and received an $800,000 final settlement payment from our insurance provider related to the damage caused by the California wildfires. As of December 31, 2019, we were in receipt of all funds associated with the claims.
Revenue Recognition
Oil, natural gas and natural gas liquids revenues are recognized when the performance obligation to deliver the production volumes is met and control is transferred to the customer. All product revenues are recognized on the basis of our net revenue interest.
Oil and natural gas are typically sold in an unprocessed state to third party purchasers. We recognize revenue based on the net proceeds received from the purchaser when control of oil or natural gas passes to the purchaser. For oil sales, control is typically transferred to the purchaser upon receipt at the wellhead or a contractually agreed upon delivery point. Under our natural gas contracts with purchasers, control transfers upon delivery at the wellhead or the inlet of the purchaser’s system. For our other natural gas contracts, control transfers upon delivery to the inlet or to a contractually agreed upon delivery point.
Transfer of control drives the presentation of transportation and gathering costs within the accompanying consolidated statements of operations. Transportation and gathering costs incurred prior to control transfer are recorded within the transportation and gathering expense line item on the accompanying consolidated statements of operations, while transportation and gathering costs incurred subsequent to control transfer are recognized as a current assetreduction to the related revenue.
We record revenue in the month production is delivered to the purchaser, but settlement statements may not be received until 30 to 90 days after the month of production. As such, we estimate the production delivered and current liability, respectively, in ourthe related pricing. The estimated revenue is recorded within Accounts receivable – Revenue on the consolidated balance sheets. Any differences between our initial estimates and actuals are recorded in the month payment is received from the customer. These differences have not historically been material.
Purchaser A comprises of approximately 23%Concentration
We sell our oil, natural gas and natural gas liquids production to various purchasers in the industry. The table below presents purchasers that account for 10% or more of total oil, natural gas, and natural gas liquids sales for the years ended December 31, 2019 and 2018. There are several purchasers in the areas where we sell our production. We do not believe that changing our primary purchasers or a loss of any other single purchaser would materially impact our business.
| Year Ended December 31, | ||||||||
| Purchaser | 2019 | 2018 | ||||||
| Purchaser A | 18 | % | * | |||||
| Purchaser B | 11 | % | * | |||||
| Purchaser C | * | 17 | % | |||||
| Purchaser D | * | 16 | % | |||||
| Purchaser E | * | 12 | % | |||||
| * | less than 10% |
As of December 31, 2019, none of the above purchasers comprised more than 10% of total accounts receivable. One purchaser’s receivable acquired with the closing of the OIE Membership Acquisition accounted for approximately 10% of accounts receivable as of December 31, 2017.2018.
Inventory
Inventory includes natural gas, which is recorded at the lower of weighted average cost or market value. Inventory also consists of material and supplies used in connection with the Company’s maintenance, storage and handling and gas that is available for immediate use, referred to as working gas, which are stated at the lower of cost or net realizable value.
Accounting for Oil and Gas Operations
We use the full cost method of accounting for oil and gas properties. Accordingly, all costs related to the acquisition, exploration and development of oil and gas properties, including costs of undeveloped leasehold, dry holes and leasehold equipment, are capitalized. Overhead costs incurred that are directly identified with acquisition, exploration and development activities undertaken by us for our own account, and which are not related to production, general corporate overhead or similar activities, are also capitalized.
Unproved properties are excluded from amortized capitalized costs until it is determined whether or not proved reserves can be assigned to such properties. We assess our unproved properties for impairment at least annually. Significant unproved properties are assessed individually.
Capitalized costs are depleted by an equivalent unit-of-production method, converting gas to oil at the ratio of six thousand cubic feet of natural gas to one barrel of oil. Depletion is calculated using capitalized costs, including estimated asset retirement costs, plus estimated future expenditures (based on current costs) to be incurred in developing proved reserves, net of estimated salvage values.
No gain or loss is recognized upon disposal of oil and gas properties unless such disposal significantly alters the relationship between capitalized costs and proved reserves. All costs related to production activities, including work-over costs incurred solely to maintain or increase levels of production from an existing completion interval, are charged to expense as incurred.
We perform a ceiling test quarterly. The full cost ceiling test is a limitation on capitalized costs prescribed by SEC Regulation S-X Rule 4-10. The ceiling test is not a fair value-based measurement, rather it is a standardized mathematical calculation. The ceiling test provides that capitalized costs less related accumulated depletion and deferred income taxes may not exceed the sum of (1) the present value of future net revenue from estimated production of proved oil and gas reserves using the un-weighted arithmetic average of the first-day-of-the month price for the previous twelve month period, excluding the future cash outflows associated with settling asset retirement obligations that have been accrued on the balance sheet, at a discount factor of 10%; plus (2) the cost of properties not being amortized, if any; plus (3) the lower of cost or estimated fair value of unproved properties included in the costs being amortized, if any; less (4) income tax effects related to differences in the book and tax basis of oil and gas properties. Should the net capitalized costs exceed the sum of the components noted above, a ceiling test write-down or impairment would be recognized to the extent of the excess capitalized costs. Such impairments are permanent and cannot be recovered in future periods even if the sum of the components noted above exceeds capitalized costs in future periods.
For the yearyears ended December 31, 2017,2019 and 2018, we did not recognize a ceiling test impairment as our full cost pool did not exceed the ceiling limitations. For the year ended December 31, 2016, we recognized a ceiling test impairment of approximately $4.3 million as our full cost pool exceeded its ceiling limitations. Future declines in oil and natural gas prices, increases in future operating expenses and future development costs could result in impairments of our oil and gas properties in future periods. Impairment changes are a non-cash charge and accordingly would not affect cash flows but would adversely affect our net income and shareholders’stockholders’ equity.
We capitalize interest in accordance with Financial Accounting Standards Board (“FASB”FASB”) ASC 932-835-25,Extractive Activities-Oil and Gas, Interest.Interest. Therefore, interest is capitalized for any unusually significant investments in unproved properties or major development projects not currently being depleted. We capitalize the portion of general and administrative costs that is attributable to our acquisition, exploration and development activities.
Other Property and Equipment
Other property and equipment are recorded at cost upon acquisitionor, in the case of assets acquired in a business combination, at fair value. Costs of renewals and include office equipment, computer equipment, building, field equipment, vehicles,improvements that substantially extend the useful lives of assets are capitalized. Maintenance and software. Depreciationrepair costs which do not extend the useful lives of other property and equipment is calculatedare charged to expense as incurred. Depreciation and amortization are computed using the straight-line method over the estimated useful lives of assets. Office furniture, automobiles, and computer hardware and software are depreciated over three to sevenfive years. Buildings are depreciated over 27.5 years, usingand pipeline facilities and equipment are depreciated over twenty years. Leasehold improvements are capitalized and amortized over the straight-line method.
Long-Lived Assetsshorter of the lease term or the estimated useful life of the asset.
We review our long-lived assets other than oilproperty and gas propertiesequipment for impairment whenever events or changes in circumstances indicate that the carrying amount of the asset may not be recovered. We look primarily to the estimated undiscounted future cash flows in our assessment of whether or not long-lived assetsproperty and equipment have been impaired.
Other Long-Term Assets
Our other long-term assets are comprised of bonds, the long-term portion of deferred debt issue and financing costs and the long-term portion of our commodity derivative liability.
Investments in Affiliates
Investments in non-consolidated affiliates are accounted for under either the cost or equity method of accounting, as appropriate. The cost method of accounting is generally used for investments in affiliates in which we have less than 20% of the voting interests of a corporate affiliate or less than a 3% to 5% interest of a partnership or limited liability company and do not have significant influence. Investments in non-consolidated affiliates, accounted for using the cost method of accounting, are recorded at cost and impairment assessments for each investment are made annually to determine if a decline in the fair value of the investment, other than temporary, has occurred. A permanent impairment is recognized if a decline in the fair value occurs.
If we hold between 20% and 50% of the voting interest in non-consolidated corporate affiliates or generally greater than a 3% to 5% interest of a partnership or limited liability company and exert significant influence or control (e.g., through our influence with a seat on the board of directors or management of operations), the equity method of accounting is generally used to account for the investment. Investment in affiliates will increase or decrease by our share of the affiliates’ profits or losses and such profits or losses are recognized in our consolidated statements of operations. If we hold greater than 50% of voting shares, we will generally consolidate the entities under the voting interest model. For our investments in Carbon Appalachia and Carbon California, we use the hypothetical liquidation at book value (“HLBV”) method to recognize our share of profits or losses. We review equity method investments for impairment whenever events or changes in circumstances indicate that “an other than temporary” decline in value has occurred.
Related Party Transactions
Management ReimbursementsBase Gas
In our role as manager of Carbon California and Carbon Appalachia, we receive management reimbursements. These reimbursements are included in general and administrative – related party reimbursement on our consolidated statement of operations.
Operating Reimbursements
In our roleGas that is used to maintain wellhead pressures within the storage fields, referred to as operator of Carbon Californiabase gas, is recorded in other property and Carbon Appalachia, we receive reimbursements of operating expenses. These expenses are recorded directly to receivable – related partyequipment, net on ourthe consolidated balance sheetssheets. Base gas is held in a storage field that is not intended for sale but is required for efficient and are therefore not included in our operating expenses on our consolidated statementsreliable operation of operations (see Note 16).
Warrant Liability
We issued warrants related to investments in Carbon California and Carbon Appalachia. We account for these warrants in accordance with guidance contained in Accounting Standards Codification (“ASC”) 815,Derivatives and Hedging, which requires these warrants to be recorded on the balance sheet as either an asset or a liability measured at fair value, with changes in fair value recognized in earnings. Accordingly, we classified the warrants as liabilities. The warrants are subject to remeasurement at each balance sheet date, with any change in the fair value recognized as a component of other income or expense in the consolidated statement of operations. For the year ended December 31, 2017, changes in the fair value of warrants accounted for gains of approximately $3.1 million.facility.
Asset Retirement Obligations
Our asset retirement obligations (“ARO”ARO”) relate to future costs associated with the plugging and abandonment of oil and gas wells, removal of equipment and facilities from leased acreage and returning such land to its original condition. The fair value of a liability for an ARO is recorded in the period in which it is incurred, and the cost of such liability is recorded as an increase in the carrying amount of the related long-livednon-current asset by the same amount. The liability is accreted each period and the capitalized cost is depleted on a units-of-production basis as part of the full cost pool. Revisions to estimated AROs result in adjustments to the related capitalized asset and corresponding liability.
The estimated ARO liability is based on estimated economic lives, estimates as to the cost to abandon the wells in the future, and federal and state regulatory requirements. The liability is discounted using a credit-adjusted risk-free rate estimated at the time the liability is incurred or increased as a result of a reassessment of expected cash flows and assumptions inherent in the estimation of the liability. Upward revisions to the liability could occur due to changes in estimated abandonment costs or well economic lives, or if federal or state regulators enact new requirements regarding the abandonment of wells. AROs are valued utilizing Level 3 fair value measurement inputs (see Note 11)Notes 6 and 13).
The following table is a reconciliation of the ARO for the years ended December 31, 2017 and 2016.
| Year Ended December 31, | ||||||||
| (in thousands) | 2017 | 2016 | ||||||
| Balance at beginning of year | $ | 5,120 | $ | 3,095 | ||||
| Accretion expense | 307 | 176 | ||||||
| Change in estimate of cash outflow | 2,402 | |||||||
| Additions during period | - | 1,849 | ||||||
| Less: sale of wells | (92 | ) | - | |||||
| 7,737 | 5,120 | |||||||
| Less: ARO recognized as accounts payable and accrued liabilities | (380 | ) | (114 | ) | ||||
| Balance at end of year | $ | 7,357 | $ | 5,006 | ||||
For the year ended December 31, 2017, we did not have any additions of ARO compared to $1.8 million in 2016, which was primarily due to the acquisition of producing oil and natural gas properties in the Appalachian Basin. During the year ended December 31, 2017, we increased the estimated cost of retirement obligations for certain wells in the Appalachian Basin. Our estimated costs range from $20,000 to $30,000, which is a better representation of current prices of supplies and services. This increase to estimated costs resulted in a $2.4 million increase to our ARO in 2017.
Financial Instruments
Our financial instruments include cash and cash equivalents, accounts receivables, accounts payables, accrued liabilities, commodity derivative instruments, warrant liability, and our credit facility. The carrying value of cash and cash equivalents, accounts receivable, accounts payables and accrued liabilities are representative of their fair value, due to the short maturity of these instruments. Our commodity derivative instruments are recorded at fair value, as discussed below and in Note 11. The carrying amount of our credit facility approximated fair value since borrowings bear interest at variable rates, which are representative of our credit adjusted borrowing rate.
Commodity Derivative Instruments
We enter into commodity derivative contracts to manage our exposure to oil and natural gas price volatility with an objective to reduce exposure to downward price fluctuations. Commodity derivative contracts may take the form of futures contracts, swaps, collars or options. We have elected not to designate our derivatives as cash flow hedges. All derivatives are initially and subsequently measured at estimated fair value and recorded as assets or liabilities on the consolidated balance sheets andsheets. Changes in the changes in fair value of commodity derivative contracts are recognized as gains or losses in revenues in the consolidated statements of operations.operations and gains and losses are included within the cash flows from operating activities in the consolidated statements of cash flows. We do not believe we are exposed to credit risk in our derivative activities as the counterparties are established, well-capitalized financial institutions.
Stock - Based Compensation
For restricted stock, compensation cost is measured at the grant date, based on the fair value of the awards and is recognized on a straight-line basis over the requisite service period (usually the vesting period). For restricted performance units, once it becomes probable that the performance measure will be achieved, expense is recognized over the remainder of the performance period.
Income Taxes
We account for income taxes using the asset and liability method, whereby deferred tax assets and liabilities are recognized for the future tax consequences attributable to differences between the financial statement carrying amounts of assets and liabilities and their respective tax basis, as well as the future tax consequences attributable to the future utilization of existing tax net operating losses and other types of carryforwards. Deferred tax assets and liabilities are measured using enacted tax rates expected to apply to taxable income in the years in which those temporary differences and carryforwards are expected to be recovered or settled. The effect on deferred tax assets and liabilities of a change in tax rates is recognized in income in the period that includes the enactment date. With the passage of the Tax Cut and Jobs Act (“TCJA”), we are required to remeasure deferred income taxes at the lower 21% corporate rate as of the date the TCJA was signed into law even though the reduced rate is effective January 1, 2018.
We account for uncertainty in income taxes for tax positions taken or expected to be taken in a tax return. Only tax positions that meet the more likely than not recognition threshold are recognized.
Stock - Based Compensation
Compensation cost is measured at the grant date, based on the fair value of the awards and is recognized on a straight-line basis over the requisite service period (usually the vesting period). For performance units, since these awards are settled in cash at the end of a defined performance period, they are measured quarterly and expensed over the remaining vesting period.
Revenue Recognition
Oil and natural gas revenues are recognized when production volumes are sold to a purchaser at a fixed or determinable price, delivery has occurred, title has transferred and collectability is reasonably assured. Natural gas revenues are recognized on the basis of our net working revenue interest.
Earnings Per Common Share
Basic earnings (loss) per common share is computed by dividing the net income (loss) attributable to common stockholders for the period by the basic weighted average number of common shares outstanding during the period. The shares of restricted common stock granted to our officers, directors and employees are included in the computation of basic net income per share only after the shares become fully vested. Diluted earnings (loss) per common share includes both the vested and unvestedpotentially issuable shares consisting primarily of non-vested restricted stock and the potential dilution that could occur upon exercise of options and warrants to acquire common stock computedcontingent restricted performance units, using the treasury stock method, which assumes that the increase in the number of shares is reduced by the number of shares which could have been repurchased by us with the proceedsmethod. In periods when we report a net loss, all common stock equivalents are excluded from the exercise of options and warrants (which were assumed to have been made at the average market price of the common shares during the reporting period).
The following table sets forth the calculation of basic and diluted income (loss) per share:
| For the Year Ended December 31, | ||||||||
| (in thousands except per share amounts) | 2017 | 2016 | ||||||
| Net income (loss) | $ | 6,318 | $ | (12,406 | ) | |||
| Less: warrant derivative gain | (3,133 | ) | - | |||||
| Diluted net income | 3,185 | (12,406 | ) | |||||
| Basic weighted-average common shares outstanding during the period | 5,662 | 5,468 | ||||||
| Add dilutive effects of warrants and non-vested shares of restricted stock | 790 | - | ||||||
| Diluted weighted-average common shares outstanding during the period | 6,452 | 5,468 | ||||||
| Basic net (loss) income per common share | $ | 1.12 | $ | (2.27 | ) | |||
| Diluted net (loss) income per common share | $ | 0.49 | $ | (2.27 | ) | |||
Forweighted average shares outstanding because they would have an anti-dilutive effect, meaning the year ended December 31, 2017, we had net income and the diluted loss per common share calculation includes the anti-dilutive effects of approximately 519,000 warrants and approximately 271,000 non-vested shares of restricted stock. In addition, approximately 259,000 restricted performance units subject to future contingencies were excluded in the basic and diluted loss per share calculations. For the year ended December 31, 2016, we had a net loss and therefore the diluted loss per common share calculation excludes the anti-dilutive effects of approximately 13,000 warrants and approximately 268,000 non-vested shares of restricted stock. In addition, approximately 296,000 restricted performance units subject to future contingencies were excluded from the basic and diluted loss per share calculations.would be reduced.
Recently Adopted Accounting Pronouncement
Oil and Gas Reserves
Oil and gas reserves represent theoretical quantities of crude oil, natural gas, and natural gas liquids (“NGL”) which geological and engineering data demonstrate with reasonable certainty to be recoverable in future years from known reservoirs under existing economic and operating conditions. There are numerous uncertainties inherent in estimating oil and gas reserves and their values, including many factors beyond our control. Accordingly, reserve estimates and the projected economic value of our and our equity investees’ properties will differ from the actual future quantities of oil and gas ultimately recovered and the corresponding value associated with the recovery of these reserves.
Use of Estimates in the Preparation of Financial Statements
The preparation of financial statements in conformity with GAAP requires management to make estimates and assumptions that affect the reported amounts of assets, liabilities and expenses and disclosure of contingent assets and liabilities. Significant items subject to such estimates and assumptions include the carrying value of oil and gas properties, the estimate of proved oil and gas reserve volumes and the related depletion and present value of estimated future net cash flows and the ceiling test applied to capitalized oil and gas properties, determining the amounts recorded for deferred income taxes, stock-based compensation, fair value of commodity derivative instruments, fair value of warrants, fair value of equity method investments, fair value of assets acquired and liabilities assumed qualifying as business contributions and asset retirement obligations. Actual results could differ from those estimates and assumptions used.
Adopted and Recently Issued Accounting Pronouncements
InOn January 2017, the Financial Accounting Standards Board (“FASB”) issued1, 2019, we adopted Accounting Standards Update No. 2016-02, Leases(“ASU”Topic 842”) 2017-01,Business Combinations (Topic 805). This ASU clarifies(ASU 2016-02), as amended, which supersedes the definition of a business with the objective of addinglease accounting guidance under Topic 840, and generally requires lessees to assist entities with evaluating whether transactions should be accounted for as acquisitions (or disposals) ofrecognize operating and financing lease liabilities and corresponding right-of-use assets or businesses. This guidance is to be applied using a prospective method and is effective for annual periods, and interim periods within those annual periods, beginning after December 15, 2017. Early adoption is permitted as outlined in ASU 2017-01. We elected to early adopt this pronouncement effective January 1, 2017.
In August 2016, the FASB issued ASU 2016-15,Statement of Cash Flows-Classification of Certain Cash Receipts and Cash Payments. The objective of this update is intended to reduce the diversity in practice as to how certain cash receipts and cash payments are presented and classified in the statement of cash flows by providing guidance for several specific cash flow issues. ASU 2016-15 is effective for the annual periods beginning after December 15, 2017, and interim periods within those annual periods. We are currently evaluating the impact of adopting this standard.
In February 2016, the FASB issued ASU 2016-02,Leases.The objective of this ASU is to increase transparency and comparability among organizations by recognizing lease assets and liabilities on the balance sheet and disclosing key information aboutto provide enhanced disclosures surrounding the amount, timing and uncertainty of cash flows arising from leasing arrangements. This update requires lesseesWe adopted the new guidance using the modified retrospective transition approach by applying the new standard to recognize a lease liability and a lease asset for all leases including operating leases, with a term greater than twelve months on its balance sheet. The update also expands the required quantitative and qualitative disclosures surrounding leases. This update is effective for fiscal years beginning after December 15, 2018 and interim periods within those fiscal years and should be applied using a modified retrospective approach. Early adoption is permitted. We have not yet determined what the effects of adopting this updated guidance will be on our consolidated financial statements.
In November 2015, the FASB issued ASU 2015-17, Balance Sheet Classification of Deferred Taxes. The objective of this update is to require deferred tax liabilities and assets to be classified as noncurrent in a classified statement of financial position. ASU 2015-17 is effective for annual periods beginning after December 15, 2016, and interim periods within those annual periods. The standard was adopted on January 1, 2017 and did not have a significant impact on our disclosures and financial statements.
In May 2014, the FASB issued ASU 2014-09,Revenue from Contracts with Customers. The objective of ASU 2014-09 is to clarify the principles for recognizing revenue and to develop a common revenue standard for U.S. GAAP and International Financial Reporting Standards. The FASB subsequently issued ASU 2015-14, ASU 2016-08, ASU 2016-10, ASU 2016-12 and ASU 2016-20, which deferred the effective date of ASU 2014-09 and provided additional implementation guidance. These ASUs are effective for fiscal years, and interim periods within those years, beginning after December 15, 2019. The standards permit retrospective application using either of the following methodologies: (i) restatement of each prior reporting period presented or (ii) recognition of a cumulative-effect adjustment as ofexisting at the date of initial application. We plan to adopt ASU 2014-09 effective January 1, 2018. We have elected to useapplication and not restating comparative periods. The most significant impact was the modified retrospective methodrecognition of right-of-use assets and lease liabilities for adoption. We are in the process of assessing our contracts with customers and evaluating the effect of adopting these standardsoperating leases. See Note 8 for further information on our financial statements, accounting policies, internal controls and disclosures. The adoption is not expected to have a significant impact on our resultsimplementation of operations or cash flows, however, we are currently evaluating the proper classification of certain pipeline gathering, transportation and gas processing agreements to determine whether reclassifications to total revenues and expenses will be necessary under the new standards.this standard.
Note 4 –3 - Acquisitions and Divestitures
AcquisitionsMajority Control of Carbon Appalachia
In October 2016, Nytis LLC completed the EXCO Acquisition consistingOn December 31, 2018, we acquired all of producing natural gas wellsOld Ironsides’ Class A Units of Carbon Appalachia for approximately $58.2 million, representing approximately 72.76% share ownership. We paid $33.0 million in cash and natural gas gathering facilities located in our Appalachian Basin operating area. The natural gas gathering facilities are primarily useddelivered promissory notes of approximately $25.2 million to gather our natural gas production. The acquisition was pursuant to a purchase and sale agreement effective October 1, 2016Old Ironsides (the “EXCO Purchase Agreement”“Old Ironsides Notes”) by and among EXCO Production Company (WV), LLC, BG Production Company (WV), LLC and EXCO Resources (PA) LLC (collectively the “Sellers”) and Nytis LLC, as the buyer. The purchase price of the acquired assets pursuant to the EXCO Purchase Agreement was $9.0 million subject to customary closing adjustments and the assumption of certain obligations.. See Note 7 for additional information.
The EXCOOIE Membership Acquisition provided us with proved developed reserves, production and operating cash flow in locations where we have similar assets.
The EXCO Acquisition qualifiedwas accounted for as a business combination and as such, we estimatedin accordance with ASC 805,Business Combinations (“ASC 805”). We finalized the determination of the fair valuevalues of the assets acquired and liabilities assumed asin the fourth quarter of 2019. There were no material changes in the fair values of the Closing Date. We considered various factors in our estimate of fair value ofassets acquired and the acquired assets including (i) reserves, (ii) production rates, (iii) future operating and development costs, (iv) future commodity prices, including price differentials, (v) future cash flows, and (vi) a market participant-based weighted average cost of capital.
We expensed approximately $501,000 of transaction and due diligence costs related toliabilities assumed from the EXCO Acquisition that were included in general and administrative expenses in the accompanying consolidated statement of operations for the year ended December 31, 2016.
preliminary amounts. The following table summarizes the consideration paid to the Sellers and the estimatedfinal fair value of the assetsvalues:
| Amount (in thousands) | ||||
| Cash consideration | $ | 33,000 | ||
| Old Ironsides Notes | 25,194 | |||
| Fair value of previously held equity interest | 14,029 | |||
| Fair value of business acquired | $ | 72,223 | ||
Assets acquired and liabilities assumed.assumed are as follows:
| Consideration paid to Sellers: | ||||
| Cash consideration | $ | 8,117 | ||
| Recognized amounts of identifiable assets acquired and liabilities assumed: | ||||
| Proved oil and gas properties and related support facilities | $ | 12,656 | ||
| Asset retirement obligations | (1,845 | ) | ||
| Working capital | (2,694 | ) | ||
| Total identified net assets | $ | 8,117 | ||
| Amount (in thousands) | ||||
| Cash | $ | 12,283 | ||
| Accounts receivable: | ||||
| Revenue | 12,834 | |||
| Trade receivable | 1,941 | |||
| Commodity derivative asset | 198 | |||
| Inventory | 2,022 | |||
| Prepaid expenses, deposits, and other current assets | 456 | |||
| Oil and gas properties: | ||||
| Proved | 107,694 | |||
| Unproved | 1,869 | |||
| Other property and equipment, net | 15,441 | |||
| Other non-current assets | 514 | |||
| Accounts payable and accrued liabilities | (20,468 | ) | ||
| Due to related parties | (236 | ) | ||
| Firm transportation contract obligations | (18,724 | ) | ||
| Asset retirement obligations | (5,626 | ) | ||
| Notes payable | (37,975 | ) | ||
| Total net assets acquired | $ | 72,223 | ||
69
Below are consolidated results
On the date of operations for the year ended December 31, 2016 as thoughacquisition, we derecognized our equity investment in Carbon Appalachia and recognized a gain of approximately $1.3 million based on the EXCO Acquisition had been completed asfair value of January 1, 2016. The EXCO Acquisition closed October 3, 2016, and accordingly,our previously held interest compared to its carrying value, which is recorded in investments in affiliates in our consolidated statement of operations for the year ended December 31, 2017 includes the2018.
Consolidation of Carbon Appalachia and OIE Membership Acquisition Pro Forma Results of Operations (Unaudited)
Below are unaudited pro forma consolidated results of operations for the year ended December 31, 20172018, as though the OIE Membership Acquisition had been completed as of January 1, 2018:
| Year Ended December 31, | ||||
| (in thousands, except per share amounts) | 2018 | |||
| Revenue | $ | 136,592 | ||
| Net income before non-controlling interests | $ | 11,320 | ||
| Net income attributable to non-controlling interests | $ | 4,375 | ||
| Net income attributable to controlling interests before preferred shares | $ | 5,596 | ||
| Net income per share, basic | $ | 0.74 | ||
| Net income per share, diluted | $ | 0.69 | ||
Liberty Acquisition
On July 11, 2018, we completed an acquisition of 54 operated oil and gas wells covering approximately 55,000 gross acres (22,000 net) and associated mineral interests in the Appalachian Basin for a purchase price of $3.0 million (the “Liberty Acquisition”). The Liberty Acquisition increased our working interest in the acquired wells from 60% to 100%. The Liberty Acquisition was funded through borrowings under our previous credit facility. The Liberty Acquisition was accounted for as a non-significant asset acquisition.
Majority Control of Carbon California
The acquisition of additional ownership interest in Carbon California on February 1, 2018, was accounted for as a step acquisition in which we obtained control in accordance with ASC 805 (referred to herein as the “Carbon California Acquisition”). We recognized 100% of the EXCO properties acquired.identifiable assets acquired, liabilities assumed and the non-controlling interest at their respective fair value as of the date of the acquisition. We exchanged 1,527,778 common shares at a fair value of approximately $8.3 million ($5.45 per share), for 11,000 Class A Units of Carbon California, representing a 38.59% profits ownership interest in Carbon California. We followed the fair value method to allocate the consideration transferred to the identifiable net assets acquired and non-controlling interest as follows:
| Unaudited Pro Forma Consolidated Results For Year Ended December 31, | ||||
| (in thousands, except per share amounts) | 2016 | |||
| Revenue | $ | 13,963 | ||
| Net income (loss) income before non-controlling interests | (6,825 | ) | ||
| Net income (loss) attributable to non-controlling interests | 413 | |||
| Net income (loss) attributable to controlling interests | $ | (6,412 | ) | |
| Net income (loss) per share (basic) | $ | (1.17 | ) | |
| Net income (loss) per share (diluted) | $ | (1.17 | ) | |
| Amount (in thousands) | ||||
| Fair value of Carbon common shares transferred as consideration | $ | 8,327 | ||
| Fair value of non-controlling interest | 16,466 | |||
| Fair value of previously held interest | 7,243 | |||
| Fair value of contribution associated with acquisition of Yorktown’s interest in Carbon California | 8,637 | |||
| Fair value of business acquired | $ | 40,673 | ||
Assets acquired and liabilities assumed are as follows:
| Amount (in thousands) | ||||
| Cash | $ | 275 | ||
| Accounts receivable: | ||||
| Joint interest billings and other | 690 | |||
| Receivable - related party | 1,610 | |||
| Prepaid expenses, deposits, and other current assets | 1,723 | |||
| Oil and gas properties: | ||||
| Proved | 65,114 | |||
| Unproved | 1,495 | |||
| Other property and equipment, net | 877 | |||
| Other non-current assets | 475 | |||
| Accounts payable and accrued liabilities | (6,054 | ) | ||
| Commodity derivative liability - current | (916 | ) | ||
| Commodity derivative liability - non-current | (1,729 | ) | ||
| Asset retirement obligations - current | (384 | ) | ||
| Asset retirement obligations - non-current | (2,537 | ) | ||
| Subordinated Notes, related party, net | (8,874 | ) | ||
| Senior Revolving Notes, related party | (11,000 | ) | ||
| Notes payable | (92 | ) | ||
| Total net assets acquired | $ | 40,673 | ||
On the date of the acquisition, we derecognized our equity investment in Carbon California and recognized a gain of approximately $5.4 million based on the fair value of our previously held interest compared to its carrying value.
During the fourth quarter of 2018, the Company finalized the determination of fair value and purchase price allocation related to the Carbon California Acquisition. Based on the final valuation received, the allocation of fair value exceeded the consideration by $8.6 million, which has been reflected in equity as a capital contribution from Yorktown who held a significant membership interest in Carbon California and is the Company’s largest stockholder.
Seneca Acquisition
On May 1, 2018, Carbon California acquired approximately 309 oil wells and approximately 6,800 gross acres (6,600 net) of oil and gas leases, and fee interests in and to certain lands, situated in the Ventura Basin, together with associated pipelines, facilities, equipment and other property rights from Seneca Resources Corporation (“Seneca Acquisition”) for a purchase price of $43.0 million. We contributed approximately $5.0 million to Carbon California to fund our portion of the purchase price through the issuance of 50,000 shares of preferred stock to Yorktown. Prudential also contributed $5.0 million to fund its share of the equity portion of the purchase price. Carbon California funded the remaining purchase price from cash, increased borrowings under the Carbon California Senior Revolving Notes and $3.0 million in proceeds from the issuance of Senior Subordinated Notes.
The Seneca Acquisition was accounted for as an asset acquisition as substantially all of the value related to proved oil and gas properties.
Consolidation of Carbon California and Seneca Acquisition Pro Forma Results of Operations (Unaudited)
Below are unaudited pro forma consolidated results of operations for the year ended December 31, 2018, as though the Carbon California Acquisition and the Seneca Acquisition had been completed as of January 1, 2018:
| (in thousands, except per share amounts) | Year Ended December 31, 2018 (unaudited) | |||
| Revenue | $ | 33,256 | ||
| Net income before non-controlling interests | $ | 5,232 | ||
| Net loss attributable to non-controlling interests | (2,334 | ) | ||
| Net income attributable to controlling interests | $ | 7,566 | ||
| Net income per share (basic) | $ | 1.00 | ||
| Net income per share (diluted) | $ | 0.96 | ||
Note 5 –4 - Property and Equipment, Net
Net propertyProperty and equipment, at December 31, 2017 and 2016net consists of the following:
| As of December 31, | ||||||||||||||||
| (in thousands) | As of December 31, | 2019 | 2018 | |||||||||||||
| 2017 | 2016 | |||||||||||||||
| Oil and gas properties: | ||||||||||||||||
| Proved oil and gas properties | $ | 114,893 | $ | 111,771 | $ | 351,488 | $ | 347,059 | ||||||||
| Unproved properties not subject to depletion | 1,947 | 1,999 | ||||||||||||||
| Unproved properties | 4,872 | 5,416 | ||||||||||||||
| Accumulated depreciation, depletion, amortization and impairment | (80,715 | ) | (78,559 | ) | (109,344 | ) | (98,604 | ) | ||||||||
| Net oil and gas properties | 36,125 | 35,211 | ||||||||||||||
| Oil and gas properties, net | 247,016 | 253,871 | ||||||||||||||
| Pipeline facilities and equipment | 12,814 | 12,714 | ||||||||||||||
| Base gas | 1,937 | 2,122 | ||||||||||||||
| Furniture and fixtures, computer hardware and software, and other equipment | 1,758 | 990 | 6,762 | 6,649 | ||||||||||||
| Accumulated depreciation and amortization | (1,021 | ) | (665 | ) | (5,529 | ) | (3,922 | ) | ||||||||
| Net other property and equipment | 737 | 325 | ||||||||||||||
| Other property and equipment, net | 15,984 | 17,563 | ||||||||||||||
| Total property and equipment, net | $ | 36,862 | $ | 35,536 | $ | 263,000 | $ | 271,434 | ||||||||
We had approximately $1.9 million and $2.0 million, at December 31, 2017 and 2016, respectively, of unproved oil and gasUnproved properties not subject to depletion. At December 31, 2017 and 2016, our unproved propertiesdepletion consist principally of leasehold acquisition costs in the following areas:
| As of December 31, | ||||||||
| (in thousands) | 2017 | 2016 | ||||||
| Illinois Basin: | ||||||||
| Indiana | $ | 432 | $ | 431 | ||||
| Illinois | 136 | 298 | ||||||
| Appalachian Basin: | ||||||||
| Kentucky | 915 | 750 | ||||||
| Ohio | 66 | 66 | ||||||
| West Virginia | 398 | 454 | ||||||
| Total unproved properties not subject to depletion | $ | 1,947 | $ | 1,999 | ||||
| As of December 31, | ||||||||
| (in thousands) | 2019 | 2018 | ||||||
| Ventura Basin: | ||||||||
| California | $ | 1,602 | $ | 1,595 | ||||
| Illinois Basin: | ||||||||
| Indiana | 432 | 432 | ||||||
| Illinois | 136 | 136 | ||||||
| Appalachian Basin: | ||||||||
| Kentucky | 461 | 920 | ||||||
| Ohio | 66 | 66 | ||||||
| Tennessee | 1,869 | 1,869 | ||||||
| West Virginia | 306 | 398 | ||||||
| Total unproved properties | $ | 4,872 | $ | 5,416 | ||||
During the years ended December 31, 2017 and 2016, expiring leasehold costs reclassified into proved property were approximately $52,000 and $1.3 million, respectively. The costs not subject to depletion relate to unproved properties that are excluded from amortized capital costs until it is determined whether or not proved reserves can be assigned to such properties. These costs do not relate to any individually significant projects. The excludedUnproved properties are assessed for impairment at least annually. During the year ended December 31, 2019, approximately $1.0 million of expired leasehold costs were reclassified into proved property. During the year ended December 31, 2018, there were no leasehold costs reclassified into proved property.
We capitalized overhead applicable to acquisition, development and exploration activities, primarily in California, of approximately $66,000$790,000 and $562,000$337,000 for the years ended December 31, 20172019 and 2016,2018, respectively.
Depletion expense related to oil and gas properties for the years ended December 31, 20172019 and 20162018 was approximately $2.2$14.1 million and $1.8$7.3 million, or $0.40 and $0.56 per Mcfe, respectively. Depreciation expense related to furniture and fixtures, computer hardware and software and other equipment for the years ended December 31, 2017 and 2016 was approximately $387,000 and $114,000, respectively.
Note 6 – Investments in Affiliates
Carbon California
Carbon California was formed in 2016 by us, entities managed by Yorktown and Prudential, to acquire producing assets in the Ventura Basin in California. On February 15, 2017, we, Yorktown and Prudential entered into a limited liability company agreement (the “Carbon California LLC Agreement”) of Carbon California, a Delaware limited liability company.
Prior to February 1, 2018, we held 17.81% of the voting and profits interests, Yorktown held 38.59% of the voting and profits interests and Prudential held 43.59% of the voting and profits interests in Carbon California. On February 1, 2018, Yorktown exercised the California Warrant, pursuant to which Yorktown obtained additional shares of common stock in us in exchange for the transfer and assignment by Yorktown of all of its rights in Carbon California. Following the exercise of the California Warrant by Yorktown, we own 56.41% of the voting and profits interests, and Prudential holds the remainder of the interests, in Carbon California.
Pursuant to the Carbon California LLC Agreement, we initially acquired a 17.81% interest in Carbon California represented by Class B Units. The Class B Units were acquired for no cash consideration. No further equity commitments have been made or are required by us under the Carbon California LLC Agreement, prior to February 1, 2018.
On February 15, 2017, Carbon California (i) issued and sold Class A Units to Yorktown and Prudential for an aggregate cash consideration of $22.0 million, (ii) entered into a Note Purchase Agreement (the “Note Purchase Agreement”) with Prudential Legacy Insurance Company of New Jersey and Prudential Insurance Company of America for the issuance and sale of up to $25.0 million of Senior Secured Revolving Notes (the “Senior Revolving Notes”) due February 15, 2022 and (iii) entered into a Securities Purchase Agreement (the “Securities Purchase Agreement”) with Prudential for the issuance and sale of $10.0 million of Senior Subordinated Notes (the “Subordinated Notes”) due February 15, 2024. We are not a guarantor of the Senior Revolving Notes or the Subordinate Notes.
The closing of the Note Purchase Agreement and the Securities Purchase Agreement on February 15, 2017, resulted in the sale and issuance by Carbon California of (i) Senior Revolving Notes in the principal amount of $10.0 million and (ii) Subordinated Notes in the original principal amount of $10.0 million. The maximum principal amount available under the Senior Revolving Notes is based upon the borrowing base attributable to Carbon California’s proved oil and gas reserves which is to be determined at least semi-annually. The current borrowing base is $15.0 million, of which $11.0 million is outstanding as of December 31, 2017.
Net proceeds from the offering transaction were used by Carbon California to complete the acquisitions of oil and gas assets in the Ventura Basin of California, which acquisitions also closed on February 15, 2017. The remainder of the net proceeds may be used to fund field development projects and to fund future complementary acquisitions and for general working capital purposes of Carbon California.
Based on our 17.8% interest in Carbon California, as of December 31, 2017, our ability to appoint a member to the board of directors and our role of manager of Carbon California, we are accounting for our investment in Carbon California under the equity method of accounting as we believe we can exert significant influence. We use the HLBV to determine our share of profits or losses in Carbon California and adjusts the carrying value of our investment accordingly. The HLBV is a balance-sheet approach that calculates the amount each member of Carbon California would receive if Carbon California were liquidated at book value at the end of each measurement period. The change in the allocated amount to each member during the period represents the income or loss allocated to that member. In the event of liquidation of Carbon California, to the extent that Carbon California has net income, available proceeds are first distributed to members holding Class A and Class B units and any remaining proceeds are then distributed to members holding Class A units. For the period February 15, 2017 (inception) through December 31, 2017, Carbon California incurred a net loss of which our share (as a holder of Class B units for that period) is zero. Should Carbon California generate net income in future periods, we will not record income (or losses) until our share of such income exceeds the amount of our share of losses not previously reported. While income may be recorded in future periods, the ability of Carbon California to make distributions to its owners, including us, is dependent upon the terms of its credit facilities, which currently prohibit distributions unless agreed to by the lender.
In connection with our entry into the Carbon California LLC Agreement, and Carbon California engaging in the transactions described above, we received the aforementioned Class B Units and issued to Yorktown the California Warrant. The exercise price for the California Warrant is payable exclusively with Class A Units of Carbon California held by Yorktown and the number of shares of our common stock for which the California Warrant is exercisable is determined, as of the time of exercise, by dividing (a) the aggregate unreturned capital of Yorktown’s Class A Units of Carbon California by (b) the exercise price. The California Warrant had a term of seven years and included certain standard registration rights with respect to the shares of our common stock issuable upon exercise of the California Warrant. Yorktown exercised the California Warrant on February 1, 2018.
The issuance of the Class B Units and the California Warrant were in contemplation of each other, and under non-monetary related party guidance, we accounted for the California Warrant, at issuance, based on the fair value of the California Warrant as of the date of grant (February 15, 2017) and recorded a warrant liability with an associated offset to APIC. Future changes to the fair value of the California Warrant are recognized in earnings. We accounted for the fair value of the Class B Units at their estimated fair value at the date of grant, which became our investment in Carbon California with an offsetting entry to APIC.
As of the grant date of the California Warrant, we estimated that the fair market value of the California Warrant was approximately $5.8 million and the fair value of the Class B Units was approximately $1.9 million. As of December 31, 2017, we estimated that the fair value of the California Warrant was approximately $2.0 million. The difference in the fair value of the California Warrant from the grant date though December 31, 2017 was approximately $3.8 million and was recognized in warrant derivative gain in our consolidated statements of operations for the year ended December 31, 2017.
As of December 31, 2017, Carbon California was in breach of the covenants for its Senior Revolving Notes and Subordinated Notes; however, it obtained a waiver for the December 31, 2017 and March 31, 2018 covenants. It is anticipated that covenants will be met in the future. SeeLiquidity and Management’s Plans within Note 1 to the Carbon California financial statements.
The following table sets forth selected historical financial data for Carbon California.
| (in thousands) | As of December 31, 2017 | |||
| Current assets | $ | 3,968 | ||
| Total oil and gas properties, net | $ | 43,458 | ||
| Current liabilities | $ | 6,899 | ||
| Non-current liabilities | $ | 23,279 | ||
| Total members’ equity | $ | 18,549 | ||
| (in thousands) | February 15, 2017 (Inception) through December 31, 2017 | |||
| Revenues | $ | 7,235 | ||
| Operating expenses | 9,893 | |||
| Loss from operations | (2,658 | ) | ||
| Net loss | (6,552 | ) | ||
Carbon Appalachia
Carbon Appalachia was formed in 2016 by us, Yorktown and Old Ironsides to acquire producing assets in the Appalachian Basin in Kentucky, Tennessee, Virginia and West Virginia.
Outlined below is a summary of i) our contributions, ii) our resulting percent of Class A unit ownership and iii) our overall resulting Sharing Percentage of Carbon Appalachia after giving effect of all classes of ownership. Holders of units within each class of units participate in profit or losses and distributions according to their proportionate share of each class of units (“Sharing Percentage”). Each contribution and its use is described in detail following the table.
| Timing | Capital Contribution | Resulting Class A Units (%) | Resulting Sharing % | |||
| April 2017 | $0.24 million | 2.00% | 2.98% | |||
| August 2017 | $3.71 million | 15.20% | 16.04% | |||
| September 2017 | $2.92 million | 18.55% | 19.37% | |||
| November 2017 | Warrant exercise | 26.50% | 27.24% |
On April 3, 2017, we, Yorktown and Old Ironsides Energy, LLC (“Old Ironsides”), entered in to a limited liability company agreement (the “Carbon Appalachia LLC Agreement”), with an initial equity commitment of $100.0 million, of which $37.0 million has been contributed as of December 31, 2017.
Pursuant to the Carbon Appalachia LLC Agreement, we acquired a 2.0% interest in Carbon Appalachia for $240,000 of Class A Units associated with our initial equity commitment of $2.0 million. We also have the ability to earn up to an additional 14.7% of Carbon Appalachia distributions (represented by Class B Units) after certain return thresholds to the holders of Class A Units are met. The Class B Units were acquired for no cash consideration.
In addition, we acquired a 1.0% interest represented by Class C Units which were obtained in connection with the contribution to Carbon Appalachia of a portion of its working interest in undeveloped properties in Tennessee. If Carbon Appalachia agrees to drill horizontal Chattanooga Shale wells on these properties, it will pay 100% of the cost of drilling and completion of the first 20 wells to earn a 75% working interest in such properties. We, through our subsidiary, Nytis LLC, will retain a 25% working interest in the properties. There was no activity associated with these properties in 2017.
In connection with and concurrently with the closing of the acquisition described below, Carbon Appalachia Enterprises, LLC, formerly known as Carbon Tennessee Company, LLC (“Carbon Appalachia Enterprises”), a subsidiary of Carbon Appalachia, entered into a 4-year $100.0 million senior secured asset-based revolving credit facility with LegacyTexas Bank with an initial borrowing base of $10.0 million. We are not a guarantor of this credit facility.
Borrowings under the credit facility, along with the initial equity contributions made to Carbon Appalachia, were used to complete the acquisition of natural gas producing properties and related facilities located predominantly in Tennessee (the “CNX Acquisition”). The purchase price was $20.0 million, subject to normal and customary closing adjustments, and Carbon Appalachia Enterprises used $8.5 million drawn from the credit facility toward the purchase price.
On August 15, 2017, Carbon Appalachia completed the acquisition of natural gas producing properties and related facilities located predominantly in the state of West Virginia (the “Enervest Acquisition”). The purchase price was $21.5 million, subject to normal and customary closing adjustments.
On August 15, 2017, the Carbon Appalachia LLC Agreement was amended and restated. Pursuant to the amended and restated Carbon Appalachia LLC Agreement, we increased our capital commitment in Carbon Appalachia from $2.0 million to $23.6 million and our portion of any subsequent capital call from 2.0% to 26.5%. Aggregate capital commitments of all members remained at $100.0 million. As each subsequent capital call is made, Carbon will contribute 26.5%. We are the sole manager of Carbon Appalachia and maintain the ability to earn additional ownership interests of Carbon Appalachia (represented by Class B Units) after certain thresholds to the holders of Class A Units are met. We also maintain our 1.0% carried interest represented by Class C Units.
In connection with and concurrently with the closing of the Enervest Acquisition, the borrowing base of its existing credit facility with LegacyTexas Bank increased to $22.0 million and Carbon Appalachia Enterprises borrowed $8.0 million from its existing credit facility with LegacyTexas Bank. Carbon Appalachia received equity funding in the amount of $14.0 million from its members, including $3.7 million from us. The contributed funds and funds drawn from the credit facility were used to pay the purchase price.
On September 29, 2017, Carbon Appalachia Enterprises amended its 4-year $100.0 million senior secured asset-based revolving credit facility with LegacyTexas Bank, resulting in a borrowing base of $50.0 million with redeterminations as of April 1 and October 1 each year and the addition of East West Bank as a participating lender. As of December 31, 2017, there was approximately $38.0 million outstanding under the credit facility.
On September 29, 2017, Carbon Appalachia completed the acquisition of natural gas producing properties, natural gas gathering pipelines and related facilities located predominantly in the state of West Virginia (the “Cabot Acquisition”). The purchase price was $41.3 million, subject to normal and customary closing adjustments.
In connection with and concurrently with the closing of the Cabot Acquisition described above, Carbon Appalachia Enterprises borrowed $20.4 million from its credit facility. Carbon Appalachia received equity funding in the amount of $11.0 million from its members, including $2.9 million from us. The contributed funds and funds drawn from the credit facility were used to pay the purchase price.
On November 30, 2017, the CAE Credit Facility was amended to include the addition of Bank SNB as a participating lender.
In connection with our entry into the Carbon Appalachia LLC Agreement, and Carbon Appalachia engaging in the transactions described above, we received the aforementioned Class B Units and issued to Yorktown the Appalachia Warrant. The Appalachia Warrant is payable exclusively with Class A Units of Carbon Appalachia held by Yorktown and the number of shares of our common stock for which the Appalachia Warrant is exercisable is determined, as of the time of exercise, by dividing (a) the aggregate unreturned capital of Yorktown’s Class A Units of Carbon Appalachia plus a required 10% internal rate of return by (b) the exercise price.
On November 1, 2017, Yorktown exercised the Appalachia Warrant, resulting in the issuance of 432,051 shares of our common stock in exchange for Class A Units representing approximately 7.95% of then outstanding Class A Units of Carbon Appalachia. We accounted for the exercise through extinguishment of the warrant liability associated with the Appalachia Warrant of approximately $1.9 million and the receipt of Yorktown’s Class A Units as an increase to investment in affiliates in the amount of approximately $2.9 million. After giving effect to the exercise, we own 26.5% of Carbon Appalachia’s outstanding Class A Units along with 100% of its Class C Units.
The issuance of the Class B Units and the Appalachia Warrant were in contemplation of each other, and under non-monetary related party guidance, we accounted for the Appalachia Warrant, at issuance, based on the fair value of the Appalachia Warrant as of the date of grant (April 3, 2017) and recorded a warrant liability with an associated offset to APIC. Future changes to the fair value of the Appalachia Warrant are recognized in earnings. We accounted for the fair value of the Class B Units at their estimated fair value at the date of grant, which became our investment in Carbon Appalachia with an offsetting entry to APIC.
As of the grant date of the Appalachia Warrant, we estimated that the fair market value of the Appalachia Warrant was approximately $1.3 million and the fair value of the Class B Units was approximately $924,000. The difference in the fair value of the Appalachia Warrant from the grant date though its exercise on November 1, 2017, was approximately $619,000 million and was recognized in warrant derivative gain in the Company’s consolidated statements of operations for the year ended December 31, 2017.
Based on our 27.24% combined Class A, Class B and Class C interest (and our ability as of December 31, 2017 to earn up to an additional 14.7%) in Carbon Appalachia, our ability to appoint a member to the board of directors and our role of manager of Carbon Appalachia, we are accounting for our investment in Carbon Appalachia under the equity method of accounting as it believes it can exert significant influence. We use the HLBV to determine its share of profits or losses in Carbon Appalachia and adjusts the carrying value of its investment accordingly. Our investment in Carbon Appalachia is represented by our Class A and C interests, which it acquired by contributing approximately $6.9 million in cash and unevaluated property. In the event of liquidation of Carbon Appalachia, available proceeds are first distributed to members holding Class C Units then to holders of Class A Units until their contributed capital is recovered with an internal rate of return of 10%. Any additional distributions would then be shared between holders of Class A, Class B and Class C Units. For the period of April 3, 2017 through December 31, 2017, Carbon Appalachia incurred a net gain, of which our share is approximately $1.1 million. The ability of Carbon Appalachia to make distributions to its owners, including us, is dependent upon the terms of its credit facilities, which currently prohibit distributions unless agreed to by the lender.
As of December 31, 2017, Carbon Appalachia is in compliance with all CAE Credit Facility covenants.
The following table sets forth, selected historical financial data for Carbon Appalachia.
| (in thousands) | As of December 31, 2017 | |||
| Current assets | $ | 20,794 | ||
| Total oil and gas properties, net | $ | 84,402 | ||
| Current liabilities | $ | 18,207 | ||
| Non-current liabilities | $ | 59,420 | ||
| Total members’ equity | $ | 40,929 | ||
| (in thousands) | Period April 3, 2017 through December 31, 2017 | |||
| Revenues | $ | 31,584 | ||
| Operating expenses | 26,764 | |||
| Income from operations | 4,820 | |||
| Net income | 3,005 | |||
The following table outlines the changes in our investments in affiliates:
| (in thousands) | Carbon California | Carbon Appalachia | CCGGC | Sullivan(1) | Total | |||||||||||||||
| Balance, December 31, 2016 | $ | - | $ | - | $ | 118 | $ | 550 | $ | 668 | ||||||||||
| Investment in affiliates gain (loss) | - | 1,090 | 38 | - | 1,128 | |||||||||||||||
| Cash distributions | - | - | (68 | ) | - | (68 | ) | |||||||||||||
| Cash contributions | - | 6,865 | - | - | 6,865 | |||||||||||||||
| Class B Units issuance | 1,854 | 924 | - | - | 2,778 | |||||||||||||||
| Appalachia Warrant exercise | - | 2,896 | 2,896 | |||||||||||||||||
| Balance, December 31, 2017 | $ | 1,854 | $ | 11,775 | $ | 88 | $ | 550 | $ | 14,267 | ||||||||||
During 2017, we received distributions of approximately $30,000 from our investment in Sullivan Energy which we account for using the cost method of accounting and, as such, we recognized a gain within investment in affiliates of $30,000 for the year ended December 31, 2017.
Note 7 – Bank Credit Facility
In 2016, Carbon entered into a 4-year $100.0 million senior secured asset-based revolving credit facility with LegacyTexas Bank (the “Credit Facility”). LegacyTexas Bank is the initial lender and acts as administrative agent.
The Credit Facility has a maximum availability of $100.0 million (with a $500,000 sublimit for letters of credit), which availability is subject to the amount of the borrowing base. The initial borrowing base established under the Credit Facility was $17.0 million. The borrowing base is subject to semi-annual redeterminations in March and September. On March 30, 2017, the borrowing base was increased to $23.0 million. As of December 31, 2017, the borrowing base was $23.0 million.
The Credit Facility is guaranteed by each existing and future subsidiary of us (subject to certain exceptions). The obligations of us and the subsidiary guarantors under the Credit Facility are secured by essentially all of our tangible and intangible personal and real property (subject to certain exclusions).
Interest is payable quarterly and accrues on borrowings under the Credit Facility at a rate per annum equal to either (i) the base rate plus an applicable margin between 0.50% and 1.50% or (ii) the Adjusted LIBOR rate plus an applicable margin between 3.50% and 4.50% at our option. The actual margin percentage is dependent on the Credit Facility utilization percentage. We are obligated to pay certain fees and expenses in connection with the Credit Facility, including a commitment fee for any unused amounts of 0.50%.
The Credit Facility contains certain affirmative and negative covenants that, among other things, limit our ability to (i) incur additional debt; (ii) incur additional liens; (iii) sell, transfer or dispose of assets; (iv) merge or consolidate, wind-up, dissolve or liquidate; (v) make dividends and distributions on, or repurchases of, equity; (vi) make certain investments; (vii) enter into certain transactions with our affiliates; (viii) enter into sales-leaseback transaction; (ix) make optional or voluntary payment of debt; (x) change the nature of our business; (xi) change our fiscal year to make changes to the accounting treatment or reporting practices; (xii) amend constituent documents; and (xiii) enter into certain hedging transactions.
The affirmative and negative covenants are subject to various exceptions, including certain basket amounts and acceptable transaction levels. In addition, the Credit Facility requires Carbon’s compliance, on a consolidated basis, with (i) a maximum Debt/EBITDA ratio of 3.5 to 1.0 and (ii) a minimum current ratio of 1.0 to 1.0, commencing with the quarter ended March 31, 2017.
In the third quarter of 2017, we contributed approximately $6.6 million to Carbon Appalachia to fund its share of producing oil and gas properties acquired during the third quarter. This funding was provided primarily with borrowings under the Credit Facility. The Debt/EBITDA and current ratio covenants negotiated at the time the credit facility was established did not contemplate our contribution for its investment in Carbon Appalachia and, as a result, we were not in compliance with financial covenants associated with the Credit Facility as of December 31, 2017. However, we have obtained a waiver of the Debt/EBITDA ratio and the current ratio covenants as of December 31, 2017. On March 27, 2018, the Credit Facility was amended to revise the calculation of the Leverage Ratio from a Debt/EBITDA ratio to a Net Debt/Adjusted EBITDA ratio, reset the testing period used in the determination of Adjusted EBITDA, eliminate the minimum current ratio and substitute alternative liquidity requirements, including maximum allowed current liabilities in relation to current assets, minimum cash balance requirements and maximum aged trade payable requirements.
We may at any time repay the loans under the credit facility, in whole or in part, without penalty. We must pay down borrowings under the credit facility or provide mortgages of additional oil and natural gas properties to the extent that outstanding loan and letters of credit exceed the borrowing base.
As required under the terms of the Credit Facility, we entered into derivative contracts at fixed pricing for a certain percentage of our production. We are party to an ISDA Master Agreement with BP Energy Company that establishes standard terms for the derivative contracts and an inter-creditor agreement with LegacyTexas Bank and BP Energy Company whereby any credit exposure related to the derivative contracts entered by us and BP Energy Company is secured by the collateral and backed by the guarantees supporting the Credit Facility.
As of December 31, 2017, there were approximately $22.1 million in outstanding borrowings and approximately $0.86 million of additional borrowing capacity available under the Credit Facility. Our effective borrowing rate at December 31, 2017 was approximately 5.67%.
We incurred fees directly associated with the issuance of the Credit Facility and amortize these fees over the life of the Credit Facility. The current portion of these fees are included in prepaid expense, deposits and other current assets and the long-term portion is included in other long-term assets for a combined value of $700,000. As of December 31, 2017, and 2016, we have unamortized deferred issuance costs of $484,000 and $596,000, respectively. During the years ended December 31, 2017 and 2016, we amortized $176,000 and $51,000, respectively, as interest expense.
Note 8 – Income Taxes
The provision for income taxes for the years ended December 31, 2017 and 2016 consists of the following:
| (in thousands) | For the Year Ended | |||||||
| December 31, | ||||||||
| 2017 | 2016 | |||||||
| Current income tax (benefit) expense | $ | (74 | ) | $ | - | |||
| Deferred income tax (benefit) expense | 7,080 | (4,472 | ) | |||||
| Change in valuation allowance | (7,080 | ) | 4,472 | |||||
| Total income tax (benefit) expense | $ | (74 | ) | $ | - | |||
The effective income tax rate for the years ended December 31, 2017 and 2016 differed from the statutory U.S. federal income tax rate as follows:
| For the Year Ended | ||||||||
| December 31, | ||||||||
| 2017 | 2016 | |||||||
| Federal income tax rate | 35.0 | % | 35.0 | % | ||||
| State income taxes, net of federal benefit | 3.8 | 3.5 | ||||||
| Permanent Differences | (20.5 | ) | 1.1 | |||||
| Non-controlling interest in consolidated partnerships | (0.8 | ) | (0.4 | ) | ||||
| True-up of prior year depletion in excess of basis | 1.1 | .2 | ||||||
| Stock-based compensation deficiency | 3.1 | (2.9 | ) | |||||
| Rate changes of prior year deferred | (1.8 | ) | 0.2 | |||||
| True-up of prior year deferred | (4.5 | ) | (1.8 | ) | ||||
| Effect of tax cuts and TCJA | 91.0 | - | ||||||
| Increase in valuation allowance and other | (107.7 | ) | (34.9 | ) | ||||
| Total income tax expense (benefit) | (1.1 | )% | - | % | ||||
The tax effects of temporary differences that gave rise to significant portions of the deferred tax assets and liabilities at December 31, 2017 and 2016 are presented below:
| (in thousands) | As of December 31, | |||||||
| 2017 | 2016 | |||||||
| Deferred tax assets | ||||||||
| Net operating loss carryforwards | $ | 6,407 | $ | 8,274 | ||||
| Depletion carryforwards | 1,934 | 2,740 | ||||||
| Accrual and other | 450 | 726 | ||||||
| Stock-based compensation | 476 | 968 | ||||||
| Derivatives | - | 730 | ||||||
| Asset retirement obligations | 1,944 | 1,936 | ||||||
| Property, plant and equipment | 2,972 | 6,439 | ||||||
| Total deferred tax assets | 14,183 | 21,813 | ||||||
| Deferred tax liability | ||||||||
| Interest in partnerships | (790 | ) | (762 | ) | ||||
| Derivative and other | (57 | ) | - | |||||
| Less valuation allowance | (13,336 | ) | (21,051 | ) | ||||
| Net deferred tax asset | $ | - | $ | - | ||||
As of December 31, 2017, we have net operating loss (“NOL”) carryforwards of approximately $21.4 million available to reduce future years’ federal taxable income. The federal NOLs expire in various years through 2037. We have various state NOL carryforwards available to reduce future years’ state taxable income, which are dependent on apportionment percentages and state laws that can change from year to year and impact the amount of such carryforwards. These state NOL carryforwards will expire in the future based upon each jurisdiction’s specific law surrounding NOL carryforwards. Tax returns are subject to audit by various taxation authorities. The results of any audits will be accounted for in the period in which they are determined.
We believe that the tax positions taken in our tax returns satisfy the more likely than not threshold for benefit recognition. Accordingly, no liabilities have been recorded by us. Any potential adjustments for uncertain tax positions would be a reclassification between the deferred tax asset related to our NOL carryforwards and another deferred tax asset.
Our policy is to classify accrued penalties and interest related to unrecognized tax benefits in our income tax provision. As of December 31, 2017, we did not have any accrued interest or penalties associated with any unrecognized tax benefits, nor was any interest expense recognized during the current year.
On December 22, 2017, the U.S. government enacted comprehensive tax legislation commonly referred to as the Tax Cuts and Jobs Act (the “TCJA”). The TCJA makes broad and complex changes to the U.S. tax code applicable to certain items in 2017 as well as those applicable to 2018 and subsequent years.
ASC 740 requires the recognition of the tax effects of the of the TCJA for annual periods that include December 22, 2017. At December 31, 2017, we have made reasonable estimates of the effects on our existing deferred tax balances. We have remeasured certain federal deferred tax assets and liabilities based upon the rates at which they are expected to reverse in the future, which is generally 21.0% percent. The provisional amount recognized related to the remeasurement of its federal deferred tax balance was $6.0 million, which was subject to a valuation allowance at December 31, 2017.
We will continue to analyze the TCJA and future IRS regulations, refine our calculations and gain a more thorough understanding of how individual states are implementing this new law. This further analysis could potentially affect the measurement of deferred tax balances or potentially give rise to new deferred tax amounts.
We file income tax returns in the U.S. federal jurisdiction and in various states, each with varying statutes of limitations. The 2014 through 2017 tax years generally remain subject to examination by federal and state tax authorities.
Note 9 – Stockholders’ Equity
Authorized and Issued Capital Stock
Effective March 15, 2017 and pursuant to a reverse stock split approved by the shareholders and Board of Directors, each 20 shares of issued and outstanding common stock became one share of common stock and no fractional shares were issued. References to the number of shares and price per share give retroactive effect to the reverse stock split for all periods presented. In connection with the reverse stock split, the number of authorized shares of our common stock was decreased from 200,000,000 to 10,000,000.
As of December 31, 2017, we had 10,000,000 shares of common stock authorized with a par value of $0.01 per share, of which approximately 6,000,000 were issued and outstanding, and 1,000,000 shares of preferred stock authorized with a par value of $0.01 per share, none of which were issued and outstanding. During the year ended December 31, 2017, the increase in our issued and outstanding common stock reflects the exercise by the holder of the Appalachia Warrant (see Note 6), resulting in the issuance of approximately 432,000 shares of our common stock in addition to restricted stock and performance units, net of shares exchanged for payroll tax obligations paid by us, that vested during the year in exchange for Class A Units in Carbon Appalachia representing approximately 7.95% of the then outstanding Class A Units.
Carbon Stock Incentive Plans
We have two stock plans, the Carbon 2011 Stock Incentive Plan and the Carbon 2015 Stock Incentive Plan (collectively the “Carbon Plans”). The Carbon Plans were approved by our shareholders and in the aggregate provide for the issuance of approximately 1.1 million shares of common stock to our officers, directors, employees or consultants eligible to receive the awards under the Carbon Plans.
The Carbon Plans provide for the granting of incentive stock options, non-qualified stock options, restricted stock awards, performance awards and phantom stock awards, or a combination of the foregoing, as to employees, officers, directors or consultants, provided that only employees may be granted incentive stock options and directors may only be granted restricted stock awards and phantom stock awards.
Restricted Stock
Restricted stock awards for employees vest ratably over a three-year service period or cliff vest at the end of a three-year service period. For non-employee directors, the awards vest upon the earlier of a change in control of us or the date their membership on the Board of Directors is terminated other than for cause. We recognize compensation expense for these restricted stock grants based on the grant date fair value of the shares, amortized ratably over three years for employee awards (based on the required service period for vesting) and seven years for non-employee director awards (based on a market survey of the average tenure of directors among U.S. public companies). For restricted stock granted between 2014 and 2017, we recognized compensation expense based on the grant date fair value of the shares, utilizing an enterprise value approach, using valuation metrics primarily based on multiples of cash flow from operations, production and reserves. For restricted stock and performance units granted in 2013, we utilized the closing price of our stock on the date of grant to recognize compensation expense. The following table shows a summary of our unvested restricted stock under the Carbon Plans as of December 31, 2017 and 2016 as well as activity during the years then ended.
| Weighted Avg | ||||||||
| Number | Grant Date | |||||||
| of Shares | Fair Value | |||||||
| Restricted stock awards, unvested, January 1, 2016 | 199,000 | $ | 10.37 | |||||
| Granted | 134,501 | 5.40 | ||||||
| Vested | (64,668 | ) | 10.84 | |||||
| Forfeited | (1,083 | ) | 6.20 | |||||
| Restricted stock awards, unvested, December 31, 2016 | 267,750 | 7.78 | ||||||
| Granted | 81,050 | 7.20 | ||||||
| Vested | (64,915 | ) | 8.38 | |||||
| Forfeited | (13,050 | ) | 6.19 | |||||
| Restricted stock awards, unvested, December 31, 2017 | 270,835 | $ | 7.54 | |||||
Compensation costs recognized for these restricted stock grants were approximately $664,000 and $742,000 for the years ended December 31, 2017 and 2016, respectively. As of December 31, 2017, there was approximately $1.1 million of unrecognized compensation costs related to these restricted stock grants which we expect to be recognized over the next 6.3 years.
Restricted Performance Units
Performance units represent a contractual right to receive one share of our common stock subject to the terms and conditions of the agreements, including the achievement of certain performance measures relative to a defined peer group or the growth of certain performance measures over a defined period of time as well as, in some cases, continued service requirements. The following table shows a summary of our unvested performance units as of December 31, 2017 and 2016 as well as activity during the years then ended.
We account for the performance units granted during 2014 through 2017 at their fair value determined at the date of grant, which were $11.80, $8.00, $5.40 and $7.20 per share, respectively. The final measurement of compensation cost will be based on the number of performance units that ultimately vest. At December 31, 2017, we estimated that none of the performance units granted in 2016 and 2017 would vest, and, accordingly, no compensation cost has been recorded for these performance units. During 2016, we estimated that it was probable that the performance units granted in 2014 and 2015 would vest and therefore compensation costs of approximately $442,000 and $1.2 million related to these performance units were recognized for the years ended December 31, 2017 and 2016, respectively. As of December 31, 2017, if change in control and other performance provisions pursuant to the terms and conditions of these award agreements are met in full, the estimated unrecognized compensation cost related to the performance units granted in 2014 through 2017 would be approximately $2.1 million.
Note 10 –5 - Accounts Payable and Accrued Liabilities
Accounts payable and accrued liabilities at December 31, 2017 and 2016 consist of the following:
| As of December 31, | ||||||||||||||||
| (in thousands) | 2019 | 2018 | ||||||||||||||
| As of December 31, | ||||||||||||||||
| 2017 | 2016 | |||||||||||||||
| Accounts payable | $ | 3,274 | $ | 2,315 | $ | 9,875 | $ | 7,670 | ||||||||
| Oil and gas revenue suspense | 1,776 | 1,415 | 3,620 | 2,675 | ||||||||||||
| Gathering and transportation payables | 497 | 468 | 1,877 | 1,774 | ||||||||||||
| Production taxes payable | 214 | 113 | 3,212 | 1,860 | ||||||||||||
| Drilling advances received from joint venture partner | 245 | 955 | ||||||||||||||
| Accrued drilling costs | - | 4 | ||||||||||||||
| Accrued lease operating costs | 684 | 282 | 664 | 3,155 | ||||||||||||
| Accrued ad valorem taxes-current | 1,054 | 1,552 | 4,407 | 3,474 | ||||||||||||
| Accrued general and administrative expenses | 2,473 | 1,572 | 3,260 | 3,111 | ||||||||||||
| Accrued asset retirement obligation-current | 380 | - | ||||||||||||||
| Asset retirement obligations-current | 5,021 | 3,099 | ||||||||||||||
| Accrued interest | 247 | 184 | 1,335 | 955 | ||||||||||||
| Accrued gas purchases | 1,392 | 5,441 | ||||||||||||||
| Other liabilities | 374 | 261 | 494 | 1,602 | ||||||||||||
| Total accounts payable and accrued liabilities | $ | 11,218 | $ | 9,121 | $ | 35,157 | $ | 34,816 | ||||||||
Note 6 - Asset Retirement Obligations
The following table is a reconciliation of the ARO:
| December 31, | ||||||||
| (in thousands) | 2019 | 2018 | ||||||
| Balance at beginning of year | $ | 22,310 | $ | 7,357 | ||||
| Accretion expense | 1,625 | 868 | ||||||
| Additions and revisions | 294 | - | ||||||
| Obligations discharged with divestitures | (1,694 | ) | - | |||||
| Change in estimate of cash outflow | - | 361 | ||||||
| Additions from Carbon California (Note 3) | - | 2,921 | ||||||
| Additions from Seneca Acquisition (Note 3) | - | 5,132 | ||||||
| Additions from Liberty Acquisition (Note 3) | - | 45 | ||||||
| Additions from OIE Membership Acquisition | - | 5,626 | ||||||
| Balance at end of year | $ | 22,535 | $ | 22,310 | ||||
| Less: Current portion | (5,021 | ) | (3,099 | ) | ||||
| Non-current portion | $ | 17,514 | $ | 19,211 | ||||
See Note 2 for additional details on the ARO.
Note 7 - Credit Facilities and Notes Payable
The table below summarizes the outstanding credit facilities and notes payable:
| (in thousands) | December 31, 2019 | December 31, 2018 | ||||||
| 2018 Credit Facility – revolver | $ | 69,150 | $ | 69,150 | ||||
| 2018 Credit Facility – term note | 5,833 | 15,000 | ||||||
| Old Ironsides Notes | 25,675 | 25,065 | ||||||
| Other debt | 45 | 57 | ||||||
| Total debt | 100,703 | 109,272 | ||||||
| Less: unamortized debt discount | (45 | ) | (134 | ) | ||||
| Total credit facilities and notes payable | 100,658 | 109,138 | ||||||
| Current portion of credit facilities and notes payable | (5,788 | ) | (11,910 | ) | ||||
| Non-current debt, net of current portion and unamortized debt discount | $ | 94,870 | $ | 97,228 | ||||
Carbon Appalachia
2018 Credit Facility
In connection with and concurrently with the closing of the OIE Membership Acquisition, the Company and its subsidiaries amended and restated our prior credit facilities and entered into a $500.0 million senior secured asset-based revolving credit facility maturing December 31, 2022 and a $15.0 million term loan maturing in 2020 (the“2018 Credit Facility”). The 2018 Credit Facility includes a sublimit of $1.5 million for letters of credit. The borrowers under the 2018 Credit Facility are Carbon Appalachia Enterprises, LLC (“CAE”) and various other subsidiaries of the Company (including Nytis USA, together with CAE, the“Borrowers”). Under the 2018 Credit Facility, Carbon Energy Corporation is neither a borrower nor a guarantor. The initial borrowing base under the 2018 Credit Facility was $75.0 million and remained so as of December 31, 2019.
The 2018 Credit Facility is guaranteed by each existing and future direct or indirect subsidiary of the Borrowers and certain other subsidiaries of the Company (subject to various exceptions) and the obligations under the 2018 Credit Facility are secured by essentially all tangible, intangible and real property (subject to certain exclusions).
Interest accrues on borrowings under the 2018 Credit Facility at a rate per annum equal to either (i) the base rate plus a margin equal to 0.25% - 0.75% depending on the utilization percentage or (ii) the Adjusted London Interbank Offered Rate (“LIBOR”) plus a margin equal to 2.75% - 3.75% depending on the utilization percentage, at the Borrowers’ option. The Borrowers are obligated to pay certain fees and expenses in connection with the 2018 Credit Facility, including a commitment fee for any unused amounts of 0.50% and an origination fee of 0.50%. Loans under the 2018 Credit Facility may be prepaid without premium or penalty.
The 2018 Credit Facility also provides for a $15.0 million term loan which bears interest at a rate of 6.25% and is payable in 18 equal monthly installments beginning February 1, 2019 with the last payment due on July 1, 2020.
The 2018 Credit Facility contains certain affirmative and negative covenants that, among other things, limit the Company’s ability to (i) incur additional debt; (ii) incur additional liens; (iii) sell, transfer or dispose of assets; (iv) merge or consolidate, wind-up, dissolve or liquidate; (v) make dividends and distribution on, or repurchase of, equity; (vi) make certain investments; (vii) enter into certain transactions with their affiliates; (viii) enter in sale-leaseback transactions; (ix) make optional or voluntary payment of debt other than obligations under the 2018 Credit Facility; (x) change the nature of their business; (xi) change their fiscal year or make changes to the accounting treatment or reporting practices; (xii) amend their constituent documents; and (xiii) enter into certain hedging transactions.
The affirmative and negative covenants are subject to various exceptions, including certain basket amounts and acceptable transaction levels. In addition, the 2018 Credit Facility requires the Borrowers’ compliance, on a consolidated basis, with a maximum Net Debt (all debt of the Borrowing Parties minus all unencumbered cash and cash equivalents of the Borrowers not to exceed $3.0 million) / EBITDAX (as defined) ratio of 3.50 to 1.00 and a current ratio, as defined, minimum of 1.00 to 1.00, tested quarterly, commencing with the quarter ending March 31, 2019.
In August 2019, we amended the 2018 Credit Facility, effective October 1, 2019, to restrict the aging of our accounts payable to 90 days or less, maintain minimum liquidity of $3.0 million and require the sale of certain non-core assets by December 31, 2019.
In February 2020, we amended the 2018 Credit Facility to eliminate the minimum liquidity requirement and reduce the borrowing base to $73.0 million, with subsequent borrowing base reductions totaling $6.0 million scheduled through May 1, 2020. Also, in connection with this amendment, the lenders agreed to waive our noncompliance with the hedging requirement for the fiscal quarter ended September 30, 2019 and waive the asset sale covenant included in the amendment from August 2019.
As of December 31, 2019, there was approximately $69.2 million in outstanding borrowings and $5.0 million of additional borrowing capacity under the 2018 Credit Facility. After considering the waivers granted in the February 2020 amendment, we were in compliance with our December 31, 2019 financial covenants.
As a result of borrowing base reductions in 2020 discussed above and currently depressed oil and natural gas prices, certain of our covenants under the 2018 Credit Facility may be stressed and may require negotiations and adjustments with our lenders. While we have historically been successful in renegotiating covenant requirements with our lenders, there can be no assurance that we will be able to do so successfully in the future. The Company believes given these circumstances it is appropriate to keep the borrowings associated with the 2018 Credit Facility as non-current.
The terms of the 2018 Credit Facility require us to enter into derivative contracts at fixed pricing for a certain percentage of our production. We are party to International Swaps and Derivatives Association Master Agreements (“ISDA Master Agreements”) that establish standard terms for the derivative contracts and inter-creditor agreements with the lenders whereby any credit exposure related to the derivative contracts entered into by us is secured by the collateral and backed by the guarantees supporting the 2018 Credit Facility.
Fees paid in connection with the 2018 Credit Facility totaled approximately $824,000, of which $134,000 was associated with the term loan. The current portion of unamortized fees associated with the credit facility is included in prepaid expenses, deposits and other current assets and the non-current portion is included in other non-current assets. The unamortized portion associated with the term loan was $45,000 as of December 31, 2019 and is directly offset against the loan in current liabilities. As of December 31, 2019, we had unamortized deferred issuance costs of approximately $519,000 associated with the 2018 Credit Facility. During the years ended December 31, 2019 and 2018, we amortized approximately $260,000 and $786,000, respectively, as interest expense associated with the 2018 Credit Facility.
Old Ironsides Notes
On December 31, 2018, as part of the OIE Membership Acquisition, we delivered unsecured, promissory notes in the aggregate original principal amount of approximately $25.2 million to Old Ironsides (the “Old Ironsides Notes”). The Old Ironsides Notes bear interest at 10.0% per annum and have a term of five years, the first three of which require interest-only payments at the end of each calendar quarter beginning with the quarter ending March 31, 2019. At the end of the three-year interest-only period, the then current outstanding principal balance and interest is to be paid in 24 equal monthly payments. The Old Ironsides Notes also require mandatory prepayments upon the occurrence of certain subsequent liquidity events. A mandatory, one-time principal reduction payment in the aggregate amount of $2.0 million was made to Old Ironsides on February 1, 2019. Subsequent to the closing of the OIE Membership Acquisition, Old Ironsides ceased to be a related party.
The interest payable under the Old Ironsides Notes can be paid-in-kind at the election of the Company. This provision allows the Company to increase the principal balance associated with the Old Ironsides Notes. This election creates a second tranche of principal, which bears interest at 12.0% per annum. For the year ended December 31, 2019, the Company elected payment-in-kind interest of approximately $2.5 million.
Carbon California
The table below summarizes the outstanding notes payable – related party:
| (in thousands) | December 31, 2019 | December 31, 2018 | ||||||
| Senior Revolving Notes, related party, due February 15, 2022 | $ | 33,000 | $ | 38,500 | ||||
| Subordinated Notes, related party, due February 15, 2024 | 13,000 | 13,000 | ||||||
| Total principal | 46,000 | 51,500 | ||||||
| Less: Deferred notes costs | (175 | ) | (235 | ) | ||||
| Less: unamortized debt discount | (1,084 | ) | (1,346 | ) | ||||
| Total notes payable – related party | $ | 44,741 | $ | 49,919 | ||||
75
Senior Revolving Notes, Related Party
On February 15, 2017, Carbon California entered into a Note Purchase Agreement (the “Note Purchase Agreement”) for the issuance and sale of Senior Secured Revolving Notes to Prudential with an initial revolving borrowing capacity of $25.0 million which mature on February 15, 2022 (the “Senior Revolving Notes”). Carbon Energy Corporation is not a guarantor of the Senior Revolving Notes. The closing of the Note Purchase Agreement on February 15, 2017 resulted in the sale and issuance by Carbon California of Senior Revolving Notes in the principal amount of $10.0 million. The maximum principal amount available under the Senior Revolving Notes is based upon the borrowing base attributable to Carbon California’s proved oil and gas reserves which is to be determined at least semi-annually. As of December 31, 2019, the borrowing base was $45.0 million, of which $33.0 million was outstanding.
Carbon California may elect to incur interest at either (i) 5.50% plus LIBOR or (ii) 4.50% plus the Prime Rate (which is defined as the interest rate published daily by JPMorgan Chase Bank, N.A.). As of December 31, 2019, the effective borrowing rate for the Senior Revolving Notes was 7.10%. In addition, the Senior Revolving Notes include a commitment fee for any unused amounts at 0.50% as well as an annual administrative fee of $75,000, payable on February 15 each year.
The Senior Revolving Notes are secured by all the assets of Carbon California. The Senior Revolving Notes require Carbon California, as of January 1 and July 1 of each year, to hedge its anticipated proved developed production for year one, two and three at a rate of 75%, 65% and 50%, respectively. Carbon California may make principal payments in minimum installments of $500,000. Distributions to equity members are generally restricted.
Carbon California incurred fees directly associated with the issuance of the Senior Revolving Notes and amortizes these fees over the life of the Senior Revolving Notes. The current portion of these fees are included in prepaid expenses, deposits and other current assets and the non-current portion is included in other non-current assets for a combined value of approximately $599,000 as of December 31, 2019. For the years ended December 31, 2019 and 2018, Carbon California amortized fees of $273,000 and $217,000, respectively.
Subordinated Notes, Related Party
On February 15, 2017, Carbon California entered into a Securities Purchase Agreement (the “Securities Purchase Agreement”) with Prudential Capital Energy Partners, L.P. for the issuance and sale of Subordinated Notes due February 15, 2024, bearing interest of 12.0% per annum (the “Subordinated Notes”). Carbon Energy Corporation is not a guarantor of the Subordinated Notes. The closing of the Securities Purchase Agreement on February 15, 2017 resulted in the sale and issuance by Carbon California of Subordinated Notes in the original principal amount of $10.0 million, all of which remains outstanding as of December 31, 2019.
Prudential received an additional 1,425 Class A Units, representing 5.0% of the total sharing percentage, for the issuance of the Subordinated Notes. Carbon California valued this unit issuance based on the relative fair value by valuing the units at $1,000 per unit and aggregating the amount with the outstanding Subordinated Notes of $10.0 million. The Company then allocated the non-cash value of the units of approximately $1.3 million, which was recorded as a discount to the Subordinated Notes. As of December 31, 2019, Carbon California has an outstanding discount of $735,000, which is presented net of the Subordinated Notes within Notes payable-related party on the consolidated balance sheets. During the years ended December 31, 2019 and 2018, Carbon California amortized fees of $178,000 and $58,000, respectively, associated with the Subordinated Notes.
The Subordinated Notes require Carbon California, as of January 1 and July 1 of each year, to hedge its anticipated production for year one, two and three at a rate of 67.5%, 58.5% and 45%, respectively.
Prepayment of the Subordinated Notes is allowed at 100%, subject to a 3.0% fee of outstanding principal. Prepayment is not subject to a prepayment fee after February 17, 2020. Distributions to equity members are generally restricted.
2018 Subordinated Notes, Related Party
On May 1, 2018, Carbon California entered into an agreement with Prudential for the issuance and sale of $3.0 million in subordinated notes due February 15, 2024, bearing interest of 12.0% per annum (the “2018 Subordinated Notes”), of which $3.0 million remains outstanding as of December 31, 2019.
Prudential received 585 Class A Units, representing an approximate 2.0% additional sharing percentage, for the issuance of the 2018 Subordinated Notes. Carbon California valued this unit issuance based on the relative fair value by valuing the units at $1,000 per unit and aggregating the amount with the outstanding 2018 Subordinated Notes of $3.0 million. The Company then allocated the non-cash value of the units of approximately $490,000, which was recorded as a discount to the 2018 Subordinated Notes. As of December 31, 2019, Carbon California had an outstanding discount of $349,000 associated with these notes, which is presented net of the 2018 Subordinated Notes within Notes payable - related party on the consolidated balance sheet. During the year ended December 31, 2019 and 2018, Carbon California amortized fees of $84,000 and $57,000, respectively, associated with the 2018 Subordinated Notes.
The 2018 Subordinated Notes require Carbon California, as of January 1 and July 1 of each year, to hedge its anticipated production for year one, two and three at a rate of 67.5%, 58.5% and 45%, respectively.
Prepayment of the 2018 Subordinated Notes is allowed at 100%, subject to a 3.0% fee of outstanding principal. Prepayment is not subject to a prepayment fee after February 17, 2020. Distributions to equity members are generally restricted.
Restrictions and Covenants
The Senior Revolving Notes, Subordinated Notes and 2018 Subordinated Notes contain affirmative and negative covenants that, among other things, limit Carbon California’s ability to (i) incur additional debt; (ii) incur additional liens; (iii) sell, transfer or dispose of assets; (iv) merge or consolidate, wind-up, dissolve or liquidate; (v) make dividends and distributions on, or repurchases of, equity; (vi) make certain investments; (vii) enter into certain transactions with our affiliates; (viii) enter into sales-leaseback transactions; (ix) make optional or voluntary payments of debt; (x) change the nature of our business; (xi) change our fiscal year to make changes to the accounting treatment or reporting practices; (xii) amend constituent documents; and (xiii) enter into certain hedging transactions.
In December 2019, Carbon California amended the Senior Revolving Notes, the Subordinated Notes and the 2018 Subordinated Notes to amend the total leverage ratio and senior leverage ratio, effective September 30, 2019. The Senior Revolving Notes were also amended to provide a mechanism to determine a successor reference rate to LIBOR.
The affirmative and negative covenants are subject to various exceptions, including basket amounts and acceptable transaction levels. In addition, (i) the Senior Revolving Notes require at December 31, 2019 Carbon California’s compliance with (A) a maximum Debt/EBITDA ratio of 4.5 to 1.0 (B) a maximum Senior Revolving Notes/EBITDA ratio of 3.5 to 1.0 and (C) a minimum interest coverage ratio of 2.0 to 1 and (ii) the Subordinated Notes require at December 31, 2019 Carbon California’s compliance with (A) a maximum Debt/EBITDA ratio of 5.18 to 1.0, (B) a maximum Senior Revolving Notes/EBITDA ratio of 4.03 to 1.0, (C) a minimum interest coverage ratio of 1.6 to 1.0, (D) an asset coverage test whereby indebtedness may not exceed the product of 0.65 times Adjusted PV-10 of proved developed reserves set forth in the most recent reserve report, (E) maintenance of a minimum borrowing base of $30.0 million under the Senior Revolving Notes and (F) a minimum current ratio of 0.85 to 1.00.
As of December 31, 2019, Carbon California was in compliance with its financial covenants.
Note 8 - Leases
On January 1, 2019, we adopted Topic 842. Results for reporting periods beginning January 1, 2019 are presented in accordance with Topic 842, while prior period amounts are reported in accordance with Topic 840 – Leases. On January 1, 2019, we recognized approximately $7.7 million in right-of-use assets and approximately $7.7 million in lease liabilities, representing the present value of minimum payment obligations associated with compressor, vehicle, and office space operating leases with non-cancellable lease terms in excess of one year. We do not have any finance leases, nor are we the lessor in any leasing arrangements. We have elected certain practical expedients available under Topic 842 including those that permit us to (i) account for lease and non-lease components in our contracts as a single lease component for all asset classes; (ii) not evaluate existing and expired land easements; (iii) not apply the recognition requirements of Topic 842 to leases with a lease term of twelve months or less; and (iv) retain our existing lease assessment and classification. As such, there was no cumulative-effect adjustment to retained earnings required at January 1, 2019.
The lease amounts disclosed herein are presented on a gross basis. A portion of these costs may have been or will be billed to other working interest owners, and our net share of these costs, once paid, are or will be included in lease operating expenses, pipeline operating expenses or general and administrative expenses, as applicable.
Our right-of-use assets and lease liabilities are recognized at their discounted present value on the balance sheet. All leases recognized on our consolidated balance sheet as of December 31, 2019 are classified as operating leases, which include leases related to the asset classes reflected in the table below:
| (in thousands) | Right-of-Use Assets | Lease Liability | ||||||
| Compressors | $ | 3,282 | $ | 3,282 | ||||
| Corporate leases | 2,065 | 2,083 | ||||||
| Vehicles | 757 | 643 | ||||||
| Total | $ | 6,104 | $ | 6,008 | ||||
We recognize lease expense on a straight-line basis excluding short-term and variable lease payments which are recognized as incurred. Short-term lease cost represents payments for leases with a lease term of twelve months or less, excluding leases with a term of one month or less. Short-term leases include certain compressors and vehicles that have a non-cancellable lease term of less than one year.
The following table summarizes the components of our gross operating lease costs incurred during the year ended December 31, 2019:
| (in thousands) | Amount | |||
| Operating lease cost | $ | 2,116 | ||
| Short-term lease cost | 629 | |||
| Total lease cost | $ | 2,745 | ||
We do not have any leases with an implicit interest rate that can be readily determined. As a result, we calculate collateralized incremental borrowing rates to use as discount rates. We utilize the benchmark rates defined in our credit facilities, and adjust for facility utilization and term considerations, to establish collateralized incremental borrowing rates.
Our weighted-average lease term and discount rate used are as follows:
| December 31, 2019 | ||||
| Weighted-average lease term (years) | 3.59 | |||
| Weighted-average discount rate | 6.4 | % | ||
The following table summarizes supplemental cash flow information related to operating leases:
| (in thousands) | Year Ended December 31, 2019 | |||
| Cash paid for operating leases | $ | 2,212 | ||
| Right-of-use assets obtained in exchange for operating lease obligations | $ | 465 | ||
Minimum future commitments by year for our long-term operating leases as of December 31, 2019 are presented in the table below. Such commitments are reflected at undiscounted values and are reconciled to the discounted present value recognized on the balance sheet as follows:
| (in thousands) | Amount | |||
| 2020 | $ | 1,960 | ||
| 2021 | 1,902 | |||
| 2022 | 1,704 | |||
| 2023 | 1,157 | |||
| 2024 | 11 | |||
| Thereafter | - | |||
| Total future minimum lease payments | $ | 6,734 | ||
| Less: imputed interest | (726 | ) | ||
| Total lease liabilities | $ | 6,008 | ||
Note 9 - Revenue
Oil, Natural Gas and Natural Gas Liquid Sales
We sell oil and natural gas products in the United States primarily within two regions of the United States: Appalachia and Illinois Basins and the Ventura Basin. We enter into contracts that generally include one type of distinct product in variable quantities and priced based on a specific index related to the type of product. Most of our contract pricing provisions are tied to a market index, with certain adjustments based on, among other factors, whether a well delivers to a gathering or transmission line, quality of the oil or natural gas, and prevailing supply and demand conditions.
Transportation and Handling
We generally purchase natural gas from producers at the wellhead or other receipt points, gather the wellhead natural gas through our gathering systems, and then sell the natural gas based on published index market prices. We remit to the producers either an agreed-upon percentage of the actual proceeds that we receive from our sales of natural gas or an agreed-upon percentage of the proceeds based on index related prices for the natural gas, regardless of the actual amount of the sales proceeds we receive. Our revenues under percent-of-proceeds/index arrangements generally correlate to the price of natural gas. Under fee-based arrangements, we receive a fee for storing natural gas. The storage revenues earned are directly related to the volume of natural gas that flows through our systems and are not directly dependent on commodity prices.
Marketing Gas Sales
We sell production purchased from third parties as well as production from our own oil and gas producing properties. Marketing gas sales are recognized on a gross basis as we purchase and take control of the gas prior to sale and are the principal in the transaction.
The following tables present our disaggregated revenue by primary region within the United States and major product line (in thousands):
| Appalachian and Illinois Basins | Ventura Basin | Total | ||||||||||||||||||||||
| Year Ended December 31, | Year Ended December 31, | Year Ended December 31, | ||||||||||||||||||||||
| 2019 | 2018 | 2019 | 2018 | 2019 | 2018 | |||||||||||||||||||
| Natural gas sales | $ | 55,279 | $ | 14,768 | $ | 1,189 | $ | 1,250 | $ | 56,468 | $ | 16,018 | ||||||||||||
| Natural gas liquids sales | - | - | 578 | 1,143 | 578 | 1,143 | ||||||||||||||||||
| Oil sales | 5,805 | 4,963 | 30,990 | 25,928 | 36,795 | 30,891 | ||||||||||||||||||
| Transportation and handling | 1,928 | - | - | - | 1,928 | - | ||||||||||||||||||
| Marketing gas sales | 16,920 | - | - | - | 16,920 | - | ||||||||||||||||||
| Total | $ | 79,932 | $ | 19,731 | $ | 32,757 | $ | 28,321 | $ | 112,689 | $ | 48,052 | ||||||||||||
Note 10 - Stock-Based Compensation Plans and Employee Benefit Plans
Carbon Stock Incentive Plans
We have three stock plans, the Carbon 2011 Stock Incentive Plan, the Carbon 2015 Stock Incentive Plan and the Carbon 2019 Long Term Incentive Plan (collectively the “Carbon Plans”). The Carbon 2019 Long Term Incentive Plan was approved by the Company’s stockholders in May 2019. The Carbon Plans provide for the issuance of approximately 1.6 million shares of common stock to our officers, directors, employees or consultants eligible to receive the awards under the Carbon Plans.
The Carbon Plans provide for the granting of incentive stock options, non-qualified stock options, restricted stock awards, performance awards and phantom stock awards, or a combination of the foregoing, to employees, officers, directors or consultants, provided that only employees may be granted incentive stock options and directors may only be granted restricted stock awards and phantom stock awards.
Restricted Stock
Restricted stock awards for employees vest ratably over a three-year service period or cliff vest at the end of a three-year service period. For non-employee directors, the awards vest upon the earlier of a change in control of us or the date their membership on the Board of Directors is terminated other than for cause. We recognize compensation expense for these restricted stock grants based on the grant date fair value. The following table shows a summary of our unvested restricted stock under the Carbon Plans as of December 31, 2019 and 2018 as well as activity during the years then ended:
| Weighted Average | ||||||||
| Number of Shares | Grant Date Fair Value | |||||||
| Restricted stock awards, unvested, January 1, 2018 | 269,997 | $ | 7.54 | |||||
| Granted | 106,000 | 9.80 | ||||||
| Vested | (59,550 | ) | 6.82 | |||||
| Forfeited | (2,240 | ) | 7.41 | |||||
| Restricted stock awards, unvested, December 31, 2018 | 314,207 | $ | 8.40 | |||||
| Granted | 99,000 | 10.00 | ||||||
| Vested | (105,628 | ) | 6.75 | |||||
| Forfeited | (6,682 | ) | 9.74 | |||||
| Restricted stock awards, unvested, December 31, 2019 | 300,897 | $ | 9.41 | |||||
Compensation costs recognized for these restricted stock grants were approximately $811,000 and $725,000 for the years ended December 31, 2019 and 2018, respectively. As of December 31, 2019, there was approximately $1.5 million of unrecognized compensation costs related to these restricted stock grants which we expect to recognize over the next 6.3 years.
Restricted Performance Units
Performance units represent a contractual right to receive one share of our common stock subject to the terms and conditions of the agreements, including the achievement of certain performance measures over a defined period of time as well as, in some cases, continued service requirements. The following table shows a summary of our unvested performance units as of December 31, 2019 and 2018 as well as activity during the years then ended:
| Number | ||||
| of Shares | ||||
| Restricted performance units, unvested, January 1, 2018 | 258,811 | |||
| Granted | 136,159 | |||
| Vested | (108,484 | ) | ||
| Forfeited | (6,610 | ) | ||
| Restricted performance units, unvested, December 31, 2018 | 279,876 | |||
| Granted | 101,864 | |||
| Vested | (95,451 | ) | ||
| Forfeited | (11,084 | ) | ||
| Restricted performance units, unvested, December 31, 2019 | 275,205 | |||
We account for the performance units granted during 2017 through 2019 at their fair value determined at the date of grant, which were $7.20, $9.80 and $10.00 per share, respectively. The final measurement of compensation cost will be based on the number of performance units that ultimately vest. At December 31, 2019, we estimated that none of the performance units granted in 2019 and 2018 would vest, and, accordingly, no compensation cost has been recorded for these performance units. At December 31, 2019, we estimated that it was probable that the performance units granted in 2015, 2016 and 2017 would vest and therefore compensation costs of approximately $637,000 and $408,000 related to these performance units were recognized for the years ended December 31, 2019 and 2018, respectively. As of December 31, 2019, compensation costs related to the performance units granted in 2015, 2016 and 2017 have been fully recognized. As of December 31, 2019, if a change in control and other performance provisions pursuant to the terms and conditions of these award agreements were met in full, the estimated unrecognized compensation cost related to unvested performance units would be approximately $3.2 million.
401(k) Plan
We have a 401(k) plan available to eligible employees. The plan provides for 6.0% matching which vests immediately. For the years ended December 31, 2019 and 2018, we contributed approximately $527,000 and $441,000, respectively, for 401(k) contributions and related administrative expenses.
Note 11 - Earnings (Loss) Per Common Share
The following table sets forth the calculation of basic and diluted income (loss) per share:
| Year Ended December 31, | ||||||||
| (in thousands, except per share amounts) | 2019 | 2018 | ||||||
| Net income attributable to controlling interests before preferred shares | $ | 1,097 | $ | 8,404 | ||||
| Less: beneficial conversion feature | - | 1,125 | ||||||
| Less: net income attributable to preferred shares – preferred return | 300 | 224 | ||||||
| Net income attributable to common stockholders, basic | 797 | 7,055 | ||||||
| Less: warrant derivative gain | - | 225 | ||||||
| Net income attributable to common stockholders, diluted | $ | 797 | $ | 6,830 | ||||
| Weighted-average number of common shares outstanding, basic | 7,794 | 7,525 | ||||||
| Add dilutive effects of non-vested shares of restricted stock and restricted performance units | 301 | 314 | ||||||
| Weighted-average number of common shares outstanding, diluted | 8,095 | 7,839 | ||||||
| Net income per common share, basic | $ | 0.10 | $ | 0.94 | ||||
| Net income per common share, diluted | $ | 0.10 | $ | 0.87 | ||||
For the years ended December 31, 2019 and 2018, approximately 275,000 and 280,000 restricted performance units subject to future contingencies were excluded from the computation of basic and diluted earnings per share.
Series B Convertible Preferred Stock – Related Party
In connection with the closing of the Seneca Acquisition, we raised $5.0 million through the issuance of 50,000 shares of Series B Convertible Preferred Stock, par value $0.01 per share (“Preferred Stock”) to Yorktown. The Preferred Stock converts into common stock at the election of the holder or will automatically convert into shares of our common stock upon completion of a qualifying equity financing event. The number of shares of common stock issuable upon conversion is dependent upon the price per share of common stock issued in connection with any such qualifying equity financing but has a floor conversion price equal to $8.00 per share. The conversion ratio at which the Preferred Stock will convert into common stock is equal to an amount per share of $100 plus all accrued but unpaid dividends payable in respect thereof divided by the greater of $8.00 per share or the price that is 15.0% less than the lowest price per share of shares sold to the public in the next equity financing. Using the floor of $8.00 per share would yield 12.5 shares of common stock for every unit of Preferred Stock. The conversion price will be proportionately increased or decreased to reflect changes to the outstanding shares of common stock, such as the result of a combination, reclassification, subdivision, stock split, stock dividend or other similar transaction involving the common stock. Additionally, after the third anniversary of the issuance of the Preferred Stock, we have the option to redeem the shares for cash.
The Preferred Stock accrues cash dividends at a rate of 6.0% of the initial issue price of $100 per share per annum. The holders of the Preferred Stock are entitled to the same number of votes of common stock that such share of Preferred Stock would represent on an as converted basis. The holders of the Preferred Stock receive liquidation preference based on the initial issue price of $100 per share plus a preferred return over common stockholders and the holders of any junior ranking stock. The preferred return was approximately $524,000 and $224,000 as of December 31, 2019 and 2018, respectively.
Note 12 - Income Taxes
The provision for income taxes consists of the following:
| Year Ended | ||||||||
| December 31, | ||||||||
| (in thousands) | 2019 | 2018 | ||||||
| Current income tax benefit | $ | - | $ | - | ||||
| Deferred income tax expense (benefit) | 895 | (590 | ) | |||||
| Change in valuation allowance | (895 | ) | 590 | |||||
| Total income tax benefit | $ | - | $ | - | ||||
The effective income tax rate for the years ended December 31, 2019 and 2018 differed from the statutory U.S. federal income tax rate as follows:
| Year Ended | ||||||||
| December 31, | ||||||||
| 2019 | 2018 | |||||||
| Federal income tax rate | 21.0 | % | 21.0 | % | ||||
| State income taxes, net of federal benefit | 4.9 | 4.9 | ||||||
| Permanent differences | (3.3 | ) | (1.2 | ) | ||||
| Non-controlling interest in consolidated partnerships | (46.2 | ) | (11.4 | ) | ||||
| True-up of prior year depletion in excess of basis | (6.5 | ) | 1.3 | |||||
| Stock-based compensation deficiency | (16.0 | ) | 1.1 | |||||
| Purchase accounting adjustments | (45.0 | ) | (22.9 | ) | ||||
| Rate changes of prior year deferred | 1.8 | (0.5 | ) | |||||
| True-up of prior year deferred | - | 3.0 | ||||||
| Decrease in valuation allowance and other | 89.3 | 4.7 | ||||||
| Total effective income tax rate | - | % | - | % | ||||
The tax effects of temporary differences that gave rise to significant portions of the deferred tax assets and liabilities are presented below:
| (in thousands) | As of December 31, | |||||||
| 2019 | 2018 | |||||||
| Deferred tax assets: | ||||||||
| Net operating loss carryforwards | $ | 6,232 | $ | 7,573 | ||||
| Depletion carryforwards | 2,569 | 2,166 | ||||||
| Accrual and other | 3,997 | 1,372 | ||||||
| Stock-based compensation | 469 | 445 | ||||||
| Asset retirement obligations | 4,659 | 4,567 | ||||||
| Property and equipment | (2,253 | ) | (42 | ) | ||||
| Total deferred tax assets | 15,673 | 16,081 | ||||||
| Deferred tax liabilities: | ||||||||
| Interest in partnerships | (338 | ) | (512 | ) | ||||
| ASC 842 Operating Leases | (12 | ) | - | |||||
| Derivative and other | (1,689 | ) | (1,008 | ) | ||||
| Less valuation allowance | (13,634 | ) | (14,561 | ) | ||||
| Net deferred tax asset | $ | - | $ | - | ||||
The Company has net operating losses (“NOL”) of approximately $21.6 million available to reduce future years’ federal taxable income. The federal net operating losses expire beginning in 2031 through 2037, while the current 2018 and 2019 net operating losses will never expire. The Company has various state NOL carryforwards available to reduce future years' state taxable income, which are dependent on apportionment percentages and state laws that can change from year to year and impact the amount of such carryforwards. These state NOL will expire beginning in 2023 through 2039 depending upon each jurisdiction’s specific law surrounding NOL carryforwards. Tax returns are subject to audit by various taxation authorities. The results of any audits will be accounted for in the period in which they are determined
The Company believes that the tax positions taken in the Company’s tax returns satisfy the more likely than not threshold for benefit recognition. Accordingly, no liabilities have been recorded by the Company. Any potential adjustments for uncertain tax positions would be a reclassification between the deferred tax asset related to the Company’s NOL and another deferred tax asset.
The Company’s policy is to recognize interest and penalties related to uncertain tax positions in income tax expense. As of December 31, 2019 and 2018, the Company did not have any uncertain tax positions.
Note 11 –13 - Fair Value Measurements
Authoritative guidance defines fair value as the price that would be received to sell an asset or paid to transfer a liability (an exit price) in an orderly transaction between market participants at the measurement date. The guidance establishes a hierarchy for inputs used in measuring fair value that maximizes the use of observable inputs and minimizes the use of unobservable inputs by requiring that the most observable inputs be used when available. Observable inputs are inputs that market participants would use in pricing the asset or liability developed based on market data obtained from sources independent of us. Unobservable inputs are inputs that reflect our assumptions of what market participants would use in pricing the asset or liability developed based on the best information available in the circumstances. The hierarchy is broken down into three levels based on the reliability of the inputs as follows:
| Level 1: | Quoted prices are available in active markets for identical assets or liabilities; |
| Level 2: | Quoted prices in active markets for similar assets or liabilities that are observable for the asset or liability; or |
| Level 3: | Unobservable pricing inputs that are generally less observable from objective sources, such as discounted cash flow models or valuations. |
Financial assets and liabilities are classified based on the lowest level of input that is significant to the fair value measurement. Our policy is to recognize transfers in and/or out of fair value hierarchy as of the end of the reporting period for which the event or change in circumstances caused the transfer. We have consistently applied the valuation techniques discussed below for all periods presented.
The following table presents our financial assets and liabilities that were accounted for at fair value on a recurring basis by level within the fair value hierarchy:
| (in thousands) | Fair Value Measurements Using | |||||||||||||||
| Level 1 | Level 2 | Level 3 | Total | |||||||||||||
| December 31, 2017 | ||||||||||||||||
| Asset: | ||||||||||||||||
| Commodity derivatives | $ | - | $ | 225 | $ | - | $ | 225 | ||||||||
| Liabilities | ||||||||||||||||
| Warrant derivative liability | $ | - | $ | - | $ | 2,017 | $ | 2,017 | ||||||||
| December 31, 2016 | ||||||||||||||||
| Liability: | ||||||||||||||||
| Commodity derivatives | $ | - | $ | 1,932 | $ | - | $ | 1,932 | ||||||||
| Fair Value Measurements Using | ||||||||||||||||
| (in thousands) | Level 1 | Level 2 | Level 3 | Total | ||||||||||||
| December 31, 2019 | ||||||||||||||||
| Assets: | ||||||||||||||||
| Commodity derivatives | $ | - | $ | 7,079 | $ | - | $ | 7,079 | ||||||||
| Liabilities: | ||||||||||||||||
| Commodity derivatives | $ | - | $ | 556 | $ | - | $ | 556 | ||||||||
| December 31, 2018 | ||||||||||||||||
| Assets: | ||||||||||||||||
| Commodity derivatives | $ | - | $ | 7,022 | $ | - | $ | 7,022 | ||||||||
84
Commodity DerivativeDerivatives
As of December 31, 2017,2019, our commodity derivative financial instruments are comprised of eight natural gas eightand oil swap,swaps and one natural gas costless collar agreements. As of December 31, 2016, our commodity derivative financial instruments were comprised of eight natural gas swap agreements and nine oil swap agreements.collars. The fair values of these agreements are determined under an income valuation technique. The valuation model requires a variety of inputs, including contractual terms, published forward prices, volatilities for options and discount rates, as appropriate. Our estimates of fair value of derivatives include consideration of the counterparty’s credit worthiness, our credit worthiness and the time value of money. The consideration of these factors results in an estimated exit-price for each derivative asset or liability under a market place participant’s view. All of the significant inputs are observable, either directly or indirectly; therefore, our derivative instruments are included within the Level 2 fair value hierarchy. The counterparty for all of our outstanding commodity derivative financial instruments as of December 31, 2017 is BP Energy Company.
Warrant Derivative
A third-party valuation specialist is utilized to determine the fair value of our California Warrant and Appalachia Warrant. These warrants are designated as Level 3. We review these valuations, including the related model inputs and assumptions, and analyze changes in fair value measurements between periods. We corroborate such inputs, calculations and fair value changes using various methodologies, and reviews unobservable inputs for reasonableness utilizing relevant information from other published sources.
We estimated the fair value of the California Warrant on February 15, 2017, the grant date of the warrant, to be approximately $5.8 million, using a call option pricing model with the following assumptions: a seven-year term, exercise price of $7.20, volatility rate of 41.8% and a risk-free rate of 2.3%. As we will receive Class A units in Carbon California in the event the holder exercises the California Warrant, we also considered the fair value of the Class A units in its valuation. We remeasured the California Warrant as of December 31, 2017, using a Monte Carlo valuation model which utilized unobservable inputs including the percentage return on our shares at various timelines, the percentage return on the privately-held Carbon California Class A units at various timelines, an exercise price of $7.20, volatility rate of 45%, a risk-free rate of 2.1% and an estimated remaining term of 6.4 years. As of December 31, 2017, the fair value of the California Warrant was approximately $2.0 million.
We estimated the fair value of the Appalachia Warrant on April 3, 2017, the grant date of the warrant, to be approximately $1.3 million, using a call option pricing model with the following assumptions: a seven-year term, exercise price of $7.20, volatility rate of 39.3% and a risk-free rate of 2.1%. As we will receive Class A units in Carbon Appalachia in the event the holder exercises the Appalachia Warrant, we also considered the fair value of the Class A units in its valuation. We remeasured the Appalachia Warrant as of November 1, 2017, immediately prior to its exercise, using a Monte Carlo valuation model which utilized unobservable inputs including the percentage return on our shares at various timelines, the percentage return on the privately-held Carbon Appalachia Class A units at various timelines, an exercise price of $7.20, volatility rate of 45%, a risk-free rate of 2.1% and an estimated remaining term of 6.5 years. As of December 31, 2017, the warrant liability had been extinguished.
The following table summarizes the changes in fair value of our financial instruments classified as Level 3 in the fair value hierarchy:
| (in thousands) | California Warrant | Appalachia Warrant | Total | |||||||||
| Balance, December 31, 2016 | $ | - | $ | - | $ | - | ||||||
| Warrant liability | 5,769 | 1,325 | 7,094 | |||||||||
| Unrealized (gain) loss included in warrant gain | (3,752 | ) | 619 | (3,133 | ) | |||||||
| Settlement of warrant liability | - | (1,944 | ) | (1,944 | ) | |||||||
| Balance, December 31, 2017 | $ | 2,017 | $ | - | $ | 2,017 | ||||||
Assets and Liabilities Measured and Recorded at Fair Value on a Non-Recurring Basis
Certain assets and liabilities are measured at fair value on a non-recurring basis. These assets and liabilities are not measured at fair value on an ongoing basis; however they are subject to fair value adjustments in certain circumstances. The fair value of each of the following assets and liabilities measured and recorded at fair value on a non-recurring basis are based on unobservable pricing inputs and therefore, are included within the Level 3 fair value hierarchy.
We use the income valuation technique to estimate the fair value of asset retirement obligations using the amounts and timing of expected future dismantlement costs, credit-adjusted risk-free rates and time value of money. During the year ended December 31, 2017, we recorded $2.4 million in additions to asset retirement obligations compared to additions of approximately $1.8 million for the year ended December 31, 2016. See Note 3 for additional information.
To determine the fair value of the proved developed properties acquired in the EXCO Acquisition in 2016, we primarily used the income approach and made market assumptions as to projections of estimated quantities of oil and natural gas reserves, future production rates, future commodity prices including price differentials as of the Closing Date, future operating and development costs and a market participant weighted average cost of capital.
The fair value of the non-controlling interest in the partnerships we are required to consolidate was determined based on the net discounted cash flows of the proved developed producing properties attributable to the non-controlling interests in these partnerships.
Firm transportation contracts. We assume, at times, certain firm transportation contracts as part of our acquisitions of oil and natural gas properties. The fair value of the firm transportation contract obligations was determined based upon the contractual obligations assumed by us and discounted based upon our effective borrowing rate. These contractual obligations are being amortized on a monthly basis as we pay these firm transportation obligations in the future.
Debt Discount. The fair value of the debt discount from the 1,425 and 585 additional Class A Units issued in connection with the Subordinated Notes and 2018 Subordinated Notes was $1.3 million and $490,000, respectively. The debt discount was based on the relative fair value of Class A Units. Class A Units were issued contemporaneously at $1,000 per Class A Unit.
Asset Retirement Obligation
. The fair value of our asset retirement obligation liability is recorded in the period in which it is incurred or assumed by taking into account the cost of abandoning oil and gas wells ranging from $20,000 to $30,000,$45,000, which is based on our historical experience and industry expectations for similar work; the estimated timing of reclamation ranging from one to 75 years based on estimates from reserve engineers; an inflation rate of 1.92%between 1.52% to 2.79%; and a credit adjusted risk-free rate of 7.24%between 3.28% to 8.27%, which takes into account our credit risk and the time value of money. Given the unobservable nature of the inputs, the initial measurement of the asset retirement obligation liability is deemed to use Level 3 inputs (see Note 3). During the year ended December 31, 2017,2019, we had minimal additions and approximately $290,000 of revisions to asset retirement obligations. During the year ended December 31, 2018, we recorded additions to asset retirement obligations of approximately $2.4$14.1 million, which was the result of increases in the costs estimated to perform plugging and reclamation activities within the Appalachian Basin. We use the income valuation technique to estimate the fair value of asset retirement obligations using the amounts and timing of expected future dismantlement costs, credit-adjusted risk-free rates and time value of money.
Class B Units
We received Class B units from Carbon California and Carbon Appalachia as part of the entry into the Carbon California, LLC AgreementSeneca, Liberty, and Carbon Appalachia LLC Agreement, respectively. We estimated the fair value of the Class B units, in each case, by utilizing the assistance of third-party valuation specialists. The fair values were based upon enterprise values derived from inputs including estimated future production rates, future commodity prices including price differentials as of the dates of closing, future operating and development costs and comparable market participants.OIE Membership Acquisitions.
Note 12 – Physical Delivery Contracts and14 - Commodity Derivatives
We historically have useduse commodity-based derivative contracts to manage exposures to commodity price on certaina portion of our oil and natural gas production. We do not hold or issue derivative financial instruments for speculative or trading purposes. We also have entered into, fixed priceon occasion, oil and natural gas physical delivery contracts to effectively provide commodity price hedges. Because these contracts are not expected to be net cash settled, they are considered to be normal sales contracts and not derivatives. Therefore, theseThese contracts are not recorded at fair value in the consolidated financial statements.
Pursuant to the terms of our credit facility with LegacyTexas Bank, weWe have entered into swap and costless collar derivative agreements to hedge certaina portion of our oil and natural gas production through 2019.2022. As of December 31, 2017,2019, these derivative agreements consisted of the following:
| Natural Gas Swaps | Natural Gas Collars | Oil Swaps | ||||||||||||||||||||||
| Weighted | Weighted | Weighted | ||||||||||||||||||||||
| Average | �� | Average Price | Average | |||||||||||||||||||||
| Year | MMBtu | Price (a) | MMBtu | Range (a) | Bbl | Price (b) | ||||||||||||||||||
| 2018 | 3,390,000 | $ | 3.01 | 60,000 | $3.00 - $3.48 | 63,000 | $ | 53.55 | ||||||||||||||||
| 2019 | 2,596,000 | $ | 2.86 | - | - | 48,000 | $ | 53.76 | ||||||||||||||||
| Natural Gas Swaps | Natural Gas Collars | |||||||||||||||
| Weighted Average | Weighted Average Price | |||||||||||||||
| Year | MMBtu | Price (a) | MMBtu | Range (a) | ||||||||||||
| 2020 | 12,433,000 | $ | 2.73 | 3,430,000 | $2.10 – $2.75 | |||||||||||
| 2021 | 6,448,000 | $ | 2.58 | 1,745,000 | $2.25 – $2.75 | |||||||||||
| Oil Swaps* | Oil Collars* | ||||||||||||||||||||||||||||||||
| Year | WTI Bbl | Weighted Average Price (b) | Brent Bbl | Weighted Average Price (c) | WTI Bbl | Weighted Average Price (b) | Brent Bbl | Weighted Average Price (c) | |||||||||||||||||||||||||
| 2019 | 17,523 | $53.30 | 13,805 | $64.87 | 1,700 | $47.50 - $57.35 | 4,500 | $47.00 - $75.00 | |||||||||||||||||||||||||
| 2020 | 121,147 | $ | 55.37 | 207,182 | $ | 64.62 | 28,200 | $47.00 - $60.15 | 57,900 | $47.00 - $75.00 | |||||||||||||||||||||||
| 2021 | - | $ | - | 86,341 | $ | 67.12 | 66,200 | $47.00 - $60.15 | 190,000 | $47.00 - $75.00 | |||||||||||||||||||||||
| 2022 | - | $ | - | - | $ | - | - | $ | - | 199,900 | $50.00 - $61.00 | ||||||||||||||||||||||
| * | Includes 100% of Carbon California’s outstanding derivative hedges at December 31, 2019, and not our proportionate share. |
| (a) | NYMEX Henry Hub Natural Gas futures |
| (b) | NYMEX Light Sweet Crude West Texas Intermediate futures | |
| (c) | Brent future contracts for the respective period. |
For our swap instruments, we receive a fixed price for the hedged commodity and payspay a floating price to the counterparty. The fixed-price payment and the floating-price payment are netted, resulting in a net amount due to or from the counterparty.
Costless collars are designed to establish floor and ceiling prices on anticipated future oil and gas production. The ceiling establishes a maximum price that wethe Company will receive for the volumes under contract, while the floor establishes a minimum price.
The following table summarizes the fair value of the derivatives recorded in the consolidated balance sheets (Note 11).sheets. These derivative instruments are not designated as cash flow hedging instruments for accounting purposes:purposes.
| (in thousands) | As of December 31, | |||||||
| 2017 | 2016 | |||||||
| Commodity derivative contracts: | ||||||||
| Commodity derivative asset | $ | 215 | $ | - | ||||
| Other long-term assets | $ | 10 | $ | - | ||||
| Commodity derivative liabilities | $ | - | $ | 1,341 | ||||
| Commodity derivative liabilities, non-current | $ | - | $ | 591 | ||||
| As of December 31, | ||||||||
| (in thousands) | 2019 | 2018 | ||||||
| Commodity derivative contracts: | ||||||||
| Commodity derivative asset | $ | 5,915 | $ | 3,517 | ||||
| Commodity derivative asset – non-current | $ | 1,164 | $ | 3,505 | ||||
| Commodity derivative liability | $ | 469 | $ | - | ||||
| Commodity derivative liability – non-current | $ | 87 | $ | - | ||||
The following table below summarizes the commodity settlements and unrealized gains and losses related to our derivative instruments for the years ended December 31, 2017 and 2016. These commodity settlements and unrealized gains and losses are recorded and included in commodity derivative gain or losspresented in the accompanying consolidated statements of operations.operations:
| (in thousands) | For the year ended December 31, | |||||||
| 2017 | 2016 | |||||||
| Commodity derivative contracts: | ||||||||
| Settlement gains | $ | 770 | $ | 231 | ||||
| Unrealized gains (loss) | 2,158 | (2,490 | ) | |||||
| Total settlement and unrealized gains (losses), net | $ | 2,928 | $ | (2,259 | ) | |||
| Year Ended December 31, | ||||||||
| (in thousands) | 2019 | 2018 | ||||||
| Commodity derivative contracts: | ||||||||
| Settlement gain (loss) | $ | 3,543 | $ | (3,848 | ) | |||
| Unrealized (loss) gain | (499 | ) | 8,742 | |||||
| Total commodity derivative gain | $ | 3,044 | $ | 4,894 | ||||
Commodity derivative settlement gains and losses are included in cash flows from operating activities in our consolidated statements of cash flows.
The counterparty in all our derivative instruments is BP Energy Company. We have entered into an International Swaps and Derivatives Association (“ISDA”) Master Agreement with BP Energy Company that establishes standard terms for the derivative contracts and an inter-creditor agreement with LegacyTexas Bank and BP Energy Company whereby any credit exposure related to the derivative contracts entered into by us and BP Energy Company is secured by the collateral and backed by the guarantees supporting the credit facility.
We net our derivative instrument fair value amounts executed with BP Energy Company pursuant to the ISDA master agreement,Master Agreements, which providesprovide for the net settlement over the term of the contracts and in the event of default or termination of the contracts. The following table summarizes the location and fair value amountseffect of all derivative instruments in the Consolidated Balance Sheet, as well as the grossnetting arrangements for recognized derivative assets and liabilities and amounts offsetthat are subject to master netting arrangements or similar arrangements in the Consolidated Balance Sheetconsolidated balance sheet as of December 31, 2017.2019:
| Net | ||||||||||||||
| Gross | Recognized | |||||||||||||
| Recognized | Gross | Fair Value | ||||||||||||
| Assets/ | Amounts | Assets/ | ||||||||||||
| Balance Sheet Classification | Liabilities | Offset | Liabilities | |||||||||||
| Commodity derivative assets: | Commodity derivative | $ | 624 | $ | (409 | ) | $ | 215 | ||||||
| Other long-term assets | 250 | (240 | ) | 10 | ||||||||||
| Total derivative assets | $ | 874 | $ | (649 | ) | $ | 225 | |||||||
| Commodity derivative liabilities: | ||||||||||||||
| Commodity derivative | $ | (409 | ) | $ | 409 | $ | - | |||||||
| Commodity derivative: non-current | (240 | ) | 240 | - | ||||||||||
| Total derivative liabilities | $ | (649 | ) | $ | 649 | $ | - | |||||||
The following table summarizes the location and fair value amounts of all derivative instruments in the Consolidated Balance Sheet, as well as the gross recognized derivative assets, liabilities and amounts offset in the Consolidated Balance Sheet as of December 31, 2016.
| Net | ||||||||||||||
| Gross | Recognized | |||||||||||||
| Recognized | Gross | Fair Value | ||||||||||||
| Assets/ | Amounts | Assets/ | ||||||||||||
| Balance Sheet Classification | Liabilities | Offset | Liabilities | |||||||||||
| Commodity derivative assets: | ||||||||||||||
| Commodity derivative | $ | - | $ | - | $ | - | ||||||||
| Other long-term assets | 249 | (249 | ) | - | ||||||||||
| Total derivative assets | $ | 249 | $ | (249 | ) | $ | - | |||||||
| Commodity derivative liabilities: | ||||||||||||||
| Commodity derivative | $ | 1,341 | $ | - | $ | 1,341 | ||||||||
| Commodity derivative: non-current | 840 | (249 | ) | 591 | ||||||||||
| Total derivative liabilities | $ | 2,181 | $ | (249 | ) | $ | 1,932 | |||||||
| Net | ||||||||||||
| Gross | Recognized | |||||||||||
| Recognized | Gross | Fair Value | ||||||||||
| Assets/ | Amounts | Assets/ | ||||||||||
| Balance Sheet Classification (in thousands) | Liabilities | Offset | Liabilities | |||||||||
| Commodity derivative assets: | ||||||||||||
| Commodity derivative asset | $ | 6,917 | $ | (1,002 | ) | $ | 5,915 | |||||
| Commodity derivative asset – non-current | 3,478 | (2,314 | ) | 1,164 | ||||||||
| Total derivative assets | $ | 10,395 | $ | (3,316 | ) | $ | 7,079 | |||||
| Commodity derivative liabilities: | ||||||||||||
| Commodity derivative liability | $ | (1,471 | ) | $ | 1,002 | $ | (469 | ) | ||||
| Commodity derivative liability – non-current | (2,401 | ) | 2,314 | (87 | ) | |||||||
| Total derivative liabilities | $ | (3,872 | ) | $ | 3,316 | $ | (556 | ) | ||||
Due to the volatility of oil and natural gas prices, the estimated fair values of our derivatives are subject to large fluctuations from period to period.
Note 13 –15 - Commitments and Contingencies
We have entered into employment agreements with certain of our executives and officers. The term of the agreements generally ranges from one to two years and provides for renewal provisions in one year increments thereafter. The agreements provide for, among other items, severance and continuation of benefit payments upon termination of employment or certain change of control events.
We have entered into long-term firm transportation contracts to ensure the transport for certain of our gas production to purchasers. Firm transportation volumes and the related demand charges for the remaining term of these contracts atas of December 31, 20172019 are summarized in the table below.
| Period | Dekatherms per day | Demand Charges | ||||||
| Jan 2018 - Apr 2018 | 5,530 | $ | 0.20 - $0.65 | |||||
| May 2018 - Mar 2020 | 3,230 | $ | 0.20 - $0.62 | |||||
| Apr 2020 – May 2020 | 2,150 | $ | 0.20 | |||||
| Jun 2020 – May 2036 | 1,000 | $ | 0.20 | |||||
| Period | Dekatherms per day | Demand Charges | ||||||
| Jan 2020 – Mar 2020 | 58,871 | $ | 0.20 - 0.62 | |||||
| Apr 2020 – May 2020 | 57,791 | $ | 0.20 - 0.56 | |||||
| Jun 2020 – Oct 2020 | 56,641 | $ | 0.20 - 0.56 | |||||
| Nov 2020 – Aug 2022 | 50,341 | $ | 0.20 - 0.56 | |||||
| Sep 2022 – May 2027 | 30,990 | $ | 0.20 - 0.21 | |||||
| Jun 2027 – May 2036 | 1,000 | $ | 0.20 | |||||
A liabilityAs of approximately $261,000December 31, 2019, the remaining commitment related to the firm transportation contracts assumed in the EXCO Acquisition in October 2016 which representsand the remaining commitment,OIE Membership Acquisition is $14.6 million and reflected on our Consolidated Balance Sheet as of December 31, 2017. The fair value of these firm transportation obligations was determined based uponin the contractual obligations assumed by us and discounted based upon our effective borrowing rate.Company’s consolidated balance sheet. These contractual obligations are being amortizedreduced monthly as we paythe Company pays these firm transportation obligations in the future.
We lease, under an operating lease arrangement, approximately 8,500 square feet of administrative office space in Denver, Colorado that expires in 2023, approximately 5,300 square feet of office space in Lexington, Kentucky that expires in 2019, and 9,500 square feet of office space in Santa Paula, California that expires in 2021. For the years ended December 31, 2017 and 2016, we incurred rental expenses of $255,000 and $220,000, respectively. We have minimum lease payments for our office space and equipment of approximately $436,000 for 2018, $390,000 for 2019, $382,000 for 2020, $275,000 for 2021, and $270,000 for 2022.obligations.
Capital CommitmentNatural gas processing agreement
In our participation asWe have entered into an initial five-year gas processing agreement expiring in 2022. We have an option to extend the term of the agreement by another five years. The related demand charges for volume commitments over the remaining term of the agreement are approximately $1.8 million per year. We will pay a Class A memberprocessing fee of Carbon Appalachia we made$2.50 per Mcf for the term of the agreement, with a capitalminimum annual volume commitment of $23.6 million, of which we have contributed $6.9 million as of December 31, 2017.720,000 Mcf.
Capital Commitments
As of December 31, 2017,2019, we had no capital commitments associated with Carbon California.commitments.
During March 2018, management became aware that one of our field employees had been misappropriating funds from our suspended revenue accounts, or suspense accounts, over a period of several years. Promptly following the discovery of the misappropriation, we terminated the employee and engaged an external forensic specialist to lead an investigation to determine the extent and impact on our financial statements. That investigation revealed that the employee’s ability to misappropriate funds from the suspense accounts was eliminated in 2017 when we moved our revenue accounting function to our Denver office and instituted our current set of revenue accounting practices and internal controls. As a result, the employee no longer had access to the suspense accounts.
The discovery of the misappropriation was made in March 2018 when the employee attempted to misappropriate funds from a different source. This attempt was identified under the Company’s current internal controls.
The investigation is still ongoing, but based on the results so far, we have recorded a provision at December 31, 2017 of $250,000 to reflect the estimated loss of suspended revenue. Depending upon the final results of the investigation, which we are seeking to conclude as soon as reasonably practicable, we may determine that the estimate should be increased or decreased. Furthermore, we will no longer be using printed manual checks for payments. Revenue and other checks will require approval from more than one individual and we are evaluating our segregation of duties, specifically related to the cash disbursement process, and will adjustwhere possible to strengthen the system of internal control.We have determined that this event constituted a significant deficiency, but not a material weakness, at December 31, 2017.
Note 14 – Retirement Savings Plan
We have a 401(k) plan available to eligible employees. The plan provides for 6% matching which vests immediately. For the years ended December 31, 2017 and 2016, we contributed approximately $175,000 and $99,000, respectively, for 401(k) contributions and related administrative expenses.
Note 15 –16 - Supplemental Cash Flow Disclosure
Supplemental cash flow disclosures are presented below:
| (in thousands) | For the Years Ended December 31, | |||||||
| 2017 | 2016 | |||||||
| Cash paid during the period for: | ||||||||
| Interest payments | $ | 967 | $ | 156 | ||||
| Income taxes | - | - | ||||||
| Non-cash transactions: | ||||||||
| Increase in asset retirement obligations | $ | 2,402 | $ | 1,849 | ||||
| Increase (decrease) in accounts payable and accrued liabilities included in oil and gas properties | $ | 67 | $ | 1,099 | ||||
| Obligations assumed with acquisitions | $ | - | $ | 2,694 | ||||
| Equity method investments | $ | 5,674 | $ | - | ||||
| Year Ended December 31, | ||||||||
| (in thousands) | 2019 | 2018 | ||||||
| Cash paid during the period for: | ||||||||
| Interest | $ | 9,191 | $ | 4,217 | ||||
| Non-cash transactions: | ||||||||
| Capital expenditures included in accounts payable and accrued liabilities | $ | (2,563 | ) | $ | (206 | ) | ||
| Adjustments to OIE Membership Acquisition purchase price | $ | 1,505 | - | |||||
Note 16 – Related Parties
During the year ended December 31, 2017, we were engaged in the following transactions with related parties:
Carbon California
We received 5,077 Class B units of Carbon California, representing 17.81% of the voting and profits interest.
Carbon California Operating Company (“CCOC”) is our subsidiary and the operator of Carbon California through an operating agreement. The operating agreement includes reimbursements and allocations made under the agreement. As of December 31, 2017, approximately $300,000 is due from Carbon California and included in accounts receivable – due from related party on the consolidated balance sheets.
On February 15, 2017, we entered into a management service agreement with Carbon California whereby we provide general management and administrative services. We receive $600,000 annually, payable in four equal quarterly installments. We also received a one-time reimbursement of $500,000 in connection with the CRC and Mirada Acquisitions. Carbon California reimburses us for all management related expenses such as travel, required third-party geological and/or accounting consulting, and other necessary expenses incurred by us in the normal course of managing Carbon California. For the year ended December 31, 2017, we recorded $1.0 million in total management reimbursements. There were no outstanding management reimbursements unpaid as of December 31, 2017.
Carbon Appalachia
We received 1,000 Class B units of Carbon Appalachia, representing a future profits interest after certain return thresholds to Class A Units are met. We also received 121 Class C Units of Carbon Appalachia, representing an approximate 1.0% profits interest, in exchange for unevaluated property in Tennessee.
Nytis is the operator of Carbon Appalachia through an operating agreement. The operating agreement includes reimbursements and allocations made under the agreement. As of December 31, 2017, approximately $1.8 million is due from Carbon Appalachia and included in accounts receivable – due from related party on the consolidated balance sheets.
On April 3, 2017, we entered into a management service agreement with Carbon Appalachia whereby we provide general management and administrative services. We initially received a quarterly reimbursement of $75,000; however, after the Enervest Acquisition in August, the amount of the reimbursement now varies quarterly based upon the percentage of our production in relation to the total of our production and Carbon Appalachia. We also received a one-time reimbursement of $300,000 in connection with the CNX Acquisition. Total reimbursements recorded by us for the year ended December 31, 2017, were approximately $1.6 million, of which approximately $579,000 was included in accounts receivable – due from related party on the consolidated balance sheets as of December 31, 2017.
Ohio Basic Minerals
During 2017, we received $96,000 in management reimbursements from Ohio Basic Minerals.
Note 17 – Subsequent Events
On February 1, 2018, Yorktown exercised the California Warrant resulting in us receiving 11,000 Class A Units in Carbon California and issuing 1,527,778 shares of its Common Stock to Yorktown. As a result, our ownership of Class A Units of Carbon California increased from zero to 11,000 or from 0% to 46.96% (which equates to a sharing percentage interest of 38.59%). We also hold all of the Class B Units of Carbon California which represent a sharing percentage of 17.81%, resulting in our aggregate sharing percentage increasing from 17.81% to 56.40%.
On March 27, 2018, we amended our senior secured asset-based revolving credit facility with LegacyTexas Bank, adjusting certain covenants, the specifics of which are described in the amended agreement.
On March 28, 2018, our Credit Facility borrowing base was increased to $25.0 million. Pursuant to the credit agreement amendment entered into on March 27, 2018, we are subject to a minimum liquidity covenant of $750,000.
Note 18–- Supplemental Financial Data –- Oil and Gas Producing Activities (unaudited)
Estimated Proved Oil, Natural Gas, and Natural Gas Liquid Reserves
The reserve estimates as of December 31, 20172019 and 20162018 presented herein were made in accordance with oil and gas reserve estimation and disclosure authoritative accounting guidance.
Proved oil, natural gas, and natural gas liquid reserves as of December 31, 20172019 and 20162018 were calculated based on the prices for oil, natural gas, and natural gas liquids during the twelve-month period before the reporting date, determined as an un-weighted arithmetic average of the first-day-of-the month price for each month within such period. This average price is also used in calculating the aggregate amount and changes in future cash inflows related to the standardized measure of discounted future cash flows. Undrilled locations can be classified as having proved undeveloped reserves only if a development plan has been adopted indicating that they are scheduled to be drilled within five years, unless the specific circumstances justify a longer time. SEC rules dictate the types of technologies that a company may use to establish reserve estimates, including the extraction of non-traditional resources, such as bitumen extracted from oil sands as well as oil and gas extracted from shales.
Our estimates of our net proved, net proved developed, and net proved undeveloped oil, gas and natural gas liquids reserves and changes in our net proved oil, natural gas, and natural gas liquid reserves for 20172019 and 20162018 are presented in the table below. Proved oil, natural gas, and natural gas liquid reserves are those quantities of oil and gas, which, by analysis of geoscience and engineering data, can be estimated with reasonable certainty to be economically producible from a given date forward, from known reservoirs, and under existing economic conditions, operating methods, and government regulation before the time at which contracts providing the right to operate expire, unless evidence indicates that renewal is reasonably certain. Existing economic conditions include the average prices for oil and gas during the twelve-month period prior to the reporting date of December 31, 20172019 and 20162018 unless prices are defined by contractual arrangements, excluding escalations based upon future conditions. Prices do not include the effects of commodity derivatives. The independent engineering firm, Cawley, Gillespie & Associates, Inc. (“CGA”) evaluated and prepared independent estimated proved reserves quantities and related pre-tax future cash flows as of December 31, 20172019 and 2016.2018. To facilitate the preparation of an independent reserve study, we provided CGA our reserve database and related supporting technical, economic, production and ownership information. Estimated reserves and related pre-tax future cash flows for the non-controlling interests of the consolidated partnerships included in our consolidated financial statements were based on CGA’s estimated reserves and related pre-tax future cash flows for the specific properties in the partnerships and have been added to CGA’s reserve estimates for December 31, 20172019 and 2016. See Note 3 for additional information.2018.
Proved developed oil and gas reserves are proved reserves that can be expected to be recovered (i) through existing wells with existing equipment and operating methods or in which the cost of the required equipment is relatively minor compared with the cost of a new well or (ii) through installed extraction equipment and infrastructure operational at the time of the reserves estimate if the extraction is by means not involving a well.
Proved undeveloped oil and gas reserves are proved reserves that are expected to be recovered from new wells on undrilled acreage, or from existing wells where a relatively major expenditure is required for recompletion.
As of December 31, 2017, we held a 17.81% and 27.24% proportionate share of Carbon California and Carbon Appalachia, respectively. This proportionate share amount reflects our aggregated sharing percentage based on all classes of ownership held in each equity investee. These proportionate share amounts assume each equity investee is operating as a going concern, and no adjustments have been made that could be required based on priority of units and hurdle rates upon liquidation or distributions.
A summary of the changes in quantities of proved oil, natural gas, and natural gas liquid reserves for the years ended December 31, 20172019 and 20162018 are as follows (in thousands):
| Company | Company’s share of Carbon California | Company’s share of Carbon Appalchia | Total | |||||||||||||||||||||||||||||||||||||||||||||||||||||
| Oil | Natural Gas | Total | Oil | Natural Gas | NGL | Total | Oil | Natural Gas | Total | Oil | Natural Gas | NGL | Total | |||||||||||||||||||||||||||||||||||||||||||
| MBbls | MMcf | MMcfe | MBbls | MMcf | (MBbls) | MMcfe | MBbls | MMcf | MMcfe | MBbls | MMcf | (MBbls) | MMcfe | |||||||||||||||||||||||||||||||||||||||||||
| January 1, 2016 | ||||||||||||||||||||||||||||||||||||||||||||||||||||||||
| Proved reserves, beginning of year | 598 | 29,958 | 33,546 | - | - | - | - | - | - | - | 598 | 29,958 | - | 33,546 | ||||||||||||||||||||||||||||||||||||||||||
| Revisions of previous estimates | 110 | 2,207 | 2,867 | - | - | - | - | - | - | - | 110 | 2,207 | - | 2,867 | ||||||||||||||||||||||||||||||||||||||||||
| Extensions and discoveries | - | - | - | - | - | - | - | - | - | - | - | - | - | - | ||||||||||||||||||||||||||||||||||||||||||
| Production | (79 | ) | (2,823 | ) | (3,297 | ) | - | - | - | - | - | - | - | (79 | ) | (2,823 | ) | - | (3,297 | ) | ||||||||||||||||||||||||||||||||||||
| Purchases of reserves in-place | 253 | 44,923 | 46,441 | - | - | - | - | - | - | - | 253 | 44,923 | - | 46,441 | ||||||||||||||||||||||||||||||||||||||||||
| Sales of reserves in-place | - | - | - | - | - | - | - | - | - | - | - | - | - | - | ||||||||||||||||||||||||||||||||||||||||||
| December 31, 2016 | 882 | 74,265 | 79,557 | - | - | - | - | - | - | - | 882 | 74,265 | - | 79,557 | ||||||||||||||||||||||||||||||||||||||||||
| Revisions of previous estimates | 107 | 12,195 | 12,835 | - | - | - | - | - | - | 107 | 12,195 | - | 12,837 | |||||||||||||||||||||||||||||||||||||||||||
| Extensions and discoveries | 16 | 138 | 232 | - | - | - | - | - | - | 16 | 138 | - | 234 | |||||||||||||||||||||||||||||||||||||||||||
| Production (2) | (86 | ) | (4,896 | ) | (5,414 | ) | (25 | ) | (63 | ) | (4 | ) | (237 | ) | (2 | ) | (1,178 | ) | (1,328 | ) | (136 | ) | (4,984 | ) | (4 | ) | (5,824 | ) | ||||||||||||||||||||||||||||
| Purchases of reserves in-place (1) | - | - | - | 1,650 | 3,075 | 231 | 14,361 | 74 | 91,935 | 101,835 | 3,300 | 4,725 | 231 | 25,911 | ||||||||||||||||||||||||||||||||||||||||||
| Sales of reserves in-place | - | - | - | - | - | - | - | - | - | - | - | - | ||||||||||||||||||||||||||||||||||||||||||||
| December 31, 2017 | 919 | 81,702 | 87,210 | 1,625 | 3,012 | 227 | 14,124 | 72 | 90,757 | 100,507 | 4,169 | 86,339 | 227 | 112,715 | ||||||||||||||||||||||||||||||||||||||||||
| 2017 | 2016 | |||||||||||||||||||||||||||||||
| Oil (MBbls) | Natural Gas (MMcf) | NGL (MBbls) | Total (MMcfe) | Oil (MBbls) | Natural Gas (MMcf) | NGL (MBbls) | Total (MMcfe) | |||||||||||||||||||||||||
| Company | ||||||||||||||||||||||||||||||||
| Proved developed reserves at: | ||||||||||||||||||||||||||||||||
| End of Year | 903 | 81,702 | - | 87,120 | 851 | 74,265 | - | 79,557 | ||||||||||||||||||||||||
| Proved undeveloped reserves at: | ||||||||||||||||||||||||||||||||
| End of Year | 16 | - | - | 96 | 31 | - | - | 186 | ||||||||||||||||||||||||
| Company’s share of Carbon California | ||||||||||||||||||||||||||||||||
| Proved developed reserves at: | ||||||||||||||||||||||||||||||||
| End of Year | 1,006 | 2,194 | 163 | 9,208 | - | - | - | - | ||||||||||||||||||||||||
| Proved undeveloped reserves at: | ||||||||||||||||||||||||||||||||
| End of Year | 619 | 818 | 63 | 4,910 | - | - | - | - | ||||||||||||||||||||||||
| Company’s share of Carbon Appalachia | ||||||||||||||||||||||||||||||||
| Proved developed reserves at: | ||||||||||||||||||||||||||||||||
| End of Year (1) (2) | 72 | 90,757 | - | 91,189 | - | - | - | - | ||||||||||||||||||||||||
| Proved undeveloped reserves at: | ||||||||||||||||||||||||||||||||
| End of Year | - | - | - | - | - | - | - | - | ||||||||||||||||||||||||
| Total | ||||||||||||||||||||||||||||||||
| Proved developed reserves at: | - | |||||||||||||||||||||||||||||||
| End of Year | 1,981 | 174,653 | 163 | 187,517 | 851 | 74,265 | - | 79,557 | ||||||||||||||||||||||||
| Proved undeveloped reserves at: | - | |||||||||||||||||||||||||||||||
| End of Year | 635 | 818 | 63 | 5,006 | 31 | - | - | 186 | ||||||||||||||||||||||||
| 2017 | 2016 | |||||||||||||||||||||||
| Oil | Natural Gas | Total | Oil | Natural Gas | Total | |||||||||||||||||||
| MBbls | MMcf | MMcfe | MBbls | MMcf | MMcfe | |||||||||||||||||||
| Proved reserves, beginning of year | 882 | 74,265 | 79,557 | 598 | 29,958 | 33,546 | ||||||||||||||||||
| Revisions of previous estimates | 107 | 12,195 | 12,837 | 110 | 2207 | 2867 | ||||||||||||||||||
| Extensions and discoveries | 16 | 138 | 234 | - | - | - | ||||||||||||||||||
| Production | (86 | ) | (4,896 | ) | (5,412 | ) | (79 | ) | (2,823 | ) | (3,297 | ) | ||||||||||||
| Purchases of reserves in-place (1) (2) | - | - | - | 253 | 44,923 | 46,441 | ||||||||||||||||||
| Sales of reserves in-place | - | - | - | - | - | - | ||||||||||||||||||
| Proved reserves, end of year | 919 | 81,702 | 87,216 | 882 | 74,265 | 79,557 | ||||||||||||||||||
| Proved developed reserves at: | ||||||||||||||||||||||||
| End of Year | 903 | 81,702 | 87,120 | 882 | 74,265 | 79,371 | ||||||||||||||||||
| Proved undeveloped reserves at: | ||||||||||||||||||||||||
| End of Year | 16 | - | 96 | 31 | - | 186 | ||||||||||||||||||
| 2019 | 2018 | |||||||||||||||||||||||||||||||
| Oil | Natural Gas | NGL | Total | Oil | Natural Gas | NGL | Total | |||||||||||||||||||||||||
| MBbls | MMcf | MBbls | MMcfe | MBbls | MMcf | MBbls | MMcfe | |||||||||||||||||||||||||
| Proved reserves, beginning of year | 18,898 | 455,400 | 1,923 | 580,326 | 919 | 81,702 | - | 87,216 | ||||||||||||||||||||||||
| Revisions of previous estimates | (1,362 | ) | 24,194 | (618 | ) | 12,310 | (2,803 | ) | 1,832 | (1,147 | ) | (21,868 | ) | |||||||||||||||||||
| Extensions and discoveries | 826 | 1,187 | 77 | 6,605 | - | - | - | - | ||||||||||||||||||||||||
| Production | (589 | ) | (21,436 | ) | (36 | ) | (25,182 | ) | (451 | ) | (4,798 | ) | (33 | ) | (7,702 | ) | ||||||||||||||||
| Purchases of reserves in-place | - | - | - | - | 21,233 | 376,664 | 3,103 | 522,680 | ||||||||||||||||||||||||
| Sales of reserves in-place | (31 | ) | (8,980 | ) | - | (9,166 | ) | - | - | - | - | |||||||||||||||||||||
| Proved reserves, end of year | 17,742 | 450,365 | 1,346 | 564,893 | 18,898 | 455,400 | 1,923 | 580,326 | ||||||||||||||||||||||||
| Proved developed reserves at: | ||||||||||||||||||||||||||||||||
| End of year | 12,972 | 444,104 | 936 | 527,555 | 14,336 | 450,424 | 1,472 | 545,272 | ||||||||||||||||||||||||
| Proved undeveloped reserves at: | ||||||||||||||||||||||||||||||||
| End of year | 4,770 | 6,261 | 410 | 37,338 | 4,562 | 4,976 | 451 | 35,054 | ||||||||||||||||||||||||
The estimated proved reserves for December 31, 20172019 and 20162018 includes approximately 3.03.4 Bcfe and 3.13.3 Bcfe, respectively, attributed to non-controlling interests of consolidated partnerships.
Aggregate Capitalized Costs
The aggregate capitalized costs relating to oil and gas producing activities at the end of each of the years indicated were as follows:
| 2017 | 2016 | |||||||
| (in thousands) | ||||||||
| Oil and gas properties | ||||||||
| Company | ||||||||
| Proved oil and gas properties | $ | 114,893 | $ | 112,579 | ||||
| Unproved properties not subject to depletion | 1,947 | 1,999 | ||||||
| Accumulated depreciation, depletion, amortization and impairment | (80,715 | ) | (78,596 | ) | ||||
| Total Company oil and gas properties, net | $ | 36,125 | $ | 35,982 | ||||
| Company’s share of Carbon California | ||||||||
| Proved oil and gas properties | $ | 7,635 | $ | - | ||||
| Unproved properties not subject to depletion | 266 | - | ||||||
| Accumulated depreciation, depletion, amortization and impairment | (208 | ) | - | |||||
| Total Company’s share of Carbon California oil and gas properties, net | $ | 7,693 | $ | - | ||||
| Company’s share of Carbon Appalachia | ||||||||
| Proved oil and gas properties | $ | 22,951 | $ | - | ||||
| Unproved properties not subject to depletion | 485 | - | ||||||
| Accumulated depreciation, depletion, amortization and impairment | (445 | ) | - | |||||
| Total Company’s share of Carbon Appalachia oil and gas properties, net | $ | 22,991 | $ | - | ||||
| (in thousands) | 2019 | 2018 | ||||||
| Oil and gas properties: | ||||||||
| Proved oil and gas properties | $ | 351,488 | $ | 347,059 | ||||
| Unproved properties | 4,872 | 5,416 | ||||||
| Accumulated depreciation, depletion, amortization and impairment | (109,344 | ) | (98,604 | ) | ||||
| Total | $ | 247,016 | $ | 253,871 | ||||
Costs Incurred in Oil and Gas Property Acquisition, Exploration, and Development Activities
The following costs were incurred in oil and gas property acquisition, exploration, and development activities during the years ended December 31, 20172019 and 2016:2018:
| (in thousands) | 2019 | 2018 | ||||||||||||||
| 2017 | 2016 | |||||||||||||||
| (in thousands) | ||||||||||||||||
| Company | ||||||||||||||||
| Property acquisition costs: | ||||||||||||||||
| Unevaluated properties | $ | 1 | $ | 97 | $ | - | $ | 3,464 | ||||||||
| Proved properties and gathering facilities | 289 | 8,117 | - | 63,517 | ||||||||||||
| Development costs | 952 | 360 | 7,676 | 2,074 | ||||||||||||
| Gathering facilities | 43 | 42 | - | 460 | ||||||||||||
| Asset retirement obligation | 2,309 | 1,849 | ||||||||||||||
| Total costs incurred | $ | 3,594 | $ | 10,465 | ||||||||||||
| Company’s share of Carbon California | ||||||||||||||||
| Property acquisition costs: | ||||||||||||||||
| Unevaluated properties | $ | 266 | $ | - | ||||||||||||
| Proved properties and gathering facilities | 7,682 | - | ||||||||||||||
| Development costs | 412 | - | ||||||||||||||
| Gathering facilities | 47 | - | ||||||||||||||
| Asset retirement obligation | 483 | - | ||||||||||||||
| Total costs incurred | $ | 8,890 | $ | - | ||||||||||||
| Company’s share of Carbon Appalachia | ||||||||||||||||
| Property acquisition costs: | ||||||||||||||||
| Unevaluated properties | $ | 483 | $ | - | ||||||||||||
| Proved properties and gathering facilities | 19,286 | - | ||||||||||||||
| Development costs | 24 | - | ||||||||||||||
| Gathering facilities | 2,544 | - | ||||||||||||||
| Asset retirement obligation | 3,592 | - | ||||||||||||||
| Total costs incurred | $ | 25,929 | $ | - | ||||||||||||
| Asset retirement obligations | - | 14,085 | ||||||||||||||
| Total | $ | 7,676 | $ | 83,600 | ||||||||||||
Our investment in unproved properties as of December 31, 2017,2019, by the year in which such costs were incurred is set forth in the table below:
| 2017 | 2016 | 2015 and Prior | ||||||||||
| (in thousands) | ||||||||||||
| Acquisition costs | ||||||||||||
| Company | $ | 1 | $ | 97 | $ | 1,849 | ||||||
| Company’s share of Carbon California | 266 | - | - | |||||||||
| Company’s share of Carbon Appalachia | 485 | - | - | |||||||||
| Total acquisition costs | $ | 752 | $ | 97 | $ | 1,849 | ||||||
| (in thousands) | 2019 | 2018 | 2017 and Prior | |||||||||
| Acquisition costs | $ | 496 | $ | 3,464 | $ | 912 | ||||||
Results of Operations from Oil and Gas Producing Activities
Results of operations from oil and gas producing activities for the years ended December 31, 20172019 and 20162018 are presented below:
| (in thousands) | ||||||||
| 2017 | 2016 | |||||||
| Revenues | ||||||||
| Oil and gas sales, including commodity derivative gains and losses | ||||||||
| Company | $ | 22,439 | $ | 8,184 | ||||
| Company’s share of Carbon California | $ | 1,289 | $ | - | ||||
| Company’s share of Carbon Appalachia | 5,273 | - | ||||||
| Total oil and gas sales, including commodity derivative gains and losses | 29,001 | 8,184 | ||||||
| Expenses: | ||||||||
| Production expenses | ||||||||
| Company | 9,589 | 5,640 | ||||||
| Company’s share of Carbon California | 664 | - | ||||||
| Company’s share of Carbon Appalachia | 1,522 | - | ||||||
| Total production expenses | 11,775 | 5,640 | ||||||
| Depletion expense | ||||||||
| Company | 2,157 | 1,839 | ||||||
| Company’s share of Carbon California | 208 | - | ||||||
| Company’s share of Carbon Appalachia | 445 | - | ||||||
| Total depletion expense | 2,810 | 1,839 | ||||||
| Accretion of asset retirement obligations | ||||||||
| Company | 307 | 176 | ||||||
| Company’s share of Carbon California | 34 | - | ||||||
| Company’s share of Carbon Appalachia | 54 | - | ||||||
| Total accretion of asset obligation | 395 | 176 | ||||||
| Impairment of oil and gas properties | ||||||||
| Company | - | 4,299 | ||||||
| Company’s share of Carbon California | - | - | ||||||
| Company’s share of Carbon Appalachia | - | - | ||||||
| Total accretion of asset obligation | - | 4,299 | ||||||
| Total expenses | 14,979 | 11,954 | ||||||
| Results of operations from oil and gas producing activities | $ | 14,021 | $ | (3,770 | ) | |||
| Depletion rate per Mcfe | $ | 0.47 | $ | 0.56 | ||||
| (in thousands) | 2019 | 2018 | ||||||
| Revenues: | ||||||||
| Oil, gas and NGL sales, including commodity derivative gains and losses | $ | 96,885 | $ | 52,946 | ||||
| Expenses: | ||||||||
| Production expenses | 41,307 | 22,226 | ||||||
| Depletion expense | 14,062 | 7,305 | ||||||
| Accretion of asset retirement obligations | 1,625 | 868 | ||||||
| Total expenses | 56,994 | 30,399 | ||||||
| Results of operations from oil and gas producing activities | $ | 39,891 | $ | 22,547 | ||||
| Depletion rate per Mcfe | $ | 0.56 | $ | 0.89 | ||||
Standardized Measure of Discounted Future Net Cash Flows
Future oil and gas sales are calculated applying the prices used in estimating our proved oil and gas reserves to the year-end quantities of those reserves. Future price changes were considered only to the extent provided by contractual arrangements in existence at each year-end. Future production and development costs, which include costs related to plugging of wells, removal of facilities and equipment, and site restoration, are calculated by estimating the expenditures to be incurred in producing and developing the proved oil and gas reserves at the end of each year, based on year-end costs and assuming continuation of existing economic conditions. Future income tax expenses are computed by applying the appropriate year-end statutory tax rates to the estimated future pretax net cash flows relating to proved oil and gas reserves, less the tax basis of the properties involved. The future income tax expenses give effect to tax deductions, credits, and allowances relating to the proved oil and gas reserves. Carbon California and Carbon Appalachia does not include the future net effect of income taxes because Carbon California and Carbon Appalachia is treated as partnerships for tax purposes and is not subject to federal income taxes. All cash flow amounts, including income taxes, are discounted at 10%.
Changes in the demand for oil and natural gas, inflation, and other factors make such estimates inherently imprecise and subject to substantial revision. This table should not be construed to be an estimate of the current market value of our proved reserves. Management does not rely upon the information that follows in making investment decisions.
| (in thousands) | December 31, | |||||||
| 2017 | 2016 | |||||||
| Company: | ||||||||
| Future cash inflows | $ | 283,664 | $ | 214,658 | ||||
| Future production costs | (119,501 | ) | (103,252 | ) | ||||
| Future development costs | (210 | ) | (315 | ) | ||||
| Future income taxes | (35,482 | ) | (14,858 | ) | ||||
| Future net cash flows | 128,471 | 96,233 | ||||||
| 10% annual discount | (71,389 | ) | (51,522 | ) | ||||
| Standardized measure of discounted future net cash flows | $ | 57,082 | $ | 44,711 | ||||
| Company’s share of Carbon California | ||||||||
| Future cash inflows | $ | 97,841 | $ | - | ||||
| Future production costs | (62,187 | ) | - | |||||
| Future development costs | (5,809 | ) | - | |||||
| Future income taxes (2) | - | - | ||||||
| Future net cash flows | 29,845 | - | ||||||
| 10% annual discount | (16,288 | ) | - | |||||
| Standardized measure of discounted future net cash flows | $ | 13,557 | $ | - | ||||
| Company’s share of Carbon Appalachia | ||||||||
Future cash inflows (1) (4) | $ | 271,638 | $ | - | ||||
| Future production costs (1) | (151,501 | ) | - | |||||
| Future development costs (1) | (27 | ) | - | |||||
| Future income taxes (3) | - | - | ||||||
| Future net cash flows | 120,110 | - | ||||||
| 10% annual discount | (73,890 | ) | - | |||||
| Standardized measure of discounted future net cash flows | $ | 46,220 | $ | - | ||||
| December 31, | ||||||||
| (in thousands) | 2019 | 2018 | ||||||
| Future cash inflows | $ | 2,212,049 | $ | 2,878,392 | ||||
| Future production costs | (1,306,608 | ) | (1,538,870 | ) | ||||
| Future development costs | (77,952 | ) | (76,852 | ) | ||||
| Future income taxes | (146,951 | ) | (258,277 | ) | ||||
| Future net cash flows | 680,538 | 1,004,393 | ||||||
| 10% annual discount | (408,690 | ) | (612,325 | ) | ||||
| Standardized measure of discounted future net cash flows | $ | 271,848 | $ | 392,068 | ||||
Changes in the Standardized Measure of Discounted Future Net Cash Flows Relating to Proved Oil and Gas Reserves
An analysis of the changes in the standardized measure of discounted future net cash flows during each of the last two years is as follows:
| December 31, | ||||||||||||||||
| Company | Company’s Share of Carbon California | Company’s Share of Carbon Appalachia | Total | |||||||||||||
| (in thousands) | ||||||||||||||||
| Balance at January 1, 2016 | ||||||||||||||||
| Standardized measure of discounted future net cash flows, beginning of year | $ | 25,032 | $ | - | $ | - | $ | 25,032 | ||||||||
| Sales of oil and gas, net of production costs and taxes | (4,804 | ) | - | - | (4,804 | ) | ||||||||||
| Price revisions | (786 | ) | - | - | (786 | ) | ||||||||||
| Extensions, discoveries and improved recovery, less related costs | - | - | - | - | ||||||||||||
| Changes in estimated future development costs | 248 | - | - | 248 | ||||||||||||
| Development costs incurred during the period | 102 | - | - | 102 | ||||||||||||
| Quantity revisions | 2,091 | - | - | 2,091 | ||||||||||||
| Accretion of discount | 2,503 | - | - | 2,503 | ||||||||||||
| Net changes in future income taxes | (4,633 | ) | - | - | (4,633 | ) | ||||||||||
| Purchases of reserves-in-place | 26,776 | - | - | 26,776 | ||||||||||||
| Sales of reserves-in-place | - | - | - | - | ||||||||||||
| Changes in production rate timing and other | (1,818 | ) | - | - | (1,818 | ) | ||||||||||
| Balance at December 31, 2016 | $ | 44,711 | $ | - | $ | - | $ | 44,711 | ||||||||
| Sales of oil and gas, net of production costs and taxes (4) | (10,038 | ) | (516 | ) | (1,240 | ) | (12,231 | ) | ||||||||
| Price revisions | 17,588 | - | - | 17,588 | ||||||||||||
| Extensions, discoveries and improved recovery, less related costs | 298 | - | - | 298 | ||||||||||||
| Changes in estimated future development costs | (324 | ) | - | - | (324 | ) | ||||||||||
| Development costs incurred during the period | 804 | - | - | 804 | ||||||||||||
| Quantity revisions | 11,196 | - | - | 11,196 | ||||||||||||
| Accretion of discount | 4,471 | - | - | 4,471 | ||||||||||||
| Net changes in future income taxes (2) (3) | (7,425 | ) | - | - | (7,425 | ) | ||||||||||
| Purchases of reserves-in-place (1) | - | 14,073 | 47,460 | 61,533 | ||||||||||||
| Sales of reserves-in-place | - | - | - | - | ||||||||||||
| Changes in production rate timing and other | (4,199 | ) | - | - | (4,199 | ) | ||||||||||
| Standardized measure of discounted future net cash flows, atDecember 31, 2017 | $ | 57,082 | $ | 13,557 | $ | 46,220 | $ | 116,422 | ||||||||
| December 31, | ||||||||
| (in thousands) | 2019 | 2018 | ||||||
| Standardized measure of discounted future net cash flows, beginning of period | $ | 392,068 | $ | 57,082 | ||||
| Sales of oil and gas, net of production costs and taxes | (49,746 | ) | (25,681 | ) | ||||
| Price revisions | (158,799 | ) | 133,789 | |||||
| Extensions, discoveries and improved recovery, less related costs | 10,822 | - | ||||||
| Changes in estimated future development costs | (3,041 | ) | (32,711 | ) | ||||
| Development costs incurred during the period | 6,685 | 926 | ||||||
| Quantity revisions | 5,565 | (23,484 | ) | |||||
| Accretion of discount | 39,207 | 5,708 | ||||||
| Net changes in future income taxes | 39,929 | (89,117 | ) | |||||
| Purchases of reserves-in-place | - | 391,877 | ||||||
| Sales of reserves-in-place | (4,004 | ) | - | |||||
| Changes in production rate timing and other | (6,838 | ) | (26,321 | ) | ||||
| Standardized measure of discounted future net cash flows, end of period | $ | 271,848 | $ | 392,068 | ||||
The twelve-month weighted averaged adjusted prices in effect at December 31, 20172019 and 20162018 were as follows:
| 2017 | 2016 | 2019 | 2018 | |||||||||||||
| Oil (per Bbl) | $ | 51.34 | $ | 40.40 | $ | 55.69 | $ | 65.56 | ||||||||
| Natural Gas (per Mcf) | $ | 2.98 | $ | 2.41 | $ | 2.58 | $ | 3.10 | ||||||||
Item 9. Changes in and Disagreements with Accountants on Accounting and Financial Disclosure
None.
Item 9A. Controls and Procedures
Evaluation of Disclosure Controls and Procedures.
We have established disclosure controls and procedures to ensure that material information relating to us and our consolidated subsidiaries is made known to the officers who certify our financial reports and the Board of Directors.
Our Chief Executive Officer, Patrick R. McDonald, and our Chief Financial Officer, Kevin D. Struzeski, evaluated the effectiveness of our disclosure controls and procedures, as defined in Rules 13a-15(e) and 15d-15(e) under the Exchange Act, as of the end of the period covered by this Annual Report on Form 10-K (the “Evaluation Date”).10-K. Based on this evaluation, they believe that as of the Evaluation DateDecember 31, 2019, our disclosure controls and procedures were effective to ensure that information required to be disclosed by us in the reports we file or submit under the Exchange Act (i) is recorded, processed, summarized, and reported within the time periods specified in the SEC’s rules and forms;forms and (ii) is accumulated and communicated to our management, including the Chief Executive Officer and Chief Financial Officer, as appropriate, to allow timely decisions regarding required disclosures.
Changes in Internal Control Over Financial Reporting.
There were no changes in our internal control over financial reporting during the year ended December 31, 2017 that materially affected, or are reasonably likely to materially affect, our internal control over financial reporting.
Management’s Annual Report on Internal Control Over Financial Reporting
Our management is responsible for establishing and maintaining adequate internal control over financial reporting as defined in Rules 13a-15(f) and 15d-15(f) under the Securities Exchange Act of 1934.
Our internal controls over financial reporting are intended to provide reasonable assurance regarding the reliability of financial reporting and the preparation of financial statements for external purposes in accordance with GAAP. Our internal controls over financial reporting are expected to include those policies and procedures that management believes are necessary that:
As of December 31, 2017,2019, management assessed the effectiveness of our internal control over financial reporting based on the criteria set forth inInternal Control-Integrated Framework (2013)issued by the Committee of Sponsoring Organizations of the Treadway Commission. Because of its inherent limitations, internal control over financial reporting is not intended to provide absolute assurance that a misstatement of our financial statements would be prevented or detected. Based on this assessment, our management believesconcluded that as of December 31, 2017, our internal control over financial reporting was effective based on these criteria.as of December 31, 2019 to provide reasonable assurance regarding the reliability of financial reporting and the preparation of financial statements in accordance with GAAP.
This Annual Report does not include an attestation report of our independent registered public accounting firm regarding internal control over financial reporting due to the permanent exemption from such requirement forrelief accorded to smaller reporting companies.companies in the Dodd-Frank Act.
Changes in Internal Control Over Financial Reporting.
A control system,There were no matter how well conceived and operated, can provide only reasonable, not absolute, assurance that the objectives of thechanges in our internal control system are met. Because ofover financial reporting that occurred during the inherent limitations of anyquarter ended December 31, 2019, that has materially affected, or is reasonably likely to materially affect, our internal control system, no evaluation of controls can provide assurance that all control issues, if any, within a company have been detected.over financial reporting.
None.
Item 10. Directors, Executive Officers and Corporate Governance
The following sets forth information regarding our directors and officers:
Executive Officer/Director
Patrick R. McDonald. Mr. McDonaldrequired by Item 10 is our Chief Executive Officer and has been Chief Executive Officer, President and Director of Nytis USA since 2004. From 1998incorporated by reference to 2003, Mr. McDonald was Chief Executive Officer, President and Director of Carbon Energy Corporation, an oil and gas exploration and production company which in 2003 was merged with Evergreen Resources, Inc. From 1987 to 1997 Mr. McDonald was Chief Executive Officer, President and Director of Interenergy Corporation, a natural gas gathering, processing and marketing company which in December 1997 was merged with KN Energy Inc. Prior to that he worked as an exploration geologist with Texaco International Exploration Company where he was responsible for oil and gas exploration effortsthe information provided in the Middle East and Far East. Mr. McDonald served as Chief Executive Officer of Forest Oil Corporation from June 2012 untilCompany’s information statement for the completion of its business combination with Sabine Oil & Gas in December 2014. Mr. McDonald is Chairman of the Board of Prairie Provident Resources (TSX: PPR), an exploration and production company based in Calgary, Alberta, Canada. Mr. McDonald received a Bachelor’s degree in both Geology and Economics from Ohio Wesleyan University and a Masters degree in Business Administration (Finance) from New York University. Mr. McDonald is a Certified Petroleum Geologist and is a member of the American Association of the Petroleum Geologists and of the Canadian Society of Petroleum Geologists.
Our Board of Directors believes that Mr. McDonald, as our Chief Executive Officer and as the founder of Nytis USA, should serve as a director because of his unique understanding of the opportunities and challenges that we face and his in-depth knowledge about the oil and natural gas business, and our long-term growth strategies.
Other Directors
The following information pertains to our non-employee directors, their principal occupations and other public company directorships for at least the last five years and information regarding their specific experiences, qualifications, attributes and skills.
James H. Brandi. Mr. Brandi has been a Director since March 2012 and Chairman of the Board since October 2012. Mr. Brandi retired from a position as Managing Director of BNP Paribas Securities Corp., an investment banking firm, where he served from 2010 until late 2011. From 2005 to 2010, Mr. Brandi was a partner of Hill Street Capital, LLC, a financial advisory and private investment firm which was purchased by BNP Paribas in 2010. From 2001 to 2005, Mr. Brandi was a Managing Director at UBS Securities, LLC, where he was the Deputy Global Head of the Energy and Power Groups. Prior to 2001, Mr. Brandi was a Managing Director at Dillon, Read & Co. Inc. and later its successor firm, UBS Warburg, concentrating on transactions in the energy and consumer goods areas. Mr. Brandi as a director of OGE Energy Corp (NYSE: OGE) and served as a director of Approach Resource, Inc. Mr. Brandi is a trustee of The Kenyon Review.
Our Board of Directors believes that Mr. Brandi should serve as director and our Chairman because of his experience on the board of directors of other public companies, which our Board believes is beneficial to us as a public company. He also has extensive financial expertise from his education background (Harvard MBA) and his 35 year career in investment banking. His background contributes to the Board of Directors’ oversight responsibility regarding the quality and integrity of our accounting and financial reporting process and the auditing of our financial statements.
David H. Kennedy. Mr. Kennedy has been a Director since December 2014 and previously served as a director of us from February 2011 to March 2012. Mr. Kennedy has served as Executive Advisor to Cadent Energy Partners since 2005. He was director and chairman of the audit committee of Logan International Inc. from 2006 until the sale of the company in 2016. From 2001 - 2004, Mr. Kennedy served as an advisor to RBC Energy Fund and served on the boards of several of its portfolio companies. From 1999 to 2003, Mr. Kennedy was a director of Carbon Energy Corporation before its merger with Evergreen Resources in 2003. From 1996 to 2006, Mr. Kennedy was a director and chairman of the Audit Committee of Maverick Tube Corporation, which was sold to Tenaris SA in 2006. He was a managing director of First Reserve Corporation from its founding in 1981 until 1998, serving on numerous boards of its portfolio companies. From 1974 to 1981, Mr. Kennedy was with Price Waterhouse in San Francisco and New York in audit and tax services before leaving to join First Reserve. He was a Certified Public Accountant.
Our Board of Directors believes that Mr. Kennedy should serve as director because of his current and prior experience as a director of us together with his experience on the board of directors of other public companies. His energy industry knowledge and financial expertise is important in his role as Chairman of the Audit Committee and its oversight responsibility regarding the quality and integrity of our accounting and financial reporting process and the auditing of our financial statements.
Bryan H. Lawrence. Mr. Lawrence has been a Director since February 2011 and of Nytis USA since 2005. Mr. Lawrence is a founder and member of Yorktown Partners LLC which was established in September 1990. Yorktown Partners LLC is the manager of private equity partnerships that invest in the energy industry. Mr. Lawrence had been employed at Dillon, Read & Co. Inc. since 1966, serving as a Managing Director until the merger of Dillon Read with SBC Warburg in September 1997. Mr. Lawrence also serves as a Director of Star Gas Partners, L.P. (NYSE:SGU), Hallador Energy Company (NASDAQ:HNRG) and certain non-public companies in the energy industry in which Yorktown partnerships hold equity interests. Mr. Lawrence served as a director of Approach Resources, Inc., Carbon Energy Corporation and Interenergy Corporation.
Our Board of Directors believes that Mr. Lawrence should serve as a director because of his experience on the board of directors of other public companies, which our Board of Directors believes is beneficial to us as a public company, as well as Mr. Lawrence’s relevant business experience in the energy industry and his extensive financial expertise, which he has acquired through his years of experience in the investment banking industry.
Peter A. Leidel. Mr. Leidel has been a Director since February 2011 and of Nytis USA since 2005. Mr. Leidel is a founder and member of Yorktown Partners LLC which was established in September 1990. Yorktown Partners LLC is the manager of private equity partnerships that invest in the energy industry. Previously, he was a Senior Vice President of Dillon, Read & Co. Inc. He was previously employed in corporate treasury positions at Mobil Corporation and worked for KPMG Peat Marwick and the U.S. Patent and Trademark Office. Mr. Leidel is a director of Mid-Con Energy Partners, L.P. (NASDAQ:MCEP), Extraction Oil & Gas, Inc. (NASDAQ: XOG) and certain non-public companies in the energy industry in which Yorktown partnerships hold equity interests. Mr. Leidel served as a director of Carbon Energy Corporation and Interenergy Corporation. He was a Certified Public Accountant.
Our Board of Directors believes that Mr. Leidel should serve as a director because of his significant knowledge of our industry, his prior experience with our business and his financial expertise, which is important as our Board of Directors exercises its oversight responsibility regarding the quality and integrity of our accounting and financial reporting processes and the auditing of our financial statements.
Edwin H. Morgens. Mr. Morgens has been a Director since May 2012. Mr. Morgens is Chairman and Co-founder of Morgens, Waterfall, Vintiadis & Company, Inc., a New York City investment firm that he founded in 1967. He is a former director of Wayside Technology Group, Inc., TransMontaigne, Inc., Sheffield Exploration, Scientific American Magazine Inc. and the Henry J. Kaiser Family Foundation. He is currently a trustee of the American Museum of Natural History, an Overseer of the Weill Cornell Medical College and emeritus trustee of Cornell University.
Our Board of Directors believes that Mr. Morgens should serve as director because of his current and prior experience on the board of directors of other public companies and his extensive financial expertise, which he has acquired through his years of experience in the financial investment advisory industry.
Other Executive Officers
Mark D. Pierce. Mr. Pierce has been President since October 2012 and was Senior Vice President for Nytis LLC from 2009 to 2012. From 2005 until 2009, he was Operations Manager for Nytis LLC. He began his career at Texaco, Inc. in 1975 and from 1977 until 1997 was employed by Ashland Exploration, Inc. attaining the position of Vice President Eastern Region and Gas Marketing. His experience includes both domestic and international work. He is a registered Petroleum Engineer in Kentucky, West Virginia and Ohio.
Kevin D. Struzeski. Mr. Struzeski has served as Treasurer and Secretary since 2011 and has been the Chief Financial Officer, Treasurer and Secretary of Nytis USA since 2005. From 2003 to 2004, Mr. Struzeski was the Director of Treasury at Evergreen Resources, Inc., and from 1998 to 2003, he was Chief Financial Officer, Secretary and Treasurer of Carbon Energy Corporation. Mr. Struzeski was also Chief Financial Officer, Secretary and Treasurer of Carbon Energy Canada Corporation. Mr. Struzeski served as Accounting Manager for Media One Group from 1997 to 1998 and prior to that was employed as Controller for Interenergy Corporation from 1995 to 1997. Mr. Struzeski is a Certified Public Accountant.
Composition of our Board of Directors
Our Board of Directors currently consists of six directors, each of whom is elected annually at the2020 annual meeting of our stockholders or through the affirmative vote of the holders of a majority of our voting stock in lieu of a meeting. Each director will continue to serve as a director until such director’s successor is duly elected and qualified or until their earlier resignation, removal or death.
Family Relationships
There are no family relationships between or among any of the current directors or executive officers.
Involvement in Certain Legal Proceedings
During the past ten years, none of the persons serving as our executive officers or directors have been the subject matter of any of the following legal proceedings that are required to be disclosed pursuant to Item 401(f) of Regulation S-K including: (a) any bankruptcy petition filed by or against any business of which such person was a general partner or executive officer either at the time of the bankruptcy or within two years prior to that time; (b) any criminal convictions; (c) any order, judgment, or decree permanently or temporarily enjoining, barring, suspending or otherwise limiting his involvement in any type of business, securities or banking activities; (d) any finding by a court, the SEC or the CFTC to have violated a federal or state securities or commodities law, any law or regulation respecting financial institutions or insurance companies, or any law or regulation prohibiting mail or wire fraud; or (e) any sanction or order of any self-regulatory organization or registered entity or equivalent exchange, association or entity. Further, no such legal proceedings are believed to be contemplated by governmental authorities against any director or executive officer.120 days from December 31, 2019.
In July 2015, Sabine Oil and Gas filed for bankruptcy protection under Chapter 11. Mr. McDonald was a director of Sabine Oil and Gasand was a Chief Executive Officer of Forest Oil Corporation, a predecessor of Sabine Oil and Gas.The Board does not believe this disclosure is material to an evaluation of the ability or integrity of Mr. McDonald because of the extenuating circumstances relating to Sabine Oil and Gas’ business and industry.
Section 16(a) Beneficial Ownership Reporting Compliance:
Section 16(a) of the 1934 Act requires our directors and officers and any persons who own more than ten percent of our equity securities, to file reports of ownership and changes in ownership with the Securities and Exchange Commission (the “SEC”). All directors, officers and greater than ten-percent stockholders are required by SEC regulation to furnish us with copies of all Section 16(a) reports files. To our knowledge, based solely upon a review of the copies of such reports furnished to us and written representations of our officers and directors, during 2017, all Section 16(a) reports applicable to our officers and directors were filed on a timely basis, except that we failed to timely file a Form 4 report for each of the following transactions:
Code of Ethics
The Board has adopted a Board of Directors Code of Business Conduct and Ethics, which applies to all of our directors. Our Code of Business Conduct and Ethics covers topics including, but not limited to, conflicts of interest, insider dealing, competition, discrimination and harassment, confidentiality, bribery and corruption, sanctions and compliance procedures. A copy of the Code of Business Conduct and Ethics is available at the “Corporate Governance” section of our website, http://carbonnaturalgas.com/board-of-directors-code-of-conduct/.
We also have an Employee Code of Conduct, which applies to all our employees and the employees of our subsidiaries. Our Code of Conduct covers topics including, but not limited to, conflicts of interest, insider dealing, competition, discrimination and harassment, confidentiality, bribery and corruption, sanctions and compliance procedures. A copy of the Code of Conduct is available at the “Corporate Governance” section of our website, http://carbonnaturalgas.com/corporate-governance/employee-code-of-conduct/.
Committees of the Board
The Board has a standing Audit Committee and a Compensation, Nominating and Governance Committee. The Board has adopted a formal written charter for each of these committees that is available on our website at www.carbonnaturalgas.com.
The table below provides the current composition of each standing committee of our Board:
The Audit Committee’s primary duties and responsibilities are to assist the Board in monitoring the integrity of our financial statements, the independent registered public accounting firm’s qualifications, performance and independence, management’s effectiveness of internal controls and our compliance with legal and regulatory requirements. The Audit Committee is directly responsible for the appointment, retention, compensation, evaluation and termination of our independent registered public accounting firm and has the sole authority to approve all audit and permitted non-audit engagement fees and terms. The Audit Committee is presently comprised of Messrs. Kennedy (Chariman), Brandi, Leidel and Morgens of which Messrs. Brandi, Kennedy and Morgens are independent directors under Nasdaq listing rules. The Board has determined that Mr. Kennedy qualifies as an “audit committee financial expert” as defined by Securities and Exchange Commission rules.
The Audit Committee was formed in September 2012 and held four meetings during 2017.
The Compensation, Nominating and Governance Committee discharges the responsibilities of the Board with respect to our compensation programs and compensation of our executives and directors. The Compensation, Nominating and Governance Committee has overall responsibility for determining the compensation of our executive officers and reviewing director compensation. The Compensation, Nominating and Governance Committee is also charged with the administration of our stock incentive plans. The Compensation, Nominating and Governance Committee is presently comprised of Messrs. Morgens (Chairman), Brandi, Kennedy and Leidel, each of whom is an outside director for purposes of Section 162(m) of the Internal Revenue Code and a non-employee director for purposes of Rule 16b-3 under the Exchange Act.
Other functions of the Compensation, Nominating and Governance Committee are to identify individuals qualified to become directors and recommend to the Board nominees for all directorships, identify directors qualified to serve on Board committees and recommend to the Board members for each committee, develop and recommend to the Board a set of corporate governance guidelines and otherwise take a leadership role in shaping our corporate governance.
In identifying and evaluating nominees for directors, the Compensation, Nominating and Governance Committee seeks to ensure that the Board possesses, in the aggregate, the strategic, managerial and financial skills and experience necessary to fulfill its duties and to achieve its objectives, and seeks to ensure that the Board is comprised of directors who have broad and diverse backgrounds, possessing knowledge in areas that are of importance to us. In addition, the Compensation, Nominating and Governance Committee believes it is important that at least one director have the requisite experience and expertise to be designated as an “audit committee financial expert.” The Compensation, Nominating and Governance Committee looks at each nominee on a case-by-case basis regardless of who recommended the nominee. In looking at the qualifications of each candidate to determine if their election would further the goals described above, the Compensation, Nominating and Governance Committee takes into account all factors it considers appropriate, which may include strength of character, mature judgment, career specialization, relevant technical skills or financial acumen, diversity of viewpoint and industry knowledge. Each director nominee must display high personal and professional ethics, integrity and values and sound business judgment.
The Compensation, Nominating and Governance Committee also monitors corporate governance for the Board, which includes reviewing the Code of Business Conduct and Ethics and evaluation of board and committee performance.
The Compensation, Nominating and Governance Committee was formed in September 2012 and held four meetings during 2017.
Item 1111. Executive Compensation.
Summary Compensation Table
Effective March 15, 2017 and pursuant to the reverse stock split approved by the shareholders and Board of Directors, each 20 shares of issued and outstanding common stock became one share of common stock and no fractional shares were issued. The tables in this section give retroactive effect to the reverse stock split for all periods presented.
The following table sets forth information relating to compensation awarded to, earned by or paid to our Named Executive Officers (“NEO”) during the fiscal years ended December 31, 2017 and 2016.
Name and Principal Position | Year | Salary ($) | Stock Awards ($)(1) | Non-Equity Incentive Plan Compensation ($)(2) | All Other Compensation ($)(3) | Total ($) | |||||||||||||
| Patrick R. McDonald | 2017 | 383,750 | 144,000 | 438,725 | 62,159 | 1,028,634 | |||||||||||||
| Chief Executive Officer | 2016 | 350,000 | 108,000 | 194,947 | 77,480 | 730,427 | |||||||||||||
| Mark D. Pierce | 2017 | 236,000 | 72,000 | 192,287 | 35,024 | 559,311 | |||||||||||||
| President | 2016 | 236,000 | 108,000 | 85,442 | 9,264 | 438,706 | |||||||||||||
| Kevin D. Struzeski | 2017 | 270,000 | 72,000 | 201,247 | 40,549 | 583,796 | |||||||||||||
| Chief Financial Officer, Treasurer and Secretary (1) | 2016 | 247,000 | 108,000 | 89,425 | 46,335 | 490,760 |
Narrative Disclosure to Summary Compensation Table
The Compensation, Nominating and Governance Committee (the “Committee”)information required by Item 11 is charged with reviewing and approvingincorporated by reference to the terms and structure of the compensation of our executive officers. The Committee has not retained an independent compensation consultant to assist the Committee to review and analyze the structure and terms of the compensation of our executive officers.
We consider various factors when evaluating and determining the compensation terms and structure of its executive officers, including the following:
| ||
| ||
| ||
| ||
Our management is responsible for reviewing the base salary, annual bonus and long-term compensation levels for other of our employees, and we expect this practice to continue going forward. The Committee is responsible for significant changes to, or adoption of, employee benefit plans.
We believe that the compensation environment for qualified professionalsinformation provided in the industry in which we operate is highly competitive. In order to compete in this environment,Company’s information statement for the compensation2020 annual meeting of our executive officers is primarily comprised of the following four components:
Base Salary.Base salary, paid in cash, is the first element of compensation to our officers.In determining base salaries for our key executive officers, we aim to set base salaries at a level we believe enables us to hire and retain individuals in a competitive environment and to reward individual performance and contribution to our overall business goals. The Board of Directors and the Committee believe that base salary should be relatively stable over time, providing the executive a dependable, minimal level of compensation, which is approximately equivalent to compensation that may be paid by competitors for persons of similar abilities. The Board of Directors and the Committee believe that base salaries for our executive officers are appropriate for persons serving as executive officers of public companies similar in size and complexity to us.
Stock Incentive Plan Benefits.Each of our executive officers is eligiblestockholders to be granted awards under our equity compensation plans. We believe that equity-based compensation helps align management and executives’ interests with the interests of our stockholders. Our equity incentives are also intended to reward the attainment of long-term corporate objectives by our executives. We also believe that grants of equity-based compensation are necessary to enable us to be competitivefiled within 120 days from a total remuneration standpoint. We have no set formula for granting awards to our executives or employees. In determining whether to grant awards and the amount of any awards, we take into consideration discretionary factors such as the individual’s current and expected future performance, level of responsibilities, retention considerations and the total compensation package.
Annual Incentive Plan.Cash payments made under the provisions of our Annual Incentive Plan (“AIP”) is another component of our compensation plan. The Board of Directors and the Committee believes that it is appropriate that executive officers and other employees have the potential to receive a portion of their annual compensation based upon the achievement of defined objectives in order to encourage performance to achieve these key corporate objectives and to be competitive from a total remuneration standpoint.
In general terms, the AIP is designed to meet the following objectives:
The AIP provided cash pools for all employees. Once the pools were established, awards were allocated by the executive officers to individuals based on their assessment as to individual or group performances.
Payments in 2017 were determined under the provisions of the Carbon Natural Gas Company 2016 Annual Incentive Plan whereby seventy percent of the AIP payments were determined at the discretion of the Board taking into consideration the factors listed above and thirty percent of the AIP payments were determined and weighted based upon the performance measures and objectives as follows:
Payments in 2016 were determined under the provisions of the Carbon Natural Gas Company 2015 Annual Incentive Plan whereby seventy percent of the AIP payments were determined at the discretion of the Committee taking into consideration the factors listed above and thirty percent of the AIP payments were determined and weighted based upon the performance measures and objectives as follows:
Other Compensation/Benefits.Another element of the overall compensation is to provide our executive officers various employment benefits, such as the payment of health and life insurance premiums on behalf of the executive officers. Our executive officers are also eligible to participate in our 401(k) plan on the same basis as other employees and we historically have made matching contributions to the 401(k) plan, including for the benefit of our executive officers.
Pursuant to the employment agreements with Messrs. McDonald, Pierce and Struzeski, such officers are entitled to certain payments upon termination of employment. SeeEmployment Contracts and Termination of Employment and Change-in-Control Arrangements below. Other than these arrangements, we currently do not have any compensatory plans or arrangements that provide for any payments or benefits upon the resignation, retirement or any other termination of any of our executive officers, as the result of a change in control, or from a change in any executive officer’s responsibilities following a change in control.
Outstanding Equity Awards at December 31, 20172019.
The following table sets forth information concerning unexercised warrants and unvested restricted stock and performance unit awards, each as held by our executive officers as of December 31, 2017.
| Equity Incentive Plan Awards | ||||||||||||||||
| Name | Number of unvested restricted shares (#) | Market Value of unvested restricted shares ($)(1) | Number of unearned performance units (#) | Market Value of unearned performance units ($)(1) | ||||||||||||
| Patrick R. McDonald | 40,000 | 440,000 | 78,080 | 858,880 | ||||||||||||
| Mark D. Pierce | 30,000 | 330,000 | 44,040 | 484,440 | ||||||||||||
| Kevin D. Struzeski | 30,000 | 330,000 | 44,040 | 484,440 | ||||||||||||
The following table reflects unvested stock awards held by our executive officers as of December 31, 2017 that have time-based vesting. These stock awards will vest as follows if the named executive officer has remained in continuous employment through the vesting date in each such year:
| Award Recipient | 2018 | 2019 | 2020 | Thereafter | ||||||||||||
| Patrick R. McDonald | 20,000 | 13,334 | 6,666 | - | ||||||||||||
| Mark D. Pierce | 10,000 | 16,667 | 3,334 | - | ||||||||||||
| Kevin D. Struzeski | 10,000 | 16,667 | 3,334 | - | ||||||||||||
The following table reflects unvested performance stock awards held by our executive officers as of December 31, 2017 that vest upon the achievement of certain performance measures relative to a defined peer group or the growth of certain performance measures over a defined period of time and, in certain cases, based on continuous service. These performance stock awards will vest as follows if the named executive officer has remained in continuous employment with us through the date of a change in control and if the executive officer earns 100% of the performance stock awards based upon the achievement of certain performance measures relative to a defined peer group or the growth of certain performance measures over a defined period of time for us.
| Stock Price and Defined Performance Measures | ||||||||
| Stock Award Recipient | Change of Control | Relative to Peer Group | ||||||
| Patrick R. McDonald | 18, 080 | 60,000 | ||||||
| Mark D. Pierce | 9,040 | 37,500 | ||||||
| Kevin D. Struzeski | 9,040 | 37,500 | ||||||
Director Compensation
We use a combination of cash and equity incentive compensation in the form of restricted stock to attract and retain qualified and experienced candidates to serve on the Board. In setting this compensation, our Committee considers the significant amount of time and energy expended and the skill level required by our directors in fulfilling their duties. Grants of shares of restricted stock vest upon the earlier of a change in control of us or the date a non-management director’s membership on the Board is terminated other than for cause. We also reimburse expenses incurred by our non-employee directors to attend Board and Board committee meetings.
The following table reports compensation earned by or paid to our non-employee directors during 2017.
| Name | Fees earned or paid in cash | Stock awards ($) (1) | Option awards ($) | Non-equity incentive plan compensation ($) | Nonqualified deferred compensation earnings ($) | All other compensation ($) | Total ($) | |||||||||||||||||||||
| James H. Brandi | $ | 30,000 | $ | 36,000 | - | - | - | - | $ | 66,000 | ||||||||||||||||||
| David H. Kennedy | $ | 20,000 | $ | 28,800 | - | - | - | - | $ | 48,800 | ||||||||||||||||||
| Bryan H. Lawrence | * | $ | 28,800 | - | - | - | - | $ | 28,800 | |||||||||||||||||||
| Peter A. Leidel | * | $ | 28,800 | - | - | - | - | $ | 28,800 | |||||||||||||||||||
| Edwin H. Morgens | $ | 20,000 | $ | 28,800 | - | - | - | - | $ | 28,800 | ||||||||||||||||||
Narrative Disclosure to Director Compensation Table
Employment Contracts and Termination of Employment and Change-in-Control Arrangements
Effective March 30, 2013, Messrs. McDonald, Pierce and Struzeski entered into employment agreements with us. These agreements superseded employment agreements between Messrs. McDonald and Struzeski and Nytis Exploration Company and between Mr. Pierce and Nytis LLC.
The agreement between us and Patrick R. McDonald has a term through December 31, 2018, which term shall automatically be extended for successive terms of one-year provided, however, that the Board of Directors may terminate the agreement at the end of the term or any additional term by giving written notice of termination at least three months preceding the end of the then current term. In the event of the termination of Mr. McDonald’s employment by us without cause or by Mr. McDonald with good reason, Mr. McDonald is to receive an amount equal to 150% of his “Compensation,” defined as the arithmetic average of Mr. McDonald’s annual base salary, bonus and other cash compensation for each of the three years prior to the termination and for a period of 24 months from the date of termination, his medical, dental, disability and life insurance coverage at the same levels of coverage as in effect immediately prior to his termination. In the event of termination of employment by us without cause or by Mr. McDonald with good reason within two years after a change in control of us, he is to receive 275% of the Compensation (as defined above).
The agreements between us and Messrs. Pierce and Struzeski have a term through December 31, 2018, which term shall automatically be extended for successive terms of one-year provided, however, that the Board of Directors may terminate the agreement at the end of the term or any additional term by giving written notice of termination at least three months preceding the end of the then current term. In the event of the termination of Mr. Pierce’s or Mr. Struzeski’s employment by us without cause or by the executive with good reason, they would receive an amount equal to 100% of his “Compensation,” defined as the arithmetic average of their annual base salary, bonus and other cash compensation for each of the three years prior to the termination and the cost to provide benefits for a period of 12 months from the date of termination at the same levels of coverage as in effect immediately prior to the date of termination. In the event of termination of employment by us without cause or by the executive with good reason within two years after a change in control of us, they would receive 200% of their Compensation (as defined above) and 100% of the annual cost to us of the benefits provided to Messrs. Pierce and Struzeski.
Item 12. Security Ownership of Certain Beneficial Owners and Management and Related Stockholder Matters.
The following table sets forth, as of March 23, 2018, the amount and percentage of our outstanding shares of common stock beneficially owned by (i) each person (including any group) known to us that beneficially more than 5% of our outstanding shares of common stock, (ii) each director, (iii) each of our executive officers and (iv) all of our directors and executive officers as a group:
| Name of Beneficial Owners | Address of Beneficial Owners | Shares Beneficially Owned (1) | Percent of Class (2) | |||||||
| 5% Holders: | ||||||||||
| Yorktown Energy Partners V, L.P. | 410 Park Avenue 19th Floor New York, NY 10022 | 896,915 | 11.9 | % | ||||||
| Yorktown Energy Partners VI, L.P. | 410 Park Avenue 19th Floor New York, NY 10022 | 896,915 | 11.9 | % | ||||||
| Yorktown Energy Partners IX, L.P. | 410 Park Avenue 19th Floor New York, NY 10022 | 1,111,111 | 14.7 | % | ||||||
| Yorktown Energy Partners XI, L.P. | 410 Park Avenue 19th Floor New York, NY 10022 | 1,959,829 | 26.0 | % | ||||||
| Arbiter Partners Capital Management LLC (3) | 530 Fifth Avenue 20thFloor New York, New York 10036 | 655,733 | 8.7 | % | ||||||
| AWM Investment Company Inc.(4) | c/o Special Situation Funds 527 Madison Avenue Suite 2600 New York, New York 10022 | 706,549 | 9.4 | % | ||||||
| Directors | ||||||||||
| Patrick R. McDonald(5) | 181,417 | 2.4 | % | |||||||
| James H. Brandi(6) | - | * | ||||||||
| David H. Kennedy(7) | 8,154 | * | ||||||||
| Bryan H. Lawrence(8) | 4,864,770 | 64.6 | % | |||||||
| Peter A. Leidel(9) | 4,864,770 | 64.6 | % | |||||||
| Edwin H. Morgens(10) | 83,333 | 1.1 | % | |||||||
| Executive Officers | ||||||||||
| Mark D. Pierce | 59,900 | * | ||||||||
| Kevin D. Struzeski | 82,535 | 1.1 | % | |||||||
| All directors and executive officers as a group (8 persons)(11) | 5,280,109 | 69.7 | % | |||||||
Additional information required by Item 12 is incorporated by reference to the information provided in the Company’s information statement for the 2020 annual meeting of stockholders to be filed within 120 days from December 31, 2019.
* Represents less than 1%
|
Equity Compensation Plans
Effective March 15, 2017 and pursuant to a reverse stock split approved by the shareholders and Board of Directors, each 20 shares of issued and outstanding common stock became one share of common stock and no fractional shares were issued. The table below gives retroactive effect to the reverse stock split for all periods presented.
We have two stock plans, the Carbon 2011 Stock Incentive Plan and the Carbon 2015 Stock Incentive Plan (collectively the “Carbon Plans”). The Carbon Plans were approved by our shareholders and, in the aggregate, allow for the issuance of 1,130,000 shares of our common stock for participants eligible to receive awards under the Carbon Plans. See Note 9 of the consolidated financial statements for a description of compensation plans.
The following is provided with respect to compensation plans (including individual compensation arrangements) under which equity securities are authorized for issuance as of December 31, 2017:2019:
| Number of | ||||||
| Securities to be | Number of Securities | |||||
| Issued Upon | Remaining Available for | |||||
| Exercise of | Future Issuance Under | |||||
| Outstanding | Equity Compensation | |||||
| Options, | Plans (Excluding | |||||
| Warrants | Securities Reflected in | |||||
| and Rights | Column(a)) | |||||
| (a) | (b) | |||||
| Equity compensation plans approved by security holders (1) | 258,308 | $172,795 | ||||
| Equity compensation plans not approved by security holders | — | — | ||||
| Total | 258,308 | $172,795 | ||||
Number of Securities to be Issued Upon Exercise of Outstanding Options, Warrants and Rights (a) | Number of Securities Remaining Available for Future Issuance Under Equity Compensation Plans (Excluding Securities Reflected in Column(a)) (b) | |||||||
| Equity compensation plans approved by security holders | 576,102 | 323,000 | ||||||
| Equity compensation plans not approved by security holders | - | - | ||||||
Item 13. Certain Relationships and Related Transactions, and Director Independence.
Certain Relationships
None
Related Transactions
The following sets forth information regarding transactions between us (and our subsidiaries) and our officers, directors and significantrequired by Item 13 is incorporated by reference to the information provided in the Company’s information statement for the 2020 annual meeting of stockholders since January 1, 2017.
Employment Agreements
See the Executive Compensation section of this Annual Report for a discussion of the employment agreements between Messrs. McDonald, Pierce and Struzeski and us.
Director Independence
Our Board consists of Messrs. Brandi, Kennedy, Lawrence, Leidel, McDonald and Morgens. We utilize the definition of “independent” as it is set forth in Rule 5605(a)(2) of the Nasdaq Listing Rules. Further, the Board considers all relevant facts and circumstances in its determination of independence of all members of the Board (including any relationships). Based on the foregoing criteria, Messrs. Brandi, Kennedy and Morgens are considered to be independent directors in accordance with NASDAQ listing rules. Mr. Leidel serves on our Audit Committee and the Compensation, Nominating and Governance Committee and is not an independent director in accordance with NASDAQ listing rules.
Carbon California
Carbon California Operating Company (“CCOC”) is our subsidiary and the operator of Carbon California through an operating agreement. The operating agreement includes reimbursements and allocations made under the agreement. As offiled within 120 days from December 31, 2017, approximately $300,000 is due from Carbon California and included in accounts receivable – due from related party on the consolidated balance sheets.2019.
On February 15, 2017, we entered into a management service agreement with Carbon California whereby we provide general management and administrative services. We receive $600,000 annually, payable in four equal quarterly installments. We also received a one-time reimbursement of $500,000 in connection with the CRC and Mirada Acquisitions. Carbon California reimburses us for all management related expenses such as travel, required third-party geological and/or accounting consulting, and other necessary expenses incurred by us in the normal course of managing Carbon California. For the year ended December 31, 2017, we recorded $1.0 million in total management reimbursements. There were no outstanding management reimbursements unpaid as of December 31, 2017.
Carbon Appalachia
Nytis is the operator of Carbon Appalachia through an operating agreement. The operating agreement includes reimbursements and allocations made under the agreement. As of December 31, 2017, approximately $1.8 million is due from Carbon Appalachia and included in accounts receivable – related party on the consolidated balance sheets.
On April 3, 2017, we entered into a management service agreement with Carbon Appalachia whereby we provide general management and administrative services. We initially received a quarterly reimbursement of $75,000; however, after the Enervest Acquisition in August, the amount of the reimbursement now varies quarterly based upon the percentage of our production in relation to the total of our production and Carbon Appalachia’s total production. We also received a one-time reimbursement of $300,000 in connection with the CNX Acquisition. Total reimbursements recorded by us for the year ended December 31, 2017, were approximately $1.6 million, of which approximately $579,000 was included in accounts receivable –due from related party on our consolidated balance sheets as of December 31, 2017.
Procedures for Review, Approval and Ratification of Transactions with Related Persons
Significant related party transactions are reviewed and approved by our Board of Directors.
Item 14. Principal AccountantAccounting Fees and Services.
The following table presents fees for professional services performedinformation required by our independent registered public accounting firm, EKS&H LLP, for 2017 and 2016.
| (in thousands) | 2017 | 2016 | ||||||
| Fees | ||||||||
| Audit fees (1) | $ | 202 | $ | 168 | ||||
| Audit-related support fees | - | - | ||||||
| Tax fees | - | - | ||||||
| All other fees | - | 54 | ||||||
| Total | $ | 202 | $ | 222 | ||||
(1) Audit Fees consist ofItem 14 is incorporated by reference to the aggregate fees for professional services renderedinformation provided in the Company’s information statement for the audit2020 annual meeting of our annual consolidated financial statements, and the reviews of the consolidated financial statements included in our Quarterly Reports on Forms 10-Q, audits relatedstockholders to statement of revenues and direct operator expense for interest acquired by the Company and certain acquisition or potential acquisition of Carbon Appalachian and Carbon California, and for any other services that were normally provided by our auditors in connection with our statutory and regulatory filings or engagements.
All Other Fees consist of the aggregate fees billed for products and services provided by our auditors and not otherwise included in audit fees, audit-related fees or tax fees.
The Board of Directors adopted resolutions that provided that the Audit Committee must:
pre-approve all audit services that the auditor may provide to us or any subsidiary (including, without limitation, providing comfort letters in connection with securities underwritings or statutory audits) as required by §10A(i)(A) of the 1934 Act.
pre-approve all non-audit services (other than certainde minimis services described in §10A(i)(1)(B) of the 1934 Act that the auditors propose to provide to us or any of our subsidiaries.
The Audit Committee considers at each of its meetings whether to approve any audit services or non-audit services. In some cases, management may present the request; in other cases, the auditors may present the request. The Board of Directors approved EKSH performing our audit for the 2017 fiscal year.
All of the fees in the table above were approved in accordance with this policy.
be filed within 120 days from December 31, 2019.
Item 15. Exhibits, Financial Statement Schedules
| (a) | The following documents are filed as part of this |
Financial Statements. See Item 8 of this Annual Report | ||
| (2) | Financial Statement Schedules: All schedules have been omitted because the information is either not required or | |
| (3) | Exhibits: See the Index of Exhibits listed in Item 15(b) hereof for a list of those exhibits filed as part of this Annual Report on Form 10-K. |
(b) Index of Exhibits:
| Index of Exhibits: |
| * | Filed herewith. |
| † | Not considered to be “filed” for purposes of Section 18 of the Securities Exchange Act of 1934 or otherwise subject to the limitations of that section. |
None.
96
Pursuant to the requirements of Section 13 or 15(d) of the Securities Exchange Act of 1934, the registrant has duly caused this report to be signed on its behalf by the undersigned, thereunto duly authorized.
| Date: March | CARBON ENERGY CORPORATION (Registrant) | |
By: | /s/ Patrick R. McDonald | |
| Patrick R. McDonald | ||
| Chief Executive Officer | ||
Pursuant to the requirements of the Securities Exchange Act of 1934, this report has been signed below by the following persons on behalf of the registrant and in the capacities and on the dates indicated.
| Signatures | Title | Date | ||
| /s/ Patrick R. McDonald | Director and Chief Executive Officer | March | ||
| Patrick R. McDonald | (Principal Executive Officer) | |||
/s/ Kevin D. Struzeski | Chief Financial Officer, Treasurer and Secretary | March | ||
| Kevin D. Struzeski | (Principal Financial Officer and Principal Accounting Officer) | |||
| /s/ James H. Brandi | Chairman and Director | March | ||
| James H. Brandi | ||||
| /s/ Peter A. Leidel | Director | March | ||
| Peter A. Leidel | ||||
| /s/ | Director | March | ||
| /s/ Edwin H. Morgens | Director | March | ||
| Edwin H. Morgens | ||||
| /s/ David H. Kennedy | Director | March | ||
| David H. Kennedy |
9197