UNITED STATES
SECURITIES AND EXCHANGE COMMISSION
Washington, D.C. 20549
Form 10-K
☒ ANNUAL REPORT PURSUANT TO SECTION 13 OR 15(d) OF THE SECURITIES EXCHANGE ACT OF 1934
For the fiscal year ended February 28, 202229, 2024
☐ TRANSITION REPORT PURSUANT TO SECTION 13 OR 15(d) OF THE SECURITIES EXCHANGE ACT OF 1934
For the transition period from ______ to ______
Commission File No. 814-00732
SARATOGA INVESTMENT CORP.
(Exact name of registrant as specified in its charter)
| Maryland | 20-8700615 | |
| (State or other jurisdiction of incorporation or organization) | (I.R.S. Employer Identification Number) |
535 Madison Avenue
New York, New York 10022
(Address of principal executive offices)
(212) 906-7800
(Registrant’s telephone number, including area code)
Securities registered pursuant to Section 12(b) of the Act:
| Title of each class | Trading Symbol(s) | Name of each exchange on which registered | ||
| Common Stock, par value $0.001 per share | SAR | The New York Stock Exchange | ||
| The New York Stock Exchange | ||||
| The New York Stock Exchange | ||||
| 8.125% Notes due 2027 | SAY | The New York Stock Exchange | ||
| 8.50% Notes due 2027 | SAZ | The New York Stock Exchange |
Securities registered pursuant to Section 12(g) of the Act: None
Indicate by check mark if the registrant is a well-known seasoned issuer, as defined in Rule 405 of the Securities Act. Yes ☐ No ☒
Indicate by check mark if the registrant is not required to file reports pursuant to Section 13 or 15(d) of the Act. Yes ☐ No ☒
Indicate by check mark whether the registrant (1) has filed all reports required to be filed by Section 13 or 15(d) of the Securities Exchange Act of 1934 during the preceding 12 months (or for such shorter period that the registrant was required to file such reports), and (2) has been subject to such filing requirements for the past 90 days: Yes ☒ No ☐
Indicate by check mark whether the registrant has submitted electronically every Interactive Data File required to be submitted pursuant to Rule 405 of Regulation S-T (§ 232.405 of this chapter) during the preceding 12 months (or for such shorter period that the registrant was required to submit such files). Yes ☐☒ No ☐
Indicate by check mark whether the registrant is a large accelerated filer, an accelerated filer, a non-accelerated filer, a smaller reporting company, or an emerging growth company. See the definitions of “large accelerated filer,” “accelerated filer”, “smaller reporting company” and “emerging growth company” in Rule 12b-2 of the Exchange Act.
| Large accelerated filer | ☐ | Accelerated filer | ☐ |
| Non-accelerated filer | ☒ | Smaller reporting company | ☐ |
| Emerging growth company | ☐ |
If an emerging growth company, indicate by check mark if the registrant has elected not to use the extended transition period for complying with any new or revised financial accounting standards provided pursuant to Section 13(a) of the Exchange Act. ☐
Indicate by check mark whether the registrant has filed a report on and attestation to its management’s assessment of the effectiveness of its internal control over financial reporting under Section 404(b) of the Sarbanes-Oxley Act (15 U.S.C. 7262(b)) by the registered public accounting firm that prepared or issued its audit report. ☐
If securities are registered pursuant to Section 12(b) of the Act, indicate by check mark whether the financial statements of the registrant included in the filing reflect the correction of an error to previously issued financial statements. ☐
Indicate by check mark whether any of those error corrections are restatements that required a recovery analysis of incentive-based compensation received by any of the registrant’s executive officers during the relevant recovery period pursuant to §240.10D-1(b). ☐
Indicate by check mark whether the registrant is a shell company (as defined in Rule 12b-2 of the Exchange Act). Yes ☐ No ☒
The aggregate market value of the voting and non-voting common stock held by non-affiliates of the registrant as of August 31, 20212023 was approximately $231.0$271.2 million based upon a closing price of $28.70$25.85 reported for such date by the New York Stock Exchange.
The number of outstanding commoncommon shares of the registrant as of May 4, 20223, 2024 was 12,124,175.13,698,966.
DOCUMENTS INCORPORATED BY REFERENCE
None.
NOTE ABOUT REFERENCES
In this Annual Report on Form 10-K (the “Annual Report”), the “Company,” “we,” “us” and “our” refer to Saratoga Investment Corp. and its wholly-ownedwholly owned subsidiaries, Saratoga Investment Funding LLC, Saratoga Investment Funding II LLC, Saratoga Investment Corp. SBIC LP, Saratoga Investment Corp. SBIC II LP, and Saratoga Investment Corp. SBIC IIIII LP, unless the context otherwise requires. We refer to Saratoga Investment Advisors, LLC, our investment adviser, as “Saratoga Investment Advisors,” the “Investment Adviser” or the “Manager.”
NOTE ABOUT FORWARD-LOOKING STATEMENTS
Some of the statements in this Annual Report constitute forward-looking statements. Forward-looking statements relate to expectations, beliefs, projections, future plans and strategies, anticipated events or trends and similar expressions concerning matters that are not historical facts. In some cases, you can identify forward-looking statements by terms such as “anticipate,” “believe,” “could,” “estimate,” “expect,” “intend,” “may,” “plan,” “potential,” “project,” “should,” “will” and “would” or the negative of these terms or other comparable terminology.
We have based the forward-looking statements included in this annual report on Form 10-K onAnnual Report information available to us on the date of this annual report on Form 10-K,Annual Report, and we assume no obligation to update any such forward-looking statements. Actual results could differ materially from those anticipated in our forward-looking statements, and future results could differ materially from historical performance. We undertake no obligation to revise or update any forward-looking statements occurring after the date of this Annual Report, whether as a result of new information, future events or otherwise, unless required by law or SEC rule or regulation. You are advised to consult any additional disclosures that we may make directly to you or through reports that we in the future may file with the SEC, including annual reports on Form 10-K, quarterly reports on Form 10-Q and current reports on Form 8-K.
The forward-looking statements contained in this Annual Report involve risks and uncertainties, including statements as to:
| ● | our future operating |
| ● | the introduction, withdrawal, success and timing of business initiatives and strategies; |
| ● | changes in political, economic or industry conditions, the interest rate environment or financial and capital markets, which could result in changes in the value of our assets; |
| ● |
| the relative and absolute investment performance and operations of our Manager; |
| ● | the impact of increased competition; |
| ● | our ability to turn potential investment opportunities into transactions and thereafter into completed and successful investments; |
| ● | the unfavorable resolution of any future legal proceedings; |
| ● | our business prospects and the operational and financial performance of our portfolio companies, including their ability to achieve our respective objectives as a result of the current |
i
| ● | the impact of investments that we expect to make and future acquisitions and divestitures; |
| ● | our contractual arrangements and relationships with third parties; |
| ● | the dependence of our future success on the general economy and its impact on the industries in which we |
| ● | the ability of our portfolio companies to achieve their objectives; |
| ● | our expected financings and investments; |
| ● | our regulatory structure and tax treatment, including our ability to operate as a business development company (“BDC”), or to operate our small business investment company (“SBIC”) subsidiaries, and to continue to qualify to be taxed as a regulated investment company (“RIC”); |
| ● | the adequacy of our cash resources and working capital; |
| ● | the timing of cash flows, if any, from the operations of our portfolio |
| ● | the impact of interest rate volatility, including the |
| ● | the impact of supply chain constraints and labor difficulties on our portfolio companies and the global economy; |
| ● | the elevated level of inflation, and its impact on our portfolio companies and on the industries in which we invest; |
| ● | the impact of legislative and regulatory actions and reforms and regulatory, supervisory or enforcement actions of government agencies relating to us or our Manager; |
| ● | the impact of changes to tax legislation and, generally, our tax position; |
| ● | our ability to access capital and any future financings by us; |
| ● | the ability of our Manager to attract and retain highly talented professionals; and |
| ● | the ability of our Manager to locate suitable investments for us and to monitor and effectively administer our |
Although we believe that the assumptions on which these forward-looking statements are based are reasonable, any of those assumptions could prove to be inaccurate, and as a result, the forward-looking statements based on those assumptions also could be inaccurate. Important assumptions include our ability to originate new loans and investments, borrowing costs and levels of profitability and the availability of additional capital. In light of these and other uncertainties, the inclusion of a projection or forward-looking statement in this annual report on Form 10-KAnnual Report should not be regarded as a representation by us that our plans and objectives will be achieved. These risks and uncertainties include those described in “Risk Factors” in this annual report on Form 10-KAnnual Report under Item 1A. You should not place undue reliance on these forward-looking statements, which apply only as of the date of this annual report on Form 10-K.Annual Report.
ii
i
iii
PART I
ITEM 1. BUSINESS
General
We are a specialty finance company that provides customized financing solutions to U.S middle-market businesses. Our investment objective is to create attractive risk-adjusted returns by generating current income and long-term capital appreciation from our investments. We primarily invest in senior and unitranche leveraged loans and mezzanine debt and, to a lesser extent, equity issued by private U.S. middle-market companies, which we define as companies having annual earnings before interest, taxes, depreciation and amortization (“EBITDA”) of between $2 million and $50 million, both through direct lending and through participation in loan syndicates. Our investment objective is to create attractive risk-adjusted returns by generating current income and long-term capital appreciation from our investments. Our investments generally provide financing for change of ownership transactions, strategic acquisitions, recapitalizations, and growth initiatives in partnership with business owners, management teams and financial sponsors. Our investment activities are externally managed and advised by Saratoga Investment Advisors, LLC, a New York-based investment firm affiliated with Saratoga Partners, a middle marketmiddle-market private equity investment firm.
Our portfolio is comprised primarily of investments in leveraged loans issued by middle marketmiddle-market companies. Leveraged loans are generally senior debt instruments that rank ahead of subordinated debt with below investment grade or “junk” ratings or, if not rated, would be rated below investment grade or “junk” and, as a result, carry a higher risk of default. Leveraged loans also have the benefit of security interests on the assets of the portfolio company, which may rank ahead of, or be junior to, other security interests. Term loans are loans that do not allow the borrowers to repay all or a portion of the loans prior to maturity and then re-borrow such repaid amounts under the loan again. We also invest in mezzanine debt and make equity investments in middle marketmiddle-market companies. Mezzanine debt is typically unsecured and subordinated to senior debt of the portfolio company.
While our primary focus is to generate current income and capital appreciation from our debt and equity investments in middle marketmiddle-market companies, we may invest up to 30.0% of our portfolio in opportunistic investments in order to seek to enhance returns to stockholders. Such investments may include investments in distressed debt, including securities of companies in bankruptcy, foreign debt, private equity, securities of public companies that are not thinly traded, joint ventures and structured finance vehicles such as collateralized loan obligation funds. Although we have no current intention to do so, to the extent we invest in private equity funds, we will limit our investments in entities that are excluded from the definition of “investment company” under Section 3(c)(1) or Section 3(c)(7) of Investment Company Act of 1940, as amended (“1940 Act”), which includes private equity funds, to no more than 15% of itsour net assets.
As of February 28, 2022,29, 2024, we had total assets of $876.2$1,191.2 million and investments in 4555 portfolio companies, excluding an investment in the subordinated notes of one collateralized loan obligation fund, Saratoga Investment Corp. CLO 2013-1, Ltd. (“Saratoga CLO”), which had a fair value of $28.7$9.5 million as of February 28, 2022,29, 2024, investments in the Class F-2-R-3 Note of the Saratoga CLO which as of February 28, 202229, 2024 had a fair value of $9.4$8.9 million, and investments in the Saratoga Senior Loan Fund I JV LLC (“SLF JV”), and its subsidiaries, a joint venture which as of February 28, 202229, 2024 had a fair value of $25.1$25.2 million. The overall portfolio composition as of February 28, 202229, 2024 consisted of 77.3%85.7% of first lien term loans, 5.4%1.6% of second lien term loans, 1.9%1.4% of unsecured loans, 4.7%2.7% of structured finance securities and 10.7%8.6% of equity interests. As of February 28, 2022,29, 2024, the weighted average yield on all of our investments, including our investment in the subordinated notes of Saratoga CLO and Class F-2-R-3 Note was approximately 7.7%11.4%. The weighted average yield of our investments is not the same as a return on investment for our stockholders and, among other things, is calculated before the payment of our fees and expenses. As of February 28, 2022,29, 2024, our total return based on market value was 28.19%-3.92% and our total return based on net asset value (“NAV”) per share was 15.88%4.20%. As of February 28, 2021,2023, our total return based on market value was 7.63%10.35% and our total return based on net asset valueNAV was 7.42%9.46%. Total return based on market value is the change in the ending market value of the Company’s common stock plus dividends distributed during the period assuming participation in the Company’s dividend reinvestment plan divided by the beginning market value of the Company’s common stock. Total return based on net asset value (“NAV”)NAV is the change in ending NAV per share plus dividends distributed per share paid during the period assuming participation in the Company’s dividend reinvestment plan divided by the beginning NAV per share. While total return based on NAV and total return based on market value reflect fund expenses, they do not reflect any sales load that may be paid by investors. As of February 28, 2022,29, 2024, approximately 97.1%99.4% of our first lien debt investments were fully collateralized in the sense that the portfolio companies in which we held such investments had an enterprise value or our investment had an asset coverage equal to or greater than the principal amount of the related debt investment. The Company uses enterprise value to assess the level of collateralization of its portfolio companies. The enterprise value of a portfolio company is determined by analyzing various factors, including EBITDA, cash flows from operations less capital expenditures and other pertinent factors, such as recent offers to purchase a portfolio company’s securities or other liquidation events. As a result, while we consider a portfolio company to be collateralized if its enterprise value exceeds the amount of our loan, we do not hold tangible assets as collateral in our portfolio companies that we would obtain in the event of a default. Our investment in the subordinated notes of Saratoga CLO represents a first loss position in a portfolio that, at February 28, 2022,29, 2024, was composed of $660.2$640.8 million in aggregate principal amount of predominantly senior secured first lien term loans. A first loss position means that we will suffer the first economic losses if losses are incurred on loans held by the Saratoga CLO. As a result, this investment is subject to unique risks. See Part I. Item 1A. “Risk Factors—Our investment in Saratoga CLO constitutes a leveraged investment in a portfolio of subordinated notes representing the lowest-rated securities issued by a pool of predominantly senior secured first lien term loans and is subject to additional risks and volatility. All losses in the pool of loans will be borne by our subordinated notes and only after the value of our subordinated notes is reduced to zero will the higher-rated notes issued by the pool bear any losses.”
We are an externally managed, closed-end, non-diversified management investment company that has elected to be regulated as a business development company (“BDC”) under the 1940 Act. As a BDC, we are required to comply with various regulatory requirements, including limitations on our use of debt. We finance our investments through borrowings. However, as a BDC, we are only generally allowed to borrow amounts such that our asset coverage, as defined in the 1940 Act, equals at least 200.0%200% after such borrowing, or 150% if we obtain the required approvals from our directors who are not “interested persons” (as defined in Section 2(a)(19) of the 1940 Act) of the Company (“independent directorsdirectors”) and/or stockholders, 150.0%.stockholders. On April 16, 2018, as permitted by the Small Business Credit Availability Act, which was signed into law on March 23, 2018, our board of directors, including, a majority of our independent directors, approved of ourus becoming subject to a minimum asset coverage ratio of 150.0%150% under Sections 18(a)(1) and 18(a)(2) of the 1940 Act. The 150.0%150% asset coverage ratio became effective on April 16, 2019.
We have elected to be treated for U.S. federal income tax purposes as a regulated investment company (“RIC”), under Subchapter M of the Internal Revenue Code of 1986, as amended (the “Code”). As a RIC, we generally will not havebe subject to pay U.S. federal income taxes at corporate ratestax on any net ordinary income or capital gains that we timely distribute to our stockholders if we meet certain source-of-income, annual distribution and asset diversification requirements.
In addition, we have two wholly-ownedhad three wholly owned subsidiaries that are each licensed as a small business investment company (“SBIC”) and regulated by the Small Business Administration (“SBA”). On March 28, 2012, our wholly-ownedwholly owned subsidiary, Saratoga Investment Corp. SBIC LP (“SBIC LP”), received an SBIC license from the SBA.Small Business Administration (the “SBA”). On August 14, 2019, our wholly-ownedwholly owned subsidiary, Saratoga Investment Corp. SBIC II LP (“SBIC II LP”), also received an SBIC license from the SBA. On September 29, 2022, our wholly owned subsidiary, Saratoga Investment Corp. SBIC III LP (“SBIC III LP” and, together with SBIC LP and SBIC II LP, the “SBIC Subsidiaries”), also received an SBIC license from the SBA, which provides up to $175.0 million in additional long-term capital in the form of SBA-guaranteed debentures. As a result, Saratoga’s SBA relationship increased from $150.0$325.0 million to $325.0$350.0 million of committed capital. The SBIC LP and SBIC II LP are regulated by the SBA. For two or more SBIC’sSBICs under common control, the maximum amount of outstanding SBA debentures cannot exceed $350.0 million. Our wholly-ownedwholly owned SBIC subsidiariesSubsidiaries are able to borrow funds from the SBA against the SBIC’s regulatory capital (which generally approximates equity capital)capital in the respective SBIC) and is subject to customary regulatory requirements, including, but not limited to, anperiodic examination by the SBA. Following the debentures being fully repaid to the SBA, SBIC LP surrendered its license on January 3, 2024, providing the Company access to all undistributed capital of SBIC LP, and SBIC LP subsequently merged with and into the Company. See “Item 1. Business—Small Business Investment Company Regulations.”
We received exemptive relief from the U.S. Securities and Exchange Commission (“SEC”(the “SEC”) to permit us to exclude the senior securities issued by ofthe SBIC LP and SBIC II LPSubsidiaries from the definition of senior securities in the asset coverage requirement under the 1940 Act. This allows the Company increased flexibility under the asset coverage requirement by permitting it to borrow up to $325.0$350.0 million more than it would otherwise be able to absent the receipt of this exemptive relief.
The Company has established wholly-ownedwholly owned subsidiaries, SIA-AAP, Inc., SIA-ARC, Inc., SIA-Avionte, Inc., SIA-AX, Inc., SIA-G4, Inc., SIA-GH, Inc., SIA-MAC, Inc., SIA-PEP,SIA-MDP, Inc., SIA-PP Inc., SIA-SZ, Inc., SIA-TG, Inc., SIA-TT, Inc., SIA-Vector, Inc. and SIA-VR, Inc., which are structured as Delaware entities orthat are treated as corporations for U.S. federal income tax blockers,purposes and are intended to holdfacilitate the Company’s compliance with the requirements to be treated as a RIC under the Code by holding equity or equity-like investments in portfolio companies organized as limited liability companies, or LLCs or(or other forms of pass through entities.entities). These entities are consolidated for accounting purposes but are not consolidated for U.S. federal income tax purposes and may incur U.S. federal income tax expenses as a result of their ownership of portfolio companies. In February 2022, SIA-GH, Inc., SIA-TT Inc. and SIA-VR, Inc. received an approved plan of liquidationwas liquidated following the sale of equity held by each of the portfolio companies. Tax blockers are consolidated for accounting purposes but are not consolidated for income tax purposescompanies and may incur income tax expense as a resultwill be dissolved following the end of their ownership of portfolio companies.the entity’s indemnification period.
During the fiscal year ended February 29, 2020, the Company sold its interest in SIA-Easy Ice, LLC. See Management’s Discussion and Analysis for additional discussion.
On October 26, 2021, the Company and TJHA JV I LLC (“TJHA”) entered into a Limited Liability Company Agreement (the “LLC Agreement”) to co-manage SLF JV. SLF JV is invested in Saratoga Investment Corp Senior Loan Fund 2021-1 Ltd (“SLF 2021”), which is a wholly owned subsidiary of SLF JV. SLF 2021 was formed for the purpose of making investments in a diversified portfolio of broadly syndicated first lien and second lien term loans or bonds in the primary and secondary markets. The Company and TJHA have equal voting interest on all material decisions with respect to SLF JV, including those involving its investment portfolio, and equal control of corporate governance. No management fee is charged to SLF JV as control and management of SLF JV is shared equally. The Company and TJHA have committed to provide up to a combined $50.0 million of financing to SLF JV through cash contributions, with the Company providing $43.75 million and TJHA providing $6.25 million, resulting in an 87.5% and 12.5% ownership between the two parties. The financing is issued in the form of an unsecured note and equity. The unsecured note will pay a fixed rate of 10.0% per annum and is due and payable in full on October 20, 2033. As of February 29, 2024, the Company and TJHA’s investment in SLF JV consisted of an unsecured note of $17.6 million and $2.5 million, respectively; and membership interest of $17.6 million and $2.5 million, respectively. For the year ended February 29, 2024, the Company earned $1.8 million of interest income related to SLF JV, which is included in interest income. SLF JV’s initial investment in SLF 2022 was in the form of an unsecured loan. The unsecured loan paid a floating rate of LIBOR plus 7.00% per annum and was due and payable in full on June 9, 2023. The unsecured loan was repaid in full on October 28, 2022, as part of the CLO closing. The Company has determined that SLF JV is an investment company under Financial Accounting Standards Board (“FASB”) Accounting Standards Codification (“ASC”) Topic 946, Financial Services—Investment Companies; however, in accordance with such guidance the Company will generally not consolidate its investment in a company other than a wholly owned investment company subsidiary. SLF JV is not a wholly owned investment company subsidiary as the Company and TJHA each have an equal 50% voting interest in SLF JV and thus neither party has a controlling financial interest. Furthermore, ASC Topic 810, Consolidation, concludes that in a joint venture where both members have equal decision-making authority, it is not appropriate for one member to consolidate the joint venture since neither has control. Accordingly, the Company does not consolidate SLF JV.
Corporate Information
Corporate History and Information
We commenced operations, at the time known as GSC Investment Corp., on March 23, 2007 and completed an initial public offering of shares of common stock on March 28, 2007. Prior to July 30, 2010, we were externally managed and advised by GSCP (NJ), L.P., an entity affiliated with GSC Group, Inc. In connection with the consummation of a recapitalization transaction on July 30, 2010, we engaged Saratoga Investment Advisors (“SIA”) to replace GSCP (NJ), L.P. as our investment adviser and changed our name to Saratoga Investment Corp.
The recapitalization transaction consisted of (i) the private sale of 986,842 shares of our common stock for $15.0 million in aggregate purchase price to Saratoga Investment Advisors and certain of its affiliates and (ii) the entry into a $40.0 million senior secured revolving credit facility with Madison Capital Funding LLC (the “Madison Credit Facility”). We used the net proceeds from the private sale of shares of our common stock and a portion of the funds available to us under the Madison Credit Facility to pay the full amount of principal and accrued interest, including default interest, outstanding under our revolving securitized credit facility with Deutsche Bank AG, New York Branch (“Deutsche Bank”). Specifically, in July 2009, we had exceeded permissible borrowing limits under the revolving securitized credit facility with Deutsche Bank, which resulted in an event of default under the revolving securitized credit facility. As a result of the event of default, Deutsche Bank had the right to accelerate repayment of the outstanding indebtedness under the revolving securitized credit facility and to foreclose and liquidate the collateral pledged under the revolving securitized credit facility. The revolving securitized credit facility with Deutsche Bank was terminated in connection with our payment of all amounts outstanding thereunder on July 30, 2010. In January 2011, we registered for public resale by Saratoga Investment Advisors and certain of its affiliates the 986,842 shares of our common stock issued to them in the recapitalization.
The Company has formed a wholly owned special purpose entity, Saratoga Investment Funding II LLC, a Delaware limited liability company (“SIF II”), for the purpose of entering into a $50.0 million senior secured revolving credit facility with Encina Lender Finance, LLC (the “Lender”), supported by loans held by SIF II and pledged to the Lender under the credit facility (the “Encina Credit Facility”). The Encina Credit Facility closed on October 4, 2021. During the first two years following the closing date, SIF II may request an increase in the commitment amount under the Encina Credit Facility to up to $75.0 million. The terms of the Encina Credit Facility require a minimum drawn amount of $12.5 million at all times during the first six months following the closing date, which increases to the greater of $25.0 million or 50% of the commitment amount in effect at any time thereafter. The term of the Encina Credit Facility is three years. Advances under the Encina Credit Facility bear interest at a floating rate per annum equal to LIBOR plus 4.0%, with LIBOR having a floor of 0.75%, with customary provisions related to the selection by the Lender and the Company of a replacement benchmark rate. Concurrently with the closing of the Encina Credit Facility, all remaining amounts outstanding on the Company’s existing revolving credit facility with Madison Capital Funding, LLC were repaid and the revolving credit facility terminated.
As noted above, on March 28, 2012, our wholly-owned subsidiary, SBIC LP, received an SBIC license from the SBA and on August 14, 2019, our wholly-owned subsidiary, SBIC II LP, also received an SBIC license from the SBA.
On October 26, 2021, the Company and TJHA JV I LLC entered into a Limited Liability Company Agreement (the “LLC Agreement”) to co-manage the SLF JV. SLF JV is a joint venture that is expected to invest in the debt or equity interests of collateralized loan obligations, loans, notes and other debt instruments.
Our corporate offices are located at 535 Madison Avenue, New York, New York 10022. Our telephone number is (212) 906-7800. We maintain a website on the Internet at www.saratogainvestmentcorp.com. Information contained on our website is not incorporated by reference into this Annual Report, and you should not consider that information to be part of this Annual Report.
Saratoga Investment Advisors
General
Our Investment Adviser was formed in 2010 as a Delaware limited liability company and became our investment adviser in July 2010. Our Investment Adviser is led by four principals, Christian L. Oberbeck, Michael J. Grisius, Thomas V. Inglesby, and Charles G. Phillips, with 36, 34, 32, 3537 and 2527 years of experience in leveraged finance, respectively, and the Chief Financial Officer, and Chief Compliance Officer, Treasurer and Secretary, Henri J. Steenkamp, who has 2325 years of experience in financial services and leveraged finance. Our Investment Adviser is affiliated with Saratoga Partners, a middle marketmiddle-market private equity investment firm. Saratoga Partners was established in 1984 to be the middle marketmiddle-market private investment arm of Dillon Read & Co. Inc. and has been independent of Dillon Read & Co. Inc. and its successor entity, SBC Warburg Dillon Read, since 1998. Saratoga Partners has a 34-year35-year history of private investments in middle marketmiddle-market companies and focuses on public and private equity, preferred stock, and senior and mezzanine debt investments.
Our Relationship with Saratoga Investment Advisors
We utilize the personnel, infrastructure, relationships and experience of Saratoga Investment Advisors to enhance the growth of our business. We currently have no employees and each of our executive officers is also an officer of Saratoga Investment Advisors.
We have entered into an investment advisory and management agreement (the “Management Agreement”) with Saratoga Investment Advisors. Pursuant to the 1940 Act, the initial term of the Management Agreement was for two years from its effective date of July 30, 2010, with automatic, one-year renewals, to beand will remain in effect on a year-to-year basis if approved annually at an in-person meeting of the board of directors, a majority of whom must not be “interested persons” (as defined in Section 2(a)(19) of the 1940 Act) of the Company (“independent directors”). Ourdirectors. Most recently, our board of directors approved the renewal of the Management Agreement for an additional one-year term at a video conferencean in-person meeting held on July 6, 2021. In reliance on certain exemptive relief provided by the SEC in connection with the COVID-19 pandemic, our board undertook to ratify the renewal of the Management Agreement at its next in-person meeting held on October 4, 2021, which was duly done.2023. Pursuant to the Management Agreement, Saratoga Investment Advisors implements our business strategy on a day-to-day basis and performs certain services for us under the direction of our board of directors. Saratoga Investment Advisors is responsible for, among other duties, performing all of our day-to-day functions, determining investment criteria, sourcing, analyzing and executing investment transactions, asset sales, financings and performing asset management duties.
Saratoga Investment Advisors has formed an investment committee to advise and consult with its senior management team with respect to our investment policies, investment portfolio holdings, financing and leveraging strategies and investment guidelines. We believe that the collective experience of the investment committee members across a variety of fixed income asset classes will benefit us. The investment committee must unanimously approve all investments in excess of $1.0 million made by us. In addition, all sales of our investments must be approved by all four of our investment committee members. The current members of the investment committee are Messrs. Oberbeck, Grisius, Inglesby, and Phillips.
We pay Saratoga Investment Advisors a fee for investment advisory and management services consisting of two components—a base management fee and an incentive fee. The base management fee is calculated at an annual rate of 1.75% of our average gross assets, which includes assets purchased with borrowed funds but excludes cash and cash equivalents. As a result, Saratoga Investment Advisors will benefit as we incur debt or use leverage to purchase assets. Our board of directors will monitor the conflicts presented by this compensation structure by approving the amount of leverage that we may incur.
In addition to the base management fee, we pay Saratoga Investment Advisors an incentive fee, which consists of two parts. First, we pay Saratoga Investment Advisors an incentive fee with respect to our pre-incentive fee net investment income in each calendar quarter as follows:
There is no accumulation of amounts from quarter to quarter on either the hurdle rate or the parameters set by the “catch-up” mechanism or any claw back of amounts previously paid to Saratoga Investment Advisors if subsequent quarters are below the quarterly hurdle or the “catch-up” parameters. Furthermore, there is no delay of payment to Saratoga Investment Advisors if prior quarters are below the quarterly hurdle or “catch-up.”
Pre-incentive fee net investment income means interest income, dividend income and other income (including any other fees, such as commitment, origination, structuring, diligence, managerial and consulting fees or other fees that we receive from portfolio companies) earned during the calendar quarter, minus our operating expenses for the quarter. Pre-incentive fee net investment income does not include any realized capital gains, realized capital losses, unrealized capital appreciation or depreciation, or realized gains or losses resulting from the extinguishment of our own debt.
The second part of the incentive fee is determined and payable in arrears as of the end of each fiscal year (or upon termination of the Management Agreement) and equals 20.0% of our “incentive fee capital gains,” which equals our realized capital gains on a cumulative basis from May 31, 2010 through the end of the fiscal year, if any, computed net of all realized capital losses and unrealized capital depreciation on a cumulative basis on each investment in the Company’s portfolio, less the aggregate amount of any previously paid capital gain incentive fee. Importantly, the capital gains portion of the incentive fee is based on realized gains and realized and unrealized losses from May 31, 2010. Therefore, realized and unrealized losses incurred prior to such time will not be taken into account when calculating the capital gains portion of the incentive fee, and our Manager will be entitled to 20.0% of incentive fee capital gains that arise after May 31, 2010. In addition, for the purpose of the “incentive fee capital gains” calculations, the cost basis for computing realized gains and losses on investments held by us as of May 31, 2010 will equal the fair value of such investments as of such date.
We have also entered into a separate Administration Agreement (the “Administration Agreement”) with Saratoga Investment Advisors pursuant to which Saratoga Investment Advisors furnishes us with office facilities, equipment and clerical, bookkeeping and record keeping services. The Administration Agreement has an initial term of two years from its effective date of July 30, 2010, with automatic one-year renewals,and will remain in effect on a year-to-year basis, subject to annual approval by our board of directors, a majority of whom must be our independent directors. OnMost recently, on July 8, 2015, our board of directors approved the renewal of the Administration Agreement for an additional one-year term and determined to increase the cap on the payment or reimbursement of expenses by us thereunder to $1.3 million. On July 7, 2016, our board of directors approved the renewal of the Administration Agreement for an additional one-year term. On October 5, 2016, our board of directors determined to increase the cap on the payment or reimbursement of expenses by the Company under the Administration Agreement, from $1.3 million to $1.5 million, effective November 1, 2016. On July 11, 2017,6, 2023, our board of directors approved the renewal of the Administration Agreement for an additional one-year term and determined to increase the cap on the payment or reimbursement of expenses by the Company from $1.5$3.275 million to $1.75$4.3 million effective August 1, 2017. On July 9, 2018, our board of directors approved the renewal of the Administration Agreement for an additional one-year term and determined to increase the cap on the payment or reimbursement of expenses by the Company from $1.75 million to $2.0 million, effective August 1, 2018. On July 9, 2019, our board of directors approved the renewal of the Administration Agreement for an additional one-year term and determined to increase the cap on the payment or reimbursement of expenses by the Company from $2.0 million to $2.225 million effective August 1, 2019. On July 7, 2020, our board of directors approved the renewal of the Administration Agreement for an additional one-year term and determined to increase the cap on the payment or reimbursement of expenses by the Company from $2.225 million to $2.775 million effective August 1, 2020. On July 6, 2021, our board of directors approved the renewal of the Administration Agreement for an additional one-year term and determined to increase the cap on the payment or reimbursement of expenses by the Company from $2.775 million to $3.0 million effective August 1, 2021.2023. Under the Administration Agreement, Saratoga Investment Advisors also performs, or oversees the performance of our required administrative services, which include, among other things, being responsible for the financial records which we are required to maintain, preparing reports for our stockholders and reports required to be filed with the SEC. Payments under the Administration Agreement will be equal to an amount based upon the allocable portion of Saratoga Investment Advisors’ overhead in performing its obligations under the Administration Agreement, including rent and the allocable portion of the cost of our officers and their respective staffs relating to the performance of services under the Administration Agreement.
Investments
Our portfolio is comprised primarily of investments in leveraged loans (both first and second lien term loans) issued by middle marketmiddle-market companies. Investments in middle marketmiddle-market companies are generally less liquid than equivalent investments in companies with larger capitalizations. These investments are sourced in both the primary and secondary markets through a network of relationships with commercial and investment banks, commercial finance companies and financial sponsors. The leveraged loans that we purchase are generally used to finance buyouts, strategic acquisitions, growth initiatives, recapitalizations and other types of transactions. Leveraged loans are generally senior debt instruments that rank ahead of subordinated debt which are invested by companies with below investment grade or “junk” ratings or, if not rated, would be rated below investment grade or “junk” and, as a result, carry a higher risk of default. Leveraged loans also have the benefit of security interests on the assets of the portfolio company, which may rank ahead of, or be junior to, other security interests. For a discussion of the risks pertaining to our secured investments, see Part I. Item 1A. “Risk Factors—Our investments may be risky, and you could lose all or part of your investment.”
As part of our long-term strategy, we also invest in mezzanine debt and make equity investments in middle marketmiddle-market companies. Mezzanine debt is typically unsecured and subordinated to senior debt of the portfolio company. See Part I. Item 1A. “Risk Factors—If we make unsecured debt investments, we may lack adequate protection in the event our portfolio companies become distressed or insolvent and will likely experience a lower recovery than more senior debtholders in the event our portfolio companies default on their indebtedness.”
Substantially all of the debt investments held in our portfolio hold a non-investment grade rating by one or more rating agencies or, if not rated, would be rated below investment grade if rated, which are often referred to as “junk.” As of February 28, 2022, 87.3%29, 2024, 77.8% of our debt portfolio at fair value consisted of debt securities for which issuers were not required to make principal payments until the maturity of such debt securities, which could result in a substantial loss to us if such issuers are unable to refinance or repay their debt at maturity. Such “interest-only” loans are structured such that the borrower makes only interest payments throughout the life of the loan and makes a large, “balloon payment” at the end of the loan term. The ability of a borrower to make or refinance a balloon payment may be affected by a number of factors, including the financial condition of the borrower, prevailing economic conditions, higher interest rates, and collateral values. If the interest-only loan borrower is unable to make or refinance a balloon payment, we may experience greater losses than if the loan were structured as amortizing. As of February 28, 2022, 12.9%29, 2024, 19.7% of our interest-only loans provided for contractual PIK interest, which represents contractual interest added to a loan balance and due at the end of such loan’s term, and 26.3%49.6% of such investments elected to pay a portion of interest due in PIK. In addition, 95.7%99.5% of our debt investments at February 28, 2022,29, 2024, had variable interest rates that reset periodically based on benchmarks such as LIBOR, BSBY, SOFR and the prime rate. As a result, significant increases in such benchmarks in the future may make it more difficult for these borrowers to service their obligations under the debt investments that we hold.
As a BDC, we are required to comply with certain regulatory requirements. For instance, as a BDC, we may not acquire any assets other than “qualifying assets” as specified in the 1940 Act unless, at the time of and after giving effect to such acquisition, at least 70% of our total assets are qualifying assets. See “Business—Business Development Company Regulations – Qualifying Assets.”
While our primary focus is to generate current income and capital appreciation from our debt and equity investments in middle marketmiddle-market companies, we may invest up to 30.0% of the portfolio in opportunistic investments in order to seek to enhance returns to stockholders. Such investments may include investments in distressed debt, private equity, securities of public companies that are not thinly traded, joint ventures and structured finance vehicles such as collateralized loan obligation funds. Although we have no current intention to do so, to the extent we invest in private equity funds, we will limit our investments in entities that are excluded from the definition of “investment company” under Section 3(c)(1) or Section 3(c)(7) of the 1940 Act, which includes private equity funds, to no more than 15% of its net assets.
Leveraged loans
Our leveraged loan portfolio is comprised primarily of first lien and second lien term loans. First lien term loans are secured by a first priority perfected security interest on all or substantially all of the assets of the borrower and typically include a first priority pledge of the capital stock of the borrower. First lien term loans hold a first priority with regard to right of payment. Generally, first lien term loans offer floating rate interest payments, have a stated maturity of five to seven years, and have a fixed amortization schedule. First lien term loans generally have restrictive financial and negative covenants. Second lien term loans are secured by a second priority perfected security interest on all or substantially all of the assets of the borrower and typically include a second priority pledge of the capital stock of the borrower. Second lien term loans hold a second priority with regard to right of payment. Second lien term loans offer either floating rate or fixed rate interest payments, generally have a stated maturity of five to eight years and may or may not have a fixed amortization schedule. Second lien term loans that do not have fixed amortization schedules require payment of the principal amount of the loan upon the maturity date of the loan. Second lien term loans have less restrictive financial and negative covenants than those that govern first lien term loans.
Mezzanine debt
Mezzanine debt usually ranks subordinate in priority of payment to senior debt and is often unsecured. However, mezzanine debt ranks senior to common and preferred equity in a borrowers’ capital structure. Mezzanine debt typically has fixed rate interest payments and a stated maturity of six to eight years and does not have fixed amortization schedules.
In some cases, our debt investments may provide for a portion of the interest payable to be payment-in-kind interest (“PIK”). To the extent interest is PIK, it will be payable through the increase of the principal amount of the obligation by the amount of interest due on the then-outstanding aggregate principal amount of such obligation.
Equity Investments
Equity investments may consist of preferred equity that is expected to pay dividends on a current basis in the form of cash or additional equity or preferred equity that does not pay current dividends. Preferred equity at times may also have PIK interest payable. Preferred equity generally has a preference over common equity as to distributions on liquidation and dividends. In some cases, we may acquire common equity. In general, our equity investments are not control-oriented investments and we expect that in many cases we will acquire equity securities as part of a group of private equity investors in which we are not the lead investor.
Opportunistic Investments
Opportunistic investments may include investments in distressed debt, which may include securities of companies in bankruptcy, debt and equity securities of public companies that are not thinly traded, emerging market debt, structured finance vehicles such as collateralized loan obligation funds and debt of middle marketmiddle-market companies located outside the United States. See Note 4 and Note 5 for more information about Saratoga CLO and SLF JV and SLF 2022.
On January 22, 2008, GSC Group, Inc., as asset manager, with Lehman Brothers raising the financing, entered into a collateral management agreement with Saratoga CLO. Saratoga CLO was structured with five tranches of debt, plus residual notes. Saratoga CLO’s five tranches of debt were purchased by a wide variety of CLO debt market participants. In addition, we purchased for $30.0 million all of the outstanding subordinated notes of Saratoga CLO.
Pursuant to its terms, the investment period for Saratoga CLO ended in January 2013, and certain restrictions in such terms limited portfolio reinvestment. As a result, the Company determined that it was in its best interest to refinance Saratoga CLO given its investment attractiveness.attractiveness, and has refinanced this multiple times since then. The Company did not originate any of the loan assets included in the formation of Saratoga CLO, nor has it done so since the subsequent refinancing transaction.transactions. Moreover, the Company does not expect to originate any of the loans in the Saratoga CLO portfolio prospectively. The Company has from time to time co-invested in loans with the Saratoga CLO. The Company currently has no co-investments between it and Saratoga CLO.
With respect to our advisory services to Saratoga CLO, and in particular the underwriting standards used when determining which investments qualify for inclusion in the Saratoga CLO, they are substantially similar to the process employed in selecting the Company’s investments. All of the credit metrics for a Saratoga CLO investment are reviewed and documented in the same manner as they would be for an investment for the Company, with some minor differences. For example, the Saratoga CLO investment process also includes multiple rating agency review and analysis of the loan investment and the assigned corporate ratings, which typically does not apply to a prospective investment of the Company. Lastly, a Saratoga CLO investment also considers the likely secondary liquidity of the loan in considering the investment, whereas the Company’s investments are generally illiquid.
The Saratoga CLO investment period was initially refinanced in October 2013 and its reinvestment period extended to October 2016. On November 15, 2016, we completed a second refinancing of the Saratoga CLO with its reinvestment period extended to October 2018. On December 14, 2018, we completed a third refinancing and upsize of the Saratoga CLO (the “2013-1 Reset CLO Notes”). This refinancing, among other things, extended the non-call period and reinvestment period to January 20, 2020 and January 20, 2021, respectively, and extended its legal final date to January 20, 2030. Following this refinancing, the Saratoga CLO portfolio increased from approximately $300.0 million in aggregate principal amount to approximately $500.0 million of predominantly senior secured first lien term loans. As part of the refinancing of its liabilities, we also purchased $2.5 million in aggregate principal amount of the Class F-R-2 and $7.5 million aggregate principal amount of the Class G-R-2 notes tranches of the Saratoga CLO at par, with a coupon of LIBOR plus 8.75% and LIBOR plus 10.00%, respectively. We also redeemed our existing $4.5 million aggregate principal amount of the Class F Notes tranche of the Saratoga CLO at par. The Class F-R-2 Notes and Class G-R-2 Notes tranches are the seventh and eighth tranches in the capital structure of Saratoga CLO and are subordinated to the other debt classes of Saratoga CLO, respectively. The Class F-R-2 and Class G-R-2 tranches are senior to the subordinated notes, which is effectively the equity position in Saratoga CLO. As a result, the other tranches of debt in Saratoga CLO rank ahead of the $2.5 million Class F-R-2 tranche and $7.5 million Class G-R-2 tranche and ahead of the aggregate principal amount of our position in the subordinated notes, with respect to priority of payments in the event of a default or a liquidation. We also purchased an aggregate principal amount of $39.5 million of subordinated notes, which is in addition to the $30.0 million of subordinated notes issued in 2013 that were reset with an extended legal final date to January 20, 2030. Following the refinancing, Saratoga Investment Corp. owns 100% of the Class F-R-2, Class G-R-2 and the subordinated notes of the Saratoga CLO. On February 11, 2020, we entered into an unsecured loan agreement (“CLO 2013-1 Warehouse 2 Loan”) with Saratoga Investment Corp. CLO 2013-1 Warehouse 2, Ltd (“CLO 2013-1 Warehouse 2”), a wholly-ownedwholly owned subsidiary of Saratoga CLO, pursuant to which CLO 2013-1 Warehouse 2 may borrow from time to time up to $20.0 million from the Company in order to provide capital necessary to support warehouse activities. On October 23, 2020, the CLO 2013-1 Warehouse 2 Loan was increased to $25.0 million availability, which was immediately fully drawn. The interest rate was also amended to be based on a pricing grid, starting at an annual rate of 3M USD LIBOR + 4.46%. On February 26, 2021, the Company completed the fourth refinancing of the Saratoga CLO. This refinancing, among other things, extended the Saratoga CLO reinvestment period to April 2024, and extended its legal maturity to April 2033. A non-call period ending February 2022 was also added. In addition, and as part of the refinancing, the Saratoga CLO has also been upsized from $500 million in assets to approximately $650 million. As part of this refinancing and upsizing, the Company invested an additional $14.0 million in all of the newly issued subordinated notes of the Saratoga CLO, and purchased $17.9 million in aggregate principal amount of the Class F-R-3 Notes tranche at par. Concurrently, the existing $2.5 million of Class F-R-2 Notes, $7.5 million of Class G-R-2 Notes and $25.0 million CLO 2013-1 Warehouse 2 Loan were repaid. The Company also paid $2.6 million of transaction costs related to the refinancing and upsizing on behalf of the Saratoga CLO, to be reimbursed from future equity distributions. On August 9, 2021, the Company exchanged its existing $17.9 million Class F-R-3 Notes for $8.5 million Class F-1-R-3 Notes and $9.4 million Class F-2-R-3 NoteNotes at par. On August 11, 2021, the Company sold its Class F-1-R-3 Notes to third parties, resulting in a realized loss of $0.1 million. At August 31, 2021, the outstanding receivable of $2.6 million was repaid in full. After the current end of the reinvestment period ends in April 2024, the Company willcontinues to consider refinancing the Saratoga CLO, subject to market conditions. A refinancing transaction entails finding existing and new investors that are willing to provide debt financing to Saratoga CLO which extends the investment period of the CLO on terms that are acceptable to it and in an amount sufficient to allow it to repay all of its existing debt holders. IfPrior to refinancing Saratoga CLO is unable to refinance itsCLO’s indebtedness by April 2024, thenafter, Saratoga CLO will be required to use investment repayments by portfolio companies received thereafterafter April 2024 to repay its outstanding indebtedness.
At February 28, 2022,29, 2024, the aggregate fair value of our investments in Saratoga Investment Corp. CLO 2013-1 F-2-R-3 Notes and subordinated notes of the Saratoga CLO was $9.4$8.9 million and $28.7$9.5 million, respectively.
The terms of the subordinated notes of Saratoga CLO entitles the Company to the residual net interest income in Saratoga CLO, which is paid on a quarterly basis after payment of all expenses, assuming that the Saratoga CLO remains in compliance with its various debt and rating agency compliance tests. The Company’s investment in the subordinated notes of Saratoga CLO can be sold or transferred at any time. The Company has held 100% of the subordinated notes of Saratoga CLO since the inception of Saratoga CLO.
Generally, the interests of the holders of the various classes of securities issued by the Saratoga CLO are aligned with the interests of the Company as holder of the subordinated notes. The investors in the various debt tranches of the securities issued by the Saratoga CLO are interested in the regular payment of interest income from the Saratoga CLO and the overcollateralization of the underlying loan assets relative to the Saratoga CLO debt issued. On the other hand, the subordinated note holders might prefer purchasing higher yielding riskier assets that could increase returns while the returns of the holders of the debt securities remain unchanged.
With respect to the collateral management agreement that the Company has entered into with Saratoga CLO, while the agreement is similar to the investment advisory and management agreement between the Company and Saratoga Investment Advisors in that it is an asset management agreement, there are material differences between the two. For example, pursuant to Section 15 of the 1940 Act, the Management Agreement with Saratoga Investment Advisors has an initial term of two years, with annual renewals to be approved at an in-person meeting of the Company’s board of directors. The contract can be terminated by the Company’s board of directors or stockholders with 60 days’ notice, with no penalty for termination. The collateral management agreement that the Company has entered into with Saratoga CLO, on the other hand, has no renewal requirement. The Saratoga CLO collateral management agreement may be terminated for cause at the direction of a majority of the most senior class of the Saratoga CLO securities then outstanding, excluding any securities held by the Company or any affiliate thereof or any other entity over which the Company or an affiliate thereof has discretionary authority over voting such securities, which securities are disregarded for this purpose. If the Saratoga CLO collateral management agreement is terminated, the manager remains in place until a new manager is appointed by the issuer at the direction of either (i) a majority of the Saratoga CLO subordinated notes, and not rejected by a majority of the most senior class of CLO securities then outstanding, or (ii) a majority of the most senior class of CLO securities then outstanding, and not rejected by a majority of the Saratoga CLO subordinated notes, in each case within 20 days of notice of a vote regarding the successor manager. If no successor investment manager shall have been appointed within 120 days after the date of notice of resignation by the investment manager, the resigning investment manager, a majority of the controlling class or a majority of the subordinated notes may petition any court of competent jurisdiction for the appointment of a successor investment manager without the approval of the holders of the notes. We receive a base management fee of 0.10% per annum and a subordinated management fee of 0.40% per annum of the outstanding principal amount of Saratoga CLO’s assets, paid quarterly to the extent of available proceeds. Prior to the second refinancing and the issuance of the 2013-1 Amended CLO Notes, we received a base management fee of 0.25% per annum and a subordinated management fee of 0.25% per annum of the outstanding principal amount of Saratoga CLO’s assets, paid quarterly to the extent of available proceeds. Following the third refinancing and the issuance of the 2013-1 Reset CLO Notes on December 14, 2018, we are no longer entitled to an incentive management fee equal to 20.0% of excess cash flow to the extent the Saratoga CLO subordinated notes receive an internal rate of return paid in cash equal to or greater than 12.0%.
The securities issued by the Saratoga CLO do not have any external credit enhancement features that would minimize the potential losses to the subordinated notes. Saratoga CLO recognized realized losses on extinguishment of debt of approximately $3.0 million, $1.2 million, $6.1 million and $3.4 million in the fiscal years ended February 28, 2021, February 28, 2019, February 28, 2017 and February 28, 2014, respectively, related to the February 2021, December 2018, November 2016 and October 2013 refinancing, primarily as a result of repurchasing securities at par at the refinancing that was previously issued at a discount, as well as the acceleration of the amortization of the legal and accounting costs associated with the refinancing. The cost of the refinancing was effectively borne by the Company as the holder of the subordinated notes in Saratoga CLO. The indenture for the Saratoga CLO contemplates the issuance of additional securities from time to time, pursuant to an amendment to the indenture and subject to various requirements and conditions, including the consent of the Company (in its capacity as investment manager) and the consent of the of the holders of a majority of the subordinated notes (all of which are held by the Company) and, except in certain limited circumstances, the consent of the holders of a majority (by principal amount) the Class A-1 Notes. The Saratoga CLO could also issue additional securities pursuant to a refinancing of the existing securities. The costs of any such future refinancing would effectively be borne by the Company as the holder of the subordinated notes in Saratoga CLO. On August 9, 2021, the Company exchanged its existing $17.9 million Class F-R-3 Notes for $8.5 million Class F-1-R-3 Notes and $9.4 million Class F-2-R-3 Notes at par. On August 11, 2021, the Company sold its Class F-1-R-3 Notes to third parties, resulting in a realized loss of $0.1 million.
The Company does not believe that any representations or warranties made by the Company as manager of Saratoga CLO or investor in the subordinated notes could materially affect the Company. However, because the Company acts as the collateral manager to Saratoga CLO, it may be subject to claims by third-party investors in Saratoga CLO for alleged or actual negligent acts, errors or omissions or breach of fiduciary duties committed in the scope of performing its services as the collateral manager.
As of February 28, 2022,29, 2024, the Saratoga CLO portfolio consisted of $660.2$640.8 million in aggregate principal amount of primarily senior secured first lien term loans. At February 28, 2022, 98.7%29, 2024, 94.8% of the Saratoga CLO portfolio consisted of such loans to 334347 borrowers with an average exposure to each borrower of $1.9$1.8 million. The weighted average maturity of the portfolio is 4.814.07 years. In addition, Saratoga CLO held $6.2$12.1 million in cash at February 28, 2022.29, 2024. Our investments in the Saratoga CLO falls into our 30% “bucket” of non-qualifying assets under the 1940 Act and currently has an aggregate cost basis of approximately $32.3 million, which is net of all principal payments made by Saratoga CLO on the Company’s total investment in the subordinate notes of Saratoga CLO is $57.8 which consists of additional investments of $30 million in January 2008, $13.8 million in December 2018 and $14.0 million in February 2021.
On October 26, 2021, the Company and TJHA JV I LLC entered into the LLC Agreement to co-manage SLF JV. SLF JV is a joint venture that is expected to investinvests in the debt or equity interests of collateralized loan obligations, loans, notes and other debt instruments. As of February 28, 2022,29, 2024, the Company has membership interests with a fair value of $12.0$9.4 million and an unsecured loan with a fair value of $13.1$15.8 million in the SLF JV.JV, and an investment in the Class E notes of the SLF JV’s wholly owned CLO (“SLF 2022”) with a fair value of $12.3 million. As of February 28, 2022,29, 2024, the SLF JV has an unsecured loaninvestment in the subordinated debt of SLF 2022 with a fair value of $28.7 million in a CLO warehouse.$30.7 million.
Prospective portfolio company characteristics
Our Investment Adviser generally selects portfolio companies with one or more of the following characteristics:
| ● | a history of generating stable earnings and strong free cash flow; |
| ● | well-constructed balance sheets with the ability to withstand industry cycles, supported by sustainable enterprise values; |
| ● | reasonable debt-to-cash flow multiples; |
| ● | exceptional management with meaningful stake; |
| ● | industry leadership with competitive advantages and sustainable market shares and growth prospects in attractive and healthy sectors; and |
| ● | capital structures that provide appropriate terms and reasonable covenants. |
Investment selection
In managing us, Saratoga Investment Advisors employs the same investment philosophy and portfolio management methodologies used by Saratoga Partners. Through this investment selection process, based on quantitative and qualitative analysis, Saratoga Investment Advisors seeks to identify portfolio companies with superior fundamental risk-reward profiles and strong, defensible business franchises with the goal of minimizing principal losses while maximizing risk-adjusted returns. Saratoga Investment Advisors’ investment process emphasizes the following:
| ● | bottom-up, company-specific research and analysis; |
| ● | capital preservation, low volatility and minimization of downside risk; and |
| ● | investing with experienced management teams that hold meaningful equity ownership in their businesses. |
Our Investment Adviser’s investment process generally includes the following steps:
| ● | Initial screening. A brief analysis identifies the investment opportunity and reviews the merits of the transaction. The initial screening memorandum provides a brief description of the company, its industry, competitive position, capital structure, financials, equity sponsor and deal economics. If the deal is determined to be attractive by the senior members of the deal team, the opportunity is fully analyzed. |
| ● | Full analysis. A full analysis includes: |
| ● | Business and Industry analysis—a review of the company’s business position, competitive dynamics within its industry, cost and growth drivers and technological and geographic factors. Business and industry research often includes meetings with industry experts, consultants, other investors, customers and competitors. |
| ● | Company analysis—a review of the company’s historical financial performance, future projections, cash flow characteristics, balance sheet strength, liquidation value, legal, financial and accounting risks, contingent liabilities, market share analysis and growth prospects. |
| ● | Structural/security analysis—a thorough legal document analysis including but not limited to an assessment of financial and negative covenants, events of default, enforceability of liens and voting rights. |
| ● | Approval of the investment committee. The investment is then presented to the investment committee for approval. The investment committee must unanimously approve all investments in excess of $1 million made by us. In addition, all sales of our investments must be approved by all four of our investment committee members. The members of our investment committee are Christian L. Oberbeck, Michael J. Grisius, Thomas V. Inglesby, and Charles G. Phillips. |
Investment structure
In general, our Investment Adviser intends to select investments with financial covenants and terms that reduce leverage over time, thereby enhancing credit quality. These methods include:
| ● | maintenance leverage covenants requiring a decreasing ratio of debt to cash flow; |
| ● | maintenance cash flow covenants requiring an increasing ratio of cash flow to the sum of interest expense and capital expenditures; and |
| ● | debt incurrence prohibitions, limiting a company’s ability to re-lever. |
In addition, limitations on asset sales and capital expenditures should prevent a company from changing the nature of its business or capitalization without our consent.
Our Investment Adviser seeks, where appropriate, to limit the downside potential of our investments by:
| ● | requiring a total return on our investments (including both interest and potential equity appreciation) that compensates us for credit risk; |
| ● | requiring companies to use a portion of their excess cash flow to repay debt; |
| ● | selecting investments with covenants that incorporate call protection as part of the investment structure; and |
| ● | selecting investments with affirmative and negative covenants, default penalties, lien protection, change of control provisions and board rights, including either observation or participation rights. |
Valuation process
We account for our investments at fair value in accordance with the Financial Accounting Standards Board (“FASB”) Accounting Standards Codification (“ASC”)FASB ASC Topic 820, Fair Value Measurements and DisclosuresMeasurement (“(“ASC 820”), as determined in good faith using written policies and procedures adopted by our board of directors. Investments for which market quotations are readily available are recorded in our consolidated financial statements at such market quotations subject to any decision by our board of directors to approve a fair value determination to reflect significant events affecting the value of these investments. We value investments for which market quotations are not readily available at fair value as determined in good faith by our board of directors based on input from Saratoga Investment Advisors, our audit committee and an independent valuation firm engaged by our board of directors. We use multiple techniques for determining fair value based on the nature of the investment and experience with those types of investments and specific portfolio companies. The selections of the valuation techniques and the inputs and assumptions used within those techniques often require subjective judgements and estimates. These techniques include market comparables, discounted cash flows and enterprise value waterfalls. Fair value is best expressed as a range of values from which the Company determines a single best estimate. The types of inputs and assumptions that may be considered in determining the range of values of our investments include the nature and realizable value of any collateral, the portfolio company’s ability to make payments, market yield trend analysis and volatility in future interest rates, call and put features, the markets in which the portfolio company does business, comparison to publicly traded companies, discounted cash flows and other relevant factors.
We undertake a multi-step valuation process each quarter when valuing investments for which market quotations are not readily available, as described below:
| ● |
| ● |
In addition, all our investments are subject to the following valuation process:
| ● |
| ● |
Our investment in Saratoga CLO is carried at fair value, which is based on a discounted cash flow model that utilizes prepayment, re-investment and loss assumptions based on historical experience and projected performance, economic factors, the characteristics of the underlying cash flow, and comparable yields for equity interests in collateralized loan obligation funds similar to Saratoga CLO, when available, as determined by SIASaratoga Investment Advisors and recommended to our board of directors. Specifically, we use Intex cash flow models, or an appropriate substitute, to form the basis for the valuation of our investment in Saratoga CLO. The models use a set of assumptions including projected default rates, recovery rates, reinvestment raterates and prepayment rates in order to arrive at estimated valuations. The assumptions are based on available market data and projections provided by third parties as well as management estimates. We use the output from the Intex models (i.e., the estimated cash flows) to perform a discounted cash flow analysis on expected future cash flows to determine a valuation for our investment in Saratoga CLO.
Because such valuations, and particularly valuations of private investments and private companies, are inherently uncertain, they may fluctuate over short periods of time and may be based on estimates. The determination of fair value may differ materially from the values that would have been used if a ready market for these investments existed. Our net asset valueNAV could be materially affected if the determinations regarding the fair value of our investments were materially higher or lower than the values that we ultimately realize upon the disposal of such investments.
Rule 2a-5 under the 1940 Act (“Rule 2a-5”) establishes a regulatory framework for determining fair value in good faith for purposes of the 1940 Act. Rule 2a-5 permits boards, subject to board oversight and certain other conditions, to designate the investment adviser to perform fair value determinations. Rule 2a-5 also defines when market quotations are “readily available” for purposes of the 1940 Act and the threshold for determining whether a fund must determine the fair value of a security. Rule 31a-4 under the 1940 Act (“Rule 31a-4”) provides the recordkeeping requirements associated with fair value determinations. While our board of directors has not elected to designate Saratoga Investment Advisors as the valuation designee, the Company has adopted certain revisions to its valuation policies and procedures in order comply with the applicable requirements of Rule 2a-5 and Rule 31a-4.
11
Ongoing relationships with and monitoring of portfolio companies
Saratoga Investment Advisors will closely monitor each investment we make and, when appropriate, will conduct a regular dialogue with both the management team and other debtholders and seek specifically tailored financial reporting. In addition, in certain circumstances, senior investment professionals of Saratoga Investment Advisors may take board seats or board observation seats.
Distributions
Our distributions, if any, will be determined by our board of directors and paid out of assets legally available for distribution. Any such distributions generally will be taxable to our stockholders, including to those stockholders who receive additional shares of our common stock pursuant to our dividend reinvestment plan. Prior to January 2009, we paid quarterly dividends to our stockholders. However, in January 2009, we suspended the practice of paying quarterly dividends to our stockholders and thereafter paid five annual dividend distributions (December 2013, 2012, 2011, 2010 and 2009) to our stockholders since such time, which distributions were made with a combination of cash and the issuance of shares of our common stock as discussed more fully below.
On September 24, 2014, we announced the recommencement of quarterly dividends to our stockholders and have subsequently made distributions under this new policy. We have adopted a dividend reinvestment plan (“DRIP”) that provides for reinvestment of our dividend distributions on behalf of our stockholders unless a stockholder elects to receive cash. As a result, if our board of directors authorizes, and we declare, a cash dividend, then our stockholders who have not “opted out” of the DRIP by the dividend record date will have their cash dividends automatically reinvested into additional shares of our common stock, rather than receiving the cash dividends. We have the option to satisfy the share requirements of the DRIP through the issuance of new shares of common stock or through open market purchases of common stock by the DRIP plan administrator.
In order to maintain our tax treatment as a RIC, we generally must, among other things, for each fiscal year, timely distribute an amount equal to at least 90.0%90% of our ordinary net taxable income and realized net short-term capital gains in excess of realized net long-term capital losses, if any, reduced by deductible expenses. In addition, we will be subject to a non-deductible 4% U.S. federal excise tax to the extent we do not distribute during the calendar year at least (1) 98.0%98% of our net ordinary income for the calendar year, (2) 98.2% of our capital gain net income for the one year period ending on October 31 of the calendar year and (3) any net ordinary income and capital gain net income that we recognized for preceding years, but were not distributed during such years, and on which we paid no U.S. federal income tax. For the 20212023 calendar year, the Company did not make sufficient distributions such that we did incur the U.S. federal excise tax. We may elect to withhold from distributionnot distribute a portion of our ordinary income for the 20222024 calendar year and/or portion of the capital gains in excess of capital losses realized during the one-year period ending October 31, 2022,2024, if any, and, if we do so, we would expect to incur U.S. federal excise taxes as a result.
We may distribute taxable dividends that are payable in cash or shares of our common stock at the election of each stockholder. Under certain applicable provisions of the Code and the Treasury regulations and a revenue procedure issued by the Internal Revenue Service (“IRS”), a RIC may treat a distribution of its own stock as fulfilling its RIC distribution requirements if each stockholder may elect to receive his or her entire distribution in either cash or stock of the RIC, subject toRIC. The IRS has issued a limitationrevenue procedure indicating that this rule will apply if the aggregatetotal amount of cash to be distributed to all stockholders must be at leastis not less than 20% of the aggregate declaredtotal distribution. IfUnder the revenue procedure, if too many stockholders elect to receive their distributions in cash, the cash available for distribution must be allocated among the stockholders electing to receive cash (with the balance of the distribution paid in stock). In no event will any stockholder, electing to receive cash, receive the lesser of (a) the portion of the distribution such shareholder has elected to receive in cash or (b) an amount equal to his or her entire distribution times the percentage limitation on cash available for distribution. If these and certain other requirements are met, for U.S. federal income tax purposes, the amount of the dividend paid in stock will be equal to the amount of cash that could have been received instead of stock. Taxable stockholdersStockholders receiving such distributions will be required to include the full amount of the dividend as ordinary income (or as long-term capital gain or qualified dividend income to the extent such distribution is properly reported as such) to the extent of our current and accumulated earnings and profits for U.S. federal income tax purposes. As a result of receiving distributions in the form of our common stock, a U.S. stockholder may be required to pay tax with respect to such distributions in excess of any cash received. If a U.S. stockholder sells the stock he or she receives as a dividend in order to pay this tax, the sales proceeds may be less than the amount included in income with respect to the dividend, depending on the market price of our stock at the time of the sale. Furthermore, with respect to non-U.S. stockholders, we may be required to withhold U.S. federal tax with respect to such dividends, including in respect of all or a portion of such dividend that is payable in stock. In addition, if a significant number of our stockholders determine to sell shares of our stock in order to pay taxes owed on dividends, it may put downward pressure on the trading price of our stock.
Competition
Competition
Our primary competitors in providing financing to private middle marketmiddle-market companies include public and private investment funds (including private equity funds, mezzanine funds, BDCs and SBICs), commercial and investment banks and commercial financing companies. Additionally, alternative investment vehicles, such as hedge funds, frequently invest in middle-market companies. As a result, competition for investment opportunities at middle-market companies can be intense, and in the past couple of years we believe there has been an increase in the amount of debt capital available on average. This has resulted in a somewhat more competitive environment for making new investments. Many middle-market companies are still unable to raise senior debt financing through traditional large financial institutions, and we believe this approach to financing remains difficult as implementation of U.S. and international financial reforms, such as Basel 3, limits the capacity of large financial institutions to hold non-investment grade leveraged loans on their balance sheets. We believe that many of these financial institutions have deemphasized their service and product offerings to middle-market companies in particular.
Many of our competitors are substantially larger and have considerably greater financial and marketing resources than us. For example, some competitors may have access to funding sources that are not available to us. In addition, some of our competitors may have higher risk tolerances or different risk assessments, which may allow them to consider a wider variety of investments and establish more relationships than us. Furthermore, many of our competitors are not subject to the regulatory restrictions that the 1940 Act imposes on us as a BDC or that the Code imposes on us as a RIC. We use the industry information available to the investment professionals of Saratoga Investment Advisors to assess investment risks and determine appropriate pricing for our investments in portfolio companies. In addition, we believe that the investment professionals of our Investment Adviser enable us to learn about, and compete effectively for, financing opportunities with attractive leveraged companies in the industries in which we seek to invest.
For additional information concerning the competitive risks we face, please see Part I. Item 1A. “Risk Factors—We operate in a highly competitive market for investment opportunities.”
Staffing
We do not currently have any employees and do not expect to have any employees in the future. Services necessary for our business are provided by individuals who are employees of Saratoga Investment Advisors, pursuant to the terms of the Management Agreement and the Administration Agreement. For a discussion of the Management Agreement, see “Business—Investment Advisory and Management Agreement” below. We reimburse Saratoga Investment Advisors for our allocable portion of expenses incurred by it in performing its obligations under the Administration Agreement, including rent and our allocable portion of the cost of our officers and their respective staffs, subject to certain limitations. For a discussion of the Administration Agreement, see “Business—Administration Agreement” below.
Investment Advisory and Management Agreement
Saratoga Investment Advisors serves as our investment adviser. Our Investment Adviser was formed in 2010 as a Delaware limited liability company and became our investment advisor in July 2010. Subject to the overall supervision of our board of directors, Saratoga Investment Advisors manages our day-to-day operations and provides investment advisory and management services to us. Under the terms of the Management Agreement, Saratoga Investment Advisors:
| ● | determines the composition of our portfolio, the nature and timing of the changes to our portfolio and the manner of implementing such changes; |
| ● | identifies, evaluates and negotiates the structure of the investments we make (including performing due diligence on our prospective portfolio companies); |
| ● | closes and monitors the investments we make; and |
| ● | determines the securities and other assets that we purchase, retain or sell. |
Saratoga Investment Advisors services under the Management Agreement are not exclusive, and it is free to furnish similar services to other entities.
Management Fee and Incentive Fee
Pursuant to the Management Agreement with Saratoga Investment Advisors, we pay Saratoga Investment Advisors a fee for investment advisory and management services consisting of two components—a base management fee and an incentive fee.
The base management fee is paid quarterly in arrears, and equals 1.75% per annum of our gross assets (other than cash or cash equivalents but including assets purchased with borrowed funds) and calculated at the end of each fiscal quarter based on the average value of our gross assets (other than cash or cash equivalents but including assets purchased with borrowed funds) as of the end of such fiscal quarter and the end of the immediate prior fiscal quarter. As a result, Saratoga Investment Advisors will benefit as we incur debt or use leverage to purchase assets. Our board of directors will monitor the conflicts presented by this compensation structure by approving the amount of leverage that we may incur. Base management fees for any partial month or quarter are appropriately pro-rated.
The incentive fee has the following two parts:
The first part is calculated and payable quarterly in arrears based on our pre-incentive fee net investment income for the immediately preceding fiscal quarter. Pre-incentive fee net investment income means interest income, dividend income and any other income (including any other fees such as commitment, origination, structuring, diligence, managerial and consulting fees or other fees that we receive from portfolio companies) accrued during the fiscal quarter, minus our operating expenses for the quarter (including the base management fee, expenses payable under the Administration Agreement, and any interest expense and dividends paid on any issued and outstanding preferred stock or debt security, but excluding the incentive fee). Pre-incentive fee net investment income includes, in the case of investments with a deferred interest feature (such as market discount, debt instruments with PIK interest, preferred stock with PIK dividends and zero-coupon securities), accrued income that we have not yet received in cash. Pre-incentive fee net investment income does not include any realized capital gains, realized capital losses, unrealized capital appreciation or depreciation or realized gains or losses resulting from the extinguishment of our own debt. Pre-incentive fee net investment income, expressed as a rate of return on the value of our net assets (defined as total assets less liabilities) at the end of the immediately preceding fiscal quarter, is compared to a “hurdle rate” of 1.875% per quarter, subject to a “catch up” provision. The base management fee is calculated prior to giving effect to the payment of any incentive fees.
We pay Saratoga Investment Advisors an incentive fee with respect to our pre-incentive fee net investment income in each fiscal quarter as follows: (A) no incentive fee in any fiscal quarter in which our pre-incentive fee net investment income does not exceed the hurdle rate; (B)
| ● | no incentive fee in any fiscal quarter in which our pre-incentive fee net investment income does not exceed the quarterly hurdle rate of 1.875%; |
| ● | 100.0% of our pre-incentive fee net investment income with respect to that portion of such pre-incentive fee net investment income, if any, that exceeds the hurdle rate but is less than or equal to 2.344% in any fiscal quarter is payable to Saratoga Investment Advisors; |
| ● | 20.0% of the amount of our pre-incentive fee net investment income, if any, that exceeds 2.344% in any fiscal quarter. We refer to the amount specified in clause (B) as the “catch-up.” The “catch-up” provision is intended to provide Saratoga Investment Advisors with an incentive fee of 20.0% on all of our pre-incentive fee net investment income as if a hurdle rate did not apply when our pre-incentive fee net investment income exceeds 2.344% in any fiscal quarter. Notwithstanding the foregoing, with respect to any period ending on or prior to December 31, 2010, Saratoga Investment Advisors was only entitled to 20.0% of the amount of our pre-incentive fee net investment income, if any, that exceeded 1.875% in any fiscal quarter without any catch-up provision. These calculations are appropriately pro-rated when such calculations are applicable for any period of less than three months. |
There is no accumulation of amounts from quarter to quarter on either the hurdle rate but is less than or equal to 2.344% inthe parameters set by the “catch-up” mechanism or any fiscal quarter is payableclaw back of amounts previously paid to Saratoga Investment Advisors; and (C) 20.0%Advisors if subsequent quarters are below the quarterly hurdle or the “catch-up” parameters. Furthermore, there is no delay of the amount of our pre-incentive fee net investment income, if any, that exceeds 2.344% in any fiscal quarter. We referpayment to the amount specified in clause (B) as the “catch-up.” The “catch-up” provision is intended to provide Saratoga Investment Advisors with an incentive fee of 20.0% on all of our pre-incentive fee net investment income as if aprior quarters are below the quarterly hurdle rate did not apply when our pre-incentive fee net investment income exceeds 2.344% in any fiscal quarter. Notwithstanding the foregoing, with respect to any period ending on or prior to December 31, 2010, Saratoga Investment Advisors was only entitled to 20.0% of the amount of our pre-incentive fee net investment income, if any, that exceeded 1.875% in any fiscal quarter without any catch-up provision. These calculations are appropriately pro-rated when such calculations are applicable for any period of less than three months.“catch-up.”
The following is a graphical representation of the calculation of the income-related portion of the incentive fee subsequent to any period ending after December 31, 2010:
Quarterly Incentive Fee Based on “Pre-Incentive Fee Net Investment Income”
Pre-Incentive Fee Net Investment Income
(expressed as a percentage of the value of net assets)
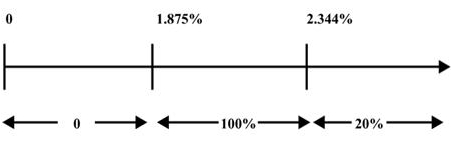

Percentage of Pre-Incentive Fee Net Investment
Income allocated to income-related portion of incentive fee
The second part of the incentive fee, the capital gains fee, is determined and payable in arrears as of the end of each fiscal year (or, upon termination of the Management Agreement), and is calculated at the end of each applicable fiscal year by subtracting (1) the sum of our cumulative aggregate realized capital losses and aggregate unrealized capital depreciation from (2) our cumulative aggregate realized capital gains, in each case calculated from May 31, 2010 on each investment in the Company’s portfolio. If such amount is positive at the end of such year, then the capital gains fee for such year is equal to 20.0% of such amount, less the cumulative aggregate amount of capital gains fees paid in all prior years. If such amount is negative, then there is no capital gains fee for such year.
Under the Management Agreement, the capital gains portion of the incentive fee is based on realized gains and realized and unrealized losses from May 31, 2010. Therefore, realized and unrealized losses incurred prior to such time will not be taken into account when calculating the capital gains portion of the incentive fee, and Saratoga Investment Advisors will be entitled to 20.0% of net capital gains that arise after May 31, 2010. In addition, the cost basis for computing our realized gains and losses on investments held by us as of May 31, 2010 equals the fair value of such investments as of such date.
Examples of Quarterly Incentive Fee Calculation
Example 1: Income Related Portion of Incentive Fee(1):
Assumptions
| ● | Hurdle rate(2) = 1.875% |
| ● | Management fee(3) = 0.4375% |
| ● | Other expenses (legal, accounting, custodian, transfer agent, etc.)(4) = 0.33% |
Alternative 1
Additional Assumptions
| ● | Investment income (including interest, dividends, fees, etc.) = 1.25% |
| ● | Pre-incentive fee net investment income (investment income–(management fee + other expenses)) = 0.4825% Pre-incentive fee net investment income does not exceed hurdle rate, therefore there is no incentive fee. |
Alternative 2
Additional Assumptions
| ● | Investment income (including interest, dividends, fees, etc.) = 3.0% |
| ● | Pre-incentive fee net investment income (investment income–(management fee + other expenses)) = 2.2325% |
Pre-incentive fee net investment income exceeds hurdle rate, but does not fully satisfy the “catch-up” provision, therefore the income related portion of the incentive fee is 0.3575%.
| Incentive Fee | = | (100.0% × (pre-incentive fee net investment income–1.875%) |
| = | 100.0%(2.2325%–1.875%) | |
| = | 100.0%(0.3575%) | |
| = | 0.3575% |
| (1) | The hypothetical amount of pre-incentive fee net investment income shown is based on a percentage of total net assets. |
| (2) | Represents 7.5% hurdle rate. |
| (3) | Represents 1.75% annualized management fee. For the purposes of this example, we have assumed that we have not incurred any indebtedness and that we maintain no cash or cash equivalents. |
| (4) | The “catch-up” provision is intended to provide our Investment Adviser with an incentive fee of 20.0% on all pre-incentive fee net investment income as if a hurdle rate did not apply when our net investment income exceeds 2.344% in any fiscal quarter. |
Alternative 3
Additional Assumptions
| ● | Investment income (including interest, dividends, fees, etc.) = 3.5% |
| ● | Pre-Incentive Fee Net Investment Income (investment income–(management fee + other expenses) = 2.7325% |
Pre-incentive fee net investment income exceeds the hurdle rate, and fully satisfies the “catch-up” provision, therefore the income related portion of the incentive fee is 0.5467%.
| Incentive fee | = | 100.0% × pre-incentive fee net investment income (subject to “catch-up”)(4) |
| Incentive fee | = | 100.0% × “catch-up” + (20.0% × (Pre-incentive fee net investment income–2.344%)) |
| Catch up | = | 2.344%–1.875% |
| = | 0.469% | |
| Incentive fee | = | (100.0% × 0.469%) +(20.0% ×(2.7325%–2.344%)) |
| = | 0.469% +(20.0% × 0.3885%) | |
| = | 0.469% + 0.0777% | |
| = | 0.5467% |
Example 2: Capital Gains Portion of Incentive Fee:
Alternative 1
Assumptions(1)
| ● | Year 1: $20.0 million investment made in Company A (“Investment A”), and $30.0 million investment made in Company B (“Investment B”) |
| ● | Year 2: Investment A is sold for $50.0 million and fair market value (“FMV”) of Investment B determined to be $32.0 million |
| ● | Year 3: FMV of Investment B determined to be $25.0 million |
| ● | Year 4: Investment B sold for $31.0 million |
The capital gains portion of the incentive fee, if any, calculated under the cumulative method would be:
| ● | Year 1: None |
| ● | Year 2: $6 million (20.0% multiplied by $30.0 million realized capital gains on sale of Investment A) |
| ● | Year 3: None; $5 million (20.0% multiplied by ($30.0 million realized cumulative capital gains less $5.0 million cumulative capital depreciation)) less $6.0 million (capital gains incentive fee paid in Year 2) |
| ● | Year 4: $200,000; $6.2 million (20.0% multiplied by $31.0 million cumulative realized capital gains) less $6.0 million (capital gains incentive fee paid in Year 2) |
Alternative 2
Assumptions(1)
| ● | Year 1: $20.0 million investment made in Company A (“Investment A”), $30.0 million investment made in Company B (“Investment B”) and $25.0 million investment made in Company C (“Investment C”) |
| ● | Year 2: Investment A sold for $50.0 million, FMV of Investment B determined to be $25.0 million and FMV of Investment C determined to be $25.0 million |
| ● | Year 3: FMV of Investment B determined to be $27.0 million and Investment C sold for $30.0 million |
| (1) | The examples assume that Investment A and Investment B were acquired by us subsequent to May 31, 2010. If Investment A and B were acquired by us prior to May 31, 2010, then the cost basis for computing our realized gains and losses on such investments would equal the fair value of such investments as of May 31, 2010. |
| ● | Year 4: FMV of Investment B determined to be $35.0 million |
| ● | Year 5: Investment B sold for $20.0 million |
The capital gains portion of the incentive fee, if any, calculated under the cumulative method would be:
| ● | Year 1: None |
| ● | Year 2: $5.0 million (20.0% multiplied by $25.0 million ($30.0 million realized capital gains on Investment A less $5.0 million unrealized capital depreciation on Investment B)) |
| ● | Year 3: $1.4 million ($6.4 million (20.0% multiplied by $32.0 million ($35.0 million cumulative realized capital gains less $3.0 million unrealized capital depreciation)) less $5.0 million (capital gains incentive fee paid in Year 2)) |
| ● | Year 4: None |
| ● | Year 5: None ($5.0 million (20.0% multiplied by $25.0 million (cumulative realized capital gains of $35.0 million less realized capital losses of $10.0 million)) less $6.4 million (cumulative capital gains incentive fee paid in Year 2 and Year 3)) |
The Management Agreement with Saratoga Investment Advisors was initially approved for a two year period by our board of directors at an in-person meeting of the directors, including a majority of our independent directors, and was approved by our stockholders at the special meeting of stockholders held on July 30, 2010. Subsequent to then,Following the initial two year period, our board of directors has approved the renewal of the Management Agreement annually for an additional one-year term every year, with the last renewal approved at an in-person meeting. In reliance on certain exemptive relief provided by the SEC in connection with the COVID-19 pandemic, the last approval was grantedmeeting on July 6, 2021 at a video conference meeting and our board ratified the approval of the2023.
In approving renewal of the Management Agreement at its next in-person meeting held on October 4, 2021.
In approving this Management Agreement,for an additional one-year term, the directors considered, among other things, (i) the nature, extent and quality of the advisory and other services to be provided to us by Saratoga Investment Advisors; (ii) our investment performance and the investment performance of Saratoga Investment Advisors; (iii) the expected costs of the services to be provided by Saratoga Investment Advisors (including management fees, advisory fees and expense ratios) as compared to other companies within the industry, and the profits expected to be realized by Saratoga Investment Advisors; (iv) the limited potential for economies of scale in investment management associated with managing us; and (v) Saratoga Investment Advisors estimated pro forma profitability with respect to managing us.
Payment of our expenses
The Management Agreement provides that all investment professionals of Saratoga Investment Advisors and its staff, when and to the extent engaged in providing investment advisory services required to be provided by Saratoga Investment Advisors, and the compensation and routine overhead expenses of such personnel allocable to such services, will be provided and paid for by Saratoga Investment Advisors and not by us.
We bear all costs and expenses of our operations and transactions, including those relating to:
| ● | organization; |
| ● | calculating our |
| ● | expenses incurred by our Investment Adviser payable to third parties, including agents, consultants or other advisers, in monitoring financial and legal affairs for us and in monitoring our investments and performing due diligence on our prospective portfolio companies; |
| ● | expenses incurred by our Investment Adviser payable for travel and due diligence on our prospective portfolio companies; |
| ● | interest payable on debt, if any, incurred to finance our investments; |
| ● | offerings of our common stock and other securities; |
| ● | investment advisory and management fees; |
| ● | fees payable to third parties, including agents, consultants or other advisers, relating to, or associated with, evaluating and making investments; |
| ● | transfer agent and custodial fees; |
| ● | federal and state registration fees; |
| ● | all costs of registration and listing our common stock on any securities exchange; |
| ● | U.S. federal, state and local taxes; |
| ● | independent directors’ fees and expenses; |
| ● | costs of preparing and filing reports or other documents required by governmental bodies (including the |
| ● | costs of any reports, proxy statements or other notices to common stockholders including printing costs; |
| ● | our fidelity bond, directors and officers errors and omissions liability insurance, and any other insurance premiums; |
| ● | direct costs and expenses of administration, including printing, mailing, long distance telephone, copying, secretarial and other staff, independent auditors and outside legal costs; and |
| ● | administration fees and all other expenses incurred by us or, if applicable, the administrator in connection with administering our business (including payments under the Administration Agreement based upon our allocable portion of the administrator’s overhead in performing its obligations under the Administration Agreement, including rent and the allocable portion of the cost of our officers and their respective staffs (including travel expenses)). |
Duration and Termination
The Management Agreement will remain in effect continuously, unless terminated under the termination provisions of the agreement.Management Agreement. The Management Agreement provides that it may be terminated at any time, without the payment of any penalty, upon 60 days written notice, by the vote of stockholders holding a majority of our outstanding voting securities, or by the vote of our directors or by Saratoga Investment Advisors.
The Management Agreement will, unless terminated as described above, continue in effect from year to year so long as it is approved at least annually by (i) the vote of the board of directors, or by the vote of stockholders holding a majority of our outstanding voting securities, and (ii) the vote of a majority of our directors who are not parties to the Management Agreement or “interested persons” (as such term is defined in Section 2(a)(19) of the 1940 Act) of any party to such agreement, in accordance with the requirements of the 1940 Act.
Indemnification
Under the Management Agreement, Saratoga Investment Advisors and certain of its affiliates are not liable to us for any action taken or omitted to be taken by Saratoga Investment Advisors in connection with the performance of any of its duties or obligations under the agreement or otherwise as an investment adviser to us, except to the extent specified in Section 36(b) of the 1940 Act concerning loss resulting from a breach of fiduciary duty (as the same is finally determined by judicial proceedings) with respect to the receipt of compensation for services and except to the extent such action or omission constitutes gross negligence, willful misfeasance, bad faith or reckless disregard of its duties and obligations under the agreement.
We also provide indemnification to Saratoga Investment Advisors and certain of its affiliates for damages, liabilities, costs and expenses incurred by them in or by reason of any pending, threatened or completed action, suit, investigation or other proceeding arising out of or otherwise based upon the performance of any of its duties or obligations under the agreement or otherwise as an investment adviser to us. However, we would not provide indemnification against any liability to us or our security holders to which Saratoga Investment Advisors or such affiliates would otherwise be subject by reason of willful misfeasance, bad faith or gross negligence in the performance of any such person’s duties or by reason of the reckless disregard of its duties and obligations under the agreement.
Organization of the Investment Adviser
Saratoga Investment Advisors is registered as an investment adviser under the Investment Advisers Act of 1940, as amended (the “Advisers Act”). The principal executive offices of Saratoga Investment Advisors are located at 535 Madison Avenue, New York, New York 10022.
Administration Agreement
Pursuant to a separate Administration Agreement, Saratoga Investment Advisors, who also serves as our administrator, furnishes us with office facilities, equipment and clerical, book-keeping and record keeping services. Under the Administration Agreement, our administrator also performs, or oversees the performance of, our required administrative services, which include, among other things, being responsible for the financial records which we are required to maintain, preparing reports for our stockholders and reports required to be filed with the SEC. In addition, our administrator assists us in determining and publishing our net asset value,NAV, oversees the preparation and filing of our tax returns and the printing and dissemination of reports to our stockholders, and generally oversees the payment of our expenses and the performance of administrative and professional services rendered to us by others. Payments under the Administration Agreement equal an amount based upon our allocable portion of our administrator’s overhead in performing its obligations under the Administration Agreement, including rent and our allocable portion of the cost of our officers and their respective staffs relating to the performance of services under this agreement (including travel expenses). Our allocable portion is based on the proportion that our total assets bears to the total assets administered or managed by our administrator. Under the Administration Agreement, our administrator also provides managerial assistance, on our behalf, to those portfolio companies who accept our offer of assistance. The Administration Agreement may be terminated by either party without penalty upon 60 days written notice to the other party. Our board of directors, including a majority of independent directors, will annually review the compensation we pay to the Adviser to determine that the provisions of the Administrative Agreement are carried out satisfactorily and to determine, among other things, whether the fees payable under such agreement are reasonable in light of the services provided. Our board of directors reviews the methodology employed in determining how the expenses are allocated to us and any proposed allocation of administrative expenses among us and any affiliates of the Adviser. Our board of directors then assesses the reasonableness of such reimbursements for expenses allocated to us based on the breadth, depth and quality of the administrative services as compared to the estimated cost to us of obtaining similar services from third-party service providers known to be available. In addition, our board of directors considers whether any single third-party service provider would be capable of providing all such services at comparable cost and quality. Finally, our board of directors compares the total amount paid to the Adviser for such services as a percentage of our net assets to the same ratio as reported by other comparable funds. The amount payable by us under the Administration Agreement was initially capped at $1.0 million for each annual term of the agreement. OnMost recently, on July 8, 2015, our board of directors approved the renewal of the Administration Agreement for an additional one-year term and determined to increase the cap on the payment or reimbursement of expenses by the Company thereunder, which had not been increased since the inception of the agreement, to $1.3 million. On July 7, 2016, our board of directors approved the renewal of the Administration Agreement for an additional one-year term. On October 5, 2016, our board of directors determined to increase the cap on the payment or reimbursement of expenses by the Company under the Administration Agreement, from $1.3 million to $1.5 million, effective November 1, 2016. On July 11, 2017,6, 2023, our board of directors approved the renewal of the Administration Agreement for an additional one-year term and determined to increase the cap on the payment or reimbursement of expenses by the Company from $1.5$3.275 million to $1.75$4.3 million effective August 1, 2017. On July 9, 2018, our board of directors approved the renewal of the Administration Agreement for an additional one-year term and determined to increase the cap on the payment or reimbursement of expenses by the Company from $1.75 million to $2.0 million, effective August 1, 2018. On July 9, 2019, our board of directors approved the renewal of the Administration Agreement for an additional one-year term and determined to increase the cap on the payment or reimbursement of expenses by the Company from $2.0 million to $2.225 million effective August 1, 2019. On July 7, 2020, our board of directors approved the renewal of the Administration Agreement for an additional one-year term and determined to increase the cap on the payment or reimbursement of expenses by the Company from $2.225 million to $2.775 million effective August 1, 2020. On July 6, 2021, our board of directors approved the renewal of the Administration Agreement for an additional one-year term and determined to increase the cap on the payment or reimbursement of expenses by the Company from $2.775 million to $3.0 million effective August 1, 2021.2023.
Indemnification
Under the Administration Agreement, Saratoga Investment Advisors and certain of its affiliates are not liable to us for any action taken or omitted to be taken by Saratoga Investment Advisors in connection with the performance of any of its duties or obligations under the agreement.
We also provide indemnification to Saratoga Investment Advisors and certain of its affiliates for damages, liabilities, costs and expenses incurred by them in or by reason of any pending, threatened or completed action, suit, investigation or other proceeding arising out of or otherwise based upon the performance of any of its duties or obligations under the agreement or otherwise as an administrator to us. However, we do not provide indemnification against any liability to us or our security holders to which Saratoga Investment Advisors or such affiliates would otherwise be subject by reason of willful misfeasance, bad faith or gross negligence in the performance of any such person’s duties or by reason of the reckless disregard of its duties and obligations under the agreement.
License Agreement
License Agreement
We entered into a trademark license agreement with Saratoga Investment Advisors, pursuant to which Saratoga Investment Advisors grants us a non-exclusive, royalty-free license to use the name “Saratoga.” Under this agreement, we have a right to use the “Saratoga” name, for so long as Saratoga Investment Advisors or one of its affiliates remains our Investment Adviser. Other than with respect to this limited license, we have no legal right to the “Saratoga” name. Saratoga Investment Advisors has the right to terminate the license agreement if it is no longer acting as our investment adviser. In the event the Management Agreement is terminated, we would be required to change our name to eliminate the use of the name “Saratoga.”
Business Development Company Regulations
We have elected to be treatedregulated as a BDC under the 1940 Act. As with other companies regulated by the 1940 Act, a BDC must adhere to certain substantive regulatory requirements. The 1940 Act contains prohibitions and restrictions relating to transactions between BDCs and their affiliates (including any investment advisers or sub-advisers), principal underwriters and affiliates of those affiliates or underwriters, and requires that a majority of the directors be persons who are not “interested persons,” as that term is defined in Section 2(a)(19) of the 1940 Act.independent directors. In addition, the 1940 Act provides that we may not change the nature of our business so as to cease to be, or to withdraw our election to be regulated as, a BDC, unless approved by “a majority of our outstanding voting securities,” as defined in the 1940 Act. A majority of the outstanding voting securities of a company is defined under the 1940 Act as the lesser of: (i) 67.0% or more of such company’s stock present at a meeting if more than 50.0% of the outstanding stock of such company is present and represented by proxy or (ii) more than 50.0% of the outstanding stock of such company.
We do not intend to acquire securities issued by any investment company (including Section 3(c)(1) and Section 3(c)(7) funds for this purpose, and mutual funds, registered closed-end funds and BDCs) that exceed the limits imposed by the 1940 Act. Under these limits, except for registered money market funds, we generally cannot acquire more than 3% of the voting stock of the investment company’s total outstanding voting stock, invest more than 5% of the value of our total assets in the securities of one investment company or invest more than 10% of the aggregate value of our total assets in the securities of more than one investment company. With regard to that portion of our portfolio invested in securities issued by investment companies, it should be noted that such investments might subject our stockholders to additional expenses.
We are required to provide and maintain a bond issued by a reputable fidelity insurance company to protect us against larceny and embezzlement. Furthermore, as a BDC, we are prohibited from protecting any director or officer against any liability to us or our stockholders arising from willful misfeasance, bad faith, gross negligence or reckless disregard of the duties involved in the conduct of such person’s office.
We and our investment adviser have adopted and implemented written policies and procedures reasonably designed to prevent violation of the federal securities laws and review these policies and procedures annually for their adequacy and the effectiveness of their implementation. We and our investment adviserthe Investment Adviser have designated a chief compliance officer to be responsible for administering these policies and procedures. We expect to be periodically examined by the SEC for compliance with the federal securities laws, including the 1940 Act.
Qualifying assets
A BDC must have been organized and have its principal place of business in the United States and must be operated for the purpose of making investments in the types of securities described in (1), (2) or (3) below. Under the 1940 Act, a BDC may not acquire any asset other than assets of the type listed in Section 55(a) of the 1940 Act, which are referred to as qualifying assets, unless, at the time the acquisition is made, qualifying assets represent at least 70.0% of the company’s total assets. The principal categories of qualifying assets relevant to our business are the following:
| (1) | Securities purchased in transactions not involving any public offering from the issuer of such securities, which issuer (subject to certain limited exceptions) is an eligible portfolio company, or from any person who is, or has been during the preceding 13 months, an affiliated person of an eligible portfolio company, or from any other person, subject to such rules as may be prescribed by the SEC. An eligible portfolio company is defined in the 1940 Act as any issuer which: |
| (a) | is organized under the laws of, and has its principal place of business in, the United States; |
| (b) | is not an investment company (other than a small business investment company |
| (c) | satisfies either of the following: |
| (i) | does not have any class of securities listed on a national securities exchange; |
| (ii) | has a class of securities listed on a national securities exchange but has an aggregate market value of outstanding voting and non-voting common equity of less than $250.0 million; |
| (iii) | is controlled by a BDC or a group of companies including a BDC and the BDC has an affiliated person who is a director of the eligible portfolio company; |
| (iv) | is a small and solvent company having total assets of not more than $4.0 million and capital and surplus of not less than $2.0 million; or |
| (v) | meets such other criteria as may established by the SEC. (2) Securities of any eligible portfolio company which we control. |
| (3) | Securities purchased in a private transaction from a U.S. issuer that is not an investment company or from an affiliated person of the issuer, or in transactions incident thereto, if the issuer is in bankruptcy and subject to reorganization or if the issuer, immediately prior to the purchase of its securities was unable to meet its obligations as they came due without material assistance other than conventional lending or financing arrangements. |
| (4) | Securities of an eligible portfolio company purchased from any person in a private transaction if there is no ready market for such securities and we already own at least 60.0% of the outstanding equity of the eligible portfolio company. |
| (5) | Securities received in exchange for or distributed on or with respect to securities described in (1) through (4) above, or pursuant to the exercise of options, warrants or rights relating to such securities. |
| (6) | Cash, cash equivalents, U.S. Government securities or high-quality debt securities maturing in one year or less from the time of investment. |
The regulations defining qualifying assets may change over time. We may adjust our investment focus as needed to comply with and/or take advantage of any regulatory, legislative, administrative or judicial actions in this area.
Significant managerial assistance to portfolio companies
A BDC generally must offer to make available to the issuer of the securities in which it invests significant managerial assistance, except in circumstances where either (i) the BDC controls such issuer of securities or (ii) the BDC purchases such securities in conjunction with one or more other persons acting together and one of the other persons in the group makes available such managerial assistance. As a BDC, we must offer, and must provide upon request, managerial assistance to our portfolio companies. Making available significant managerial assistance means, among other things, any arrangement whereby the BDC, through its directors, officers or employees or those of its investment adviser or administrator, offers to provide, and, if accepted, does so provide, significant guidance and counsel concerning the management, operations or business objectives and policies of a portfolio company. This assistance could involve, among other things, monitoring the operations of our portfolio companies, participating in board and management meetings, consulting with and advising officers of portfolio companies and providing other organizational and financial guidance. Pursuant to a separate Administration Agreement, our Saratoga Investment Advisors provides such managerial assistance on our behalf to portfolio companies that request this assistance, recognizing that our involvement with each investment will vary based on factors including the size of the company, the nature of our investment, the company’s overall stage of development and our relative position in the capital structure. We may receive fees for these services.
Temporary investments
As a BDC, pending investment in other types of “qualifying assets,” as described above, our investments may consist of cash, cash equivalents, U.S. Government securities or high-quality debt securities maturing in one year or less from the time of investment, which we refer to, collectively, as temporary investments, so that 70.0% of our assets are qualifying assets. Typically, we will invest in U.S. Treasury bills or in repurchase agreements, provided that such agreements are fully collateralized by cash or securities issued by the U.S. Government or its agencies. A repurchase agreement involves the purchase by an investor, such as us, of a specified security and the simultaneous agreement by the seller to repurchase it at an agreed-upon future date and at a price which is greater than the purchase price by an amount that reflects an agreed-upon interest rate. There is no percentage restriction on the proportion of our assets that may be invested in such repurchase agreements. However, if more than 25.0% of our total assets constitute repurchase agreements from a single counterparty, we would not meet the asset-diversification requirements in order to qualify as a regulated investment company (“RIC”)RIC for U.S. federal income tax purposes. Thus, we do not intend to enter into repurchase agreements with a single counterparty in excess of this limit. Our Investment Adviser will monitor the creditworthiness of the counterparties with which we enter into repurchase agreement transactions.
Indebtedness and senior securities
As a BDC, we are permitted, under specified conditions, to issue multiple classes of indebtedness and one class of shares of stock, senior to our common stock, if our asset coverage, as defined in the 1940 Act, is at least equal to 200.0%200% immediately after each such issuance.issuance or 150% if certain requirements are met. On April 16, 2018, as permitted by the Small Business Credit Availability Act, which was signed into law on March 23, 2018, our board of directors, including a majority of our independent directors, approved of ourus becoming subject to a minimum asset coverage ratio of 150.0%150% under Sections 18(a)(1) and 18(a)(2) of the 1940 Act. The 150.0%150% asset coverage ratio became effective on April 16, 2019. See “Risk Factors – Effective April 16, 2019, our asset coverage requirement was reduced from 200% to 150%, which couldmay increase the risk of investing in the Company.” We may also borrow amounts up to 5.0% of the value of our total assets for temporary or emergency purposes without regard to asset coverage.
The 1940 Act also limits the amount of warrants, options and rights to common stock that we may issue and the terms of such securities.
Common stock
We generally are generally not able to issue and sell our common stock at a price below net asset valueNAV per share. We may, however, sell our common stock, warrants, options or rights to acquire our common stock, at a price below the current net asset valueNAV of the common stock if our board of directors determines that such sale is in our best interests and that of our stockholders, and our stockholders approve such sale. In any such case, the price at which our securities are to be issued and sold may not be less than a price which, in the determination of our board of directors, closely approximates the market value of such securities (less any distributing commission or discount). We may also make rights offerings to our stockholders at prices per share less than the net asset valueNAV per share, subject to applicable requirements of the 1940 Act.
Code of ethics
As a BDC, we and Saratoga Investment Advisors have each adopted a code of ethics pursuant to Rule 17j-1 under the 1940 Act and Rule 204A-1 under the Advisers Act, respectively, that establishes procedures for personal investments and restricts certain personal securities transactions. Personnel subject to each code may invest in securities for their personal investment accounts, including securities that may be purchased or held by us, so long as such investments are made in accordance with the code’s requirements. In addition, each code of ethics is available on the EDGAR database on the SEC’s website at http://www.sec.gov. Our code of ethics is also available on our corporate governance webpage at http://ir.saratogainvestmentcorp.com/corporate-governance.corporate-governance.
Proxy voting policies and procedures
SEC registered investment advisers that have the authority to vote (client) proxies (which authority may be implied from a general grant of investment discretion) are required to adopt policies and procedures reasonably designed to ensure that the adviser votes proxies in the best interests of its clients. Registered investment advisers also must maintain certain records on proxy voting. In most cases, we will invest in securities that do not generally entitle us to voting rights in our portfolio companies. When we do have voting rights, we will delegate the exercise of such rights to our Investment Adviser.
Saratoga Investment Advisors has particular proxy voting policies and procedures in place. In determining how to vote, officers of Saratoga Investment Advisors will consult with each other, taking into account our interests and the interests of our investors, as well as any potential conflicts of interest. Saratoga Investment Advisors will consult with legal counsel to identify potential conflicts of interest. Where a potential conflict of interest exists, Saratoga Investment Advisors may, if it so elects, resolve it by following the recommendation of a disinterested third party, by seeking the direction of our independent directors or, in extreme cases, by abstaining from voting. While Saratoga Investment Advisors may retain an outside service to provide voting recommendations and to assist in analyzing votes, it will not delegate its voting authority to any third party.
An officer of Saratoga Investment Advisors will keep a written record of how all such proxies are voted. It will retain records of (1) proxy voting policies and procedures, (2) all proxy statements received (or it may rely on proxy statements filed on the SEC’s EDGAR system in lieu thereof), (3) all votes cast, (4) investor requests for voting information, and (5) any specific documents prepared or received in connection with a decision on a proxy vote. If it uses an outside service, Saratoga Investment Advisors may rely on such service to maintain copies of proxy statements and records, so long as such service will provide a copy of such documents promptly upon request.
Saratoga Investment Advisors’ proxy voting policies are not exhaustive and are designed to be responsive to the wide range of issues that may be subject to a proxy vote. In general, Saratoga Investment Advisors will vote our proxies in accordance with these guidelines unless: (1) it has determined otherwise due to the specific and unusual facts and circumstances with respect to a particular vote, (2) the subject matter of the vote is not covered by these guidelines, (3) a material conflict of interest is present, or (4) it finds it necessary to vote contrary to its general guidelines to maximize stockholder value or our best interests.
In reviewing proxy issues, Saratoga Investment Advisors generally will use the following guidelines:
Elections of Directors: In general, Saratoga Investment Advisors will vote in favor of the management-proposed slate of directors. If there is a proxy fight for seats on a portfolio company’s board of directors, or Saratoga Investment Advisors determines that there are other compelling reasons for withholding our vote, it will determine the appropriate vote on the matter. It may withhold votes for directors that fail to act on key issues, such as failure to: (1) implement proposals to declassify a board, (2) implement a majority vote requirement, (3) submit a rights plan to a stockholder vote or (4) act on tender offers where a majority of stockholders have tendered their shares. Finally, Saratoga Investment Advisors may withhold votes for directors of non-U.S. issuers where there is insufficient information about the nominees disclosed in the proxy statement.
Appointment of Auditors: We believe that a portfolio company remains in the best position to choose its independent auditors and Saratoga Investment Advisors will generally support management’s recommendation in this regard.
Changes in Capital Structure: Changes in a portfolio company’s organizational documents may be required by state or federal regulation. In general, Saratoga Investment Advisors will cast our votes in accordance with the management on such proposals. However, Saratoga Investment Advisors will consider carefully any proposal regarding a change in corporate structure that is not required by state or federal regulation.
Corporate Restructurings, Mergers and Acquisitions: We believe proxy votes dealing with corporate reorganizations are an extension of the investment decision. Accordingly, Saratoga Investment Advisors will analyze such proposals on a case-by-case basis and vote in accordance with its perception of our interests.
Proposals Affecting Stockholder Rights: We will generally vote in favor of proposals that give stockholders a greater voice in the affairs of a portfolio company and oppose any measure that seeks to limit such rights. However, when analyzing such proposals, Saratoga Investment Advisors will balance the financial impact of the proposal against any impairment of stockholder rights as well as of our investment in the portfolio company.
Corporate Governance: We recognize the importance of good corporate governance. Accordingly, Saratoga Investment Advisors will generally favor proposals that promote transparency and accountability within a portfolio company.
Anti-Takeover Measures: Saratoga Investment Advisors will evaluate, on a case-by-case basis, any proposals regarding anti- takeover measures to determine the likely effect on stockholder value dilution.
Share Splits: Saratoga Investment Advisors will generally vote with management on share split matters.
Limited Liability of Directors: Saratoga Investment Advisors will generally vote with management on matters that could adversely affect the limited liability of directors.
Social and Corporate Responsibility: Saratoga Investment Advisors will review proposals related to social, political and environmental issues to determine whether they may adversely affect stockholder value. It may abstain from voting on such proposals where they do not have a readily determinable financial impact on stockholder value.
Privacy principles
We are committed to protecting the privacy of our stockholders. The following explains the privacy policies of Saratoga
Investment Corp., Saratoga Investment Advisors and their affiliated companies.
We will safeguard, according to strict standards of security and confidentiality, all information we receive about our stockholders.
Generally, we do not receive any non-public personal information relating to our stockholders, although certain non-public personal information of our stockholders may become available to us. The only information we collect from stockholders is the holder’s name, address, number of shares and social security number. This information is used only so that we can send annual reports and other information about us to the stockholder and send the stockholder proxy statements or other information required by law. We restrict access to non-public personal information about our stockholders to our Investment Adviser’s and Administrator’s employees with a legitimate business need for the information. We maintain physical, electronic and procedural safeguards designed to protect the non-public personal information of our stockholders.
We do not share this information with any non-affiliated third party except as described below:
| ● | Authorized Employees of Saratoga Investment Advisors. It is our policy that only authorized employees of Saratoga Investment Advisors who need to know a stockholder’s personal information will have access to it. |
| ● | Service Providers. We may disclose your personal information to companies that provide services on our behalf, such as recordkeeping, processing a stockholder’s trades, and mailing stockholder information. These companies are required to protect our stockholders’ information and use it solely for the purpose for which they received it. |
| ● | Courts and Government Officials.If required by law, we may disclose a stockholder’s personal information in accordance with a court order or at the request of government regulators. Only that information required by law, subpoena, or court order will be disclosed. |
Compliance with applicable laws
As a BDC, we are periodically examined by the SEC for compliance with the federal securities laws, including the 1940 Act.
We are required to provide and maintain a bond issued by a reputable fidelity insurance company to protect us against larceny and embezzlement. Furthermore, as a BDC, we are prohibited from protecting any director or officer against any liability to us or our stockholders arising from willful misfeasance, bad faith, gross negligence or reckless disregard of the duties involved in the conduct of such person’s office.
We and Saratoga Investment Advisors are each required to adopt and implement written policies and procedures reasonably designed to prevent violation of the federal securities laws, review these policies and procedures annually for their adequacy and the effectiveness of their implementation, and designate a chief compliance officer to be responsible for administering the policies and procedures.
The New York Stock Exchange (“NYSE”) Corporate Governance Regulations
The NYSE has adopted corporate governance regulations that listed companies must comply with. We are in compliance with such corporate governance listing standards applicable to BDCs.the Company.
Co-investmentAffiliated Transactions
WeThe Company may be prohibited under the 1940 Act from knowingly participating in certain transactions with ourcertain of its affiliates without the prior approval of our board ofindependent directors who are not interested persons and, in some cases, the prior approval byof the SEC. Thus, based on currentOn December 12, 2023, the SEC interpretations,granted an exemptive order (collectively, the “Order”) that permits the Company to participate in negotiated co-investment transactions involving a BDC like uswith certain other funds and an entity that is advisedaccounts managed and controlled by Saratoga Investment Advisors or an affiliated adviser generally could not be effected without SEC relief. The staffa control affiliate thereof, subject to the satisfaction of certain conditions. Pursuant to the Order, the Company is permitted to co-invest with such affiliates if a “required majority” (as defined in Section 57(o) of the SEC has, however, granted no-action relief to third parties permitting purchases of a single class of privately-placed securities provided that the adviser negotiates no term other than price and certain other conditions are met. As a result, currently we only expect to co-invest on a concurrent basis with affiliates of Saratoga Investment Advisors when each party will own the same securities1940 Act) of the issuer and when no term is negotiated other than price. Any such investment would be made, subjectBoard’s independent directors make certain conclusions in connection with a co-investment transaction, including, but not limited to, compliance with existing regulatory guidance, applicable regulations and our allocation procedures.
We may in the future submit an application for exemptive relief to the SEC to permit greater flexibility to negotiatethat (1) the terms of co-investments because we believe that it willthe potential co-investment transaction, including the consideration to be advantageous for uspaid, are reasonable and fair to co-invest with affiliatesthe Company and its shareholders and do not involve overreaching in respect of Saratoga Investment Advisors where such investmentthe Company or its shareholders on the part of any person concerned, and (2) the potential co-investment transaction is consistent with the interests of the Company’s shareholders and is consistent with its then-current investment objective and strategies. Neither the Company nor its affiliates that are permitted to rely on the Order are obligated to invest or co-invest when investment positions, investment policies, investment strategies, investment restrictions, regulatory requirements and other pertinent factors applicableopportunities are referred to us. However, there is no assurance that any application for exemptive relief, if made, would be granted by the SEC.Company or them.
Small Business Investment Company Regulations
On March 28, 2012, our wholly-owned subsidiary,Our wholly owned subsidiaries, SBIC LP, SBIC II LP, and SBIC III LP, received an SBIC license from the SBA. OnSBA on March 28, 2012, August 14, 2019, our wholly-owned subsidiary,and September 29, 2022, respectively. Following the debentures being fully repaid to the SBA, SBIC II LP also received ansurrendered its license on January 3, 2024, providing the Company access to all undistributed capital of SBIC license fromLP, and SBIC LP subsequently merged with and into the SBA.Company.
The SBIC licenses allows our SBIC LP and SBIC II LPSubsidiaries to obtain leverage by issuing SBA-guaranteed debentures, subject to the satisfaction of certain customary procedures. SBA-guaranteed debentures are non-recourse, interest only debentures with interest payable semi- annuallysemi-annually and have a ten-year maturity. The principal amount of SBA-guaranteed debentures is not required to be paid prior to maturity but may be prepaid at any time without penalty. The interest rate of SBA-guaranteed debentures is fixed at the time of issuance at a market-driven spread over U.S. Treasury Notes with 10-year maturities.
SBICs are designed to stimulate the flow of private equity capital to eligible small businesses. Under SBA regulations, SBICs may make loans to eligible small businesses and invest in the equity securities of small businesses. Under present SBA regulations, eligible small businesses include businesses (together with their affiliates) that have a tangible net worth not exceeding $19.5$24.0 million and have average annual fully taxed net income after U.S federal income taxes not exceeding $6.5$8.0 million (average net income to be computed without benefit of any carryover loss) for the two most recent fiscal years. In addition, an SBIC must devote 25.0% of its investment activity to “smaller enterprises” as defined by the SBA. A smaller enterprise is a business (including its affiliates)one that has a tangible net worth not exceeding $6.0 million and has average annual fully taxed net income after U.S. federal income taxes not exceeding $2.0 million (average net income to be computed without benefit of any net carryover loss) for the two most recent fiscal years. SBA regulations also provide alternative size standard criteria to determine eligibility, for designation as an eligible small business, which depend on the industry in which the business is engaged and are based on such factors as the number of employees and gross revenue.sales. According to SBA regulations, SBICs may make long-term loans to small businesses, invest in the equity securities of such businesses and provide them with consulting and advisory services.
The Company’s wholly owned SBIC LP andSubsidiaries are able to borrow funds from the SBA against each SBIC’s regulatory capital (which generally approximates equity capital in the respective SBIC). The SBIC II LPSubsidiaries are subject to regulation and oversightcustomary regulatory requirements including but not limited to, a periodic examination by the SBA includingand requirements with respect to maintainingmaintain certain minimum financial ratios and other covenants. Receipt of an SBIC license does not assure that the SBIC LP or SBIC II LPSubsidiaries will receive SBA-guaranteed debenture funding, which is dependent upon SBIC LPsubject to SBA approval and SBIC II LP continuing to be incontinued compliance with SBA regulations and policies. The SBA, as a creditor, will have a superior claim to each SBIC LP and SBIC II LP’sSubsidiaries’ assets over ourthe Company’s stockholders and debtholders in the event we liquidatethat the Company liquidates such SBIC LP or SBIC II LPSubsidiary or the SBA exercises its remedies under the SBA-guaranteed debentures issued by the SBIC LP or SBIC II LPSubsidiary upon an event of default.
WeThe Company received exemptive relief from the SEC to permit it to exclude the senior securities of the SBIC LP and SBIC II LPsubsidiaries guaranteed by the SBA from the definition of senior securities in the asset coverage requirement under the 1940 Act. This allows usthe Company increased flexibility under the asset coverage requirement by permitting it to borrow up to $325.0$350.0 million more than it would otherwise be able to absent the receipt of this exemptive relief.
For two or more SBIC’s under common control, the maximum amount of outstanding SBA debentures cannot exceed $350.0 million with at least $175.0 million in combined regulatory capital. Our wholly-ownedwholly owned SBIC subsidiariesSubsidiaries may borrow funds from the SBA against its respective regulatory capital (which generally approximates equity capital) that is paid in and is subject to customary regulatory requirements, including, but not limited to, an examination by the SBA. The SBIC I LP and SBIC II LPSubsidiaries have $325.0$308.4 million of committed capital on an aggregate basis. SBA regulations currently limit the amount of SBA-guaranteed debentures that an individual SBIC may issue to $150.0$175.0 million when it has at least $75.0$87.5 million in regulatory capital.
As of February 28, 2022, we have funded29, 2024, SBIC LP with an aggregate totalwas dissolved. As of $75.0 million of equity capital and have $86.0 million of SBA guaranteed debentures outstanding andFebruary 29, 2024, we have funded SBIC II LP with an aggregate total of $87.5 million of equity capital and have $99.0$175.0 million of SBA-guaranteed debentures outstanding. SBAoutstanding, and we have funded SBIC III LP with an aggregate total of $66.7 million of equity capital and have $39.0 million of SBA-guaranteed debentures are non-recourse to us, have a 10-year maturity, and may be prepaid at any time without penalty. The interest rate of SBA debentures is fixed at the time of issuance, often referred to as pooling, at a market-driven spread over 10-year U.S. Treasury Notes. SBA current regulations limit the amount that SBIC LP and SBIC II LP may borrow to a maximum of $150.0 million and $175.0 million, respectively, which is up to twice its potential regulatory capital.outstanding.
Available Information
We file with or submit to the SEC annual, quarterly and current periodic reports, proxy statements and other information meeting the informational requirements of the Securities Exchange of 1934, as amended (the “Exchange Act”). The SEC maintains an Internet website that contains reports, proxy and information statements and other information filed electronically by us with the SEC at http://www.sec.gov.
Our Internet address is http://www.saratogainvestmentcorp.com. We make available free of charge on our Internet website our Annual Report on Form 10-K, quarterly reports on Form 10-Q, current reports on Form 8-K, and amendments to those reports as soon as reasonably practicable after we electronically file such material with, or furnish it to, the SEC. Information contained on our website is not incorporated by reference into this Annual Report, and you should not consider that information to be part of this Annual Report.
ITEM 1A. RISK FACTORS
Investing in our securities involves a number of significant risks. In addition to other information contained in this Annual Report on Form 10-K, you should consider carefully the following information before making an investment in our securities. The risks set forth below are the principal risks with respect to the Company generally and with respect to BDCs, they may not be the only risks we face. This section nonetheless describes the principal risk factors associated with investment in the Company specifically, as well as those factors generally associated with investment in a company with investment objectives, investment policies, capital structure or trading markets similar to the Company’s. If any of the risks occur, our business, financial condition and results of operations could be materially adversely affected. In such case, our net asset valueNAV and the trading price of our securities could decline and you may lose all or part of your investment.
SUMMARY OF RISK FACTORS
The following is a summary of the principal risks that you should carefully consider before investing in our securities. These and other risk factors are described more fully in this “Item 1A. Risk Factors.”
Risks Related to Our Business and Structure
| ● | We employ leverage, which magnifies the potential for gain or loss on amounts invested and may increase the risk of investing in us. |
| ● | We are exposed to risks associated with changes in interest rates including potential effects on our cost of capital and net investment income. |
| ● | The |
Risks Related to the Current Environment
| ● | Global economic, political and market conditions may adversely affect our business, results of operations and financial condition, including our revenue growth and profitability. |
| ● |
| ● | We are currently operating in a period of capital markets disruption and economic uncertainty. |
| ● | Economic recessions or downturns could impair the ability of our portfolio companies to repay loans and harm our operating results. |
Risks Related to Our Adviser and Its Affiliates
| ● | We may be obligated to pay Saratoga Investment Advisors incentive fees even if we incur a net loss, or there is a decline in the value of our portfolio. |
| ● | The way in which the base management and incentive fees under the Management Agreement is determined may encourage Saratoga Investment Advisors to take actions that may not be in our best interests. |
| ● | Saratoga Investment Advisors’ liability is limited under the Management Agreement and we will indemnify Saratoga |
| ● | Our ability to enter into transactions with our affiliates is restricted. |
Risks Related to Our Investments
| ● | A majority of our debt investments are not required to make principal payments until the maturity of such debt securities and are generally riskier than other types of loans. |
| ● | The lack of liquidity in our investments may adversely affect our business. |
| ● | Our investment in Saratoga CLO constitutes a leveraged investment in a portfolio of subordinated notes representing the lowest-rated securities issued by a pool of predominantly senior secured first lien term loans and is subject to additional risks and volatility. All losses in the pool of loans will be borne by our subordinated notes and only after the value of our subordinated notes is reduced to zero will the higher-rated notes issued by the pool bear any losses. |
| ● | Investments in equity securities involve a substantial degree of risk. |
Risks Related to Our Common Stock
| ● | We may choose to pay dividends in our own stock, in which case you may be required to pay tax in excess of the cash you receive. |
| ● | Due to the |
| ● | The market price of our common stock may fluctuate significantly. |
| ● | There is a risk that you may not receive distributions or that our distributions may not grow over time. |
Risks Related to Our Notes
| ● | The Notes are unsecured and therefore are effectively subordinated to any existing and future secured indebtedness, |
| ● | An active trading market for the Public Notes may not develop or be sustained, which could limit the market price of the Public Notes or the ability to sell them. |
RISKS RELATED TO OUR BUSINESS AND STRUCTURE
We employ leverage, which magnifies the potential for gain or loss on amounts invested and may increase the risk of investing in us.
Borrowings, also known as leverage, magnify the potential for gain or loss on amounts invested and, therefore, increase the risks associated with investing in us. We borrow from and issue senior debt securities to banks and other lenders that is secured by a lien on our assets. Holders of these senior securities have fixed dollar claims on our assets that are superior to the claims of the holders of our securities. Leverage is generally considered a speculative investment technique. Any increase in our income in excess of interest payable on our outstanding indebtedness would cause our net income to increase more than it would have had we not incurred leverage, while any decrease in our income would cause net income to decline more sharply than it would have had we not incurred leverage. Such a decline could negatively affect our ability to make common stock distributions or scheduled debt payments, including with respect to the Notes, as defined below. There can be no assurance that our leveraging strategy will be successful.
Our outstanding indebtedness imposes, and additional debt we may incur in the future will likely impose, financial and operating covenants that restrict our business activities, including limitations that could hinder our ability to finance additional loans and investments or to make the distributions required to maintain our status as a RIC. A failure to add new debt facilities or issue additional debt securities or other evidences of indebtedness in lieu of or in addition to existing indebtedness could have a material adverse effect on our business, financial condition or results of operations.
As of February 28, 2022,29, 2024, there were $12.5$35.0 million outstanding borrowings under the Encina Credit Facility. As of February 28, 2022,29, 2024, we had issued $185.0$214.0 million in SBA-guaranteed debentures and $43.1our $20.0 million $5.0 million, $5.0 million, $10.0 million, $175.0 million and $75.0 million respectively in aggregate principal amount of the 7.25%8.75% fixed-rate notes due 2025 (the “7.25%“8.75% 2025 Notes” or the “Public), $12.0 million principal amount of 7.00% fixed-rate notes due 2025 (the “7.00% 2025 Notes”), theour $5.0 million principal amount of 7.75% fixed-rate notes due in 2025 (the “7.75% 2025 Notes”), the 6.25%our $175.0 million principal amount of 4.375% fixed-rate notes due 2027 (the “6.25% 2027 Notes), the 6.25% notes due 2027 (the “Second 6.25% 2027 Notes”), the 4.375% Notes duein 2026 (the “4.375% 2026 Notes”) and, our $75.0 million principal amount of 4.35% fixed-rate notes due in 2027 (the “4.35% 2027 Notes”), our $105.5 million principal amount of 6.00% fixed-rate notes due in 2027 (the “6.00% 2027 Notes”), our $15.0 million principal amount of 6.25% fixed-rate notes due in 2027 (the “6.25% 2027 Notes”) our $46.0 million principal amount of 8.00% fixed-rate notes due 2027 (the “8.00% 2027 Notes”), our $60.375 million principal amount of 8.125% fixed-rate notes due 2027 (the “8.125% 2027 Notes”) and our $57.5 million principal amount of 8.50% fixed-rate notes due 2028 (the “8.50% 2028 Notes” and together with the Public6.00% 2027 Notes, the 8.00% 2027 Notes, and the 8.125% 2027 Notes, the “Public Notes”). Together, the 8.75% 2025 Notes, 7.00% 2025 Notes, the 7.75% 2025 Notes, and the 6.25% 2027 Notes and the 4.375% 2026, and the 4.35% 2027 Notes, the 6.00% 2027 Notes, the 6.25% 2027 Notes, the 8.00% 2027 Notes, the 8.125% 2027 Notes, and the 8.50% 2028 Notes are referred to as the “Notes”). We may incur additional indebtedness in the future, including, but not limited to, borrowings under the Encina Credit Facility, the Live Oak Credit Facility, or the issuance of additional debt securities in one or more public or private offerings, although there can be no assurance that we will be successful in doing so. Our ability to service our debt depends largely on our financial performance and is subject to prevailing economic conditions and competitive pressures. The amount of leverage that we employ at any particular time will depend on our management’s and our board of directors’ assessment of market and other factors at the time of any proposed borrowing.
As a BDC, we are generally permitted to issue senior securities only in amounts such that our asset coverage ratio equals at least 150.0%150% of total assets to total borrowings and other senior securities, which include all of our borrowings (other than the senior securities of SBIC III LP’s and SBIC IIIII LP’s under the terms of our SEC exemptive relief) and any preferred stock we may issue in the future. If this ratio declines below 150.0%150%, we may not be able to incur additional debt and may need to sell a portion of our investments to repay some debt when it is disadvantageous to do so, and we may not be able to make distributions to our stockholders.
The following table illustrates the effect of leverage on returns from an investment in our common stock assuming various annual returns, net of expenses. The calculations in the table below are hypothetical and actual returns may be higher or lower than those appearing in the table below.
Assumed Return on Our Portfolio
(net of expenses)
| Assumed Return on Portfolio (Net of Expenses) | -10.0% | -5.0% | 0% | 5% | 10% | |||||||||||||||
| Corresponding Return to Common Stockholder (1) | -29% | -17% | -6% | 5% | 17% |
| -10.0% | -5.0% | 0% | 5% | 10% | ||||||
| Assumed Return on Portfolio (Net of Expenses) | ||||||||||
| Corresponding Return to Common Stockholder (1) | -46% | -30% | -14% | 2% | 18% |
| (1) | Assumes |
Substantially all of the assets of SIF II’s, SBIC I’sII and SBIC II’s assetsSIF III are subject to security interests under our Encina Credit Facility orand our Live Oak Facility, respectively, and all of each SBIC Subsidiary’s assets are subject to claims of the SBA with respect to SBA-guaranteed debentures we may issue and if we default on our obligations thereunder, we may suffer adverse consequences, including the foreclosure on our assets.
Substantially all of the assets of SIF II’s, SBIC I’sII and SBIC II’s assetsSIF III are pledged as collateral under the Encina Credit Facility orand the Live Oak Credit Facility, respectively, and all of each SBIC Subsidiary’s assets are subject to a superior claim over the holders of our common stock or the Notes by the SBA pursuant to the SBA-guaranteed debentures. If we default on our obligations under the Encina Credit Facility, the Live Oak Credit Facility, or the SBA-guaranteed debentures, Encina Lender Finance, LLC, Live Oak Banking Company, and/or the SBA may have the right to foreclose upon and sell, or otherwise transfer, the collateral subject to their security interests or superior claim. In such event, we may be forced to sell our investments to raise funds to repay our outstanding borrowings in order to avoid foreclosure and these forced sales may be at times and at prices we would not consider advantageous. Moreover, such deleveraging of our company could significantly impair our ability to effectively operate our business in the manner in which we have historically operated.
In addition, if Encina Lender Finance, LLC, the lender under the Encina Credit Facility, exercises itsor the Live Oak Banking Company, the lender under the Live Oak Credit Facility, exercise their right to sell the assets pledged under the Encina Credit Facility or the Live Oak Credit Facility, respectively, such sales may be completed at distressed sale prices, thereby diminishing or potentially eliminating the amount of cash available to us after repayment of the amounts outstanding under the Encina Credit Facility or the Live Oak Credit Facility.
We are exposed to risks associated with changes in interest rates including potential effects on our cost of capital and net investment income.
General interest rate fluctuations and changes in credit spreads on floating rate loans may have a substantial negative impact on our investments and investment opportunities and, accordingly, may have a material adverse effect on our rate of return on invested capital. In addition, anin response to market indicators showing a rise in inflation, since March 2022, the Federal Reserve has been rapidly increasing interest rates. Although the Federal Reserve left its benchmark rates steady in the fourth quarter of 2023, it has indicated that additional rate increases in the future may be necessary to mitigate inflationary pressures and there can be no assurance that the Federal Reserve will not make upwards adjustments to the federal funds rate in the future. However, there are reports that the Federal Reserve may begin to cut the benchmark rates in 2024. An increase in interest rates would make it more expensive to use debt to finance our investments. Decreases in credit spreads on debt that pays a floating rate of return would have an impact on the income generation of our floating rate assets. Trading prices for debt that pays a fixed rate of return tend to fall as interest rates rise. Trading prices tend to fluctuate more for fixed rate securities that have longer maturities. Although we have no policy governing the maturities of our investments, under current market conditions we expect that we will invest in a portfolio of debt generally having maturities of up to ten years. This means that we will be subject to greater risk (other things being equal) than an entity investing solely in shorter-term securities.
Because we may borrow to fund our investments, a portion of our net investment income may be dependent upon the difference between the interest rate at which we borrow funds and the interest rate at which we invest these funds. A portion of our investments will have fixed interest rates, while a portion of our borrowings will likely have floating interest rates. As a result, a significant change in market interest rates could have a material adverse effect on our net investment income. In periods of rising interest rates, our cost of funds could increase, which would reduce our net investment income. income if there is not a corresponding increase in interest income generated by our investment portfolio. Further, rising interest rates could also adversely affect our performance if we hold investments with floating interest rates, subject to specified minimum (or “floor”) interest rates, while at the same time engaging in borrowings subject to floating interest rates not subject to such minimums. In such a scenario, rising interest rates may temporarily increase our interest expense, even though our interest income from investments is not increasing in a corresponding manner if market rates remain lower than the existing floor rate. If general interest rates rise, there is also a risk that the portfolio companies in which we hold floating rate securities will be unable to pay escalating interest amounts, which could result in a default under their loan documents with us. Rising interest rates could also cause portfolio companies to shift cash from other productive uses to the payment of interest, which may have a material adverse effect on their business and operations and could, over time, lead to increased defaults. In addition, rising interest rates may increase pressure on us to provide fixed rate loans to our portfolio companies, which could adversely affect our net investment income, as increases in our cost of borrowed funds would not be accompanied by increased interest income from such fixed-rate investments.
We may hedge against such interest rate fluctuations by using standard hedging instruments such as futures, options and forward contracts, subject to applicable legal requirements, including without limitation, all necessary registrations (or exemptions from registration) with the Commodity Futures Trading Commission. These activities may limit our ability to participate in the benefits of lower interest rates with respect to the hedged borrowings. Adverse developments resulting from changes in interest rates or hedging transactions could have a material adverse effect on our business, financial condition and results of operations.
The interestalternative reference rates ofthat have replaced LIBOR in our loans to our portfolio companies, any LIBOR-linked securities,credit arrangements and other financial obligations that extended beyond 2021 might be subject to change based on recent regulatory changes, includinginstruments may not yield the decommissioningsame or similar economic results as LIBOR over the life of LIBOR.such transactions.
TheLIBOR, the London Interbank Offered Rate, (“LIBOR”) is an index rate that historically has beenwas widely used in lending transactions and remainswas a common reference rate for setting the floating interest rate on private loans. Prior to June 30, 2023, LIBOR was typically has been the reference rate used in floating-rate loans extended to our portfolio companiesidentified by the Investment Adviser.
The ICE Benchmark Administration (“IBA”) (the entity that is responsible for calculating LIBOR) ceased providing overnight, one, three, six and to some degree, is expected to continue to be used as a reference rate until such time that private markets have fully transitioned totwelve months USD LIBOR tenors on June 30, 2023. In addition, the United Kingdom’s Financial Conduct Authority (“FCA”), which oversees the IBA, now prohibits entities supervised by the FCA from using LIBORs, including USD LIBOR, except in very limited circumstances.
In the United States, the Secured Overnight Financing Rate (“SOFR”), or other alternative reference rates recommended by applicable market regulators. Uncertainty relating to is the LIBOR calculation process, the valuation of LIBOR alternatives, and other economic consequences from the phasing out of LIBOR may adversely affect our results of operations, financial condition and liquidity.
On March 5, 2021, the United Kingdom’s Financial Conduct Authority (the “FCA”), which regulates LIBOR, announced that it will not compel panel banks to contribute to the overnight 1, 3, 6 and 12 months USD LIBOR tenors after June 30, 2023 and all other tenors after December 31, 2021. On November 16, 2021, the FCA issued a statement confirming that starting January 1, 2022, entities supervised by the FCA will be prohibited from using LIBORs, including USD LIBOR, that will be discontinued as of December 31, 2021 as well as, except in very limited circumstances, those tenors of USD LIBOR that will be discontinued or declared non-representative after June 30, 2023. While LIBOR will cease to exist or be declared non-representative, there continues to be uncertainty regarding the nature of potential changes to specific USD LIBOR tenors, the development and acceptance of alternative reference rates and other reforms.
Central banks and regulators in a number of major jurisdictions (for example, United States, United Kingdom, European Union, Switzerland and Japan) have convened working groups to find, and implement the transition to, suitable replacements for LIBORs and other interbank offered rates (“IBORs”). To identify a successor rate for USD LIBOR, the Alternative Reference Rates Committee (“ARRC”), U.S.-based group convened by the U.S. Federal Reserve Board and the Federal Reserve Bank of New York, was formed. The ARRC has identified SOFR as its preferred alternative rate for LIBOR. SOFR is a measure of the cost of borrowing cash overnight, collateralized by U.S. Treasury securities, and is based on directly observable U.S. Treasury-backed repurchase transactions. On July 29, 2021, the ARRC formally recommended SOFR as its preferred alternative replacement rate for LIBOR. On July 29, 2021, the ARRC also recommended a forward-looking term rate based on SOFRis published by CME Group. Although SOFR appears to be the preferred replacement rateFederal Reserve Bank of New York each U.S. Government Securities Business Day, for U.S. dollar LIBOR, at this time, it is not possible to predicttransactions made on the effect of any such changes, any establishment of alternative reference rates or other reforms to LIBOR that may be enacted in the United States, United Kingdom or elsewhere.immediately preceding US. Government Securities Business Day. Alternative reference rates that may replace LIBOR, including SOFR for USD transactions, may not yield the same or similar economic results as LIBOR over the lives of such transactions. There can
All of our loans that referenced LIBOR have been amended to reference the forward-looking term rate published by CME Group Benchmark Administration Limited based on the secured overnight financing rate (“CME Term SOFR”), or a similarly accepted alternative rate. CME Term SOFR rates are forward-looking rates that are derived by compounding projected overnight SOFR rates over one, three, and six months taking into account the values of multiple consecutive, executed, one-month and three-month CME Group traded SOFR futures contracts and, in some cases, over-the-counter SOFR Overnight Indexed Swaps as an indicator of CME Term SOFR reference rate values. CME Term SOFR and the inputs on which it is based are derived from SOFR. Since CME Term SOFR is a relatively new market rate, there will likely be no guarantee that SOFR will become the dominant alternative to USD LIBORestablished trading market for credit agreements or that SOFR will be widely usedother financial instruments when they are issued, and other alternativesan established market may never develop or may not be developed and adopted with additional consequences.
On April 6, 2021, legislation was signed into law inliquid. Market terms for instruments referencing CME Term SOFR rates may be lower than those of later-issued CME Term SOFR indexed instruments. Similarly, if CME Term SOFR does not prove to be widely used, the statetrading price of New Yorkinstruments referencing CME Term SOFR may be lower than those of instruments indexed to indices that provides that contracts, securities and instruments governed by New York law that reference USD LIBOR and that either lack benchmark fallback provisions or include ineffective benchmark fallback provisions in connection with USD LIBOR no longer being published or becoming non-representative, will, by operation of law, refer to a replacement benchmark rate based on SOFR. Despite the adoption of the New York legislation, successful legal challenges against the legislation may render it partially or wholly unconstitutional or unenforceable, e.g., based on other federal or state law grounds.are more widely used.
The elimination of LIBOR or any other changes or reforms to the determination or supervision of LIBOR could have an adverse impact on the market value of and/or transferability of any LIBOR-linked securities, loans, and other financial obligations or extensions of credit held by or due to us, valuation measurements used by us that include LIBOR as an input, our operational processes or our overall financial condition or results of operations. For instance, if the LIBOR reference rate of our LIBOR-linked securities, loans, and other financial obligations is higher than an alternative reference rate, such as SOFR, on our alternative reference rate-linked portfolio investments, the difference between the total interest income earned on interest earning assets and the total interest expense incurred on interest bearing liabilities may be compressed, reducing our net interest income and potentially adversely affecting our operating results. In addition, while the majority of our LIBOR-linked loans contemplate that LIBOR may cease to exist and allow for amendment to a new alternative reference rate without the approval of 100% of the lenders, if LIBOR ceases to exist, we could be required, in such situations, to negotiate modifications to credit agreements governing such instruments, in order to replace LIBOR with such alternative reference rate and to incorporate any conforming changes to applicable credit spreads or margins. Following the replacement of LIBOR, some or all of these credit agreements may bear interest at a lower interest rate, which could have an adverse impact on the value and liquidity of our investment in these portfolio companies and, as a result, on our results of operations. Such adverse impacts and the uncertainty of the transition could result in disputes and litigation with counterparties and borrowers regarding the implementation of alternative reference rates.
Uncertainty about U.S. Presidential Administration initiatives could negatively impact our business, financial condition and results of operations.
The U.S. government has recently calledperiodically calls for significant changes to U.S. trade, healthcare, immigration, foreign and government regulatory policy. In this regard, there is significant uncertainty with respect to legislation, regulation and government policy at the federal level, as well as the state and local levels. Recent events have created a climate of heightened uncertainty and introduced new and difficult-to-quantify macroeconomic and political risks with potentially far-reaching implications. There has been a corresponding meaningful increase in the uncertainty surrounding interest rates, inflation, foreign exchange rates, trade volumes and fiscal and monetary policy. To the extent the U.S. Congress or the current presidential administration implements changes to U.S. policy, those changes may impact, among other things, the U.S. and global economy, international trade and relations, unemployment, immigration, corporate taxes, healthcare, the U.S. regulatory environment, inflation and other areas. Although we cannot predict the impact, if any, of these changes to our business, they could adversely affect our business, financial condition, operating results and cash flows. Until we know what policy changes are made and how those changes impact our business and the business of our competitors over the long term, we will not know if, overall, we will benefit from them or be negatively affected by them.
There are significant potential conflicts of interest which could adversely impact our investment returns.
Our executive officers and directors, and the members of our Investment Adviser, serve or may serve as officers, directors or principals of entities that operate in the same or a related line of business as we do or of investment funds managed by our affiliates. Accordingly, they may have obligations to investors in those entities, the fulfillment of which might not be in the best interests of us or our stockholders. For example, Christian L. Oberbeck, our chief executive officer and managing member of our Investment Adviser, is the managing partner of Saratoga Partners, a middle marketmiddle-market private equity investment firm. In addition, the principals of our Investment Adviser may manage other funds which may from time to time have overlapping investment objectives with those of us and accordingly invest in, whether principally or secondarily, asset classes similar to those targeted by us. If this should occur, the principals of our Investment Adviser will face conflicts of interest in the allocation of investment opportunities to us and such other funds. Although our investment professionals will endeavor to allocate investment opportunities in a fair and equitable manner, we and our common stockholders could be adversely affected in the event investment opportunities are allocated among us and other investment vehicles managed or sponsored by, or affiliated with, our executive officers, directors and Investment Adviser, and the members of our Investment Adviser.
Changes in laws or regulations governing our operations, or changes in the interpretation thereof, and any failure by us to comply with laws or regulations governing our operations may adversely affect our business.
We are subject to regulation at the local, state and federal level. New legislation may be enacted or new interpretations, rulings or regulations could be adopted, including those governing the types of investments we are permitted to make, any of which could harm us and our stockholders, potentially with retroactive effect. For example, the current U.S. presidential administration could support an enhanced regulatory agenda that imposes greater costs on all sectors and on financial services companies in particular. In addition, any change to the SBA’s current debenture program could have a significant impact on our ability to obtain low-cost leverage and, therefore, our competitive advantage over other funds.
Legal, tax and regulatory changes could occur that may adversely affect us. For example, from time to time the market for private equity transactions has been (and is currently being) adversely affected by a decrease in the availability of senior and subordinated financings for transactions, in part in response to credit market disruptions and/or regulatory pressures on providers of financing to reduce or eliminate their exposure to the risks involved in such transactions.
Additionally, any changes to the laws and regulations governing our operations related to permitted investments may cause us to alter our investment strategy in order to meet our investment objectives. Such changes could result in material differences to the strategies and plans set forth in this Annual Report and may shift our investment focus from the areas of expertise of our Investment Adviser to other types of investments in which our Investment Adviser may have little or no expertise or experience. Any such changes, if they occur, could have a material adverse effect on our results of operations and the value of your investment.
Legislative or other actions relating to taxes could have a negative effect on the Company.
Legislative or other actions relating to taxes could have a negative effect on the Company and its investors. The rules dealing with U.S. federal income taxation are constantly under review by persons involved in the legislative process and by the IRS and the U.S. Treasury Department. We cannot predict with certainty how any changes in the tax laws might affect the Company, its investments or its investors. New legislation and any U.S. Treasury regulations, administrative interpretations or court decisions interpreting such legislation could significantly and negatively affect the Company’s ability to qualify for tax treatment as a RIC or the U.S. federal income tax consequences to the Company and its investors of such qualification or could have other adverse consequences. You are urged to consult with your tax advisor with respect to the impact of the status of any legislative, regulatory or administrative developments and proposals and their potential effect on your investment in our securities.
There is uncertainty surrounding potential legal, regulatory and policy changes by newthe current presidential administrationsadministration and Congress in the United States that may directly affect financial institutions and the global economy.
As a result ofFollowing the November 20202022 elections in the United States, the Democratic Party gained control of bothcontrols the Presidency and the Senate, fromwith the Republican Party and retained control ofcontrolling the House of Representatives. Therefore,Despite political tensions and uncertainty in a divided legislature, changes in federal policy, including tax policies, and at regulatory agencies are expected to occur over time through policy and personnel changes, which may lead to changes involving the level of oversight and focus on the financial services industry or the tax rates paid by corporate entities. The nature, timing and economic and political effects of potential changes to the current legal and regulatory framework affecting financial institutions remain highly uncertain. Uncertainty surrounding future changes may adversely affect our operating environment and therefore our business, financial condition, results of operations and growth prospects.
Changes to United States tariff and import/export regulations may have a negative effect on our portfolio companies and, in turn, harm us.
There has been ongoing discussion and commentary regarding potential significant changes to United States trade policies, treaties and tariffs. The current U.S. presidential administration, along with Congress, has created significant uncertainty about the future relationship between the United States and other countries with respect to the trade policies, treaties and tariffs. These developments, or the perception that any of them could occur, may have a material adverse effect on global economic conditions and the stability of global financial markets, and may significantly reduce global trade and, in particular, trade between the impacted nations and the United States. Any of these factors could depress economic activity and restrict our portfolio companies’ access to suppliers or customers and have a material adverse effect on their business, financial condition and results of operations, which in turn would negatively impact us.
We are dependent on information systems and systems failures could significantly disrupt our business, which may, in turn, negatively affect the market price of our common stock and our ability to pay dividends.
Our business is dependent on our and third parties’ communications and information systems. Any failure or interruption of those systems, including as a result of the termination of an agreement with any third-party service providers, could cause delays or other problems in our activities. Our financial, accounting, data processing, backup or other operating systems and facilities may fail to operate properly or become disabled or damaged as a result of a number of factors including events that are wholly or partially beyond our control and adversely affect our business. There could be:
| ● | sudden electrical or telecommunications outages; |
| ● | natural disasters such as earthquakes, tornadoes and hurricanes; |
| ● | disease pandemics or other serious public health events, such as the |
| ● | events arising from local or larger scale political or social matters, including terrorist acts; |
| ● | acts of war; and |
| ● | cyber-attacks. |
These events, in turn, could have a material adverse effect on our operating results and negatively affect the market price of our common stock and our ability to pay dividends to our stockholders.
Our ability to enter into transactions involving derivatives and financial commitment transactions may be limited.
Through comprehensive new global regulatory regimes impacting derivatives (e.g., the Wall Street Reform and Consumer Protection Act of 2010 (“Dodd-Frank Act”), European Market Infrastructure Regulation (“EMIR”), Markets in Financial Investments Regulation (“MIFIR”)/Markets in Financial Instruments Directive (“MIFID II”)), certain over-the-counter derivatives transactions in which we may engage are either now or will soon be subject to various requirements, such as mandatory central clearing of transactions which include additional margin requirements and in certain cases trading on electronic platforms, pre-and post-trade transparency reporting requirements and mandatory bi-lateral exchange of initial margin for non-cleared swaps. The Dodd-Frank Act also created new categories of regulated market participants, such as “swap dealers,” “security-based swap dealers,” “major swap participants,” and “major security-based swap participants” who are subject to significant new capital, registration, recordkeeping, reporting, disclosure, business conduct and other regulatory requirements. The EU and some other jurisdictions are implementing similar requirements. Because these requirements are new and evolving (and some of the rules are not yet final), their ultimate impact remains unclear. However, even if the Company itself is not located in a particular jurisdiction or directly subject to the jurisdiction’s derivatives regulations, we may still be impacted to the extent we enter into a derivatives transaction with a regulated market participant or counterparty that is organized in that jurisdiction or otherwise subject to that jurisdiction’s derivatives regulations.
Based on information available as of the date of this Annual Report, the effect of such requirements will be likely to (directly or indirectly) increase our overall costs of entering into derivatives transactions. In particular, new margin requirements, position limits and significantly higher capital charges resulting from new global capital regulations, even if not directly applicable to us, may cause an increase in the pricing of derivatives transactions entered into by market participants to whom such requirements apply or affect our overall ability to enter into derivatives transactions with certain counterparties. Such new global capital regulations and the need to satisfy the various requirements by counterparties are resulting in increased funding costs, increased overall transaction costs, and significantly affecting balance sheets, thereby resulting in changes to financing terms and potentially impacting our ability to obtain financing. Administrative costs, due to new requirements such as registration, recordkeeping, reporting, and compliance, even if not directly applicable to us, may also be reflected in our derivatives transactions. New requirements to trade certain derivatives transactions on electronic trading platforms and trade reporting requirements may lead to (among other things) fragmentation of the markets, higher transaction costs or reduced availability of derivatives, and/or a reduced ability to hedge, all of which could adversely affect the performance of certain of our trading strategies. In addition, changes to derivatives regulations may impact the tax and/or accounting treatment of certain derivatives, which could adversely impact us.
In November 2020, the SEC adopted new rules regardingRule 18f-4 under the ability1940 Act, which relates to the use of a BDC (or a registered investment company) to use derivatives and other transactions that create future payment or delivery obligations. obligations by BDCs (and other funds that are registered investment companies). Under Rule 18f-4, for which compliance was required beginning in August 2022, BDCs that use derivatives would beare subject to a value-at-risk (“VaR”) leverage limit, certain other derivatives risk management program and testing requirements and requirements related to board reporting. These new requirements would apply unless the BDC qualifiedqualifies as a “limited derivatives user,” as defined in the SEC’s adopted rules.Rule 18f-4. A BDC that enters into reverse repurchase agreements or similar financing transactions would need to aggregate the amount of indebtedness associated with the reverse repurchase agreements or similar financing transactions could either (i) comply with the asset coverage requirements of the Section 18, as modified by Section 61, of the 1940 Act when engaging in reverse repurchase agreements or (ii) choose to treat such agreements as derivativederivatives transactions under the adopted rule. Under the adopted rule,Rule 18f-4. In addition, under Rule 18f-4, a BDC may enter into an unfunded commitment agreement that is not a derivatives transaction, such as an agreement to provide financing to a portfolio company, if the BDC has a reasonable belief, at the time it enters into such an agreement, that it will have sufficient cash and cash equivalents to meet its obligations with respect to all of its unfunded commitment agreements, in each case as it becomes due. If the BDC cannot meet this test,requirement, it is required to treat the unfunded commitmentscommitment as a derivatives transaction subject to the aforementioned requirements of the rule.Rule 18f-4. Collectively, these requirements may limit our ability to use derivatives and/or enter into certain other financial contracts. However, if we fail to qualify as a limited derivatives user and become subject to the additional requirements under Rule 18f-4, compliance with such requirements may increase cost of doing business, which could have a material adverse effect on our business, financial condition, results of operations, and cash flows.
Internal and external cyber threats, as well as other disasters, could impair our ability to conduct business effectively.
The occurrenceWe, and others in our industry, are the targets of a disaster, such as a cyber-attackmalicious cyber activity. A successful cyber-attach, whether perpetrated by criminal or state-sponsored actors, against us or against a third-party that has access to our dataservice providers, or networks, a natural catastrophe, an industrial accident, failureaccidental disclosure of our disaster recovery systems, or consequential employee error,non-public information, could have an adverse effect on our ability to communicate or conduct business, negatively impacting our operations and financial condition. This adverse effect can become particularly acute if those events affect our electronic data processing, transmission, storage, and retrieval systems, or impact the availability, integrity, or confidentiality of our data.data, especially personal and other confidential information.
WeSaratoga Investment Advisors and third-party service providers with which we do business depend heavily upon computer systems to perform necessary business functions. Despite our implementation of a variety of security measures, our computer systems, networks, and data, like those of other companies, could be subject to cyber-attacks and unauthorized access, acquisition, use, alteration, or destruction, such as from the insertion of malware (including ransomware) physical and electronic break-ins or unauthorized tampering, malware and computer virus attacks,unauthorized access, or system failures and disruptions.disruptions of our computer systems, networks and date. If one or more of these events occurs, it could potentially jeopardize the confidential, proprietary, personal and other information processed, stored in, and transmitted through our computer systems and networks. Such an attack could cause interruptions or malfunctions in our operations, which could result in financial losses, misappropriation of assets, loss of personal information, litigation, regulatory enforcement action and penalties, client dissatisfaction or loss, reputational damage, and increased costs associated with mitigation of damages and remediation. We may have to make a significant investment to fix or replace any inoperable or compromised systems or to modify or enhance its cybersecurity controls, procedures and measures. Similarly, the public perception that we or our affiliates may have been the target of a cybersecurity threat, whether successful or not, also could have a material adverse effect on our reputation and lead to financial losses from loss of business, depending on the nature and severity of the threat.
If unauthorized parties gain access to such information and technology systems, they may be able to steal, publish, delete or modify private and sensitive information, including nonpublic personal information related to stockholders (and their beneficial owners) and material nonpublic information. The systems we have implemented to manage risks relating to these types of events could prove to be inadequate and, if compromised, could become inoperable for extended periods of time, cease to function properly or fail to adequately secure private information. Breaches such as those involving covertly introduced malware, impersonation of authorized users and industrial or other espionage may not be identified even with sophisticated prevention and detection systems, potentially resulting in further harm and preventing them from being addressed appropriately. The failure of these systems or of disaster recovery plans for any reason could cause significant interruptions in our and our investment advisor’s operations and result in a failure to maintain the security, confidentiality or privacy of sensitive data, including personal information relating to stockholders, material nonpublic information and other sensitive information in our possession.
A disaster or a disruption in the infrastructure that supports ourThird parties with which we do business including a disruption involving electronic communicationsare sources of cybersecurity or other services used by ustechnological risks. We outsource certain functions and these relationships allow for the storage and processing of our information, as well as client, counterparty, employee, and borrower information. Cybersecurity failures or third partiesbreaches to Saratoga Investment Advisors and other service providers (including, but not limited to, accountants, custodians, transfer agents and administrators), and the issuers of securities in which we invest, also have the ability to cause disruptions and impact business operations, potentially resulting in financial losses, interference with whom we conduct business, or directly affecting our headquarters, could have a material adverse impact on our ability to continuecalculate its NAV, impediments to operatetrading, the inability of our shareholders to transact business, without interruption. violations of applicable privacy and other laws, regulatory fines, penalties, reputation damages, reimbursement of other compensation costs, or additional compliance costs. Our disaster recovery programs may not be sufficient to mitigate the harm that may result from such a disaster or disruption. In addition, insurance and other safeguards might only partially reimburse us for our losses, if at all.
Third parties with which we do business may also be sources of cybersecurity or other technological risk. We outsource certain functions and these relationships allow for the storage and processing of our information, as well as client, counterparty, employee, and borrower information. While we engage in actions to reduce our exposure resulting from outsourcing, ongoing threats may result in unauthorized access, loss, exposure,acquisitions, use, alteration or destruction of data, or other cybersecurity incidentincidents that affects our data, resulting in increased costs and other consequences as described above. The Company does not control the cybersecurity measures put in place by such third parties, and such third parties could have limited indemnification obligations to the Company and its affiliates. If such a third party fails to adopt or adhere to adequate cybersecurity procedures, or if despite such procedures its networks or systems are breached, information relating to investor transactions and/or personal information of investors may be lost or improperly accessed, used or disclosed.
In addition, cybersecurity has become a top priority for regulators around the world,world. Privacy and some jurisdictions have enacted laws requiring companies to notify individuals of datainformation security breaches involving certain types of personal data. If we fail to comply with the relevant laws and regulations,regulation changes, and compliance with those changes, may result in cost increases due to system changes and the development of new administrative processes. In addition, we could suffermay be required to expend significant additional resources to modify our protective measures and to investigate and remediate vulnerabilities or other exposures arising from operational and security risks. We currently maintain insurance coverage relating to cybersecurity risks; however, we may be required to expend significant additional resources to modify our protective measures or to investigate and remediate vulnerabilities or other exposures, and we may be subject to litigation and financial losses a disruption of our businesses, liability to investors, regulatory intervention or reputational damage.that are not fully insured.
We and our service providers continue to be impacted by government actions and actions by private businesses in response to the COVID-19 pandemic, which are obstructing the regular functioning of business workforces (including requiring employees to work from external locations and their homes). Policies of extended periods of remote working, whether by us or by our service providers, could strain technology resources, introduce operational risks and otherwise heighten the risks described above. Remote working environments may be less secure and more susceptible to hacking attacks, including phishing and social engineering attempts that seek to exploit the COVID-19 pandemic. Accordingly, the risks described above are heightened under current conditions.
33
Cybersecurity risks and cyber incidents may adversely affect our business or the business of our portfolio companies by causing a disruption to our operations or the operations of our portfolio companies, a compromise or corruption of our confidential information or the confidential information of our portfolio companies and/or damage to our business relationships or the business relationships of our portfolio companies, all of which could negatively impact the business, financial condition and operating results of us or our portfolio companies.
A cybercybersecurity incident is considered to be any adverse eventan unauthorized occurrence, or a series of related unauthorized occurrences, on or conducted through a company’s information systems that threatensjeopardizes the confidentiality, integrity, or availability of thea company’s information resources of ussystems or our portfolio companies.any information residing therein.. These incidents may be an intentional attack or an unintentional event and could involve gaining unauthorized access to our information systems or those of our portfolio companies or third-party vendors for purposes of misappropriating assets, stealing confidential information, corrupting data or causing operational disruption. Despite careful security and controls design, the information technology system of our portfolio companies and our third-party vendors, may be subject to security breaches and cyber-attacks the result of which could include disrupted operations, misstated or unreliable financial data, liability for stolen assets or information, increased cybersecurity protection and insurance costs, litigation and damage to business relationships. As our portfolio companies’ and our third party vendor’s reliance on technology has increased, so have the risks posed to our information systems, both internal and those provided by third-party service providers, and the information systems of our portfolio companies and third-party vendors. We have implemented processes, procedures and internal controls to help mitigate cybersecurity risks and cyber intrusions, but these measures, as well as our increased awareness of the nature and extent of a risk of a cyber-incident, do not guarantee that a cyber-incident will not occur and/or that our financial results, operations or confidential information will not be negatively impacted by such an incident. Further, the remote working conditions resulting from COVID-19 pandemic have heightened our and our portfolio companies’ vulnerability to a cybersecurity risk or incident.
Regulations governing our operation as a BDC will affect our ability to raise additional capital.
Our business requires a substantial amount of additional capital. We may acquire additional capital from the issuance of senior securities or other indebtedness or the issuance of additional shares of our common stock. However, we may not be able to raise additional capital in the future on favorable terms or at all. We may issue debt securities or preferred securities, which we refer to collectively as “senior securities,” and we may borrow money from banks or other financial institutions, up to the maximum amount permitted by the 1940 Act.
We are not generally able to issue and sell our common stock at a price below NAV per share. We may, however, sell our common stock, or issue warrants, options or rights to acquire our common stock, at a price below the current NAV of the common stock if our board of directors determines that such sale is in our best interests and the best interests of our stockholders, and the holders of a majority of our outstanding voting securities have approved such issuances within the prior year. In any such case, the price at which our securities are to be issued and sold may not be less than a price which, in the determination of our board of directors, closely approximates the market value of such securities (less any commission or discount). If our common stock trades at a discount to NAV, this restriction could adversely affect our ability to raise capital. We do not currently have stockholder approval of issuances below NAV.
Effective April 16, 2019, our asset coverage requirement was reduced from 200% to 150%, which may increase the risk of investing in the Company.
The 1940 Act generally prohibits BDCs from incurring indebtedness unless immediately after such borrowing we have an asset coverage for total borrowings of at least 200% (i.e., the amount of debt may not exceed 50% of the value of our assets). However, on March 23, 2018, the Small Business Credit Availability Act modified the 1940 Act by allowing a BDC to increase the maximum amount of leverage it may incur from an asset coverage ratio of 200% to an asset coverage ratio of 150%, if certain requirements are met. Under the 1940 Act, we were allowed to increase our leverage capacity once the majority of our independent directors approved an increase in our leverage capacity, with such approval becoming effective after one year. On April 16, 2018, our board of directors, including a majority of our independent directors, approved of our becoming subject to a minimum asset coverage ratio of 150% under the 1940 Act, which became effective on April 16, 2019. We are required to make certain disclosures on our website and in SEC filings regarding, among other things, the receipt of approval to increase our leverage, our leverage capacity and usage, and risks related to leverage.
We are generally permitted to incur indebtedness or issue senior securities in amounts such that our asset coverage, as defined in the 1940 Act, equals at least 150% after each issuance of senior securities. Compliance with these requirements may unfavorably limit our investment opportunities and reduce our ability in comparison to other companies to profit from favorable spreads between the rates at which we can borrow and the rates at which we can lend. As a BDC, therefore, we may need to issue equity more frequently than our privately-owned competitors, which may lead to greater stockholder dilution. With respect to stock that is a senior security, we must make provisions to prohibit any dividend distribution to our stockholders or the repurchase of certain of our securities, unless we meet the applicable asset coverage ratios at the time of the dividend distribution or repurchase. If the value of our assets declines, we may be unable to satisfy the asset coverage test. If that happens, we may be required to liquidate a portion of our investments and repay a portion of our indebtedness at a time when such sales may be disadvantageous in order to make dividend distributions or repurchase certain of our securities.
We are not generally able to issue and sell our common stock at a price below net asset value per share. We may, however, sell our common stock, or issue warrants, options or rights to acquire our common stock, at a price below the current net asset value of the common stock if our board of directors determines that such sale is in our best interests and the best interests of our stockholders, and the holders of a majority of our outstanding voting securities have approved such issuances within the prior year. In any such case, the price at which our securities are to be issued and sold may not be less than a price which, in the determination of our board of directors, closely approximates the market value of such securities (less any commission or discount). If our common stock trades at a discount to net asset value, this restriction could adversely affect our ability to raise capital. We do not currently have stockholder approval of issuances below net asset value.
Effective April 16, 2019, our asset coverage requirement was reduced from 200% to 150%, which could increase the risk of investing in the Company.
The 1940 Act generally prohibits us from incurring indebtedness unless immediately after such borrowing we have an asset coverage for total borrowings of at least 200% (i.e., the amount of debt may not exceed 50% of the value of our assets). However, on March 23, 2018, the Small Business Credit Availability Act was signed into law and, among other things, modified the 1940 Act by allowing a BDC to increase the maximum amount of leverage it may incur from an asset coverage ratio of 200% to an asset coverage ratio of 150%, if certain requirements are met. Under the 1940 Act, we were allowed to increase our leverage capacity once the majority of our independent directors approved an increase in our leverage capacity, with such approval becoming effective after one year. On April 16, 2018, our board of directors, including a majority of our independent directors, approved of our becoming subject to a minimum asset coverage ratio of 150% under Sections 18(a)(1) and 18(a)(2) of the 1940 Act. The 150% asset coverage ratio became effective on April 16, 2019. We are required to make certain disclosures on our website and in SEC filings regarding, among other things, the receipt of approval to increase our leverage, our leverage capacity and usage, and risks related to leverage.
Leverage magnifies the potential for loss on investments in our indebtedness and on invested equity capital. As we use leverage to partially finance our investments, our stockholders will experience increased risks of investing in our securities. If the value of our assets increases, then leveraging would cause the net asset valueNAV attributable to our common stock to increase more sharply than it would have had we not leveraged. Conversely, if the value of our assets decreases, leveraging would cause net asset valueNAV to decline more sharply than it otherwise would have had we not leveraged our business. Similarly, any increase in our income in excess of interest payable on the borrowed funds would cause our net investment income to increase more than it would without the leverage, while any decrease in our income would cause net investment income to decline more sharply than it would have had we not borrowed. Such a decline could negatively affect our ability to pay common stock dividends, scheduled debt payments or other payments related to our securities. Increased leverage may also cause a downgrade of our credit rating. Leverage is generally considered a speculative investment technique. See “Risk Factors—Risks Related to Our Business and Structure—We employ leverage, which magnifies the potential for gain or loss on amounts invested and may increase the risk of investing in us.”
The agreementagreements governing our Encina Credit Facility containsand our Live Oak Credit Facility contain various covenants that, among other things, limitslimit our discretion in operating our business and providesprovide for certain minimum financial covenants.
The agreementagreements governing the Encina Credit Facility containsand the Live Oak Credit Facility contain customary default provisions such as the termination or departure of certain “key persons” of Saratoga Investment Advisors, a material adverse change in our business and the failure to maintain certain minimum loan quality and performance standards. An event of default under the Encina Credit Facility or the Live Oak Credit Facility would result, among other things, in termination of the availability of further funds under the Encina Credit Facility or the Live Oak Credit Facility and an accelerated maturity date for all amounts outstanding under the Encina Credit Facility or the Live Oak Credit Facility, which would likely disrupt our business and, potentially, the portfolio companies whose loans we financed through the Encina Credit Facility or the Live Oak Credit Facility. This could reduce our revenues and, by delaying any cash payment allowed to us under the Encina Credit Facility or the Live Oak Credit Facility until the lender has been paid in full, reduce our liquidity and cash flow and impair our ability to grow our business and maintain our status as a RIC.
Each loan origination under the respective facility is subject to the satisfaction of certain conditions. We cannot assure you that we will be able to borrow funds under the Encina Credit Facility or Live Oak Credit Facility at any particular time or at all.
We will be subject to U.S. federal income tax imposed at corporate rates if we fail to qualify as a RIC.
We have elected to be treated, and intend to maintain our qualification annually as a RIC under Subchapter M of the Code.Code; however, no assurance can be given that we will be able to maintain our RIC tax treatment. As a RIC, we doare not paysubject to U.S. federal income taxestax on our income (including realized gains) that is timely distributed to our stockholders, provided that we satisfy certain source-of-income, annual distribution and asset–diversification requirements. While we are not subject to U.S. federal income tax on the income and gains we timely distribute to our stockholders, our stockholders will be required to include the amounts of such distributions in income and may be subject to U.S. federal income tax on such amounts.
The source-of-income requirement is satisfied if we derive at least 90.0%90% of our annual gross income from interest, dividends, payments with respect to certain securities loans, gains from the sale or other disposition of securities or options thereon or foreign currencies, or other income derived with respect to our business of investing in such securities or currencies, and net income from interests in “qualified publicly traded partnerships,” as defined in the Code.
The annual distribution requirement generally is satisfied if we timely distribute to our stockholders on an annual basis an amount equal to at least 90.0%90% of our ordinary net taxable income and realized net short-term capital gains in excess of realized net long-term capital losses, if any, reduced by deductible expenses. We are subject to certain asset coverage ratio requirements under the 1940 Act and covenants under our borrowing agreements that could, under certain circumstances, restrict us from making the required distributions. In such case, if we are unable to obtain cash from other sources or are prohibited from making distributions, we may be subject to U.S. federal income tax at corporate rates.
The asset-diversification requirements will be satisfied if we diversify our holdings so that at the end of each quarter of the taxable year: (i) at least 50.0%50% of the value of our assets consists of cash, cash equivalents, U.S. government securities, securities of other regulated investment companies, and other securities if such other securities of any one issuer do not represent more than 5.0%5% of the value of our assets or more than 10% of the outstanding voting securities of the issuer; and (ii) no more than 25.0%25% of the value of our assets is invested in (a) the securities, other than U.S. government securities or securities of other regulated investment companies, of one issuer, or(b) the securities, other than securities of other RICs, of two or more issuers that are controlled, as determined under applicable tax rules, by us and that are engaged in the same or similar or related trades or businesses or in certain(c) the securities of one or more “qualified” publicly traded partnerships.
Failure to meet these tests may result in our having to (i) dispose of certain investments quickly or (ii) raise additional capital to prevent the loss of our RIC qualification. Because most of our investments will be in private companies, any such dispositions could be made at disadvantageous prices and may result in substantial losses. If we raise additional capital to satisfy the asset- diversification requirements, it could take us time to invest such capital. During this period, we will invest the additional capital in temporary investments, such as cash and cash equivalents, which we expect will earn yields substantially lower than the interest income that we anticipate receiving in respect of investments in leveraged loans and mezzanine debt.
If we fail to qualify as a RIC for any reason, all of our taxable income will be subject to U.S. federal income tax at regular corporate rates. The resulting corporate taxestax liability could substantially reduce our net assets, the amount of income available for distribution to our common stockholders or payment of our outstanding indebtedness including the Notes. Such a failure would have a material adverse effect on our results of operations and financial condition.
Because we intend to distribute between 90% and 100% of our income to our stockholders in connection with our election to be treated as a RIC, we will continue to need additional capital to finance our growth. If additional funds are unavailable or not available on favorable terms, our ability to grow will be impaired.
In order to qualify for the tax benefits available to RICs and to minimize U.S. federal income taxes at corporate rates, we intend to distribute to our stockholders between 90% and 100% of our annual taxable income and capital gains, except that we may retain certain net capital gains for investment and treat such amounts as deemed distributions to our stockholders. If we elect to treat any amounts as deemed distributions, we must pay U.S. federal income taxes at the corporate rate on such deemed distributions on behalf of our stockholders. As a result of these requirements, we will likely need to raise capital from other sources to grow our business. As a BDC, we generally are required to meet a coverage ratio of total assets, less liabilities and indebtedness not represented by senior securities, to total senior securities, which includes all of our borrowings and any outstanding preferred stock, of at least 150% as of April 16, 2019;2019. These requirements limit the amount that we may borrow. Because we will continue to need capital to grow our investment portfolio, these limitations may prevent us from incurring debt and require us to raise additional equity at a time when it may be disadvantageous to do so.
While we expect to be able to borrow and to issue additional debt and equity securities, we cannot assure you that debt and equity financing will be available to us on favorable terms, or at all. Also, as a BDC, we generally are not permitted to issue equity securities priced below net asset valueNAV without stockholder approval. If additional funds are not available to us, we could be forced to curtail or cease new investment activities, and our net asset valueNAV and share price could decline.
We may have difficulty paying our required distributions if we recognize income before or without receiving cash in respect of such income.
For U.S. federal income tax purposes, we may be required to recognize taxable income in circumstances in which we do not receive a corresponding payment in cash. For example, we may on occasion hold debt obligations that are treated under applicable tax rules as having original issue discount (such as debt instruments with PIK or, in certain cases, increasing interest rates or issued with warrants) and we must include in income each year a portion of the original issue discount that accrues over the life of the obligation, regardless of whether cash representing such income is received by us in the same taxable year. We may also have to include in income other amounts that we have not yet received in cash, such as deferred loan origination fees that are paid after origination of the loan or are paid in non-cash compensation such as warrants or stock. In addition, we may be required to accrue for U.S. federal income tax purposes amounts attributable to our investment in Saratoga CLO, a collateralized loan obligation fund, that may differ from the distributions paid in respect of our investment in the subordinated notes of such collateralized loan obligation fund because of the factors set forth above or because distributions on the subordinated notes are contractually required to be diverted for reinvestment or to pay down outstanding indebtedness.
Because original issue discount will be included in the Company’s “investment company taxable income” for the year of the accrual, we may be requested to make distributions to shareholders to satisfy the annual distribution requirement applicable to RICs, even where we have not received any corresponding cash amount. As a result, we may have difficulty meeting the annual distribution requirement necessary to maintain favorable tax treatment. If we are not able to obtain cash from other sources, and choose not to make a qualifying share distribution, we may become subject to U.S federal income tax at corporate rates. Additionally, because investments with a deferred payment feature may have the effect of deferring a portion of the borrower’s payment obligation until maturity of the debt investment, it may be difficult for us to identify and address developing problems with borrowers in terms of their ability to repay us.
We operate in a highly competitive market for investment opportunities.
A number of entities compete with us to make the types of investments that we make in private middle marketmiddle-market companies. We compete with other BDCs, public and private funds (including SBICs), commercial and investment banks, commercial financing companies, insurance companies, high-yield investors, hedge funds, and, to the extent they provide an alternative form of financing, private equity funds. Many of our competitors are substantially larger and have considerably greater financial, technical and marketing resources than us. Some competitors may have a lower cost of funds and access to funding sources that are not available to us. In addition, some of our competitors may have higher risk tolerances or different risk assessments that could allow them to consider a wider variety of investments and establish more relationships than us. Furthermore, many of our competitors are not subject to the regulatory restrictions that the 1940 Act imposes on us as a BDC. As a result of this competition, we may not be able to take advantage of attractive investment opportunities from time to time, and we cannot assure you that we will be able to identify and make investments that meet our investment objective.
While we do not seek to compete primarily based on the interest rates we offer, we believe that some our competitors may make loans with interest rates that are comparable or lower than the rates we offer.
We may lose investment opportunities if we do not match our competitors’ pricing, terms and structure. If we match our competitors’ pricing, terms and structure, we may experience decreased net interest income and increased risk of credit loss. As a result of operating in such a competitive environment, we may make investments that are on better terms to our portfolio companies than we originally anticipated, which may impact our return on these investments.
We are a non-diversified investment company within the meaning of the 1940 Act, and therefore we are not limited with respect to the proportion of our assets that may be invested in securities of a single issuer.
We are classified as a non-diversified investment company within the meaning of the 1940 Act, which means that we are not limited by the 1940 Act with respect to the proportion of our assets that we may invest in securities of a single issuer. Although we seek to maintain a diversified portfolio in accordance with our business strategies, to the extent that we assume large positions in the securities of a small number of issuers, our net asset valueNAV may fluctuate to a greater extent than that of a diversified investment company as a result of changes in the financial condition or the market’s assessment of the issuer. We may also be more susceptible to any single economic or regulatory occurrence than a diversified investment company. Beyond our RIC asset-diversification requirements, we do not have fixed guidelines for diversification, and our investments could be concentrated in relatively few portfolio companies.
Our financial condition and results of operations depend on our ability to manage future investments effectively.
Our ability to achieve our investment objective depends on our ability to acquire suitable investments and monitor and administer those investments, which depends, in turn, on Saratoga Investment Advisors’ ability to identify, invest in and monitor companies that meet our investment criteria.
Accomplishing this result on a cost-effective basis is largely a function of Saratoga Investment Advisors’ structuring of the investment process and its ability to provide competent, attentive and efficient service to us. Our executive officers and the officers and employees of Saratoga Investment Advisors have substantial responsibilities in connection with their roles at Saratoga Partners as well as responsibilities under the Management Agreement. They may also be called upon to provide managerial assistance to our portfolio companies. These demands on their time, which will increase as the number of investments grow, may distract them or slow the rate of investment. In order to grow, Saratoga Investment Advisors may need to hire, train, supervise and manage new employees. However, we cannot assure you that any such employees will contribute beneficially to the work of Saratoga Investment Advisors. Any failure to manage our future growth effectively could have a material adverse effect on our business and financial condition.
We may experience fluctuations in our quarterly and annual results.
We could experience fluctuations in our quarterly operating results due to a number of factors, including the interest rate payable on the debt investments we make, the default rate on such investments, the level of our expenses, variations in and the timing of the recognition of realized and unrealized gains or losses, changes in our portfolio composition, the degree to which we encounter competition in our markets and general economic conditions. As a result of these factors, results for any period should not be relied upon as being indicative of performance in future periods. In addition, any of these factors could negatively impact our ability to achieve our investment objectives, which may cause the net asset valueNAV of our common stock to decline.
Terrorist attacks, acts of war, or natural disasters may affect any market for our common stock, impact the businesses in which we invest and harm our business, operating results and financial condition.
Portfolio investments may be affected by force majeure events (i.e., events beyond the control of the party claiming that the event has occurred, including, without limitation, acts of God, fire, flood, earthquakes, war, terrorism and labor strikes). Some force majeure events may adversely affect the ability of a party (including a portfolio company or a counterparty to us or a portfolio company) to perform its obligations until it is able to remedy the force majeure event. In addition, the cost to a portfolio company of repairing or replacing damaged assets resulting from such force majeure event could be considerable. Additionally, a major governmental intervention into industry, including the nationalization of an industry or the assertion of control over one or more companies or its assets, could result in a loss to us, including if its investment in such issuer is cancelled, unwound or acquired (which could be without what we consider to be adequate compensation). To the extent we are exposed to investments in portfolio companies that as a group are exposed to such force majeure events, the risks and potential losses to us are enhanced.
The continued threat of global terrorism and the impact of military and other action will likely continue to cause volatility in the economies of certain countries, contribute to increased market volatility and economic uncertainties or deterioration in the United States and worldwide and various aspects thereof, including in prices of commodities. Our portfolio investments may involve significant strategic assets having a national or regional profile. The nature of these assets could expose them to a greater risk of being the subject of a terrorist attack than other assets or businesses. Acts of war could similarly lead to such volatility. For example, in response to the conflict between Russia and Ukraine, the United States and other countries have imposed sanctions or other restrictive actions against Russia. In addition, the recent outbreak of hostilities in the Middle East and escalating tensions in the region may create volatility and disruption of global markets. Any of the above factors, including sanctions, export controls, tariffs, trade wars and other governmental actions, could have a material adverse effect on our business, financial condition, cash flows, and results of operations, and could cause the market value of our common stock to decline.
Substantially all of our portfolio investments are recorded at fair value as determined in good faith by our board of directors; such valuations are inherently uncertain and may be materially higher or lower than the values that we ultimately realize upon the disposal of such investments.
Substantially all of our portfolio is, and we expect will continue to be, comprised of investments that are not publicly traded. The value of investments that are not publicly traded may not be readily determinable. We value these investments quarterly at fair value as determined in good faith by our board of directors. Saratoga Investment Advisors may utilize the services of an independent valuation firm to aid it in determining fair value of investments for which market quotations are not readily available. The types of factors that may be considered in valuing our investments include the nature and realizable value of any collateral, the portfolio company’s ability to make payments and its earnings, the markets in which the portfolio company does business, market yield trend analysis, comparison to publicly traded companies, discounted cash flow and other relevant factors. Because such valuations, and particularly valuations of private investments and private companies are inherently uncertain, may fluctuate over short periods of time and may be based on estimates, our determinations of fair value may differ materially from the values that would have been used if a ready market for these investments existed. Our net asset valueNAV could be materially affected if the determinations regarding the fair value of our investments were materially higher or lower than the values that we ultimately realize upon the disposal of such investments.
Our board of directors may change our investment objective, operating policies and strategies without prior notice or stockholder approval, the effects of which may be adverse.
Our board of directors has the authority to modify or waive our current investment objective, operating policies and strategies without prior notice and without stockholder approval. We cannot predict the effect any changes to our current operating policies and strategies would have on our business, financial condition, and value of our common stock. However, the effects might be adverse, which could negatively impact our ability to pay dividends and cause you to lose all or part of your investment.
We have limited experience in managing a SBIC and anyAny failure to comply with SBA regulations resulting from our lack of experience or otherwise, could have an adverse effect on our operations.
On March 28, 2012, our wholly-owned subsidiary, Saratoga Investment Corp. SBIC, LP, received a license from the SBA to operate as an SBIC under Section 301(c) of the Small Business Investment Act of 1958 and is regulated by the SBA. On August 14, 2019, our wholly-owned subsidiary,Our wholly owned subsidiaries, SBIC II LP alsoand SBIC III LP, received an SBIC license from the SBA.SBA on August 14, 2019 and September 29, 2022, respectively.
The SBA places certain limitations on the financing terms of investments by SBICs in portfolio companies and prohibits SBICs from providing funds for certain purposes or to businesses in a few prohibited industries. Compliance with SBIC requirements may cause our SBIC subsidiaries to forego attractive investment opportunities that are not permitted under SBA regulations.
Further, SBA regulations require that an SBIC be periodically examined and audited by the SBA to determine its compliance with the relevant SBA regulations. The SBA prohibits, without prior SBA approval, a “change of control” of an SBIC or transfers that would result in any person (or a group of persons acting in concert) owning 10% or more of a class of capital stock of an SBIC. If our SBIC subsidiariesSubsidiaries fail to comply with applicable SBA regulations, the SBA could, depending on the severity of the violation, limit or prohibit its use of debentures, declare outstanding debentures immediately due and payable, and/or limit it from making new investments. In addition, the SBA can revoke or suspend a license for willful or repeated violation of, or willful or repeated failure to observe, any provision of the Small Business Investment Act of 1958 or any rule or regulation promulgated thereunder. These actions by the SBA would, in turn, negatively affect us because our SBIC subsidiariesSubsidiaries are our wholly-ownedwholly owned subsidiaries. We do not have any prior experience managing a SBIC. Our lack of experience in complyingAny failure to comply with SBA regulations may hinder our ability to take advantage of our SBIC subsidiaries’ access to SBA-guaranteed debentures.
Any failure to comply with SBA regulationsdebentures, which could have an adverse effect on our operations.
RISKS RELATED TO THE CURRENT ENVIRONMENT
Global economic, political and market conditions may adversely affect our business, results of operations and financial condition, including our revenue growth and profitability.
The current worldwide financial marketsmarket situation, as well as various social and political tensions in the United States and around the world (including wars and other forms of conflict, terrorist acts, security operations and catastrophic events such as fires, floods, earthquakes, tornadoes, hurricanes and global health epidemics), may contribute to increased market volatility, may have long termlong-term effects on the United StatesU.S. and worldwide financial markets, and may cause economic uncertainties or deterioration in the United States and worldwide. For example, the COVID-19 pandemic continues to adversely impact global commercial activity and has contributed to significant volatility in financial markets. We monitor developments and seek to manage our investments in a manner consistent with achieving our investment objective, but there can be no assurance that we will be successful in doing so. See “—Events outside of our control, including public health crises such as the ongoing COVID-19 pandemic, may negatively affect our results of operations and financial performance.”
On January 31, 2020, the United Kingdom ended its membership in the European Union, (“Brexit”). Underreferred to as “Brexit.” Following the termstermination of the withdrawal agreement negotiated and agreed betweena transition period, the United Kingdom (the “UK”) and the European Union entered into a trade and cooperation agreement to govern the UK’s departure fromfuture relationship between the parties, which was provisionally applied as of January 1, 2021 and entered into force on May 1, 2021 following ratification by the European Union. With respect to financial services, the agreement leaves decisions on equivalence and adequacy to be determined by each of the United Kingdom and the European Union was followed by a transition period, which ran until December 31, 2020unilaterally in due course. Such agreement is untested and during whichcould lead to ongoing political and economic uncertainty and periods of exacerbated volatility in both the UK continued to applyUnited Kingdom and in wider European Union law and was treatedglobal markets for all material purposes as if it were still a member of the European Union. Onsome time. In addition, on December 24, 2020, the European Union and United Kingdom governments signed a trade deal that became provisionally effective on January 1, 2021 and that now governs the relationship between the United Kingdom and the European Union (the “Trade Agreement”). The Trade Agreement implements significant regulation around trade, transport of goods and travel restrictions between the United Kingdom and the European Union.
Notwithstanding the foregoing, the longer term economic, legal, political and social implications of Brexit are unclear at this stage and are likely to continue to lead to ongoing political and economic uncertainty and periods of increased volatility in both the United Kingdom and in wider European markets for some time. In particular, Brexit could lead to calls for similar referendums in other European Union jurisdictions, which could cause increased economic volatility in the European and global markets. This mid- to long-term uncertainty could have adverse effects on the economy generally and on our ability to earn attractive returns. In particular, currency volatility could mean that our returns are adversely affected by market movements and could make it more difficult, or more expensive, for us to execute prudent currency hedging policies. Potential decline in the value of the British Pound and/or the Euro against other currencies, along with the potential further downgrading of the United Kingdom’s sovereign credit rating, could also have an impact on the performance of certain investments made in the United Kingdom or Europe.
We are currently operating in a period of capital markets disruptionssignificant market disruption and economic uncertainty. Such market conditions may materially and adversely affect debt and equity capital markets,uncertainty, which may have a negative impact on our business, financial condition and results of operations. An extended disruption in the capital markets and the credit markets could negatively affect our business.
From time to time, capital markets may experience periods of disruption and instability. The U.S. capital markets have experienced extreme volatility and disruption following the global outbreak of COVID-19 that began in December 2019, and the conflict between Russia and Ukraine that began in late February 2022, and the ongoing war in the Middle East (see “Terrorist attacks, acts of war, or natural disasters may affect any market for our common stock, impact the businesses in which we invest and harm our business, operating results and financial condition” for more information). DisruptionsEven after the COVID-19 pandemic subsided, the U.S. economy, as well as most other major economies, have continued to experience unpredictable economic conditions, and we anticipate our businesses would be materially and adversely affected by any prolonged economic downturn or recession in the United States and other major markets. In addition, disruptions in the capital markets have increased the spread between the yields realized on risk-free and higher risk securities, resulting in illiquidity in parts of the capital markets. The COVID-19 pandemic and new variants of COVID, such as the Delta and Omicron variants, has led to, and for an unknown period of time will continue to lead to, disruptions in local, regional, national and global markets and economies affected thereby. These types of events have adversely affected and could continue to adversely affect operating results for us and for our portfolio companies. For example, the COVID-19 pandemic has delivered a shock to the global economy.
The COVID-19 outbreak, including new variants of COVID-19, such as the Delta and Omicron variants, continues tocurrent economic conditions have and any future outbreaks could have,resulted in an adverse impact on the ability of lenders to originate loans, the volume and type of loans originated, the ability of borrowers to make payments and the volume and type of amendments and waivers granted to borrowers and remedial actions taken in the event of a borrower default, each of which could negatively impact the amount and quality of loans available for investment by the Company and returns to the Company, among other things. With respect to theThe U.S. credit markets (in particular for middle marketmiddle-market loans), the COVID-19 pandemic has resulted in, and until fully resolved is likely to continue to result in, have experienced the following among other things: (i) increased draws by borrowers on revolving lines of credit and other financing instruments; (ii) increased requests by borrowers for amendments and waivers of their credit agreements to avoid default, increased defaults by such borrowers and/or increased difficulty in obtaining refinancing at the maturity dates of their loans;loans and increased uses of PIK features; and (iii) volatility and disruption of these markets including greater volatility in pricing and spreads and difficulty in valuing loans during periods of increased volatility, and liquidity issues; and (iv) rapidly evolving proposals and/or actions by state and federal governments to address problems being experienced in the markets and by businesses and the economy in general which may not necessarily adequately address the problems facing the loan market and middle market businesses.
The COVID-19 pandemic is having, and any future outbreaks of COVID-19 could have, an adverse impact on the markets and the economy in general, which could have a material adverse impact on, among other things, the ability of lenders to originate loans, the volume and type of loans originated, and the volume and type of amendments and waivers granted to borrowers and remedial actions taken in the event of a borrower default, each of which could negatively impact the amount and quality of loans available for investment by us and returns to us, among other things. As of the date of this Annual Report, it is impossible to determine the scope of the COVID-19 pandemic, or any future outbreaks of COVID-19, how long any such outbreak, market disruption or uncertainties may last, the effect any governmental actions will have or the full potential impact on us and our portfolio companies. Any potential impact to our results of operations will depend to a large extent on future developments and new information that could emerge regarding the duration and severity of COVID-19 and the actions taken by authorities and other entities to contain COVID-19 or treat its impact, all of which are beyond our control. These potential impacts, while uncertain, could adversely affect our and our portfolio companies’ operating results.
These and future market disruptions and/or illiquidity could have an adverse effect on our business, financial condition, results of operations and cash flows. Unfavorable economic conditions also could increase our funding costs, limit our access to the capital markets or result in a decision by lenders not to extend credit to us. These events could limit our investment originations and our ability to grow and could also have a material negative impact on our operating results and the fair values of our debt and equity investments. We may have to access, if available, alternative markets for debt and equity capital, and a severe disruption in the global financial markets, deterioration in credit and financing conditions or uncertainty regarding U.S. government spending and deficit levels or other global economic conditions could have a material adverse effect on our business, financial condition and results of operations.issues.
Past economic downturns or recessions have had a significant negative impact on the operating performance and fair value of middle market companies. For example, between 2008 and 2009, the U.S. and global capital markets were unstable, as evidenced by periodic disruptions in liquidity in the debt capital markets, significant write-offs in the financial services sector, the re-pricing of credit risk in the broadly syndicated credit market and the failure of major financial institutions. Despite actions of the U.S. federal government and foreign governments, these events contributed to worsening general economic conditions that materially and adversely impacted the broader financial and credit markets and reduced the availability of debt and equity capital for the market as a whole and financial services firms in particular.
We cannot be certain as to the duration or magnitude of the economic impact of the COVID-19 pandemic on the markets in which we and our portfolio companies operate, including with respect to travel restrictions, business operating restrictions, mitigation efforts (whether voluntary, suggested, or mandated by law) and corresponding declines in economic activity that may negatively impact the U.S. economy and the markets for the various types of goods and services provided by U.S. middle market companies. Depending on the duration, magnitude and severity of these conditions and their related economic and market impacts, certain portfolio companies may suffer declines in earnings and could experience financial distress, which could cause them to default on their financial obligations to us and their other lenders.
We will also be negatively affected if our operations and effectiveness or the operations and effectiveness of a portfolio company (or any of the key personnel or service providers of the foregoing) is compromised or if necessary or beneficial systems and processes are disrupted.
Events outside of our control, such as the COVID-19 pandemic, could negatively affect our portfolio companies and our results of our operations and financial condition.
Periods of market volatility have occurred and could continue to occur in response to pandemics or other events outside of our control. These types of events have adversely affected—and could continue to adversely affect—operating results for us and for our portfolio companies. For example, the COVID-19 pandemic has led to, and for an unknown period of time will continue to lead to, disruptions in local, regional, national and global markets and the economies affected thereby, including the United States. With respect to U.S. and global credit markets and the economy in general, the COVID-19 pandemic and preventative measures taken to contain or mitigate its spread have caused, and are continuing to cause, business shutdowns, cancellations of events and restrictions on travel, significant reductions in demand for certain goods and services, reductions in business activity and financial transactions, supply chain disruptions, labor difficulties and shortages, commodity inflation and elements of economic and financial market instability in the United States and globally. Such effects will likely continue for the duration of the pandemic, for some period thereafter, and may be reinstated in the future. COVID-19 and the resulting economic dislocations have had adverse consequences for the business operations and financial performance of some of our portfolio companies, which may, in turn impact the valuation of our investments and have adversely affected, and threaten to continue to adversely affect, our operations. We cannot predict the full impact of COVID-19, including the duration of the restrictions described above. As a result, we are unable to predict the duration of these business and supply chain disruptions, the extent to which COVID-19 will negatively affect our portfolio companies’ operating results or the impact that such disruptions may have on our results of operations and financial condition. With respect to loans to portfolio companies, the Company will be impacted if, among other things, (i) amendments and waivers are granted (or are required to be granted) to borrowers permitting deferral of loan payments or allowing for PIK interest payments, (ii) borrowers default on their loans, are unable to refinance their loans at maturity, or go out of business, or (iii) the value of loans held by the Company decreases as a result of such events and the uncertainty they cause. Portfolio companies may also be more likely to seek to draw on unfunded commitments we have made, and the risk of being unable to fund such commitments is heightened during such periods.
Depending on the duration and extent of the disruption to the business operations of our portfolio companies, we expect some portfolio companies, particularly those in vulnerable industries, to experience financial distress and possibly to default on their financial obligations to us and/or their other capital providers. In addition, if such portfolio companies are subjected to prolonged and severe financial distress, we expect some of them to substantially curtail their operations, defer capital expenditures, and lay off workers. These developments would be likely to permanently impair their businesses and result in a reduction in the value of our investments in them. Any potential
These conditions and future market disruptions and/or illiquidity could have an adverse effect on our (and our portfolio companies’) business, financial condition, results of operations and cash flows. Ongoing unfavorable economic conditions may increase our funding costs, limit our access to the capital markets or result in a decision by lenders not to extend credit to our portfolio companies and/or us. These events have limited and could continue to limit our investment originations, limit our ability to grow and have a material negative impact on our operating results and the fair values of our debt and equity investments. We may have to access, if available, alternative markets for debt and equity capital, and a severe disruption in the global financial markets, deterioration in credit and financing conditions, continued increases in interest rates, or uncertainty regarding U.S. government spending and deficit levels or other global economic conditions could have a material adverse effect on our business, financial condition and results of operations.
While we intend to continue to source and invest in new loan transactions to U.S. middle-market companies, we cannot be certain that we will be able to do so successfully or consistently. A lack of suitable investment opportunities may impair our ability to make new investments, and may negatively impact our earnings and result in decreased dividends to our shareholders.
If current economic conditions continue for an extended period of time, loan delinquencies, loan non-accruals, problem assets, and bankruptcies may increase. In addition, collateral for our loans may decline in value, which could cause loan losses to increase and the net worth and liquidity of loan guarantors could decline, impairing their ability to honor commitments to us. An increase in loan delinquencies and non-accruals or a decrease in loan collateral and guarantor net worth could result in increased costs and reduced income which would have a material adverse effect on our business, financial condition or results of operations. We continue to observe supply chain interruptions, labor difficulties, commodity inflation and elements of economic and financial market instability both globally and in the United States.
We will need to raise additional capital in the future in order to continue to make investments in accordance with our business and investing strategy and to pursue new business opportunities. Ongoing disruptive conditions in the financial industry and the impact of new legislation in response to those conditions could restrict our business operations and could adversely impact our results of operations will depend to a large extent on future developments and new information that could emerge regarding the duration and severity of the COVID-19 pandemic and the actions taken by authorities and other entities to contain the spread or treat its impact, all of which are beyond our control. These potential impacts, while uncertain, could adversely affect our and our portfolio companies’ operating results and financial condition.
We cannot be certain as to the duration or magnitude of the ongoing economic conditions in the markets in which we and our portfolio companies operate and corresponding declines in economic activity that may negatively impact the U.S. economy and the markets for the various types of goods and services provided by U.S. middle-market companies. Depending on the duration, magnitude and severity of these conditions and their related economic and market impacts, certain of our portfolio companies may suffer declines in earnings and could experience financial distress, which could cause them to default on their financial obligations to us and their other lenders.
We will also be negatively affected if our operations and effectiveness or the operations and effectiveness of a portfolio company (or any of the key personnel or service providers of the foregoing) is compromised or if necessary or beneficial systems and processes are disrupted. In consideration of these and related factors, we may downgrade our internal ratings with respect to other portfolio companies in the future as conditions warrant and new information becomes available.
Inflation may adversely affect the business, results of operations and financial condition of our portfolio companies, which may, in turn, impact the valuation of such portfolio companies.
Certain of our portfolio companies may be impacted by inflation, which may, in turn, impact the valuation of such portfolio companies. If such portfolio companies are unable to pass any increases in their costs along to their customers, it could adversely affect their results and their ability to pay interest and principal on our loans, particularly if interest rates rise in response to inflation. In March 2022, the Federal Reserve raised interest rates by 0.25%, the first increase since December 2018, and indicated that it would raise rates at each of the remaining six meeting in 2022. (See “We are exposed to risks associated with changes in interest rates including potential effects on our cost of capital and net investment income” for a discussion of the risks associated with a rising interest rate environment). In addition, any projected future decreases in our portfolio companies’ operating results due to inflation could adversely impact the fair value of those investments. Any decreases in the fair value of our investments could result in future unrealized losses and therefore reduce our net assets resulting from operations.
Further downgrades of the U.S. credit rating, automatic spending cuts, or another government shutdown could negatively impact our liquidity, financial condition and earnings.
U.S. debt ceiling and budget deficit concerns have increased the possibility of additional credit-rating downgrades and economic slowdowns, or a recession in the United States. Although U.S. lawmakers have passed legislation to raise the federal debt ceiling on multiple occasions, including, a suspension ofmost recently, in June 2023, which suspended the federal debt ceiling in August 2019 and December 2021,through early 2025 unless Congress takes legislative action to further extend or defer it. Despite taking action to suspend the debt ceiling, ratings agencies have lowered or threatened to lower the long-term sovereign credit rating on the United States. The December 2021 legislation suspendsStates, including Fitch downgrading the debt ceiling throughU.S. government’s long-term rating from AAA to AA+ in August 2023 unless Congress takes legislative actionand Moody’s lowering the U.S. government’s credit rating outlook from “stable” to further extend or defer it.“negative” in November 2023.
The impact of this the increased debt ceiling and/or any further downgrades to the U.S. government’s sovereign credit rating or its perceived creditworthiness could adversely affect the U.S. and global financial markets and economic conditions. Absent further quantitative easing by the Federal Reserve, these developments could cause interest rates and borrowing costs to rise, which may negatively impact our ability to access the debt markets on favorable terms. In addition, disagreement over the federal budget has caused the U.S. federal government to shut down for periods of time.time, and may lead to additional shutdowns in the future. Continued adverse political and economic conditions could have a material adverse effect on our business, financial condition and results of operations.
Economic recessions or downturns could impair the ability of our portfolio companies to repay loans and harm our operating results.
Many of our portfolio companies are susceptible to economic slowdowns or recessions, (including industry specific downturns)including as a result of, among other things, the COVID-19 pandemic, elevated levels of inflation, and a rising interest rate environment, and may be unable to repay our debt investmentsloans during these periods. The global outbreak of COVID-19 has disrupted, and continues to disrupt, economic markets, and the prolonged economic impact is uncertain. Many manufacturers of goods in China and other countries in Asia have seen a downturn in production due to the suspension of business and temporary closure of factories in an attempt to curb the spread of the illness. As the impact of COVID-19 spreads to other parts of the world, similar impacts may occur with respect to affected countries. In the past, instability in the global capital markets resulted in disruptions in liquidity in the debt capital markets, significant write-offs in the financial services sector, the re-pricing of credit risk in the broadly syndicated credit market and the failure of major domestic and international financial institutions. In particular, in past periods of instability, the financial services sector was negatively impacted by significant write-offs as the value of the assets held by financial firms declined, impairing their capital positions and abilities to lend and invest. In addition, continued uncertainty surrounding the negotiation of trade deals between Britain and the European Union following the United Kingdom’s exit from the European Union and uncertainty between the United States and other countries, including China, with respect to trade policies, treaties, and tariffs, among other factors, have caused disruption in the global markets. There can be no assurance that market conditions will not worsen in the future.
In an economic downturn, we may haveTherefore, any non-performing assets or non-performing assets mayare likely to increase, and the value of our portfolio is likely to decrease during these periods. Adverse economic conditions also may also decrease the value of any collateral securing some of our debt investmentsloans and the value of our equity investments. Economic slowdowns or recessionsinvestments and could lead to financial losses in our portfolio and a corresponding decrease in revenues, net income and assets. Unfavorable economic conditions also could increase our funding costs, limit our access to the capital markets or result in a decision by lenders not to extend credit to us. These events could prevent us from increasing our investments and harm our operating results.
The occurrence of recessionary conditions and/A portfolio company’s failure to satisfy financial or negative developments in the domestic and international credit markets may significantly affect the markets in which we do business, the value of our investments, and our ongoing operations, costs and profitability. Any such unfavorable economic conditions, including rising interest rates, may also increase our funding costs, limit our access to capital marketsoperating covenants imposed by us or negatively impact our ability to obtain financing, particularly from the debt markets. In addition, any future financial market uncertaintyother lenders could lead to financial market disruptionsdefaults and, potentially, acceleration of its loans and foreclosure on its assets, which could further impacttrigger cross-defaults under other agreements and jeopardize our portfolio company’s ability to obtain financing. These eventsmeet its obligations under the debt securities that we hold. We may incur expenses to the extent necessary to seek recovery upon default or to negotiate new terms with a defaulting portfolio company. It is possible that we could limitbecome subject to a lender liability claim, including as a result of actions taken if we or Saratoga Investment Advisors renders significant managerial assistance to the borrower. Furthermore, if one of our portfolio companies were to file for bankruptcy protection, even though we may have structured our investment originations, limitas senior secured debt, depending on the facts and circumstances, including the extent to which we or Saratoga Investment Advisors provided managerial assistance to that portfolio company or otherwise exercise control over it, a bankruptcy court might re-characterize our abilitydebt as a form of equity and subordinate all or a portion of our claim to grow and negatively impact our operating results and financial condition.claims of other creditors.
RISKS RELATED TO OUR ADVISER AND ITS AFFILIATES
We may be obligated to pay Saratoga Investment Advisors incentive fees even if we incur a net loss, or there is a decline in the value of our portfolio.
Saratoga Investment Advisors is entitled to incentive fees for each fiscal quarter in an amount equal to a percentage of the excess of our investment income for that quarter (before deducting incentive compensation, but net of operating expenses and certain other items) above a threshold return for that quarter. Our pre-incentive fee net investment income, for incentive compensation purposes, excludes realized and unrealized capital gains or losses that we may incur in the fiscal quarter, even if such capital gains or losses result in a net gain or loss on our consolidated statements of operations for that quarter. Thus, we may be required to pay Saratoga Investment Advisors incentive fees for a fiscal quarter even if there is a decline in the value of our portfolio or we incur a net loss for that quarter.
Under the terms of the Management Agreement, we may have to pay incentive fees to Saratoga Investment Advisors in connection with the sale of an investment that is sold at a price higher than the fair value of such investment on May 31, 2010, even if we incur a loss on the sale of such investment.
Incentive fees on capital gains paid to Saratoga Investment Advisors under the Management Agreement equals 20.0% of our “incentive fee capital gains,” which equals our realized capital gains on a cumulative basis from May 31, 2010 through the end of the fiscal year, if any, computed net of all realized capital losses and unrealized capital depreciation on a cumulative basis on each investment in the Company’s portfolio, less the aggregate amount of any previously paid capital gain incentive fee. Under the Management Agreement, the capital gains portion of the incentive fee is based on realized gains and realized and unrealized losses from May 31, 2010. Therefore, realized and unrealized losses incurred prior to such time will not be taken into account when calculating the capital gains portion of the incentive fee, and Saratoga Investment Advisors will be entitled to 20.0% of the incentive fee capital gains that arise after May 31, 2010. In addition, the cost basis for computing realized gains and losses on investments held by us as of May 31, 2010 will equal the fair value of such investments as of such date. See our Form 10-Q for the quarter ended May 31, 2010 that was filed with the SEC on July 15, 2010 for the fair value and other information related to our investments as of such date. As a result, we may be required to pay incentive fees to Saratoga Investment Advisors on the sale of an investment even if we incur a realized loss on such investment, so long as the investment is sold for an amount greater than its fair value as of May 31, 2010.
The way in which the base management and incentive fees under the Management Agreement is determined may encourage Saratoga Investment Advisors to take actions that may not be in our best interests.
The incentive fee payable by us to our Investment Adviser may create an incentive for it to make investments on our behalf that are risky or more speculative than would be the case in the absence of such compensation arrangement, which could result in higher investment losses, particularly during cyclical economic downturns. The way in which the incentive fee payable to our Investment Adviser is determined, which is calculated separately in two components as a percentage of the income (subject to a hurdle rate) and as a percentage of the realized gain on invested capital, may encourage our Investment Adviser to use leverage to increase the return on our investments or otherwise manipulate our income so as to recognize income in quarters where the hurdle rate is exceeded.
Moreover, we pay Saratoga Investment Advisors a base management fee based on our total assets, including any investments made with borrowings, which may create an incentive for it to cause us to incur more leverage than is prudent, or not to repay our outstanding indebtedness when it may be advantageous for us to do so, in order to maximize its compensation. Under certain circumstances, the use of leverage may increase the likelihood of default, which would disfavor the holders of our securities.
The incentive fee payable by us to our Investment Adviser also may create an incentive for our Investment Adviser to invest on our behalf in instruments that have a deferred interest feature. Under these investments, we would accrue the interest over the life of the investment but would not receive the cash income from the investment until the end of the investment’s term, if at all. Our net investment income used to calculate the income portion of our incentive fee, however, includes accrued interest. Thus, a portion of the incentive fee would be based on income that we have not yet received in cash and may never receive in cash if the portfolio company is unable to satisfy such interest payment obligation to us. Consequently, while we may make incentive fee payments on income accruals that we may not collect in the future and with respect to which we do not have a “claw back” right against our Investment Adviser per se, the amount of accrued income written off in any period will reduce the income in the period in which such write-off was taken and may thereby reduce such period’s incentive fee payment.
In addition, Saratoga Investment Advisors receives a quarterly income incentive fee based, in part, on our pre-incentive fee net investment income, if any, for the immediately preceding calendar quarter. This income incentive fee is subject to a fixed quarterly hurdle rate before providing an income incentive fee return to Saratoga Investment Advisors. This fixed hurdle rate was determined when then current interest rates were relatively low on a historical basis. Thus, if interest rates rise, it would become easier for our investment income to exceed the hurdle rate and, as a result, more likely that Saratoga Investment Advisors will receive an income incentive fee than if interest rates on our investments remained constant or decreased. However, if we repurchase our outstanding debt securities, including the Notes, and such repurchase results in our recording a net gain or loss on the extinguishment of debt for financial reporting and tax purposes, such net gain or loss will not be included in our pre-incentive fee net investment income for purposes of determining the income incentive fee payable to our Investment Adviser under the Management Agreement. Moreover, our Investment Adviser receives the incentive fee based, in part, upon net capital gains realized on our investments. Unlike the portion of the incentive fee based on income, there is no performance threshold applicable to the portion of the incentive fee based on net capital gains. As a result, our Investment Adviser may have a tendency to invest more in investments that are likely to result in capital gains as compared to income producing securities. Such a practice could result in our investing in more speculative securities than would otherwise be the case, which could result in higher investment losses, particularly during economic downturns.
Our board of directors will seek to ensure that Saratoga Investment Advisors is acting in our best interests and that any conflict of interest faced by Saratoga Investment Advisors in its capacity as our Investment Adviser does not negatively impact us.
The base management fee we pay to Saratoga Investment Advisors may induce it to influence our leverage, which may be contrary to our interest.
We pay Saratoga Investment Advisors a quarterly base management fee based on the value of our total assets (including any assets acquired with leverage). Accordingly, Saratoga Investment Advisors has an economic incentive to increase our leverage. Our board of directors monitors the conflicts presented by this compensation structure by approving the amount of leverage that we incur. If our leverage is increased, we will be exposed to increased risk of loss, bear the increase cost of issuing and servicing such senior indebtedness, and will be subject to any additional covenant restrictions imposed on us in an indenture or other instrument or by the applicable lender.
Saratoga Investment Advisors’ liability is limited under the Management Agreement and we will indemnify Saratoga InvestmentsInvestment Advisors against certain liabilities, which may lead it to act in a riskier manner on our behalf than it would when acting for its own account.
Saratoga Investment Advisors has not assumed any responsibility to us other than to render the services described in the Management Agreement. Pursuant to the Management Agreement, Saratoga Investment Advisors and its officers and employees are not liable to us for their acts under the Management Agreement absent willful misfeasance, bad faith, gross negligence or reckless disregard in the performance of their duties. We have agreed to indemnify, defend and protect Saratoga Investment Advisors and its officers and employees with respect to all damages, liabilities, costs and expenses resulting from acts of Saratoga Investment Advisors not arising out of willful misfeasance, bad faith, gross negligence or reckless disregard in the performance of their duties under the Management Agreement. These protections may lead Saratoga Investment Advisors to act in a riskier manner when acting on our behalf than it would when acting for its own account.
Our ability to enter into transactions with our affiliates is restricted.
Because we have elected to be treated as a BDC, we are prohibited under the 1940 Act from participating in certain transactions with certain of our affiliates without the prior approval of our independent directors and, in some cases, the SEC. Any person that owns, directly or indirectly, 5.0% or more of our outstanding voting securities is our affiliate for purposes of the 1940 Act and we are generally prohibited from buying or selling any securities (other than any security of which we are the issuer) from or to such affiliate, absent the prior approval of our independent directors. The 1940 Act also prohibits certain “joint” transactions with certain of our affiliates, which could include investments in the same portfolio company, without prior approval of our independent directors and, in some cases, the SEC. If a person acquires more than 25.0% of our voting securities, we are prohibited from buying or selling any security (other than any security of which we are the issuer) from or to such person or certain of that person’s affiliates, or entering into prohibited joint transactions with such person, absent the prior approval of the SEC. Similar restrictions limit our ability to transact business with our officers, directors or Investment Adviser or their affiliates. As a resultWe rely on the Order granted to us, Saratoga Investment Advisors and certain of these restrictions, we may be prohibited from buying or selling any security (other than any security of which we are the issuer) from or to any portfolio company of a private equity fund managedits affiliates by our Investment Adviser without the prior approval of the SEC whichthat permits us to participate in negotiated co-investment transactions with certain other funds and accounts managed and controlled by Saratoga Investment Advisors or a control affiliate thereof, subject to the satisfaction of certain conditions. These restrictions may limit the scope of investment opportunities that would otherwise be available to us and there can be no assurance that we will be able to participate in all investment opportunities that are suitable to us.
RISKS RELATED TO OUR INVESTMENTS
If we make unsecured debt investments, we may lack adequate protection in the event our portfolio companies become distressed or insolvent and will likely experience a lower recovery than more senior debtholders in the event our portfolio companies default on their indebtedness.
We make unsecured debt investments in portfolio companies. Unsecured debt investments are unsecured and junior to other indebtedness of the portfolio company. As a consequence, the holder of an unsecured debt investment may lack adequate protection in the event the portfolio company becomes distressed or insolvent and will likely experience a lower recovery than more senior debtholders in the event the portfolio company defaults on its indebtedness. In addition, unsecured debt investments of middle- marketmiddle-market companies are often highly illiquid and in adverse market conditions may experience steep declines in valuation even if they are fully performing.
If we invest in the securities and other obligations of distressed or bankrupt companies, such investments may be subject to significant risks, including lack of income, extraordinary expenses, uncertainty with respect to satisfaction of debt, lower-than expected investment values or income potentials and resale restrictions.
We are authorized to invest in the securities and other obligations of distressed or bankrupt companies. At times, distressed debt obligations may not produce income and may require us to bear certain extraordinary expenses (including legal, accounting, valuation and transaction expenses) in order to protect and recover our investment. Therefore, to the extent we invest in distressed debt, our ability to achieve current income may be diminished which may affect our ability to make distributions on our common stock or make interest and principal payments of the Notes.
We also will be subject to significant uncertainty as to when and in what manner and for what value the distressed debt we invest in will eventually be satisfied (e.g., through a liquidation of the obligor’s assets, an exchange offer or plan of reorganization involving the distressed debt securities or a payment of some amount in satisfaction of the obligation). In addition, even if an exchange offer is made or plan of reorganization is adopted with respect to distressed debt held by us, there can be no assurance that the securities or other assets received by us in connection with such exchange offer or plan of reorganization will not have a lower value or income potential than may have been anticipated when the investment was made.
Moreover, any securities received by us upon completion of an exchange offer or plan of reorganization may be restricted as to resale. As a result of our participation in negotiations with respect to any exchange offer or plan of reorganization with respect to an issuer of distressed debt, we may be restricted from disposing of such securities if we are in possession of material non-public information relating to the issuer.
Second priority liens on collateral securing loans that we make to our portfolio companies may be subject to control by senior creditors with first priority liens. If there is a default, the value of the collateral may not be sufficient to repay in full both the first priority creditors and us.
Certain loans that we make to portfolio companies will be secured on a second priority basis by the same collateral securing senior secured debt of such companies. The first priority liens on the collateral will secure the portfolio company’s obligations under any outstanding senior debt and may secure certain other future debt that may be permitted to be incurred by the company under the agreements governing the loans. The holders of obligations secured by the first priority liens on the collateral will generally control the liquidation of and be entitled to receive proceeds from any realization of the collateral to repay their obligations in full before us. In addition, the value of the collateral in the event of liquidation will depend on market and economic conditions, the availability of buyers and other factors. There can be no assurance that the proceeds, if any, from the sale or sales of all of the collateral would be sufficient to satisfy the loan obligations secured by the second priority liens after payment in full of all obligations secured by the first priority liens on the collateral. If such proceeds are not sufficient to repay amounts outstanding under the loan obligations secured by the second priority liens, then we, to the extent not repaid from the proceeds of the sale of the collateral, will only have an unsecured claim against the company’s remaining assets, if any.
The rights we may have with respect to the collateral securing the loans we make to our portfolio companies with senior debt outstanding may also be limited pursuant to the terms of one or more intercreditor agreements that we enter into with the holders of senior debt. Under such an intercreditor agreement, at any time that obligations that have the benefit of the first priority liens are outstanding, any of the following actions that may be taken with respect to the collateral will be at the direction of the holders of the obligations secured by the first priority liens: the ability to cause the commencement of enforcement proceedings against the collateral; the ability to control the conduct of such proceedings; the approval of amendments to collateral documents; releases of liens on the collateral; and waivers of past defaults under collateral documents. We may not have the ability to control or direct such actions, even if our rights are adversely affected.
A majority of our debt investments are not required to make principal payments until the maturity of such debt securities and are generally riskier than other types of loans.
As of February 28, 2022, 87.3%29, 2024, 77.8% of our debt portfolio consisted of “interest-only” loans, which are structured such that the borrower makes only interest payments throughout the life of the loan and makes a large, “balloon payment” at the end of the loan term. The ability of a borrower to make or refinance a balloon payment may be affected by a number of factors, including the financial condition of the borrower, prevailing economic conditions, interest rates, and collateral values. If the interest-only loan borrower is unable to make or refinance a balloon payment, we may experience greater losses than if the loan were structured as amortizing.
We may be exposed to higher risks with respect to our investments that include PIK interest, particularly our investments in interest-only loans.
To the extent our portfolio investments permit PIK interest and our portfolio companies elect to pay PIK interest, we will be exposed to higher risks, including the following:
| ● |
| ● | PIK instruments may have higher yields, which reflect the payment deferral and credit risk associated with these instruments; |
| ● | PIK accruals may create uncertainty about the source of our distributions to stockholders; |
| ● | PIK instruments may have unreliable valuations because their continuing accruals require continuing judgments about the collectability of the deferred payments and the value of the collateral. |
To the extent our investments are structured as interest-only loans, PIK interest will increase the size of the balloon payment due at the end of the loan term. PIK interest payments on such loans may increase the probability and magnitude of a loss on our investment, particularly with respect to our interest-only loans. As of February 28, 2022, 12.9%29, 2024, 19.7% of our interest-only loans provided for contractual PIK interest, which represents contractual interest added to a loan balance and due at the end of such loan’s term, and 26.3%49.6% of such investments elected to pay a portion of interest due in PIK. As of February 28, 2022, 3.4%29, 2024, 2.3% of the Company’s interest-only loans are loans that pay contractual PIK interest only.
The lack of liquidity in our investments may adversely affect our business.
We primarily make investments in private companies. A portion of these securities may be subject to legal and other restrictions on resale, transfer, pledge or other disposition or will otherwise be less liquid than publicly traded securities. The illiquidity of our investments may make it difficult for us to sell such investments if the need arises. In addition, if we are required to liquidate all or a portion of our portfolio quickly, we may realize significantly less than the value at which we have previously recorded our investments. In addition, we may face other restrictions on our ability to liquidate an investment in a business entity to the extent that we or our Investment Adviser has or could be deemed to have material non-public information regarding such business entity.
We may not have the funds to make additional investments in our portfolio companies which could impair the value of our portfolio.
After our initial investment in a portfolio company, we may be called upon from time to time to provide additional funds to such company or have the opportunity to increase our investment through the exercise of a warrant to purchase common stock. There is no assurance that we will make, or will have sufficient funds to make, follow-on investments. Any decisions not to make a follow-on investment or any inability on our part to make such an investment may have a negative impact on a portfolio company in need of such an investment, may result in a missed opportunity for us to increase our participation in a successful operation or may reduce the expected yield on the investment. Even if we have sufficient capital to make a desired follow-on investment, we may elect not to make a follow-on investment because we may not want to increase our level of risk, because we prefer other opportunities or because we are inhibited by compliance with BDC requirements, SBA regulations or the desire to maintain our RIC tax treatment. Our ability to make follow-on investments may also be limited by our Investment Adviser allocation policy.
The debt securities in which we invest are subject to credit risk and prepayment risk.
An issuer of a debt security may be unable to make interest payments and repay principal. We could lose money if the issuer of a debt obligation is, or is perceived to be, unable or unwilling to make timely principal and/or interest payments, or to otherwise honor its obligations. Substantially all of the debt investments held in our portfolio hold a non-investment grade rating by one or more rating agencies or, if not rated, would be rated below investment grade if they were rated, which are often referred to as “junk.”
Certain debt instruments may contain call or redemption provisions which would allow the issuer thereof to prepay principal prior to the debt instrument’s stated maturity. This is known as prepayment risk. Prepayment risk is greater during a falling interest rate environment as issuers can reduce their cost of capital by refinancing higher interest debt instruments with lower interest debt instruments. An issuer may also elect to refinance their debt instruments with lower interest debt instruments if the credit standing of the issuer improves. To the extent debt securities in our portfolio are called or redeemed, we may receive less than we paid for such security and we may be forced to reinvest in lower yielding securities or debt securities of issuers of lower credit quality.
Our investment in Saratoga CLO constitutes a leveraged investment in a portfolio of subordinated notes representing the lowest-rated securities issued by a pool of predominantly senior secured first lien term loans and is subject to additional risks and volatility. All losses in the pool of loans will be borne by our subordinated notes and only after the value of our subordinated notes is reduced to zero will the higher-rated notes issued by the pool bear any losses.
At February 28, 2022,29, 2024, our investment in the subordinated notes of Saratoga CLO, a collateralized loan obligation fund, had a fair value of $28.7$9.5 million and constituted 3.5%0.8% of our portfolio. This investment constitutes a first loss position in a portfolio that, as of February 28, 2022,29, 2024, was composed of $660.2$640.8 million in aggregate principal amount of primarily senior secured first lien term loans and $6.2$12.1 million in uninvested cash. In addition, as of February 28, 2022,29, 2024, we also own $9.4 million in aggregate principal of the F-2-R-3 Notes with a fair value of $9.4$8.9 million in the Saratoga CLO, that only rank senior to the subordinated notes. A first loss position means that we will suffer the first economic losses if the value of Saratoga CLO decreases. First loss positions typically carry a higher risk and earn a higher yield. Interest payments generated from this portfolio will be used to pay the administrative expenses of Saratoga CLO and interest on the debt issued by Saratoga CLO before paying a return on the subordinated notes.
Principal payments will be similarly applied to pay administrative expenses of Saratoga CLO and for reinvestment or repayment of Saratoga CLO debt before paying a return on, or repayment of, the subordinated notes. In addition, 80.0% of our fixed management fee and 100.0% our incentive management fee for acting as the collateral manager of Saratoga CLO is subordinated to the payment of interest and principal on Saratoga CLO debt. Any losses on the portfolio will accordingly reduce the cash flow available to pay these management fees and provide a return on, or repayment of, our investment. Depending on the amount and timing of such losses, we may experience smaller than expected returns and, potentially, the loss of our entire investment.
As the manager of the portfolio of Saratoga CLO, we will have some ability to direct the composition of the portfolio, but our discretion is limited by the terms of the debt issued by Saratoga CLO which may limit our ability to make investments that we feel are in the best interests of the subordinated notes, and the availability of suitable investments. The performance of Saratoga CLO’s portfolio is also subject to many of the same risks sets forth in this Annual Report with respect to portfolio investments in leveraged loans.
In the event that a bankruptcy court orders the substantive consolidation of us with Saratoga CLO, the creditors of Saratoga CLO, including the holders of $660.2 $640.8 million aggregate principal amount of debt, as of February 28, 202229, 2024 issued by Saratoga CLO, would have claims against the consolidated bankruptcy estate, which would include our assets.
We believe that we have observed and will observe certain formalities and operating procedures that are generally recognized requirements for maintaining our separate existence and that our assets and liabilities can be readily identified as distinct from those of Saratoga CLO. However, we cannot assure you that a bankruptcy court would agree in the event that we or Saratoga CLO became a debtor in connection with a bankruptcy proceeding. If a bankruptcy court concludes that substantive consolidation of us with Saratoga CLO is warranted, the creditors of Saratoga CLO would have claims against the consolidated bankruptcy estate.
Substantive consolidation means that our assets are placed in a single bankruptcy estate with those of Saratoga CLO, rather than kept separate, and that the creditors of Saratoga CLO have a claim against that single estate (including our assets), as opposed to retaining their claims against only Saratoga CLO.
Our investments in Saratoga CLO have a different risk profile than would direct investments made by us, including less information available and fewer rights regarding repayment compared to companies we invest in directly as well as complicated accounting and tax implications.
Due to our investments in the Saratoga CLO being primarily broadly syndicated loans, there may be less information available to us on those companies as compared to most investments that we make directly. For example, we will typically have fewer rights relating to how such companies manage their cash flow to repay debt, the inclusion of protective covenants, default penalties, lien protection, change of control provisions and board observation rights in deal terms, and our general ability to oversee the company’s operations. Our investment in Saratoga CLO is also subject to the risk of leverage associated with the debt issued by Saratoga CLO and the repayment priority of senior debt holders in Saratoga CLO.
The accounting and tax implications of such investments are complicated. In particular, reported earnings from the equity tranche investment of Saratoga CLO are recorded according to U.S. GAAP based upon an effective yield calculation. Current taxable earnings on these investments, however, will generally not be determinable until after the end of the fiscal year of Saratoga CLO that ends within the Company’s fiscal year, even though the investment is generating cash flow. In general, the U.S. federal income tax treatment of investment in Saratoga CLO may result in higher distributable earnings in the early years and a capital loss at maturity, while for reporting purposes the totality of cash flows are reflected in a constant yield to maturity.
The senior loan portfolio of Saratoga CLO may be concentrated in a limited number of industries or borrowers, which may subject Saratoga CLO, and in turn us, to a risk of significant loss if there is a downturn in a particular industry in which Saratoga CLO is concentrated.
Saratoga CLO has senior loan portfolios that may be concentrated in a limited number of industries or borrowers. A downturn in any particular industry or borrower in which Saratoga CLO is heavily invested may subject Saratoga CLO, and in turn us, to a risk of significant loss and could significantly impact the aggregate returns we realize. If an industry in which Saratoga CLO is heavily invested suffers from adverse business or economic conditions, a material portion of our investment in Saratoga CLO could be affected adversely, which, in turn, could adversely affect our financial position and results of operations. For example, as of February 28, 2022,29, 2024, Saratoga CLO’s investments in the banking, finance, insurance & real estate industry represented approximately 19.3%19.0% of the fair value of Saratoga CLO’s portfolio. Companies in the banking, finance, insurance & real estate industry are subject to general economic downturns and business cycles and will often suffer reduced revenues and rate pressures during periods of economic uncertainty. In addition, investments in business service represented approximately 10.9%10.8% of the fair value of Saratoga CLO’s portfolio. Changes in healthcare or other laws and regulations applicable to the businesses of some of the companies in which Saratoga CLO invests may occur that could increase their compliance and other costs of doing business, require significant systems enhancements, or render their products or services less profitable or obsolete, any of which could have a material adverse effect on their results of operations. There has also been an increased political and regulatory focus on healthcare laws in recent years, and new legislation could have a material effect on the business and operations of companies in which Saratoga CLO invests.
48
Failure by Saratoga CLO to satisfy certain debt compliance ratios may entitle senior debtholders to additional payments, which may harm our operating results by reducing payments we would otherwise be entitled to receive from Saratoga CLO.
The failure by Saratoga CLO to satisfy certain debt compliance ratios, specifically those with respect to adequate collateralization and/or interest coverage tests, could lead to a reduction in its payments to us. In the event that Saratoga CLO failed these certain tests, senior debt holders may be entitled to additional payments that would, in turn, reduce the payments we would otherwise be entitled to receive. Separately, we may incur expenses to the extent necessary to seek recovery upon default or to negotiate new terms, which may include the waiver of certain financial covenants, with Saratoga CLO or any other investment we may make. If any of these occur, it could materially and adversely affect our operating results and cash flows.
Downgrades by rating agencies of broadly syndicated loans could adversely impact the financial performance of Saratoga CLO and its ability to pay equity distributions in the future.
Ratings agencies have recently undergone reviews of CLO tranches and their broadly syndicated loans in light of the COVID-19 pandemic’s adverse impact on the economic market. Such reviews have, in some cases, resulted in downgrades of broadly syndicated loans. Such downgrades of broadly syndicated loans, as well as downgrades of broadly syndicated loans in the future, could adversely impact the financial performance of Saratoga CLO, thereby limiting Saratoga CLO’s ability to pay equity distributions and subordinated management fees to the Company in the future. The full extent of downgrades by ratings agencies of broadly syndicated loans is currently unknown, thereby resulting in a high degree of uncertainty with respect to Saratoga CLO’s financial performance and ability to pay equity distributions and subordinated management fees to the Company in the future.
We may invest through joint ventures, partnerships or other special purpose vehicles and our investments through these vehicles may entail greater risks, or risks that we otherwise would not incur, if we otherwise made such investments directly.
We may make indirect investments in portfolio companies through joint ventures, partnerships or other special purpose vehicles, including SLF JV. In general, the risks associated with indirect investments in portfolio companies through a joint venture, partnership or other special purpose vehicle are similar to those associated with a direct investment in a portfolio company. While we intend to analyze the credit and business of a potential portfolio company in determining whether to make an investment in an investment vehicle, we will nonetheless be exposed to the creditworthiness of the investment vehicle. In the event of a bankruptcy proceeding against the portfolio company, the assets of the portfolio company may be used to satisfy its obligations prior to the satisfaction of our investment in the investment vehicle (i.e., our investment in the investment vehicle could be structurally subordinated to the other obligations of the portfolio company). In addition, if we are to invest in an investment vehicle, we may be required to rely on our partners in the investment vehicle when making decisions regarding such investment vehicle’s investments, accordingly, the value of the investment could be adversely affected if our interests diverge from those of our partners in the investment vehicle.
Available information about privately held companies is limited.
We invest primarily in privately-held companies. Generally, little public information exists about these companies, and we are required to rely on the ability of our Investment Adviser’s investment professionals to obtain adequate information to evaluate the potential returns from investing in these companies. These companies and their financial information are not subject to the Sarbanes-Oxley Act of 2002 and other rules that govern public companies. If we are unable to uncover all material information about these companies, we may not make a fully informed investment decision, and we may lose money on our investments.
When we are a debt or minority equity investor in a portfolio company, we may not be in a position to control the entity, and its management may make decisions that could decrease the value of our investment.
We make both debt and minority equity investments; therefore, we are subject to the risk that a portfolio company may make business decisions with which we disagree, and the stockholders and management of such company may take risks or otherwise act in ways that do not serve our interests. As a result, a portfolio company may make decisions that could decrease the value of our portfolio holdings.
Our portfolio companies may incur debt or issue equity securities that rank equally with, or senior to, our investments in such companies.
Our portfolio companies usually will have, or may be permitted to incur, other debt, or issue other equity securities that rank equally with, or senior to, our investments. By their terms, such instruments may provide that the holders are entitled to receive payment of dividends, interest or principal on or before the dates on which we are entitled to receive payments in respect of our investments. These debt instruments will usually prohibit the portfolio companies from paying interest on or repaying our investments in the event and during the continuance of a default under such debt. Also, in the event of insolvency, liquidation, dissolution, reorganization or bankruptcy of a portfolio company, holders of securities ranking senior to our investment in that portfolio company would typically be entitled to receive payment in full before we receive any distribution in respect of our investment. After repaying such holders, the portfolio company may not have any remaining assets to use for repaying its obligation to us. In the case of debtor ranking equally with our investments, we would have to share on an equal basis any distributions with other holders in the event of an insolvency, liquidation, dissolution, reorganization or bankruptcy of the relevant portfolio company.
There may be circumstances where our debt investments could be subordinated to claims of other creditors or we could be subject to lender liability claims.
If one of our portfolio companies were to go bankrupt, even though we may have structured our interest as senior debt, depending on the facts and circumstances, including the extent to which we actually provided managerial assistance to that portfolio company, a bankruptcy court might re-characterize our debt holding and subordinate all or a portion of our claim to that of other creditors. In addition, lenders can be subject to lender liability claims for actions taken by them where they become too involved in the borrower’s business or exercise control over the borrower. It is possible that we could become subject to a lender’s liability claim, including as a result of actions taken if we actually render significant managerial assistance.
Investments in equity securities involve a substantial degree of risk.
We purchase common stock and other equity securities. Although equity securities have historically generated higher average total returns than fixed-income securities over the long-term, equity securities also have experienced significantly more volatility in those returns and in recent years have significantly underperformed relative to fixed-income securities. The equity securities we acquire may fail to appreciate and may decline in value or become worthless and our ability to recover our investment will depend on our portfolio company’s success. Investments in equity securities involve a number of significant risks, including:
| ● | any equity investment we make in a portfolio company could be subject to further dilution as a result of the issuance of additional equity interests and to serious risks as a junior security that will be subordinate to all indebtedness or senior securities in the event that the issuer is unable to meet its obligations or becomes subject to a bankruptcy process; |
| ● | to the extent that the portfolio company requires additional capital and is unable to obtain it, we may not recover our investment in equity securities; and |
| ● | in some cases, equity securities in which we invest will not pay current dividends, and our ability to realize a return on our investment, as well as to recover our investment, will be dependent on the success of our portfolio companies. Even if the portfolio companies are successful, our ability to realize the value of our investment may be dependent on the occurrence of a liquidity event, such as a public offering or the sale of the portfolio company. It is likely to take a significant amount of time before a liquidity event occurs or we can sell our equity investments. In addition, the equity securities we receive or invest in may be subject to restrictions on resale during periods in which it could be advantageous to sell. |
There are special risks associated with investing in preferred securities, including:
| ● | preferred securities may include provisions that permit the issuer, at its discretion, to defer distributions for a stated period without any adverse consequences to the issuer. If we own a preferred security that is deferring its distributions, we may be required to report income for U.S. federal income tax purposes even though we have not received any cash payments in respect of such income; |
| ● | preferred securities are subordinated with respect to corporate income and liquidation payments, and are therefore subject to greater risk than debt; |
| ● | preferred securities may be substantially less liquid than many other securities, such as common securities or U.S. government securities; and |
| ● | preferred security holders generally have no voting rights with respect to the issuing company, subject to limited exceptions. |
Our investments in foreign debt, including that of emerging market issuers, may involve significant risks in addition to the risks inherent in U.S. investments.
Although there are limitations on our ability to invest in foreign debt, we may, from time to time, invest in debt of foreign companies, including the debt of emerging market issuers. Investing in foreign companies may expose us to additional risks not typically associated with investing in U.S. companies. These risks include changes in exchange control regulations, political and social instability, expropriation, imposition of foreign taxes, less liquid markets and less available information than is generally the case in the United States, higher transaction costs, less government supervision of exchanges, brokers and issuers, less developed bankruptcy laws, difficulty in enforcing contractual obligations, lack of uniform accounting and auditing standards and greater price volatility.
Investments in the debt of emerging market issuers may subject us to additional risks such as inflation, wage and price controls, and the imposition of trade barriers. Furthermore, economic conditions in emerging market countries are, to some extent, influenced by economic and securities market conditions in other emerging market countries. Although economic conditions are different in each country, investors’ reaction to developments in one country can have effects on the debt of issuers in other countries.
Although most of our investments will be U.S. dollar-denominated, our investments that are denominated in a foreign currency will be subject to the risk that the value of a particular currency will change in relation to one or more other currencies. Among the factors that may affect currency values are trade balances, the level of short-term interest rates, differences in relative values of similar assets in different currencies, long-term opportunities for investment and capital appreciation, and political developments.
We may employ hedging techniques to minimize these risks, but we cannot assure you that we will fully hedge against these risks or that such strategies will be effective. As a result, a change in currency exchange rates may adversely affect our profitability.
We may expose ourselves to risks if we engage in hedging transactions.
We may utilize instruments such as forward contracts, currency options and interest rate swaps, caps, collars and floors to seek to hedge against fluctuations in the relative values of our portfolio positions from changes in currency exchange rates and market interest rates. Use of these hedging instruments may expose us to counter-party credit risk. Hedging against a decline in the values of our portfolio positions does not eliminate the possibility of fluctuations in the values of such positions or prevent losses if the values of such positions decline. However, such hedging can establish other positions designed to gain from those same developments, thereby offsetting the decline in the value of such portfolio positions. Such hedging transactions may also limit the opportunity for gain if the values of the portfolio positions should increase. Moreover, it may not be possible to hedge against an exchange rate or interest rate fluctuation that is generally anticipated at an acceptable price.
The success of our hedging transactions will depend on our ability to correctly predict movements in currencies and interest rates.
Therefore, while we may enter into such transactions to seek to reduce currency exchange rate and interest rate risks, unanticipated changes in currency exchange rates or interest rates may result in poorer overall investment performance than if we had not engaged in any such hedging transactions. In addition, the degree of correlation between price movements of the instruments used in a hedging strategy and price movements in the portfolio positions being hedged may vary. Moreover, for a variety of reasons, we may not seek to establish a perfect correlation between such hedging instruments and the portfolio holdings being hedged. Any such imperfect correlation may prevent us from achieving the intended hedge and expose us to risk of loss. In addition, it may not be possible to hedge fully or perfectly against currency fluctuations affecting the value of securities denominated in non-U.S. currencies because the value of those securities is likely to fluctuate as a result of factors not entirely related to currency fluctuations. To the extent we engage in hedging transactions, we also face the risk that counterparties to the derivative instruments we hold may default, which may expose us to unexpected losses from positions where we believed that our risk had been appropriately hedged.
Our investments may be risky, and you could lose all or part of your investment.
Substantially all of our debt investments hold a non-investment grade rating by one or more rating agencies (which non- investmentnon-investment grade debt is commonly referred to as “high yield” and “junk” debt) or, where not rated by any rating agency, would be below investment grade or “junk”, if rated. A below investment grade or “junk” rating means that, in the rating agency’s view, there is an increased risk that the obligor on such debt will be unable to pay interest and repay principal on its debt in full. We also invest in debt that defers or pays PIK interest. To the extent interest payments associated with such debt are deferred, such debt will be subject to greater fluctuations in value based on changes in interest rates, such debt could produce taxable income without a corresponding cash payment to us, and since we generally do not receive any cash prior to maturity of the debt, the investment will be of greater risk.
In addition, private middle marketmiddle-market companies in which we invest are exposed to a number of significant risks, including:
| ● | limited financial resources and an inability to meet their obligations, which may be accompanied by a deterioration in the value of any collateral and a reduction in the likelihood of us realizing any guarantees we may have obtained in connection with our investment; |
| ● | shorter operating histories, narrower product lines and smaller market shares than larger businesses, which tend to render them more vulnerable to competitors’ actions and market conditions, as well as general economic downturns; |
| ● | dependence on the management talents and efforts of a small group of persons; the death, disability, resignation or termination of one or more of which could have a material adverse impact on the company and, in turn, on us; |
| ● | less predictable operating results and, possibly, substantial additional capital requirements to support their operations, finance expansion or maintain their competitive position; and |
| ● | difficulty accessing the capital markets to meet future capital needs. |
In addition, our executive officers, directors and our Investment Adviser may, in the ordinary course of business, be named as defendants in litigation arising from our investments in the portfolio companies.
Our portfolio may continue to be concentrated in a limited number of industries, which may subject us to a risk of significant loss if there is a downturn in a particular industry in which a number of our investments are concentrated.
Our portfolio may continue to be concentrated in a limited number of industries. A downturn in any particular industry in which we are invested could significantly impact the aggregate returns we realize.
As of February 28, 2022,29, 2024, our investments in the Healthcare Software industry represented approximately 11.0%10.6% of the fair value of our portfolio and our investments in the IT Services industry represented approximately 9.9%6.9% of the fair value of our portfolio. In addition, we may from time to time invest a relatively significant percentage of our portfolio in industries we do not necessarily target. If an industry in which we have significant investments suffers from adverse business or economic conditions, as these industries have to varying degrees, a material portion of our investment portfolio could be affected adversely, which, in turn, could adversely affect our financial position and results of operations.
A number of our portfolio companies are in the Software-as-a-Service industry and such companies are subject to additional risks that are unique to that industry, and the financial results of our portfolio companies in the Software-as-a-Service industry could materially adversely affect our financial results.
A number of our portfolio companies are in the Software-as-a-Service (“SAAS”) industry and such companies are subject to additional risks that are unique to the SAAS industry. For example, such portfolio companies may be subject to consumer protection laws that are enforced by regulators such as the Federal Trade Commission (“FTC”) and private parties, and include statutes that regulate the collection and use of information for marketing purposes. Any new legislation or regulations regarding the Internet, mobile devices, software sales or export and/or the cloud or SAAS industry, and/or the application of existing laws and regulations to the Internet, mobile devices, software sales or export and/or the cloud or SAAS industry, could create new legal or regulatory burdens on our portfolio companies that could have a material adverse effect on their respective operations. As a result,In addition, our SAAS portfolio companies may incur significant operating losses and negative cash flows becauseduring certain times of their respective life cycles, resulting in an adverse impact on their operations and on their ability to repay their debt. Because our SAAS portfolio companies are generally investments that are underwritten and valued on “recurring revenue” rather than EBITDA, the fair value determinations of such companies are inherently uncertain and may fluctuate over short periods of time. They are also subject to the risks that their customers have financial difficulties that make them unable or unwilling to pay for the software and services that drive a portfolio company’s recurring revenue projections. There is often less collateral securing our loans to these companies as compared to our other portfolio companies, which could impair our ability to be repaid if the portfolio companies default on their obligations or otherwise encounter financial difficulties. For these reasons, our financial results could be materially adversely affected if our portfolio companies in the SAAS industry encounter financial difficulty and fail to repay their obligations. As of February 28, 2022,29, 2024, our current total investments in SAAS companies were $510.0$664.7 million, or 62.4%58.4% of total investments.
52
If our primary investments are deemed not to be qualifying assets, we could be precluded from investing in our desired manner or deemed to be in violation of the 1940 Act.
In order to maintain our status as a BDC, we may not acquire any assets other than “qualifying assets” unless, at the time of and after giving effect to such acquisition, at least 70.0% of our total assets are qualifying assets. We believe that most of the investments that we may acquire in the future will constitute qualifying assets. However, we may be precluded from investing in what we believe are attractive investments if such investments are not qualifying assets for purposes of the 1940 Act. If we do not invest a sufficient portion of our assets in qualifying assets, we could violate the 1940 Act provisions applicable to BDCs and be precluded from making follow-on investments in existing portfolio companies (which could result in the dilution of our position) or required to dispose of investments at inappropriate times in order to come into compliance with the 1940 Act. If we need to dispose of such investments quickly, it could be difficult to dispose of such investments on favorable terms. We may not be able to find a buyer for such investments and, even if we do find a buyer, we may have to sell the investments at a substantial loss. Any such outcomes would have a material adverse effect on our business, financial condition, results of operations and cash flows. Furthermore, any failure to comply with the requirements imposed on BDCs by the 1940 Act could cause the SEC to bring an enforcement action against us and/or expose us to claims of private litigants. If we do not maintain our status as a BDC, we would be subject to regulation as a registered closed-end investment company under the 1940 Act. As a registered closed-end investment company, we would be subject to substantially more regulatory restrictions under the 1940 Act, which would significantly decrease our operating flexibility.
RISKS RELATED TO OUR COMMON STOCK
Investing in our common stock may involve an above average degree of risk.
The investments we make in accordance with our investment objective may result in a higher amount of risk than alternative investment options and volatility or loss of principal. Our investments in portfolio companies may be highly speculative and aggressive, and therefore, an investment in our common stock may not be suitable for someone with lower risk tolerance.
We may choose to pay dividends in our own stock, in which case you may be required to pay tax in excess of the cash you receive.
We have in the past, and may in the future, distribute taxable dividends that are payable to our stockholders in part through the issuance of shares of our common stock. For example, on October 30, 2013, our board of directors declared a dividend of $2.65 per share to shareholders payable in cash or shares of our common stock. Under certain applicable provisions of the Code and the Treasury regulations and a revenue procedure issued by the IRS, a RIC may treat a distribution of its own stock as fulfilling its RIC distribution requirements if each stockholder may elect to receive his or her entire distribution in either cash or stock of the RIC, subject to a limitation that the aggregate amount of cash to be distributed to all stockholders must be at least 20% of the aggregate declared distribution. If too many stockholders elect to receive their distributions in cash, we must allocate the cash available for distribution among the shareholders electing to receive cash (with the balance of the distribution paid in shares of our common stock). If we qualify as a publicly offered RIC and we decide to make any distributions consistent with this revenue procedure that are payable in part in our stock, taxable stockholders receiving such dividends will be required to include the full amount of the dividend (whether received in cash, our stock, or a combination thereof) as ordinary income (or as long-term capital gain to the extent such distribution is properly reported as a capital gain dividend) to the extent of our current and accumulated earnings and profits for U.S. federal income tax purposes. AsThe value of the shares received by a result,stockholder is treated as income for U.S. federal income tax purposes. A U.S. stockholder may have income from such a U.S. stockholderdividend in excess of the amount of cash received, and thus may be required to obtain cash from other sources to pay tax with respect to such dividends in excess of any cash received.applicable U.S. federal income tax. If a U.S. stockholder sells the stock it receives as a dividend in order to pay this tax, the sales proceeds may be less than the amount included in income with respect to the dividend, depending on the market price of our stock at the time of the sale.
Furthermore, with respect to non-U.S. stockholders, we may be required to withhold U.S. tax with respect to such dividends, including in respect of all or a portion of such dividend that is payable in stock. If a significant number of our stockholders determine to sell shares of our stock in order to pay taxes owed on dividends, it may put downward pressure on the trading price of our stock.
Due to the COVID-19 pandemic or other disruptions in the economy,current market conditions, we may reduce or defer our dividends and choose to incur USU.S. federal excise tax in order preserve cash and maintain flexibility.
As a BDC, we are not required to make any distributions to shareholders other than in connection with our election to be taxed astreated a RIC for U.S. federal income tax purposes as under subchapterSubchapter M of the Code. In order to maintain our tax treatment as a RIC, we generally must distribute to shareholders for each taxable year at least 90% of our investment company taxable income (i.e., net ordinary income plus realized net short-term capital gains in excess of realized net long-term capital losses). If we qualify for taxation as a RIC, we generally will not be subject to USU.S. federal income tax at corporate rates on our investment company taxable income and net capital gains (i.e., realized net long- term capital gains in excess of realized net short-term capital losses) that we timely distribute to shareholders. We will be subject to U.S. federal income tax on our investment company taxable income and net capital gains that we do not timely distribute to shareholders. In addition, we will be subject to a nondeductible 4% U.S. federal excise tax on undistributed earnings of a RIC unless we distribute each calendar year at least the sum of (i) 98.0%98% of our net ordinary income for the calendar year, (ii) 98.2% of our capital gain net income for the one-year period ending on October 31 of the calendar year, and (iii) any net ordinary income and capital gain net income that we recognized for preceding years, but were not distributed during such years, and on which we paid no U.S. federal income tax.
Under the Code, we may satisfy certain of our RIC distributions with dividends paid after the end of the current calendar year. In particular, if we pay a distribution in January of the following year that was declared in October, November, or December of the current year and is payable to shareholders of record in the current year, the dividend will be treated for all USU.S. federal tax purposes as if it were paid on December 31 of the current year. In addition, under the Code, we may pay dividends, referred to as “spillover dividends,” that are paid during the following taxable year that will allow us to maintain our qualification for taxation as a RIC and eliminate our liability for U.S. federal income tax at corporate rates. Under these spillover dividend procedures, because our taxable year ends on February 28 or 29, we may defer distribution of income earned during the current taxable year until February of the following taxable year. For example, we may defer distributions of income earned during the year ended February 28, 202229, 2024 until as late as February 28, 2023.2025. If we choose to carry-over this distribution of income in the form of a spillover dividend, we will incur the 4% U.S. federal excise tax on some or all of the distribution.
Due to the COVID-19 pandemic or other disruptions in the economy, we anticipatecurrent market conditions (as described herein) it is possible that we may take certain actions with respect to the timing and amounts of our distributions in order to preserve cash and maintain flexibility. For example, we may not be able to increase our dividends. In addition, we may reduce our dividends and/or defer our dividends to the following taxable year. If we defer our dividends, we may choose to utilize the spillover dividend rules discussed above and incur the 4% U.S. federal excise tax on such amounts. To further preserve cash, we may combine these reductions or deferrals of dividends with one or more distributions that are payable partially in our stock as discussed above understock. (see “We may choose to pay dividends in our own stock, in which case you may be required to pay tax in excess of the cash you receive.”receive” for more information).
The market price of our common stock may fluctuate significantly.
The market price and liquidity of the market for our common stock may be significantly affected by numerous factors, some of which are beyond our control and may not be directly related to our operating performance. These factors include, but are not limited to:
| ● | significant volatility in the market price and trading volume of securities of BDCs or other companies in our sector, which are not necessarily related to the operating performance of these companies; |
| ● | changes in regulatory policies, accounting pronouncements or tax guidelines, particularly with respect to RICs, BDCs or SBICs; |
| ● | failure to qualify for RIC tax |
| ● | changes in the value of our portfolio of investments; |
| ● | any shortfall in revenue or net income or any increase in losses from levels expected by investors or securities analysts; |
| ● | departure of any of Saratoga Investment Advisors’ key personnel; |
| ● | operating performance of companies comparable to us; |
| ● | general economic trends and other external factors; or |
| ● | loss of a major funding source. |
Our business and operation could be negatively affected if we become subject to any securities litigation or shareholder activism, which could cause us to incur significant expense, hinder execution of investment strategy and impact our stock price.
In the past, following periods of volatility in the market price of a company’s securities, securities class action litigation has often been brought against that company. Shareholder activism, which could take many forms or arise in a variety of situations, has been increasing in the BDC space recently. While we are currently not subject to any securities litigation or shareholder activism, due to the potential volatility of our stock price and for a variety of other reasons, we may in the future become the target of securities litigation or shareholder activism. Securities litigation and shareholder activism, including potential proxy contests, could result in substantial costs and divert management’s and our board of directors’ attention and resources from our business.
Additionally, such securities litigation and shareholder activism could give rise to perceived uncertainties as to our future, adversely affect our relationships with service providers and make it more difficult to attract and retain qualified personnel. Also, we may be required to incur significant legal fees and other expenses related to any securities litigation and activist shareholder matters. Further, our stock price could be subject to significant fluctuation or otherwise be adversely affected by the events, risks and uncertainties of any securities litigation and shareholder activism.
There is a risk that you may not receive distributions or that our distributions may not grow over time.
As a BDC for 1940 Act purposes and a RIC for U.S. federal income tax purposes, we intend to make distributions out of assets legally available for distribution to our stockholders once such distributions are authorized by our board of directors and declared by us. We cannot assure you that we will achieve investment results that will allow us to make a specified level of cash distributions or periodically increase our dividend rate. In addition, due to the asset coverage test that is applicable to us as a BDC, and provisions contained in the agreements governing our borrowings, we may be limited in our ability to make distributions. Further, if we invest a greater amount of assets in equity securities that do not pay current dividends, it could reduce the amount available for distribution.
Provisions of our governing documents and the Maryland General Corporation Law could deter future takeover attempts and have an adverse impact on the price of our common stock.
We are governed by our charter and bylaws, which we refer to as our “governing documents.”
Our governing documents and the Maryland General Corporation Law contain provisions that may have the effect of delaying, deferring or preventing a future transaction or change in control of us that might involve a premium price for our stockholders or otherwise be in their best interest.
Our charter provides for the classification of our board of directors into three classes of directors, serving staggered three-year terms, which may render a change of control of us or removal of our incumbent management more difficult. Furthermore, any and all vacancies on our board of directors will be filled generally only by the affirmative vote of a majority of the remaining directors in office, even if the remaining directors do not constitute a quorum, and any director elected to fill a vacancy will serve for the remainder of the full term until a successor is elected and qualifies.
Our board of directors is authorized to create and issue new series of shares, to classify or reclassify any unissued shares of stock into one or more classes or series, including preferred stock and, without stockholder approval, to amend our charter to increase or decrease the number of shares of stock that we have authority to issue, which could have the effect of diluting a stockholder’s ownership interest. Prior to the issuance of shares of stock of each class or series, including any reclassified series, our board of directors is required by our governing documents to set the terms, preferences, conversion or other rights, voting powers, restrictions, limitations as to dividends or other distributions, qualifications and terms or conditions of redemption for each class or series of shares of stock.
Our governing documents also provide that our board of directors has the exclusive power to adopt, alter or repeal any provision of our bylaws, and to make new bylaws. The Maryland General Corporation Law also contains certain provisions that may limit the ability of a third party to acquire control of us, such as:
| ● |
| ● |
In addition, the provisions of the Maryland Business Combination Act will not apply, however, if our board of directors adopts a resolution that any business combination between us and any other person will be exempt from the provisions of the Maryland Business Combination Act. Although our board of directors has adopted such a resolution, there can be no assurance that this resolution will not be altered or repealed in whole or in part at any time. If the resolution is altered or repealed, the provisions of the Maryland Business Combination Act may discourage others from trying to acquire control of us.
As permitted by Maryland law, our bylaws contain a provision exempting from the Maryland Control Share Acquisition Act any and all acquisitions by any person of our common stock. Although our bylaws include such a provision, such a provision may also be amended or eliminated by our board of directors at any time in the future, subject to obtaining confirmation from the SEC that it does not object to us being subject to the Maryland Control Share Acquisition Act.
Our common stock may trade at a discount to our net asset valueNAV per share.
Common stock of BDCs, as closed-end investment companies, frequently trade at a discount to net asset value.NAV. Our common stock has traded at a discount to our net asset valueNAV since shortly after our initial public offering. The risk that our common stock may continue to trade at a discount to our net asset valueNAV is separate and distinct from the risk that our net asset valueNAV per share may decline.
Stockholders may incur dilution if we sell shares of our common stock in one or more offerings at prices below the then current net asset valueNAV per share of our common stock.
The 1940 Act prohibits us from selling shares of our common stock at a price below the current net asset valueNAV per share of such stock, with certain exceptions. One such exception is prior stockholder approval of issuances below net asset valueNAV provided that our board of directors makes certain determinations. We do not currently have stockholder approval of issuances below net asset value.NAV.
If we were to sell shares of our common stock below net asset valueNAV per share, such sales would result in an immediate dilution to the net asset valueNAV per share. This dilution would occur as a result of the sale of shares at a price below the then current net asset valueNAV per share of our common stock and a proportionately greater decrease in a stockholder’s interest in our earnings and assets and voting interest in us than the increase in our assets resulting from such issuance.
Because the number of shares of common stock that could be so issued and the timing of any issuance is not currently known, the actual dilutive effect cannot be predicted.
The issuance of subscription rights, warrants or convertible debt that are exchangeable for our common stock, will cause your economic interest and voting power in us to be diluted as a result of our offering of any such securities.
Stockholders who do not fully exercise rights, warrants or convertible debt issued to them in any offering of subscription rights, warrants or convertible debt to purchase our common stock should expect that they will, at the completion of the offering, own a smaller proportional economic interest and have diminished voting power in us than would otherwise be the case if they fully exercised their rights, warrants or convertible debt. We cannot state precisely the amount of any such dilution in share ownership or voting power because we do not know what proportion of the common stock would be purchased as a result of any such offering.
In addition, if the subscription price, warrant price or convertible debt price is less than our net asset valueNAV per share of common stock at the time of such offering, then our stockholders would experience an immediate dilution of the aggregate net asset valueNAV of their shares as a result of the offering. The amount of any such decrease in net asset valueNAV is not predictable because it is not known at this time what the subscription price, warrant price, convertible debt price or net asset valueNAV per share will be on the expiration date of such offering or what proportion of our common stock will be purchased as a result of any such offering. The risk of dilution is greater if there are multiple rights offerings. However, our board of directors will make a good faith determination that any offering of subscription rights, warrants or convertible debt would result in a net benefit to existing stockholders.
Finally, our common stockholders will bear all costs and expenses incurred by us in connection with any proposed offering of subscription rights, warrants or convertible debt that are exchangeable for our common stock, whether or not such offering is actually completed by us.
RISKS RELATED TO OUR NOTES
The Notes are unsecured and therefore are effectively subordinated to any secured indebtedness to any existing and future secured indebtedness, including indebtedness under our Encina Credit Facility and our Live Oak Credit Facility.
The Notes are not secured by any of our assets or any of the assets of any of our subsidiaries, including our wholly owned subsidiaries. As a result, the Notes are effectively subordinated to any existing and future secured indebtedness we or our subsidiaries have outstanding (including our Encina Credit Facility and our Live Oak Credit Facility) or that we or our subsidiaries may incur in the future (or any indebtedness that is initially unsecured as to which we have granted or subsequently grant a security interest) to the extent of the value of the assets securing such indebtedness, including, without limitation, borrowings under our Encina Credit Facility and our Live Oak Credit Facility. In any liquidation, dissolution, bankruptcy or other similar proceeding, the holders of any of our secured indebtedness or secured indebtedness of our subsidiaries may assert rights against the assets pledged to secure that indebtedness in order to receive full payment of their indebtedness before the assets may be used to pay other creditors, including the holders of the Notes. As of February 28, 2022,29, 2024, there was $12.5$35.0 million outstanding borrowings under the Encina Credit Facility and we had the ability to borrow up to $50.0$65.0 million under the Encina Credit Facility, subject to certain conditions. The Encina Credit Facility and the Live Oak Credit Facility is secured by substantially all of the assets of SIF II ourand SIF III, respectively, wholly owned subsidiary.subsidiaries.
The Notes are structurally subordinated to the indebtedness and other liabilities of our subsidiaries.
The Notes are obligations exclusively of Saratoga Investment Corp., and not of any of our subsidiaries. None of our subsidiaries is a guarantor of the Notes and the Notes are not required to be guaranteed by any subsidiary we may acquire or create in the future. Any assets of our subsidiaries are not directly available to satisfy the claims of our creditors, including holders of the Notes. Except to the extent we are a creditor with recognized claims against our subsidiaries, all claims of creditors of our subsidiaries will have priority over our equity interests in such entities (and therefore the claims of our creditors, including holders of the Notes) with respect to the assets of such entities. Even if we are recognized as a creditor of one or more of these entities, our claims would still be effectively subordinated to any security interests in the assets of any such entity and to any indebtedness or other liabilities of any such entity senior to our claims. Consequently, the Notes are structurally subordinated to all indebtedness and other liabilities including trade payables, of any of our existing or future.future indebtedness of our subsidiaries, including the SBA-guaranteed debentures. These entities may incur substantial indebtedness in the future, all of which would be structurally senior to the Notes. As of February 28, 2022,29, 2024, we had $185.0$214.0 million in SBA-guaranteed debentures outstanding. The indebtedness under the SBA-guaranteed debentures is structurally senior to the Notes.
The indenture under which the Notes are issued contains limited protection for holders of the Notes.
The indenture under which the Notes are issued offers limited protection to holders of the Notes.
The terms of the indenture and the Notes do not restrict our or any of our subsidiaries’ ability to engage in, or otherwise be a party to, a variety of corporate transactions, circumstances or events that could have a material adverse impact on your investment in the Notes. In particular, the terms of the indenture and the Notes do not place any restrictions on our or our subsidiaries’ ability to:
| ● | issue securities or otherwise incur additional indebtedness or other obligations, including (1) any indebtedness or other obligations that would be equal in right of payment to the Notes, (2) any indebtedness or other obligations that would be secured and therefore rank effectively senior in right of payment to the Notes to the extent of the values of the assets securing such debt, (3) indebtedness of ours that is guaranteed by one or more of our subsidiaries and which therefore is structurally senior to the Notes and (4) securities, indebtedness or obligations issued or incurred by our subsidiaries that would be senior to our equity interests in our subsidiaries and therefore rank structurally senior to the Notes with respect to the assets of these entities, in each case other than an incurrence of indebtedness or other obligation that would cause a violation of Section 18(a)(1)(A) as modified by Section 61(a)(2) of the 1940 Act or any successor provisions, whether or not we continue to be subject to such provisions of the 1940 Act), but giving effect, in each case, to any exemptive relief granted to us by the SEC. Currently, these provisions generally prohibit us from incurring additional borrowings, including through the issuance of additional debt securities, unless our asset coverage, as defined in the 1940 Act, equals at least 150% after such borrowings; |
| ● | sell assets (other than certain limited restrictions on our ability to consolidate, merge or sell all or substantially all of our assets); |
| ● | enter into transactions with affiliates; |
| ● | create liens (including liens on the shares of our subsidiaries) or enter into sale and leaseback transactions; |
| ● | make investments; or |
| ● | create restrictions on the payment of dividends or other amounts to us from our subsidiaries. |
Furthermore, the terms of the indenture and the Notes do not protect holders of the Notes in the event that we experience changes (including significant adverse changes) in our financial condition, results of operations or credit ratings, if any, as they do not require that we or our subsidiaries adhere to any financial tests or ratios or specified levels of net worth, revenues, income, cash flow, or liquidity.
Our ability to recapitalize, incur additional debt (including additional debt that matures prior to the maturity of the Notes), and take a number of other actions that are not limited by the terms of the Notes may have important consequences for you as a holder of the Notes, including making it more difficult for us to satisfy our obligations with respect to the Notes or negatively affecting the market value of the Notes.
Other debt we issue or incur in the future could contain more protections for its holders than the indenture and the Notes, including additional covenants and events of default. For example, the indenture under which the Notes is issued do not contain cross-default provisions that are contained in the agreement relating to the Encina Credit Facility and the Live Oak Credit Facility. The issuance or incurrence of any such debt with incremental protections could affect the market for, trading levels and prices of the Notes.
We may not be able to repurchase the 4.375% 2026 Notes and the 4.35% 2027 Notes 2027 upon a Change of Control Repurchase Event.
Upon a Change of Control Repurchase Event (as defined in the relevant indenture), holders of the 4.375% 2026 Notes and the 4.35% 2027 Notes 2027 may require us to repurchase for cash some or all of the 4.375% 2026 Notes and the 4.35% 2027 Notes, 2027, respectively, at a repurchase price equal to 100% of the aggregate principal amount of the 4.375% 2026 Notes and the 4.35% 2027 Notes, 2027, respectively, being repurchased, plus their respective accrued and unpaid interest to, but not including, the repurchase date. We may not be able to repurchase the 4.375% 2026 Notes and the 4.35% 2027 Notes 2027 upon a Change of Control Repurchase Event because we may not have sufficient funds. Our and our subsidiaries’ future financing facilities may contain similar restrictions and provisions. Our failure to purchase such tendered .375%4.375% 2026 Notes and the 4.35% 2027 Notes 2027 upon the occurrence of such Change of Control Repurchase Event would cause an event of default under the respective indenture governing the 4.375% 2026 Notes and the 4.35% 2027 Notes, 2027, respectively, which may result in the acceleration of such indebtedness requiring us to repay that indebtedness immediately. If the holders of the October 20244.375% 2026 Notes orand the January 20264.35% 2027 Notes exercise their respective right to require us to repurchase the 4.375% 2026 Notes and the 4.35% 2027 Notes, 2027, respectively, upon a Change of Control Repurchase Event, the financial effect of any such repurchase could cause a default under our current and future debt instruments, even if the Change of Control Repurchase Event itself would not cause a default. If a Change of Control Repurchase Event were to occur, we may not have sufficient funds to repay any such accelerated indebtedness.
An active trading market for the 7.25% 2025Public Notes may not develop or be sustained, which could limit the market price of the Public Notes or the ability to sell them.
Although each of the 7.25% 20256.00% 2027 Notes, 8.00% 2027 Notes, 8.125% 2027 Notes, and 8.50% 2028 Notes are listed on the NYSE under the symbol “SAK”“SAT”, “SAJ”, “SAY”, and “SAZ”, respectively, we cannot provide any assurances that an active trading market will develop or be maintained for the 7.25% 2025Public Notes or that the 7.25% 2025Public Notes will be able to be sold. At various times, the 7.25% 2025Public Notes may trade at a discount from their initial offering price depending on prevailing interest rates, the market for similar securities, our credit ratings, if any, general economic conditions, our financial condition, performance and prospects and other factors. Accordingly, we cannot provide any assurance that a liquid trading market will develop for the 7.25% 2025Public Notes, or that the 7.25% 2025Public Notes will be able to be sold at a particular time or at a favorable price. To the extent an active trading market does not develop, the liquidity and trading price for the 7.25% 2025Public Notes may be harmed. At the same time, the trading market for the Public Notes may also be very volatile, and many of the risk factors related to our common stock and outlined above in “Risks Related to Our Common Stock” could also be applicable to the Public Notes.
58
Public health threats may affect the market for the Public Notes, impact the businesses in which we invest and affect our business, operating results and financial condition.
Public health threats, such as the COVID-19 pandemic or any other illness, may disrupt the operations of the businesses in which we invest. Such threats can create economic and political uncertainties and can contribute to global economic instability. A public health threat poses the risk that our portfolio companies may have significantly reduced or be prevented from conducting business activities for an unknown period of time, including shutdowns that may be requested or mandated by governmental authorities. We cannot estimate the impact that a public health threat could have on our portfolio companies, but it could disrupt their businesses and their ability to make interest or dividend payments and decrease the overall value of our investments which adversely impact our business, financial condition or results of operations. Additionally, as a result of the volatile market conditions that may result from public health threats, such as COVID-19 or any other illness, we cannot provide any assurance that the Public Notes will trade at a favorable price.
Terms relating to redemption may materially adversely affect the return on our debt securities.Notes.
On or after June 24, 2022,Subject to their terms, we may choose to redeem the 7.25% 2025 Notes from time to time, especially when prevailing interest rates are lower than the rate borne by the Public Notes. If prevailing rates are lower at the time of redemption, you would not be able to reinvest the redemption proceeds in a comparable security at an effective interest rate as high as the interest rate on the Public Notes being redeemed. Our redemption right also may adversely impact your ability to sell the Public Notes as the optional redemption date or period approaches.
The 6.00% 2027 Notes mature on April 30, 2027 and commencing April 27, 2024, may be redeemed in whole or in part at any time or from time to time at our option. The 8.00% 2027 Notes mature on October 31, 2027 and commencing October 27, 2024, may be redeemed in whole or in part at any time or from time to time at our option. The 8.125% 2027 Notes mature on December 31, 2027 and commencing December 13, 2024, may be redeemed in whole or in part at any time or from time to time at our option. The 8.50% 2028 Notes mature on April 15, 2028 and commencing April 14, 2025, may be redeemed in whole or in part at any time or from time to time at our option.
The 4.375% 2026 Notes 2026 are redeemable, in whole or in part, at any time at our option prior to November 28. 2025, at par plus a “make-whole” premium, and thereafter at par. The 4.35% 2027 Notes 2027 are redeemable, in whole or in part, at any time at our option prior to November 28, 2026, at par plus a “make-whole” premium, and thereafter at par. We
The 7.00% 2025 Notes mature on September 8, 2025 and commencing September 8, 2024, may choosebe redeemed in whole or in part at any time or from time to redeem the 4.375%time at our option, at par plus a “make-whole” premium, and thereafter at par. The 7.75% Notes 20262025 mature on July 9, 2025 and may be redeemed in whole or 4.35% Notes 2027in part at times when prevailing interest rates are lower than the interest rate paidany time or from time to time at our option, subject to a fee depending on the 4.375%date of repayment, at par plus a “make-whole” premium, and thereafter at par. The 6.25% 2027 Notes 2026mature on December 29, 2027 and may be redeemed in whole or 4.35% Notes 2027.in part at any time or from time to time at our option, on or after December 29, 2024, at par plus a “make-whole” premium, and thereafter at par.
If we default on our obligations to pay our other indebtedness, we may not be able to make payments on the Notes.
Any default under the agreements governing our indebtedness, including a default under the Encina Credit Facility or the Live Oak Credit Facility, indenture governing each of the Notes or other indebtedness to which we may be a party that is not waived by the required lenders or the holders, and the remedies sought by the lenders or the holders of such indebtedness could make us unable to pay principal, premium, if any, and interest on the Notes and substantially decrease the market value of the Notes. If we are unable to generate sufficient cash flow and are otherwise unable to obtain funds necessary to meet required payments of principal, premium, if any, and interest on our indebtedness, or if we otherwise fail to comply with the various covenants, including financial and operating covenants, as applicable, in the instruments governing our indebtedness, we could be in default under the terms of the agreements governing such indebtedness including(including the Notes.Encina Credit Facility, the Live Oak Credit Facility and the Notes). In the event of such default, the holders of such indebtedness could elect to declare all the funds borrowed thereunder to be due and payable, together with accrued and unpaid interest, the lenders under the Encina Credit Facility, the Live Oak Credit Facility, or other debt we may incur in the future could elect to terminate their commitment, cease making further loans and institute foreclosure proceedings against our assets, and we could be forced into bankruptcy or liquidation. In addition, any such default may constitute a default under the Notes, which could further limit our ability to repay our debt, including the Encina Credit Facility and the Notes.
Our ability to generate sufficient cash flow in the future is, to some extent, subject to general economic, financial, competitive, legislative and regulatory factors as well as other factors that are beyond our control. We cannot assure you that our business will generate cash flow from operations, or that future borrowings will be available to us under the Encina Credit Facility, the Live Oak Credit Facility, or otherwise, in an amount sufficient to enable us to meet our payment obligations under the Notes, the Encina Credit Facility, and the EncinaLive Oak Credit Facility, and to fund other liquidity needs.
If our operating performance declines and we are not able to generate sufficient cash flow to service our debt obligations, we may, in the future, need to refinance or restructure our debt, including any Notes sold, sell assets, reduce or delay capital investments, seek to raise additional capital or seek to obtain waivers from the required lenders under the Encina Credit Facility or the Live Oak Credit Facility, the holders of the respective Notes, or other debt that we may incur in the future to avoid being in default. If we are unable to implement one or more of these alternatives, we may not be able to meet our payment obligations under the Notes and our other debt. If we breach our covenants under the Encina Credit Facility, the Live Oak Credit Facility, the Notes or other debt and seek a waiver, we may not be able to obtain a waiver from the required lenders or the holders thereof. If this occurs, we would be in default under the Encina Credit Facility, the Live Oak Credit Facility, the Notes or other debt, the lenders or holders could exercise their rights as described above, and we could be forced into bankruptcy or liquidation. If we are unable to repay debt, lenders having secured obligations could proceed against the collateral securing the debt.
ITEM 1B. UNRESOLVED STAFF COMMENTS
None.
ITEM 1C. CYBERSECURITY
The Company’s cybersecurity program is designed to identify, assess, and manage material risks from cybersecurity threats. The Company relies on Saratoga Investment Advisors to implement the cybersecurity program. The cyber risk management program involves risk assessments relating to the information systems of Saratoga Investment Advisors, incident response training and testing, implementation of security measures, identification of sensitive information assets (“Critical Information”) and ongoing monitoring of systems and networks and assessment of the associated risks on an annual basis, including networks on which the Company relies on. The Chief Compliance Officer, along with the Company’s external information technology consultant (the “IT Consultant”), actively monitors the current threat landscape in an effort to identify material risks arising from new and evolving cybersecurity threats. The Company and Saratoga Investment Advisors have engaged external experts, including consultants, such as the IT Consultant, to evaluate cybersecurity measures and risk management processes, and depends on and engages various third parties, including suppliers, vendors, and service providers. The compliance team of the Company and Saratoga Investment Advisors will conduct ongoing due diligence of its significant service providers to determine whether the cybersecurity programs of service providers include, among other things, procedures and safeguards designed to ensure the protection of Critical Information and the information of the Company’s stockholders and portfolio companies, as well as adequate responses in the case of a cybersecurity incident.
Board Oversight of Cybersecurity Risks
The Board has the primary responsibility for overseeing and reviewing the guidelines and policies with respect to the Company’s risk management, including risks associated with cybersecurity threats. The Chief Compliance Officer will periodically report to the Board on cybersecurity matters, such as the overall state of the Company’s cybersecurity program, information on the current threat landscape, and risks from cybersecurity threats and material cybersecurity incidents.
Management's Role in Cybersecurity Risk Management
The Company’s management is responsible for assessing and managing material risks from cybersecurity threats, in consultations with cybersecurity consultants. The compliance team of the Company will maintain effective disclosure controls and procedures to ensure timely identification, consideration, and disclosure of material cybersecurity incidents, including through timely reporting to management and the Board. The Chief Compliance Officer, in consultation with the IT Consultant, will periodically determine whether the Company requires additional information technology or cybersecurity support.
Assessment of Cybersecurity Risk
The potential impact of risks from cybersecurity threats are assessed on an ongoing basis, and how such risks could materially affect the Company’s business strategy, operational results, and financial condition are regularly evaluated. During the reporting period, the Company has not identified any risks from cybersecurity threats, including as a result of previous cybersecurity incidents, that the Company believes has materially affected, or are reasonably likely to materially affect, the Company, including the Company’s business strategy, operational results, and financial condition.
ITEM 2. PROPERTIES
We do not own any real estate or other physical properties important to our operations, however, an affiliate of our Investment Adviser leases office space for our executive offices at 535 Madison Avenue, New York, New York 10022.
ITEM 3. LEGAL PROCEEDINGS
Neither we nor our wholly-ownedwholly owned subsidiaries Saratoga Investment Funding LLC, Saratoga Investment Funding II, LLC, Saratoga Investment Corp. SBIC LP and Saratoga Investment Corp. SBIC II LP, are currently subject to any material legal proceedings. From time to time, we, our consolidated subsidiaries and/or Saratoga Investment Advisors may be a party to certain legal proceedings in the ordinary course of business, including proceedings relating to the enforcement of our rights under contracts with our portfolio companies. Our business also is subject to extensive regulation, which may result in regulatory proceedings against us.
ITEM 4. MINE SAFETY DISCLOSURES
Not applicable.
PART II
ITEM 5. MARKET FOR REGISTRANT’S COMMON EQUITY, RELATED STOCKHOLDER MATTERS AND ISSUER PURCHASES OF EQUITY SECURITIES
Price range of common stock
Our common stock is traded on the New York Stock ExchangeNYSE under the symbol “SAR.” The following table lists the high and low closing sales pricessale price for the Company’sour common stock, and suchthe closing sales prices’sale price as a percentage of premium or discount toNAV for each fiscal quarter during the net asset value (“NAV”) for thelast two most recentrecently completed fiscal years and the current fiscal year to date.any subsequent interim period.
| Price Range | ||||||||||||||||||||
| NAV(1) | High | Low | Percentage of High Closing Sales Price as a Premium (Discount) to NAV(2) | Percentage of Low Closing Sales Price as a Premium (Discount) to NAV(2) | ||||||||||||||||
| Fiscal Year Ending February 28, 2023 | ||||||||||||||||||||
| First Quarter through May 3, 2022 | $ | * | $ | 28.31 | $ | 25.01 | * | *. | ||||||||||||
| Fiscal Year Ended February 28, 2022 | ||||||||||||||||||||
| First Quarter | $ | 28.70 | $ | 26.54 | $ | 22.66 | (7.5 | )% | (21.1 | )% | ||||||||||
| Second Quarter | $ | 28.97 | $ | 28.90 | $ | 25.70 | (0.2 | )% | (11.3 | )% | ||||||||||
| Third Quarter | $ | 29.17 | $ | 29.80 | $ | 27.19 | 2.2 | % | (6.8 | )% | ||||||||||
| Fourth Quarter | $ | 29.32 | $ | 29.51 | $ | 25.20 | 0.6 | % | (14.1 | )% | ||||||||||
| Fiscal Year Ended February 28, 2021 | ||||||||||||||||||||
| First Quarter | $ | 25.11 | $ | 24.97 | $ | 8.40 | (0.6 | )% | (66.5 | )% | ||||||||||
| Second Quarter | $ | 26.68 | $ | 18.71 | $ | 15.08 | (29.9 | )% | (43.5 | )% | ||||||||||
| Third Quarter | $ | 26.84 | $ | 22.67 | $ | 16.21 | (15.5 | )% | (39.6 | )% | ||||||||||
| Fourth Quarter | $ | 27.25 | $ | 24.20 | $ | 20.43 | (11.2 | )% | (25.0 | )% | ||||||||||
| Price Range | Percentage of High Closing Sales Price as a Premium (Discount) | Percentage of Low Closing Sales Price as a Premium (Discount) | ||||||||||||||||||
| NAV(1) | High | Low | to NAV(2) | to NAV(2) | ||||||||||||||||
| Fiscal Year Ending February 28, 2025 | ||||||||||||||||||||
| First Quarter through May 1, 2024 | $ | * | $ | 24.09 | $ | 22.52 | * | *. | ||||||||||||
| Fiscal Year Ended February 29, 2024 | ||||||||||||||||||||
| First Quarter | $ | 28.48 | $ | 28.10 | $ | 22.82 | (1.3 | )% | (19.9 | )% | ||||||||||
| Second Quarter | $ | 28.44 | $ | 28.64 | $ | 25.70 | 0.7 | % | (9.6 | )% | ||||||||||
| Third Quarter | $ | 27.42 | $ | 26.60 | $ | 23.05 | (3.0 | )% | (15.9 | )% | ||||||||||
| Fourth Quarter | $ | 27.12 | $ | 26.73 | $ | 22.77 | (1.4 | )% | (16.0 | )% | ||||||||||
| Fiscal Year Ended February 28, 2023 | ||||||||||||||||||||
| First Quarter | $ | 28.69 | $ | 28.31 | $ | 24.98 | (1.3 | )% | (12.9 | )% | ||||||||||
| Second Quarter | $ | 28.27 | $ | 26.95 | $ | 22.70 | (4.7 | )% | (19.7 | )% | ||||||||||
| Third Quarter | $ | 28.25 | $ | 27.16 | $ | 20.36 | (3.9 | )% | (27.9 | )% | ||||||||||
| Fourth Quarter | $ | 29.18 | $ | 27.77 | $ | 25.02 | (4.8 | )% | (14.3 | )% | ||||||||||
| * | Net asset value has not yet been calculated for this period. |
| (1) | Net asset value per share is determined as of the last day in the relevant quarter and therefore may not reflect the net asset value per share on the date of the high and low sales prices. |
| (2) | Calculated as the respective high or low closing sales price divided by the quarter end net asset value and subtracting 1. |
Shares of BDCs may trade at a market price that is less than the NAV of those shares. The possibilities that our shares of common stock will trade at a discount from NAV or at premiums that are unsustainable over the long term are separate and distinct from the risk that our NAV will decrease. The last reported closing sale price of our common stock on May 3, 2024 was $23.57 per share, which represents a discount of approximately 13.1% to the NAV of $27.12 as of February 29, 2024.
Summarized Financial Highlights
The following table summarizes ten years of financial highlights:
| For the year ended | ||||||||||||||||||||
| Per share data | February 28, 2022 | February 28, 2021 | February 29, 2020 | February 28, 2019 | February 28, 2018 | |||||||||||||||
| Net asset value at beginning of period | $ | 27.25 | $ | 27.13 | $ | 23.62 | $ | 22.96 | $ | 21.97 | ||||||||||
| Adoption of ASC 606 | - | - | (0.01 | ) | - | |||||||||||||||
| Net asset value at beginning of period, as adjusted | 27.25 | 27.13 | 23.62 | 22.95 | 21.97 | |||||||||||||||
| Net investment income(1) | 1.74 | 2.07 | 1.59 | 2.60 | 2.11 | |||||||||||||||
| Net realized and unrealized gains (losses) on investments(1) | 2.46 | (0.74 | ) | 4.56 | 0.03 | 0.82 | ||||||||||||||
| Realized losses on extinguishment of debt* | (0.21 | ) | (0.01 | ) | (0.17 | ) | - | - | ||||||||||||
| Net increase in net assets resulting from operations | 3.99 | 1.32 | 5.98 | 2.63 | 2.93 | |||||||||||||||
| Distributions declared from net investment income | (1.93 | ) | (1.23 | ) | (2.21 | ) | (2.06 | ) | (1.90 | ) | ||||||||||
| Total distributions to stockholders | (1.93 | ) | (1.23 | ) | (2.21 | ) | (2.06 | ) | (1.90 | ) | ||||||||||
| Issuance of common stock above net asset value(2) | - | - | - | 0.15 | - | |||||||||||||||
| Repurchases of common stock(3) | 0.01 | 0.13 | - | - | - | |||||||||||||||
| Dilution(4) | - | (0.10 | ) | (0.26 | ) | (0.05 | ) | (0.04 | ) | |||||||||||
| Net asset value at end of period | $ | 29.33 | $ | 27.25 | $ | 27.13 | $ | 23.62 | $ | 22.96 | ||||||||||
| Per share market value at end of period | $ | 27.47 | $ | 23.08 | $ | 22.91 | $ | 23.04 | $ | 21.86 | ||||||||||
| Total return based on market value(5)(6) | 28.19 | % | 7.63 | % | 9.28 | % | 16.11 | % | 5.28 | % | ||||||||||
| Total return based on net asset value(6)(7) | 15.88 | % | 7.31 | % | 26.22 | % | 13.33 | % | 14.45 | % | ||||||||||
| Shares outstanding at end of period | 12,131,350 | 11,161,416 | 11,217,545 | 7,657,156 | 6,257,029 | |||||||||||||||
| Ratio/Supplemental data: | ||||||||||||||||||||
| Net assets at end of period | 355,780,523 | 304,185,770 | 304,286,853 | 180,875,187 | 143,691,367 | |||||||||||||||
| Ratio of total expenses to average net assets(8)* | 15.42 | % | 11.60 | % | 18.49 | % | 18.03 | % | 19.05 | % | ||||||||||
| Ratio of net investment income to average net assets(8)* | 6.05 | % | 7.77 | % | 6.31 | % | 11.22 | % | 9.37 | % | ||||||||||
| Portfolio turnover rate(5)(9) | 33.59 | % | 25.26 | % | 36.82 | % | 35.26 | % | 19.73 | % | ||||||||||
| For the year ended | ||||||||||||||||||||
| Per share data | February 28, 2017 | February 29, 2016 | February 28, 2015 | February 28, 2014 | February 28, 2013 | |||||||||||||||
| Net asset value at beginning of period | $ | 22.06 | $ | 22.70 | $ | 21.08 | $ | 22.71 | $ | 24.94 | ||||||||||
| Adoption of ASC 606 | - | - | - | - | - | |||||||||||||||
| Net asset value at beginning of period, as adjusted | 22.06 | 22.70 | 21.08 | 22.71 | 24.94 | |||||||||||||||
| Net investment income(1) | 1.94 | 1.91 | 1.80 | 1.80 | 1.57 | |||||||||||||||
| Net realized and unrealized gains (losses) on investments(1) | 0.30 | 0.18 | 0.24 | (0.07 | ) | 1.85 | ||||||||||||||
| Realized losses on extinguishment of debt* | (0.26 | ) | - | - | - | - | ||||||||||||||
| Net increase in net assets resulting from operations | 2.24 | 2.09 | 2.04 | 1.73 | 3.42 | |||||||||||||||
| Distributions declared from net investment income | (1.93 | ) | (2.36 | ) | (0.40 | ) | (2.65 | ) | (4.25 | ) | ||||||||||
| Total distributions to stockholders | (1.93 | ) | (2.36 | ) | (0.40 | ) | (2.65 | ) | (4.25 | ) | ||||||||||
| Issuance of common stock above net asset value(2) | - | - | - | - | - | |||||||||||||||
| Repurchases of common stock(3) | - | - | - | - | - | |||||||||||||||
| Dilution(4) | (0.14 | ) | (0.37 | ) | (0.02 | ) | (0.71 | ) | (1.40 | ) | ||||||||||
| Net asset value at end of period | $ | 21.97 | $ | 22.06 | $ | 22.70 | $ | 21.08 | $ | 22.71 | ||||||||||
| Per share market value at end of period | $ | 22.74 | $ | 14.22 | $ | 15.76 | $ | 15.85 | $ | 17.02 | ||||||||||
| Total return based on market value(5)(6) | 80.83 | % | 4.27 | % | 1.63 | % | 9.10 | % | 36.67 | % | ||||||||||
| Total return based on net asset value(6)(7) | 12.62 | % | 11.10 | % | 10.09 | % | 8.75 | % | 16.12 | % | ||||||||||
| Shares outstanding at end of period | 5,794,600 | 5,672,227 | 5,401,899 | 5,379,616 | 4,730,116 | |||||||||||||||
| Ratio/Supplemental data: | ||||||||||||||||||||
| Net assets at end of period | 127,294,777 | 125,149,875 | 122,598,742 | 113,427,929 | 107,437,874 | |||||||||||||||
| Ratio of total expenses to average net assets(8)* | 17.27 | % | 15.46 | % | 14.85 | % | 12.59 | % | 10.19 | % | ||||||||||
| Ratio of net investment income to average net assets(8)* | 8.71 | % | 8.52 | % | 8.11 | % | 7.97 | % | 6.26 | % | ||||||||||
| Portfolio turnover rate(5)(9) | 43.76 | % | 26.22 | % | 31.28 | % | 37.82 | % | 17.30 | % | ||||||||||
| For the year ended | ||||||||||||||||||||
| Per share data | February 29, 2024 | February 28, 2023 | February 28, 2022 | February 28, 2021 | February 29, 2020 | |||||||||||||||
| Net asset value at beginning of period | $ | 29.18 | $ | 29.33 | $ | 27.25 | $ | 27.13 | $ | 23.62 | ||||||||||
| Net investment income(1) | 4.49 | 2.94 | 1.74 | 2.07 | 1.59 | |||||||||||||||
| Net realized and unrealized gains (losses) on investments(1) | (3.77 | ) | (0.75 | ) | 2.46 | (0.74 | ) | 4.56 | ||||||||||||
| Realized losses on extinguishment of debt* | (0.01 | ) | (0.13 | ) | (0.21 | ) | (0.01 | ) | (0.17 | ) | ||||||||||
| Net increase in net assets resulting from operations | 0.71 | 2.06 | 3.99 | 1.32 | 5.98 | |||||||||||||||
| Distributions declared from net investment income | (2.82 | ) | (2.28 | ) | (1.93 | ) | (1.23 | ) | (2.21 | ) | ||||||||||
| Total distributions to stockholders | (2.82 | ) | (2.28 | ) | (1.93 | ) | (1.23 | ) | (2.21 | ) | ||||||||||
| Issuance of common stock at net asset value (2) | (0.40 | ) | - | - | - | - | ||||||||||||||
| Capital contribution from manager for the issuance of common stock (8) | 0.48 | - | - | - | - | |||||||||||||||
| Repurchases of common stock(3) | 0.03 | 0.17 | 0.01 | 0.13 | - | |||||||||||||||
| Dilution(4) | (0.06 | ) | (0.10 | ) | - | (0.10 | ) | (0.26 | ) | |||||||||||
| Net asset value at end of period | $ | 27.12 | $ | 29.18 | $ | 29.33 | $ | 27.25 | $ | 27.13 | ||||||||||
| Per share market value at end of period | $ | 23.61 | $ | 27.55 | $ | 27.47 | $ | 23.08 | $ | 22.91 | ||||||||||
| Total return based on market value(5) | -3.92 | % | 10.35 | % | 28.19 | % | 7.63 | % | 9.28 | % | ||||||||||
| Total return based on net asset value(5)(6) | 4.20 | % | 9.46 | % | 15.88 | % | 7.31 | % | 26.22 | % | ||||||||||
| Shares outstanding at end of period | 13,653,476 | 11,890,500 | 12,131,350 | 11,161,416 | 11,217,545 | |||||||||||||||
| Ratio/Supplemental data: | ||||||||||||||||||||
| Net assets at end of period | 370,224,108 | 346,958,042 | 355,780,523 | 304,185,770 | 304,286,853 | |||||||||||||||
| Ratio of total expenses to average net assets* | 24.70 | % | 18.91 | % | 16.09 | % | 13.11 | % | 18.34 | % | ||||||||||
| Ratio of net investment income to average net assets* | 16.01 | % | 10.23 | % | 6.05 | % | 7.77 | % | 6.31 | % | ||||||||||
| Portfolio turnover rate(7) | 2.80 | % | 24.05 | % | 33.59 | % | 25.26 | % | 36.82 | % | ||||||||||
| For the year ended | ||||||||||||||||||||
| Per share data | February 28, 2019 | February 28, 2018 | February 28, 2017 | February 29, 2016 | February 28, 2015 | |||||||||||||||
| Net asset value at beginning of period | $ | 22.96 | $ | 21.97 | $ | 22.06 | $ | 22.70 | $ | 21.08 | ||||||||||
| Adoption of ASC 606 | (0.01 | ) | - | - | - | - | ||||||||||||||
| Net asset value at beginning of period, as adjusted | 22.95 | 21.97 | 22.06 | 22.70 | 21.08 | |||||||||||||||
| Net investment income(1) | 2.60 | 2.11 | 1.94 | 1.91 | 1.80 | |||||||||||||||
| Net realized and unrealized gains (losses) on investments(1) | 0.03 | 0.82 | 0.30 | 0.18 | 0.24 | |||||||||||||||
| Realized losses on extinguishment of debt* | - | - | (0.26 | ) | - | - | ||||||||||||||
| Net increase in net assets resulting from operations | 2.63 | 2.93 | 2.24 | 2.09 | 2.04 | |||||||||||||||
| Distributions declared from net investment income | (2.06 | ) | (1.90 | ) | (1.93 | ) | (2.36 | ) | (0.40 | ) | ||||||||||
| Total distributions to stockholders | (2.06 | ) | (1.90 | ) | (1.93 | ) | (2.36 | ) | (0.40 | ) | ||||||||||
| Issuance of common stock above net asset value(2) | 0.15 | - | - | - | - | |||||||||||||||
| Repurchases of common stock(3) | - | - | - | - | - | |||||||||||||||
| Dilution(4) | (0.05 | ) | (0.04 | ) | (0.14 | ) | (0.37 | ) | (0.02 | ) | ||||||||||
| Net asset value at end of period | $ | 23.62 | $ | 22.96 | $ | 21.97 | $ | 22.06 | $ | 22.70 | ||||||||||
| Per share market value at end of period | $ | 23.04 | $ | 21.86 | $ | 22.74 | $ | 14.22 | $ | 15.76 | ||||||||||
| Total return based on market value(5) | 16.11 | % | 5.28 | % | 80.83 | % | 4.27 | % | 1.63 | % | ||||||||||
| Total return based on net asset value(5)(6) | 13.33 | % | 14.45 | % | 12.62 | % | 11.10 | % | 10.09 | % | ||||||||||
| Shares outstanding at end of period | 7,657,156 | 6,257,029 | 5,794,600 | 5,672,227 | 5,401,899 | |||||||||||||||
| Ratio/Supplemental data: | ||||||||||||||||||||
| Net assets at end of period | 180,875,187 | 143,691,367 | 127,294,777 | 125,149,875 | 122,598,742 | |||||||||||||||
| Ratio of total expenses to average net assets* | 19.12 | % | 19.05 | % | 17.27 | % | 15.46 | % | 14.85 | % | ||||||||||
| Ratio of net investment income to average net assets* | 11.22 | % | 9.37 | % | 8.71 | % | 8.52 | % | 8.11 | % | ||||||||||
| Portfolio turnover rate(7) | 35.26 | % | 19.73 | % | 43.76 | % | 26.22 | % | 31.28 | % | ||||||||||
| * | Certain prior period amounts have been reclassified to conform to current period presentation. |
| (1) | Per share amounts are calculated using the weighted average shares outstanding during the period. |
| (2) | The continuous issuance of common stock may cause an incremental |
| (3) | Represents the anti-dilutive impact on the |
| (4) | Represents the dilutive effect of issuing common stock below |
| (5) |
| Total investment return is calculated assuming a purchase of common shares at the current market value on the first day and a sale at the current market value on the last day of the periods reported. Dividends and distributions, if any, are assumed for purposes of this calculation to be reinvested at prices obtained under the Company’s DRIP. Total investment return does not reflect brokerage commissions. |
| (6) | Total investment return is calculated assuming a purchase of common shares at the current net asset value on the first day and a sale at the current net asset value on the last day of the periods reported. Dividends and distributions, if any, are assumed for purposes of this calculation to be reinvested at prices obtained under the Company’s DRIP. Total investment return does not reflect brokerage commissions. |
| (7) |
| Portfolio turnover rate is calculated using the lesser of year-to-date sales or year-to-date purchases over the average of the invested assets at fair value. | ||
| (8) | The Manager agreed to reimburse the Company to the extent the per share price of the shares to the public, less underwriting fees, was less than net asset value per share. |
On September 24, 2014, the Company announced the approval of an open market share repurchase plan that allowed it to repurchase up to 200,000 shares of its common stock at prices below its NAV as reported in its then most recently published consolidated financial statements (the “Share Repurchase Plan”). On October 7, 2015, our board of directors extendedSince September 24, 2014, the Share Repurchase Plan for another yearhas been extended annually, and the Company has periodically increased the numberamount of shares the Company is permitted to repurchase at prices below its NAV, as reported in its then most recently published consolidated financial statements, to 400,000 shares of its common stock. On October 5, 2016, our board of directors extendedstock that may be purchased under the Share Repurchase Plan, for another year to October 15, 2017 and increased the number of shares the Company is permitted to repurchase at prices below its NAV, as reported in its thenwhich, most recently, published consolidated financial statements,was increased to 600,000 shares of its common stock. On October 10, 2017, January 8, 2019 and January 7, 2020, our board of directors extended the Share Repurchase Plan for another year to October 15, 2018, January 15, 2020 and January 15, 2021, respectively, each time leaving the number of shares unchanged at 600,000 shares of its common stock. On May 4, 2020, our board of directors increased the Share Repurchase Plan to 1.31.7 million shares of common stock. OnMost recently, on January 5, 2021, our8, 2024, the Company’s board of directors extended the Share Repurchase Plan for another year to January 15, 2022, leaving2025. As shown in the number of shares unchanged at 1.3 million shares of common stock. On January 4, 2022, our board of directors extended the Share Repurchase Plan for another year to January 15, 2023, leaving the number of shares unchanged. Astable below, as of February 28, 2022,29, 2024, the Company purchased 508,435an aggregate of 1,035,203 shares of common stock, at the average price of $19.35$22.05 for approximately $9.8$22.8 million pursuant to the Share Repurchase Plan. During the three months ended February 28, 202229, 2024, the Company purchased 50,00did not purchase any shares of common stock at the average price $25.86 for approximately $1.3 million pursuant to the Share Repurchase Plan. During the year ended February 28, 202229, 2024, the Company purchased 99,62388,576 shares of common stock, at the average price $25.55$24.36 for approximately $2.5$2.2 million pursuant to the Share Repurchase Plan.
As shown in the table below, as of February 28, 2022, we had purchased 508,435 shares of common stock pursuant to this repurchase plan.
| Period | Total Number of Shares (or Units) Purchased | Average Price per Share (or Unit) | Total Number of Shares (or Units) Purchased as Part of Publicly Announced Plans or Programs | Maximum Number (or Approximate Dollar Value) of Shares (or Units) that May Yet Be Purchased Under the Plans or Programs | ||||||||||||
| March 1, 2015 through November 30, 2015 | 2,500 | $ | 15.59 | 2,500 | 397,500 | |||||||||||
| December 1, 2015 through December 31, 2015 | - | $ | - | 2,500 | 397,500 | |||||||||||
| January 1, 2016 through January 31, 2016 | 4,200 | $ | 13.86 | 6,700 | 393,300 | |||||||||||
| February 1, 2016 through February 29, 2016 | 18,717 | $ | 13.86 | 25,417 | 374,583 | |||||||||||
| March 1, 2016 through March 31, 2016 | 16,282 | $ | 14.57 | 41,699 | 358,301 | |||||||||||
| April 1, 2016 through April 30, 2016 | 7,858 | $ | 16.22 | 49,557 | 350,443 | |||||||||||
| May 1, 2016 through May 31, 2016 | 21,357 | $ | 16.29 | 70,914 | 329,086 | |||||||||||
| June 1, 2016 through June 30, 2016 | 8,310 | $ | 16.50 | 79,224 | 320,776 | |||||||||||
| July 1, 2016 through July 31, 2016 | 19,212 | $ | 17.31 | 98,436 | 301,564 | |||||||||||
| August 1, 2016 through August 31, 2016 | 40,058 | $ | 17.44 | 138,494 | 261,506 | |||||||||||
| September 1, 2016 through September 30, 2016 | 40,221 | $ | 18.04 | 178,715 | 221,285 | |||||||||||
| October 1, 2016 through October 31, 2016 | 27,076 | $ | 18.10 | 205,791 | 394,209 | |||||||||||
| November 1, 2016 through November 30, 2016 | 8,600 | $ | 18.24 | 214,391 | 385,609 | |||||||||||
| December 1, 2016 through December 31, 2016 | 4,100 | $ | 18.57 | 218,491 | 381,509 | |||||||||||
| January 1, 2017 through February 29, 2020 | - | - | 218,491 | 381,509 | ||||||||||||
| March 1, 2020 through February 28, 2021 | 190,321 | $ | 18.96 | 408,812 | 891,188 | |||||||||||
| March 1, 2021 through February 28, 2022 | 99,623 | $ | 25.55 | 508,435 | 791,565 | |||||||||||
| Total | 508,435 | $ | 19.35 | |||||||||||||
| Period | Total Number of Shares (or Units) Purchased | Average Price per Share (or Unit) | Total Number of Shares (or Units) Purchased as Part of Publicly Announced Plans or Programs | Maximum Number (or Approximate Dollar Value) of Shares (or Units) that May Yet Be Purchased Under the Plans or Programs | ||||||||||||
| March 1, 2015 through November 30, 2015 | 2,500 | $ | 15.59 | 2,500 | 397,500 | |||||||||||
| December 1, 2015 through December 31, 2015 | - | $ | - | 2,500 | 397,500 | |||||||||||
| January 1, 2016 through January 31, 2016 | 4,200 | $ | 13.86 | 6,700 | 393,300 | |||||||||||
| February 1, 2016 through February 29, 2016 | 18,717 | $ | 13.86 | 25,417 | 374,583 | |||||||||||
| March 1, 2016 through March 31, 2016 | 16,282 | $ | 14.57 | 41,699 | 358,301 | |||||||||||
| April 1, 2016 through April 30, 2016 | 7,858 | $ | 16.22 | 49,557 | 350,443 | |||||||||||
| May 1, 2016 through May 31, 2016 | 21,357 | $ | 16.29 | 70,914 | 329,086 | |||||||||||
| June 1, 2016 through June 30, 2016 | 8,310 | $ | 16.50 | 79,224 | 320,776 | |||||||||||
| July 1, 2016 through July 31, 2016 | 19,212 | $ | 17.31 | 98,436 | 301,564 | |||||||||||
| August 1, 2016 through August 31, 2016 | 40,058 | $ | 17.44 | 138,494 | 261,506 | |||||||||||
| September 1, 2016 through September 30, 2016 | 40,221 | $ | 18.04 | 178,715 | 221,285 | |||||||||||
| October 1, 2016 through October 31, 2016 | 27,076 | $ | 18.10 | 205,791 | 394,209 | |||||||||||
| November 1, 2016 through November 30, 2016 | 8,600 | $ | 18.24 | 214,391 | 385,609 | |||||||||||
| December 1, 2016 through December 31, 2016 | 4,100 | $ | 18.57 | 218,491 | 381,509 | |||||||||||
| January 1, 2017 through February 29, 2020 | - | - | 218,491 | 381,509 | ||||||||||||
| March 1, 2020 through February 28, 2021 | 190,321 | $ | 18.96 | 408,812 | 891,188 | |||||||||||
| March 1, 2021 through February 28, 2022 | 99,623 | $ | 25.55 | 508,435 | 791,565 | |||||||||||
| March 1, 2022 through February 28, 2023 | 438,192 | $ | 24.70 | 946,627 | 353,373 | |||||||||||
| March 1, 2023 through February 29, 2024 | 88,576 | $ | 24.36 | 1,035,203 | 664,797 | |||||||||||
| Total | 1,035,203 | $ | 22.05 | |||||||||||||
Holders
The last reported closing sale price of our common stock on May 3, 2022 was $25.61 per share, which represents a discount of approximately 12.7% to the NAV reported as of February 28, 2022. As of May 3, 2022,2024, there were 11 holders of record of our common stock.
Dividend Policy
Our distributions, if any, will be determined by our board of directors and paid out of assets legally available for distribution. Any such distributions generally will be taxable to our stockholders, including to those stockholders who receive additional shares of our common stock pursuant to our dividend reinvestment plan. Prior to January 2009, we paid quarterly dividends to our stockholders. However, in January 2009, we suspended the practice of paying quarterly dividends to our stockholders and thereafter, paid five annual dividend distributions (December 2013, 2012, 2011, 2010 and 2009) to our stockholders since such time, which distributions were made with a combination of cash and the issuance of shares of our common stock as discussed more fully below.
On September 24, 2014, we announced the recommencement of quarterly dividends to our stockholders. We have adopted a dividend reinvestment plan (“DRIP”) that provides for reinvestment of our dividend distributions on behalf of our stockholders unless a stockholder elects to receive cash. As a result, if our board of directors authorizes, and we declare, a cash dividend, then our stockholders who have not “opted out” of the DRIP by the dividend record date will have their cash dividends automatically reinvested into additional shares of our common stock, rather than receiving the cash dividends. We have the option to satisfy the share requirements of the DRIP through the issuance of new shares of common stock or through open market purchases of common stock by the DRIP plan administrator.
We are prohibited from making distributions that cause us to fail to maintain the asset coverage ratio stipulated by the 1940 Act, subject to certain exceptions, or that violate our debt covenants.
In order to maintain tax treatment as a RIC, we must for each fiscal year timely distribute an amount equal to at least 90.0% of our ordinary net taxable income and realized net short-term capital gains in excess of realized net long-term capital losses, if any, reduced by deductible expenses. In addition, we will be subject to federal excise taxes to the extent we do not distribute during the calendar year at least (1) 98.0% of our net ordinary income for the calendar year, (2) 98.2% of our capital gain net income for the one-year period ending on October 31 of the calendar year and (3) any net ordinary income and capital gain net income that we recognized for preceding years, but were not distributed during such years, and on which we paid no U.S. federal income tax. For the 2019, 2018 and 2017 calendar year, the Company made distributions sufficient such that we did not incur any U.S. federal excise taxes. For the 2014, 2015, 2016, 2020 and 2021 calendar years, our distributions were insufficient such that we incurred U.S. federal excise taxes. We may elect to withhold from distribution a portion of our ordinary income for the 2022 calendar year and/or portion of the capital gains in excess of capital losses realized during the one-year period ending October 31, 2022, if any, and, if we do so, we would expect to incur U.S. federal excise taxes as a result.
In accordance with certain applicable provisions of the Code and the Treasury regulations and a revenue procedure issued by the IRS, a RIC may treat a distribution of its own stock as fulfilling its RIC distribution requirements if each stockholder may elect to receive his or her entire distribution in either cash or stock of the RIC subject to a limitation that the aggregate amount of cash to be distributed to all stockholders must be at least 20% of the aggregate declared distribution. If too many stockholders elect to receive cash, the cash available for distribution must be allocated among the shareholders electing to receive cash (with the balance of the distribution paid in stock). In no event will any stockholder, electing to receive cash, receive the lesser of (a) the portion of the distribution such shareholder has elected to receive in cash or (b) an amount equal to his or her entire distribution times the percentage limitation on cash available for distribution. If these and certain other requirements are met, for U.S. federal income tax purposes, the amount of the dividend paid in stock will be equal to the amount of cash that could have been received instead of stock. Taxable stockholders receiving such distributions (whether received in cash, our stock, or a combination thereof) will be required to include the full amount of the dividend as ordinary income (or as long-term capital gain or qualified dividend income to the extent such distribution is properly reported as such) to the extent of our current and accumulated earnings and profits for U.S. federal income tax purposes.
Performance Graph
The following graph compares the return on our common stock with that of the Standard & Poor’s 500 Stock Index, the NASDAQ Financial 100 index and the Standard & Poor’s BDC Index, for the period from March 23, 2007, the date our common stock began trading, through February 28, 2022.29, 2024. The graph assumes that, on March 23, 2007, a person invested $100 in each of our common stock, the Standard & Poor’s 500 Stock Index, the NASDAQ Financial 100 index and the Standard & Poor’s BDC Index. The graph measures total shareholder return, which takes into account both changes in stock price and dividends. It assumes that dividends paid are reinvested in like securities.
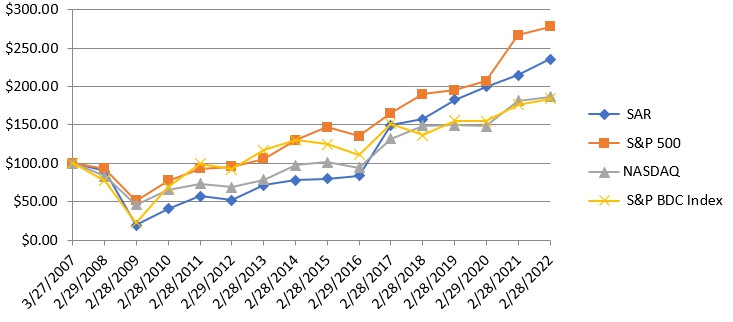
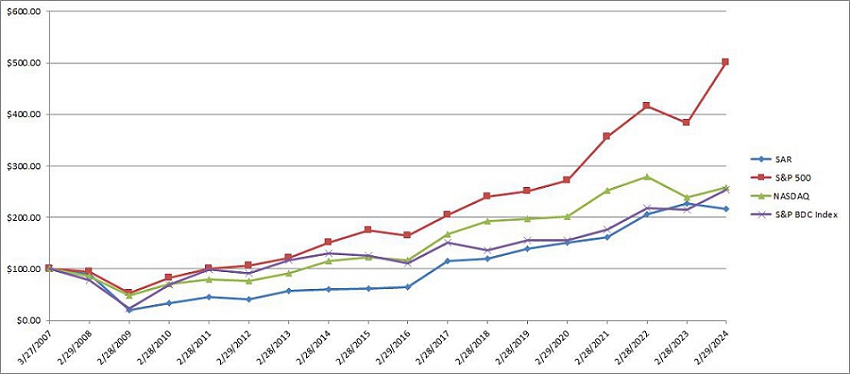
Outstanding Securities and Debt
The following table shows our outstanding classes of securities and debt as of February 28, 2022.29, 2024.
| (a) Title of Class | (b) Amount Authorized | (c) Amount Held by us or for Our Account | (d) Amount Outstanding Exclusive of Amounts Shown Under (c) | |||||||||
| Securities: | ||||||||||||
| Common Stock | 100,000,000 | 12,131,350 | $ | 87,868,650 | ||||||||
| Debt: | ||||||||||||
| Encina credit facility | $ | 50,000,000 | $ | 12,500,000 | $ | 37,500,000 | ||||||
| SBA Debentures | $ | 325,000,000 | (1) | $ | 185,000,000 | $ | 76,000,000 | |||||
| 7.25% 2025 Notes | $ | 43,125,000 | $ | 43,125,000 | $ | - | ||||||
| 7.75% 2025 Notes | $ | 5,000,000 | $ | 5,000,000 | $ | - | ||||||
| 4.375% 2026 Notes | $ | 175,000,000 | $ | 175,000,000 | $ | - | ||||||
| 4.35% 2027 Notes | $ | 75,000,000 | $ | 75,000,000 | $ | - | ||||||
| 6.25% 2027 Notes | $ | 15,000,000 | $ | 15,000,000 | $ | - | ||||||
| (a) Title of Class | (b) Amount Authorized | (c) Amount Held by us or for Our Account | (d) Amount Outstanding Exclusive of Amounts Shown Under (c) | |||||||||
| Securities: | ||||||||||||
| Common Stock | 100,000,000 | 11,890,500 | $ | 88,109,500 | ||||||||
| Debt: | ||||||||||||
| Encina credit facility | $ | 65,000,000 | $ | 35,000,000 | $ | 49,965,000 | ||||||
| SBA Debentures | $ | 325,000,000 | $ | 214,000,000 | $ | 47,000,000 | ||||||
| 7.00% 2025 Notes | $ | 12,000,000 | $ | 12,000,000 | $ | - | ||||||
| 7.75% 2025 Notes | $ | 5,000,000 | $ | 5,000,000 | $ | - | ||||||
| 8.75% 2025 Notes | $ | 20,000,000 | $ | 20,000,000 | $ | - | ||||||
| 4.375% 2026 Notes | $ | 175,000,000 | $ | 175,000,000 | $ | - | ||||||
| 4.35% 2027 Notes | $ | 75,000,000 | $ | 75,000,000 | $ | - | ||||||
| 6.00% 2027 Notes | $ | 105,500,000 | $ | 105,500,000 | $ | - | ||||||
| 6.25% 2027 Notes | $ | 15,000,000 | $ | 15,000,000 | $ | - | ||||||
| 8.00% 2027 Notes | $ | 46,000,000 | $ | 46,000,000 | $ | - | ||||||
| 8.125% 2027 Notes | $ | 60,375,000 | $ | 60,375,000 | $ | - | ||||||
| 8.50% 2028 Notes | $ | 57,500,000 | $ | 57,500,000 | $ | - | ||||||
FEES AND EXPENSES
The following table is intended to assist you in understanding the costs and expenses that an investor will bear directly or indirectly. We caution you that some of the percentages indicated in the table below are estimates and may vary. Except where the context suggests otherwise, whenever this report contains a reference to fees or expenses paid by “you,” “us” or “Saratoga Investment Corp.,” or that “we” will pay fees or expenses, stockholders will indirectly bear such fees or expenses as investors in Saratoga Investment Corp.
| Stockholder transaction expenses (as a percentage of offering price): | ||||||
| Sales load paid | - | % | (1 | ) | ||
| Offering expenses borne by us | - | % | (2 | ) | ||
| Dividend reinvestment plan expenses | None | (3 | ) | |||
| Total stockholder transaction expenses paid | - | % | ||||
| Annual estimated expenses (as a percentage of average net assets attributable to common stock): | ||||||
| Management fees | 3.6 | % | (4 | ) | ||
| Incentive fees payable under the Management Agreement | 1.9 | % | (5 | ) | ||
| Interest payments on borrowed funds | 6.1 | % | (6 | ) | ||
| Other expenses | 2.2 | % | (7 | ) | ||
| Total annual expenses | 13.8 | % | (8 | ) | ||
| Stockholder transaction expenses (as a percentage of offering price): | ||||
| Sales load paid | - | %(1) | ||
| Offering expenses borne by us | - | %(2) | ||
| Dividend reinvestment plan expenses | None | (3) | ||
| Total stockholder transaction expenses paid | - | % | ||
| Annual estimated expenses (as a percentage of average net assets attributable to common stock): | ||||
Base management fees | 5.4 | %(4) | ||
| Incentive fees payable under the Management Agreement | 2.3 | %(5) | ||
| Interest payments on borrowed funds | 13.8 | %(6) | ||
| Other expenses | 3.2 | %(7) | ||
| Total annual expenses | 24.7 | %(8) | ||
| (1) | In the event that the shares of common stock are sold to or through underwriters, a corresponding prospectus supplement will disclose the applicable sales load. |
| (2) | The prospectus supplement corresponding to each offering will disclose the applicable offering expenses and total stockholder transaction expenses. |
| (3) | The expenses associated with the administration of our dividend reinvestment plan are included in “Other expenses.” The participants in the dividend reinvestment plan will pay a pro rata share of brokerage commissions incurred with respect to open market purchases, if any, made by the administrator under the dividend reinvestment plan. |
| (4) | Our base management fee under the Management Agreement with Saratoga Investment Advisors is based on our gross assets, which is defined as our total assets, including those acquired using borrowings for investment purposes, but excluding cash and cash equivalents. See “Investment Advisory and Management |
| (5) | The incentive fee consists of two parts. The first part is calculated and payable quarterly in arrears and equals 20% of our “pre-incentive fee net investment income” for the immediately preceding quarter, subject to a preferred return, or “hurdle,” and a “catch up” feature. For this purpose, “pre-incentive fee net investment income” means interest income, dividend income and any other income (including any other fees, such as commitment, origination, structuring, diligence, managerial and consulting fees or other fees that we receive from portfolio companies) accrued by us during the fiscal quarter, minus our operating expenses for the quarter (including the base management fee, expenses payable under the administration agreement described below, and any interest expense and dividends paid on any issued and outstanding preferred stock, but excluding the incentive fee). |
| The second part of the incentive fee is determined and payable in arrears as of the end of each fiscal year (or upon termination of the Management Agreement) and equals 20% of our “incentive fee capital gains,” which equals our realized capital gains on a cumulative basis from May 31, 2010 through the end of the year, if any, computed net of all realized capital losses and unrealized capital depreciation on a cumulative basis, less the aggregate amount of any previously paid capital gain incentive fee. Under the Management Agreement, the capital gains portion of the incentive fee is based on realized gains and realized and unrealized losses from May 31, 2010. Therefore, realized and unrealized losses incurred prior to such time will not be taken into account when calculating the capital gains portion of the incentive fee, and Saratoga Investment Advisors will be entitled to 20% of incentive fee capital gains that arise after May 31, 2010. In addition, the cost basis for computing realized gains and losses on investments held by us as of May 31, 2010 will equal the fair value of such investments as of such date. |
| (6) | |
| We may borrow funds from time to time to make investments to the extent we determine that the economic situation is conducive to doing so. The |
| (7) | “Other expenses” are based on estimated amounts for the current fiscal year and include our overhead expenses, including payments under our administration agreement based on our allocable portion of overhead and other expenses incurred by Saratoga Investment Advisors in performing its obligations under the administration agreement. See “Administration Agreement.” |
| (8) | This figure includes all of the fees and expenses of our |
Example
Example
The following example demonstrates the projected dollar amount of total cumulative expenses over various periods with respect to a hypothetical $1,000 investment in our common stock, assuming an asset coverage ratio of 209.3%161.1% (the Company’s actual asset coverage as of February 28, 2022)29, 2024) and total annual expenses of 13.8%24.7% of net assets attributable to common stock as set forth in the fees and expenses table above, and (x) a 5.0% annual return resulting entirely from net realized capital gains (none of which is subject to the incentive fee) and (y) a 5.0% annual return resulting entirely from net realized capital gains (all of which is subject to the incentive fee based on capital gains). Transaction expenses are included in the following example. This example and the expenses in the table above should not be considered a representation of our future expenses, and actual expenses (including cost of debt, if any, and other expenses) may be greater or less than those shown.
| 1 Year | 3 Years | 5 years | 10 years | |||||||||||||
| Assuming a 5% annual return on portfolio resulting entirely from net realized capital gains (none of which is subject to the capital gains incentive fee)(1) | $ | 141 | $ | 404 | $ | 779 | $ | 1,773 | ||||||||
| Assuming a 5% annual return resulting entirely from net realized capital gains (all of which is subject to incentive fee based on capital gains)(2) | $ | 151 | $ | 476 | $ | 834 | $ | 1,899 | ||||||||
| 1 Year | 3 Years | 5 years | 10 years | |||||||||||||
| Assuming a 5% annual return on portfolio resulting entirely from net realized capital gains (none of which is subject to the capital gains incentive fee)(1) | $ | 253 | $ | 798 | $ | 1,399 | $ | 3,184 | ||||||||
| Assuming a 5% annual return resulting entirely from net realized capital gains (all of which is subject to incentive fee based on capital gains)(2) | $ | 263 | $ | 830 | $ | 1,454 | $ | 3,310 | ||||||||
| (1) | Assumes that we will not realize any capital gains computed net of all realized capital losses and unrealized capital depreciation. |
| (2) | Assumes no unrealized capital depreciation and a 5% annual return resulting entirely from net realized capital gains and therefore subject to the incentive fee based on capital gains. Because our investment strategy involves investments that generate primarily current income, we believe that a 5% annual return resulting entirely from net realized capital gains is unlikely. |
This example and the expenses in the table above should not be considered a representation of our future expenses, and actual expenses (including the cost of debt, if any, and other expenses) may be greater or less than those shown.
The foregoing table is to assist you in understanding the various costs and expenses that an investor in our common stock will bear directly or indirectly. While the example assumes, as required by the SEC, a 5% annual return, our performance will vary and may result in a return greater or less than 5%. Both examples assume that the 5% annual return will be generated entirely through net realized capital gains and, as a result, will trigger the payment of the capital gains portion of the incentive fee under the investment advisory agreement. Any potential income portion of the incentive fee under the investment advisory agreement is not included in the example. If we achieve sufficient returns on our investments, including through net realized capital gains, to trigger an incentive fee of a material amount, our expenses, and returns to our investors, would be higher. In addition, while the example assumes reinvestment of all dividends and distributions at net asset value,NAV, under certain circumstances, reinvestment of dividends and other distributions under our dividend reinvestment plan may occur at a price per share that differs from net asset value.NAV.
Sales of unregistered securities
On July 9, 2020, the Company issued $5.0 million aggregate principal amount of our 7.75% fixed-rate Notes due in 2025 (the “7.75% 2025 Notes”) for net proceeds of $4.8 million after deducting underwriting commissions of approximately $0.2 million. Offering costs incurred were approximately $0.1 million. Interest on the 7.75% Notes 2025 is paid quarterly in arrears on February 28, May 31, August 31 and November 30, at a rate of 7.75% per year. The 7.75% Notes 2025 mature on July 9, 2025 and may be redeemed in whole or in part at any time or from time to time at our option. The net proceeds from the offering were used for general corporate purposes in accordance with our investment objective and strategies. Financing costs of $0.3 million related to the 7.75% Notes 2025 have been capitalized and are being amortized over the term of the Notes. As of February 28, 2022, the total 7.25% 2025 Notes outstanding was $5.0 million. The 7.75% 2025 Notes are unlisted and have a par value of $25.00 per share.
All sales of unregistered securities during the year ended February 29, 2024 were reported in a Form 8-K or Quarterly Report on Form 10-Q filed with the SEC.
At February 28, 2022, the total 7.75% 2025 Notes outstanding was $5.0 million.
On December 29, 2020, the Company issued $5.0 million aggregate principal amount of our 6.25% fixed-rate Notes due in 2027 (the “6.25% Notes 2027”). Offering costs incurred were approximately $0.1 million. Interest on the 6.25% Notes 2027 is paid quarterly in arrears on February 28, May 31, August 31 and November 30, at a rate of 6.25% per year. The 6.25% Notes 2027 mature on December 29, 2027 and may be redeemed in whole or in part at any time or from time to time at our option, on or after December 29, 2024. The net proceeds from the offering were used for general corporate purposes in accordance with our investment objective and strategies. Financing costs of $0.1 million related to the 6.25% Notes 2027 have been capitalized and are being amortized over the term of the Notes. The 6.25% 2027 Notes are unlisted and have a par value of $25.00 per share.
On January 28, 2021, the Company issued $10.0 million aggregate principal amount of our 6.25% fixed rate Notes due in 2027 (the “Second 6.25% Notes 2027”) for net proceeds of $9.7 million after deducting underwriting commissions of approximately $0.3 million. Offering costs incurred were approximately $0.0 million. Interest on the Second 6.25% Notes 2027 is paid quarterly in arrears on February 28, May 31, August 31 and November 30, at a rate of 6.25% per year. The Second 6.25% Notes 2027 mature on January 28, 2027 and commencing January 28, 2023, may be redeemed in whole or in part at any time or from time to time at our option. The net proceeds from the offering were used for general corporate purposes in accordance with our investment objective and strategies. Financing costs of $0.3 million related to the Second 6.25% Notes 2027 have been capitalized and are being amortized over the term of the Notes. The Second 6.25% 2027 Notes are unlisted and have a par value of $25.00 per share.
At February 28, 2022, the total 6.25% 2027 Notes outstanding was $15.0 million.
Issuer purchases of equity securities
During the year ended February 29, 2024, February 28, 20222023 and February 28, 2021,2022, we purchased 99,62388,576, 438,192 and 190,32199,623 shares, respectfully of our common stock in the open market. We did not make any purchases of our common stock in the open market during the year ended February 29, 2020.
The following table summarizes the purchased common stock on a month to month basis for the year ended February 28, 2022:29, 2024:
| Period | Quantity | |||
| March 1, | 60,000 | |||
| April 1, 2023 through April 30, 2023 | 15,000 | |||
| May 1, 2023 through May 31, 2023 | 13,576 | |||
| June 1, 2023 through June 30, 2023 | - | |||
| July 1, | - | |||
| August 1, | - | |||
| September 1, | - | |||
| October 1, 2023 through October 31, | - | |||
| November 1, | - | |||
| December 1, | - | |||
| January 1, | ||||
| February 1, | ||||
| Total | ||||
ITEM 7. MANAGEMENT’S DISCUSSION AND ANALYSIS OF FINANCIAL CONDITION AND RESULTS OF OPERATIONS
The following discussion should be read in conjunction with our consolidated financial statements and related notes and other financial information appearing elsewhere in this Annual Report on Form 10-K. In addition to historical information, the following discussion and other parts of this Annual Report contain forward-looking information that involves risks and uncertainties. Our actual results could differ materially from those anticipated by such forward-looking information due to the factors discussed under Part I. Item 1A. “Risk Factors” and “Note about Forward-Looking Statements” appearing elsewhere herein.
The forward-looking statements are based on our beliefs, assumptions and expectations of our future performance, taking into account all information currently available to us. These beliefs, assumptions and expectations can change as a result of many possible events or factors, not all of which are known to us or are within our control. If a change occurs, our business, financial condition, liquidity and results of operations may vary materially from those expressed in our forward-looking statements.
The forward-looking statements contained in this Annual Report on Form 10-K involve risks and uncertainties, including statements as to:
| ● | our future operating |
| ● | the introduction, withdrawal, success and timing of business initiatives and strategies; |
| ● | changes in political, economic or industry conditions, the interest rate environment or financial and capital markets, which could result in changes in the value of our assets; |
| ● |
| the relative and absolute investment performance and operations of our Manager; |
| ● | the impact of increased competition; |
| ● | our ability to turn potential investment opportunities into transactions and thereafter into completed and successful investments; |
| ● | the unfavorable resolution of any future legal proceedings; |
| ● | our business prospects and the operational and financial performance of our portfolio companies, including their ability to achieve our respective objectives as a result of the current economic conditions caused by, among other things, the COVID-19 pandemic, elevated levels of inflation, and a rising interest rate environment, and the effects of the disruptions caused |
| ● | interest rate volatility, including the replacement of LIBOR with alternate reference rates and the high interest rate environment, could adversely affect our results, particularly if we elect to use leverage as part of our investment strategy; |
| ● | the impact of investments that we expect to make and future acquisitions and divestitures; |
| ● | our contractual arrangements and relationships with third parties; |
| ● | the dependence of our future success on the general economy and its impact on the industries in which we |
| ● | the ability of our portfolio companies to achieve their objectives; |
| ● | our expected financings and investments; |
| ● | our regulatory structure and tax treatment, including our ability to operate as a business development company (“BDC”), or to operate our small business investment company (“SBIC”) subsidiaries, and to continue to qualify to be taxed as a regulated investment company (“RIC”); |
| ● | the adequacy of our cash resources and working capital; |
| ● | the timing of cash flows, if any, from the operations of our portfolio companies; |
| ● | the impact of supply chain constraints and labor difficulties on our portfolio companies and the | |
| ● | the elevated level of |
| ● | the impact of legislative and regulatory actions and reforms and regulatory, supervisory or enforcement actions of government agencies relating to us or our Manager; |
| ● | the impact of changes to tax legislation and, generally, our tax position; |
| ● | our ability to access capital and any future financings by us; |
| ● | the ability of our Manager to attract and retain highly talented professionals; and |
| ● | the ability of our Manager to locate suitable investments for us and to monitor and effectively administer our |
Such forward-looking statements may include statements preceded by, followed by or that otherwise include terms such as “anticipate,” “believe,” “could,” “estimate,” “expect,” “intend,” “may,” “plan,” “potential,” “project,” “should,” “will” and “would” or the negative of these terms or other comparable terminology.
We have based the forward-looking statements included in this annual reportAnnual Report on Form 10-K on information available to us on the date of this annual reportAnnual Report on Form 10-K, and we assume no obligation to update any such forward-looking statements. Actual results could differ materially from those anticipated in our forward-looking statements, and future results could differ materially from historical performance. We undertake no obligation to revise or update any forward-looking statements, whether as a result of new information, future events or otherwise, unless required by law or SEC rule or regulation. You are advised to consult any additional disclosures that we may make directly to you or through reports that we in the future may file with the U.S. Securities and Exchange Commission (the “SEC”), including annual reports on Form 10-K, quarterly reports on Form 10-Q and current reports on Form 8-K.
The following analysis of our financial condition and results of operations should be read in conjunction with our consolidated financial statements and the related notes thereto contained elsewhere in this annual report on Form 10-K.
OVERVIEW
We are a Maryland corporation that has elected to be treated as a BDC under the Investment Company Act of 1940, as amended (the “1940 Act”). Our investment objective is to create attractive risk-adjusted returns by generating current income and long-term capital appreciation from our investments. We invest primarily in senior and unitranche leveraged loans and mezzanine debt issued by private U.S. middle marketmiddle-market companies, which we define as companies having earnings before interest, tax, depreciation and amortization (“EBITDA”) of between $2 million and $50 million, both through direct lending and through participation in loan syndicates. We may also invest up to 30.0% of the portfolio in opportunistic investments in order to seek to enhance returns to stockholders. Such investments may include investments in distressed debt, which may include securities of companies in bankruptcy, foreign debt, private equity, securities of public companies that are not thinly traded and structured finance vehicles such as collateralized loan obligation funds. Although we have no current intention to do so, to the extent we invest in private equity funds, we will limit our investments in entities that are excluded from the definition of “investment company” under Section 3(c)(1) or Section 3(c)(7) of the 1940 Act, which includes private equity funds, to no more than 15.0% of itsour net assets. We have elected and qualified to be treated as a RIC under Subchapter M of the Internal Revenue Code of 1986, as amended (the “Code”).
Corporate History
We commenced operations, at the time known as GSC Investment Corp., on March 23, 2007 and completed an initial public offering of shares of common stock on March 28, 2007. Prior to July 30, 2010, we were externally managed and advised by GSCP (NJ), L.P., an entity affiliated with GSC Group, Inc. In connection with the consummation of a recapitalization transaction on July 30, 2010, as described below we engaged Saratoga Investment Advisors to replace GSCP (NJ), L.P. as our investment adviser and changed our name to Saratoga Investment Corp.
As a result of the event of default under a revolving securitized credit facility with Deutsche Bank we previously had in place, in December 2008 we engaged the investment banking firm of Stifel, Nicolaus & Company to evaluate strategic transaction opportunities and consider alternatives for us. On April 14, 2010, GSC Investment Corp. entered into a stock purchase agreement with Saratoga Investment Advisors and certain of its affiliates and an assignment, assumption and novation agreement with Saratoga Investment Advisors, pursuant to which GSC Investment Corp. assumed certain rights and obligations of Saratoga Investment Advisors under a debt commitment letter Saratoga Investment Advisors received from Madison Capital Funding LLC, which indicated Madison Capital Funding’s willingness to provide GSC Investment Corp. with a $40.0 million senior secured revolving credit facility, subject to the satisfaction of certain terms and conditions. In addition, GSC Investment Corp. and GSCP (NJ), L.P. entered into a termination and release agreement, to be effective as of the closing of the transaction contemplated by the stock purchase agreement, pursuant to which GSCP (NJ), L.P., among other things, agreed to waive any and all accrued and unpaid deferred incentive management fees up to and as of the closing of the transaction contemplated by the stock purchase agreement but continued to be entitled to receive the base management fees earned through the date of the closing of the transaction contemplated by the stock purchase agreement.
On July 30, 2010, the transactions contemplated by the stock purchase agreement with Saratoga Investment Advisors and certain of its affiliates were completed, the private sale of 986,842 shares of our common stock for $15.0 million in aggregate purchase price to Saratoga Investment Advisors and certain of its affiliates closed, the Company entered into the Madison Credit Facility, and the Company began doing business as Saratoga Investment Corp.
We used the net proceeds from the private sale transaction and a portion of the funds available to us under the Madison Credit Facility to pay the full amount of principal and accrued interest, including default interest, outstanding under our revolving securitized credit facility with Deutsche Bank. The revolving securitized credit facility with Deutsche Bank was terminated in connection with our payment of all amounts outstanding thereunder on July 30, 2010.
On August 12, 2010, we effected a one-for-ten reverse stock split of our outstanding common stock. As a result of the reverse
stock split, every ten shares of our common stock were converted into one share of our common stock. Any fractional shares received as a result of the reverse stock split were redeemed for cash. The total cash payment in lieu of shares was $230. Immediately after the reverse stock split, we had 2,680,842 shares of our common stock outstanding.
In January 2011, we registered for public resale of the 986,842 shares of our common stock issued to Saratoga Investment
Advisors and certain of its affiliates.
On March 28, 2012, our wholly-owned subsidiary,Our wholly owned subsidiaries, Saratoga Investment Corp. SBIC LP (“SBIC LP”), received an SBIC license from the Small Business Administration (“SBA”). On August 14, 2019, our wholly-owned subsidiary, Saratoga Investment Corp. SBIC II LP (“SBIC II LP”), also received an SBIC license from the SBA.
In May 2013, we issued $48.3 million in aggregate principal amount of our 7.50% fixed-rate unsecured notes due 2020 (the “2020 Notes”) for net proceeds of $46.1 million after deducting underwriting commissions of $1.9 million and offering costs of $0.3 million. The proceeds included the underwriters’ full exercise of their overallotment option. The 2020 Notes were listed on the NYSE under the trading symbol “SAQ” with a par value of $25.00 per share. The 2020 Notes were redeemed in full on January 13, 2017 and are no longer listed on the NYSE.
On May 29, 2015, we entered into a Debt Distribution Agreement with Ladenburg Thalmann & Co. through which we may offer for sale, from time to time, up to $20.0 million in aggregate principal amount of the 2020 Notes through an At-the-Market (“ATM”) offering. Prior to the 2020 Notes being redeemed in full, the Company sold 539,725 bonds with a principal of $13.5 million at an average price of $25.31 for aggregate net proceeds of $13.4 million (net of transaction costs).
On December 21, 2016, we issued $74.5 million in aggregate principal amount of our 6.75% fixed-rate unsecured notes due 2023 (the “2023 Notes”) for net proceeds of $71.7 million after deducting underwriting commissions of approximately $2.3 million and offering costs of approximately $0.5 million. The issuance included the exercise of substantially all of the underwriters’ option to purchase an additional $9.8 million aggregate principal amount of 2023 Notes within 30 days. The 2023 Notes were listed on the NYSE under the trading symbol “SAB” with a par value of $25.00 per share. On December 21, 2019 and February 7, 2020, the Company redeemed $50.0 million and $24.45 million, respectively, in aggregate principal amount of the $74.45 million in aggregate principal amount of issued and outstanding 2023 Notes.
On March 16, 2017, we entered into an equity distribution agreement with Ladenburg Thalmann & Co. Inc., through which we may offer for sale, from time to time, up to $30.0 million of our common stock through an ATM offering. Subsequent to this, BB&T Capital Markets and B. Riley FBR, Inc. were also added to the agreement. On July 9, 2019, the amount of the common stock to be offered through this offering was increased to $70.0 million, and on October 8, 2019, the amount of the common stock to be offered was increased to $130.0 million. As of February 28, 2021, the Company sold 3,922,018 shares for gross proceeds of $97.1 million at an average price of $24.77 for aggregate net proceeds of $95.9 million (net of transaction costs). For the year ended February 28, 2021, there was no activity related to the ATM offerings.
On July 13, 2018, the Company issued 1,150,000 shares of its common stock priced at $25.00 per share (par value $0.001 per share) at an aggregate total of $28.75 million. The net proceeds, after deducting underwriting commissions of $1.15 million and offering costs of approximately $0.2 million, amounted to approximately $27.4 million. The Company also granted the underwriters a 30-day option to purchase up to an additional 172,500 shares of its common stock, which was not exercised.
On August 7, 2018, we entered into an unsecured loan agreement (“CLO 2013-1 Warehouse Loan”) with Saratoga Investment Corp. CLO 2013-1 Warehouse, Ltd (“CLO 2013-1 Warehouse”), a wholly-owned subsidiary of Saratoga Investment Corp. CLO 2013-1, Ltd. (“Saratoga CLO”), pursuant to which CLO 2013-1 Warehouse may borrow from time to time up to $20 million from us in order to provide capital necessary to support warehouse activities. The CLO 2013-1 Warehouse Loan, which expired on February 7, 2020, bears interest at an annual rate of 3M USD LIBOR + 7.5%. During the year ended February 28, 2019, the maximum amount invested by us in the CLO 2013-1 Warehouse Loan amounted to $20.0 million.
On August 28, 2018, the Company issued $40.0 million in aggregate principal amount of our 6.25% fixed-rate notes due 2025 (the “6.25% 2025 Notes”) for net proceeds of $38.7 million after deducting underwriting commissions of approximately $1.3 million. Offering costs incurred were approximately $0.3 million. The issuance included the full exercise of the underwriters’ option to purchase an additional $5.0 million aggregate principal amount of 6.25% 2025 Notes within 30 days. Interest on the 6.25% 2025 Notes is paid quarterly in arrears on February 28, May 31, August 31 and November 30, at a rate of 6.25% per year, beginning November 30, 2018. The 6.25% 2025 Notes mature on August 31, 2025 and commencing August 31, 2021, may be redeemed in whole or in part at any time or from time to time at our option. The net proceeds from the offering were used for general corporate purposes in accordance with our investment objective and strategies. Financing costs of $1.6 million related to the 6.25% 2025 Notes have been capitalized and are being amortized over the term of the 6.25% 2025 Notes.
On December 14, 2018, the Company completed the third refinancing of the Saratoga CLO (the “2013-1 Reset CLO Notes”). This refinancing, among other things, extended the Saratoga CLO reinvestment period to January 2021, and extended its legal maturity to January 2030. A non-call period of January 2020 was also added. In addition to and as part of the refinancing, the Saratoga CLO has also been upsized from $300 million in assets to approximately $500 million. As part of this refinancing and upsizing, the Company invested an additional $13.8 million in all of the newly issued subordinated notes of the Saratoga CLO, and purchased $2.5 million in aggregate principal amount of the Class F-R-2 Notes tranche and $7.5 million in aggregate principal amount of the Class G-R-2 Notes tranche at par. Concurrently, the existing $4.5 million of Class F notes and $20.0 million CLO 2013-1 Warehouse Loan were repaid.
On February 5, 2019, the Company completed a re-opening and up-sizing of its existing 6.25% 2025 Notes by issuing an additional $20.0 million in aggregate principal amount for net proceeds of $19.2 million after deducting underwriting commissions of approximately $0.6 million and discount of $0.2 million. Offering costs incurred were approximately $0.2 million. The issuance included the full exercise of the underwriters’ option to purchase an additional $2.5 million aggregate principal amount of 6.25% 2025 Notes within 30 days. Interest rate, interest payment dates and maturity remain unchanged from the existing 6.25% 2025 Notes issued in August 2018. The net proceeds from this offering were used for general corporate purposes in accordance with our investment objective and strategies. The financing costs and discount of $1.0 million related to the 6.25% 2025 Notes have been capitalized and are being amortized over the term of the 6.25% 2025 Notes.
On August 31, 2021, the Company redeemed $60.0 million in aggregate principal amount of issued and outstanding 6.25% 2025 Notes at par ($25 per note), plus the accrued and unpaid interest thereon, through, but excluding, the redemption date of August 31, 2021. The 6.25% 2025 Notes were listed on the NYSE under the trading symbol of “SAF” and have been delisted effective as of August 31, 2021, following the full redemption.
On August 14, 2019, our wholly-owned subsidiary, Saratoga Investment Corp. SBIC IIIII LP (“SBIC III LP”, and together with SBIC LP and SBIC II LP”LP, the “SBIC Subsidiaries”), also received an SBIC licenselicenses from the SBA. The newSBA on March 28, 2012, August 14, 2019, and September 29, 2022, respectively. SBIC LP’s license will provideprovided up to $175.0$150.0 million in additional long-term capital in the form of SBA debentures.
On June 24, 2020,debentures, while SBIC II LP’s and SBIC III LP’s SBIC licenses each provide up to $175.0 million. Under current SBIC regulations, for two or more SBICs under common control, the maximum amount of outstanding SBA debentures cannot exceed $350.0 million with at least $175.0 million in combined regulatory capital. With all debentures repaid to the SBA, SBIC LP’s license was surrendered on January 3, 2024, providing the Company issued $37.5 million in aggregate principal amountaccess to all undistributed capital of our 7.25% fixed-rate notes due 2025 (the “7.25% 2025 Notes”) for net proceeds of $36.3 million after deducting underwriting commissions of approximately $1.2 million. Offering costs incurred were approximately $0.2 million. On July 6, 2020, the underwriters exercised their option in full to purchase an additional $5.625 million in aggregate principal amount of its 7.25% unsecured notes due 2025. Net proceeds to the Company were $5.4 million after deducting underwriting commissions of approximately $0.2 million. Interest on the 7.25% 2025 Notes is paid quarterly in arrears on February 28, May 31, August 31 and November 30, at a rate of 7.25% per year, beginning August 31, 2020. The 7.25% 2025 Notes mature on June 30, 2025 and commencing June 24, 2022, may be redeemed in whole or in part at any time or from time to time at our option. The net proceeds from the offering were used for general corporate purposes in accordance with our investment objective and strategies. Financing costs of $1.6 million related to the 7.25% 2025 Notes have been capitalized and are being amortized over the term of the 7.25% 2025 Notes. The Company has received an investment grade private rating of “BBB” from Egan-Jones Ratings Company, an independent, unaffiliated rating agency. As of February 28, 2022, the total 7.25% 2025 Notes outstanding was $43.1 million. The 7.25% 2025 Notes are listed on the NYSE under the trading symbol “SAK” with a par value of $25.00 per share.SBIC LP.
On July 9, 2020, the Company issued $5.0 million aggregate principal amount of our 7.75% fixed-rate Notes due in 2025 (the “7.75% 2025 Notes”) for net proceeds of $4.8 million after deducting underwriting commissions of approximately $0.2 million. Offering costs incurred were approximately $0.1 million. Interest on the 7.75% Notes 2025 is paid quarterly in arrears on February 28, May 31, August 31 and November 30, at a rate of 7.75% per year, beginning August 31, 2020. The 7.75% Notes 2025 mature on July 9, 2025 and may be redeemed in whole or in part at any time or from time to time at our option. The net proceeds from the offering were used for general corporate purposes in accordance with our investment objective and strategies. Financing costs of $0.3 million related to the 7.75% Notes 2025 have been capitalized and are being amortized over the term of the Notes. As of February 28, 2022, the total 7.25% 2025 Notes outstanding was $5.0 million. The 7.75% 2025 Notes are unlisted and have a par value of $25.00 per share.
On December 29, 2020, the Company issued $5.0 million aggregate principal amount of our 6.25% fixed-rate Notes due in 2027 (the “6.25% Notes 2027”). Offering costs incurred were approximately $0.1 million. Interest on the 6.25% Notes 2027 is paid quarterly in arrears on February 28, May 31, August 31 and November 30, at a rate of 6.25% per year, beginning February 28, 2021. The 6.25% Notes 2027 mature on December 29, 2027 and may be redeemed in whole or in part at any time or from time to time at our option, on or after December 29, 2024. The net proceeds from the offering were used for general corporate purposes in accordance with our investment objective and strategies. Financing costs of $0.1 million related to the 6.25% Notes 2027 have been capitalized and are being amortized over the term of the Notes. The 6.25% 2027 Notes are unlisted and have a par value of $25.00 per share.
On January 28, 2021, the Company issued $10.0 million aggregate principal amount of our 6.25% fixed rate Notes due in 2027 (the “Second 6.25% Notes 2027”) for net proceeds of $9.7 million after deducting underwriting commissions of approximately $0.3 million. Offering costs incurred were approximately $0.0 million. Interest on the Second 6.25% Notes 2027 is paid quarterly in arrears on February 28, May 31, August 31 and November 30, at a rate of 6.25% per year, beginning February 28, 2021. The Second 6.25% Notes 2027 mature on January 28, 2027 and commencing January 28, 2023, may be redeemed in whole or in part at any time or from time to time at our option. The net proceeds from the offering were used for general corporate purposes in accordance with our investment objective and strategies. Financing costs of $0.3 million related to the Second 6.25% Notes 2027 have been capitalized and are being amortized over the term of the Notes. The Second 6.25% 2027 Notes are unlisted and have a par value of $25.00 per share.
On February 26, 2021, the Companywe completed the fourth refinancing of the Saratoga CLO. This refinancing, among other things, extended the Saratoga CLO reinvestment period to April 2024, and extended its legal maturity to April 2033. A2033, and added a non-call period ending February 2022 was also added.2022. In addition, and as part of the refinancing, the Saratoga CLO has also beenwas upsized from $500 million in assets to approximately $650 million. As part of this refinancing and upsizing, the Companywe invested an additional $14.0 million in all of the newly issued subordinated notes of the Saratoga CLO, and purchased $17.9 million in aggregate principal amount of the Class F-R-3 Notes tranche at par. Concurrently, the existing $2.5 million of Class F-R-2 Notes, $7.5 million of Class G-R-2 Notes and $25.0 million CLO 2013-1 Warehouse 2 Loan were repaid. The CompanyWe also paid $2.6 million of transaction costs related to the refinancing and upsizing on behalf of the Saratoga CLO, to be reimbursed from future equity distributions. At August 31, 2021, the outstanding receivable of $2.6 million was repaid.
On March 10, 2021, the Company issued $50.0 million aggregate principal amount of our 4.375% fixed-rate Notes due in 2026 (the “4.375% Notes 2026”) for net proceeds of $49.0 million after deducting underwriting commissions of approximately $1.0 million. Offering costs incurred were approximately $0.2 million. Interest on the 4.375% Notes 2026 is paid semi-annually in arrears on February 28 and August 28, at a rate of 4.375% per year, beginning August 28, 2021. The 4.375% Notes 2026 mature on February 28, 2026 and may be redeemed in whole or in part at any time on or after November 28, 2025 at par plus a “make-whole” premium, and thereafter at par. The net proceeds from the offering were used for general corporate purposes in accordance with our investment objective and strategies. Financing costs of $1.2 million related to the 4.375% Notes 2026 have been capitalized and are being amortized over the term of the Notes. At August 31, 2021, the outstanding receivable of $2.6 million was paid in full.
On July 15, 2021, the Company issued an additional $125.0 million aggregate principal amount of the Company’s 4.375% Notes 2026 (the “Additional 4.375% 2026 Notes”) for net proceeds for approximately $123.5 million, based on the public offering price of 101.00% of the aggregate principal amount of the Additional 4.375% 2026 Notes, after deducting the underwriting discount of $2.5 million and the estimated offering expenses of approximately $0.2 million payable by the Company. The net proceeds from the offering were used redeem all of the outstanding 6.25% 2025 Notes (as described above), and for general corporate purposes in accordance with our investment objective and strategies. The Additional 4.375% 2026 Notes were treated as a single series with the existing 4.375% 2026 Notes under the indenture and had the same terms as the existing 4.375% 2026 Notes.
On July 30, 2021, we entered into an equity distribution agreement with Ladenburg Thalmann & Co. Inc. and Compass Point Research and Trading, LLC (the “Agents”), through which we may offer for sale, from time to time, up to $150.0 million of our common stock through the Agents, or to them, as principal for their account. As February 28, 2022, the Company sold 4,840,361 shares for gross proceeds of $123.9 million at an average price of $25.61 for aggregate net proceeds of $122.4 million (net of transaction costs). During the three months ended February 28, 2022, the Company sold 392,826 shares for gross proceeds of $11.5 million at an average price of $29.31 for aggregate net proceeds of $11.4 million (net of transaction cost). During the year ended February 28, 2022, the Company sold 918,343 shares for gross proceeds of $26.8 million at an average price of $29.22 for aggregate net proceeds of $26.6 million (net of transaction cost).
On January 19, 2022, the Company issued $75.0 million aggregate principal amount of our 4.35% fixed-rate Notes due in 2027 (the “4.35% Notes 2027”) for net proceeds of $73.0 million, based on the public offering price of 99.317% of the aggregate principal amount of the 4.35% Notes 2027, after deducting the underwriting commissions of approximately $1.5 million. Offering costs incurred were approximately $0.2 million. Interest on the 4.35% Notes 2027 is paid semi-annually in arrears on February 28 and August 28, at a rate of 4.35% per year, beginning August 28, 2022. The 4.35% Notes 2027 mature on February 28, 2027 and may be redeemed in whole or in part at the Company’s option at any time prior to November 28, 2026, at par plus a “make-whole” premium, and thereafter at par. The net proceeds from the offering were used for general corporate purposes in accordance with our investment objective and strategies. Financing costs of $1.7 million related to the 4.35% Notes 2027We have been capitalized and are being amortized over the term of the Notes.
On August 9, 2021, the Company exchanged its existing $17.9 million Class F-R-3 Notes for $8.5 million Class F-1-R-3 Notes and $9.4 million Class F-2-R-3 Note at par. On August 11, 2021, the Company sold its Class F-1-R-3 Notes to third parties, resulting in a realized loss of $0.1 million.
The Company has formed a wholly owned special purpose entity, Saratoga Investment Funding II LLC, a Delaware limited liability company (“SIF II”), for the purpose of entering into a $50.0 million senior secured revolving credit facility with Encina Lender Finance, LLC (the “Lender”), supported by loans held by SIF II and pledged to the Lender under the credit facility (the “Encina Credit Facility). The Encina Credit Facility closed on October 4, 2021. During the first two years following the closing date, SIF II may request an increase in the commitment amount under the Encina Credit Facility to up to $75.0 million. The terms of the Encina Credit Facility require a minimum drawn amount of $12.5 million at all times during the first six months following the closing date, which increases to the greater of $25.0 million or 50% of the commitment amount in effect at any time thereafter. The term of the Encina Credit Facility is three years. Advances under the Encina Credit Facility bear interest at a floating rate per annum equal to LIBOR plus 4.0%, with LIBOR having a floor of 0.75%, with customary provisions related to the selection by the Lenderour and the CompanyLender’s selection of a replacement benchmark rate. Concurrently with the closing of the Encina Credit Facility, all remaining amounts outstanding on the Company’sour existing revolving credit facility with Madison Capital Funding, LLC were repaid and the facility was terminated. On January 27, 2023, among other things, the borrowings available under the Encina Credit Facility was increased from up to $50.0 million to up to $65.0 million, the underlying benchmark rate used to compute interest changed from LIBOR to Term SOFR for one-month tenor plus a 0.10% credit spread adjustment; the applicable effective margin rate on borrowings increased from 4.00% to 4.25% and the maturity date was extended from October 4, 2024 to January 27, 2026.
On October 26, 2021, the Company and TJHA JV I LLC (“TJHA”)we entered into a Limited Liability Company Agreement (the “LLC Agreement”with TJHA JV I LLC (“TJHA”) to co-manage Saratoga Senior Loan Fund I JV LLC (“SLF JV”). SLF JV is invested in Saratoga Investment Corp Senior Loan Fund 2021-1 Ltd (“SLF 2021”), which is a wholly owned subsidiary of SLF JV. SLF 2021 was formed for the purpose of making investments in a diversified portfolio of broadly syndicated first lien and second lien term loans or bonds in the primary and secondary markets.
The Company
On September 30, 2022, SLF 2021 was renamed to Saratoga Investment Corp Senior Loan Fund 2022-1, Ltd. (“SLF 2022”).
We and TJHA have equal voting interest on all material decisions with respect to SLF JV, including those involving its investment portfolio, and equal control of corporate governance. No management fee is charged to SLF JV as control and management of SLF JV is shared equally.
The CompanyWe and TJHA have committed to provide up to a combined $50.0 million of financing to SLF JV through cash contributions, with the Company providingwhere we provided $43.75 million and TJHA providingprovides $6.25 million, resulting in an 87.5% and 12.5% ownership between the two parties. The financing is issued in the form of an unsecured note and equity. The unsecured note will pay a fixed rate of 10.0% per annum and is due and payable in full on June 15, 2023.October 20, 2033. As of February 29, 2024, our and TJHA’s investment in SLF JV consisted of an unsecured note of $17.6 million and $2.5 million, respectively; and membership interest of $17.6 million and $2.5 million, respectively. As of February 28, 2022,2023, the Company and TJHA’s investment in SLF JV consisted of an unsecured note of $13.1$17.6 million and $1.9$2.5 million, respectively; and membership interest of $13.1$17.6 million and $1.9$2.5 million, respectively.
For the period from October 26, 2021, through February 28, 2022, the Company earned approximately $0.1 million of interest income related to SLF JV, which is included in interest income. As of February 29, 2024, and February 28, 2022, approximately $0.1 million2023, the Company’s investment in the unsecured note of interest income related to SLF JV was includedhad a fair value of $15.8 million and $17.6 million, respectively, and the Company’s investment in interest receivable.the membership interests of SLF JV had a fair value of $9.4 million and $13.1 million, respectively.
SLF JV’s initial investment in SLF 2021 is2022 was in the form of an unsecured loan. The unsecured note will payloan paid a floating rate of SOFRLIBOR plus 7.00% per annum and is due and payablewas paid in full on June 9, 2023. As of FebruaryThe unsecured loan was repaid in full on October 28, 2022, SLF JV’s investment in SLF 2021 had an aggregate fair valueas part of approximately $28.7 million.the CLO closing.
The Company hasWe have determined that SLF JV is an investment company under ASC 946;(“FASB”) Accounting Standards Codification (“ASC”) Topic 946, Financial Services—Investment Companies; however, in accordance with such guidance the Companywe will generally not consolidate itsour investment in a company other than a wholly-ownedwholly owned investment company subsidiary. SLF JV is not a wholly-ownedwholly owned investment company subsidiary as the Companywe and TJHA each have an equal 50% voting interest in SLF JV and thus neither party has a controlling financial interest. Furthermore, FASB ASC Topic 810,Consolidation, concludes that in a joint venture where both members have equal decision making authority, it is not appropriate for one member to consolidate the joint venture since neither has control. Accordingly, the Company doeswe do not consolidate SLF JV.
On October 28, 2022, SLF 2022 issued $402.1 million of debt through the JV CLO trust. The 2022 JV CLO Notes were issued pursuant to the JV Indenture, with the Trustee. As part of the transaction, we purchased 87.50% of the Class E Notes from SLF 2022 with a par value of $12.25 million. As of February 29, 2024 and February 28, 2023, the fair value of these Class E Notes were $12.3 million and $11.4 million, respectively.
COVID-19
We have been closely monitoring, and will continue to monitor, the impact of the COVID-19 pandemic (including new variants of COVID-19) and its impact on all aspects of our business, including how it will impact our portfolio companies, employees, due diligence and underwriting processes, and financial markets. Given the fluidity of the pandemic, we cannot estimate the long-term impact of COVID-19 on our business, future results of operations, financial position or cash flows at this time. Further, the operational and financial performance of the portfolio companies in which we make investments may be significantly impacted by COVID-19, which may in turn impact the valuation of our investments. We believe our portfolio companies have taken, and continue to take, immediate actions to effectively and efficiently respond to the challenges posed by COVID-19 and related orders imposed by state and local governments, including developing liquidity plans supported by internal cash reserves, and shareholder support. The COVID-19 pandemic and preventative measures taken to contain or mitigate its spread have caused, and are continuing to cause, business shutdowns, cancellations of events and restrictions on travel, significant reductions in demand for certain goods and services, reductions in business activity and financial transactions, supply chain disruptions, labor difficulties and shortages, commodity inflation and elements of economic and financial market instability in the United States and globally. Such effects will likely continue for the duration of the pandemic, which is uncertain, and for some period thereafter.
Critical Accounting Policies and Estimates
Basis of Presentation
The preparation of financial statements in accordance with U.S. generally accepted accounting principles (“U.S. GAAP”) requires management to make certain estimates and assumptions affecting amounts reported in the Company’sour consolidated financial statements. We have identified investment valuation, revenue recognition and the recognition of capital gains incentive fee expense as our most critical accounting estimates. We continuously evaluate our estimates, including those related to the matters described below. These estimates are based on the information that is currently available to us and on various other assumptions that we believe to be reasonable under the circumstances. Actual results could differ materially from those estimates under different assumptions or conditions. A discussion of our critical accounting policies and estimates follows.
Investment Valuation
The Company accountsWe account for its investments at fair value in accordance with the Financial Accounting Standards Board (“FASB”) Accounting Standards Codification (“ASC”)FASB ASC Topic 820, Fair Value Measurements and Disclosures (“Measurement (“ASC 820”). ASC 820 defines fair value, establishes a framework for measuring fair value, establishes a fair value hierarchy based on the quality of inputs used to measure fair value and enhances disclosure requirements for fair value measurements. Under ASC 820 requires the Companywe are required to assume that its investments are to be sold or its liabilities are to be transferred at the balance sheet date in the principal market to independent market participants, or in the absence of a principal market, in the most advantageous market, which may be a hypothetical market. Market participants are defined as buyers and sellers in the principal or most advantageous market that are independent, knowledgeable, and willing and able to transact.
Investments for which market quotations are readily available are fair valued at such market quotations obtained from independent third-party pricing services and market makers subject to any decision by our board of directors to approve a fair value determination to reflect significant events affecting the value of these investments. We value investments for which market quotations are not readily available at fair value as approved, in good faith, by our board of directors based on input from Saratoga Investment Advisors, the audit committee of our board of directors and a third party independent valuation firm. We use multiple techniques for determining fair value based on the nature of the investment and experience with those types of investments and specific portfolio companies. The selections of the valuation techniques and the inputs and assumptions used within those techniques often require subjective judgements and estimates. These techniques include market comparables, discounted cash flows and enterprise value waterfalls. Fair value is best expressed as a range of values from which the Companywe determines a single best estimate. The types of inputs and assumptions that may be considered in determining the range of values of our investments include the nature and realizable value of any collateral, the portfolio company’s ability to make payments, market yield trend analysis and volatility in future interest rates, call and put features, the markets in which the portfolio company does business, comparison to publicly traded companies, discounted cash flows and other relevant factors.
We undertake a multi-step valuation process each quarter when valuing investments for which market quotations are not readily available, as described below:
| ● |
| ● |
In addition, all our investments are subject to the following valuation process:
| ● |
| ● |
Our investment in Saratoga CLO is carried at fair value, which is based on a discounted cash flows that utilizes prepayment, re-investment and loss assumptions based on historical experience and projected performance, economic factors, the characteristics of the underlying cash flow, and market comparables for equity interests in collateralized loan obligation funds similar to Saratoga CLO, when available, as determined by Saratoga Investment Advisors and recommended to our board of directors. Specifically, we use Intex cash flows, or an appropriate substitute, to form the basis for the valuation of our investment in Saratoga CLO. The cash flows use a set of inputs including projected default rates, recovery rates, reinvestment raterates and prepayment rates in order to arrive at estimated valuations. The inputs are based on available market data and projections provided by third parties as well as management estimates. We use the output from the Intex models (i.e., the estimated cash flows) to perform a discounted cash flow analysis on expected future cash flows to determine a valuation for our investment in Saratoga CLO.
The SEC has adopted new
Rule 2a-5 under the 1940 Act. This ruleAct (“Rule 2a-5”) establishes requirementsa regulatory framework for determining fair value in good faith for purposes of the 1940 Act. We willRule 2a-5 permits boards, subject to board oversight and certain other conditions, to designate the investment adviser to perform fair value determinations. Rule 2a-5 also defines when market quotations are “readily available” for purposes of the 1940 Act and the threshold for determining whether a fund must determine the fair value of a security. Rule 31a-4 under the 1940 Act (“Rule 31a-4”) provides the recordkeeping requirements associated with fair value determinations. While our board of directors has not elected to designate Saratoga Investment Advisors as the valuation designee, we has adopted certain revisions to its valuation policies and procedures in order comply with the new rule’s valuationapplicable requirements on or before the SEC’s compliance date in September 2022.of Rule 2a-5 and Rule 31a-4.
Revenue Recognition
Income Recognition
Interest income, adjusted for amortization of premium and accretion of discount, is recorded on an accrual basis to the extent that such amounts are expected to be collected. The Company stops accruing interest on its investments when it is determined that interest is no longer collectible. Discounts and premiums on investments purchased are accreted/amortized over the life of the respective investment using the effective yield method. The amortized cost of investments represents the original cost adjusted for the accretion of discounts and amortization of premiums on investments.
Loans are generally placed on non-accrual status when there is reasonable doubt that principal or interest will be collected. Accrued interest is generally reserved when a loan is placed on non-accrual status. Interest payments received on non-accrual loans may be recognized as a reduction in principal depending upon management’s judgment regarding collectability. Non-accrual loans are restored to accrual status when past due principal and interest is paid and, in management’s judgment, are likely to remain current, although we may make exceptions to this general rule if the loan has sufficient collateral value and is in the process of collection.
Payment-in-Kind Interest
The Company holdsWe hold debt and preferred equity investments in itsour portfolio that contain a payment-in-kind (“PIK”) interest provision. The PIK interest, which represents contractually deferred interest added to the investment balance that is generally due at maturity, is generally recorded on the accrual basis to the extent such amounts are expected to be collected. We stop accruing PIK interest if we do not expect the issuer to be able to pay all principal and interest when due.
Revenues
We generate revenue in the form of interest income and capital gains on the debt investments that we hold and capital gains, if any, on equity interests that we may acquire. We expect our debt investments, whether in the form of leveraged loans or mezzanine debt, to have terms of up to ten years, and to bear interest at either a fixed or floating rate. Interest on debt will be payable generally
either quarterly or semi-annually. In some cases, our debt or preferred equity investments may provide for a portion or all of the interest to be PIK. To the extent interest is PIK, it will be payable through the increase of the principal amount of the obligation by the amount of interest due on the then-outstanding aggregate principal amount of such obligation. The principal amount of the debt and any accrued but unpaid interest will generally become due at the maturity date. In addition, we may generate revenue in the form of commitment, origination, structuring, amendment, redemption or diligence fees, fees for providing managerial assistance or investment management services and possibly consulting fees. Any such fees will be generated in connection with our investments and recognized as earned. We may also invest in preferred equity or common equity securities that pay dividends on a current basis.
On January 22, 2008, we entered into a collateral management agreement with Saratoga CLO, pursuant to which we act as its collateral manager. The Saratoga CLO was initially refinanced in October 2013 with its reinvestment period extended to October 2016. On November 15, 2016, we completed a second refinancing of the Saratoga CLO with its reinvestment period extended to October 2018.
On August 7, 2018, we entered into an unsecured loan agreement, CLO 2013-1 Warehouse Loan, with Saratoga Investment Corp. CLO 2013-1 Warehouse, Ltd, a wholly-owned subsidiary of Saratoga CLO, pursuant to which CLO 2013-1 Warehouse may borrow from time to time up to $20 million from us in order to provide capital necessary to support warehouse activities. The CLO 2013-1 Warehouse Loan, which expires on February 7, 2020, bears interest at an annual rate of 3M USD LIBOR + 7.5%. During the year ended February 28, 2019, the maximum amount invested by us in the CLO 2013-1 Warehouse Loan amounted to $20.0 million.
On December 14, 2018, we completed a third refinancing and upsize of the Saratoga CLO. The third Saratoga CLO refinancing, among other things, extended its reinvestment period to January 2021, and extended its legal maturity date to January 2030. A2030, and added a non-call period of January 2020 was also added.2020. Following this refinancing, the Saratoga CLO portfolio increased from approximately $300.0 million in aggregate principal amount to approximately $500.0 million of predominantly senior secured first lien term loans. In addition to refinancing its liabilities, we invested an additional $13.8 million in all of the newly issued subordinated notes of the Saratoga CLO and also purchased $2.5 million in aggregate principal amount of the Class F-R-2 and $7.5 million aggregate principal amount of the Class G-R-2 notes tranches at par, with a coupon of 3M USD LIBOR plus 8.75% and 3M USD LIBOR plus 10.00%, respectively. As part of this refinancing, we also redeemed our existing $4.5 million aggregate amount of the Class F notes tranche at par and the $20.0 million CLO 2013-1 Warehouse Loan was repaid.
On February 11, 2020, we entered into an unsecured loan agreement (“CLO 2013-1 Warehouse 2 Loan”) with Saratoga Investment Corp. CLO 2013-1 Warehouse 2, Ltd (“CLO 2013-1 Warehouse 2”), a wholly-ownedwholly owned subsidiary of Saratoga CLO, pursuant to which CLO 2013-1 Warehouse 2 may borrow from time to time up to $20.0 million from the Company in order to provide capital necessary to support warehouse activities. On October 23, 2020, the availability under the CLO 2013-1 Warehouse 2 Loan was increased to $25.0 million, availability, which was immediately fully drawn and, which expires on August 20, 2021. The interest rate was also amended to be based on a pricing grid, starting at an annual rate of 3M USD LIBOR + 4.46%. During the fourth quarter ended February 28, 2021, the CLO 2013-1 Warehouse 2 Ltd was repaid in full.
On February 26, 2021, the Companywe completed the fourth refinancing of the Saratoga CLO. This refinancing, among other things, extended the Saratoga CLO reinvestment period to April 2024, and extended its legal maturity to April 2033. A2033, and added a non-call period endingof February 2022 was also added.2022. In addition, and as part of the refinancing, the Saratoga CLO has also beenwas upsized from $500 million in assets to approximately $650 million. As part of this refinancing and upsizing, the Company invested an additional $14.0 million in all of the newly issued subordinated notes of the Saratoga CLO, and purchased $17.9 million in aggregate principal amount of the Class F-R-3 Notes tranche at par. Concurrently, the existing $2.5 million of Class F-R-2 Notes, $7.5 million of Class G-R-2 Notes and $25.0 million of the CLO 2013-1 Warehouse 2 Loan were repaid. The CompanyWe also paid $2.6 million of transaction costs related to the refinancing and upsizing on behalf of the Saratoga CLO, to be reimbursed from future equity distributions. At August 31, 2021, the outstanding receivable of $2.6 million was repaid in full.
On August 9, 2021, the Companywe exchanged itsour existing $17.9 million Class F-R-3 Notes for $8.5 million Class F-1-R-3 Notes and $9.4 million Class F-2-R-3 NoteNotes at par. On August 11, 2021, the Companywe sold itsour Class F-1-R-3 Notes to third parties, resulting in a realized loss of $0.1 million.
The Saratoga CLO remains effectively 100% owned and managed by Saratoga Investment Corp. We receive a base management fee of 0.10% per annum and a subordinated management fee of 0.40% per annum of the outstanding principal amount of Saratoga CLO’s assets, paid quarterly to the extent of available proceeds. Prior to the second refinancing and the issuance of the 2013-1 Amended CLO Notes, we received a base management fee of 0.25% per annum and a subordinated management fee of 0.25% per annum of the outstanding principal amount of Saratoga CLO’s assets, paid quarterly to the extent of available proceeds.
Following the third refinancing and the issuance of the 2013-1 Reset CLO Notes on December 14, 2018, we are no longer entitled to an incentive management fee equal to 20.0% of excess cash flow to the extent the Saratoga CLO subordinated notes receive an internal rate of return paid in cash equal to or greater than 12.0%.
Interest income on our investment in Saratoga CLO is recorded using the effective interest method in accordance with the provisions of FASB ASC Topic 325-40, Investments-Other, Beneficial Interests in Securitized Financial Assets, (“ASC 325-40”), based on the anticipated yield and the estimated cash flows over the projected life of the investment. Yields are revised when there are changes in actual or estimated cash flows due to changes in prepayments and/or re-investments, credit losses or asset pricing. Changes in estimated yield are recognized as an adjustment to the estimated yield over the remaining life of the investment from the date the estimated yield was changed.
Expenses
Our primary operating expenses include the payment of investment advisory and management fees, professional fees, directors and officers insurance, fees paid to directors who are not “interested persons” (as defined in Section 2(a)(19) of the 1940 Act) of the Company (“independent directorsdirectors”) and administrator expenses, including our allocable portion of our administrator’s overhead. Our investment advisory and management fees compensate our Manager for its work in identifying, evaluating, negotiating, closing and monitoring our investments. We bear all other costs and expenses of our operations and transactions, including those relating to:
| ● | organization; |
| ● | calculating our net asset value (“NAV”) (including the cost and expenses of any independent valuation firm); |
| ● | expenses incurred by our Manager payable to third parties, including agents, consultants or other advisers, in monitoring our financial and legal affairs and in monitoring our investments and performing due diligence on our prospective portfolio companies; |
| ● | expenses incurred by our Manager payable for travel and due diligence on our prospective portfolio companies; |
| ● | interest payable on debt, if any, incurred to finance our investments; |
| ● | offerings of our common stock and other securities; |
| ● | investment advisory and management fees; |
| ● | fees payable to third parties, including agents, consultants or other advisers, relating to, or associated with, evaluating and making investments; |
| ● | transfer agent and custodial fees; |
| ● | federal and state registration fees; |
| ● | all costs of registration and listing our common stock on any securities exchange; |
| ● | U.S. federal, state and local taxes; |
| ● | independent directors’ fees and expenses; |
| ● | costs of preparing and filing reports or other documents required by governmental bodies (including the |
Exchange Commission (“SEC”) and the SBA);
| ● | costs of any reports, proxy statements or other notices to common stockholders including printing costs; |
| ● | our fidelity bond, directors and officers errors and omissions liability insurance, and any other insurance premiums; |
| ● | direct costs and expenses of administration, including printing, mailing, long distance telephone, copying, secretarial and other staff, independent auditors and outside legal costs; and |
| ● | administration fees and all other expenses incurred by us or, if applicable, the administrator in connection with administering our business (including payments under the Administration Agreement based upon our allocable portion of the administrator’s overhead in performing its obligations under an Administration Agreement, including rent and the allocable portion of the cost of our officers and their respective staffs (including travel expenses)). |
Pursuant to the investment advisory and management agreement that we had with GSCP (NJ), L.P., our former investment adviser and administrator, we had agreed to pay GSCP (NJ), L.P. as investment adviser a quarterly base management fee of 1.75% of the average value of our total assets (other than cash or cash equivalents but including assets purchased with borrowed funds) at the end of the two most recently completed fiscal quarters and an incentive fee.
The incentive fee had two parts:
| ● | A fee, payable quarterly in arrears, equal to 20.0% of our pre-incentive fee net investment income, expressed as a rate of return on the value of the net assets at the end of the immediately preceding quarter, that exceeded a 1.875% quarterly hurdle rate measured as of the end of each fiscal quarter. Under this provision, in any fiscal quarter, our investment adviser received no incentive fee unless our pre-incentive fee net investment income exceeded the hurdle rate of 1.875%. Amounts received as a return of capital were not included in calculating this portion of the incentive fee. Since the hurdle rate was based on net assets, a return of less than the hurdle rate on total assets could still have resulted in an incentive fee. |
| ● | A fee, payable at the end of each fiscal year, equal to 20.0% of our net realized capital gains, if any, computed net of all realized capital losses and unrealized capital depreciation, in each case on a cumulative basis on each investment in |
We deferred cash payment of any incentive fee otherwise earned by our former investment adviser if, during the then most recent four full fiscal quarters ending on or prior to the date such payment was to be made, the sum of (a) our aggregate distributions to our stockholders and (b) our change in net assets (defined as total assets less liabilities) (before taking into account any incentive fees payable during that period) was less than 7.5% of our net assets at the beginning of such period. These calculations were appropriately pro-rated for the first three fiscal quarters of operation and adjusted for any share issuances or repurchases during the applicable period. Such incentive fee would become payable on the next date on which such test had been satisfied for the most recent four full fiscal quarters or upon certain terminations of the investment advisory and management agreement. We commenced deferring cash payment of incentive fees during the quarterly period ended August 31, 2007 and continued to defer such payments through the quarterly period ended May 31, 2010. As of July 30, 2010, the date on which GSCP (NJ), L.P. ceased to be our investment adviser and administrator, we owed GSCP (NJ), L.P. $2.9 million in fees for services previously provided to us; of which $0.3 million has been paid by us. GSCP (NJ), L.P. agreed to waive payment by us of the remaining $2.6 million in connection with the consummation of the stock purchase transaction with Saratoga Investment Advisors and certain of its affiliates described elsewhere in this Annual Report.
The terms of the investment advisory and management agreement with Saratoga Investment Advisors, our current investment adviser, are substantially similar to the terms of the investment advisory and management agreement we had entered into with GSCP (NJ), L.P., our former investment adviser, except for the following material distinctions in the fee terms:
| ● | The capital gains portion of the incentive fee was reset with respect to gains and losses from May 31, 2010, and therefore losses and gains incurred prior to such time will not be taken into account when calculating the capital gains fee payable to Saratoga Investment Advisors and, as a result, Saratoga Investment Advisors will be entitled to 20.0% of net gains that arise after May 31, 2010. In addition, the cost basis for computing realized gains and losses on investments held by us as of May 31, 2010 equal the fair value of such investment as of such date. Under the investment advisory and management agreement with our former investment adviser, GSCP (NJ), L.P., the capital gains fee was calculated from March 21, 2007, and the gains were substantially outweighed by losses. |
| ● | Under the “catch up” provision, 100.0% of our pre-incentive fee net investment income with respect to that portion of such pre-incentive fee net investment income that exceeds 1.875% but is less than or equal to 2.344% in any fiscal quarter is payable to Saratoga Investment Advisors. This will enable Saratoga Investment Advisors to receive 20.0% of all net investment income as such amount approaches 2.344% in any quarter, and Saratoga Investment Advisors will receive 20.0% of any additional net investment income. Under the investment advisory and management agreement with our former investment adviser, GSCP (NJ), L.P. only received 20.0% of the excess net investment income over 1.875%. |
| ● | We will no longer have deferral rights regarding incentive fees in the event that the distributions to stockholders and change in net assets is less than 7.5% for the preceding four fiscal quarters. |
Capital Gains Incentive Fee
The Company recordsWe record an expense accrual relating to the capital gains incentive fee payable by the Companyus to itsthe Manager when the unrealized gains on its investments exceed all realized capital losses on its investments given the fact that a capital gains incentive fee would be owed to the Manager if the Companywe were to liquidate itsour investment portfolio at such time. The actual incentive fee payable to the Company’s Manager related to capital gains will be determined and payable in arrears at the end of each fiscal year and will include only realized capital gains for the period.
NewRecent Accounting Pronouncements
In June 2022, the FASB issued Accounting Standards Update (“ASU”) 2022-03, Fair Value Measurement of Equity Securities Subject to Contractual Sale Restrictions (Topic 820) (“ASU 2022-03”), which clarifies that a contractual sale restriction prohibiting the sale of an equity security is a characteristic of the reporting entity holding the equity security and is not included in the equity security’s unit of account. Accordingly, an entity should not consider the contractual sale restriction when measuring the equity security’s fair value. In addition, ASU 2022-03 prohibits an entity from recognizing a contractual sale restriction as a separate unit of account. ASU 2022-03’s amendments are effective for fiscal years beginning after December 15, 2023, with early adoption permitted. We are currently evaluating the impact of the adoption of ASU 2022-03 on our consolidated financial statements.
In March 2020, the FASB issued ASU 2020-04, Reference Rate Reform (Topic 848): Facilitation of the Effects of Reference Rate Reform on Financial Reporting(“ASU 2020-04”) to provide optional guidance to ease the potential burden in accounting for (or recognizing the effects of) reference rate reform on financial reporting. ASU 2020-04 established Topic 848 to provide relief during the temporary transition period and includes a sunset provision based on expectations of when the London Interbank Offered Rate (“LIBOR”) would cease being published. In December 2022, the FASB issued ASU No. 2022-06, Reference Rate Reform (Topic 848): Deferral of the Sunset Date of Topic 848, which deferred the sunset day of this guidance to December 31, 2024. With the adoption of ASU 2022-06, there was no significant impact to our consolidated financial position.
In December 2023, the FASB issued ASU 2023-09, Improvements to Income Tax Disclosures. The amendments in this update require more disaggregated information on income taxes paid. ASU 2020-04 provide optional expedients and exceptions2023-09 is effective for applying GAAPyears beginning after December 15, 2024. Early adoption is permitted, however the Company has not elected to contracts, hedging relationships, and other transactions affected by reference rate reform if certain criteria are met.adopt this provision as of the date of the financial statements contained in this report. The Company has agreements that have LIBOR as a reference rate with certain portfolio companies and underis still assessing the Encina Credit Facility. Manyimpact of these agreements (including the credit agreements relating to the Encina Credit Facility) include an alternative successor rate or language for choosing an alternative successor rate when LIBOR reference is no longer considered to be appropriate. With respect to other agreements, the Company intends to work with its portfolio companies to modify agreements to choose an alternative successor rate. Contract modifications are required to be evaluated in determining whether the modifications result in the establishment of new contracts or the continuation of existing contracts. The standard is effective as of March 12, 2020 through December 31, 2022. Managementguidance. However, it does not believe this optional guidance hasexpect ASU 2023-09 to have a material impact on the Company’s consolidated financial statements and disclosures.the notes thereto.
Portfolio and investment activity
Investment Portfolio Overview
| February 28, 2022 | February 28, 2021 | February 29, 2020 | ||||||||||
| ($ in millions) | ||||||||||||
| Number of investments(1) | 94 | 81 | 74 | |||||||||
| Number of portfolio companies(2) | 45 | 40 | 35 | |||||||||
| Average investment per portfolio company(2) | $ | 17.3 | $ | 12.6 | $ | 12.9 | ||||||
| Average investment size(1) | $ | 8.4 | $ | 6.5 | $ | 6.3 | ||||||
| Weighted average maturity(3) | 2.9 yrs | 3.2 yrs | 3.1 yrs | |||||||||
| Number of industries | 38 | 31 | 28 | |||||||||
| Non-performing or delinquent investments (fair value) | $ | - | $ | 2.1 | $ | 2.1 | ||||||
| Fixed rate debt (% of interest earning portfolio)(3) | $ | 16.9(2.5 | )% | $ | 23.3(4.8 | )% | $ | 29.7(6.8 | )% | |||
| Fixed rate debt (weighted average current coupon)(3) | 10.0 | % | 9.8 | % | 9.3 | % | ||||||
| Floating rate debt (% of interest earning portfolio)(3) | $ | 671.2(97.5 | )% | $ | 462.6(95.2 | )% | $ | 404.4(93.2 | )% | |||
| Floating rate debt (weighted average current spread over LIBOR)(3)(4) | 7.1 | % | 7.4 | % | 8.0 | % | ||||||
| February 29, 2024 | February 28, 2023 | February 28, 2022 | ||||||||||
| ($ in millions) | ||||||||||||
| Number of investments(1) | 139 | 115 | 94 | |||||||||
| Number of portfolio companies(2) | 55 | 49 | 45 | |||||||||
| Average investment per portfolio company(2) | $ | 20.1 | $ | 19.0 | $ | 17.3 | ||||||
| Average investment size(1) | $ | 8.1 | $ | 8.3 | $ | 8.4 | ||||||
| Weighted average maturity(3) | 2.5 yrs | 2.9 yrs | 2.9 yrs | |||||||||
| Number of industries(5) | 43 | 40 | 38 | |||||||||
| Non-performing or delinquent investments (fair value) | $ | 18.9 | $ | 9.8 | $ | - | ||||||
| Fixed rate debt (% of interest earning portfolio)(3) | $ | 5.5(0.5 | )% | $ | 8.2(1.0 | )% | $ | 16.9(2.5 | )% | |||
| Fixed rate debt (weighted average current coupon)(3) | 15.0 | % | 12.2 | % | 10.0 | % | ||||||
| Floating rate debt (% of interest earning portfolio)(3) | $ | 997.9(99.5 | )% | $ | 817.1(99.0 | )% | $ | 671.2(97.5 | )% | |||
| Floating rate debt (weighted average current spread over SOFR)(3)(4) | 7.5 | % | 7.0 | % | 7.1 | % | ||||||
| (1) | Excludes our investment in the subordinated notes of Saratoga CLO. |
| (2) | At February |
| (3) | Excludes our investment in the subordinated notes of Saratoga CLO and equity interests, as well as the unsecured notes and equity interests in |
| (4) | Calculation uses either 1-month or 3-month |
| (5) | Our investment in the subordinated notes of Saratoga CLO and Class F-R-3 Note tranche, as well as the unsecured notes and equity interests in the SLF JV and the Class E note tranche of the SLF 2022 are included in Structured Finance Securities industry. |
During the fiscal year ended February 29, 2024, we invested $246.1 million in new and existing portfolio companies and had $30.3 million in aggregate amount of exits and repayments resulting in net investments of $215.8 million for the year.
During the fiscal year ended February 28, 2023, we invested $385.1 million in new and existing portfolio companies and had $222.2 million in aggregate amount of exits and repayments resulting in net investments of $162.9 million for the year.
During the fiscal year ended February 28, 2022, we invested $458.1 million in new orand existing portfolio companies and had
$226.9 $226.9 million in aggregate amount of exits and repayments resulting in net investments of $231.1 million for the year.
During the fiscal year ended February 28, 2021, we invested $202.3 million in new or existing portfolio companies and had
$130.3 million in aggregate amount of exits and repayments resulting in net investments of $72.0 million for the year.
During the fiscal year ended February 29, 2020, we invested $204.6 million in new or existing portfolio companies and had $167.3 million in aggregate amount of exits and repayments resulting in net investments of $37.3 million for the year.
Portfolio Composition
Our portfolio composition at February 28, 2022,29, 2024, February 28, 20212023 and February 29, 202028, 2022 at fair value was as follows:
| February 28, 2022 | February 28, 2021 | February 29, 2020 | ||||||||||||||||||||||
| Percentage of Total Portfolio | Weighted Average Current Yield | Percentage of Total Portfolio | Weighted Average Current Yield | Percentage of Total Portfolio | Weighted Average Current Yield | |||||||||||||||||||
| First lien term loans | 77.3 | % | 8.3 | % | 79.5 | % | 9.5 | % | 71.3 | % | 9.6 | % | ||||||||||||
| Second lien term loans | 5.4 | 11.1 | 4.4 | 12.3 | 15.1 | 10.7 | ||||||||||||||||||
| Unsecured loans | 1.9 | 9.7 | 0.4 | - | 0.9 | 9.3 | ||||||||||||||||||
| Structured finance securities | 4.7 | 10.5 | 9.0 | 11.6 | 6.7 | 11.4 | ||||||||||||||||||
| Equity interests | 10.7 | - | 6.7 | - | 6.0 | - | ||||||||||||||||||
| Total | 100.0 | % | 7.7 | % | 100.0 | % | 9.1 | % | 100.0 | % | 9.3 | % | ||||||||||||
| February 29, 2024 | February 28, 2023 | February 28, 2022 | ||||||||||||||||||||||
| Percentage of Total Portfolio | Weighted Average Current Yield | Percentage of Total Portfolio | Weighted Average Current Yield | Percentage of Total Portfolio | Weighted Average Current Yield | |||||||||||||||||||
| First lien term loans | 85.7 | % | 12.6 | % | 82.1 | % | 12.3 | % | 77.3 | % | 8.3 | % | ||||||||||||
| Second lien term loans | 1.6 | 5.1 | 1.5 | 5.3 | 5.4 | 11.1 | ||||||||||||||||||
| Unsecured loans | 1.4 | 11.1 | 2.1 | 9.8 | 1.9 | 9.7 | ||||||||||||||||||
| Structured finance securities | 2.7 | 10.3 | 4.3 | 7.4 | 4.7 | 10.5 | ||||||||||||||||||
| Equity interests | 8.6 | - | 10.0 | - | 10.7 | - | ||||||||||||||||||
| Total | 100.0 | % | 11.4 | % | 100.0 | % | 10.7 | % | 100.0 | % | 7.7 | % | ||||||||||||
At February 28, 2022,29, 2024, our investment in the subordinated notes of Saratoga CLO, a collateralized loan obligation fund, had a fair value of $28.7$9.5 million and constituted 3.5%0.8% of our portfolio. This investment constitutes a first loss position in a portfolio that, as of February 28, 202229, 2024 and February 28, 2021,2023, was composed of $660.2$640.8 million and $603.7$658.0 million, respectively, in aggregate principal amount of primarily senior secured first lien term loans. In addition, as of February 28, 2022,29, 2024, we also own $9.4 million in aggregate principal of the F-2-R-3 Notes in the Saratoga CLO, thatwhich only rank senior to the subordinated notes.
This investment is subject to unique risks. (See “Part 1. Item 1A. Risk Factors—Our investment in Saratoga CLO constitutes a leveraged investment in a portfolio of subordinated notes representing the lowest-rated securities issued by a pool of predominantly senior secured first lien term loans and is subject to additional risks and volatility”volatility. All losses in the pool of loans will be borne by our subordinated notes and only after the value of our subordinated notes is reduced to zero will the higher-rated notes issued by the pool bear any losses”). We do not consolidate the Saratoga CLO portfolio in our consolidated financial statements. Accordingly, the metrics below do not include the underlying Saratoga CLO portfolio investments. However, at February 28, 2022, $630.329, 2024, $603.0 million or 98.7%99.2% of the Saratoga CLO portfolio investments in terms of market value had a CMR (as defined below)color rating of green or yellow and two of the Saratoga CLO portfolio investments were in default with a fair value of $0.3 million. At February 28, 2023, $544.4 million or 89.8% of the Saratoga CLO portfolio investments in terms of market value had a CMR color rating of green or yellow and two Saratoga CLO portfolio investments were in default with a fair value of $2.8 million. At February 28, 2021, $584.6 million or 98.7% of the Saratoga CLO portfolio investments in terms of market value had a CMR (as defined below) color rating of green or yellow and four Saratoga CLO portfolio investment were in default with a fair value of $0.8 million. For more information relating to Saratoga CLO, see the audited financial statements for Saratoga CLO included elsewhere herein.
Saratoga Investment Advisors normally grades all of our investments using a credit and monitoring rating system (“CMR”). The CMR consists of a single component: a color rating. The color rating is based on several criteria, including financial and operating strength, probability of default, and restructuring risk. The color ratings are characterized as follows: (Green)—performing credit; (Yellow)—underperforming credit; (Red)—in principal payment default and/or expected loss of principal.
Portfolio CMR distribution
The CMR distribution of our investments at February 28, 202229, 2024 and February 28, 20212023 was as follows:
Saratoga Investment Corp.
| February 28, 2022 | February 28, 2021 | |||||||||||||||
| Investments | Percentage | Investments | Percentage | |||||||||||||
| at | of Total | at | of Total | |||||||||||||
| Color Score | Fair Value | Portfolio | Fair Value | Portfolio | ||||||||||||
| ($ in thousands) | ||||||||||||||||
| Green | $ | 690,672 | 84.5 | % | $ | 453,297 | 81.8 | % | ||||||||
| Yellow | 10,593 | 1.3 | 32,559 | 5.9 | ||||||||||||
| Red | - | 0.0 | - | 0.0 | ||||||||||||
| N/A(1) | 116,302 | 14.2 | 68,457 | 12.3 | ||||||||||||
| Total | $ | 817,567 | 100.0 | % | $ | 554,313 | 100.0 | % | ||||||||
| February 29, 2024 | February 28, 2023 | |||||||||||||||
| Color Score | Investments at Fair Value | Percentage of Total Portfolio | Investments at Fair Value | Percentage of Total Portfolio | ||||||||||||
| ($ in thousands) | ||||||||||||||||
| Green | $ | 1,000,298 | 87.8 | % | $ | 808,791 | 83.2 | % | ||||||||
| Yellow | 12,643 | 1.1 | 34,172 | 3.5 | ||||||||||||
| Red | 6,273 | 0.6 | - | 0.0 | ||||||||||||
| N/A(1) | 119,580 | 10.5 | 129,627 | 13.3 | ||||||||||||
| Total | $ | 1,138,794 | 100.0 | % | $ | 972,590 | 100.0 | % | ||||||||
| (1) | Comprised of our investment in the subordinated notes of Saratoga CLO and equity interests. |
The change in reserve from $1.2$2.2 million as of February 28, 20212023 to $0.0$9.5 million as of February 28, 202229, 2024 was primarily related to the write-offnon-accrual of the interest accrualsincome related to My Alarm Center, LLC, that we deemed non-recoverable, as well as the release of the reserve for our Taco Mac investment that has gone back on accrual. As of February 28, 2022, there are no non-accrual investments.investments in Knowland Group, Pepper Palace and Zollege.
The CMR distribution of Saratoga CLO investments at February 28, 202229, 2024 and February 29, 202128, 2023 was as follows:
Saratoga CLO
| February 28, 2022 | February 28, 2021 | |||||||||||||||
| Color Score | Investments at Fair Value | Percentage of Total Portfolio | Investments at Fair Value | Percentage of Total Portfolio | ||||||||||||
| ($ in thousands) | ||||||||||||||||
| Green | $ | 595,324 | 93.2 | % | $ | 514,183 | 86.8 | % | ||||||||
| Yellow | 34,983 | 5.5 | 70,415 | 11.9 | ||||||||||||
| Red | 8,622 | 1.3 | 6,921 | 1.2 | ||||||||||||
| N/A(1) | 34 | 0.0 | 501 | 0.1 | ||||||||||||
| Total | $ | 638,963 | 100.0 | % | $ | 592,020 | 100.0 | % | ||||||||
| February 29, 2024 | February 28, 2023 | |||||||||||||||
| Color Score | Investments at Fair Value | Percentage of Total Portfolio | Investments at Fair Value | Percentage of Total Portfolio | ||||||||||||
| ($ in thousands) | ||||||||||||||||
| Green | $ | 560,384 | 92.2 | % | $ | 544,424 | 89.9 | % | ||||||||
| Yellow | 42,580 | 7.0 | 40,812 | 6.7 | ||||||||||||
| Red | 3,568 | 0.6 | 20,718 | 3.4 | ||||||||||||
| N/A(1) | 1,020 | 0.2 | 0 | 0.0 | ||||||||||||
| Total | $ | 607,552 | 100.0 | % | $ | 605,954 | 100.0 | % | ||||||||
| (1) | Comprised of Saratoga CLO’s equity interests. |
Portfolio composition by industry grouping at fair value
The following table shows our portfolio composition by industry grouping at fair value at February 28, 202229, 2024 and February 28, 2021:2023:
Saratoga Investment Corp.
| February 28, 2022 | February 28, 2021 | |||||||||||||||
| Investments At Fair Value | Percentage of Total Portfolio | Investments At Fair Value | Percentage of Total Portfolio | |||||||||||||
| ($ in thousands) | ||||||||||||||||
| Healthcare Software | $ | 90,126 | 11.0 | % | $ | 28,972 | 5.2 | % | ||||||||
| IT Services | 80,804 | 9.9 | 73,087 | 13.2 | ||||||||||||
| Structured Finance Securities(1) | 38,030 | 4.7 | 49,779 | 9.0 | ||||||||||||
| Real Estate Services | 53,506 | 6.6 | 18,032 | 3.3 | ||||||||||||
| Healthcare Services | 42,054 | 5.1 | 42,410 | 7.7 | ||||||||||||
| Consumer Services | 38,234 | 4.7 | 181 | 0.0 | ||||||||||||
| Education Services | 35,309 | 4.3 | 40,384 | 7.1 | ||||||||||||
| Dental Practice Management Software | 35,038 | 4.3 | 23,659 | 4.3 | ||||||||||||
| Specialty Food Retailer | 34,013 | 4.2 | - | 0.0 | ||||||||||||
| Education Software | 33,656 | 4.1 | 88,090 | 15.9 | ||||||||||||
| HVAC Services and Sales | 29,976 | 3.7 | 14,894 | 2.7 | ||||||||||||
| Marketing Orchestration Software | 28,777 | 3.5 | - | 0.0 | ||||||||||||
| Sports Management | 26,654 | 3.3 | 25,469 | 4.6 | ||||||||||||
| Investment Fund | 25,140 | 3.1 | - | 0.0 | ||||||||||||
| Financial Services | 23,540 | 2.9 | 419 | 0.1 | ||||||||||||
| Hospitality/Hotel | 19,925 | 2.4 | 17,080 | 3.1 | ||||||||||||
| Talent Acquisition Software | 19,652 | 2.4 | - | 0.0 | ||||||||||||
| Mentoring Software | 18,321 | 2.2 | - | 0.0 | ||||||||||||
| Marketing Services | 17,327 | 2.1 | 17,372 | 3.1 | ||||||||||||
| Payroll Services | 17,000 | 2.1 | 18,333 | 3.3 | ||||||||||||
| Restaurant | 15,686 | 1.9 | 2,141 | 0.4 | ||||||||||||
| Insurance Software | 10,921 | 1.3 | - | 0.0 | ||||||||||||
| Non-profit Services | 10,039 | 1.2 | 5,554 | 1.0 | ||||||||||||
| Employee Collaboration Software | 10,000 | 1.2 | - | 0.0 | ||||||||||||
| Waste Services | 9,000 | 1.1 | 9,000 | 1.6 | ||||||||||||
| Industrial Products | 8,427 | 1.0 | 9,047 | 1.6 | ||||||||||||
| Dental Practice Management | 8,403 | 1.0 | 7,133 | 1.3 | ||||||||||||
| Legal Software | 7,425 | 0.9 | - | 0.0 | ||||||||||||
| Field Service Management | 6,981 | 0.9 | 4,018 | 0.7 | ||||||||||||
| Financial Services Software | 5,940 | 0.7 | - | 0.0 | ||||||||||||
| Healthcare Supply | 5,194 | 0.6 | 5,422 | 1.0 | ||||||||||||
| Office Supplies | 3,726 | 0.5 | 3,610 | 0.7 | ||||||||||||
| Corporate Education Software | 3,306 | 0.4 | 1,050 | 0.2 | ||||||||||||
| Staffing Services | 1,912 | 0.2 | 925 | 0.2 | ||||||||||||
| Cyber Security | 1,636 | 0.2 | 13,174 | 2.4 | ||||||||||||
| Healthcare Products Manufacturing | 714 | 0.1 | 567 | 0.1 | ||||||||||||
| Consumer Products | 693 | 0.1 | 475 | 0.1 | ||||||||||||
| Facilities Maintenance | 482 | 0.1 | 6,193 | 1.1 | ||||||||||||
| Corporate Governance | - | 0.0 | 13,265 | 2.4 | ||||||||||||
| Property Management | - | 0.0 | 14,578 | 2.6 | ||||||||||||
| Total | $ | 817,567 | 100.0 | % | $ | 554,313 | 100.0 | % | ||||||||
| February 29, 2024 | February 28, 2023 | |||||||||||||||
| Investments At Fair Value | Percentage of Total Portfolio | Investments At Fair Value | Percentage of Total Portfolio | |||||||||||||
| ($ in thousands) | ||||||||||||||||
| Healthcare Software | $ | 120,500 | 10.8 | % | $ | 119,124 | 12.2 | % | ||||||||
| IT Services | 78,422 | 6.9 | 87,167 | 9.0 | ||||||||||||
| Consumer Services | 64,689 | 5.7 | 63,642 | 6.6 | ||||||||||||
| HVAC Services and Sales | 59,208 | 5.2 | 54,450 | 5.6 | ||||||||||||
| Real Estate Services | 52,350 | 4.6 | 53,406 | 5.5 | ||||||||||||
| Healthcare Services | 51,094 | 4.5 | 26,286 | 2.7 | ||||||||||||
| Education Software | 45,579 | 4.0 | 44,955 | 4.6 | ||||||||||||
| Hospitality/Hotel | 41,447 | 3.6 | 37,972 | 3.9 | ||||||||||||
| Dental Practice Management | 40,235 | 3.5 | 1,000 | 0.1 | ||||||||||||
| Mental Healthcare Services | 37,377 | 3.3 | 16,922 | 1.7 | ||||||||||||
| Health/Fitness Franchisor | 32,032 | 2.8 | - | 0.0 | ||||||||||||
| Structured Finance Securities(1) | 30,626 | 2.7 | 41,363 | 4.4 | ||||||||||||
| Sports Management | 27,000 | 2.4 | 26,711 | 2.7 | ||||||||||||
| Talent Acquisition Software | 26,896 | 2.4 | 25,999 | 2.7 | ||||||||||||
| Financial Services | 26,276 | 2.3 | 26,218 | 2.7 | ||||||||||||
| Research Software | 26,255 | 2.3 | 10,677 | 1.1 | ||||||||||||
| Education Services | 25,819 | 2.3 | 34,489 | 3.5 | ||||||||||||
| Architecture & Engineering Software | 25,247 | 2.2 | - | 0.0 | ||||||||||||
| Investment Fund | 25,222 | 2.2 | 30,726 | 3.2 | ||||||||||||
| Association Management Software | 24,089 | 2.1 | - | 0.0 | ||||||||||||
| Direct Selling Software | 24,073 | 2.1 | 25,771 | 2.7 | ||||||||||||
| Restaurant | 22,580 | 2.0 | 24,826 | 2.6 | ||||||||||||
| Mentoring Software | 22,069 | 1.9 | 21,359 | 2.2 | ||||||||||||
| Legal Software | 20,709 | 1.8 | 20,699 | 2.1 | ||||||||||||
| Insurance Software | 19,821 | 1.7 | 16,761 | 1.7 | ||||||||||||
| Roofing Contractor Software | 19,014 | 1.7 | - | 0.0 | ||||||||||||
| Marketing Orchestration Software | 18,420 | 1.6 | 18,715 | 1.9 | ||||||||||||
| Corporate Education Software | 18,026 | 1.6 | 15,254 | 1.6 | ||||||||||||
| Non-profit Services | 16,267 | 1.4 | 13,095 | 1.3 | ||||||||||||
| Employee Collaboration Software | 14,150 | 1.2 | 13,052 | 1.3 | ||||||||||||
| Lead Management Software | 12,120 | 1.1 | 12,090 | 1.2 | ||||||||||||
| Alternative Investment Management Software | 10,779 | 0.9 | 10,459 | 1.1 | ||||||||||||
| Field Service Management | 10,708 | 0.9 | 9,958 | 1.0 | ||||||||||||
| Financial Services Software | 9,916 | 0.9 | 9,096 | 0.9 | ||||||||||||
| Fire Inspection Business Software | 9,916 | 0.9 | - | 0.0 | ||||||||||||
| Industrial Products | 9,095 | 0.8 | 9,608 | 1.0 | ||||||||||||
| Office Supplies | 7,181 | 0.6 | 6,373 | 0.7 | ||||||||||||
| Veterinary Services | 4,753 | 0.4 | - | 0.0 | ||||||||||||
| Staffing Services | 3,288 | 0.3 | 2,079 | 0.2 | ||||||||||||
| Cyber Security | 2,826 | 0.2 | 2,509 | 0.3 | ||||||||||||
| Specialty Food Retailer | 2,489 | 0.2 | - | 0.0 | ||||||||||||
| Facilities Maintenance | 231 | 0.0 | 408 | 0.0 | ||||||||||||
| Specialty Food Retailer | - | 0.0 | 24,411 | 2.5 | ||||||||||||
| Dental Practice Management | - | 0.0 | 11,151 | 1.1 | ||||||||||||
| Corporate Education Software | - | 0.0 | 3,809 | 0.4 | ||||||||||||
| Healthcare Supply | - | 0.0 | - | 0.0 | ||||||||||||
| Total | $ | 1,138,794 | 100.0 | % | $ | 972,590 | 100.0 | % | ||||||||
| (1) | As of February |
The following table shows Saratoga CLO’s portfolio composition by industry grouping at fair value at February 28, 202229, 2024 and February 28, 2021:2023:
Saratoga CLO
| February 28, 2022 | February 28, 2021 | |||||||||||||||
| Investments at Fair Value | Percentage of Total Portfolio | Investments at Fair Value | Percentage of Total Portfolio | |||||||||||||
| ($ in thousands) | ||||||||||||||||
| Banking, Finance, Insurance & Real Estate | $ | 123,124 | 19.4 | % | $ | 105,326 | 17.9 | % | ||||||||
| Services: Business | 69,491 | 10.9 | 55,588 | 9.4 | ||||||||||||
| High Tech Industries | 60,048 | 9.4 | 50,106 | 8.5 | ||||||||||||
| Healthcare & Pharmaceuticals | 43,136 | 6.9 | 46,689 | 7.9 | ||||||||||||
| Services: Consumer | 41,393 | 6.5 | 31,604 | 5.4 | ||||||||||||
| Telecommunications | 27,058 | 4.2 | 29,878 | 5.1 | ||||||||||||
| Automotive | 24,207 | 3.7 | 19,159 | 3.2 | ||||||||||||
| Chemicals, Plastics, & Rubber | 22,669 | 3.5 | 23,302 | 3.9 | ||||||||||||
| Beverage, Food & Tobacco | 22,086 | 3.4 | 17,998 | 3.1 | ||||||||||||
| Consumer goods: Durable | 21,085 | 3.2 | 13,143 | 2.1 | ||||||||||||
| Media: Advertising, Printing & Publishing | 19,660 | 3.1 | 19,826 | 3.3 | ||||||||||||
| Hotel, Gaming & Leisure | 16,572 | 2.6 | 20,515 | 3.4 | ||||||||||||
| Retail | 16,050 | 2.5 | 12,880 | 2.1 | ||||||||||||
| Containers, Packaging & Glass | 15,253 | 2.4 | 18,822 | 3.2 | ||||||||||||
| Aerospace & Defense | 14,369 | 2.2 | 25,952 | 4.4 | ||||||||||||
| Consumer goods: Non-durable | 14,359 | 2.2 | 19,343 | 3.3 | ||||||||||||
| Media: Broadcasting & Subscription | 11,539 | 1.8 | 9,426 | 1.6 | ||||||||||||
| Construction & Building | 11,102 | 1.7 | 5,362 | 0.9 | ||||||||||||
| Capital Equipment | 10,062 | 1.6 | 9,961 | 1.7 | ||||||||||||
| Forest Products & Paper | 9,367 | 1.5 | 6,954 | 1.2 | ||||||||||||
| Media: Diversified & Production | 9,203 | 1.4 | 6,035 | 1.0 | ||||||||||||
| Utilities: Oil & Gas | 8,095 | 1.3 | 8,235 | 1.3 | ||||||||||||
| Metals & Mining | 6,846 | 1.1 | 6,127 | 1.0 | ||||||||||||
| Transportation: Consumer | 4,891 | 0.8 | 6,183 | 1.0 | ||||||||||||
| Wholesale | 4,155 | 0.7 | 5,841 | 1.0 | ||||||||||||
| Utilities: Electric | 4,026 | 0.6 | 4,209 | 0.7 | ||||||||||||
| Transportation: Cargo | 3,752 | 0.6 | 5,812 | 1.0 | ||||||||||||
| Energy: Electricity | 3,660 | 0.6 | 4,547 | 0.8 | ||||||||||||
| Environmental Industries | 1,550 | 0.2 | 989 | 0.2 | ||||||||||||
| Energy: Oil & Gas | 155 | 0.0 | 2,208 | 0.4 | ||||||||||||
| Total | $ | 638,963 | 100.0 | % | $ | 592,020 | 100.0 | % | ||||||||
| February 29, 2024 | February 28, 2023 | |||||||||||||||
| Investments at Fair Value | Percentage of Total Portfolio | Investments at Fair Value | Percentage of Total Portfolio | |||||||||||||
| ($ in thousands) | ||||||||||||||||
| Banking, Finance, Insurance & Real Estate | $ | 116,253 | 19.0 | % | $ | 114,570 | 18.9 | % | ||||||||
| Services: Business | 65,524 | 10.8 | 65,947 | 10.9 | ||||||||||||
| High Tech Industries | 50,996 | 8.4 | 52,636 | 8.7 | ||||||||||||
| Healthcare & Pharmaceuticals | 40,453 | 6.7 | 38,952 | 6.4 | ||||||||||||
| Services: Consumer | 30,433 | 5.0 | 34,544 | 5.7 | ||||||||||||
| Chemicals, Plastics, & Rubber | 30,219 | 5.0 | 23,857 | 3.9 | ||||||||||||
| Retail | 26,339 | 4.3 | 24,049 | 4.0 | ||||||||||||
| Telecommunications | 22,718 | 3.7 | 22,514 | 3.7 | ||||||||||||
| Media: Advertising, Printing & Publishing | 20,265 | 3.3 | 20,309 | 3.4 | ||||||||||||
| Hotel, Gaming & Leisure | 20,217 | 3.3 | 14,315 | 2.4 | ||||||||||||
| Automotive | 20,007 | 3.3 | 20,410 | 3.4 | ||||||||||||
| Consumer goods: Durable | 17,555 | 2.9 | 24,887 | 4.1 | ||||||||||||
| Containers, Packaging & Glass | 17,138 | 2.8 | 18,239 | 3.0 | ||||||||||||
| Construction & Building | 16,663 | 2.7 | 13,875 | 2.3 | ||||||||||||
| Beverage, Food & Tobacco | 13,150 | 2.2 | 14,501 | 2.4 | ||||||||||||
| Aerospace & Defense | 13,068 | 2.2 | 13,688 | 2.3 | ||||||||||||
| Media: Broadcasting & Subscription | 10,778 | 1.8 | 11,143 | 1.8 | ||||||||||||
| Consumer goods: Non-durable | 10,698 | 1.8 | 13,734 | 2.3 | ||||||||||||
| Media: Diversified & Production | 10,390 | 1.7 | 9,279 | 1.5 | ||||||||||||
| Transportation: Cargo | 8,890 | 1.5 | 8,236 | 1.4 | ||||||||||||
| Utilities: Oil & Gas | 8,046 | 1.3 | 7,246 | 1.2 | ||||||||||||
| Wholesale | 7,255 | 1.2 | 8,011 | 1.3 | ||||||||||||
| Capital Equipment | 5,694 | 0.9 | 8,450 | 1.4 | ||||||||||||
| Transportation: Consumer | 4,720 | 0.8 | 6,844 | 1.1 | ||||||||||||
| Metals & Mining | 4,256 | 0.7 | 3,239 | 0.5 | ||||||||||||
| Energy: Oil & Gas | 4,024 | 0.7 | 2,676 | 0.4 | ||||||||||||
| Forest Products & Paper | 3,592 | 0.6 | 3,190 | 0.5 | ||||||||||||
| Environmental Industries | 3,120 | 0.5 | 2,155 | 0.4 | ||||||||||||
| Energy: Electricity | 2,855 | 0.5 | 2,105 | 0.3 | ||||||||||||
| Utilities: Electric | 2,234 | 0.4 | 2,353 | 0.4 | ||||||||||||
| Total | $ | 607,550 | 100.0 | % | $ | 605,954 | 100.0 | % | ||||||||
Portfolio composition by geographic location at fair value
The following table shows our portfolio composition by geographic location at fair value at February 28, 202229, 2024 and February 28, 2021.2023. The geographic composition is determined by the location of the corporate headquarters of the portfolio company.
| February 28, 2022 | February 28, 2021 | |||||||||||||||
| Investments at Fair Value | Percentage of Total Portfolio | Investments at Fair Value | Percentage of Total Portfolio | |||||||||||||
| ($ in thousands) | ||||||||||||||||
| Southeast | $ | 257,199 | 31.5 | % | $ | 167,397 | 30.2 | % | ||||||||
| West | 183,643 | 22.5 | 145,907 | 26.3 | ||||||||||||
| Midwest | 160,718 | 19.7 | 110,125 | 19.9 | ||||||||||||
| Northeast | 85,414 | 10.4 | 7,314 | 1.3 | ||||||||||||
| Southwest | 62,475 | 7.6 | 39,334 | 7.1 | ||||||||||||
| Northwest | 1,636 | 0.2 | 13,174 | 2.4 | ||||||||||||
| Other(1) | 66,482 | 8.1 | 71,062 | 12.8 | ||||||||||||
| Total | $ | 817,567 | 100.0 | % | $ | 554,313 | 100.0 | % | ||||||||
| February 29, 2024 | February 28, 2023 | |||||||||||||||
| Investments at Fair Value | Percentage of Total Portfolio | Investments at Fair Value | Percentage of Total Portfolio | |||||||||||||
| ($ in thousands) | ||||||||||||||||
| Southeast | $ | 308,590 | 27.1 | % | $ | 247,192 | 25.4 | % | ||||||||
| Midwest | 264,966 | 23.3 | 199,944 | 20.6 | ||||||||||||
| West | 233,791 | 20.5 | 173,283 | 17.8 | ||||||||||||
| Northeast | 144,562 | 12.7 | 133,158 | 13.7 | ||||||||||||
| Southwest | 111,911 | 9.8 | 123,744 | 12.7 | ||||||||||||
| Other(1) | 74,974 | 6.6 | 92,760 | 9.5 | ||||||||||||
| Northwest | - | - | 2,509 | 0.3 | ||||||||||||
| Total | $ | 1,138,794 | 100.0 | % | $ | 972,590 | 100.0 | % | ||||||||
| (1) | As of February |
Results of operations
Operating results for the fiscal years ended February 28, 2022,29, 2024, February 28, 20212023 and February 29, 202028, 2022 were as follows:
| For the Year Ended | ||||||||||||
| February 28, 2022 | February 28, 2021 | February 29, 2020 | ||||||||||
| ($ in thousands) | ||||||||||||
| Total investment income | $ | 70,740 | $ | 57,650 | $ | 58,448 | ||||||
| Total operating expenses | 50,797 | 34,537 | 43,587 | |||||||||
| Net investment income | 19,943 | 23,113 | 14,861 | |||||||||
| Net realized gains (losses) from investments | 13,398 | (8,704 | ) | 42,877 | ||||||||
| Income tax (provision) benefit from realized gain on investments | (2,886 | ) | (3,895 | ) | ||||||||
| Net change in unrealized appreciation (depreciation) on investments | 17,020 | 4,966 | (771 | ) | ||||||||
| Net change in provision for deferred taxes on unrealized (appreciation) depreciation on investments | 695 | (574 | ) | 355 | ||||||||
| Loss on extinguishment of debt* | (2,434 | ) | (129 | ) | (1,583 | ) | ||||||
| Net increase in net assets resulting from operations | $ | 45,735 | $ | 14,777 | $ | 55,739 | ||||||
| For the Year Ended | ||||||||||||
| February 29, 2024 | February 28, 2023 | February 28, 2022 | ||||||||||
| ($ in thousands) | ||||||||||||
| Total investment income | $ | 143,720 | $ | 99,104 | $ | 70,740 | ||||||
| Total operating expenses | 86,846 | 63,903 | 50,797 | |||||||||
| Net investment income | 56,874 | 35,201 | 19,943 | |||||||||
| Net realized gains (losses) from investments | 154 | 7,446 | 13,398 | |||||||||
| Income tax (provision) benefit from realized gain on investments | - | 549 | (2,886 | ) | ||||||||
| Net change in unrealized appreciation (depreciation) on investments | (47,091 | ) | (15,218 | ) | 17,020 | |||||||
| Net change in provision for deferred taxes on unrealized (appreciation) depreciation on investments | (893 | ) | (1,715 | ) | 695 | |||||||
| Loss on extinguishment of debt* | (110 | ) | (1,587 | ) | (2,434 | ) | ||||||
| Net increase in net assets resulting from operations | $ | 8,934 | $ | 24,676 | $ | 45,735 | ||||||
| * | Certain prior period amounts have been reclassified to conform to current period presentation. |
Investment income
The composition of our investment income for the fiscal years ended February 28, 2022,29, 2024, February 28, 20212023 and February 29,202028, 2022 were as follows:
| For the Year Ended | ||||||||||||
| February 28, 2022 | February 28, 2021 | February 29, 2020 | ||||||||||
| ($ in thousands) | ||||||||||||
| Interest from investments | $ | 58,502 | $ | 51,714 | $ | 48,047 | ||||||
| Interest from cash and cash equivalents | 4 | 14 | 536 | |||||||||
| Management fee income | 3,263 | 2,508 | 2,504 | |||||||||
| Incentive fee income | - | - | - | |||||||||
| Dividend Income* | 1,926 | 158 | 216 | |||||||||
| Structuring and advisory fee income | 4,308 | 2,157 | 5,286 | |||||||||
| Other income* | 2,739 | 1,099 | 1,859 | |||||||||
| Total investment income | $ | 70,740 | $ | 57,650 | $ | 58,448 | ||||||
| For the Year Ended | ||||||||||||
| February 29, 2024 | February 28, 2023 | February 28, 2022 | ||||||||||
| ($ in thousands) | ||||||||||||
| Interest from investments | $ | 127,785 | $ | 85,217 | $ | 58,502 | ||||||
| Interest from cash and cash equivalents | 2,512 | 1,368 | 4 | |||||||||
| Management fee income | 3,270 | 3,270 | 3,263 | |||||||||
| Incentive fee income | - | - | - | |||||||||
| Dividend Income* | 6,533 | 2,720 | 1,926 | |||||||||
| Structuring and advisory fee income | 2,150 | 3,585 | 4,308 | |||||||||
| Other income* | 1,470 | 2,944 | 2,739 | |||||||||
| Total investment income | $ | 143,720 | $ | 99,104 | $ | 70,740 | ||||||
| * | Certain prior period amounts have been reclassified to conform to current period presentation. |
For the fiscal year ended February 28, 2022,29, 2024, total investment income increased $13.1$44.6 million, or 22.7%45.0%, to $70.7$143.7 million for the fiscal year ended February 29, 2024 compared to $99.1 million for the fiscal year ended February 28, 2022 compared2023. Interest income from investments increased $42.6 million, or 50.0%, to $57.7$127.8 million for the year ended February 29, 2024 from $85.2 million for the fiscal year ended February 28, 2021. Interest2023. The increase in interest income from investments increased $6.8 million, or 13.1%, to $58.5 million for the fiscal year ended February 29, 2024 is primarily attributable to an increase of 17.1% in total investments to $1,138.8 million from $972.6 million in the prior period, as well as the increase in the weighted average current yield on investments of 11.4% compared to 10.7% in the prior period.
For the fiscal year ended February 28, 2022 from $51.72023, total investment income increased $28.4 million, or 40.1%, to $99.1 million for the fiscal year ended February 28, 2021. This reflects2023 compared to $13.1 million for the fiscal year ended February 28, 2022. Interest income from investments increased $26.7 million, or 45.7%, to $85.2 million for the year ended February 28, 2023 from $58.5 million for the fiscal year ended February 28, 2022. The increase in interest income for the fiscal year ended February 28, 2023 is primarily attributable to an increase of 47.5%19.0% in total investments to $972.6 million from $817.6 million at February 28, 2022 from $554.3 million at February 28, 2021, offset by (i)in the reduction in LIBOR and interest spreads during the sameprior period, and (ii)as well as the increase in equity positions that are not interest-bearing. At February 28, 2022, the weighted average current yield on investments was 7.7%of 10.7% compared to 9.1% at7.7% in the prior period.
For the fiscal year ended February 29, 2024 and February 28, 2021, which offset some2023, total PIK income was $2.5 million and $1.2 million, respectively. This increase was due to investment growth and amended terms of the impactdebt securities that elected to pay a portion of the increased investments.their interest in PIK.
For the fiscal year ended February 28, 2021, total investment income decreased $0.8 million, or 1.4% compared to the fiscal year ended February 29, 2020. Interest income from investments increased $3.7 million, or 7.7%, to $51.7 million for the year ended February 28, 2021 from $48.0 million for the fiscal year ended February 29, 2020. This reflects an increase of 14.1% in total investments to $554.3 million at February 28, 2021 from $485.6 million at February 29, 2020. At February 28, 2021, the weighted average current yield on investments was 9.1% compared to 9.3% at February 29, 2020, which offset some of the interest income increase.
For the fiscal year ended February 28, 20222023 and February 28, 2021,2022, total PIK income was $1.5$1.2 million and $2.6$1.5 million, respectively. This decrease was primarily due to the repayment of debt securities whichthat elected to pay a portion of their interest in PIKPIK.
Management fee income reflects the fee income received for managing the Saratoga CLO. For the years ended February 29, 2024, 2023 and the change in PIK interest of investments that were restored from non-accrual to accrual status over the past two years.2022, total management fee income was $3.3 million, $3.3 million and $3.3 million, respectively.
For the fiscal year ended February 29, 2024, February 28, 20212023 and February 29, 2020, total PIK income was $2.6 million and $4.5 million, respectively. This decrease was primarily due to our sale in Easy Ice, LLC, which primarily generated PIK interest income. The Company sold its interest in Easy Ice, LLC during the end of the year ended February 29, 2020.
For the fiscal year ended February 28, 2022, February 28, 2021 and February 29, 2020, total dividend income was $1.9$6.5 million, $0.1$2.7 million and $0.2$1.9 million, respectively. Dividends received is recorded in the consolidated statements of operations when earned, and the increase primarily reflects $5.9 million of dividend income received on various preferred equity investments.the SLF JV.
For the fiscal year ended February 28, 2022,29, 2024, February 28, 20212023 and February 29, 2020,28, 2022, total structuring and advisory fee income was $4.3$2.1 million, $2.2$3.6 million and $5.3$4.3 million, respectively. Structuring and advisory fee income represents fee income earned and received performing certain investment and advisory activities during the closing of new investments, with the increasechanges year-over-year primarily reflecting the increased or decreased originations during the period.
For the fiscal year ended February 28, 2022,29, 2024, February 28, 20212023 and February 29, 2020,28, 2022, other income was $2.7$1.5 million, $1.1$2.9 million and $1.9$2.7 million, respectively. Other income primarily includes prepayment, incomeamendment and redemption fees and is recorded in the consolidated statements of operations when earned.
Operating expenses
The composition of our operating expenses for the years ended February 28, 2022,29, 2024, February 28, 20212023 and February 29, 202028, 2022 were as follows:
| For the Year Ended | ||||||||||||
| February 28, 2022 | February 28, 2021 | February 29, 2020 | ||||||||||
| ($ in thousands) | ||||||||||||
| Interest and debt financing expenses | $ | 19,880 | $ | 13,587 | $ | 14,683 | ||||||
| Base management fees | 11,902 | 9,098 | 8,099 | |||||||||
| Incentive management fees | 11,794 | 4,904 | 14,164 | |||||||||
| Professional fees | 1,378 | 1,706 | 1,684 | |||||||||
| Administrator expenses | 2,906 | 2,546 | 2,131 | |||||||||
| Insurance | 349 | 285 | 260 | |||||||||
| Directors fees and expenses | 336 | 290 | 278 | |||||||||
| General and administrative and other expenses | 1,662 | 1,428 | 1,326 | |||||||||
| Income tax benefit | (40 | ) | 1 | 962 | ||||||||
| Excise tax expense (credit) | 630 | 692 | - | |||||||||
| Total operating expenses | $ | 50,797 | $ | 34,537 | $ | 43,587 | ||||||
| For the Year Ended | ||||||||||||
| February 29, 2024 | February 28, 2023 | February 28, 2022 | ||||||||||
| ($ in thousands) | ||||||||||||
| Interest and debt financing expenses | $ | 49,180 | $ | 33,499 | $ | 19,880 | ||||||
| Base management fees | 19,212 | 16,424 | 11,902 | |||||||||
| Incentive management fees | 8,025 | 5,057 | 11,794 | |||||||||
| Professional fees | 1,767 | 1,812 | 1,378 | |||||||||
| Administrator expenses | 3,873 | 3,160 | 2,906 | |||||||||
| Insurance | 322 | 347 | 349 | |||||||||
| Directors fees and expenses | 351 | 360 | 336 | |||||||||
| General and administrative and other expenses | 2,243 | 2,329 | 1,662 | |||||||||
| Income tax expense (benefit) | 43 | (153 | ) | (40 | ) | |||||||
| Excise tax expense (benefit) | 1,830 | 1,068 | 630 | |||||||||
| Total operating expenses | $ | 86,846 | $ | 63,903 | $ | 50,797 | ||||||
For the year ended February 29, 2024, total operating expenses increased $22.9 million, or 35.9%, to $86.8 million compared to $63.9 million for the year ended February 28, 2023. For the year ended February 28, 2022,2023, total operating expenses increased $16.3$13.1 million, or 47.2%25.8%, to $63.9 compared to $50.8 million for the year ended February 28, 20222022.
For the year ended February 29, 2024, interest and debt financing expenses increased $15.7 million, or 46.8% compared to $34.5the year ended February 28, 2023. The increase is attributable to both the total average outstanding debt increasing from $663.0 million for the year ended February 28, 2021. For the year ended February 28, 2021, total operating expenses decreased $9.0 million, or 20.8%,2023 to $34.5 million for the year ended February 28, 2021 compared to $43.6$798.9 million for the year ended February 29, 2020.
For the year ended February 28, 2022, interest and debt financing expenses increased $16.3 million, or 47.2% compared to the year ended February 28, 2021. The increase is primarily attributable to total average outstanding debt increasing from $264.2 million for the year ended February 28, 2021 to $417.4 million for the year ended February 28, 2022. For the year ended February 28, 2022,2024, as well as the weighted average interest rate on our outstanding indebtedness was 4.15% comparedincreasing from 4.48% to 4.46%5.46% for the year ended February 28, 2021.same periods. The decreaseincrease in total average outstanding debt and the weighted average interest rate and increase in average outstanding debt was primarily due to the issuance ofduring the lower-cost 2026 and 2027 Notes and the repaymentyear ended February 29, 2024 of the higher-cost 8.75% 2025 Notes and 8.50% 2028 Notes. At February 29, 2024 and February 28, 2023, the issuance of newlower-cost SBA debentures that carry a lower interest rate. The average outstanding borrowingsrepresented 26.1% and 27.7% of the 2025 Notes decreased $30.7 million from $60.0 foroverall debt, respectively.
For the year ended February 28, 20212023, interest and debt financing expenses increased $13.6 million, or 68.5% compared to $29.6the year ended February 28, 2022. The increase is attributable to both the total average outstanding debt increasing from $417.4 million for the year ended February 28, 2022. At February 28, 2022 and February 28, 2021, the SBA debentures represented 36.2% and 56.2% of overall debt, respectively.
For the years ended February 28, 2021 and February 29, 2020, the decrease in interest and debt financing expenses is primarily attributable to a decrease in total outstanding debt. The decrease is primarily attributable to a decrease in average outstanding debt from $273.8 million for the year ended February 29, 2020 to $264.2$663.0 million for the year ended February 28, 2021. For the year ended February 28, 2021,2023, as well as the weighted average interest rate on our outstanding indebtedness was 4.46% comparedincreasing from 4.15% to the 4.71%4.48% for the year ended February 29, 2020.same periods. The decreaseincrease in total average outstanding debt and the weighted average interest rate was primarily driven bydue to the issuance during the year ended February 28, 2023 of new SBA debentures that carry a lower interest rate.the higher-cost 6.00% 2027 Notes, 7.00% 2025 Notes, 8.00% 2027 Notes and 8.125% 2027 Notes. At February 28, 20212023 and February 29, 2020,28, 2022, the lower-cost SBA debentures represented 56.2%27.7% and 71.4%36.2% of overall
debt, respectively.
For the year ended February 28, 2022,29, 2024, base management fees increased $2.8 million, or 30.8%17.0% compared to the fiscal year ended February 28, 2021.2023. The increase in base management fees results fromis due to the 30.8%17.0% increase in the average value of our total assets, less cash and cash equivalents, from $519.9$938.5 million as of February 28, 20212023 to $680.1$1,097.8 million as of February 28, 2022.29, 2024.
For the year ended February 28, 2021,2023, base management fees increased $1.0$4.5 million, or 12.3%38.0% compared to the fiscal year ended February 29, 2020.28, 2022. The increase in base management fees results fromis due to the 12.3%38.0% increase in the average value of our total assets, less cash and cash equivalents, from $462.8 million as of February 29, 2020 to $519.9$680.1 million as of February 28, 2021.2022 to $938.5 million as of February 28, 2023.
For the year ended February 28, 2022,29, 2024, incentive management fees increased $6.9$3.0 million, or 141.7%58.7% compared to the fiscal year ended February 28, 2021.2023. The first part of the incentive management feesfee on income increased this year from $5.4$6.8 million for the year ended February 28, 20212023 to $13.0 million for the year ended February 29, 2024, reflecting the increased operating performance of our debt investments during this period. The incentive fees on capital gains decreased from ($1.8) million benefit for the fiscal year ended February 28, 2023 to ($8.3) million benefit for the fiscal year ended February 29, 2024, both reflecting the incentive fee income and expense on net unrealized appreciation and depreciation recognized during both these periods.
For the year ended February 28, 2023, incentive fees decreased $6.7 million, or 57.1% compared to the fiscal year ended February 28, 2022. The incentive fee on income increased this year from $6.4 million for the year ended February 28, 2022 to $6.8 million for the year ended February 28, 2023, reflecting the increased operating performance of our debt investments during this period. The incentive management fees related toon capital gains increaseddecreased from $(0.5) million benefit for the fiscal year ended February 28, 2021 to $5.5 million expense for the fiscal year ended February 28, 2022 reflecting the incentive fee expense on net realized gains and net unrealized appreciation this quarter across numerous investments.
For the year ended February 28, 2021, incentive management fees decreased $9.3 million, or 65.4% compared to the fiscal year ended February 29, 2020. The first part of the incentive management fees decreased this year from $5.8 million for the year ended February 29, 2020 to $5.4 million for the year ended February 28, 2021, as higher average net equity during this period resulted in an increase to the net investment income hurdle rate pursuant to the Management Agreement. The incentive management fees related to capital gains decreased from $8.4 million expense for the fiscal year ended February 29, 2020 to $(0.5)($1.7) million benefit for the fiscal year ended February 28, 2021,2023, both reflecting a reversal ofthe incentive fee accrual due to an increase inincome and expense on net unrealized appreciation and depreciation on investmentsrecognized during the year ended February 28, 2021.both these periods.
For the year ended February 28, 2022,29, 2024, professional fees decreased $0.3$0.05 million, or 19.2%2.5% compared to the fiscal year ended February 28, 2021.2023. This decrease primarily reflects the benefit of scale and optimization of costs and vendors across accounting, legal and consulting fees across the Company.
For the year ended February 28, 2023, professional fees increased $0.4 million, or 31.5% compared to the fiscal year ended February 28, 2022. This increase primarily reflects growth across accounting, legal and consulting fees in connection with an increase in our assets and legal entities, as well as the Company bringing certain services in-house.increased rates across vendors in the current inflation environment.
For the year ended February 28, 2021, professional fees increased $0.02 million, or 1.3% compared to the fiscal year ended February 29, 2020. This increase primarily relates to increased legal and accounting fees this year, as investment activities continue to grow.
For the year ended February 28, 2022,2024, administrator expenses increased $0.4$0.7 million, or 14.2%22.5% compared to the fiscal year ended February 28, 2021,2023, which reflects an increase to the cap on the payment or reimbursement of expenses by the Company from
$2.775 $3.275 million last year to $3.0$ 4.3 million, effective August 1, 2021.2023.
For the year ended February 28, 2021,2023, administrator expenses increased $0.4$0.3 million, or 19.5%8.7% compared to the fiscal year ended February 29, 2020,28, 2022, which reflects an increase to the cap on the payment or reimbursement of expenses by the Company from $2.225$3.0 million to $2.7753.275 million, effective August 1, 2020.2022.
For the fiscal years ended February 28, 2022,29, 2024, February 28, 20212023 and February 29, 2020,28, 2022, the average borrowings outstanding under the Credit Facilities was approximately $8.7$37.9 million, $1.8$26.3 million and $0.6$8.7 million, respectively, and the average weighted average interest rate on the outstanding borrowing under the Credit Facilities was 5.22%9.66%, 0.17%6.72% and 6.66%5.22%, respectively.
For the fiscal years ended February 28, 2022,29, 2024, February 28, 20212023 and February 29, 2020,28, 2022, the average borrowings outstanding of SBA debentures was $180.4$202.5 million, $169.3$230.0 million and $150.0$180.4 million, respectively. For the years ended February 28, 2022,29, 2024, February 28, 20212023 and February 29, 2020,28, 2022, the weighted average interest rate on the outstanding borrowings of the SBA debentures was 2.60%3.08%, 3.25%2.78% and 3.23%2.60%, respectively.
During the year ended February 28, 2021, theThe weighted average dollar amount of our 6.25% fixed-rate 2025 Notes outstanding was 60.0 million. On August 31, 2021,unsecured notes for the Company redeemed $60.0 million in aggregate principal amount of issued and outstanding 6.25% 2025 Notes.
During the yearfiscal years ended February 28, 202229, 2024 and February 28, 2021, the average dollar amount of our 7.25% fixed-rate 2025 Notes outstanding was $43.1 million and $43.1 million, respectively.2023 were as follows:
| Fiscal Year Ended | ||||||||
| (in millions) | February 29, 2024 | February 28, 2023 | ||||||
| 7.25% 2025 Notes | $ | - | $ | 13.6 | ||||
| 7.75% 2025 Notes | 5.0 | 5.0 | ||||||
| 6.25% 2027 Notes | 15.0 | 15.0 | ||||||
| 4.375% 2026 Notes | 175.0 | 175.0 | ||||||
| 4.35% 2027 Notes | 75.0 | 75.0 | ||||||
| 6.00% 2027 Notes | 105.5 | 88.2 | ||||||
| 7.00% 2025 Notes | 12.0 | 5.7 | ||||||
| 8.00% 2027 Notes | 46.0 | 15.6 | ||||||
| 8.125% 2027 Notes | 60.4 | 13.2 | ||||||
| 8.75% 2025 Notes | 17.5 | - | ||||||
| 8.50% 2028 Notes | 50.2 | - | ||||||
During the year ended February 28, 2022 and February 28, 2021, the average dollar amount of our 7.75% fixed-rate 2025 Notes outstanding was $5.0 million and $5.0 million, respectively.
During the year ended February 28, 2022 and February 28, 2021, the average dollar amount of our 6.25% fixed-rate 2027 Notes outstanding was $15.0 million and $7.0 million, respectively.
During the year ended February 28, 2022 and February 28, 2021, the average dollar amount of our 4.375% fixed-rate 2026 Notes outstanding was $130.4 million and $0.0 million, respectively.
During the year ended February 28, 2022 and February 28, 2021, the average dollar amount of our 4.35% fixed-rate 2027 Notes outstanding was $8.4 million and $0.0 million, respectively.
As discussed above, during the fourth quarter of 2020 fiscal year, the Company redeemed $74.45 million in aggregate principal amount of issued and outstanding 2023 Notes. During the years ended February 28, 2021, February 29, 2020 and February 28, 2019, the average dollar amount of our 6.75% fixed-rate 2023 Notes outstanding was $0.0 million, $0.0 million and $63.2 million, respectively.
As discussed above, during the first quarter of 2022 fiscal year, the Company redeemed $60.0 million in aggregate principal amount of issued and outstanding 2025 Notes. During the years ended February 28, 2022, February 28, 2021 and February 29, 2020, the average dollar amount of our 6.25% fixed-rate 2025 Notes outstanding was $29.6 million, $60.0 million and $60.0 million, respectively.
For the years ended February 28, 2022,29, 2024, February 28, 20212023 and February 29, 2020,28, 2022, we recognized income tax expense (benefit) of ($0.04)$0.04 million, $0.0($0.15) million and $1.0($0.04) million, respectively. This relates to net deferred federal and state income tax expense (benefit) with respect to operating gains and losses and income derived from equity investments held in the taxable blockers.entities that are treated as corporations for U.S. federal income tax purposes, as well as current U.S. federal and state income taxes on those operating gains and losses when realized.
For the year ended February 28, 2022,29, 2024, we accrued excise taxes of $0.6$1.8 million on undistributed taxable income as of December 31, 2021.2023. For the year ended February 28, 2021,2023, we accrued excise taxes of $0.7$1.1 million on undistributed taxable income as of December 31, 2020.2022.
Net realized gains (losses) on sales of investments
For the fiscal year ended February 29, 2024, we had $30.3 million of sales, repayments, exits or restructurings resulting in $0.2 million of net realized gains. The most significant realized gains and losses during the year ended February 29, 2024 were as follows (dollars in thousands):
Fiscal year ended February 29, 2024
| Issuer | Asset Type | Gross Proceeds | Cost | Net Realized Gain (Loss) | ||||||||||
| PDDS Buyer, LLC | Equity Interests | $ | - | $ | - | $ | 41,350 | |||||||
| Censis Technologies, Inc. | Equity Interests | - | - | 6,773 | ||||||||||
| GreyHeller LLC | Equity Interests | - | - | 42,568 | ||||||||||
| Ohio Medical, LLC | Equity Interests | - | - | 60,565 | ||||||||||
| Targus Holdings, Inc | Equity Interests | - | - | 2,327 | ||||||||||
We received escrow payments from the prior sales of our investments in PPDS Buyer, LLC, Censis Technologies, Inc., Ohio Medical, LLC, GreyHeller LLC and Targus Holdings, Inc.
For the fiscal year ended February 28, 2023, we had $222.2 million of sales, repayments, exits or restructurings resulting in $7.4 million of net realized loss. The most significant realized gains and losses during the year ended February 28, 2023 were as follows (dollars in thousands):
Fiscal year ended February 28, 2023
| Issuer | Asset Type | Gross Proceeds | Cost | Net Realized Gain (Loss) | ||||||||||
| PDDS Buyer, LLC | Equity Interests | $ | 9,943,838 | $ | 2,000,000 | $ | 7,943,838 | |||||||
| Ohio Medical, LLC | Equity Interests | 770,161 | 380,353 | 389,808 | ||||||||||
| Targus Holdings, Inc. | Equity Interests | 540,075 | 1,589,630 | (1,049,555 | ) | |||||||||
| Censis Technologies, Inc. | Equity Interests | - | - | 68,731 | ||||||||||
| Texas Teachers of Tomorrow, LLC | Equity Interests | - | - | 24,977 | ||||||||||
| V Rental Holdings LLC | Equity Interests | - | - | 68,800 | ||||||||||
The $7.9 million of net realized gains was from the sales of the equity position in our investment in PDDS Buyer, LLC.
The $0.4 million of net realized gains was from the sales of the equity position in our investment in Ohio Medical, LLC.
The $1.0 million of net realized loss was from the sales of the equity position in our investment in Targus Holding, Inc.
We received escrow payments from the prior sales of our investments in Censis Technologies, Inc., Texas Teachers of Tomorrow, LLC and V Rental Holdings LLC.
For the fiscal year ended February 28, 2022, the Companywe had $226.9 million of sales, repayments, exits or restructurings resulting in $13.4 million of net realized loss. The most significant realized gains and losses during the year ended February 28, 2022 were as follows (dollars in thousands):
Fiscal year ended February 28, 2022
| Issuer | Asset Type | Gross Proceeds | Cost | Net Realized Gain (Loss) | ||||||||||
| GreyHeller LLC | Equity Interests | $ | 8,178 | $ | 850 | $ | 7,328 | |||||||
| Lexipol, LLC | Equity Interests | 10,792 | 10,792 | - | ||||||||||
| My Alarm Center, LLC | Equity Interests | - | 4,867 | (4,867 | ) | |||||||||
| Passageways, Inc. | Equity Interests | 7,440 | 1,000 | 6,476 | ||||||||||
| Saratoga Investment Corp. CLO 2013-1, Ltd. Class F-1-R-3 Note | Structured Finance Securities | 8,360 | 8,500 | (140 | ) | |||||||||
| Texas Teachers of Tomorrow, LLC | Equity Interests | 3,339 | 750 | 2,589 | ||||||||||
| V Rental Holdings LLC | Equity Interests | 2,345 | 366 | 1,979 | ||||||||||
| Issuer | Asset Type | Gross Proceeds | Cost | Net Realized Gain | ||||||||||
| GreyHeller LLC | Equity Interests | $ | 8,178 | $ | 850 | $ | 7,328 | |||||||
| Lexipol, LLC | Equity Interests | 10,792 | 10,792 | - | ||||||||||
| My Alarm Center, LLC | Equity Interests | - | 4,867 | (4,867 | ) | |||||||||
| Passageways, Inc. | Equity Interests | 7,440 | 1,000 | 6,476 | ||||||||||
| Saratoga Investment Corp. CLO 2013-1, Ltd. Class F-1-R-3 Note | Structured Finance Securities | 8,360 | 8,500 | (140 | ) | |||||||||
| Texas Teachers of Tomorrow, LLC | Equity Interests | 3,339 | 750 | 2,589 | ||||||||||
| V Rental Holdings LLC | Equity Interests | 2,345 | 366 | 1,979 | ||||||||||
The $7.3 million of net realized gains was from the sales of the equity position in the Company’sour investment in GreyHeller LLC investment.LLC.
The $0.1 million of net realized loss was from the sales of the equity position in our investment in Lexipol, LLC.
The $4.9 million of net realized loss was from the Company’sour investment in My Alarm Center, LLC investment that was deemed worthless during this period.
The $6.4 million of net realized gains was from the sales of the equity position in the Company’sour investment in Passageways Inc. investment.
The $0.1 million of net realized loss was from the repayment of the structured finance securities in the Saratoga Investment Corp. CLO 2013-1, Ltd. Class F-1-R-3 Note.
The $2.6 million of net realized gains was from the sales of the equity position in the Company’sour investment in Texas Teachers of Tomorrow, LLC investment..
The $1.9 million of net realized gains was from the sales of the equity position in the Company’sour investment in V Rental Holdings LLC investment.LLC.
For the fiscal year ended February 28, 2021, the Company had $130.3 million of sales, repayments, exits or restructurings resulting in $8.7 million of net realized loss. The most significant realized gains and losses during the year ended February 28, 2021 were as follows (dollars in thousands):
Fiscal year ended February 28, 2021
| Issuer | Asset Type | Gross Proceeds | Cost | Net Realized Gain | ||||||||||
| Elyria Foundry Company, L.L.C | Equity Interests | $ | 959 | $ | 9,685 | $ | (8,726 | ) | ||||||
The $8.7 million of net realized losses was from the sales of the equity positions in Elyria Foundry Company, L.L.C.
For the fiscal year ended February 29, 2020, the Company had $167.3 million of sales, repayments, exits or restructurings resulting in $42.9 million of net realized gains. The most significant realized gains and losses during the year ended February 29, 2020 were as follows (dollars in thousands):
Fiscal year ended February 29, 2020
| Issuer | Asset Type | Gross Proceeds | Cost | Net Realized Gain (Loss) | ||||||||||
| Easy Ice, LLC | Equity Interests | $ | 41,928 | $ | 10,703 | $ | 31,225 | |||||||
| Censis Technologies, Inc. | Equity Interests | 12,280 | 999 | 11,281 | ||||||||||
The $31.2 million and $11.3 million of net realized gains was from the sales of the equity position in Easy Ice, LLC and Censis Technologies, Inc., respectively.
Net change in unrealized appreciation (depreciation) on investments
For the year ended February 29, 2024, our investments had a net change in unrealized depreciation of $47.1 million compared to a net change in unrealized depreciation of $15.2 million for the year ended February 28, 2023. The most significant cumulative changes in unrealized appreciation (depreciation) for the year ended February 29, 2024, were the following (dollars in thousands):
Fiscal year ended February 29, 2024
| Issuer | Asset Type | Cost | Fair Value | Total Unrealized Appreciation (Depreciation) | YTD Change in Unrealized Appreciation (Depreciation) | |||||||||||||
| Pepper Palace, Inc. | First Lien Term Loan & Equity Interests | $ | 35,438 | $ | 2,489 | $ | (32,949 | ) | $ | (23,104 | ) | |||||||
| Zollege PBC | First Lien Term Loan & Equity Interests | 17,949 | 3,784 | (14,165 | ) | (12,845 | ) | |||||||||||
| Netreo Holdings, LLC | First Lien Term Loan & Equity Interests | 39,225 | 35,422 | (3,803 | ) | (12,083 | ) | |||||||||||
| Saratoga Senior Loan Fund I JV, LLC | Equity Interests | 35,202 | 25,222 | (9,980 | ) | (5,504 | ) | |||||||||||
| Saratoga Investment Corp. CLO 2013-1, Ltd. | Structured Finance Securities | 22,002 | 9,501 | (12,501 | ) | (4,734 | ) | |||||||||||
| Knowland Group, LLC | Second Lien Term Loan | 15,879 | 12,643 | (3,236 | ) | 2,882 | ||||||||||||
| ETU Holdings, Inc. | First Lien Term Loan, Second Lien Term Loan & Equity Interests | 16,034 | 13,600 | (2,434 | ) | (2,518 | ) | |||||||||||
| Vector Controls Holding Co., LLC | First Lien Term Loan & Equity Interests | 924 | 9,095 | 8,171 | 1,653 | |||||||||||||
| Chronus LLC | First Lien Term Loan & Equity Interests | 22,875 | 22,069 | (806 | ) | (1,304 | ) | |||||||||||
| Avionte Holdings, LLC | Equity Interests | 100 | 3,288 | 3,188 | 1,209 | |||||||||||||
| Buildout, Inc. | First Lien Term Loan, Second Lien Term Loan & Equity Interests | 53,666 | 52,350 | (1,316 | ) | (1,167 | ) | |||||||||||
The $23.1 million net change in unrealized depreciation in our investment in Pepper Palace, Inc. was driven by further declines in company performance during the year ended February 29, 2024.
The $12.8 million net change in unrealized depreciation in our investment in Zollege PBC was driven by further declines in company performance during the year ended February 29, 2024.
The $12.1 million net change in unrealized depreciation in our investment in Netreo Holdings, LLC was driven by increased company leverage and declines in company performance.
The $5.5 million net change in unrealized depreciation in our investment in Saratoga Senior Loan Fund I JV, LLC was primarily driven by overall market conditions.
The $4.7 million net change in unrealized depreciation in our investment in Saratoga Investment Corp. CLO 2013-1, Ltd. was driven by overall market conditions as well as the mark-down of specific investments.
The $2.9 million net change in unrealized appreciation in our investment in Knowland Group, LLC was driven by overall improved company performance and valuation.
The $2.5 million net change in unrealized depreciation in our investment in ETU Holdings, Inc. was driven by declining company performance.
The $1.7 million net change in unrealized appreciation in our investment in Vector Controls Holding Co., LLC was driven by overall company performance.
The $1.3 million net change in unrealized depreciation in our investment in Chronus LLC was driven by overall company performance.
The $1.2 million net change in unrealized appreciation in our investment in Avionte Holdings, Inc. was driven by overall company performance.
The $1.2 million net change in unrealized depreciation in our investment in Buildout, Inc. was driven by overall company performance.
For the year ended February 28, 2023, our investments had a net change in unrealized depreciation of $15.2 million compared to a net change in unrealized appreciation of $17.0 million for the year ended February 28, 2022. The most significant cumulative changes in unrealized appreciation (depreciation) for the year ended February 28, 2023, were the following (dollars in thousands):
Fiscal year ended February 28, 2023
| Issuer | Asset Type | Cost | Fair Value | Total Unrealized Appreciation (Depreciation) | YTD Change in Unrealized Appreciation (Depreciation) | |||||||||||||
| Pepper Palace, Inc. | First Lien Term Loan & Equity Interests | $ | 34,256 | $ | 24,411 | $ | (9,845 | ) | $ | (9,327 | ) | |||||||
| Artemis Wax Corp. | First Lien Term Loan & Equity Interests | 60,059 | 63,642 | 3,583 | 1,460 | |||||||||||||
| Vector Controls Holding Co., LLC | First Lien Term Loan & Equity Interests | 3,090 | 9,608 | 6,518 | 3,099 | |||||||||||||
| Axero Holdings, LLC | First Lien Term Loan & Equity Interests | 10,551 | 13,052 | 2,500 | 1,952 | |||||||||||||
| Destiny Solutions Inc. | First Lien Term Loan & Equity Interests | 3,969 | 8,941 | 4,972 | 1,309 | |||||||||||||
| Zollege PBC | First Lien Term Loan & Equity Interests | 16,652 | 15,333 | (1,319 | ) | (1,185 | ) | |||||||||||
| Netreo Holdings, LLC | First Lien Term Loan & Equity Interests | 35,887 | 44,167 | 8,280 | (2,363 | ) | ||||||||||||
| PDDS Buyer, LLC | First Lien Term Loan & Equity Interests | - | - | - | (5,094 | ) | ||||||||||||
| Saratoga Investment Corp. CLO 2013-1, Ltd. | Structured Finance Securities | 28,944 | 21,177 | (7,767 | ) | (4,149 | ) | |||||||||||
| Saratoga Senior Loan Fund I JV, LLC | Equity Interests | 35,202 | 30,726 | (4,476 | ) | (3,368 | ) | |||||||||||
The $9.3 million net change in unrealized depreciation in our investment in Pepper Palace, Inc. was driven by overall company performance.
The $2.1 million net change in unrealized appreciation in our investment in Artemis Wax Corp. was driven by improved financial performance.
The $3.1 million net change in unrealized appreciation in our investment in Vector Controls Holding Co., LLC was driven by improved financial performance.
The $2.0 million net change in unrealized appreciation in our investment in Axero Holdings, LLC was driven by growth and overall strong financial performance.
The $1.3 million net change in unrealized appreciation in our investment in Destiny Solutions Inc. was driven by growth and overall strong financial performance.
The $1.2 million net change in unrealized depreciation in our investment in Zollege PBC was driven by weakened financial performance.
The $2.4 million net change in unrealized depreciation in our investment in Netreo Holdings, LLC was driven by increased leverage and slowing top line growth.
The $5.1 million net change in unrealized depreciation in our investment in PDDS Buyer, LLC was driven by the sale of that investment, resulting in a reversal of previously recognized unrealized appreciation reclassified to realized gains.
The $4.1 million net change in unrealized depreciation in our investment in Saratoga Investment Corp. CLO 2013-1 Ltd. was driven by the increase in discount rates and overall market conditions.
The $3.4 million net change in unrealized depreciation in our investment in Saratoga Senior Loan Fund I JV, LLC was driven by the increase in discount rates and overall market conditions.
For the year ended February 28, 2022, our investments had a net change in unrealized appreciation of $17.0 million versuscompared to a net change in unrealized appreciation of $5.0 million for the year ended February 28, 2021. The most significant cumulative changes in unrealized appreciation (depreciation) for the year ended February 28, 2022, were the following (dollars in thousands):
Fiscal year ended February 28, 2022
| Issuer | Asset Type | Cost | Fair Value | Total Unrealized Appreciation (Depreciation) | YTD Change in Unrealized Appreciation (Depreciation) | |||||||||||||
| ArbiterSports, LLC | First Term Lien Loan | 26,846 | 26,654 | (192 | ) | 1,140 | ||||||||||||
| Artemis Wax | First Term Lien Loan & Equity Interests | 36,774 | 38,234 | 1,460 | 1,460 | |||||||||||||
| C2 Educational Systems | First Term Lien Loan & Equity Interests | 18,985 | 18,820 | (165 | ) | 2,334 | ||||||||||||
| Destiny Solutions Inc. | First Term Lien Loan & Equity Interests | 3,969 | 7,632 | 3,663 | 2,636 | |||||||||||||
| GreyHeller LLC | First Term Lien Loan & Equity Interests | 1,636 | 1,636 | - | (3,103 | ) | ||||||||||||
| My Alarm Center, LLC | Equity Interests | - | - | - | 4,686 | |||||||||||||
| Netreo Holdings, LLC | First Term Lien Loan & Equity Interests | 27,160 | 37,804 | 10,644 | 5,056 | |||||||||||||
| Passageways, Inc. | First Term Lien Loan & Equity Interests | - | - | - | (2,311 | ) | ||||||||||||
| PDDS | First Term Lien Loan & Equity Interests | 29,944 | 35,038 | 5,094 | 4,270 | |||||||||||||
| Saratoga Investment Corp. CLO 2013-1, Ltd. | Structured Finance Securities | 41,648 | 38,030 | (3,618 | ) | (1,675 | ) | |||||||||||
| Saratoga Senior Loan Fund I JV, LLC | Unsecured & Equity Interest | 26,250 | 25,141 | (1,109 | ) | (1,109 | ) | |||||||||||
| SCHOOX INVESTMENTS LLC | Equity Interests | 476 | 3,306 | 2,830 | 2,830 | |||||||||||||
| TG Pressure Washing Holdings | First Term Lien Loan & Equity Interests | 488 | 482 | (6 | ) | 1,060 | ||||||||||||
| Village Realty Holdings LLC | First Term Lien Loan & Equity Interests | - | - | - | (2,183 | ) | ||||||||||||
| Vector Controls | First Term Lien Loan & Equity Interests | 5,008 | 8,427 | 3,419 | 1,393 | |||||||||||||
| Issuer | Asset Type | Cost | Fair Value | Total Unrealized Appreciation (Depreciation) | YTD Change in Unrealized Appreciation (Depreciation) | |||||||||||||
| ArbiterSports, LLC | First Term Lien Loan | $ | 26,846 | $ | 26,654 | $ | (192 | ) | $ | 1,140 | ||||||||
| Artemis Wax | First Term Lien Loan & Equity Interests | 36,774 | 38,234 | 1,460 | 1,460 | |||||||||||||
| C2 Educational Systems | First Term Lien Loan & Equity Interests | 18,985 | 18,820 | (165 | ) | 2,334 | ||||||||||||
| Destiny Solutions Inc. | First Term Lien Loan & Equity Interests | 3,969 | 7,632 | 3,663 | 2,636 | |||||||||||||
| GreyHeller LLC | First Term Lien Loan & Equity Interests | 1,636 | 1,636 | - | (3,103 | ) | ||||||||||||
| My Alarm Center, LLC | Equity Interests | - | - | - | 4,686 | |||||||||||||
| Netreo Holdings, LLC | First Term Lien Loan & Equity Interests | 27,160 | 37,804 | 10,644 | 5,056 | |||||||||||||
| Passageways, Inc. | First Term Lien Loan & Equity Interests | - | - | - | (2,311 | ) | ||||||||||||
| PDDS | First Term Lien Loan & Equity Interests | 29,944 | 35,038 | 5,094 | 4,270 | |||||||||||||
| Saratoga Investment Corp. CLO 2013-1, Ltd. | Structured Finance Securities | 41,648 | 38,030 | (3,618 | ) | (1,675 | ) | |||||||||||
| Saratoga Senior Loan Fund I JV, LLC | Unsecrued & Equity Interest | 26,250 | 25,141 | (1,109 | ) | (1,109 | ) | |||||||||||
| SCHOOX INVESTMENTS LLC | Equity Interests | 476 | 3,306 | 2,830 | 2,830 | |||||||||||||
| TG Pressure Washing Holdings | First Term Lien Loan & Equity Interests | 488 | 482 | (6 | ) | 1,060 | ||||||||||||
| Village Realty Holdings LLC | First Term Lien Loan & Equity Interests | - | - | - | (2,183 | ) | ||||||||||||
| Vector Controls | First Term Lien Loan & Equity Interests | 5,008 | 8,427 | 3,419 | 1,393 | |||||||||||||
The $1.1 million net change in unrealized appreciation in our investment in ArbiterSports, LLC was driven by improved financial performance.
The $1.5 million net change in unrealized appreciation in our investment in Artemis Wax was driven by improved financial performance.
The $2.3 million net change in unrealized appreciation in our investment in C2 Education Systems was driven by improved financial performance.
The $2.6 million net change in unrealized appreciation in our investment in Destiny Solutions Inc. was driven by growth and overall strong financial performance.
The $3.1 million net change in unrealized depreciation in our investment in GreyHeller LLC. was driven by the sale of that investment, resulting in a reversal of previously recognized unrealized appreciation reclassified to realized gains.
The $4.7 million net change in unrealized appreciation in our investment in My Alarm Center, LLC was driven by the reversal of previously recognized unrealized depreciation reclassified to realized losses.
The $5.1 million net change in unrealized appreciation in our investment in Netreo Holdings, LLC was driven by growth and improved financial performance.
The $2.3 million net change in unrealized depreciation in our investment in Passageways, Inc. was driven by the sale of that investment, resulting in a reversal of previously recognized unrealized appreciation reclassified to realized gains.
The $4.3 million net change in unrealized appreciation in our investment in PDDS Buyer, LLC was driven by overall strong company performance.
The $1.7 million net change in unrealized depreciation in our investment in Saratoga Investment Corp. CLO 2013-1 Ltd. was driven by the increase in discount rates, impact of LIBOR changes and overall market conditions.
The $1.1 million net change in unrealized depreciation in our investment in Saratoga Senior Loan Fund I JV, LLC was driven by market volatility of the underlying investments of the fund.
The $2.8 million net change in unrealized appreciation in our investment in Schoox, Inc. was driven by overall strong company performance.
The $1.1 million net change in unrealized appreciation in our investment in Top Gun Pressure Washing, LLC was driven by growth, improved financial performance, and a reduced leverage profile.
The $2.2 million net change in unrealized depreciation in our investment in Village Realty Holdings, LLC was driven by the sale of that investment, resulting in a reversal of previously recognized unrealized appreciation reclassified to realized gains.
The $1.4 million net change in unrealized appreciation in our investment in Vector Controls. was driven by growth and overall strong financial performance.
For the year ended February 28, 2021, our investments had a net change in unrealized appreciation of $5.0 million versus a net change in unrealized depreciation of $0.8 million for the year ended February 29, 2020. The most significant cumulative changes in unrealized appreciation (depreciation) for the year ended February 28, 2021, were the following (dollars in thousands):
| Fiscal year ended February 28, 2021 | ||||||||||||||||||
| Issuer | Asset Type | Cost | Fair Value | Total Unrealized | YTD Change in Appreciation | |||||||||||||
| ArbiterSports, LLC | First Term Lien Loan | 26,801 | 25,469 | (1,332 | ) | (1,306 | ) | |||||||||||
| C2 Educational Systems | First Term Lien Loan | 15,998 | 13,499 | (2,499 | ) | (2,517 | ) | |||||||||||
| Elyria Foundry Company, L.L.C. | Equity Interests | 9,685 | 730 | (8,955 | ) | 7,745 | ||||||||||||
| Knowland Group, LLC | Second Lien Term Loan | 15,768 | 10,788 | (4,980 | ) | (4,873 | ) | |||||||||||
| My Alarm Center, LLC | Equity Interests | 712 | 181 | (531 | ) | 1,816 | ||||||||||||
| Netreo Holdings, LLC | First Term Lien Loan & Equity Interests | 9,632 | 15,220 | 5,588 | 1,832 | |||||||||||||
| Passageways, Inc. | First Term Lien Loan & Equity Interests | 10,953 | 13,264 | 2,311 | 1,173 | |||||||||||||
| Roscoe Medical, Inc. | Second Lien Term Loan & Equity Interests | 5,649 | 5,422 | (227 | ) | 2,343 | ||||||||||||
| Saratoga Investment Corp. CLO 2013-1, Ltd. | Structured Finance Securities | 33,847 | 31,450 | (2,397 | ) | (1,434 | ) | |||||||||||
| Village Realty Holdings LLC | First Term Lien Loan & Equity Interests | 12,394 | 14,577 | 2,183 | 2,038 | |||||||||||||
The $1.3 million net change in unrealized depreciation in our investment in ArbiterSports, LLC was driven by disruptions to its business due to COVID-related shutdowns.
The $2.5 million net change in unrealized depreciation in our investment C2 Education Systems was driven by disruptions to its business due to COVID-related shutdowns.
The $7.7 million net unrealized loss reversal in our investment in Elyria Foundry Company, L.L.C. was due to the realization of this investment, which resulted in a net unrealized appreciation during FY21.
The $4.9 million net change in unrealized depreciation in our investment in Knowland Group, LLC was driven by disruptions to its business due to COVID-related shutdowns.
The $1.8 million net change in unrealized depreciation in our investment in My Alarm Center, LLC was driven by increasing leverage levels combined with declining market conditions in the sector.
The $1.8 million net change in unrealized appreciation in our investment in Netreo Holdings, LLC was driven by growth and improved financial performance.
The $1.2 million net change in unrealized appreciation in our investment in Passageways, Inc. was driven by growth and improved financial performance.
The $2.3 million net change in unrealized appreciation in our investment in Roscoe Medical, Inc. was driven by continued improvement in the company’s performance.
The $1.4 million of unrealized depreciation in our investment in Saratoga Investment Corp. CLO 2013-1, Ltd. was driven by a reduction in base interest rates during FY 2021, along with expenses resulting from the recapitalization of the CLO.
The $2.0 million net change in unrealized appreciation in our investment in Village Realty Holdings, LLC was driven by increased customer demand during its peak season this year.
For the year ended February 29, 2020, our investments had a net change in unrealized depreciation of $0.8 million versus a net change in unrealized depreciation of $2.9 million for the year ended February 28, 2019. The most significant cumulative changes in unrealized appreciation (depreciation) for the year ended February 29, 2020, were the following (dollars in thousands):
| Fiscal year ended February 29, 2020 | ||||||||||||||||||
| Issuer | Asset Type | Cost | Fair Value | Total Unrealized | YTD Change in Unrealized Appreciation (Depreciation) | |||||||||||||
| Easy Ice, LLC | Second Term Lien Loan & Equity Interests | $ | - | $ | - | $ | - | $ | (3,817 | ) | ||||||||
| GreyHeller LLC | First Term Lien Loan & Equity Interests | 7,821 | 9,981 | 2,160 | 1,331 | |||||||||||||
| Netreo Holdings, LLC | First Term Lien Loan & Equity Interests | 8,273 | 12,029 | 3,756 | 1,655 | |||||||||||||
The $3.8 million net change in unrealized depreciation in our investment in Easy Ice, LLC was driven by the completion of a sales transaction. In recognizing a realized gain as a result of the sale, unrealized appreciation was adjusted to zero, which resulted in a $3.8 million change in unrealized depreciation for the year.
The $1.3 million net change in unrealized appreciation in our investment GreyHeller LLC was driven by increased operating margins and an increase in overall financial performance.
The $1.7 million net change in unrealized appreciation in our investment in Netreo Holdings, LLC was driven by growth and improved financial performance.
Changes in net assets resulting from operations
For the fiscal years ended February 28, 2022,29, 2024, February 28, 20212023 and February 29, 2020,28, 2022, we recorded a net increase in net assets resulting from operations of $45.7$8.9 million, $14.8$24.7 million and $55.7$45.7 million, respectively. Based on 11,456,63112,670,939 weighted average common shares outstanding as of February 28, 2022,29, 2024, our per share net increase in net assets resulting from operations was $3.99$0.71 for the fiscal year ended February 28, 2022.29, 2024. This compares to a per share net increase in net assets resulting from operations of $1.32$2.06 for the fiscal year ended February 28, 20212023 (based on 11,188,62911,963,533 weighted average common shares outstanding as of February 28, 2021)2023), and a per share net increase in net assets resulting from operations of $5.98$3.99 for the fiscal year ended February 29, 202028, 2022 (based on 9,319,19211,456,631 weighted average common shares outstanding as of February 29, 2020)28, 2022).
FINANCIAL CONDITION, LIQUIDITY AND CAPITAL RESOURCES
We intend to continue to generate cash primarily from cash flows from operations, including interest earned from our investments in debt in middle marketmiddle-market companies, interest earned from the temporary investment of cash in U.S. government securities and other high-quality debt investments that mature in one year or less, the Encina Credit Facility and the Live Oak Credit Facility, our continued access to the SBA debentures future borrowings and future offerings of debt and equity securities.
Although we expect to fund the growth of our investment portfolio through the net proceeds from future equity offerings, including our dividend reinvestment plan (“DRIP”), our equity ATM program, and issuances of senior securities or future borrowings, to the extent permitted by the 1940 Act, we cannot assure you that our plans to raise capital will be successful. In this regard, because our common stock has historically traded at a price below our current net asset valueNAV per share and we are limited in our ability to sell our common stock at a price below net asset valueNAV per share, we have been and may continue to be limited in our ability to raise equity capital.
In addition, we intend to distribute to our stockholders substantially all of our operating taxable income in order to satisfy the distribution requirement applicable to RICs under the Code. In satisfying this distribution requirement, in accordance with certain applicable provisions of the Code and the Treasury regulations and a revenue procedure issued by the Internal Revenue Service (“IRS”), a RIC may treat a distribution of its own stock as fulfilling its RIC distribution requirements if each stockholder may elect to receive his or her entire distribution in either cash or stock of the RIC subject to a limitation that the aggregate amount of cash to be distributed to all stockholders must be at least 20% of the aggregate declared distribution. We may rely on the revenue procedure in future periods to satisfy our RIC distribution requirement.
Also, as a BDC, we generally are required to meet a coverage ratio of total assets, less liabilities and indebtedness not represented by senior securities, to total senior securities, which include all of our borrowings and any outstanding preferred stock, of at least 200.0%200%, reduced to 150.0%150% effective April 16, 2019 following the approval received from theour board of directors, including a majority of our independent directors, on April 16, 2018. This requirement limits the amount that we may borrow. Our asset coverage ratio, as defined in the 1940 Act, was 209.2%161.1% as of February 29, 2024 and 165.9% as of February 28, 2022 and 347.1% as of February 28, 2021.2023. To fund growth in our investment portfolio in the future, we anticipate needing to raise additional capital from various sources, including the equity markets and other debt-related markets, which may or may not be available on favorable terms, if at all.
Consequently, we may not have the funds or the ability to fund new investments, to make additional investments in our portfolio companies, to fund our unfunded commitments to portfolio companies, to pay dividends or to repay borrowings. Also, the illiquidity of our portfolio investments may make it difficult for us to sell these investments when desired and, if we are required to sell these investments, we may realize significantly less than their recorded value.
Madison Revolving Credit FacilityDue to the diverse capital sources available to us at this time, we believe we have adequate liquidity to support our near term capital requirements.
The senior secured revolving credit facility we entered into with Madison Capital Funding LLC (the “Madison Credit Facility”) on June 30, 2010, which was most recently amended on September 3, 2021 and then fully repaid and terminated on October 4, 2021.
As of February 28, 2021, we had no outstanding borrowings under the Madison Credit Facility. Our borrowing base under the Madison Credit Facility at February 28, 2021 was $38.9 million.
Encina Credit Facility
Below is a summary of the terms of the senior secured revolving credit facility we entered into with Encina Lender Finance, LLC on October 4, 2021.2021 (the “Encina Credit Facility”).
Commitment. The CompanyWe entered into a senior secured revolving credit facilitythe Credit and Security Agreement (the “Encina Credit Agreement”) relating to the Encina Credit Facility in the initial facility amount of $50.0 million (the “Facility Amount”). The Company has the ability to request an increase in the Facility Amount during the first two years following the closing date to up to $75.0 million. The commitment termination date is October 4, 2024.
Availability. The CompanyWe can draw up to the lesser of (i) the Facility Amount and (ii) the Borrowing Base. The Borrowing Base is an amount equal to (i) the difference of (A) the product of the applicable advance rate which varies from 50.0% to 75.0% depending on the type of loan asset (Defaulted Loans being excluded in that they carry an advance rate of 0%) and the value, determined in accordance with the Encina Credit Facility (the “Adjusted Borrowing Value”), of certain “eligible” loan assets pledged as security for the loan (the “Borrowing Base Value”) and (B) the Excess Concentration Amount, as calculated in accordance with the Encina Credit Facility, plus (ii) any amounts held in the Prefunding Account and, without duplication, Excess Cash held in the Collection Account, less (iii) the product of (a) the amount of any undrawn funding commitments the Company haswe have under any loan asset and (b) the Unfunded Exposure Haircut Percentage, and less (iv) $100,000. Each loan asset we held by the Company as of the date on which the Encina Credit Facility was closed was valued as of that date and each loan asset that the Companywe acquires after such date will be valued at the lowest of its fair value, its face value (excluding accrued interest) and the purchase price paid for such loan asset. Adjustments to the value of a loan asset will be made to reflect, among other things and under certain circumstances, changes in its fair value, a default by the obligor on the loan asset, insolvency of the obligor, acceleration of the loan asset, and certain modifications to the terms of the loan asset.
The Encina Credit Facility contains limitations on the type of loan assets that are “eligible” to be included in the Borrowing Base and as to the concentration level of certain categories of loan assets in the Borrowing Base such as restrictions on geographic and industry concentrations, asset size and quality, payment frequency, status and terms, average life, and collateral interests. In addition, if an asset is to remain an “eligible” loan asset, the Companywe may not make changes to the payment, amortization, collateral and certain other terms of the loan assets without the consent of the administrative agent that will either result in subordination of the loan asset or be materially adverse to the lenders.
The Encina Credit Facility requires certain minimum drawn amounts. For the period beginning on the closing date and endingended April 4, 2022, the minimum funding amount iswas $12.5 million. For the period beginning on April 5, 2022 through maturity, the minimum funding amount is the greater of $25.0 million and 50% of the Facility Amount in effect from time to time.
Collateral. The Encina Credit Facility is secured by assets of Saratoga Investment Funding II LLC (“SIF II”) and pledged to the lender under the credit facility. SIF II is a wholly owned special purpose entity formed by the Company for the purpose of entering into the Encina Credit Facility.
Interest Rate and Fees. Fees. Under the Encina Credit Facility, funds arewere borrowed from or through certain lenders at the greater of the prevailing LIBOR rate and 0.75%, plus an applicable margin of 4.00%. The Encina Credit FacilityAgreement includes benchmark replacement provisions which permit the Administrative Agent and the Borrowerborrower to select a replacement rate upon the unavailability of LIBOR. In addition, the Company payswe pay the lenders a commitment fee of 0.75% per year (or 0.50% if the ratio of advances outstanding to aggregate commitments is greater than or equal to 50%) on the unused amount of the Encina Credit Facility for the duration of the term of the credit facility.Encina Credit Facility. Accrued interest and commitment fees are payable monthly in arrears. The Company wasWe were also obligated to pay certain other fees to the lenders in connection with the closing of the Encina Credit Facility.
Collateral Tests. It is a condition precedent to any borrowing under the Encina Credit Facility that the principal amount outstanding under the Encina Credit Facility, after giving effect to the proposed borrowings, not exceed the Borrowing Base (the “Borrowing Base Test”). In addition to satisfying the Borrowing Base Test, the following tests must also be satisfied (together with Borrowing Base Test, the “Collateral Tests”):
| o | Interest Coverage Ratio. The ratio (expressed as a percentage) of interest collections with respect to pledged loan assets, less certain fees and expenses relating to the Encina Credit Facility, to accrued interest and commitment fees payable to the lenders under the Encina Credit Facility for the last 6 payment periods must equal at least 175.0%. |
| o | Overcollateralization Ratio. The ratio (expressed as a percentage) of the aggregate Adjusted Borrowing Value of “eligible” pledged loan assets plus the fair value of certain ineligible pledged loan assets (in each case, subject to certain adjustments) to outstanding borrowings under the Encina Credit Facility plus the Unfunded Exposure Amount must equal at least 200.0%. |
The Encina Credit Facility also may require payment of outstanding borrowings or replacement of pledged loan assets upon the Company’sour breach of itsour representation and warranty that pledged loan assets included in the Borrowing Base are “eligible” loan assets. Such ineligible collateral loans will be excluded from the calculation of the Borrowing Base and may lead to a Borrowing Base Deficiency, which may be cured by effecting one or more (or any combination thereof) of the following actions: (A) deposit into or credit to the collection account cash and eligible investments, (B) repay outstanding borrowings (together with certain costs and expenses), (C) sell or substitute loan assets in accordance with the Encina Credit Facility, or (D) pledge additional loan assets as collateral. Compliance with the Collateral Tests is also a condition to the discretionary sale of pledged loan assets by the Company.us.
Priority of Payments. The priority of payments provisions of the Encina Credit Facility require, after payment of specified fees and expenses, that collections of interest from the loan assets and, to the extent that these are insufficient, collections of principal from the loan assets, be applied on each payment date to payment of outstanding borrowings if the Borrowing Base Test, the Overcollateralization Ratio and the Interest Coverage Ratio would not otherwise be met.
Operating Expenses. The priority of payments provision of the Encina Credit Facility provides for the payment of certain of our operating expenses of the Company out of collections on interest and principal in accordance with the priority established in such provision. The operating expenses payable pursuant to the priority of payment provisions is limited to $200,000 per annum.
Covenants; Representations and Warranties; Events of Default. The Encina Credit FacilityAgreement contains customary representations and warranties, affirmative covenants, negative covenants and events of default. The Encina Credit FacilityAgreement does not contain grace periods for breach by the Companyus of any negative covenants or of certain of the affirmative covenants, including, without limitation, those related to preservation of the existence and separateness of the Company. Other events of default under the Encina Credit FacilityAgreement include, among other things, the following:
| o |
| o |
| o | the filing of certain ERISA or tax liens on our assets |
| o | failure by Specified Holders to collectively, directly or indirectly, own and control at least 51% of the outstanding equity interests of Saratoga Investment Advisor, or (y) possess the right to elect (through contract, ownership of voting securities or otherwise) at all times a majority of the board of directors (or similar governing body) of Saratoga Investment Advisor and to direct the management policies and decisions of Saratoga Investment Advisor, or (ii) the dissolution, termination or liquidation in whole or in part, transfer or other disposition, in each case, of all or substantially all of the assets of, Saratoga Investment Advisor; |
| o | indictment or conviction of Saratoga Investment Advisors or any “key person” for a felony offense, or any fraud, embezzlement or misappropriation of funds by Saratoga Investment Advisors or any “key person” and, in the case of “key persons,” without a reputable, experienced individual reasonably satisfactory to Encina Lender Finance appointed to replace such key person within 30 days; |
| o | resignation, termination, disability or death of a “key person” or failure of any “key person” to provide active participation in Saratoga Investment Advisors’ daily activities, all without a reputable, experienced individual reasonably satisfactory to Encina Lender Finance appointed within 30 days. |
Fees and Expenses. The CompanyWe paid certain fees and reimbursed Encina Lender Finance, LLC for the aggregate amount of all documented, out-of-pocket costs and expenses, including the reasonable fees and expenses of lawyers, incurred by Encina Lender Finance, LLC in connection with the Encina Credit Facility and the carrying out of any and all acts contemplated thereunder up to and as of the date of closing. These amounts totaled $1.4 million.
On January 27, 2023, we entered into the first amendment to the Encina Credit Agreement to, among other things:
| ● | increase the borrowings available under the Encina Credit Facility from up to $50.0 million to up to $65.0 million; |
| ● | change the underlying benchmark used to compute interest under the Encina Credit Agreement from LIBOR to Term SOFR for a one-month tenor plus a 0.10% credit spread adjustment; |
| ● | increase the applicable effective margin rate on borrowings from 4.00% to 4.25%; |
| ● | extend the revolving period from October 4, 2024 to January 27, 2026; |
| ● | extend the period during which the borrower may request one or more increases in the borrowings available under the Encina Credit Facility (each such increase, a “Facility Increase”) from October 4, 2023 to January 27, 2025, and increased the maximum borrowings available pursuant to the Encina Facility Increase from $75.0 million to $150.0 million; |
| ● | revised the eligibility criteria for eligible collateral loans to exclude certain industries in which an obligor or related guarantor may be involved; and |
| ● | amended the provisions permitting the borrower to request an extension in the Commitment Termination Date (as defined in the Encina Credit Agreement) to allow requests to extend any applicable Commitment Termination Date, rather than a one-time request to extend the original Commitment Termination Date, subject to a notice requirement. |
As of February 28, 2022,29, 2024, we had $12.5$35.0 million outstanding borrowings under the Credit Facility and $185.0$214.0 million of SBA-guaranteed debentures outstanding (which are discussed below). As of February 28, 2021,2023, we had no$32.5 million outstanding borrowings under the Credit Facility and $158.0$202.0 million of SBA-guaranteed debentures outstanding. Our borrowing base under the Credit Facility at February 28,202229, 2024 and February 28, 20212023 was $50.0$65.0 million and $38.9$65.0 million, respectively.
Our asset coverage ratio, as defined in the 1940 Act, was 209.2%161.1% as of February 29, 2024 and 165.9% as of February 28, 2022 and 347.1% as of February 28, 2021.2023.
SBA-guaranteed debentures
In addition, we, through two wholly-ownedthree wholly owned subsidiaries, sought and obtained licenses from the SBA to operate an SBIC. In this regard, our wholly owned subsidiaries, SBIC LP, SBIC II LP, and SBIC III LP, received an SBIC license from the SBA on March 28, 2012, our wholly-owned subsidiary, Saratoga Investment Corp. SBIC LP, received a license from the SBA to operate as an SBIC under Section 301(c) of the Small Business Investment Act of 1958 and on August 14, 2019, our wholly-owned subsidiary, Saratoga Investment Corp. SBIC II LP, also received a license.and September 29, 2022, respectively. SBICs are designated to stimulate the flow of private equity capital to eligible small businesses. Under SBA regulations, SBICs may make loans to eligible small businesses and invest in the equity securities of small businesses. Following the debentures being fully repaid to the SBA, SBIC LP surrendered its license on January 3, 2023, and SBIC LP subsequently merged with and into the Company.
The SBIC license allows our SBIC subsidiariesSubsidiaries to obtain leverage by issuing SBA-guaranteed debentures. SBA-guaranteed debentures are non-recourse, interest only debentures with interest payable semi-annually and have a ten-year maturity. The principal amount of SBA-guaranteed debentures is not required to be paid prior to maturity but may be prepaid at any time without penalty. The interest rate of SBA-guaranteed debentures is fixed on a semi-annual basis at a market-driven spread over U.S. Treasury Notes with 10-year maturities.
The SBIC Subsidiaries are regulated by the SBA. SBA regulations previously limitedcurrently limit the amount that our SBIC subsidiarySubsidiaries may borrow to a maximum of $150.0 million when it has at least $75.0 million in regulatory capital, receives a capital commitment from the SBA and has been through an examination by the SBA subsequent to licensing. This maximum has been increased by SBA regulators for new licenses to $175.0 million of SBA debentures when it has at least $87.5 million in regulatory capital. The new license will provide upcapital, subject to $175.0 million in additional long-term capital in the form of SBA-guaranteed debentures. TheSBA’s approval. Under current SBIC LP and SBIC II LP are regulated by the SBA. As a result of the 2016 omnibus spending bill signed into law in December 2015,regulations, for two or more SBICs under common control, the maximum amount of SBA-guaranteedoutstanding SBA debentures that affiliated SBIC funds can have outstanding was increased from $225.0 million tocannot exceed $350.0 million. Our wholly-ownedwholly owned SBIC subsidiariesSubsidiaries are able to borrow funds from the SBA against regulatory capital (which generally approximates equity capital) that is paidcapital in the respective SBIC) and is subject to customary regulatory requirements, including, but not limited to, anperiodic examination by the SBA. With this license approval, Saratoga will grow its SBA relationship from $150.0 million to $325.0 million of committed capital.
We received exemptive relief from the SEC to permit us to exclude the debt of our SBIC subsidiariesSubsidiaries guaranteed by the SBA from the definition of senior securities in the asset coverage test under the 1940 Act. This allows us increased flexibility under the asset coverage test by permitting us to borrow up to $325.0$350.0 million more than we would otherwise be able to absent the receipt of this exemptive relief. On April 16, 2018, as permitted by the Small Business Credit Availability Act, which was signed into law on March 23, 2018, our board of directors, including a majority of our independent directors, approved of our becoming subject to a minimum asset coverage ratio of 150.0%150% from 200% under Sections 18(a)(1) and 18(a)(2) of the Investment Company Act, as amended. The 150.0%150% asset coverage ratio became effective on April 16, 2019.
As of February 28, 2022, our29, 2024, SBIC LP subsidiary had $75.0$0.0 million in regulatory capital and $86.0$0.0 million SBA-guaranteed debentures outstanding and ouroutstanding. SBIC II LP subsidiary had $87.5 million in regulatory capital and $99.0$175.0 million SBA-guaranteed debentures outstanding. SBIC III LP had $66.7 million in regulatory capital and $39.0 million SBA-guaranteed debentures outstanding.
Unsecured notes
In May 2013, the Company issued $48.3 million in aggregate principal amount of 7.50% fixed-rate notes due 2020 (the “2020 Notes”). The 20207.25% 2025 Notes were redeemed in full on January 13, 2017 and are no longer listed on the NYSE.
On May 29, 2015, we entered into a Debt Distribution Agreement with Ladenburg Thalmann & Co. through which we may offer for sale, from time to time, up to $20.0 million in aggregate principal amount of the 2020 Notes through an ATM offering. Prior to the 2020 Notes being redeemed in full, the Company had sold 539,725 bonds with a principal of $13.5 million at an average price of $25.31 for aggregate net proceeds of $13.4 million (net of transaction costs).
On December 21, 2016, we issued $74.5 million in aggregate principal amount of our 2023 Notes for net proceeds of $71.7 million after deducting underwriting commissions of approximately $2.3 million and offering costs of approximately $0.5 million. The net proceeds from the offering were used to repay all of the outstanding indebtedness under the 2020 Notes on January 13, 2017, which amounted to $61.8 million, and for general corporate purposes in accordance with our investment objective and strategies. On December 21, 2019 and February 7, 2020, the Company redeemed $50.0 million and $24.5 million, respectively, in aggregate principal amount of the $74.5 million in aggregate principal amount of issued and outstanding 2023 Notes and are no longer listed on the NYSE.
On August 28, 2018, the Company issued $40.0 million in aggregate principal amount of our 6.25% fixed-rate notes due 2025 (the “6.25% 2025 Notes”) for net proceeds of $38.7 million after deducting underwriting commissions of approximately $1.3 million. Offering costs incurred were approximately $0.3 million. The issuance included the full exercise of the underwriters’ option to purchase an additional $5.0 million aggregate principal amount of 6.25% 2025 Notes within 30 days. Interest on the 6.25% 2025 Notes is paid quarterly in arrears on February 28, May 31, August 31 and November 30, at a rate of 6.25% per year, beginning November 30, 2018. The 6.25% 2025 Notes mature on August 31, 2025 and commencing August 28, 2021, may be redeemed in whole or in part at any time or from time to time at our option. The net proceeds from the offering were used for general corporate purposes in accordance with our investment objective and strategies. Financing costs of $1.6 million related to the 6.25% 2025 Notes have been capitalized and are being amortized over the term of the 6.25% 2025 Notes. The 6.25% 2025 Notes are no longer listed on the NYSE under the trading symbol “SAF” with a par value of $25.00 per share.
On February 5, 2019, the Company completed a re-opening and up-sizing of its existing 6.25% 2025 Notes by issuing an additional $20.0 million in aggregate principal amount for net proceeds of $19.2 million after deducting underwriting commissions of approximately $0.6 million and discount of $0.2 million. Offering costs incurred were approximately $0.2 million. The issuance included the full exercise of the underwriters’ option to purchase an additional $2.5 million aggregate principal amount of 6.25% 2025 Notes within 30 days. Interest rate, interest payment dates and maturity remain unchanged from the existing 6.25% 2025 Notes issued in August 2018. The net proceeds from this offering were used for general corporate purposes in accordance with our investment objective and strategies. The financing costs and discount of $1.0 million related to the 6.25% 2025 Notes have been capitalized and are being amortized over the term of the 6.25% 2025 Notes.
On August 31, 2021, the Company redeemed $60.0 million in aggregate principal amount of the issued and outstanding 6.25% 2025 Notes at par, plus the accrued and unpaid interest thereon, through, but excluding, the redemption date of August 31, 2021. The 6.25% 2025 Notes were listed on the NYSE under the trading symbol of “SAF” with a par value of $25.00 per share and effective as of August 31, 2021, have been delisted following the redemption.
On June 24, 2020, the Companywe issued $37.5 million in aggregate principal amount of our 7.25% fixed-rate notes due 2025 (the “7.25% 2025 Notes”)Notes for net proceeds of $36.3 million after deducting underwriting commissions of approximately $1.2 million. Offering costs incurred were approximately $0.2$0.3 million. On July 6, 2020, the underwriters exercised their option in full to purchase an additional $5.625 million in aggregate principal amount of its 7.25% unsecured notes due 2025.2025 Notes. Net proceeds to the Company were $5.4 million after deducting underwriting commissions of approximately $0.2 million. Interest on the 7.25% 2025 Notes is paid quarterly in arrears on February 28, May 31, August 31 and November 30, at a rate of 7.25% per year, beginning August 31, 2020. The 7.25% 2025 Notes mature on June 30, 2025 and commencing June 24, 2022, may be redeemed in whole or in part at any time or from time to time at our option. The net proceeds from the offering were used for general corporate purposes in accordance with our investment objective and strategies. Financing costs of $1.6 million related to the 7.25% 2025 Notes have been capitalized and are beingwere amortized over the term of the 7.25% 2025 Notes. The Company has received an investment grade private rating
On July 14, 2022, we redeemed $43.1 million in aggregate principal amount of “BBB+” from Egan-Jones Ratings Company, an independent, unaffiliated rating agency.the issued and outstanding 7.25% 2025 Notes. The 7.25% 2025 Notes arewere listed on the NYSE under the trading symbol of “SAK” with a par value of $25.00 per share.and have been delisted following the full redemption on July 14, 2022.
At February 28, 2022,29, 2024, the total 7.25% 2025 Notes outstanding was $43.1$0.0 million.
7.75% 2025 Notes
On July 9, 2020, the Companywe issued $5.0 million aggregate principal amount of our 7.75% fixed-rate Notesnotes due in 2025 (the “7.75% 2025 Notes”) for net proceeds of $4.8 million after deducting underwriting commissions of approximately $0.2 million. Offering costs incurred were approximately $0.1 million. Interest on the 7.75% 2025 Notes 2025 is paid quarterly in arrears on February 28, May 31, August 31 and November 30, at a rate of 7.75% per year, beginning August 31, 2020.year. The 7.75% 2025 Notes 2025 mature on July 9, 2025 and may be redeemed in whole or in part at any time or from time to time at our option.option, subject to a fee depending on the date of repayment. The net proceeds from the offering were used for general corporate purposes in accordance with our investment objective and strategies. Financing costs of $0.3 million related to the 7.75% 2025 Notes 2025 have been capitalized and are being amortized over the term of the Notes. The 7.75% 2025 Notes are unlistednot listed and have a par value of $25.00 per share.note.
At February 28, 2022,29, 2024, the total 7.75% 2025 Notes outstanding was $5.0 million.
6.25% 2027 Notes
On December 29, 2020, the Companywe issued $5.0 million in aggregate principal amount of our 6.25% fixed-rate Notesnotes due in 2027 (the “6.25% Notes 2027”2027 Notes”). Offering costs incurred were approximately $0.1 million. Interest on the 6.25% 2027 Notes 2027 is paid quarterly in arrears on February 28, May 31, August 31 and November 30, at a rate of 6.25% per year, beginning February 28, 2021.year. The 6.25% 2027 Notes 2027 mature on December 29, 2027 and may be redeemed in whole or in part at any time or from time to time at our option, on or after December 29, 2024. The net proceeds from the offering were used for general corporate purposes in accordance with our investment objective and strategies. Financing costs of $0.1 million related to the 6.25% 2027 Notes 2027 have been capitalized and are being amortized over the term of the Notes.
On January 28, 2021, the Companywe issued an additional $10.0 million in aggregate principal amount of the Second 6.25% 2027 Notes 2027 for net proceeds of $9.7 million after deducting underwriting commissions of approximately $0.3 million.million (the “Additional 6.25% 2027 Notes”). The Additional 6.25% 2027 Notes are treated as a single series with the existing 6.25% 2027 Notes under the indenture and have the same terms as the existing 6.25% 2027 Notes. Offering costs incurred were approximately $0.0$0.1 million. Interest on the 6.25% 2027 Notes 2027 is paid quarterly in arrears on February 28, May 31, August 31 and November 30, at a rate of 6.25% per year. The 6.25% 2027 Notes 2027 mature on January 28, 2027 and commencing January 28, 2023, may be redeemed in whole or in part at any time or from time to time at our option on or after December 29, 2024. The net proceeds from the offering were used for general corporate purposes in accordance with our investment objective and strategies. Financing costs of $0.3$0.4 million related to the 6.25% 2027 Notes 2027 have been capitalized and are being amortized over the term of the 6.25% 2027 Notes. The 6.25% 2027 Notes are not listed and have a par value of $25.00 per note.
At February 28, 2022,29, 2024, the total 6.25% 2025 Notes outstanding was $15.0 million.
4.375% 2026 Notes
On March 10, 2021, the Companywe issued $50.0 million in aggregate principal amount of the 4.375% Notesfixed rate notes due 2026 (the “4.375% 2026 Notes”) for net proceeds of $49.0 million after deducting underwriting commissions of approximately $1.0 million. Offering costs incurred were approximately $0.2$0.3 million. Interest on the 4.375% 2026 Notes 2026 is paid semi-annually in arrears on February 28 and August 28, at a rate of 4.375% per year. The 4.375% 2026 Notes 2026 mature on February 28, 2026 and may be redeemed in whole or in part at any time on or after November 28, 2025 at par plus a “make-whole” premium, orand thereafter at par. The net proceeds from the offering were used for general corporate purposes in accordance with our investment objective and strategies. Financing costs of $1.2 million related to the 4.375% 2026 Notes 2026 have been capitalized and are being amortized over the term of the 4.375% 2026 Notes.
On July 15, 2021, the Companywe issued an additional $125.0 million in aggregate principal amount of the Company’s 4.375% 2026 Notes 2026 (the “Additional 4.375% 2026 Notes”) for net proceeds for approximately $123.5 million, based on the public offering price of 101.00% of the aggregate principal amount of the Additional 4.375% 2026 Notes, after deducting the underwriting discount of $2.5 million and the estimated offering expenses of approximately $0.2 million payable by the Company. The net proceeds from the offering were used to redeem all of the outstanding 6.25% 2025 Notes (as described above), and for general corporate purposes in accordance with our investment objective and strategies. The Additional 4.375% 2026 Notes wereare treated as a single series with the existing 4.375% 2026 Notes under the indenture and hadhave the same terms as the existing 4.375% 2026 Notes.
At February 28, 202229, 2024 the total 4.375% Notes outstanding was $175.0 million.
4.35% 2027 Notes
On January 19, 2022, the Companywe issued $75.0 million in aggregate principal amount of our 4.35% fixed-rate Notes due in 2027 (the “4.35% Notes 2027”2027 Notes”) for net proceeds of $73.0 million, based on the public offering price of 99.317% of the aggregate principal amount of the 4.35% 2027 Notes, 2027, after deducting the underwriting commissions of approximately $1.5 million. Offering costs incurred were approximately $0.2$0.3 million. Interest on the 4.35% 2027 Notes 2027 is paid semi-annually in arrears on February 28 and August 28, at a rate of 4.35% per year, beginning August 28, 2022.year. The 4.35% 2027 Notes 2027 mature on February 28, 2027 and may be redeemed in whole or in part at the Company’sour option at any time prior to November 28, 2026, at par plus a “make-whole” premium, and thereafter at par. The net proceeds from the offering were used for general corporate purposes in accordance with our investment objective and strategies. Financing costs of $1.7$1.8 million related to the 4.35% 2027 Notes 2027 have been capitalized and are being amortized over the term of the 4.35% 2027 Notes.
At February 28, 202229, 2024 the total 4.35% Notes outstanding was $75.0 million.
At February 28, 2022 and February 28, 2021, the fair value of total cash and cash equivalents, cash and cash equivalents in reserve accounts and total investments by major category are as follows:
| February 28, 2022 | February 28, 2021 | |||||||||||||||
| Fair Value | Percentage of Total | Fair Value | Percentage of Total | |||||||||||||
| ($ in thousands) | ||||||||||||||||
| Cash and cash equivalents | $ | 47,258 | 5.4 | % | $ | 18,828 | 3.2 | % | ||||||||
| Cash and cash equivalents, reserve accounts | 5,613 | 0.6 | 11,087 | 1.9 | ||||||||||||
| First lien term loans | 631,573 | 72.6 | 440,456 | 75.4 | ||||||||||||
| Second lien term loans | 44,385 | 5.1 | 24,930 | 4.3 | ||||||||||||
| Structured finance securities | 38,030 | 4.4 | 49,779 | 8.5 | ||||||||||||
| Unsecured loan | 15,931 | 1.8 | 2,141 | 0.4 | ||||||||||||
| Equity interests | 87,648 | 10.1 | 37,007 | 6.3 | ||||||||||||
| Total | $ | 870,438 | 100.0 | % | $ | 584,228 | 100.0 | % | ||||||||
On July 13, 2018, the Company issued 1,150,000 shares of its common stock priced at $25.00 per share (par value $0.001 per share) at an aggregate total of $28.75 million. The net proceeds, after deducting underwriting commissions of $1.15 million and offering costs of approximately $0.2 million, amounted to approximately $27.4 million. The Company also granted the underwriters a 30-day option to purchase up to an additional 172,500 shares of its common stock, which was not exercised.
On March 16, 2017, we entered into an equity distribution agreement with Ladenburg Thalmann & Co. Inc., through which we may offer for sale, from time to time, up to $30.0 million of our common stock through an ATM offering. Subsequent to this, BB&T Capital Markets and B. Riley FBR, Inc. were added to the equity ATM program. On July 11, 2019, the amount of the common stock to be offered was increased to $70.0 million, and on October 8, 2019, the amount of the common stock to be offered was increased to $130.0 million. This agreement was terminated as of July 29, 2021, and as of that date, the Company had sold 3,922,018 shares for gross proceeds of $97.1 million at an average price of $24.77 for aggregate net proceeds of $95.9 million (net of transaction costs).
On July 30, 2021, we entered into an equity distribution agreement with Ladenburg Thalmann & Co. Inc. and Compass Point Research and Trading, LLC (the “Agents”), through which we may offer for sale, from time to time, up to $150.0 million of our common stock through the Agents, or to them, as principal for their account. As of February 28, 2022, the Company sold 4,840,361 shares for gross proceeds of $123.9 million at an average price of $25.61 for aggregate net proceeds of $122.4 million (net of transaction costs). During the three months ended February 28, 2022, the Company sold 392,826 shares for gross proceeds of $11.5 million at an average price of $29.31 for aggregate net proceeds of $11.4 million (net of transaction cost). During the year ended February 28, 2022, the Company sold 918,343 shares for gross proceeds of $26.8 million at an average price of $29.22 for aggregate net proceeds of $26.6 million (net of transaction cost).
On September 24, 2014, the Company announced the approval of an open market share repurchase plan that allowed it to repurchase up to 200,000 shares of its common stock at prices below its NAV as reported in its then most recently published consolidated financial statements (the “Share Repurchase Plan”). On October 7, 2015, our board of directors extended the Share Repurchase Plan for another year and increased the number of shares the Company is permitted to repurchase at prices below its NAV, as reported in its then most recently published consolidated financial statements, to 400,000 shares of its common stock. On October 5, 2016, our board of directors extended the Share Repurchase Plan for another year to October 15, 2017 and increased the number of shares the Company is permitted to repurchase at prices below its NAV, as reported in its then most recently published consolidated financial statements, to 600,000 shares of its common stock. On October 10, 2017, January 8, 2019 and January 7, 2020, our board of directors extended the Share Repurchase Plan for another year to October 15, 2018, January 15, 2020 and January 15, 2021, respectively, each time leaving the number of shares unchanged at 600,000 shares of its common stock. On May 4, 2020, our board of directors increased the Share Repurchase Plan to 1.3 million shares of common stock. On January 5, 2021, our board of directors extended the Share Repurchase Plan for another year to January 15, 2022, leaving the number of shares unchanged at 1.3 million shares of common stock. On January 4, 2022, our board of directors extended the Share Repurchase Plan for another year to January 15, 2023, leaving the number of shares unchanged. As of February 28, 2022, the Company purchased 508,435 shares of common stock, at the average price of $19.35 for approximately $9.8 million pursuant to the Share Repurchase Plan. During the three months ended February 28, 2022 the Company purchased 50,00 shares of common stock, at the average price $25.86 for approximately $1.3 million pursuant to the Share Repurchase Plan. During the year ended February 28, 2022 the Company purchased 99,623 shares of common stock, at the average price $25.55 for approximately $2.5 million pursuant to the Share Repurchase Plan.6.00% 2027 Notes
On February 24, 2022, the Company declared a dividend of $0.53 per share payable on March 28, 2022, to common stockholders of record on March 14, 2022. Shareholders have the option to receive payment of the dividend in cash, or receive shares of common stock, pursuant to the Company’s DRIP. Based on shareholder elections, the dividend consisted of approximately $5.3 million in cash and 42,825 newly issued shares of common stock, or 0.4% of our outstanding common stock prior to the dividend payment. The number of shares of common stock comprising the stock portion was calculated based on a price of $25.89 per share, which equaled 95% of the volume weighted average trading price per share of the common stock on March 15, 16, 17, 18, 21, 22, 23, 24, 25 and 28, 2022.
On November 30, 2021, the Company declared a dividend of $0.53 per share payable on January 19, 2022, to common stockholders of record on January 4, 2021. Shareholders have the option to receive payment of the dividend in cash, or receive shares of common stock, pursuant to the Company’s DRIP. Based on shareholder elections, the dividend consisted of approximately $5.3 million in cash and 41,520 newly issued shares of common stock, or 0.3% of our outstanding common stock prior to the dividend payment. The number of shares of common stock comprising the stock portion was calculated based on a price of $26.85 per share, which equaled 95% of the volume weighted average trading price per share of the common stock on January 5, 6, 7, 10, 11, 12, 13, 14, 18 and 19, 2022.
On August 26, 2021, the Company declared a dividend of $0.52 per share payable on September 28, 2021, to common stockholders of record on September 14, 2021. Shareholders have the option to receive payment of the dividend in cash, or receive shares of common stock, pursuant to the Company’s DRIP. Based on shareholder elections, the dividend consisted of approximately $4.9 million in cash and 38,016 newly issued shares of common stock, or 0.3% of our outstanding common stock prior to the dividend payment. The number of shares of common stock comprising the stock portion was calculated based on a price of $26.77 per share, which equaled 95% of the volume weighted average trading price per share of the common stock on September 15, 16, 17, 20, 21, 22, 23, 24, 27 and 28, 2021.
On May 27, 2021, the Company declared a dividend of $0.44 per share payable on June 29, 2021, to common stockholders of record on June 15, 2021. Shareholders have the option to receive payment of the dividend in cash, or receive shares of common stock, pursuant to the Company’s DRIP. Based on shareholder elections, the dividend consisted of approximately $4.1 million in cash and 33,100 newly issued shares of common stock, or 0.3% of our outstanding common stock prior to the dividend payment. The number of shares of common stock comprising the stock portion was calculated based on a price of $25.03 per share, which equaled 95% of the volume weighted average trading price per share of the common stock on June 16, 17, 18, 21, 22, 23, 24, 25, 28 and 29, 2021.
On March 22, 2021, the Company declared a dividend of $0.43 per share payable on April 22, 2021, to common stockholders of record on April 8, 2021. Shareholders have the option to receive payment of the dividend in cash, or receive shares of common stock, pursuant to the Company’s DRIP. Based on shareholder elections, the dividend consisted of approximately $3.9 million in cash and 38,580 newly issued shares of common stock, or 0.3% of our outstanding common stock prior to the dividend payment. The number of shares of common stock comprising the stock portion was calculated based on a price of $23.69 per share, which equaled 95% of the volume weighted average trading price per share of the common stock on April 9,12, 13, 14, 15, 16, 19, 20, 21 and 22, 2021.
On January 5, 2021, our board of directors declared a dividend of $0.42 per share, which was paid on February 10, 2021, to common stockholders of record as of January 26, 2021. Shareholders had the option to receive payment of the dividend in cash, or receive shares of common stock, pursuant to the DRIP. Based on shareholder elections, the dividend consisted of approximately $3.8 million in cash and 41,388 newly issued shares of common stock, or 0.4% of our outstanding common stock prior to the dividend payment. The number of shares of common stock comprising the stock portion was calculated based on a price of $21.75 per share, which equaled 95% of the volume weighted average trading price per share of the common stock on January 28, 29 and February 1, 2, 3, 4, 5, 8, 9 and 10, 2021.
On October 7, 2020, our board of directors declared a dividend of $0.41 per share, which was paid on November 10, 2020, to common stockholders of record as of October 26, 2020. Shareholders had the option to receive payment of the dividend in cash, or receive shares of common stock, pursuant to the DRIP. Based on shareholder elections, the dividend consisted of approximately $3.8 million in cash and 45,706 newly issued shares of common stock, or 0.4% of our outstanding common stock prior to the dividend payment. The number of shares of common stock comprising the stock portion was calculated based on a price of $17.63 per share, which equaled 95% of the volume weighted average trading price per share of the common stock on October 28, 29, 30 and November 2, 3, 4, 5, 6, 9 and 10, 2020.
On July 7, 2020, the Company declared a dividend of $0.40 per share payable on August 12, 2020, to common stockholders of record on July 27, 2020. Shareholders have the option to receive payment of the dividend in cash, or receive shares of common stock, pursuant to the Company’s DRIP. Based on shareholder elections, the dividend consisted of approximately $3.7 million in cash and 47,098 newly issued shares of common stock, or 0.4% of our outstanding common stock prior to the dividend payment. The number of shares of common stock comprising the stock portion was calculated based on a price of $16.45 per share, which equaled 95.0% of the volume weighted average trading price per share of the common stock on July 30, 31 and August 3, 4, 5, 6, 7, 10, 11 and 12, 2020.
During the three months ended May 31, 2020, there were no dividends declared.
On January 7, 2020, the Company declared a dividend of $0.56 per share, which was paid on February 6, 2020, to common stockholders of record on January 24, 2020. Shareholders had the option to receive payment of the dividend in cash, or receive shares of common stock, pursuant to the Company’s DRIP. Based on shareholder elections, the dividend consisted of approximately $5.4 million in cash and 35,682 newly issued shares of common stock, or 0.3% of our outstanding common stock prior to the dividend payment. The number of shares of common stock comprising the stock portion was calculated based on a price of $25.44 per share, which equaled 95.0% of the volume weighted average trading price per share of the common stock on January 24, 27, 28, 29, 30, 31 and February 3, 4, 5 and 6, 2020.
On August 27, 2019, the Company declared a dividend of $0.56 per share, which was paid on September 26, 2019, to common stockholders of record on September 13, 2019. Shareholders had the option to receive payment of the dividend in cash, or receive shares of common stock, pursuant to the Company’s DRIP. Based on shareholder elections, the dividend consisted of approximately $4.5 million in cash and 34,575 newly issued shares of common stock, or 0.4% of our outstanding common stock prior to the dividend payment. The number of shares of common stock comprising the stock portion was calculated based on a price of $23.34 per share, which equaled 95.0% of the volume weighted average trading price per share of the common stock on September 13, 16, 17, 18, 19, 20, 23, 24, 25 and 26, 2019.
On May 28, 2019, our board of directors declared a dividend of $0.55 per share, which was paid on June 27, 2019, to common stockholders of record as of June 13, 2019. Shareholders had the option to receive payment of the dividend in cash, or receive shares of common stock, pursuant to the DRIP. Based on shareholder elections, the dividend consisted of approximately $3.6 million in cash and 31,545 newly issued shares of common stock, or 0.4% of our outstanding common stock prior to the dividend payment. The number of shares of common stock comprising the stock portion was calculated based on a price of $22.65 per share, which equaled 95.0% of the volume weighted average trading price per share of the common stock on June 14, 17, 18, 19, 20, 21, 24, 25, 26 and 27, 2019.
On February 26, 2019, our board of directors declared a dividend of $0.54 per share, which was paid on March 28, 2019, to common stockholders of record as of March 14, 2019. Shareholders had the option to receive payment of the dividend in cash, or receive shares of common stock, pursuant to the DRIP. Based on shareholder elections, the dividend consisted of approximately $3.5 million in cash and 31,240 newly issued shares of common stock, or 0.4% of our outstanding common stock prior to the dividend payment. The number of shares of common stock comprising the stock portion was calculated based on a price of $21.36 per share, which equaled 95.0% of the volume weighted average trading price per share of the common stock on March 15, 18, 19, 20, 21, 22, 25, 26, 27 and 28, 2019.
On November 27, 2018, our board declared a dividend of $0.53 per share payable on January 2, 2019, to common stockholders of record on December 17, 2018. Shareholders had the option to receive payment of the dividend in cash, or receive shares of common stock, pursuant to the Company’s DRIP. Based on shareholder elections, the dividend consisted of approximately $3.4 million in cash and 30,796 newly issued shares of common stock, or 0.4% of our outstanding common stock prior to the dividend payment. The number of shares of common stock comprising the stock portion was calculated based on a price of $18.88 per share, which equaled 95.0% of the volume weighted average trading price per share of the common stock on December 18, 19, 20, 21, 24, 26, 27, 28, 31, 2018 and January 2, 2019.
On August 28, 2018, our board of directors declared a dividend of $0.52 per share, which was paid on September 27, 2018, to common stockholders of record as of September 17, 2018. Shareholders had the option to receive payment of the dividend in cash, or receive shares of common stock, pursuant to the DRIP. Based on shareholder elections, the dividend consisted of approximately $3.3 million in cash and 25,862 newly issued shares of common stock, or 0.3% of our outstanding common stock prior to the dividend payment. The number of shares of common stock comprising the stock portion was calculated based on a price of $22.35 per share, which equaled 95.0% of the volume weighted average trading price per share of the common stock on September 14, 17, 18, 19, 20, 21, 24, 25, 26 and 27, 2018.
On May 30, 2018, our board of directors declared a dividend of $0.51 per share, which was paid on June 27, 2018, to common stockholders of record as of June 15, 2018. Shareholders had the option to receive payment of the dividend in cash, or receive shares of common stock, pursuant to the DRIP. Based on shareholder elections, the dividend consisted of approximately $2.7 million in cash and 21,562 newly issued shares of common stock, or 0.3% of our outstanding common stock prior to the dividend payment. The number of shares of common stock comprising the stock portion was calculated based on a price of $23.72 per share, which equaled 95.0% of the volume weighted average trading price per share of the common stock on June 14, 15, 18, 19, 20, 21, 22, 25, 26 and 27, 2018.
On February 26, 2018, our board of directors declared a dividend of $0.50 per share, which was paid on March 26, 2018, to common stockholders of record as of March 14, 2018. Shareholders had the option to receive payment of the dividend in cash, or receive shares of common stock, pursuant to the DRIP. Based on shareholder elections, the dividend consisted of approximately $2.6 million in cash and 25,354 newly issued shares of common stock, or 0.4% of our outstanding common stock prior to the dividend payment. The number of shares of common stock comprising the stock portion was calculated based on a price of $19.91 per share, which equaled 95.0% of the volume weighted average trading price per share of the common stock on March 13, 14, 15, 16, 19, 20, 21, 22, 23 and 26, 2018.
On November 29, 2017, our board of directors declared a dividend of $0.49 per share payable on December 27, 2017, to common stockholders of record on December 15, 2017. Shareholders had the option to receive payment of the dividend in cash, or receive shares of common stock, pursuant to the DRIP. Based on shareholder elections, the dividend consisted of approximately $2.5 million in cash and 25,435 newly issued shares of common stock, or 0.4% of our outstanding common stock prior to the dividend payment. The number of shares of common stock comprising the stock portion was calculated based on a price of $21.14 per share, which equaled 95.0% of the volume weighted average trading price per share of the common stock on December 13, 14, 15, 18, 19, 20, 21, 22, 26 and 27, 2017.
On August 28, 2017, our board of directors declared a dividend of $0.48 per share payable on September 26, 2017, to common stockholders of record on September 15, 2017. Shareholders had the option to receive payment of the dividend in cash, or receive shares of common stock, pursuant to the DRIP. Based on shareholder elections, the dividend consisted of approximately $2.2 million in cash and 33,551 newly issued shares of common stock, or 0.6% of our outstanding common stock prior to the dividend payment. The number of shares of common stock comprising the stock portion was calculated based on a price of $20.19 per share, which equaled 95.0% of the volume weighted average trading price per share of the common stock on September 13, 14, 15, 18, 19, 20, 21, 22, 25 and 26, 2017.
On May 30, 2017, our board of directors declared a dividend of $0.47 per share which was paid on June 27, 2017, to common stockholders of record on June 15, 2017. Shareholders had the option to receive payment of the dividend in cash, or receive shares of common stock, pursuant to the DRIP. Based on shareholder elections, the dividend consisted of approximately $2.3 million in cash and 26,222 newly issued shares of common stock, or 0.4% of our outstanding common stock prior to the dividend payment. The number of shares of common stock comprising the stock portion was calculated based on a price of $20.04 per share, which equaled 95.0% of the volume weighted average trading price per share of the common stock on June 14, 15, 16, 19, 20, 21, 22, 23, 26 and 27, 2017.
On February 28, 2017, our board of directors declared a dividend of $0.46 per share, which was paid on March 28, 2017, to common stockholders of record as of March 15, 2017. Shareholders had the option to receive payment of the dividend in cash, or receive shares of common stock, pursuant to the DRIP. Based on shareholder elections, the dividend consisted of approximately $2.0 million in cash and 29,096 newly issued shares of common stock, or 0.5% of our outstanding common stock prior to the dividend payment. The number of shares of common stock comprising the stock portion was calculated based on a price of $21.38 per share, which equaled 95.0% of the volume weighted average trading price per share of the common stock on March 15, 16, 17, 20, 21, 22, 23, 24, 27 and 28, 2017.
On January 12, 2017, our board of directors declared a dividend of $0.45 per share, which was paid on February 9, 2017, to common stockholders of record as of January 31, 2017. Shareholders had the option to receive payment of the dividend in cash, or receive shares of common stock, pursuant to the DRIP. Based on shareholder elections, the dividend consisted of approximately
$1.6 million in cash and 50,453 newly issued shares of common stock, or 0.9% of our outstanding common stock prior to the dividend payment. The number of shares of common stock comprising the stock portion was calculated based on a price of $20.25 per share, which equaled 95.0% of the volume weighted average trading price per share of the common stock on January 27, 30, 31 and February 1, 2, 3, 6, 7, 8 and 9, 2017.
On October 5, 2016, our board of directors declared a dividend of $0.44 per share, which was paid on November 9, 2016, to common stockholders of record as of October 31, 2016. Shareholders had the option to receive payment of the dividend in cash, or receive shares of common stock, pursuant to the DRIP. Based on shareholder elections, the dividend consisted of approximately
$1.5 million in cash and 58,548 newly issued shares of common stock, or 1.0% of our outstanding common stock prior to the dividend payment. The number of shares of common stock comprising the stock portion was calculated based on a price of $17.12 per share, which equaled 95.0% of the volume weighted average trading price per share of the common stock on October 27, 28, 31 and November 1, 2, 3, 4, 7, 8 and 9, 2016.
On August 8, 2016, our board of directors declared a special dividend of $0.20 per share, which was paid on September 5, 2016, to common stockholders of record as of August 24, 2016. Shareholders had the option to receive payment of the dividend in cash, or receive shares of common stock, pursuant to the DRIP. Based on shareholder elections, the dividend consisted of approximately $0.7 million in cash and 24,786 newly issued shares of common stock, or 0.4% of our outstanding common stock prior to the dividend payment. The number of shares of common stock comprising the stock portion was calculated based on a price of $17.06 per share, which equaled 95.0% of the volume weighted average trading price per share of the common stock on August 22, 23, 24, 25, 26, 29, 30, 31 and September 1 and 2, 2016.
On July 7, 2016, our board of directors declared a dividend of $0.43 per share, which was paid on August 9, 2016, to common stockholders of record as of July 29, 2016. Shareholders had the option to receive payment of the dividend in cash, or receive shares of common stock, pursuant to the DRIP. Based on shareholder elections, the dividend consisted of approximately $1.5 million in cash and 58,167 newly issued shares of common stock, or 1.0% of our outstanding common stock prior to the dividend payment. The number of shares of common stock comprising the stock portion was calculated based on a price of $16.32 per share, which equaled 95.0% of the volume weighted average trading price per share of the common stock on July 27, 28, 29 and August 1, 2, 3, 4, 5, 8 and 9, 2016.
On March 31, 2016, our board of directors declared a dividend of $0.41 per share, which was paid on April 27, 2016, to common stockholders of record as of April 15, 2016. Shareholders had the option to receive payment of the dividend in cash, or receive shares of common stock, pursuant to the DRIP. Based on shareholder elections, the dividend consisted of approximately $1.5 million in cash and 56,728 newly issued shares of common stock, or 1.0% of our outstanding common stock prior to the dividend payment. The number of shares of common stock comprising the stock portion was calculated based on a price of $15.43 per share, which equaled 95.0% of the volume weighted average trading price per share of the common stock on April 14, 15, 18, 19, 20, 21, 22, 25, 26 and 27, 2016.
On January 12, 2016, our board of directors declared a dividend of $0.40 per share, which was paid on February 29, 2016, to common stockholders of record as of February 1, 2016. Shareholders had the option to receive payment of the dividend in cash, or receive shares of common stock, pursuant to the DRIP. Based on shareholder elections, the dividend consisted of approximately $1.4 million in cash and 66,765 newly issued shares of common stock, or 1.2% of our outstanding common stock prior to the dividend payment. The number of shares of common stock comprising the stock portion was calculated based on a price of $13.11 per share, which equaled 95.0% of the volume weighted average trading price per share of the common stock on February 16, 17, 18, 19, 22, 23, 24, 25, 26 and 29, 2016.
On October 7, 2015, our board of directors declared a dividend of $0.36 per share, which was paid on November 30, 2015, to common stockholders of record as of November 2, 2015. Shareholders had the option to receive payment of the dividend in cash, or receive shares of common stock, pursuant to the DRIP. Based on shareholder elections, the dividend consisted of approximately $1.1 million in cash and 61,029 newly issued shares of common stock, or 1.1% of our outstanding common stock prior to the dividend payment. The number of shares of common stock comprising the stock portion was calculated based on a price of $14.53 per share, which equaled 95.0% of the volume weighted average trading price per share of the common stock on November 16, 17, 18, 19, 20, 23, 24, 25, 27 and 30, 2015.
On July 8, 2015, our board of directors declared a dividend of $0.33 per share, which was paid on August 31, 2015, to common stockholders of record as of August 3, 2015. Shareholders had the option to receive payment of the dividend in cash, or receive shares of common stock, pursuant to the DRIP. Based on shareholder elections, the dividend consisted of approximately $1.1 million in cash and 47,861 newly issued shares of common stock, or 0.9% of our outstanding common stock prior to the dividend payment. The number of shares of common stock comprising the stock portion was calculated based on a price of $15.28 per share, which equaled 95.0% of the volume weighted average trading price per share of the common stock on August 18, 19, 20, 21, 24, 25, 26, 27, 28 and 31, 2015.
On May 14, 2015, our board of directors declared a special dividend of $1.00 per share, which was paid on June 5, 2015, to common stockholders of record on as of May 26, 2015. Shareholders had the option to receive payment of the dividend in cash, or receive shares of common stock, pursuant to the DRIP. Based on shareholder elections, the dividend consisted of approximately $3.4 million in cash and 126,230 newly issued shares of common stock, or 2.3% of our outstanding common stock prior to the dividend payment. The number of shares of common stock comprising the stock portion was calculated based on a price of $16.47 per share, which equaled 95.0% of the volume weighted average trading price per share of the common stock on May 22, 26, 27, 28, 29 and June 1, 2, 3, 4, and 5, 2015.
On April 9, 2015, our board of directors declared a dividend of $0.27 per share, which was paid on May 29, 2015, to common stockholders of record as of May 4, 2015. Shareholders had the option to receive payment of the dividend in cash, or receive shares of common stock, pursuant to the DRIP. Based on shareholder elections, the dividend consisted of approximately $0.9 million in cash and 33,766 newly issued shares of common stock, or 0.6% of our outstanding common stock prior to the dividend payment. The number of shares of common stock comprising the stock portion was calculated based on a price of $16.78 per share, which equaled 95.0% of the volume weighted average trading price per share of the common stock on May 15, 18, 19, 20, 21, 22, 26, 27, 28 and 29, 2015.
On September 24, 2014, our board of directors declared a dividend of $0.22 per share, which was paid on February 27, 2015, to common stockholders of record on February 2, 2015. Shareholders have the option to receive payment of the dividend in cash, or receive shares of common stock, pursuant to the DRIP. Based on shareholder elections, the dividend consisted of approximately $0.8 million in cash and 26,858 newly issued shares of common stock, or 0.5% of our outstanding common stock prior to the dividend payment. The number of shares of common stock comprising the stock portion was calculated based on a price of $14.97 per share, which equaled 95.0% of the volume weighted average trading price per share of the common stock on February 13, 17, 18, 19, 20, 23, 24, 25, 26 and 27, 2015.
Also, on September 24, 2014, our board of directors declared a dividend of $0.18 per share, which was paid on November 28, 2014, to common stockholders of record on November 3, 2014. Shareholders had the option to receive payment of the dividend in cash, or receive shares of common stock pursuant to the DRIP. Based on shareholder elections, the dividend consisted of approximately $0.6 million in cash and 22,283 newly issued shares of common stock, or 0.4% of our outstanding common stock prior to the dividend payment. The number of shares of common stock comprising the stock portion was calculated based on a price of $14.37 per share, which equaled 95.0% of the volume weighted average trading price per share of the common stock on November 14, 17, 18, 19, 20, 21, 24, 25, 26 and 28, 2014.
On October 30, 2013, our board of directors declared a dividend of $2.65 per share, which was paid on December 27, 2013, to common stockholders of record as of November 13, 2013. Shareholders had the option to receive payment of the dividend in cash, shares of common stock, or a combination of cash and shares of common stock, provided that the aggregate cash payable to all shareholders was limited to approximately $2.5 million or $0.53 per share. This dividend was declared in reliance on certain private letter rulings issued by the IRS concluding that a RIC may treat a distribution of its own stock as fulfilling its RIC distribution requirements if each stockholder may elect to receive his or her entire distribution in either cash or stock of the RIC subject to a limitation on the aggregate amount of cash to be distributed to all stockholders, which limitation must be at least 20.0% of the aggregate declared distribution. Based on shareholder elections, the dividend consisted of approximately $2.5 million in cash and 649,500 shares of common stock, or 13.7% of our outstanding common stock prior to the dividend payment. The amount of cash elected to be received was greater than the cash limit of 20.0% of the aggregate dividend amount, thus resulting in the payment of a combination of cash and stock to shareholders who elected to receive cash. The number of shares of common stock comprising the stock portion was calculated based on a price of $15.439 per share, which equaled the volume weighted average trading price per share of the common stock on December 11, 13 and 16, 2013.
On November 9, 2012, our board of directors declared a dividend of $4.25 per share, which was paid on December 31, 2012, to common stockholders of record as of November 20, 2012. Shareholders had the option to receive payment of the dividend in cash, shares of common stock, or a combination of cash and shares of common stock, provided that the aggregate cash payable to all shareholders was limited to approximately $3.3 million or $0.85 per share. Based on shareholder elections, the dividend consisted of $3.3 million in cash and 853,455 shares of common stock, or 22.0% of our outstanding common stock prior to the dividend payment. The amount of cash elected to be received was greater than the cash limit of 20.0% of the aggregate dividend amount, thus resulting in the payment of a combination of cash and stock to shareholders who elected to receive cash. The number of shares of common stock comprising the stock portion was calculated based on a price of $15.444 per share, which equaled the volume weighted average trading price per share of the common stock on December 14, 17 and 19, 2012.
On November 15, 2011, our board of directors declared a dividend of $3.00 per share, which was paid on December 30, 2011, to common stockholders of record as of November 25, 2011. Shareholders had the option to receive payment of the dividend in cash, shares of common stock, or a combination of cash and shares of common stock, provided that the aggregate cash payable to all shareholders was limited to $2.0 million or $0.60 per share. Based on shareholder elections, the dividend consisted of $2.0 million in cash and 599,584 shares of common stock, or 18.0% of our outstanding common stock prior to the dividend payment. The amount of cash elected to be received was greater than the cash limit of 20.0% of the aggregate dividend amount, thus resulting in the payment of a combination of cash and stock to shareholders who elected to receive cash. The number of shares of common stock comprising the stock portion was calculated based on a price of $13.117067 per share, which equaled the volume weighted average trading price per share of the common stock on December 20, 21 and 22, 2011.
On November 12, 2010, our board of directors declared a dividend of $4.40 per share to shareholders payable in cash or shares of our common stock, in accordance with the provisions of the IRS Revenue Procedure 2010-12, which allows a publicly-traded regulated investment company to satisfy its distribution requirements with a distribution paid partly in common stock provided that at least 10.0% of the distribution is payable in cash. The dividend was paid on December 29, 2010 to common shareholders of record on November 19, 2010. Based on shareholder elections, the dividend consisted of $1.2 million in cash and 596,235 shares of common stock, or 22.0% of our outstanding common stock prior to the dividend payment. The amount of cash elected to be received was greater than the cash limit of 10.0% of the aggregate dividend amount, thus resulting in the payment of a combination of cash and stock to shareholders who elected to receive cash. The number of shares of common stock comprising the stock portion was calculated based on a price of $17.8049 per share, which equaled the volume weighted average trading price per share of the common stock on December 20, 21 and 22, 2010.
On November 13, 2009, our board of directors declared a dividend of $18.25 per share, which was paid on December 31, 2009, to common stockholders of record as of November 25, 2009. Shareholders had the option to receive payment of the dividend in cash, shares of common stock, or a combination of cash and shares of common stock, provided that the aggregate cash payable to all shareholders was limited to $2.1 million or $0.25 per share. Based on shareholder elections, the dividend consisted of $2.1 million in cash and 864,872.5 shares of common stock, or 104.0% of our outstanding common stock prior to the dividend payment. The amount of cash elected to be received was greater than the cash limit of 13.7% of the aggregate dividend amount, thus resulting in the payment of a combination of cash and stock to shareholders who elected to receive cash. The number of shares of common stock comprising the stock portion was calculated based on a price of $1.5099 per share, which equaled the volume weighted average trading price per share of the common stock on December 24 and 28, 2009.
We cannot provide any assurance that these measures will provide sufficient sources of liquidity to support our operations and growth.
Subsequent Events:
On April 27, 2022, we issued $87.5 million in aggregate principal amount of 6.00% fixed-rate notes due 2027 (the “6.00% 2027 Notes”) for net proceeds of $84.5$84.8 million after deducting underwriting commissions of approximately $2.7 million and offeringmillion. Offering costs ofincurred were approximately $0.3$0.1 million. The issuance includedOn May 10, 2022, the underwriters’underwriters partially exercised their option to purchase an additional $12.5$10.0 million in aggregate principal amount of the 6.00% 2027 Notes within 30 days. The 6.00% 2027 Notes will be listed on the NYSE under the trading symbol “SAT” with a par valueNotes. Net proceeds were $9.7 million after deducting underwriting commissions of $25.00 per share.approximately $0.3 million. Interest on the 6.00% 2027 Notes is paid quarterly in arrears on February 28, May 31, August 31 and November 30, at a rate of 6.00% per year, beginning August 31, 2022.year. The 6.00% 2027 Notes mature on April 30, 2027 and commencing April 27, 2024, may be redeemed in whole or in part at any time or from time to time at our option. The net proceeds from the offering were used for general corporate purposes in accordance with our investment objective and strategies. WeFinancing costs of $3.3 million related to the 6.00% 2027 Notes have been capitalized and are being amortized over the term of the 6.00% 2027 Notes. The 6.00% 2027 Notes are listed on the NYSE under the trading symbol “SAT” with a par value of $25.00 per note.
On August 15, 2022, we issued an additional $8.0 million in aggregate principal amount of the 6.00% 2027 Notes (the “Additional 6.00% 2027 Notes”) for net proceeds of $7.8 million, based on the public offering price of 97.80% of the aggregate principal amount of the 6.00% 2027 Notes. The Additional 6.00% 2027 Notes are treated as a single series with the existing 6.00% 2027 Notes under the indenture and have the same terms as the existing 6.00% 2027 Notes. The net proceeds from the offering were used for general corporate purposes in accordance with our investment objective and strategies. Additional offering costs incurred were approximately $0.03 million. Additional financing costs of $0.03 million related to the 6.00% 2027 Notes have been capitalized and are being amortized over the term of the 6.00% 2027 Notes.
At February 29, 2024 the total 6.00% 2027 Notes outstanding was $105.5 million.
7.00% 2025 Notes
On September 8, 2022, we issued $12.0 million in aggregate principal amount of 7.00% fixed-rate notes due 2025 (the “7.00% 2025 Notes”) for net proceeds of $11.6 million after deducting customary fees and offering expenses of approximately $0.4 million. Interest on the 7.00% 2025 Notes is paid quarterly in arrears on February 28, May 31, August 31 and November 30, at a rate of 7.00% per year. The 7.00% 2025 Notes mature on September 8, 2025 and commencing September 8, 2024, may usebe redeemed in whole or in part at any time or from time to time at our option. The net proceeds from the offering were used for general corporate purposes in accordance with our investment objective and strategies. Financing costs of $0.05 million related to the 7.00% 2025 Notes have been capitalized and are being amortized over the term of the 7.00% 2025 Notes.
At February 29, 2024 the total 7.00% 2025 Notes outstanding was $12.0 million.
8.00% 2027 Notes
On October 27, 2022, we issued $40.0 million in aggregate principal amount of our 8.00% fixed-rate notes due 2027 (the “8.00% 2027 Notes”) for net proceeds of $38.7 million after deducting underwriting commissions of approximately $1.3 million. Offering costs incurred were approximately $0.1 million. On November 10, 2022, the underwriters partially exercised their option to purchase an additional $6.0 million in aggregate principal amount of the 8.00% 2027 Notes. Net proceeds were $5.8 million after deducting underwriting commissions of approximately $0.2 million. Interest on the 8.00% 2027 Notes is paid quarterly in arrears on February 28, May 31, August 31 and November 30, at a rate of 8.00% per year. The 8.00% 2027 Notes mature on October 31, 2027 and commencing October 27, 2024, may be redeemed in whole or in part at any time or from time to time at our option. The net proceeds from the offering were used for general corporate purposes in accordance with our investment objective and strategies. Financing costs of $1.73 million related to the 8.00% 2027 Notes have been capitalized and are being amortized over the term of the 8.00% 2027 Notes. The 8.00% 2027 Notes are listed on the NYSE under the trading symbol “SAJ” with a par value of $25.00 per note.
At February 29, 2024 the total 8.00% 2027 Notes outstanding was $46.0 million.
8.125% 2027 Notes
On December 13, 2022, we issued $52.5 million in aggregate principal amount of 8.125% fixed-rate notes due 2027 (the “8.125% 2027 Notes”) for net proceeds of $50.8 million after deducting underwriting commissions of approximately $1.6 million. Offering costs incurred were approximately $0.1 million. On December 21, 2022, the underwriters fully exercised their option to purchase an additional $7.875 million in aggregate principal amount of the 8.125% 2027 Notes. Net proceeds were $7.6 million after deducting underwriting commissions of approximately $0.2 million. Interest on the 8.125% 2027 Notes is paid quarterly in arrears on February 28, May 31, August 31 and November 30, at a rate of 8.125% per year. The 8.125% 2027 Notes mature on December 31, 2027 and commencing December 13, 2024, may be redeemed in whole or in part at any time or from time to time at our option. The net proceeds from this offering were used to redeem allmake investments in middle-market companies (including investments made through our SBIC subsidiaries) in accordance with our investment objective and strategies and for general corporate purposes. Financing costs of $2.0 million related to the 8.125% 2027 Notes have been capitalized and are being amortized over the term of the 8.125% 2027 Notes. The 8.125% 2027 Notes are listed on the NYSE under the trading symbol “SAY” with a par value of $25.00 per note.
At February 29, 2024, the total 8.125% 2027 Notes outstanding was $60.4 million.
8.75% 2025 Notes
On March 31, 2023, we issued $10.0 million in aggregate principal amount of 8.75% fixed-rate notes due 2024 (the “8.75% 2025 Notes”) for net proceeds of $9.7 million after deducting underwriting discounts of approximately $0.4 million. On May 1, 2023, we issued an additional $10.0 million in aggregate principal amount of the 8.75% 2024 Notes for net proceeds of $9.7 million after deducting underwriting discounts of approximately $0.4 million. Offering costs incurred were approximately $0.03 million. Interest on the 8.75% 2025 Notes is paid quarterly in arrears on February 28, May 31, August 31 and November 30, at a rate of 8.75% per year. On February 2, 2024, pursuant to the terms of the indenture governing the 8.75% 2025 Notes, we elected to exercise our option to extend the maturity date of the 8.75% 2025 Notes from March 31, 2024 to March 31, 2025. Net proceeds from this offering were used to make investments in middle-market companies (including investments made through our SBIC Subsidiaries) in accordance with our investment objective and strategies and general corporate purposes. Financing costs and discounts of $0.7 million related to the 8.75% 2025 Notes have been capitalized and are being amortized over the term of the 8.75% 2025 Notes.
At February 29, 2024, the total 8.75% 2025 Notes outstanding was $20.0 million.
8.50% 2028 Notes
On April 14, 2023, we issued $50.0 million in aggregate principal amount of 8.50% fixed-rate notes due 2028 (the “8.50% 2028 Notes”) for net proceeds of $48.4 million after deducting underwriting commissions of approximately $1.6 million. Offering costs incurred were approximately $0.03 million. On April 26, 2023, the underwriters fully exercised their option to purchase an additional $7.5 million in aggregate principal amount of the 8.50% 2028 Notes. Net proceeds were $7.3 million after deducting underwriting commissions of approximately $0.2 million. Interest on the 8.50% 2028 Notes is paid quarterly in arrears on February 28, May 31, August 31 and November 30, at a rate of 8.50% per year. The 8.50% 2028 Notes mature on April 15, 2028, and commencing April 14, 2025, may be redeemed in whole or in part at any time or from time to time at our option. Net proceeds from this offering were used to repay a portion of the outstanding 7.25% fixed-rate notes due 2025,indebtedness under the Encina Credit Facility, make investments in middle-market companies (including investments made through our SBIC Subsidiaries) in accordance with our investment objective and strategies and for general corporate purposes. Financing costs of $2.0 million related to the 8.50% 2028 Notes have been capitalized and are being amortized over the term of the 8.50% 2028 Notes. The 8.50% 2028 Notes are listed on the NYSE under the trading symbol “SAZ” with a par value of $25.00 per note.
At February 29, 2024, the total 8.50% 2028 Notes outstanding was $57.5 million.
At February 29, 2024 and February 28, 2023, the fair value of total cash and cash equivalents, cash and cash equivalents in reserve accounts and total investments by major category are as follows:
| February 29, 2024 | February 28, 2023 | |||||||||||||||
| Fair Value | Percentage of Total | Fair Value | Percentage of Total | |||||||||||||
| ($ in thousands) | ||||||||||||||||
| Cash and cash equivalents | $ | 8,693 | 0.8 | % | $ | 65,746 | 6.2 | % | ||||||||
| Cash and cash equivalents, reserve accounts | 31,814 | 2.7 | 30,330 | 2.8 | ||||||||||||
| First lien term loans | 976,423 | 82.8 | 798,534 | 74.7 | ||||||||||||
| Second lien term loans | 18,097 | 1.5 | 14,936 | 1.4 | ||||||||||||
| Structured finance securities | 30,626 | 2.6 | 41,362 | 3.9 | ||||||||||||
| Unsecured loan | 15,818 | 1.3 | 20,661 | 1.9 | ||||||||||||
| Equity interests | 97,830 | 8.3 | 97,097 | 9.1 | ||||||||||||
| Total | $ | 1,179,301 | 100.0 | % | $ | 1,068,666 | 100.0 | % | ||||||||
Equity Capital Activities
Share Repurchases
On September 24, 2014, we announced the approval of the Share Repurchase Plan. Since September 24, 2014, the Share Repurchase Plan has been extended annually, and we have periodically increased the amount of shares of common stock that may be purchased under the Share Repurchase Plan. Most recently, on January 9, 2023, our board of directors extended the Share Repurchase Plan for another year to January 15, 2024, increasing the number of shares that may be repurchased under the Share Repurchase Plan to 1.7 million shares of common stock. As of February 29, 2024, we purchased 1,035,203 shares of common stock, at the average price of $22.05 for approximately $22.8 million pursuant to the Share Repurchase Plan. During the three months ended February 29, 2024 we did not purchased shares of common stock pursuant to the Share Repurchase Plan. During the year ended February 29, 2024 we purchased 88,576 shares of common stock, at the average price $24.36 for approximately $2.2 million pursuant to the Share Repurchase Plan.
Public Equity Offering
On July 13, 2018, we issued 1,150,000 shares of its common stock priced at $25.00 per share (par value $0.001 per share) at an aggregate total of $28.75 million. The net proceeds, after deducting underwriting commissions of $1.15 million and offering costs of approximately $0.2 million, amounted to approximately $27.4 million. We also granted the underwriters a 30-day option to purchase up to an additional 172,500 shares of its common stock, which was not exercised.
Equity ATM Program
On March 16, 2017, we entered into an equity distribution agreement with Ladenburg Thalmann & Co. Inc., through which we may offer for sale, from time to time, up to $30.0 million of our common stock through an ATM offering. Subsequent to this, we amended our equity distribution agreement to add BB&T Capital Markets and B. Riley FBR, Inc. as sales agents in our ATM offering. On July 11, 2019, the amount of the common stock to be offered was increased to $70.0 million, and on October 8, 2019, the amount of the common stock to be offered was increased to $130.0 million. This agreement was terminated as of July 29, 2021, and as of that date, we had sold 3,922,018 shares for gross proceeds of $97.1 million at an average price of $24.77 for aggregate net proceeds of $95.9 million (net of transaction costs).
On July 30, 2021, we entered into an equity distribution agreement (the “Equity Distribution Agreement”) with Ladenburg Thalmann & Co. Inc. and Compass Point Research and Trading, LLC, each as agents (the “Agents”), through which we may offer for sale, from time to time, up to $150.0 million of our common stock through the Agents, or to them, as principal for their account (the “ATM Program”).
On July 6, 2023, we amended the Equity Distribution Agreement to increase the maximum amount of shares of our common stock to be sold through the ATM Program to $300.0 million from $150.0 million, and on July 19, 2023, we amended the Equity Distribution Agreement to add an additional distribution agent, Raymond James & Associates. The sales price per share of our common stock offered under the ATM Program, less the Agents’ commission, will not be less than the NAV per share of our common stock at the time of such sale. Consistent with the terms of the ATM Program, the Manager may, from time to time and in its sole discretion, contribute proceeds necessary to ensure that no sales are callable bymade at a price below the then-current NAV per share.
As of February 29, 2024 we sold 6,543,878 shares for gross proceeds of $172.5 million at an average price of $26.37 for aggregate net proceeds of $171.0 million (net of transaction costs). During the three months ended February 29, 2024, we sold 501,105 shares for gross proceeds of $14.3 million at an average price of $28.44 for aggregate net proceeds of $14.3 million (net of transaction costs). During the year ended February 29, 2024, we sold 1,703,517 shares for gross proceeds of $49.0 million at an average price of $28.51 for aggregate net proceeds of $49.0 million (net of transaction costs). The Manager agreed to reimburse the Company commencing June 24, 2022.to the extent the per share price of the shares to the public, less underwriting fees, was less than net asset value per share. For the three months ended February 29, 2024, the Manager reimbursed the Company $1.4 million. For the year ended February 29, 2024, the Manager reimbursed the Company $4.5 million.
Dividend Distributions
We have distributed or intend to distribute sufficient dividends to eliminate taxable income for our completed tax years. If we fail to satisfy the 90% distribution requirement or otherwise fail to qualify as a RIC in any tax year, we would be subject to U.S. federal income tax in that year on all of our taxable income imposed at corporate rates, regardless of whether we made any distributions to our shareholders. Shareholders have the option to receive payment of the dividend in cash, or receive shares of common stock, pursuant to the DRIP. Our distributions for the tax years ended February 29, 2024 to inception were as follows:
| Payment date | Cash Dividend | |||
| Tax Year Ended February 28, 2025 | ||||
| March 28, 2024 | $ | 0.73 | (45) | |
| $ | 0.73 | |||
| Tax Year Ended February 29, 2024 | ||||
| December 28, 2023 | $ | 0.72 | (44) | |
| September 28, 2023 | 0.71 | (43) | ||
| June 29, 2023 | 0.70 | (42) | ||
| March 30, 2023 | 0.69 | (1) | ||
| $ | 2.82 | |||
| Tax Year Ended February 28, 2023 | ||||
| January 4, 2023 | $ | 0.68 | (2) | |
| September 29, 2022 | 0.54 | (3) | ||
| June 29, 2022 | 0.53 | (4) | ||
| March 28, 2022 | 0.53 | (5) | ||
| $ | 2.28 | |||
| Tax Year Ended February 28, 2022 | ||||
| January 19, 2022 | $ | 0.53 | (6) | |
| September 28, 2021 | 0.52 | (7) | ||
| June 29, 2021 | 0.44 | (8) | ||
| April 22, 2021 | 0.43 | (9) | ||
| $ | 1.92 | |||
| Tax Year Ended February 28, 2021 | ||||
| February 10, 2021 | $ | 0.42 | (10) | |
| November 10, 2020 | 0.41 | (11) | ||
| August 12, 2020 | 0.40 | (12) | ||
| $ | 1.03 | |||
| Tax Year Ended February 29, 2020 | ||||
| February 6, 2020 | $ | 0.56 | (13) | |
| September 26, 2019 | 0.56 | (14) | ||
| June 27, 2019 | 0.55 | (15) | ||
| March 28, 2019 | 0.54 | (16) | ||
| $ | 2.21 | |||
| Tax Year Ended February 28, 2019 | ||||
| January 2, 2019 | $ | 0.53 | (17) | |
| September 27, 2018 | 0.52 | (18) | ||
| June 27, 2018 | 0.51 | (19) | ||
| March 26, 2018 | 0.50 | (20) | ||
| $ | 2.06 | |||
| Tax Year Ended February 28, 2018 | ||||
| December 27, 2017 | $ | 0.49 | (21) | |
| September 26, 2017 | 0.48 | (22) | ||
| June 27, 2017 | 0.47 | (23) | ||
| March 28, 2017 | 0.46 | (24) | ||
| $ | 1.90 | |||
| Tax Year Ended February 28, 2017 | ||||
| February 9, 2017 | $ | 0.45 | (25) | |
| November 9, 2016 | 0.44 | (26) | ||
| September 5, 2016 | 0.20 | (27) | ||
| August 9, 2016 | 0.43 | (28) | ||
| April 27, 2016 | 0.41 | (29) | ||
| $ | 1.93 | |||
| Tax Year Ended February 29, 2016 | ||||
| February 29, 2016 | $ | 0.40 | (30) | |
| November 30, 2015 | 0.36 | (31) | ||
| August 31, 2015 | 0.33 | (32) | ||
| June 5, 2015 | 1.00 | (33) | ||
| May 29. 2015 | 0.27 | (34) | ||
| $ | 2.36 | |||
| Tax Year Ended February 28, 2015 | ||||
| February 27, 2015 | $ | 0.22 | (35) | |
| November 28, 2014 | 0.18 | (36) | ||
| $ | 0.40 | |||
| Tax Year Ended February 28. 2014 | ||||
| December 27, 2013 | $ | 2.65 | (37) | |
| $ | 2.65 | |||
| Tax Year Ended February 28, 2013 | ||||
| December 31, 2012 | $ | 4.25 | (38) | |
| $ | 4.25 | |||
| Tax Year Ended February 29, 2012 | ||||
| December 30, 2011 | $ | 3.00 | (39) | |
| $ | 3.00 | |||
| Tax Year Ended February 28, 2011 | ||||
| December 29, 2010 | $ | 4.40 | (40) | |
| $ | 4.40 | |||
| Tax Year Ended February 28, 2010 | ||||
| December 31, 2009 | $ | 18.25 | (41) | |
| $ | 18.25 | |||
| (1) | Based on shareholder elections, the dividend consisted of approximately $7.1 million in cash and 45,818 newly issued shares of common stock, or 0.4% of our outstanding common stock prior to the dividend payment. The number of shares of common stock comprising the stock portion was calculated based on a price of $23.11 per share, which equaled 95% of the volume weighted average trading price per share of the common stock on March 17, 20, 21, 22, 23, 24, 27, 28, 29, and 30, 2023. |
| (2) | Based on shareholder elections, the dividend consisted of approximately $6.8 million in cash and 53,615 newly issued shares of common stock, or 0.5% of our outstanding common stock prior to the dividend payment. The number of shares of common stock comprising the stock portion was calculated based on a price of $24.26 per share, which equaled 95% of the volume weighted average trading price per share of the common stock on December 20, 21, 22, 23, 27, 28, 29 and 30 2022 and January 3 and 4, 2023. |
| (3) | Based on shareholder elections, the dividend consisted of approximately $5.3 million in cash and 52,312 newly issued shares of common stock, or 0.4% of our outstanding common stock prior to the dividend payment. The number of shares of common stock comprising the stock portion was calculated based on a price of $22.00 per share, which equaled 95% of the volume weighted average trading price per share of the common stock on September 16, 19, 20, 21, 22, 23, 26, 27, 28 and 29, 2022. |
| (4) | Based on shareholder elections, the dividend consisted of approximately $5.1 million in cash and 48,590 newly issued shares of common stock, or 0.4% of our outstanding common stock prior to the dividend payment. The number of shares of common stock comprising the stock portion was calculated based on a price of $22.40 per share, which equaled 95% of the volume weighted average trading price per share of the common stock on June 15, 16, 17, 21, 22, 23, 24, 27, 28 and 29, 2022. |
| (5) | Based on shareholder elections, the dividend consisted of approximately $5.3 million in cash and 42,825 newly issued shares of common stock, or 0.4% of our outstanding common stock prior to the dividend payment. The number of shares of common stock comprising the stock portion was calculated based on a price of $25.89 per share, which equaled 95% of the volume weighted average trading price per share of the common stock on March 15, 16, 17, 18, 21, 22, 23, 24, 25 and 28, 2022. |
| (6) | Based on shareholder elections, the dividend consisted of approximately $5.3 million in cash and 41,520 newly issued shares of common stock, or 0.3% of our outstanding common stock prior to the dividend payment. The number of shares of common stock comprising the stock portion was calculated based on a price of $26.85 per share, which equaled 95% of the volume weighted average trading price per share of the common stock on January 5, 6, 7, 10, 11, 12, 13, 14, 18 and 19, 2022. |
| (7) | Based on shareholder elections, the dividend consisted of approximately $4.9 million in cash and 38,016 newly issued shares of common stock, or 0.3% of our outstanding common stock prior to the dividend payment. The number of shares of common stock comprising the stock portion was calculated based on a price of $26.77 per share, which equaled 95% of the volume weighted average trading price per share of the common stock on September 15, 16, 17, 20, 21, 22, 23, 24, 27 and 28, 2021. |
| (8) | Based on shareholder elections, the dividend consisted of approximately $4.1 million in cash and 33,100 newly issued shares of common stock, or 0.3% of our outstanding common stock prior to the dividend payment. The number of shares of common stock comprising the stock portion was calculated based on a price of $25.03 per share, which equaled 95% of the volume weighted average trading price per share of the common stock on June 16, 17, 18, 21, 22, 23, 24, 25, 28 and 29, 2021. |
| (9) | Based on shareholder elections, the dividend consisted of approximately $3.9 million in cash and 38,580 newly issued shares of common stock, or 0.3% of our outstanding common stock prior to the dividend payment. The number of shares of common stock comprising the stock portion was calculated based on a price of $23.69 per share, which equaled 95% of the volume weighted average trading price per share of the common stock on April 9,12, 13, 14, 15, 16, 19, 20, 21 and 22, 2021. |
| (10) | Based on shareholder elections, the dividend consisted of approximately $3.8 million in cash and 41,388 newly issued shares of common stock, or 0.4% of our outstanding common stock prior to the dividend payment. The number of shares of common stock comprising the stock portion was calculated based on a price of $21.75 per share, which equaled 95% of the volume weighted average trading price per share of the common stock on January 28, 29 and February 1, 2, 3, 4, 5, 8, 9 and 10, 2021. |
| (11) | Based on shareholder elections, the dividend consisted of approximately $3.8 million in cash and 45,706 newly issued shares of common stock, or 0.4% of our outstanding common stock prior to the dividend payment. The number of shares of common stock comprising the stock portion was calculated based on a price of $17.63 per share, which equaled 95% of the volume weighted average trading price per share of the common stock on October 28, 29, 30 and November 2, 3, 4, 5, 6, 9 and 10, 2020. |
| (12) | Based on shareholder elections, the dividend consisted of approximately $3.7 million in cash and 47,098 newly issued shares of common stock, or 0.4% of our outstanding common stock prior to the dividend payment. The number of shares of common stock comprising the stock portion was calculated based on a price of $16.45 per share, which equaled 95.0% of the volume weighted average trading price per share of the common stock on July 30, 31 and August 3, 4, 5, 6, 7, 10, 11 and 12, 2020. |
| (13) | Based on shareholder elections, the dividend consisted of approximately $5.4 million in cash and 35,682 newly issued shares of common stock, or 0.3% of our outstanding common stock prior to the dividend payment. The number of shares of common stock comprising the stock portion was calculated based on a price of $25.44 per share, which equaled 95.0% of the volume weighted average trading price per share of the common stock on January 24, 27, 28, 29, 30, 31 and February 3, 4, 5 and 6, 2020. |
| (14) | Based on shareholder elections, the dividend consisted of approximately $4.5 million in cash and 34,575 newly issued shares of common stock, or 0.4% of our outstanding common stock prior to the dividend payment. The number of shares of common stock comprising the stock portion was calculated based on a price of $23.34 per share, which equaled 95.0% of the volume weighted average trading price per share of the common stock on September 13, 16, 17, 18, 19, 20, 23, 24, 25 and 26, 2019. |
| (15) | Based on shareholder elections, the dividend consisted of approximately $3.6 million in cash and 31,545 newly issued shares of common stock, or 0.4% of our outstanding common stock prior to the dividend payment. The number of shares of common stock comprising the stock portion was calculated based on a price of $22.65 per share, which equaled 95.0% of the volume weighted average trading price per share of the common stock on June 14, 17, 18, 19, 20, 21, 24, 25, 26 and 27, 2019. |
| (16) | Based on shareholder elections, the dividend consisted of approximately $3.5 million in cash and 31,240 newly issued shares of common stock, or 0.4% of our outstanding common stock prior to the dividend payment. The number of shares of common stock comprising the stock portion was calculated based on a price of $21.36 per share, which equaled 95.0% of the volume weighted average trading price per share of the common stock on March 15, 18, 19, 20, 21, 22, 25, 26, 27 and 28, 2019. |
| (17) | Based on shareholder elections, the dividend consisted of approximately $3.4 million in cash and 30,796 newly issued shares of common stock, or 0.4% of our outstanding common stock prior to the dividend payment. The number of shares of common stock comprising the stock portion was calculated based on a price of $18.88 per share, which equaled 95.0% of the volume weighted average trading price per share of the common stock on December 18, 19, 20, 21, 24, 26, 27, 28, 31, 2018 and January 2, 2019. |
| (18) | Based on shareholder elections, the dividend consisted of approximately $3.3 million in cash and 25,862 newly issued shares of common stock, or 0.3% of our outstanding common stock prior to the dividend payment. The number of shares of common stock comprising the stock portion was calculated based on a price of $22.35 per share, which equaled 95.0% of the volume weighted average trading price per share of the common stock on September 14, 17, 18, 19, 20, 21, 24, 25, 26 and 27, 2018. |
| (19) | Based on shareholder elections, the dividend consisted of approximately $2.7 million in cash and 21,562 newly issued shares of common stock, or 0.3% of our outstanding common stock prior to the dividend payment. The number of shares of common stock comprising the stock portion was calculated based on a price of $23.72 per share, which equaled 95.0% of the volume weighted average trading price per share of the common stock on June 14, 15, 18, 19, 20, 21, 22, 25, 26 and 27, 2018. |
| (20) | Based on shareholder elections, the dividend consisted of approximately $2.6 million in cash and 25,354 newly issued shares of common stock, or 0.4% of our outstanding common stock prior to the dividend payment. The number of shares of common stock comprising the stock portion was calculated based on a price of $19.91 per share, which equaled 95.0% of the volume weighted average trading price per share of the common stock on March 13, 14, 15, 16, 19, 20, 21, 22, 23 and 26, 2018. |
| (21) | Based on shareholder elections, the dividend consisted of approximately $2.5 million in cash and 25,435 newly issued shares of common stock, or 0.4% of our outstanding common stock prior to the dividend payment. The number of shares of common stock comprising the stock portion was calculated based on a price of $21.14 per share, which equaled 95.0% of the volume weighted average trading price per share of the common stock on December 13, 14, 15, 18, 19, 20, 21, 22, 26 and 27, 2017. |
| (22) | Based on shareholder elections, the dividend consisted of approximately $2.2 million in cash and 33,551 newly issued shares of common stock, or 0.6% of our outstanding common stock prior to the dividend payment. The number of shares of common stock comprising the stock portion was calculated based on a price of $20.19 per share, which equaled 95.0% of the volume weighted average trading price per share of the common stock on September 13, 14, 15, 18, 19, 20, 21, 22, 25 and 26, 2017. |
| (23) | Based on shareholder elections, the dividend consisted of approximately $2.3 million in cash and 26,222 newly issued shares of common stock, or 0.4% of our outstanding common stock prior to the dividend payment. The number of shares of common stock comprising the stock portion was calculated based on a price of $20.04 per share, which equaled 95.0% of the volume weighted average trading price per share of the common stock on June 14, 15, 16, 19, 20, 21, 22, 23, 26 and 27, 2017. |
| (24) | Based on shareholder elections, the dividend consisted of approximately $2.0 million in cash and 29,096 newly issued shares of common stock, or 0.5% of our outstanding common stock prior to the dividend payment. The number of shares of common stock comprising the stock portion was calculated based on a price of $21.38 per share, which equaled 95.0% of the volume weighted average trading price per share of the common stock on March 15, 16, 17, 20, 21, 22, 23, 24, 27 and 28, 2017. |
| (25) | Based on shareholder elections, the dividend consisted of approximately $1.6 million in cash and 50,453 newly issued shares of common stock, or 0.9% of our outstanding common stock prior to the dividend payment. The number of shares of common stock comprising the stock portion was calculated based on a price of $20.25 per share, which equaled 95.0% of the volume weighted average trading price per share of the common stock on January 27, 30, 31 and February 1, 2, 3, 6, 7, 8 and 9, 2017. |
| (26) | Based on shareholder elections, the dividend consisted of approximately $1.5 million in cash and 58,548 newly issued shares of common stock, or 1.0% of our outstanding common stock prior to the dividend payment. The number of shares of common stock comprising the stock portion was calculated based on a price of $17.12 per share, which equaled 95.0% of the volume weighted average trading price per share of the common stock on October 27, 28, 31 and November 1, 2, 3, 4, 7, 8 and 9, 2016. |
| (27) | Based on shareholder elections, the dividend consisted of approximately $0.7 million in cash and 24,786 newly issued shares of common stock, or 0.4% of our outstanding common stock prior to the dividend payment. The number of shares of common stock comprising the stock portion was calculated based on a price of $17.06 per share, which equaled 95.0% of the volume weighted average trading price per share of the common stock on August 22, 23, 24, 25, 26, 29, 30, 31 and September 1 and 2, 2016. |
| (28) | Based on shareholder elections, the dividend consisted of approximately $1.5 million in cash and 58,167 newly issued shares of common stock, or 1.0% of our outstanding common stock prior to the dividend payment. The number of shares of common stock comprising the stock portion was calculated based on a price of $16.32 per share, which equaled 95.0% of the volume weighted average trading price per share of the common stock on July 27, 28, 29 and August 1, 2, 3, 4, 5, 8 and 9, 2016. |
| (29) | Based on shareholder elections, the dividend consisted of approximately $1.5 million in cash and 56,728 newly issued shares of common stock, or 1.0% of our outstanding common stock prior to the dividend payment. The number of shares of common stock comprising the stock portion was calculated based on a price of $15.43 per share, which equaled 95.0% of the volume weighted average trading price per share of the common stock on April 14, 15, 18, 19, 20, 21, 22, 25, 26 and 27, 2016. |
| (30) | Based on shareholder elections, the dividend consisted of approximately $1.4 million in cash and 66,765 newly issued shares of common stock, or 1.2% of our outstanding common stock prior to the dividend payment. The number of shares of common stock comprising the stock portion was calculated based on a price of $13.11 per share, which equaled 95.0% of the volume weighted average trading price per share of the common stock on February 16, 17, 18, 19, 22, 23, 24, 25, 26 and 29, 2016. |
| (31) | Based on shareholder elections, the dividend consisted of approximately $1.1 million in cash and 61,029 newly issued shares of common stock, or 1.1% of our outstanding common stock prior to the dividend payment. The number of shares of common stock comprising the stock portion was calculated based on a price of $14.53 per share, which equaled 95.0% of the volume weighted average trading price per share of the common stock on November 16, 17, 18, 19, 20, 23, 24, 25, 27 and 30, 2015. |
| (32) | Based on shareholder elections, the dividend consisted of approximately $1.1 million in cash and 47,861 newly issued shares of common stock, or 0.9% of our outstanding common stock prior to the dividend payment. The number of shares of common stock comprising the stock portion was calculated based on a price of $15.28 per share, which equaled 95.0% of the volume weighted average trading price per share of the common stock on August 18, 19, 20, 21, 24, 25, 26, 27, 28 and 31, 2015. |
| (33) | Based on shareholder elections, the dividend consisted of approximately $3.4 million in cash and 126,230 newly issued shares of common stock, or 2.3% of our outstanding common stock prior to the dividend payment. The number of shares of common stock comprising the stock portion was calculated based on a price of $16.47 per share, which equaled 95.0% of the volume weighted average trading price per share of the common stock on May 22, 26, 27, 28, 29 and June 1, 2, 3, 4, and 5, 2015. |
| (34) | Based on shareholder elections, the dividend consisted of approximately $0.9 million in cash and 33,766 newly issued shares of common stock, or 0.6% of our outstanding common stock prior to the dividend payment. The number of shares of common stock comprising the stock portion was calculated based on a price of $16.78 per share, which equaled 95.0% of the volume weighted average trading price per share of the common stock on May 15, 18, 19, 20, 21, 22, 26, 27, 28 and 29, 2015. |
| (35) | Based on shareholder elections, the dividend consisted of approximately $0.8 million in cash and 26,858 newly issued shares of common stock, or 0.5% of our outstanding common stock prior to the dividend payment. The number of shares of common stock comprising the stock portion was calculated based on a price of $14.97 per share, which equaled 95.0% of the volume weighted average trading price per share of the common stock on February 13, 17, 18, 19, 20, 23, 24, 25, 26 and 27, 2015. |
| (36) | Based on shareholder elections, the dividend consisted of approximately $0.6 million in cash and 22,283 newly issued shares of common stock, or 0.4% of our outstanding common stock prior to the dividend payment. The number of shares of common stock comprising the stock portion was calculated based on a price of $14.37 per share, which equaled 95.0% of the volume weighted average trading price per share of the common stock on November 14, 17, 18, 19, 20, 21, 24, 25, 26 and 28, 2014. |
| (37) | Based on shareholder elections, the dividend consisted of approximately $2.5 million in cash and 649,500 shares of common stock, or 13.7% of our outstanding common stock prior to the dividend payment. The amount of cash elected to be received was greater than the cash limit of 20.0% of the aggregate dividend amount, thus resulting in the payment of a combination of cash and stock to shareholders who elected to receive cash. The number of shares of common stock comprising the stock portion was calculated based on a price of $15.439 per share, which equaled the volume weighted average trading price per share of the common stock on December 11, 13 and 16, 2013. |
| (38) | Based on shareholder elections, the dividend consisted of $3.3 million in cash and 853,455 shares of common stock, or 22.0% of our outstanding common stock prior to the dividend payment. The amount of cash elected to be received was greater than the cash limit of 20.0% of the aggregate dividend amount, thus resulting in the payment of a combination of cash and stock to shareholders who elected to receive cash. The number of shares of common stock comprising the stock portion was calculated based on a price of $15.444 per share, which equaled the volume weighted average trading price per share of the common stock on December 14, 17 and 19, 2012. |
| (39) | Based on shareholder elections, the dividend consisted of $2.0 million in cash and 599,584 shares of common stock, or 18.0% of our outstanding common stock prior to the dividend payment. The amount of cash elected to be received was greater than the cash limit of 20.0% of the aggregate dividend amount, thus resulting in the payment of a combination of cash and stock to shareholders who elected to receive cash. The number of shares of common stock comprising the stock portion was calculated based on a price of $13.117067 per share, which equaled the volume weighted average trading price per share of the common stock on December 20, 21 and 22, 2011. |
| (40) | Based on shareholder elections, the dividend consisted of $1.2 million in cash and 596,235 shares of common stock, or 22.0% of our outstanding common stock prior to the dividend payment. The amount of cash elected to be received was greater than the cash limit of 10.0% of the aggregate dividend amount, thus resulting in the payment of a combination of cash and stock to shareholders who elected to receive cash. The number of shares of common stock comprising the stock portion was calculated based on a price of $17.8049 per share, which equaled the volume weighted average trading price per share of the common stock on December 20, 21 and 22, 2010. |
| (41) | Based on shareholder elections, the dividend consisted of $2.1 million in cash and 864,872 shares of common stock, or 104.0% of our outstanding common stock prior to the dividend payment. The amount of cash elected to be received was greater than the cash limit of 13.7% of the aggregate dividend amount, thus resulting in the payment of a combination of cash and stock to shareholders who elected to receive cash. The number of shares of common stock comprising the stock portion was calculated based on a price of $1.5099 per share, which equaled the volume weighted average trading price per share of the common stock on December 24 and 28, 2009. |
| (42) | Based on shareholder elections, the dividend consisted of approximately $7.6 million in cash and 29,627 newly issued shares of common stock, or 0.2% of our outstanding common stock prior to the dividend payment. The number of shares of common stock comprising the stock portion was calculated based on a price of $25.29 per share, which equaled 95% of the volume weighted average trading price per share of the common stock on June 15, 16, 20, 21, 22, 23, 26, 27, 28, and 29, 2023. |
| (43) | Based on shareholder elections, the dividend consisted of approximately $8.4 million in cash and 35,196 newly issued shares of common stock, or 0.3% of our outstanding common stock prior to the dividend payment. The number of shares of common stock comprising the stock portion was calculated based on a price of $24.41 per share, which equaled 95% of the volume weighted average trading price per share of the common stock on September 15, 18, 19, 20, 21, 22, 25, 26, 27, and 28, 2023. |
| (44) | Based on shareholder elections, the dividend consisted of approximately $8.9 million in cash and 37,394 newly issued shares of common stock, or 0.3% of our outstanding common stock prior to the dividend payment. The number of shares of common stock comprising the stock portion was calculated based on a price of $24.47 per share, which equaled 95% of the volume weighted average trading price per share of the common stock on December 14, 15, 18, 19, 20, 21, 22, 26, 27, and 28, 2023. |
| (45) | Based on shareholder elections, the dividend consisted of approximately $9.0 million in cash and 45,490 newly issued shares of common stock, or 0.3% of our outstanding common stock prior to the dividend payment. The number of shares of common stock comprising the stock portion was calculated based on a price of $22.85 per share, which equaled 95% of the volume weighted average trading price per share of the common stock on March 15, 18, 19, 20, 21, 22, 25, 26, 27, and 28, 2024. |
We cannot provide any assurance that these measures will provide sufficient sources of liquidity to support our operations and growth.
Subsequent Events
Live Oak Facility
On March 27, 2024, we and our wholly owned special purpose subsidiary, Saratoga Investment Funding III LLC (“SIF III”), entered into a credit and security agreement (the “Live Oak Credit Agreement”), by and among SIF III, as borrower, us, as collateral manager and equity holder, the lenders from time to time parties thereto, Live Oak Banking Company (“Live Oak”), as administrative agent and collateral agent, U.S. Bank National Association, as custodian, and U.S. Bank Trust Company, National Association, as collateral administrator, relating to a special purpose vehicle financing credit facility (the “Live Oak Credit Facility”).
The Live Oak Credit Facility provides for borrowings in U.S. dollars in an aggregate amount of up to $50.0 million. During the first two years following the closing date, SIF III may request one or more increases in the commitment amount from $50.0 million to an amount not to exceed $150.0 million, subject to certain terms and conditions and a customary fee. The terms of the Live Oak Credit Agreement require a minimum drawn amount of $12.5 million at all times during the period ending March 27, 2025 and, thereafter, the greater of: (i) $25.0 million and (ii) 50% of the facility amount in effect at such time. The Live Oak Credit Facility matures on March 27, 2027. Advances are available during the term of the Live Oak Credit Facility and must be repaid in full at maturity. SIF III may request an extension of the maturity date by an additional one year, subject to the agreement of the lenders and an extension fee.
Advances under the Live Oak Credit Facility are subject to a borrowing base calculation, and the Live Oak Credit Facility has various eligibility criteria for loans to be included in the borrowing base. Advances under the Live Oak Credit Facility bear interest at a floating rate per annum equal to Adjusted Term SOFR plus an applicable margin between 3.50% and 4.25% based on the Live Oak Credit Facility’s utilization. The Live Oak Credit Agreement also provides for an unused fee of 0.50% on the unused commitments. SIF III’s obligations to the lenders under the Live Oak Credit Facility are secured by a first priority security interest in substantially all of SIF III’s assets. In addition, SIF III’s obligations to the lenders under the Live Oak Credit Facility are secured by a pledge by us of our equity interests in SIF III, which is evidenced by the equity pledge agreement, dated as of March 27, 2024, by and between us, as pledgor, and Live Oak, as collateral agent for the benefit of the secured parties.
In connection with the Live Oak Credit Agreement, we entered into a loan sale and contribution agreement with SIF III, dated as of March 27, 2024, by and between us, as seller, and SIF III, as purchaser, pursuant to which we will sell or contribute certain loans held by us to SIF III to be used to support the borrowing base under the Live Oak Credit Facility. The Live Oak Credit Facility permits loan proceeds and excess cash in SIF III’s collection accounts to be distributed to us at any time based on three business days advance notice, subject to compliance with various conditions, including the absence of a default or event of default, the absence of an over-advance against the borrowing base and the absence of a violation of the financial covenants.
Contractual obligations
The following table shows our payment obligations for repayment of debt and other contractual obligations at February 28, 2022:29, 2024:
| Payment Due by Period | ||||||||||||||||||||
| Long-Term Debt Obligations | Total | Less Than 1 Year | 1 - 3 Years | 3 - 5 Years | More Than 5 Years | |||||||||||||||
| ($ in thousands) | ||||||||||||||||||||
| Encina credit facility | $ | 12,500 | $ | - | $ | 12,500 | $ | - | $ | - | ||||||||||
| SBA debentures | 185,000 | - | 15,000 | 24,660 | 145,340 | |||||||||||||||
| 7.25% 2025 Notes | 43,125 | - | - | 43,125 | - | |||||||||||||||
| 7.75% 2025 Notes | 5,000 | - | - | 5,000 | - | |||||||||||||||
| 4.375% 2026 Notes | 175,000 | - | 175,000 | - | ||||||||||||||||
| 4.35% 2027 Notes | 75,000 | 75,000 | ||||||||||||||||||
| 6.25% 2027 Notes | 15,000 | - | - | - | 15,000 | |||||||||||||||
| Total Long-Term Debt Obligations | $ | 510,625 | $ | - | $ | 27,500 | $ | 322,785 | $ | 160,340 | ||||||||||
| Payment Due by Period | ||||||||||||||||||||
| Long-Term Debt Obligations | Total | Less Than 1 Year | 1 - 3 Years | 3 - 5 Years | More Than 5 Years | |||||||||||||||
| ($ in thousands) | ||||||||||||||||||||
| Encina credit facility | $ | 35,000 | $ | - | $ | 35,000 | $ | - | $ | - | ||||||||||
| SBA debentures | 214,000 | - | - | - | 214,000 | |||||||||||||||
| 8.75% 2025 Notes | 20,000 | - | 20,000 | - | - | |||||||||||||||
| 7.00% 2025 Notes | 12,000 | - | 12,000 | - | - | |||||||||||||||
| 7.75% 2025 Notes | 5,000 | - | 5,000 | - | - | |||||||||||||||
| 4.375% 2026 Notes | 175,000 | - | 175,000 | - | - | |||||||||||||||
| 4.35% 2027 Notes | 75,000 | - | 75,000 | - | - | |||||||||||||||
| 6.00% 2027 Notes | 105,500 | - | - | 105,500 | - | |||||||||||||||
| 6.25% 2027 Notes | 15,000 | - | - | 15,000 | - | |||||||||||||||
| 8.00% 2027 Notes | 46,000 | - | - | 46,000 | - | |||||||||||||||
| 8.125% 2027 Notes | 60,375 | - | - | 60,375 | - | |||||||||||||||
| 8.50% 2028 Notes | 57,500 | - | - | 57,500 | - | |||||||||||||||
| Total Long-Term Debt Obligations | $ | 820,375 | $ | - | $ | 322,000 | $ | 284,375 | $ | 214,000 | ||||||||||
Off-balance sheet arrangements
At February 28, 202229, 2024 and February 28, 2021, the Company’s2023, our off-balance sheet arrangements consisted of $88.4$132.4 million and $58.8$108.8 million, respectively, of unfunded commitments outstanding to provide debt financing to its portfolio companies or to fund limited partnership interests. Such commitments are generally up to the Company’sour discretion to approve, or the satisfaction of certain financial and nonfinancial covenants and involve, to varying degrees, elements of credit risk in excess of the amount recognized in the Company’sour consolidated statements of assets and liabilities.
A summary of the unfunded commitments outstanding as of February 28, 202229, 2024 and February 28, 20212023 is shown in the table below (dollars in thousands):
| February 28, 2022 | February 28, 2021 | |||||||
| At Company’s discretion | ||||||||
| Artemin Wax | $ | 3,700 | $ | - | ||||
| Ascend Software LLC | 5,000 | - | ||||||
| Axero Holdings | 3,000 | - | ||||||
| Book4Time, Inc. | 2,000 | 2,000 | ||||||
| CLEO Communications Holding, LLC | - | 630 | ||||||
| Davisware | 2,000 | - | ||||||
| GreyHeller LLC | - | 15,000 | ||||||
| LFR Chicken LLC | 10,000 | - | ||||||
| Netreo Holdings, LLC | 4,000 | 10,000 | ||||||
| Omatic Software, LLC | - | - | ||||||
| Passageways, Inc. | - | 5,000 | ||||||
| Pepper Palace | 3,000 | - | ||||||
| Procrement Partners | 2,800 | - | ||||||
| Saratoga Senior Loan Fund I JV LLC | 17,500 | - | ||||||
| Sceptre Hospitality Resources | 1,000 | - | ||||||
| Top Gun Pressure Washing, LLC | - | 3,175 | ||||||
| Village Realty Holdings LLC | - | 10,000 | ||||||
| Total | 54,000 | 45,805 | ||||||
| At portfolio company’s discretion - satisfaction of certain financial and nonfinancial covenants required | ||||||||
| Ascend Software LLC | 6,500 | - | ||||||
| Axero Holdings | 2,000 | - | ||||||
| Axero Holdings - Revolver | 500 | - | ||||||
| Davisware, LLC | 1,000 | - | ||||||
| GDS Holdings US, Inc. | 2,786 | - | ||||||
| GoReact | 2,500 | 2,000 | ||||||
| Granite Comfort, LP | - | - | ||||||
| HemaTerra Holding Company, LLC | - | 2,000 | ||||||
| LFR Chicken LLC | 3,000 | - | ||||||
| Madison Logic - Revolver | 1,084 | - | ||||||
| New England Dental Partners | 4,500 | 6,000 | ||||||
| Passageways, Inc. | - | 2,000 | ||||||
| Pepper Palace - DDTL | 2,000 | - | ||||||
| Pepper Palace - Revolver | 2,500 | - | ||||||
| Procurement Partners, LLC | - | 1,000 | ||||||
| Zollege | 1,000 | - | ||||||
| 29,370 | 13,000 | |||||||
| Total | $ | 83,370 | $ | 58,805 | ||||
| February 29, 2024 | February 28, 2023 | |||||||
| At Company’s discretion | ||||||||
| ActiveProspect, Inc. | $ | 10,000 | $ | 10,000 | ||||
| Artemis Wax Corp. | 23,500 | - | ||||||
| Ascend Software, LLC | 5,000 | 5,000 | ||||||
| Granite Comfort, LP | 750 | 15,000 | ||||||
| JDXpert | 5,000 | 5,000 | ||||||
| LFR Chicken LLC | - | 4,000 | ||||||
| Pepper Palace, Inc. | 1,898 | 3,000 | ||||||
| Procurement Partners, LLC | 4,250 | 4,250 | ||||||
| Saratoga Senior Loan Fund I JV, LLC | 8,548 | 8,548 | ||||||
| Sceptre Hospitality Resources, LLC | 5,000 | 5,000 | ||||||
| Stretch Zone Franchising, LLC | 3,750 | - | ||||||
| VetnCare MSO, LLC | 10,000 | - | ||||||
| Total | $ | 77,696 | $ | 59,798 | ||||
| At portfolio company’s discretion - satisfaction of certain financial and nonfinancial covenants required | ||||||||
| Alpha Aesthetics Partners OpCo, LLC | $ | 6,500 | $ | - | ||||
| ARC Health OpCo LLC | 2,585 | 10,773 | ||||||
| Artemis Wax Corp. | - | 8,500 | ||||||
| Ascend Software, LLC | - | 3,200 | ||||||
| Axero Holdings, LLC - Revolver | 500 | 500 | ||||||
| Axiom Medical Consulting, LLC | 2,000 | - | ||||||
| BQE Software, Inc. | 3,250 | - | ||||||
| C2 Educational Systems | 3,000 | - | ||||||
| Davisware, LLC | 750 | - | ||||||
| Exigo, LLC | - | 4,167 | ||||||
| Exigo, LLC - Revolver | 1,042 | 833 | ||||||
| Gen4 Dental Partners Holdings, LLC | - | 11,000 | ||||||
| GoReact | 2,500 | 2,500 | ||||||
| Granite Comfort, LP | 11,637 | - | ||||||
| JDXpert | - | 1,000 | ||||||
| Inspect Point Holding, LLC | 1,500 | - | ||||||
| Pepper Palace, Inc. - Delayed Draw Term Loan | - | 2,000 | ||||||
| Pepper Palace, Inc. - Revolver | 2,500 | 2,500 | ||||||
| Procurement Partners, LLC | - | 1,000 | ||||||
| Stretch Zone Franchising, LLC | 1,500 | - | ||||||
| VetnCare MSO, LLC | 15,319 | - | ||||||
| Zollege PBC | 150 | 1,000 | ||||||
| 54,733 | 48,973 | |||||||
| Total | $ | 132,429 | $ | 108,771 | ||||
The Company believes itsWe believe our assets will provide adequate coverage to satisfy these unfunded commitments. As of February 28, 2022, the Company29, 2024, we had cash and cash equivalents of $47.3$8.7 million and $37.5$31.8 million in available borrowings under the Encina Credit Facility.
ITEM 7A. QUANTITATIVE AND QUALITATIVE DISCLOSURES ABOUT MARKET RISK SUTHERLAND TO UPDATE
Our business activities contain elements of market risk. We consider our principal market risk to be the fluctuation in interest rates.rates to be our principal market risk. Managing this risk is essential to our business. Accordingly, we have systems and procedures designed to identify and analyze our risks, to establish appropriate policies and thresholds and to continually monitor this risk and thresholds by means of administrative and information technology systems and other policies and processes. In addition, U.S. and global capital markets and credit markets have experienced a higher level of stress due to the global COVID-19 pandemic, which has resulted in an increase in the level of volatility across such markets and a general decline in value of the securities held by us.
Interest rate risk is defined as the sensitivity of our current and future earnings to interest rate volatility, including relative changes in different interest rates, variability of spread relationships, the difference in re-pricing intervals between our assets and liabilities and the effect that interest rates may have on our cash flows. Changes in the general level of interest rates can affect our net interest income, which is the difference between the interest income earned on interest earning assets and our interest expense incurred in connection with our interest-bearing debt and liabilities. Changes in interest rates can also affect, among other things, our ability to acquire leveraged loans, high yield bonds and other debt investments and the value of our investment portfolio.
Our investment income is affected by fluctuations in various interest rates, including LIBORSOFR and the prime rate. Substantially all of our portfolio is, and we expect will continue to be, comprised of floating rate investments that utilize LIBOR. In connection withSOFR or an alternate rate. Since March 2022, the COVID-19 pandemic, the U.S. Federal Reserve and other central banks have reduced certainhas been rapidly raising interest rates in response to ongoing inflation concerns. Although the Federal Reserve left its benchmark rates steady in the fourth quarter of 2023, it has indicated that additional rate increases in the future may be necessary to mitigate inflationary pressures and LIBOR has decreased.there can be no assurance that the Federal Reserve will not make upwards adjustments to the federal funds rate in the future. However, there are reports that the Federal Reserve may begin to cut the benchmark rates in 2024. In a rising interest rate environment, our cost of funds would increase, which could reduce our net investment income if there is not a corresponding increase in interest income generated by our investment portfolio. It is possible that the Federal Reserve’s tightening cycle could result in a recession in the United States, which would likely decrease interest rates. A prolonged reduction in interest rates will reduce our gross investment income and could result in a decrease in our net investment income if such decreases in LIBORbase rates, such as SOFR, are not offset by a corresponding increaseincreases in the spread over LIBORsuch base rates that we earn on any portfolio investments, a decrease in in our operating expenses, including with respect to our income incentive fee, or a decrease in the interest rate of our floating interest rate liabilities tied to LIBOR.liabilities. Our interest expense is affected by fluctuations in LIBOR onlySOFR on our revolving credit facility.Encina Credit Facility. In addition, substantially all of our assets and our Encina Credit Facility have been transitioned from LIBOR transition language to include the use of an acceptable replacement rate, such as SOFR.
At February 28, 2022,29, 2024, we had $498.1$785.4 million of borrowings outstanding. There were $12.5$35.0 million borrowings outstanding under the revolving credit facilityEncina Credit Facility as of February 28, 2022.29, 2024. As of February 29, 2024, on a fair value basis, approximately 0.5% of our debt investments bear interest at a fixed-rate and approximately 99.5% of our debt investments bear interest at a floating rate. As of February 29, 2024, 0% of our floating rate debt investments are subject to interest rate floors. Additionally, the Encina Credit Facility also is subject to a floating interest rate and is currently paid based on floating Term SOFR rate.
We have analyzed the potential impact of changes in interest rates on interest income from investments. Assuming that our investments as of February 28, 202229, 2024 were to remain constant for a full fiscal year and no actions were taken to alter the existing interest rate terms, a hypothetical change of a 1.0% increase in interest rates would cause a corresponding increase of approximately $2.5$10.4 million to our interest income. Conversely, a hypothetical change of a 1.0% decrease in interest rates would cause a corresponding decrease of approximately $0.03$10.4 million to our interest income.
Changes in interest rates would have no impact to our current interest and debt financing expense, as all our borrowings except for our credit facility are fixed rate, and our credit facility is currently undrawn.
Although management believes that this measure is indicative of our sensitivity to interest rate changes, it does not adjust for potential changes in credit quality, size and composition of the assets on the statements of assets and liabilities and other business developments that could magnify or diminish our sensitivity to interest rate changes, nor does it account for divergences in LIBORSOFR and the commercial paper rate, which have historically moved in tandem but, in times of unusual credit dislocations, have experienced periods of divergence. Accordingly, no assurances can be given that actual results would not materially differ from the potential outcome simulated by this estimate.
For further information, the following table shows the approximate annualized increase or decrease in the components of net investment income due to hypothetical base rate changes in interest rates, assuming no changes in our investments and borrowings as of February 28, 2022.29, 2024.
Basis Point Change | Increase (Decrease) in Interest Income | (Increase) Decrease in Interest Expense | Increase (Decrease) in Net Income | Increase (Decrease) in Net Income per Share | ||||||||||||||
| ($ in thousands) | ||||||||||||||||||
| -100 | $ | (47 | ) | $ | - | $ | (47 | ) | $ | (0.00 | ) | |||||||
| -50 | (47 | ) | - | (47 | ) | (0.00 | ) | |||||||||||
| -25 | (23 | ) | - | (23 | ) | (0.00 | ) | |||||||||||
| 25 | 115 | - | 115 | 0.01 | ||||||||||||||
| 50 | 230 | - | 230 | 0.02 | ||||||||||||||
| 100 | 2,459 | (43 | ) | 2,416 | 0.21 | |||||||||||||
| 200 | 8,524 | (168 | ) | 8,356 | 0.73 | |||||||||||||
| 300 | 15,326 | (293 | ) | 15,033 | 1.31 | |||||||||||||
| 400 | 22,128 | (418 | ) | 21,710 | 1.89 | |||||||||||||
| Increase | (Increase) | Increase | Increase | Increase | ||||||||||||||||||
| Basis | (Decrease) | Decrease | (Decrease) in Net | (Decrease) in Net | (Decrease) in Net | |||||||||||||||||
| Point | in Interest | in Interest | Investment | Investment | Investment | |||||||||||||||||
| Change | Income | Expense | Income | Income* | Income per Share | |||||||||||||||||
| ($ in thousands) | ||||||||||||||||||||||
| -100 | $ | (10,431 | ) | $ | 350 | $ | (10,081 | ) | $ | (8,065 | ) | $ | (0.59 | ) | ||||||||
| -50 | (5,215 | ) | 175 | (5,040 | ) | (4,032 | ) | (0.30 | ) | |||||||||||||
| -25 | (2,608 | ) | 88 | (2,520 | ) | (2,016 | ) | (0.15 | ) | |||||||||||||
| 25 | 2,608 | (88 | ) | 2,520 | 2,016 | 0.15 | ||||||||||||||||
| 50 | 5,215 | (175 | ) | 5,040 | 4,032 | 0.30 | ||||||||||||||||
| 100 | 10,431 | (350 | ) | 10,081 | 8,065 | 0.59 | ||||||||||||||||
| 200 | 20,862 | (700 | ) | 20,162 | 16,130 | 1.18 | ||||||||||||||||
| 300 | 31,448 | (1,050 | ) | 30,398 | 24,318 | 1.78 | ||||||||||||||||
| 400 | 42,079 | (1,400 | ) | 40,679 | 32,543 | 2.38 | ||||||||||||||||
| * | Adjusts Net Interest Income for the impact of the first incentive fee on Net Investment Income |
The table above assumes no defaults or prepayments by portfolio companies over the next twelve months. The hypothetical results would also be impacted by the changes in the amount of debt outstanding under our Encina Credit Facility, with an increase (decrease) in the debt outstanding under the Encina Credit Facility resulting in an (increase) decrease in the hypothetical interest expense.
ITEM 8. CONSOLIDATED FINANCIAL STATEMENTS AND SUPPLEMENTARY DATA
Our consolidated financial statements are annexed to this Annual Report beginning on page F-1. In addition, the Financial Statements of Saratoga Investment Corp. CLO 2013-1, Ltd. are annexed to this Annual Report beginning on page S-1.
ITEM 9. CHANGES IN AND DISAGREEMENTS WITH ACCOUNTANTS ON ACCOUNTING AND FINANCIAL DISCLOSURE
None.
ITEM 9A. CONTROLS AND PROCEDURES
Evaluation of disclosure controls and procedures
As of the end of the period covered by this report, we carried out an evaluation, under the supervision and with the participation of our management, including our chief executive officer and our chief financial officer, of the effectiveness of the design and operation of our disclosure controls and procedures (as defined in Rule 13a-15(e) and 15d-15(e) of the Securities Exchange Act of 1934)Act). Based on that evaluation, our chief executive officer and our chief financial officer have concluded that our current disclosure controls and procedures are effective in facilitating timely decisions regarding required disclosure of any material information relating to us that is required to be disclosed by us in the reports we file or submit under the Securities Exchange Act of 1934.Act. However, in evaluating the disclosure controls and procedures, management recognized that any controls and procedures, no matter how well designed and operated, can provide only reasonable assurance of achieving the desired control objectives, and management necessarily was required to apply its judgment in evaluating the cost-benefit relationship of possible controls and procedures.
Management’s annual report on internal control over financial reporting
The Company’s management is responsible for establishing and maintaining adequate internal control over financial reporting (as defined in Rules 13a-15(f) and 15d-15(f) of the Exchange Act). Our internal control over financial reporting is a process designed to provide reasonable assurance regarding the reliability of financial reporting and the preparation of our financial statements for external reporting purposes in accordance with U.S. GAAP. Internal control over financial reporting includes those policies and procedures that (i) pertain to the maintenance of records that in reasonable detail accurately and fairly reflect the transactions and dispositions of the assets of the company; (ii) provide reasonable assurance that the transactions are recorded as necessary to permit preparation of financial statements in accordance with U.S. GAAP, and that the receipts and expenditures of the company are being made only in accordance with authorizations of management and directors of the company; and (iii) provide reasonable assurance regarding prevention or timely detection of unauthorized acquisition, use, or disposition of the company’s assets that could have a material effect on the financial statements. Because of its inherent limitations, internal control over financial reporting may not prevent or detect misstatements. Projections of any evaluation of effectiveness to future periods are subject to the risk that controls may become inadequate because of changes in conditions, or that the degree of compliance with polices or procedures may deteriorate.
Under the supervision and with participation of our Chief Executive Officer and Chief Financial Officer, the Company conducted an evaluation of the effectiveness of internal control over financial reporting based on the criteria established in Internal Control—Integrated Framework (2013) issued by the Committee of Sponsoring Organizations of the Treadway Commission (COSO). Based on the Company’s evaluation under the framework in Internal Control—Integrated Framework (2013), management concluded that the Company’s internal control over financial reporting was effective as of February 28, 2022.29, 2024.
Changes in internal controls over financial reporting
There have been no changes in the Company’s internal control over financial reporting (as defined in Rule 13a-15(f) of Exchange Act) that occurred during our most recently completed fiscal year that have materially affected, or are reasonably likely to materially affect, the Company’s internal control over financial reporting.
ITEM 9B. OTHER INFORMATION
None.
| a) | None. |
| b) | During the fiscal quarter ended February 29, 2024, no director or officer of the Company has entered into (i) any contract, instruction or written plan for the purchase or sale of securities of the Company intended to satisfy the affirmative defense conditions of Rule 10b5-1(c) under the Exchange Act or (ii) any non-Rule 10b5-1 trading arrangement. |
The Company has adopted insider trading policies and procedures governing the purchase, sale, and disposition of the Company’s securities by officers and directors of the Company that are reasonably designed to promote compliance with insider trading laws, rules and regulations.
ITEM 9C. DISCLOSURE REGARDING FOREIGN JURISDICTIONS THAT PREVENT INSPECTIONS
Not applicable.
115
PART III
ITEM 10. DIRECTORS, EXECUTIVE OFFICERS AND CORPORATE GOVERNANCE PLEASE HAVE ROCHELLE REVIEW THIS SECTION
Director and Executive Officer Information
Directors and Executive Officers
The following table sets forth the names, ages and positions held by each of our directors, followed by a brief biography of each individual, including the business experience of each individual during the past five years and the specific qualifications that led to the conclusion that each individual should serve as a director.
| Name | Age | Position | Director Since | Term Expires | ||||
| Interested Directors | ||||||||
| Christian L. Oberbeck | 62 | Chairman of the Board, Chief Executive Officer and President | 2010 | 2024 | ||||
| Henri J. Steenkamp | 46 | Chief Financial Officer, Chief Compliance Officer, Treasurer and Secretary | 2020 | 2023 | ||||
| Independent Directors | ||||||||
| Steven M. Looney | 72 | Director | 2007 | 2022 | ||||
| Charles S. Whitman III | 80 | Director | 2007 | 2022 | ||||
| G. Cabell Williams | 68 | Director | 2007 | 2023 |
| Name | Age | Position | Director Since | Term Expires | ||||
| Interested Directors | ||||||||
| Christian L. Oberbeck | 64 | Chairman of the Board, Chief Executive Officer and President | 2010 | 2024 | ||||
| Henri J. Steenkamp | 48 | Chief Financial Officer, Chief Compliance Officer, Treasurer and Secretary | 2020 | 2026 | ||||
| Independent Directors | ||||||||
| Steven M. Looney | 74 | Director | 2007 | 2025 | ||||
| Charles S. Whitman III | 82 | Director | 2007 | 2025 | ||||
| G. Cabell Williams | 70 | Director | 2007 | 2026 |
Christian L. Oberbeck— Mr. Oberbeck has over 3637 years of experience in leveraged finance, including acquisition financing, distressed investing, and private equity, and has been involved in originating, structuring, negotiating, consummating, managing, operating, and monitoring minority and control investments in a broad array of businesses. Mr. Oberbeck is the Founder and Managing Member of Saratoga Investment Advisors, LLC, the Company’s investment adviser, and has served as the Chairman of the Board, Chief Executive Officer, and President of the Company since 2010. Mr. Oberbeck is also the Managing Partner of Saratoga Partners, a middle marketmiddle-market private equity investment firm. Prior to assuming full management responsibility for Saratoga Partners in 2008, Mr. Oberbeck had co-managed Saratoga Partners since 1995. Mr. Oberbeck joined Dillon Read and Saratoga Partners from Castle Harlan, Inc., a corporate buyout firm which he had joined at its founding in 1987 and was a Managing Director, leading successful investments in manufacturing and financial services companies. Prior to that, he worked in the Corporate Development Group of Arthur Young and in corporate finance at Blyth Eastman Paine Webber. Mr. Oberbeck has been a director of numerous middle marketmiddle-market companies. Mr. Oberbeck graduated from Brown University in 1982 with a BS in Physics and a BA in Mathematics. In 1985, he earned an MBA from Columbia University. Mr. Oberbeck’s qualifications as a director include his extensive experience in the investment and finance industry, as well as his intimate knowledge of the Company’s operations gained through his service as an executive officer.
Steven M. Looney — Mr. Looney has served as member of our Board since 2007. Mr. Looney is a Managing Director of Peale Davies & Co. Inc., a strategic advisory firm specializing in change management and revenue enhancement for middle marketmiddle-market enterprises, is a Director and Audit Chair of ICG Loan Funding Ltd., an investment company specializing in corporate debt, and is a CPA and an attorney. Mr. Looney has served as a consultant and director to numerous companies in the healthcare, manufacturing and services industries. Between 2000 and 2005, he served as Senior Vice President and Chief Financial Officer of PCCI, Inc., a private IT staffing and outsourcing firm. Between 1992 and 2000, Mr. Looney worked at WH Industries as Chief Financial and Administrative Officer. Mr. Looney is a trustee of Excellent Education for Everyone, a nonprofit organization and founder of its affiliate, Education Moms.TradePrep and a director of ICG Loan Funding Ltd., a manager of and investor in collateralized loan portfolios in Europe and the United States. Mr. Looney graduated summa cum laude from the University of Washington with a B.A. degree in accounting and received a J.D. from the University of Washington School of Law where he was a member of the law review. He began his career at the United States Securities and Exchange Commission.SEC. Mr. Looney’s qualifications as director include his experience as a Managing Director of Peale Davies & Co., as Chief Financial and Administrative Officer of WH Industries and as General Counsel and Chief Compliance Officer of A.G. Becker-Warburg Paribas Becker, as well as his financial, accounting and legal expertise.
Charles S. Whitman III—Mr. Whitman has served as member of our Board since 2007. Mr. Whitman is senior counsel (retired) at Davis Polk & Wardwell LLP. Mr. Whitman was a partner in Davis Polk’s Corporate Department for 28 years, representing clients in a broad range of corporate finance matters, including shelf registrations, securities compliance for financial institutions, foreign asset privatizations, and mergers and acquisitions. From 1971 to 1973, Mr. Whitman served as Executive Assistant to three successive Chairmen of the SEC. Mr. Whitman graduated from Harvard College and graduated magna cum laude from Harvard Law School with a LL.B. Mr. Whitman also received an LL.M. from Cambridge University in England. Mr. Whitman’s qualifications as director include his 28 years of experience representing clients, including AT&T, Exxon Mobil, General Motors and BP, in securities matters as a partner in Davis Polk’s corporate department.
Henri J. Steenkamp— Mr. Steenkamp has served as the Chief Financial Officer, Chief Compliance Officer, Treasurer and Secretary of the Company, the Company’s investment adviser, Saratoga Investment Advisors, since 2014, and2014. Mr. Steenkamp has also served as a director of the Company since 2020. Mr. Steenkamp has served as Treasurer and Secretary of Saratoga Investment Advisors LLC, the Company’s investment adviser, since 2014. Mr. Steenkamp has also served as the Chief Financial Officer of MF Global Holdings Ltd., a broker in commodities and derivatives, from April 2011. Prior to that, Mr. Steenkamp held the position of Chief Accounting Officer and Global Controller at MF Global for four years. He joined MF Global, then Man Financial, in 2006 as Vice President of External Reporting and Accounting Policy. After MF Global filed for bankruptcy protection in October 2011, he continued to serve as Chief Financial Officer through January 2013. Before joining MF Global, Mr. Steenkamp spent eight years with PricewaterhouseCoopers (“PwC”), including four years in Transaction Services in its New York office, managing a variety of capital-raising transactions on a global basis. His focus was also on the SEC registration and public company filing process, including technical accounting. He spent four years with PwC in South Africa, where he served as an auditor primarily for SEC registrants and assisted South African companies as they went public in the U.S.United States Mr. Steenkamp is a chartered accountant and holds an honors degree in Finance. Mr. Steenkamp’s qualifications as a director include his extensive experience in the investment and finance industry, as well as his intimate knowledge of the Company’s operations gained through his service as an executive officer.
G. Cabell Williams— Mr. Williams has served as member of our Board since 2007. Mr. Williams has served as the Managing General Partner of Williams and Gallagher, a private equity partnership located in Chevy Chase, Maryland since 2004. Mr. Williams is a Partner, Senior Manager and Director of Farragut Capital Partners, which is a Mezzanine Fund based out of Chevy Chase, Maryland. Since 2011, Mr. Williams has also served as a partner of Farragut Capital Partners, an investment firm based in Fairfax, VA. In 2004, Mr. Williams concluded a 23-year career at Allied Capital Corporation, a business development company based in Washington, DC, which was acquired by Ares Capital Corporation in 2010. While at Allied, Mr. Williams held a variety of positions, including President, CIO and finally Managing Director following Allied’s merger with its affiliates in 1998. From 1991 to 2004, Mr. Williams either led or co-managed the firm’s Private Equity Group. For the nine years prior to 1999, Mr. Williams led Allied’s Mezzanine investment activities. For 15 years, Mr. Williams served on Allied’s Investment Committee where he was responsible for reviewing and approving all of the firm’s investments. Prior to 1991, Mr. Williams ran Allied’s Minority Small Business Investment Company. He also founded Allied Capital Commercial Corporation, a real estate investment vehicle. Mr. Williams has served on the board of directors of various public and private companies. Mr. Williams attended The Landon School, and graduated from Mercersburg Academy and Rollins College, receiving a B.S. in Business Administration from the latter. Mr. Williams’ qualifications as director include his 28 years of experience managing investment activities at Allied Capital, where he served in a variety of positions, including President, CIO and Managing Director.
Code of Business Conduct and Ethics
We have adopted a Code of Business Conduct and Ethics which applies to, among others, our executive officers, including our principal executive officer and principal financial officer, as well as every officer, director and employee of the Company. Requests for copies should be sent in writing to Saratoga Investment Corp., 535 Madison Avenue, New York, New York 10022. The Company’s Code of Business Conduct and Ethics is also available on our website at www.saratogainvestmentcorp.com.
If we make any substantive amendment to, or grant a waiver from, a provision of our Code of Business Conduct and Ethics, we will promptly disclose the nature of the amendment or waiver on our website at www.saratogainvestmentcorp.com.
Delinquent Section 16(a) Reports
Section 16(a) of the Exchange Act requires the Company’s officers and directors, and persons who own more than 10% of our shares, to file reports of securities ownership and changes in such ownership with the SEC. Officers, directors, and greater than 10% shareholders also are required by SEC rules to furnish the Company with copies of all Section 16(a) forms they file.
Based solely on the Company’s review of Forms 3, 4 and 5 filed by such persons and information provided by the Company’s directors and officers, the Company believes that during the year ended February 29, 2024, all Section 16(a) filing requirements applicable to such persons were met in a timely manner, with the following inadvertent exceptions: Christian L. Oberbeck filed late a Form 4 with respect to one transaction in our shares during the reporting period.
Practices and Policies Regarding Hedging, Speculative Trading and Pledging of Securities
Our insider trading policy generally prohibits the Company’s and our Investment Adviser’s directors, officers and employees from engaging in any short-term trading, short sales and other speculative transactions involving our securities, including buying or selling puts or calls or other derivative securities based on our securities. In addition, such persons are generally prohibited under our insider trading policy from entering into hedging or monetization transactions or similar arrangements, as well as pledging our securities in a margin account or as collateral for a loan, except in limited circumstances that are pre-approved by our chief compliance officer.
Insider Trading Arrangements and Policies
We have adopted insider trading policies and procedures governing the purchase, sale, and disposition of our securities by our officers and directors of that are reasonably designed to promote compliance with insider trading laws, rules and regulations.
Nomination of Directors
There have been no material changes to the procedures by which stockholders may recommend nominees to our board of directors implemented since the filing of our Proxy Statement for our 2018 Annual Meeting of Stockholders.
Audit Committee
The current members of the audit committee are Steven M. Looney (Chairman), Charles S. Whitman III and G. Cabell Williams. The board of directors has determined that Mr. Looney is an “audit committee financial expert” as defined under Item 407 of Regulation S-K of the Securities Exchange Act of 1934 and that each of Messrs. Whitman and Williams are “financially literate” as required by NYSE corporate governance standards. All of these members are independent directors.
ITEM 11. EXECUTIVE COMPENSATION
Executive Compensation
Currently, none of our executive officers are compensated by us. We currently have no employees, and each of our executive officers is also an employee of Saratoga Investment Advisors. Services necessary for our business are provided by individuals who are employees of Saratoga Investment Advisors, pursuant to the terms of the Management Agreement and the Administration Agreement.
Director Compensation
Our independent directors receive an annual fee of $70,000. They also receive $3,000 plus reimbursement of reasonable out-of-pocket expenses incurred in connection with attending each board meeting and receive $1,500 plus reimbursement of reasonable out-of-pocket expenses incurred in connection with attending each committee meeting. In addition, the chairman of the audit committee receives an annual fee of $12,500 and the chairman of each other committee receives an annual fee of $6,000 for their additional services in these capacities. In addition, we have purchased directors’ and officers’ liability insurance on behalf of our directors and officers. Independent directors have the option to receive their directors’ fees in the form of our common stock issued at a price per share equal to the greater of net asset valueNAV or the market price at the time of payment. No compensation is paid to directors who are “interested persons.”
The following table sets forth information concerning total compensation earned by or paid to each of our directors during the fiscal year ended February 28, 2022:29, 2024:
| Fees Earned or Paid in Cash | Total | |||||||
| Interested Directors | ||||||||
| Christian L. Oberbeck(1) | $ | - | $ | - | ||||
| Henri J. Steenkamp(1) | - | - | ||||||
| Independent Directors | ||||||||
| Steven M. Looney | $ | 114,500 | $ | 114,500 | ||||
| Charles S. Whitman III | 109,500 | 109,500 | ||||||
| G. Cabell Williams | 109,500 | 109,500 | ||||||
| Fees Earned or Paid in Cash | Total | |||||||
| Interested Directors | ||||||||
| Christian L. Oberbeck(1) | $ | - | $ | - | ||||
| Henri J. Steenkamp(1) | - | - | ||||||
| Independent Directors | ||||||||
| Steven M. Looney | $ | 102,500 | $ | 102,500 | ||||
| Charles S. Whitman III | 96,000 | 96,000 | ||||||
| G. Cabell Williams | 96,000 | 96,000 | ||||||
| (1) | No compensation was paid to directors who are interested persons of us as defined in the 1940 Act. |
Compensation Committee Interlocks and Insider Participation
The current members of the compensation committee are G. Cabell Williams (Chairman), Steven M. Looney and Charles S. Whitman III. All of these members are independent directors. The compensation committee is responsible for overseeing the Company’s compensation policies generally and making recommendations to the board of directors with respect to incentive compensation and equity-based plans of the Company that are subject to board of directors approval, evaluating executive officer performance and reviewing the Company’s management succession plan, overseeing and setting compensation for the Company’s directors and, as applicable, its executive officers and, as applicable, preparing the report on executive officer compensation that SEC rules require to be included in our Annual Report on Form 10-K. Currently, none of our executive officers are compensated by the Company and as such the compensation committee is not required to produce a report on executive officer compensation for inclusion in our Annual Report on Form 10-K.
During fiscal year ended February 28, 202229, 2024 none of the Company’s executive officers served on the board of directors (or a compensation committee thereof or other board committee performing equivalent functions) of any entities that had one or more executive officers serve on the compensation committee or on the board of directors. No current or past executive officers or employees of the Company or its affiliates serve on the compensation committee.
ITEM 12. SECURITY OWNERSHIP OF CERTAIN BENEFICIAL OWNERS AND MANAGEMENT AND RELATED STOCKHOLDER MATTERS
The following table sets forth, as of May 4, 2022,3, 2024, the beneficial ownership of each current director, the nominees for director, the Company’s executive officers, each person known to us to beneficially own 5.0% or more of the outstanding shares of our common stock, and the executive officers and directors as a group.
The percentage ownership is based on 12,124,17513,698,966 shares of common stock outstanding as of May 4, 2022.3, 2024. Shares of common stock that are subject to warrants or other convertible securities currently exercisable or exercisable within 60 days thereof, are deemed outstanding for the purposes of computing the percentage ownership of the person holding these options or convertible securities, but are not deemed outstanding for computing the percentage ownership of any other person. Beneficial ownership is determined under the rules of the SEC and generally includes voting or investment power with respect to securities. To our knowledge, unless otherwise indicated in the footnotes to this table, the persons and entities named in the table have sole voting and sole investment power with respect to all shares beneficially owned. Unless otherwise indicated by footnote, the address for each listed individual is Saratoga Investment Corp., 535 Madison Avenue, New York, New York 10022.
| Name of Beneficial Owners | Number of Shares of Common Stock Beneficially Owned | Percent of Class | ||||||
| Interested Directors | ||||||||
| Christian L. Oberbeck | 1,529,307 | (1) | 12.6 | % | ||||
| Henri J. Steenkamp | 22,841 | * | ||||||
| Independent Directors | ||||||||
| Steven M. Looney | 2,508 | * | ||||||
| Charles S. Whitman III | 3,737 | * | ||||||
| G. Cabell Williams | 75,499 | * | ||||||
| All Directors as a Group | 1,633,892 | 13.5 | % | |||||
| Owners of 5% or more of our common stock | ||||||||
| Black Diamond Capital Management, L.L.C.(2) | 978,398 | 8.1 | % | |||||
| Elizabeth Oberbeck(3) | 549,183 | 4.5 | % | |||||
| Thomas V. Inglesby | 355,236 | 2.9 | % | |||||
| Michael J. Grisius | 167,216 | 1.4 | % | |||||
| Name of Beneficial Owners | Number of Shares of Common Stock Beneficially Owned | Percent of Class | ||||||
| Interested Directors | ||||||||
| Christian L. Oberbeck | 1,520,712 | (1) | 11.1 | % | ||||
| Henri J. Steenkamp | 28,459 | * | ||||||
| Independent Directors | ||||||||
| Steven M. Looney | 4,258 | * | ||||||
| Charles S. Whitman III | 4,518 | * | ||||||
| G. Cabell Williams | 88,773 | * | ||||||
| All Directors as a Group | 1,646,720 | 12.0 | % | |||||
| Owners of 5% or more of our common stock | ||||||||
| Elizabeth Oberbeck(2) | 549,183 | 4.0 | % | |||||
| Thomas V. Inglesby | 352,236 | 2.6 | % | |||||
| Michael J. Grisius | 167,216 | 1.2 | % | |||||
| * | Less than 1.0% |
Mr. Oberbeck, Mr. Grisius and Mr. Inglesby are affiliates who make up 17.2% of the ownership of SAR.
| (1) | Includes |
| (2) |
| Based on information included in Amendment No. 2 to Schedule 13D filed on January 16, 2020, which amends and supplements the statements on Schedule 13D originally filed with the Securities and Exchange filed jointly by Christian L. Oberbeck, Elizabeth Oberbeck, Saratoga Investment Advisors and CLO Partners LLC on November 4, 2014. Pursuant to an Agreement Relating to Shares of Common Stock of Saratoga Investment Corp. (the “Transfer Agreement”), Christian L. Oberbeck transferred 744,183 shares of common stock beneficially owned by him to Elizabeth Oberbeck. Elizabeth Oberbeck has full ownership rights with respect to the shares, including without limitation, the right to (A) receive any cash and/or stock dividends and distributions paid on or with respect to the shares and (B) sell the shares in accordance with the provisions of the Transfer Agreement and receive all proceeds therefrom. However, pursuant to the terms of the Transfer Agreement, Christian L. Oberbeck has retained the right to vote the shares, except that Elizabeth Oberbeck has retained the right to vote the shares on all matters submitted to shareholders with respect to any matter that could give rise to dissenters or other rights of an objecting shareholder under Maryland General Corporation Law. The Transfer Agreement also contains a right of first refusal that requires Elizabeth Oberbeck to offer Christian L. Oberbeck the opportunity to purchase any shares of Common Stock owned by her prior to her intended sale of the shares. Any such purchases may be made either directly by Mr. Oberbeck or through entities affiliated with him. |
ITEM 13. CERTAIN RELATIONSHIPS AND RELATED TRANSACTIONS, AND DIRECTOR INDEPENDENCE
Transactions with Related Persons
We have entered into a Management Agreement with Saratoga Investment Advisors, LLC. We have also entered into a license agreement with Saratoga Investment Advisors, LLC, pursuant to which Saratoga Investment Advisors has agreed to grant us a non-exclusive, royalty-free license to use the name “Saratoga.” In addition, pursuant to the terms of the Administration Agreement, Saratoga Investment Advisors, LLC provides us with the office facilities and administrative services necessary to conduct our day-to-day operations. Mr. Oberbeck, our chief executive officer, is the primary investor in and controls Saratoga Investment Advisors, LLC.
Review, Approval or Ratification of Transactions with Related Persons
The Audit Committee of our board is required to review and approve any transactions with related persons (as such term is defined in Item 404 of Regulation S-K).
Director Independence
In accordance with rules of the NYSE, the board of directors annually determines the independence of each director. No director is considered independent unless the board of directors has determined that he or she has no material relationship with the Company. The Company monitors the status of its directors and officers through the activities of the Company’s Nominating and Corporate Governance Committee and through a questionnaire to be completed by each director no less frequently than annually, with updates periodically if information provided in the most recent questionnaire has changed.
In order to evaluate the materiality of any such relationship, the board of directors uses the definition of director independence set forth in the NYSE Listed Company Manual. Section 303A.00 of the NYSE Listed Company Manual provides that business development companies, or BDCs, such as the Company, are required to comply with all of the provisions of Section 303A applicable to domestic issuers other than Sections 303A.02, the section that defines director independence.
Section 303A.00 provides that a director of a BDC shall be considered to be independent if he or she is not an “interested person” of the Company, as defined in Section 2(a)(19) of the 1940 Act. Section 2(a)(19) of the 1940 Act defines an “interested person” to include, among other things, any person who has, or within the last two years had, a material business or professional relationship with the Company.
The board of directors has determined that each of the directors is independent and has no relationship with the Company, except as a director and stockholder of the Company, with the exception of Messrs. Oberbeck and Grisius who are interested persons of the Company due to their positions as officers of the Company and its Investment Adviser.
ITEM 14. PRINCIPAL ACCOUNTING FEES AND SERVICES
Independent Registered Public Accounting Firm
For the years ended February 28, 202229, 2024 and February 28, 2021,2023, the Company incurred the following fees for services provided by Ernst & Young LLP, including expenses:
| Fiscal Year Ended February 28, 2022 | Fiscal Year Ended February 28, 2021 | |||||||
| Audit Fees | $ | 513,000 | $ | 525,000 | ||||
| Tax Fees | 44,000 | 42,800 | ||||||
| Total Fees | $ | 557,000 | $ | 567,800 | ||||
| Fiscal Year Ended February 29, 2024 | Fiscal Year 2023 | |||||||
| Audit Fees | $ | 642,300 | $ | 584,500 | ||||
| Tax Fees | 50,350 | 46,200 | ||||||
| Total Fees | $ | 692,650 | $ | 630,700 | ||||
In addition to the services listed above, Ernst & Young LLP provided audit services to the Company’s subsidiaries. The following are the related fees:
| Fiscal Year Ended February 28, 2022 | Fiscal Year Ended February 28, 2021 | |||||||
| CLO Audit Fees | $ | - | $ | - | ||||
| Tax Services for Company’s Subsidiaries | - | - | ||||||
| All Other Fees | 89,000 | 29,000 | ||||||
| Total Fees | $ | 89,000 | $ | 29,000 | ||||
| Fiscal Year Ended February 29, 2024 | Fiscal Year Ended February 28, 2023 | |||||||
| CLO Audit Fees | $ | — | $ | — | ||||
| Tax Services for Company’s Subsidiaries | — | — | ||||||
| All Other Fees | 84,925 | 97,750 | ||||||
| Total Fees | $ | 84,925 | $ | 97,750 | ||||
Audit Fees. Audit fees include fees for services that normally would be provided by the accountant in connection with statutory and regulatory filings or engagements and that generally only the independent accountant can provide. In addition to fees for the audit of our annual consolidated financial statements, the audit of the effectiveness of our internal control over financial reporting and the review of our quarterly consolidated financial statements in accordance with generally accepted auditing standards, this category contains fees for comfort letters, statutory audits, consents, and assistance with and review of documents filed with the SEC.
Tax Fees. Tax fees include services in conjunction with preparation of the Company’s tax return.
All Other Fees. Fees for other services would include fees for products and services other than the services reported above.
It is the policy of the audit committee to pre-approve all audit, review or attest engagements and permissible non-audit services to be performed by our independent registered public accounting firm.
PART IV
ITEM 15. EXHIBITS, CONSOLIDATED FINANCIAL STATEMENT SCHEDULES
The following documents are filed or incorporated by reference as part of this Annual Report:
1. Consolidated Financial Statements
The following consolidated financial statements of the Company are filed herewith: Report of Independent Registered Public Accounting Firm
Consolidated Statements of Assets and Liabilities as of February 28, 202229, 2024 and February 28, 20212023
Consolidated Statements of Operations for the years ended February 28, 2022,29, 2024, February 28, 20212023 and February 28, 20202022
Consolidated Schedules of Investments as of February 28, 202229, 2024 and February 28, 20212023
Consolidated Statements of Changes in Net Assets for the years ended February 28, 2022,29, 2024, February 28, 20212023 and
February 29, 202028, 2022
Consolidated Statements of Cash Flows for the years ended February 28, 2022,29, 2024, February 28, 20212023 and February 29, 202028, 2022
Notes to Consolidated Financial Statements
2. Financial Statement Schedules
Reference is made to the Index to Other Financial Statements on page S-1.
3. Exhibits required to be filed by Item 601 of Regulation S-K
The following exhibits are filed as part of this report or hereby incorporated by reference to exhibits previously filed with the SEC:
EXHIBIT INDEX
| * | Filed herewith |
ITEM 16. FORM 10-K SUMMARY
None.
SIGNATURES
Pursuant to the requirements of Section 13 or 15(d) of the Securities Exchange Act of 1934, the registrant has duly caused this report to be signed on its behalf by the undersigned, thereunto duly authorized.
| SARATOGA INVESTMENT CORP. | ||
| Date: May | By: | /s/ CHRISTIAN L. OBERBECK |
| Christian L. Oberbeck | ||
| Chief Executive Officer | ||
| By: | /s/ HENRI J. STEENKAMP | |
| Henri J. Steenkamp | ||
| Chief Financial Officer and Chief Compliance Officer | ||
KNOW ALL PERSONS BY THESE PRESENT, that each person whose signature appears below hereby constitutes and appoints Christian L. Oberbeck and Henri J. Steenkamp, and each of them (with full power to each of them to act alone), his true and lawful attorneys-in-fact and agents, with full power of substitution and resubstitution, for him and in his name, place, and stead, in any and all capacities, to sign this report and any and all amendments thereto, and to file the same, with the Securities and Exchange Commission, granting unto said attorneys-in-fact and agents full power and authority to do and perform each and every act and thing requisite and necessary to be done in and about the premises, as fully to all intents and purposes as he might or could do in person, hereby ratifying and confirming all that said attorneys-in-fact and agents, or their substitute or substitutes, may lawfully do or cause to be done by virtue hereof.
Pursuant to the requirements of the Securities Exchange Act of 1934, this report has been signed below by the following persons on behalf of the registrant and in the capacities and on the dates indicated.
| Signature | Title | Date | ||
| /s/ CHRISTIAN L. OBERBECK | Chairman of the Board of Directors, Chief Executive Officer | May | ||
| Christian L. Oberbeck | ||||
| /s/ HENRI J. STEENKAMP | Chief Financial Officer (Principal Accounting Officer and | May | ||
| Henri J. Steenkamp | Principal Financial Officer), Member of the Board of Directors | |||
| /s/ STEVEN M. LOONEY | Member of the Board of Directors | May | ||
| Steven M. Looney | ||||
| /s/ CHARLES S. WHITMAN III | Member of the Board of Directors | May | ||
| Charles S. Whitman III | ||||
| /s/ G. CABELL WILLIAMS | Member of the Board of Directors | May | ||
| Cabell Williams |
INDEX TO CONSOLIDATED FINANCIAL STATEMENTS
F-1
Report of Independent Registered Public Accounting Firm
TheTo the Shareholders and the Board of Directors of Saratoga Investment Corp.
Opinion on the Financial Statements
We have audited the accompanying consolidated statements of assets and liabilities of Saratoga Investment Corp. (the “Company”), including the consolidated schedules of investments, as of February 28, 202229, 2024 and February 28, 2021,2023, the related consolidated statements of operations, changes in net assets, and cash flows for each of the three years in the period ended February 28, 2022,29, 2024, and the related notes (collectively referred to as the “consolidated financial statements”). In our opinion, the consolidated financial statements present fairly, in all material respects, the financial position of the Company at February 28, 202229, 2024 and February 28, 2021,2023, and the results of its operations, changes in its net assets and its cash flows for each of the three years in the period ended February 28, 2022,29, 2024, in conformity with USU.S. generally accepted accounting principles.
Basis for Opinion
These financial statements are the responsibility of the Company’s management. Our responsibility is to express an opinion on the Company’s financial statements based on our audits. We are a public accounting firm registered with the Public Company Accounting Oversight Board (United States) (PCAOB) and are required to be independent with respect to the Company in accordance with the U.S. federal securities laws and the applicable rules and regulations of the Securities and Exchange Commission and the PCAOB.
We conducted our audits in accordance with the standards of the PCAOB. Those standards require that we plan and perform the audit to obtain reasonable assurance about whether the financial statements are free of material misstatement, whether due to error or fraud. The Company is not required to have, nor were we engaged to perform, an audit of its internal controlscontrol over financial reporting. As part of our audits, we are required to obtain an understanding of internal control over financial reporting but not for the purpose of expressing an opinion on the effectiveness of the Company’s internal control over financial reporting. Accordingly, we express no such opinion.
Our audits included performing procedures to assess the risks of material misstatement of the financial statements, whether due to error or fraud, and performing procedures that respond to those risks. Such procedures included examining, on a test basis, evidence regarding the amounts and disclosures in the financial statements. Our procedures included confirmation of investments owned as of February 28, 202229, 2024 and February 28, 20212023 by correspondence with the portfolio companies, custodians and debt agents. Our audits also included evaluating the accounting principles used and significant estimates made by management, as well as evaluating the overall presentation of the financial statements. We believe that our audits provide a reasonable basis for our opinion.
Critical Audit Matter
The critical audit matter communicated below is a matter arising from the current period audit of the financial statements that was communicated or required to be communicated to the audit committee and that: (1) relates to accounts or disclosures that are material to the financial statements and (2) involved our especially challenging, subjective or complex judgments. The communication of the critical audit matter does not alter in any way our opinion on the consolidated financial statements, taken as a whole, and we are not, by communicating the critical audit matter below, providing a separate opinion on the critical audit matter or on the account or disclosure to which is relates.
Valuation of investments using significant unobservable inputs
| Description of the Matter | At February
Auditing the fair value of the | |
| How We Addressed the Matter in Our Audit | To test the valuation of the Company’s Level 3 investments, we gained an understanding of the valuation techniques, significant unobservable inputs and assumptions used by the Company to value the Level 3 investments and reviewed the information considered by the Board of Directors relating to the fair value of each investment. For a sample of Level 3 investments, we evaluated the valuation techniques used, tested the significant unobservable inputs and assumptions, and tested the mathematical accuracy of the related valuation models. For this sample of Level 3 investments, we agreed the significant inputs and underlying data used in the Company’s valuations (for example, deal terms, portfolio company operating results, market | |
/s/ Ernst & Young LLP
We have served as the Company’s auditor since 2006.
New York, New York
May 4, 20226, 2024
PART I. FINANCIAL INFORMATION
Item 1. Consolidated Financial Statements
Saratoga Investment Corp.
Consolidated Statements of Assets and Liabilities
| February 28, 2022 | February 28, 2021 | |||||||
| ASSETS | ||||||||
| Investments at fair value | ||||||||
| Non-control/Non-affiliate investments (amortized cost of $654,965,044 and $471,328,212, respectively) | $ | 668,358,516 | $ | 469,946,494 | ||||
| Affiliate investments (amortized cost of $46,224,927 and $17,331,707, respectively) | 48,234,124 | 19,367,740 | ||||||
| Control investments (amortized cost of $95,058,356 and $61,353,761, respectively) | 100,974,715 | 64,998,481 | ||||||
| Total investments at fair value (amortized cost of $796,248,327 and $550,013,680, respectively) | 817,567,355 | 554,312,715 | ||||||
| Cash and cash equivalents | 47,257,801 | 18,828,047 | ||||||
| Cash and cash equivalents, reserve accounts | 5,612,541 | 11,087,027 | ||||||
| Interest receivable (net of reserve of $0 and $1,152,086, respectively) | 5,093,561 | 4,223,630 | ||||||
| Due from affiliate (See Note 7) | 90,968 | 2,719,000 | ||||||
| Management fee receivable | 362,549 | 34,644 | ||||||
| Other assets | 254,980 | 947,315 | ||||||
| Total assets | $ | 876,239,755 | $ | 592,152,378 | ||||
| LIABILITIES | ||||||||
| Revolving credit facility | $ | 12,500,000 | $ | - | ||||
| Deferred debt financing costs, revolving credit facility | (1,191,115 | ) | (639,982 | ) | ||||
| SBA debentures payable | 185,000,000 | 158,000,000 | ||||||
| Deferred debt financing costs, SBA debentures payable | (4,344,983 | ) | (2,642,622 | ) | ||||
| 6.25% Notes Payable 2025 | - | 60,000,000 | ||||||
| Deferred debt financing costs, 6.25% notes payable 2025 | - | (1,675,064 | ) | |||||
| 7.25% Notes Payable 2025 | 43,125,000 | 43,125,000 | ||||||
| Deferred debt financing costs, 7.25% notes payable 2025 | (1,078,201 | ) | (1,401,307 | ) | ||||
| 7.75% Notes Payable 2025 | 5,000,000 | 5,000,000 | ||||||
| Deferred debt financing costs, 7.75% notes payable 2025 | (184,375 | ) | (239,222 | ) | ||||
| 4.375% Notes Payable 2026 | 175,000,000 | - | ||||||
| Premium on 4.375% notes payable 2026 | 1,086,013 | - | ||||||
| Deferred debt financing costs, 4.375% notes payable 2026 | (3,395,435 | ) | - | |||||
| 4.35% Notes Payable 2027 | 75,000,000 | - | ||||||
| Discount on 4.35% notes payable 2027 | (499,263 | ) | - | |||||
| Deferred debt financing costs, 4.35% notes payable 2027 | (1,722,908 | ) | - | |||||
| 6.25% Notes Payable 2027 | 15,000,000 | 15,000,000 | ||||||
| Deferred debt financing costs, 6.25% notes payable 2027 | (416,253 | ) | (476,820 | ) | ||||
| Base management and incentive fees payable | 12,947,025 | 6,556,674 | ||||||
| Deferred tax liability | 1,249,015 | 1,922,664 | ||||||
| Accounts payable and accrued expenses | 799,058 | 1,750,266 | ||||||
| Current income tax payable | 2,820,036 | - | ||||||
| Interest and debt fees payable | 2,801,621 | 2,645,784 | ||||||
| Directors fees payable | 70,000 | 70,500 | ||||||
| Due to manager | 263,814 | 279,065 | ||||||
| Excise tax payable | 630,183 | 691,672 | ||||||
| Total liabilities | 520,459,232 | 287,966,608 | ||||||
| Commitments and contingencies (See Note 9) | ||||||||
| NET ASSETS | ||||||||
| Common stock, par value $0.001, 100,000,000 common shares authorized, 12,131,350 and 11,161,416 common shares issued and outstanding, respectively | 12,131 | 11,161 | ||||||
| Capital in excess of par value | 328,062,246 | 304,874,957 | ||||||
| Total distributable earnings (deficit) | 27,706,146 | (700,348 | ) | |||||
| Total net assets | 355,780,523 | 304,185,770 | ||||||
| Total liabilities and net assets | $ | 876,239,755 | $ | 592,152,378 | ||||
| NET ASSET VALUE PER SHARE | $ | 29.33 | $ | 27.25 | ||||
| February 29, 2024 | February 28, 2023 | |||||||
| ASSETS | ||||||||
| Investments at fair value | ||||||||
| Non-control/Non-affiliate investments (amortized cost of $1,035,879,751 and $819,966,208, respectively) | $ | 1,019,774,616 | $ | 828,028,800 | ||||
| Affiliate investments (amortized cost of $26,707,415 and $25,722,320, respectively) | 27,749,137 | 28,305,871 | ||||||
| Control investments (amortized cost of $117,196,571 and $120,800,829, respectively) | 91,270,036 | 116,255,582 | ||||||
| Total investments at fair value (amortized cost of $1,179,783,737 and $966,489,357, respectively) | 1,138,793,789 | 972,590,253 | ||||||
| Cash and cash equivalents | 8,692,846 | 65,746,494 | ||||||
| Cash and cash equivalents, reserve accounts | 31,814,278 | 30,329,779 | ||||||
| Interest receivable (net of reserve of $9,490,340 and $2,217,300, respectively) | 10,298,998 | 8,159,951 | ||||||
| Management fee receivable | 343,023 | 363,809 | ||||||
| Other assets | 1,163,225 | 531,337 | ||||||
| Current tax receivable | 99,676 | 436,551 | ||||||
| Total assets | $ | 1,191,205,835 | $ | 1,078,158,174 | ||||
| LIABILITIES | ||||||||
| Revolving credit facility | $ | 35,000,000 | $ | 32,500,000 | ||||
| Deferred debt financing costs, revolving credit facility | (882,122 | ) | (1,344,005 | ) | ||||
| SBA debentures payable | 214,000,000 | 202,000,000 | ||||||
| Deferred debt financing costs, SBA debentures payable | (5,779,892 | ) | (4,923,488 | ) | ||||
| 8.75% Notes Payable 2025 | 20,000,000 | - | ||||||
| Discount on 8.75% notes payable 2025 | (112,894 | ) | - | |||||
| Deferred debt financing costs, 8.75% notes payable 2025 | (4,777 | ) | - | |||||
| 7.00% Notes Payable 2025 | 12,000,000 | 12,000,000 | ||||||
| Discount on 7.00% notes payable 2025 | (193,175 | ) | (304,946 | ) | ||||
| Deferred debt financing costs, 7.00% notes payable 2025 | (24,210 | ) | (40,118 | ) | ||||
| 7.75% Notes Payable 2025 | 5,000,000 | 5,000,000 | ||||||
| Deferred debt financing costs, 7.75% notes payable 2025 | (74,531 | ) | (129,528 | ) | ||||
| 4.375% Notes Payable 2026 | 175,000,000 | 175,000,000 | ||||||
| Premium on 4.375% notes payable 2026 | 564,260 | 830,824 | ||||||
| Deferred debt financing costs, 4.375% notes payable 2026 | (1,708,104 | ) | (2,552,924 | ) | ||||
| 4.35% Notes Payable 2027 | 75,000,000 | 75,000,000 | ||||||
| Discount on 4.35% notes payable 2027 | (313,010 | ) | (408,932 | ) | ||||
| Deferred debt financing costs, 4.35% notes payable 2027 | (1,033,178 | ) | (1,378,515 | ) | ||||
| 6.25% Notes Payable 2027 | 15,000,000 | 15,000,000 | ||||||
| Deferred debt financing costs, 6.25% notes payable 2027 | (273,449 | ) | (344,949 | ) | ||||
| 6.00% Notes Payable 2027 | 105,500,000 | 105,500,000 | ||||||
| Discount on 6.00% notes payable 2027 | (123,782 | ) | (159,334 | ) | ||||
| Deferred debt financing costs, 6.00% notes payable 2027 | (2,224,403 | ) | (2,926,637 | ) | ||||
| 8.00% Notes Payable 2027 | 46,000,000 | 46,000,000 | ||||||
| Deferred debt financing costs, 8.00% notes payable 2027 | (1,274,455 | ) | (1,622,376 | ) | ||||
| 8.125% Notes Payable 2027 | 60,375,000 | 60,375,000 | ||||||
| Deferred debt financing costs, 8.125% notes payable 2027 | (1,563,594 | ) | (1,944,536 | ) | ||||
| 8.50% Notes Payable 2028 | 57,500,000 | - | ||||||
| Deferred debt financing costs, 8.50% notes payable 2028 | (1,680,039 | ) | - | |||||
| Base management and incentive fees payable | 8,147,217 | 12,114,878 | ||||||
| Deferred tax liability | 3,791,150 | 2,816,572 | ||||||
| Accounts payable and accrued expenses | 1,337,542 | 1,464,343 | ||||||
| Interest and debt fees payable | 3,582,173 | 3,652,936 | ||||||
| Directors fees payable | - | 14,932 | ||||||
| Due to Manager | 450,000 | 10,935 | ||||||
| Total liabilities | 820,981,727 | 731,200,132 | ||||||
| Commitments and contingencies (See Note 9) | ||||||||
| NET ASSETS | ||||||||
| Common stock, par value $0.001, 100,000,000 common shares authorized, 13,653,476 and 11,890,500 common shares issued and outstanding, respectively | 13,654 | 11,891 | ||||||
| Capital in excess of par value | 371,081,199 | 321,893,806 | ||||||
| Total distributable earnings (deficit) | (870,745 | ) | 25,052,345 | |||||
| Total net assets | 370,224,108 | 346,958,042 | ||||||
| Total liabilities and net assets | $ | 1,191,205,835 | $ | 1,078,158,174 | ||||
| NET ASSET VALUE PER SHARE | $ | 27.12 | $ | 29.18 | ||||
See accompanying notes to consolidated financial statements.
Saratoga Investment Corp.
Consolidated Statements of Operations
| For the year ended | ||||||||||||
| February 28, 2022 | February 28, 2021 | February 28, 2020 | ||||||||||
| INVESTMENT INCOME | ||||||||||||
| Interest from investments | ||||||||||||
| Interest income: | ||||||||||||
| Non-control/Non-affiliate investments | $ | 46,369,544 | $ | 41,621,899 | $ | 36,252,113 | ||||||
| Affiliate investments | 3,308,471 | 1,656,263 | 1,230,578 | |||||||||
| Control investments | 7,345,691 | 5,848,980 | 6,175,120 | |||||||||
| Payment-in-kind interest income: | ||||||||||||
| Non-control/Non-affiliate investments | 1,150,695 | 2,251,499 | 816,041 | |||||||||
| Affiliate investments | - | 172,626 | 167,836 | |||||||||
| Control investments | 327,171 | 162,658 | 3,405,307 | |||||||||
| Total interest from investments | 58,501,572 | 51,713,925 | 48,046,995 | |||||||||
| Interest from cash and cash equivalents | 3,584 | 14,609 | 536,053 | |||||||||
| Management fee income | 3,262,591 | 2,507,626 | 2,503,804 | |||||||||
| Dividend Income* | 1,925,791 | 158,045 | 215,893 | |||||||||
| Structuring and advisory fee income | 4,307,647 | 2,157,405 | 5,286,475 | |||||||||
| Other income* | 2,739,372 | 1,098,646 | 1,858,971 | |||||||||
| Total investment income | 70,740,557 | 57,650,256 | 58,448,191 | |||||||||
| OPERATING EXPENSES | ||||||||||||
| Interest and debt financing expenses | 19,880,693 | 13,587,201 | 14,682,611 | |||||||||
| Base management fees | 11,901,729 | 9,098,495 | 8,098,995 | |||||||||
| Incentive management fees expense | 11,794,208 | 4,903,499 | 14,163,776 | |||||||||
| Professional fees | 1,378,134 | 1,705,942 | 1,684,089 | |||||||||
| Administrator expenses | 2,906,250 | 2,545,833 | 2,131,250 | |||||||||
| Insurance | 348,671 | 285,529 | 259,981 | |||||||||
| Directors fees and expenses | 335,596 | 290,000 | 277,500 | |||||||||
| General & administrative | 1,661,932 | 1,428,293 | 1,326,457 | |||||||||
| Income tax expense (benefit) | (39,649 | ) | 667 | 961,995 | ||||||||
| Excise tax expense (credit) | 630,183 | 691,672 | - | |||||||||
| Total operating expenses | 50,797,747 | 34,537,131 | 43,586,654 | |||||||||
| NET INVESTMENT INCOME | 19,942,810 | 23,113,125 | 14,861,537 | |||||||||
| REALIZED AND UNREALIZED GAIN (LOSS) ON INVESTMENTS | ||||||||||||
| Net realized gain (loss) from investments: | ||||||||||||
| Non-control/Non-affiliate investments | 6,209,737 | 22,207 | 11,651,990 | |||||||||
| Affiliate investments | 7,328,457 | (8,726,013 | ) | - | ||||||||
| Control investments | (139,867 | ) | - | 31,225,165 | ||||||||
| Net realized gain (loss) from investments | 13,398,327 | (8,703,806 | ) | 42,877,155 | ||||||||
| Income tax (provision) benefit from realized gain on investments | (2,886,444 | ) | (3,895,354 | ) | - | |||||||
| Net change in unrealized appreciation (depreciation) on investments: | ||||||||||||
| Non-control/Non-affiliate investments | 14,775,190 | (3,817,921 | ) | 3,060,964 | ||||||||
| Affiliate investments | (26,836 | ) | 7,549,096 | 1,538,572 | ||||||||
| Control investments | 2,271,639 | 1,235,147 | (5,370,450 | ) | ||||||||
| Net change in unrealized appreciation (depreciation) on investments | 17,019,993 | 4,966,322 | (770,914 | ) | ||||||||
| Net change in provision for deferred taxes on unrealized (appreciation) depreciation on investments | 694,908 | (574,634 | ) | 354,349 | ||||||||
| Net realized and unrealized gain (loss) on investments | 28,226,784 | (8,207,472 | ) | 42,460,590 | ||||||||
| Realized losses on extinguishment of debt | (2,434,410 | ) | (128,617 | ) | (1,583,266 | ) | ||||||
| NET INCREASE IN NET ASSETS RESULTING FROM OPERATIONS | $ | 45,735,184 | $ | 14,777,036 | $ | 55,738,861 | ||||||
| WEIGHTED AVERAGE - BASIC AND DILUTED EARNINGS PER COMMON SHARE | $ | 3.99 | $ | 1.32 | $ | 5.98 | ||||||
| WEIGHTED AVERAGE COMMON SHARES OUTSTANDING - BASIC AND DILUTED | 11,456,631 | 11,188,629 | 9,319,192 | |||||||||
| For the year ended | ||||||||||||
| February 29, 2024 | February 28, 2023 | February 28, 2022 | ||||||||||
| INVESTMENT INCOME | ||||||||||||
| Interest from investments | ||||||||||||
| Interest income: | ||||||||||||
| Non-control/Non-affiliate investments | $ | 113,521,652 | $ | 72,677,237 | $ | 46,369,544 | ||||||
| Affiliate investments | 3,299,816 | 4,773,527 | 3,308,471 | |||||||||
| Control investments | 8,507,909 | 6,602,594 | 7,345,691 | |||||||||
| Payment-in-kind interest income: | ||||||||||||
| Non-control/Non-affiliate investments | 766,697 | 359,910 | 1,150,695 | |||||||||
| Affiliate investments | 874,226 | 416,711 | - | |||||||||
| Control investments | 814,925 | 386,889 | 327,171 | |||||||||
| Total interest from investments | 127,785,225 | 85,216,868 | 58,501,572 | |||||||||
| Interest from cash and cash equivalents | 2,512,416 | 1,368,489 | 3,584 | |||||||||
| Management fee income | 3,270,232 | 3,269,820 | 3,262,591 | |||||||||
| Dividend income(*): | ||||||||||||
| Non-control/Non-affiliate investments | 621,398 | 2,104,355 | 1,379,182 | |||||||||
| Affiliate investments | - | 615,917 | 546,609 | |||||||||
| Control investments | 5,911,564 | - | - | |||||||||
| Total dividend from investments | 6,532,962 | 2,720,272 | 1,925,791 | |||||||||
| Structuring and advisory fee income | 2,149,751 | 3,585,061 | 4,307,647 | |||||||||
| Other income | 1,469,320 | 2,943,610 | 2,739,372 | |||||||||
| Total investment income | 143,719,906 | 99,104,120 | 70,740,557 | |||||||||
| OPERATING EXPENSES | ||||||||||||
| Interest and debt financing expenses | 49,179,899 | 33,498,489 | 19,880,693 | |||||||||
| Base management fees | 19,212,337 | 16,423,960 | 11,901,729 | |||||||||
| Incentive management fees expense (benefit) | 8,025,468 | 5,057,117 | 11,794,208 | |||||||||
| Professional fees | 1,767,015 | 1,812,259 | 1,378,134 | |||||||||
| Administrator expenses | 3,872,917 | 3,160,417 | 2,906,250 | |||||||||
| Insurance | 322,323 | 347,483 | 348,671 | |||||||||
| Directors fees and expenses | 351,297 | 360,000 | 335,596 | |||||||||
| General and administrative | 2,241,579 | 2,328,672 | 1,661,932 | |||||||||
| Income tax expense (benefit) | 42,926 | (152,956 | ) | (39,649 | ) | |||||||
| Excise tax expense (benefit) | 1,829,837 | 1,067,532 | 630,183 | |||||||||
| Total operating expenses | 86,845,598 | 63,902,973 | 50,797,747 | |||||||||
| NET INVESTMENT INCOME | 56,874,308 | 35,201,147 | 19,942,810 | |||||||||
| REALIZED AND UNREALIZED GAIN (LOSS) ON INVESTMENTS | ||||||||||||
| Net realized gain (loss) from investments: | ||||||||||||
| Non-control/Non-affiliate investments | 153,583 | 7,446,596 | 6,209,737 | |||||||||
| Affiliate investments | - | - | 7,328,457 | |||||||||
| Control investments | - | - | (139,867 | ) | ||||||||
| Net realized gain (loss) from investments | 153,583 | 7,446,596 | 13,398,327 | |||||||||
| Income tax (provision) benefit from realized gain on investments | - | 548,568 | (2,886,444 | ) | ||||||||
| Net change in unrealized appreciation (depreciation) on investments: | ||||||||||||
| Non-control/Non-affiliate investments | (24,167,727 | ) | (5,330,880 | ) | 14,775,190 | |||||||
| Affiliate investments | (1,541,829 | ) | 574,354 | (26,836 | ) | |||||||
| Control investments | (21,381,288 | ) | (10,461,606 | ) | 2,271,639 | |||||||
| Net change in unrealized appreciation (depreciation) on investments | (47,090,844 | ) | (15,218,132 | ) | 17,019,993 | |||||||
| Net change in provision for deferred taxes on unrealized (appreciation) depreciation on investments | (893,166 | ) | (1,715,333 | ) | 694,908 | |||||||
| Net realized and unrealized gain (loss) on investments | (47,830,427 | ) | (8,938,301 | ) | 28,226,784 | |||||||
| Realized losses on extinguishment of debt | (110,056 | ) | (1,587,083 | ) | (2,434,410 | ) | ||||||
| NET INCREASE (DECREASE) IN NET ASSETS RESULTING FROM OPERATIONS | $ | 8,933,825 | $ | 24,675,763 | $ | 45,735,184 | ||||||
| WEIGHTED AVERAGE - BASIC AND DILUTED EARNINGS (LOSS) PER COMMON SHARE | $ | 0.71 | $ | 2.06 | $ | 3.99 | ||||||
| WEIGHTED AVERAGE COMMON SHARES OUTSTANDING - BASIC AND DILUTED | 12,670,939 | 11,963,533 | 11,456,631 | |||||||||
| * | Certain prior period amounts have been reclassified to conform to current |
See accompanying notes to consolidated financial statements.
F-4
Consolidated Statements of Changes in Net Assets
| For the year ended | ||||||||||||
| February 28, 2022 | February 28, 2021 | February 28, 2020 | ||||||||||
| INCREASE (DECREASE) FROM OPERATIONS: | ||||||||||||
| Net investment income | $ | 19,942,810 | $ | 23,113,125 | $ | 14,861,537 | ||||||
| Net realized gain from investments | 13,398,327 | (8,703,806 | ) | 42,877,155 | ||||||||
| Realized losses on extinguishment of debt | (2,434,410 | ) | (128,617 | ) | (1,583,266 | ) | ||||||
| Income tax (provision) benefit from realized gain on investments | (2,886,444 | ) | (3,895,354 | ) | - | |||||||
| Net change in unrealized appreciation (depreciation) on investments | 17,019,993 | 4,966,322 | (770,914 | ) | ||||||||
| Net change in provision for deferred taxes on unrealized (appreciation) depreciation on investments | 694,908 | (574,634 | ) | 354,349 | ||||||||
| Net increase in net assets resulting from operations | 45,735,184 | 14,777,036 | 55,738,861 | |||||||||
| DECREASE FROM SHAREHOLDER DISTRIBUTIONS: | ||||||||||||
| Total distributions to shareholders | (22,033,235 | ) | (13,746,998 | ) | (20,097,580 | ) | ||||||
| Net decrease in net assets from shareholder distributions | (22,033,235 | ) | (13,746,998 | ) | (20,097,580 | ) | ||||||
| CAPITAL SHARE TRANSACTIONS: | ||||||||||||
| Proceeds from issuance of common stock | 26,835,203 | - | 85,904,441 | |||||||||
| Stock dividend distribution | 3,875,206 | 2,481,084 | 3,096,492 | |||||||||
| Repurchases of common stock | (2,545,037 | ) | (3,608,459 | ) | - | |||||||
| Repurchase fees | (1,992 | ) | (3,746 | ) | - | |||||||
| Offering costs | (270,576 | ) | - | (1,230,548 | ) | |||||||
| Net increase (decrease) in net assets from capital share transactions | 27,892,804 | (1,131,121 | ) | 87,770,385 | ||||||||
| Total increase (decrease) in net assets | 51,594,753 | (101,083 | ) | 123,411,666 | ||||||||
| Net assets at beginning of period | 304,185,770 | 304,286,853 | 180,875,187 | |||||||||
| Net assets at end of period | $ | 355,780,523 | $ | 304,185,770 | $ | 304,286,853 | ||||||
| For the year ended | ||||||||||||
| February 29, 2024 | February 28, 2023 | February 28, 2022 | ||||||||||
| INCREASE (DECREASE) FROM OPERATIONS: | ||||||||||||
| Net investment income | $ | 56,874,308 | $ | 35,201,147 | $ | 19,942,810 | ||||||
| Net realized gain from investments | 153,583 | 7,446,596 | 13,398,327 | |||||||||
| Realized losses on extinguishment of debt | (110,056 | ) | (1,587,083 | ) | (2,434,410 | ) | ||||||
| Income tax (provision) benefit from realized gain on investments | - | 548,568 | (2,886,444 | ) | ||||||||
| Net change in unrealized appreciation (depreciation) on investments | (47,090,844 | ) | (15,218,132 | ) | 17,019,993 | |||||||
| Net change in provision for deferred taxes on unrealized (appreciation) depreciation on investments | (893,166 | ) | (1,715,333 | ) | 694,908 | |||||||
| Net increase in net assets resulting from operations | 8,933,825 | 24,675,763 | 45,735,184 | |||||||||
| DECREASE FROM SHAREHOLDER DISTRIBUTIONS: | ||||||||||||
| Total distributions to shareholders | (35,635,955 | ) | (27,313,402 | ) | (22,033,235 | ) | ||||||
| Net decrease in net assets from shareholder distributions | (35,635,955 | ) | (27,313,402 | ) | (22,033,235 | ) | ||||||
| CAPITAL SHARE TRANSACTIONS: | ||||||||||||
| Proceeds from issuance of common stock(1) | 44,539,387 | - | 26,835,203 | |||||||||
| Capital contribution from Manager | 4,475,297 | - | - | |||||||||
| Stock dividend distribution | 3,582,345 | 4,648,262 | 3,875,206 | |||||||||
| Repurchases of common stock | (2,157,605 | ) | (10,824,340 | ) | (2,545,037 | ) | ||||||
| Repurchase fees | (1,772 | ) | (8,764 | ) | (1,992 | ) | ||||||
| Offering costs | (469,456 | ) | - | (270,576 | ) | |||||||
| Net increase (decrease) in net assets from capital share transactions | 49,968,196 | (6,184,842 | ) | 27,892,804 | ||||||||
| Total increase (decrease) in net assets | 23,266,066 | (8,822,481 | ) | 51,594,753 | ||||||||
| Net assets at beginning of year | 346,958,042 | 355,780,523 | 304,185,770 | |||||||||
| Net assets at end of year | $ | 370,224,108 | $ | 346,958,042 | $ | 355,780,523 | ||||||
| (1) | See Note 11 to the Consolidated Financial Statements contained herein for more information on share issuance. |
See accompanying notes to consolidated financial statements.
Saratoga Investment Corp.
Consolidated Statements of Cash Flows
| For the year ended | ||||||||||||
| February 28, 2022 | February 28, 2021 | February 28, 2020 | ||||||||||
| Operating activities | ||||||||||||
| NET INCREASE (DECREASE) IN NET ASSETS RESULTING FROM OPERATIONS | $ | 45,735,184 | $ | 14,777,036 | $ | 55,738,861 | ||||||
| ADJUSTMENTS TO RECONCILE NET INCREASE (DECREASE) IN NET ASSETS RESULTING | ||||||||||||
| FROM OPERATIONS TO NET CASH PROVIDED BY (USED IN) OPERATING ACTIVITIES: | ||||||||||||
| Payment-in-kind and other adjustments to cost | 349,292 | 973,606 | (3,045,533 | ) | ||||||||
| Net accretion of discount on investments | (2,043,088 | ) | (1,390,128 | ) | (1,069,710 | ) | ||||||
| Amortization of deferred debt financing costs | 2,164,761 | 1,372,662 | 1,340,299 | |||||||||
| Realized losses on extinguishment of debt | 2,434,410 | 128,617 | 1,583,266 | |||||||||
| Income tax expense | 21,260 | 667 | 961,995 | |||||||||
| Net realized (gain) loss from investments | (13,398,327 | ) | 8,703,806 | (42,877,155 | ) | |||||||
| Net change in unrealized (appreciation) depreciation on investments | (17,019,993 | ) | (4,966,322 | ) | 770,914 | |||||||
| Net change in provision for deferred taxes on unrealized appreciation (depreciation) on investments | (694,908 | ) | 574,634 | (354,349 | ) | |||||||
| Proceeds from sales and repayments of investments | 226,931,104 | 130,259,061 | 167,252,601 | |||||||||
| Purchases of investments | (458,073,629 | ) | (202,260,764 | ) | (204,643,371 | ) | ||||||
| (Increase) decrease in operating assets: | ||||||||||||
| Interest receivable | (869,931 | ) | 586,826 | (1,063,852 | ) | |||||||
| Due from affiliate | 2,628,032 | (2,719,000 | ) | 1,673,747 | ||||||||
| Management and incentive fee receivable | (327,905 | ) | 237,563 | 269,887 | ||||||||
| Other assets | 692,335 | (265,997 | ) | (128,982 | ) | |||||||
| Increase (decrease) in operating liabilities: | ||||||||||||
| Base management and incentive fees payable | 6,390,351 | (9,243,423 | ) | 9,115,312 | ||||||||
| Accounts payable and accrued expenses | (951,208 | ) | 37,109 | 97,714 | ||||||||
| Current tax payable | 2,820,036 | - | - | |||||||||
| Interest and debt fees payable | 155,837 | 411,742 | (990,629 | ) | ||||||||
| Directors fees payable | (500 | ) | 9,000 | (500 | ) | |||||||
| Excise tax payable | (61,489 | ) | 691,672 | - | ||||||||
| Due to manager | (15,251 | ) | (264,777 | ) | 224,751 | |||||||
| NET CASH PROVIDED BY (USED IN) OPERATING ACTIVITIES | (203,133,627 | ) | (62,346,410 | ) | (15,144,734 | ) | ||||||
| Financing activities | ||||||||||||
| Borrowings on debt | 135,000,000 | 41,000,000 | 20,200,000 | |||||||||
| Paydowns on debt | (95,500,000 | ) | (33,000,000 | ) | (20,200,000 | ) | ||||||
| Issuance of notes | 250,000,000 | 63,125,000 | - | |||||||||
| Repayments of notes | (60,000,000 | ) | - | (74,450,500 | ) | |||||||
| Payments of deferred debt financing costs | (10,008,424 | ) | (3,435,749 | ) | (755,136 | ) | ||||||
| Premium on debt issuance, 4.375% notes 2026 | 1,250,000 | - | - | |||||||||
| Discount on debt issuance, 4.35% notes 2027 | (512,250 | ) | - | - | ||||||||
| Proceeds from issuance of common stock | 26,835,203 | - | 85,897,846 | |||||||||
| Payments of cash dividends | (18,158,029 | ) | (11,265,914 | ) | (17,001,088 | ) | ||||||
| Repurchases of common stock | (2,545,037 | ) | (3,608,459 | ) | ||||||||
| Repurchases fees | (1,992 | ) | (3,746 | ) | ||||||||
| Payments of offering costs | (270,576 | ) | - | (1,190,430 | ) | |||||||
| NET CASH PROVIDED BY (USED IN) FINANCING ACTIVITIES | 226,088,895 | 52,811,132 | (7,499,308 | ) | ||||||||
| NET INCREASE (DECREASE) IN CASH AND CASH EQUIVALENTS AND CASH AND CASH EQUIVALENTS, RESERVE ACCOUNTS | 22,955,268 | (9,535,278 | ) | (22,644,042 | ) | |||||||
| CASH AND CASH EQUIVALENTS AND CASH AND CASH EQUIVALENTS, RESERVE ACCOUNTS, BEGINNING OF PERIOD | 29,915,074 | 39,450,352 | 62,094,394 | |||||||||
| CASH AND CASH EQUIVALENTS AND CASH AND CASH EQUIVALENTS, RESERVE ACCOUNTS, END OF PERIOD | $ | 52,870,342 | $ | 29,915,074 | $ | 39,450,352 | ||||||
| Supplemental information: | ||||||||||||
| Interest paid during the period | $ | 17,560,094 | $ | 11,802,800 | $ | 14,332,943 | ||||||
| Cash paid for taxes | 1,355,083 | 4,140,241 | 18,390 | |||||||||
| Supplemental non-cash information: | ||||||||||||
| Payment-in-kind interest income and other adjustments to cost | (349,292 | ) | (973,606 | ) | 3,045,533 | |||||||
| Net accretion of discount on investments | 2,043,088 | 1,390,128 | 1,069,710 | |||||||||
| Amortization of deferred debt financing costs | 2,164,761 | 1,372,662 | 1,340,299 | |||||||||
| Stock dividend distribution | 3,875,206 | 2,481,084 | 3,096,492 | |||||||||
| For the year ended | ||||||||||||
| February 29, 2024 | February 28, 2023 | February 28, 2022 | ||||||||||
| Operating activities | ||||||||||||
| NET INCREASE (DECREASE) IN NET ASSETS RESULTING FROM OPERATIONS | $ | 8,933,825 | $ | 24,675,763 | $ | 45,735,184 | ||||||
| ADJUSTMENTS TO RECONCILE NET INCREASE (DECREASE) IN NET ASSETS RESULTING | ||||||||||||
| FROM OPERATIONS TO NET CASH PROVIDED BY (USED IN) OPERATING ACTIVITIES: | ||||||||||||
| Payment-in-kind and other adjustments to cost | 4,910,320 | 1,882,734 | 349,292 | |||||||||
| Net accretion of discount on investments | (2,221,257 | ) | (1,816,934 | ) | (2,043,088 | ) | ||||||
| Amortization of deferred debt financing costs | 5,171,249 | 3,587,139 | 2,164,761 | |||||||||
| Realized losses on extinguishment of debt | 110,056 | 1,587,083 | 2,434,410 | |||||||||
| Income tax expense (benefit) | 42,926 | (152,956 | ) | 21,260 | ||||||||
| Net realized (gain) loss from investments | (153,583 | ) | (7,446,596 | ) | (13,398,327 | ) | ||||||
| Net change in unrealized (appreciation) depreciation on investments | 47,090,844 | 15,218,132 | (17,019,993 | ) | ||||||||
| Net change in provision for deferred taxes on unrealized (appreciation) depreciation on investments | 893,166 | 1,715,333 | (694,908 | ) | ||||||||
| Proceeds from sales and repayments of investments | 30,271,047 | 222,215,062 | 226,931,104 | |||||||||
| Purchases of investments | (246,100,906 | ) | (385,075,296 | ) | (458,073,629 | ) | ||||||
| (Increase) decrease in operating assets: | ||||||||||||
| Interest receivable | (2,139,047 | ) | (3,066,390 | ) | (869,931 | ) | ||||||
| Due from affiliate | - | 90,968 | 2,628,032 | |||||||||
| Management fee receivable | 20,786 | (1,260 | ) | (327,905 | ) | |||||||
| Other assets | (631,887 | ) | (276,357 | ) | 692,335 | |||||||
| Current income tax receivable | 336,875 | (436,551 | ) | - | ||||||||
| Increase (decrease) in operating liabilities: | ||||||||||||
| Base management and incentive fees payable | (3,967,661 | ) | (832,147 | ) | 6,390,351 | |||||||
| Accounts payable and accrued expenses | (126,801 | ) | 665,285 | (951,208 | ) | |||||||
| Current tax payable | - | (2,820,036 | ) | 2,820,036 | ||||||||
| Interest and debt fees payable | (70,763 | ) | 851,315 | 155,837 | ||||||||
| Directors fees payable | (14,932 | ) | (55,068 | ) | (500 | ) | ||||||
| Excise tax payable | - | (630,183 | ) | (61,489 | ) | |||||||
| Due to Manager | 439,065 | (252,879 | ) | (15,251 | ) | |||||||
| NET CASH PROVIDED BY (USED IN) OPERATING ACTIVITIES | (157,206,679 | ) | (130,373,839 | ) | (203,133,627 | ) | ||||||
| Financing activities | ||||||||||||
| Borrowings on debt | 71,500,000 | 113,000,000 | 135,000,000 | |||||||||
| Paydowns on debt | (57,000,000 | ) | (76,000,000 | ) | (95,500,000 | ) | ||||||
| Issuance of notes | 77,500,000 | 223,875,000 | 250,000,000 | |||||||||
| Repayments of notes | - | (43,125,000 | ) | (60,000,000 | ) | |||||||
| Payments of deferred debt financing costs | (4,694,711 | ) | (10,135,986 | ) | (10,008,424 | ) | ||||||
| Discount on debt issuance, 6.00% notes 2027 | - | (176,000 | ) | - | ||||||||
| Discount on debt issuance, 7.00% notes 2025 | - | (360,000 | ) | - | ||||||||
| Premium on debt issuance, 4.375% notes 2026 | - | - | 1,250,000 | |||||||||
| Discount on debt issuance, 4.35% notes 2027 | - | - | (512,250 | ) | ||||||||
| Proceeds from issuance of common stock | 44,539,387 | - | 26,835,203 | |||||||||
| Capital contribution from Manager | 4,475,297 | - | - | |||||||||
| Payments of cash dividends | (32,053,610 | ) | (22,665,140 | ) | (18,158,029 | ) | ||||||
| Repurchases of common stock | (2,157,605 | ) | (10,824,340 | ) | (2,545,037 | ) | ||||||
| Repurchases fees | (1,772 | ) | (8,764 | ) | (1,992 | ) | ||||||
| Payments of offering costs | (469,456 | ) | - | (270,576 | ) | |||||||
| NET CASH PROVIDED BY (USED IN) FINANCING ACTIVITIES | 101,637,530 | 173,579,770 | 226,088,895 | |||||||||
| NET INCREASE (DECREASE) IN CASH AND CASH EQUIVALENTS AND CASH AND CASH EQUIVALENTS, RESERVE ACCOUNTS | (55,569,149 | ) | 43,205,931 | 22,955,268 | ||||||||
| CASH AND CASH EQUIVALENTS AND CASH AND CASH EQUIVALENTS, RESERVE ACCOUNTS, BEGINNING OF YEAR | 96,076,273 | 52,870,342 | 29,915,074 | |||||||||
| CASH AND CASH EQUIVALENTS AND CASH AND CASH EQUIVALENTS, RESERVE ACCOUNTS, END OF YEAR (See Note 2) | $ | 40,507,124 | $ | 96,076,273 | $ | 52,870,342 | ||||||
| Supplemental information: | ||||||||||||
| Interest paid during the year | $ | 44,079,413 | $ | 28,904,198 | $ | 17,560,094 | ||||||
| Cash paid for taxes | 748,721 | 2,770,984 | 1,355,083 | |||||||||
| Supplemental non-cash information: | ||||||||||||
| Payment-in-kind interest income and other adjustments to cost | (4,910,319 | ) | (1,882,734 | ) | (349,292 | ) | ||||||
| Net accretion of discount on investments | 2,221,257 | 1,816,934 | 2,043,088 | |||||||||
| Amortization of deferred debt financing costs | 5,171,249 | 3,587,139 | 2,164,761 | |||||||||
| Stock dividend distribution | 3,582,345 | 4,648,262 | 3,875,206 | |||||||||
See accompanying notes to consolidated financial statements.
Saratoga Investment Corp.
Consolidated Schedule of Investments
February 29, 2024
| Company(1) | Industry | Investment Interest Rate/ Maturity | Original Acquisition Date | Principal/ Number of Shares | Cost | Fair Value (c) | % of Net Assets | |||||||||||||||
| Non-control/Non-affiliate investments - 276.5% (b) | ||||||||||||||||||||||
| Altvia MidCo, LLC. | Alternative Investment Management Software | First Lien Term Loan (3M USD TERM SOFR+8.50%), 13.83% Cash, 7/18/2027 | 7/18/2022 | $ | 7,900,000 | $ | 7,840,328 | $ | 7,884,990 | 2.1 | % | |||||||||||
| Altvia MidCo, LLC. (h) | Alternative Investment Management Software | Series A-1 Preferred Shares | 7/18/2022 | 2,000,000 | 2,000,000 | 2,894,346 | 0.8 | % | ||||||||||||||
| Total Alternative Investment Management Software | 9,840,328 | 10,779,336 | 2.9 | % | ||||||||||||||||||
| BQE Software, Inc. | Architecture & Engineering Software | First Lien Term Loan (3M USD TERM SOFR+6.75%), 12.08% Cash, 4/13/2028 | 4/13/2023 | $ | 24,500,000 | 24,285,669 | 24,497,550 | 6.6 | % | |||||||||||||
| BQE Software, Inc. (j) | Architecture & Engineering Software | Delayed Draw Term Loan (3M USD TERM SOFR+6.75%), 12.08% Cash, 4/13/2028 | 4/13/2023 | $ | 750,000 | 743,481 | 749,925 | 0.2 | % | |||||||||||||
| Total Architecture & Engineering Software | 25,029,150 | 25,247,475 | 6.8 | % | ||||||||||||||||||
| GrowthZone, LLC | Association Management Software | First Lien Term Loan (3M USD TERM SOFR+8.25%), 13.58% Cash, 5/10/2028 | 5/10/2023 | $ | 22,649,425 | 22,292,083 | 22,934,808 | 6.2 | % | |||||||||||||
| Golden TopCo LP (h) | Association Management Software | Class A-2 Common Units | 5/10/2023 | 1,072,394 | 1,072,394 | 1,154,132 | 0.3 | % | ||||||||||||||
| Total Association Management Software | 23,364,477 | 24,088,940 | 6.5 | % | ||||||||||||||||||
February 28, 2022
| Company(1) | Industry | Investment Interest Rate/ Maturity | Original Acquisition Date | Principal/ Number of Shares | Cost | Fair Value (c) | % of Net Assets | |||||||||||||||
| Non-control/Non-affiliate investments - 187.4% (b) | ||||||||||||||||||||||
| Targus Holdings, Inc. (h) | Consumer Products | Common Stock | 12/31/2009 | 210,456 | $ | 1,589,630 | $ | 692,535 | 0.2 | % | ||||||||||||
| Total Consumer Products | 1,589,630 | 692,535 | 0.2 | % | ||||||||||||||||||
| Schoox, Inc. (h), (i) | Corporate Education Software | Series 1 Membership Interest | 12/8/2020 | 1,050 | 475,698 | 3,305,839 | 0.9 | % | ||||||||||||||
| Total Corporate Education Software | 475,698 | 3,305,839 | 0.9 | % | ||||||||||||||||||
| GreyHeller LLC (h) | Cyber Security | Common Stock | 11/10/2021 | 6,742,392 | 1,635,704 | 1,635,704 | 0.5 | % | ||||||||||||||
| Total Cyber Security | 1,635,704 | 1,635,704 | 0.5 | % | ||||||||||||||||||
| New England Dental Partners | Dental Practice Management | First Lien Term Loan (3M USD LIBOR+8.00%), 8.50% Cash, 11/25/2025 | 11/25/2020 | $ | 6,555,000 | 6,502,672 | 6,404,891 | 1.8 | % | |||||||||||||
| New England Dental Partners (j) | Dental Practice Management | Delayed Draw Term Loan (3M USD LIBOR+8.00%), 8.50% Cash, 11/25/2025 | 11/25/2020 | $ | 2,150,000 | 2,132,639 | 1,997,715 | 0.6 | % | |||||||||||||
| Total Dental Practice Management | 8,635,311 | 8,402,606 | 2.4 | % | ||||||||||||||||||
| PDDS Buyer, LLC (d) | Dental Practice Management Software | First Lien Term Loan (3M USD LIBOR+5.50%), 6.00% Cash, 7/15/2024 | 7/15/2019 | $ | 28,000,000 | 27,943,852 | 27,938,400 | 7.9 | % | |||||||||||||
| PDDS Buyer, LLC (h) | Dental Practice Management Software | Series A-1 Preferred Shares | 8/10/2020 | 1,755,831 | 2,000,000 | 7,099,940 | 2.0 | % | ||||||||||||||
| Total Dental Practice Management Software | 29,943,852 | 35,038,340 | 9.9 | % | ||||||||||||||||||
| C2 Educational Systems | Education Services | First Lien Term Loan (3M USD LIBOR+8.50%), 10.00% Cash, 5/31/2023 | 5/31/2017 | $ | 18,500,000 | 18,484,747 | 18,220,650 | 5.1 | % | |||||||||||||
| C2 Education Systems, Inc. (h) | Education Services | Series A-1 Preferred Stock | 5/18/2021 | 3,127 | 499,904 | 599,296 | 0.2 | % | ||||||||||||||
| Zollege PBC | Education Services | First Lien Term Loan (3M USD LIBOR+5.50%), 6.50% Cash, 5/11/2026 | 5/11/2021 | $ | 16,000,000 | 15,877,908 | 15,794,300 | 4.4 | % | |||||||||||||
| Zollege PBC (j) | Education Services | Delayed Draw Term Loan (3M USD LIBOR+5.50%), 6.50% Cash, 5/11/2026 | 5/11/2021 | $ | 500,000 | 495,811 | 493,950 | 0.1 | % | |||||||||||||
| Zollege PBC (h) | Education Services | Class A Units | 5/11/2021 | 250,000 | 250,000 | 201,218 | 0.1 | % | ||||||||||||||
| Total Education Services | 35,608,370 | 35,309,414 | 9.9 | % | ||||||||||||||||||
| Destiny Solutions Inc. (h), (i) | Education Software | Limited Partner Interests | 5/16/2018 | 3,065 | 3,969,291 | 7,632,061 | 2.1 | % | ||||||||||||||
| Identity Automation Systems (d) | Education Software | First Lien Term Loan (3M USD LIBOR+9.24%), 10.99% Cash, 5/8/2024 | 8/25/2014 | $ | 16,941,250 | 16,941,250 | 16,941,250 | 4.8 | % | |||||||||||||
| Identity Automation Systems (h) | Education Software | Common Stock Class A-2 Units | 8/25/2014 | 232,616 | 232,616 | 801,923 | 0.2 | % | ||||||||||||||
| Identity Automation Systems (h) | Education Software | Common Stock Class A-1 Units | 3/6/2020 | 43,715 | 171,571 | 200,820 | 0.1 | % | ||||||||||||||
Saratoga Investment Corp.
Consolidated Schedule of Investments
February 29, 2024
| Company(1) | Industry | Investment Interest Rate/ Maturity | Original Acquisition Date | Principal/ Number of Shares | Cost | Fair Value (c) | % of Net Assets | |||||||||||||||
| Artemis Wax Corp. (d)(j) | Consumer Services | Delayed Draw Term Loan (1M USD TERM SOFR+6.75%), 12.07% Cash, 5/20/2026 | 5/20/2021 | $ | 57,500,000 | 57,208,255 | 58,149,750 | 15.7 | % | |||||||||||||
| Artemis Wax Corp. (h) | Consumer Services | Series B-1 Preferred Stock | 5/20/2021 | 934,463 | 1,500,000 | 4,822,941 | 1.3 | % | ||||||||||||||
| Artemis Wax Corp. (h) | Consumer Services | Series D Preferred Stock | 12/22/2022 | 290,595 | 1,500,000 | 1,716,380 | 0.5 | % | ||||||||||||||
| Total Consumer Services | 60,208,255 | 64,689,071 | 17.5 | % | ||||||||||||||||||
| Schoox, Inc. (h), (i) | Corporate Education Software | Series 1 Membership Interest | 12/8/2020 | 1,050 | 475,698 | 4,426,630 | 1.2 | % | ||||||||||||||
| Total Corporate Education Software | 475,698 | 4,426,630 | 1.2 | % | ||||||||||||||||||
| GreyHeller LLC (h) | Cyber Security | Common Stock | 11/10/2021 | 7,857,689 | 1,906,275 | 2,826,009 | 0.8 | % | ||||||||||||||
| Total Cyber Security | 1,906,275 | 2,826,009 | 0.8 | % | ||||||||||||||||||
| Gen4 Dental Partners Holdings, LLC | Dental Practice Management | Delayed Draw Term Loan (3M USD TERM SOFR+10.22%), 15.55% Cash, 4/29/2026 | 2/8/2023 | $ | 11,000,000 | 10,979,958 | 11,110,000 | 3.0 | % | |||||||||||||
| Gen4 Dental Partners Holdings, LLC (h)(i) | Dental Practice Management | Series A Preferred Units | 2/8/2023 | 493,999 | 1,027,519 | 1,111,499 | 0.3 | % | ||||||||||||||
| Modis Dental Partners OpCo, LLC | Dental Practice Management | First Lien Term Loan (1M USD TERM SOFR+9.48%), 14.80% Cash, 4/18/2028 | 4/18/2023 | $ | 7,000,000 | 6,906,453 | 7,113,400 | 1.9 | % | |||||||||||||
| Modis Dental Partners OpCo, LLC | Dental Practice Management | Delayed Draw Term Loan (1M USD TERM SOFR+9.48%), 14.80% Cash, 4/18/2028 | 4/18/2023 | $ | 7,500,000 | 7,392,367 | 7,621,500 | 2.1 | % | |||||||||||||
| Modis Dental Partners OpCo, LLC (h) | Dental Practice Management | Class A Preferred Units | 4/18/2023 | 2,950,000 | 2,950,000 | 2,682,996 | 0.7 | % | ||||||||||||||
| New England Dental Partners | Dental Practice Management | First Lien Term Loan (3M USD TERM SOFR+8.00%), 13.48% Cash, 11/25/2025 | 11/25/2020 | $ | 6,555,000 | 6,526,643 | 6,198,408 | 1.7 | % | |||||||||||||
| New England Dental Partners | Dental Practice Management | Delayed Draw Term Loan (3M USD TERM SOFR+8.00%), 13.48% Cash, 11/25/2025 | 11/25/2020 | $ | 4,650,000 | 4,635,903 | 4,397,040 | 1.2 | % | |||||||||||||
| Total Dental Practice Management | 40,418,843 | 40,234,843 | 10.9 | % | ||||||||||||||||||
February 28, 2022
Company(1) Industry Investment Interest Rate/
Maturity Original Acquisition Date Principal/
Number of Shares Cost Fair Value (c) % of
Net Assets GoReact Education Software First Lien Term Loan
(3M USD LIBOR+7.50%), 9.50% Cash, 1/17/2025 1/17/2020 $ 8,000,000 7,920,033 8,080,000 2.3 % GoReact (j) Education Software Delayed Draw Term Loan
(3M USD LIBOR+7.50%), 9.50% Cash, 1/17/2025 1/18/2022 $ - - - 0.0 % Total Education Software 29,234,761 33,656,054 9.5 % TG Pressure Washing Holdings, LLC (h) Facilities Maintenance Preferred Equity 8/12/2019 488,148 488,148 482,036 0.1 % Total Facilities Maintenance 488,148 482,036 0.1 % Davisware, LLC Field Service Management First Lien Term Loan
(3M USD LIBOR+7.00%), 9.00% Cash, 7/31/2024 9/6/2019 $ 6,000,000 5,954,705 6,003,000 1.7 % Davisware, LLC (j) Field Service Management Delayed Draw Term Loan
(3M USD LIBOR+7.00%), 9.00% Cash, 7/31/2024 9/6/2019 $ 977,790 975,504 978,279 0.3 % Total Field Service Management 6,930,209 6,981,279 2.0 % GDS Software Holdings, LLC Financial Services First Lien Term Loan
(3M USD LIBOR+7.00%), 8.00% Cash, 12/30/2026 12/30/2021 $ 22,713,926 22,579,864 22,570,829 6.3 % GDS Software Holdings, LLC (j) Financial Services Delayed Draw Term loan
(3M USD LIBOR+7.00%), 8.00% Cash, 12/30/2026 12/18/2021 $ 500,000 495,031 496,850 0.1 % GDS Software Holdings, LLC (h) Financial Services Common Stock Class A Units 8/23/2018 250,000 250,000 472,009 0.1 % Total Financial Services 23,324,895 23,539,688 6.5 % Ascend Software, LLC Financial Services Software First Lien Term Loan
(3M USD LIBOR+7.50%), 8.50% Cash, 12/15/2026 12/15/2021 $ 6,000,000 5,942,482 5,940,000 1.7 % Ascend Software, LLC (j) Financial Services Software Delayed Draw Term Loan
(3M USD LIBOR+7.50%), 8.50% Cash, 12/15/2026 12/15/2021 $ - - - 0.0 % Total Financial Services Software 5,942,482 5,940,000 1.7 % Ohio Medical, LLC (h) Healthcare Products Manufacturing Common Stock 1/15/2016 5,000 380,353 714,271 0.2 % Total Healthcare Products Manufacturing 380,353 714,271 0.2 % Axiom Parent Holdings, LLC (h) Healthcare Services Common Stock Class A Units 6/19/2018 400,000 400,000 1,032,934 0.3 % Axiom Purchaser, Inc. (d) Healthcare Services First Lien Term Loan
(3M USD LIBOR+6.00%), 7.75% Cash, 6/19/2023 6/19/2018 $ 10,000,000 9,974,217 10,013,000 2.8 % Axiom Purchaser, Inc. (d) Healthcare Services Delayed Draw Term Loan
(3M USD LIBOR+6.00%), 7.75% Cash, 6/19/2023 6/19/2018 $ 6,000,000 5,977,846 6,007,800 1.7 %
Saratoga Investment Corp.
Consolidated Schedule of Investments
February 28, 202229, 2024
| Company(1) | Industry | Investment Interest Rate/ Maturity | Original Acquisition Date | Principal/ Number of Shares | Cost | Fair Value (c) | % of Net Assets | |||||||||||||||
| ComForCare Health Care (d) | Healthcare Services | First Lien Term Loan (3M USD LIBOR+7.25%), 8.25% Cash, 1/31/2025 | 1/31/2017 | $ | 25,000,000 | 24,903,581 | 25,000,000 | 7.0 | % | |||||||||||||
| Total Healthcare Services | 41,255,644 | 42,053,734 | 11.8 | % | ||||||||||||||||||
| TRC HemaTerra, LLC (h) | Healthcare Software | Class D Membership Interests | 4/15/2019 | 2,487 | 2,816,693 | 3,788,769 | 1.1 | % | ||||||||||||||
| HemaTerra Holding Company, LLC (d) | Healthcare Software | First Lien Term Loan (3M USD LIBOR+8.25%), 9.25% Cash, 1/31/2026 | 4/15/2019 | $ | 36,000,000 | 35,715,061 | 35,640,000 | 10.0 | % | |||||||||||||
| HemaTerra Holding Company, LLC (d) | Healthcare Software | Delayed Draw Term Loan (3M USD LIBOR+8.25%), 9.25% Cash, 1/31/2026 | 4/15/2019 | $ | 14,000,000 | 13,912,744 | 13,860,000 | 3.9 | % | |||||||||||||
| Procurement Partners, LLC | Healthcare Software | First Lien Term Loan (3M USD LIBOR+5.50%), 6.50% Cash, 11/12/2025 | 11/12/2020 | $ | 35,125,000 | 34,827,633 | 34,998,550 | 9.8 | % | |||||||||||||
| Procurement Partners, LLC (j) | Healthcare Software | Delayed Draw Term Loan (3M USD LIBOR+5.50%), 6.50% Cash, 11/12/2025 | 11/12/2020 | $ | 1,200,000 | 1,188,047 | 1,195,680 | 0.3 | % | |||||||||||||
| Procurement Partners Holdings LLC (h) | Healthcare Software | Class A Units | 11/12/2020 | 550,986 | 550,986 | 643,044 | 0.2 | % | ||||||||||||||
| Total Healthcare Software | 89,011,164 | 90,126,043 | 25.3 | % | ||||||||||||||||||
| Roscoe Medical, Inc. (h) | Healthcare Supply | Common Stock | 3/26/2014 | 5,081 | 508,077 | 52,853 | 0.0 | % | ||||||||||||||
| Roscoe Medical, Inc. | Healthcare Supply | Second Lien Term Loan 11.25% Cash, 3/31/2022 | 3/26/2014 | $ | 5,141,413 | 5,141,413 | 5,141,413 | 1.4 | % | |||||||||||||
| Total Healthcare Supply | 5,649,490 | 5,194,266 | 1.4 | % | ||||||||||||||||||
| Company(1) | Industry | Investment Interest Rate/ Maturity | Original Acquisition Date | Principal/ Number of Shares | Cost | Fair Value (c) | % of Net Assets | |||||||||||||||
| Exigo, LLC (d) | Direct Selling Software | First Lien Term Loan (1M USD TERM SOFR+5.75%), 11.17% Cash, 3/16/2027 | 3/16/2022 | $ | 24,313,135 | 24,167,354 | 23,165,555 | 6.3 | % | |||||||||||||
| Exigo, LLC (j) | Direct Selling Software | Revolving Credit Facility (1M USD TERM SOFR+5.75%), 11.17% Cash, 3/16/2027 | 3/16/2022 | $ | - | - | (49,167 | ) | 0.0 | % | ||||||||||||
| Exigo, LLC (h), (i) | Direct Selling Software | Common Units | 3/16/2022 | 1,041,667 | 1,041,667 | 957,067 | 0.3 | % | ||||||||||||||
| Total Direct Selling Software | 25,209,021 | 24,073,455 | 6.6 | % | ||||||||||||||||||
| C2 Educational Systems, Inc. (d) | Education Services | First Lien Term Loan (3M USD TERM SOFR+8.50%), 13.83% Cash, 5/31/2025 | 5/31/2017 | $ | 21,500,000 | 21,478,821 | 21,459,150 | 5.8 | % | |||||||||||||
| C2 Educational Systems, Inc. (j) | Education Services | Delayed Draw Term Loan (3M USD TERM SOFR+8.50%), 13.83% Cash, 5/31/2025 | 4/28/2023 | $ | - | - | - | 0.0 | % | |||||||||||||
| C2 Education Systems, Inc. (h) | Education Services | Series A-1 Preferred Stock | 5/18/2021 | 3,127 | 499,904 | 576,118 | 0.2 | % | ||||||||||||||
| Zollege PBC (k) | Education Services | First Lien Term Loan (3M USD TERM SOFR+7.00%), 12.33% Cash/2.00% PIK, 5/11/2026 | 5/11/2021 | $ | 16,409,153 | 16,340,466 | 3,493,509 | 0.9 | % | |||||||||||||
| Zollege PBC (j)(k) | Education Services | Delayed Draw Term Loan (3M USD TERM SOFR+7.00%), 12.33% Cash/2.00% PIK, 5/11/2026 | 5/11/2021 | $ | 1,364,109 | 1,358,200 | 290,419 | 0.1 | % | |||||||||||||
| Zollege PBC (h) | Education Services | Class A Units | 5/11/2021 | 250,000 | 250,000 | - | 0.0 | % | ||||||||||||||
| Total Education Services | 39,927,391 | 25,819,196 | 7.0 | % | ||||||||||||||||||
| Destiny Solutions Inc. (h)(i) | Education Software | Limited Partner Interests | 5/16/2018 | 3,068 | 3,969,291 | 9,894,736 | 2.7 | % | ||||||||||||||
| GoReact | Education Software | First Lien Term Loan (3M USD TERM SOFR+7.50%), 13.03% Cash/1.00% PIK, 1/17/2025 | 1/17/2020 | $ | 8,087,775 | 8,060,498 | 8,087,775 | 2.2 | % | |||||||||||||
| GoReact (j) | Education Software | Delayed Draw Term Loan (3M USD TERM SOFR+7.50%), 13.03% Cash/1.00% PIK, 1/17/2025 | 1/18/2022 | $ | - | - | - | 0.0 | % | |||||||||||||
| Identity Automation Systems (h) | Education Software | Common Stock Class A-2 Units | 8/25/2014 | 232,616 | 232,616 | 569,355 | 0.2 | % | ||||||||||||||
| Identity Automation Systems (h) | Education Software | Common Stock Class A-1 Units | 3/6/2020 | 43,715 | 171,571 | 235,296 | 0.1 | % | ||||||||||||||
| Ready Education | Education Software | First Lien Term Loan (3M USD TERM SOFR+7.00%), 12.33% Cash, 8/5/2027 | 8/5/2022 | $ | 27,000,000 | 26,797,063 | 26,792,100 | 7.2 | % | |||||||||||||
| Total Education Software | 39,231,039 | 45,579,262 | 12.4 | % | ||||||||||||||||||
| TG Pressure Washing Holdings, LLC (h) | Facilities Maintenance | Preferred Equity | 8/12/2019 | 488,148 | 488,148 | 231,181 | 0.1 | % | ||||||||||||||
| Total Facilities Maintenance | 488,148 | 231,181 | 0.1 | % | ||||||||||||||||||
Saratoga Investment Corp.
Consolidated Schedule of Investments
February 28, 202229, 2024
| Company(1) | Industry | Investment Interest Rate/ Maturity | Original Acquisition Date | Principal/ Number of Shares | Cost | Fair Value (c) | % of Net Assets | |||||||||||||||
| Book4Time, Inc. (a), (d) | Hospitality/Hotel | First Lien Term Loan (3M USD LIBOR+8.50%), 10.25%, 12/22/2025 | 12/22/2020 | $ | 3,136,517 | 3,111,278 | 3,112,052 | 0.9 | % | |||||||||||||
| Book4Time, Inc. (a), (j) | Hospitality/Hotel | Delayed Draw Term Loan (3M USD LIBOR+8.50%), 10.25%, 12/22/2025 | 12/22/2020 | $ | - | - | - | 0.0 | % | |||||||||||||
| Book4Time, Inc. (a), (h), (i) | Hospitality/Hotel | Class A Preferred Shares | 12/22/2020 | $ | 200,000 | 156,826 | 198,638 | 0.1 | % | |||||||||||||
| Knowland Group, LLC | Hospitality/Hotel | Second Lien Term Loan (3M USD LIBOR+8.00%), 10.00% Cash/1.00% PIK, 5/9/2024 | 11/9/2018 | $ | 15,878,989 | 15,878,989 | 10,592,873 | 3.0 | % | |||||||||||||
| Sceptre Hospitality Resources, LLC | Hospitality/Hotel | First Lien Term Loan (1M USD LIBOR+8.00%), 9.00% Cash, 9/2/2026 | 4/27/2020 | $ | 6,000,000 | 5,952,460 | 6,021,000 | 1.7 | % | |||||||||||||
| Sceptre Hospitality Resources, LLC (j) | Hospitality/Hotel | Delayed Draw Term Loan (1M USD LIBOR+8.00%), 9.00% Cash, 9/2/2026 | 9/2/2021 | $ | - | - | - | 0.0 | % | |||||||||||||
| Total Hospitality/Hotel | 25,099,553 | 19,924,563 | 5.7 | % | ||||||||||||||||||
| Granite Comfort, LP | HVAC Services and Sales | First Lien Term Loan (1M USD LIBOR+8.00%), 9.00% Cash, 11/16/2025 | 11/16/2020 | $ | 28,000,000 | 27,764,146 | 27,977,600 | 7.9 | % | |||||||||||||
| Granite Comfort, LP(j) | HVAC Services and Sales | Delayed Draw Term Loan (1M USD LIBOR+8.00%), 9.00% Cash, 11/16/2025 | 11/16/2020 | $ | 2,000,000 | 1,980,805 | 1,998,400 | 0.6 | % | |||||||||||||
| Total HVAC Services and Sales | 29,744,951 | 29,976,000 | 8.5 | % | ||||||||||||||||||
| AgencyBloc, LLC | Insurance Software | First Lien Term Loan (3M USD BSBY+8.00%), 9.00% Cash, 10/1/2026 | 10/1/2021 | $ | 9,000,000 | 8,925,938 | 8,920,800 | 2.5 | % | |||||||||||||
| Panther ParentCo LLC (h) | Insurance Software | Class A Units | 10/1/2021 | 2,000,000 | 2,000,000 | 2,000,000 | 0.6 | % | ||||||||||||||
| Total Insurance Software | 10,925,938 | 10,920,800 | 3.1 | % | ||||||||||||||||||
| Company(1) | Industry | Investment Interest Rate/ Maturity | Original Acquisition Date | Principal/ Number of Shares | Cost | Fair Value (c) | % of Net Assets | |||||||||||||||
| Davisware, LLC | Field Service Management | First Lien Term Loan (3M USD TERM SOFR+7.00%), 12.33% Cash, 7/31/2024 | 9/6/2019 | $ | 6,000,000 | 5,991,382 | 5,989,200 | 1.6 | % | |||||||||||||
| Davisware, LLC (j) | Field Service Management | Delayed Draw Term Loan (3M USD TERM SOFR+7.00%), 12.33% Cash, 7/31/2024 | 9/6/2019 | $ | 4,727,790 | 4,714,256 | 4,719,280 | 1.3 | % | |||||||||||||
| Total Field Service Management | 10,705,638 | 10,708,480 | 2.9 | % | ||||||||||||||||||
| GDS Software Holdings, LLC | Financial Services | First Lien Term Loan (3M USD TERM SOFR+7.00%), 12.33% Cash, 12/30/2026 | 12/30/2021 | $ | 22,713,926 | 22,624,322 | 22,545,843 | 6.1 | % | |||||||||||||
| GDS Software Holdings, LLC | Financial Services | Delayed Draw Term Loan (3M USD TERM SOFR+7.00%), 12.33% Cash, 12/30/2026 | 12/30/2021 | $ | 3,286,074 | 3,262,111 | 3,261,757 | 0.9 | % | |||||||||||||
| GDS Software Holdings, LLC (h) | Financial Services | Common Stock Class A Units | 8/23/2018 | 250,000 | 250,000 | 468,204 | 0.1 | % | ||||||||||||||
| Total Financial Services | 26,136,433 | 26,275,804 | 7.1 | % | ||||||||||||||||||
| Ascend Software, LLC | Financial Services Software | First Lien Term Loan (3M USD TERM SOFR+7.50%), 13.10% Cash, 12/15/2026 | 12/15/2021 | $ | 6,000,000 | 5,961,680 | 5,920,200 | 1.6 | % | |||||||||||||
| Ascend Software, LLC (j) | Financial Services Software | Delayed Draw Term Loan (3M USD TERM SOFR+7.50%), 13.10% Cash, 12/15/2026 | 12/15/2021 | $ | 4,050,000 | 4,029,154 | 3,996,135 | 1.1 | % | |||||||||||||
| Total Financial Services Software | 9,990,834 | 9,916,335 | 2.7 | % | ||||||||||||||||||
| Inspect Point Holdings, LLC | Fire Inspection Business Software | First Lien Term Loan (1M USD TERM SOFR+6.50%), 11.82% Cash, 07/19/2028 | 7/19/2023 | $ | 10,000,000 | 9,908,861 | 9,916,000 | 2.7 | % | |||||||||||||
| Inspect Point Holdings, LLC (j) | Fire Inspection Business Software | Delayed Draw Term Loan (1M USD TERM SOFR+6.50%), 11.82% Cash, 07/19/2028 | 7/19/2023 | $ | - | - | - | 0.0 | % | |||||||||||||
| Total Fire Inspection Business Software | 9,908,861 | 9,916,000 | 2.7 | % | ||||||||||||||||||
Saratoga Investment Corp.
Consolidated Schedule of Investments
February 28, 202229, 2024
| Company(1) | Industry | Investment Interest Rate/ Maturity | Original Acquisition Date | Principal/ Number of Shares | Cost | Fair Value (c) | % of Net Assets | |||||||||||||||
| Vector Controls Holding Co., LLC (d) | Industrial Products | First Lien Term Loan (3M USD LIBOR+6.50%), 8.00% Cash, 3/6/2025 | 3/6/2013 | $ | 5,008,186 | 5,008,186 | 5,008,186 | 1.4 | % | |||||||||||||
| Vector Controls Holding Co., LLC (h) | Industrial Products | Warrants to Purchase Limited Liability Company Interests, Expires 11/30/2027 | 5/31/2015 | 343 | - | 3,418,993 | 1.0 | % | ||||||||||||||
| Total Industrial Products | 5,008,186 | 8,427,179 | 2.4 | % | ||||||||||||||||||
| LogicMonitor, Inc. (d) | IT Services | First Lien Term Loan (3M USD LIBOR+5.00), 6.00% Cash, 5/17/2023 | 3/20/2020 | $ | 43,000,000 | 42,806,801 | 43,000,000 | 12.1 | % | |||||||||||||
| Total IT Services | 42,806,801 | 43,000,000 | 12.1 | % | ||||||||||||||||||
| Centerbase, LLC | Legal Software | First Lien Term Loan (Daialy USD SOFR+7.50%), 8.50% Cash, 1/18/2027 | 1/18/2022 | $ | 7,500,000 | 7,409,860 | 7,425,000 | 2.1 | % | |||||||||||||
| Total Legal Software | 7,409,860 | 7,425,000 | 2.1 | % | ||||||||||||||||||
| Madison Logic, Inc. | Marketing Orchestration Software | First Lien Term Loan (1M USD LIBOR+5.75%), 6.75% Cash, 11/22/2026 | 12/10/2021 | $ | 28,915,663 | 28,782,977 | 28,776,867 | 8.1 | % | |||||||||||||
| Madison Logic, Inc. (j) | Marketing Orchestration Software | Revolving Credit Facility (1M USD LIBOR+5.75%), 6.75% Cash, 11/22/2026 | 12/10/2021 | $ | - | - | - | 0.0 | % | |||||||||||||
| Total Marketing Orchestration Software | 28,782,977 | 28,776,867 | 8.1 | % | ||||||||||||||||||
| inMotionNow, Inc. | Marketing Services | First Lien Term Loan (3M USD LIBOR+7.50), 10.00% Cash, 5/15/2024 | 5/15/2019 | $ | 12,200,000 | 12,139,533 | 12,290,280 | 3.5 | % | |||||||||||||
| inMotionNow, Inc. (d) | Marketing Services | Delayed Draw Term Loan (3M USD LIBOR+7.50) 10.00% Cash, 5/15/2024 | 5/15/2019 | $ | 5,000,000 | 4,972,992 | 5,037,000 | 1.4 | % | |||||||||||||
| Total Marketing Services | 17,112,525 | 17,327,280 | 4.9 | % | ||||||||||||||||||
| Chronus LLC | Mentoring Software | First Lien Term Loan (3M USD LIBOR+5.25), 6.25% Cash, 8/26/2026 | 8/26/2021 | $ | 15,000,000 | 14,861,338 | 14,938,500 | 4.2 | % | |||||||||||||
| Chronus LLC (h) | Mentoring Software | Series A Preferred Stock | 8/26/2021 | 3,000 | 3,000,000 | 3,382,625 | 1.0 | % | ||||||||||||||
| Total Mentoring Software | 17,861,338 | 18,321,125 | 5.2 | % | ||||||||||||||||||
| Omatic Software, LLC | Non-profit Services | First Lien Term Loan (3M USD LIBOR+8.00%), 9.75% Cash/1.00% PIK, 5/29/2023 | 5/29/2018 | $ | 10,010,685 | 9,955,082 | 10,038,714 | 2.8 | % | |||||||||||||
| Company(1) | Industry | Investment Interest Rate/ Maturity | Original Acquisition Date | Principal/ Number of Shares | Cost | Fair Value (c) | % of Net Assets | |||||||||||||||
| Stretch Zone Franchising, LLC | Health/Fitness Franchisor | First Lien Term Loan (3M USD TERM SOFR+7.00%), 12.33% Cash, 3/31/2028 | 3/31/2023 | $ | 30,000,000 | 29,740,931 | 29,970,000 | 8.1 | % | |||||||||||||
| Stretch Zone Franchising, LLC (j) | Health/Fitness Franchisor | Delayed Draw Term Loan (3M USD TERM SOFR+7.00%), 12.33% Cash, 3/31/2028 | 3/31/2023 | $ | - | - | - | 0.0 | % | |||||||||||||
| Stretch Zone Franchising, LLC (h) | Health/Fitness Franchisor | Class A Units | 3/31/2023 | 20,000 | 2,000,000 | 2,062,331 | 0.6 | % | ||||||||||||||
| Total Health/Fitness Franchisor | 31,740,931 | 32,032,331 | 8.7 | % | ||||||||||||||||||
| Alpha Aesthetics Partners OpCo, LLC | Healthcare Services | First Lien Term Loan (1M USD TERM SOFR+9.98%), 15.30% Cash, 3/20/2028 | 3/20/2023 | $ | 3,900,000 | 3,847,845 | 3,959,670 | 1.2 | % | |||||||||||||
| Alpha Aesthetics Partners OpCo, LLC (j) | Healthcare Services | Delayed Draw Term Loan (1M USD TERM SOFR+9.98%), 15.30% Cash, 3/20/2028 | 3/20/2023 | $ | 8,600,000 | 8,482,841 | 8,731,580 | 2.4 | % | |||||||||||||
| Alpha Aesthetics Partners OpCo, LLC (h) | Healthcare Services | Class A Preferred Units | 3/20/2023 | 2,850,000 | 2,850,000 | 2,859,121 | 0.8 | % | ||||||||||||||
| Axiom Medical Consulting, LLC | Healthcare Services | First Lien Term Loan (3M USD TERM SOFR+6.00%), 11.33% Cash, 9/11/2028 | 9/11/2023 | $ | 10,000,000 | 9,917,367 | 9,913,000 | 2.7 | % | |||||||||||||
| Axiom Medical Consulting, LLC (j) | Healthcare Services | Delayed Draw Term Loan (3M USD TERM SOFR+6.00%), 11.33% Cash, 9/11/2028 | 9/11/2023 | $ | - | - | - | 0.0 | % | |||||||||||||
| Axiom Parent Holdings, LLC (h) | Healthcare Services | Class A Preferred Units | 6/19/2018 | 400,000 | 258,389 | 630,740 | 0.2 | % | ||||||||||||||
| ComForCare Health Care (d) | Healthcare Services | First Lien Term Loan (3M USD TERM SOFR+6.25%), 11.58% Cash, 1/31/2025 | 1/31/2017 | $ | 25,000,000 | 24,973,000 | 25,000,000 | 6.8 | % | |||||||||||||
| Total Healthcare Services | 50,329,442 | 51,094,111 | 14.1 | % | ||||||||||||||||||
| HemaTerra Holding Company, LLC (d) | Healthcare Software | First Lien Term Loan (1M USD TERM SOFR+8.25%), 13.57% Cash, 1/31/2027 | 4/15/2019 | $ | 54,927,713 | 54,624,303 | 55,087,003 | 14.9 | % | |||||||||||||
| HemaTerra Holding Company, LLC | Healthcare Software | Delayed Draw Term Loan (1M USD TERM SOFR+8.25%), 13.57% Cash, 1/31/2027 | 4/15/2019 | $ | 13,755,875 | 13,710,513 | 13,795,767 | 3.7 | % | |||||||||||||
| TRC HemaTerra, LLC (h) | Healthcare Software | Class D Membership Interests | 4/15/2019 | 2,487 | 2,816,693 | 5,362,439 | 1.4 | % | ||||||||||||||
| Procurement Partners, LLC | Healthcare Software | First Lien Term Loan (3M USD TERM SOFR+6.50%), 11.83% Cash, 5/12/2026 | 11/12/2020 | $ | 35,125,000 | 34,965,458 | 35,125,000 | 9.5 | % | |||||||||||||
| Procurement Partners, LLC (j) | Healthcare Software | Delayed Draw Term Loan (3M USD TERM SOFR+6.50%), 11.83% Cash, 5/12/2026 | 11/12/2020 | $ | 10,300,000 | 10,230,001 | 10,300,000 | 2.8 | % | |||||||||||||
| Procurement Partners Holdings LLC (h) | Healthcare Software | Class A Units | 11/12/2020 | 571,219 | 571,219 | 826,280 | 0.2 | % | ||||||||||||||
| Total Healthcare Software | 116,918,187 | 120,496,489 | 32.5 | % | ||||||||||||||||||
| Roscoe Medical, Inc. (h) | Healthcare Supply | Common Stock | 3/26/2014 | 5,081 | 508,077 | - | 0.0 | % | ||||||||||||||
| Total Healthcare Supply | 508,077 | - | 0.0 | % | ||||||||||||||||||
Saratoga Investment Corp.
Consolidated Schedule of Investments
February 28, 202229, 2024
| Company(1) | Industry | Investment Interest Rate/ Maturity | Original Acquisition Date | Principal/ Number of Shares | Cost | Fair Value (c) | % of Net Assets | |||||||||||||||
| Total Non-profit Services | 9,955,082 | 10,038,714 | 2.8 | % | ||||||||||||||||||
| Emily Street Enterprises, L.L.C. | Office Supplies | Senior Secured Note (3M USD LIBOR+8.50%), 10.00% Cash, 12/31/2023 | 12/28/2012 | $ | 3,300,000 | 3,300,000 | 3,278,880 | 0.9 | % | |||||||||||||
| Emily Street Enterprises, L.L.C. (h) | Office Supplies | Warrant Membership Interests Expires 12/28/2022 | 12/28/2012 | 49,318 | 400,000 | 446,927 | 0.1 | % | ||||||||||||||
| Total Office Supplies | 3,700,000 | 3,725,807 | 1.0 | % | ||||||||||||||||||
| Apex Holdings Software Technologies, LLC | Payroll Services | First Lien Term Loan (3M USD LIBOR+8.00%), 9.00% Cash, 9/21/2024 | 9/21/2016 | $ | 17,000,000 | 16,990,006 | 17,000,000 | 4.7 | % | |||||||||||||
| Total Payroll Services | 16,990,006 | 17,000,000 | 4.7 | % | ||||||||||||||||||
| Buildout, Inc. | Real Estate Services | First Lien Term Loan (3M USD LIBOR+7.00%), 8.00% Cash, 7/9/2025 | 7/9/2020 | $ | 14,000,000 | 13,897,546 | 13,904,800 | 3.9 | % | |||||||||||||
| Buildout, Inc. | Real Estate Services | Delayed Draw Term Loan (3M USD LIBOR+7.00%), 8.00% Cash, 7/9/2025 | 2/12/2021 | $ | 38,500,000 | 38,173,998 | 38,238,200 | 10.6 | % | |||||||||||||
| Buildout, Inc. (h), (i) | Real Estate Services | Limited Partner Interests | 7/9/2020 | 1,205 | 1,205,308 | 1,363,014 | 0.4 | % | ||||||||||||||
| Total Real Estate Services | 53,276,852 | 53,506,014 | 14.9 | % | ||||||||||||||||||
| LFR Chicken LLC | Restaurant | First Lien Term Loan (1M USD LIBOR+7.00%), 8.00% Cash, 11/19/2026 | 11/19/2021 | $ | 12,000,000 | 11,886,588 | 11,880,000 | 3.3 | % | |||||||||||||
| LFR Chicken LLC (j) | Restaurant | Delayed Draw Term Loan (1M USD LIBOR+7.00%), 8.00% Cash, 11/19/2026 | 11/19/2021 | $ | - | - | - | 0.0 | % | |||||||||||||
| LFR Chicken LLC (h) | Restaurant | Series B Preferred Units | 11/19/2021 | 497,183 | 1,000,000 | 999,984 | 0.3 | % | ||||||||||||||
| TMAC Acquisition Co., LLC | Restaurant | Unsecured Term Loan 8.00% PIK, 9/01/2023 | 3/1/2018 | $ | 2,979,312 | 2,979,312 | 2,805,541 | 0.8 | % | |||||||||||||
| Total Restaurant | 15,865,900 | 15,685,525 | 4.4 | % | ||||||||||||||||||
| Company(1) | Industry | Investment Interest Rate/ Maturity | Original Acquisition Date | Principal/ Number of Shares | Cost | Fair Value (c) | % of Net Assets | |||||||||||||||
| Book4Time, Inc. (a)(d) | Hospitality/Hotel | First Lien Term Loan (3M USD TERM SOFR+7.50%), 12.83%, 12/22/2025 | 12/22/2020 | $ | 3,136,517 | 3,122,542 | 3,136,517 | 0.8 | % | |||||||||||||
| Book4Time, Inc. (a) | Hospitality/Hotel | Delayed Draw Term Loan (3M USD TERM SOFR+7.50%), 12.83%, 12/22/2025 | 12/22/2020 | $ | 2,000,000 | 1,989,839 | 2,000,000 | 0.5 | % | |||||||||||||
| Book4Time, Inc. (a)(h)(i) | Hospitality/Hotel | Class A Preferred Shares | 12/22/2020 | 200,000 | 156,826 | 389,531 | 0.1 | % | ||||||||||||||
| Knowland Group, LLC (k) | Hospitality/Hotel | Second Lien Term Loan (3M USD TERM SOFR+8.00%), 13.48% Cash/3.00% PIK, 12/31/2024 | 11/9/2018 | $ | 15,878,989 | 15,878,989 | 12,642,851 | 3.4 | % | |||||||||||||
| Sceptre Hospitality Resources, LLC | Hospitality/Hotel | First Lien Term Loan (3M USD TERM SOFR+7.25%), 12.58% Cash, 11/15/2027 | 4/27/2020 | $ | 23,000,000 | 22,835,500 | 23,278,300 | 6.3 | % | |||||||||||||
| Sceptre Hospitality Resources, LLC (j) | Hospitality/Hotel | Delayed Draw Term Loan (3M USD TERM SOFR+7.25%), 12.58% Cash, 11/15/2027 | 9/2/2021 | $ | - | - | - | 0.0 | % | |||||||||||||
| Total Hospitality/Hotel | 43,983,696 | 41,447,199 | 11.1 | % | ||||||||||||||||||
| Granite Comfort, LP (d) | HVAC Services and Sales | First Lien Term Loan (3M USD TERM SOFR+7.46%), 12.79% Cash, 5/16/2027 | 11/16/2020 | $ | 43,000,000 | 42,781,757 | 43,000,000 | 11.6 | % | |||||||||||||
| Granite Comfort, LP (j) | HVAC Services and Sales | Delayed Draw Term Loan (3M USD TERM SOFR+7.46%), 12.79% Cash, 5/16/2027 | 11/16/2020 | $ | 16,207,805 | 16,059,588 | 16,207,805 | 4.4 | % | |||||||||||||
| Total HVAC Services and Sales | 58,841,345 | 59,207,805 | 16.0 | % | ||||||||||||||||||
| Vector Controls Holding Co., LLC (d) | Industrial Products | First Lien Term Loan (3M USD TERM SOFR+6.50%), 11.75% Cash, 3/6/2025 | 3/6/2013 | $ | 923,886 | 923,886 | 923,886 | 0.2 | % | |||||||||||||
| Vector Controls Holding Co., LLC (h) | Industrial Products | Warrants to Purchase Limited Liability Company Interests, Expires 11/30/2027 | 5/31/2015 | 343 | - | 8,171,235 | 2.2 | % | ||||||||||||||
| Total Industrial Products | 923,886 | 9,095,121 | 2.4 | % | ||||||||||||||||||
Saratoga Investment Corp.
Consolidated Schedule of Investments
February 28, 202229, 2024
| Company(1) | Industry | Investment Interest Rate/ Maturity | Original Acquisition Date | Principal/ Number of Shares | Cost | Fair Value (c) | % of Net Assets | |||||||||||||||
| Pepper Palace, Inc. (d) | Specialty Food Retailer | First Lien Term Loan (3M USD LIBOR+6.25%), 7.25% Cash, 6/30/2026 | 6/30/2021 | $ | 33,830,000 | 33,531,592 | 33,261,656 | 9.2 | % | |||||||||||||
| Pepper Palace, Inc. (j) | Specialty Food Retailer | Delayed Draw Term Loan (3M USD LIBOR+6.25%), 7.25% Cash, 6/30/2026 | 6/30/2021 | $ | - | - | (33,600 | ) | 0.0 | % | ||||||||||||
| Pepper Palace, Inc. (j) | Specialty Food Retailer | Revolving Credit Facility (3M USD LIBOR+6.25%), 7.25% Cash, 6/30/2026 | 6/30/2021 | $ | - | - | (42,000 | ) | 0.0 | % | ||||||||||||
| Pepper Palace, Inc. (h) | Specialty Food Retailer | Membership Interest | 6/30/2021 | 1,000,000 | 1,000,000 | 827,050 | 0.1 | % | ||||||||||||||
| Total Specialty Food Retailer | 34,531,592 | 34,013,106 | 9.3 | % | ||||||||||||||||||
| ArbiterSports, LLC (d) | Sports Management | First Lien Term Loan (3M USD LIBOR+6.50%), 8.25% Cash, 2/21/2025 | 2/21/2020 | $ | 26,000,000 | 25,846,091 | 25,667,199 | 7.1 | % | |||||||||||||
| ArbiterSports, LLC (d) | Sports Management | Delayed Draw Term Loan (3M USD LIBOR+6.50%), 8.25% Cash, 2/21/2025 | 2/21/2020 | $ | 1,000,000 | 999,997 | 987,200 | 0.3 | % | |||||||||||||
| Total Sports Management | 26,846,088 | 26,654,399 | 7.4 | % | ||||||||||||||||||
| Avionte Holdings, LLC (h) | Staffing Services | Class A Units | 1/8/2014 | 100,000 | 100,000 | 1,912,328 | 0.5 | % | ||||||||||||||
| Total Staffing Services | 100,000 | 1,912,328 | 0.5 | % | ||||||||||||||||||
| Jobvite, Inc. (d) | Talent Acquisition Software | Second Lien Term Loan (3M USD LIBOR+7.50%), 8.50% Cash, 1/6/2027 | 7/6/2021 | $ | 20,000,000 | 19,841,684 | 19,652,000 | 5.5 | % | |||||||||||||
| Total Talent Acquisition Software | 19,841,684 | 19,652,000 | 5.5 | % | ||||||||||||||||||
| National Waste Partners (d) | Waste Services | Second Lien Term Loan 10.00% Cash, 11/13/2022 | 2/13/2017 | $ | 9,000,000 | 9,000,000.0 | 9,000,000.0 | 2.5 | % | |||||||||||||
| Total Waste Services | 9,000,000 | 9,000,000 | 2.5 | % | ||||||||||||||||||
| Sub Total Non-control/Non-affiliate investments | 654,965,044 | 668,358,516 | 187.4 | % | ||||||||||||||||||
| Company(1) | Industry | Investment Interest Rate/ Maturity | Original Acquisition Date | Principal/ Number of Shares | Cost | Fair Value (c) | % of Net Assets | |||||||||||||||
| AgencyBloc, LLC | Insurance Software | First Lien Term Loan (1M USD TERM SOFR+7.76%), 13.09% Cash, 10/1/2026 | 10/1/2021 | $ | 15,788,864 | 15,686,250 | 15,806,231 | 4.3 | % | |||||||||||||
| Panther ParentCo LLC (h) | Insurance Software | Class A Units | 10/1/2021 | 2,500,000 | 2,500,000 | 4,014,869 | 1.1 | % | ||||||||||||||
| Total Insurance Software | 18,186,250 | 19,821,100 | 5.4 | % | ||||||||||||||||||
| LogicMonitor, Inc. (d) | IT Services | First Lien Term Loan (3M USD TERM SOFR+6.50%), 11.83% Cash, 5/17/2026 | 3/20/2020 | $ | 43,000,000 | 42,967,165 | 43,000,000 | 11.6 | % | |||||||||||||
| Total IT Services | 42,967,165 | 43,000,000 | 11.6 | % | ||||||||||||||||||
| ActiveProspect, Inc. (d) | Lead Management Software | First Lien Term Loan (3M USD TERM SOFR+6.00%), 11.53% Cash, 8/8/2027 | 8/8/2022 | $ | 12,000,000 | 11,920,834 | 12,120,000 | 3.3 | % | |||||||||||||
| ActiveProspect, Inc. (j) | Lead Management Software | Delayed Draw Term Loan (3M USD TERM SOFR+6.00%), 11.53% Cash, 8/8/2027 | 8/8/2022 | $ | - | - | - | 0.0 | % | |||||||||||||
| Total Lead Management Software | 11,920,834 | 12,120,000 | 3.3 | % | ||||||||||||||||||
| Centerbase, LLC | Legal Software | First Lien Term Loan (3M USD TERM SOFR+7.75%), 13.08% Cash, 1/18/2027 | 1/18/2022 | $ | 21,033,360 | 20,882,496 | 20,709,446 | 5.6 | % | |||||||||||||
| Total Legal Software | 20,882,496 | 20,709,446 | 5.6 | % | ||||||||||||||||||
| Madison Logic, Inc. (d) | Marketing Orchestration Software | First Lien Term Loan (3M USD TERM SOFR+7.00%), 12.33% Cash, 12/30/2028 | 12/30/2022 | $ | 18,857,500 | 18,544,720 | 18,420,006 | 5.0 | % | |||||||||||||
| Total Marketing Orchestration Software | 18,544,720 | 18,420,006 | 5.0 | % | ||||||||||||||||||
Saratoga Investment Corp.
Consolidated Schedule of Investments
February 28, 202229, 2024
| Company(1) | Industry | Investment Interest Rate/ Maturity | Original Acquisition Date | Principal/ Number of Shares | Cost | Fair Value (c) | % of Net Assets | |||||||||||||||
| Affiliate investments - 13.5% (b) | ||||||||||||||||||||||
| Artemis Wax Corp. (f), (j) | Consumer Services | Delayed Draw Term Loan (1M USD LIBOR+9.00%), 11.00% Cash, 5/20/2026 | 5/20/2021 | $ | 30,000,000 | 29,727,282 | 30,000,000 | 8.4 | % | |||||||||||||
| Artemis Wax Corp. (f), (h) | Consumer Services | Series B-1 Preferred Stock | 5/20/2021 | 934,463 | 1,500,000 | 2,687,573 | 0.8 | % | ||||||||||||||
| Artemis Wax Corp. (f), (h) | Consumer Services | Series C Preferred Stock | 5/20/2021 | 5,547 | 5,546,609 | 5,546,605 | 1.6 | % | ||||||||||||||
| Total Consumer Services | 36,773,891 | 38,234,178 | 10.8 | % | ||||||||||||||||||
| Axero Holdings, LLC (f) | Employee Collaboration Software | First Lien Term Loan (3M USD LIBOR+10.00%), 11.00% Cash, 6/30/2026 | 6/30/2021 | $ | 5,500,000 | 5,451,036 | 5,482,950 | 1.5 | % | |||||||||||||
| Axero Holdings, LLC (f), (j) | Employee Collaboration Software | Delayed Draw Term Loan (3M USD LIBOR+10.00%), 11.00% Cash, 6/30/2026 | 6/30/2021 | $ | - | - | - | 0.0 | % | |||||||||||||
| Axero Holdigns, LLC (f), (j) | Employee Collaboration Software | Revolving Credit Facility (3M USD LIBOR+10.00%), 11.00% Cash, 6/30/2026 | 2/3/2022 | $ | - | - | - | 0.0 | % | |||||||||||||
| Axero Holdings, LLC (f), (h) | Employee Collaboration Software | Series A Preferred Units | 6/30/2021 | 2,000,000 | 2,000,000 | 2,198,000 | 0.5 | % | ||||||||||||||
| Axero Holdings, LLC (f), (h) | Employee Collaboration Software | Series B Preferred Units | 6/30/2021 | 2,000,000 | 2,000,000 | 2,318,996 | 0.7 | % | ||||||||||||||
| Total Employee Collaboration Software | 9,451,036 | 9,999,946 | 2.7 | % | ||||||||||||||||||
| Sub Total Affiliate investments | 46,224,927 | 48,234,124 | 13.5 | % | ||||||||||||||||||
| Company(1) | Industry | Investment Interest Rate/ Maturity | Original Acquisition Date | Principal/ Number of Shares | Cost | Fair Value (c) | % of Net Assets | |||||||||||||||
| ARC Health OpCo LLC (d) | Mental Healthcare Services | First Lien Term Loan (3M USD TERM SOFR+8.47%), 13.81% Cash, 8/5/2027 | 8/5/2022 | $ | 6,500,000 | 6,438,832 | 6,490,900 | 1.8 | % | |||||||||||||
| ARC Health OpCo LLC (d)(j) | Mental Healthcare Services | Delayed Draw Term Loan (3M USD TERM SOFR+8.47%), 13.81% Cash, 8/5/2027 | 8/5/2022 | $ | 26,914,577 | 26,903,916 | 26,876,897 | 7.3 | % | |||||||||||||
| ARC Health OpCo LLC (h) | Mental Healthcare Services | Class A Preferred Units | 8/5/2022 | 3,818,400 | 4,169,599 | 4,009,323 | 1.1 | % | ||||||||||||||
| Total Mental Healthcare Services | 37,512,347 | 37,377,120 | 10.2 | % | ||||||||||||||||||
| Chronus LLC | Mentoring Software | First Lien Term Loan (3M USD TERM SOFR+5.25%), 10.73% Cash, 8/26/2026 | 8/26/2021 | $ | 15,000,000 | 14,911,921 | 14,841,000 | 4.0 | % | |||||||||||||
| Chronus LLC | Mentoring Software | First Lien Term Loan (3M USD TERM SOFR+6.00%), 11.48% Cash, 8/26/2026 | 8/26/2021 | $ | 5,000,000 | 4,962,938 | 4,947,000 | 1.3 | % | |||||||||||||
| Chronus LLC (h) | Mentoring Software | Series A Preferred Stock | 8/26/2021 | 3,000 | 3,000,000 | 2,280,881 | 0.6 | % | ||||||||||||||
| Total Mentoring Software | 22,874,859 | 22,068,881 | 5.9 | % | ||||||||||||||||||
| Omatic Software, LLC | Non-profit Services | First Lien Term Loan (3M USD TERM SOFR+8.00%), 13.59% Cash/1.00% PIK, 6/30/2025 | 5/29/2018 | $ | 16,270,192 | 16,239,922 | 16,266,938 | 4.4 | % | |||||||||||||
| Total Non-profit Services | 16,239,922 | 16,266,938 | 4.4 | % | ||||||||||||||||||
| Emily Street Enterprises, L.L.C. | Office Supplies | Senior Secured Note (3M USD TERM SOFR+7.50%), 12.83% Cash, 12/31/2025 | 12/28/2012 | $ | 6,000,000 | 5,992,437 | 6,027,000 | 1.6 | % | |||||||||||||
| Emily Street Enterprises, L.L.C. (h) | Office Supplies | Warrant Membership Interests, Expires 12/31/2025 | 12/28/2012 | 49,318 | 400,000 | 1,153,874 | 0.3 | % | ||||||||||||||
| Total Office Supplies | 6,392,437 | 7,180,874 | 1.9 | % | ||||||||||||||||||
Saratoga Investment Corp.
Consolidated Schedule of Investments
February 29, 2024
February 28, 2022
| Company(1) | Industry | Investment Interest Rate/ Maturity | Original Acquisition Date | Principal/ Number of Shares | Cost | Fair Value (c) | % of Net Assets | |||||||||||||||
| Buildout, Inc. (d) | Real Estate Services | First Lien Term Loan (3M USD TERM SOFR+7.00%), 12.43% Cash, 7/9/2025 | 7/9/2020 | $ | 14,000,000 | 13,950,236 | 13,631,800 | 3.7 | % | |||||||||||||
| Buildout, Inc. | Real Estate Services | Delayed Draw Term Loan (3M USD TERM SOFR+7.00%), 12.47% Cash, 7/9/2025 | 2/12/2021 | $ | 38,500,000 | 38,342,798 | 37,487,450 | 10.1 | % | |||||||||||||
| Buildout, Inc. (h)(i) | Real Estate Services | Limited Partner Interests | 7/9/2020 | 1,250 | 1,372,557 | 1,231,195 | 0.3 | % | ||||||||||||||
| Total Real Estate Services | 53,665,591 | 52,350,445 | 14.1 | % | ||||||||||||||||||
| Wellspring Worldwide Inc. | Research Software | First Lien Term Loan (1M USD TERM SOFR+6.00%), 11.32% Cash, 12/22/2028 | 6/27/2022 | $ | 9,552,000 | 9,474,084 | 9,483,226 | 2.6 | % | |||||||||||||
| Wellspring Worldwide Inc. | Research Software | Delayed DrawTerm Loan (1M USD TERM SOFR+6.00%), 11.32% Cash, 12/22/2028 | 6/27/2022 | $ | 14,400,000 | 14,227,504 | 14,296,320 | 3.9 | % | |||||||||||||
| Archimedes Parent LLC (h) | Research Software | Class A Common Units | 6/27/2022 | 2,475,160 | 2,475,160 | 2,475,160 | 0.7 | % | ||||||||||||||
| Total Research Software | 26,176,748 | 26,254,706 | 7.2 | % | ||||||||||||||||||
| LFR Chicken LLC | Restaurant | First Lien Term Loan (1M USD TERM SOFR+7.00%), 12.32% Cash, 11/19/2026 | 11/19/2021 | $ | 12,000,000 | 11,926,272 | 12,104,400 | 3.3 | % | |||||||||||||
| LFR Chicken LLC | Restaurant | Delayed Draw Term Loan (1M USD TERM SOFR+7.00%), 12.32% Cash, 11/19/2026 | 11/19/2021 | $ | 9,000,000 | 8,935,545 | 9,078,300 | 2.5 | % | |||||||||||||
| LFR Chicken LLC (h) | Restaurant | Series B Preferred Units | 11/19/2021 | 497,183 | 1,000,000 | 1,397,572 | 0.4 | % | ||||||||||||||
| Total Restaurant | 21,861,817 | 22,580,272 | 6.2 | % | ||||||||||||||||||
| JobNimbus LLC | Roofing Contractor Software | First Lien Term Loan (1M USD TERM SOFR+8.75%), 14.17% Cash, 9/20/2026 | 3/28/2023 | $ | 18,777,459 | 18,624,294 | 19,014,055 | 5.1 | % | |||||||||||||
| Total Roofing Contractor Software | 18,624,294 | 19,014,055 | 5.1 | % | ||||||||||||||||||
| Company(1) | Industry | Investment Interest Rate/ Maturity | Original Acquisition Date | Principal/ Number of Shares | Cost | Fair Value (c) | % of Net Assets | |||||||||||||||
| Control investments - 28.3% (b) | ||||||||||||||||||||||
| Netreo Holdings, LLC (g) | IT Services | First Lien Term Loan (3M USD LIBOR +8.00%), 9.00% Cash 12/31/2025 | 7/3/2018 | $ | 5,432,440 | 5,409,201 | 5,421,575 | 1.4 | % | |||||||||||||
| Netreo Holdings, LLC (d), (g), (j) | IT Services | Delayed Draw Term Loan (3M USD LIBOR +8.00%), 9.00% Cash, 12/31/2025 | 5/26/2020 | $ | 13,433,515 | 13,406,530 | 13,406,648 | 3.8 | % | |||||||||||||
| Netreo Holdings, LLC (g), (h) | IT Services | Common Stock Class A Unit | 7/3/2018 | 4,600,677 | 8,344,500 | 18,975,523 | 5.3 | % | ||||||||||||||
| Total IT Services | 27,160,231 | 37,803,746 | 10.5 | % | ||||||||||||||||||
| Saratoga Investment Corp. CLO 2013-1, Ltd. (a), (e), (g) | Structured Finance Securities | Other/Structured Finance Securities 9.27%, 4/20/2033 | 1/22/2008 | $ | 111,000,000 | 32,273,125 | 28,654,905 | 8.1 | % | |||||||||||||
| Saratoga Investment Corp. CLO 2013-1, Ltd. Class F-2-R-3 Note (a), (g) | Structured Finance Securities | Other/Structured Finance Securities (3M USD LIBOR+10.00%), 10.17%, 4/20/2033 | 8/9/2021 | $ | 9,375,000 | 9,375,000 | 9,375,000 | 2.6 | % | |||||||||||||
| Total Structured Finance Securities | 41,648,125 | 38,029,905 | 10.7 | % | ||||||||||||||||||
| Saratoga Senior Loan Fund I JV, LLC (a), (g), (j) | Investment Fund | Unsecured Loan 10.00%, 6/15/2023 | 2/17/2022 | $ | 13,125,000 | 13,125,000 | 13,125,000 | 3.7 | % | |||||||||||||
| Saratoga Senior Loan Fund I JV, LLC (a), (g), (j) | Investment Fund | Membership Interest | 2/17/2022 | 13,125,000 | 13,125,000 | 12,016,064 | 3.4 | % | ||||||||||||||
| Total Investment Fund | 26,250,000 | 25,141,064 | 7.1 | % | ||||||||||||||||||
| Sub Total Control investments | 95,058,356 | 100,974,715 | 28.3 | % | ||||||||||||||||||
| TOTAL INVESTMENTS - 229.2% (b) | $ | 796,248,327 | $ | 817,567,355 | 229.2 | % | ||||||||||||||||
| Number of Shares | Cost | Fair Value | % of Net Assets | |||||||||||||
| Cash and cash equivalents and cash and cash equivalents, reserve accounts - 14.9% (b) | ||||||||||||||||
| U.S. Bank Money Market (k) | 52,870,342 | $ | 52,870,342 | $ | 52,870,342 | 14.9 | % | |||||||||
| Total cash and cash equivalents and cash and cash equivalents, reserve accounts | 52,870,342 | $ | 52,870,342 | $ | 52,870,342 | 14.9 | % | |||||||||
Saratoga Investment Corp.
Consolidated Schedule of Investments
February 29, 2024
| Company(1) | Industry | Investment Interest Rate/ Maturity | Original Acquisition Date | Principal/ Number of Shares | Cost | Fair Value (c) | % of Net Assets | |||||||||||||||
| Pepper Palace, Inc. (d)(k) | Specialty Food Retailer | First Lien Term Loan (3M USD TERM SOFR+6.25%), 11.73% Cash, 6/30/2026 | 6/30/2021 | $ | 33,320,000 | 33,148,332 | 2,409,036 | 0.7 | % | |||||||||||||
| Pepper Palace, Inc. (j)(k) | Specialty Food Retailer | Delayed Draw Term Loan (3M USD TERM SOFR+6.25%), 11.73% Cash, 6/30/2026 | 6/30/2021 | $ | 1,101,600 | 1,092,422 | 79,646 | 0.0 | % | |||||||||||||
| Pepper Palace, Inc. (j)(k) | Specialty Food Retailer | Revolving Credit Facility (3M USD TERM SOFR+6.25%), 11.73% Cash, 6/30/2026 | 6/30/2021 | $ | - | - | - | 0.0 | % | |||||||||||||
| Pepper Palace, Inc. (h) | Specialty Food Retailer | Membership Interest (Series A) | 6/30/2021 | 1,000,000 | 1,000,000 | - | 0.0 | % | ||||||||||||||
| Pepper Palace, Inc. (h) | Specialty Food Retailer | Membership Interest (Series B) | 6/30/2021 | 197,035 | 197,035 | - | 0.0 | % | ||||||||||||||
| Total Specialty Food Retailer | 35,437,789 | 2,488,682 | 0.7 | % | ||||||||||||||||||
| ArbiterSports, LLC (d) | Sports Management | First Lien Term Loan (3M USD TERM SOFR+6.00%), 11.33% Cash, 2/21/2025 | 2/21/2020 | $ | 26,000,000 | 25,945,071 | 26,000,000 | 7.0 | % | |||||||||||||
| ArbiterSports, LLC | Sports Management | Delayed Draw Term Loan (3M USD TERM SOFR+6.00%), 11.33% Cash, 2/21/2025 | 2/21/2020 | $ | 1,000,000 | 1,000,000 | 1,000,000 | 0.3 | % | |||||||||||||
| Total Sports Management | 26,945,071 | 27,000,000 | 7.3 | % | ||||||||||||||||||
| Avionte Holdings, LLC (h) | Staffing Services | Class A Units | 1/8/2014 | 100,000 | 100,000 | 3,287,970 | 0.9 | % | ||||||||||||||
| Total Staffing Services | 100,000 | 3,287,970 | 0.9 | % | ||||||||||||||||||
| JDXpert | Talent Acquisition Software | First Lien Term Loan (3M USD TERM SOFR+8.50%), 14.10% Cash, 5/2/2027 | 5/2/2022 | $ | 6,000,000 | 5,955,935 | 6,060,000 | 1.6 | % | |||||||||||||
| JDXpert (j) | Talent Acquisition Software | Delayed Draw Term Loan (3M USD TERM SOFR+8.50%), 14.10% Cash, 5/2/2027 | 5/2/2022 | $ | 1,000,000 | 991,649 | 1,010,000 | 0.3 | % | |||||||||||||
| Jobvite, Inc. (d) | Talent Acquisition Software | First Lien Term Loan (6M USD TERM SOFR+8.00%), 13.27% Cash, 8/5/2028 | 8/5/2022 | $ | 20,000,000 | 19,875,273 | 19,826,000 | 5.6 | % | |||||||||||||
| Total Talent Acquisition Software | 26,822,857 | 26,896,000 | 7.5 | % | ||||||||||||||||||
Saratoga Investment Corp.
Consolidated Schedule of Investments
February 29, 2024
| Company(1) | Industry | Investment Interest Rate/ Maturity | Original Acquisition Date | Principal/ Number of Shares | Cost | Fair Value (c) | % of Net Assets | |||||||||||||||
| VetnCare MSO, LLC (j) | Veterinary Services | Delayed Draw Term Loan (3M USD TERM SOFR+5.75%), 11.08% Cash, 5/12/2028 | 5/12/2023 | $ | 4,680,505 | 4,638,599 | 4,753,048 | 1.3 | % | |||||||||||||
| Total Veterinary Services | 4,638,599 | 4,753,048 | 1.3 | % | ||||||||||||||||||
| Sub Total Non-control/Non-affiliate investments | 1,035,879,751 | 1,019,774,616 | 276.5 | % | ||||||||||||||||||
| Affiliate investments - 7.5% (b) | ||||||||||||||||||||||
| ETU Holdings, Inc. (f) | Corporate Education Software | First Lien Term Loan (3M USD TERM SOFR+9.00%), 14.48% Cash, 8/18/2027 | 8/18/2022 | $ | 7,000,000 | 6,945,060 | 6,983,200 | 1.9 | % | |||||||||||||
| ETU Holdings, Inc. (f) | Corporate Education Software | Second Lien Term Loan 15.00% PIK, 2/18/2028 | 8/18/2022 | $ | 6,130,483 | 6,089,408 | 5,454,290 | 1.5 | % | |||||||||||||
| ETU Holdings, Inc. (f)(h) | Corporate Education Software | Series A Preferred Units | 8/18/2022 | 3,000,000 | 3,000,000 | 1,162,040 | 0.3 | % | ||||||||||||||
| Total Corporate Education Software | 16,034,468 | 13,599,530 | 3.7 | % | ||||||||||||||||||
| Axero Holdings, LLC (f) | Employee Collaboration Software | First Lien Term Loan (3M USD TERM SOFR+8.00%), 13.48% Cash, 6/30/2026 | 6/30/2021 | $ | 5,500,000 | 5,468,859 | 5,555,000 | 1.5 | % | |||||||||||||
| Axero Holdings, LLC (f) | Employee Collaboration Software | Delayed Draw Term Loan (3M USD TERM SOFR+8.00%), 13.48% Cash, 6/30/2026 | 6/30/2021 | $ | 1,100,000 | 1,092,870 | 1,111,000 | 0.3 | % | |||||||||||||
| Axero Holdings, LLC (f)(j) | Employee Collaboration Software | Revolving Credit Facility (3M USD TERM SOFR+8.00%), 13.48% Cash, 6/30/2026 | 2/3/2022 | $ | - | - | - | 0.0 | % | |||||||||||||
| Axero Holdings, LLC (f)(h) | Employee Collaboration Software | Series A Preferred Units | 6/30/2021 | 2,055,609 | 2,055,609 | 2,877,000 | 0.8 | % | ||||||||||||||
| Axero Holdings, LLC (f)(h) | Employee Collaboration Software | Series B Preferred Units | 6/30/2021 | 2,055,609 | 2,055,609 | 4,606,607 | 1.2 | % | ||||||||||||||
| Total Employee Collaboration Software | 10,672,947 | 14,149,607 | 3.8 | % | ||||||||||||||||||
| Sub Total Affiliate investments | 26,707,415 | 27,749,137 | 7.5 | % | ||||||||||||||||||
| Control investments - 24.7% (b) | ||||||||||||||||||||||
Saratoga Investment Corp.
Consolidated Schedule of Investments
February 29, 2024
| Company(1) | Industry | Investment Interest Rate/ Maturity | Original Acquisition Date | Principal/ Number of Shares | Cost | Fair Value (c) | % of Net Assets | |||||||||||||||
| Netreo Holdings, LLC (g) | IT Services | First Lien Term Loan (3M USD TERM SOFR +6.50%), 11.98% Cash/3.50% PIK 12/31/2025 | 7/3/2018 | $ | 5,693,748 | 5,686,791 | 5,582,719 | 1.5 | % | |||||||||||||
| Netreo Holdings, LLC (d)(g) | IT Services | Delayed Draw Term Loan (3M USD TERM SOFR +6.50%), 11.98% Cash/3.50% PIK, 12/31/2025 | 5/26/2020 | $ | 25,271,214 | 25,193,452 | 24,778,425 | 6.7 | % | |||||||||||||
| Netreo Holdings, LLC (g)(h) | IT Services | Common Stock Class A Units | 7/3/2018 | 4,600,677 | 8,344,500 | 5,060,745 | 1.4 | % | ||||||||||||||
| Total IT Services | 39,224,743 | 35,421,889 | 9.6 | % | ||||||||||||||||||
| Saratoga Investment Corp. CLO 2013-1, Ltd. (a)(e)(g) | Structured Finance Securities | Other/Structured Finance Securities 0.00%, 4/20/2033 | 1/22/2008 | $ | 111,000,000 | 22,001,887 | 9,500,627 | 2.6 | % | |||||||||||||
| Saratoga Investment Corp. CLO 2013-1, Ltd. Class F-2-R-3 Note (a)(g) | Structured Finance Securities | Other/Structured Finance Securities (3M USD TERM SOFR+10.00%), 15.60%, 4/20/2033 | 8/9/2021 | $ | 9,375,000 | 9,375,000 | 8,875,227 | 2.4 | % | |||||||||||||
| Saratoga Investment Corp. Senior Loan Fund 2022-1, Ltd. Class E Note (a)(g) | Structured Finance Securities | Other/Structured Finance Securities (3M USD TERM SOFR+8.55%), 13.88%, 10/20/2033 | 10/28/2022 | $ | 12,250,000 | 11,392,500 | 12,250,000 | 3.3 | % | |||||||||||||
| Total Structured Finance Securities | 42,769,387 | 30,625,854 | 8.3 | % | ||||||||||||||||||
| Saratoga Senior Loan Fund I JV, LLC (a)(g)(j) | Investment Fund | Unsecured Loan 10.00%, 10/20/2033 | 12/17/2021 | $ | 17,618,954 | 17,618,954 | 15,818,297 | 4.3 | % | |||||||||||||
| Saratoga Senior Loan Fund I JV, LLC (a)(g) | Investment Fund | Membership Interest | 12/17/2021 | 17,583,486 | 17,583,487 | 9,403,996 | 2.5 | % | ||||||||||||||
| Total Investment Fund | 35,202,441 | 25,222,293 | 6.8 | % | ||||||||||||||||||
| Sub Total Control investments | 117,196,571 | 91,270,036 | 24.7 | % | ||||||||||||||||||
| TOTAL INVESTMENTS - 308.7% (b) | $ | 1,179,783,737 | $ | 1,138,793,789 | 308.7 | % | ||||||||||||||||
Saratoga Investment Corp.
Consolidated Schedule of Investments
February 29, 2024
| Number of Shares | Cost | Fair Value | % of Net Assets | |||||||||||||
| Cash and cash equivalents and cash and cash equivalents, reserve accounts - 10.9% (b) | ||||||||||||||||
| U.S. Bank Money Market (l) | 40,507,124 | $ | 40,507,124 | $ | 40,507,124 | 10.9 | % | |||||||||
| Total cash and cash equivalents and cash and cash equivalents, reserve accounts | 40,507,124 | $ | 40,507,124 | $ | 40,507,124 | 10.9 | % | |||||||||
| (1) | Securities are exempt from registration under Rule 144A of the Securities Act of 1933, as amended, and are restricted securities. Money market funds are valued at net asset value and are considered level 1 investments within the fair value hierarchy. |
| (a) | Represents an investment that is not a “qualifying asset” under Section 55(a) of the Investment Company Act of 1940, as amended (the 1940 Act”). As of February |
| (b) | Percentages are based on net assets of |
Saratoga Investment Corp.
Consolidated Schedule of Investments
February 28, 2022
| (c) | Because there is no |
| (d) | These securities are either fully or partially pledged as collateral under |
| (e) | This investment does not have a stated interest rate that is payable thereon. As a result, the |
Saratoga Investment Corp.
Consolidated Schedule of Investments
February 29, 2024
| (f) | As defined in the 1940 Act, this portfolio company is an “affiliate” as we own between 5.0% and 25.0% of the outstanding voting securities. |
| Company | Purchases | Sales | Total Interest from Investments | Management Fee Income | Net Realized Gain (Loss) from Investments | Net Change in Unrealized Appreciation (Depreciation) | ||||||||||||||||||
| Artemis Wax Corp. | $ | 36,200,000 | $ | - | $ | 1,919,100 | $ | - | $ | - | $ | 1,460,287 | ||||||||||||
| Axero Holdings, LLC | 9,445,000 | - | 416,092 | - | - | 548,910 | ||||||||||||||||||
| GreyHeller, LLC | 8,910,000 | (26,428,457 | ) | 973,278 | - | 7,328,457 | (3,102,569 | ) | ||||||||||||||||
| Top Gun | - | - | - | - | - | 1,066,536 | ||||||||||||||||||
| Total | $ | 54,555,000 | $ | (26,428,457 | ) | $ | 3,308,471 | $ | - | $ | 7,328,457 | $ | (26,836 | ) | ||||||||||
(g) As defined in the 1940 Act, we “control” this portfolio company because we own more than 25% of the portfolio company’s outstanding voting securities. Transactions during the year ended February 28, 2022 in which the issuer was both an affiliate and a portfolio company that we control are as follows:
| Company | Purchases | Sales | Total Interest from Investments | Management Fee Income | Net Realized Gain (Loss) from Investments | Net Change in Unrealized Appreciation (Depreciation) | ||||||||||||||||||
| Axero Holdings, LLC | $ | - | $ | - | $ | 931,008 | $ | - | $ | - | $ | 976,251 | ||||||||||||
| ETU Holdings, Inc. | - | - | 1,915,718 | - | - | (2,518,080 | ) | |||||||||||||||||
| Modis Dental Partners OpCo, LLC | 8,845,000 | - | 656,579 | - | - | - | ||||||||||||||||||
| Alpha Aesthetics Partners OpCo, LLC | 10,498,789 | - | 670,737 | - | - | - | ||||||||||||||||||
| Total | $ | 19,343,789 | $ | - | $ | 4,174,042 | $ | - | $ | - | $ | (1,541,829 | ) | |||||||||||
Saratoga Investment Corp.
| (g) | As defined in the 1940 Act, we “control” this portfolio company because we own more than 25% of the portfolio company’s outstanding voting securities. Transactions during the year ended February 29, 2024 in which the issuer was both an affiliate and a portfolio company that we control are as follows: |
Consolidated Schedule of Investments
| Company | Purchases | Sales | Total Interest from Investments | Total Dividends from Investments | Management Fee Income | Net Realized Gain (Loss) from Investments | Net Change in Unrealized Appreciation (Depreciation) | |||||||||||||||||||||
| Netreo Holdings, LLC | $ | 2,475,000 | $ | - | $ | 4,374,804 | $ | - | $ | - | $ | - | $ | (12,083,067 | ) | |||||||||||||
| Saratoga Investment Corp. CLO 2013-1, Ltd. | - | - | - | - | 3,270,232 | - | (4,733,934 | ) | ||||||||||||||||||||
| Saratoga Investment Corp. Senior Loan Fund 2022-1, Ltd. Class E Note | - | - | 1,696,890 | - | - | - | 895,505 | |||||||||||||||||||||
| Saratoga Investment Corp. CLO 2013-1, Ltd. Class F-2-R-3 Note | - | - | 1,469,668 | - | - | - | 43,821 | |||||||||||||||||||||
| Saratoga Senior Loan Fund I JV, LLC | - | - | 1,781,472 | - | - | - | (1,800,657 | ) | ||||||||||||||||||||
| Saratoga Senior Loan Fund I JV, LLC | - | - | - | 5,911,564 | - | - | (3,702,956 | ) | ||||||||||||||||||||
| Total | $ | 2,475,000 | $ | - | $ | 9,322,834 | $ | 5,911,564 | $ | 3,270,232 | $ | - | $ | (21,381,288 | ) | |||||||||||||
February 28, 2022
| Company | Purchases | Sales | Total Interest from Investments | Management Fee Income | Net Realized Gain (Loss) from Investments | Net Change in Unrealized Appreciation (Depreciation) | ||||||||||||||||||
| Netreo Holdings, LLC | $ | 17,074,500 | $ | - | $ | 1,814,735 | $ | - | $ | - | $ | 5,055,909 | ||||||||||||
| Saratoga Investment Corp. CLO 2013-1, Ltd. | - | - | 4,372,958 | 3,262,591 | - | (1,221,309 | ) | |||||||||||||||||
| Saratoga Investment Corp. CLO 2013-1, Ltd. Class F-R-3 Note | - | (17,875,000 | ) | 814,431 | - | - | (454,025 | ) | ||||||||||||||||
| Saratoga Investment Corp. CLO 2013-1, Ltd. Class F-1-R-3 Note | 8,500,000 | (8,500,000 | ) | 4,786 | - | (139,867 | ) | - | ||||||||||||||||
| Saratoga Investment Corp. CLO 2013-1, Ltd. Class F-2-R-3 Note | 9,375,000 | - | 539,564 | - | - | - | ||||||||||||||||||
| Saratoga Senior Loan Fund I JV, LLC | 13,125,000 | - | 126,389 | - | - | - | ||||||||||||||||||
| Saratoga Senior Loan Fund I JV, LLC | 13,125,000 | - | - | - | - | (1,108,936 | ) | |||||||||||||||||
| Total | $ | 61,199,500 | $ | (26,375,000 | ) | $ | 7,672,863 | $ | 3,262,591 | $ | (139,867 | ) | $ | 2,271,639 | ||||||||||
| (h) | Non-income producing at February |
| (i) | Includes securities issued by an affiliate of the company. |
| (j) | All or a portion of this investment has an unfunded commitment as of February |
| (k) | As of February 29, 2024, the investment was on non-accrual status. The fair value of these investments was approximately $18.9 million, which represented 1.7% of the Company’s portfolio (see Note 2 to the consolidated financial statements). |
| (l) | Included within cash and cash equivalents and cash and cash equivalents, reserve accounts in the Company’s consolidated statements of assets and liabilities as of February |
BSBY - Bloomberg Short-Term Bank Yield
LIBOR - London Interbank Offered Rate
SOFR - Secured Overnight Financing Rate
1M USD TERM SOFR - The 1 month USD TERM SOFR rate as of February 29, 2024 was 5.32%.
3M USD BSBYTERM SOFR - The 3 month USD BSBY rate as of February 28, 2022 was 0.50%.
1M USD LIBOR - The 1 month USD LIBOR rate as of February 28, 2022 was 0.24%.
3M USD LIBOR - The 3 month USD LIBOR rate as of February 28, 2022 was 0.50%.
Daily USD SOFR - The daily USDTERM SOFR rate as of February 28, 202229, 2024 was 0.05%5.33%.
6M USD TERM SOFR - The 6 month USD TERM SOFR rate as of February 29, 2024 was 5.27%.
PIK - Payment-in-Kind (see Note 2 to the consolidated financial statements).
See accompanying notes to consolidated financial statements.
Saratoga Investment Corp.
Consolidated Schedule of Investments
February 28, 20212023
| Company(1) | Industry | Investment Interest Rate/ Maturity | Original Acquisition Date | Principal/ Number of Shares | Cost | Fair Value (c) | % of Net Assets | |||||||||||||||
| Non-control/Non-affiliate investments - 154.5% (b) | ||||||||||||||||||||||
| Targus Holdings, Inc. (d), (h) | Consumer Products | Common Stock | 12/31/2009 | 210,456 | $ | 1,589,630 | $ | 475,116 | 0.2 | % | ||||||||||||
| Total Consumer Products | 1,589,630 | 475,116 | 0.2 | % | ||||||||||||||||||
| My Alarm Center, LLC (k) | Consumer Services | Preferred Equity Class A Units 8.00% PIK | 7/14/2017 | 2,227 | 2,357,879 | - | 0.0 | % | ||||||||||||||
| My Alarm Center, LLC (h) | Consumer Services | Preferred Equity Class B Units | 7/14/2017 | 1,797 | 1,796,880 | - | 0.0 | % | ||||||||||||||
| My Alarm Center, LLC (h) | Consumer Services | Preferred Equity Class Z Units | 9/12/2018 | 676 | 712,343 | 181,240 | 0.1 | % | ||||||||||||||
| My Alarm Center, LLC (h) | Consumer Services | Common Stock | 7/14/2017 | 96,224 | - | - | 0.0 | % | ||||||||||||||
| Total Consumer Services | 4,867,102 | 181,240 | 0.1 | % | ||||||||||||||||||
| Schoox, Inc. (h), (i) | Corporate Education Software | Series 1 Membership Interest | 12/8/2020 | 226,782 | 1,050,000 | 1,050,000 | 0.3 | % | ||||||||||||||
| Total Corporate Education Software | 1,050,000 | 1,050,000 | �� | 0.3 | % | |||||||||||||||||
| Passageways, Inc. | Corporate Governance | First Lien Term Loan (3M USD LIBOR+7.00%), 8.75% Cash, 12/31/2025 | 7/5/2018 | $ | 5,000,000 | 4,972,250 | 5,050,000 | 1.7 | % | |||||||||||||
| Passageways, Inc. (j) | Corporate Governance | Delayed Draw Term Loan (3M USD LIBOR+7.00%), 8.75% Cash, 12/31/2025 | 1/3/2020 | $ | 5,000,000 | 4,980,871 | 5,050,000 | 1.7 | % | |||||||||||||
| Passageways, Inc. (h) | Corporate Governance | Series A Preferred Stock | 7/5/2018 | 2,027,205 | 1,000,000 | 3,164,579 | 1.0 | % | ||||||||||||||
| Total Corporate Governance | 10,953,121 | 13,264,579 | 4.4 | % | ||||||||||||||||||
| New England Dental Partners | Dental Practice Management | First Lien Term Loan (3M USD LIBOR+8.00%), 8.50% Cash, 11/25/2025 | 11/25/2020 | $ | 6,555,000 | 6,491,331 | 6,489,450 | 2.1 | % | |||||||||||||
| New England Dental Partners (j) | Dental Practice Management | Delayed Draw Term Loan (3M USD LIBOR+8.00%), 8.50% Cash, 11/25/2025 | 11/25/2020 | $ | 650,000 | 644,419 | 643,500 | 0.2 | % | |||||||||||||
| Total Dental Practice Management | 7,135,750 | 7,132,950 | 2.3 | % | ||||||||||||||||||
| Company(1) | Industry | Investment Interest Rate/ Maturity | Original Acquisition Date | Principal/ Number of Shares | Cost | Fair Value (c) | % of Net Assets | |||||||||||||||
| Non-control/Non-affiliate investments - 238.6% (b) | ||||||||||||||||||||||
| Altvia MidCo, LLC. | Alternative Investment Management Software | First Lien Term Loan (3M USD TERM SOFR+8.50%), 13.39% Cash, 7/18/2027 | 7/18/2022 | $ | 7,980,000 | $ | 7,907,457 | $ | 7,911,372 | 2.3 | % | |||||||||||
| Altvia MidCo, LLC. (h) | Alternative Investment Management Software | Series A-1 Preferred Shares | 7/18/2022 | 2,000,000 | 2,000,000 | 2,548,000 | 0.7 | % | ||||||||||||||
| Total Alternative Investment Management Software | 9,907,457 | 10,459,372 | 3.0 | % | ||||||||||||||||||
| Artemis Wax Corp. (d)(j) | Consumer Services | Delayed Draw Term Loan (1M USD TERM SOFR+6.75%), 11.41% Cash, 5/20/2026 | 5/20/2021 | $ | 57,500,000 | 57,059,057 | 57,500,000 | 16.6 | % | |||||||||||||
| Artemis Wax Corp. (h) | Consumer Services | Series B-1 Preferred Stock | 5/20/2021 | 934,463 | 1,500,000 | 4,642,322 | 1.3 | % | ||||||||||||||
| Artemis Wax Corp. (h) | Consumer Services | Series D Preferred Stock | 12/22/2022 | 278,769 | 1,500,000 | 1,500,005 | 0.4 | % | ||||||||||||||
| Total Consumer Services | 60,059,057 | 63,642,327 | 18.3 | % | ||||||||||||||||||
| Schoox, Inc. (h), (i) | Corporate Education Software | Series 1 Membership Interest | 12/8/2020 | 1,050 | 475,698 | 3,809,091 | 1.1 | % | ||||||||||||||
| Total Corporate Education Software | 475,698 | 3,809,091 | 1.1 | % | ||||||||||||||||||
| GreyHeller LLC (h) | Cyber Security | Common Stock | 11/10/2021 | 7,857,689 | 1,906,275 | 2,509,210 | 0.7 | % | ||||||||||||||
| Total Cyber Security | 1,906,275 | 2,509,210 | 0.7 | % | ||||||||||||||||||
| New England Dental Partners | Dental Practice Management | First Lien Term Loan (3M USD LIBOR+8.00%), 12.97% Cash, 11/25/2025 | 11/25/2020 | $ | 6,555,000 | 6,514,437 | 6,523,536 | 1.9 | % | |||||||||||||
| New England Dental Partners | Dental Practice Management | Delayed Draw Term Loan (3M USD LIBOR+8.00%), 12.97% Cash, 11/25/2025 | 11/25/2020 | $ | 4,650,000 | 4,627,032 | 4,627,680 | 1.3 | % | |||||||||||||
| Gen4 Dental Partners Holdings, LLC (j) | Dental Practice Management | Delayed Draw Term Loan (3M USD TERM SOFR+10.35%), 15.24% Cash, 4/29/2026 | 2/8/2023 | $ | - | (94,504 | ) | - | 0.0 | % | ||||||||||||
| Gen4 Dental Partners Holdings, LLC (i) | Dental Practice Management | Series A Preferred Units | 2/8/2023 | 480,769 | 1,000,000 | 1,000,000 | 0.3 | % | ||||||||||||||
| Total Dental Practice Management | 12,046,965 | 12,151,216 | 3.5 | % | ||||||||||||||||||
| Exigo, LLC (d) | Direct Selling Software | First Lien Term Loan (1M USD LIBOR+5.75%), 10.42% Cash, 3/16/2027 | 3/16/2022 | $ | 24,812,500 | 24,632,494 | 24,504,825 | 7.1 | % | |||||||||||||
| Exigo, LLC (j) | Direct Selling Software | Delayed Draw Term Loan (1M USD LIBOR+5.75%), 10.42% Cash, 3/16/2027 | 3/16/2022 | $ | - | - | (51,667 | ) | 0.0 | % | ||||||||||||
| Exigo, LLC (j) | Direct Selling Software | Revolving Credit Facility (1M USD LIBOR+5.75%), 10.42% Cash, 3/16/2027 | 3/16/2022 | $ | 208,334 | 208,333 | 195,417 | 0.1 | % | |||||||||||||
| Exigo, LLC (h), (i) | Direct Selling Software | Common Units | 3/16/2022 | 1,041,667 | 1,041,667 | 1,121,575 | 0.3 | % | ||||||||||||||
| Total Direct Selling Software | 25,882,494 | 25,770,150 | 7.5 | % | ||||||||||||||||||
| C2 Educational Systems (d) | Education Services | First Lien Term Loan (3M USD LIBOR+8.50%), 13.47% Cash, 5/31/2023 | 5/31/2017 | $ | 18,500,000 | 18,497,146 | 18,525,900 | 5.3 | % | |||||||||||||
| C2 Education Systems, Inc. (h) | Education Services | Series A-1 Preferred Stock | 5/18/2021 | 3,127 | 499,904 | 629,892 | 0.2 | % | ||||||||||||||
| Zollege PBC | Education Services | First Lien Term Loan (3M USD LIBOR+7.00%), 11.97% Cash, 5/11/2026 | 5/11/2021 | $ | 16,000,000 | 15,905,830 | 14,827,200 | 4.3 | % | |||||||||||||
| Zollege PBC (j) | Education Services | Delayed Draw Term Loan (3M USD LIBOR+7.00%), 11.97% Cash, 5/11/2026 | 5/11/2021 | $ | 500,000 | 496,809 | 390,050 | 0.1 | % | |||||||||||||
| Zollege PBC (h) | Education Services | Class A Units | 5/11/2021 | 250,000 | 250,000 | 115,676 | 0.0 | % | ||||||||||||||
| Total Education Services | 35,649,689 | 34,488,718 | 9.9 | % | ||||||||||||||||||
Saratoga Investment Corp.
Consolidated Schedule of Investments
February 28, 20212023
| Company(1) | Industry | Investment Interest Rate/ Maturity | Original Acquisition Date | Principal/ Number of Shares | Cost | Fair Value (c) | % of Net Assets | |||||||||||||||
| PDDS Buyer, LLC | Dental Practice Management Software | First Lien Term Loan (3M USD LIBOR+7.00%), 9.50% Cash, 7/15/2024 | 7/15/2019 | $ | 14,000,000 | 13,895,777 | 14,278,600 | 4.7 | % | |||||||||||||
| PDDS Buyer, LLC | Dental Practice Management Software | Delayed Draw Term Loan (3M USD LIBOR+7.00%), 9.50% Cash, 7/15/2024 | 7/15/2019 | $ | 7,000,000 | 6,938,964 | 7,139,300 | 2.3 | % | |||||||||||||
| PDDS Buyer, LLC (h) | Dental Practice Management Software | Series A-1 Preferred Shares | 8/10/2020 | 1,755,831 | 2,000,000 | 2,240,946 | 0.7 | % | ||||||||||||||
| Total Dental Practice Management Software | 22,834,741 | 23,658,846 | 7.7 | % | ||||||||||||||||||
| C2 Educational Systems (d) | Education Services | First Lien Term Loan (3M USD LIBOR+8.50%), 10.00% Cash, 5/31/2023 | 5/31/2017 | $ | 16,000,000 | 15,998,379 | 13,499,200 | 4.4 | % | |||||||||||||
| Texas Teachers of Tomorrow, LLC (h), (i) | Education Services | Common Stock | 12/2/2015 | 750 | 750,000 | 1,011,596 | 0.3 | % | ||||||||||||||
| Texas Teachers of Tomorrow, LLC (d) | Education Services | First Lien Term Loan (3M USD LIBOR+7.25%), 9.75% Cash, 6/28/2024 | 6/28/2019 | $ | 25,947,024 | 25,748,711 | 25,874,372 | 8.5 | % | |||||||||||||
| Total Education Services | 42,497,090 | 40,385,168 | 13.2 | % | ||||||||||||||||||
| Destiny Solutions Inc. (d) | Education Software | First Lien Term Loan (3M USD LIBOR+7.50%), 9.50% Cash, 10/24/2024 | 5/16/2018 | $ | 43,500,000 | 43,204,446 | 43,630,500 | 14.3 | % | |||||||||||||
| Destiny Solutions Inc. (h), (i) | Education Software | Limited Partner Interests | 5/16/2018 | 2,342 | 2,468,464 | 3,069,267 | 1.0 | % | ||||||||||||||
| Identity Automation Systems (d) | Education Software | First Lien Term Loan (3M USD LIBOR+9.24%), 10.99% Cash, 5/8/2024 | 8/25/2014 | $ | 17,247,500 | 17,247,500 | 17,357,884 | 5.7 | % | |||||||||||||
| Identity Automation Systems (h) | Education Software | Common Stock Class A-2 Units | 8/25/2014 | 232,616 | 232,616 | 725,726 | 0.2 | % | ||||||||||||||
| Identity Automation Systems (h) | Education Software | Common Stock Class A-1 Units | 3/6/2020 | 43,715 | 171,571 | 185,553 | 0.1 | % | ||||||||||||||
| Company(1) | Industry | Investment Interest Rate/ Maturity | Original Acquisition Date | Principal/ Number of Shares | Cost | Fair Value (c) | % of Net Assets | |||||||||||||||
| Destiny Solutions Inc. (h), (i) | Education Software | Limited Partner Interests | 5/16/2018 | 3,068 | 3,969,291 | 8,941,350 | 2.6 | % | ||||||||||||||
| GoReact | Education Software | First Lien Term Loan (3M USD TERM SOFR+7.50%), 13.59% Cash, 1/17/2025 | 1/17/2020 | $ | 8,006,000 | 7,952,042 | 7,982,783 | 2.3 | % | |||||||||||||
| GoReact (j) | Education Software | Delayed Draw Term Loan (3M USD TERM SOFR+7.50%), 13.59% Cash, 1/17/2025 | 1/18/2022 | $ | 1,000,750 | 1,000,750 | 997,848 | 0.3 | % | |||||||||||||
| Identity Automation Systems (h) | Education Software | Common Stock Class A-2 Units | 8/25/2014 | 232,616 | 232,616 | 218,168 | 0.1 | % | ||||||||||||||
| Identity Automation Systems (h) | Education Software | Common Stock Class A-1 Units | 3/6/2020 | 43,715 | 171,571 | 217,370 | 0.1 | % | ||||||||||||||
| Ready Education | Education Software | First Lien Term Loan (3M USD TERM SOFR+6.00%), 10.89% Cash, 8/5/2027 | 8/5/2022 | $ | 27,000,000 | 26,751,573 | 26,597,700 | 7.7 | % | |||||||||||||
| Total Education Software | 40,077,843 | 44,955,219 | 13.1 | % | ||||||||||||||||||
| TG Pressure Washing Holdings, LLC (h) | Facilities Maintenance | Preferred Equity | 8/12/2019 | 488,148 | 488,148 | 407,760 | 0.1 | % | ||||||||||||||
| Total Facilities Maintenance | 488,148 | 407,760 | 0.1 | % | ||||||||||||||||||
| Davisware, LLC | Field Service Management | First Lien Term Loan (3M USD TERM SOFR+7.00%), 11.89% Cash, 7/31/2024 | 9/6/2019 | $ | 6,000,000 | 5,972,735 | 5,988,000 | 1.7 | % | |||||||||||||
| Davisware, LLC | Field Service Management | Delayed Draw Term Loan (3M USD TERM SOFR+7.00%), 11.89% Cash, 7/31/2024 | 9/6/2019 | $ | 3,977,790 | 3,950,992 | 3,969,834 | 1.1 | % | |||||||||||||
| Total Field Service Management | 9,923,727 | 9,957,834 | 2.8 | % | ||||||||||||||||||
| B. Riley Financial, Inc. (a) | Financial Services | Senior Unsecured Loan 6.75% Cash, 5/31/2024 | 10/18/2022 | $ | 165,301 | 165,301 | 160,077 | 0.0 | % | |||||||||||||
| GDS Software Holdings, LLC | Financial Services | First Lien Term Loan (3M USD LIBOR+7.00%), 11.97% Cash, 12/30/2026 | 12/30/2021 | $ | 22,713,926 | 22,603,970 | 22,311,890 | 6.4 | % | |||||||||||||
| GDS Software Holdings, LLC | Financial Services | Delayed Draw Term Loan (3M USD LIBOR+7.00%), 11.97% Cash, 12/30/2026 | 12/30/2021 | $ | 3,286,074 | 3,257,297 | 3,227,910 | 0.9 | % | |||||||||||||
| GDS Software Holdings, LLC (h) | Financial Services | Common Stock Class A Units | 8/23/2018 | 250,000 | 250,000 | 518,413 | 0.1 | % | ||||||||||||||
| Total Financial Services | 26,276,568 | 26,218,290 | 7.4 | % | ||||||||||||||||||
| Ascend Software, LLC | Financial Services Software | First Lien Term Loan (3M USD LIBOR+7.50%), 12.47% Cash, 12/15/2026 | 12/15/2021 | $ | 6,000,000 | 5,952,354 | 5,902,200 | 1.7 | % | |||||||||||||
| Ascend Software, LLC (j) | Financial Services Software | Delayed Draw Term Loan (3M USD LIBOR+7.50%), 12.47% Cash, 12/15/2026 | 12/15/2021 | $ | 3,300,000 | 3,269,283 | 3,194,050 | 0.9 | % | |||||||||||||
| Total Financial Services Software | 9,221,637 | 9,096,250 | 2.6 | % | ||||||||||||||||||
| Axiom Parent Holdings, LLC (h) | Healthcare Services | Common Stock Class A Units | 6/19/2018 | $ | 400,000 | 400,000 | 1,286,156 | 0.4 | % | |||||||||||||
| ComForCare Health Care (d) | Healthcare Services | First Lien Term Loan (3M USD LIBOR+6.25%), 11.22% Cash, 1/31/2025 | 1/31/2017 | $ | 25,000,000 | 24,938,666 | 25,000,000 | 7.2 | % | |||||||||||||
| Total Healthcare Services | 25,338,666 | 26,286,156 | 7.6 | % | ||||||||||||||||||
Saratoga Investment Corp.
Consolidated Schedule of Investments
February 28, 20212023
| Company(1) | Industry | Investment Interest Rate/ Maturity | Original Acquisition Date | Principal/ Number of Shares | Cost | Fair Value (c) | % of Net Assets | |||||||||||||||
| GoReact | Education Software | First Lien Term Loan (3M USD LIBOR+7.50%), 9.50% Cash, 1/17/2025 | 1/17/2020 | $ | 5,000,000 | 4,940,297 | 5,100,000 | 1.7 | % | |||||||||||||
| GoReact (j) | Education Software | Delayed Draw Term Loan (3M USD LIBOR+7.50%), 9.50% Cash, 1/17/2025 | 1/17/2020 | $ | - | - | - | 0.0 | % | |||||||||||||
| Kev Software Inc. (a) | Education Software | First Lien Term Loan (1M USD LIBOR+8.63%), 9.63% Cash, 9/13/2023 | 9/13/2018 | $ | 17,835,914 | 17,745,629 | 18,021,407 | 5.9 | % | |||||||||||||
| Total Education Software | 86,010,523 | 88,090,337 | 28.9 | % | ||||||||||||||||||
| Davisware, LLC | Field Service Management | First Lien Term Loan (3M USD LIBOR+7.00%), 9.00% Cash, 7/31/2024 | 9/6/2019 | $ | 3,000,000 | 2,977,590 | 3,030,000 | 1.0 | % | |||||||||||||
| Davisware, LLC | Field Service Management | Delayed Draw Term Loan (3M USD LIBOR+7.00%), 9.00% Cash, 7/31/2024 | 9/6/2019 | $ | 977,790 | 974,399 | 987,568 | 0.3 | % | |||||||||||||
| Total Field Service Management | 3,951,989 | 4,017,568 | 1.3 | % | ||||||||||||||||||
| GDS Software Holdings, LLC (h) | Financial Services | Common Stock Class A Units | 8/23/2018 | 250,000 | 250,000 | 418,531 | 0.1 | % | ||||||||||||||
| Total Financial Services | 250,000 | 418,531 | 0.1 | % | ||||||||||||||||||
| Ohio Medical, LLC (h) | Healthcare Products Manufacturing | Common Stock | 1/15/2016 | 5,000 | 380,353 | 566,592 | 0.2 | % | ||||||||||||||
| Total Healthcare Products Manufacturing | 380,353 | 566,592 | 0.2 | % | ||||||||||||||||||
| Company(1) | Industry | Investment Interest Rate/ Maturity | Original Acquisition Date | Principal/ Number of Shares | Cost | Fair Value (c) | % of Net Assets | |||||||||||||||
| HemaTerra Holding Company, LLC (d) | Healthcare Software | First Lien Term Loan (1M USD TERM SOFR+8.25%), 12.91% Cash, 1/31/2027 | 4/15/2019 | $ | 55,483,943 | 55,105,372 | 55,445,104 | 16.0 | % | |||||||||||||
| HemaTerra Holding Company, LLC | Healthcare Software | Delayed Draw Term Loan (1M USD TERM SOFR+8.25%), 12.91% Cash, 1/31/2027 | 4/15/2019 | $ | 13,895,175 | 13,829,142 | 13,885,448 | 4.0 | % | |||||||||||||
| TRC HemaTerra, LLC (h) | Healthcare Software | Class D Membership Interests | 4/15/2019 | 2,487 | 2,816,693 | 4,606,741 | 1.3 | % | ||||||||||||||
| Procurement Partners, LLC | Healthcare Software | First Lien Term Loan (3M USD TERM SOFR+6.50%), 11.39% Cash, 5/12/2026 | 11/12/2020 | $ | 35,125,000 | 34,906,981 | 35,103,925 | 10.1 | % | |||||||||||||
| Procurement Partners, LLC (j) | Healthcare Software | Delayed Draw Term Loan (3M USD TERM SOFR+6.50%), 11.39% Cash, 5/12/2026 | 11/12/2020 | $ | 9,300,000 | 9,219,412 | 9,294,420 | 2.7 | % | |||||||||||||
| Procurement Partners Holdings LLC (h) | Healthcare Software | Class A Units | 11/12/2020 | 571,219 | 571,219 | 788,283 | 0.2 | % | ||||||||||||||
| Total Healthcare Software | 116,448,819 | 119,123,921 | 34.3 | % | ||||||||||||||||||
| Roscoe Medical, Inc. (h) | Healthcare Supply | Common Stock | 3/26/2014 | 5,081 | 508,077 | - | 0.0 | % | ||||||||||||||
| Total Healthcare Supply | 508,077 | - | 0.0 | % | ||||||||||||||||||
| Book4Time, Inc. (a), (d) | Hospitality/Hotel | First Lien Term Loan (3M USD LIBOR+7.50%), 12.47%, 12/22/2025 | 12/22/2020 | $ | 3,136,517 | 3,116,896 | 3,136,517 | 0.9 | % | |||||||||||||
| Book4Time, Inc. (a) | Hospitality/Hotel | Delayed Draw Term Loan (3M USD LIBOR+7.50%), 12.47%, 12/22/2025 | 12/22/2020 | $ | 2,000,000 | 1,984,212 | 2,000,000 | 0.6 | % | |||||||||||||
| Book4Time, Inc. (a), (h), (i) | Hospitality/Hotel | Class A Preferred Shares | 12/22/2020 | 200,000 | 156,826 | 281,778 | 0.1 | % | ||||||||||||||
| Knowland Group, LLC (h), (k) | Hospitality/Hotel | Second Lien Term Loan (3M USD LIBOR+8.00%), 13.97% Cash/1.00% PIK, 5/9/2024 | 11/9/2018 | $ | 15,878,989 | 15,878,989 | 9,760,821 | 2.8 | % | |||||||||||||
| Sceptre Hospitality Resources, LLC | Hospitality/Hotel | First Lien Term Loan (3M USD TERM SOFR+7.25%), 12.14% Cash, 11/15/2027 | 4/27/2020 | $ | 23,000,000 | 22,806,316 | 22,793,000 | 6.6 | % | |||||||||||||
| Sceptre Hospitality Resources, LLC (j) | Hospitality/Hotel | Delayed Draw Term Loan (3M USD TERM SOFR+7.25%), 12.14% Cash, 11/15/2027 | 9/2/2021 | $ | - | - | - | 0.0 | % | |||||||||||||
| Total Hospitality/Hotel | 43,943,239 | 37,972,116 | 11.0 | % | ||||||||||||||||||
| Granite Comfort, LP (d) | HVAC Services and Sales | First Lien Term Loan (3M USD TERM SOFR+7.86%), 12.75% Cash, 11/16/2025 | 11/16/2020 | $ | 43,000,000 | 42,694,831 | 42,570,000 | 12.3 | % | |||||||||||||
| Granite Comfort, LP (j) | HVAC Services and Sales | Delayed Draw Term Loan (3M USD TERM SOFR+7.86%), 12.75% Cash, 11/16/2025 | 11/16/2020 | $ | 12,000,000 | 11,894,177 | 11,880,000 | 3.4 | % | |||||||||||||
| Total HVAC Services and Sales | 54,589,008 | 54,450,000 | 15.7 | % | ||||||||||||||||||
| Vector Controls Holding Co., LLC (d) | Industrial Products | First Lien Term Loan (3M USD LIBOR+6.50%), 11.47% Cash, 3/6/2025 | 3/6/2013 | $ | 3,089,986 | 3,089,986 | 3,089,986 | 0.9 | % | |||||||||||||
| Vector Controls Holding Co., LLC (h) | Industrial Products | Warrants to Purchase Limited Liability Company Interests, Expires 11/30/2027 | 5/31/2015 | 343 | - | 6,517,923 | 1.9 | % | ||||||||||||||
| Total Industrial Products | 3,089,986 | 9,607,909 | 2.8 | % | ||||||||||||||||||
Saratoga Investment Corp.
Consolidated Schedule of Investments
February 28, 20212023
| Company(1) | Industry | Investment Interest Rate/ Maturity | Original Acquisition Date | Principal/ Number of Shares | Cost | Fair Value (c) | % of Net Assets | |||||||||||||||
| Axiom Parent Holdings, LLC (h) | Healthcare Services | Common Stock Class A Units | 6/19/2018 | 400,000 | 400,000 | 1,415,301 | 0.5 | % | ||||||||||||||
| Axiom Purchaser, Inc. (d) | Healthcare Services | First Lien Term Loan (3M USD LIBOR+6.00%), 7.75% Cash, 6/19/2023 | 6/19/2018 | $ | 10,000,000 | 9,955,177 | 10,059,000 | 3.3 | % | |||||||||||||
| Axiom Purchaser, Inc. (d) | Healthcare Services | Delayed Draw Term Loan (3M USD LIBOR+6.00%), 7.75% Cash, 6/19/2023 | 6/19/2018 | $ | 6,000,000 | 5,961,748 | 6,035,400 | 2.0 | % | |||||||||||||
| ComForCare Health Care | Healthcare Services | First Lien Term Loan (3M USD LIBOR+7.75%), 8.75% Cash, 1/31/2025 | 1/31/2017 | $ | 25,000,000 | 24,871,639 | 24,900,000 | 8.2 | % | |||||||||||||
| Total Healthcare Services | 41,188,564 | 42,409,701 | 14.0 | % | ||||||||||||||||||
| TRC HemaTerra, LLC (h) | Healthcare Software | Class D Membership Interests | 4/15/2019 | 2,000,000 | 2,000,000 | 2,572,002 | 0.8 | % | ||||||||||||||
| HemaTerra Holding Company, LLC | Healthcare Software | First Lien Term Loan (3M USD LIBOR+6.75%), 9.25% Cash, 4/15/2024 | 4/15/2019 | $ | 6,000,000 | 5,956,593 | 6,060,000 | 2.0 | % | |||||||||||||
| HemaTerra Holding Company, LLC (d), (j) | Healthcare Software | Delayed Draw Term Loan (3M USD LIBOR+6.75%), 9.25% Cash, 4/15/2024 | 4/15/2019 | $ | 12,000,000 | 11,914,035 | 12,120,000 | 4.0 | % | |||||||||||||
| Procurement Partners, LLC | Healthcare Software | First Lien Term Loan (3M USD LIBOR+6.50%), 7.50% Cash, 11/12/2025 | 11/12/2020 | $ | 8,000,000 | 7,924,230 | 7,920,000 | 2.6 | % | |||||||||||||
| Procurement Partners, LLC (j) | Healthcare Software | Delayed Draw Term Loan (3M USD LIBOR+6.50%), 7.50% Cash, 11/12/2025 | 11/12/2020 | $ | - | - | - | 0.0 | % | |||||||||||||
| Procurement Partners Holdings LLC (h) | Healthcare Software | Class A Units | 11/12/2020 | 300,000 | 300,000 | 300,000 | 0.1 | % | ||||||||||||||
| Total Healthcare Software | 28,094,858 | 28,972,002 | 9.5 | % | ||||||||||||||||||
| Roscoe Medical, Inc. (d), (h) | Healthcare Supply | Common Stock | 3/26/2014 | 5,081 | 508,077 | 280,346 | 0.1 | % | ||||||||||||||
| Roscoe Medical, Inc. | Healthcare Supply | Second Lien Term Loan 11.25% Cash, 6/28/2021 | 3/26/2014 | $ | 5,141,413 | 5,141,413 | 5,141,413 | 1.7 | % | |||||||||||||
| Total Healthcare Supply | 5,649,490 | 5,421,759 | 1.8 | % | ||||||||||||||||||
| Company(1) | Industry | Investment Interest Rate/ Maturity | Original Acquisition Date | Principal/ Number of Shares | Cost | Fair Value (c) | % of Net Assets | |||||||||||||||
| AgencyBloc, LLC | Insurance Software | First Lien Term Loan (1M USD BSBY+8.00%), 12.58% Cash, 10/1/2026 | 10/1/2021 | $ | 13,469,318 | 13,376,121 | 13,449,114 | 3.9 | % | |||||||||||||
| Panther ParentCo LLC (h) | Insurance Software | Class A Units | 10/1/2021 | 2,500,000 | 2,500,000 | 3,311,442 | 1.0 | % | ||||||||||||||
| Total Insurance Software | 15,876,121 | 16,760,556 | 4.9 | % | ||||||||||||||||||
| LogicMonitor, Inc. (d) | IT Services | First Lien Term Loan (3M USD TERM SOFR+6.50%), 11.39% Cash, 5/17/2026 | 3/20/2020 | $ | 43,000,000 | 42,953,087 | 43,000,000 | 12.4 | % | |||||||||||||
| Total IT Services | 42,953,087 | 43,000,000 | 12.4 | % | ||||||||||||||||||
| ActiveProspect, Inc. (d) | Lead Management Software | First Lien Term Loan (3M USD LIBOR+6.00%), 10.97% Cash, 8/8/2027 | 8/8/2022 | $ | 12,000,000 | 11,906,362 | 12,090,000 | 3.5 | % | |||||||||||||
| ActiveProspect, Inc. (j) | Lead Management Software | Delayed Draw Term Loan (3M USD LIBOR+6.00%), 10.97% Cash, 8/8/2027 | 8/8/2022 | $ | - | - | - | 0.0 | % | |||||||||||||
| Total Lead Management Software | 11,906,362 | 12,090,000 | 3.5 | % | ||||||||||||||||||
| Centerbase, LLC | Legal Software | First Lien Term Loan (1M USD TERM SOFR+7.75%), 12.41% Cash, 1/18/2027 | 1/18/2022 | $ | 21,247,440 | 21,055,931 | 20,699,256 | 6.0 | % | |||||||||||||
| Total Legal Software | 21,055,931 | 20,699,256 | 6.0 | % | ||||||||||||||||||
| Madison Logic, Inc. (d) | Marketing Orchestration Software | First Lien Term Loan (3M USD TERM SOFR+7.00%), 11.89% Cash, 12/30/2028 | 12/10/2021 | $ | 19,000,000 | 18,626,777 | 18,715,000 | 5.4 | % | |||||||||||||
| Total Marketing Orchestration Software | 18,626,777 | 18,715,000 | 5.4 | % | ||||||||||||||||||
| ARC Health OpCo LLC (d) | Mental Healthcare Services | First Lien Term Loan (3M USD TERM SOFR+8.48%), 13.37% Cash, 8/5/2027 | 8/5/2022 | $ | 6,500,000 | 6,427,296 | 6,461,000 | 1.9 | % | |||||||||||||
| ARC Health OpCo LLC (d), (j) | Mental Healthcare Services | Delayed Draw Term Loan (3M USD TERM SOFR+8.48%), 13.37% Cash, 8/5/2027 | 8/5/2022 | $ | 7,726,978 | 7,634,711 | 7,680,616 | 2.2 | % | |||||||||||||
| ARC Health OpCo LLC (h) | Mental Healthcare Services | Class A Preferred Shares | 8/5/2022 | 2,808,236 | 3,035,108 | 2,780,153 | 0.8 | % | ||||||||||||||
| Total Mental Healthcare Services | 17,097,115 | 16,921,769 | 4.9 | % | ||||||||||||||||||
| Chronus LLC | Mentoring Software | First Lien Term Loan (3M USD LIBOR+5.25), 10.22% Cash, 8/26/2026 | 8/26/2021 | $ | 15,000,000 | 14,887,780 | 14,890,500 | 4.3 | % | |||||||||||||
| Chronus LLC | Mentoring Software | First Lien Term Loan (3M USD LIBOR+6.00), 10.97% Cash, 8/26/2026 | 8/26/2021 | $ | 3,000,000 | 2,973,634 | 2,978,100 | 0.9 | % | |||||||||||||
| Chronus LLC (h) | Mentoring Software | Series A Preferred Stock | 8/26/2021 | 3,000 | 3,000,000 | 3,490,403 | 1.0 | % | ||||||||||||||
| Total Mentoring Software | 20,861,414 | 21,359,003 | 6.2 | % | ||||||||||||||||||
| Omatic Software, LLC | Non-profit Services | First Lien Term Loan (3M USD TERM SOFR+8.00%), 14.15% Cash/1.00% PIK, 1/31/2024 | 5/29/2018 | $ | 13,122,781 | 13,091,197 | 13,095,223 | 3.8 | % | |||||||||||||
| Total Non-profit Services | 13,091,197 | 13,095,223 | 3.8 | % | ||||||||||||||||||
| Emily Street Enterprises, L.L.C. | Office Supplies | Senior Secured Note (3M USD TERM SOFR+7.50%), 12.39% Cash, 12/31/2025 | 12/28/2012 | $ | 6,000,000 | 5,974,379 | 5,965,800 | 1.7 | % | |||||||||||||
| Emily Street Enterprises, L.L.C. (h) | Office Supplies | Warrant Membership Interests, Expires 12/31/2025 | 12/28/2012 | 49,318 | 400,000 | 406,755 | 0.1 | % | ||||||||||||||
| Total Office Supplies | 6,374,379 | 6,372,555 | 1.8 | % | ||||||||||||||||||
Saratoga Investment Corp.
Consolidated Schedule of Investments
February 28, 20212023
| Company(1) | Industry | Investment Interest Rate/ Maturity | Original Acquisition Date | Principal/ Number of Shares | Cost | Fair Value (c) | % of Net Assets | |||||||||||||||
| Book4Time, Inc. (a) | Hospitality/Hotel | First Lien Term Loan (3M USD LIBOR+8.50%), 10.25%, 12/22/2025 | 12/22/2020 | $ | 3,136,517 | 3,105,788 | 3,105,152 | 1.0 | % | |||||||||||||
| Book4Time, Inc. (a), (j) | Hospitality/Hotel | Delayed Draw Term Loan (3M USD LIBOR+8.50%), 10.25%, 12/22/2025 | 12/22/2020 | $ | - | - | - | 0.0 | % | |||||||||||||
| Book4Time, Inc. (a), (i) | Hospitality/Hotel | Class A Preferred Shares | 12/22/2020 | 200,000 | 156,826 | 156,826 | 0.1 | % | ||||||||||||||
| Knowland Group, LLC | Hospitality/Hotel | Second Lien Term Loan (3M USD LIBOR+8.00%), 10.00% Cash, 5/9/2024 | 11/9/2018 | $ | 15,767,918 | 15,767,918 | 10,788,409 | 3.5 | % | |||||||||||||
| Sceptre Hospitality Resources, LLC | Hospitality/Hotel | First Lien Term Loan (1M USD LIBOR+9.00%), 10.00% Cash, 4/27/2025 | 4/27/2020 | $ | 3,000,000 | 2,973,387 | 3,030,000 | 1.0 | % | |||||||||||||
| Total Hospitality/Hotel | 22,003,919 | 17,080,387 | 5.6 | % | ||||||||||||||||||
| Granite Comfort, LP | HVAC Services and Sales | First Lien Term Loan (1M USD LIBOR+9.00%), 10.00% Cash, 11/16/2025 | 11/16/2020 | $ | 7,000,000 | 6,932,689 | 6,950,300 | 2.3 | % | |||||||||||||
| Granite Comfort, LP | HVAC Services and Sales | Delayed Draw Term Loan (1M USD LIBOR+9.00%), 10.00% Cash, 11/16/2025 | 11/16/2020 | $ | 8,000,000 | 7,922,181 | 7,943,200 | 2.6 | % | |||||||||||||
| Total HVAC Services and Sales | 14,854,870 | 14,893,500 | 4.9 | % | ||||||||||||||||||
| Vector Controls Holding Co., LLC (d) | Industrial Products | First Lien Term Loan 11.50% (9.75% Cash/1.75% PIK), 3/6/2022 | 3/6/2013 | $ | 7,021,046 | 7,021,046 | 7,021,046 | 2.3 | % | |||||||||||||
| Vector Controls Holding Co., LLC (d), (h) | Industrial Products | Warrants to Purchase Limited Liability Company Interests, Expires 11/30/2027 | 5/31/2015 | 343 | - | 2,025,598 | 0.7 | % | ||||||||||||||
| Total Industrial Products | 7,021,046 | 9,046,644 | 3.0 | % | ||||||||||||||||||
| Company(1) | Industry | Investment Interest Rate/ Maturity | Original Acquisition Date | Principal/ Number of Shares | Cost | Fair Value (c) | % of Net Assets | |||||||||||||||
| Buildout, Inc. | Real Estate Services | First Lien Term Loan (3M USD LIBOR+7.00%), 11.97% Cash, 7/9/2025 | 7/9/2020 | $ | 14,000,000 | 13,924,435 | 13,855,800 | 4.0 | % | |||||||||||||
| Buildout, Inc. | Real Estate Services | Delayed Draw Term Loan (3M USD LIBOR+7.00%), 11.97% Cash, 7/9/2025 | 2/12/2021 | $ | 38,500,000 | 38,257,589 | 38,103,450 | 11.0 | % | |||||||||||||
| Buildout, Inc. (h), (i) | Real Estate Services | Limited Partner Interests | 7/9/2020 | 1,250 | 1,372,557 | 1,447,219 | 0.4 | % | ||||||||||||||
| Total Real Estate Services | 53,554,581 | 53,406,469 | 15.4 | % | ||||||||||||||||||
| Archimedes Parent LLC (h) | Research Software | Class A Common Units | 6/27/2022 | 1,125,160 | 1,125,160 | 1,136,503 | 0.3 | % | ||||||||||||||
| Wellspring Worldwide Inc. | Research Software | First Lien Term Loan (1M USD BSBY+7.25%), 11.83% Cash, 6/27/2027 | 6/27/2022 | $ | 9,600,000 | 9,503,123 | 9,540,480 | 2.7 | % | |||||||||||||
| Total Research Software | 10,628,283 | 10,676,983 | 3.0 | % | ||||||||||||||||||
| LFR Chicken LLC | Restaurant | First Lien Term Loan (1M USD LIBOR+7.00%), 11.67% Cash, 11/19/2026 | 11/19/2021 | $ | 12,000,000 | 11,906,864 | 11,866,800 | 3.4 | % | |||||||||||||
| LFR Chicken LLC (j) | Restaurant | Delayed Draw Term Loan (1M USD LIBOR+7.00%), 11.67% Cash, 11/19/2026 | 11/19/2021 | $ | 9,000,000 | 8,927,326 | 8,900,100 | 2.6 | % | |||||||||||||
| LFR Chicken LLC (h) | Restaurant | Series B Preferred Units | 11/19/2021 | 497,183 | 1,000,000 | 1,177,373 | 0.3 | % | ||||||||||||||
| TMAC Acquisition Co., LLC | Restaurant | Unsecured Term Loan 8.00% PIK, 3/1/2024 | 3/1/2018 | $ | 3,217,657 | 3,217,657 | 2,881,888 | 0.8 | % | |||||||||||||
| Total Restaurant | 25,051,847 | 24,826,161 | 7.1 | % | ||||||||||||||||||
| Pepper Palace, Inc. (d) | Specialty Food Retailer | First Lien Term Loan (3M USD LIBOR+6.25%), 11.22% Cash, 6/30/2026 | 6/30/2021 | $ | 33,490,000 | 33,255,863 | 24,410,861 | 7.0 | % | |||||||||||||
| Pepper Palace, Inc. (j) | Specialty Food Retailer | Delayed Draw Term Loan (3M USD LIBOR+6.25%), 11.22% Cash, 6/30/2026 | 6/30/2021 | $ | - | - | - | 0.0 | % | |||||||||||||
| Pepper Palace, Inc. (j) | Specialty Food Retailer | Revolving Credit Facility (3M USD LIBOR+6.25%), 11.22% Cash, 6/30/2026 | 6/30/2021 | $ | - | - | - | 0.0 | % | |||||||||||||
| Pepper Palace, Inc. (h) | Specialty Food Retailer | Membership Interest | 6/30/2021 | 1,000,000 | 1,000,000 | - | 0.0 | % | ||||||||||||||
| Total Specialty Food Retailer | 34,255,863 | 24,410,861 | 7.0 | % | ||||||||||||||||||
Saratoga Investment Corp.
Consolidated Schedule of Investments
February 28, 20212023
| Company(1) | Industry | Investment Interest Rate/ Maturity | Original Acquisition Date | Principal/ Number of Shares | Cost | Fair Value (c) | % of Net Assets | |||||||||||||||
| CLEO Communications Holding, LLC (d) | IT Services | First Lien Term Loan (3M USD LIBOR+8.00%), 9.00% Cash/2.00% PIK, 3/31/2022 | 3/31/2017 | $ | 14,073,964 | 14,064,807 | 14,176,704 | 4.7 | % | |||||||||||||
| CLEO Communications Holding, LLC (d), (j) | IT Services | Delayed Draw Term Loan (3M USD LIBOR+8.00%), 9.00% Cash/2.00% PIK, 3/31/2022 | 3/31/2017 | $ | 20,451,756 | 20,388,504 | 20,601,054 | 6.8 | % | |||||||||||||
| LogicMonitor, Inc. | IT Services | First Lien Term Loan (3M USD LIBOR+5.00), 6.00% Cash, 5/17/2023 | 3/20/2020 | $ | 23,000,000 | 22,865,749 | 23,089,700 | 7.6 | % | |||||||||||||
| Total IT Services | 57,319,060 | 57,867,458 | 19.1 | % | ||||||||||||||||||
| inMotionNow, Inc. | Marketing Services | First Lien Term Loan (3M USD LIBOR+7.50), 10.00% Cash, 5/15/2024 | 5/15/2019 | $ | 12,200,000 | 12,116,232 | 12,322,000 | 4.1 | % | |||||||||||||
| inMotionNow, Inc. | Marketing Services | Delayed Draw Term Loan (3M USD LIBOR+7.50) 10.00% Cash, 5/15/2024 | 5/15/2019 | $ | 5,000,000 | 4,960,820 | 5,050,000 | 1.7 | % | |||||||||||||
| Total Marketing Services | 17,077,052 | 17,372,000 | 5.8 | % | ||||||||||||||||||
| Omatic Software, LLC | Non-profit Services | First Lien Term Loan (3M USD LIBOR+8.00%), 9.75% Cash, 5/29/2023 | 5/29/2018 | $ | 5,500,000 | 5,470,787 | 5,554,450 | 1.8 | % | |||||||||||||
| Total Non-profit Services | 5,470,787 | 5,554,450 | 1.8 | % | ||||||||||||||||||
| Emily Street Enterprises, L.L.C. | Office Supplies | Senior Secured Note (3M USD LIBOR+8.50%), 10.00% Cash, 12/31/2023 | 12/28/2012 | $ | 3,300,000 | 3,300,000 | 3,287,460 | 1.1 | % | |||||||||||||
| Emily Street Enterprises, L.L.C. (h) | Office Supplies | Warrant Membership Interests Expires 12/28/2022 | 12/28/2012 | 49,318 | 400,000 | 322,853 | 0.1 | % | ||||||||||||||
| Total Office Supplies | 3,700,000 | 3,610,313 | 1.2 | % | ||||||||||||||||||
| Apex Holdings Software Technologies, LLC | Payroll Services | First Lien Term Loan (3M USD LIBOR+8.00%), 9.00% Cash, 9/21/2024 | 9/21/2016 | $ | 18,000,000 | 17,981,413 | 17,368,200 | 5.7 | % | |||||||||||||
| Apex Holdings Software Technologies, LLC | Payroll Services | Delayed Draw Term Loan (3M USD LIBOR+8.00%), 9.00% Cash, 9/21/2024 | 10/1/2018 | $ | 1,000,000 | 994,557 | 964,900 | 0.3 | % | |||||||||||||
| Total Payroll Services | 18,975,970 | 18,333,100 | 6.0 | % | ||||||||||||||||||
| Village Realty Holdings LLC | Property Management | First Lien Term Loan (3M USD LIBOR+6.50%), 8.75% Cash, 10/8/2024 | 10/8/2019 | $ | 7,250,000 | 7,189,591 | 7,395,000 | 2.4 | % | |||||||||||||
| Village Realty Holdings LLC (j) | Property Management | Delayed Draw Term Loan (3M USD LIBOR+6.50%), 8.75% Cash, 10/8/2024 | 10/8/2019 | $ | 4,876,322 | 4,838,617 | 4,973,850 | 1.6 | % | |||||||||||||
| V Rental Holdings LLC (h) | Property Management | Class A-1 Membership Units | 10/8/2019 | 122,578 | 365,914 | 2,208,681 | 0.7 | % | ||||||||||||||
| Total Property Management | 12,394,122 | 14,577,531 | 4.7 | % | ||||||||||||||||||
| Company(1) | Industry | Investment Interest Rate/ Maturity | Original Acquisition Date | Principal/ Number of Shares | Cost | Fair Value (c) | % of Net Assets | |||||||||||||||
| ArbiterSports, LLC (d) | Sports Management | First Lien Term Loan (3M USD LIBOR+6.50%), 11.47% Cash, 2/21/2025 | 2/21/2020 | $ | 26,000,000 | 25,894,505 | 25,721,800 | 7.4 | % | |||||||||||||
| ArbiterSports, LLC | Sports Management | Delayed Draw Term Loan (3M USD LIBOR+6.50%), 11.47% Cash, 2/21/2025 | 2/21/2020 | $ | 1,000,000 | 1,000,000 | 989,300 | 0.3 | % | |||||||||||||
| Total Sports Management | 26,894,505 | 26,711,100 | 7.7 | % | ||||||||||||||||||
| Avionte Holdings, LLC (h) | Staffing Services | Class A Units | 1/8/2014 | 100,000 | 100,000 | 2,079,325 | 0.6 | % | ||||||||||||||
| Total Staffing Services | 100,000 | 2,079,325 | 0.6 | % | ||||||||||||||||||
| JDXpert | Talent Acquisition Software | First Lien Term Loan (3M USD LIBOR+8.50%), 13.47% Cash, 5/2/2027 | 5/2/2022 | $ | 6,000,000 | 5,947,780 | 6,045,000 | 1.7 | % | |||||||||||||
| JDXpert (j) | Talent Acquisition Software | Delayed Draw Term Loan (3M USD LIBOR+8.50%), 13.47% Cash, 5/2/2027 | 5/2/2022 | $ | - | - | - | 0.0 | % | |||||||||||||
| Jobvite, Inc. (d) | Talent Acquisition Software | First Lien Term Loan (3M USD TERM SOFR+8.00%), 12.89% Cash, 8/5/2028 | 8/5/2022 | $ | 20,000,000 | 19,857,613 | 19,954,000 | 5.8 | % | |||||||||||||
| Total Talent Acquisition Software | 25,805,393 | 25,999,000 | 7.5 | % | ||||||||||||||||||
| Sub Total Non-control/Non-affiliate investments | 819,966,208 | 828,028,800 | 238.6 | % | ||||||||||||||||||
Saratoga Investment Corp.
Consolidated Schedule of Investments
February 28, 20212023
| Company(1) | Industry | Investment Interest Rate/ Maturity | Original Acquisition Date | Principal/ Number of Shares | Cost | Fair Value (c) | % of Net Assets | |||||||||||||||
| Buildout, Inc. | Real Estate Services | First Lien Term Loan (3M USD LIBOR+7.75%), 9.25% Cash, 7/9/2025 | 7/9/2020 | $ | 14,000,000 | 13,873,317 | 13,952,400 | 4.6 | % | |||||||||||||
| Buildout, Inc. | Real Estate Services | Delayed Draw Term Loan (3M USD LIBOR+7.75%), 9.25% Cash, 7/9/2025 | 2/12/2021 | $ | 3,000,000 | 2,970,361 | 2,989,800 | 1.0 | % | |||||||||||||
| Buildout, Inc. (h), (i) | Real Estate Services | Limited Partner Interests | 7/9/2020 | 1,071 | 1,071,301 | 1,090,002 | 0.4 | % | ||||||||||||||
| Total Real Estate Services | 17,914,979 | 18,032,202 | 6.0 | % | ||||||||||||||||||
| TMAC Acquisition Co., LLC (k) | Restaurant | Unsecured Term Loan 8.00% PIK, 9/01/2023 | 3/1/2018 | $ | 2,261,017 | 2,261,017 | 2,140,911 | 0.7 | % | |||||||||||||
| Total Restaurant | 2,261,017 | 2,140,911 | 0.7 | % | ||||||||||||||||||
| ArbiterSports, LLC (d) | Sports Management | First Lien Term Loan (3M USD LIBOR+6.50%), 8.25% Cash, 2/21/2025 | 2/21/2020 | $ | 26,000,000 | 25,800,743 | 24,525,800 | 8.1 | % | |||||||||||||
| ArbiterSports, LLC (d) | Sports Management | Delayed Draw Term Loan (3M USD LIBOR+6.50%), 8.25% Cash, 2/21/2025 | 2/21/2020 | $ | 1,000,000 | 1,000,000 | 943,300 | 0.3 | % | |||||||||||||
| Total Sports Management | 26,800,743 | 25,469,100 | 8.4 | % | ||||||||||||||||||
| Avionte Holdings, LLC (h) | Staffing Services | Class A Units | 1/8/2014 | 100,000 | 100,000 | 924,509 | 0.3 | % | ||||||||||||||
| Total Staffing Services | 100,000 | 924,509 | 0.3 | % | ||||||||||||||||||
| National Waste Partners (d) | Waste Services | Second Lien Term Loan 10.00% Cash, 2/13/2022 | 2/13/2017 | $ | 9,000,000 | 8,981,436 | 9,000,000 | 3.0 | % | |||||||||||||
| Total Waste Services | 8,981,436 | 9,000,000 | 3.0 | % | ||||||||||||||||||
| Sub Total Non-control/Non-affiliate investments | 471,328,212 | 469,946,494 | 154.5 | % | ||||||||||||||||||
| Company(1) | Industry | Investment Interest Rate/ Maturity | Original Acquisition Date | Principal/ Number of Shares | Cost | Fair Value (c) | % of Net Assets | |||||||||||||||
| Affiliate investments - 6.4% (b) | ||||||||||||||||||||||
| GreyHeller LLC (f) | Cyber Security | First Lien Term Loan (3M USD LIBOR+11.00%), 12.00% Cash, 12/31/2025 | 11/17/2016 | $ | 7,000,000 | 6,988,549 | 7,000,000 | 2.3 | % | |||||||||||||
| GreyHeller LLC (d), (f), (j) | Cyber Security | Delayed Draw Term Loan (3M USD LIBOR+11.00%), 12.00% Cash, 12/31/2025 | 10/19/2020 | $ | 2,250,000 | 2,233,173 | 2,250,000 | 0.7 | % | |||||||||||||
| GreyHeller LLC (f), (h) | Cyber Security | Series A Preferred Units | 11/17/2016 | 850,000 | 850,000 | 3,924,291 | 1.3 | % | ||||||||||||||
| Total Cyber Security | 10,071,722 | 13,174,291 | 4.3 | % | ||||||||||||||||||
| Top Gun Pressure Washing, LLC (f) | Facilities Maintenance | First Lien Term Loan (3M USD LIBOR+7.00%), 9.50% Cash, 8/12/2024 | 8/12/2019 | $ | 5,000,000 | 4,961,639 | 4,491,500 | 1.5 | % | |||||||||||||
| Top Gun Pressure Washing, LLC (f), (j) | Facilities Maintenance | Delayed Draw Term Loan (3M USD LIBOR+7.00%), 9.50% Cash, 8/12/2024 | 8/12/2019 | $ | 1,825,000 | 1,810,198 | 1,639,397 | 0.6 | % | |||||||||||||
| TG Pressure Washing Holdings, LLC (f), (h) | Facilities Maintenance | Preferred Equity | 8/12/2019 | 488,148 | 488,148 | 62,552 | 0.0 | % | ||||||||||||||
| Total Facilities Maintenance | 7,259,985 | 6,193,449 | 2.1 | % | ||||||||||||||||||
| Sub Total Affiliate investments | 17,331,707 | 19,367,740 | 6.4 | % | ||||||||||||||||||
| Company(1) | Industry | Investment Interest Rate/ Maturity | Original Acquisition Date | Principal/ Number of Shares | Cost | Fair Value (c) | % of Net Assets | |||||||||||||||
| Affiliate investments - 8.1% (b) | ||||||||||||||||||||||
| ETU Holdings, Inc. (f) | Corporate Education Software | First Lien Term Loan (3M USD LIBOR+9.00%), 13.97% Cash, 8/18/2027 | 8/18/2022 | $ | 7,000,000 | 6,935,556 | 7,006,300 | 2.0 | % | |||||||||||||
| ETU Holdings, Inc. (f) | Corporate Education Software | Second Lien Term Loan 15.00% PIK, 2/18/2028 | 8/18/2022 | $ | 5,282,563 | 5,235,433 | 5,175,327 | 1.5 | % | |||||||||||||
| ETU Holdings, Inc. (f), (h) | Corporate Education Software | Series A-1 Preferred Stock | 8/18/2022 | 3,000,000 | 3,000,000 | 3,072,504 | 0.9 | % | ||||||||||||||
| Total Corporate Education Software | 15,170,989 | 15,254,131 | 4.4 | % | ||||||||||||||||||
| Axero Holdings, LLC (f) | Employee Collaboration Software | First Lien Term Loan (3M USD TERM SOFR+8.00%), 13.04% Cash, 6/30/2026 | 6/30/2021 | $ | 5,500,000 | 5,460,448 | 5,513,200 | 1.6 | % | |||||||||||||
| Axero Holdings, LLC (f) | Employee Collaboration Software | Delayed Draw Term Loan (3M USD TERM SOFR+8.00%), 13.04% Cash, 6/30/2026 | 6/30/2021 | $ | 1,100,000 | 1,090,883 | 1,102,640 | 0.3 | % | |||||||||||||
| Axero Holdings, LLC (f), (j) | Employee Collaboration Software | Revolving Credit Facility (3M USD TERM SOFR+8.00%), 13.04% Cash, 6/30/2026 | 2/3/2022 | $ | - | - | - | 0.0 | % | |||||||||||||
| Axero Holdings, LLC (f), (h) | Employee Collaboration Software | Series A Preferred Units | 6/30/2021 | 2,000,000 | 2,000,000 | 2,498,000 | 0.7 | % | ||||||||||||||
| Axero Holdings, LLC (f), (h) | Employee Collaboration Software | Series B Preferred Units | 6/30/2021 | 2,000,000 | 2,000,000 | 3,937,900 | 1.1 | % | ||||||||||||||
| Total Employee Collaboration Software | 10,551,331 | 13,051,740 | 3.7 | % | ||||||||||||||||||
| Sub Total Affiliate investments | 25,722,320 | 28,305,871 | 8.1 | % | ||||||||||||||||||
Saratoga Investment Corp.
Consolidated Schedule of Investments
February 28, 20212023
| Company(1) | Industry | Investment Interest Rate/ Maturity | Original Acquisition Date | Principal/ Number of Shares | Cost | Fair Value (c) | % of Net Assets | |||||||||||||||
| Control investments - 21.4% (b) | ||||||||||||||||||||||
| Netreo Holdings, LLC (g) | IT Services | First Lien Term Loan (3M USD LIBOR +6.25%), 9.00% Cash/2.75% PIK, 12/31/2025 | 7/3/2018 | $ | 5,296,555 | 5,268,156 | 5,349,521 | 1.8 | % | |||||||||||||
| Netreo Holdings, LLC (g), (j) | IT Services | Delayed Draw Term Loan (3M USD LIBOR +6.25%), 9.00% Cash/2.75% PIK, 12/31/2020 | 5/26/2020 | $ | 1,223,203 | 1,213,962 | 1,235,435 | 0.4 | % | |||||||||||||
| Netreo Holdings, LLC (g), (h) | IT Services | Common Stock Class A Unit | 7/3/2018 | 3,150,000 | 3,150,000 | 8,634,768 | 2.8 | % | ||||||||||||||
| Total IT Services | 9,632,118 | 15,219,724 | 5.0 | % | ||||||||||||||||||
| Saratoga Investment Corp. CLO 2013-1, Ltd. (a), (e), (g) | Structured Finance Securities | Other/Structured Finance Securities 11.72%, 1/20/2030 | 1/22/2008 | $ | 111,000,000 | 33,846,643 | 31,449,732 | 10.3 | % | |||||||||||||
| Saratoga Investment Corp. CLO 2013-1, Ltd. Class F-R-3 Note (a), (g) | Structured Finance Securities | Other/Structured Finance Securities (3M USD LIBOR+10.00%), 10.19%, 4/20/2033 | 2/26/2021 | $ | 17,875,000 | 17,875,000 | 18,329,025 | 6.1 | % | |||||||||||||
| Total Structured Finance Securities | 51,721,643 | 49,778,757 | 16.4 | % | ||||||||||||||||||
| Sub Total Control investments | 61,353,761 | 64,998,481 | 21.4 | % | ||||||||||||||||||
| TOTAL INVESTMENTS - 182.2% (b) | $ | 550,013,680 | $ | 554,312,715 | 182.2 | % | ||||||||||||||||
| Company(1) | Industry | Investment Interest Rate/ Maturity | Original Acquisition Date | Principal/ Number of Shares | Cost | Fair Value (c) | % of Net Assets | |||||||||||||||
| Control investments - 33.6% (b) | ||||||||||||||||||||||
| Netreo Holdings, LLC (g) | IT Services | First Lien Term Loan (3M USD LIBOR +6.50%), 13.47% Cash/2.00% PIK 12/31/2025 | 7/3/2018 | $ | 5,539,029 | 5,522,608 | 5,443,757 | 1.6 | % | |||||||||||||
| Netreo Holdings, LLC (d), (g) | IT Services | Delayed Draw Term Loan (3M USD LIBOR +6.50%), 13.47% Cash/2.00% PIK, 12/31/2025 | 5/26/2020 | $ | 22,111,008 | 22,019,877 | 21,730,699 | 6.3 | % | |||||||||||||
| Netreo Holdings, LLC (g), (h) | IT Services | Common Stock Class A Unit | 7/3/2018 | 4,600,677 | 8,344,500 | 16,992,742 | 4.9 | % | ||||||||||||||
| Total IT Services | 35,886,985 | 44,167,198 | 12.8 | % | ||||||||||||||||||
| Saratoga Investment Corp. CLO 2013-1, Ltd. (a), (e), (g) | Structured Finance Securities | Other/Structured Finance Securities 0.00%, 4/20/2033 | 1/22/2008 | $ | 111,000,000 | 28,943,904 | 21,176,578 | 6.1 | % | |||||||||||||
| Saratoga Investment Corp. CLO 2013-1, Ltd. Class F-2-R-3 Note (a), (g) | Structured Finance Securities | Other/Structured Finance Securities (3M USD LIBOR+10.00%), 14.97%, 4/20/2033 | 8/9/2021 | $ | 9,375,000 | 9,375,000 | 8,831,406 | 2.5 | % | |||||||||||||
| Saratoga Investment Corp. Senior Loan Fund 2022-1, Ltd. Class E Note (a), (g) | Structured Finance Securities | Other/Structured Finance Securities (3M USD TERM SOFR+8.55%), 13.44%, 10/20/2033 | 10/28/2022 | $ | 12,250,000 | 11,392,500 | 11,354,495 | 3.3 | % | |||||||||||||
| Total Structured Finance Securities | 49,711,404 | 41,362,479 | 11.9 | % | ||||||||||||||||||
| Saratoga Senior Loan Fund I JV, LLC (a), (g), (j) | Investment Fund | Unsecured Loan 10.00%, 6/15/2023 | 2/17/2022 | $ | 17,618,954 | 17,618,954 | 17,618,954 | 5.1 | % | |||||||||||||
| Saratoga Senior Loan Fund I JV, LLC (a), (g), (h) | Investment Fund | Membership Interest | 2/17/2022 | 17,583,486 | 17,583,486 | 13,106,951 | 3.8 | % | ||||||||||||||
| Total Investment Fund | 35,202,440 | 30,725,905 | 8.9 | % | ||||||||||||||||||
| Sub Total Control investments | 120,800,829 | 116,255,582 | 33.6 | % | ||||||||||||||||||
| TOTAL INVESTMENTS - 280.3% (b) | $ | 966,489,357 | $ | 972,590,253 | 280.3 | % | ||||||||||||||||
Saratoga Investment Corp.
Consolidated Schedule of Investments
February 28, 20212023
| Number of Shares | Cost | Fair Value | % of Net Assets | |||||||||||||
| Cash and cash equivalents and cash and cash equivalents, reserve accounts - 27.7% (b) | ||||||||||||||||
| U.S. Bank Money Market (l) | 96,076,273 | $ | 96,076,273 | $ | 96,076,273 | 27.7 | % | |||||||||
| Total cash and cash equivalents and cash and cash equivalents, reserve accounts | 96,076,273 | $ | 96,076,273 | $ | 96,076,273 | 27.7 | % | |||||||||
| Number of Shares | Cost | Fair Value | % of Net Assets | |||||||||||||
| Cash and cash equivalents and cash and cash equivalents, reserve accounts - 6.2% (b) | ||||||||||||||||
| U.S. Bank Money Market (l) | 18,828,047 | $ | 18,828,047 | $ | 18,828,047 | 6.2 | % | |||||||||
| Total cash and cash equivalents and cash and cash equivalents, reserve accounts | 18,828,047 | $ | 18,828,047 | $ | 18,828,047 | 6.2 | % | |||||||||
| (1) | Securities are exempt from registration under Rule 144A of the Securities Act of 1933, as amended, and are restricted securities. Money market funds are valued at net asset value and are considered level 1 investments within the fair value hierarchy. |
| (a) | Represents an investment that is not a “qualifying asset” under Section 55(a) of the Investment Company Act of 1940, as amended (the |
| (b) | Percentages are based on net assets of |
| (c) | Because there is no |
| (d) | These securities are either fully or partially pledged as collateral under |
| (e) | This investment does not have a stated interest rate that is payable thereon. As a result, the |
| (f) | As defined in the 1940 Act, this portfolio company is an “affiliate” as we own between 5.0% and 25.0% of the outstanding voting securities. Artemis Wax Corp. is no longer an affiliate as of February 28, 2023. Transactions during the |
| Company | Purchases | Sales | Total Interest from Investments | Management Fee Income | Net Realized Gain (Loss) from Investments | Net Change in Unrealized Appreciation (Depreciation) | ||||||||||||||||||
| Elyria Foundry Company, L.L.C. | $ | - | $ | (2,309,806 | ) | $ | 172,626 | $ | - | $ | (8,726,013 | ) | $ | 7,745,228 | ||||||||||
| GreyHeller LLC | 2,227,500 | - | 987,969 | - | - | 942,175 | ||||||||||||||||||
| Top Gun Pressure Washing, LLC | 1,806,750 | - | 668,294 | - | - | (712,711 | ) | |||||||||||||||||
| TG Pressure Washing Holdings, LLC | 138,148 | - | - | - | - | (425,596 | ) | |||||||||||||||||
| Total | $ | 4,172,398 | $ | (2,309,806 | ) | $ | 1,828,889 | $ | - | $ | (8,726,013 | ) | $ | 7,549,096 | ||||||||||
| Company | Purchases | Sales | Total Interest from Investments | Management Fee Income | Net Realized Gain (Loss) from Investments | Net Change in Unrealized Appreciation (Depreciation) | ||||||||||||||||||
| Artemis Wax Corp | $ | 27,440,000 | $ | 6,162,526 | $ | 3,418,378 | $ | - | $ | - | $ | (1,460,287 | ) | |||||||||||
| Axero Holdings, LLC | 1,089,000 | - | 848,422 | - | - | 1,951,499 | ||||||||||||||||||
| ETU Holdings, Inc. | 14,880,000 | - | 923,437 | - | - | 83,142 | ||||||||||||||||||
| Total | $ | 43,409,000 | $ | 6,162,526 | $ | 5,190,237 | $ | - | $ | - | $ | 574,354 | ||||||||||||
Saratoga Investment Corp.
Consolidated Schedule of Investments
February 28, 20212023
| (g) | As defined in the 1940 Act, we “control” this portfolio company because we own more than 25% of the portfolio company’s outstanding voting securities. Transactions during the year ended February 28, |
| Company | Purchases | Sales | Total Interest from Investments | Management Fee Income | Net Realized Gain (Loss) from Investments | Net Change in Unrealized Appreciation (Depreciation) | ||||||||||||||||||
| Netreo Holdings, LLC | $ | 1,188,000 | $ | - | $ | 738,012 | $ | - | $ | - | $ | 1,832,136 | ||||||||||||
| Saratoga Investment Corp. CLO 2013-1, Ltd. | 14,000,000 | - | 3,535,591 | 2,507,626 | - | (1,433,723 | ) | |||||||||||||||||
| Saratoga Investment Corp. CLO 2013-1, Ltd. Class F-R-2 Notes | - | (2,500,000 | ) | 237,163 | - | - | 22,000 | |||||||||||||||||
| Saratoga Investment Corp. CLO 2013-1, Ltd. Class F-R-3 Note | 17,875,000 | - | 15,187 | - | - | 454,025 | ||||||||||||||||||
| Saratoga Investment Corp. CLO 2013-1, Ltd. Class G-R-2 Notes | - | (7,500,000 | ) | 805,759 | - | - | 65,250 | |||||||||||||||||
| Saratoga Investment Corp. CLO 2013-1 Warehouse 2, Ltd. | 22,500,000 | (25,000,000 | ) | 679,926 | - | - | 295,459 | |||||||||||||||||
| Total | $ | 55,563,000 | $ | (35,000,000 | ) | $ | 6,011,638 | $ | 2,507,626 | $ | - | $ | 1,235,147 | |||||||||||
| Company | Purchases | Sales | Total Interest from Investments | Management Fee Income | Net Realized Gain (Loss) from Investments | Net Change in Unrealized Appreciation (Depreciation) | ||||||||||||||||||
| Netreo Holdings, LLC | $ | 8,290,000 | $ | - | $ | 2,529,483 | $ | - | $ | - | $ | (2,363,302 | ) | |||||||||||
| Saratoga Investment Corp. CLO 2013-1, Ltd. | - | - | 1,228,486 | 3,269,820 | - | (4,149,106 | ) | |||||||||||||||||
| Saratoga Investment Corp. Senior Loan Fund 2022-1, Ltd. Class E Note | 11,392,500 | - | 552,330 | - | - | (38,005 | ) | |||||||||||||||||
| Saratoga Investment Corp. CLO 2013-1, Ltd. Class F-2-R-3 Note | - | - | 1,195,662 | - | - | (543,594 | ) | |||||||||||||||||
| Saratoga Senior Loan Fund I JV, LLC | 4,493,954 | - | 1,483,522 | - | - | - | ||||||||||||||||||
| Saratoga Senior Loan Fund I JV, LLC | 4,458,486 | - | - | - | - | (3,367,599 | ) | |||||||||||||||||
| Total | $ | 28,634,940 | $ | - | $ | 6,989,483 | $ | 3,269,820 | $ | - | $ | (10,461,606 | ) | |||||||||||
| (h) | Non-income producing at February 28, |
| (i) | Includes securities issued by an affiliate of the |
| (j) | All or a portion of this investment has an unfunded commitment as of February 28, |
| (k) | As of February 28, |
| (l) | Included within cash and cash equivalents and cash and cash equivalents, reserve accounts in the Company’s consolidated statements of assets and liabilities as of February 28, |
BSBY - Bloomberg Short-Term Bank Yield
LIBOR - London Interbank Offered Rate
SOFR - Secured Overnight Financing Rate
1M USD BSBY - The 1 month USD BSBY rate as of February 28, 2023 was 4.58%.
3M USD BSBY - The 3 month USD BSBY rate as of February 28, 2023 was 4.87%.
1M USD LIBOR - The 1 month USD LIBOR rate as of February 28, 20212023 was 0.12%4.67%.
3M USD LIBOR - The 3 month USD LIBOR rate as of February 28, 20212023 was 0.19%4.97%.
1M USD TERM SOFR - The 1 month USD TERM SOFR rate as of February 28, 2023 was 4.66%
3M USD TERM SOFR - The 3 month USD TERM SOFR rate as of February 28, 2023 was 4.89%
PIK - Payment-in-Kind (see Note 2 to the consolidated financial statements).
See accompanying notes to consolidated financial statements.
NOTES TO CONSOLIDATED FINANCIAL STATEMENTS
February 28, 202229, 2024
Note 1. Organization
Saratoga Investment Corp. (the “Company”, “we”, “our” and “us”) is a non-diversified closed end management investment company incorporated in Maryland that has elected to be treated and is regulated as a business development company (“BDC”) under the Investment Company Act of 1940, as amended (the “1940 Act”). The Company commenced operations on March 23, 2007 as GSC Investment Corp. and completed the initial public offering (“IPO”) on March 28, 2007. The Company has elected, and intends to qualify annually, to be treated for U.S. federal income tax purposes as a regulated investment company (“RIC”) under subchapterSubchapter M of the Internal Revenue Code of 1986, as amended (the “Code”). The Company expects to continue to qualify and to elect to be treated, for tax purposes, as a RIC. The Company’s investment objective is to generate current income and, to a lesser extent, capital appreciation from its investments.
GSC Investment, LLC (the “LLC”) was organized in May 2006 as a Maryland limited liability company. As of February 28, 2007, the LLC had not yet commenced its operations and investment activities.
On March 21, 2007, the Company was incorporated and concurrently therewith the LLC was merged with and into the Company, with the Company as the surviving entity, in accordance with the procedure for such merger in the LLC’s limited liability company agreement and Maryland law. In connection with such merger, each outstanding limited liability company interest of the LLC was converted into a share of common stock of the Company.
On July 30, 2010, the Company changed its name from “GSC Investment Corp.” to “Saratoga Investment Corp.” in connection with the consummation of a recapitalization transaction.
The Company is externally managed and advised by the investment adviser, Saratoga Investment Advisors, LLC (the “Manager” or “Saratoga Investment Advisors”), pursuant to an investment advisory and management agreement (the “Management Agreement”). Prior to July 30, 2010, the Company was managed and advised by GSCP (NJ), L.P.
The Company has established wholly-ownedwholly owned subsidiaries, SIA-AAP, Inc., SIA-ARC, Inc., SIA-Avionte, Inc., SIA-AX, Inc., SIA-G4, Inc., SIA-GH, Inc., SIA-MAC, Inc., SIA-PEP,SIA-MDP, Inc., SIA-PP Inc., SIA-SZ, Inc., SIA-TG, Inc., SIA-TT, Inc., SIA-Vector, Inc. and SIA-VR, Inc., which are structured as Delaware entities orthat are treated as corporations for U.S. federal income tax blockers (“Taxable Blockers”),purposes and are intended to holdfacilitate its compliance with the requirements to be treated as a RIC under the Code by holding equity or equity-like investments in portfolio companies organized as limited liability companies, or LLCs (or other forms of pass through entities). In February 2022, SIA-GH, Inc., SIA-TT Inc. and SIA-VR, Inc. received an approved plan of liquidation following the sale of equity held by each of the portfolio companies. Tax BlockersThese entities are consolidated for accounting purposes, but are not consolidated for U.S. federal income tax purposes and may incur U.S. federal income tax expenses as a result of their ownership of portfolio companies. In February 2022, SIA-GH, Inc., SIA-TT Inc. and SIA-VR, Inc. received an approved plan of liquidation following the sale of equity held by each of the portfolio companies.
On December 31, 2019, the Company’s second lien term loans in Easy Ice, LLC and Easy Ice Masters, LLC were repaid at par, and its preferred equity was sold in a change of control transaction. In addition to the second lien term loans of $27.9 million and the preferred equity of $10.7 million being repaid in full including all accrued interest, the Company also received approximately $35.6 million of additional proceeds, interest and fees. The Company recognized a gain of $31.2 million, which is included in the net realized gain (loss) from investments in the Company’s consolidated statement of operations from the sale. The SIA-Easy Ice, LLC Taxable Blocker was sold as part of this transaction.
On March 28, 2012, our wholly-owned subsidiary,Our wholly owned subsidiaries, Saratoga Investment Corp. SBIC LP (“SBIC LP”), received a Small Business Investment Company (“SBIC”) license from the Small Business Administration (“SBA”). On August 14, 2019, our wholly-owned subsidiary, Saratoga Investment Corp. SBIC II LP (“SBIC II LP”), alsoand Saratoga Investment Corp. SBIC III LP (“SBIC III LP”, and together with SBIC LP and SBIC II LP, the “SBIC Subsidiaries”), received an SBIC licenselicenses from the SBA. The newSBA on March 28, 2012, August 14, 2019, and September 29, 2022, respectively. SBIC LP’s license will provideprovided up to $175.0$150.0 million in additional long-term capital in the form of SBA debentures.debentures, while SBIC II LP’s and SBIC III LP’s SBIC licenses provide up to $175.0 million each. Under current SBIC regulations, for two or more SBICs under common control, the maximum amount of outstanding SBA debentures cannot exceed $350.0 million with at least $175.0 million in combined regulatory capital. Following the debentures being fully repaid to the SBA, SBIC LP surrendered its license on January 3, 2024, providing the Company access to all undistributed capital of SBIC LP, and SBIC LP subsequently merged with and into the Company.
The Company has formed a wholly owned special purpose entity, Saratoga Investment Funding II LLC (“SIF II”), a Delaware limited liability company, (“SIF II”), for the purpose of entering into a $50.0 millionthe senior secured revolving credit facility with Encina Lender Finance, LLC (the “Lender”), supported by loans held by SIF II and pledged to the Lender under the credit facility (the “Encina Credit Facility”). The Encina Credit Facility closed on October 4, 2021. During the first two years following the closing date, SIF II may request an increase in the commitment amount under the Encina Credit Facility to up to $75.0 million. The terms of the Encina Credit Facility require a minimum drawn amount of $12.5 million at all times during the first six months following the closing date, which increases to the greater of $25.0 million or 50% of the commitment amount in effect at any time thereafter. The term of the Encina Credit Facility is three years. Advances under the Encina Credit Facility bear interest at a floating rate per annum equal to LIBOR plus 4.0%, with LIBOR having a floor of 0.75%, with customary provisions related to the selection by the Lender and the Company of a replacement benchmark rate. Concurrently with the closing of the Encina Credit Facility, all remaining amounts outstanding on the Company’s existing revolving credit facility with Madison Capital Funding, LLC were repaid and the revolving credit facility terminated.
On October 26, 2021, the Company and TJHA JV I LLC (“TJHA”) entered into a Limited Liability Company Agreement (the “LLC Agreement”) to co-manage Saratoga Senior Loan Fund I JV LLC (“SLF JV”). SLF JV is under joint control and is not consolidated. SLF JV is invested in Saratoga Investment Corp Senior Loan Fund 2021-1 Ltd2022-1 Ltd. (“SLF 2021”2022”), which is a wholly owned subsidiary of SLF JV. SLF 20212022 was formed for the purpose of making investments in a diversified portfolio of broadly syndicated first lien and second lien term loans or bonds in the primary and secondary markets. On October 28, 2022, SLF 2022 issued $402.1 million of debt (the “2022 JV CLO Notes”) through a collateralized loan obligation trust (the “JV CLO trust”). The 2022 JV CLO Notes were issued pursuant to an indenture, dated October 28, 2022 (the “JV Indenture”), with U.S. Bank Trust Company, National Association (as successor in interest to U.S. Bank National Association) (the “Trustee”) servicing as the trustee.
Note 2. Summary of Significant Accounting Policies
Basis of Presentation
The accompanying consolidated financial statements have been prepared on the accrual basis of accounting in conformity with U.S. generally accepted accounting principles (“U.S. GAAP”), are stated in U.S. Dollars and include the accounts of the Company and its wholly owned special purpose financing subsidiaries, Saratoga Investment Funding, LLC (previously known as GSC Investment Funding LLC), SIF II, SBIC LP, SBIC II LP, SBIC III LP, SIA-AAP, Inc., SIA-ARC, Inc., SIA-Avionte, Inc., SIA-AX, Inc., SIA-G4, Inc., SIA-GH, Inc., SIA-MDP, Inc., SIA-MAC, Inc., SIA-PEP,SIA-PP, Inc., SIA-PP,SIA-SZ, Inc., SIA-TG, Inc., SIA-TT Inc., SIA-Vector, Inc. and SIA-VR, Inc. All intercompany accounts and transactions have been eliminated in consolidation. All references made to the “Company,” “we,” and “us” herein include Saratoga Investment Corp. and its consolidated subsidiaries, except as stated otherwise.
The Company, SBIC LP, SBIC II LP, and SBIC IIIII LP are all considered to be investment companies for financial reporting purposes and have applied the guidance in the Financial Accounting Standards Board (“FASB”) Accounting Standards Codification (“ASC”) Topic 946, “Financial Services — Investment Companies” (“ASC 946”). There have been no changes to the Company, SBIC LP, SBIC II LP, or SBIC IIIII LP’s status as investment companies during the year ended February 28, 2022.29, 2024.
Principles of Consolidation
Under the investment company rules and regulations pursuant to ASC Topic 946, the Company is precluded from consolidating any entity other than another investment company.company or controlled operating company whose business consists of providing services to the Company. As a result, the consolidated financial statements of the Company include only the accounts of the Company and its wholly owned subsidiaries. All intercompany balances and transactions have been eliminated in consolidation.
The Company has determined that SLF JV is an investment company under ASC 946; however, in accordance with such guidance the Company will generally not consolidate its investment in a company other than a wholly-ownedwholly owned investment company subsidiary. SLF JV is not a wholly-ownedwholly owned investment company subsidiary as the Company and TJHA each have an equal 50% voting interest in SLF JV and thus neither party has a controlling financial interest. Furthermore, FASB ASC Topic 810,Consolidation, concludes that in a joint venture where both members have equal decision making authority, it is not appropriate for one member to consolidate the joint venture since neither has control. Accordingly, the Company does not consolidate its investment in SLF JV.
Use of Estimates in the Preparation of Financial Statements
The preparation of the accompanying consolidated financial statements in conformity with U.S. GAAP requires management to make estimates and assumptions that affect the reported amounts of assets and liabilities, and disclosure of contingent assets and liabilities at the date of the financial statements, and income, gains (losses) and expenses during the period reported. Actual results could differ materially from those estimates.
Operating Segment
The Company invests in various industries. The Company separately evaluates the performance of each of its investment relationships. However, because each of these investment relationships has similar business and economic characteristics, they have been aggregated into a single investment segment. All applicable segment disclosures are included in or can be derived from the Company’s consolidated financial statements (See “Note 3. Investments”).
Cash and Cash Equivalents
Cash and cash equivalents include short-term, liquid investments in a money market fund. The Company places its cash in financial institutions and, at times, such balances may be in excess of the Federal Deposit Insurance Corporation insurance limits. Cash and cash equivalents are carried at cost which approximates fair value. Per sectionPursuant to Section 12(d)(1)(A) of the 1940 Act, the Company may not invest in another registered investment company, such as a money market fund, if such investment would cause the Company to exceed any of the following limitations:to:
| ● |
| ● |
| ● |
As of February 28, 2022,29, 2024, the Company did not exceed any of these limitations.
Cash and Cash Equivalents, Reserve Accounts
Cash and cash equivalents, reserve accounts include amounts held in designated bank accounts in the form of cash and short-term liquid investments in money market funds, and, at times, such balances may be in excess of the Federal Deposit Insurance Corporation insurance limits, representing payments received on secured investments or other reserved amounts associated with the revolving credit facilities.Encina Credit Facility held by the Company’s wholly owned subsidiary, SIF II. The Company is required to use these amounts to pay interest expense, reduce borrowings, or pay other amounts in accordance with the terms of the revolving credit facilities.Encina Credit Facility.
In addition, cash and cash equivalents, reserve accounts also include amounts held in designated bank accounts, in the form of cash and short-term liquid investments in money market funds, within our wholly-ownedthe Company’s wholly owned subsidiaries, SBIC LP, SBIC II LP and SBIC IIIII LP.
The statements of cash flows explain the change during the period in the total of cash, cash equivalents and amounts generally described as restricted cash and restricted cash equivalents when reconciling the beginning-of-period and end-of-period total amounts.
The following table provides a reconciliation of cash and cash equivalents and cash and cash equivalents, reserve accounts reported within the consolidated statements of assets and liabilities that sum to the total of the same such amounts shown in the consolidated statements of cash flows:
February 28, 2022 | February 28, 2021 | February 29, 2020 | February 29, 2024 | February 28, 2023 | February 28, 2022 | |||||||||||||||||||
| Cash and cash equivalents | $ | 47,257,801 | $ | 18,828,047 | $ | 24,598,905 | $ | 8,692,846 | $ | 65,746,494 | $ | 47,257,801 | ||||||||||||
| Cash and cash equivalents, reserve accounts | 5,612,541 | 11,087,027 | 14,851,447 | 31,814,278 | 30,329,779 | 5,612,541 | ||||||||||||||||||
| Total cash and cash equivalents and cash and cash equivalents, reserve accounts | $ | 52,870,342 | $ | 29,915,074 | $ | 39,450,352 | $ | 40,507,124 | $ | 96,076,273 | $ | 52,870,342 | ||||||||||||
Investment Classification
The Company classifies its investments in accordance with the requirements of the 1940 Act. Under the 1940 Act, “Control Investments”“control investments” are defined as investments in companies in which we ownthe Company owns more than 25.0% of the voting securities or maintainmaintains greater than 50.0% of the board representation. Under the 1940 Act, “Affiliated Investments”“affiliated investments” are defined as those non-control investments in companies in which we ownthe Company owns between 5.0% and 25.0% of the voting securities. Under the 1940 Act, “Non-affiliated Investments”“non-affiliated investments” are defined as investments that are neither Control Investmentscontrol investments nor Affiliated Investments.affiliated investments.
Investment Valuation
The Company accounts for its investments at fair value in accordance with the FASB ASC Topic 820, Fair Value Measurement (“(“ASC 820”). ASC 820 defines fair value, establishes a framework for measuring fair value, establishes a fair value hierarchy based on the quality of inputs used to measure fair value and enhances disclosure requirements for fair value measurements. ASC 820 requires the Company to assume that its investments are to be sold or its liabilities are to be transferred at the measurement date in the principal market to independent market participants, or in the absence of a principal market, in the most advantageous market, which may be a hypothetical market. Market participants are defined as buyers and sellers in the principal or most advantageous market that are independent, knowledgeable, and willing and able to transact.
Investments for which market quotations are readily available are fair valued at such market quotations obtained from independent third-party pricing services and market makers subject to any decision by ourthe Company’s board of directors to approve a fair value determination to reflect significant events affecting the value of these investments. We valueThe Company values investments for which market quotations are not readily available at fair value as approved, in good faith, by ourthe Company’s board of directors based on input from ourthe Manager, the audit committee of ourthe board of directors and a third-party independent valuation firm.
The Company undertakes a multi-step valuation process each quarter when valuing investments for which market quotations are not readily available, as described below:
| ● | Each investment is initially valued by the responsible investment professionals of the Manager and preliminary valuation conclusions are documented, reviewed and discussed with our senior management; and |
| ● | An independent valuation firm engaged by |
In addition, all our investments are subject to the following valuation process:
| ● | The audit committee of |
| ● |
We useThe Company uses multiple techniques for determining fair value based on the nature of the investment and experience with those types of investments and specific portfolio companies. The selections of the valuation techniques and the inputs and assumptions used within those techniques often require subjective judgements and estimates. These techniques include market comparables, discounted cash flows and enterprise value waterfalls. Fair value is best expressed as a range of values from which the Company determines a single best estimate. The types of inputs and assumptions that may be considered in determining the range of values of ourthe Company’s investments include the nature and realizable value of any collateral, the portfolio company’s ability to make payments, market yield trend analysis and volatility in future interest rates, call and put features, the markets in which the portfolio company does business, comparison to publicly traded companies, discounted cash flows and other relevant factors.
The Company’s investmentinvestments in the subordinated notes of Saratoga Investment Corp. CLO, 2013-1, Ltd. (“Class F-2-R-3 Notes of the Saratoga CLO”) isCLO and the Class E Notes of SLF 2022 are carried at fair value, which is based on a discounted cash flow valuation technique that utilizes prepayment, re-investment and loss inputs based on historical experience and projected performance, economic factors, the characteristics of the underlying cash flow, and comparable yields for equity interests in collateralized loan obligation funds, similar to Saratoga CLO, when available, as determined by ourthe Manager and recommended to ourthe Company’s board of directors. Specifically, we usethe Company uses Intex cash flows, or an appropriate substitute, to form the basis for the valuation of ourits investment in the subordinated notes of Saratoga CLO. The cash flows use a setCLO, Class F-2-R-3 Notes of inputs including projected default rates, recovery rates, reinvestment ratesthe Saratoga CLO and prepayment rates in order to arrive at estimated valuations.the Class E Notes of SLF 2022. The inputs are based on available market data and projections provided by third parties as well as management estimates. The Company uses the output from the Intex models (i.e., the estimated cash flows) to perform a discounted cash flow analysis on expected future cash flows to determine the valuation for our investment in Saratoga CLO.
The Company’s equity investment in SLF JV is measured using the proportionate share of the net asset value (“NAV”), or equivalent, of SLF JV as a practical expedient for fair value, provided by ASC 820. The Company’s unsecured loan investment in SLF JV is based on a discounted cash flow valuation technique.
Because such valuations, and particularly valuations of private investments and private companies, are inherently uncertain, they may fluctuate over short periods of time and may be based on estimates. The determination of fair value may differ materially from the values that would have been used if a ready market for these investments existed. The Company’s net asset valueNAV could be materially affected if the determinations regarding the fair value of ourits investments were materially higher or lower than the values that wethe Company ultimately realizerealizes upon the disposal of such investments.
Rule 2a-5 under the 1940 Act (“Rule 2a-5”) establishes a regulatory framework for determining fair value in good faith for purposes of the 1940 Act. Rule 2a-5 permits boards of directors, subject to board oversight and certain other conditions, to designate the investment adviser to perform fair value determinations. Rule 2a-5 also defines when market quotations are “readily available” for purposes of the 1940 Act and the threshold for determining whether a fund must determine the fair value of a security. Rule 31a-4 under the 1940 Act (“Rule 31a-4”) provides for certain recordkeeping requirements associated with fair value determinations. Finally, the Securities and Exchange Commission (the “SEC”) rescinded previously issued guidance on related issues, including the role of the board in determining fair value and the accounting and auditing of fund investments. While the Company’s board of directors has not elected to designate Saratoga Investment Advisors as the valuation designee, the Company has established policies and procedures in compliance with the applicable requirements of Rule 2a-5 and Rule 31a-4.
Derivative Financial Instruments
The Company accounts for derivative financial instruments in accordance with FASB ASC Topic 815, Derivatives and Hedging (“ASC 815”). ASC 815 requires recognizing all derivative instruments as either assets or liabilities on the consolidated statements of assets and liabilities at fair value. The Company values derivative contracts at the closing fair value provided by the counterparty. Changes in the values of derivative contracts are included in the consolidated statements of operations.
Investment Transactions and Income Recognition
Purchases and sales of investments and the related realized gains or losses are recorded on a trade-date basis. Interest income, adjusted for amortization of premium and accretion of discount, is recorded on an accrual basis to the extent that such amounts are expected to be collected. The Company stops accruing interest on its investments when it is determined that interest is no longer collectible. Discounts and premiums on investments purchased are accreted/amortized using the effective yield method. The amortized cost of investments represents the original cost adjusted for the accretion of discounts over the life of the investment and amortization of premiums on investments up to the earliest call date.
Loans are generally placed on non-accrual status when there is reasonable doubt that principal or interest will be collected. Accrued interest is generally reserved when a loan is placed on non-accrual status. Interest payments received on non-accrual loans may be recognized as a reduction in principal depending upon management’s judgment regarding collectability. Non-accrual loans are restored to accrual status when past due principal and interest is paid and, in management’s judgment, are likely to remain current, although wemanagement may make exceptions to this general rule if the loan has sufficient collateral value and is in the process of collection. At February 28, 2022, there were no investments on non-accrual status. At February 28, 2021, certain investments29, 2024 our investment in twothree portfolio companies including preferred equity interests, were on non-accrual status with a fair value of approximately $2.1$18.9 million, or 0.4%1.7% of the fair value of our portfolio. At February 28, 2023, our investment in one portfolio company was on non-accrual status with a fair value of approximately $9.8 million, or 1.0% of the fair value of our portfolio.
Interest income on our investment in the subordinated note of Saratoga CLO is recorded using the effective interest method in accordance with the provisions of ASC Topic 325,325-40, Investments-Other, Beneficial Interests in Securitized Financial Assets, (“ASC 325”), based on the anticipated yield and the estimated cash flows over the projected life of the investment. Yields are revised when there are changes in actual or estimated cash flows due to changes in prepayments and/or re-investments, credit losses or asset pricing. Changes in estimated yield are recognized as an adjustment to the estimated yield over the remaining life of the investment from the date the estimated yield was changed.
Payment-in-Kind Interest
The Company holds debt and preferred equity investments in its portfolio that contain a payment-in-kind (“PIK”) interest provision. The PIK interest, which represents contractually deferred interest added to the investment balance that is generally due at maturity, is generally recorded on thean accrual basis to the extent such amounts are expected to be collected. The Company stops accruing PIK interest if it is expected that the issuer will not be able to pay all principal and interest when due. The Company restores to accrual status when past due principal and interest is paid and, in management’s judgment, are likely to remain current, although management may make exceptions to this general rule if the loan has sufficient collateral value and is in the process of collection.
Dividend Income
DividendsDividend income is recorded in the consolidated statements of operations when earned.
Structuring and Advisory Fee Income
Structuring and advisory fee income represents various fee income earned and received for performing certain investment structuring and advisory activities during the closing of new investments.
Other Income
Other income includes prepayment income fees, and monitoring, administration, redemption and amendment fees and is recorded in the consolidated statements of operations when earned.
Deferred Debt Financing Costs
Financing costs incurred in connection with our credit facility and notes are deferred and amortized using the straight-line method over the life of the respective facility and debt securities. Financing costs incurred in connection with ourthe SBA debentures of SBIC LP, SBIC II LP, and SBIC III LP are deferred and amortized using the straight-line method over the life of the debentures. Any discount or premium on the issuance of any debt is accreted and amortized using the effective interest method over the life of the respective debt security.
The Company presents deferred debt financing costs on the balance sheet as a contra-liability, aswhich is a direct deduction from the carrying amount of that debt liability, consistent with debt discounts.
Realized Loss on Extinguishment of Debt
Upon the repayment of debt obligations that are deemed to be extinguishments, the difference between the principal amount due at maturity adjusted for any unamortized debt issuance costs is recognized as a loss (i.e., the unamortized debt issuance costs are recognized as a loss upon extinguishment of the underlying debt obligation).
Contingencies
In the ordinary course of business, the Company may enter into contracts or agreements that contain indemnifications or warranties. Future events could occur that lead to the execution of these provisions against the Company. Based on its history and experience, management reasonably believes that the likelihood of such an event is remote. Therefore, the Company has not accrued any liabilities in connection with such indemnifications.
In the ordinary course of business, the Company may directly or indirectly be a defendant or plaintiff in legal actions with respect to bankruptcy, insolvency or other types of proceedings. Such lawsuits may involve claims that could adversely affect the value of certain financial instruments owned by the Company.
Income Taxes
The Company has elected, and intends to qualify annually, to be treated for U.S. federal income tax purposes as a RIC under Subchapter M of the Code. By meeting these requirements, the Company generally will not be subject to corporateU.S. federal income taxestax on ordinary income or capital gains timely distributed to stockholders. Therefore, no provision has been recorded for federal income taxes, except as related to the TaxableCorporate Blockers (as defined below) and long-term capital gains, when applicable.
In order to qualify as a RIC, among other requirements, the Company generally is required to timely distribute to its stockholders at least 90% of its “investment company taxable income”, as defined by the Code, for each fiscal tax year. The Company will be subject to U.S. federal income tax imposed at corporate rates on its investment company taxable income and net capital gains that it does not timely distribute to shareholders. The Company will be subject to a nondeductiblenon-deductible U.S. federal excise tax of 4% on undistributed income if it does not distribute at least (1) 98% of its net ordinary income in any calendar year, (2) 98.2% of its capital gain net income for each one-year period ending on October 31and (3) any net ordinary income and capital gain net income that it recognized for preceding years, but were not distributed during such year, and on which the Company paid no U.S federal income tax.
Depending on the level of investment company taxable income earned in a tax year and the amount of net capital gains recognized in such tax year, the Company may choose to carry forward investment company taxable income and net capital gains in excess of current year dividend distributions into the next tax year and pay U.S. federal income tax, and possibly the 4.0%4% U.S. federal excise tax on such income, as required. To the extent that the Company determines that its estimated current year annual investment company taxable income will be in excess of estimated current year dividend distributions for U.S. federal excise tax purposes, the Company accrues the U.S. federal excise tax, if any, on estimated excess taxable income as taxable income is earned. For the years ended February 28,29, 2024, 2023 and 2022, 2021 and 2020, the excise tax accrual on estimated excess tabletaxable income was $0.6$1.8 million, $0.7$1.1 million and $0.0$0.6 million, respectively.
In accordance with U.S. Treasury regulations and published guidance issued by the Internal Revenue Service (“IRS”), a publicly offered RIC may treat a distribution of its own stock as counting toward its RIC distribution requirements if each stockholder may elect to receive his, her, or its entire distribution in either cash or stock of the RIC. This published guidance indicates that the rule will apply where the aggregate amount of cash to be distributed to all stockholders is not at least 20.0%20% of the aggregate declared distribution. Under the published guidance, if too many stockholders elect to receive cash, the cash available for distribution must be allocated among the stockholders electing to receive cash (with the balance of the distribution paid in stock). In no event will any stockholder, electing to receive cash, receive less than 20.0%20% of his or her entire distribution in cash. If these and certain other requirements are met, for U.S. federal income tax purposes, the amount of the dividend paid in stock will be equal to the amount of cash that could have been received instead of stock.
The Company may utilize wholly owned holding companies taxed under Subchapter C of the Code orthat are treated as corporations for U.S. federal income tax blockers,purposes when making equity investments in portfolio companies taxed as pass-through entities to meet its source-of-income requirements as a RIC. TaxableRIC (“Corporate Blockers”). Corporate Blockers are consolidated in the Company’s U.S. GAAP financial statements and may result in current and deferred U.S. federal and state income tax expense with respect to income derived from those investments. Such income, net of applicable income taxes, is not included in the Company’s tax-basis net investment income until distributed by the TaxableCorporate Blocker, which may result in timing and character differences between the Company’s U.S. GAAP and tax-basis net investment income and realized gains and losses. Income tax expense or benefit from TaxableCorporate Blockers related to net investment income are included in total operating expenses, while any expense or benefit related to federal or state income tax originated for capital gains and losses are included together with the applicable net realized or unrealized gain or loss line item. Deferred tax assets of the TaxableCorporate Blockers are reduced by a valuation allowance when, in the opinion of management, it is more-likely than-not that some portion or all of the deferred tax assets will not be realized.
FASB ASC Topic 740, Income Taxes, (“ASC 740”), provides guidance for how uncertain tax positions should be recognized, measured, presented and disclosed in the financial statements. ASC 740 requires the evaluation of tax positions taken or expected to be taken in the course of preparing the Company’s tax returns to determine whether the tax positions are “more-likely-than-not” of being sustained by the applicable tax authority. Tax positions deemed to meet a “more-likely-than-not” threshold would be recorded as a tax benefit or expense in the current period. The Company recognizes interest and penalties, if any, related to unrecognized tax benefits as income tax expense on the consolidated statements of operations. During the fiscal year ended February 28, 2022,29, 2024, February 28, 20212023 and February 29, 202028, 2022 the Company did not incur any interest or penalties. Although we file federal and state tax returns, our major tax jurisdiction is federal. The 2019, 2020, 2021, 2022 and 20222023 federal tax years for the Company remain subject to examination by the IRS. At February 28, 2022,29, 2024, and February 28, 2021,2023, there were no uncertain tax positions. The Company is not aware of any tax positions for which it is reasonably possible that the total amounts of unrecognized tax benefits will change significantly in the next 12 months.
Dividends
Dividends to common stockholders are recorded on the ex-dividend date. The amount to be paid out as a dividend is determined by the board of directors. Net realized capital gains, if any, are generally distributed at least annually, although we may decide to retain some or all of our net capital gains for reinvestment.
We have adopted a dividend reinvestment plan (“DRIP”) that provides for reinvestment of our dividend distributions on behalf of our stockholders unless a stockholder elects to receive cash. As a result, if our board of directors authorizes, and we declare, a cash dividend, then our stockholders who have not “opted out” of the DRIP by the dividend record date will have their cash dividends automatically reinvested into additional shares of our common stock, rather than receiving the cash dividends. We have the option to satisfy the share requirements of the DRIP through the issuance of new shares of common stock or through open market purchases of common stock by the DRIP plan administrator.
Capital Gains Incentive Fee
The Company records an expense accrual on the consolidated statements of operations relating to the capital gains incentive fee payable by the Company to the Manager, as recorded on the consolidated statements of assets and liabilities when the net realized and unrealized gain on its investments exceed all net realized and unrealized capital losses on its investments, becauseas a capital gains incentive fee would be owed to the Manager if the Company were to liquidate its investment portfolio at such time.
The actual incentive fee payable to the Manager related to capital gains will be determined and payable in arrears at the end of each fiscal year and only reflect those realized capital gains net of realized and unrealized losses for the period.
NewRecent Accounting Pronouncements
In June 2022, the FASB issued ASU 2022-03, Fair Value Measurement of Equity Securities Subject to Contractual Sale Restrictions (Topic 820) (“ASU 2022-03”), which clarifies that a contractual sale restriction prohibiting the sale of an equity security is a characteristic of the reporting entity holding the equity security and is not included in the equity security’s unit of account. Accordingly, an entity should not consider the contractual sale restriction when measuring the equity security’s fair value. In addition, ASU 2022-03 prohibits an entity from recognizing a contractual sale restriction as a separate unit of account. ASU 2022-03 amendments are effective for fiscal years beginning after December 15, 2023, with early adoption permitted. The Company is currently evaluating the impact of the adoption of ASU 2022-03 on its consolidated financial statements.
In March 2020, the FASB issued ASU 2020-04, Reference Rate Reform (Topic 848): Facilitation of the Effects of Reference Rate Reform on Financial Reporting(“ASU 2020-04”) to provide optional guidance to ease the potential burden in accounting for (or recognizing the effects of) reference rate reform on financial reporting. ASU 2020-04 established Topic 848 to provide relief during the temporary transition period and includes a sunset provision based on expectations of when the London Interbank Offered Rate (“LIBOR”) would cease being published. With the adoption of ASU 2020-04, there was no significant impact to the Company’s financial position.
In December 2023, the FASB issued ASU 2023-09, Improvements to Income Tax Disclosures. The amendments in this update require more disaggregated information on income taxes paid. ASU 2020-04 provide optional expedients and exceptions2023-09 is effective for applying GAAPyears beginning after December 15, 2024. Early adoption is permitted, however the Company has not elected to contracts, hedging relationships, and other transactions affected by reference rate reform if certain criteria are met.adopt this provision as of the date of the financial statements contained in this report. The Company has agreements that have LIBOR as a reference rate with certain portfolio companies and underis still assessing the Encina Credit Facility. Manyimpact of these agreements (including the credit agreements relating to the Encina Credit Facility) include an alternative successor rate or language for choosing an alternative successor rate when LIBOR reference is no longer considered to be appropriate. With respect to other agreements, the Company intends to work with its portfolio companies to modify agreements to choose an alternative successor rate. Contract modifications are required to be evaluated in determining whether the modifications result in the establishment of new contracts or the continuation of existing contracts. The standard is effective as of March 12, 2020 through December 31, 2022. Managementguidance. However, it does not believe this optional guidance hasexpect ASU 2023-09 to have a material impact on the Company’s consolidated financial statements and disclosures.the notes thereto.
Risk Management
In the ordinary course of its business, the Company manages a variety of risks, including market risk and credit risk. Market risk is the risk of potential adverse changes to the value of investments because of changes in market conditions such as interest rate movements and volatility in investment prices.
Credit risk is the risk of default or non-performance by portfolio companies, equivalent to the investment’s carrying amount. The Company is also exposed to credit risk related to maintaining all of its cash and cash equivalents, including those in reserve accounts, at a major financial institution and credit risk related to any of its derivative counterparties.
The Company has investments in lower rated and comparable quality unrated high yield bonds and bank loans. Investments in high yield investments are accompanied by a greater degree of credit risk. The risk of loss due to default by the issuer is significantly greater for holders of high yield securities, because such investments are generally unsecured and are often subordinated to other creditors of the issuer.
Note 3. Investments
As noted above, the Company values all investments in accordance with ASC 820. As defined in ASC 820, fair value is the price that would be received to sell an asset or paid to transfer a liability in an orderly transaction between independent market participants at the measurement date.
ASC 820 establishes a hierarchal disclosure framework which prioritizes and ranks the level of market price observability of inputs used in measuring investments at fair value. Market price observability is affected by a number of factors, including the type of investment and the characteristics specific to the investment. Investments with readily available active quoted prices or for which fair value can be measured from actively quoted prices generally will have a higher degree of market price observability and a lesser degree of judgment used in measuring fair value.
Based on the observability of the inputs used in the valuation techniques, the Company is required to provide disclosures on fair value measurements according to the fair value hierarchy. The fair value hierarchy ranks the observability of the inputs used to determine fair values. Investments carried at fair value are classified and disclosed in one of the following three categories:
| ● | Level 1—Valuations based on quoted prices in active markets for identical assets or liabilities that the Company has the ability to access. |
| ● | Level 2— Pricing inputs are other than quoted prices in active markets, which are either directly or indirectly observable as of the reporting date. Such inputs may be quoted prices for similar assets or liabilities, quoted markets that are not active, or other inputs that are observable or can be corroborated by observable market data for substantially the full character of the financial instrument, or inputs that are derived principally from, or corroborated by, observable market information. Investments that are generally included in this category include illiquid debt securities and less liquid, privately held or restricted equity securities, for which some level of recent trading activity has been observed. |
| ● | Level 3—Pricing inputs are unobservable for the investment and includes situations where there is little, if any, market activity for the investment. The inputs may be based on the Company’s own assumptions about how market participants would price the asset or liability or may use Level 2 inputs, as adjusted, to reflect specific investment attributes relative to a broader market assumption. Even if observable market data for comparable performance or valuation measures (earnings multiples, discount rates, other financial/valuation ratios, etc.) are available, such investments are grouped as Level 3 if any significant data point that is not also market observable (private company earnings, cash flows, etc.) is used in the valuation technique. We use multiple techniques for determining fair value based on the nature of the investment and experience with those types of investments and specific portfolio companies. The selections of the valuation techniques and the inputs and assumptions used within those techniques often require subjective judgements and estimates. These techniques include market comparables, discounted cash flows and enterprise value waterfalls. Fair value is best expressed as a range of values from which the Company determines a single best estimate. The types of inputs and assumptions that may be considered in determining the range of values of our investments include the nature and realizable value of any collateral, the portfolio company’s ability to make payments, market yield trend analysis and volatility in future interest rates, call and put features, the markets in which the portfolio company does business, comparison to publicly traded companies, discounted cash flows and other relevant factors. |
In addition to using the above inputs in investment valuations, the Company continues to employ the valuation policy approved by the board of directors that is consistent with ASC 820 and the 1940 Act (see Note 2). Consistent with our valuation policy, we evaluatethe Company evaluates the source of inputs, including any markets in which ourits investments are trading, in determining fair value.
The following table presents fair value measurements of investments, by major class, as of February 28, 202229, 2024 (dollars in thousands), according to the fair value hierarchy:
| Fair Value Measurements | Valued Using Net Asset | Fair Value Measurements | Valued Using Net Asset | |||||||||||||||||||||||||||||||||||||
| Level 1 | Level 2 | Level 3 | Value* | Total | Level 1 | Level 2 | Level 3 | Value* | Total | |||||||||||||||||||||||||||||||
| First lien term loans | $ | - | $ | - | $ | 631,572 | $ | - | $ | 631,572 | $ | - | $ | - | $ | 976,423 | $ | - | $ | 976,423 | ||||||||||||||||||||
| Second lien term loans | - | - | 44,386 | - | 44,386 | - | - | 18,097 | - | 18,097 | ||||||||||||||||||||||||||||||
| Unsecured loans | - | - | 15,931 | - | 15,931 | - | - | 15,818 | - | 15,818 | ||||||||||||||||||||||||||||||
| Structured finance securities | - | - | 38,030 | - | 38,030 | - | - | 30,626 | - | 30,626 | ||||||||||||||||||||||||||||||
| Equity interests | - | - | 75,632 | 12,016 | 87,648 | - | - | 88,426 | 9,404 | 97,830 | ||||||||||||||||||||||||||||||
| Total | $ | - | $ | - | $ | 805,551 | $ | 12,016 | $ | 817,567 | $ | - | $ | - | $ | 1,129,390 | $ | 9,404 | $ | 1,138,794 | ||||||||||||||||||||
| * | The |
The following table presents fair value measurements of investments, by major class, as of February 28, 20212023 (dollars in thousands), according to the fair value hierarchy:
| Fair Value Measurements | Fair Value Measurements | Valued Using Net Asset | ||||||||||||||||||||||||||||||||||
| Level 1 | Level 2 | Level 3 | Total | Level 1 | Level 2 | Level 3 | Value* | Total | ||||||||||||||||||||||||||||
| First lien term loans | $ | - | $ | - | $ | 440,456 | $ | 440,456 | $ | - | $ | - | $ | 798,534 | $ | - | $ | 798,534 | ||||||||||||||||||
| Second lien terms loans | - | - | 24,930 | 24,930 | ||||||||||||||||||||||||||||||||
| Unsecured term loans | - | - | 2,141 | 2,141 | ||||||||||||||||||||||||||||||||
| Second lien term loans | - | - | 14,936 | - | 14,936 | |||||||||||||||||||||||||||||||
| Unsecured loans | - | - | 20,661 | - | 20,661 | |||||||||||||||||||||||||||||||
| Structured finance securities | - | - | 49,779 | 49,779 | - | - | 41,362 | - | 41,362 | |||||||||||||||||||||||||||
| Equity interests | - | - | 37,007 | 37,007 | - | - | 83,990 | 13,107 | 97,097 | |||||||||||||||||||||||||||
| Total | $ | - | $ | - | $ | 554,313 | $ | 554,313 | $ | - | $ | - | $ | 959,483 | $ | 13,107 | $ | 972,590 | ||||||||||||||||||
| * | The Company’s equity investment in SLF JV is measured using the proportionate share of the NAV, or equivalent, as a practical expedient and thus has not been classified in the fair value hierarchy. The Company’s unsecured loan investment in SLF JV is based on a discounted cash flow valuation technique. |
The following table provides a reconciliation of the beginning and ending balances for investments that use Level 3 inputs for the year ended February 28, 202229, 2024 (dollars in thousands):
| First lien term loans | Second lien term loans | Unsecured term loans | Structured finance securities | Equity interests | Total | First lien term loans | Second lien term loans | Unsecured term loans | Structured finance securities | Equity interests | Total | |||||||||||||||||||||||||||||||||||||
| Balance as of February 28, 2021 | $ | 440,456 | $ | 24,930 | $ | 2,141 | $ | 49,779 | $ | 37,007 | $ | 554,313 | ||||||||||||||||||||||||||||||||||||
| Balance as of February 28, 2023 | $ | 798,534 | $ | 14,936 | $ | 20,661 | $ | 41,362 | $ | 83,990 | $ | 959,483 | ||||||||||||||||||||||||||||||||||||
| Payment-in-kind and other adjustments to cost | (546 | ) | 111 | 718 | (1,574 | ) | 942 | (349 | ) | 1,479 | 848 | - | (6,941 | ) | (296 | ) | (4,910 | ) | ||||||||||||||||||||||||||||||
| Net accretion of discount on investments | 2,008 | 35 | - | - | - | 2,043 | 2,215 | 6 | - | - | - | 2,221 | ||||||||||||||||||||||||||||||||||||
| Net change in unrealized appreciation (depreciation) on investments | 1,670 | (515 | ) | (54 | ) | (1,676 | ) | 18,703 | 18,128 | (33,325 | ) | 2,307 | (1,460 | ) | (3,795 | ) | (7,115 | ) | (43,388 | ) | ||||||||||||||||||||||||||||
| Purchases | 364,216 | 19,825 | 13,126 | - | 47,783 | 444,950 | 234,408 | - | - | - | 11,693 | 246,101 | ||||||||||||||||||||||||||||||||||||
| Sales and repayments | (176,264 | ) | - | - | (8,359 | ) | (42,309 | ) | (226,932 | ) | (26,888 | ) | - | (3,383 | ) | - | - | (30,271 | ) | |||||||||||||||||||||||||||||
| Net realized gain (loss) from investments | 33 | - | - | (140 | ) | 13,505 | 13,398 | - | - | - | - | 154 | 154 | |||||||||||||||||||||||||||||||||||
| Restructures in | - | - | - | - | - | - | ||||||||||||||||||||||||||||||||||||||||||
| Restructures out | - | - | - | - | - | - | ||||||||||||||||||||||||||||||||||||||||||
| Balance as of February 28, 2022 | $ | 631,572 | $ | 44,386 | $ | 15,931 | $ | 38,030 | $ | 75,632 | $ | 805,551 | ||||||||||||||||||||||||||||||||||||
| Balance as of February 29, 2024 | $ | 976,423 | $ | 18,097 | $ | 15,818 | $ | 30,626 | $ | 88,426 | $ | 1,129,390 | ||||||||||||||||||||||||||||||||||||
| Net change in unrealized appreciation (depreciation) for the year relating to those Level 3 assets that were still held by the Company at the end of the year | $ | 2,605 | $ | (515 | ) | $ | (54 | ) | $ | (1,222 | ) | $ | 21,361 | $ | 22,175 | $ | (33,307 | ) | $ | 2,307 | $ | 1,801 | $ | (3,795 | ) | $ | (7,115 | ) | $ | (40,109 | ) | |||||||||||||||||
Purchases, PIK and other adjustments to cost include purchases of new investments at cost, effects of refinancing/restructuring, accretion/amortization of income from discount/premium on debt securities, and PIK interests.
Sales and repayments represent net proceeds received from investments sold and principal paydowns received during the year.period.
Transfers and restructurings, if any, are recognized at the beginning of the period in which they occur. There were no restructurestransfers or restructurings in or out of Levels 1, 2, or 3 during the year ended February 28, 2022.29, 2024.
The following table provides a reconciliation of the beginning and ending balances for investments that use Level 3 inputs for the year ended February 28, 20212023 (dollars in thousands):
| First lien term loans | Second lien term loans | Unsecured term loans | Structured finance securities | Equity interests | Total | First lien term loans | Second lien term loans | Unsecured term loans | Structured finance securities | Equity interests | Total | |||||||||||||||||||||||||||||||||||||
| Balance as of February 29, 2020 | $ | 346,233 | $ | 73,570 | $ | 4,346 | $ | 32,470 | $ | 29,013 | $ | 485,632 | ||||||||||||||||||||||||||||||||||||
| Balance as of February 28, 2022 | $ | 631,572 | $ | 44,386 | $ | 15,931 | $ | 38,030 | $ | 75,632 | $ | 805,551 | ||||||||||||||||||||||||||||||||||||
| Payment-in-kind and other adjustments to cost | 828 | 1,993 | - | (3,674 | ) | (120 | ) | (973 | ) | 391 | 283 | 238 | (3,329 | ) | 535 | (1,882 | ) | |||||||||||||||||||||||||||||||
| Net accretion of discount on investments | 1,147 | 243 | - | - | - | 1,390 | 1,831 | (14 | ) | - | - | - | 1,817 | |||||||||||||||||||||||||||||||||||
| Net change in unrealized appreciation (depreciation) on investments | (4,267 | ) | (3,053 | ) | 295 | (892 | ) | 12,883 | 4,966 | (10,465 | ) | (703 | ) | (167 | ) | (4,731 | ) | 4,215 | (11,851 | ) | ||||||||||||||||||||||||||||
| Purchases | 142,970 | - | 22,500 | 31,875 | 4,916 | 202,261 | 345,955 | 4,950 | 4,659 | 11,392 | 13,660 | 380,616 | ||||||||||||||||||||||||||||||||||||
| Sales and repayments | (46,477 | ) | (47,823 | ) | (25,000 | ) | (10,000 | ) | (959 | ) | (130,259 | ) | (170,913 | ) | (33,966 | ) | - | - | (17,336 | ) | (222,215 | ) | ||||||||||||||||||||||||||
| Net realized gain (loss) from investments | 22 | - | - | - | (8,726 | ) | (8,704 | ) | 163 | - | - | - | 7,284 | 7,447 | ||||||||||||||||||||||||||||||||||
| Balance as of February 28, 2021 | $ | 440,456 | $ | 24,930 | $ | 2,141 | $ | 49,779 | $ | 37,007 | $ | 554,313 | ||||||||||||||||||||||||||||||||||||
| Balance as of February 28, 2023 | $ | 798,534 | $ | 14,936 | $ | 20,661 | $ | 41,362 | $ | 83,990 | $ | 959,483 | ||||||||||||||||||||||||||||||||||||
| Net change in unrealized appreciation (depreciation) for the year relating to those Level 3 assets that were still held by the Company at the end of the year | $ | (3,866 | ) | $ | (2,832 | ) | $ | - | $ | (979 | ) | $ | 5,137 | $ | (2,540 | ) | $ | (10,575 | ) | $ | (892 | ) | $ | (167 | ) | $ | (4,731 | ) | $ | 6,111 | $ | (10,254 | ) | |||||||||||||||
Transfers and restructurings, if any, are recognized at the beginning of the period in which they occur. There were no restructurestransfers or restructurings in or out of Levels 1, 2, or 3 during the year ended February 28, 20212023
The valuation techniques and significant unobservable inputs used in recurring Level 3 fair value measurements of assets as of February 29, 2024 were as follows (dollars in thousands):
| Fair Value | Valuation Technique | Unobservable Input | Range | Weighted Average* | ||||||||
| First lien term loans | $ | 976,423 | Market Comparables | Market Yield (%) | 10.6% - 17.2% | 13.0% | ||||||
| Revenue Multiples (x) | 4.6x - 9.4x | 6.6x | ||||||||||
| EBITDA Multiples (x) | 5.0x - 6.0x | 5.6x | ||||||||||
| Third-party bid (x) | 3.9x - 4.2x | 4.0x | ||||||||||
| Second lien term loans | 18,097 | Market Comparables | Market Yield (%) | 19.0% - 28.3% | 25.5% | |||||||
| EBITDA Multiples (x) | 7.0x | 7.0x | ||||||||||
| Third-party bid (x) | 29.7x | 29.7x | ||||||||||
| Unsecured term loans | 15,818 | Discounted Cash Flow | Discount Rate (%) | 10.5% | 10.5% | |||||||
| Structured finance securities | 30,626 | Discounted Cash Flow | Discount Rate (%) | 8.5% - 22.0% | 15.1% | |||||||
| Recovery Rate (%) | 35.0% - 70.0% | 70.0% | ||||||||||
| Prepayment Rate (%) | 20.0% | 20.0% | ||||||||||
| Equity interests | 88,426 | Enterprise Value Waterfall | EBITDA Multiples (x) | 4.7x - 20.4x | 10.4x | |||||||
| Revenue Multiples (x) | 1.3x - 10.4x | 6.3x | ||||||||||
| Third-party bid (x) | 3.9x | 3.9x | ||||||||||
| Total | $ | 1,129,390 | ||||||||||
| * | The weighted average in the table above is calculated based on each investment’s fair value weighting, using the applicable unobservable input, excluding the recovery rate for Structured finance securities. |
The valuation techniques and significant unobservable inputs used in recurring Level 3 fair value measurements of assets as of February 28, 20222023 were as follows (dollars in thousands):
| Fair Value | Valuation Technique | Unobservable Input | Range | Weighted Average* | ||||||||
| First lien term loans | $ | 798,534 | Market Comparables | Market Yield (%) | 10.5% - 23.1% | 12.8% | ||||||
| Revenue Multiples (x) | 4.1x | 4.1x | ||||||||||
| EBITDA Multiples (x) | 8.0x | 8.0x | ||||||||||
| Second lien term loans | 14,936 | Market Comparables | Market Yield (%) | 15.6% - 61.8% | 45.8% | |||||||
| Unsecured term loans | 20,661 | Market Comparables | Market Yield (%) | 10.0% - 28.8% | 12.6% | |||||||
| Market Comparables | Market Quote (%) | 100.0% | 100% | |||||||||
| Collateral Value Coverage | Net Asset Value (%) | 100.0% | 100% | |||||||||
| Structured finance securities | 41,362 | Discounted Cash Flow | Discount Rate (%) | 12.0% - 22.0% | 17.6% | |||||||
| Recovery Rate (%) | 35.0% - 70.0% | 70.0% | ||||||||||
| Prepayment Rate (%) | 20.0% | 20.0% | ||||||||||
| Equity interests | 83,990 | Enterprise Value Waterfall | EBITDA Multiples (x) | 5.5x - 28.6x | 11.0x | |||||||
| Revenue Multiples (x) | 1.3x - 11.2x | 6.4x | ||||||||||
| Total | $ | 959,483 | ||||||||||
| Fair Value | Valuation Technique | Unobservable Input | Range | Weighted Average* | ||||||||||||
| First lien term loans | $ | 631,572 | Market Comparables | Market Yield (%) | 6.0% - 11.3% | 8.4% | ||||||||||
| Revenue Multiples (x) | 3.5x | 3.5x | ||||||||||||||
| Second lien term loans | 44,386 | Market Comparables | Market Yield (%) | 8.9% - 32.9% | 15.6% | |||||||||||
| EBITDA Multiples (x) | 7.5x | 7.5x | ||||||||||||||
| Unsecured term loans | 15,931 | Market Comparables | Market Yield (%) | 22.3% | 22.3% | |||||||||||
| Collateral Value Coverage | Net Asset Value | 100% | 100% | |||||||||||||
| Structured finance securities | 38,030 | Discounted Cash Flow | Discount Rate (%) | 10.0% - 15.0% | 14.2% | |||||||||||
| Recovery Rate (%) | 35.0% - 70.0% | 70.0% | ||||||||||||||
| Prepayment Rate (%) | 20.0% | 20.0% | ||||||||||||||
| Equity interests | 75,632 | Enterprise Value Waterfall | EBITDA Multiples (x) | 4.0x - 28.6x | 9.3x | |||||||||||
| Revenue Multiples (x) | 1.0x - 11.7x | 6.6x | ||||||||||||||
| Third-party bid | 100.0% | 100.0% | ||||||||||||||
| Total | $ | 805,551 | ||||||||||||||
| * | The weighted average in the table above is calculated based on each investment’s fair value weighting, using the applicable unobservable input, excluding the recovery rate for Structured finance securities. |
The valuation techniques and significant unobservable inputs used in recurring Level 3 fair value measurements of assets as of February 28, 2021 were as follows (dollars in thousands):
| Fair Value | Valuation Technique | Unobservable Input | Range | Weighted Average* | ||||||||||||
| First lien term loans | $ | 440,456 | Market Comparables | Market Yield (%) | 5.8% - 18.7% | 9.7 | % | |||||||||
| EBITDA Multiples (x) | 6.8x | 6.8 | x | |||||||||||||
| Revenue Multiples (x) | 4.1x - 8.0x | 7.5 | x | |||||||||||||
| Second lien term loans | 24,930 | Market Comparables | Market Yield (%) | 10.0% - 24.5 | % | 16.5 | % | |||||||||
| EBITDA Multiples (x) | 7.5x | 7.5 | x | |||||||||||||
| Unsecured term loans | 2,141 | Market Comparables | Market Yield (%) | 31.1 | % | 31.1 | % | |||||||||
| EBITDA Multiples (x) | 5.2x | 5.2 | x | |||||||||||||
| Structured finance securities | 49,779 | Discounted Cash Flow | Discount Rate (%) | 10.0% - 15.0 | % | 13.8 | % | |||||||||
| Recovery Rate (%) | 35.0% - 70.0 | % | 70.0 | % | ||||||||||||
| Prepayment Rate (%) | 20.0 | % | 20.0 | % | ||||||||||||
| Equity interests | 37,007 | Enterprise Value Waterfall | EBITDA Multiples (x) | 4.0x - 14.0x | 9.7 | x | ||||||||||
| Revenue Multiples (x) | 0.5x - 38.3x | 4.6 | x | |||||||||||||
| Total | $ | 554,313 | ||||||||||||||
For investments utilizing a market comparables valuation technique, a significant increase (decrease) in the market yield, in isolation, would result in a significantly lower (higher) fair value measurement, and a significant increase (decrease) in any of the earnings before interest, tax, depreciation and amortization (“EBITDA”) or revenue valuation multiples, in isolation, would result in a significantly higher (lower) fair value measurement. For investments utilizing a discounted cash flow valuation technique, a significant increase (decrease) in the discount rate, and prepayment rate, in isolation, would result in a significantly lower (higher) fair value measurement while a significant increase (decrease) in recovery rate, in isolation, would result in a significantly higher (lower) fair value measurement. For investments utilizing a market quote, or third party bid or net asset value in deriving a value, a significant increase (decrease) in the market quote, bid or bid,net asset value in isolation, would result in a significantly higher (lower) fair value measurement.
The composition of our investments as of February 28, 202229, 2024 at amortized cost and fair value was as follows (dollars in thousands):
| Investments at Amortized Cost | Amortized Cost Percentage of Total Portfolio | Investments at Fair Value | Fair Value Percentage of Total Portfolio | Investments at Amortized Cost | Amortized Cost Percentage of Total Portfolio | Investments at Fair Value | Fair Value Percentage of Total Portfolio | |||||||||||||||||||||||||
| First lien term loans | $ | 631,037 | 79.3 | % | $ | 631,573 | 77.3 | % | $ | 1,019,678 | 86.4 | % | $ | 976,423 | 85.7 | % | ||||||||||||||||
| Second lien term loans | 49,862 | 6.3 | 44,386 | 5.4 | 21,968 | 1.9 | 18,097 | 1.6 | ||||||||||||||||||||||||
| Unsecured loans | 16,104 | 2.0 | 15,931 | 1.9 | 17,619 | 1.5 | 15,818 | 1.4 | ||||||||||||||||||||||||
| Structured finance securities | 41,648 | 5.2 | 38,030 | 4.7 | 42,769 | 3.6 | 30,626 | 2.7 | ||||||||||||||||||||||||
| Equity interests | 57,597 | 7.2 | 87,648 | 10.7 | 77,750 | 6.6 | 97,830 | 8.6 | ||||||||||||||||||||||||
| Total | $ | 796,248 | 100.0 | % | $ | 817,568 | 100.0 | % | $ | 1,179,784 | 100.0 | % | $ | 1,138,794 | 100.0 | % | ||||||||||||||||
The composition of our investments as of February 28, 20212023 at amortized cost and fair value was as follows (dollars in thousands):
| Investments at Amortized Cost | Amortized Cost Percentage of Total Portfolio | Investments at Fair Value | Fair Value Percentage of Total Portfolio | Investments at Amortized Cost | Amortized Cost Percentage of Total Portfolio | Investments at Fair Value | Fair Value Percentage of Total Portfolio | |||||||||||||||||||||||||
| First lien term loans | $ | 441,590 | 80.3 | % | $ | 440,456 | 79.5 | % | $ | 808,464 | 83.7 | % | $ | 798,534 | 82.1 | % | ||||||||||||||||
| Second lien term loans | 29,891 | 5.4 | 24,930 | 4.4 | 21,114 | 2.2 | 14,936 | 1.5 | ||||||||||||||||||||||||
| Unsecured term loans | 2,261 | 0.4 | 2,141 | 0.4 | ||||||||||||||||||||||||||||
| Unsecured loans | 21,001 | 2.2 | 20,661 | 2.1 | ||||||||||||||||||||||||||||
| Structured finance securities | 51,722 | 9.4 | 49,779 | 9.0 | 49,711 | 5.1 | 41,362 | 4.3 | ||||||||||||||||||||||||
| Equity interests | 24,550 | 4.5 | 37,007 | 6.7 | 66,199 | 6.8 | 97,097 | 10.0 | ||||||||||||||||||||||||
| Total | $ | 550,014 | 100.0 | % | $ | 554,313 | 100.0 | % | $ | 966,489 | 100.0 | % | $ | 972,590 | 100.0 | % | ||||||||||||||||
For loans and debt securities for which market quotations are not readily available, we determinethe Company determines their fair value based on third party indicative broker quotes, where available, or the inputs that a hypothetical market participant would use to value the security in a current hypothetical sale using a market comparables valuation technique. In applying the market comparables valuation technique, we determinethe Company determines the fair value based on such factors as market participant inputs including synthetic credit ratings, estimated remaining life, current market yield and interest rate spreads of similar securities as of the measurement date. If, in ourthe Company’s judgment, the market comparables technique is not sufficient or appropriate, wethe Company may use additional techniques such as an asset liquidation or expected recovery model.
For equity securities of portfolio companies and partnership interests, we determinethe Company determines the fair value using an enterprise value waterfall valuation technique. Under the enterprise value waterfall valuation technique, we determinethe Company determines the enterprise fair value of the portfolio company and then waterfallwaterfalls the enterprise value over the portfolio company’s securities in order of their preference relative to one another. To estimate the enterprise value of the portfolio company, we weighthe Company weighs some or all of the traditional market valuation techniques and factors based on the individual circumstances of the portfolio company in order to estimate the enterprise value. The techniques for performing investments may be based on, among other things: valuations of comparable public companies, recent sales of private and public comparable companies, discounting the forecasted cash flows of the portfolio company, third party valuations of the portfolio company, considering offers from third parties to buy the company, estimating the value to potential strategic buyers and considering the value of recent investments in the equity securities of the portfolio company. For non-performing investments, wethe Company may estimate the liquidation or collateral value of the portfolio company’s assets and liabilities. WeThe Company also taketakes into account historical and anticipated financial results.
Our investment
The Company’s investments in Saratoga CLO isand SLF 2022 are carried at fair value, which is based on a discounted cash flow valuation technique that utilizes prepayment, re-investment and loss inputs based on historical experience and projected performance, economic factors, the characteristics of the underlying cash flow, and comparable yields for equity interests in collateralized loan obligation funds similar to Saratoga CLO and SLF 2022, when available, as determined by ourthe Manager and recommended to ourthe Company’s board of directors. Specifically, we usethe Company uses Intex cash flows, or an appropriate substitute, to form the basis for the valuation of ourthe investment in Saratoga CLO.CLO and SLF 2022. The cash flows use a set of inputs including projected default rates, recovery rates, reinvestment rates and prepayment rates in order to arrive at estimated valuations. The inputs are based on available market data and projections provided by third parties as well as management estimates. WeThe Company ran Intex models based on inputs about the refinanced Saratoga CLO’s structure and the SLF 2022 structure, including capital structure, cost of liabilities and reinvestment period. We useThe Company uses the output from the Intex models (i.e., the estimated cash flows) to perform a discounted cash flow analysis on expected future cash flows to determine a valuation for our investmentinvestments in Saratoga CLO and SLF 2022 at February 28, 2022.29, 2024. The inputs at February 28, 202229, 2024 for the valuation model include:
| ● | Default rate: 2.0% |
| ● | Recovery rate: |
| ● | Discount rate: |
| ● | Prepayment rate: 20.0% |
| ● | Reinvestment rate / price: |
F-39
Investment Concentration
Set forth is a brief description of each portfolio company in which the fair value of ourthe Company’s investment represents greater than 5% of ourthe Company’s total assets as of February 28, 2022.29, 2024, excluding Saratoga CLO, SLF JV and SLF 2022 (see Note 4 and Note 5 for more information on Saratoga CLO, SLF JV and SLF 2022, respectively).
HematerraHemaTerra Holdings Company, LLC
HemaTerra Holding Company, LLC (“HemaTerra”) provides SaaS-based software solutions addressing complex supply chain issues across a variety of medical environments, including blood, plasma, tissue, implants and DNA sample management, to customers in blood centers, hospitals, pharmaceuticals, and law enforcement settings.
Buildout, Inc.Artemis Wax Corp.
Artemis Wax Corporation is a U.S. based retail aggregator of European Wax Center (“EWC”) franchise locations with a concentration in the northeast. Founded in 2004, EWC is the largest U.S. body waxing national chain with more than 800 locations across the country.
Granite Comfort, LP
Buildout, Inc.
Granite Comfort, LP is a U.S. based heating, ventilation and air conditioning (“Buildout”HVAC”) company. The company provides SaaS-based real estate marketingtraditional service and customer relationship management (“CRM”) software to commercial real estate (“CRE”) brokerages. Buildout providesreplacement of HVAC / plumbing systems, as well as a suiterental model that is in the early stages of software solutions brokers use to manage relationships, efficiently create and distribute marketing materials over a wide variety of channels, including direct mail, multiple listing websites, brokerage website, property specific websites and manage back office functions like commission calculations and broker productivity.implementation.
Note 4. Investment in Saratoga Investment Corp. CLO 2013-1, Ltd. (“Saratoga CLO”)
On January 22, 2008, the Company entered into a collateral management agreement with Saratoga CLO, pursuant to which the Company acts as its collateral manager. The Saratoga CLO was initially refinanced in October 2013 with its reinvestment period extended to October 2016. On November 15, 2016, the Company completed a second refinancing of the Saratoga CLO with its reinvestment period extended to October 2018.
On August 7, 2018, the Company entered into an unsecured loan agreement (“CLO 2013-1 Warehouse Loan”) with Saratoga Investment Corp. CLO 2013-1 Warehouse, Ltd. (“CLO 2013-1 Warehouse”), a wholly-owned subsidiary of Saratoga CLO, pursuant to which CLO 2013-1 Warehouse may borrow from time to time up to $20 million from the Company in order to provide capital necessary to support warehouse activities. The CLO 2013-1 Warehouse Loan, which expired on February 7, 2020, bears interest at an annual rate of 3M USD LIBOR + 7.5%. Interest accrued on the investment in the CLO 2013-1 Warehouse Loan is included in interest income on the Company’s consolidated statement of operations. During the year ended February 28, 2019, the maximum amount invested by the Company in the CLO 2013-1 Warehouse Loan amounted to $20.0 million and at February 29, 2020, the Company no longer held an investment in the CLO 2013-1 Warehouse Loan.
On December 14, 2018, the Company completed a third refinancing and upsize of the Saratoga CLO (the “2013-1 Reset CLO Notes”). The third Saratoga CLO refinancing, among other things, extended its reinvestment period to January 2021, and extended its legal maturity date to January 2030. A non-call period ending January 2020 was also added. Following this refinancing, the Saratoga CLO portfolio increased its aggregate principal amount from approximately $300.0 million in aggregate principal amount to approximately $500.0 million of predominantly senior secured first lien term loans. In addition to refinancing its liabilities, the Company invested an additional $13.8 million in all of the newly issued subordinated notes of the Saratoga CLO and also purchased $2.5 million in aggregate principal amount of the Class F-R-2 and $7.5 million aggregate principal amount of the Class G-R-2 notes tranches at par, with a coupon of 3M USD LIBOR plus 8.75% and 3M USD LIBOR plus 10.00%, respectively. As part of this refinancing, the Company also redeemed our existing $4.5 million aggregate amount of the Class F notes tranche at par and the $20.0 million CLO 2013-Warehouse loan was repaid.
On February 11, 2020, the Company entered into an unsecured loan agreement (“CLO 2013-1 Warehouse 2 Loan”) with Saratoga Investment Corp. CLO 2013-1 Warehouse 2, Ltd., (“CLO 2013-1 Warehouse 2”), a wholly owned subsidiary of Saratoga CLO. During the fourth quarter ended February 28, 2021, the CLO 2013-1 Warehouse 2 Ltd. was repaid in full.
On February 26, 2021, the Company completed the fourth refinancing of the Saratoga CLO. This refinancing, among other things, extended the Saratoga CLO reinvestment period to April 2024, and extended its legal maturity to April 2033. A2033, and added a non-call period endingof February 2022 was also added.2022. In addition, and as part of the refinancing, the Saratoga CLO has also beenwas upsized from $500 million in assets to approximately $650 million. As part of this refinancing and upsizing, the Company invested an additional $14.0 million in all of the newly issued subordinated notes of the Saratoga CLO, and purchased $17.9 million in aggregate principal amount of the Class F-R-3 Notes tranche at par. Concurrently, the existing $2.5 million of Class F-R-2 Notes, $7.5 million of Class G-R-2 Notes and $25.0 million of the CLO 2013-1 Warehouse 2 Loan were repaid. The Company also paid $2.6 million of transaction costs related to the refinancing and upsizing on behalf of the Saratoga CLO, to be reimbursed from future equity distributions. At August 31, 2021, the outstanding receivable of $2.6 million was repaid in full.
On August 9, 2021, the Company exchanged its existing $17.9 million Class F-R-3 Note for $8.5 million Class F-1-R-3 Notes and $9.4 million Class F-2-R-3 Notes at par. On August 11, 2021, the Company sold its Class F-1-R-3 Notes to third parties, resulting in a realized loss of $0.1 million.
The Saratoga CLO remains effectively 100.0% owned and managed by the Company. We receiveThe Company receives a base management fee of 0.10% per annum and a subordinated management fee of 0.40% per annum of the outstanding principal amount of Saratoga CLO’s assets, paid quarterly to the extent of available proceeds. Following the third refinancing and the issuance of the 2013-1 Reset CLO Notes on December 14, 2018, we arethe Company is no longer entitled to an incentive management fee equal to 20.0% of excess cash flow to the extent the Saratoga CLO subordinated notes receive an internal rate of return paid in cash equal to or greater than 12.0%.
For the years ended February 28, 2022,29, 2024, February 28, 20212023 and February 29, 2020,28, 2022, we accrued management fee income of $3.3 million, $2.5$3.3 million and $2.5$3.3 million, respectively, and interest income of $4.9$0.0 million, $3.5$1.2 million and $4.1$4.9 million, respectively, from the Saratoga CLO.
As of February 28, 2021,29, 2024, the Company determined that the fair value of its investment in the subordinated notes of Saratoga CLO was $31.4$9.5 million. The Company determines the fair value of its investment in the subordinated notes of Saratoga CLO based on the present value of the projected future cash flows of the subordinated notes over the life of Saratoga CLO. As of February 28, 2021,29, 2024, the fair value of its investment in the Class F-R-3 Notes of Saratoga CLO was $18.3 million,$8.9 million. As of February 28, 2021,29, 2024, Saratoga CLO had investments with a principal balance of $603.7$640.8 million and a weighted average spread over LIBOR of 3.8% and had debt with a principal balance of $611.0 million with a weighted average spread over LIBOR of 2.2%. As a result, Saratoga CLO earns a “spread” between the interest income it receives on its investments and the interest expense it pays on its debt and other operating expenses, which is distributed quarterly to the Company as the holder of its subordinated notes. As of February 28, 2021,29, 2024, the present value of the projected future cash flows of the subordinated notes, was approximately $31.7$9.5 million, using a 15.0% discount rate. In conjunction with the third refinancing of the 2013-1 Reset CLO Notes on December 14, 2018, the Company is no longer entitled to receive an incentive management fee from Saratoga CLO. For the fourth quarter ended February 28, 2021, the F-R-2 Notes and G-R-2 Notes were redeemed in full.
As of February 28, 2022, the Company determined that the fair value of its investment in the subordinated notes of Saratoga CLO was $28.7 million. As of February 28, 2022, the fair value of its investment in the Class F-R-3 Notes of Saratoga CLO was $9.4 million. As of February 28, 2022, Saratoga CLO had investments with a principal balance of $660.2 million and a weighted average spread over LIBOR of 3.7% and had debt with a principal balance of $611.0 million with a weighted average spread over LIBOR of 2.2%. As of February 28, 2022, the present value of the projected future cash flows of the subordinated notes, was approximately $27.9 million, using a 15.0%22.0% discount rate. The Company’s total investment in the subordinate notes of Saratoga CLO is $57.8 which consists of additional investments of $30 million in January 2008, $13.8 million in December 2018 and $14.0 million in February 2021; to2021. To date the Company has since received distributions of $72.8$84.6 million, management fees of $28.6$35.1 million and incentive fees of $1.2 million.
As of February 28, 2023, the Company determined that the fair value of its investment in the subordinated notes of Saratoga CLO was $21.2 million. As of February 28, 2023, the fair value of its investment in the Class F-R-3 Notes of Saratoga CLO was $8.8 million. As of February 28, 2023, Saratoga CLO had investments with a principal balance of $645.6 million and a weighted average spread over LIBOR of 3.8% and had debt with a principal balance of $611.0 million with a weighted average spread over LIBOR of 2.2%. As of February 28, 2023, the present value of the projected future cash flows of the subordinated notes, was approximately $21.2 million, using a 22.0% discount rate. The Company’s total investment in the subordinate notes of Saratoga CLO is $57.8 million, which consists of additional investments of $30 million in January 2008, $13.8 million in December 2018 and $14.0 million in February 2021. As of February 28, 2023, the Company has received distributions of $77.7 million, management fees of $31.9 million and incentive fees of $1.2 million.
The separate audited financial statements of the Saratoga CLO as of February 28, 202229, 2024 and February 28, 2021,2023, pursuant to Rule 3-09 of SEC rules Regulation S-X, and for the years ended February 28, 2022,29, 2024, February 28, 20212023 and February 29, 2020,28, 2022, are presented on page S-1.
Note 5. Investment in SLF JV
On October 26, 2021, the Company and TJHA entered into the LLC Agreement to co-manage SLF JV. SLF JV is invested in Saratoga Investment Corp Senior Loan Fund 2022-1, Ltd (“SLF 2021,2021”), which is a wholly owned subsidiary of SLF JV. SLF 2021 was formed for the purpose of making investments in a diversified portfolio of broadly syndicated first lien and second lien term loans or bonds in the primary and secondary markets.
On September 30, 2022, SLF 2021 was renamed to Saratoga Investment Corp Senior Loan Fund 2022-1, Ltd. (“SLF 2022”).
The Company and TJHA have equal voting interest on all material decisions with respect to SLF JV, including those involving its investment portfolio, and equal control of corporate governance. No management fee is charged to SLF JV as control and management of SLF JV is shared equally.
The Company and TJHA have committed to provide up to a combined $50.0 million of financing to SLF JV through cash contributions, with the Company providing $43.75 million and TJHA providing $6.25 million, resulting in an 87.5% and 12.5% ownership between the two parties. The financing is issued in the form of an unsecured note and equity. The unsecured note will paypays a fixed rate of 10.0%10% per annum and is due and payable in full on June 15, 2023.October 20, 2033. As of February 28, 2022,29, 2024, the Company and TJHA’s investment in SLF JV consisted of an unsecured note of $13.1$17.6 million and $1.9$2.5 million, respectively; and membership interest of $13.1$17.6 million and $1.9$2.5 million, respectively.
For the period from October 26, 2021, through February 28, 2022, the Company earned approximately $0.1 million of interest income related to SLF JV, which is included in interest income. As of February 28, 2022, approximately $0.1 million of interest income related to SLF JV was included in interest receivable.
SLF JV’s2023, the Company and TJHA’s investment in SLF 2021 is in the formJV consisted of an unsecured loan. The unsecured note will pay a floating rate of SOFR plus 7.00% per annum$17.6 million and is due$2.5 million, respectively; and payable in full on June 9, 2023.membership interest of $17.6 million and $2.5 million, respectively. As of February 29, 2024, and February 28, 2022, SLF JV’s2023, the Company’s investment in the unsecured note of SLF 2021JV had an aggregatea fair value of approximately $28.7 million.$15.8 million and $17.6 million, respectively, and the Company’s investment in the membership interests of SLF JV had a fair value of $9.4 million and $13.1 million, respectively.
The Company has determined that SLF JV is an investment company under ASC 946; however, in accordance with such guidance the Company will generally not consolidate its investment in a company other than a wholly-ownedwholly owned investment company subsidiary. SLF JV is not a wholly-ownedwholly owned investment company subsidiary as the Company and TJHA each have an equal 50% voting interest in SLF JV and thus neither party has a controlling financial interest. Furthermore, ASC 810Consolidation concludes that in a joint venture where both members have equal decision making authority, it is not appropriate for one member to consolidate the joint venture since neither has control. Accordingly, the Company does not consolidate SLF JV.
For the year ended February 29, 2024, the Company earned approximately $1.8 million of interest income related to SLF JV, which is included in interest income on the Statement of Operations. As of February 29, 2024, approximately $0.2 million of interest income related to SLF JV was included in interest receivable on the Statements of Assets and Liabilities.
For the year ended February 28, 2023 the Company earned approximately $1.5 million of interest income related to SLF JV, which is included in interest income on the Statements of Operations. As of February 28, 2023, approximately $0.4 million of interest income related to SLF JV was included in interest receivable on the Statements of Assets and Liabilities.
For the period from October 26, 2021, through February 28, 2022, the Company earned approximately $0.1 million of interest income related to SLF JV, which is included in interest income on the Statement of Operations. As of February 28, 2022, approximately $0.1 million of interest income related to SLF JV was included in interest receivable.
For the years ended February 29, 2024, and February 28, 2023 and 2022, the Company earned approximately $5.9 million, $0.0 million and $0.0 million of dividend related to SLF JV, which is included in dividend income on control investments.
SLF JV’s initial investment in SLF 2022 was in the form of an unsecured loan. The unsecured loan paid a floating rate of LIBOR plus 7.00% per annum and was paid in full on June 9, 2023. The unsecured loan was repaid in full on October 28, 2022, as part of the CLO closing.
On October 28, 2022, SLF 2022 issued $402.1 million of the 2022 JV CLO Notes through the JV CLO trust. The 2022 JV CLO Notes were issued pursuant to the JV Indenture, with the Trustee. As part of the transaction, the Company purchased 87.50% of the Class E Notes from SLF 2022 with a par value of $12.25 million. As of February 29, 2024 and February 28, 2023, the fair value of these Class E Notes were $12.3 million and $11.4 million, respectively.
Note 6. Income Taxes
The Company has elected and intends to operate so as to qualify annually to be taxed as a RIC under Subchapter M of the Code and, as such, will not be subject to U.S. federal income tax on the portion of taxable income and gains timely distributed to stockholders.
The Company owns 100.0%100% of Saratoga CLO, an exempted company incorporated in the Cayman Islands. For financial reporting purposes, the Saratoga CLO is not included as part of the consolidated financial statements. For U.S. federal income tax purposes, the Company has requested and received approval from the IRS to treat the Saratoga CLO as a disregarded entity. As such, for U.S. federal income tax purposes and for purposes of meeting the RIC qualification and diversification tests, the results of operations of the Saratoga CLO are included with those of the Company to qualify as a RIC. TheGenerally, the Company is required to meet certain income and asset diversification tests in addition to timely distributing at least 90.0%90% of its investment company taxable income, as defined by the Code. Because U.S. federal income tax regulations differ from U.S. GAAP, distributions as required in accordance with tax regulations may differ from net investment income and realized gains recognized for financial reporting purposes. Differences between these distributions and U.S. GAAP financial results may be permanent or temporary in nature. Permanent differences are reclassified among capital accounts in the consolidated financial statements to reflect their tax character. Differences in classification may also result from the treatment of short-term gains as ordinary income for U.S. federal income tax purposes. As of February 28, 202229, 2024 and February 28, 2021,2023, the Company reclassified for book purposes amounts arising from permanent book/tax differences primarily related to nondeductible U.S. federal excise and capital gains tax and worthless securities losses (dollars in thousands):
| February 28, 2022 | February 28, 2021 | February 29, 2024 | February 28, 2023 | |||||||||||||
| Capital in excess of par value | $ | (4,704 | ) | $ | (16,529 | ) | $ | (779 | ) | $ | 16 | |||||
| Total distributable earnings (loss) | 4,704 | 16,529 | 779 | (16 | ) | |||||||||||
For U.S federal income tax purposes, distributions paid to shareholders are reported as ordinary income, return of capital, long term capital gains or a combination thereof. The tax character of distributions paid for the years ended February 28, 2022,29, 2024, February 28, 20212023 and February 29, 202028, 2022 was as follows (dollars in thousands):
| February 28, 2022 | February 28, 2021 | February 29, 2020 | February 29, 2024 | February 28, 2023 | February 28, 2022 | |||||||||||||||||||
| Ordinary income | $ | 22,033 | $ | 13,747 | $ | 15,292 | $ | 35,636 | $ | 27,313 | $ | 22,033 | ||||||||||||
| Capital gains | - | - | 4,806 | - | - | - | ||||||||||||||||||
| Total | $ | 22,033 | $ | 13,747 | $ | 20,098 | $ | 35,636 | $ | 27,313 | $ | 22,033 | ||||||||||||
For U.S. federal income tax purposes, as of February 29, 2024, the aggregate net unrealized depreciation for all securities was $39.7 million. The aggregate cost of securities for U.S. federal income tax purposes was $1.8 billion.
For U.S. federal income tax purposes, as of February 28, 2022,2023, the aggregate net unrealized appreciationdepreciation for all securities was $21.2$15.5 million. The aggregate cost of securities for U.S. federal income tax purposes was $1.4$1.6 billion.
For federal income tax purposes, as of February 28, 2021, the aggregate net unrealized appreciation for all securities was $12.2 million. The aggregate cost of securities for federal income tax purposes was $1.1 billion.
As of February 28, 202229, 2024 and February 28, 2021,2023, the components of accumulated losses on a tax basis as detailed below differ from the amounts reflected per the Company’s consolidated statements of assets and liabilities by temporary book/tax differences primarily arising from the consolidation of the Saratoga CLO for U.S federal tax purposes, market discount and original issue discount income, interest income accrual on defaulted bonds, write-off of investments, and amortization of organizational expenditures and partnership interests (dollars in thousands).
| February 28, 2022 | February 28, 2021 | February 29, 2024 | February 28, 2023 | |||||||||||||
| Post October loss deferred | $ | - | $ | - | $ | - | $ | - | ||||||||
| Accumulated capital losses | (1,143 | ) | (19,461 | ) | (19,900 | ) | (1,580 | ) | ||||||||
| Other temporary differences | (1,601 | ) | 729 | 6,855 | 1,971 | |||||||||||
| Undistributed Long Term Gain | - | - | - | - | ||||||||||||
| Undistributed ordinary income | 9,898 | 7,903 | 46,215 | 19,771 | ||||||||||||
| Unrealized appreciation (depreciation) | 21,283 | 12,176 | (39,685 | ) | (15,500 | ) | ||||||||||
| Total components of accumulated losses | $ | 28,436 | $ | 1,347 | $ | (6,515 | ) | $ | 4,662 | |||||||
At February 28, 2022,29, 2024, the Company had a short-term capital loss of $0.0 million and a long-term capital loss of $1.1$19.9 million, available to offset future capital gains. At February 28, 202229, 2024 the company utilized $0.3 million of itsdid not utilize any short-term capital losses and $21.0 million of itsor long-term capital losses. Post RIC-modernization act losses are deemed to arise on the first day of the fund’s following fiscal year and there is no expiration for these losses. As of February 28, 2023, the Company had net long-term capital losses of $1.6 million.
Depending on the level of taxable income earned in a tax year, the Company may choose to carry forward taxable income in excess of current year dividend distributions into the next tax year and pay a 4.0% U.S. federal excise tax on such income, as required. To the extent that the Company determines that its estimated current year annual taxable income will be in excess of estimated current year dividend distributions for excise tax purposes, the Company accrues excise tax, if any, on estimated excess taxable income as taxable income is earned. For the calendar years ended December 31, 20212023 and December 31, 2020,2022, the Company did not distribute at least 98% of its ordinary income and 98.2% of its capital gains and accrued $0.7$1.8 million and $0.6$1.1 million in U.S. federal excise taxes on undistributed taxable income for the years ended February 28, 202229, 2024 and February 28, 2021,2023, respectively.
As of February 28, 2022 and 2021, the Company had net long-term capital losses of $1.1 million and $19.5 million.
Management has analyzed the Company’s tax positions taken on U.S. federal income tax returns for all open years (fiscal years 2019- 2022)2020- 2023) and has concluded that no provision for uncertain income tax positions is required in the Company’s consolidated financial statements.
On December 22, 2010, the Regulated Investment Company Modernization Act of 2010 (the “Modernization Act”) was enacted, and the provisions with the Modernization were are effective for the Company for the year ended February 29, 2012. The Modernization Act was the first major piece of legislation affecting RICs since 1986 and it modernized several of the U.S. federal income and U.S. federal excise tax provisions related to RICs. Some highlights of the enacted provisions are as follows:
New capital losses may now be carried forward indefinitely and retain the character of the original loss. Under pre-enactment law, capital losses could be carried forward for eight years, and carried forward as short-term capital, irrespective of the character of the original loss.
The Modernization Act contains simplification provisions, which are aimed at preventing disqualification of a RIC for “inadvertent” failures of the asset diversification and/or qualifying income tests. Additionally, the Modernization Act exempts RICs from the preferential dividend rule and repealed the 60-day designation requirement for certain types of pay-through income and gains.
Finally, the Modernization Act contains several provisions aimed at preserving the character of distributions made by a fiscal year RIC during the portion of its taxable year ending after October 31 or December 31, reducing the circumstances under which a RIC might be required to file amended Forms 1099 to restate previously reported distributions.
SIA-AAP, Inc., SIA-ARC, Inc., SIA-Avionte, Inc., SIA-AX, Inc., SIA-G4, Inc., SIA-GH, Inc., SIA-MAC, Inc., SIA-PEPSIA-MDP, Inc., SIA-PP Inc., SIA-SZ, Inc., SIA-TG, Inc., SIA-TT Inc., SIA-Vector, Inc., and SIA-VR, Inc., each 100% owned by the Company, are each filing standalone C Corporation tax returns for U.S. federal and state tax purposes. As separately regarded entities for tax purposes, these entities are taxedsubject to U.S. federal income tax at normal corporate rates. For tax purposes, any distributions by the entities to the parent company would generally need to be distributed to the Company’s shareholders. Generally, such distributions of the entities’ income to the Company’s shareholders will be considered as qualified dividends for tax purposes. The entities’ taxable net income will differ from U.S. GAAP net income because of deferred tax temporary differences arising from net operating losses and unrealized appreciation and deprecation of securities held. Deferred tax assets and liabilities are measured using enacted corporate federal and state tax rates expected to apply to taxable income in the years in which those net operating losses are utilized and the unrealized gains and losses are realized. Deferred tax assets and deferred tax liabilities are netted off by entity, as allowed. The recoverability of deferred tax assets is assessed and a valuation allowance is recorded to the extent that it is more likely than not that any portion of the deferred tax asset will not be realized on the basis of a history of operating losses combined with insufficient projected taxable income or other taxable events in the taxable blockers.Corporate Blockers. In February 2022, SIA-GH, Inc., SIA-TT Inc. and SIA-VR, Inc. received an approved plan of liquidation following the sale of equity held by each of the portfolio companies.
The Company’s Easy Ice investment was sold during the year ended February 29, 2020. As part of the transaction, the actual legal entity, SIA-Easy Ice, LLC (“Tax Blocker”) that owned the preferred equity was sold. This Tax Blocker was a wholly-owned subsidiary of the Company. For purposes of tax accounting, the Company had an $8.0 million tax basis in the Tax Blocker.
The Company’s V Rental Holdings LLC Class A-1 membership units waswere sold during the year ended February 28, 2022. The tax blockerentity which held this investment, SIA-VR, Inc. will remain in existence for a period of time until all ongoing indemnification obligations are settled, after which it will be dissolved. For purposes of tax accounting, the Company had an $0.4$0.0 million current tax basis in the investment, which resulted in a current income tax payable of $0.4 millionreceivable as of February 28, 2022. 29, 2024.
The Company’s Texas Teachers of Tomorrow, LLC common stock was sold during the year ended February 28, 2022. The tax blockerentity which held this investment, SIA-TT, Inc. will remain in existence for a period of time until all ongoing indemnification obligations are settled, after which it will be dissolved. For purposes of tax accounting, the Company had an $0.8$0.01 million current tax basis in the investment, which resulted in a current income tax payable of $0.6 millionreceivable as of February 28, 2022. 29, 2024.
The Company’s GreyHeller LLC Series A preferred units was sold during the year ended February 28, 2022. The tax blockerentity which held this investment, SIA-TT, Inc. will remain in existence for a period of time until all ongoing indemnification obligations are settled, after which it will be dissolved. For purposes of tax accounting, the Company had an $0.9$0.09 million current tax basis in the investment, which resulted in a current income tax payable of $1.8 millionreceivable as of February 28, 2022.29, 2024.
The Company may distribute a portion of its realized net long term capital gains in excess of realized net short term capital losses to its stockholders, but may also decide to retain a portion, or all, of its net capital gains and elect to pay the 21% U.S. federal tax on the net capital gain, potentially in the form of a “deemed distribution” to its stockholders. Income tax (provision) relating to an election to retain its net capital gains, including in the form of a deemed distribution, is included as a component of income tax (provision) benefit from realized gains on investments, depending on the character of the underlying taxable income (ordinary or capital gains), on the consolidated statements of operations. During the year ended February 28, 2022, the Company paid federal tax of $1.3 million on the undistributed net capital gains it elected to retain for the tax year ended February 28, 2021.
Deferred tax assets and liabilities, and related valuation allowances, as of February 28, 202229, 2024 and February 28, 2021,2023, were as follows:
| February 28, 2022 | February 28, 2021 | |||||||
| Total deferred tax assets | $ | 1,991,241 | $ | 2,108,556 | ||||
| Total deferred tax liabilities | (1,293,496 | ) | (1,987,120 | ) | ||||
| Valuation allowance on net deferred tax assets | (1,946,761 | ) | (2,044,100 | ) | ||||
| Net deferred tax liability | $ | (1,249,016 | ) | $ | (1,922,664 | ) | ||
| February 29, 2024 | February 28, 2023 | |||||||
| Total deferred tax assets | $ | 2,650,580 | $ | 2,542,373 | ||||
| Total deferred tax liabilities | (3,901,995 | ) | (3,008,829 | ) | ||||
| Valuation allowance on net deferred tax assets | (2,539,735 | ) | (2,350,116 | ) | ||||
| Net deferred tax liability | $ | (3,791,150 | ) | $ | (2,816,572 | ) | ||
As of February 28, 2022,29, 2024, the valuation allowance on deferred tax assets was $1.9$2.5 million, which represents the federal and state tax effect of net operating losses and unrealized losses that we do not believe we will realize through future taxable income. Any adjustments to the Company’s valuation allowance will depend on estimates of future taxable income and will be made in the period such determination is made.
Net deferred tax expense (benefit) expense for the year ended February 28, 202229, 2024 includes $0.7$0.9 million net change in unrealized appreciation (depreciation) on investments and $0.0$0.04 million net change in total operating expense (benefit), in the consolidated statement of operations, respectively.
Net deferred tax expense (benefit) for the year ended February 28, 2023 includes $1.7 million net change in unrealized appreciation (depreciation) on investments and $(0.2) million net change in total operating expense, in the consolidated statement of operations, respectively.
Net deferred tax expense (benefit) expense for the year ended February 28, 20212022 includes $0.6$(0.7) million net change in unrealized appreciation (depreciation) on investments and $0.0 million net change in total operating expense, in the consolidated statement of operations, respectively.
Net deferred tax (benefit) expense for the year ended February 29, 2020 includes $(0.4) million net change in unrealized appreciation (depreciation) on investments and $1.0 million net change in total operating expense, in the consolidated statement of operations, respectively.
Deferred tax temporary differences may include differences for state taxes and joint venture interests.
Federal and state income tax provisions (benefits) on investments are as follows:
| February 28, 2022 | February 28, 2021 | February 29, 2020 | February 29, 2024 | February 28, 2023 | February 28, 2022 | |||||||||||||||||||
| Current | ||||||||||||||||||||||||
| Federal | $ | 2,498,515 | $ | - | $ | - | $ | - | $ | (473,475 | ) | $ | 2,498,515 | |||||||||||
| State | 327,021 | - | - | - | (80,273 | ) | 327,021 | |||||||||||||||||
| Net current expense | 2,825,536 | - | - | - | (553,748 | ) | 2,825,536 | |||||||||||||||||
| Deferred | ||||||||||||||||||||||||
| Federal | (444,628 | ) | 461,503 | 480,415 | 990,920 | 1,467,975 | (444,628 | ) | ||||||||||||||||
| State | (227,737 | ) | 113,798 | 127,232 | (16,343 | ) | 99,582 | (227,737 | ) | |||||||||||||||
| Net deferred expense | (672,365 | ) | 575,301 | 607,647 | 974,577 | 1,567,557 | (672,365 | ) | ||||||||||||||||
| Net tax provision | $ | 2,153,171 | $ | 575,301 | $ | 607,647 | $ | 974,577 | $ | 1,013,809 | $ | 2,153,171 | ||||||||||||
The Company has remaining federal net operating loss carryforwards of $0.0$0.03 million which will expire starting in 2037, with the remaining net operating loss carryforwards of $4.2$6.2 million having an indefinite life. In addition, the Company has state net operating loss carryforwards of $1.3$2.5 million, which begin to expire in fiscal year 2026.2029.
Income tax expense was computed by applying the U.S. federal statutory rate of 21% combined with the weighted average state tax rate applicable to each taxable blockerCorporate Blocker based on the states they operate in.
F-45
Note 7. Agreements and Related Party Transactions
Investment Advisory and Management Agreement
On July 30, 2010, the Company entered into the Management Agreement with ourthe Manager. The initial term of the Management Agreement was two years from its effective date, with automatic, one-year renewals at the end of each year,thereafter subject to certain approvals by ourthe Company’s board of directors and/or the Company’s stockholders. OnMost recently, on July 6, 2021, our2023, the Company’s board of directors approved the renewal of the Management Agreement for an additional one-year term. Pursuant to the Management Agreement, ourthe Manager implements ourthe Company’s business strategy on a day-to-day basis and performs certain services for us,the Company, subject to oversight by ourthe board of directors. OurThe Manager is responsible for, among other duties, determining investment criteria, sourcing, analyzing and executing investments transactions, asset sales, financings and performing asset management duties. Under the Management Agreement, we have agreed to pay ourthe Company pays the Manager a management fee for investment advisory and management services consisting of a base management fee and an incentive management fee.
Base Management Fee and Incentive Management Fee
The base management fee of 1.75% per year is calculated based on the average value of our gross assets (other than cash or cash equivalents, but including assets purchased with borrowed funds) at the end of the two most recently completed fiscal quarters. The base management fee is paid quarterly following the filing of the most recent quarterly report on Form 10-Q.
The incentive management fee consists of the following two parts:
The first, payable quarterly in arrears, equals 20.0%20% of ourthe Company’s pre-incentive fee net investment income, expressed as a rate of return on the value of our net assets at the end of the immediately preceding quarter, that exceeds a 1.875% quarterly hurdle rate measured as of the end of each fiscal quarter, subject to a “catch-up” provision. Under this provision, in any fiscal quarter, ourthe Manager receives no incentive fee unless our pre-incentive fee net investment income exceeds the hurdle rate of 1.875%. OurThe Manager will receive 100.0%100% of pre-incentive fee net investment income, if any, that exceeds the hurdle rate but is less than or equal to 2.344% in any fiscal quarter; and 20.0%20% of the amount of our pre-incentive fee net investment income, if any, that exceeds 2.344% in any fiscal quarter. There is no accumulation of amounts on the hurdle rate from quarter to quarter, and accordingly there is no claw back of amounts previously paid if subsequent quarters are below the quarterly hurdle rate, and there is no delay of payment if prior quarters are below the quarterly hurdle rate.
The second part of the incentive fee is determined and payable in arrears as of the end of each fiscal year (or upon termination of the Management Agreement) and equals 20.0%20% of ourthe Company’s “incentive fee capital gains,” which equals ourthe Company’s realized capital gains on a cumulative basis from May 31, 2010 through the end of the fiscal year, if any, computed net of all realized capital losses and unrealized capital depreciation on a cumulative basis on each investment in the Company’s portfolio, less the aggregate amount of any previously paid capital gain incentive fee. Importantly, the capital gains portion of the incentive fee is based on realized gains and realized and unrealized losses from May 31, 2010. Therefore, realized and unrealized losses incurred prior to such time will not be taken into account when calculating the capital gains portion of the incentive fee, and ourthe Manager will be entitled to 20.0% of incentive fee capital gains that arise after May 31, 2010. In addition, for the purpose of the “incentive fee capital gains” calculations, the cost basis for computing realized gains and losses on investments held by us as of May 31, 2010 will equal the fair value of such investments as of such date.
For the years ended February 28, 2022,29, 2024, February 28, 20212023 and February 29, 2020,28, 2022, the Company incurred $11.9$19.2 million, $9.1$16.4 million and $8.1$11.9 million in base management fees, respectively. For the years ended February 28, 2022,29, 2024, February 28, 20212023 and February 29, 2020,28, 2022, the Company incurred $6.4$13.0 million, $5.4$6.8 million and $5.8$6.4 million in incentive fees related to pre-incentive fee net investment income. For the years ended February 29, 2024, February 28, 2023 and February 28, 2022, February 28, 2021 and February 29, 2020, wethe Company accrued $5.5$(8.3) million, $0.0$(1.8) million and $8.4$5.5 million, respectively, in incentive fees related to capital gains.
The accrual is calculated using both realized and unrealized capital gains for the period. The actual incentive fee related to capital gains will be determined and payable in arrears at the end of the fiscal year and will include only realized capital gains for the period. As of February 28, 2022,29, 2024, the base management fees accrual was $3.2$5.0 million and the incentive fees accrual was $9.8$3.2 million and isare included in base management and incentive fees payable in the accompanying consolidated statements of assets and liabilities. As of February 28, 2021,2023, the base management fees accrual was $2.4$4.3 million and the incentive fees accrual was $13.8$7.9 million and isare included in base management and incentive fees payable in the accompanying consolidated statements of assets and liabilities.
Administration Agreement
On July 30, 2010, the Company entered into a separate administration agreement (the “Administration Agreement”) with ourthe Manager, pursuant to which ourthe Manager, as ourthe Company’s administrator, has agreed to furnish usthe Company with the facilities and administrative services necessary to conduct our day-to-day operations and provide managerial assistance on ourthe Company’s behalf to those portfolio companies to which we arethe Company is required to provide such assistance. The initial term of the Administration Agreement was two years from its effective date, with automatic, one-year renewals at the end of each yearthereafter subject to certain approvals by ourthe Company’s board of directors and/or ourthe Company’s stockholders. The amount of expenses payable or reimbursable thereunder by the Company was capped at $1.0 million for the initial two-year term of the Administration Agreement and subsequent renewals. OnMost recently, on July 8, 2015, our6, 2023, the Company’s board of directors approved the renewal of the Administration Agreement for an additional one-year term and determined to increase the cap on the payment or reimbursement of expenses by the Company thereunder, which had not beensubsequently increased since the inception of the agreement, to $1.3 million. On July 7, 2016, our board of directors approved the renewal of the Administration Agreement for an additional one-year term. On October 5, 2016, our board of directors determined to increase the cap on the payment or reimbursement of expenses by the Company under the Administration Agreement, from $1.3 million to $1.5 million, effective November 1, 2016. On July 11, 2017, our board of directors approved the renewal of the Administration Agreement for an additional one-year term and determined to increase the cap on the payment or reimbursement of expenses by the Company from $1.5$3.275 million to $1.75$4.3 million, effective August 1, 2017. On July 9, 2018, our board of directors approved the renewal of the Administration Agreement for an additional one-year term and determined to increase the cap on the payment or reimbursement of expenses by the Company from $1.75 million to $2.0 million, effective August 1, 2018. On July 9, 2019, our board of directors approved the renewal of the Administration Agreement for an additional one-year term and determined to increase the cap on the payment or reimbursement of expenses by the Company from $2.0 million to $2.225 million effective August 1, 2019. On July 7, 2020, our board of directors approved the renewal of the Administration Agreement for an additional one-year term and determined to increase the cap on the payment or reimbursement of expenses by the Company from $2.225 million to $2.775 million effective August 1, 2020. On July 6, 2021, our board of directors approved the renewal of the Administration Agreement for an additional one-year term and determined to increase the cap on the payment or reimbursement of expenses by the Company from $2.775 million to $3.0 million effective August 1, 2021.2023.
For the years ended February 29, 2024, February 28, 2023 and February 28, 2022, February 28, 2021 and February 29, 2020, we recognized $2.9$3.9 million, $2.5$3.2 million and $2.1$2.9 million in administrator expenses, respectively, pertaining to bookkeeping, recordkeeping and other administrative services provided to us in addition to our allocable portion of rent and other overhead related expenses. As of February 28, 2022, $0.329, 2024, $0.5 million of administrator expenses were accrued and included in due to managerManager in the accompanying consolidated statements of assets and liabilities. As of February 28, 2021, $0.32023, $0.001 million of administrator expenses were accrued and included in due to managerManager in the accompanying consolidated statements of assets and liabilities.
Saratoga CLO
On August 7, 2018, the Company entered into an unsecured loan agreement with CLO 2013-1 Warehouse, a wholly-owned subsidiary of Saratoga CLO, pursuant to which CLO 2013-1 Warehouse may borrow from time to time up to $20 million from the Company in order to provide capital necessary to support warehouse activities. The CLO 2013-1 Warehouse Loan, which expired on February 7, 2020, bears interest at an annual rate of 3M USD LIBOR + 7.5%.
On December 14, 2018, the Company completed the third refinancing and issuance of the 2013-1 Reset CLO Notes. This refinancing, among other things, extended the Saratoga CLO reinvestment period to January 2021, and extended its legal maturity to January 2030. A non-call period ending January 2020 was also added. In addition, and as part of the refinancing, the Saratoga CLO has also been upsized from $300 million in assets to approximately $500 million. As part of this
In conjunction with the third refinancing and upsizing,issuance of the 2013-1 Reset CLO Notes on December 14, 2018, the Company investedis no longer entitled to receive an incentive management fee from Saratoga CLO. See Note 4 for additional $13.8 million in all of the newly issued subordinated notes of the Saratoga CLO, and purchased $2.5 million in aggregate principal amount of the Class F-R-2 Notes tranche and $7.5 million in aggregate principal amount of the Class G-R-2 Notes tranche at par. Concurrently, the existing $4.5 million of Class F notes and $20.0 million CLO 2013-1 Warehouse Loan were repaid. The Company also paid $2.0 million of transaction costs related to the refinancing and upsizing on behalf of the Saratoga CLO, to be reimbursed from future equity distributions. During the year ended February 29, 2020, the Company received full payment of $1.7 million from the Saratoga CLO for such transaction costs.information.
On February 11, 2020, we entered into an unsecured loan agreement (“CLO 2013-1 Warehouse 2 Loan”) with Saratoga Investment Corp. CLO 2013-1 Warehouse 2, Ltd (“CLO 2013-1 Warehouse 2”), a wholly-owned subsidiary of Saratoga Investment Corp. CLO 2013-1, Ltd. pursuant to which CLO 2013-1 Warehouse 2 may borrow from time to time up to $20.0 million from the Company in order to provide capital necessary to support warehouse activities. On October 23, 2020, the CLO 2013-1 Warehouse 2 Loan was increased to $25.0 million availability, which was immediately fully drawn and, which expires on August 20, 2021. The interest rate was also amended to be based on a pricing grid, starting at an annual rate of 3M USD LIBOR + 4.46%.
On February 26, 2021, the Company completed the fourth refinancing of the Saratoga CLO. This refinancing, among other things, extended the Saratoga CLO reinvestment period to April 2024, and extended its legal maturity to April 2033. A2033, and extended the non-call period endingto February 2022 was also added.2022. In addition, and as part of the refinancing, the Saratoga CLO has also beenwas upsized from $500 million in assets to approximately $650 million. As part of this refinancing and upsizing, the Company invested an additional $14.0 million in all of the newly issued subordinated notes of the Saratoga CLO, and purchased $17.9 million in aggregate principal amount of the Class F-R-3 Notes tranche at par. Concurrently, the existing $2.5 million of Class F-R-2 Notes, $7.5 million of Class G-R-2 Notes and $25.0 million CLO 2013-1 Warehouse 2 Loan were repaid. The Company also paid $2.6 million of transaction costs related to the refinancing and upsizing on behalf of the Saratoga CLO, to be reimbursed from future equity distributions. At August 31,November 30, 2021, the outstanding receivable of 2.6 million was repaid in full.
DuringOn August 9, 2021, the year endedCompany exchanged its existing $17.9 million Class F-R-3 Notes for $8.5 million Class F-1-R-3 Notes and $9.4 million Class F-2-R-3 Notes at par. On August 11, 2021, the Company sold its Class F-1-R-3 Notes to third parties, resulting in a realized loss of $0.1 million.
As of February 29, 2024, and February 28, 2021,2023, the maximum amount invested byCompany’s investment in the Class F-2-R-3 Note of the Saratoga CLO had a fair value of $8.9 million and $8.8 million, respectively. In addition, the Company inhas no outstanding receivable balance from the Class F-2-R-3 Note of the Saratoga CLO, 2013-1 Warehouse 2 Loan amounted to $25.0 million, with interest incomeas of $0.7 million recognized related to the CLO 2013-1 Warehouse 2 Loan and is included in interest from investments on the Company’s consolidated statement of operations for the year ended February 28, 2021.29, 2024.
For the years ended February 29, 2024, February 28, 2023, and February 28, 2022, we recognized $1.5 million, $1.2 million and $0.5 million in interest income, respectively, related to the Class F-2-R-3 Note of the Saratoga CLO.
As of February 29, 2024, and February 28, 20212023, the Company’s investment in the Subordinated Note of the Saratoga CLO had a fair value of $9.5 million and $21.2 million, respectively. In addition, the Company has no outstanding receivable balance from the Subordinated Note of the Saratoga CLO, as of February 29, 2024.
For the years ended February 29, 2024, February 28, 2023, and February 29, 2020,28, 2022, we recognized $3.3 million, $2.5$3.3 million and $2.5$3.3 million in management fee income, respectively, related to the Subordinated Note of the Saratoga CLO.
In conjunction withFor the third refinancingyears ended February 29, 2024, February 28, 2023, and issuanceFebruary 28, 2022, we recognized $0.0 million, $1.2 million and $4.4 million in interest income, respectively, related to the Subordinated Note of the 2013-1 Reset CLO Notes on December 14, 2018,Saratoga CLO.
For the years ended February 29, 2024, February 28, 2023, and February 28, 2022, the Company is no longer entitled to receive an incentive management feeneither bought nor sold any investments from the Saratoga CLO. See Note 4 for additional information.
SLF JV
On October 26, 2021, the Company and TJHA entered into an LLC Agreement to co-manage the SLF JV. SLF JV is a joint venture that is expected to investinvests in the debt or equity interests of collateralized loan obligations, loan, notes and other debt instruments. The Company records interest income from its investment in an unsecured loan with SLF JV on an accrual basis and records dividend income from its membership interest when earned. All operating decisions are shared with a 50% voting interest in SLF JV.
On October 28, 2022, SLF 2022 issued $402.1 million of the 2022 JV CLO Notes through the JV CLO trust. The 2022 JV CLO Notes were issued pursuant to the JV Indenture, with the Trustee.
As of February 29, 2024 and February 28, 2022,2023 respectively, the Company’s investment in the SLF JV had a fair value of $25.1$25.2 million and $30.7 million, consisting of an unsecured loan of $13.1$15.8 million and $17.6 million, and membership interest of $12.0$9.4 million and $13.1 million. In addition, approximately $0.3 million and $0.4 million of interest income related to SLF JV was included in interest receivable on the Statement of Assets and Liabilities.
For the years ended February 29, 2024, February 28, 2023, and February 28, 2022, we recognized $1.8 million, $1.5 million and $0.1 million in interest income on the consolidated statement of operations, respectively, related to the SLF JV.
For the years ended February 29, 2024, and February 28, 2023 and 2022, the we recognized $5.9 million, $0.0 million and $0.0 million of dividend income on the consolidated statement of operations, respectively, related to the SLF JV.
As part of the JV CLO trust transaction, the Company hadpurchased 87.50% of the Class E Notes from SLF 2022 with a receivablepar value of $0.1 million outstanding from the SLF JV, included in Due from Affiliate in the consolidated statements of assets and liabilities.$12.25 million.
Note 8. Borrowings
Credit Facility
As a BDC, we are only allowed to employ leverage to the extent that our asset coverage, as defined in the 1940 Act, equals at least 200% after giving effect to such leverage, or, 150% if certain requirements under the 1940 Act are met. On April 16, 2018, as permitted by the Small Business Credit Availability Act, which was signed into law on March 23, 2018, our board of directors, including a majority of our directors who are not “interested persons” (as defined in Section 2(a)(19) of the 1940 Act”) of the Company (“independent directors,directors”), approved a minimum asset coverage ratio of 150%. The 150% asset coverage ratio became effective on April 16, 2019. The amount of leverage that we employ at any time depends on our assessment of the market and other factors at the time of any proposed borrowing. Our asset coverage ratio, as defined in the 1940 Act, was 209.3%161.1% as of February 29, 2024 and 165.9% as of February 28, 2022 and 347.1% as of February 28, 2021.2023.
On April 11, 2007, we entered into a $100.0 million revolving securitized credit facility (the “Revolving Facility”). On May 1, 2007, we entered into a $25.7 million term securitized credit facility (the “Term Facility” and, together with the Revolving Facility, the “Facilities”), which was fully drawn at closing. In December 2007, we consolidated the Facilities by using a draw under the Revolving Facility to repay the Term Facility. In response to the market wide decline in financial asset prices, which negatively affected the value of our portfolio, we terminated the revolving period of the Revolving Facility effective January 14, 2009 and commenced a two-year amortization period during which all principal proceeds from the collateral were used to repay outstanding borrowings. A significant percentage of our total assets had been pledged under the Revolving Facility to secure our obligations thereunder. Under the Revolving Facility, funds were borrowed from or through certain lenders and interest was payable monthly at the greater of the commercial paper rate and our lender’s prime rate plus 4.00% plus a default rate of 2.00% or, if the commercial paper market was unavailable, the greater of the prevailing LIBOR rates and our lender’s prime rate plus 6.00% plus a default rate of 3.00%.
On July 30, 2010, we used the net proceeds from (i) the stock purchase transaction and (ii) a portion of the funds available to us under the $45.0 million senior secured revolving credit facility with Madison Capital Funding LLC (the “Madison Credit Facility”), in each case, to pay the full amount of principal and accrued interest, including default interest, outstanding under the Revolving Facility. As a result, the Revolving Facility was terminated in connection therewith. Substantially all of our total assets, other than those held by SBIC LP, and SBIC II LP wasand SBIC III LP, were pledged under the Madison Credit Facility to secure our obligations thereunder.
On February 24, 2012, we amended the Madison Credit Facility to, among other things:
On September 17, 2014, we entered into a second amendment to the Madison Credit Facility to, among other things:
On May 18, 2017, we entered into a third amendment to the Madison Credit Facility to, among other things:
On April 24, 2020, we entered into a fourth amendment to the Madison Credit Facility to, among other things:
On September 14, 2020, we entered into a fifth amendment to the Madison Credit Facility to, among other things:
On September 13, 2021, we entered into a sixth amendment to the Madison Credit Facility to, among other things:
On October 4, 2021, all outstanding amounts on the Madison Credit Facility were repaid and the Madison Credit Facility was terminated. The repayment and termination of the Madison Credit Facility resulted in a realized loss on the extinguishment of debt of $0.8 million.
In addition to any fees or other amounts payable under the terms of the Madison
Encina Credit Facility an administrative agent fee per annum equal to $0.1 million is payable in equal monthly installments in arrears.
On October 4, 2021, the Company entered into the Credit and Security Agreement (the “Encina Credit Agreement”) relating to a $50.0 million senior secured revolving credit facility with the Lender, supported by loans held by SIF II and pledged to the Encina Credit Facility. During the first two years following the closing date, SIF II may request an increase in the commitment amount to up to $75.0 million. The terms of the Encina Credit Facility requirerequired a minimum drawn amount of $12.5 million at all times during the first six months following the closing date, which increasesincreased to the greater of $25.0 million or 50% of the commitment amount in effect at any time thereafter. The term of the Encina Credit Facility is three years. Advances under the Encina Credit Facility bearoriginally bore interest at a floating rate per annum equal to LIBOR plus 4.0%, with LIBOR having a floor of 0.75%, with customary provisions related to the selection by the Lender and the Company of a replacement benchmark rate. The commitment termination date is October 4, 2024.
On January 27, 2023, we entered into the first amendment to the Encina Credit Agreement to, among other things:
| ● | increase the borrowings available under the Encina Credit Facility from up to $50.0 million to up to $65.0 million; |
| ● | change the underlying benchmark used to compute interest under the Encina Credit Agreement from LIBOR to Term SOFR for a one-month tenor plus a 0.10% credit spread adjustment; |
| ● | increase the applicable effective margin rate on borrowings from 4.00% to 4.25%; |
| ● | extend the revolving period from October 4, 2024 to January 27, 2026; |
| ● | extend the period during which the borrower may request one or more increases in the borrowings available under the Encina Credit Facility (each such increase, a “Facility Increase”) from October 4, 2023 to January 27, 2025, and increased the maximum borrowings available pursuant to the Encina Facility Increase from $75.0 million to $150.0 million; |
| ● | revise the eligibility criteria for eligible collateral loans to exclude certain industries in which an obligor or related guarantor may be involved; and |
| ● | amend the provisions permitting the borrower to request an extension in the Commitment Termination Date (as defined in the Encina Credit Agreement) to allow requests to extend any applicable Commitment Termination Date, rather than a one-time request to extend the original Commitment Termination Date, subject to a notice requirement. |
In addition to any fees or other amounts payable under the terms of the Encina Credit Facility, an administrative agent fee per annum equal to $0.1 million is payable in equal monthly installments in arrears.
As of February 28, 202229, 2024 and February 28, 2021,2023, there were $12.5$35.0 million and $0.0$32.5 million outstanding borrowings under the Encina Credit Facility and Madison Credit Facility, respectively.Facility. During the applicable periods, the Company was in compliance with all of the limitations and requirements of both facilities.under the Encina Credit Agreement. Financing costs of $1.4$2.0 million related to the Encina Credit Facility have been capitalized and are being amortized over the term of the facility.facility, with all existing financing costs amortized through January 27, 2026 from the date of the amendment and extension. For the years ended February 29, 2024, February 28, 2023 and February 28, 2022, February 28, 2021 and February 29, 2020, we recorded $0.8$3.9 million, $0.5$2.0 million and $0.6$0.8 million of interest expense related to the Encina Credit Facility and the Madison Credit Facility, respectively, which includes commitment and administrative agent fees.
For the years ended February 29, 2024, February 28, 2023 and February 28, 2022, February 28, 2021 and February 29, 2020, we recorded $0.3$0.5 million, $0.1$0.5 million and $0.09$0.3 million of amortization of deferred financing costs related to the Encina Credit Facility and Madison Credit Facility, respectively. Interest expense and amortization of deferred financing costs are reported as interest and debt financing expenseexpenses on the consolidated statements of operations. For the fiscal year ended February 29, 2024, the average borrowings outstanding and the weighted average interest rate on outstanding borrowings under the Encina Credit Facility was approximately $37.9 million and 9.66%, respectively. For the fiscal year ended February 28, 2023, the average borrowings outstanding and the weighted average interest rate on outstanding borrowings under the Encina Credit Facility and the Madison Credit Facility were approximately $26.3 million and 6.72%, respectively. For the fiscal year ended February 28, 2022, the average borrowings outstanding and the weighted average interest rate on outstanding borrowings under the Encina Credit Facility and the Madison Credit Facility were approximately $8.7 million and 5.22%, respectively. For the fiscal year ended February 28, 2021, the average borrowings outstanding and the weighted average interest rate on outstanding borrowings under the Encina Credit Facility and the Madison Credit Facility were approximately $1.8 million and 0.17%, respectively. For the fiscal year ended February 29, 2020, the average borrowings outstanding and the weighted average interest rate on outstanding borrowings under the Madison Credit Facility were approximately $0.6 million and 6.66%, respectively.
The Encina Credit Facility contains limitations as to how borrowed funds may be used, such as restrictions on industry concentrations, asset size, weighted average life, currency denomination and collateral interests. The Encina Credit Facility also includes certain requirements relating to portfolio performance, the violation of which could result in the limit of further advances and, in some cases, result in an event of default, allowing the lenders to accelerate repayment of amounts owed thereunder. The Encina Credit Facility has a three-year term. Availability on the Encina Credit Facility will be subject to a borrowing base calculation, based on, among other things, applicable advance rates (which vary from 50.0% to 75.0% of par or fair value depending on the type of loan asset) and the value of certain “eligible” loan assets included as part of the borrowing base. Funds may be borrowed at the greater of the prevailing one-month LIBORSOFR rate, and 0.75%, plus an applicable effective margin of 4.00%4.25%. In addition, the Company will pay the lender a commitment fee of 0.75% per year (or 0.50% if the ratio of advances outstanding to aggregate commitments is greater than or equal to 50%) on the unused amount of the Encina Credit Facility.
Our borrowing base under the Encina Credit Facility was $50.0$35.0 million subject to the Encina Credit Facility cap of $50.0$65.0 million at February 28, 2022.29, 2024. For purposes of determining the borrowing base, most assets are assigned the values set forth in our most recent Annual Report on Form 10-K or Quarterly Report on Form 10-Q filed with the U.S. Securities and Exchange Commission (“SEC”). Accordingly, the February 28, 202229, 2024 borrowing base relies upon the valuations set forth in the Quarterly Report on Form 10-K10-Q for the period ended November 30, 20212023. The valuations presented in this Quarterly Report on Form 10-K10-Q will not be incorporated into the borrowing base until after this Annual Report on Form 10-K is filed with the SEC.
SBA Debentures
Our wholly-ownedThe Company’s wholly owned subsidiaries, SBIC subsidiaries are able to borrow fundsLP, SBIC II LP, and SBIC III LP, received SBIC licenses from the SBA against regulatory capital (which approximates equity capital) that is paid in and is subject to customary regulatory requirements including but not limited to an examination by the SBA.
Onon March 28, 2012, August 14, 2019, the Company’s wholly-owned subsidiary,and September 29, 2022, respectively. SBIC II LP, received an SBIC license from the SBA. The newLP’s license provides up to $175.0$150.0 million in additional long-term capital in the form of SBA debentures. As a result of the 2016 omnibus spending bill signed into law in December 2015,debentures, while SBIC II LP’s and SBIC III LP’s SBIC licenses each provide up to $175.0 million. Under current SBIC regulations, for two or more SBICs under common control, the maximum amount of SBA-guaranteedoutstanding SBA debentures that affiliated SBIC funds can have outstanding was increased from $225.0 million tocannot exceed $350.0 million. With this license approval, Saratoga will grow itsFollowing the debentures being fully repaid to the SBA, relationship from $150.0 million to $325.0 million of committed capital.
As of February 28, 2022, we have funded SBIC LP and SBIC II LP with an aggregate total of equitysurrendered its license on January 3, 2024, providing the Company access to all undistributed capital of $75.0 million and $87.5 million, respectively, and have $185.0 million in SBA-guaranteed debentures outstanding, of which $86.0 million is held in SBIC LP and $99.0 million held in SBIC II LP. SBA debentures are non-recourse to us, have a 10-year maturity, and may be prepaid at any time without penalty. The interest rate of SBA debentures is fixed at the time of issuance, often referred to as pooling, at a market-driven spread over 10-year U.S. Treasury Notes. SBA current regulations limit the amount that SBIC LP and SBIC II LP may borrow to a maximum of $150.0 million and $175.0 million, respectively, which is up to twice its potential regulatory capital.
SBICs are designed to stimulate the flow of private equity capital to eligible small businesses. Under SBA regulations, SBICs may make loans to eligible small businesses and invest in the equity securities of small businesses. Under present SBA regulations, eligible small businesses include businesses that have a tangible net worth not exceeding $19.5$24.0 million and have average annual fully taxed net income not exceeding $6.5$8.0 million for the two most recent fiscal years. In addition, an SBIC must devote 25.0% of its investment activity to ’’smaller’’ concerns“smaller enterprises” as defined by the SBA. A smaller concernenterprise is one that has a tangible net worth not exceeding $6.0 million and has average annual fully taxed net income not exceeding $2.0 million for the two most recent fiscal years. SBA regulations also provide alternative size standard criteria to determine eligibility, which depend on the industry in which the business is engaged and are based on such factors as the number of employees and gross sales. According to SBA regulations, SBICs may make long-term loans to small businesses, invest in the equity securities of such businesses and provide them with consulting and advisory services.
The Company’s wholly owned SBIC LP andSubsidiaries are able to borrow funds from the SBA against each SBIC’s regulatory capital (which generally approximates equity capital in the respective SBIC). The SBIC II LPSubsidiaries are subject to regulation and oversightcustomary regulatory requirements including but not limited to, a periodic examination by the SBA includingand requirements with respect to maintainingmaintain certain minimum financial ratios and other covenants. Receipt of an SBIC license does not assure that the SBIC II LPSubsidiaries will receive SBA-guaranteed debenture funding, which is dependent upon the SBIC II LP continuing to be in complianceSubsidiaries complying with SBA regulations and policies. The SBA, as a creditor, will have a superior claim to each SBIC LP and SBIC II LPSubsidiaries’ assets over ourthe Company’s stockholders and debtholders in the event we liquidatethat the Company liquidates such SBIC LP and SBIC II LPSubsidiary or the SBA exercises its remedies under the SBA-guaranteed debentures issued by the SBIC LP and SBIC II LPSubsidiary upon an event of default.
The Company received exemptive relief from the SEC to permit it to exclude the debt of the SBIC subsidiaries guaranteed by the SBA from the definition of senior securities in the asset coverage test under the 1940 Act. This allows the Company increased flexibility under the asset coverage testrequirement by permitting it to borrow up to $325.0$350.0 million more than it would otherwise be able to absent the receipt of this exemptive relief. On April 16, 2018, as permitted
As of February 29, 2024, we have funded SBIC II LP and SBIC III LP with an aggregate total of equity capital of $87.5 million and $66.7 million, respectively, and have $214.0 million in SBA-guaranteed debentures outstanding, of which $175.0 million was held by the Small Business Credit Availability Act, which was signed into law on March 23, 2018, the board of directors, including a majority of our independent directors, of the Company approved of the Company becoming subject to a minimum asset coverage ratio of 150.0% from 200% under Sections 18(a)(1)SBIC II LP and 18(a)(2) of the Investment Company Act, as amended. The 150.0% asset coverage ratio became effective on April 16, 2019.$39.0 million held in SBIC III LP.
At February 28, 202229, 2024 and February 28, 2021,2023, there was $185.0$214.0 million and $158.0$202.0 million outstanding of SBA debentures, respectively. The carrying amount of the amount outstanding of SBA debentures approximates its fair value, which is based on a waterfall analysis showing adequate collateral coverage and would be classified as a Level 3 liability within the fair value hierarchy. Financing costs of $5.0 million, $6.0, and $4.8$0.4 million related to the SBA debentures issued by SBIC LP, SBIC II LP and SBIC IIIII LP, respectively, have been capitalized and are being amortized over the term of the commitment and drawdown. During the year ended February 28, 2022,29, 2024, the Company repaid $38.0$27.0 million of SBA debentures, resulting in a realized loss on extinguishment of $0.2$0.1 million related to the acceleration of deferred debt financing costs.
For the years ended February 29, 2024, February 28, 2023 and February 28, 2022, February 28, 2021 and February 29, 2020, we recorded $4.7$6.2 million, $5.5$6.4 million and $4.8$4.7 million of interest expense related to the SBA debentures, respectively. For the years ended February 29, 2024, February 28, 2023 and February 28, 2022, February 28, 2021 and February 29, 2020, we recorded $0.7$1.0 million, $0.6$1.0 million and $0.5$0.7 million of amortization of deferred financing costs related to the SBA debentures, respectively. Interest expense and amortization of deferred financing costs are reported as interest and debt financing expense on the consolidated statements of operations. The weighted average interest rate during the years ended February 28, 2022,29, 2024, February 28, 20212023 and February 29, 202028, 2022 on the outstanding borrowings of the SBA debentures was 2.60%3.08%, 3.25%2.78% and 3.23%2.60%, respectively. During the years ended February 28, 202229, 2024 and February 28, 2021,2023, the average dollar amount of SBA debentures outstanding was $180.4$202.5 million and $169.3$229.9 million, respectively.
In December 2015, the 2016 omnibus spending bill approved by Congress and signed into law by the President increased the amount of SBA-guaranteed debentures that affiliated SBIC funds can have outstanding from $225.0 million to $350.0 million, subject to SBA approval. SBA regulations previously limited the amount of SBA-guaranteed debentures that an SBIC may issue to $150.0 million when it has at least $75.0 million in regulatory capital but this has increased to $175.0 million for new licenses when it has at least $87.5 million in regulatory capital. Affiliated SBICs are permitted to issue up to a combined maximum amount of $350.0 million in SBA-guaranteed debentures when they have at least $175.0 million in combined regulatory capital.
Notes
In May 10, 2013, the Company issued $48.3 million in aggregate principal amount of 7.50% fixed-rate notes due 2020 (the “2020 Notes”). The 20206.25% 2025 Notes were redeemed in full on January 13, 2017 and are no longer listed on the NYSE.
On May 29, 2015, the Company entered into a Debt Distribution Agreement with Ladenburg Thalmann & Co. through which the Company may offer for sale, from time to time, up to $20.0 million in aggregate principal amount of the 2020 Notes through an At-the-Market (“ATM”) offering. Prior to the 2020 Notes being redeemed in full, the Company had sold 539,725 bonds with a principal of $13.5 million at an average price of $25.31 for aggregate net proceeds of $13.4 million (net of transaction costs).
On December 21, 2016, the Company issued $74.5 million in aggregate principal amount of our 6.75% fixed-rate notes due 2023 (the “2023 Notes”) for net proceeds of $71.7 million after deducting underwriting commissions of approximately $2.3 million and offering costs of approximately $0.5 million. The net proceeds from the offering were used to repay all of the outstanding indebtedness under the 2020 Notes (as described above), and for general corporate purposes in accordance with our investment objective and strategies.
On December 21, 2019 and February 7, 2020, the Company redeemed $50.0 million and $24.5 million, respectively, in aggregate principal amount of the $74.5 million in aggregate principal amount of issued and outstanding 2023 Notes. The 2023 Notes were listed on the NYSE under the trading symbol “SAB” with a par value of $25.00 per share, and have been delisted following the redemption.
For the year ended February 28, 2019, we recorded $5.0 million of interest expense and $0.4 million of amortization of deferred financing cost related to the 2023 Notes. Interest expense and amortization of deferred financing cost are reported as interest and debt financing expense on the consolidated statements of operations. During the years ended February 28, 2019 the average dollar amount of 2023 Notes outstanding was $74.5 million.
On August 28, 2018, the Company issued $40.0 million in aggregate principal amount of our 6.25% fixed-rate notes due 2025 (the “6.25% 2025 Notes”) for net proceeds of $38.7 million after deducting underwriting commissions of approximately $1.3 million. Offering costs incurred were approximately $0.3 million. The issuance included the full exercise of the underwriters’ option to purchase an additional $5.0 million in aggregate principal amount of 6.25% 2025 Notes within 30 days. Interest on the 6.25% 2025 Notes is paid quarterly in arrears on February 28, May 31, August 31 and November 30, at a rate of 6.25% per year, beginning November 30, 2018. The 6.25% 2025 Notes mature on August 31, 2025 and commencing August 31, 2021, may be redeemed in whole or in part at any time or from time to time at our option. The net proceeds from the offering were used for general corporate purposes in accordance with ourthe Company’s investment objective and strategies. Financing costs of $1.6 million related to the 6.25% 2025 Notes have been capitalized and are beingwere amortized over the term of the 6.25% 2025 Notes.
On February 5, 2019, the Company completed a re-opening and up-sizing of its existing 6.25% 2025 Notes by issuingissued an additional $20.0 million in aggregate principal amount of the 6.25% 2025 Notes for net proceeds of $19.2 million after deducting underwriting commissions of approximately $0.6 million and discount of $0.2 million. Offering costs incurred were approximately $0.2 million. The issuance included the full exercise of the underwriters’ option to purchase an additional $2.5 million in aggregate principal amount of 6.25% 2025 Notes within 30 days. Interest rate, interest payment dates and maturity remain unchanged fromThe additional 6.25% 2025 Notes were treated as a single series with the existing 6.25% 2025 Notes issued in August 2018.under the indenture and have the same terms as the existing 6.25% 2025 Notes. The net proceeds from this offering were used for general corporate purposes in accordance with ourthe Company’s investment objective and strategies. The financing costs and discount of $1.0 million related to the 6.25% 2025 Notes have been capitalized and are beingwere amortized over the term of the 6.25% 2025 Notes.
On August 31, 2021, the Company redeemed $60.0 million in aggregate principal amount of issued and outstanding 6.25% 2025 Notes at par ($25 per note), plus the accrued and unpaid interest thereon, through, but excluding, the redemption date of August 31, 2021.Notes. The 6.25% 2025 Notes were listed on the NYSE under the trading symbol of “SAF” and have been delisted effective as of August 31, 2021, following the full redemption.
Atredemption on August 31, 2021, the debt was extinguished.2021. As such, it was not fair valued with market quotes and is not fair value leveled. As of February 28, 2021, the carrying amount and fair value of the 6.25% 2025 Notes was $60.0 million and $61.2 million, respectively. The repayment of the 6.25% 2025 Notes resulted in a realized loss on the extinguishment of debt of $1.5 million.
As discussed above, during the fourth quarter of 2020 fiscal year, the Company redeemed $74.45 million in aggregate principal amount of issued outstanding 2023 Notes.
7.25% 2025 Notes
On June 24, 2020, the Company issued $37.5 million in aggregate principal amount of our 7.25% fixed-rate notes due 2025 (the “7.25% 2025 Notes”) for net proceeds of $36.3 million after deducting underwriting commissions of approximately $1.2 million. Offering costs incurred were approximately $0.2$0.3 million. On July 6, 2020, the underwriters exercised their option in full to purchase an additional $5.625 million in aggregate principal amount of its 7.25% 2025 Notes. Net proceeds to the Company were $5.4 million after deducting underwriting commissions of approximately $0.2 million. Interest on the 7.25% 2025 Notes is paid quarterly in arrears on February 28, May 31, August 31 and November 30, at a rate of 7.25% per year, beginning August 31, 2020. The 7.25% 2025 Notes mature on June 30, 2025 and commencing June 24, 2022, may be redeemed in whole or in part at any time or from time to time at our option. The net proceeds from the offering were used for general corporate purposes in accordance with ourthe Company’s investment objective and strategies. Financing costs of $1.6 million related to the 7.25% 2025 Notes have been capitalized and are beingwere amortized over the term of the 7.25% 2025 Notes.
As of February 28,On July 14, 2022, the totalCompany redeemed $43.1 million in aggregate principal amount of the issued and outstanding 7.25% Notes 2025 outstanding was $43.1 million.Notes. The 7.25% 2025 Notes arewere listed on the NYSE under the trading symbol of “SAK” and have been delisted following the full redemption on July 14, 2022. As such, it was not fair valued with a par value of $25.00 per share. As of February 28, 2022, the carrying amountmarket quotes and is not fair value leveled. The repayment of the 7.25% 2025 Notes was $43.1 million and $43.9 million, respectively. The fair valueresulted in a realized loss on the extinguishment of the 7.25% 2025 Notes, which are publicly traded, is based upon closing market quotes asdebt of the measurement date and would be classified as a Level 1 liability within the fair value hierarchy.$1.0 million.
For the years ended February 28, 202229, 2024 and February 28, 2021,2023, we recorded $3.1$0.0 million and $2.2$1.2 million, respectively, of interest expense and $0.3$0.0 million and $0.2$0.1 million, respectively, of amortization of deferred financing costs related to the 7.25% 2025 Notes. Interest expense and amortization of deferred financing costcosts are reported as interest and debt financing expense on the consolidated statements of operations. For the year ended February 28, 202229, 2024 and February 28, 2021,2023, the average dollar amount of 7.25% 2025 Notes outstanding was $43.1$0.0 million and $43.1$13.5 million, respectively.
F-537.75% 2025 Notes
On July 9, 2020, the Company issued $5.0 million in aggregate principal amount of our 7.75% fixed-rate notes due in 2025 (the “7.75% Notes 2025”2025 Notes”) for net proceeds of $4.8 million after deducting underwriting commissions of approximately $0.2 million. Offering costs incurred were approximately $0.1 million. Interest on the 7.75% 2025 Notes 2025 is paid quarterly in arrears on February 28, May 31, August 31 and November 30, at a rate of 7.75% per year, beginning August 31, 2020.year. The 7.75% 2025 Notes 2025 mature on July 9, 2025 and may be redeemed in whole or in part at any time or from time to time at our option.the Company’s option subject to a fee depending on the date of repayment. The net proceeds from the offering were used for general corporate purposes in accordance with ourthe Company’s investment objective and strategies. Financing costs of $0.3 million related to the 7.75% 2025 Notes 2025 have been capitalized and are being amortized over the term of the 7.75% 2025 Notes.
As of February 28, 2022,29, 2024, the total 7.75% 2025 Notes 2025 outstanding was $5.0 million. The 7.75% 2025 Notes 2025 are not listed and have a par value of $25.00 per share.note. The carrying amount of the amount outstanding of 7.75% 2025 Notes approximates itshad a fair value of $5.0 million, which is based on a waterfallmarket yield analysis showing adequate collateral coverageand would be classified as a Level 3 liability within the fair value hierarchy. As of February 28, 2023, the total 7.75% 2025 Notes outstanding was $5.0 million, and they had a fair value of $5.0 million, which is based on a market yield analysis and would be classified as a Level 3 liability within the fair value hierarchy.
For the years ended February 28, 202229, 2024 and February 28, 2021,2023, we recorded $0.4 million and $0.3$0.4 million, respectively, of interest expense and $0.05 million and $0.04$0.05 million, respectively, of amortization of deferred financing costs related to the 7.75% 2025 Notes. Interest expense and amortization of deferred financing costcosts are reported as interest and debt financing expense on the consolidated statements of operations. For the year ended February 28, 202229, 2024 and February 28, 2021,2023, the average dollar amount of 7.75% 2025 Notes outstanding was $5.0 million and $5.0 million, respectively.
6.25% 2027 Notes
On December 29, 2020, the Company issued $5.0 million in aggregate principal amount of our 6.25% fixed-rate notes due in 2027 (the “6.25% Notes 2027”2027 Notes”). Offering costs incurred were approximately $0.1 million. Interest on the 6.25% 2027 Notes 2027 is paid quarterly in arrears on February 28, May 31, August 31 and November 30, at a rate of 6.25% per year, beginning February 28, 2021.year. The 6.25% 2027 Notes 2027 mature on December 29, 2027 and may be redeemed in whole or in part at any time or from time to time at ourthe Company’s option, on or after December 29, 2024. The net proceeds from the offering were used for general corporate purposes in accordance with ourthe Company’s investment objective and strategies. Financing costs of $0.1 million related to the 6.25% 2027 Notes 2027 have been capitalized and are being amortized over the term of the Notes.
On January 28, 2021, the Company issued an additional $10.0 million in aggregate principal amount of ourthe 6.25% fixed rate2027 Notes due in 2027 (the “6.25% Notes 2027”) for net proceeds of $9.7 million after deducting underwriting commissions of approximately $0.3 million.million (the “Additional 6.25% 2027 Notes”). Offering costs incurred were approximately $0.0$0.1 million. The Additional 6.25% 2027 Notes are treated as a single series with the existing 6.25% 2027 Notes under the indenture and have the same terms as the existing 6.25% 2027 Notes. Interest on the 6.25% 2027 Notes 2027 is paid quarterly in arrears on February 28, May 31, August 31 and November 30, at a rate of 6.25% per year, beginning February 28, 2021.year. The 6.25% 2027 Notes 2027 mature on January 28, 2027 and commencing January 28, 2023, may be redeemed in whole or in part at any time or from time to time at ourthe Company’s option. The net proceeds from the offering were used for general corporate purposes in accordance with ourthe Company’s investment objective and strategies. Financing costs of $0.3$0.4 million related to the 6.25% 2027 Notes 2027 have been capitalized and are being amortized over the term of the 6.25% 2027 Notes. The 6.25% 2027 Notes are not listed and have a par value of $25.00 per note.
As of February 28, 2022,29, 2024, the total 6.25% 2027 Notes 2027 outstanding was $15.0 million. The 6.25% 2027 Notes are not listed and have a par value of $25.00 per share.note. The carrying amount of the amount outstanding of 6.25% 2027 Notes approximates itshad a fair value of $14.2 million, which is based on a waterfallmarket yield analysis showing adequate collateral coverageand would be classified as a Level 3 liability within the fair value hierarchy. As of February 28, 2023, the total 6.25% 2027 Notes outstanding was $15.0 million, and they had a fair value of $13.7 million, which is based on a market yield analysis and would be classified as a Level 3 liability within the fair value hierarchy.
For the years ended February 28, 202229, 2024 and February 28, 2021,2023, we recorded $0.9 million and $0.1$0.9 million, respectively, of interest expense and $0.07 million and $0.01$0.07 million, respectively, of amortization of deferred financing costs related to the 6.25% 2027 Notes. Interest expense and amortization of deferred financing cost are reported as interest and debt financing expense on the consolidated statements of operations. For the year ended February 28, 202229, 2024 and February 28, 2021,2023, the average dollar amount of 6.25% 2027 Notes outstanding was $15.0 million and $7.0$15.0 million, respectively.
4.375% 2026 Notes
On March 10, 2021, the Company issued $50.0 million in aggregate principal amount of our 4.375% fixed-rate Notesnotes due in 2026 (the “4.375% Notes 2026”2026 Notes”) for net proceeds of $49.0 million after deducting underwriting commissions of approximately $1.0 million. Offering costs incurred were approximately $0.2$0.3 million. Interest on the 4.375% 2026 Notes 2026 is paid semi-annually in arrears on February 28 and August 28, at a rate of 4.375% per year, beginning August 28, 2021.year. The 4.375% 2026 Notes 2026 mature on February 28, 2026 and may be redeemed in whole or in part at any time on or after November 28, 2025 at par plus a “make-whole” premium, and thereafter at par. The net proceeds from the offering were used for general corporate purposes in accordance with ourthe Company’s investment objective and strategies. Financing costs of $1.2$1.3 million related to the 4.375% 2026 Notes 2026 have been capitalized and are being amortized over the term of the 4.375% 2026 Notes.
On July 15, 2021, the Company issued an additional $125.0 million in aggregate principal amount of the Company’s 4.375% 2026 Notes 2026 (the “Additional 4.375% 2026 Notes”) for net proceeds for approximately $123.5$123.8 million, based on the public offering price of 101.00% of the aggregate principal amount of the Additional 4.375% 2026 Notes, after deducting the underwriting discountcommissions of $2.5 million and the estimated offering expenses ofmillion. Offering costs incurred were approximately $0.2 million payable bymillion. The Additional 4.375% 2026 Notes are treated as a single series with the Company.existing 4.375% 2026 Notes under the indenture and have the same terms as the existing 4.375% 2026 Notes. The net proceeds from the offering were used to redeem all of the outstanding 6.25% 2025 Notes (as described above), and for general corporate purposes in accordance with ourthe Company’s investment objective and strategies. Financing costs of $2.7 million have been capitalized and are being amortized over the term of the additional 4.375% 2026 Notes.
As of February 28, 2022,29, 2024, the total 4.375% 2026 Notes 2026 outstanding was $175.0 million. The 4.375% 2026 Notes 2026 are not listed and are issued in minimum denominations of $2,000 and integral multiples of $1,000 in excess thereof. As of February 28, 2021, there was $0.0 million outstanding. The carrying amount of the amount outstanding of 4.375% 2026 Notes 2026 approximates itshad a fair value of $163.4 million, which is based on a waterfallmarket yield analysis showing adequate collateral coverage and would be classified as a Level 3 liability within the fair value hierarchy. As of February 28, 2023, the total 4.375% 2026 Notes outstanding was $175.0 million, and they had a fair value of $156.1 million, which is based on a market yield analysis and would be classified as a Level 3 liability within the fair value hierarchy. As of February 28, 2023, there was $175.0 million outstanding.
For the years ended February 28, 202229, 2024 and February 28, 2021,2023, we recorded $5.5$7.7 million and $0.0$7.7 million, respectively, of interest expense, $0.4$0.8 million and $0.0$0.8 million, respectively, of amortization of deferred financing costs and $0.2$0.3 million and $0.0$0.3 million, respectively, of amortization of premium on issuance of 4.375% Notes due 2026 (inclusive of the issuance of the Additional 4.375% 2026 Notes). Interest expense, amortization of deferred financing costs and amortization of premium on issuance of notes are reported as interest and debt financing expense on the consolidated statements of operations. During the years ended February 28, 202229, 2024 and February 28, 20212023, the average dollar amount of 4.375% 2026 Notes 2026 outstanding was $130.8$175.0 million and $0.0$175.0 million respectively.
4.35% 2027 Notes
On January 19, 2022, the Company issued $75.0 million in aggregate principal amount of our 4.35% fixed-rate Notesnotes due in 2027 (the “4.35% Notes 2027”2027 Notes”) for net proceeds of $73.0 million, based on the public offering price of 99.317% of the aggregate principal amount of the 4.35% 2027 Notes, 2027, after deducting the underwriting commissions of approximately $1.5 million. Offering costs incurred were approximately $0.2$0.3 million. Interest on the 4.35% 2027 Notes 2027 is paid semi-annually in arrears on February 28 and August 28, at a rate of 4.35% per year, beginning August 28, 2022.year. The 4.35% 2027 Notes 2027 mature on February 28, 2027 and may be redeemed in whole or in part at the Company’s option at any time prior to November 28, 2026, at par plus a “make-whole” premium, and thereafter at par. par. The net proceeds from the offering were used for general corporate purposes in accordance with ourthe Company’s investment objective and strategies. Financing costs of $1.7$1.8 million related to the 4.35% 2027 Notes 2027 have been capitalized and are being amortized over the term of the 4.35% 2027 Notes.
As of February 28, 2022,29, 2024, the total 4.35% 2027 Notes 2027 outstanding was $75.0 million. The 4.35% 2027 Notes 2027 are not listed. As of February 28, 2021, there was $0.0 million outstanding. The carrying amount of the amount outstanding of 4.35% 2027 Notes 2027 approximates itshad a fair value of $67.8 million, which is based on a waterfallmarket yield analysis showing adequate collateral coverage and would be classified as a Level 3 liability within the fair value hierarchy. As of February 28, 2023, the total 4.35% 2027 Notes outstanding was $75.0 million, and they had a fair value of $64.5 million, which is based on a market yield analysis and would be classified as a Level 3 liability within the fair value hierarchy. As of February 28, 2023, there was $75.0 million outstanding.
For the years ended February 28, 202229, 2024 and February 28, 2021,2023, we recorded $0.4$3.3 million and $0.0$3.3 million, respectively, of interest expense, $0.05$0.3 million and $0.0$0.3 million, respectively, of amortization of deferred financing costs and $0.07$0.10 million and $0.0$0.09 million, respectively, of amortization of discount on issuance of 4.35% Notes due 2027 (inclusive of the issuance of the Additional 4.35% 2027 Notes). Interest expense, amortization of deferred financing costs and amortization of premiumdiscount on issuance of notes are reported as interest and debt financing expense on the consolidated statements of operations. During the years ended February 28, 202229, 2024 and February 28, 20212023, the average dollar amount of 4.35% 2027 Notes 2027 outstanding was $8.4$75.0 million and $75.0 million respectively.
6.00% 2027 Notes
On April 27, 2022, the Company issued $87.5 million in aggregate principal amount of 6.00% fixed-rate notes due 2027 (the “6.00% 2027 Notes”) for net proceeds of $84.8 million after deducting underwriting commissions of approximately $2.7 million. Offering costs incurred were approximately $0.1 million. On May 10, 2022, the underwriters partially exercised their option to purchase an additional $10.0 million in aggregate principal amount of the 6.00% 2027 Notes. Net proceeds to the Company were $9.7 million after deducting underwriting commissions of approximately $0.3 million. Interest on the 6.00% 2027 Notes is paid quarterly in arrears on February 28, May 31, August 31 and November 30, at a rate of 6.00% per year. The 6.00% 2027 Notes mature on April 30, 2027 and commencing April 27, 2024, may be redeemed in whole or in part at any time or from time to time at the Company’s option. The net proceeds from the offering were used for general corporate purposes in accordance with the Company’s investment objective and strategies. Financing costs of $3.3 million related to the 6.00% 2027 Notes have been capitalized and are being amortized over the term of the 6.00% 2027 Notes. The 6.00% 2027 Notes are listed on the NYSE under the trading symbol “SAT” with a par value of $25.00 per note.
On August 15, 2022, the Company issued an additional $8.0 million in aggregate principal amount of the 6.00% 2027 Notes (the “Additional 6.00% 2027 Notes”) for net proceeds of $7.8 million, based on the public offering price of 97.80% of the aggregate principal amount of the 6.00% 2027 Notes. Additional offering costs incurred were approximately $0.2 million. The Additional 6.00% 2027 Notes are treated as a single series with the existing 6.00% 2027 Notes under the indenture and have the same terms as the existing 6.00% 2027 Notes. The net proceeds from the offering were used for general corporate purposes in accordance with the Company’s investment objective and strategies. Additional financing costs of $0.3 million related to the 6.00% 2027 Notes have been capitalized and are being amortized over the term of the 6.00% 2027 Notes.
As of February 29, 2024, the total 6.00% 2027 Notes outstanding was $105.5 million. The 6.00% 2027 Notes are listed on the NYSE under the trading symbol “SAT” with a par value of $25.00 per note. As of February 29, 2024, the carrying amount and fair value of the 6.00% 2027 Notes was $105.5 million and $100.7 million, respectively. The fair value of the 6.00% 2027 Notes, which are publicly traded, is based upon closing market quotes as of the measurement date and would be classified as a Level 1 liability within the fair value hierarchy. As of February 28, 2023, the carrying amount and fair value of the 6.00% 2027 Notes was $105.5 million and $100.4 million, respectively.
For the years ended February 29, 2024 and February 28, 2023, we recorded $6.3 million and $5.3 million, respectively, of interest expense, $0.7 million and $0.6 million, respectively, of amortization of deferred financing costs related to the 6.00% Notes due 2027. Interest expense and amortization of deferred financing costs are reported as interest and debt financing expense on the consolidated statements of operations. During the years ended February 29, 2024 and February 28, 2023, the average dollar amount of 6.00% 2027 Notes outstanding was $105.5 million and $100.4 million respectively.
7.00% 2025 Notes
On September 8, 2022, the Company issued $12.0 million in aggregate principal amount of 7.00% fixed-rate notes due 2025 (the “7.00% 2025 Notes”) for net proceeds of $11.6 million after deducting underwriting discounts of approximately $0.4 million. Additional offering costs incurred were approximately $0.05 million. Interest on the 7.00% 2025 Notes is paid quarterly in arrears on February 28, May 31, August 31 and November 30, at a rate of 7.00% per year. The 7.00% 2025 Notes mature on September 8, 2025 and commencing September 8, 2024, may be redeemed in whole or in part at any time or from time to time at the Company’s option. The net proceeds from the offering were used for general corporate purposes in accordance with the Company’s investment objective and strategies. Financing costs of $0.04 million related to the 7.00% 2025 Notes have been capitalized and are being amortized over the term of the 7.00% 2025 Notes.
As of February 29, 2024, the total 7.00% 2025 Notes outstanding was $12.0 million. The 7.00% 2025 Notes are not listed. The carrying amount of the outstanding 7.00% 2025 Notes had a fair value of $11.8 million, which is based on a market yield analysis and would be classified as a Level 3 liability within the fair value hierarchy. As of February 28, 2023, the total 7.00% 2025 Notes outstanding was $12.0 million, and they had a fair value of $11.5 million, which is based on a market yield analysis and would be classified as a Level 3 liability within the fair value hierarchy. As of February 28, 2023, there was $12.0 million outstanding.
For the years ended February 29, 2024 and February 28, 2023, we recorded $0.8 million and $0.4 million, respectively, of interest expense, $0.01 million and $0.01 million, respectively, of amortization of deferred financing costs and $0.1 million and $0.06 million, respectively, of amortization of discount on issuance of 7.00% Notes due 2025. Interest expense, amortization of deferred financing costs and amortization of discount on issuance of notes are reported as interest and debt financing expense on the consolidated statements of operations. During the years ended February 29, 2024 and February 28, 2023, the average dollar amount of 7.00% 2025 Notes outstanding was $12.0 million and $5.8 million respectively.
8.00% 2027 Notes
On October 27, 2022, the Company issued $40.0 million in aggregate principal amount of our 8.00% fixed-rate notes due 2027 (the “8.00% 2027 Notes”) for net proceeds of $38.7 million after deducting underwriting commissions of approximately $1.3 million. Offering costs incurred were approximately $0.2 million. On November 10, 2022, the underwriters partially exercised their option to purchase an additional $6.0 million in aggregate principal amount of the 8.00% 2027 Notes. Net proceeds to the Company were $5.8 million after deducting underwriting commissions of approximately $0.2 million. Interest on the 8.00% 2027 Notes is paid quarterly in arrears on February 28, May 31, August 31 and November 30, at a rate of 8.00% per year. The 8.00% 2027 Notes mature on October 31, 2027 and commencing October 27, 2024, may be redeemed in whole or in part at any time or from time to time at the Company’s option. The net proceeds from the offering were used for general corporate purposes in accordance with the Company’s investment objective and strategies. Financing costs of $1.7 million related to the 8.00% 2027 Notes have been capitalized and are being amortized over the term of the 8.00% 2027 Notes.
As of February 29, 2024, the total 8.00% 2027 Notes outstanding was $46.0 million. The 8.00% 2027 Notes are listed on the NYSE under the trading symbol “SAJ” with a par value of $25.00 per note. As of February 29, 2024, the carrying amount and fair value of the 8.00% 2027 Notes was $46.0 million and $46.2 million, respectively. The fair value of the 8.00% 2027 Notes, which are publicly traded, is based upon closing market quotes as of the measurement date and would be classified as a Level 1 liability within the fair value hierarchy. As of February 28, 2023, the carrying amount and fair value of the 8.00% 2027 Notes was $46.0 million and $46.4 million, respectively.
For the years ended February 29, 2024 and February 28, 2023, the Company recorded $3.7 million and $1.3 million, respectively, of interest expense and $0.3 million and $0.1 million, respectively, of amortization of deferred financing costs related to the 8.00% 2027 Notes. Interest expense and amortization of deferred financing costs are reported as interest and debt financing expense on the consolidated statements of operations. During the years ended February 29, 2024 and February 28, 2023, the average dollar amount of 8.00% 2027 Notes outstanding was $46.0 million and $15.7 million, respectively.
8.125% 2027 Notes
On December 13, 2022, the Company issued $52.5 million in aggregate principal amount of 8.125% fixed-rate notes due 2027 (the “8.125% 2027 Notes”) for net proceeds of $50.8 million after deducting underwriting commissions of approximately $1.6 million. Offering costs incurred were approximately $0.1 million. On December 21, 2022, the underwriters fully exercised their option to purchase an additional $7.9 million in aggregate principal amount of the 8.125% 2027 Notes. Net proceeds to the Company were $7.6 million after deducting underwriting commissions of approximately $0.2 million. Interest on the 8.125% 2027 Notes is paid quarterly in arrears on February 28, May 31, August 31 and November 30, at a rate of 8.125% per year. The 8.125% 2027 Notes mature on December 31, 2027 and commencing December 13, 2024, may be redeemed in whole or in part at any time or from time to time at the Company’s option. The net proceeds from this offering were used to make investments in middle-market companies (including investments made through our SBIC Subsidiaries) in accordance with the Company’s investment objective and strategies and for general corporate purposes. Financing costs of $2.0 million related to the 8.125% 2027 Notes have been capitalized and are being amortized over the term of the 8.125% 2027 Notes.
As of February 29, 2024, the total 8.125% 2027 Notes outstanding was $60.4 million. The 8.125% 2027 Notes are listed on the NYSE under the trading symbol “SAY” with a par value of $25.00 per note. As of February 29, 2024, the carrying amount and fair value of the 8.125% 2027 Notes was $60.4 million and $60.8 million, respectively. The fair value of the 8.125% 2027 Notes, which are publicly traded, is based upon closing market quotes as of the measurement date and would be classified as a Level 1 liability within the fair value hierarchy. As of February 28, 2023, the carrying amount and fair value of the 8.125% 2027 Notes was $60.4 million and $61.1 million, respectively.
For the years ended February 29, 2024 and February 28, 2023, the Company recorded $4.9 million and $1.1 million, respectively, of interest expense and $0.4 million and $0.09 million, respectively, of amortization of deferred financing costs related to the 8.125% 2027 Notes. Interest expense and amortization of deferred financing costs are reported as interest and debt financing expense on the consolidated statements of operations. During the years ended February 29, 2024 and February 28, 2023, the average dollar amount of 8.125% 2027 Notes outstanding was $60.4 million and $13.2 million, respectively.
8.75% 2025 Notes
On March 31, 2023, the Company issued $10.0 million in aggregate principal amount of 8.75% fixed-rate notes due 2024 (the “8.75% 2025 Notes”) for net proceeds of $9.7 million after deducting underwriting discounts of approximately $0.4 million. On May 1, 2023, the Company issued an additional $10.0 million in aggregate principal amount of the 8.75% 2025 Notes for net proceeds of $9.7 million after deducting underwriting discounts of approximately $0.4 million. Offering costs incurred were approximately $0.03 million. Interest on the 8.75% 2025 Notes is paid quarterly in arrears on February 28, May 31, August 31 and November 30, at a rate of 8.75% per year. On February 2, 2024, pursuant to the terms of the indenture governing the 8.75% 2025 Notes, the Company elected to exercise its option to extend the maturity date of the 8.75% 2025 Notes from March 31, 2024 to March 31, 2025. Net proceeds from this offering were used to make investments in middle-market companies (including investments made through the SBIC Subsidiaries) in accordance with the Company’s investment objective and strategies and general corporate purposes. Financing costs and discounts of $0.7 million related to the 8.75% 2025 Notes have been capitalized and are being amortized over the term of the 8.75% 2025 Notes.
As of February 29, 2024, the total 8.75% 2025 Notes outstanding was $20.0 million. The 8.75% 2025 Notes are not listed. The carrying amount of the outstanding 8.75% 2025 Notes had a fair value of $20.1 million, which is based on a market yield analysis and would be classified as a Level 3 liability within the fair value hierarchy. As of February 28, 2023, the total 8.75% 2025 Notes outstanding was $0.0 million, and they had a fair value of $0.0 million. As of February 28, 2023, there was $0.0 million outstanding.
For the years ended February 29, 2024 and February 28, 2023, we recorded $1.5 million and $0.0 million, respectively, of interest expense, $0.02 million and $0.0 million, respectively, of amortization of deferred financing costs and $0.6 million and $0.0 million, respectively, of amortization of discount on issuance of 8.75% Notes due 2025. Interest expense, amortization of deferred financing costs and amortization of discount on issuance of notes are reported as interest and debt financing expense on the consolidated statements of operations. During the years ended February 29, 2024 and February 28, 2023, the average dollar amount of 8.75% 2025 Notes outstanding was $17.5 million and $0.0 million respectively.
8.50% 2028 Notes
F-55
On April 14, 2023, the Company issued $50.0 million in aggregate principal amount of 8.50% fixed-rate notes due 2028 (the “8.50% 2028 Notes”) for net proceeds of $48.4 million after deducting underwriting commissions of approximately $1.6 million. Offering costs incurred were approximately $0.03 million. On April 26, 2023, the underwriters fully exercised their option to purchase an additional $7.5 million in aggregate principal amount of the 8.50% 2028 Notes. Net proceeds to the Company were $7.3 million after deducting underwriting commissions of approximately $0.2 million. Interest on the 8.50% 2028 Notes is paid quarterly in arrears on February 28, May 31, August 31 and November 30, at a rate of 8.50% per year. The 8.50% 2028 Notes mature on April 15, 2028, and commencing April 14, 2025, may be redeemed in whole or in part at any time or from time to time at the Company’s option. Net proceeds from this offering were used to repay a portion of the outstanding indebtedness under the Encina Credit Facility, make investments in middle-market companies (including investments made through our SBIC Subsidiaries) in accordance with the Company’s investment objective and strategies and for general corporate purposes. Financing costs of $2.0 million related to the 8.50% 2028 Notes have been capitalized and are being amortized over the term of the 8.50% 2028 Notes.
As of February 29, 2024, the total 8.50% 2028 Notes outstanding was $57.5 million. The 8.50% 2028 Notes are listed on the NYSE under the trading symbol “SAZ” with a par value of $25.00 per note. As of February 29, 2024, the carrying amount and fair value of the 8.50% 2028 Notes was $57.5 million and $58.3 million, respectively. The fair value of the 8.50% 2028 Notes, which are publicly traded, is based upon closing market quotes as of the measurement date and would be classified as a Level 1 liability within the fair value hierarchy. As of February 28, 2023, the carrying amount and fair value of the 8.50% 2028 Notes was $0.0 million and $0.0 million, respectively.
For the years ended February 29, 2024 and February 28, 2023, we recorded $4.3 million and $0.0 million, respectively, of interest expense and $0.4 million and $0.0 million, respectively, of amortization of deferred financing costs of 8.50% 2028 Notes. Interest expense and amortization of deferred financing costs are reported as interest and debt financing expense on the consolidated statements of operations. During the years ended February 29, 2024 and February 28, 2023, the average dollar amount of 8.50% 2028 Notes outstanding was $50.2 million and $0.0 million respectively.
Senior Securities
Information about our senior securities is shown in the following table as of February 28/29 for the fiscal years indicated in the table, unless otherwise noted. See “Management’s Discussion and Analysis of Financial Condition and Results of Operations—Financial condition, liquidity and capital resources” for more detailed information regarding the senior securities.
| SENIOR SECURITIES | ||||||||||||||||
| (dollar amounts in thousands, except per share data) | ||||||||||||||||
| Class and Year (1)(2) | Total Amount Outstanding Exclusive of Treasury Securities(3) | Asset Coverage per Unit(4) | Involuntary Liquidating Preference per Share(5) | Average Market Value per Share(6) | ||||||||||||
| (in thousands) | ||||||||||||||||
| Credit Facility with Encina Lender Finance, LLC | ||||||||||||||||
| Fiscal year 2022 (as of February 28, 2022) | $ | 12,500 | $ | 2,093 | - | N/A | ||||||||||
| Credit Facility with Madison Capital Funding(14) | ||||||||||||||||
| Fiscal year 2021 (as of February 28, 2021) | $ | - | $ | 3,471 | - | N/A | ||||||||||
| Fiscal year 2020 (as of February 29, 2020) | $ | - | $ | 6,071 | - | N/A | ||||||||||
| Fiscal year 2019 (as of February 28, 2019) | $ | - | $ | 2,345 | - | N/A | ||||||||||
| Fiscal year 2018 (as of February 28, 2018) | $ | - | $ | 2,930 | - | N/A | ||||||||||
| Fiscal year 2017 (as of February 28, 2017) | $ | - | $ | 2,710 | - | N/A | ||||||||||
| Fiscal year 2016 (as of February 29, 2016) | $ | - | $ | 3,025 | - | N/A | ||||||||||
| Fiscal year 2015 (as of February 28, 2015) | $ | 9,600 | $ | 3,117 | - | N/A | ||||||||||
| Fiscal year 2014 (as of February 28, 2014) | $ | - | $ | 3,348 | - | N/A | ||||||||||
| Fiscal year 2013 (as of February 28, 2013) | $ | 24,300 | $ | 5,421 | - | N/A | ||||||||||
| Fiscal year 2012 (as of February 29, 2012) | $ | 20,000 | $ | 5,834 | - | N/A | ||||||||||
| Fiscal year 2011 (as of February 28, 2011) | $ | 4,500 | $ | 20,077 | - | N/A | ||||||||||
| Fiscal year 2010 (as of February 28, 2010) | $ | - | $ | - | - | N/A | ||||||||||
| Fiscal year 2009 (as of February 28, 2009) | $ | - | $ | - | - | N/A | ||||||||||
| Fiscal year 2008 (as of February 29, 2008) | $ | - | $ | - | - | N/A | ||||||||||
| Fiscal year 2007 (as of February 28, 2007) | $ | - | $ | - | - | N/A | ||||||||||
| 7.50% Notes due 2020(7) | ||||||||||||||||
| Fiscal year 2017 (as of February 28, 2017) | $ | - | $ | - | - | N/A | ||||||||||
| Fiscal year 2016 (as of February 29, 2016) | $ | 61,793 | $ | 3,025 | - | $ | 25.24 | (8) | ||||||||
| Fiscal year 2015 (as of February 28, 2015) | $ | 48,300 | $ | 3,117 | - | $ | 25.46 | (8) | ||||||||
| Fiscal year 2014 (as of February 28, 2014) | $ | 48,300 | $ | 3,348 | - | $ | 25.18 | (8) | ||||||||
| Fiscal year 2013 (as of February 28, 2013) | $ | - | $ | - | - | N/A | ||||||||||
| Fiscal year 2012 (as of February 29, 2012) | $ | - | $ | - | - | N/A | ||||||||||
| Fiscal year 2011 (as of February 28, 2011) | $ | - | $ | - | - | N/A | ||||||||||
| Fiscal year 2010 (as of February 28, 2010) | $ | - | $ | - | - | N/A | ||||||||||
| Fiscal year 2009 (as of February 28, 2009) | $ | - | $ | - | - | N/A | ||||||||||
| Fiscal year 2008 (as of February 29, 2008) | $ | - | $ | - | - | N/A | ||||||||||
| Fiscal year 2007 (as of February 28, 2007) | $ | - | $ | - | - | N/A | ||||||||||
| 6.75% Notes due 2023(9) | ||||||||||||||||
| Fiscal year 2020 (as of February 29, 2020) | $ | - | $ | - | - | N/A | ||||||||||
| Fiscal year 2019 (as of February 28, 2019) | $ | 74,451 | $ | 2,345 | - | $ | 25.74 | (10) | ||||||||
| Fiscal year 2018 (as of February 28, 2018) | $ | 74,451 | $ | 2,930 | - | $ | 26.05 | (10) | ||||||||
| Fiscal year 2017 (as of February 28, 2017) | $ | 74,451 | $ | 2,710 | - | $ | 25.89 | (10) | ||||||||
| 6.25% Notes due 2025(13) | ||||||||||||||||
| Fiscal year 2022 (as of February 28, 2022) | - | - | - | N/A | ||||||||||||
| Fiscal year 2021 (as of February 28, 2021) | $ | 60,000 | $ | 3,471 | - | $ | 24.24 | (11) | ||||||||
| Fiscal year 2020 (as of February 29, 2020) | $ | 60,000 | $ | 6,071 | - | $ | 25.75 | (11) | ||||||||
| Fiscal year 2019 (as of February 28, 2019) | $ | 60,000 | $ | 2,345 | - | $ | 24.97 | (11) | ||||||||
| 7.25% Notes due 2025 | ||||||||||||||||
| Fiscal year 2022 (as of February 28, 2022) | $ | 43,125 | $ | 2,093 | - | $ | 25.46 | (11) | ||||||||
| Fiscal year 2021 (as of February 28, 2021) | $ | 43,125 | $ | 3,471 | - | $ | 25.77 | (11) | ||||||||
| 7.75% Notes due 2025 | ||||||||||||||||
| Fiscal year 2022 (as of February 28, 2022) | $ | 5,000 | $ | 2,093 | - | $ | 25.00 | (12) | ||||||||
| Fiscal year 2021 (as of February 28, 2021) | $ | 5,000 | $ | 3,471 | - | $ | 25.00 | (12) | ||||||||
| 4.375% Notes due 2026 | ||||||||||||||||
| Fiscal year 2022 (as of February 28, 2022) | $ | 175,000 | $ | 2,093 | - | $ | 25.00 | (12) | ||||||||
| 4.35% Notes due 2027 | ||||||||||||||||
| Fiscal year 2022 (as of February 28, 2022) | $ | 75,000 | $ | 2,093 | - | $ | 25.00 | (12) | ||||||||
| 6.25% Notes due 2027 | ||||||||||||||||
| Fiscal year 2022 (as of February 28, 2022) | $ | 15,000 | $ | 2,093 | - | $ | 25.00 | (12) | ||||||||
| Fiscal year 2021 (as of February 28, 2021) | $ | 15,000 | $ | 3,471 | - | $ | 25.00 | (12) | ||||||||
SENIOR SECURITIES
(dollar amounts in thousands, except per share data)
| Class and Year (1)(2) | Total Amount Outstanding Exclusive of Treasury Securities(3) | Asset Coverage per Unit(4) | Involuntary Liquidating Preference per Share(5) | Average Market Value per Share(6) | ||||||||||||
| (in thousands) | ||||||||||||||||
| Credit Facility with Encina Lender Finance, LLC | ||||||||||||||||
| Fiscal year 2024 (as of February 29, 2024) | $ | 35,000 | $ | 1,610 | - | N/A | ||||||||||
| Fiscal year 2023 (as of February 28, 2023) | $ | 32,500 | $ | 1,659 | - | N/A | ||||||||||
| Fiscal year 2022 (as of February 28, 2022) | $ | 12,500 | $ | 2,093 | - | N/A | ||||||||||
| Credit Facility with Madison Capital Funding(14) | ||||||||||||||||
| Fiscal year 2021 (as of February 28, 2021) | $ | - | $ | 3,471 | - | N/A | ||||||||||
| Fiscal year 2020 (as of February 29, 2020) | $ | - | $ | 6,071 | - | N/A | ||||||||||
| Fiscal year 2019 (as of February 28, 2019) | $ | - | $ | 2,345 | - | N/A | ||||||||||
| Fiscal year 2018 (as of February 28, 2018) | $ | - | $ | 2,930 | - | N/A | ||||||||||
| Fiscal year 2017 (as of February 28, 2017) | $ | - | $ | 2,710 | - | N/A | ||||||||||
| Fiscal year 2016 (as of February 29, 2016) | $ | - | $ | 3,025 | - | N/A | ||||||||||
| Fiscal year 2015 (as of February 28, 2015) | $ | 9,600 | $ | 3,117 | - | N/A | ||||||||||
| Fiscal year 2014 (as of February 28, 2014) | $ | - | $ | 3,348 | - | N/A | ||||||||||
| Fiscal year 2013 (as of February 28, 2013) | $ | 24,300 | $ | 5,421 | - | N/A | ||||||||||
| Fiscal year 2012 (as of February 29, 2012) | $ | 20,000 | $ | 5,834 | - | N/A | ||||||||||
| Fiscal year 2011 (as of February 28, 2011) | $ | 4,500 | $ | 20,077 | - | N/A | ||||||||||
| 7.50% Notes due 2020(7) | ||||||||||||||||
| Fiscal year 2017 (as of February 28, 2017) | $ | - | $ | - | - | N/A | ||||||||||
| Fiscal year 2016 (as of February 29, 2016) | $ | 61,793 | $ | 3,025 | - | $ | 25.24 | (8) | ||||||||
| Fiscal year 2015 (as of February 28, 2015) | $ | 48,300 | $ | 3,117 | - | $ | 25.46 | (8) | ||||||||
| Fiscal year 2014 (as of February 28, 2014) | $ | 48,300 | $ | 3,348 | - | $ | 25.18 | (8) | ||||||||
| 6.75% Notes due 2023(9) | ||||||||||||||||
| Fiscal year 2020 (as of February 29, 2020) | $ | - | $ | - | - | N/A | ||||||||||
| Fiscal year 2019 (as of February 28, 2019) | $ | 74,451 | $ | 2,345 | - | $ | 25.74 | (10) | ||||||||
| Fiscal year 2018 (as of February 28, 2018) | $ | 74,451 | $ | 2,930 | - | $ | 26.05 | (10) | ||||||||
| Fiscal year 2017 (as of February 28, 2017) | $ | 74,451 | $ | 2,710 | - | $ | 25.89 | (10) | ||||||||
| 8.75% Notes due 2025 | ||||||||||||||||
| Fiscal year 2024 (as of February 29, 2024) | $ | 20,000 | $ | 1,610 | - | $ | 25.00 | (12) | ||||||||
| 6.25% Notes due 2025(13) | ||||||||||||||||
| Fiscal year 2022 (as of February 28, 2022) | - | - | - | N/A | ||||||||||||
| Fiscal year 2021 (as of February 28, 2021) | $ | 60,000 | $ | 3,471 | - | $ | 24.24 | (11) | ||||||||
| Fiscal year 2020 (as of February 29, 2020) | $ | 60,000 | $ | 6,071 | - | $ | 25.75 | (11) | ||||||||
| Fiscal year 2019 (as of February 28, 2019) | $ | 60,000 | $ | 2,345 | - | $ | 24.97 | (11) | ||||||||
SENIOR SECURITIES
(dollar amounts in thousands, except per share data)
| Class and Year (1)(2) | Total Amount Outstanding Exclusive of Treasury Securities(3) | Asset Coverage per Unit(4) | Involuntary Liquidating Preference per Share(5) | Average Market Value per Share(6) | ||||||||||||
| (in thousands) | ||||||||||||||||
| 7.00% Notes due 2025 | ||||||||||||||||
| Fiscal year 2024 (as of February 29, 2024) | $ | 12,000 | $ | 1,610 | - | $ | 25.00 | (12) | ||||||||
| Fiscal year 2023 (as of February 28, 2023) | $ | 12,000 | $ | 1,659 | - | $ | 25.00 | (12) | ||||||||
| 7.25% Notes due 2025(16) | ||||||||||||||||
| Fiscal year 2023 (as of February 28, 2023) | - | - | - | N/A | ||||||||||||
| Fiscal year 2022 (as of February 28, 2022) | $ | 43,125 | $ | 2,093 | - | $ | 25.46 | (11) | ||||||||
| Fiscal year 2021 (as of February 28, 2021) | $ | 43,125 | $ | 3,471 | - | $ | 25.77 | (11) | ||||||||
| 7.75% Notes due 2025 | ||||||||||||||||
| Fiscal year 2024 (as of February 29, 2024) | $ | 5,000 | $ | 1,610 | - | $ | 25.00 | (12) | ||||||||
| Fiscal year 2023 (as of February 28, 2023) | $ | 5,000 | $ | 1,659 | - | $ | 25.00 | (12) | ||||||||
| Fiscal year 2022 (as of February 28, 2022) | $ | 5,000 | $ | 2,093 | - | $ | 25.00 | (12) | ||||||||
| Fiscal year 2021 (as of February 28, 2021) | $ | 5,000 | $ | 3,471 | - | $ | 25.00 | (12) | ||||||||
| 4.375% Notes due 2026 | ||||||||||||||||
| Fiscal year 2024 (as of February 29, 2024) | $ | 175,000 | $ | 1,610 | - | $ | 25.00 | (12) | ||||||||
| Fiscal year 2023 (as of February 28, 2023) | $ | 175,000 | $ | 1,659 | - | $ | 25.00 | (12) | ||||||||
| Fiscal year 2022 (as of February 28, 2022) | $ | 175,000 | $ | 2,093 | - | $ | 25.00 | (12) | ||||||||
| 4.35% Notes due 2027 | ||||||||||||||||
| Fiscal year 2024 (as of February 29, 2024) | $ | 75,000 | $ | 1,610 | - | $ | 25.00 | (12) | ||||||||
| Fiscal year 2023 (as of February 28, 2023) | $ | 75,000 | $ | 1,659 | - | $ | 25.00 | (12) | ||||||||
| Fiscal year 2022 (as of February 28, 2022) | $ | 75,000 | $ | 2,093 | - | $ | 25.00 | (12) | ||||||||
| 6.00% Notes due 2027 | ||||||||||||||||
| Fiscal year 2024 (as of February 29, 2024) | $ | 105,500 | $ | 1,610 | - | $ | 23.51 | (15) | ||||||||
| Fiscal year 2023 (as of February 28, 2023) | $ | 105,500 | $ | 1,659 | - | $ | 23.97 | (15) | ||||||||
| 6.25% Notes due 2027 | ||||||||||||||||
| Fiscal year 2024 (as of February 29, 2024) | $ | 15,000 | $ | 1,610 | - | $ | 25.00 | (12) | ||||||||
| Fiscal year 2023 (as of February 28, 2023) | $ | 15,000 | $ | 1,659 | - | $ | 25.00 | (12) | ||||||||
| Fiscal year 2022 (as of February 28, 2022) | $ | 15,000 | $ | 2,093 | - | $ | 25.00 | (12) | ||||||||
| Fiscal year 2021 (as of February 28, 2021) | $ | 15,000 | $ | 3,471 | - | $ | 25.00 | (12) | ||||||||
| 8.00% Notes due 2027 | ||||||||||||||||
| Fiscal year 2024 (as of February 29, 2024) | $ | 46,000 | $ | 1,610 | - | $ | 25.00 | (15) | ||||||||
| 8.125% Notes due 2027 | ||||||||||||||||
| Fiscal year 2024 (as of February 29, 2024) | $ | 60,375 | $ | 1,610 | - | $ | 25.05 | (15) | ||||||||
| Fiscal year 2023 (as of February 28, 2023) | $ | 60,375 | $ | 1,659 | - | $ | 25.10 | (15) | ||||||||
| 8.50% Notes due 2028 | ||||||||||||||||
| Fiscal year 2024 (as of February 29, 2024) | $ | 57,500 | $ | 1,610 | - | $ | 25.17 | (17) | ||||||||
| (1) | We have excluded our SBA-guaranteed debentures from this table because the SEC has granted us exemptive relief that permits us to exclude such debentures from the definition of senior securities in the 150% asset coverage ratio we are required to maintain under the 1940 Act. |
| (2) | This table does not include the senior securities of our predecessor entity, GSC Investment Corp., relating to a revolving securitized credit facility with Deutsche Bank, in light of the fact that the Company was under different management during the time that such credit facility was outstanding. |
| (3) | Total amount of senior securities outstanding at the end of the period presented. |
| (4) | Asset coverage per unit is the ratio of our total assets, less all liabilities and indebtedness not represented by senior securities, to the aggregate amount of senior securities representing indebtedness. Asset coverage per unit is expressed in terms of dollar amounts per $1,000 of indebtedness, calculated on a total basis. |
| (5) | The amount to which such class of senior security would be entitled upon the involuntary liquidation of the issuer in preference to any security junior to it. The “—” indicates information which the Securities and Exchange Commission expressly does not require to be disclosed for certain types of senior securities. |
| (6) | Not applicable for credit facility because not registered for public trading. |
| (7) | On January 13, 2017, the Company redeemed in full its 2020 Notes. The Company used a portion of the net proceeds from the 2023 Notes offering, which was completed in December 2016, to redeem the 2020 Notes in full. |
| (8) | Based on the average daily trading price of the 2020 Notes on the NYSE. |
| (9) | On December 21, 2019 and February 7, 2020, the Company redeemed $50.0 million and $24.45 million, respectively, in aggregate principal amount of the $74.45 million in aggregate principal amount of issued and outstanding 2023 Notes. |
| (10) | Based on the average daily trading price of the 2023 Notes on the NYSE. |
| (11) | Based on the average daily trading price of the 2025 Notes on the NYSE. |
| (12) | The carrying value of this unlisted security approximates its fair value, based on a waterfall analysis showing adequate collateral coverage. |
| (13) | On August 31, 2021, the Company redeemed $60.0 million in aggregate principal amount of the issued and outstanding 6.25% 2025 Notes. The Company used a portion of the net proceeds from the 4.375% 2026 Notes offering, which was completed in July 2021, to redeem the 6.25% 2025 Notes in full. |
| (14) | On October 4, 2021, the Company repaid all remaining amounts outstanding under the Madison Credit Facility and the credit agreement relating to the Madison Credit Facility was terminated. |
| (15) | Based on the average daily trading price of the 2027 Notes on the NYSE. |
| (16) | On July 14, 2022, the Company redeemed $43.1 million in aggregate principal amount of the issued and outstanding 7.25% 2025 Notes. |
| (17) | Based on the average daily trading price of the 2028 Notes on the NYSE. |
Note 9. Commitments and Contingencies
Contractual Obligations
The following table shows our payment obligations for repayment of debt and other contractual obligations at February 28, 2022:29, 2024:
| Payment Due by Period | ||||||||||||||||||||
| Long-Term Debt Obligations | Total | Less Than 1 Year | 1 - 3 Years | 3 - 5 Years | More Than 5 Years | |||||||||||||||
| ($ in thousands) | ||||||||||||||||||||
| Revolving credit facility | $ | 12,500 | $ | - | $ | 12,500 | $ | - | $ | - | ||||||||||
| SBA debentures | 185,000 | - | 15,000 | 24,660 | 145,340 | |||||||||||||||
| 7.25% 2025 Notes | 43,125 | - | - | 43,125 | - | |||||||||||||||
| 7.75% 2025 Notes | 5,000 | - | - | 5,000 | - | |||||||||||||||
| 4.375% 2026 Notes | 175,000 | - | 175,000 | |||||||||||||||||
| 4.35% 2027 Notes | 75,000 | 75,000 | ||||||||||||||||||
| 6.25% 2027 Notes | 15,000 | - | - | - | 15,000 | |||||||||||||||
| Total Long-Term Debt Obligations | $ | 260,625 | $ | - | $ | 27,500 | $ | 72,785 | $ | 160,340 | ||||||||||
| Payment Due by Period | ||||||||||||||||||||
| Long-Term Debt Obligations | Total | Less Than 1 Year | 1 - 3 Years | 3 - 5 Years | More Than 5 Years | |||||||||||||||
| ($ in thousands) | ||||||||||||||||||||
| Encina credit facility | $ | 35,000 | $ | - | $ | 35,000 | $ | - | $ | - | ||||||||||
| SBA debentures | 214,000 | - | - | - | 214,000 | |||||||||||||||
| 8.75% 2025 Notes | 20,000 | - | 20,000 | - | - | |||||||||||||||
| 7.00% 2025 Notes | 12,000 | - | 12,000 | - | - | |||||||||||||||
| 7.75% 2025 Notes | 5,000 | - | 5,000 | - | - | |||||||||||||||
| 4.375% 2026 Notes | 175,000 | - | 175,000 | - | - | |||||||||||||||
| 4.35% 2027 Notes | 75,000 | - | 75,000 | - | - | |||||||||||||||
| 6.00% 2027 Notes | 105,500 | - | - | 105,500 | - | |||||||||||||||
| 6.25% 2027 Notes | 15,000 | - | - | 15,000 | - | |||||||||||||||
| 8.00% 2027 Notes | 46,000 | - | - | 46,000 | - | |||||||||||||||
| 8.125% 2027 Notes | 60,375 | - | - | 60,375 | - | |||||||||||||||
| 8.50% 2028 Notes | 57,500 | - | - | 57,500 | - | |||||||||||||||
| Total Long-Term Debt Obligations | $ | 820,375 | $ | - | $ | 322,000 | $ | 284,375 | $ | 214,000 | ||||||||||
Off-balance Sheet Arrangements
At February 28, 202229, 2024 and February 28, 2021,2023, the Company’s off-balance sheet arrangements consisted of $88.4$132.4 million and $58.8$108.8 million, respectively, of unfunded commitments outstanding to provide debt financing to its portfolio companies or to fund limited partnership interests. Such commitments are generally up to the Company’s discretion to approve, or the satisfaction of certain financial and nonfinancial covenants and involve, to varying degrees, elements of credit risk in excess of the amount recognized in the Company’s consolidated statements of assets and liabilities and are not reflected in the Company’s consolidated statements of assets and liabilities.
A summary of the unfunded commitments outstanding as of February 28, 202229, 2024 and February 28, 20212023 is shown in the table below (dollars in thousands):
| February 28, 2022 | February 28, 2021 | |||||||
| At Company’s discretion | ||||||||
| Artemin Wax | $ | 3,700 | $ | - | ||||
| Ascend Software LLC | 5,000 | - | ||||||
| Axero Holdings | 3,000 | - | ||||||
| Book4Time, Inc. | 2,000 | 2,000 | ||||||
| CLEO Communications Holding, LLC | - | 630 | ||||||
| Davisware | 2,000 | - | ||||||
| GreyHeller LLC | - | 15,000 | ||||||
| LFR Chicken LLC | 10,000 | - | ||||||
| Netreo Holdings, LLC | 4,000 | 10,000 | ||||||
| Omatic Software, LLC | - | - | ||||||
| Passageways, Inc. | - | 5,000 | ||||||
| Pepper Palace | 3,000 | - | ||||||
| Procrement Partners | 2,800 | - | ||||||
| Saratoga Senior Loan Fund I JV LLC | 17,500 | - | ||||||
| Sceptre Hospitality Resources | 1,000 | - | ||||||
| Top Gun Pressure Washing, LLC | - | 3,175 | ||||||
| Village Realty Holdings LLC | - | 10,000 | ||||||
| Total | 54,000 | 45,805 | ||||||
| At portfolio company’s discretion - satisfaction of certain financial and nonfinancial covenants required | ||||||||
| Ascend Software LLC | 6,500 | - | ||||||
| Axero Holdings | 2,000 | - | ||||||
| Axero Holdings - Revolver | 500 | - | ||||||
| Davisware, LLC | 1,000 | - | ||||||
| GDS Holdings US, Inc. | 2,786 | - | ||||||
| GoReact | 2,500 | 2,000 | ||||||
| Granite Comfort, LP | - | - | ||||||
| HemaTerra Holding Company, LLC | - | 2,000 | ||||||
| LFR Chicken LLC | 3,000 | - | ||||||
| Madison Logic - Revolver | 1,084 | - | ||||||
| New England Dental Partners | 4,500 | 6,000 | ||||||
| Passageways, Inc. | - | 2,000 | ||||||
| Pepper Palace - DDTL | 2,000 | - | ||||||
| Pepper Palace - Revolver | 2,500 | - | ||||||
| Procurement Partners, LLC | - | 1,000 | ||||||
| Zollege | 1,000 | - | ||||||
| 29,370 | 13,000 | |||||||
| Total | $ | 83,370 | $ | 58,805 | ||||
| February 29, 2024 | February 28, 2023 | |||||||
| At Company’s discretion | ||||||||
| ActiveProspect, Inc. | $ | 10,000 | $ | 10,000 | ||||
| Artemis Wax Corp. | 23,500 | - | ||||||
| Ascend Software, LLC | 5,000 | 5,000 | ||||||
| Granite Comfort, LP | 750 | 15,000 | ||||||
| JDXpert | 5,000 | 5,000 | ||||||
| LFR Chicken LLC | - | 4,000 | ||||||
| Pepper Palace, Inc. | 1,898 | 3,000 | ||||||
| Procurement Partners, LLC | 4,250 | 4,250 | ||||||
| Saratoga Senior Loan Fund I JV, LLC | 8,548 | 8,548 | ||||||
| Sceptre Hospitality Resources, LLC | 5,000 | 5,000 | ||||||
| Stretch Zone Franchising, LLC | 3,750 | - | ||||||
| VetnCare MSO, LLC | 10,000 | - | ||||||
| Total | $ | 77,696 | $ | 59,798 | ||||
| At portfolio company’s discretion - satisfaction of certain financial and nonfinancial covenants required | ||||||||
| Alpha Aesthetics Partners OpCo, LLC | $ | 6,500 | $ | - | ||||
| ARC Health OpCo LLC | 2,585 | 10,773 | ||||||
| Artemis Wax Corp. | - | 8,500 | ||||||
| Ascend Software, LLC | - | 3,200 | ||||||
| Axero Holdings, LLC - Revolver | 500 | 500 | ||||||
| Axiom Medical Consulting, LLC | 2,000 | - | ||||||
| BQE Software, Inc. | 3,250 | - | ||||||
| C2 Educational Systems | 3,000 | - | ||||||
| Davisware, LLC | 750 | - | ||||||
| Exigo, LLC | - | 4,167 | ||||||
| Exigo, LLC - Revolver | 1,042 | 833 | ||||||
| Gen4 Dental Partners Holdings, LLC | - | 11,000 | ||||||
| GoReact | 2,500 | 2,500 | ||||||
| Granite Comfort, LP | 11,637 | - | ||||||
| JDXpert | - | 1,000 | ||||||
| Inspect Point Holding, LLC | 1,500 | - | ||||||
| Pepper Palace, Inc. - Delayed Draw Term Loan | - | 2,000 | ||||||
| Pepper Palace, Inc. - Revolver | 2,500 | 2,500 | ||||||
| Procurement Partners, LLC | - | 1,000 | ||||||
| Stretch Zone Franchising, LLC | 1,500 | - | ||||||
| VetnCare MSO, LLC | 15,319 | - | ||||||
| Zollege PBC | 150 | 1,000 | ||||||
| 54,733 | 48,973 | |||||||
| Total | $ | 132,429 | $ | 108,771 | ||||
The Company believes its assets will provide adequate coverage to satisfy these unfunded commitments. As of February 28, 2022,29, 2024, the Company had cash and cash equivalents of $47.3$8.7 million and $37.5$31.8 million in available borrowings under the Encina Credit Facility.
Note 10. Directors Fees
The independent directors each receive an annual fee of $70,000. They also receive $3,000 plus reimbursement of reasonable out-of-pocket expenses incurred in connection with attending each board meeting and receive $1,500 plus reimbursement of reasonable out-of-pocket expenses incurred in connection with attending each committee meeting. In addition, the chairman of the Audit Committee receives an annual fee of $12,500 and the chairman of each other committee of the board of directors receives an annual fee of $6,000 for their additional services in these capacities. In addition, we have purchased directors’ and officers’ liability insurance on behalf of our directors and officers. Independent directors have the option to receive their directors’ fees in the form of our common stock issued at a price per share equal to the greater of net asset valueNAV or the market price at the time of payment. No compensation is paid to directors who are “interested persons” of the Company (as such termdefined in Section 2(a)(19) of the 1940 Act). No compensation is paid to directors who are “interested persons” of the Company (as defined in Section 2(a)(19) of the 1940 Act). For the years ended February 29, 2024, February 28, 2023 and February 28, 2022, February 28, 2021 and February 29, 2020, we incurred $0.3$0.4 million, $0.3$0.4 million and $0.3 million for directors’ fees and expenses, respectively. As of February 28, 202229, 2024 and February 28, 2021, $0.072023, $0.0 million and $0.07$0.01 million in directors’ fees and expenses were accrued and unpaid, respectively. As of February 28, 2022,29, 2024, we had not issued any common stock to our directors as compensation for their services.
Note 11. Stockholders’ Equity
On May 16, 2006, GSC Group, Inc. capitalized the LLC, by contributing $1,000 in exchange for 67 shares, constituting all of the issued and outstanding shares of the LLC.Share Repurchases
On March 20, 2007, the Company issued 95,995.5 and 8,136.2 shares of common stock, priced at $150.00 per share, to GSC Group and certain individual employees of GSC Group, respectively, in exchange for the general partnership interest and a limited partnership interest in GSC Partners CDO III GP, LP, collectively valued at $15.6 million. At this time, the 6.7 shares owned by GSC Group in the LLC were exchanged for 6.7 shares of the Company.
On March 28, 2007, the Company completed its IPO of 725,000 shares of common stock, priced at $150.00 per share, before underwriting discounts and commissions. Total proceeds received from the IPO, net of $7.1 million in underwriter’s discount and commissions, and $1.0 million in offering costs, were $100.7 million.
On July 30, 2010, our Manager and its affiliates purchased 986,842 shares of common stock at $15.20 per share. Total proceeds received from this sale were $15.0 million.
On August 12, 2010, we effected a one-for-ten reverse stock split of our outstanding common stock. As a result of the reverse stock split, every ten shares of our common stock were converted into one share of our common stock. Any fractional shares received as a result of the reverse stock split were redeemed for cash. The total cash payment in lieu of shares was $230. Immediately after the reverse stock split, we had 2,680,842 shares of our common stock outstanding.
On September 24, 2014, the Company announced the approval of an open market share repurchase plan that originally allowed it to repurchase up to 200,000 shares of its common stock at prices below its NAV as reported in its then most recently published consolidated financial statements (the “Share Repurchase Plan”). On October 7, 2015, our board of directors extendedSince September 24, 2014, the Share Repurchase Plan for another yearhas been extended annually, and the Company has periodically increased the numberamount of shares of common stock that may be purchased under the Company is permitted to repurchase at prices below its NAV, as reported in its thenShare Repurchase Plan, most recently published consolidated financial statements, to 400,0001.7 million shares of its common stock. On October 5, 2016, ourJanuary 8, 2024, the Company’s board of directors extended the Share Repurchase Plan for another year to October 15, 2017 and increased the number of shares the Company is permitted to repurchase at prices below its NAV, as reported in its then most recently published consolidated financial statements, to 600,000 shares of its common stock. On October 10, 2017, January 8, 2019 and January 7, 2020, our board of directors extended the Share Repurchase Plan for another year to October 15, 2018, January 15, 2020 and January 15, 2021, respectively, each time leaving the number of shares unchanged at 600,000 shares of its common stock. On May 4, 2020, our board of directors increased the Share Repurchase Plan to 1.3 million shares of common stock. On January 5, 2021, our board of directors extended the Shares Repurchase Plan for another year to January 15, 2022, leaving the number of shares unchanged at 1.3 million shares of common stock.2025. As of February 28, 2022,29, 2024, the Company purchased 508,4351,035,203 shares of common stock, at the average price of $19.35$22.05 for approximately $9.8$22.8 million pursuant to the Share Repurchase Plan. During the three months ended February 28, 202229, 2024, the Company purchased 50,000did not purchase any shares of common stock at the average price $25.86 for approximately $1.3 million pursuant to the Share Repurchase Plan. During the year ended February 28, 2022,29, 2024, the Company purchased 99,62388,576 shares of common stock, at the average price $25.55$24.36 for approximately $2.5$2.2 million pursuant to the Share Repurchase Plan.
Public Equity Offering
On July 13, 2018, the Company issued 1,150,000 shares of its common stock priced at $25.00 per share (par value $0.001 per share) at an aggregate total of $28.75 million. The net proceeds, after deducting underwriting commissions of $1.15 million and offering costs of approximately $0.2 million, amounted to approximately $27.4 million. The Company also granted the underwriters a 30-day option to purchase up to an additional 172,500 shares of its common stock, which was not exercised.
Equity ATM Program
On March 16, 2017, wethe Company entered into an equity distribution agreement with Ladenburg Thalmann & Co. Inc., through which we may offerthe Company offered for sale, from time to time, up to $30.0 million of ourthe Company’s common stock through an ATM offering. Subsequent to this, BB&T Capital Markets and B. Riley FBR, Inc. were also added to the agreement. On July 9,11, 2019, the amount of the common stock to be offered through this offering was increased to $70.0 million, and on October 8, 2019, the amount of the common stock to be offered was increased to $130.0 million. This agreement was terminated as of July 29, 2021. As2021, and as of February 28, 2021,that date, the Company had sold 3,922,018 shares for gross proceeds of $97.1 million at an average price of $24.77 for aggregate net proceeds of $95.9 million (net of transaction costs). For the year ended February 28, 2021, there was no activity related to the ATM offerings.
On July 30, 2021, wethe Company entered into an equity distribution agreement (the “Equity Distribution Agreement”) with Ladenburg Thalmann & Co. Inc. and Compass Point Research and Trading, LLC (collectively the “Agents”), through which wethe Company may offer for sale, from time to time, up to $150.0 million of ourthe Company’s common stock through the Agents, or to them, as principal for their account. account (the “ATM Program”).
On July 6, 2023, the Equity Distribution Agreement was amended to increase the maximum amount of shares of our common stock to be sold through the ATM Program to $300.0 million from $150.0 million, and on July 19, 2023, the Equity Distribution Agreement was amended to add an additional distribution agent, Raymond James & Associates. The sales price per share of the Company’s common stock offered under the ATM Program, less the Agents’ commission, will not be less than the NAV per share of the Company’s common stock at the time of such sale. Consistent with the terms of the ATM Program, the Manager may, from time to time and in its sole discretion, contribute proceeds necessary to ensure that no sales are made at a price below the then-current NAV per share.
As of February 28, 2022,29, 2024 the Company sold 4,840,3616,543,878 shares for gross proceeds of $123.9$172.5 million at an average price of $25.61$26.37 for aggregate net proceeds of $122.4$171.0 million (net of transaction costs). During the three months ended February 28, 2022,29, 2024, the Company sold 392,926501,105 shares for gross proceeds of $11.5$14.3 million at an average price of $29.31$28.44 for aggregate net proceeds of $11.4$14.3 million (net of transaction cost)costs). During the year ended February 28, 2022,29, 2024, the Company sold 918,3431,703,517 shares for gross proceeds of $26.8$49.0 million at an average price of $29.22$28.51 for aggregate net proceeds of $26.6$49.0 million (net of transaction cost)costs). The Manager agreed to reimburse the Company to the extent the per share price of the shares to the public, less underwriting fees, was less than net asset value per share. For the three months ended February 29, 2024, the Manager reimbursed the Company $1.4 million. For the year ended February 29, 2024, the Manager reimbursed the Company $4.5 million.
F-60
The Company adopted Rule 3-04/Rule 8-03(a)(5) under Regulation S-X (Note 2). Pursuant to the regulation,Regulation S-X, the Company has presented a reconciliation of the changes in each significant caption of stockholders’ equity as shown in the tables below:
| Total | Total | |||||||||||||||||||||||||||||||||||||||
| Common Stock | Capital in Excess | Distributable Earnings | Common Stock | Capital in Excess | Distributable Earnings | |||||||||||||||||||||||||||||||||||
| Shares | Amount | of Par Value | (Loss) | Net Assets | Shares | Amount | of Par Value | (Loss) | Net Assets | |||||||||||||||||||||||||||||||
| Balance at February 29, 2020 | 11,217,545 | $ | 11,218 | $ | 289,476,991 | $ | 14,798,644 | $ | 304,286,853 | |||||||||||||||||||||||||||||||
| Balance at February 28, 2022 | 12,131,350 | $ | 12,131 | $ | 328,062,246 | $ | 27,706,146 | $ | 355,780,523 | |||||||||||||||||||||||||||||||
| Increase (Decrease) from Operations: | ||||||||||||||||||||||||||||||||||||||||
| Net investment income | - | - | - | 9,018,314 | 9,018,314 | - | - | - | 7,976,222 | 7,976,222 | ||||||||||||||||||||||||||||||
| Net realized gain (loss) from investments | - | - | - | 8,480 | 8,480 | - | - | - | 162,509 | 162,509 | ||||||||||||||||||||||||||||||
| Income tax (provision) benefit from realized gain on investments | - | - | - | 69,250 | 69,250 | |||||||||||||||||||||||||||||||||||
| Net change in unrealized appreciation (depreciation) on investments | - | - | - | (31,950,369 | ) | (31,950,369 | ) | - | - | - | (9,333,449 | ) | (9,333,449 | ) | ||||||||||||||||||||||||||
| Net change in provision for deferred taxes on unrealized (appreciation) depreciation on investments | - | - | - | 267,740 | 267,740 | - | - | - | (361,951 | ) | (361,951 | ) | ||||||||||||||||||||||||||||
| Decrease from Shareholder Distributions: | ||||||||||||||||||||||||||||||||||||||||
| Distributions of investment income – net | - | - | - | - | - | - | - | - | (6,428,817 | ) | (6,428,817 | ) | ||||||||||||||||||||||||||||
| Capital Share Transactions: | ||||||||||||||||||||||||||||||||||||||||
| Proceeds from issuance of common stock | - | - | - | - | - | |||||||||||||||||||||||||||||||||||
| Stock dividend distribution | - | - | - | - | - | 42,825 | 43 | 1,108,637 | - | 1,108,680 | ||||||||||||||||||||||||||||||
| Repurchases of common stock | - | - | - | - | - | (142,177 | ) | (142 | ) | (3,734,174 | ) | - | (3,734,316 | ) | ||||||||||||||||||||||||||
| Offering costs | - | - | - | - | - | |||||||||||||||||||||||||||||||||||
| Balance at May 31, 2020 | 11,217,545 | $ | 11,218 | $ | 289,476,991 | $ | (7,857,191 | ) | $ | 281,631,018 | ||||||||||||||||||||||||||||||
| Repurchase fees | - | - | (2,840 | ) | - | (2,840 | ) | |||||||||||||||||||||||||||||||||
| Balance at May 31, 2022 | 12,031,998 | $ | 12,032 | $ | 325,433,869 | $ | 19,789,910 | $ | 345,235,811 | |||||||||||||||||||||||||||||||
| Increase (Decrease) from Operations: | ||||||||||||||||||||||||||||||||||||||||
| Net investment income | - | - | - | 5,334,713 | 5,334,713 | - | - | - | 7,698,014 | 7,698,014 | ||||||||||||||||||||||||||||||
| Net realized gain (loss) from investments | - | - | - | 11,929 | 11,929 | - | - | - | 7,943,838 | 7,943,838 | ||||||||||||||||||||||||||||||
| Realized losses on extinguishment of debt | - | - | - | (1,204,809 | ) | (1,204,809 | ) | |||||||||||||||||||||||||||||||||
| Net change in unrealized appreciation (depreciation) on investments | - | - | - | 16,580,401 | 16,580,401 | - | - | - | (13,258,456 | ) | (13,258,456 | ) | ||||||||||||||||||||||||||||
| Net change in provision for deferred taxes on unrealized (appreciation) depreciation on investments | - | - | - | (116,521 | ) | (116,521 | ) | - | - | - | (230,154 | ) | (230,154 | ) | ||||||||||||||||||||||||||
| Decrease from Shareholder Distributions: | ||||||||||||||||||||||||||||||||||||||||
| Distributions of investment income – net | - | - | - | (4,487,015 | ) | (4,487,015 | ) | - | - | - | (6,369,981 | ) | (6,369,981 | ) | ||||||||||||||||||||||||||
| Capital Share Transactions: | ||||||||||||||||||||||||||||||||||||||||
| Proceeds from issuance of common stock | - | - | - | - | - | |||||||||||||||||||||||||||||||||||
| Stock dividend distribution | 47,098 | 46 | 774,944 | - | 774,990 | 48,590 | 49 | 1,088,139 | - | 1,088,188 | ||||||||||||||||||||||||||||||
| Repurchases of common stock | (90,321 | ) | (90 | ) | (1,550,327 | ) | - | (1,550,417 | ) | (153,350 | ) | (154 | ) | (3,685,951 | ) | - | (3,686,105 | ) | ||||||||||||||||||||||
| Repurchase fees | - | - | (1,740 | ) | - | (1,740 | ) | - | - | (3,071 | ) | - | (3,071 | ) | ||||||||||||||||||||||||||
| Offering costs | - | - | - | - | - | |||||||||||||||||||||||||||||||||||
| Balance at August 31, 2020 | 11,174,322 | $ | 11,174 | $ | 288,699,868 | $ | 9,466,316 | $ | 298,177,358 | |||||||||||||||||||||||||||||||
| Balance at August 31, 2022 | 11,927,238 | $ | 11,927 | $ | 322,832,986 | $ | 14,368,362 | $ | 337,213,275 | |||||||||||||||||||||||||||||||
| Total | ||||||||||||||||||||
| Common Stock | Capital in Excess | Distributable Earnings | ||||||||||||||||||
| Shares | Amount | of Par Value | (Loss) | Net Assets | ||||||||||||||||
| Increase (Decrease) from Operations: | ||||||||||||||||||||
| Net investment income | - | - | - | 4,471,102 | 4,471,102 | |||||||||||||||
| Net realized gain (loss) from investments | - | - | - | 1,798 | 1,798 | |||||||||||||||
| Income tax (provision) benefit from realized gain on investments | (3,895,354 | ) | (3,895,354 | ) | ||||||||||||||||
| Net change in unrealized appreciation (depreciation) on investments | - | - | - | 5,998,830 | 5,998,830 | |||||||||||||||
| Net change in provision for deferred taxes on unrealized (appreciation) depreciation on investments | - | - | - | (210,057 | ) | (210,057 | ) | |||||||||||||
| Decrease from Shareholder Distributions: | ||||||||||||||||||||
| Distributions of investment income – net | - | - | - | (4,581,469 | ) | (4,581,469 | ) | |||||||||||||
| Capital Share Transactions: | ||||||||||||||||||||
| Proceeds from issuance of common stock | - | - | - | - | - | |||||||||||||||
| Stock dividend distribution | 45,706 | 46 | 805,883 | - | 805,929 | |||||||||||||||
| Repurchases of common stock | (50,000 | ) | (50 | ) | (914,194 | ) | - | (914,244 | ) | |||||||||||
| Repurchase fees | - | - | (1,003 | ) | - | (1,003 | ) | |||||||||||||
| Offering costs | - | - | - | - | - | |||||||||||||||
| Balance at November 30, 2020 | 11,170,028 | $ | 11,170 | $ | 288,590,554 | $ | 11,251,166 | $ | 299,852,890 | |||||||||||
| Increase (Decrease) from Operations: | ||||||||||||||||||||
| Net investment income | - | - | - | 4,288,996 | 4,288,996 | |||||||||||||||
| Net realized gain (loss) from investments | - | - | - | (8,726,013 | ) | (8,726,013 | ) | |||||||||||||
| Income tax (provision) benefit from realized gain on investments | - | - | - | - | - | |||||||||||||||
| Realized losses on extinguishment of debt | (128,617 | ) | (128,617 | ) | ||||||||||||||||
| Net change in unrealized appreciation (depreciation) on investments | - | - | - | 14,337,460 | 14,337,460 | |||||||||||||||
| Net change in provision for deferred taxes on unrealized (appreciation) depreciation on investments | - | - | - | (515,796 | ) | (515,796 | ) | |||||||||||||
| Decrease from Shareholder Distributions: | ||||||||||||||||||||
| Distributions of investment income – net | - | - | - | (4,678,514 | ) | (4,678,514 | ) | |||||||||||||
| Capital Share Transactions: | ||||||||||||||||||||
| Proceeds from issuance of common stock | - | - | - | - | - | |||||||||||||||
| Stock dividend distribution | 41,388 | 41 | 900,124 | - | 900,165 | |||||||||||||||
| Repurchases of common stock | (50,000 | ) | (50 | ) | (1,143,748 | ) | - | (1,143,798 | ) | |||||||||||
| Repurchase fees | - | - | (1,003 | ) | - | (1,003 | ) | |||||||||||||
| Offering costs | - | - | - | - | - | |||||||||||||||
| Tax reclassification of stockholders’ equity in accordance with generally accepted accounting principles | - | - | 16,529,030 | (16,529,030 | ) | - | ||||||||||||||
| Balance at February 28, 2021 | 11,161,416 | $ | 11,161 | $ | 304,874,957 | $ | (700,348 | ) | $ | 304,185,770 | ||||||||||
| Increase (Decrease) from Operations: | ||||||||||||||||||||
| Net investment income | - | - | - | 2,555,935 | 2,555,935 | |||||||||||||||
| Net realized gain (loss) from investments | - | - | - | 1,910,141 | 1,910,141 | |||||||||||||||
| Net change in unrealized appreciation (depreciation) on investments | - | - | - | 16,812,577 | 16,812,577 | |||||||||||||||
| Net change in provision for deferred taxes on unrealized (appreciation) depreciation on investments | - | - | - | (230,144 | ) | (230,144 | ) | |||||||||||||
| Decrease from Shareholder Distributions: | ||||||||||||||||||||
| Distributions of investment income – net | - | - | - | (4,799,405 | ) | (4,799,405 | ) | |||||||||||||
| Capital Share Transactions: | ||||||||||||||||||||
| Proceeds from issuance of common stock | - | - | - | - | - | |||||||||||||||
| Stock dividend distribution | 38,580 | 39 | 914,063 | - | 914,102 | |||||||||||||||
| Repurchases of common stock | (40,000 | ) | (40 | ) | (1,003,380 | ) | - | (1,003,420 | ) | |||||||||||
| Repurchase fees | - | - | (800 | ) | - | (800 | ) | |||||||||||||
| Offering costs | - | - | - | - | - | |||||||||||||||
| Balance at May 31, 2021 | 11,159,995 | $ | 11,160 | $ | 304,784,840 | $ | 15,548,756 | $ | 320,344,756 | |||||||||||
| Total | Total | |||||||||||||||||||||||||||||||||||||||
| Common Stock | Capital in Excess | Distributable Earnings | Common Stock | Capital in Excess | Distributable Earnings | |||||||||||||||||||||||||||||||||||
| Shares | Amount | of Par Value | (Loss) | Net Assets | Shares | Amount | of Par Value | (Loss) | Net Assets | |||||||||||||||||||||||||||||||
| Increase (Decrease) from Operations: | ||||||||||||||||||||||||||||||||||||||||
| Net investment income | - | - | - | 6,393,261 | 6,393,261 | - | - | - | 9,877,437 | 9,877,437 | ||||||||||||||||||||||||||||||
| Net realized gain (loss) from investments | - | - | - | 1,501,597 | 1,501,597 | - | - | - | (740,434 | ) | (740,434 | ) | ||||||||||||||||||||||||||||
| Income tax (provision) benefit from realized gain on investments | - | - | - | (448,883 | ) | (448,883 | ) | - | - | - | 479,318 | 479,318 | ||||||||||||||||||||||||||||
| Net change in unrealized appreciation (depreciation) on investments | - | - | - | (3,176,208 | ) | (3,176,208 | ) | |||||||||||||||||||||||||||||||||
| Net change in provision for deferred taxes on unrealized (appreciation) depreciation on investments | - | - | - | (425,848 | ) | (425,848 | ) | |||||||||||||||||||||||||||||||||
| Decrease from Shareholder Distributions: | ||||||||||||||||||||||||||||||||||||||||
| Distributions of investment income – net | - | - | - | (6,433,298 | ) | (6,433,298 | ) | |||||||||||||||||||||||||||||||||
| Capital Share Transactions: | ||||||||||||||||||||||||||||||||||||||||
| Stock dividend distribution | 52,312 | 53 | 1,150,881 | - | 1,150,934 | |||||||||||||||||||||||||||||||||||
| Repurchases of common stock | (94,071 | ) | (95 | ) | (2,179,600 | ) | - | (2,179,695 | ) | |||||||||||||||||||||||||||||||
| Repurchase fees | - | - | (1,881 | ) | - | (1,881 | ) | |||||||||||||||||||||||||||||||||
| Balance at November 30, 2022 | 11,885,479 | $ | 11,885 | $ | 321,802,386 | $ | 13,949,329 | $ | 335,763,600 | |||||||||||||||||||||||||||||||
| Increase (Decrease) from Operations: | ||||||||||||||||||||||||||||||||||||||||
| Net investment income | - | - | - | 9,649,474 | 9,649,474 | |||||||||||||||||||||||||||||||||||
| Net realized gain (loss) from investments | - | - | - | 80,683 | 80,683 | |||||||||||||||||||||||||||||||||||
| Realized losses on extinguishment of debt | (1,552,140 | ) | (1,552,140 | ) | - | - | - | (382,274 | ) | (382,274 | ) | |||||||||||||||||||||||||||||
| Net change in unrealized appreciation (depreciation) on investments | - | - | - | 3,376,540 | 3,376,540 | - | - | - | 10,549,981 | 10,549,981 | ||||||||||||||||||||||||||||||
| Net change in provision for deferred taxes on unrealized (appreciation) depreciation on investments | - | - | - | (1,328,711 | ) | (1,328,711 | ) | - | - | - | (697,380 | ) | (697,380 | ) | ||||||||||||||||||||||||||
| Decrease from Shareholder Distributions: | ||||||||||||||||||||||||||||||||||||||||
| Distributions of investment income – net | - | - | - | (4,910,394 | ) | (4,910,394 | ) | - | - | - | (8,081,306 | ) | (8,081,306 | ) | ||||||||||||||||||||||||||
| Capital Share Transactions: | ||||||||||||||||||||||||||||||||||||||||
| Proceeds from issuance of common stock | 5,441 | 6 | 157,034 | - | 157,040 | |||||||||||||||||||||||||||||||||||
| Stock dividend distribution | 33,099 | 33 | 828,479 | - | 828,512 | 53,615 | 55 | 1,300,405 | - | 1,300,460 | ||||||||||||||||||||||||||||||
| Repurchases of common stock | (9,623 | ) | (10 | ) | (248,713 | ) | - | (248,723 | ) | (48,594 | ) | (49 | ) | (1,224,175 | ) | - | (1,224,224 | ) | ||||||||||||||||||||||
| Repurchase fees | - | - | (192 | ) | - | (192 | ) | - | - | (972 | ) | - | (972 | ) | ||||||||||||||||||||||||||
| Offering costs | - | - | (817 | ) | - | (817 | ) | |||||||||||||||||||||||||||||||||
| Balance at August 31, 2021 | 11,188,912 | $ | 11,189 | $ | 305,520,631 | $ | 18,580,025 | $ | 324,111,845 | |||||||||||||||||||||||||||||||
| Increase (Decrease) from Operations: | ||||||||||||||||||||||||||||||||||||||||
| Net investment income | - | - | - | 5,196,635 | 5,196,635 | |||||||||||||||||||||||||||||||||||
| Net realized gain (loss) from investments | - | - | - | 9,916,925 | 9,916,925 | |||||||||||||||||||||||||||||||||||
| Income tax (provision) benefit from realized gain on investments | - | - | - | (2,447,173 | ) | (2,447,173 | ) | |||||||||||||||||||||||||||||||||
| Realized losses on extinguishment of debt | (764,123 | ) | (764,123 | ) | ||||||||||||||||||||||||||||||||||||
| Net change in unrealized appreciation (depreciation) on investments | - | - | - | (6,042,616 | ) | (6,042,616 | ) | |||||||||||||||||||||||||||||||||
| Net change in provision for deferred taxes on unrealized (appreciation) depreciation on investments | - | - | - | 2,480,465 | 2,480,465 | |||||||||||||||||||||||||||||||||||
| Decrease from Shareholder Distributions: | ||||||||||||||||||||||||||||||||||||||||
| Distributions of investment income – net | - | - | - | (5,889,329 | ) | (5,889,329 | ) | |||||||||||||||||||||||||||||||||
| Capital Share Transactions: | ||||||||||||||||||||||||||||||||||||||||
| Proceeds from issuance of common stock | 520,076 | 520 | 15,163,259 | - | 15,163,779 | |||||||||||||||||||||||||||||||||||
| Stock dividend distribution | 38,016 | 38 | 1,017,625 | - | 1,017,663 | |||||||||||||||||||||||||||||||||||
| Repurchases of common stock | - | - | - | - | - | |||||||||||||||||||||||||||||||||||
| Repurchase fees | - | - | - | - | ||||||||||||||||||||||||||||||||||||
| Offering costs | - | - | (142,326 | ) | - | (142,326 | ) | |||||||||||||||||||||||||||||||||
| Balance at November 30, 2021 | 11,747,004 | $ | 11,747 | $ | 321,559,189 | $ | 21,030,809 | $ | 342,601,745 | |||||||||||||||||||||||||||||||
| Increase (Decrease) from Operations: | ||||||||||||||||||||||||||||||||||||||||
| Net investment income | 5,796,910 | 5,796,910 | ||||||||||||||||||||||||||||||||||||||
| Net realized gain (loss) from investments | 69,664 | 69,664 | ||||||||||||||||||||||||||||||||||||||
| Income tax (provision) benefit from realized gain on investments | 9,612 | 9,612 | ||||||||||||||||||||||||||||||||||||||
| Realized losses on extinguishment of debt | (118,147 | ) | (118,147 | ) | ||||||||||||||||||||||||||||||||||||
| Net change in unrealized appreciation (depreciation) on investments | 2,873,561 | 2,873,561 | ||||||||||||||||||||||||||||||||||||||
| Net change in provision for deferred taxes on unrealized (appreciation) depreciation on investments | (226,702 | ) | (226,702 | ) | ||||||||||||||||||||||||||||||||||||
| Decrease from Shareholder Distributions: | ||||||||||||||||||||||||||||||||||||||||
| Distributions of investment income – net | (6,434,106 | ) | (6,434,106 | ) | ||||||||||||||||||||||||||||||||||||
| Capital Share Transactions: | ||||||||||||||||||||||||||||||||||||||||
| Proceeds from issuance of common stock | 392,826 | 392 | 11,513,992 | 11,514,383 | ||||||||||||||||||||||||||||||||||||
| Stock dividend distribution | 41,520 | 42 | 1,114,886 | 1,114,929 | ||||||||||||||||||||||||||||||||||||
| Repurchases of common stock | (50,000 | ) | (50 | ) | (1,292,843 | ) | (1,292,893 | ) | ||||||||||||||||||||||||||||||||
| Repurchase fees | (1,000 | ) | (1,000 | ) | ||||||||||||||||||||||||||||||||||||
| Offering costs | (127,433 | ) | (127,433 | ) | ||||||||||||||||||||||||||||||||||||
| Tax reclassification of stockholders’ equity in accordance with generally accepted accounting principles | (4,704,545 | ) | 4,704,545 | - | - | 16,162 | (16,162 | ) | - | |||||||||||||||||||||||||||||||
| Balance at February 28, 2022 | 12,131,350 | $ | 12,131 | $ | 328,062,246 | $ | 27,706,146 | $ | 355,780,523 | |||||||||||||||||||||||||||||||
| Balance at February 28, 2023 | 11,890,500 | $ | 11,891 | $ | 321,893,806 | $ | 25,052,345 | $ | 346,958,042 | |||||||||||||||||||||||||||||||
| Total | ||||||||||||||||||||
| Common Stock | Capital in Excess | Distributable Earnings | ||||||||||||||||||
| Shares | Amount | of Par Value | (Loss) | Net Assets | ||||||||||||||||
| Increase (Decrease) from Operations: | ||||||||||||||||||||
| Net investment income | - | - | - | 15,958,950 | 15,958,950 | |||||||||||||||
| Net realized gain (loss) from investments | - | - | - | 90,691 | 90,691 | |||||||||||||||
| Net change in unrealized appreciation (depreciation) on investments | - | - | - | (16,322,307 | ) | (16,322,307 | ) | |||||||||||||
| Net change in provision for deferred taxes on unrealized (appreciation) depreciation on investments | - | - | - | 59,407 | 59,407 | |||||||||||||||
| Decrease from Shareholder Distributions: | ||||||||||||||||||||
| Distributions of investment income – net | - | - | - | (8,193,402 | ) | (8,193,402 | ) | |||||||||||||
| Capital Share Transactions: | ||||||||||||||||||||
| Stock dividend distribution | 45,818 | 47 | 1,058,797 | - | 1,058,844 | |||||||||||||||
| Repurchases of common stock | (88,576 | ) | (90 | ) | (2,157,515 | ) | - | (2,157,605 | ) | |||||||||||
| Repurchase fees | - | - | (1,772 | ) | - | (1,772 | ) | |||||||||||||
| Balance at May 31, 2023 | 11,847,742 | $ | 11,848 | $ | 320,793,316 | $ | 16,645,684 | $ | 337,450,848 | |||||||||||
| Increase (Decrease) from Operations: | ||||||||||||||||||||
| Net investment income | - | - | - | 13,964,784 | 13,964,784 | |||||||||||||||
| Realized losses on extinguishment of debt | - | - | - | (110,056 | ) | (110,056 | ) | |||||||||||||
| Net change in unrealized appreciation (depreciation) on investments | - | - | - | (5,737,571 | ) | (5,737,571 | ) | |||||||||||||
| Net change in provision for deferred taxes on unrealized (appreciation) depreciation on investments | - | - | - | (221,206 | ) | (221,206 | ) | |||||||||||||
| Decrease from Shareholder Distributions: | ||||||||||||||||||||
| Distributions of investment income – net | - | - | - | (8,352,335 | ) | (8,352,335 | ) | |||||||||||||
| Capital Share Transactions: | ||||||||||||||||||||
| Proceeds from issuance of common stock | 852,412 | 852 | 22,497,265 | - | 22,498,117 | |||||||||||||||
| Capital contribution from Manager | - | - | 2,050,288 | - | 2,050,288 | |||||||||||||||
| Stock dividend distribution | 29,627 | 30 | 749,283 | - | 749,313 | |||||||||||||||
| Offfering costs | - | - | (213,427 | ) | - | (213,427 | ) | |||||||||||||
| Balance at August 31, 2023 | 12,729,781 | $ | 12,730 | $ | 345,876,725 | $ | 16,189,300 | $ | 362,078,755 | |||||||||||
| Increase (Decrease) from Operations: | ||||||||||||||||||||
| Net investment income | - | - | - | 14,166,063 | 14,166,063 | |||||||||||||||
| Net realized gain (loss) from investments | - | - | - | 60,565 | 60,565 | |||||||||||||||
| Net change in unrealized appreciation (depreciation) on investments | - | - | - | (17,866,353 | ) | (17,866,353 | ) | |||||||||||||
| Net change in provision for deferred taxes on unrealized (appreciation) depreciation on investments | - | - | - | (415,894 | ) | (415,894 | ) | |||||||||||||
| Decrease from Shareholder Distributions: | ||||||||||||||||||||
| Distributions of investment income – net | - | - | - | (9,286,642 | ) | (9,286,642 | ) | |||||||||||||
| Capital Share Transactions: | ||||||||||||||||||||
| Proceeds from issuance of common stock | 350,000 | 350 | 9,012,150 | - | 9,012,500 | |||||||||||||||
| Capital contribution from Manager | - | - | 1,043,000 | - | 1,043,000 | |||||||||||||||
| Stock dividend distribution | 35,196 | 35 | 858,960 | - | 858,995 | |||||||||||||||
| Offering costs | - | - | (92,240 | ) | - | (92,240 | ) | |||||||||||||
| Balance at November 30, 2023 | 13,114,977 | $ | 13,115 | $ | 356,698,595 | $ | 2,847,039 | $ | 359,558,749 | |||||||||||
| Increase (Decrease) from Operations: | ||||||||||||||||||||
| Net investment income | - | - | - | 12,784,511 | 12,784,511 | |||||||||||||||
| Net realized gain (loss) from investments | - | - | - | 2,328 | 2,328 | |||||||||||||||
| Net change in unrealized appreciation (depreciation) on investments | - | - | - | (7,164,613 | ) | (7,164,613 | ) | |||||||||||||
| Net change in provision for deferred taxes on unrealized (appreciation) depreciation on investments | - | - | - | (315,473 | ) | (315,473 | ) | |||||||||||||
| Decrease from Shareholder Distributions: | ||||||||||||||||||||
| Distributions of investment income – net | - | - | - | (9,803,576 | ) | (9,803,576 | ) | |||||||||||||
| Capital Share Transactions: | ||||||||||||||||||||
| Proceeds from issuance of common stock | 501,105 | 501 | 13,028,269 | - | 13,028,770 | |||||||||||||||
| Capital contribution from Manager | - | - | 1,382,009 | - | 1,382,009 | |||||||||||||||
| Stock dividend distribution | 37,394 | 38 | 915,155 | - | 915,193 | |||||||||||||||
| Offering costs | - | - | (163,789 | ) | - | (163,789 | ) | |||||||||||||
| Tax reclassification of stockholders’ equity in accordance with generally accepted accounting principles | - | - | (779 | ) | 779 | - | ||||||||||||||
| Balance at February 29, 2024 | 13,653,476 | $ | 13,654 | $ | 371,081,199 | $ | (870,745 | ) | $ | 370,224,108 | ||||||||||
Note 12. Earnings Per Share
In accordance with the provisions of FASB ASC Topic 260, “Earnings per Share” (“ASC 260”), basic earnings per share is computed by dividing earnings available to common shareholders by the weighted average number of shares outstanding during the period. Other potentially dilutive common shares, and the related impact to earnings, are considered when calculating earnings per share on a diluted basis.
The following information sets forth the computation of the weighted average basic and diluted net increase in net assets resulting from operations per share for the years ended February 28, 2022,29, 2024, February 28, 20212023 and February 29, 202028, 2022 (dollars in thousands except share and per share amounts):
| Basic and Diluted | February 28, 2022 | February 28, 2021 | February 29, 2020 | February 29, 2024 | February 28, 2023 | February 28, 2022 | ||||||||||||||||||
| Net increase in net assets resulting from operations | $ | 45,735 | $ | 14,777 | $ | 55,739 | $ | 8,934 | $ | 24,676 | $ | 45,735 | ||||||||||||
| Weighted average common shares outstanding | 11,456,631 | 11,188,629 | 9,319,192 | 12,670,939 | 11,963,533 | 11,456,631 | ||||||||||||||||||
| Weighted average earnings per common share | $ | 3.99 | $ | 1.32 | $ | 5.98 | $ | 0.71 | $ | 2.06 | $ | 3.99 | ||||||||||||
Note 13. Dividend
On February 24, 2022,We have distributed or intend to distribute sufficient dividends to eliminate our U.S. federal taxable income for our completed tax years. If we fail to satisfy the Company declared90% distribution requirement or otherwise fail to qualify as a dividendRIC in any tax year, we would be subject to U.S. federal income tax in that year on all of $0.53 per share payable on March 28, 2022,our taxable income, regardless of whether we made any distributions to common stockholders of record on March 14, 2022.our shareholders. Shareholders have the option to receive payment of the dividend in cash, or receive shares of common stock, pursuantstock. Our distributions for the tax years ended February 29, 2024 to the Company’s DRIP. Based on shareholder elections, the dividend consisted of approximately $5.3 million in cash and 42,825 newly issued shares of common stock, or 0.4% of our outstanding common stock prior to the dividend payment. The number of shares of common stock comprising the stock portion was calculated based on a price of $25.89 per share, which equaled 95% of the volume weighted average trading price per share of the common stock on March 15, 16, 17, 18, 21, 22, 23, 24, 25 and 28, 2022.inception were as follows:
| Payment date | Cash Dividend | |||
| Tax Year Ended February 28, 2025 | ||||
| March 28, 2024 | $ | 0.73 | (45) | |
| $ | 0.73 | |||
| Tax Year Ended February 29, 2024 | ||||
| December 28, 2023 | $ | 0.72 | (44) | |
| September 28, 2023 | 0.71 | (43) | ||
| June 29, 2023 | 0.70 | (42) | ||
| March 30, 2023 | 0.69 | (1) | ||
| $ | 2.82 | |||
| Tax Year Ended February 28, 2023 | ||||
| January 4, 2023 | $ | 0.68 | (2) | |
| September 29, 2022 | 0.54 | (3) | ||
| June 29, 2022 | 0.53 | (4) | ||
| March 28, 2022 | 0.53 | (5) | ||
| $ | 2.28 | |||
| Tax Year Ended February 28, 2022 | ||||
| January 19, 2022 | $ | 0.53 | (6) | |
| September 28, 2021 | 0.52 | (7) | ||
| June 29, 2021 | 0.44 | (8) | ||
| April 22, 2021 | 0.43 | (9) | ||
| $ | 1.92 | |||
| Tax Year Ended February 28, 2021 | ||||
| February 10, 2021 | $ | 0.42 | (10) | |
| November 10, 2020 | 0.41 | (11) | ||
| August 12, 2020 | 0.40 | (12) | ||
| $ | 1.03 | |||
| Tax Year Ended February 29, 2020 | ||||
| February 6, 2020 | $ | 0.56 | (13) | |
| September 26, 2019 | 0.56 | (14) | ||
| June 27, 2019 | 0.55 | (15) | ||
| March 28, 2019 | 0.54 | (16) | ||
| $ | 2.21 | |||
| Tax Year Ended February 28, 2019 | ||||
| January 2, 2019 | $ | 0.53 | (17) | |
| September 27, 2018 | 0.52 | (18) | ||
| June 27, 2018 | 0.51 | (19) | ||
| March 26, 2018 | 0.50 | (20) | ||
| $ | 2.06 | |||
| Tax Year Ended February 28, 2018 | ||||
| December 27, 2017 | $ | 0.49 | (21) | |
| September 26, 2017 | 0.48 | (22) | ||
| June 27, 2017 | 0.47 | (23) | ||
| March 28, 2017 | 0.46 | (24) | ||
| $ | 1.90 | |||
On November 30, 2021, the Company declared a dividend of $0.53 per share payable on January 19, 2022, to common stockholders of record on January 4, 2021. Shareholders have the option to receive payment of the dividend in cash, or receive shares of common stock, pursuant to the Company’s DRIP. Based on shareholder elections, the dividend consisted of approximately $5.3 million in cash and 41,520 newly issued shares of common stock, or 0.3% of our outstanding common stock prior to the dividend payment. The number of shares of common stock comprising the stock portion was calculated based on a price of $26.85 per share, which equaled 95% of the volume weighted average trading price per share of the common stock on January 5, 6, 7, 10, 11, 12, 13, 14, 18 and 19, 2022.
| Payment date | Cash Dividend | |||
| Tax Year Ended February 28, 2017 | ||||
| February 9, 2017 | $ | 0.45 | (25) | |
| November 9, 2016 | 0.44 | (26) | ||
| September 5, 2016 | 0.20 | (27) | ||
| August 9, 2016 | 0.43 | (28) | ||
| April 27, 2016 | 0.41 | (29) | ||
| $ | 1.93 | |||
| Tax Year Ended February 29, 2016 | ||||
| February 29, 2016 | $ | 0.40 | (30) | |
| November 30, 2015 | 0.36 | (31) | ||
| August 31, 2015 | 0.33 | (32) | ||
| June 5, 2015 | 1.00 | (33) | ||
| May 29. 2015 | 0.27 | (34) | ||
| $ | 2.36 | |||
| Tax Year Ended February 28, 2015 | ||||
| February 27, 2015 | $ | 0.22 | (35) | |
| November 28, 2014 | 0.18 | (36) | ||
| $ | 0.40 | |||
| Tax Year Ended February 28. 2014 | ||||
| December 27, 2013 | $ | 2.65 | (37) | |
| $ | 2.65 | |||
| Tax Year Ended February 28, 2013 | ||||
| December 31, 2012 | $ | 4.25 | (38) | |
| $ | 4.25 | |||
| Tax Year Ended February 29, 2012 | ||||
| December 30, 2011 | $ | 3.00 | (39) | |
| $ | 3.00 | |||
| Tax Year Ended February 28, 2011 | ||||
| December 29, 2010 | $ | 4.40 | (40) | |
| $ | 4.40 | |||
| Tax Year Ended February 28, 2010 | ||||
| December 31, 2009 | $ | 18.25 | (41) | |
| $ | 18.25 | |||
| (1) | Based on shareholder elections, the dividend consisted of approximately $7.1 million in cash and 45,818 newly issued shares of common stock, or 0.4% of our outstanding common stock prior to the dividend payment. The number of shares of common stock comprising the stock portion was calculated based on a price of $23.11 per share, which equaled 95% of the volume weighted average trading price per share of the common stock on March 17, 20, 21, 22, 23, 24, 27, 28, 29, and 30, 2023. |
| (2) | Based on shareholder elections, the dividend consisted of approximately $6.8 million in cash and 53,615 newly issued shares of common stock, or 0.5% of our outstanding common stock prior to the dividend payment. The number of shares of common stock comprising the stock portion was calculated based on a price of $24.26 per share, which equaled 95% of the volume weighted average trading price per share of the common stock on December 20, 21, 22, 23, 27, 28, 29 and 30 2022 and January 3 and 4, 2023. |
| (3) | Based on shareholder elections, the dividend consisted of approximately $5.3 million in cash and 52,312 newly issued shares of common stock, or 0.4% of our outstanding common stock prior to the dividend payment. The number of shares of common stock comprising the stock portion was calculated based on a price of $22.00 per share, which equaled 95% of the volume weighted average trading price per share of the common stock on September 16, 19, 20, 21, 22, 23, 26, 27, 28 and 29, 2022. |
| (4) | Based on shareholder elections, the dividend consisted of approximately $5.1 million in cash and 48,590 newly issued shares of common stock, or 0.4% of our outstanding common stock prior to the dividend payment. The number of shares of common stock comprising the stock portion was calculated based on a price of $22.40 per share, which equaled 95% of the volume weighted average trading price per share of the common stock on June 15, 16, 17, 21, 22, 23, 24, 27, 28 and 29, 2022. |
| (5) | Based on shareholder elections, the dividend consisted of approximately $5.3 million in cash and 42,825 newly issued shares of common stock, or 0.4% of our outstanding common stock prior to the dividend payment. The number of shares of common stock comprising the stock portion was calculated based on a price of $25.89 per share, which equaled 95% of the volume weighted average trading price per share of the common stock on March 15, 16, 17, 18, 21, 22, 23, 24, 25 and 28, 2022. |
On August 26, 2021, the Company declared a dividend of $0.52 per share payable on September 28, 2021, to common stockholders of record on September 14, 2021. Shareholders have the option to receive payment of the dividend in cash, or receive shares of common stock, pursuant to the Company’s DRIP. Based on shareholder elections, the dividend consisted of approximately $4.9 million in cash and 38,016 newly issued shares of common stock, or 0.3% of our outstanding common stock prior to the dividend payment. The number of shares of common stock comprising the stock portion was calculated based on a price of $26.77 per share, which equaled 95% of the volume weighted average trading price per share of the common stock on September 15, 16, 17, 20, 21, 22, 23, 24, 27 and 28, 2021.
On May 27, 2021, the Company declared a dividend of $0.44 per share payable on June 29, 2021, to common stockholders of record on June 15, 2021. Shareholders have the option to receive payment of the dividend in cash, or receive shares of common stock, pursuant to the Company’s DRIP. Based on shareholder elections, the dividend consisted of approximately $4.1 million in cash and 33,100 newly issued shares of common stock, or 0.3% of our outstanding common stock prior to the dividend payment. The number of shares of common stock comprising the stock portion was calculated based on a price of $25.03 per share, which equaled 95% of the volume weighted average trading price per share of the common stock on June 16, 17, 18, 21, 22, 23, 24, 25, 28 and 29, 2021.
On March 22, 2021, the Company declared a dividend of $0.43 per share payable on April 22, 2021, to common stockholders of record on April 8, 2021. Shareholders have the option to receive payment of the dividend in cash, or receive shares of common stock, pursuant to the Company’s DRIP. Based on shareholder elections, the dividend consisted of approximately $3.9 million in cash and 38,580 newly issued shares of common stock, or 0.3% of our outstanding common stock prior to the dividend payment. The number of shares of common stock comprising the stock portion was calculated based on a price of $23.69 per share, which equaled 95% of the volume weighted average trading price per share of the common stock on April 9,12, 13, 14, 15, 16, 19, 20, 21 and 22, 2021.
On January 5, 2021, our board of directors declared a dividend of $0.42 per share, which was paid on February 10, 2021, to common stockholders of record as of January 26, 2021. Shareholders had the option to receive payment of the dividend in cash, or receive shares of common stock, pursuant to the DRIP. Based on shareholder elections, the dividend consisted of approximately $3.8 million in cash and 41,388 newly issued shares of common stock, or 0.4% of our outstanding common stock prior to the dividend payment. The number of shares of common stock comprising the stock portion was calculated based on a price of $21.75 per share, which equaled 95% of the volume weighted average trading price per share of the common stock on January 28, 29 and February 1, 2, 3, 4, 5, 8, 9 and 10, 2021.
| (6) | Based on shareholder elections, the dividend consisted of approximately $5.3 million in cash and 41,520 newly issued shares of common stock, or 0.3% of our outstanding common stock prior to the dividend payment. The number of shares of common stock comprising the stock portion was calculated based on a price of $26.85 per share, which equaled 95% of the volume weighted average trading price per share of the common stock on January 5, 6, 7, 10, 11, 12, 13, 14, 18 and 19, 2022. |
| (7) | Based on shareholder elections, the dividend consisted of approximately $4.9 million in cash and 38,016 newly issued shares of common stock, or 0.3% of our outstanding common stock prior to the dividend payment. The number of shares of common stock comprising the stock portion was calculated based on a price of $26.77 per share, which equaled 95% of the volume weighted average trading price per share of the common stock on September 15, 16, 17, 20, 21, 22, 23, 24, 27 and 28, 2021. |
| (8) | Based on shareholder elections, the dividend consisted of approximately $4.1 million in cash and 33,100 newly issued shares of common stock, or 0.3% of our outstanding common stock prior to the dividend payment. The number of shares of common stock comprising the stock portion was calculated based on a price of $25.03 per share, which equaled 95% of the volume weighted average trading price per share of the common stock on June 16, 17, 18, 21, 22, 23, 24, 25, 28 and 29, 2021. |
| (9) | Based on shareholder elections, the dividend consisted of approximately $3.9 million in cash and 38,580 newly issued shares of common stock, or 0.3% of our outstanding common stock prior to the dividend payment. The number of shares of common stock comprising the stock portion was calculated based on a price of $23.69 per share, which equaled 95% of the volume weighted average trading price per share of the common stock on April 9,12, 13, 14, 15, 16, 19, 20, 21 and 22, 2021. |
| (10) | Based on shareholder elections, the dividend consisted of approximately $3.8 million in cash and 41,388 newly issued shares of common stock, or 0.4% of our outstanding common stock prior to the dividend payment. The number of shares of common stock comprising the stock portion was calculated based on a price of $21.75 per share, which equaled 95% of the volume weighted average trading price per share of the common stock on January 28, 29 and February 1, 2, 3, 4, 5, 8, 9 and 10, 2021. |
| (11) | Based on shareholder elections, the dividend consisted of approximately $3.8 million in cash and 45,706 newly issued shares of common stock, or 0.4% of our outstanding common stock prior to the dividend payment. The number of shares of common stock comprising the stock portion was calculated based on a price of $17.63 per share, which equaled 95% of the volume weighted average trading price per share of the common stock on October 28, 29, 30 and November 2, 3, 4, 5, 6, 9 and 10, 2020. |
| (12) | Based on shareholder elections, the dividend consisted of approximately $3.7 million in cash and 47,098 newly issued shares of common stock, or 0.4% of our outstanding common stock prior to the dividend payment. The number of shares of common stock comprising the stock portion was calculated based on a price of $16.45 per share, which equaled 95.0% of the volume weighted average trading price per share of the common stock on July 30, 31 and August 3, 4, 5, 6, 7, 10, 11 and 12, 2020. |
On October 7, 2020, our board of directors declared a dividend of $0.41 per share, which was paid on November 10, 2020, to common stockholders of record as of October 26, 2020. Shareholders had the option to receive payment of the dividend in cash, or receive shares of common stock, pursuant to the DRIP. Based on shareholder elections, the dividend consisted of approximately $3.8 million in cash and 45,706 newly issued shares of common stock, or 0.4% of our outstanding common stock prior to the dividend payment. The number of shares of common stock comprising the stock portion was calculated based on a price of $17.63 per share, which equaled 95% of the volume weighted average trading price per share of the common stock on October 28, 29, 30 and November 2, 3, 4, 5, 6, 9, and 10, 2020.
On July 7, 2020, our board of directors declared a dividend of $0.40 per share, which was paid on August 12, 2020, to common stockholders of record as of July 27, 2020. Shareholders had the option to receive payment of the dividend in cash, or receive shares of common stock, pursuant to the DRIP. Based on shareholder elections, the dividend consisted of approximately $3.7 million in cash and 47,098 newly issued shares of common stock, or 0.4% of our outstanding common stock prior to the dividend payment. The number of shares of common stock comprising the stock portion was calculated based on a price of $16.45 per share, which equaled 95% of the volume weighted average trading price per share of the common stock on July 30, 31 and August 3, 4, 5, 6, 7, 10, 11 and 12, 2020.
During the three months ended May 31, 2020, there were no dividends declared.
On January 7, 2020, the Company declared a dividend of $0.56 per share, which was paid on February 6, 2020, to common stockholders of record on January 24, 2020. Shareholders had the option to receive payment of the dividend in cash, or receive shares of common stock, pursuant to the Company’s DRIP. Based on shareholder elections, the dividend consisted of approximately $5.4 million in cash and 35,682 newly issued shares of common stock, or 0.3% of our outstanding common stock prior to the dividend payment. The number of shares of common stock comprising the stock portion was calculated based on a price of $25.44 per share, which equaled 95.0% of the volume weighted average trading price per share of the common stock on January 24, 27, 28, 29, 30, 31 and February 3, 4, 5 and 6, 2020.
On August 27, 2019, the Company declared a dividend of $0.56 per share, which was paid on September 26, 2019, to common stockholders of record on September 13, 2019. Shareholders had the option to receive payment of the dividend in cash, or receive shares of common stock, pursuant to the Company’s DRIP. Based on shareholder elections, the dividend consisted of approximately $4.5 million in cash and 34,575 newly issued shares of common stock, or 0.4% of our outstanding common stock prior to the dividend payment. The number of shares of common stock comprising the stock portion was calculated based on a price of $23.34 per share, which equaled 95.0% of the volume weighted average trading price per share of the common stock on September 13, 16, 17, 18, 19, 20, 23, 24, 25 and 26, 2019.
On May 28, 2019, the Company declared a dividend of $0.55 per share, which was paid on June 27, 2019, to common stockholders of record on June 13, 2019. Shareholders had the option to receive payment of the dividend in cash, or receive shares of common stock, pursuant to the Company’s DRIP. Based on shareholder elections, the dividend consisted of approximately $3.6 million in cash and 31,545 newly issued shares of common stock, or 0.4% of our outstanding common stock prior to the dividend payment. The number of shares of common stock comprising the stock portion was calculated based on a price of $22.65 per share, which equaled 95.0% of the volume weighted average trading price per share of the common stock on June 14, 17, 18, 19, 20, 21, 24, 25, 26 and 27, 2019.
| (13) | Based on shareholder elections, the dividend consisted of approximately $5.4 million in cash and 35,682 newly issued shares of common stock, or 0.3% of our outstanding common stock prior to the dividend payment. The number of shares of common stock comprising the stock portion was calculated based on a price of $25.44 per share, which equaled 95.0% of the volume weighted average trading price per share of the common stock on January 24, 27, 28, 29, 30, 31 and February 3, 4, 5 and 6, 2020. |
| (14) | Based on shareholder elections, the dividend consisted of approximately $4.5 million in cash and 34,575 newly issued shares of common stock, or 0.4% of our outstanding common stock prior to the dividend payment. The number of shares of common stock comprising the stock portion was calculated based on a price of $23.34 per share, which equaled 95.0% of the volume weighted average trading price per share of the common stock on September 13, 16, 17, 18, 19, 20, 23, 24, 25 and 26, 2019. |
| (15) | Based on shareholder elections, the dividend consisted of approximately $3.6 million in cash and 31,545 newly issued shares of common stock, or 0.4% of our outstanding common stock prior to the dividend payment. The number of shares of common stock comprising the stock portion was calculated based on a price of $22.65 per share, which equaled 95.0% of the volume weighted average trading price per share of the common stock on June 14, 17, 18, 19, 20, 21, 24, 25, 26 and 27, 2019. |
On February 26, 2019, our board of directors declared a dividend of $0.54 per share, which was paid on March 28, 2019, to common stockholders of record as of March 14, 2019. Shareholders had the option to receive payment of the dividend in cash, or receive shares of common stock, pursuant to our DRIP. Based on shareholder elections, the dividend consisted of approximately $3.5 million in cash and 31,240 newly issued shares of common stock, or 0.4% of our outstanding common stock prior to the dividend payment. The number of shares of common stock comprising the stock portion was calculated based on a price of $21.36 per share, which equaled 95.0% of the volume weighted average trading price per share of the common stock on March 15, 18, 19, 20, 21, 22, 25, 26, 27 and 28, 2019.
On November 27, 2018, the Company declared a dividend of $0.53 per share, which was paid on January 2, 2019, to common stockholders of record on December 17, 2018. Shareholders had the option to receive payment of the dividend in cash, or receive shares of common stock, pursuant to the Company’s DRIP. Based on shareholder elections, the dividend consisted of approximately $3.4 million in cash and 30,797 newly issued shares of common stock, or 0.4% of our outstanding common stock prior to the dividend payment. The number of shares of common stock comprising the stock portion was calculated based on a price of $18.88 per share, which equaled 95.0% of the volume weighted average trading price per share of the common stock on December 18, 19, 20, 21, 24, 26, 27, 28, 31, 2018 and January 2, 2019.
On August 28, 2018, the Company declared a dividend of $0.52 per share, which was paid on September 27, 2018, to common stockholders of record as of September 17, 2018. Shareholders had the option to receive payment of the dividend in cash, or receive shares of common stock, pursuant to our DRIP. Based on shareholder elections, the dividend consisted of approximately $3.3 million in cash and 25,863 newly issued shares of common stock, or 0.3% of our outstanding common stock prior to the dividend payment. The number of shares of common stock comprising the stock portion was calculated based on a price of $22.35 per share, which equaled 95.0% of the volume weighted average trading price per share of the common stock on September 14, 17, 18, 19, 20, 21, 24, 25, 26 and 27, 2018.
On May 30, 2018, the Company declared a dividend of $0.51 per share, which was paid on June 27, 2018, to common stockholders of record as of June 15, 2018. Shareholders had the option to receive payment of the dividend in cash, or receive shares of common stock, pursuant to our DRIP. Based on shareholder elections, the dividend consisted of approximately $2.7 million in cash and 21,563 newly issued shares of common stock, or 0.3% of our outstanding common stock prior to the dividend payment. The number of shares of common stock comprising the stock portion was calculated based on a price of $23.72 per share, which equaled 95.0% of the volume weighted average trading price per share of the common stock on June 14, 15, 18, 19, 20, 21, 22, 25, 26 and 27, 2018.
On February 26, 2018, the Company declared a dividend of $0.50 per share, which was paid on March 26, 2018, to common stockholders of record as of March 14, 2018. Shareholders had the option to receive payment of the dividend in cash, or receive shares of common stock, pursuant to our DRIP. Based on shareholder elections, the dividend consisted of approximately $2.6 million in cash and 25,355 newly issued shares of common stock, or 0.4% of our outstanding common stock prior to the dividend payment. The number of shares of common stock comprising the stock portion was calculated based on a price of $19.91 per share, which equaled 95.0% of the volume weighted average trading price per share of the common stock on March 13, 14, 15, 16, 19, 20, 21, 22, 23 and 26, 2018.
On November 29, 2017, the Company declared a dividend of $0.49 per share, which was paid on December 27, 2017, to common stockholders of record on December 15, 2017. Shareholders had the option to receive payment of the dividend in cash, or receive shares of common stock, pursuant the Company’s DRIP. Based on shareholder elections, the dividend consisted of approximately $2.5 million in cash and 25,435 newly issued shares of common stock, or 0.4% of our outstanding common stock prior to the dividend payment. The number of shares of common stock comprising the stock portion was calculated based on a price of $21.14 per share, which equaled 95.0% of the volume weighted average trading price per share of the common stock on December 13, 14, 15, 18, 19, 20, 21, 22, 26 and 27, 2017.
On August 28, 2017, the Company declared a dividend of $0.48 per share, which was paid on September 26, 2017, to common stockholders of record as of September 15, 2017. Shareholders had the option to receive payment of the dividend in cash, or receive shares of common stock, pursuant to our DRIP. Based on shareholder elections, the dividend consisted of approximately $2.2 million in cash and 33,551 newly issued shares of common stock, or 0.6% of our outstanding common stock prior to the dividend payment. The number of shares of common stock comprising the stock portion was calculated based on a price of $20.19 per share, which equaled 95.0% of the volume weighted average trading price per share of the common stock on September 13, 14, 15, 18, 19, 20, 21, 22, 25 and 26, 2017.
On May 30, 2017, the Company declared a dividend of $0.47 per share, which was paid on June 27, 2017, to common stockholders of record as of June 15, 2017. Shareholders had the option to receive payment of the dividend in cash, or receive shares of common stock, pursuant to our DRIP. Based on shareholder elections, the dividend consisted of approximately $2.3 million in cash and 26,222 newly issued shares of common stock, or 0.4% of our outstanding common stock prior to the dividend payment. The number of shares of common stock comprising the stock portion was calculated based on a price of $20.04 per share, which equaled 95.0% of the volume weighted average trading price per share of the common stock on June 14, 15, 16, 19, 20, 21, 22, 23, 26 and 27, 2017.
| (16) | Based on shareholder elections, the dividend consisted of approximately $3.5 million in cash and 31,240 newly issued shares of common stock, or 0.4% of our outstanding common stock prior to the dividend payment. The number of shares of common stock comprising the stock portion was calculated based on a price of $21.36 per share, which equaled 95.0% of the volume weighted average trading price per share of the common stock on March 15, 18, 19, 20, 21, 22, 25, 26, 27 and 28, 2019. |
| (17) | Based on shareholder elections, the dividend consisted of approximately $3.4 million in cash and 30,796 newly issued shares of common stock, or 0.4% of our outstanding common stock prior to the dividend payment. The number of shares of common stock comprising the stock portion was calculated based on a price of $18.88 per share, which equaled 95.0% of the volume weighted average trading price per share of the common stock on December 18, 19, 20, 21, 24, 26, 27, 28, 31, 2018 and January 2, 2019. |
| (18) | Based on shareholder elections, the dividend consisted of approximately $3.3 million in cash and 25,862 newly issued shares of common stock, or 0.3% of our outstanding common stock prior to the dividend payment. The number of shares of common stock comprising the stock portion was calculated based on a price of $22.35 per share, which equaled 95.0% of the volume weighted average trading price per share of the common stock on September 14, 17, 18, 19, 20, 21, 24, 25, 26 and 27, 2018. |
| (19) | Based on shareholder elections, the dividend consisted of approximately $2.7 million in cash and 21,562 newly issued shares of common stock, or 0.3% of our outstanding common stock prior to the dividend payment. The number of shares of common stock comprising the stock portion was calculated based on a price of $23.72 per share, which equaled 95.0% of the volume weighted average trading price per share of the common stock on June 14, 15, 18, 19, 20, 21, 22, 25, 26 and 27, 2018. |
| (20) | Based on shareholder elections, the dividend consisted of approximately $2.6 million in cash and 25,354 newly issued shares of common stock, or 0.4% of our outstanding common stock prior to the dividend payment. The number of shares of common stock comprising the stock portion was calculated based on a price of $19.91 per share, which equaled 95.0% of the volume weighted average trading price per share of the common stock on March 13, 14, 15, 16, 19, 20, 21, 22, 23 and 26, 2018. |
| (21) | Based on shareholder elections, the dividend consisted of approximately $2.5 million in cash and 25,435 newly issued shares of common stock, or 0.4% of our outstanding common stock prior to the dividend payment. The number of shares of common stock comprising the stock portion was calculated based on a price of $21.14 per share, which equaled 95.0% of the volume weighted average trading price per share of the common stock on December 13, 14, 15, 18, 19, 20, 21, 22, 26 and 27, 2017. |
| (22) | Based on shareholder elections, the dividend consisted of approximately $2.2 million in cash and 33,551 newly issued shares of common stock, or 0.6% of our outstanding common stock prior to the dividend payment. The number of shares of common stock comprising the stock portion was calculated based on a price of $20.19 per share, which equaled 95.0% of the volume weighted average trading price per share of the common stock on September 13, 14, 15, 18, 19, 20, 21, 22, 25 and 26, 2017. |
| (23) | Based on shareholder elections, the dividend consisted of approximately $2.3 million in cash and 26,222 newly issued shares of common stock, or 0.4% of our outstanding common stock prior to the dividend payment. The number of shares of common stock comprising the stock portion was calculated based on a price of $20.04 per share, which equaled 95.0% of the volume weighted average trading price per share of the common stock on June 14, 15, 16, 19, 20, 21, 22, 23, 26 and 27, 2017. |
On February 28, 2017, the Company declared a dividend of $0.46 per share, which was paid on March 28, 2017, to common stockholders of record as of March 15, 2017. Shareholders had the option to receive payment of the dividend in cash, or receive shares of common stock, pursuant to our DRIP. Based on shareholder elections, the dividend consisted of approximately $2.0 million in cash and 29,096 newly issued shares of common stock, or 0.5% of our outstanding common stock prior to the dividend payment. The number of shares of common stock comprising the stock portion was calculated based on a price of $21.38 per share, which equaled 95.0% of the volume weighted average trading price per share of the common stock on March 15, 16, 17, 20, 21, 22, 23, 24, 27 and 28, 2017.
On January 12, 2017, the Company declared a dividend of $0.45 per share, which was paid on February 9, 2017, to common stockholders of record as of January 31, 2017. Shareholders had the option to receive payment of the dividend in cash, or receive shares of common stock, pursuant to our DRIP. Based on shareholder elections, the dividend consisted of approximately $1.6 million in cash and 50,453 newly issued shares of common stock, or 0.9% of our outstanding common stock prior to the dividend payment. The number of shares of common stock comprising the stock portion was calculated based on a price of $20.25 per share, which equaled 95.0% of the volume weighted average trading price per share of the common stock on January 27, 30, 31 and February 1, 2, 3, 6, 7, 8 and 9, 2017.
On October 5, 2016, the Company declared a dividend of $0.44 per share, which was paid on November 9, 2016, to common stockholders of record as of October 31, 2016. Shareholders had the option to receive payment of the dividend in cash, or receive shares of common stock, pursuant to our DRIP. Based on shareholder elections, the dividend consisted of approximately $1.5 million in cash and 58,548 newly issued shares of common stock, or 1.0% of our outstanding common stock prior to the dividend payment. The number of shares of common stock comprising the stock portion was calculated based on a price of $17.12 per share, which equaled 95.0% of the volume weighted average trading price per share of the common stock on October 27, 28, 31 and November 1, 2, 3, 4, 7, 8 and 9, 2016.
On August 8, 2016, the Company declared a special dividend of $0.20 per share, which was paid on September 5, 2016, to common stockholders of record as of August 24, 2016. Shareholders had the option to receive payment of the dividend in cash, or receive shares of common stock, pursuant to our DRIP. Based on shareholder elections, the dividend consisted of approximately $0.7 million in cash and 24,786 newly issued shares of common stock, or 0.4% of our outstanding common stock prior to the dividend payment. The number of shares of common stock comprising the stock portion was calculated based on a price of $17.06 per share, which equaled 95.0% of the volume weighted average trading price per share of the common stock on August 22, 23, 24, 25, 26, 29, 30, 31 and September 1 and 2, 2016.
On July 7, 2016, the Company declared a dividend of $0.43 per share, which was paid on August 9, 2016, to common stockholders of record as of July 29, 2016. Shareholders had the option to receive payment of the dividend in cash, or receive shares of common stock, pursuant to our DRIP. Based on shareholder elections, the dividend consisted of approximately $1.5 million in cash and 58,167 newly issued shares of common stock, or 1.0% of our outstanding common stock prior to the dividend payment. The number of shares of common stock comprising the stock portion was calculated based on a price of $16.32 per share, which equaled 95.0% of the volume weighted average trading price per share of the common stock on July 27, 28, 29 and August 1, 2, 3, 4, 5, 8 and 9, 2016.
On March 31, 2016, the Company declared a dividend of $0.41 per share, which was paid on April 27, 2016, to common stockholders of record as of April 15, 2016. Shareholders had the option to receive payment of the dividend in cash, or receive shares of common stock, pursuant to our DRIP. Based on shareholder elections, the dividend consisted of approximately $1.5 million in cash and 56,728 newly issued shares of common stock, or 1.0% of our outstanding common stock prior to the dividend payment. The number of shares of common stock comprising the stock portion was calculated based on a price of $15.43 per share, which equaled 95.0% of the volume weighted average trading price per share of the common stock on April 14, 15, 18, 19, 20, 21, 22, 25, 26 and 27, 2016.
| (24) | Based on shareholder elections, the dividend consisted of approximately $2.0 million in cash and 29,096 newly issued shares of common stock, or 0.5% of our outstanding common stock prior to the dividend payment. The number of shares of common stock comprising the stock portion was calculated based on a price of $21.38 per share, which equaled 95.0% of the volume weighted average trading price per share of the common stock on March 15, 16, 17, 20, 21, 22, 23, 24, 27 and 28, 2017. |
| (25) | Based on shareholder elections, the dividend consisted of approximately $1.6 million in cash and 50,453 newly issued shares of common stock, or 0.9% of our outstanding common stock prior to the dividend payment. The number of shares of common stock comprising the stock portion was calculated based on a price of $20.25 per share, which equaled 95.0% of the volume weighted average trading price per share of the common stock on January 27, 30, 31 and February 1, 2, 3, 6, 7, 8 and 9, 2017. |
| (26) | Based on shareholder elections, the dividend consisted of approximately $1.5 million in cash and 58,548 newly issued shares of common stock, or 1.0% of our outstanding common stock prior to the dividend payment. The number of shares of common stock comprising the stock portion was calculated based on a price of $17.12 per share, which equaled 95.0% of the volume weighted average trading price per share of the common stock on October 27, 28, 31 and November 1, 2, 3, 4, 7, 8 and 9, 2016. |
| (27) | Based on shareholder elections, the dividend consisted of approximately $0.7 million in cash and 24,786 newly issued shares of common stock, or 0.4% of our outstanding common stock prior to the dividend payment. The number of shares of common stock comprising the stock portion was calculated based on a price of $17.06 per share, which equaled 95.0% of the volume weighted average trading price per share of the common stock on August 22, 23, 24, 25, 26, 29, 30, 31 and September 1 and 2, 2016. |
| (28) | Based on shareholder elections, the dividend consisted of approximately $1.5 million in cash and 58,167 newly issued shares of common stock, or 1.0% of our outstanding common stock prior to the dividend payment. The number of shares of common stock comprising the stock portion was calculated based on a price of $16.32 per share, which equaled 95.0% of the volume weighted average trading price per share of the common stock on July 27, 28, 29 and August 1, 2, 3, 4, 5, 8 and 9, 2016. |
| (29) | Based on shareholder elections, the dividend consisted of approximately $1.5 million in cash and 56,728 newly issued shares of common stock, or 1.0% of our outstanding common stock prior to the dividend payment. The number of shares of common stock comprising the stock portion was calculated based on a price of $15.43 per share, which equaled 95.0% of the volume weighted average trading price per share of the common stock on April 14, 15, 18, 19, 20, 21, 22, 25, 26 and 27, 2016. |
| (30) | Based on shareholder elections, the dividend consisted of approximately $1.4 million in cash and 66,765 newly issued shares of common stock, or 1.2% of our outstanding common stock prior to the dividend payment. The number of shares of common stock comprising the stock portion was calculated based on a price of $13.11 per share, which equaled 95.0% of the volume weighted average trading price per share of the common stock on February 16, 17, 18, 19, 22, 23, 24, 25, 26 and 29, 2016. |
| (31) | Based on shareholder elections, the dividend consisted of approximately $1.1 million in cash and 61,029 newly issued shares of common stock, or 1.1% of our outstanding common stock prior to the dividend payment. The number of shares of common stock comprising the stock portion was calculated based on a price of $14.53 per share, which equaled 95.0% of the volume weighted average trading price per share of the common stock on November 16, 17, 18, 19, 20, 23, 24, 25, 27 and 30, 2015. |
| (32) | Based on shareholder elections, the dividend consisted of approximately $1.1 million in cash and 47,861 newly issued shares of common stock, or 0.9% of our outstanding common stock prior to the dividend payment. The number of shares of common stock comprising the stock portion was calculated based on a price of $15.28 per share, which equaled 95.0% of the volume weighted average trading price per share of the common stock on August 18, 19, 20, 21, 24, 25, 26, 27, 28 and 31, 2015. |
| (33) | Based on shareholder elections, the dividend consisted of approximately $3.4 million in cash and 126,230 newly issued shares of common stock, or 2.3% of our outstanding common stock prior to the dividend payment. The number of shares of common stock comprising the stock portion was calculated based on a price of $16.47 per share, which equaled 95.0% of the volume weighted average trading price per share of the common stock on May 22, 26, 27, 28, 29 and June 1, 2, 3, 4, and 5, 2015. |
| (34) | Based on shareholder elections, the dividend consisted of approximately $0.9 million in cash and 33,766 newly issued shares of common stock, or 0.6% of our outstanding common stock prior to the dividend payment. The number of shares of common stock comprising the stock portion was calculated based on a price of $16.78 per share, which equaled 95.0% of the volume weighted average trading price per share of the common stock on May 15, 18, 19, 20, 21, 22, 26, 27, 28 and 29, 2015. |
| (35) | Based on shareholder elections, the dividend consisted of approximately $0.8 million in cash and 26,858 newly issued shares of common stock, or 0.5% of our outstanding common stock prior to the dividend payment. The number of shares of common stock comprising the stock portion was calculated based on a price of $14.97 per share, which equaled 95.0% of the volume weighted average trading price per share of the common stock on February 13, 17, 18, 19, 20, 23, 24, 25, 26 and 27, 2015. |
| (36) | Based on shareholder elections, the dividend consisted of approximately $0.6 million in cash and 22,283 newly issued shares of common stock, or 0.4% of our outstanding common stock prior to the dividend payment. The number of shares of common stock comprising the stock portion was calculated based on a price of $14.37 per share, which equaled 95.0% of the volume weighted average trading price per share of the common stock on November 14, 17, 18, 19, 20, 21, 24, 25, 26 and 28, 2014. |
| (37) | Based on shareholder elections, the dividend consisted of approximately $2.5 million in cash and 649,500 shares of common stock, or 13.7% of our outstanding common stock prior to the dividend payment. The amount of cash elected to be received was greater than the cash limit of 20.0% of the aggregate dividend amount, thus resulting in the payment of a combination of cash and stock to shareholders who elected to receive cash. The number of shares of common stock comprising the stock portion was calculated based on a price of $15.439 per share, which equaled the volume weighted average trading price per share of the common stock on December 11, 13 and 16, 2013. |
| (38) | Based on shareholder elections, the dividend consisted of $3.3 million in cash and 853,455 shares of common stock, or 22.0% of our outstanding common stock prior to the dividend payment. The amount of cash elected to be received was greater than the cash limit of 20.0% of the aggregate dividend amount, thus resulting in the payment of a combination of cash and stock to shareholders who elected to receive cash. The number of shares of common stock comprising the stock portion was calculated based on a price of $15.444 per share, which equaled the volume weighted average trading price per share of the common stock on December 14, 17 and 19, 2012. |
| (39) | Based on shareholder elections, the dividend consisted of $2.0 million in cash and 599,584 shares of common stock, or 18.0% of our outstanding common stock prior to the dividend payment. The amount of cash elected to be received was greater than the cash limit of 20.0% of the aggregate dividend amount, thus resulting in the payment of a combination of cash and stock to shareholders who elected to receive cash. The number of shares of common stock comprising the stock portion was calculated based on a price of $13.117067 per share, which equaled the volume weighted average trading price per share of the common stock on December 20, 21 and 22, 2011. |
| (40) | Based on shareholder elections, the dividend consisted of $1.2 million in cash and 596,235 shares of common stock, or 22.0% of our outstanding common stock prior to the dividend payment. The amount of cash elected to be received was greater than the cash limit of 10.0% of the aggregate dividend amount, thus resulting in the payment of a combination of cash and stock to shareholders who elected to receive cash. The number of shares of common stock comprising the stock portion was calculated based on a price of $17.8049 per share, which equaled the volume weighted average trading price per share of the common stock on December 20, 21 and 22, 2010. |
| (41) | Based on shareholder elections, the dividend consisted of $2.1 million in cash and 864,872 shares of common stock, or 104.0% of our outstanding common stock prior to the dividend payment. The amount of cash elected to be received was greater than the cash limit of 13.7% of the aggregate dividend amount, thus resulting in the payment of a combination of cash and stock to shareholders who elected to receive cash. The number of shares of common stock comprising the stock portion was calculated based on a price of $1.5099 per share, which equaled the volume weighted average trading price per share of the common stock on December 24 and 28, 2009. |
| (42) | Based on shareholder elections, the dividend consisted of approximately $7.6 million in cash and 29,627 newly issued shares of common stock, or 0.2% of our outstanding common stock prior to the dividend payment. The number of shares of common stock comprising the stock portion was calculated based on a price of $25.29 per share, which equaled 95% of the volume weighted average trading price per share of the common stock on June 15, 16, 20, 21, 22, 23, 26, 27, 28, and 29, 2023. |
| (43) | Based on shareholder elections, the dividend consisted of approximately $8.4 million in cash and 35,196 newly issued shares of common stock, or 0.3% of our outstanding common stock prior to the dividend payment. The number of shares of common stock comprising the stock portion was calculated based on a price of $24.41 per share, which equaled 95% of the volume weighted average trading price per share of the common stock on September 15, 18, 19, 20, 21, 22, 25, 26, 27, and 28, 2023. |
| (44) | Based on shareholder elections, the dividend consisted of approximately $8.9 million in cash and 37,394 newly issued shares of common stock, or 0.3% of our outstanding common stock prior to the dividend payment. The number of shares of common stock comprising the stock portion was calculated based on a price of $24.47 per share, which equaled 95% of the volume weighted average trading price per share of the common stock on December 14, 15, 18, 19, 20, 21, 22, 26, 27, and 28, 2023. |
| (45) | Based on shareholder elections, the dividend consisted of approximately $9.0 million in cash and 45,490 newly issued shares of common stock, or 0.3% of our outstanding common stock prior to the dividend payment. The number of shares of common stock comprising the stock portion was calculated based on a price of $22.85 per share, which equaled 95% of the volume weighted average trading price per share of the common stock on March 15, 18, 19, 20, 21, 22, 25, 26, 27, and 28, 2024. |
The following tables summarize dividends declared for the years ended February 29, 2024, February 28, 2023, February 28, 2022, February 28, 2021 and February 29, 2020 February 28, 2019 and February 28, 2018 (dollars in thousands except for share amounts):
| Date Declared | Record Date | Payment Date | Amount per Share | Total Amount* | ||||||||
| February 24, 2022 | March 14, 2022 | March 28, 2022 | 0.53 | 6,434 | ||||||||
| August 26, 2021 | September 14, 2021 | September 28, 2021 | 0.52 | 5,889 | ||||||||
| May 27, 2021 | June 15, 2021 | June 29, 2021 | 0.44 | 4,910 | ||||||||
| March 22, 2021 | April 8, 2021 | April 22, 2021 | 0.43 | 4,799 | ||||||||
| Total dividends declared | $ | 1.92 | $ | 22,032 | ||||||||
| Date Declared | Record Date | Payment Date | Amount per Share | Total Amount* | ||||||||
| February 15, 2024 | March 13, 2024 | March 28, 2024 | $ | 0.73 | $ | 9,967 | ||||||
| November 15, 2023 | December 11, 2023 | December 28, 2023 | 0.72 | 9,803 | ||||||||
| August 14, 2023 | September 14, 2023 | September 28, 2023 | 0.71 | 9,287 | ||||||||
| May 22, 2023 | June 13, 2023 | June 29, 2023 | 0.70 | 8,352 | ||||||||
| Total dividends declared | $ | 2.86 | $ | 37,409 | ||||||||
| Date Declared | Record Date | Payment Date | Amount per Share | Total Amount* | ||||||||
| January 5, 2021 | January 26, 2021 | February 10, 2021 | 0.42 | 4,679 | ||||||||
| October 7, 2020 | October 26, 2020 | November 10, 2020 | 0.41 | 4,581 | ||||||||
| July 7, 2020 | July 27, 2020 | August 12, 2020 | 0.40 | 4,487 | ||||||||
| Total dividends declared | $ | 1.23 | $ | 13,747 | ||||||||
| Date Declared | Record Date | Payment Date | Amount per Share | Total Amount* | ||||||||
| February 28, 2023 | March 14, 2023 | March 28, 2023 | $ | 0.69 | $ | 8,193 | ||||||
| November 15, 2022 | December 15, 2022 | January 4, 2023 | 0.68 | 8,081 | ||||||||
| August 29, 2022 | September 14, 2022 | September 29, 2022 | 0.54 | 6,433 | ||||||||
| May 26, 2022 | June 14, 2022 | June 29, 2022 | 0.53 | 6,370 | ||||||||
| Total dividends declared | $ | 2.44 | $ | 29,077 | ||||||||
| Date Declared | Record Date | Payment Date | Amount per Share | Total Amount* | ||||||||
| January 7, 2020 | January 24, 2020 | February 6, 2020 | $ | 0.56 | $ | 6,262 | ||||||
| August 27, 2019 | September 13, 2019 | September 26, 2019 | 0.56 | 5,323 | ||||||||
| May 28, 2019 | June 13, 2019 | June 27, 2019 | 0.55 | 4,336 | ||||||||
| February 26, 2019 | March 14, 2019 | March 28, 2019 | 0.54 | 4,176 | ||||||||
| Total dividends declared | $ | 2.21 | $ | 20,097 | ||||||||
| Date Declared | Record Date | Payment Date | Amount per Share | Total Amount* | ||||||||
| February 24, 2022 | March 14, 2022 | March 28, 2022 | $ | 0.53 | $ | 6,434 | ||||||
| August 26, 2021 | September 14, 2021 | September 28, 2021 | 0.52 | 5,889 | ||||||||
| May 27, 2021 | June 15, 2021 | June 29, 2021 | 0.44 | 4,910 | ||||||||
| March 22, 2021 | April 8, 2021 | April 22, 2021 | 0.43 | 4,799 | ||||||||
| Total dividends declared | $ | 1.92 | $ | 22,032 | ||||||||
| Date Declared | Record Date | Payment Date | Amount per Share | Total Amount* | ||||||||
| November 27, 2018 | December 17, 2018 | January 2, 2019 | $ | 0.53 | $ | 3,980 | ||||||
| August 28, 2018 | September 17, 2018 | September 27, 2018 | 0.52 | 3,876 | ||||||||
| May 30, 2018 | June 15, 2018 | June 27, 2018 | 0.51 | 3,204 | ||||||||
| February 26, 2018 | March 14, 2018 | March 26, 2018 | 0.50 | 3,129 | ||||||||
| Total dividends declared | $ | 2.06 | $ | 14,189 | ||||||||
| Date Declared | Record Date | Payment Date | Amount per Share | Total Amount* | ||||||||
| January 5, 2021 | January 26, 2021 | February 10, 2021 | $ | 0.42 | $ | 4,679 | ||||||
| October 7, 2020 | October 26, 2020 | November 10, 2020 | 0.41 | 4,581 | ||||||||
| July 7, 2020 | July 27, 2020 | August 12, 2020 | 0.40 | 4,487 | ||||||||
| Total dividends declared | $ | 1.23 | $ | 13,747 | ||||||||
| Date Declared | Record Date | Payment Date | Amount per Share | Total Amount* | ||||||||
| November 29, 2017 | December 15, 2017 | December 27, 2017 | $ | 0.49 | $ | 3,052 | ||||||
| August 28, 2017 | September 15, 2017 | September 26, 2017 | 0.48 | 2,866 | ||||||||
| May 30, 2017 | June 15, 2017 | June 27, 2017 | 0.47 | 2,792 | ||||||||
| February 28, 2017 | March 15, 2017 | March 28, 2017 | 0.46 | 2,666 | ||||||||
| Total dividends declared | $ | 1.90 | $ | 11,376 | ||||||||
| Date Declared | Record Date | Payment Date | Amount per Share | Total Amount* | ||||||||
| January 7, 2020 | January 24, 2020 | February 6, 2020 | $ | 0.56 | $ | 6,262 | ||||||
| August 27, 2019 | September 13, 2019 | September 26, 2019 | 0.56 | 5,323 | ||||||||
| May 28, 2019 | June 13, 2019 | June 27, 2019 | 0.55 | 4,336 | ||||||||
| February 26, 2019 | March 14, 2019 | March 28, 2019 | 0.54 | 4,176 | ||||||||
| Total dividends declared | $ | 2.21 | $ | 20,097 | ||||||||
| * | amount is calculated based on the number of shares outstanding at the date of record. |
F-68
Note 14. Financial Highlights
The following is a schedule of financial highlights as of and for the years ended February 29, 2024, February 28, 2023, February 28, 2022, February 28, 2021 and February 29, 2020, February 28, 2019 and February 28, 2018:2020:
| Per share data | February 28, 2022 | February 28, 2021 | February 29, 2020 | February 28, 2019 | February 28, 2018 | |||||||||||||||
| Net asset value at beginning of period | $ | 27.25 | $ | 27.13 | $ | 23.62 | $ | 22.96 | $ | 21.97 | ||||||||||
| Adoption of ASC 606 | - | - | (0.01 | ) | - | |||||||||||||||
| Net asset value at beginning of period, as adjusted | 27.25 | 27.13 | 23.62 | 22.95 | 21.97 | |||||||||||||||
| Net investment income(1) | 1.74 | 2.07 | 1.59 | 2.60 | 2.11 | |||||||||||||||
| Net realized and unrealized gains (losses) on investments(1) | 2.46 | (0.74 | ) | 4.56 | 0.03 | 0.82 | ||||||||||||||
| Realized losses on extinguishment of debt* | (0.21 | ) | (0.01 | ) | (0.17 | ) | - | - | ||||||||||||
| Net increase in net assets resulting from operations | 3.99 | 1.32 | 5.98 | 2.63 | 2.93 | |||||||||||||||
| Distributions declared from net investment income | (1.93 | ) | (1.23 | ) | (2.21 | ) | (2.06 | ) | (1.90 | ) | ||||||||||
| Total distributions to stockholders | (1.93 | ) | (1.23 | ) | (2.21 | ) | (2.06 | ) | (1.90 | ) | ||||||||||
| Issuance of common stock above net asset value(2) | - | - | - | 0.15 | - | |||||||||||||||
| Repurchases of common stock(3) | 0.01 | 0.13 | - | - | - | |||||||||||||||
| Dilution(4) | - | (0.10 | ) | (0.26 | ) | (0.05 | ) | (0.04 | ) | |||||||||||
| Net asset value at end of period | $ | 29.33 | $ | 27.25 | $ | 27.13 | $ | 23.62 | $ | 22.96 | ||||||||||
| Net assets at end of period | $ | 355,780,523 | $ | 304,185,770 | $ | 304,286,853 | $ | 180,875,187 | $ | 143,691,367 | ||||||||||
| Shares outstanding at end of period | 12,131,350 | 11,161,416 | 11,217,545 | 7,657,156 | 6,257,029 | |||||||||||||||
| Per share market value at end of period | $ | 27.47 | $ | 23.08 | $ | 22.91 | $ | 23.04 | $ | 21.86 | ||||||||||
| Total return based on market value(5) | 28.19 | % | 7.63 | % | 9.28 | % | 16.11 | % | 5.28 | % | ||||||||||
| Total return based on net asset value(6) | 15.88 | % | 7.31 | % | 26.22 | % | 13.33 | % | 14.45 | % | ||||||||||
| Ratio/Supplemental data: | ||||||||||||||||||||
| Ratio of net investment income to average net assets(7)* | 6.05 | % | 7.77 | % | 6.31 | % | 11.22 | % | 9.37 | % | ||||||||||
| Ratio of loss on extinguishment of debt to average net assets(7) | 0.74 | % | 0.04 | % | 0.67 | % | - | - | ||||||||||||
| Expenses: | ||||||||||||||||||||
| Ratio of operating expenses to average net assets(7) | 5.81 | % | 5.39 | % | 6.25 | % | 6.98 | % | 7.81 | % | ||||||||||
| Ratio of incentive management fees to average net assets(7) | 3.58 | % | 1.65 | % | 6.01 | % | 3.00 | % | 3.19 | % | ||||||||||
| Ratio of interest and debt financing expenses to average net assets(7) | 6.03 | % | 4.56 | % | 6.23 | % | 8.05 | % | 8.05 | % | ||||||||||
| Ratio of total expenses to average net assets(7)* | 15.42 | % | 11.60 | % | 18.49 | % | 18.03 | % | 19.05 | % | ||||||||||
| Portfolio turnover rate(8) | 33.59 | % | 25.26 | % | 36.82 | % | 35.26 | % | 19.73 | % | ||||||||||
| Asset coverage ratio per unit(9) | 2,092 | 3,471 | 6,071 | 2,345 | 2,930 | |||||||||||||||
| Average market value per unit | ||||||||||||||||||||
| Revolving Credit Facility(10) | N/A | N/A | N/A | N/A | N/A | |||||||||||||||
| SBA Debentures Payable(10) | N/A | N/A | N/A | N/A | N/A | |||||||||||||||
| 7.50% Notes Payable 2020 | N/A | N/A | N/A | N/A | N/A | |||||||||||||||
| 6.75% Notes Payable 2023(11) | N/A | N/A | N/A | $ | 25.74 | $ | 26.05 | |||||||||||||
| 6.25% Notes Payable 2025(12) | N/A | $ | 24.24 | $ | 25.75 | $ | 24.97 | N/A | ||||||||||||
| 7.25% Notes Payable 2025 | $ | 26.18 | $ | 25.77 | N/A | N/A | N/A | |||||||||||||
| 7.75% Notes Payable 2025(10) | N/A | N/A | N/A | N/A | N/A | |||||||||||||||
| 4.275% Notes Payable(10) | N/A | N/A | N/A | N/A | N/A | |||||||||||||||
| 4.35% Notes Payable(10) | N/A | N/A | N/A | N/A | N/A | |||||||||||||||
| 6.25% Notes Payable 2027(10) | N/A | N/A | N/A | N/A | N/A | |||||||||||||||
| Per share data | February 29, 2024 | February 28, 2023 | February 28, 2022 | February 28, 2021 | February 29, 2020 | |||||||||||||||
| Net asset value at beginning of period | $ | 29.18 | $ | 29.33 | $ | 27.25 | $ | 27.13 | $ | 23.62 | ||||||||||
| Net investment income(1) | 4.49 | 2.94 | 1.74 | 2.07 | 1.59 | |||||||||||||||
| Net realized and unrealized gain and losses on investments(1) | (3.77 | ) | (0.75 | ) | 2.46 | (0.74 | ) | 4.56 | ||||||||||||
| Realized losses on extinguishment of debt* | (0.01 | ) | (0.13 | ) | (0.21 | ) | (0.01 | ) | (0.17 | ) | ||||||||||
| Net increase in net assets resulting from operations | 0.71 | 2.06 | 3.99 | 1.32 | 5.98 | |||||||||||||||
| Distributions declared from net investment income | (2.82 | ) | (2.28 | ) | (1.93 | ) | (1.23 | ) | (2.21 | ) | ||||||||||
| Total distributions to stockholders | (2.82 | ) | (2.28 | ) | (1.93 | ) | (1.23 | ) | (2.21 | ) | ||||||||||
| Issuance of common stock above net asset value(2) | (0.40 | ) | (2.28 | ) | (1.93 | ) | (1.23 | ) | (2.21 | ) | ||||||||||
| Capital contribution from Manager for the issuance of common stock(8) | 0.48 | - | - | - | - | |||||||||||||||
| Repurchases of common stock(3) | 0.03 | 0.17 | 0.01 | 0.13 | - | |||||||||||||||
| Dilution(4) | (0.06 | ) | (0.10 | ) | - | (0.10 | ) | (0.26 | ) | |||||||||||
| Net asset value at end of period | $ | 27.12 | $ | 29.18 | $ | 29.33 | $ | 27.25 | $ | 27.13 | ||||||||||
| Net assets at end of period | $ | 370,224,108 | $ | 346,958,042 | $ | 355,780,523 | $ | 304,185,770 | $ | 304,286,853 | ||||||||||
| Shares outstanding at end of period | 13,653,476 | 11,890,500 | 12,131,350 | 11,161,416 | 11,217,545 | |||||||||||||||
| Per share market value at end of period | $ | 23.61 | $ | 27.55 | $ | 27.47 | $ | 23.08 | $ | 22.91 | ||||||||||
| Total return based on market value(5) | -3.92 | % | 10.35 | % | 28.19 | % | 7.63 | % | 9.28 | % | ||||||||||
| Total return based on net asset value(6) | 4.20 | % | 9.46 | % | 15.88 | % | 7.31 | % | 26.22 | % | ||||||||||
| Ratio/Supplemental data: | ||||||||||||||||||||
| Ratio of net investment income to average net assets | 16.01 | % | 10.23 | % | 6.05 | % | 7.77 | % | 6.31 | % | ||||||||||
| Ratio of loss on extinguishment of debt to average net assets | 0.03 | % | 0.46 | % | 0.74 | % | 0.04 | % | 0.67 | % | ||||||||||
| Expenses: | ||||||||||||||||||||
| Ratios of operating expenses and income taxes to average net assets* | 8.59 | % | 7.71 | % | 6.48 | % | 6.90 | % | 6.10 | % | ||||||||||
| Ratio of incentive management fees to average net assets | 2.26 | % | 1.47 | % | 3.58 | % | 1.65 | % | 6.01 | % | ||||||||||
| Ratio of interest and debt financing expenses to average net assets | 13.84 | % | 9.73 | % | 6.03 | % | 4.56 | % | 6.23 | % | ||||||||||
| Ratio of total expenses and income taxes to average net assets* | 24.70 | % | 18.91 | % | 16.09 | % | 13.11 | % | 18.34 | % | ||||||||||
| Portfolio turnover rate(7) | 2.80 | % | 24.05 | % | 33.59 | % | 25.26 | % | 36.82 | % | ||||||||||
| Asset coverage ratio per unit(8) | 1,610 | 1,659 | 2,092 | 3,471 | 6,071 | |||||||||||||||
| Average market value per unit | ||||||||||||||||||||
| Revolving Credit Facility(9) | N/A | N/A | N/A | N/A | N/A | |||||||||||||||
| SBA Debentures Payable(9) | N/A | N/A | N/A | N/A | N/A | |||||||||||||||
| 6.75% Notes Payable 2023(10) | N/A | N/A | N/A | N/A | N/A | |||||||||||||||
| 8.75% Notes Payable 2025(9) | N/A | N/A | N/A | N/A | N/A | |||||||||||||||
| 6.25% Notes Payable 2025(11) | N/A | N/A | N/A | $ | 24.24 | $ | 25.75 | |||||||||||||
| 7.00% Notes Payable 2025(9) | N/A | N/A | N/A | N/A | N/A | |||||||||||||||
| 7.25% Notes Payable 2025(12) | N/A | N/A | $ | 26.18 | 25.77 | N/A | ||||||||||||||
| 7.75% Notes Payable 2025(9) | N/A | N/A | N/A | N/A | N/A | |||||||||||||||
| 4.375% Notes Payable 2026(9) | N/A | N/A | N/A | N/A | N/A | |||||||||||||||
| 4.35% Notes Payable 2027(9) | N/A | N/A | N/A | N/A | N/A | |||||||||||||||
| 6.00% Notes Payable 2027 | $ | 23.51 | $ | 23.97 | N/A | N/A | N/A | |||||||||||||
| 6.25% Notes Payable 2027(9) | N/A | N/A | N/A | N/A | N/A | |||||||||||||||
| 8.00% Notes Payable 2027 | $ | 25.00 | $ | 25.08 | N/A | N/A | N/A | |||||||||||||
| 8.125% Notes Payable 2027 | $ | 25.05 | $ | 25.10 | N/A | N/A | N/A | |||||||||||||
| 8.50% Notes Payable 2028 | $ | 25.17 | N/A | N/A | N/A | N/A | ||||||||||||||
| * | Certain prior period amounts have been reclassified to conform to current period presentation. |
| (1) | Per share amounts are calculated using the weighted average shares outstanding during the period. |
| (2) | The continuous issuance of common stock may cause an incremental increase in |
| (3) | Represents the anti-dilutive impact on the |
| (4) | Represents the dilutive effect of issuing common stock below |
| (5) | Total investment return is calculated assuming a purchase of common shares at the current market value on the first day and a sale at the current market value on the last day of the periods reported. Dividends and distributions, if any, are assumed for purposes of this calculation to be reinvested at prices obtained under the |
F-69
| (6) | Total investment return is calculated assuming a purchase of common shares at the current |
| (7) |
| Portfolio turnover rate is calculated using the lesser of year-to-date sales or year-to-date purchases over the average of the invested assets at fair value. |
| (8) | Asset coverage ratio per unit is the ratio of the carrying value of our total consolidated assets, less all liabilities and indebtedness not represented by senior securities, to the aggregate amount of senior securities representing indebtedness. Asset coverage ratio per unit is expressed in terms of dollar amounts per $1,000 of indebtedness. Asset coverage ratio per unit does not include unfunded commitments. The inclusion of unfunded commitments in the calculation of the asset coverage ratio per unit would not cause us to be below the required amount of regulatory coverage. |
| (9) | The Revolving Credit Facility, SBA Debentures, 8.75 Notes Payable 2025, 7.75% Notes Payable 2025, 4.375% Notes Payable 2026, 4.35% Notes Payable 2026, 7.00% Notes Payable 2025 and 6.25% Notes Payable 2027 are not registered for public trading. |
| (10) | On December 21, 2019 and February 7, 2020, the Company redeemed $50.0 million and $24.5 million, respectively, in aggregate principal amount of the $74.5 million in aggregate principal amount of issued and outstanding 2023 Notes and are no longer listed on the NYSE. |
| (11) | On August 31, 2021, the Company redeemed $60.0 million in aggregate principal amount of the issued and outstanding 6.25% 2025 Notes and, as a result of the full redemption, the 6.25% 2025 Notes are no longer listed on the NYSE. |
| (12) | On July 14, 2022, the Company redeemed $43.1 million in aggregate principal amount of the $43.1 million in aggregate principal amount of issued and outstanding 7.25% 2025 Notes and are no longer listed on the NYSE. |
Note 15. Selected Quarterly Data (Unaudited)
| 2022 | 2024 | |||||||||||||||||||||||||||||||
| ($ in thousands, except per share numbers) | Qtr 4 | Qtr 3 | Qtr 2 | Qtr 1 | Qtr 4 | Qtr 3 | Qtr 2 | Qtr 1 | ||||||||||||||||||||||||
| Total investment income | $ | 18,980 | $ | 16,502 | $ | 18,442 | $ | 16,816 | $ | 37,233 | $ | 36,340 | $ | 35,514 | $ | 34,632 | ||||||||||||||||
| Net investment income | 5,796 | 5,197 | 6,393 | 2,556 | $ | 12,785 | $ | 14,166 | $ | 13,965 | $ | 15,959 | ||||||||||||||||||||
| Net realized and unrealized gain (loss) | 2,725 | 3,908 | 3,101 | 18,493 | $ | (7,478 | ) | $ | (18,222 | ) | $ | (5,959 | ) | $ | (16,172 | ) | ||||||||||||||||
| Realized losses on extinguishment of debt* | (2,434 | ) | (118 | ) | (1,552 | ) | - | $ | - | $ | - | $ | (110 | ) | $ | - | ||||||||||||||||
| Net increase in net assets resulting from operations | 8,404 | 8,340 | 7,942 | 21,049 | $ | 5,307 | $ | (4,056 | ) | $ | 7,896 | $ | (213 | ) | ||||||||||||||||||
| Net investment income per common share | $ | 0.48 | $ | 0.45 | $ | 0.57 | $ | 0.23 | $ | 0.94 | $ | 1.09 | $ | 1.15 | $ | 1.35 | ||||||||||||||||
| Net realized and unrealized gain (loss) per common share | $ | 0.23 | $ | 0.34 | $ | 0.29 | $ | 1.66 | $ | (0.55 | ) | $ | (1.40 | ) | $ | (0.49 | ) | $ | (1.36 | ) | ||||||||||||
| Dividends declared per common share | $ | 0.53 | $ | 0.52 | $ | 0.44 | $ | 0.43 | $ | 0.72 | $ | 0.71 | $ | 0.70 | $ | 0.69 | ||||||||||||||||
| Net asset value per common share | $ | 29.33 | $ | 29.17 | $ | 28.97 | $ | 28.70 | $ | 27.12 | $ | 27.42 | $ | 28.44 | $ | 28.48 | ||||||||||||||||
| 2021 | 2023 | |||||||||||||||||||||||||||||||
| ($ in thousands, except per share numbers) | Qtr 4 | Qtr 3 | Qtr 2 | Qtr 1 | Qtr 4 | Qtr 3 | Qtr 2 | Qtr 1 | ||||||||||||||||||||||||
| Total investment income | $ | 16,214 | $ | 14,283 | $ | 13,856 | $ | 13,297 | $ | 32,315 | $ | 26,257 | $ | 21,853 | $ | 18,679 | ||||||||||||||||
| Net investment income | 4,289 | 4,471 | 5,335 | 9,018 | $ | 9,650 | $ | 9,877 | $ | 7,698 | $ | 7,976 | ||||||||||||||||||||
| Net realized and unrealized gain (loss) | 5,096 | 1,895 | 16,476 | (31,674 | ) | $ | 9,934 | $ | (3,863 | ) | $ | (5,545 | ) | $ | (9,464 | ) | ||||||||||||||||
| Realized losses on extinguishment of debt* | (129 | ) | - | - | - | $ | (382 | ) | $ | - | $ | (1,205 | ) | $ | - | |||||||||||||||||
| Net increase in net assets resulting from operations | 9,256 | 6,366 | 21,811 | (22,656 | ) | $ | 19,202 | $ | 6,014 | $ | 948 | $ | (1,488 | ) | ||||||||||||||||||
| Net investment income per common share | $ | 0.38 | $ | 0.40 | $ | 0.48 | $ | 0.80 | $ | 0.81 | $ | 0.83 | $ | 0.64 | $ | 0.66 | ||||||||||||||||
| Net realized and unrealized gain (loss) per common share | $ | 0.46 | $ | 0.17 | $ | 1.48 | $ | (2.82 | ) | $ | 0.81 | $ | (0.32 | ) | $ | (0.46 | ) | $ | (0.78 | ) | ||||||||||||
| Dividends declared per common share | $ | 0.42 | $ | 0.41 | $ | 0.40 | $ | - | $ | 0.68 | $ | 0.54 | $ | 0.53 | $ | 0.53 | ||||||||||||||||
| Net asset value per common share | $ | 27.25 | $ | 26.84 | $ | 26.68 | $ | 25.11 | $ | 29.18 | $ | 28.25 | $ | 28.27 | $ | 28.69 | ||||||||||||||||
| 2020 | 2022 | |||||||||||||||||||||||||||||||
| ($ in thousands, except per share numbers) | Qtr 4 | Qtr 3 | Qtr 2 | Qtr 1 | Qtr 4 | Qtr 3 | Qtr 2 | Qtr 1 | ||||||||||||||||||||||||
| Total investment income | $ | 17,613 | $ | 14,196 | $ | 13,888 | $ | 12,751 | $ | 18,980 | $ | 16,502 | $ | 18,442 | $ | 16,816 | ||||||||||||||||
| Net investment income | 1,649 | 4,575 | 4,956 | 3,681 | $ | 5,796 | $ | 5,197 | $ | 6,393 | $ | 2,556 | ||||||||||||||||||||
| Net realized and unrealized gain (loss) | 26,727 | 9,142 | 2,624 | 3,968 | $ | 2,725 | $ | 3,908 | $ | 3,101 | $ | 18,493 | ||||||||||||||||||||
| Realized losses on extinguishment of debt* | (1,583 | ) | - | - | - | $ | (2,434 | ) | $ | (118 | ) | $ | (1,552 | ) | $ | - | ||||||||||||||||
| Net increase in net assets resulting from operations | 26,793 | 13,717 | 7,580 | 7,649 | $ | 8,404 | $ | 8,340 | $ | 7,942 | $ | 21,049 | ||||||||||||||||||||
| Net investment income per common share | $ | 0.15 | $ | 0.46 | $ | 0.59 | $ | 0.48 | $ | 0.48 | $ | 0.45 | $ | 0.57 | $ | 0.23 | ||||||||||||||||
| Net realized and unrealized gain (loss) per common share | $ | 2.39 | $ | 0.91 | $ | 0.31 | $ | 0.51 | $ | 0.23 | $ | 0.34 | $ | 0.29 | $ | 1.66 | ||||||||||||||||
| Dividends declared per common share | $ | 0.56 | $ | 0.56 | $ | 0.55 | $ | 0.54 | $ | 0.53 | $ | 0.52 | $ | 0.44 | $ | 0.43 | ||||||||||||||||
| Net asset value per common share | $ | 27.13 | $ | 25.30 | $ | 24.47 | $ | 24.06 | $ | 29.33 | $ | 29.17 | $ | 28.97 | $ | 28.70 | ||||||||||||||||
| * | Certain prior period amounts have been reclassified to conform to current period presentation. |
Note 16. Subsequent Events
The Company has evaluated subsequent events through the filing of this Form 10-K and determined that there have been no events that have occurred that would require adjustments to the Company’s consolidated financial statements and disclosures in the consolidated financial statements except for the following:
Subsequent to February 28, 2022, the global outbreak of the coronavirus pandemic has adversely affected some of the Company’s investments and continues to have adverse consequences on the U.S. and global economies. The ultimate economic fallout from the pandemic, and the long-term impact on economies, markets, industries and individual portfolio companies, remains uncertain. At the time of this filing, there is no indication of a reportable subsequent event impacting the Company’s financial statements for the year ended February 28, 2022. The Company cannot predict the extent to which its financial condition and results of operations will be adversely affected at this time. The potential impact to our results will depend to a large extent on future developments and new information that may emerge regarding the duration and severity of COVID-19. The Company continues to observe and respond to the evolving COVID-19 environment and its potential impact on areas across its business.Live Oak Facility
On AprilMarch 27, 2022,2024, the Company issued $87.5 million in aggregate principal amount of 6.00% fixed-rate notes due 2027and its wholly owned special purpose subsidiary, Saratoga Investment Funding III LLC (“SIF III”), entered into a credit and security agreement (the “6.00% 2027 Notes”“Live Oak Credit Agreement”) for net proceeds of $84.5 million after deducting underwriting commissions of $2.7 million, by and offering costs of approximately $0.3 million. The issuance includedamong SIF III, as borrower, the underwriters’ option to purchase an additional $12.5 million aggregate principal amount of 6.00% 2027 Notes within 30 days. The 6.00% 2027 Notes will be listed onCompany, as collateral manager and equityholder, the NYSE under the trading symbol “SAT” with a par value of $25.00 per share. Interest on the 6.00% 2027 Notes is paid quarterly in arrears on February 28, May 31, August 31 and November 30, at a rate of 6.00% per year, beginning August 31, 2022. The 6.00% 2027 Notes mature on April 30, 2027 and commencing April 27, 2024, may be redeemed in whole or in part at any time orlenders from time to time parties thereto, Live Oak Banking Company (“Live Oak”), as administrative agent and collateral agent, U.S. Bank National Association, as custodian, and U.S. Bank Trust Company, National Association, as collateral administrator, relating to a special purpose vehicle financing credit facility (the “Live Oak Credit Facility”).
The Live Oak Credit Facility provides for borrowings in U.S. dollars in an aggregate amount of up to $50.0 million. During the first two years following the closing date, SIF III may request one or more increases in the commitment amount from $50.0 million to an amount not to exceed $150.0 million, subject to certain terms and conditions and a customary fee. The terms of the Live Oak Credit Agreement require a minimum drawn amount of $12.5 million at our option.all times during the period ending March 27, 2025 and, thereafter, the greater of: (i) $25.0 million and (ii) 50% of the facility amount in effect at such time. The net proceeds fromLive Oak Credit Facility matures on March 27, 2027. Advances are available during the offering were usedterm of the Live Oak Credit Facility and must be repaid in full at maturity. SIF III may request an extension of the maturity date by an additional one year, subject to the agreement of the lenders and an extension fee.
Advances under the Live Oak Credit Facility are subject to a borrowing base calculation, and the Live Oak Credit Facility has various eligibility criteria for general corporate purposesloans to be included in accordance with our investment objectivethe borrowing base. Advances under the Live Oak Credit Facility bear interest at a floating rate per annum equal to Adjusted Term SOFR plus an applicable margin between 3.50% and strategies.4.25% based on the Live Oak Credit Facility’s utilization. The Company may useLive Oak Credit Agreement also provides for an unused fee of 0.50% on the net proceeds from this offeringunused commitments. SIF III’s obligations to redeemthe lenders under the Live Oak Credit Facility are secured by a first priority security interest in substantially all of SIF III’s assets. In addition, SIF III’s obligations to the outstanding 7.25% fixed-rate notes due 2025, whichlenders under the Live Oak Credit Facility are callablesecured by a pledge by the Company commencing June 24, 2022.of its equity interests in SIF III, which is evidenced by the equity pledge agreement, dated as of March 27, 2024, by and between the Company, as pledgor, and Live Oak, as collateral agent for the benefit of the secured parties.
In connection with the Live Oak Credit Agreement, the Company entered into a loan sale and contribution agreement with SIF III, dated as of March 27, 2024, by and between the Company, as seller, and SIF III, as purchaser, pursuant to which the Company will sell or contribute certain loans held by the Company to SIF III to be used to support the borrowing base under the Live Oak Credit Facility. The Live Oak Credit Facility permits loan proceeds and excess cash in SIF III’s collection accounts to be distributed to us at any time based on three business days advance notice, subject to compliance with various conditions, including the absence of a default or event of default, the absence of an over-advance against the borrowing base and the absence of a violation of the financial covenants.
F-71
INDEX TO OTHER FINANCIAL STATEMENTS
Saratoga Investment Corp. CLO 2013-1, Ltd.
IMPORTANT NOTE
In accordance with certain SEC rules, Saratoga Investment Corp. (the “Company”) is providing additional information regarding one of its portfolio companies, Saratoga Investment Corp. CLO 2013-1, Ltd. (“Saratoga CLO”). The Company owns 100% of the subordinated notes of the Saratoga CLO. The additional financial information regarding the Saratoga CLO does not directly impact the Company’s financial position, results of operations or cash flows.

Independent Auditor’s Report
To the Board of Directors
Saratoga Investment Corp. CLO 2013-1, Ltd.
Opinion
We have audited the financial statements of Saratoga Investment Corp. CLO 2013-1, Ltd. (the “Fund”(“Saratoga CLO”), which comprise the statements of assets and liabilities as of February 29, 2024 and February 28, 2023, including the schedulesschedule of investments, as of February 29, 2024 and February 28, 2022 and 2021,2023, and the related statements of operations, changes in net assets, and cash flows for the years then ended February 29, 2024, February 28, 2023, and February 28, 2022, and the related notes to the financial statements.
In our opinion, the accompanying financial statements present fairly, in all material respects, the financial position of Saratoga Investment Corp. CLO 2013-1, Ltd. as of February 29, 2024 and February 28, 2022 and 2021,2023, and the results of its operations, changes in its net assets, and its cash flows for the years then ended February 29, 2024, February 28, 2023, and February 28, 2022, in accordance with accounting principles generally accepted in the United States of America.
Basis for Opinion
We conducted our audits in accordance with auditing standards generally accepted in the United States of America (“GAAS”("GAAS"). Our responsibilities under those standards are further described in the Auditor’sAuditor's Responsibilities for the Audit of the Financial Statements section of our report. We are required to be independent of the FundSaratoga CLO and to meet our other ethical responsibilities, in accordance with the relevant ethical requirements relating to our audits. We believe that the audit evidence we have obtained is sufficient and appropriate to provide a basis for our audit opinion.
Other Matter - 2020 Financial Statements Audited by Another Auditor
The financial statements of the Fund for the year ended February 29, 2020, were audited by another auditor who expressed an unmodified opinion on those statements dated May 6, 2020.
Responsibilities of Management for the Financial Statements
Management is responsible for the preparation and fair presentation of the financial statements in accordance with accounting principles generally accepted in the United States of America, and for the design, implementation, and maintenance of internal control relevant to the preparation and fair presentation of financial statements that are free from material misstatement, whether due to fraud or error.
In preparing the financial statements, management is required to evaluate whether there are conditions or events, considered in the aggregate, that raise substantial doubt about the Fund’sSaratoga CLO's ability to continue as a going concern for one year after the date that the financial statements are available to be issued.
Auditor’sAuditor's Responsibilities for the Audit of the Financial Statements
Our objectives are to obtain reasonable assurance about whether the financial statements as a whole are free from material misstatement, whether due to fraud or error, and to issue an auditor’sauditor's report that includes our opinion. Reasonable assurance is a high level of assurance but is not absolute assurance and therefore is not a guarantee that an audit conducted in accordance with GAAS will always detect a material misstatement when it exists. The risk of not detecting a material misstatement resulting from fraud is higher than for one resulting from error, as fraud may involve collusion, forgery, intentional omissions, misrepresentations, or the override of internal control. Misstatements are considered material if there is a substantial likelihood that, individually or in the aggregate, they would influence the judgment made by a reasonable user based on the financial statements.
In performing an audit in accordance with GAAS, we:
| ● | Exercise professional judgment and maintain professional skepticism throughout the audit. |
| ● | Identify and assess the risks of material misstatement of the financial statements, whether due to fraud or error, and design and perform audit procedures responsive to those risks. Such procedures include examining, on a test basis, evidence regarding the amounts and disclosures in the financial statements. |
| ● | Obtain an understanding of internal control relevant to the audit in order to design audit procedures that are appropriate in the circumstances, but not for the purpose of expressing an opinion on the effectiveness of |
| ● | Evaluate the appropriateness of accounting policies used and the reasonableness of significant accounting estimates made by management, as well as evaluate the overall presentation of the financial statements. |
| ● | Conclude whether, in our judgment, there are conditions or events, considered in the aggregate, that raise substantial doubt about |
We are required to communicate with those charged with governance regarding, among other matters, the planned scope and timing of the audit, significant audit findings, and certain internal control-related matters that we identified during the audit.
/s/ CohnReznick LLP
Chicago, Illinois
May 4, 2022
Parsippany, New Jersey
May 6, 2024
Saratoga Investment Corp. CLO 2013-1, Ltd.
Statements of Assets and Liabilities
| February 28, 2022 | February 28, 2021 | |||||||
| ASSETS | ||||||||
| Investments at fair value | ||||||||
| Loans at fair value (amortized cost of $653,022,265 and $594,722,350, respectively) | $ | 638,929,660 | $ | 591,518,866 | ||||
| Equities at fair value (amortized cost of $0 and $527,124, respectively) | 33,690 | 501,175 | ||||||
| Total investments at fair value (amortized cost of $653,022,265 and $595,249,474, respectively) | 638,963,350 | 592,020,041 | ||||||
| Cash and cash equivalents | 6,171,793 | 114,145,406 | ||||||
| Receivable from open trades | 9,152,660 | 1,901,754 | ||||||
| Interest receivable (net of reserve of $0 and $35,000, respectively) | 2,062,856 | 1,497,333 | ||||||
| Prepaid expenses and other assets | 100,067 | 118,868 | ||||||
| Total assets | $ | 656,450,726 | $ | 709,683,402 | ||||
| LIABILITIES | ||||||||
| Interest payable | $ | 1,659,776 | $ | 124,233 | ||||
| Payable from open trades | 18,794,627 | 66,298,568 | ||||||
| Accrued base management fee | 72,510 | 6,930 | ||||||
| Accrued subordinated management fee | 290,040 | 27,715 | ||||||
| Accounts payable and accrued expenses | 58,716 | 809,760 | ||||||
| Due to Affiliate | - | 2,600,000 | ||||||
| Saratoga Investment Corp. CLO 2013-1, Ltd. Notes: | ||||||||
| Class A-1-R-3 Senior Secured Floating Rate Notes | 357,500,000 | 357,500,000 | ||||||
| Class A-2-R-3 Senior Secured Floating Rate Notes | 65,000,000 | 65,000,000 | ||||||
| Class B-FL-R-3 Senior Secured Floating Rate Notes | 60,500,000 | 60,500,000 | ||||||
| Class B-FXD-R-3 Senior Secured Fixed Rate Notes | 11,000,000 | 11,000,000 | ||||||
| Class C-FL-R-3 Deferrable Mezzanine Floating Rate Notes | 26,000,000 | 26,000,000 | ||||||
| Class C-FXD-R-3 Deferrable Mezzanine Fixed Rate Notes | 6,500,000 | 6,500,000 | ||||||
| Class D-R-3 Deferrable Mezzanine Floating Rate Notes | 39,000,000 | 39,000,000 | ||||||
| Discount on Class D-R-3 Notes | (268,301 | ) | (292,368 | ) | ||||
| Class E-R-3 Deferrable Mezzanine Floating Rate Notes | 27,625,000 | 27,625,000 | ||||||
| Discount on Class E-R-3 Notes | (2,787,348 | ) | (3,037,380 | ) | ||||
| Class F-1-R-3 Notes Deferrable Junior Floating Rate Notes | 8,500,000 | 17,875,000 | ||||||
| Class F-2-R-3 Notes Deferrable Junior Floating Rate Notes | 9,375,000 | - | ||||||
| Deferred debt financing costs | (2,086,928 | ) | (2,276,780 | ) | ||||
| Subordinated Notes | 111,000,000 | 111,000,000 | ||||||
| Discount on Subordinated Notes | (44,084,883 | ) | (48,039,412 | ) | ||||
| Total liabilities | $ | 693,648,209 | $ | 738,221,266 | ||||
| NET ASSETS | ||||||||
| Ordinary equity, par value $1.00, 250 ordinary shares authorized, 250 and 250 common shares issued and outstanding, respectively | $ | 250 | $ | 250 | ||||
| Total distributable earnings (loss) | (37,197,733 | ) | (28,538,114 | ) | ||||
| Total net assets | (37,197,483 | ) | (28,537,864 | ) | ||||
| Total liabilities and net assets | $ | 656,450,726 | $ | 709,683,402 | ||||
| February 29, 2024 | February 28, 2023 | |||||||
| ASSETS | ||||||||
| Investments at fair value | ||||||||
| Loans at fair value (amortized cost of $629,345,724 and $645,599,001, respectively) | $ | 606,531,189 | $ | 605,954,468 | ||||
| Equities at fair value (amortized cost of $1,649,986 and $0, respectively) | 1,020,585 | - | ||||||
| Total investments at fair value (amortized cost of $630,995,710 and $645,599,001, respectively) | 607,551,774 | 605,954,468 | ||||||
| Cash and cash equivalents | 12,104,832 | 23,776,950 | ||||||
| Receivable from open trades | 2,865,174 | 1,827,460 | ||||||
| Interest receivable (net of reserve of $615,604 and $234,690, respectively) | 3,402,471 | 3,026,720 | ||||||
| Due from affiliate (See Note 7) | 3,953 | 119,150 | ||||||
| Prepaid expenses and other assets | 205,400 | 152,760 | ||||||
| Total assets | $ | 626,133,604 | $ | 634,857,508 | ||||
| LIABILITIES | ||||||||
| Interest payable | $ | 5,043,712 | $ | 4,662,695 | ||||
| Payable from open trades | 10,519,573 | 23,184,337 | ||||||
| Accrued base management fee | 68,605 | 72,762 | ||||||
| Accrued subordinated management fee | 274,418 | 291,047 | ||||||
| Accounts payable and accrued expenses | 84,199 | 82,565 | ||||||
| Saratoga Investment Corp. CLO 2013-1, Ltd. Notes: | ||||||||
| Class A-1-R-3 Senior Secured Floating Rate Notes | 357,500,000 | 357,500,000 | ||||||
| Class A-2-R-3 Senior Secured Floating Rate Notes | 65,000,000 | 65,000,000 | ||||||
| Class B-FL-R-3 Senior Secured Floating Rate Notes | 60,500,000 | 60,500,000 | ||||||
| Class B-FXD-R-3 Senior Secured Fixed Rate Notes | 11,000,000 | 11,000,000 | ||||||
| Class C-FL-R-3 Deferrable Mezzanine Floating Rate Notes | 26,000,000 | 26,000,000 | ||||||
| Class C-FXD-R-3 Deferrable Mezzanine Fixed Rate Notes | 6,500,000 | 6,500,000 | ||||||
| Class D-R-3 Deferrable Mezzanine Floating Rate Notes | 39,000,000 | 39,000,000 | ||||||
| Discount on Class D-R-3 Notes | (220,100 | ) | (244,234 | ) | ||||
| Class E-R-3 Deferrable Mezzanine Floating Rate Notes | 27,625,000 | 27,625,000 | ||||||
| Discount on Class E-R-3 Notes | (2,286,598 | ) | (2,537,315 | ) | ||||
| Class F-1-R-3 Notes Deferrable Junior Floating Rate Notes | 8,500,000 | 8,500,000 | ||||||
| Class F-2-R-3 Notes Deferrable Junior Floating Rate Notes | 9,375,000 | 9,375,000 | ||||||
| Deferred debt financing costs | (1,707,224 | ) | (1,897,076 | ) | ||||
| Subordinated Notes | 111,000,000 | 111,000,000 | ||||||
| Discount on Subordinated Notes | (36,164,988 | ) | (40,130,353 | ) | ||||
| Total liabilities | 697,611,597 | 705,484,428 | ||||||
| Commitments and contingencies | ||||||||
| NET ASSETS | ||||||||
| Ordinary equity, par value $1.00, 250 ordinary shares authorized, 250 and 250 common shares issued and outstanding, respectively | 250 | 250 | ||||||
| Total distributable earnings (loss) | (71,478,243 | ) | (70,627,170 | ) | ||||
| Total net deficit | (71,477,993 | ) | (70,626,920 | ) | ||||
| Total liabilities and net assets | $ | 626,133,604 | $ | 634,857,508 | ||||
See accompanying notes to financial statements.
Saratoga Investment Corp. CLO 2013-1, Ltd.
Statements of Operations
| For the year ended | ||||||||||||
| February 28, 2022 | February 28, 2021 | February 29, 2020 | ||||||||||
| INVESTMENT INCOME | ||||||||||||
| Total interest from investments | 30,767,008 | 27,100,908 | 32,413,402 | |||||||||
| Interest from cash and cash equivalents | 691 | 3,835 | 98,964 | |||||||||
| Other income | 710,708 | 729,235 | 416,089 | |||||||||
| Total investment income | 31,478,407 | 27,833,978 | 32,928,455 | |||||||||
| EXPENSES | ||||||||||||
| Interest and debt financing expenses | 24,220,477 | 25,903,182 | 28,511,147 | |||||||||
| Base management fee | 652,517 | 501,526 | 500,761 | |||||||||
| Subordinated management fee | 2,610,073 | 2,006,101 | 2,003,043 | |||||||||
| Professional fees | 255,521 | 454,136 | 322,170 | |||||||||
| Trustee expenses | 262,632 | 213,212 | 194,169 | |||||||||
| Other expense | 243,511 | 55,702 | 71,096 | |||||||||
| Total expenses | 28,244,731 | 29,133,859 | 31,602,386 | |||||||||
| NET INVESTMENT INCOME (LOSS) | 3,233,676 | (1,299,881 | ) | 1,326,069 | ||||||||
| REALIZED AND UNREALIZED LOSS ON INVESTMENTS | ||||||||||||
| Net realized loss from investments | (1,063,813 | ) | (10,922,627 | ) | (4,795,185 | ) | ||||||
| Net change in unrealized appreciation (depreciation) on investments | (10,829,482 | ) | 21,775,577 | (13,733,384 | ) | |||||||
| Net realized and unrealized gain (loss) on investments | (11,893,295 | ) | 10,852,950 | (18,528,569 | ) | |||||||
| Realized losses on extinguishment of debt | - | (2,988,764 | ) | - | ||||||||
| NET INCREASE (DECREASE) IN NET ASSETS RESULTING FROM OPERATIONS | $ | (8,659,619 | ) | $ | 6,564,305 | $ | (17,202,500 | ) | ||||
| For the years ended | ||||||||||||
| February 29, 2024 | February 28, 2023 | February 28, 2022 | ||||||||||
| INVESTMENT INCOME | ||||||||||||
| Interest from investments | $ | 61,667,773 | $ | 42,505,427 | $ | 30,767,008 | ||||||
| Interest from cash and cash equivalents | 719,268 | 39,754 | 691 | |||||||||
| Other income | 929,392 | 551,174 | 710,708 | |||||||||
| Total investment income | 63,316,433 | 43,096,355 | 31,478,407 | |||||||||
| EXPENSES | ||||||||||||
| Interest and debt financing expenses | 57,706,205 | 38,425,261 | 24,220,477 | |||||||||
| Base management fee | 654,046 | 653,964 | 652,517 | |||||||||
| Subordinated management fee | 2,616,185 | 2,615,856 | 2,610,073 | |||||||||
| Professional fees | 307,340 | 252,196 | 255,521 | |||||||||
| Trustee expenses | 262,197 | 276,689 | 262,632 | |||||||||
| Other expense | 241,181 | 303,371 | 243,511 | |||||||||
| Total expenses | 61,787,154 | 42,527,337 | 28,244,731 | |||||||||
| NET INVESTMENT INCOME (LOSS) | 1,529,279 | 569,018 | 3,233,676 | |||||||||
| REALIZED AND UNREALIZED GAIN (LOSS) ON INVESTMENTS | ||||||||||||
| Net realized loss from investments | (18,580,949 | ) | (8,412,837 | ) | (1,063,813 | ) | ||||||
| Net change in unrealized appreciation (depreciation) on investments | 16,200,597 | (25,585,618 | ) | (10,829,482 | ) | |||||||
| Net realized and unrealized gain (loss) on investments | (2,380,352 | ) | (33,998,455 | ) | (11,893,295 | ) | ||||||
| NET INCREASE (DECREASE) IN NET ASSETS RESULTING FROM OPERATIONS | $ | (851,073 | ) | $ | (33,429,437 | ) | $ | (8,659,619 | ) | |||
See accompanying notes to financial statements.
Saratoga Investment Corp. CLO 2013-1, Ltd.
Statements of Changes in Net Assets
| For the year ended | ||||||||||||
| February 28, 2022 | February 28, 2021 | February 29, 2020 | ||||||||||
| INCREASE (DECREASE) FROM OPERATIONS: | ||||||||||||
| Net investment income (loss) | $ | 3,233,676 | $ | (1,299,881 | ) | $ | 1,326,069 | |||||
| Net realized gain (loss) from investments | (1,063,813 | ) | (10,922,627 | ) | (4,795,185 | ) | ||||||
| Realized losses on extinguishment of debt | - | (2,988,764 | ) | - | ||||||||
| Net change in unrealized appreciation (depreciation) on investments | (10,829,482 | ) | 21,775,577 | (13,733,384 | ) | |||||||
| Net increase (decrease) in net assets resulting from operations | (8,659,619 | ) | 6,564,305 | (17,202,500 | ) | |||||||
| Total increase (decrease) in net assets | (8,659,619 | ) | 6,564,305 | (17,202,500 | ) | |||||||
| Net assets at beginning of period | (28,537,864 | ) | (35,102,169 | ) | (17,899,669 | ) | ||||||
| Net assets at end of period | $ | (37,197,483 | ) | $ | (28,537,864 | ) | $ | (35,102,169 | ) | |||
| For the years ended | ||||||||||||
| February 29, 2024 | February 28, 2023 | February 28, 2022 | ||||||||||
| INCREASE (DECREASE) FROM OPERATIONS: | ||||||||||||
| Net investment income (loss) | $ | 1,529,279 | $ | 569,018 | $ | 3,233,676 | ||||||
| Net realized gain (loss) from investments | (18,580,949 | ) | (8,412,837 | ) | (1,063,813 | ) | ||||||
| Realized losses on extinguishment of debt | - | - | - | |||||||||
| Net change in unrealized appreciation (depreciation) on investments | 16,200,597 | (25,585,618 | ) | (10,829,482 | ) | |||||||
| Net increase (decrease) in net assets resulting from operations | (851,073 | ) | (33,429,437 | ) | (8,659,619 | ) | ||||||
| Total increase (decrease) in net assets | (851,073 | ) | (33,429,437 | ) | (8,659,619 | ) | ||||||
| Net assets at beginning of period | (70,626,920 | ) | (37,197,483 | ) | (28,537,864 | ) | ||||||
| Net assets at end of period | $ | (71,477,993 | ) | $ | (70,626,920 | ) | $ | (37,197,483 | ) | |||
See accompanying notes to financial statements.
Saratoga Investment Corp.
CLO 2013-1, Ltd.
Statements of Cash Flows
| For the year ended | ||||||||||||
| February 28, 2022 | February 28, 2021 | February 29, 2020 | ||||||||||
| Operating activities | ||||||||||||
| NET INCREASE (DECREASE) IN NET ASSETS RESULTING FROM OPERATIONS | $ | (8,659,619 | ) | $ | 6,564,305 | $ | (17,202,500 | ) | ||||
| ADJUSTMENTS TO RECONCILE NET INCREASE (DECREASE) IN NET ASSETS RESULTING | ||||||||||||
| FROM OPERATIONS TO NET CASH PROVIDED BY (USED IN) OPERATING ACTIVITIES: | ||||||||||||
| Payment-in-kind and other adjustments to cost | (609,083 | ) | 261,032 | 386,212 | ||||||||
| Net accretion of discount on investments | (3,151,234 | ) | (2,346,642 | ) | (1,623,059 | ) | ||||||
| Amortization of discount and deferred debt financing costs | 4,418,481 | 3,211,790 | 2,751,310 | |||||||||
| Realized Loss on extinguishment of debt | - | 2,988,764 | - | |||||||||
| Net realized (gain) loss from investments | 1,063,813 | 10,922,627 | 4,795,185 | |||||||||
| Net change in unrealized (appreciation) depreciation on investments | 10,829,482 | (21,775,577 | ) | 13,733,384 | ||||||||
| Proceeds from sales and repayments of investments | 247,233,353 | 142,702,281 | 210,110,101 | |||||||||
| Purchases of investments | (302,309,641 | ) | (220,783,828 | ) | (229,996,697 | ) | ||||||
| (Increase) decrease in operating assets: | ||||||||||||
| Interest receivable | (565,523 | ) | (202,810 | ) | 809,972 | |||||||
| Receivable from open trades | (7,250,906 | ) | 8,517,946 | (2,564,391 | ) | |||||||
| Other assets | 18,801 | (34,342 | ) | (84,526 | ) | |||||||
| Increase (decrease) in operating liabilities: | ||||||||||||
| Interest and debt fees payable | 1,535,543 | (1,965,955 | ) | (2,873,284 | ) | |||||||
| Payable for open trades | (47,503,941 | ) | 29,625,097 | 10,441,224 | ||||||||
| Accrued base management fee | 65,580 | (47,511 | ) | (53,978 | ) | |||||||
| Accrued subordinated management fee | 262,325 | (190,051 | ) | (215,909 | ) | |||||||
| Accounts payable and accrued expenses | (751,044 | ) | 727,938 | (1,139,288 | ) | |||||||
| Directors fees payable | - | - | - | |||||||||
| Due to affiliate | (2,600,000 | ) | 2,600,000 | (1,673,747 | ) | |||||||
| NET CASH PROVIDED BY (USED IN) OPERATING ACTIVITIES | (107,973,613 | ) | (39,224,936 | ) | (14,399,991 | ) | ||||||
| Financing activities | ||||||||||||
| Borrowings on debt | - | 627,359,912 | 5,100,000 | |||||||||
| Paydowns on debt | - | (475,100,000 | ) | - | ||||||||
| Deferred debt financing costs paid | - | (7,970,611 | ) | (114,621 | ) | |||||||
| NET CASH PROVIDED BY (USED IN) FINANCING ACTIVITIES | - | 144,289,301 | 4,985,379 | |||||||||
| NET INCREASE (DECREASE) IN CASH AND CASH EQUIVALENTS | (107,973,613 | ) | 105,064,365 | (9,414,612 | ) | |||||||
| CASH AND CASH EQUIVALENTS, BEGINNING OF PERIOD | 114,145,406 | 9,081,041 | 18,495,653 | |||||||||
| CASH AND CASH EQUIVALENTS, END OF PERIOD | $ | 6,171,793 | $ | 114,145,406 | $ | 9,081,041 | ||||||
| Supplemental Information: | ||||||||||||
| Interest paid during the period | $ | 18,266,452 | $ | 24,657,347 | $ | 28,633,121 | ||||||
| For the years ended | ||||||||||||
| February 29, 2024 | February 28, 2023 | February 28, 2022 | ||||||||||
| Operating activities | ||||||||||||
| NET INCREASE (DECREASE) IN NET ASSETS RESULTING FROM OPERATIONS | $ | (851,073 | ) | $ | (33,429,437 | ) | $ | (8,659,618 | ) | |||
| ADJUSTMENTS TO RECONCILE NET INCREASE (DECREASE) IN NET ASSETS RESULTING FROM OPERATIONS TO NET CASH PROVIDED BY (USED IN) OPERATING ACTIVITIES: | ||||||||||||
| Payment-in-kind and other adjustments to cost | (960,409 | ) | (764,255 | ) | (609,083 | ) | ||||||
| Net accretion of discount on investments | (3,123,995 | ) | (2,470,677 | ) | (3,151,234 | ) | ||||||
| Amortization of discount and deferred debt financing costs | 4,430,068 | 4,418,481 | 4,418,481 | |||||||||
| Realized loss on extinguishment of debt | - | - | - | |||||||||
| Net realized (gain) loss from investments | 18,580,949 | 8,412,837 | 1,063,812 | |||||||||
| Net change in unrealized (appreciation) depreciation on investments | (16,200,597 | ) | 25,585,618 | 10,829,482 | ||||||||
| Proceeds from sales and repayments of investments | 121,049,971 | 124,326,428 | 247,233,353 | |||||||||
| Purchases of investments | (120,943,225 | ) | (122,081,068 | ) | (302,309,641 | ) | ||||||
| (Increase) decrease in operating assets: | ||||||||||||
| Interest receivable, net | (375,751 | ) | (963,864 | ) | (565,523 | ) | ||||||
| Receivable from open trades | (1,037,714 | ) | 7,325,200 | (7,250,906 | ) | |||||||
| Due from affiliate | 115,197 | (119,150 | ) | - | ||||||||
| Prepaid expenses and other assets | (52,640 | ) | (52,693 | ) | 18,801 | |||||||
| Increase (decrease) in operating liabilities: | ||||||||||||
| Interest and debt fees payable | 381,017 | 3,002,919 | 1,535,543 | |||||||||
| Payable for open trades | (12,664,764 | ) | 4,389,710 | (47,503,941 | ) | |||||||
| Accrued base management fee | (4,157 | ) | 252 | 65,580 | ||||||||
| Accrued subordinated management fee | (16,629 | ) | 1,007 | 262,325 | ||||||||
| Accounts payable and accrued expenses | 1,634 | 23,849 | (751,044 | ) | ||||||||
| Due to affiliate | - | - | (2,600,000 | ) | ||||||||
| NET CASH PROVIDED BY (USED IN) OPERATING ACTIVITIES | (11,672,118 | ) | 17,605,157 | (107,973,613 | ) | |||||||
| NET INCREASE (DECREASE) IN CASH AND CASH EQUIVALENTS | (11,672,118 | ) | 17,605,157 | (107,973,613 | ) | |||||||
| CASH AND CASH EQUIVALENTS, BEGINNING OF YEAR | 23,776,950 | 6,171,793 | 114,145,406 | |||||||||
| CASH AND CASH EQUIVALENTS, END OF YEAR | $ | 12,104,832 | $ | 23,776,950 | $ | 6,171,793 | ||||||
| Supplemental Information: | ||||||||||||
| Interest paid during the year | $ | 52,895,120 | $ | 31,003,861 | $ | 18,266,452 | ||||||
| Supplemental non-cash information: | ||||||||||||
| Paid-in-kind interest income and other adjustments to cost | $ | 960,409 | $ | 764,255 | $ | 609,083 | ||||||
| Net accretion of discount on investments | 3,123,995 | 2,470,677 | 3,151,234 | |||||||||
| Amortization of deferred debt financing costs and discount on notes | 4,430,068 | 4,418,481 | 4,418,481 | |||||||||
See accompanying notes to financial statements.
S-6
Saratoga Investment Corp. CLO 2013-1, Ltd. Schedule of Investments February Saratoga Investment Corp. CLO 2013-1, Ltd. Schedule of Investments February Saratoga Investment Corp. CLO 2013-1, Ltd. Schedule of Investments February Saratoga Investment Corp. CLO 2013-1, Ltd. Schedule of Investments February Saratoga Investment Corp. CLO 2013-1, Ltd. Schedule of Investments February Saratoga Investment Corp. CLO 2013-1, Ltd. Schedule of Investments February Saratoga Investment Corp. CLO 2013-1, Ltd. Schedule of Investments February Saratoga Investment Corp. CLO 2013-1, Ltd. Schedule of Investments February Saratoga Investment Corp. CLO 2013-1, Ltd. Schedule of Investments February Saratoga Investment Corp. CLO 2013-1, Ltd. Schedule of Investments February Saratoga Investment Corp. CLO 2013-1, Ltd. Schedule of Investments February Saratoga Investment Corp. CLO 2013-1, Ltd. Schedule of Investments February Saratoga Investment Corp. CLO 2013-1, Ltd. Schedule of Investments February Saratoga Investment Corp. CLO 2013-1, Ltd. Schedule of Investments February Saratoga Investment Corp. CLO 2013-1, Ltd. Schedule of Investments February Saratoga Investment Corp. CLO 2013-1, Ltd. Schedule of Investments February Saratoga Investment Corp. CLO 2013-1, Ltd. Schedule of Investments February Saratoga Investment Corp. CLO 2013-1, Ltd. Schedule of Investments February Saratoga Investment Corp. CLO 2013-1, Ltd. Schedule of February 29, 2024 Saratoga Investment Corp. CLO 2013-1, Ltd. Schedule of Investments February As of February 29, 2024, the investment was in default and on non-accrual status. LIBOR - London Interbank Offered Rate SOFR - Secured Overnight Financing Rate 1M USD Prime - The Prime Rate as of February See accompanying notes to financial statements. Saratoga Investment Corp. CLO Schedule of Investments February 28, Saratoga Investment Corp. CLO Schedule of Investments February 28, 2023 Saratoga Investment Corp. CLO Schedule of Investments February 28, Saratoga Investment Corp. CLO Schedule of Investments February 28, Saratoga Investment Corp. CLO Schedule of Investments February 28, Saratoga Investment Corp. CLO Schedule of Investments February 28, Saratoga Investment Corp. CLO Schedule of Investments February 28, Saratoga Investment Corp. CLO Schedule of Investments February 28, Saratoga Investment Corp. CLO Schedule of Investments February 28, Saratoga Investment Corp. CLO Schedule of Investments February 28, Saratoga Investment Corp. CLO Schedule of Investments February 28, Saratoga Investment Corp. CLO Schedule of Investments February 28, Saratoga Investment Corp. CLO 2013-1, Ltd. Schedule of Investments February 28, 2023 Saratoga Investment Corp. CLO 2013-1, Ltd. Schedule of Investments February 28, 2023 Saratoga Investment Corp. CLO 2013-1, Ltd. Schedule of Investments February 28, 2023 SOFR - Secured Overnight Financing Rate Prime—The Prime Rate as of February 28, See accompanying notes to financial statements. SARATOGA INVESTMENT CORP. CLO 2013-1, LTD. NOTES TO FINANCIAL STATEMENTS 1. Organization and Purpose Saratoga Investment Corp. CLO 2013-1, Ltd. (the “Issuer”, “we”, “our”, “us”, “CLO” On January 22, 2008, the Issuer issued $400.0 million of notes, consisting of Class A Floating Rate Senior Notes, Class B Floating Rate Senior Notes, Class C Deferrable Floating Rate Notes, Class D Deferrable Floating Rate Notes, Class E Deferrable Floating Rate Notes (collectively the “Secured Notes”), and Subordinated Notes. The notes were issued pursuant to an indenture, dated January 22, 2008 (the “Indenture”), with U.S. Bank National Association (the “Trustee”) servicing as the Trustee On October 17, 2013, in a refinancing transaction, the Issuer issued $284.9 million of notes (the “2013-1 CLO Notes”), consisting of Class X Floating Rate Senior Notes, Class A-1 Floating Rate Senior Notes, Class A-2 Floating Rate Senior Notes, Class B Floating Rate Senior Notes, Class C Deferrable Floating Rate Notes, Class D Deferrable Floating Rate Notes, Class E Deferrable Floating Rate Notes, and Class F Deferrable Floating Rate Notes. The 2013-1 CLO Notes were issued pursuant to the Indenture with the same Trustee. Proceeds of the issuance of the 2013-1 CLO Notes were used, along with existing assets held by the Trustee, to redeem all of the Secured Notes issued in 2008. On November 15, 2016, On December 14, 2018, in a refinancing transaction, the Issuer issued $509.5 million of notes (the “2013-1 Reset CLO Notes”), consisting of Class A-1FL-R-2 Floating Rate Senior Notes, Class A-1FXD-R-2 Fixed Rate Senior Notes, Class A-2-R-2 Floating Rate Senior Notes, Class B-R-2 Floating Rate Senior Notes, Class C-R-2 Deferrable Mezzanine Floating Rate Notes, Class D-R-2 Deferrable Mezzanine Floating Rate Notes, Class E-1-R-2 Deferrable Mezzanine Floating Rate Notes, Class F-R-2 Deferrable Junior Floating Rate Notes, Class G-R-2 Deferrable Junior Floating Rate Notes, and Subordinated Notes. The 2013-1 Reset CLO Notes were issued pursuant to the Indenture with the same Trustee. Proceeds of the issuance of the 2013-1 Reset CLO Notes were used along with existing assets held by the Trustee to redeem all of the Secured Notes issued in 2016. On February 26, 2021, in a refinancing transaction, the On August 9, 2021, the Company exchanged its existing $17.9 million Class F-R-3 Notes for $8.5 million Class F-1-R-3 Notes and $9.4 million Class F-2-R-3 Pursuant to an investment management agreement (the “Investment Management Agreement”), Saratoga Investment Corp. (the “Investment Manager”), provides investment management services to the Issuer, and makes day-to-day investment decisions concerning the assets of the Issuer. The Investment Manager also performs certain administrative services on behalf of the Issuer under the Investment Management Agreement. The CLO 2. Significant Accounting Policies Basis of Presentation The accompanying financial statements have been prepared in accordance with U.S. generally accepted accounting principles (“U.S. GAAP”) and are stated in U.S. dollars. The following is a summary of the significant accounting policies followed by the Issuer in the preparation of its financial statements. The Issuer is considered to be an investment company for financial reporting purposes and has applied the guidance in accordance with the Financial Accounting Standards Board (“FASB”) Accounting Standards Codification (“ASC”) Topic 946, Use of Estimates The preparation of the financial statements in conformity with U.S. GAAP requires the Investment Manager to make estimates and assumptions that affect the amounts of assets and liabilities reported and disclosed at the date of the financial statements, including the fair value of investments, and the amounts of income and expenses during the reporting period. Actual results could differ from these estimates and such differences could be material. Cash and Cash Equivalents The Issuer defines cash and cash equivalents as Valuation of Investments The Issuer accounts for its investments at fair value in accordance with the FASB ASC Topic 820, Fair Value Measurement (“ASC 820”). ASC 820 defines fair value, establishes a framework for measuring fair value, establishes a fair value hierarchy based on the quality of inputs used to measure fair value and enhances disclosure requirements for fair value measurements. ASC 820 requires the Issuer to assume that its investments are to be sold at the statement of assets and liabilities date in the principal market to independent market participants, or in the absence of a principal market, in the most advantageous market, which may be a hypothetical market. Market participants are defined as buyers and sellers in the principal or most advantageous market that are independent, knowledgeable, and willing and able to transact. Investments for which market quotations are readily available are fair valued at such market quotations obtained from independent third-party pricing services and market makers subject to any decision by the Investment Manager to approve a fair value determination to reflect significant events affecting the value of these investments. The Investment Manager values investments for which market quotations are not readily available at fair value. Determinations of fair value may involve significant judgments and estimates. The types of factors that may be considered in determining the fair value of investments include the nature and realizable value of any collateral, the portfolio company’s ability to make payments, market yield trend analysis, the markets in which the portfolio company does business, comparison to publicly traded companies, discounted cash flow and other relevant factors. Because such valuations, and particularly valuations of private investments and private companies, are inherently uncertain, they may fluctuate over short periods of time and may be based on estimates. The determination of fair value may differ materially from the values that would have been used if a ready market for these investments existed. Our net asset value could be materially affected if the determinations regarding the fair value of our investments were materially higher or lower than the values that are ultimately realized upon the disposal of such investments. Investment Transactions and Income Recognition Purchases and sales of investments and the related realized gains or losses are recorded on a trade-date basis. Interest income, adjusted for amortization of premium and accretion of discount, is recorded on an accrual basis to the extent that such amounts are expected to be collected. Loans are generally placed on non-accrual status when there is reasonable doubt that principal or interest will be collected. Payment-in-Kind Interest The Issuer holds debt investments in its portfolio that contain a payment-in-kind (“PIK”) interest provision. The PIK interest, which represents contractually deferred interest added to the investment balance that is generally due at maturity, is generally recorded on the accrual basis to the extent such amounts are expected to be collected. We stop accruing PIK interest if we do not expect the issuer to be able to pay all principal and interest when due. For the years ended February 29, 2024, February 28, 2023 and February 28, 2022 Deferred Debt Financing Costs, net The Issuer presents deferred debt financing costs on the balance sheet as a contra-liability as a direct deduction from the carrying amount of that debt liability, consistent with debt discounts. As of February 29, 2020, included in deferred debt financing costs of $2.3 million, New debt financing costs of $2.3 million were incurred with the issuance of the 2013-1 2021 Reset CLO Notes on February 26, 2021. These costs consist of structuring fees of the investment bank, rating agency and legal fees, and other various closing costs. Of that amount, $1.8 million has been capitalized and amortized using an effective yield method, as appropriate, over the life of the related notes. Management Fees The Issuer is externally managed by the Investment Manager pursuant to the Investment Management Agreement. As compensation for the performance of its obligations under the Investment Management Agreement, the Investment Manager is entitled to receive from the Issuer a base management fee (the “Base Management Fee”), a subordinated management fee (the “Subordinated Management Fee”) and an incentive management fee (the “Incentive Management Fee”). The Base Management Fee is payable in arrears quarterly (subject to availability of funds and to the satisfaction of payment obligations on the debt obligations of the Issuer (the “Priority of Payments”)) and prior to the second refinancing and the issuance of the 2013-1 Amended CLO Notes, was payable in an amount equal to 0.25% per annum of the fee basis amount at the beginning of the Collection Prior to the third refinancing of the CLO, the Incentive Management Fee equaled 20.0% of the remaining interest proceeds and principal proceeds, if any, after the Subordinated Notes have realized the Expenses The Issuer bears its own organizational and offering expenses, all expenses related to its investment program and expenses incurred in connection with its operations including, but not limited to, external legal, administrative, trustee, accounting, tax and audit expenses, costs related to trading, acquiring, monitoring or disposing of investments of the Issuer, and interest and other borrowing expenses, expenses of preparing and distributing reports, financial statements, and litigation or other extraordinary expenses. The Issuer has retained the Trustee to provide trustee services. Additionally, the Trustee performs loan administration, debt covenant compliance calculations, and monitoring and reporting services. For the years ended February Interest Expense The Issuer has issued rated and unrated notes to finance its operations. Interest on debt is calculated by the Trustee for the Issuer. Interest is accrued and generally paid quarterly. For the years ended February 29, 2024, February 28, 2023 and February 28, 2022, Risk Management In the ordinary course of its business, the Issuer manages a variety of risks, including market risk and credit risk. Market risk is the risk of potential adverse changes to the value of investments because of changes in market conditions such as interest rate movements and volatility in investment prices. Credit risk is the risk of default or non-performance by portfolio companies, equivalent to the investment’s carrying amount. The Issuer is also exposed to credit risk related to maintaining all of its cash and cash equivalents, including those in reserve accounts, at a major financial institution. The Issuer has investments in lower rated and comparable quality unrated high yield bonds and bank loans. Investments in high yield investments are accompanied by a greater degree of credit risk. The risk of loss due to default by the issuer is significantly greater for holders of high yield securities, because such investments are generally unsecured and are often subordinated to other creditors of the issuer. New Accounting Pronouncements In June 2022, the FASB issued Accounting Standards Update (“ASU”) 2022-03, Fair Value Measurement of Equity Securities Subject to Contractual Sale Restrictions (Topic 820) (“ASU 2022-03”), which clarifies that a contractual sale restriction prohibiting the sale of an equity security is a characteristic of the reporting entity holding the equity security and is not included in the equity security’s unit of account. Accordingly, an entity should not consider the contractual sale restriction when measuring the equity security’s fair value. In addition, ASU 2022-03 prohibits an entity from recognizing a contractual sale restriction as a separate unit of account. ASU 2022-03’s amendments are effective for fiscal years beginning after December 15, 2023, with early adoption permitted. We are currently evaluating the impact of the adoption of ASU 2022-03 on our consolidated financial statements. In March 2020, the FASB issued In December 2023, the FASB issued ASU 2023-09, Improvements to Income Tax Disclosures. The amendments in this update require more disaggregated information on income taxes paid. ASU 3. Fair Value Measurements As noted above, the Issuer values all investments in accordance with ASC 820. ASC 820 requires enhanced disclosures about assets and liabilities that are measured and reported at fair value. As defined in ASC 820, fair value is the price that would be received to sell an asset or paid to transfer a liability in an orderly transaction between market participants at the measurement date. ASC 820 establishes a hierarchal disclosure framework which prioritizes and ranks the level of market price observability of inputs used in measuring investments at fair value. Market price observability is affected by a number of factors, including the type of investment and the characteristics specific to the investment. Investments with readily available active quoted prices or for which fair value can be measured from actively quoted prices generally will have a higher degree of market price observability and a lesser degree of judgment used in measuring fair value. Based on the observability of the inputs used in the valuation techniques, the Issuer is required to provide disclosures on fair value measurements according to the fair value hierarchy. The fair value hierarchy ranks the observability of the inputs used to determine fair values. Investments carried at fair value are classified and disclosed in one of the following three categories: In addition to using the above inputs in investment valuations, the Issuer continues to employ the valuation policy that is consistent with ASC 820 and the Investment Company Act of 1940, as amended (“1940 Act”). The following table presents fair value measurements of investments, by major class, as of February 29, 2024, according to the fair value hierarchy: The following table presents fair value measurements of investments, by major class, as of February 28, Transfers into or out of Level 1, 2 or 3 are recognized at the reporting date. The following table provides a reconciliation of the beginning and ending balances for investments that use Level 3 inputs for the year ended February 29, 2024: The following table provides a reconciliation of the beginning and ending balances for investments that use Level 3 inputs for the year ended February 28, Purchases and other adjustments to cost include purchases of new investments at cost, effects of refinancing/restructuring, accretion/amortization of income from discount/premium on debt securities, and PIK. Sales and repayments represent net proceeds received from investments sold and principal paydowns received, during the period. Significant unobservable inputs used in the fair value measurement of the Level 3 term loans and equity include market quotations available from multiple dealers. A significant increase (decrease) in the market quote, in isolation, would result in a significantly lower (higher) fair value measurement. The valuation techniques and significant unobservable inputs used in recurring Level 3 fair value measurements of assets as of February 29, 2024 were as follows: The valuation techniques and significant unobservable inputs used in recurring Level 3 fair value measurements of assets as of February 28, 4. Financing On January 22, 2008, the Issuer issued $400.0 million of notes, consisting of Class A Floating Rate Senior Notes, Class B Floating Rate Senior Notes, Class C Deferrable Floating Rate Notes, Class D Deferrable Floating Rate Notes, Class E Deferrable Floating Rate Notes (collectively the “Secured Notes”), and Subordinated Notes. The notes were issued pursuant to the Indenture. The Secured Notes are limited recourse obligations of the Issuer. The Subordinated Notes are unsecured, limited recourse debt obligations of the Issuer. On February 26, 2021, in a refinancing transaction, the Issuer issued $722.0 million of notes consisting of Class A-1-R-3 Senior Secured Floating Rate Notes, Class A-2-R-3 Senior Secured Floating Rate Notes, Class B-FL-R-3 Senior Secured Floating Rate Notes, Class B-FXD-R-3 Senior Secured Fixed Rate Notes, Class C-FL-R-3 Deferrable Mezzanine Floating Rate Notes, Class C-FXD-R-3 Deferrable Mezzanine Fixed Rate Notes, Class D-R-3 Deferrable Mezzanine Floating Rate Notes, Class E-R-3 Deferrable Mezzanine Floating Rate Notes, Class F-R-3 Deferrable Junior Floating Rate Notes, and Subordinated Notes. Proceeds net of issue discounts were used along with existing trust assets to redeem all of the rated note classes of the 2013-1 Reset CLO Notes. The 2013-1 2021 Reset CLO Notes are limited recourse obligations of the Issuer. The Subordinated Notes are unsecured, limited recourse debt obligations of the Issuer. The relative order of seniority of payment of each class of securities is as follows: first, Class A-1-R- 3 Notes, second, Class A-2-R-3 Notes, third Class B-FL-R-3 Notes, fourth, Class B-FXD-R-3 Notes, fifth, Class C-FL-R-3 Notes, sixth, Class C-FXD-R-3 Notes, seventh, Class D-R-3 Notes, eighth, Class E-R-3 Notes, ninth, Class The table below sets forth certain information for each outstanding class of notes issued, pursuant to the loan agreements and Indenture at February 29, 2024. The table below sets forth certain information for each outstanding class of notes issued, pursuant to the loan agreements and Indenture at February 28, The following table shows the fair value of the Issuer’s debt outstanding as of February The following table shows each outstanding class of notes issued, pursuant to the Indenture, at fair value at February 28, The Indenture provides that payments on the Subordinated Notes shall rank subordinate in priority of payment to payments due on all classes of 2013-1 2021 Reset CLO Notes and subordinate in priority of payment to the payment of fees and expenses. Distributions on the Subordinated Notes are limited to the assets of the Issuer remaining after payment of all of the liabilities of the Issuer that rank senior in priority of payment to the Subordinated Notes. To the extent that the proceeds from the collateral are not sufficient to make distributions on the Subordinated Notes the Issuer will have no further obligation in respect of the Subordinated Notes. Interest proceeds and, after the 2013-1 2021 Reset CLO Notes have been paid in full, principal proceeds in each case will be distributed to the holders of the Subordinated Notes in accordance with the Indenture. Distributions, if any, on the Subordinated Notes will be payable quarterly on the 20th day of each January, April, July and October of each calendar year or, if any such day is not a business day, on the next succeeding business day (each, a “Payment Date”), commencing on the first Payment Date, and on April 20, 2033 (or if any such day is not a business day, the next succeeding business day) (the “Stated Redemption Date”) (if not redeemed prior to such date) sequentially in order of seniority. At the Stated Redemption Date, the Subordinated Notes will be redeemed after payment in full of all of the 2013-1 2021 Reset CLO Notes and the payment of all administrative and other fees and expenses. The failure to pay interest proceeds or principal proceeds to the holders of the Subordinated Notes will not be an event of default under the Indenture. As of February As of February 28, As of February 29, 2024 and February 28, 5. Income Tax Under the current laws, the Issuer is not subject to net income taxation in the United States or the Cayman Islands. Accordingly, no provision for income taxes has been made in the accompanying financial statements. Pursuant to ASC Topic 740, Accounting for Uncertainty in Income Taxes, the Issuer adopted the provisions of the FASB relating to accounting for uncertainty in income taxes which clarifies the accounting for income taxes by prescribing the minimum recognition threshold a tax position must meet before being recognized in the financial statements and applies to all open tax years as of the effective date. The Investment Manager has analyzed such tax positions for uncertain tax positions for tax years that may be open 6. Commitments and Contingencies In the ordinary course of its business, the Issuer may enter into contracts or agreements that contain indemnifications or warranties. Future events could occur that lead to the execution of these provisions against the Issuer. Based on its history and experience, the Investment Manager feels that the likelihood of such an event is remote. Therefore, the Issuer has not accrued any liabilities in connection with such indemnifications. In the ordinary course of business, the Issuer may directly or indirectly be a defendant or plaintiff in legal actions with respect to bankruptcy, insolvency or other types of proceedings. Such lawsuits may involve claims that could adversely affect the value of certain financial instruments owned by the Issuer. As of February The terms of Collateralized Debt Investments may require the Issuer to provide funding for any unfunded portion of a Collateralized Debt Investment at the request of the borrower. At February In the ordinary course of business and as permitted per the terms of the Indenture, the Issuer may acquire or sell investments to or from related parties at the fair value at such time. For the years ended February 29, 2024, February 28, The Subordinated Notes are In addition, as of February 29, 2024 and February 28, 2023, $0.01 million and $0.0 million, respectively, is included in due from affiliate are amounts reimbursable to Saratoga CLO for shared operating expenses with a related party. 8. Shareholders’ Capital Capital contributions and distributions shall be made at such time and in such amounts as determined by the Investment Manager and the Indenture. The majority holder of the Subordinated Notes has various control rights over the CLO, including the ability to call the CLO prior to its legal maturity, replace the Investment Manager under certain circumstances, and refinance any of the outstanding debt tranches. The voting structure of the Subordinated Notes may require either majority or unanimous approval depending upon the issue. The authorized share capital of the Issuer consists of 50,000 ordinary shares, 250 of which are owned by Maples Finance Limited and are held under the terms of a declaration of trust. As of February The Issuer 9. Financial Highlights The following is a schedule of financial highlights for the years ended February 29, 2024, February 28, 2023, February 28, 2022, February 28, 2021 and February 29, The Investment Manager has deemed the total return and other ratios to be not meaningful (“NM”) for the year ended February 29, 2024. As the total of the subordinated notes and retained earnings balance was negative at certain times during the year, the time-weighted rate of return methodology can result in misleading returns. With average capital balances during the year being negative, the other ratios can be misleading as well and therefore not meaningful. 10. Subsequent Events The Investment Manager has evaluated events or transactions that have occurred since February Saratoga Investment Corp. CLO 2013-1 Ltd.Schedule of InvestmentsFebruary 28, 2022Issuer Name Industry Asset Name Asset
Type Reference
Rate/Spread LIBOR Floor Current Rate
(All In) Maturity
Date Principal/
Number of Shares Cost Fair Value Fusion Connect Warrant Telecommunications Warrants Equity - - - - - 32,832 - - J Jill Common Stock Retail Common stock Equity - - - - - 2,107 - 33,691 19TH HOLDINGS GOLF, LLC Consumer goods: Durable Term Loan Loan 3M USD SOFR+ 3.25 % 0.50 % 3.75 % 2/7/2029 500,000 497,530 493,750 ADMI Corp. Healthcare & Pharmaceuticals Term Loan B Loan 1M USD LIBOR+ 2.75 % 0.00 % 2.96 % 4/30/2025 1,930,276 1,925,558 1,892,886 Adtalem Global Education Inc. Services: Business Term Loan B (02/21) Loan 1M USD LIBOR+ 4.50 % 0.75 % 5.25 % 8/11/2028 2,000,000 1,981,559 1,977,920 Aegis Sciences Corporation Healthcare & Pharmaceuticals Term Loan Loan 3M USD LIBOR+ 5.50 % 1.00 % 6.50 % 5/9/2025 2,737,038 2,723,587 2,686,403 Agiliti Health Inc. Healthcare & Pharmaceuticals Term Loan (1/19) Loan 1M USD LIBOR+ 2.75 % 0.00 % 2.88 % 1/4/2026 1,483,686 1,476,852 1,470,704 Agiliti Health Inc. Healthcare & Pharmaceuticals Term Loan (09/20) Loan 1M USD LIBOR+ 2.75 % 0.75 % 3.50 % 1/4/2026 285,714 283,586 283,571 AHEAD DB Holdings, LLC Services: Business Term Loan (04/21) Loan 3M USD LIBOR+ 3.75 % 0.75 % 4.50 % 10/18/2027 2,985,000 2,885,411 2,962,135 AI Convoy (Luxembourg) S.a.r.l. Aerospace & Defense Term Loan B (USD) Loan 6M USD LIBOR+ 3.50 % 1.00 % 4.50 % 1/18/2027 1,469,671 1,464,591 1,460,485 AIS HoldCo, LLC Services: Business Term Loan Loan 3M USD LIBOR+ 5.00 % 0.00 % 5.30 % 8/15/2025 4,789,642 4,670,148 4,705,823 Alchemy Copyrights, LLC Media: Diversified & Production Term Loan B Loan 1M USD LIBOR+ 3.00 % 0.50 % 3.50 % 3/10/2028 493,763 490,886 489,442 Alchemy US Holdco 1, LLC Metals & Mining Term Loan Loan 1M USD LIBOR+ 5.50 % 0.00 % 5.60 % 10/10/2025 1,654,803 1,640,863 1,644,874 AlixPartners, LLP Banking, Finance, Insurance & Real Estate Term Loan B (01/21) Loan 1M USD LIBOR+ 2.75 % 0.50 % 3.25 % 2/4/2028 248,125 247,608 245,217 Alkermes, Inc. Healthcare & Pharmaceuticals Term Loan B (3/21) Loan 3M USD LIBOR+ 2.50 % 0.50 % 3.00 % 3/12/2026 2,147,859 2,130,749 2,110,271 Allen Media, LLC Media: Diversified & Production Term Loan (7/21) Loan 3M USD LIBOR+ 5.50 % 0.00 % 5.72 % 2/10/2027 4,439,454 4,407,744 4,412,639 Alliant Holdings I, Inc. Banking, Finance, Insurance & Real Estate Term Loan B4 Loan 1M USD LIBOR+ 3.50 % 0.50 % 4.00 % 11/5/2027 997,500 996,393 987,944 Allied Universal Holdco LLC Services: Business Term Loan 4/21 Loan 3M USD LIBOR+ 3.75 % 0.50 % 4.25 % 5/12/2028 1,995,000 1,985,516 1,966,412 Altisource Solutions S.a r.l. Banking, Finance, Insurance & Real Estate Term Loan B (03/18) Loan 3M USD LIBOR+ 4.00 % 1.00 % 5.00 % 4/3/2024 1,223,297 1,220,031 1,102,497 Altium Packaging LLC Containers, Packaging & Glass Term Loan (01/21) Loan 1M USD LIBOR+ 2.75 % 0.50 % 3.25 % 1/29/2028 496,250 494,097 485,084 American Greetings Corporation Media: Advertising, Printing & Publishing Term Loan Loan 1M USD LIBOR+ 4.50 % 1.00 % 5.50 % 4/6/2024 3,012,861 3,011,323 3,011,355 American Trailer World Corp Automotive Term Loan Loan 1M USD LIBOR+ 3.75 % 0.75 % 4.50 % 3/3/2028 1,990,000 1,984,442 1,954,558 AmeriLife Holdings LLC Banking, Finance, Insurance & Real Estate Term Loan Loan 1M USD LIBOR+ 4.00 % 0.00 % 4.11 % 3/18/2027 1,976,415 1,967,087 1,956,651 28, 202229, 2024Issuer Name Industry Asset Name Asset
Type Reference
Rate/Spread LIBOR Floor Current Rate
(All In) Maturity
Date Principal/
Number of Shares Cost Fair Value AmWINS Group, LLC Banking, Finance, Insurance & Real Estate Term Loan 2/21 Loan 1M USD LIBOR+ 2.25 % 0.75 % 3.00 % 2/17/2028 1,980,006 1,957,163 1,946,900 Anastasia Parent LLC Consumer goods: Non-durable Term Loan Loan 3M USD LIBOR+ 3.75 % 0.00 % 3.97 % 8/11/2025 967,500 964,919 832,253 Anchor Glass Container Corporation Containers, Packaging & Glass Term Loan (07/17) Loan 3M USD LIBOR+ 2.75 % 1.00 % 3.75 % 12/7/2023 475,113 474,420 406,882 Anchor Packaging, LLC Containers, Packaging & Glass Term Loan B Loan 1M USD LIBOR+ 4.00 % 0.00 % 4.21 % 7/18/2026 987,342 979,469 972,532 ANI Pharmaceuticals, Inc. Healthcare & Pharmaceuticals Term Loan B Loan 1M USD LIBOR+ 6.00 % 0.75 % 6.75 % 11/19/2027 3,000,000 2,943,100 3,000,000 AP Core Holdings II LLC High Tech Industries Term Loan B1 Loan 1M USD LIBOR+ 5.50 % 0.75 % 6.25 % 9/1/2027 1,975,000 1,947,406 1,965,125 AP Core Holdings II LLC High Tech Industries Term Loan B2 Loan 1M USD LIBOR+ 5.50 % 0.75 % 6.25 % 9/1/2027 500,000 493,024 498,125 APi Group DE, Inc. (J2 Acquisition) Services: Business Term Loan B Loan 1M USD LIBOR+ 2.50 % 0.00 % 2.71 % 10/1/2026 1,950,000 1,942,029 1,927,575 APLP Holdings Limited Partnership Energy: Electricity Term Loan B (3/21) Loan 1M USD LIBOR+ 3.75 % 1.00 % 4.75 % 5/14/2027 828,378 821,051 826,655 Apollo Commercial Real Estate Finance, Inc. Banking, Finance, Insurance & Real Estate Term Loan B Loan 1M USD LIBOR+ 2.75 % 0.00 % 2.86 % 5/15/2026 2,969,543 2,937,176 2,887,881 Apollo Commercial Real Estate Finance, Inc. Banking, Finance, Insurance & Real Estate Term Loan B1 (2/21) Loan 1M USD LIBOR+ 3.50 % 0.50 % 4.00 % 3/6/2028 992,500 983,643 982,575 AppLovin Corporation High Tech Industries Term Loan B Loan 1M USD LIBOR+ 3.25 % 0.00 % 3.46 % 8/15/2025 989,796 989,796 982,066 AppLovin Corporation High Tech Industries Term Loan (10/21) Loan 1M USD LIBOR+ 3.00 % 0.50 % 3.50 % 10/21/2028 1,496,250 1,492,669 1,481,288 Aramark Corporation Services: Consumer Term Loan Loan 1M USD LIBOR+ 1.75 % 0.00 % 1.96 % 1/15/2027 2,331,250 2,268,549 2,279,776 Aramark Corporation Services: Consumer Term Loan B (4/21) Loan 1M USD LIBOR+ 2.50 % 0.00 % 2.71 % 4/1/2028 1,753,715 1,746,008 1,743,491 ARC FALCON I INC. Chemicals, Plastics, & Rubber Term Loan Loan 1M USD LIBOR+ 3.75 % 0.50 % 4.25 % 9/23/2028 872,611 868,610 855,526 ARC FALCON I INC. (a) Chemicals, Plastics, & Rubber Delayed Draw Term Loan Loan N/A N/A N/A N/A 9/22/2028 - (601 ) (2,494 ) Arches Buyer Inc. Services: Consumer Term Loan B Loan 1M USD LIBOR+ 3.25 % 0.50 % 3.75 % 12/6/2027 1,500,000 1,490,625 1,473,570 Issuer Name Industry Asset Name Asset
Type Reference Rate/
Spread SOFR/
LIBOR Floor Current Rate
(All In) Maturity Date Principal/
Number
of Shares Cost Fair Value Altisource Solutions S.a r.l. Banking, Finance, Insurance & Real Estate Common Stock Equity 15,981 $ - $ 44,587 Envision Parent Inc Healthcare & Pharmaceuticals Common Stock Equity 92,837 - - Envision Parent Inc Healthcare & Pharmaceuticals Warrants Equity 4,410 175,000 42,998 Isagenix International, LLC Beverage, Food & Tobacco Common Stock Equity 86,398 - - Resolute Investment Managers (American Beacon), Inc. Banking, Finance, Insurance & Real Estate Common Stock Equity 24,320 1,034,581 468,000 URS TOPCO LLC Transportation: Cargo Common Stock Equity 25,330 440,405 465,000 1011778 B.C Unltd Liability Co Beverage, Food & Tobacco Term Loan B (09/23) Loan 1M USD SOFR+ 2.25 % 0.00 % 7.58 % 9/12/2030 $ 1,447,500 1,427,292 1,440,002 19TH HOLDINGS GOLF, LLC Consumer goods: Durable Term Loan Loan 1M USD SOFR+ 3.25 % 0.50 % 8.67 % 2/7/2029 2,473,646 2,383,742 2,416,950 888 Acquisitions Limited Hotel, Gaming & Leisure Term Loan B Loan 6M USD SOFR+ 5.25 % 0.00 % 10.82 % 7/8/2028 2,472,826 2,173,473 2,418,745 Adtalem Global Education Inc. Services: Business Term Loan B Loan 1M USD SOFR+ 3.50 % 0.75 % 8.83 % 8/12/2028 582,329 578,482 583,423 Aegis Sciences Corporation Healthcare & Pharmaceuticals Term Loan Loan 3M USD SOFR+ 5.50 % 1.00 % 11.08 % 5/9/2025 2,308,370 2,303,734 2,206,410 Agiliti Health Inc. Healthcare & Pharmaceuticals Term Loan B (03/23) Loan 3M USD SOFR+ 3.00 % 0.00 % 8.33 % 5/1/2030 1,674,704 1,662,945 1,668,424 AHEAD DB Holdings, LLC Services: Business Term Loan (04/21) Loan 3M USD SOFR+ 3.75 % 0.75 % 9.20 % 10/18/2027 2,925,000 2,856,780 2,914,031 Air Canada Transportation: Consumer Term Loan B (07/21) Loan 1M USD SOFR+ 3.50 % 0.75 % 8.93 % 8/11/2028 1,970,000 1,853,394 1,970,276 AIS HoldCo, LLC Services: Business Term Loan Loan 3M USD SOFR+ 5.00 % 0.00 % 10.57 % 8/15/2025 4,551,925 4,499,117 4,392,607 AIT Worldwide Logistics Holdings, Inc. Transportation: Cargo Term Loan (04/21) Loan 1M USD SOFR+ 4.75 % 0.75 % 10.17 % 4/6/2028 2,474,684 2,334,728 2,471,590 Alchemy US Holdco 1, LLC Metals & Mining Term Loan Loan 1M USD LIBOR+ 7.32 % 0.00 % 7.42 % 10/10/2025 1,654,803 1,647,646 1,646,943 AlixPartners, LLP Banking, Finance, Insurance & Real Estate Term Loan B (01/21) Loan 1M USD SOFR+ 2.50 % 0.50 % 7.94 % 2/4/2028 243,125 242,907 243,064 Alkermes, Inc. Healthcare & Pharmaceuticals Term Loan B (3/21) Loan 1M USD SOFR+ 2.50 % 0.50 % 7.93 % 3/12/2026 2,104,577 2,095,205 2,101,947 Allen Media, LLC Media: Diversified & Production Term Loan (7/21) Loan 3M USD SOFR+ 5.50 % 0.00 % 11.00 % 2/10/2027 4,349,069 4,329,175 3,803,870 Alliant Holdings Intermediate, LLC Banking, Finance, Insurance & Real Estate Term Loan (12/23) Loan 1M USD SOFR+ 3.50 % 0.50 % 8.82 % 11/6/2030 803,044 802,787 803,197 Allied Universal Holdco LLC Services: Business Term Loan 4/21 Loan 1M USD SOFR+ 3.75 % 0.50 % 9.18 % 5/12/2028 1,955,000 1,948,856 1,945,948 Alterra Mountain Company (Intrawest Resort Holdings) Hotel, Gaming & Leisure Term Loan B Add-on Loan 1M USD SOFR+ 3.75 % 0.00 % 9.07 % 5/31/2030 250,000 250,000 250,000 28, 202229, 2024Issuer Name Industry Asset Name Asset
Type Reference
Rate/Spread LIBOR Floor Current Rate
(All In) Maturity
Date Principal/
Number of Shares Cost Fair Value Arctic Glacier U.S.A., Inc. Beverage, Food & Tobacco Term Loan (3/18) Loan 3M USD LIBOR+ 3.50 % 1.00 % 4.50 % 3/20/2024 3,350,967 3,341,474 3,103,833 Aretec Group, Inc. Banking, Finance, Insurance & Real Estate Term Loan (10/18) Loan 1M USD LIBOR+ 4.25 % 0.00 % 4.46 % 10/1/2025 2,436,164 2,430,830 2,425,518 ASP BLADE HOLDINGS, INC. Capital Equipment Term Loan Loan 1M USD LIBOR+ 4.00 % 0.50 % 4.50 % 10/7/2028 100,000 99,530 99,542 Asplundh Tree Expert, LLC Services: Business Term Loan 2/21 Loan 1M USD LIBOR+ 1.75 % 0.00 % 1.96 % 9/7/2027 987,500 983,579 973,458 AssuredPartners Capital, Inc. Banking, Finance, Insurance & Real Estate Term Loan B (2/20) Loan 1M USD LIBOR+ 3.50 % 0.00 % 3.71 % 2/12/2027 1,000,000 996,250 984,580 Assuredpartners Inc. Banking, Finance, Insurance & Real Estate Incremental Term Loan (7/21) Loan 1M USD LIBOR+ 3.50 % 0.50 % 4.00 % 2/12/2027 995,006 995,006 978,837 Assuredpartners Inc. Banking, Finance, Insurance & Real Estate Term Loan Loan 1M USD SOFR+ 3.50 % 0.50 % 4.00 % 2/12/2027 500,000 498,811 491,875 ASTRO ONE ACQUISITION CORPORATION Consumer goods: Durable Term Loan Loan 1M USD LIBOR+ 5.50 % 0.75 % 6.25 % 9/15/2028 3,000,000 2,971,643 2,968,140 Asurion, LLC Banking, Finance, Insurance & Real Estate Term Loan B6 Loan 1M USD LIBOR+ 3.13 % 0.00 % 3.33 % 11/3/2023 266,824 266,095 264,767 Asurion, LLC Banking, Finance, Insurance & Real Estate Term Loan B8 Loan 1M USD LIBOR+ 3.25 % 0.00 % 3.46 % 12/18/2026 2,995,112 2,984,120 2,939,882 ATHENAHEALTH GROUP INC. Healthcare & Pharmaceuticals Term Loan B (2/22) Loan 1M USD SOFR+ 3.50 % 0.50 % 4.00 % 2/15/2029 1,282,609 1,276,322 1,269,462 ATHENAHEALTH GROUP INC. (a) Healthcare & Pharmaceuticals Delayed Draw Term Loan (02/22) Loan N/A N/A N/A N/A 2/15/2029 - - (2,228 ) Avast Software S.R.O. (Sybil Finance) High Tech Industries Term Loan (Sybil Software) Loan 3M USD LIBOR+ 2.00 % 0.00 % 2.22 % 3/22/2028 1,925,000 1,920,766 1,916,819 Avaya, Inc. Telecommunications Term Loan B1 Loan 1M USD LIBOR+ 4.25 % 0.00 % 4.44 % 12/15/2027 1,755,766 1,747,367 1,739,859 Avaya, Inc. Telecommunications Term Loan B-2 (2/21) Loan 1M USD LIBOR+ 4.00 % 0.00 % 4.19 % 12/15/2027 1,000,000 1,000,000 988,590 Avison Young (Canada) Inc Services: Business Term Loan Loan 3M USD LIBOR+ 5.75 % 0.00 % 5.97 % 1/31/2026 3,405,995 3,370,219 3,371,935 Issuer Name Industry Asset Name Asset
Type Reference Rate/
Spread SOFR/
LIBOR Floor Current Rate
(All In) Maturity Date Principal/
Number
of Shares Cost Fair Value Altisource Solutions S.a r.l.(c) Banking, Finance, Insurance & Real Estate Term Loan B (03/18) Loan 3M USD SOFR+ 5.00 % 1.00 % 10.45 % 4/30/2025 1,110,821 1,110,656 877,549 Altium Packaging LLC Containers, Packaging & Glass Term Loan (01/21) Loan 1M USD SOFR+ 2.75 % 0.50 % 8.19 % 1/29/2028 486,250 484,910 483,819 Amer Sports Oyj (MASCOT BIDCO OY) Consumer goods: Durable USD Term Loan B (01/24) Loan 3M USD SOFR+ 3.25 % 0.00 % 8.58 % 2/7/2031 500,000 497,525 499,375 American Axle & Manufacturing Inc. Automotive Term Loan (12/22) Loan 1M USD SOFR+ 3.50 % 0.50 % 8.92 % 12/13/2029 480,000 467,515 479,798 American Greetings Corporation Media: Advertising, Printing & Publishing Term Loan (01/23) Loan 1M USD SOFR+ 6.00 % 1.00 % 11.33 % 4/5/2028 2,982,733 2,981,076 2,983,478 American Trailer World Corp Automotive Term Loan Loan 1M USD SOFR+ 3.75 % 0.75 % 9.18 % 3/3/2028 1,357,439 1,355,695 1,323,788 AmWINS Group, LLC Banking, Finance, Insurance & Real Estate Term Loan 2/21 Loan 1M USD SOFR+ 2.25 % 0.75 % 7.69 % 2/17/2028 1,940,029 1,924,089 1,930,484 Anastasia Parent LLC Consumer goods: Non-durable Term Loan Loan 3M USD SOFR+ 3.75 % 0.00 % 9.36 % 8/11/2025 947,500 946,257 681,859 Anchor Packaging, LLC Containers, Packaging & Glass Term Loan B Loan 1M USD SOFR+ 3.50 % 0.00 % 8.93 % 7/18/2026 1,959,296 1,939,016 1,955,632 ANI Pharmaceuticals, Inc. Healthcare & Pharmaceuticals Term Loan B Loan 1M USD SOFR+ 6.00 % 0.75 % 11.44 % 11/19/2027 2,940,000 2,901,304 2,940,000 AP Core Holdings II LLC High Tech Industries Term Loan B1 Loan 1M USD SOFR+ 5.50 % 0.75 % 10.94 % 9/1/2027 1,775,000 1,757,513 1,734,317 AP Core Holdings II LLC High Tech Industries Term Loan B2 Loan 1M USD SOFR+ 5.50 % 0.75 % 10.94 % 9/1/2027 500,000 495,081 487,320 APEX GROUP TREASURY LLC Banking, Finance, Insurance & Real Estate Term Loan Loan 3M USD SOFR+ 5.00 % 0.50 % 10.32 % 7/26/2028 495,000 468,246 494,381 Apollo Commercial Real Estate Finance, Inc. Banking, Finance, Insurance & Real Estate Term Loan B Loan 1M USD SOFR+ 2.75 % 0.00 % 8.19 % 5/15/2026 2,908,629 2,890,508 2,857,728 Apollo Commercial Real Estate Finance, Inc. Banking, Finance, Insurance & Real Estate Term Loan B1 (2/21) Loan 1M USD SOFR+ 3.50 % 0.50 % 8.94 % 3/6/2028 972,500 966,275 943,325 AppLovin Corporation High Tech Industries Term Loan (10/21) Loan 1M USD SOFR+ 3.00 % 0.50 % 8.43 % 10/21/2028 1,473,750 1,471,272 1,474,207 AppLovin Corporation High Tech Industries Term Loan (08/23) Loan 1M USD SOFR+ 3.00 % 0.50 % 8.43 % 8/15/2030 969,617 969,617 970,374 AqGen Ascensus, Inc. Banking, Finance, Insurance & Real Estate Term Loan Loan 1M USD SOFR+ 3.50 % 0.50 % 8.94 % 8/2/2028 500,000 496,312 496,375 Aramark Services, Inc. Services: Consumer Term Loan B (4/21) Loan 1M USD SOFR+ 2.50 % 0.00 % 7.94 % 4/1/2028 1,753,715 1,748,558 1,750,436 Aramark Services, Inc. Services: Consumer Term Loan Loan 1M USD SOFR+ 1.75 % 0.00 % 7.19 % 1/15/2027 2,331,250 2,292,785 2,324,699 28, 202229, 2024Issuer Name Industry Asset Name Asset
Type Reference
Rate/Spread LIBOR Floor Current Rate
(All In) Maturity
Date Principal/
Number of Shares Cost Fair Value Avolon TLB Borrower 1 (US) LLC Capital Equipment Term Loan B3 Loan 1M USD LIBOR+ 1.75 % 0.75 % 2.50 % 1/15/2025 1,000,000 900,020 990,630 Avolon TLB Borrower 1 (US) LLC Capital Equipment Term Loan B5 (7/21) Loan 1M USD LIBOR+ 2.25 % 0.50 % 2.75 % 12/1/2027 495,000 490,860 491,466 AZURITY PHARMACEUTICALS, INC. Healthcare & Pharmaceuticals Term Loan B Loan 3M USD LIBOR+ 6.00 % 0.75 % 6.75 % 9/20/2027 500,000 485,751 495,000 B&G Foods, Inc. Beverage, Food & Tobacco Term Loan Loan 1M USD LIBOR+ 2.50 % 0.00 % 2.71 % 10/10/2026 706,458 701,732 701,605 B.C. Unlimited Liability Co (Burger King) Beverage, Food & Tobacco Term Loan B4 Loan 1M USD LIBOR+ 1.75 % 0.00 % 1.96 % 11/19/2026 1,470,000 1,438,969 1,440,968 BAKELITE UK INTERMEDIATE LTD. Chemicals, Plastics, & Rubber Term Loan Loan 3M USD SOFR+ 4.25 % 0.00 % 4.75 % 2/1/2029 1,000,000 995,000 992,500 Baldwin Risk Partners, LLC Banking, Finance, Insurance & Real Estate Term Loan Loan 1M USD LIBOR+ 3.50 % 0.50 % 4.00 % 10/14/2027 1,238,775 1,225,981 1,222,522 Belfor Holdings Inc. Services: Consumer Term Loan Loan 1M USD LIBOR+ 3.75 % 0.00 % 3.96 % 4/6/2026 248,092 247,897 246,851 Belron Finance US LLC Automotive Term Loan B (3/21) Loan 3M USD LIBOR+ 2.75 % 0.50 % 3.25 % 4/13/2028 1,985,000 1,967,341 1,968,247 Bengal Debt Merger Sub LLC Beverage, Food & Tobacco Term Loan Loan 3M USD SOFR+ 3.25 % 0.50 % 3.75 % 1/24/2029 1,890,909 1,889,030 1,873,191 Bengal Debt Merger Sub LLC Beverage, Food & Tobacco Delayed Draw Term Loan Loan 3M USD SOFR+ 3.25 % 0.50 % 3.75 % 1/24/2029 109,091 109,048 108,069 Blackstone Mortgage Trust, Inc. Banking, Finance, Insurance & Real Estate Term Loan B Loan 1M USD LIBOR+ 2.25 % 0.00 % 2.46 % 4/23/2026 989,873 983,805 967,601 Blackstone Mortgage Trust, Inc. Banking, Finance, Insurance & Real Estate Term Loan (6/21) Loan 1M USD LIBOR+ 2.75 % 0.50 % 3.25 % 4/23/2026 1,480,053 1,470,897 1,464,335 Blucora, Inc. Services: Consumer Term Loan (11/17) Loan 3M USD LIBOR+ 4.00 % 1.00 % 5.00 % 5/22/2024 2,443,339 2,437,898 2,437,230 Blue Tree Holdings, Inc. Chemicals, Plastics, & Rubber Term Loan (2/21) Loan 3M USD LIBOR+ 2.50 % 0.00 % 2.72 % 3/4/2028 992,500 990,307 983,200 Bombardier Recreational Products, Inc. Consumer goods: Durable Term Loan (1/20) Loan 1M USD LIBOR+ 2.00 % 0.00 % 2.21 % 5/24/2027 1,470,049 1,461,460 1,442,486 Issuer Name Industry Asset Name Asset
Type Reference Rate/
Spread SOFR/
LIBOR Floor Current Rate
(All In) Maturity Date Principal/
Number
of Shares Cost Fair Value ARC FALCON I INC. Chemicals, Plastics, & Rubber Term Loan Loan 1M USD SOFR+ 3.50 % 0.50 % 8.93 % 9/23/2028 981,274 978,810 972,550 Arches Buyer Inc. Services: Consumer Term Loan B Loan 1M USD SOFR+ 3.25 % 0.50 % 8.68 % 12/6/2027 1,469,697 1,463,299 1,405,398 ARCIS GOLF LLC Services: Consumer Term Loan B Loan 1M USD SOFR+ 3.75 % 0.50 % 9.19 % 11/24/2028 497,980 493,335 498,602 Aretec Group, Inc. Banking, Finance, Insurance & Real Estate Term Loan B Loan 1M USD SOFR+ 4.50 % 0.00 % 9.93 % 8/9/2030 2,642,718 2,627,451 2,651,650 Aspire Bakeries Holdings, LLC Beverage, Food & Tobacco Term loan Loan 1M USD SOFR+ 4.25 % 0.00 % 9.57 % 12/13/2030 900,000 891,160 900,000 Asplundh Tree Expert, LLC Services: Business Term Loan 2/21 Loan 1M USD SOFR+ 1.75 % 0.00 % 7.18 % 9/7/2027 967,500 965,030 966,068 AssuredPartners Capital, Inc. Banking, Finance, Insurance & Real Estate Term Loan B (2/20) Loan 1M USD SOFR+ 3.50 % 0.00 % 8.94 % 2/12/2027 979,592 977,377 979,866 Assuredpartners Inc. Banking, Finance, Insurance & Real Estate Term Loan Loan 1M USD SOFR+ 3.50 % 0.50 % 8.83 % 2/12/2027 491,250 490,654 491,250 Assuredpartners Inc. Banking, Finance, Insurance & Real Estate Incremental Term Loan (7/21) Loan 1M USD SOFR+ 3.50 % 0.50 % 8.94 % 2/12/2027 975,000 975,000 975,000 Asurion, LLC Banking, Finance, Insurance & Real Estate Term Loan B10 Loan 1M USD SOFR+ 4.00 % 0.00 % 9.43 % 8/19/2028 1,975,000 1,895,414 1,957,719 Asurion, LLC Banking, Finance, Insurance & Real Estate Term Loan B8 Loan 1M USD SOFR+ 3.25 % 0.00 % 8.69 % 12/18/2026 2,934,604 2,928,879 2,915,442 ATHENAHEALTH GROUP INC. Healthcare & Pharmaceuticals Term Loan B (2/22) Loan 1M USD SOFR+ 3.25 % 0.50 % 8.58 % 2/15/2029 1,317,171 1,313,077 1,304,619 Avolon TLB Borrower 1 (US) LLC Capital Equipment Term Loan B6 Loan 1M USD SOFR+ 2.00 % 0.00 % 7.32 % 6/22/2028 1,483,750 1,429,872 1,483,038 Axalta Coating Systems US Holdings Chemicals, Plastics, & Rubber Term Loan B (08/23) Loan 3M USD SOFR+ 2.50 % 0.50 % 7.85 % 12/20/2029 867,888 860,595 868,183 AZURITY PHARMACEUTICALS, INC. Healthcare & Pharmaceuticals Term Loan B Loan 1M USD SOFR+ 6.62 % 0.75 % 12.06 % 9/20/2027 450,000 440,909 445,500 B&G Foods, Inc. Beverage, Food & Tobacco Term Loan Loan 1M USD SOFR+ 2.50 % 0.00 % 7.83 % 10/10/2026 556,042 553,804 553,540 BAKELITE UK INTERMEDIATE LTD. Chemicals, Plastics, & Rubber Term Loan Loan 3M USD SOFR+ 4.00 % 0.50 % 9.50 % 5/29/2029 985,000 981,238 980,075 Baldwin Risk Partners, LLC Banking, Finance, Insurance & Real Estate Term Loan Loan 1M USD SOFR+ 3.50 % 0.50 % 8.94 % 10/14/2027 1,960,048 1,946,212 1,946,171 28, 202229, 2024Issuer Name Industry Asset Name Asset
Type Reference
Rate/Spread LIBOR Floor Current Rate
(All In) Maturity
Date Principal/
Number of Shares Cost Fair Value Boxer Parent Company, Inc. High Tech Industries Term Loan (2/21) Loan 3M USD LIBOR+ 3.75 % 0.00 % 3.97 % 10/2/2025 522,846 522,846 516,310 Bracket Intermediate Holding Corp Healthcare & Pharmaceuticals Term Loan Loan 3M USD LIBOR+ 4.25 % 0.00 % 4.47 % 9/5/2025 967,500 964,897 959,034 BrightSpring Health Services (Phoenix Guarantor) Healthcare & Pharmaceuticals Term Loan B-3 Loan 1M USD LIBOR+ 3.50 % 0.00 % 3.66 % 3/5/2026 992,500 992,500 980,342 BroadStreet Partners, Inc. Banking, Finance, Insurance & Real Estate Term Loan B3 Loan 1M USD LIBOR+ 3.00 % 0.00 % 3.21 % 1/22/2027 2,979,108 2,973,591 2,930,697 Brookfield WEC Holdings Inc. Energy: Electricity Term Loan (1/21) Loan 1M USD LIBOR+ 2.75 % 0.50 % 3.25 % 8/1/2025 1,477,538 1,479,743 1,453,528 Buckeye Partners, L.P. Utilities: Oil & Gas Term Loan (1/21) Loan 1M USD LIBOR+ 2.25 % 0.00 % 2.36 % 11/1/2026 1,970,088 1,958,262 1,946,565 BW Gas & Convenience Holdings LLC Beverage, Food & Tobacco Term Loan B Loan 1M USD LIBOR+ 3.50 % 0.50 % 4.00 % 3/31/2028 2,487,500 2,465,358 2,475,063 Callaway Golf Company Retail Term Loan B Loan 1M USD LIBOR+ 4.50 % 0.00 % 4.71 % 1/4/2026 682,500 673,958 681,005 CareerBuilder, LLC Services: Business Term Loan Loan 3M USD LIBOR+ 6.75 % 1.00 % 7.75 % 7/31/2023 5,393,388 5,246,921 4,159,650 CareStream Health, Inc. Healthcare & Pharmaceuticals Term Loan Loan 6M USD LIBOR+ 6.75 % 1.00 % 7.75 % 5/8/2023 2,184,163 2,181,757 2,184,163 Casa Systems, Inc Telecommunications Term Loan Loan 1M USD LIBOR+ 4.00 % 1.00 % 5.00 % 12/20/2023 1,391,125 1,387,217 1,349,391 Castle US Holding Corporation Media: Advertising, Printing & Publishing Term Loan B (USD) Loan 3M USD LIBOR+ 3.75 % 0.00 % 3.97 % 1/27/2027 1,980,130 1,968,915 1,934,864 CBI BUYER, INC. Consumer goods: Durable Term Loan Loan 3M USD LIBOR+ 3.25 % 0.50 % 3.75 % 1/6/2028 995,000 992,948 963,906 CCC Intelligent Solutions Inc. Services: Business Term Loan B Loan 3M USD LIBOR+ 2.50 % 0.50 % 3.00 % 9/16/2028 250,000 249,432 246,875 CCI Buyer, Inc Telecommunications Term Loan Loan 3M USD LIBOR+ 3.75 % 0.75 % 4.50 % 12/17/2027 248,125 246,017 245,257 CCRR Parent, Inc. Healthcare & Pharmaceuticals Term Loan B Loan 3M USD LIBOR+ 3.75 % 0.75 % 4.50 % 3/5/2028 992,500 988,070 986,297 CCS-CMGC Holdings, Inc. Healthcare & Pharmaceuticals Term Loan Loan 1M USD LIBOR+ 5.50 % 0.00 % 5.71 % 9/25/2025 2,425,000 2,412,003 2,371,456 Cengage Learning, Inc. Media: Advertising, Printing & Publishing Term Loan B (6/21) Loan 6M USD LIBOR+ 4.75 % 1.00 % 5.75 % 7/14/2026 2,992,500 2,966,179 2,985,019 Issuer Name Industry Asset Name Asset
Type Reference Rate/
Spread SOFR/
LIBOR Floor Current Rate
(All In) Maturity Date Principal/
Number
of Shares Cost Fair Value Barnes Group Inc. Aerospace & Defense Term Loan B Loan 1M USD SOFR+ 3.00 % 0.00 % 8.43 % 8/9/2030 249,375 247,649 249,500 Bausch Health Companies Inc. Healthcare & Pharmaceuticals Term Loan B (1/22) Loan 1M USD SOFR+ 5.25 % 0.50 % 10.67 % 2/1/2027 1,850,000 1,710,365 1,465,552 Belfor Holdings Inc. Services: Consumer Term Loan B-1 (11/23) Loan 1M USD SOFR+ 3.75 % 0.50 % 9.08 % 10/25/2030 1,600,000 1,584,928 1,602,000 Belron Finance US LLC Automotive Term Loan B Loan 3M USD SOFR+ 2.00 % 0.50 % 7.58 % 4/13/2028 1,945,000 1,945,000 1,943,172 Belron Finance US LLC Automotive Term Loan B Loan 3M USD SOFR+ 2.25 % 0.50 % 7.66 % 4/18/2029 248,750 248,750 248,544 Bengal Debt Merger Sub LLC Beverage, Food & Tobacco Term Loan Loan 3M USD SOFR+ 3.25 % 0.50 % 8.70 % 1/24/2029 1,970,000 1,969,251 1,852,785 Blackstone Mortgage Trust, Inc. Banking, Finance, Insurance & Real Estate Term Loan (6/21) Loan 1M USD SOFR+ 2.75 % 0.50 % 8.19 % 4/23/2026 1,450,228 1,444,650 1,439,352 Blackstone Mortgage Trust, Inc. Banking, Finance, Insurance & Real Estate Term Loan B Loan 1M USD SOFR+ 2.25 % 0.00 % 7.69 % 4/23/2026 969,620 966,168 962,348 Blue Tree Holdings, Inc. Chemicals, Plastics, & Rubber Term Loan (2/21) Loan 3M USD SOFR+ 2.50 % 0.00 % 8.11 % 3/4/2028 972,500 971,083 967,229 Bombardier Recreational Products, Inc. Consumer goods: Durable Term Loan Loan 1M USD SOFR+ 2.75 % 0.00 % 8.08 % 1/22/2031 1,440,189 1,436,033 1,437,942 Bombardier Recreational Products, Inc. Consumer goods: Durable Term Loan B3 Loan 1M USD SOFR+ 2.75 % 0.50 % 8.18 % 12/13/2029 493,769 482,991 493,833 Boost Newco Borrower, LLC (Worldpay) Banking, Finance, Insurance & Real Estate Term Loan B Loan 1M USD SOFR+ 3.00 % 0.50 % 8.33 % 1/31/2031 500,000 497,629 501,460 Boxer Parent Company, Inc. High Tech Industries Term Loan USD (11/23) Loan 1M USD SOFR+ 4.25 % 0.00 % 9.58 % 12/29/2028 1,012,255 1,007,334 1,015,018 BrightSpring Health Services (Phoenix Guarantor) Healthcare & Pharmaceuticals Term Loan (02/24) Loan 1M USD SOFR+ 3.25 % 0.00 % 8.58 % 2/21/2031 972,500 972,500 961,355 BroadStreet Partners, Inc. Banking, Finance, Insurance & Real Estate Term Loan B3 Loan 1M USD SOFR+ 3.00 % 0.00 % 8.44 % 1/22/2027 2,918,464 2,915,588 2,913,007 Brookfield WEC Holdings Inc. Energy: Electricity Term Loan B Loan 1M USD SOFR+ 2.75 % 0.00 % 8.08 % 1/17/2031 1,447,688 1,447,688 1,442,028 BROWN GROUP HOLDING, LLC Aerospace & Defense Term Loan B-2 Loan 1M USD SOFR+ 3.00 % 0.00 % 8.33 % 7/1/2029 493,750 483,706 492,856 Buckeye Partners, L.P. Utilities: Oil & Gas Term Loan B2 Loan 1M USD SOFR+ 2.50 % 0.00 % 7.83 % 11/15/2030 333,333 332,779 333,393 Buckeye Partners, L.P. Utilities: Oil & Gas Term Loan B 3 Loan 1M USD SOFR+ 2.00 % 0.00 % 7.33 % 11/1/2026 1,595,639 1,589,524 1,595,910 BW Gas & Convenience Holdings LLC Beverage, Food & Tobacco Term Loan B Loan 1M USD SOFR+ 3.50 % 0.50 % 8.94 % 3/31/2028 2,437,500 2,421,791 2,400,938 28, 202229, 2024Issuer Name Industry Asset Name Asset
Type Reference
Rate/Spread LIBOR Floor Current Rate
(All In) Maturity
Date Principal/
Number of Shares Cost Fair Value CENTURI GROUP, INC. Construction & Building Term Loan B Loan 1M USD LIBOR+ 2.50 % 0.50 % 3.00 % 8/27/2028 931,998 923,210 923,647 CenturyLink, Inc. Telecommunications Term Loan B (1/20) Loan 1M USD LIBOR+ 2.25 % 0.00 % 2.46 % 3/15/2027 3,929,899 3,924,411 3,823,045 Chemours Company, (The) Chemicals, Plastics, & Rubber Term Loan Loan 1M USD LIBOR+ 1.75 % 0.00 % 1.96 % 4/3/2025 915,661 880,331 896,780 Churchill Downs Incorporated Hotel, Gaming & Leisure Term Loan B1 (3/21) Loan 1M USD LIBOR+ 2.00 % 0.00 % 2.21 % 3/17/2028 496,250 495,147 489,427 CIMPRESS PUBLIC LIMITED COMPANY Media: Advertising, Printing & Publishing USD Term Loan Loan 1M USD LIBOR+ 3.50 % 0.50 % 4.00 % 5/17/2028 995,000 986,097 987,538 CITADEL SECURITIES LP Banking, Finance, Insurance & Real Estate Term Loan B (01/21) Loan 1M USD SOFR+ 2.50 % 0.00 % 2.69 % 2/2/2028 4,962,500 4,957,863 4,911,089 Clarios Global LP Automotive Term Loan B1 Loan 1M USD LIBOR+ 3.25 % 0.00 % 3.46 % 4/30/2026 1,267,812 1,259,559 1,253,549 Claros Mortgage Trust, Inc Banking, Finance, Insurance & Real Estate Term Loan B-1 (11/21) Loan 1M USD SOFR+ 4.50 % 0.50 % 5.00 % 8/9/2026 3,474,709 3,452,852 3,457,336 Cole Haan Consumer goods: Non-durable Term Loan B Loan 3M USD LIBOR+ 5.50 % 0.00 % 6.01 % 2/7/2025 925,000 919,273 811,688 Columbus McKinnon Corporation Capital Equipment Term Loan (4/21) Loan 3M USD LIBOR+ 2.75 % 0.50 % 3.25 % 5/14/2028 487,192 486,099 482,929 Compass Power Generation, LLC Utilities: Electric Term Loan B (08/18) Loan 1M USD LIBOR+ 3.50 % 1.00 % 4.50 % 12/20/2024 1,707,152 1,704,898 1,686,120 Conduent, Inc. Services: Business Term Loan B Loan 1M USD LIBOR+ 4.25 % 0.50 % 4.75 % 10/16/2028 1,000,000 990,409 990,310 Connect Finco SARL Telecommunications Term Loan (1/21) Loan 1M USD LIBOR+ 3.50 % 1.00 % 4.50 % 12/11/2026 2,947,500 2,823,770 2,906,972 Consolidated Communications, Inc. Telecommunications Term Loan B Loan 1M USD LIBOR+ 3.50 % 0.75 % 4.25 % 10/2/2027 714,005 705,262 704,187 CORAL-US CO-BORROWER LLC Telecommunications Term Loan B-5 Loan 1M USD LIBOR+ 2.25 % 0.00 % 2.44 % 1/31/2028 4,000,000 3,986,739 3,914,280 Issuer Name Industry Asset Name Asset
Type Reference Rate/
Spread SOFR/
LIBOR Floor Current Rate
(All In) Maturity Date Principal/
Number
of Shares Cost Fair Value Callaway Golf Company Retail Term Loan B Loan 1M USD SOFR+ 3.50 % 0.00 % 8.93 % 3/16/2030 496,250 491,660 496,200 Calpine Corporation Utilities: Electric Term Loan B-10 (01/20) Loan 3M USD LIBOR+ 2.00 % 0.00 % 3.87 % 8/12/2026 2,000,000 1,990,000 1,983,760 Camping World, Inc. Retail Term Loan B (5/21) Loan 1M USD SOFR+ 2.50 % 0.75 % 7.94 % 6/5/2028 2,462,025 2,277,630 2,401,238 CAPSTONE BORROWER INC Services: Business Term Loan (06/23) Loan 3M USD SOFR+ 3.75 % 0.00 % 9.10 % 6/15/2030 998,077 984,312 993,396 CareerBuilder, LLC Services: Business Term Loan B3 Loan 3M USD SOFR+ 6.75 % 0.00 % 12.36 % 7/31/2026 3,930,582 3,912,784 589,587 Castle US Holding Corporation Media: Advertising, Printing & Publishing Term Loan B (USD) Loan 3M USD SOFR+ 3.75 % 0.00 % 9.35 % 1/27/2027 1,946,639 1,939,553 1,354,627 CASTLELAKE AVIATION LLC Aerospace & Defense Term Loan B Loan 3M USD SOFR+ 2.75 % 0.50 % 8.40 % 10/21/2027 990,000 983,747 989,228 Catalent Pharma Solutions, Inc. Healthcare & Pharmaceuticals Term Loan B4 Loan 1M USD SOFR+ 3.00 % 0.50 % 8.32 % 2/22/2028 600,000 595,597 601,500 Catalent Pharma Solutions, Inc. Healthcare & Pharmaceuticals Term Loan B3 (2/21) Loan 1M USD SOFR+ 2.00 % 0.50 % 7.43 % 2/22/2028 598,462 587,525 597,588 CBL & Associates Limited Partnership Retail Term Loan 11/21 Loan 1M USD SOFR+ 2.75 % 1.00 % 8.19 % 11/1/2025 2,464,605 2,167,043 2,214,029 CCC Intelligent Solutions Inc. Services: Business Term Loan B Loan 1M USD SOFR+ 2.25 % 0.50 % 7.69 % 9/16/2028 245,000 244,633 244,030 CCI Buyer, Inc Telecommunications Term Loan Loan 3M USD SOFR+ 4.00 % 0.75 % 9.35 % 12/17/2027 243,125 241,678 241,195 CCRR Parent, Inc. Healthcare & Pharmaceuticals Term Loan Loan 1M USD SOFR+ 4.25 % 0.50 % 9.68 % 3/5/2028 990,000 949,452 920,700 CCRR Parent, Inc. Healthcare & Pharmaceuticals Term Loan B Loan 1M USD SOFR+ 3.75 % 0.75 % 9.19 % 3/5/2028 972,500 969,580 866,741 CCS-CMGC Holdings, Inc. Healthcare & Pharmaceuticals Term Loan Loan 1M USD SOFR+ 5.50 % 0.00 % 10.83 % 9/25/2025 2,375,000 2,368,777 1,863,520 CDK GLOBAL, INC. High Tech Industries Term Loan B (10/23) Loan 3M USD SOFR+ 4.00 % 0.00 % 9.35 % 7/6/2029 992,500 967,482 994,406 Cengage Learning, Inc. Media: Advertising, Printing & Publishing Term Loan B (6/21) Loan 3M USD SOFR+ 4.75 % 1.00 % 10.33 % 7/14/2026 2,932,500 2,917,832 2,930,682 CENTURI GROUP, INC. Construction & Building Term Loan B Loan 1M USD SOFR+ 2.50 % 0.50 % 7.94 % 8/27/2028 868,330 862,415 868,191 28, 202229, 2024Issuer Name Industry Asset Name Asset
Type Reference
Rate/Spread LIBOR Floor Current Rate
(All In) Maturity
Date Principal/
Number of Shares Cost Fair Value CoreCivic, Inc. Banking, Finance, Insurance & Real Estate Term Loan (12/19) Loan 1M USD LIBOR+ 4.50 % 1.00 % 5.50 % 12/18/2024 1,872,727 1,852,319 1,857,127 Corelogic, Inc. Services: Business Term Loan (4/21) Loan 1M USD LIBOR+ 3.50 % 0.50 % 4.00 % 6/2/2028 2,493,750 2,482,238 2,459,461 Cortes NP Acquisition Corp (Vertiv) Capital Equipment Term Loan 2/21 Loan 1M USD LIBOR+ 2.75 % 0.00 % 2.86 % 3/2/2027 1,980,000 1,980,000 1,913,175 COWEN INC. Banking, Finance, Insurance & Real Estate Term Loan Loan 6M USD LIBOR+ 3.25 % 0.00 % 4.00 % 3/24/2028 3,967,481 3,944,804 3,898,050 CROCS INC Consumer goods: Durable Term Loan Loan 3M USD SOFR+ 3.50 % 0.50 % 4.03 % 1/26/2029 1,000,000 995,000 987,500 Cross Financial Corp Banking, Finance, Insurance & Real Estate Term Loan B (3/21) Loan 6M USD LIBOR+ 4.00 % 0.75 % 4.81 % 9/15/2027 497,500 497,013 495,634 Crown Subsea Communications Holding, Inc. Construction & Building Term Loan (4/21) Loan 1M USD LIBOR+ 4.75 % 0.75 % 5.50 % 4/27/2027 2,404,110 2,382,506 2,402,114 CSC Holdings LLC (Neptune Finco Corp.) Media: Broadcasting & Subscription Term Loan B (03/17) Loan 1M USD LIBOR+ 2.25 % 0.00 % 2.44 % 7/15/2025 1,934,010 1,919,923 1,873,263 CSC Holdings LLC (Neptune Finco Corp.) Media: Broadcasting & Subscription Term Loan B Loan 1M USD LIBOR+ 2.25 % 0.00 % 2.44 % 1/15/2026 485,000 484,359 469,946 CSC Holdings LLC (Neptune Finco Corp.) Media: Broadcasting & Subscription Term Loan B-5 Loan 1M USD LIBOR+ 2.50 % 0.00 % 2.69 % 4/15/2027 490,000 490,000 475,035 CTS Midco, LLC High Tech Industries Term Loan B Loan 3M USD LIBOR+ 6.00 % 1.00 % 7.00 % 11/2/2027 1,980,000 1,929,799 1,952,775 Daseke Inc Transportation: Cargo Term Loan 2/21 Loan 1M USD LIBOR+ 4.00 % 0.75 % 4.75 % 3/5/2028 1,488,750 1,482,131 1,473,863 DCert Buyer, Inc. High Tech Industries Term Loan Loan 1M USD LIBOR+ 4.00 % 0.00 % 4.21 % 10/16/2026 1,484,887 1,484,887 1,477,046 Dealer Tire, LLC Automotive Term Loan B-1 Loan 1M USD LIBOR+ 4.25 % 0.00 % 4.46 % 12/12/2025 2,940,000 2,935,370 2,926,211 Delek US Holdings, Inc. Utilities: Oil & Gas Term Loan B Loan 1M USD LIBOR+ 2.25 % 0.00 % 2.46 % 3/31/2025 6,315,361 6,274,862 6,148,699 DexKo Global, Inc. (Dragon Merger) Automotive Term Loan (9/21) Loan 3M USD LIBOR+ 3.75 % 0.50 % 4.25 % 10/4/2028 840,000 836,119 828,450 DexKo Global, Inc. (Dragon Merger) (a) Automotive Delayed Draw Term Loan (9/21) Loan 3M USD LIBOR+ 3.75 % 0.50 % 4.25 % 10/4/2028 130,905 134,906 132,706 Diamond Sports Group, LLC (b) Media: Broadcasting & Subscription Term Loan Loan Prime+ 2.25 % 0.00 % 5.50 % 8/24/2026 3,408,970 2,964,398 1,264,728 Issuer Name Industry Asset Name Asset
Type Reference Rate/
Spread SOFR/
LIBOR Floor Current Rate
(All In) Maturity Date Principal/
Number
of Shares Cost Fair Value CenturyLink, Inc. Telecommunications Term Loan B (1/20) Loan 1M USD SOFR+ 2.25 % 0.00 % 7.69 % 3/15/2027 3,838,165 3,835,627 2,781,480 Charlotte Buyer, Inc. Services: Business Term Loan B Loan 1M USD SOFR+ 5.25 % 0.50 % 10.57 % 2/11/2028 1,485,000 1,404,122 1,487,866 Chemours Company, (The) Chemicals, Plastics, & Rubber Term Loan B2 Loan 1M USD SOFR+ 3.50 % 0.50 % 8.83 % 8/10/2028 2,393,717 2,355,365 2,345,842 Churchill Downs Incorporated Hotel, Gaming & Leisure Term Loan B1 (3/21) Loan 1M USD SOFR+ 2.00 % 0.00 % 7.43 % 3/17/2028 486,250 485,591 485,642 CIMPRESS PUBLIC LIMITED COMPANY Media: Advertising, Printing & Publishing USD Term Loan Loan 1M USD SOFR+ 3.50 % 0.50 % 8.94 % 5/17/2028 1,959,849 1,885,810 1,951,676 CITADEL SECURITIES LP Banking, Finance, Insurance & Real Estate Term Loan B (01/24) Loan 1M USD SOFR+ 2.25 % 0.00 % 7.58 % 7/29/2030 4,863,365 4,862,868 4,857,286 Citco Funding LLC Banking, Finance, Insurance & Real Estate Term Loa 1st Lien Incremental Loan 3M USD SOFR+ 3.25 % 0.50 % 8.57 % 4/27/2028 997,500 992,828 997,919 Clarios Global LP Automotive Term Loan (12/23) Loan 1M USD SOFR+ 3.00 % 0.00 % 8.33 % 5/6/2030 1,197,000 1,191,616 1,196,629 Claros Mortgage Trust, Inc Banking, Finance, Insurance & Real Estate Term Loan B-1 (11/21) Loan 1M USD SOFR+ 4.50 % 0.50 % 9.92 % 8/9/2026 3,404,430 3,390,583 3,132,076 CLYDESDALE ACQUISITION HOLDINGS, INC. Containers, Packaging & Glass Term Loan B Loan 1M USD SOFR+ 3.68 % 0.50 % 9.10 % 4/13/2029 1,477,500 1,448,088 1,475,343 Columbus McKinnon Corporation Capital Equipment Term Loan (4/21) Loan 3M USD SOFR+ 2.75 % 0.50 % 8.39 % 5/14/2028 406,951 406,326 407,207 Conduent, Inc. Services: Business Term Loan B Loan 1M USD SOFR+ 4.25 % 0.50 % 9.69 % 10/16/2028 2,762,330 2,701,073 2,702,470 Connect Finco SARL Telecommunications Term Loan (1/21) Loan 1M USD SOFR+ 3.50 % 1.00 % 8.83 % 12/11/2026 2,887,500 2,809,993 2,882,678 Consolidated Communications, Inc. Telecommunications Term Loan B Loan 1M USD SOFR+ 3.50 % 0.75 % 8.94 % 10/2/2027 2,714,005 2,553,865 2,544,379 CORAL-US CO-BORROWER LLC Telecommunications Term Loan B-5 Loan 1M USD SOFR+ 2.25 % 0.00 % 7.68 % 1/31/2028 4,000,000 3,990,860 3,950,000 Corelogic, Inc. Services: Business Term Loan (4/21) Loan 1M USD SOFR+ 3.50 % 0.50 % 8.94 % 6/2/2028 2,443,750 2,436,006 2,372,344 Cortes NP Acquisition Corp (Vertiv) Capital Equipment Term Loan B (12/23) Loan 1M USD SOFR+ 2.50 % 0.00 % 7.94 % 3/2/2027 1,940,138 1,940,138 1,941,903 Creative Artists Agency, LLC Media: Diversified & Production Term Loan B (02/23) Loan 1M USD SOFR+ 3.50 % 0.00 % 8.83 % 11/27/2028 1,588,004 1,577,748 1,588,449 CROCS INC Consumer goods: Durable Term Loan B (01/24) Loan 1M USD SOFR+ 2.25 % 0.50 % 7.58 % 2/19/2029 1,230,000 1,190,854 1,230,923 Cross Financial Corp Banking, Finance, Insurance & Real Estate Term Loan B2 Loan 1M USD SOFR+ 3.50 % 0.75 % 8.83 % 9/15/2027 487,500 487,355 486,891 28, 202229, 2024Issuer Name Industry Asset Name Asset
Type Reference
Rate/Spread LIBOR Floor Current Rate
(All In) Maturity
Date Principal/
Number of Shares Cost Fair Value DIRECTV FINANCING, LLC Media: Broadcasting & Subscription Term Loan Loan 3M USD LIBOR+ 5.00 % 0.75 % 5.75 % 8/2/2027 3,910,000 3,874,543 3,896,823 Dispatch Acquisition Holdings, LLC Environmental Industries Term Loan B (3/21) Loan 3M USD LIBOR+ 4.25 % 0.75 % 5.00 % 3/25/2028 497,500 493,121 493,769 DOMTAR CORPORATION Forest Products & Paper Term Loan 9/21 Loan 1M USD LIBOR+ 5.50 % 0.75 % 6.25 % 11/30/2028 840,645 832,557 837,140 DRI HOLDING INC. Media: Advertising, Printing & Publishing Term Loan (12/21) Loan 1M USD LIBOR+ 5.25 % 0.50 % 5.75 % 12/15/2028 3,000,000 2,970,701 2,944,500 DRW Holdings, LLC Banking, Finance, Insurance & Real Estate Term Loan (2/21) Loan 1M USD LIBOR+ 3.75 % 0.00 % 3.96 % 3/1/2028 6,500,000 6,454,552 6,467,500 DTZ U.S. Borrower, LLC Construction & Building Term Loan Loan 1M USD LIBOR+ 2.75 % 0.00 % 2.96 % 8/21/2025 3,876,012 3,865,362 3,838,880 EAB Global, Inc. Services: Business Term Loan (08/21) Loan 6M USD LIBOR+ 3.50 % 0.50 % 4.00 % 8/16/2028 1,000,000 995,320 989,250 Echo Global Logistics, Inc. Services: Business Term Loan Loan 1M USD LIBOR+ 3.75 % 0.50 % 4.25 % 11/23/2028 2,000,000 1,995,444 1,978,500 Edelman Financial Group Inc., The Banking, Finance, Insurance & Real Estate Term Loan B (3/21) Loan 1M USD LIBOR+ 3.50 % 0.75 % 4.25 % 4/7/2028 2,210,766 2,203,181 2,190,603 Electrical Components Inter., Inc. Capital Equipment Term Loan (6/18) Loan 1M USD LIBOR+ 4.25 % 0.00 % 4.46 % 6/26/2025 1,903,934 1,903,934 1,874,575 ELECTRON BIDCO INC. Healthcare & Pharmaceuticals Term Loan Loan 1M USD LIBOR+ 3.25 % 0.50 % 3.75 % 11/1/2028 500,000 497,610 494,455 ELO Touch Solutions, Inc. Media: Diversified & Production Term Loan (12/18) Loan 1M USD LIBOR+ 6.50 % 0.00 % 6.71 % 12/14/2025 2,341,935 2,266,272 2,334,137 Embecta Corp Healthcare & Pharmaceuticals Term Loan B Loan 3M USD SOFR+ 3.00 % 0.50 % 3.50 % 1/26/2029 750,000 746,250 742,688 Endo Luxembourg Finance Company I S.a.r.l. Healthcare & Pharmaceuticals Term Loan (3/21) Loan 3M USD LIBOR+ 5.00 % 0.75 % 5.75 % 3/27/2028 2,347,110 2,338,792 2,264,421 Endure Digital, Inc. High Tech Industries Term Loan B Loan 6M USD LIBOR+ 3.50 % 0.75 % 4.25 % 2/10/2028 2,487,500 2,476,721 2,394,219 Enterprise Merger Sub Inc. Healthcare & Pharmaceuticals Term Loan B (06/18) Loan 1M USD LIBOR+ 3.75 % 0.00 % 3.96 % 10/10/2025 4,850,000 4,844,205 3,516,638 Equiniti Group PLC Services: Business Term Loan B Loan 3M USD LIBOR+ 4.50 % 0.50 % 5.00 % 12/11/2028 500,000 495,392 497,085 EyeCare Partners, LLC Healthcare & Pharmaceuticals Term Loan Loan 3M USD LIBOR+ 3.75 % 0.00 % 3.97 % 2/18/2027 1,967,959 1,967,595 1,945,820 Issuer Name Industry Asset Name Asset
Type Reference Rate/
Spread SOFR/
LIBOR Floor Current Rate
(All In) Maturity Date Principal/
Number
of Shares Cost Fair Value Crown Subsea Communications Holding, Inc. Construction & Building Term Loan B (01/24) Loan 3M USD SOFR+ 4.75 % 0.75 % 10.07 % 1/30/2031 2,400,000 2,376,371 2,409,000 CSC Holdings LLC (Neptune Finco Corp.) Media: Broadcasting & Subscription Term Loan B-5 Loan 1M USD LIBOR+ 2.50 % 0.00 % 7.93 % 4/15/2027 480,000 480,000 448,277 CSC Holdings LLC (Neptune Finco Corp.) Media: Broadcasting & Subscription Term Loan 12/22 Loan 1M USD SOFR+ 4.50 % 0.00 % 9.82 % 4/15/2027 2,376,032 2,368,120 2,307,222 CTC Holdings, LP Banking, Finance, Insurance & Real Estate Term Loan B Loan 3M USD SOFR+ 5.00 % 0.50 % 10.48 % 2/15/2029 2,210,625 2,165,966 2,194,045 CTS Midco, LLC High Tech Industries Term Loan B Loan 3M USD SOFR+ 6.00 % 1.00 % 11.57 % 11/2/2027 1,937,017 1,903,074 1,830,481 Daseke Inc Transportation: Cargo Term Loan 2/21 Loan 1M USD SOFR+ 4.00 % 0.75 % 9.44 % 3/5/2028 1,162,500 1,159,080 1,162,860 Dave & Buster’s Inc. Hotel, Gaming & Leisure Term Loan B (1/24) Loan 1M USD SOFR+ 3.25 % 0.50 % 8.63 % 6/29/2029 990,019 949,041 990,791 DCert Buyer, Inc. High Tech Industries Term Loan Loan 1M USD SOFR+ 4.00 % 0.00 % 9.33 % 10/16/2026 1,454,660 1,454,660 1,442,426 Delek US Holdings, Inc. Utilities: Oil & Gas Term Loan B (11/22) Loan 1M USD SOFR+ 3.50 % 0.50 % 8.93 % 11/16/2029 5,346,000 5,244,974 5,325,952 Delos Aircraft DAC Transportation: Consumer Term Loan B Loan 3M USD SOFR+ 2.00 % 0.00 % 7.35 % 10/31/2027 250,000 250,000 250,438 Delta 2 Lux Sarl Hotel, Gaming & Leisure Term Loan B Loan 3M USD SOFR+ 2.25 % 0.50 % 7.60 % 1/15/2030 2,000,000 1,991,389 1,997,000 Derby Buyer LLC Chemicals, Plastics, & Rubber Term Loan (09/23) Loan 1M USD SOFR+ 4.25 % 0.50 % 9.58 % 11/1/2030 625,000 616,061 625,394 DexKo Global, Inc. (Dragon Merger) Automotive Term Loan (9/21) Loan 3M USD SOFR+ 3.75 % 0.50 % 9.36 % 10/4/2028 982,500 979,722 978,206 DG Investment Intermediate Holdings 2, Inc. Aerospace & Defense Incremental Term Loan (3/22) Loan 1M USD SOFR+ 4.75 % 0.75 % 10.08 % 3/31/2028 493,750 477,680 492,051 Diamond Sports Group, LLC Media: Broadcasting & Subscription 1st Priority Term Loan Loan 1M USD SOFR+ 10.00 % 1.00 % 15.43 % 5/25/2026 152,224 149,462 146,896 DIRECTV FINANCING, LLC Media: Broadcasting & Subscription Term Loan Loan 3M USD SOFR+ 5.25 % 0.75 % 10.83 % 8/2/2029 3,190,000 3,169,423 3,181,036 DISCOVERY PURCHASER CORPORATION Chemicals, Plastics, & Rubber Term Loan Loan 3M USD SOFR+ 4.38 % 0.50 % 9.71 % 10/4/2029 1,485,028 1,383,712 1,476,207 Dispatch Acquisition Holdings, LLC Environmental Industries Term Loan B (3/21) Loan 3M USD SOFR+ 4.25 % 0.75 % 9.75 % 3/25/2028 487,500 484,443 452,463 DOMTAR CORPORATION Forest Products & Paper Term Loan 9/21 Loan 1M USD SOFR+ 5.50 % 0.75 % 10.94 % 11/30/2028 3,243,968 3,187,785 3,163,874 DOTDASH MEREDITH, INC. Media: Advertising, Printing & Publishing Term Loan B Loan 1M USD SOFR+ 4.00 % 0.50 % 9.43 % 11/30/2028 1,974,747 1,809,468 1,955,000 DRI HOLDING INC. Media: Advertising, Printing & Publishing Term Loan (12/21) Loan 1M USD SOFR+ 5.25 % 0.50 % 10.68 % 12/15/2028 3,932,462 3,808,999 3,605,596 DRW Holdings, LLC Banking, Finance, Insurance & Real Estate Term Loan (2/21) Loan 1M USD SOFR+ 3.75 % 0.00 % 9.19 % 3/1/2028 6,370,000 6,338,820 6,354,075 28, 202229, 2024Issuer Name Industry Asset Name Asset
Type Reference Rate/
Spread SOFR/
LIBOR Floor Current Rate
(All In) Maturity Date Principal/
Number
of Shares Cost Fair Value DTZ U.S. Borrower, LLC Construction & Building Term Loan Loan 1M USD SOFR+ 2.75 % 0.00 % 8.19 % 8/21/2025 198,929 198,685 198,432 DTZ U.S. Borrower, LLC Construction & Building Term Loan (01/23) Loan 1M USD SOFR+ 3.25 % 0.50 % 8.68 % 1/31/2030 2,024,241 2,022,091 1,999,788 DTZ U.S. Borrower, LLC Construction & Building Term Loan (08/23) Loan 1M USD SOFR+ 4.00 % 0.50 % 9.33 % 1/31/2030 1,100,000 1,074,202 1,097,250 EAB Global, Inc. Services: Business Term Loan (08/21) Loan 1M USD SOFR+ 3.50 % 0.50 % 8.94 % 8/16/2028 980,000 976,771 977,344 Echo Global Logistics, Inc. Services: Business Term Loan Loan 1M USD SOFR+ 3.50 % 0.50 % 8.93 % 11/23/2028 1,965,000 1,962,209 1,926,761 Edelman Financial Group Inc., The Banking, Finance, Insurance & Real Estate Term Loan B (3/21) Loan 1M USD SOFR+ 3.50 % 0.75 % 8.94 % 4/7/2028 2,166,328 2,161,731 2,158,616 Electrical Components Inter., Inc. Capital Equipment Term Loan (6/18) Loan 1M USD SOFR+ 4.25 % 0.00 % 9.68 % 6/26/2025 1,868,421 1,868,421 1,861,415 ELECTRON BIDCO INC. Healthcare & Pharmaceuticals Term Loan Loan 1M USD SOFR+ 3.00 % 0.50 % 8.44 % 11/1/2028 491,250 489,769 490,253 ELO Touch Solutions, Inc. Media: Diversified & Production Term Loan (12/18) Loan 1M USD SOFR+ 6.50 % 0.00 % 11.94 % 12/14/2025 2,522,373 2,488,308 2,485,798 Embecta Corp Healthcare & Pharmaceuticals Term Loan B Loan 1M USD SOFR+ 3.00 % 0.50 % 8.33 % 3/30/2029 2,598,596 2,581,552 2,366,360 Emerson Climate Technologies Inc Services: Business Term Loan B (04/23) Loan 1M USD SOFR+ 2.50 % 0.00 % 7.79 % 5/31/2030 1,000,000 995,376 997,250 Endo Luxembourg Finance Company I S.a.r.l. Healthcare & Pharmaceuticals Term Loan (3/21) Loan Prime 6.00 % 0.75 % 14.50 % 3/27/2028 2,335,285 2,330,451 1,522,606 Endure Digital, Inc. High Tech Industries Term Loan B Loan 6M USD SOFR+ 3.50 % 0.75 % 9.42 % 2/10/2028 2,437,500 2,430,093 2,380,048 Entain Holdings (Gibraltar) Limited Hotel, Gaming & Leisure Term Loan B (10/22) Loan 3M USD SOFR+ 3.50 % 0.50 % 8.95 % 10/30/2029 1,487,496 1,472,128 1,489,355 EOS U.S. FINCO LLC Transportation: Cargo Term Loan Loan 3M USD SOFR+ 5.75 % 0.50 % 11.10 % 10/6/2029 975,000 908,088 871,104 Equiniti Group PLC Services: Business Term Loan B Loan 6M USD SOFR+ 4.50 % 0.50 % 9.93 % 12/11/2028 980,000 973,017 981,470 Evertec Group LLC Banking, Finance, Insurance & Real Estate Term Loan B (09/23) Loan 1M USD SOFR+ 3.50 % 0.50 % 8.83 % 10/30/2030 1,125,000 1,108,675 1,123,594 EyeCare Partners, LLC Healthcare & Pharmaceuticals Term Loan Loan 3M USD SOFR+ 3.75 % 0.00 % 9.39 % 2/18/2027 - 1,951 - Fiesta Purchaser, Inc. Beverage, Food & Tobacco First Lien TLB Loan 1M USD SOFR+ 4.00 % 0.00 % 9.32 % 2/12/2031 500,000 495,088 499,315 Finco I LLC Banking, Finance, Insurance & Real Estate Term Loan B (08/23) Loan 3M USD SOFR+ 3.00 % 0.00 % 8.31 % 6/27/2029 2,816,795 2,813,980 2,815,386 Issuer Name Industry Asset Name Asset
Type Reference
Rate/Spread LIBOR Floor Current Rate
(All In) Maturity
Date Principal/
Number of Shares Cost Fair Value Finco I LLC Banking, Finance, Insurance & Real Estate Term Loan B (9/20) Loan 1M USD LIBOR+ 2.50 % 0.00 % 2.71 % 6/27/2025 3,793,978 3,787,136 3,743,708 First Brands Group, LLC Automotive 1st Lien Term Loan (3/21) Loan 3M USD LIBOR+ 5.00 % 1.00 % 6.00 % 3/30/2027 4,962,500 4,891,260 4,925,281 First Eagle Investment Management Banking, Finance, Insurance & Real Estate Refinancing Term Loan Loan 3M USD LIBOR+ 2.50 % 0.00 % 2.72 % 2/1/2027 5,200,639 5,184,839 5,109,628 First Student Bidco Inc. Transportation: Consumer Term Loan B Loan 3M USD LIBOR+ 3.00 % 0.50 % 3.50 % 7/21/2028 730,392 725,495 719,663 First Student Bidco Inc. Transportation: Consumer Term Loan C Loan 3M USD LIBOR+ 3.00 % 0.50 % 3.50 % 7/21/2028 269,608 267,800 265,647 Fitness International, LLC (LA Fitness) Services: Consumer Term Loan B (4/18) Loan 3M USD LIBOR+ 3.25 % 1.00 % 4.25 % 4/18/2025 1,330,058 1,325,610 1,235,292 FOCUS FINANCIAL PARTNERS, LLC Banking, Finance, Insurance & Real Estate Term Loan (1/20) Loan 1M USD LIBOR+ 2.00 % 0.00 % 2.21 % 7/3/2024 494,872 494,493 488,122 Franchise Group, Inc. Services: Consumer First Out Term Loan Loan 3M USD LIBOR+ 4.75 % 0.75 % 5.50 % 3/10/2026 815,445 808,696 813,406 Franklin Square Holdings, L.P. Banking, Finance, Insurance & Real Estate Term Loan Loan 1M USD LIBOR+ 2.25 % 0.00 % 2.50 % 8/1/2025 4,353,736 4,335,125 4,310,199 Froneri International (R&R Ice Cream) Beverage, Food & Tobacco Term Loan B-2 Loan 1M USD LIBOR+ 2.25 % 0.00 % 2.46 % 1/29/2027 1,970,000 1,966,736 1,927,428 Garrett LX III S.a r.l. Automotive Dollar Term Loan Loan 3M USD LIBOR+ 3.25 % 0.50 % 3.75 % 4/28/2028 1,496,250 1,489,649 1,470,066 Gemini HDPE LLC Chemicals, Plastics, & Rubber Term Loan B (12/20) Loan 3M USD LIBOR+ 3.00 % 0.50 % 3.50 % 12/31/2027 2,392,656 2,376,261 2,370,715 General Nutrition Centers, Inc. (d) Retail Second Lien Term Loan Loan 1M USD LIBOR+ 6.00 % 0.00 % 6.11 % 10/7/2026 376,605 376,605 351,342 Genesee & Wyoming, Inc. Transportation: Cargo Term Loan (11/19) Loan 3M USD LIBOR+ 2.00 % 0.00 % 2.22 % 12/30/2026 1,473,750 1,468,685 1,451,305 GEO Group, Inc., The Banking, Finance, Insurance & Real Estate Term Loan Refinance Loan 1M USD LIBOR+ 2.00 % 0.75 % 2.75 % 3/22/2024 3,922,786 3,717,418 3,615,828 GGP Inc. Banking, Finance, Insurance & Real Estate Term Loan B Loan 1M USD LIBOR+ 2.50 % 0.00 % 2.71 % 8/27/2025 3,775,280 3,197,869 3,684,031 28, 202229, 2024Issuer Name Industry Asset Name Asset
Type Reference
Rate/Spread LIBOR Floor Current Rate
(All In) Maturity
Date Principal/
Number of Shares Cost Fair Value Gigamon Inc. Services: Business Term Loan B Loan 6M USD LIBOR+ 3.50 % 0.75 % 4.25 % 12/27/2024 2,900,607 2,887,935 2,889,730 Global Business Travel (GBT) III Inc. Hotel, Gaming & Leisure Term Loan Loan 1M USD LIBOR+ 2.50 % 0.00 % 2.71 % 8/13/2025 4,353,750 4,353,165 4,065,314 Global Tel*Link Corporation Telecommunications Term Loan B Loan 1M USD LIBOR+ 4.25 % 0.00 % 4.46 % 11/29/2025 4,938,649 4,748,435 4,788,959 Go Daddy Operating Company, LLC High Tech Industries Term Loan 2/21 Loan 1M USD LIBOR+ 2.00 % 0.00 % 2.21 % 8/10/2027 1,979,899 1,979,899 1,948,657 Go Wireless Holdings, Inc. Telecommunications Term Loan Loan 1M USD LIBOR+ 6.50 % 1.00 % 7.50 % 12/22/2024 2,846,753 2,824,354 2,828,961 GOLDEN WEST PACKAGING GROUP LLC Forest Products & Paper Term Loan (11/21) Loan 1M USD LIBOR+ 5.25 % 0.75 % 6.00 % 11/23/2027 2,000,000 1,980,672 1,980,000 Graham Packaging Co Inc Containers, Packaging & Glass Term Loan (2/21) Loan 1M USD LIBOR+ 3.00 % 0.75 % 3.75 % 8/7/2027 972,314 966,607 961,647 Great Outdoors Group, LLC Retail Term Loan B2 Loan 3M USD LIBOR+ 3.75 % 0.75 % 4.50 % 3/6/2028 990,019 985,574 984,079 Greenhill & Co., Inc. Banking, Finance, Insurance & Real Estate Term Loan B Loan 1M USD LIBOR+ 3.25 % 0.00 % 3.46 % 4/12/2024 2,844,231 2,829,223 2,826,454 Griffon Corporation Consumer goods: Durable Term Loan B Loan 3M USD SOFR+ 2.75 % 0.50 % 3.27 % 1/24/2029 250,000 249,378 248,063 Grosvenor Capital Management Holdings, LLLP Banking, Finance, Insurance & Real Estate Amendment 5 Term Loan Loan 1M USD LIBOR+ 2.50 % 0.50 % 3.00 % 2/24/2028 3,870,741 3,867,368 3,845,581 Harbor Freight Tools USA, Inc. Retail Term Loan B (06/21) Loan 1M USD LIBOR+ 2.75 % 0.50 % 3.25 % 10/19/2027 3,473,618 3,452,200 3,414,393 Harland Clarke Holdings Corp. Media: Advertising, Printing & Publishing Term Loan (08/21) Loan 3M USD LIBOR+ 7.75 % 1.00 % 8.75 % 6/16/2026 1,262,555 1,260,655 1,121,149 Helix Gen Funding, LLc Energy: Electricity Term Loan B (02/17) Loan 1M USD LIBOR+ 3.75 % 1.00 % 4.75 % 6/3/2024 226,716 226,626 218,895 Hillman Group Inc. (The) (New) Consumer goods: Durable Term Loan B-1 (2/21) Loan 1M USD LIBOR+ 2.75 % 0.50 % 3.25 % 7/14/2028 3,514,399 3,506,291 3,471,101 Hillman Group Inc. (The) (New) (a) Consumer goods: Durable Delayed Draw Term Loan (2/21) Loan 1M USD LIBOR+ 2.75 % 0.50 % 3.25 % 7/14/2028 67,342 67,342 56,947 HLF Financing SARL (Herbalife) Consumer goods: Non-durable Term Loan B (08/18) Loan 1M USD LIBOR+ 2.50 % 0.00 % 2.71 % 8/18/2025 3,550,000 3,541,488 3,505,625 Holley Purchaser, Inc Automotive Term Loan (11/21) Loan 3M USD LIBOR+ 3.75 % 0.75 % 4.50 % 11/17/2028 2,137,500 2,127,187 2,117,899 Issuer Name Industry Asset Name Asset
Type Reference Rate/
Spread SOFR/
LIBOR Floor Current Rate
(All In) Maturity Date Principal/
Number
of Shares Cost Fair Value First Brands Group, LLC Automotive 1st Lien Term Loan (3/21) Loan 3M USD SOFR+ 5.00 % 1.00 % 10.57 % 3/30/2027 4,862,500 4,816,997 4,868,578 First Eagle Investment Management Banking, Finance, Insurance & Real Estate Refinancing Term Loan Loan 3M USD SOFR+ 2.50 % 0.00 % 7.95 % 2/1/2027 5,091,652 5,082,259 5,068,332 First Student Bidco Inc. Transportation: Consumer Term Loan B Loan 3M USD SOFR+ 3.00 % 0.50 % 8.61 % 7/21/2028 715,360 711,800 709,694 First Student Bidco Inc. Transportation: Consumer Term Loan C Loan 3M USD SOFR+ 3.00 % 0.50 % 8.61 % 7/21/2028 216,966 215,877 215,248 Fitness International, LLC (LA Fitness) Services: Consumer Term Loan B (1/24) Loan 1M USD SOFR+ 5.25 % 1.00 % 10.58 % 2/5/2029 1,200,000 1,164,361 1,165,500 Flutter Financing B.V. Hotel, Gaming & Leisure Third Amendment 2028-B Term Loan Loan 3M USD SOFR+ 3.25 % 0.50 % 8.86 % 7/21/2028 309,759 304,101 310,103 Flutter Financing B.V. Hotel, Gaming & Leisure Term Loan B3 (11/23) Loan 3M USD SOFR+ 2.25 % 0.50 % 7.70 % 11/25/2030 3,000,000 2,992,850 2,984,370 FOCUS FINANCIAL PARTNERS, LLC Banking, Finance, Insurance & Real Estate Term Loan B7 Loan 1M USD SOFR+ 2.75 % 0.50 % 8.08 % 6/30/2028 1,472,388 1,458,275 1,461,345 Franchise Group, Inc. Services: Consumer First Out Term Loan Loan 6M USD SOFR+ 4.75 % 0.75 % 10.36 % 3/10/2026 799,104 795,310 703,211 Franchise Group, Inc. Services: Consumer Term Loan B Loan 3M USD SOFR+ 4.75 % 0.75 % 10.33 % 3/10/2026 2,977,500 2,874,281 2,612,756 Franklin Square Holdings, L.P. Banking, Finance, Insurance & Real Estate Term Loan Loan 1M USD SOFR+ 2.25 % 0.00 % 7.68 % 8/1/2025 4,263,723 4,255,884 4,258,394 Froneri International (R&R Ice Cream) Beverage, Food & Tobacco Term Loan B-2 Loan 1M USD SOFR+ 2.25 % 0.00 % 7.68 % 1/29/2027 1,930,000 1,928,989 1,928,340 Garrett LX III S.a r.l. Automotive Dollar Term Loan Loan 3M USD SOFR+ 3.25 % 0.50 % 8.82 % 4/30/2028 1,466,250 1,461,820 1,465,634 Gemini HDPE LLC Chemicals, Plastics, & Rubber Term Loan B (12/20) Loan 3M USD SOFR+ 3.00 % 0.50 % 8.57 % 12/31/2027 2,183,488 2,172,849 2,163,466 Genesee & Wyoming, Inc. Transportation: Cargo Term Loan (11/19) Loan 3M USD SOFR+ 2.00 % 0.00 % 7.45 % 12/30/2026 1,443,750 1,440,683 1,443,577 GGP Inc. Banking, Finance, Insurance & Real Estate Term Loan B Loan 1M USD LIBOR+ 2.50 % 0.00 % 2.96 % 8/27/2025 2,781,634 2,604,347 2,766,864 GIP Pilot Acquisition Partners, L.P. Energy: Oil & Gas Term Loan Loan 3M USD SOFR+ 3.00 % 0.00 % 8.33 % 10/4/2030 500,000 497,577 499,585 Global Tel*Link Corporation Telecommunications Term Loan B Loan 1M USD SOFR+ 4.25 % 0.00 % 9.68 % 11/29/2025 4,846,612 4,750,154 4,708,290 Go Daddy Operating Company, LLC High Tech Industries Term Loan 2/21 Loan 1M USD SOFR+ 2.00 % 0.00 % 7.44 % 8/10/2027 947,411 947,411 946,984 GOLDEN WEST PACKAGING GROUP LLC Forest Products & Paper Term Loan (11/21) Loan 1M USD SOFR+ 5.25 % 0.75 % 10.69 % 12/1/2027 1,875,000 1,862,167 1,556,250 28, 202229, 2024Issuer Name Industry Asset Name Asset
Type Reference
Rate/Spread LIBOR Floor Current Rate
(All In) Maturity
Date Principal/
Number of Shares Cost Fair Value Holley Purchaser, Inc (a) Automotive Delayed Draw Term Loan Loan 3M USD LIBOR+ 3.75 % 0.75 % 4.50 % 11/17/2028 106,875 106,875 103,602 Howden Group Holdings Banking, Finance, Insurance & Real Estate Term Loan (1/21) Loan 1M USD LIBOR+ 3.25 % 0.75 % 4.00 % 11/12/2027 2,174,152 2,164,312 2,148,192 Hudson River Trading LLC Banking, Finance, Insurance & Real Estate Term Loan (3/21) Loan 1M USD SOFR+ 3.00 % 0.00 % 3.30 % 3/17/2028 5,955,000 5,902,173 5,843,344 Idera, Inc. High Tech Industries Term Loan (02/21) Loan 6M USD LIBOR+ 3.75 % 0.75 % 4.50 % 3/2/2028 4,860,079 4,848,914 4,811,478 IMA Financial Group, Inc. Banking, Finance, Insurance & Real Estate Term Loan (10/21) Loan 1M USD LIBOR+ 3.75 % 0.50 % 4.25 % 11/1/2028 2,000,000 1,990,546 1,973,760 INDY US BIDCO, LLC Services: Business Term Loan (11/21) Loan 1M USD LIBOR+ 3.75 % 0.00 % 3.96 % 3/6/2028 2,238,141 2,237,925 2,221,355 INEOS US PETROCHEM LLC Chemicals, Plastics, & Rubber Term Loan (1/21) Loan 1M USD LIBOR+ 2.75 % 0.50 % 3.25 % 1/29/2026 995,000 991,113 983,189 Informatica Inc. High Tech Industries Term Loan B (10/21) Loan 1M USD LIBOR+ 2.75 % 0.00 % 3.00 % 10/27/2028 500,000 499,441 493,440 Ingram Micro Inc. High Tech Industries Term Loan Loan 3M USD LIBOR+ 3.50 % 0.50 % 4.00 % 6/30/2028 1,492,500 1,478,709 1,483,172 Inmar Acquisition Sub, Inc. Services: Business Term Loan B Loan 3M USD LIBOR+ 4.00 % 1.00 % 5.00 % 5/1/2024 3,386,129 3,343,519 3,356,501 Innophos, Inc. Chemicals, Plastics, & Rubber Term Loan B Loan 1M USD LIBOR+ 3.75 % 0.00 % 3.96 % 2/4/2027 491,250 489,509 487,973 INSTANT BRANDS HOLDINGS INC. Consumer goods: Durable Term Loan 4/21 Loan 3M USD LIBOR+ 5.00 % 0.75 % 5.75 % 4/7/2028 4,368,033 4,346,269 4,018,591 INSTRUCTURE HOLDINGS, INC. High Tech Industries Term Loan B Loan 3M USD LIBOR+ 2.75 % 0.50 % 3.27 % 10/21/2028 500,000 498,797 492,500 Isagenix International, LLC Beverage, Food & Tobacco Term Loan Loan 3M USD LIBOR+ 5.75 % 1.00 % 6.75 % 6/14/2025 2,427,552 2,401,608 1,775,900 Ivory Merger Sub, Inc. Healthcare & Pharmaceuticals Term Loan Loan 1M USD LIBOR+ 3.50 % 0.00 % 3.67 % 3/14/2025 2,949,539 2,931,462 2,870,285 J Jill Group, Inc Retail Priming Term Loan Loan 3M USD LIBOR+ 5.00 % 1.00 % 6.00 % 5/8/2024 1,574,907 1,573,650 1,409,542 Jane Street Group Banking, Finance, Insurance & Real Estate Term Loan (1/21) Loan 1M USD LIBOR+ 2.75 % 0.00 % 2.96 % 1/31/2028 3,960,000 3,954,873 3,906,778 Journey Personal Care Corp. Consumer goods: Non-durable Term Loan B Loan 3M USD LIBOR+ 4.25 % 0.75 % 5.00 % 3/1/2028 995,000 990,570 945,250 Issuer Name Industry Asset Name Asset
Type Reference Rate/
Spread SOFR/
LIBOR Floor Current Rate
(All In) Maturity Date Principal/
Number
of Shares Cost Fair Value GOTO GROUP, INC. High Tech Industries First Lien Term Loan Loan 1M USD SOFR+ 4.75 % 0.00 % 10.17 % 4/30/2028 1,254,792 730,596 1,198,326 GOTO GROUP, INC. High Tech Industries Second-Out Term Loan (02/24) Loan 1M USD SOFR+ 4.75 % 0.00 % 10.17 % 4/30/2028 1,732,808 1,646,943 1,199,970 Graham Packaging Co Inc Containers, Packaging & Glass Term Loan (2/21) Loan 1M USD SOFR+ 3.00 % 0.75 % 8.44 % 8/7/2027 945,831 942,144 944,554 Great Outdoors Group, LLC Retail Term Loan B2 Loan 1M USD SOFR+ 3.75 % 0.75 % 9.19 % 3/6/2028 970,169 967,400 969,994 Griffon Corporation Consumer goods: Durable Term Loan B Loan 3M USD SOFR+ 2.25 % 0.50 % 7.75 % 1/24/2029 144,063 143,842 143,838 Grosvenor Capital Management Holdings, LLLP Banking, Finance, Insurance & Real Estate Amendment 5 Term Loan Loan 1M USD SOFR+ 2.50 % 0.50 % 7.94 % 2/24/2028 2,807,931 2,806,739 2,807,061 Groupe Solmax Inc. Environmental Industries Term Loan (6/21) Loan 3M USD SOFR+ 4.75 % 0.75 % 10.36 % 5/27/2028 2,473,405 2,125,105 2,402,740 GYP HOLDINGS III CORP. Construction & Building Term Loan (1/24) Loan 1M USD SOFR+ 2.25 % 0.00 % 7.58 % 5/12/2030 249,375 248,230 249,375 Harbor Freight Tools USA, Inc. Retail Term Loan B (06/21) Loan 1M USD SOFR+ 2.75 % 0.50 % 8.19 % 10/19/2027 3,344,665 3,330,419 3,319,212 Helix Gen Funding, LLc Energy: Electricity Term Loan Loan 3M USD SOFR+ 4.75 % 1.00 % 10.10 % 12/31/2027 932,597 915,944 933,763 Hertz Corporation (The) Transportation: Consumer Term Loan B Loan 1M USD SOFR+ 3.75 % 0.00 % 9.07 % 6/30/2028 500,000 490,436 481,875 Hillman Group Inc. (The) (New) Consumer goods: Durable Term Loan B-1 (2/21) Loan 1M USD SOFR+ 2.75 % 0.50 % 8.19 % 7/14/2028 3,172,373 3,168,887 3,167,266 Hilton Domestic Operating Company Inc. Hotel, Gaming & Leisure Term Loan B 4 Loan 1M USD SOFR+ 2.00 % 0.00 % 7.42 % 11/8/2030 1,500,000 1,496,471 1,501,020 Hilton Grand Vacations Borrower LLC Hotel, Gaming & Leisure Term Loan (3/21) Loan 1M USD SOFR+ 2.75 % 0.50 % 8.19 % 8/2/2028 497,455 497,455 496,834 Hilton Grand Vacations Borrower LLC Hotel, Gaming & Leisure Term Loan B Loan 1M USD SOFR+ 2.75 % 0.00 % 8.18 % 8/2/2028 500,000 500,000 499,375 HLF Financing SARL (Herbalife) Consumer goods: Non-durable Term Loan B (08/18) Loan 1M USD SOFR+ 2.50 % 0.00 % 7.94 % 8/18/2025 3,116,400 3,113,557 3,044,598 Holley Purchaser, Inc Automotive Term Loan (11/21) Loan 1M USD SOFR+ 3.75 % 0.75 % 9.19 % 11/17/2028 2,254,003 2,247,557 2,188,795 Hudson River Trading LLC Banking, Finance, Insurance & Real Estate Term Loan (3/21) Loan 1M USD SOFR+ 3.00 % 0.00 % 8.44 % 3/17/2028 5,835,000 5,798,864 5,792,171 Hunter Douglas Inc Consumer goods: Durable Term Loan B-1 Loan 3M USD SOFR+ 3.50 % 0.50 % 8.82 % 2/26/2029 2,474,937 2,235,702 2,442,466 Hyperion Refinance S.a.r.l. Banking, Finance, Insurance & Real Estate Term Loan B Loan 3M USD SOFR+ 3.50 % 0.50 % 8.81 % 2/15/2031 3,000,000 2,985,024 2,983,440 28, 202229, 2024Issuer Name Industry Asset Name Asset
Type Reference
Rate/Spread LIBOR Floor Current Rate
(All In) Maturity
Date Principal/
Number of Shares Cost Fair Value JP Intermediate B, LLC Consumer goods: Non-durable Term Loan Loan 3M USD LIBOR+ 5.50 % 1.00 % 6.50 % 11/15/2025 4,154,019 4,125,538 3,620,933 KAR Auction Services, Inc. Automotive Term Loan B (09/19) Loan 1M USD LIBOR+ 2.25 % 0.00 % 2.50 % 9/19/2026 244,375 243,989 241,931 Klockner-Pentaplast of America, Inc. Containers, Packaging & Glass Term Loan (1/21) (USD) Loan 6M USD LIBOR+ 4.75 % 0.50 % 5.55 % 2/12/2026 1,488,750 1,482,629 1,391,981 Kodiak BP, LLC Construction & Building Term Loan Loan 3M USD LIBOR+ 3.25 % 0.75 % 4.00 % 3/13/2028 496,250 494,732 489,054 KREF Holdings X LLC Banking, Finance, Insurance & Real Estate Term Loan (11/21) Loan 3M USD LIBOR+ 3.50 % 0.50 % 4.00 % 9/1/2027 496,250 486,145 491,288 Lakeland Tours, LLC (d) Hotel, Gaming & Leisure Priority Exit PIK Term Loan (9/20) Loan 3M USD LIBOR+ 6.00 % 1.25 % 7.25 % 9/25/2023 299,904 288,132 300,054 Lakeland Tours, LLC (d) Hotel, Gaming & Leisure 2nd Out Take Back PIK Term Loan Loan 3M USD LIBOR+ 1.50 % 1.25 % 2.75 % 9/25/2025 616,465 528,040 592,115 Lakeland Tours, LLC (d) Hotel, Gaming & Leisure Third Out PIK Term Loan Loan 3M USD LIBOR+ 1.50 % 1.25 % 2.75 % 9/25/2025 818,373 540,076 720,987 Lakeland Tours, LLC (d) Hotel, Gaming & Leisure Holdco Fixed Term Loan Loan Fixed 0.00 % 0.00 % 13.25 % 9/27/2027 869,977 228,303 594,847 Lealand Finance Company B.V. (d) Energy: Oil & Gas Exit Term Loan Loan 1M USD LIBOR+ 1.00 % 0.00 % 1.21 % 6/30/2025 334,753 334,753 155,422 Learfield Communications, Inc Media: Advertising, Printing & Publishing Initial Term Loan (A-L Parent) Loan 1M USD LIBOR+ 3.25 % 1.00 % 4.25 % 12/1/2023 475,000 474,352 449,616 Lifetime Brands, Inc Consumer goods: Non-durable Term Loan B Loan 1M USD LIBOR+ 3.50 % 1.00 % 4.50 % 2/28/2025 2,694,077 2,673,038 2,667,136 Lightstone Generation LLC Energy: Electricity Term Loan B Loan 3M USD LIBOR+ 3.75 % 1.00 % 4.75 % 1/30/2024 1,322,520 1,321,594 1,099,212 Lightstone Generation LLC Energy: Electricity Term Loan C Loan 3M USD LIBOR+ 3.75 % 1.00 % 4.75 % 1/30/2024 74,592 74,542 61,997 Liquid Tech Solutions Holdings, LLC Services: Business Term Loan Loan 12M USD LIBOR+ 4.75 % 0.00 % 5.50 % 3/17/2028 995,000 991,612 991,269 LogMeIn, Inc. High Tech Industries Term Loan (8/20) Loan 1M USD LIBOR+ 4.75 % 0.00 % 4.89 % 8/31/2027 3,960,000 3,897,792 3,888,482 Issuer Name Industry Asset Name Asset
Type Reference Rate/
Spread SOFR/
LIBOR Floor Current Rate
(All In) Maturity Date Principal/
Number
of Shares Cost Fair Value Idera, Inc. High Tech Industries Term Loan (02/21) Loan 3M USD SOFR+ 3.75 % 0.75 % 9.21 % 3/2/2028 4,762,143 4,756,197 4,730,379 IMA Financial Group, Inc. Banking, Finance, Insurance & Real Estate Term Loan (10/21) Loan 1M USD SOFR+ 3.75 % 0.50 % 9.19 % 11/1/2028 2,458,728 2,449,919 2,452,581 INDY US BIDCO, LLC Services: Business Term Loan (11/21) Loan 1M USD SOFR+ 3.75 % 0.00 % 9.08 % 3/6/2028 2,193,266 2,192,568 2,119,243 INEOS 226 Ltd. Chemicals, Plastics, & Rubber Term Loan 3/23 Loan 1M USD SOFR+ 3.75 % 0.00 % 9.18 % 3/13/2030 497,500 492,907 490,450 Ineos US Finance LLC Chemicals, Plastics, & Rubber Term Loan C Loan 1M USD SOFR+ 3.50 % 0.00 % 8.93 % 2/18/2030 995,000 985,838 985,259 INEOS US PETROCHEM LLC Chemicals, Plastics, & Rubber Term Loan B Loan 1M USD SOFR+ 4.25 % 0.00 % 9.68 % 4/2/2029 2,714,874 2,657,733 2,667,363 Informatica Inc. High Tech Industries Term Loan B (10/21) Loan 1M USD SOFR+ 2.75 % 0.00 % 8.19 % 10/27/2028 491,250 491,064 491,250 Ingram Micro Inc. Wholesale Term Loan (09/23) Loan 3M USD SOFR+ 3.00 % 0.50 % 8.61 % 6/30/2028 1,095,000 1,087,525 1,093,631 Inmar, Inc. Services: Business Term Loan (06/23) Loan 1M USD SOFR+ 5.50 % 1.00 % 10.83 % 5/1/2026 3,333,250 3,240,468 3,305,117 Innophos, Inc. Chemicals, Plastics, & Rubber Term Loan B Loan 1M USD SOFR+ 3.25 % 0.00 % 8.58 % 2/4/2027 481,250 480,346 475,475 INSTANT BRANDS HOLDINGS INC. Consumer goods: Durable Instant Brands TL Loan Prime 4.00 % 0.75 % 14.50 % 4/7/2028 10,085 10,085 10,085 INSTANT BRANDS HOLDINGS INC. (b) Consumer goods: Durable Term Loan 4/21 Loan Prime 4.00 % 0.75 % 14.50 % 4/7/2028 3,942,576 3,929,234 256,267 INSTANT BRANDS HOLDINGS INC. (c) Consumer goods: Durable PIK DIP Term Loan Loan 1M USD SOFR+ 3.00 % 1.00 % 15.45 % 1/31/2024 1,523,653 1,523,115 1,557,935 IRB Holding Corporation Beverage, Food & Tobacco Term Loan B Loan 1M USD SOFR+ 2.75 % 0.75 % 8.18 % 12/15/2027 494,962 490,830 494,101 Isagenix International, LLC (c) Beverage, Food & Tobacco Term Loan Loan 6M USD SOFR+ 2.50 % 0.00 % 2.50 % 4/13/2028 1,258,790 838,779 1,082,559 Isolved Inc. Services: Business Term Loan Loan 6M USD SOFR+ 4.00 % 0.50 % 9.48 % 10/5/2030 625,000 618,886 626,563 Jane Street Group Banking, Finance, Insurance & Real Estate Term Loan Loan 1M USD SOFR+ 2.50 % 0.00 % 7.94 % 1/26/2028 3,880,000 3,878,565 3,869,602 Journey Personal Care Corp. Consumer goods: Non-durable Term Loan B Loan 1M USD SOFR+ 4.25 % 0.75 % 9.69 % 3/1/2028 2,925,000 2,876,836 2,850,647 JP Intermediate B, LLC Consumer goods: Non-durable Term Loan 7/23 Loan 3M USD SOFR+ 5.50 % 1.00 % 11.07 % 11/20/2027 3,456,884 3,442,560 276,551 Kleopatra Finco S.a r.l. Containers, Packaging & Glass Term Loan (1/21) (USD) Loan 6M USD SOFR+ 4.73 % 0.50 % 10.27 % 2/12/2026 1,458,750 1,456,824 1,400,400 28, 202229, 2024Issuer Name Industry Asset Name Asset
Type Reference
Rate/Spread LIBOR Floor Current Rate
(All In) Maturity
Date Principal/
Number of Shares Cost Fair Value LOYALTY VENTURES INC. Services: Business Term Loan B Loan 1M USD LIBOR+ 4.50 % 0.50 % 5.00 % 11/3/2027 3,340,141 3,320,925 3,294,214 LPL Holdings, Inc. Banking, Finance, Insurance & Real Estate Term Loan B1 Loan 1M USD LIBOR+ 1.75 % 0.00 % 1.86 % 11/11/2026 1,220,308 1,218,289 1,200,857 LSF11 A5 HOLDCO LLC Chemicals, Plastics, & Rubber Term Loan Loan 1M USD SOFR+ 3.75 % 0.50 % 4.25 % 10/16/2028 250,000 248,837 246,875 MA FinanceCo LLC High Tech Industries Term Loan B4 Loan 3M USD LIBOR+ 4.25 % 1.00 % 5.25 % 6/5/2025 2,234,660 2,228,836 2,208,582 MAGNITE, INC. Services: Business Term Loan Loan 6M USD LIBOR+ 5.00 % 0.75 % 5.75 % 4/28/2028 1,990,000 1,935,905 1,980,050 Marriott Ownership Resorts, Inc. Hotel, Gaming & Leisure Term Loan (11/19) Loan 1M USD LIBOR+ 1.75 % 0.00 % 1.96 % 8/29/2025 1,317,074 1,317,074 1,290,403 Match Group, Inc, The Services: Consumer Term Loan (1/20) Loan 3M USD LIBOR+ 1.75 % 0.00 % 2.22 % 2/15/2027 250,000 249,562 244,895 Mayfield Agency Borrower Inc. (FeeCo) Banking, Finance, Insurance & Real Estate Term Loan Loan 1M USD LIBOR+ 4.50 % 0.00 % 4.71 % 2/28/2025 3,392,071 3,369,794 3,375,823 McAfee, LLC Services: Business Term Loan B Loan Prime+ 2.75 % 0.00 % 6.00 % 9/30/2024 1,642,423 1,638,322 1,638,054 McGraw-Hill Education, Inc. Media: Advertising, Printing & Publishing Term Loan (07/21) Loan 3M USD LIBOR+ 4.75 % 0.50 % 5.26 % 7/28/2028 1,995,000 1,976,108 1,975,050 MedAssets Software Inter Hldg, Inc. High Tech Industries Term Loan (11/21) (USD) Loan 3M USD LIBOR+ 4.00 % 0.50 % 4.50 % 11/17/2028 500,000 492,500 496,250 Mermaid Bidco Inc. High Tech Industries Term Loan B2 Loan 3M USD LIBOR+ 3.75 % 0.75 % 4.50 % 12/22/2027 993,756 990,577 976,366 Messer Industries, LLC Chemicals, Plastics, & Rubber Term Loan B Loan 3M USD LIBOR+ 2.50 % 0.00 % 2.72 % 3/1/2026 3,381,477 3,366,633 3,341,677 Michaels Companies Inc Retail Term Loan B (Magic Mergeco) Loan 3M USD LIBOR+ 4.25 % 0.75 % 5.00 % 4/8/2028 2,492,500 2,474,302 2,312,492 Milk Specialties Company Beverage, Food & Tobacco Term Loan (6/21) Loan 3M USD LIBOR+ 4.00 % 1.00 % 5.00 % 8/15/2025 3,801,560 3,774,075 3,782,552 MJH Healthcare Holdings, LLC Healthcare & Pharmaceuticals Term Loan B (01/22) Loan 1M USD SOFR+ 3.50 % 0.50 % 4.00 % 1/28/2029 250,000 248,782 247,500 MKS Instruments, Inc. High Tech Industries Term Loan B6 Loan 1M USD LIBOR+ 1.75 % 0.00 % 1.96 % 2/2/2026 868,529 863,296 862,562 MRC Global Inc. Metals & Mining Term Loan B2 Loan 1M USD LIBOR+ 3.00 % 0.00 % 3.21 % 9/20/2024 351,484 351,116 348,848 MW Industries, Inc. (Helix Acquisition Holdings) Capital Equipment Term Loan (2019 Incremental) Loan 3M USD LIBOR+ 3.75 % 0.00 % 3.97 % 9/30/2024 2,842,097 2,812,930 2,765,730 NAB Holdings, LLC (North American Bancard) Banking, Finance, Insurance & Real Estate Term Loan (11/21) Loan 1M USD SOFR+ 3.00 % 0.50 % 3.50 % 11/17/2028 3,000,000 2,992,613 2,950,710 Natgasoline LLC Chemicals, Plastics, & Rubber Term Loan Loan 1M USD LIBOR+ 3.50 % 0.00 % 3.75 % 11/14/2025 3,472,277 3,448,686 3,411,513 National Mentor Holdings, Inc. Healthcare & Pharmaceuticals Term Loan 2/21 Loan 1M USD LIBOR+ 3.75 % 0.75 % 4.50 % 3/2/2028 2,763,891 2,753,599 2,704,771 National Mentor Holdings, Inc. Healthcare & Pharmaceuticals Term Loan C 2/21 Loan 3M USD LIBOR+ 3.75 % 0.75 % 4.50 % 3/2/2028 87,464 87,078 85,593 National Mentor Holdings, Inc. (a) Healthcare & Pharmaceuticals Delayed Draw Term Loan 2/21 Loan N/A N/A N/A N/A 3/2/2028 - - (2,758 ) Neenah, Inc. Forest Products & Paper Term Loan B (03/21) Loan 3M USD LIBOR+ 3.00 % 0.50 % 3.50 % 4/6/2028 1,990,000 1,981,133 1,960,150 NEW ERA CAP, LLC Consumer goods: Durable Term Loan (01/22) Loan 6M USD LIBOR+ 6.00 % 0.75 % 6.75 % 7/13/2027 1,000,000 998,828 997,500 Nexstar Broadcasting, Inc. (Mission Broadcasting) Media: Broadcasting & Subscription Term Loan Loan 1M USD LIBOR+ 2.50 % 0.00 % 2.61 % 9/18/2026 1,113,795 1,103,364 1,107,146 Next Level Apparel, Inc. Retail Term Loan Loan 3M USD WIBOR+ 5.50 % 1.00 % 6.50 % 8/9/2024 1,725,340 1,717,025 1,690,834 NM Z Parent Inc (Zep Inc) Chemicals, Plastics, & Rubber Term Loan Loan 12M USD LIBOR+ 4.00 % 1.00 % 5.00 % 8/9/2024 871,151 869,399 842,838 NorthPole Newco S.a.r.l (b), (d) Aerospace & Defense Term Loan Loan 3M USD LIBOR+ 7.00 % 0.00 % 7.22 % 3/3/2025 5,348,887 5,028,659 1,537,805 NortonLifeLock Inc. High Tech Industries Term Loan B Loan 3M USD SOFR+ 2.00 % 0.50 % 2.50 % 1/28/2029 1,500,000 1,492,500 1,480,620 Novae LLC Automotive Term Loan B Loan 1M USD SOFR+ 5.00 % 0.75 % 5.75 % 12/22/2028 1,555,556 1,540,210 1,540,000 Issuer Name Industry Asset Name Asset
Type Reference Rate/
Spread SOFR/
LIBOR Floor Current Rate
(All In) Maturity Date Principal/
Number
of Shares Cost Fair Value Kodiak BP, LLC Construction & Building Term Loan Loan 3M USD SOFR+ 3.25 % 0.75 % 8.86 % 3/13/2028 486,159 485,291 485,211 Koppers Inc Chemicals, Plastics, & Rubber Term Loan B Loan 1M USD SOFR+ 3.50 % 0.50 % 8.93 % 4/10/2030 995,006 967,558 998,121 KREF Holdings X LLC Banking, Finance, Insurance & Real Estate Term Loan (11/21) Loan 1M USD SOFR+ 3.50 % 0.50 % 8.93 % 9/1/2027 486,325 479,475 464,440 Lakeland Tours, LLC (c) Hotel, Gaming & Leisure Holdco Fixed Term Loan Loan Fixed 0.00 % 0.00 % 8.00 % 9/27/2027 1,127,568 568,253 761,108 Lealand Finance Company B.V. (c) Energy: Oil & Gas Exit Term Loan Loan 1M USD SOFR+ 1.00 % 0.00 % 6.44 % 6/30/2025 355,751 355,751 138,149 LHS BORROWER, LLC Construction & Building Term Loan (02/22) Loan 1M USD SOFR+ 4.75 % 0.50 % 10.18 % 2/16/2029 2,475,771 2,084,045 2,310,216 Lifetime Brands, Inc Consumer goods: Non-durable Term Loan Loan 1M USD SOFR+ 5.50 % 1.00 % 10.94 % 8/26/2027 1,659,313 1,653,207 1,595,015 Liquid Tech Solutions Holdings, LLC Services: Business Term Loan Loan 1M USD SOFR+ 4.75 % 0.75 % 10.19 % 3/17/2028 975,000 972,922 957,938 LOYALTY VENTURES INC. (b) Services: Business Term Loan B Loan Prime 5.50 % 0.50 % 14.00 % 11/3/2027 2,913,525 2,902,171 25,493 LPL Holdings, Inc. Banking, Finance, Insurance & Real Estate Term Loan B1 Loan 1M USD SOFR+ 1.75 % 0.00 % 7.18 % 11/11/2026 1,195,404 1,194,671 1,194,125 LSF11 A5 HOLDCO LLC Chemicals, Plastics, & Rubber Term Loan (01/23) Loan 1M USD SOFR+ 4.25 % 0.50 % 9.68 % 10/14/2028 1,492,500 1,473,942 1,491,754 LSF11 A5 HOLDCO LLC Chemicals, Plastics, & Rubber Term Loan Loan 1M USD SOFR+ 3.50 % 0.50 % 8.94 % 10/16/2028 245,625 244,848 244,473 LSF11 TRINITY BIDCO INC Aerospace & Defense Term Loan B Loan 1M USD SOFR+ 4.00 % 0.00 % 9.32 % 6/14/2030 980,756 967,038 980,756 LSF9 Atlantis Holdings, LLC (A Wireless) Retail Term Loan (2/24) Loan 1M USD SOFR+ 6.50 % 0.75 % 11.83 % 3/31/2029 2,775,000 2,700,276 2,775,860 MAGNITE, INC. Services: Business Term Loan B (01/24) Loan 1M USD SOFR+ 4.50 % 0.00 % 9.82 % 2/6/2031 3,250,000 3,218,266 3,241,875 Marriott Ownership Resorts, Inc. Hotel, Gaming & Leisure Term Loan (11/19) Loan 1M USD SOFR+ 1.75 % 0.00 % 7.18 % 8/29/2025 1,317,074 1,317,074 1,312,543 Match Group, Inc, The Services: Consumer Term Loan (1/20) Loan 3M USD SOFR+ 1.75 % 0.00 % 7.27 % 2/15/2027 250,000 249,741 249,063 Max US Bidco Inc. Beverage, Food & Tobacco Term Loan B Loan 3M USD SOFR+ 5.00 % 0.50 % 10.35 % 10/3/2030 2,000,000 1,870,298 1,832,500 Mayfield Agency Borrower Inc. (FeeCo) Banking, Finance, Insurance & Real Estate First Lien Term Loan B (12/23) Loan 1M USD SOFR+ 4.25 % 0.00 % 9.58 % 2/28/2028 3,432,772 3,346,276 3,432,772 McGraw-Hill Education, Inc. Media: Advertising, Printing & Publishing Term Loan (07/21) Loan 1M USD SOFR+ 4.75 % 0.50 % 10.19 % 7/28/2028 1,955,000 1,940,387 1,946,281 28, 202229, 2024Issuer Name Industry Asset Name Asset
Type Reference
Rate/Spread LIBOR Floor Current Rate
(All In) Maturity
Date Principal/
Number of Shares Cost Fair Value Novae LLC (a) Automotive Delayed Draw Term Loan Loan N/A N/A N/A N/A 12/22/2028 - - (4,444 ) Novolex Holdings, Inc (Flex Acquisition) Containers, Packaging & Glass Term Loan (02/21) Loan 3M USD LIBOR+ 3.50 % 0.50 % 4.00 % 3/2/2028 987,555 983,296 983,437 Nuvei Technologies Corp. High Tech Industries US Term Loan Loan 1M USD LIBOR+ 2.50 % 0.50 % 3.00 % 9/29/2025 2,238,750 2,234,198 2,210,766 Olaplex, Inc. Consumer goods: Non-durable Term Loan (2/22) Loan 1M USD SOFR+ 3.75 % 0.50 % 4.25 % 2/23/2029 1,000,000 997,500 996,250 Organon & Co. Healthcare & Pharmaceuticals Term Loan USD Loan 6M USD LIBOR+ 3.00 % 0.50 % 3.50 % 6/2/2028 2,410,417 2,399,629 2,397,617 Pacific Gas and Electric Company Utilities: Electric Term Loan Loan 3M USD LIBOR+ 3.00 % 0.50 % 3.50 % 6/18/2025 1,479,969 1,474,197 1,449,999 PACTIV EVERGREEN GROUP HOLDINGS INC. Containers, Packaging & Glass Term Loan B Loan 1M USD LIBOR+ 3.50 % 0.50 % 4.00 % 9/20/2028 997,500 992,792 984,473 Padagis LLC Healthcare & Pharmaceuticals Term Loan Loan 3M USD LIBOR+ 4.75 % 0.50 % 5.25 % 7/6/2028 941,176 932,470 934,118 Panther Guarantor II, L.P. (Forcepoint) High Tech Industries Term Loan 1/21 Loan 3M USD LIBOR+ 4.50 % 0.50 % 5.00 % 1/7/2028 497,500 494,346 493,520 Pathway Partners Vet Management Company LLC Services: Business Term Loan Loan 1M USD LIBOR+ 3.75 % 0.00 % 3.96 % 3/30/2027 491,473 482,640 486,804 PCI Gaming Authority Hotel, Gaming & Leisure Term Loan Loan 1M USD LIBOR+ 2.50 % 0.00 % 2.71 % 5/29/2026 809,038 806,361 800,188 PEARLS (Netherlands) Bidco B.V. Chemicals, Plastics, & Rubber USD Term Loan (02/22) Loan 3M USD SOFR+ 4.00 % 0.50 % 4.50 % 2/4/2029 1,000,000 997,500 989,580 PECF USS INTERMEDIATE HOLDING III CORPORATION Environmental Industries Term Loan B Loan 1M USD LIBOR+ 4.25 % 0.50 % 4.75 % 12/15/2028 100,000 99,777 99,391 PEDIATRIC ASSOCIATES HOLDING COMPANY, LLC Healthcare & Pharmaceuticals Term Loan (12/22) Loan 3M USD LIBOR+ 3.50 % 0.00 % 3.84 % 12/28/2028 1,302,632 1,296,159 1,291,234 PEDIATRIC ASSOCIATES HOLDING COMPANY, LLC (a) Healthcare & Pharmaceuticals Delayed Draw Term Loan (12/21) Loan N/A N/A N/A N/A 12/28/2028 - - (1,727 ) Penn National Gaming Hotel, Gaming & Leisure Term Loan B-1 Loan 1M USD LIBOR+ 2.25 % 0.75 % 3.00 % 10/15/2025 1,762,675 1,715,292 1,746,370 Peraton Corp. Aerospace & Defense Term Loan B Loan 1M USD LIBOR+ 3.75 % 0.75 % 4.50 % 2/1/2028 5,459,994 5,439,162 5,425,869 PHYSICIAN PARTNERS, LLC Healthcare & Pharmaceuticals Term Loan Loan 1M USD SOFR+ 4.00 % 0.50 % 4.50 % 12/23/2028 2,000,000 1,980,245 1,985,000 Ping Identity Corporation High Tech Industries Term Loan B (11/21) Loan 6M USD SOFR+ 3.75 % 0.50 % 4.45 % 11/22/2028 1,000,000 995,074 990,000 Pitney Bowes Inc Services: Business Term Loan B Loan 1M USD LIBOR+ 4.00 % 0.00 % 4.21 % 3/17/2028 2,977,500 2,960,793 2,944,003 Pixelle Specialty Solutions LLC Forest Products & Paper Term Loan Loan 1M USD LIBOR+ 6.50 % 1.00 % 7.50 % 10/31/2024 3,535,026 3,515,981 3,504,837 Plastipak Holdings Inc. Containers, Packaging & Glass Term Loan B (11/21) Loan 1M USD LIBOR+ 2.50 % 0.50 % 3.00 % 11/17/2028 2,000,000 1,990,299 1,974,380 Playtika Holding Corp. High Tech Industries Term Loan B (3/21) Loan 1M USD LIBOR+ 2.75 % 0.00 % 2.96 % 3/13/2028 4,466,250 4,457,371 4,415,513 PMHC II, INC. Chemicals, Plastics, & Rubber Term Loan (02/22) Loan 3M USD SOFR+ 4.25 % 0.50 % 4.75 % 2/2/2029 2,000,000 1,990,000 1,968,340 Issuer Name Industry Asset Name Asset
Type Reference Rate/
Spread SOFR/
LIBOR Floor Current Rate
(All In) Maturity Date Principal/
Number
of Shares Cost Fair Value MedAssets Software Inter Hldg, Inc. High Tech Industries Term Loan (11/21) (USD) Loan 1M USD SOFR+ 4.00 % 0.50 % 9.44 % 12/18/2028 491,250 488,835 409,275 Mermaid Bidco Inc. High Tech Industries Term Loan B2 Loan 3M USD SOFR+ 4.50 % 0.75 % 9.88 % 12/22/2027 1,966,412 1,947,595 1,968,870 Michaels Companies Inc Retail Term Loan B (Magic Mergeco) Loan 3M USD SOFR+ 4.25 % 0.75 % 9.86 % 4/8/2028 2,442,400 2,429,364 1,996,417 MKS Instruments, Inc. High Tech Industries Term Loan B Loan 1M USD SOFR+ 2.50 % 0.50 % 7.82 % 8/17/2029 1,971,537 1,967,675 1,966,253 Momentive Performance Materials Inc. Chemicals, Plastics, & Rubber Term Loan (03/23) Loan 1M USD SOFR+ 4.50 % 0.00 % 9.83 % 3/28/2028 496,250 479,007 485,084 Moneygram International, Inc. Services: Business Term Loan Loan 3M USD SOFR+ 5.50 % 0.50 % 10.88 % 5/31/2030 2,993,750 2,617,290 2,936,989 Mosel Bidco SE High Tech Industries Term Loan B Loan 3M USD SOFR+ 4.75 % 0.50 % 10.10 % 9/16/2030 500,000 495,262 500,625 MPH Acquisition Holdings LLC (Multiplan) Services: Business Term Loan B (08/21) Loan 3M USD SOFR+ 4.25 % 0.50 % 9.85 % 9/1/2028 2,962,121 2,734,973 2,861,320 NAB Holdings, LLC (North American Bancard) Banking, Finance, Insurance & Real Estate Term Loan (11/21) Loan 3M USD SOFR+ 2.75 % 0.50 % 8.25 % 11/23/2028 2,940,000 2,935,048 2,929,504 Napa Management Services Corp Healthcare & Pharmaceuticals Term Loan B (02/22) Loan 1M USD SOFR+ 5.25 % 0.75 % 10.68 % 2/22/2029 2,969,773 2,447,043 2,806,436 Natgasoline LLC Chemicals, Plastics, & Rubber Term Loan Loan 1M USD SOFR+ 3.50 % 0.00 % 8.94 % 11/14/2025 3,305,649 3,294,914 3,289,120 National Mentor Holdings, Inc. Healthcare & Pharmaceuticals Term Loan 2/21 Loan 1M USD SOFR+ 3.75 % 0.75 % 9.18 % 3/2/2028 2,708,195 2,701,639 2,522,007 National Mentor Holdings, Inc. Healthcare & Pharmaceuticals Term Loan C 2/21 Loan 3M USD SOFR+ 3.75 % 0.75 % 9.20 % 3/2/2028 87,464 87,200 81,450 New Trojan Parent, Inc. (c) Consumer goods: Durable Term Loan Loan 1M USD SOFR+ 5.25 % 0.50 % 10.69 % 1/6/2028 - 40,239 - Nexstar Broadcasting, Inc. (Mission Broadcasting) Media: Broadcasting & Subscription Term Loan Loan 1M USD SOFR+ 2.50 % 0.00 % 7.94 % 9/18/2026 657,625 654,056 655,705 Next Level Apparel, Inc. Retail Term Loan Loan 1M USD SOFR+ 7.50 % 1.00 % 12.92 % 8/9/2026 2,605,709 2,579,219 2,019,425 NortonLifeLock Inc. High Tech Industries Term Loan B Loan 1M USD SOFR+ 2.00 % 0.50 % 7.43 % 9/12/2029 997,195 993,475 994,014 Nouryon Finance B.V. Chemicals, Plastics, & Rubber Term Loan B Loan 1M USD SOFR+ 4.00 % 0.00 % 9.42 % 4/3/2028 497,500 492,525 497,192 Nouryon Finance B.V. Chemicals, Plastics, & Rubber Term Loan (05/23) Loan 3M USD SOFR+ 4.00 % 0.00 % 9.42 % 4/3/2028 498,747 494,084 498,228 Novae LLC Automotive Term Loan B Loan 3M USD SOFR+ 5.00 % 0.75 % 10.52 % 12/22/2028 1,965,000 1,954,113 1,948,632 28, 202229, 2024Issuer Name Industry Asset Name Asset
Type Reference
Rate/Spread LIBOR Floor Current Rate
(All In) Maturity
Date Principal/
Number of Shares Cost Fair Value PointClickCare Technologies, Inc. High Tech Industries Term Loan B Loan 6M USD LIBOR+ 3.00 % 0.75 % 3.75 % 12/29/2027 496,250 494,183 486,945 Polymer Process Holdings, Inc. Containers, Packaging & Glass Term Loan Loan 1M USD LIBOR+ 4.75 % 0.75 % 5.50 % 2/12/2028 5,458,750 5,404,639 5,333,635 Pre-Paid Legal Services, Inc. Services: Consumer Term Loan (12/21) Loan 3M USD LIBOR+ 3.75 % 0.50 % 4.25 % 12/15/2028 3,000,000 2,975,633 2,973,000 Presidio, Inc. Services: Business Term Loan B (1/20) Loan 1M USD LIBOR+ 3.50 % 0.00 % 3.71 % 1/22/2027 492,500 491,700 488,038 Prime Security Services Borrower, LLC (ADT) Services: Consumer Term Loan (1/21) Loan 6M USD LIBOR+ 2.75 % 0.75 % 3.50 % 9/23/2026 3,556,300 3,553,818 3,513,837 PRIORITY HOLDINGS, LLC Services: Consumer Term Loan Loan 1M USD LIBOR+ 5.75 % 1.00 % 6.75 % 4/27/2027 2,985,000 2,957,411 2,973,806 PriSo Acquisition Corporation Construction & Building Term Loan (01/21) Loan 3M USD LIBOR+ 3.25 % 0.75 % 4.00 % 12/28/2027 496,248 494,100 487,832 Project Leopard Holdings Inc High Tech Industries Term Loan Loan 6M USD LIBOR+ 4.75 % 1.00 % 5.75 % 7/5/2024 495,000 494,242 492,678 Prometric Inc. (Sarbacane Bidco) Services: Consumer Term Loan Loan 1M USD LIBOR+ 3.00 % 1.00 % 4.00 % 1/29/2025 481,388 480,315 474,017 PUG LLC Services: Consumer Term Loan B (02/20) Loan 1M USD LIBOR+ 3.50 % 0.00 % 3.71 % 2/12/2027 485,075 483,298 475,374 QUEST BORROWER LIMITED High Tech Industries Term Loan (1/22) Loan 3M USD SOFR+ 4.25 % 0.50 % 4.75 % 1/19/2029 2,000,000 1,980,237 1,968,760 Rackspace Technology Global, Inc. High Tech Industries Term Loan (1/21) Loan 1M USD LIBOR+ 2.75 % 0.75 % 3.50 % 2/15/2028 496,250 494,141 480,519 RealPage, Inc. High Tech Industries Term Loan (04/21) Loan 1M USD LIBOR+ 3.25 % 0.50 % 3.75 % 4/24/2028 997,500 995,328 985,720 Renaissance Learning, Inc. Services: Consumer Term Loan (5/18) Loan 1M USD LIBOR+ 3.25 % 0.00 % 3.46 % 5/30/2025 2,969,141 2,946,381 2,922,496 Rent-A-Center, Inc. Retail Term Loan B2 (9/21) Loan 1M USD LIBOR+ 3.25 % 0.50 % 3.81 % 2/17/2028 993,744 991,647 973,869 Research Now Group, Inc Media: Advertising, Printing & Publishing Term Loan Loan 6M USD LIBOR+ 5.50 % 1.00 % 6.50 % 12/20/2024 4,343,378 4,268,021 4,251,082 Resideo Funding Inc. Services: Consumer Term Loan (1/21) Loan 1M USD LIBOR+ 2.25 % 0.50 % 2.75 % 2/11/2028 1,488,750 1,486,251 1,481,306 Resolute Investment Managers (American Beacon), Inc. Banking, Finance, Insurance & Real Estate Term Loan (10/20) Loan 3M USD LIBOR+ 4.25 % 1.00 % 5.25 % 4/30/2024 3,084,702 3,078,180 3,067,366 Restoration Hardware, Inc. Retail Term Loan (9/21) Loan 3M USD LIBOR+ 2.50 % 0.50 % 3.00 % 10/20/2028 3,497,500 3,489,704 3,456,509 Reynolds Consumer Products LLC Containers, Packaging & Glass Term Loan Loan 1M USD LIBOR+ 1.75 % 0.00 % 1.96 % 1/29/2027 1,291,932 1,290,988 1,271,829 Reynolds Group Holdings Inc. Metals & Mining Term Loan B2 Loan 1M USD LIBOR+ 3.25 % 0.00 % 3.46 % 2/5/2026 3,465,000 3,449,546 3,406,545 Robertshaw US Holding Corp. Consumer goods: Durable Term Loan B Loan 6M USD LIBOR+ 3.50 % 1.00 % 4.50 % 2/28/2025 962,500 961,492 877,800 Rocket Software, Inc. High Tech Industries Term Loan (11/18) Loan 1M USD LIBOR+ 4.25 % 0.00 % 4.46 % 11/28/2025 2,905,190 2,897,593 2,876,138 Russell Investments US Inst'l Holdco, Inc. Banking, Finance, Insurance & Real Estate Term Loan (10/20) Loan 6M USD LIBOR+ 3.50 % 1.00 % 4.50 % 6/2/2025 5,637,965 5,601,072 5,592,185 Issuer Name Industry Asset Name Asset
Type Reference Rate/
Spread SOFR/
LIBOR Floor Current Rate
(All In) Maturity Date Principal/
Number
of Shares Cost Fair Value Nuvei Technologies Corp. High Tech Industries Term Loan B Loan 1M USD SOFR+ 3.00 % 0.50 % 8.43 % 12/19/2030 2,100,000 2,084,250 2,100,336 Olaplex, Inc. Consumer goods: Non-durable Term Loan (2/22) Loan 1M USD SOFR+ 3.50 % 0.50 % 8.93 % 2/23/2029 2,467,387 2,376,707 2,249,442 Open Text Corporation High Tech Industries Term Loan B (08/23) Loan 1M USD SOFR+ 2.75 % 0.50 % 8.18 % 1/31/2030 1,380,397 1,343,151 1,381,267 Organon & Co. Healthcare & Pharmaceuticals Term Loan USD Loan 1M USD SOFR+ 3.00 % 0.50 % 8.43 % 6/2/2028 2,118,750 2,112,577 2,120,085 Oxbow Carbon, LLC Metals & Mining Term Loan B (04/23) Loan 1M USD SOFR+ 4.00 % 0.50 % 9.43 % 5/2/2030 497,500 488,294 496,669 PACIFIC DENTAL SERVICES, LLC Healthcare & Pharmaceuticals Term Loan Loan 1M USD SOFR+ 3.50 % 0.75 % 8.94 % 4/21/2028 895,408 894,474 893,734 Pacific Gas & Electric Utilities: Electric Term Loan Loan 1M USD SOFR+ 2.50 % 0.50 % 7.83 % 6/23/2027 250,000 248,893 249,923 PACTIV EVERGREEN GROUP HOLDINGS INC. Containers, Packaging & Glass Term Loan B Loan 1M USD SOFR+ 3.25 % 0.50 % 8.69 % 9/20/2028 975,000 971,827 975,994 Padagis LLC Healthcare & Pharmaceuticals Term Loan Loan 3M USD SOFR+ 4.75 % 0.50 % 10.34 % 7/6/2028 941,176 934,588 896,471 PAR PETROLEUM LLC Energy: Oil & Gas Term Loan 2/23 Loan 3M USD SOFR+ 4.25 % 0.50 % 9.69 % 2/27/2030 2,483,737 2,460,184 2,482,198 PATAGONIA HOLDCO LLC Telecommunications Term Loan B Loan 3M USD SOFR+ 5.75 % 0.50 % 11.06 % 8/1/2029 1,975,000 1,671,950 1,816,013 Pathway Partners Vet Management Company LLC Services: Business Term Loan Loan 1M USD SOFR+ 3.75 % 0.00 % 9.19 % 3/30/2027 481,544 475,840 411,321 PCI Gaming Authority Hotel, Gaming & Leisure Term Loan Loan 1M USD SOFR+ 2.50 % 0.00 % 7.94 % 5/29/2026 794,490 793,022 794,156 PEARLS (Netherlands) Bidco B.V. Chemicals, Plastics, & Rubber USD Term Loan (02/22) Loan 3M USD SOFR+ 3.75 % 0.50 % 9.06 % 2/28/2029 982,500 981,042 972,066 PEDIATRIC ASSOCIATES HOLDING COMPANY, LLC Healthcare & Pharmaceuticals Term Loan (12/22) Loan 1M USD SOFR+ 3.25 % 0.50 % 8.69 % 12/29/2028 1,474,639 1,470,327 1,325,332 Penn National Gaming, Inc Hotel, Gaming & Leisure Term Loan B Loan 1M USD SOFR+ 2.75 % 0.50 % 8.18 % 5/3/2029 985,000 981,209 979,720 Peraton Corp. Aerospace & Defense Term Loan B Loan 1M USD SOFR+ 3.75 % 0.75 % 9.18 % 2/1/2028 5,236,340 5,225,013 5,236,340 PHYSICIAN PARTNERS, LLC Healthcare & Pharmaceuticals Term Loan Loan 3M USD SOFR+ 4.00 % 0.50 % 9.46 % 12/23/2028 2,958,680 2,899,926 2,608,254 28, 202229, 2024Issuer Name Industry Asset Name Asset
Type Reference
Rate/Spread LIBOR Floor Current Rate
(All In) Maturity
Date Principal/
Number of Shares Cost Fair Value RV Retailer LLC Automotive Term Loan Loan 3M USD SOFR+ 3.75 % 0.75 % 4.50 % 2/8/2028 1,985,000 1,967,852 1,951,513 Ryan Specialty Group LLC Banking, Finance, Insurance & Real Estate Term Loan Loan 1M USD LIBOR+ 3.00 % 0.75 % 3.75 % 9/1/2027 493,750 487,862 489,583 S&S HOLDINGS LLC Services: Business Term Loan Loan 3M USD LIBOR+ 5.00 % 0.50 % 5.50 % 3/10/2028 2,483,744 2,427,454 2,458,906 Sally Holdings LLC Retail Term Loan B Loan 1M USD LIBOR+ 2.25 % 0.00 % 2.46 % 7/5/2024 748,409 746,932 740,925 Samsonite International S.A. Consumer goods: Non-durable Term Loan B2 Loan 1M USD LIBOR+ 3.00 % 0.75 % 3.75 % 4/25/2025 987,538 967,436 979,519 Schweitzer-Mauduit International, Inc. High Tech Industries Term Loan B Loan 1M USD LIBOR+ 3.75 % 0.75 % 4.50 % 4/20/2028 2,985,000 2,969,212 2,895,450 Scientific Games Holdings LP Hotel, Gaming & Leisure Term Loan B Loan 3M USD SOFR+ 3.50 % 0.50 % 4.00 % 2/3/2029 500,000 498,750 496,460 SETANTA AIRCRAFT LEASING DAC Aerospace & Defense Term Loan Loan 3M USD LIBOR+ 2.00 % 0.00 % 2.14 % 11/2/2028 1,000,000 997,653 993,440 Signify Health, LLC Healthcare & Pharmaceuticals Term Loan B (6/21) Loan 3M USD LIBOR+ 3.25 % 0.50 % 3.75 % 6/16/2028 498,750 496,482 492,206 Sitel Worldwide Corporation Services: Business USD Term Loan (7/21) Loan 3M USD LIBOR+ 3.75 % 0.50 % 4.25 % 8/28/2028 1,995,000 1,985,688 1,981,294 SiteOne Landscape Supply, LLC Services: Business Term Loan (3/21) Loan 3M USD LIBOR+ 2.00 % 0.50 % 2.50 % 3/18/2028 785,769 784,048 780,528 SMG US Midco 2, Inc. Services: Business Term Loan (01/20) Loan 3M USD LIBOR+ 2.50 % 0.00 % 2.80 % 1/23/2025 490,000 490,000 472,238 Sotheby's Services: Business Term Loan (7/21) Loan 3M USD LIBOR+ 4.50 % 0.50 % 5.00 % 1/15/2027 3,256,472 3,207,096 3,240,190 Sparta U.S. HoldCo LLC Chemicals, Plastics, & Rubber Term Loan (04/21) Loan 1M USD LIBOR+ 3.50 % 0.75 % 4.25 % 8/2/2028 2,000,000 1,990,687 1,985,000 Specialty Pharma III Inc. Services: Business Term Loan Loan 1M USD LIBOR+ 4.50 % 0.75 % 5.25 % 3/31/2028 1,995,000 1,977,135 1,975,050 Spectrum Brands, Inc. Consumer goods: Durable Term Loan (2/21) Loan 3M USD LIBOR+ 2.00 % 0.50 % 2.50 % 3/3/2028 496,250 495,145 494,389 Spin Holdco, Inc. Services: Consumer Term Loan 3/21 Loan 3M USD LIBOR+ 4.00 % 0.75 % 4.75 % 3/4/2028 2,977,500 2,962,439 2,958,474 SRAM, LLC Consumer goods: Durable Term Loan (05/21) Loan 1M USD LIBOR+ 2.75 % 0.50 % 3.26 % 5/12/2028 3,600,000 3,594,517 3,571,488 SS&C Technologies, Inc. Services: Business Term Loan B3 Loan 1M USD LIBOR+ 1.75 % 0.00 % 1.96 % 4/16/2025 190,170 189,956 186,819 SS&C Technologies, Inc. Services: Business Term Loan B4 Loan 1M USD LIBOR+ 1.75 % 0.00 % 1.96 % 4/16/2025 154,375 154,203 151,655 SS&C Technologies, Inc. Services: Business Term Loan B-5 Loan 1M USD LIBOR+ 1.75 % 0.00 % 1.96 % 4/16/2025 477,615 477,001 469,376 STANDARD INDUSTRIES INC. Construction & Building Term Loan B Loan 3M USD LIBOR+ 2.50 % 0.50 % 3.00 % 9/22/2028 640,250 634,225 637,503 Staples, Inc. Wholesale Term Loan (03/19) Loan 3M USD LIBOR+ 5.00 % 0.00 % 5.13 % 4/16/2026 4,386,462 4,265,782 4,154,813 Stars Group Inc. (The) Hotel, Gaming & Leisure Term Loan Loan 3M USD LIBOR+ 2.25 % 0.00 % 2.47 % 7/21/2026 1,995,000 1,990,864 1,972,776 Issuer Name Industry Asset Name Asset
Type Reference Rate/
Spread SOFR/
LIBOR Floor Current Rate
(All In) Maturity Date Principal/
Number
of Shares Cost Fair Value Pitney Bowes Inc Services: Business Term Loan B Loan 1M USD SOFR+ 4.00 % 0.00 % 9.44 % 3/17/2028 3,899,823 3,878,054 3,880,324 Plastipak Holdings Inc. Containers, Packaging & Glass Term Loan B (11/21) Loan 1M USD SOFR+ 2.50 % 0.50 % 7.93 % 12/1/2028 1,795,294 1,789,191 1,791,309 Playtika Holding Corp. High Tech Industries Term Loan B (3/21) Loan 1M USD SOFR+ 2.75 % 0.00 % 8.19 % 3/13/2028 4,376,250 4,370,414 4,362,377 PMHC II, INC. Chemicals, Plastics, & Rubber Term Loan (02/22) Loan 3M USD SOFR+ 4.25 % 0.50 % 9.72 % 4/21/2029 1,975,000 1,967,432 1,926,968 PointClickCare Technologies, Inc. High Tech Industries Term Loan B Loan 3M USD SOFR+ 3.00 % 0.75 % 8.61 % 12/29/2027 486,250 484,831 485,642 Polymer Process Holdings, Inc. Containers, Packaging & Glass Term Loan Loan 1M USD SOFR+ 4.75 % 0.75 % 10.19 % 2/12/2028 5,348,750 5,313,507 5,071,310 Pre-Paid Legal Services, Inc. Services: Consumer Term Loan (12/21) Loan 1M USD SOFR+ 3.75 % 0.50 % 9.19 % 12/15/2028 2,947,500 2,929,343 2,939,512 Presidio, Inc. Services: Business Term Loan B (1/20) Loan 3M USD SOFR+ 3.50 % 0.00 % 8.91 % 1/22/2027 482,500 482,164 483,103 Prime Security Services Borrower, LLC (ADT) Services: Consumer Term Loan B (10/23) Loan 3M USD SOFR+ 2.50 % 0.00 % 7.83 % 10/11/2030 2,000,000 1,980,728 1,998,300 PRIORITY HOLDINGS, LLC Services: Consumer Term Loan Loan 1M USD SOFR+ 5.75 % 1.00 % 11.19 % 4/27/2027 2,925,000 2,906,770 2,921,344 PriSo Acquisition Corporation Construction & Building Term Loan (01/21) Loan 3M USD SOFR+ 3.25 % 0.75 % 8.84 % 12/28/2027 486,242 484,862 472,311 Project Leopard Holdings, Inc. (NEW) High Tech Industries Term Loan B (06/22) Loan 3M USD SOFR+ 5.25 % 0.50 % 10.66 % 7/20/2029 990,000 931,883 907,711 Propulsion (BC) Finco Aerospace & Defense Term Loan Loan 3M USD SOFR+ 3.75 % 0.50 % 9.10 % 9/14/2029 750,000 742,504 748,748 PUG LLC Services: Consumer Term Loan B (02/20) Loan 1M USD SOFR+ 3.50 % 0.00 % 8.94 % 2/12/2027 475,176 474,168 466,010 Quartz AcquireCo, LLC High Tech Industries Term Loan B Loan 1M USD SOFR+ 3.50 % 0.00 % 8.83 % 6/28/2030 997,500 988,167 996,253 QUEST BORROWER LIMITED High Tech Industries Term Loan (1/22) Loan 3M USD SOFR+ 4.25 % 0.50 % 9.71 % 2/1/2029 1,970,000 1,954,941 1,552,734 R1 RCM INC. Healthcare & Pharmaceuticals Term Loan (12/23) Loan 1M USD SOFR+ 3.00 % 0.00 % 8.36 % 6/21/2029 1,200,000 1,185,480 1,200,000 R1 RCM INC. Healthcare & Pharmaceuticals Term Loan Loan 1M USD SOFR+ 3.00 % 0.50 % 8.33 % 6/21/2029 1,200,000 1,185,733 1,200,000 Rackspace Technology Global, Inc. High Tech Industries Term Loan (1/21) Loan 1M USD SOFR+ 2.75 % 0.75 % 8.19 % 2/15/2028 2,944,353 2,869,199 1,278,173 RAND PARENT LLC Transportation: Cargo Term Loan B Loan 3M USD SOFR+ 4.25 % 0.00 % 9.60 % 3/16/2030 2,481,250 2,400,653 2,476,213 28, 202229, 2024Issuer Name Industry Asset Name Asset
Type Reference
Rate/Spread LIBOR Floor Current Rate
(All In) Maturity
Date Principal/
Number of Shares Cost Fair Value Storable, Inc High Tech Industries Term Loan B Loan 6M USD LIBOR+ 3.25 % 0.50 % 3.75 % 4/17/2028 500,000 498,861 494,375 Superannuation & Investments US LLC Banking, Finance, Insurance & Real Estate Term Loan Loan 1M USD LIBOR+ 3.75 % 0.50 % 4.25 % 12/1/2028 1,000,000 990,274 995,940 Sylvamo Corporation Forest Products & Paper Term Loan Loan 1M USD LIBOR+ 4.50 % 0.50 % 5.00 % 8/18/2028 1,093,333 1,082,992 1,085,133 Syncsort Incorporated High Tech Industries Term Loan B (10/21) Loan 3M USD LIBOR+ 4.00 % 0.75 % 4.75 % 4/24/2028 2,495,000 2,493,770 2,465,684 Syniverse Holdings, Inc. Telecommunications Term Loan Loan 3M USD SOFR+ 4.25 % 0.50 % 4.75 % 2/1/2029 500,000 495,000 499,375 Tenable Holdings, Inc. Services: Business Term Loan B (6/21) Loan 6M USD LIBOR+ 2.75 % 0.50 % 3.27 % 7/7/2028 1,000,000 997,633 986,250 Teneo Holdings LLC Banking, Finance, Insurance & Real Estate Term Loan Loan 1M USD SOFR+ 5.25 % 1.00 % 6.25 % 7/15/2025 4,428,522 4,355,261 4,383,129 Tenneco Inc Capital Equipment Term Loan B Loan 1M USD LIBOR+ 3.00 % 0.00 % 3.21 % 10/1/2025 1,455,000 1,447,215 1,444,088 Ten-X, LLC Banking, Finance, Insurance & Real Estate Term Loan Loan 1M USD LIBOR+ 4.00 % 1.00 % 5.00 % 9/27/2024 1,920,000 1,918,652 1,881,600 The Dun & Bradstreet Corporation Services: Business Term Loan Loan 1M USD LIBOR+ 3.25 % 0.00 % 3.46 % 2/6/2026 1,000,000 998,750 988,330 The Dun & Bradstreet Corporation Services: Business Term Loan B Loan 1M USD SOFR+ 3.25 % 0.00 % 3.44 % 1/5/2029 250,000 248,180 246,668 THE KNOT WORLDWIDE INC. Services: Consumer Term Loan (1/22) Loan 1M USD SOFR+ 4.50 % 0.00 % 4.67 % 12/19/2025 4,869,796 4,863,346 4,829,231 The Octave Music Group, Inc (Touchtunes) Services: Business Term Loan B Loan 1M USD LIBOR+ 6.00 % 1.00 % 7.00 % 5/29/2025 2,893,526 2,872,208 2,871,824 Thor Industries, Inc. Automotive USD Term Loan (3/21) Loan 1M USD LIBOR+ 3.00 % 0.00 % 3.25 % 2/1/2026 2,810,435 2,763,310 2,797,563 Tosca Services, LLC Containers, Packaging & Glass Term Loan (2/21) Loan 1M USD LIBOR+ 3.50 % 0.75 % 4.25 % 8/18/2027 495,000 489,079 487,575 Trans Union LLC Banking, Finance, Insurance & Real Estate Term Loan Loan 1M USD LIBOR+ 2.00 % 0.50 % 2.50 % 12/1/2028 870,968 868,877 860,804 Transdigm, Inc. Aerospace & Defense Term Loan G (02/20) Loan 1M USD LIBOR+ 2.25 % 0.00 % 2.46 % 8/22/2024 4,024,167 4,026,414 3,959,700 Travel Leaders Group, LLC Hotel, Gaming & Leisure Term Loan B (08/18) Loan 1M USD LIBOR+ 4.00 % 0.00 % 4.21 % 1/25/2024 2,412,500 2,411,191 2,268,353 TRITON WATER HOLDINGS, INC. Beverage, Food & Tobacco Term Loan (03/21) Loan 3M USD LIBOR+ 3.50 % 0.50 % 4.00 % 3/31/2028 1,492,500 1,485,884 1,454,352 Tronox Pigments (Netherlands) B.V. Chemicals, Plastics, & Rubber Term Loan Loan 3M USD LIBOR+ 2.25 % 0.00 % 2.47 % 3/10/2028 346,923 346,183 341,719 TruGreen Limited Partnership Services: Consumer Term Loan Loan 1M USD LIBOR+ 4.00 % 0.75 % 4.75 % 10/29/2027 964,241 957,748 961,830 Uber Technologies, Inc. Transportation: Consumer Term Loan B (2/21) Loan 1M USD LIBOR+ 3.50 % 0.00 % 3.71 % 2/25/2027 3,947,943 3,909,627 3,905,740 Ultra Clean Holdings, Inc. High Tech Industries Incremental Term Loan 3/21 Loan 1M USD LIBOR+ 3.75 % 0.00 % 3.96 % 8/27/2025 884,205 880,505 882,366 Unimin Corporation Metals & Mining Term Loan (12/20) Loan 3M USD LIBOR+ 4.00 % 1.00 % 5.00 % 7/31/2026 496,815 471,432 490,853 Issuer Name Industry Asset Name Asset
Type Reference Rate/
Spread SOFR/
LIBOR Floor Current Rate
(All In) Maturity Date Principal/
Number
of Shares Cost Fair Value RealPage, Inc. High Tech Industries Term Loan (04/21) Loan 1M USD SOFR+ 3.00 % 0.50 % 8.44 % 4/24/2028 977,500 976,326 950,501 Rent-A-Center, Inc. Retail Term Loan B2 (9/21) Loan 6M USD SOFR+ 3.25 % 0.50 % 9.12 % 2/17/2028 1,860,192 1,827,856 1,856,323 Research Now Group, Inc Media: Advertising, Printing & Publishing Term Loan Loan 3M USD SOFR+ 5.50 % 1.00 % 11.07 % 12/20/2024 4,252,891 4,231,426 2,426,275 Resideo Funding Inc. Services: Consumer Term Loan (1/21) Loan 1M USD SOFR+ 2.25 % 0.50 % 7.69 % 2/11/2028 1,458,750 1,457,581 1,454,651 Resolute Investment Managers (American Beacon), Inc. Banking, Finance, Insurance & Real Estate Term Loan (12/23) Loan 3M USD SOFR+ 6.50 % 1.00 % 12.11 % 4/30/2027 1,968,154 1,968,154 1,936,172 Restoration Hardware, Inc. Retail Term Loan (9/21) Loan 1M USD SOFR+ 2.50 % 0.50 % 7.94 % 10/20/2028 3,427,375 3,422,882 3,328,838 Reynolds Consumer Products LLC Containers, Packaging & Glass Term Loan Loan 1M USD SOFR+ 1.75 % 0.00 % 7.18 % 1/29/2027 1,117,917 1,117,917 1,117,078 Reynolds Group Holdings Inc. Containers, Packaging & Glass Term Loan B2 Loan 1M USD SOFR+ 3.25 % 0.00 % 8.69 % 2/5/2026 1,933,578 1,929,763 1,936,692 Russell Investments US Inst’l Holdco, Inc. Banking, Finance, Insurance & Real Estate Term Loan (10/20) Loan 1M USD SOFR+ 3.50 % 1.00 % 8.93 % 6/2/2025 5,503,217 5,487,956 5,313,356 RV Retailer LLC Automotive Term Loan Loan 1M USD SOFR+ 3.75 % 0.75 % 9.17 % 2/8/2028 2,927,756 2,890,768 2,728,317 Ryan Specialty Group LLC Banking, Finance, Insurance & Real Estate Term Loan Loan 1M USD SOFR+ 2.75 % 0.75 % 8.08 % 9/1/2027 1,463,497 1,454,416 1,463,497 S&S HOLDINGS LLC Services: Business Term Loan Loan 3M USD SOFR+ 5.00 % 0.50 % 10.42 % 3/10/2028 2,433,693 2,393,141 2,405,560 Sally Holdings LLC Retail Term Loan B Loan 1M USD SOFR+ 2.25 % 0.00 % 7.58 % 2/28/2030 496,250 492,943 495,421 Schweitzer-Mauduit International, Inc. High Tech Industries Term Loan B Loan 1M USD SOFR+ 3.75 % 0.75 % 9.19 % 4/20/2028 1,297,546 1,293,069 1,294,847 Scientific Games Holdings LP Hotel, Gaming & Leisure Term Loan B Loan 3M USD SOFR+ 3.25 % 0.50 % 8.58 % 4/4/2029 493,750 492,933 492,516 Sedgwick Claims Management Services, Inc. Services: Business Term Loan B 2/23 Loan 1M USD SOFR+ 3.75 % 0.00 % 9.08 % 2/17/2028 992,500 984,017 993,294 SETANTA AIRCRAFT LEASING DAC Aerospace & Defense Term Loan Loan 3M USD SOFR+ 2.00 % 0.00 % 7.61 % 11/2/2028 1,000,000 998,338 1,000,560 Sitel Worldwide Corporation Services: Business USD Term Loan (7/21) Loan 1M USD SOFR+ 3.75 % 0.50 % 9.19 % 8/28/2028 1,955,000 1,948,734 1,873,144 28, 202229, 2024Issuer Name Industry Asset Name Asset
Type Reference
Rate/Spread LIBOR Floor Current Rate
(All In) Maturity
Date Principal/
Number of Shares Cost Fair Value United Natural Foods, Inc Beverage, Food & Tobacco Term Loan B Loan 1M USD LIBOR+ 3.25 % 0.00 % 3.46 % 10/22/2025 1,624,974 1,562,482 1,616,166 United Road Services Inc. Transportation: Cargo Term Loan (10/17) Loan 6M USD LIBOR+ 5.75 % 1.00 % 6.75 % 9/1/2024 920,843 915,490 826,457 Univar Inc. Chemicals, Plastics, & Rubber Term Loan B6 Loan 1M USD LIBOR+ 2.00 % 0.00 % 2.21 % 6/2/2028 1,990,000 1,980,782 1,974,458 Univision Communications Inc. Media: Broadcasting & Subscription Term Loan B (6/21) Loan 1M USD LIBOR+ 3.25 % 0.75 % 4.00 % 3/15/2026 2,471,487 2,464,765 2,451,913 US Ecology, Inc. Environmental Industries Term Loan B Loan 1M USD LIBOR+ 2.50 % 0.00 % 2.71 % 11/2/2026 490,000 489,302 488,040 Utz Quality Foods, LLC Beverage, Food & Tobacco Term Loan B Loan 1M USD LIBOR+ 3.00 % 0.00 % 3.21 % 1/20/2028 1,847,121 1,844,606 1,827,264 Vaco Holdings, LLC Services: Business Term Loan (01/22) Loan 1M USD SOFR+ 5.00 % 0.75 % 5.75 % 1/19/2029 250,000 248,777 248,124 Verifone Systems, Inc. Banking, Finance, Insurance & Real Estate Term Loan (7/18) Loan 3M USD LIBOR+ 4.00 % 0.00 % 4.50 % 8/20/2025 1,382,319 1,377,042 1,354,672 Vertex Aerospace Services Corp Aerospace & Defense Term Loan (10/21) Loan 1M USD LIBOR+ 4.00 % 0.75 % 4.75 % 12/6/2028 1,000,000 995,345 992,080 VFH Parent LLC Banking, Finance, Insurance & Real Estate Term Loan (01/22) Loan Daily SOFR+ 3.00 % 0.50 % 3.50 % 1/12/2029 3,100,888 3,092,414 3,071,833 Virtus Investment Partners, Inc. Banking, Finance, Insurance & Real Estate Term Loan B (9/21) Loan 1M USD LIBOR+ 2.25 % 0.00 % 2.36 % 9/28/2028 2,992,500 2,982,995 2,971,942 Vistra Energy Corp Utilities: Electric 2018 Incremental Term Loan Loan 1M USD LIBOR+ 1.75 % 0.00 % 1.87 % 12/31/2025 907,176 906,677 890,075 Vizient, Inc Healthcare & Pharmaceuticals Term Loan B-6 Loan 1M USD LIBOR+ 2.00 % 0.00 % 2.21 % 5/6/2026 486,250 485,567 480,779 VM Consolidated, Inc. Construction & Building Term Loan B (3/21) Loan 6M USD LIBOR+ 3.25 % 0.00 % 3.60 % 3/19/2028 2,339,327 2,336,223 2,322,951 Vouvray US Finance LLC High Tech Industries Term Loan Loan 1M USD LIBOR+ 3.00 % 1.00 % 4.00 % 3/11/2024 476,250 476,250 411,837 Warner Music Group Corp. (WMG Acquisition Corp.) Hotel, Gaming & Leisure Term Loan G Loan 1M USD LIBOR+ 2.13 % 0.00 % 2.33 % 1/20/2028 1,250,000 1,249,760 1,234,763 Wastequip, LLC (HPCC Merger/Patriot Container) Environmental Industries Term Loan (3/18) Loan 1M USD LIBOR+ 3.75 % 1.00 % 4.75 % 3/15/2025 489,822 488,550 469,004 Watlow Electric Manufacturing Company High Tech Industries Term Loan B Loan 3M USD LIBOR+ 3.75 % 0.50 % 4.25 % 3/2/2028 2,481,250 2,470,270 2,452,294 Issuer Name Industry Asset Name Asset
Type Reference Rate/
Spread SOFR/
LIBOR Floor Current Rate
(All In) Maturity Date Principal/
Number
of Shares Cost Fair Value SiteOne Landscape Supply, LLC Services: Business Term Loan (3/21) Loan 1M USD SOFR+ 2.00 % 0.50 % 7.44 % 3/18/2028 1,267,378 1,261,906 1,267,378 SMG US Midco 2, Inc. Services: Business Term Loan (01/20) Loan 3M USD SOFR+ 2.50 % 0.00 % 8.07 % 1/23/2025 480,000 480,000 479,702 Smyrna Ready Mix Concrete, LLC Construction & Building Term Loan B Loan 1M USD SOFR+ 3.50 % 0.00 % 8.82 % 4/1/2029 514,217 510,811 514,860 Sotheby’s Services: Business Term Loan (7/21) Loan 3M USD SOFR+ 4.50 % 0.50 % 10.08 % 1/15/2027 3,191,015 3,159,783 3,159,903 Sparta U.S. HoldCo LLC Chemicals, Plastics, & Rubber Term Loan (04/21) Loan 1M USD SOFR+ 3.25 % 0.75 % 8.69 % 8/2/2028 1,960,000 1,953,602 1,955,453 Specialty Pharma III Inc. Services: Business Term Loan Loan 1M USD SOFR+ 4.25 % 0.75 % 9.68 % 3/31/2028 1,955,000 1,942,520 1,857,250 Spin Holdco, Inc. Services: Consumer Term Loan 3/21 Loan 3M USD SOFR+ 4.00 % 0.75 % 9.62 % 3/4/2028 2,917,500 2,907,433 2,644,510 SRAM, LLC Consumer goods: Durable Term Loan (05/21) Loan 1M USD SOFR+ 2.75 % 0.50 % 8.19 % 5/12/2028 2,523,636 2,521,215 2,517,327 STANDARD INDUSTRIES INC. Construction & Building Term Loan B Loan 1M USD SOFR+ 2.25 % 0.50 % 7.68 % 9/22/2028 620,250 616,132 619,785 Staples, Inc. Wholesale Term Loan (03/19) Loan 1M USD SOFR+ 5.00 % 0.00 % 10.44 % 4/16/2026 4,296,252 4,227,884 4,185,881 Star Parent, Inc. Services: Business Term Loan B (09/23) Loan 3M USD SOFR+ 4.00 % 0.00 % 9.35 % 9/19/2030 1,250,000 1,232,293 1,233,600 Storable, Inc High Tech Industries Term Loan B Loan 1M USD SOFR+ 3.50 % 0.50 % 8.83 % 4/17/2028 490,000 489,451 489,084 Superannuation & Investments US LLC Banking, Finance, Insurance & Real Estate Term Loan Loan 1M USD SOFR+ 3.75 % 0.50 % 9.19 % 12/1/2028 980,000 972,893 979,510 Sweetwater Borrower, LLC Retail Term Loan (8/21) Loan 1M USD SOFR+ 4.25 % 0.75 % 9.69 % 8/2/2028 2,197,331 2,118,286 2,186,345 Syncsort Incorporated High Tech Industries Term Loan B (10/21) Loan 3M USD SOFR+ 4.00 % 0.75 % 9.59 % 4/24/2028 2,444,975 2,444,257 2,421,748 Ta TT Buyer LLC Media: Broadcasting & Subscription Term Loan 3/22 Loan 3M USD SOFR+ 5.00 % 0.50 % 10.35 % 4/2/2029 987,475 979,563 987,060 Tenable Holdings, Inc. Services: Business Term Loan B (6/21) Loan 1M USD SOFR+ 2.75 % 0.50 % 8.19 % 7/7/2028 980,000 978,620 977,962 Teneo Holdings LLC Banking, Finance, Insurance & Real Estate Term Loan Loan 1M USD SOFR+ 5.25 % 1.00 % 10.68 % 7/15/2025 4,337,912 4,305,238 4,332,490 Ten-X, LLC Banking, Finance, Insurance & Real Estate Term Loan 5/23 Loan 1M USD SOFR+ 6.00 % 0.00 % 11.33 % 5/25/2028 1,880,000 1,879,762 1,809,030 The Dun & Bradstreet Corporation Services: Business Term Loan (01/24) Loan 1M USD SOFR+ 2.75 % 0.00 % 8.07 % 1/18/2029 1,148,788 1,146,995 1,145,629 28, 202229, 2024Issuer Name Industry Asset Name Asset
Type Reference
Rate/Spread LIBOR Floor Current Rate
(All In) Maturity
Date Principal/
Number of Shares Cost Fair Value West Corporation Telecommunications Term Loan B (Olympus Merger) Loan 3M USD LIBOR+ 4.00 % 1.00 % 5.00 % 10/10/2024 1,086,078 1,047,433 967,424 West Corporation Telecommunications Term Loan B Loan 3M USD LIBOR+ 3.50 % 1.00 % 4.50 % 10/10/2024 2,599,274 2,562,059 2,301,449 WEX Inc. Services: Business Term Loan B (3/21) Loan 1M USD LIBOR+ 2.25 % 0.00 % 2.46 % 3/31/2028 2,985,000 2,974,005 2,937,419 WildBrain Ltd. Media: Diversified & Production Term Loan Loan 1M USD LIBOR+ 4.25 % 0.75 % 5.00 % 3/27/2028 1,985,000 1,949,907 1,966,401 WP CITYMD BIDCO LLC Services: Consumer Term Loan B Loan 6M USD LIBOR+ 3.25 % 0.50 % 3.75 % 12/22/2028 7,424,013 7,399,065 7,355,340 Xperi Corporation High Tech Industries Term Loan Loan 1M USD LIBOR+ 3.50 % 0.00 % 3.71 % 6/8/2028 2,741,617 2,730,066 2,719,355 ZEBRA BUYER LLC Banking, Finance, Insurance & Real Estate Term Loan 4/21 Loan 3M USD LIBOR+ 3.25 % 0.50 % 3.75 % 11/1/2028 887,097 883,013 882,661 Zekelman Industries, Inc. Metals & Mining Term Loan (01/20) Loan 1M USD LIBOR+ 2.00 % 0.00 % 2.14 % 1/25/2027 968,914 968,914 954,622 Zodiac Pool Solutions Consumer goods: Durable Term Loan (1/22) Loan 1M USD SOFR+ 2.00 % 0.50 % 2.50 % 1/19/2029 500,000 498,783 493,440 $ 653,022,265 $ 638,963,350 Issuer Name Industry Asset Name Asset
Type Reference Rate/
Spread SOFR/
LIBOR Floor Current Rate
(All In) Maturity Date Principal/
Number
of Shares Cost Fair Value Thor Industries, Inc. Automotive Term Loan B2 Loan 1M USD SOFR+ 2.75 % 0.00 % 8.07 % 11/15/2030 847,276 839,124 847,276 Torrid LLC Wholesale Term Loan 5/21 Loan 3M USD SOFR+ 5.50 % 0.75 % 11.11 % 6/14/2028 3,293,297 2,885,799 2,766,369 TORY BURCH LLC Retail Term Loan Loan 1M USD SOFR+ 3.25 % 0.50 % 8.69 % 4/15/2028 2,308,083 2,173,521 2,279,878 Tosca Services, LLC Containers, Packaging & Glass Term Loan (2/21) Loan 3M USD SOFR+ 3.50 % 0.75 % 9.07 % 8/18/2027 485,000 481,026 403,360 Trans Union LLC Banking, Finance, Insurance & Real Estate Term Loan B7 (02/24) Loan 1M USD SOFR+ 2.00 % 0.50 % 7.33 % 12/1/2028 609,032 608,154 608,161 Transdigm, Inc. Aerospace & Defense Term Loan H Loan 3M USD SOFR+ 3.25 % 0.00 % 8.60 % 2/22/2027 1,973,436 1,970,279 1,977,580 TRITON WATER HOLDINGS, INC. Beverage, Food & Tobacco Term Loan (03/21) Loan 3M USD SOFR+ 3.25 % 0.50 % 8.86 % 3/31/2028 1,462,504 1,457,793 1,435,389 Tronox Finance LLC Chemicals, Plastics, & Rubber Term Loan Loan 1M USD SOFR+ 2.50 % 0.00 % 7.94 % 3/10/2028 346,923 346,548 345,584 Tronox Finance LLC Chemicals, Plastics, & Rubber Incremental Term Loan Loan 3M USD SOFR+ 3.50 % 0.50 % 8.85 % 8/11/2028 2,000,000 1,981,659 1,997,500 TruGreen Limited Partnership Services: Consumer Term Loan Loan 1M USD SOFR+ 4.00 % 0.75 % 9.43 % 10/29/2027 944,761 940,433 912,034 Uber Technologies, Inc. Transportation: Consumer Term Loan 2/23 Loan 3M USD SOFR+ 2.75 % 0.00 % 8.13 % 3/3/2030 395,438 394,559 396,284 Ultra Clean Holdings, Inc. High Tech Industries Incremental Term Loan 3/21 Loan 1M USD SOFR+ 3.75 % 0.00 % 9.19 % 8/27/2025 763,480 761,941 764,755 Unimin Corporation Metals & Mining Term Loan (12/20) Loan 3M USD SOFR+ 4.00 % 1.00 % 9.59 % 7/31/2026 496,815 481,603 494,207 United Natural Foods, Inc Beverage, Food & Tobacco Term Loan B Loan 1M USD SOFR+ 3.25 % 0.00 % 8.69 % 10/22/2025 1,241,834 1,218,443 1,239,922 Univision Communications Inc. Media: Broadcasting & Subscription Term Loan B (6/21) Loan 1M USD SOFR+ 3.25 % 0.75 % 8.69 % 3/15/2026 2,421,809 2,418,336 2,418,031 Univision Communications Inc. Media: Broadcasting & Subscription Term Loan B (6/22) Loan 3M USD SOFR+ 4.25 % 0.50 % 9.60 % 6/25/2029 246,250 240,243 246,250 Utz Quality Foods, LLC Beverage, Food & Tobacco Term Loan B Loan 1M USD SOFR+ 3.00 % 0.00 % 8.44 % 1/20/2028 1,478,977 1,478,749 1,478,252 Vaco Holdings, LLC Services: Business Term Loan (01/22) Loan 6M USD SOFR+ 5.00 % 0.75 % 10.43 % 1/19/2029 2,318,552 2,260,590 2,287,251 Number of Shares Cost Fair Value Cash and cash equivalents U.S. Bank Money Market (c) 6,171,793 $ 6,171,793 $ 6,171,793 Total cash and cash equivalents 6,171,793 $ 6,171,793 $ 6,171,793 (a) All or a portionthis investment has an unfunded commitment asInvestmentsIssuer Name Industry Asset Name Asset
Type Reference Rate/
Spread SOFR/
LIBOR Floor Current Rate
(All In) Maturity Date Principal/
Number
of Shares Cost Fair Value Vericast Corp. (c) Media: Advertising, Printing & Publishing Term Loan (12/23) Loan 3M USD SOFR+ 7.75 % 0.00 % 13.36 % 6/16/2026 1,208,512 1,207,739 1,111,831 Verifone Systems, Inc. Banking, Finance, Insurance & Real Estate Term Loan (7/18) Loan 3M USD SOFR+ 4.00 % 0.00 % 9.59 % 8/20/2025 1,353,744 1,351,272 1,170,988 Vertex Aerospace Services Corp Aerospace & Defense Term Loan (10/21) Loan 1M USD SOFR+ 3.25 % 0.75 % 8.68 % 12/6/2028 982,538 979,566 982,459 VFH Parent LLC Banking, Finance, Insurance & Real Estate Term Loan (01/22) Loan 1M USD SOFR+ 3.00 % 0.50 % 8.43 % 1/12/2029 2,975,130 2,970,557 2,970,667 Viasat Inc Telecommunications Term Loan (2/22) Loan 1M USD SOFR+ 4.50 % 0.50 % 9.83 % 3/5/2029 2,967,381 2,908,179 2,909,903 Virtus Investment Partners, Inc. Banking, Finance, Insurance & Real Estate Term Loan B (9/21) Loan 1M USD SOFR+ 2.25 % 0.00 % 7.69 % 9/28/2028 2,823,409 2,817,201 2,819,880 Vistra Operations Company LLC Energy: Electricity 2018 Incremental Term Loan Loan 1M USD SOFR+ 2.00 % 0.00 % 7.33 % 12/20/2030 1,889,393 1,880,083 1,880,135 Vizient, Inc Healthcare & Pharmaceuticals Term Loan 4/22 Loan 1M USD SOFR+ 2.25 % 0.50 % 7.68 % 5/16/2029 492,500 488,534 492,731 VM Consolidated, Inc. Construction & Building Term Loan B (01/24) Loan 1M USD SOFR+ 2.75 % 0.00 % 8.08 % 3/24/2028 1,841,374 1,840,186 1,843,676 Vouvray US Finance LLC High Tech Industries Term Loan Loan 1M USD SOFR+ 6.00 % 1.00 % 11.33 % 9/30/2025 466,250 466,250 472,078 Walker & Dunlop, Inc. Banking, Finance, Insurance & Real Estate Term Loan B (12/22) Loan 1M USD SOFR+ 3.00 % 0.50 % 8.43 % 12/15/2028 496,250 487,839 495,009 Warner Music Group Corp. (WMG Acquisition Corp.) Hotel, Gaming & Leisure First Lien TL I (01/24) Loan 1M USD SOFR+ 2.00 % 0.00 % 7.33 % 1/24/2031 1,250,000 1,249,906 1,247,463 Watlow Electric Manufacturing Company High Tech Industries Term Loan B Loan 3M USD SOFR+ 3.75 % 0.50 % 9.33 % 3/2/2028 2,831,632 2,822,010 2,826,337 WeddingWire, Inc. Services: Consumer Term Loan (09/23) Loan 1M USD SOFR+ 4.50 % 0.00 % 9.82 % 1/29/2028 4,808,923 4,806,669 4,784,879 WEX Inc. Services: Business Term Loan Loan 1M USD SOFR+ 2.00 % 0.00 % 7.33 % 3/31/2028 2,924,849 2,918,448 2,919,379 WildBrain Ltd. Media: Diversified & Production Term Loan Loan 1M USD SOFR+ 4.25 % 0.75 % 9.69 % 3/27/2028 3,005,025 2,952,048 2,899,849 Windsor Holdings III, LLC Chemicals, Plastics, & Rubber Term Loan Loan 1M USD SOFR+ 4.50 % 0.00 % 9.82 % 8/1/2030 500,000 500,000 500,390 Wyndham Hotels & Resorts, Inc. Hotel, Gaming & Leisure Term Loan 5/23 Loan 1M USD SOFR+ 2.25 % 0.00 % 7.68 % 5/24/2030 995,000 990,380 996,124 28, 202229, 2024(b) As of February 28, 2022, the investment was in default and on non-accrual status.(c) Included within cash and cash equivalents in Saratoga CLO's Statements of Assets and Liabilities as of February 28, 2022.(d) Investments include Payment-in-Kind Interest.Issuer Name Industry Asset Name Asset
Type Reference Rate/
Spread SOFR/
LIBOR Floor Current Rate
(All In) Maturity Date Principal/
Number
of Shares Cost Fair Value Xperi Corporation High Tech Industries Term Loan Loan 1M USD SOFR+ 3.50 % 0.00 % 8.94 % 6/8/2028 1,983,094 1,979,717 1,977,303 Zayo Group, LLC Telecommunications Term Loan 4/22 Loan 1M USD SOFR+ 4.25 % 0.50 % 9.65 % 3/9/2027 982,500 965,514 884,555 ZEBRA BUYER (Allspring) LLC Banking, Finance, Insurance & Real Estate Term Loan 4/21 Loan 3M USD SOFR+ 3.25 % 0.50 % 8.89 % 11/1/2028 1,866,509 1,857,862 1,862,142 Zekelman Industries, Inc. Metals & Mining Term Loan (01/20) Loan 1M USD SOFR+ 2.00 % 0.00 % 7.44 % 1/25/2027 954,029 954,029 953,733 Zest Acquisition Corp. Healthcare & Pharmaceuticals Term Loan (1/23) Loan 1M USD SOFR+ 5.50 % 0.00 % 10.83 % 2/8/2028 1,980,000 1,897,656 1,940,400 Zodiac Pool Solutions Consumer goods: Durable Term Loan (1/22) Loan 1M USD SOFR+ 1.93 % 0.50 % 7.35 % 1/29/2029 490,000 489,237 488,772 TOTAL INVESTMENTS $ 630,995,710 $ 607,551,774 LIBOR— Number of Shares Cost Fair Value Cash and cash equivalents U.S. Bank Money Market (a) 12,104,832 $ 12,104,832 $ 12,104,832 Total cash and cash equivalents 12,104,832 $ 12,104,832 $ 12,104,832 (a) Included within cash and cash equivalents in Saratoga CLO’s Statements of Assets and Liabilities as of February 29, 2024. (b) (c) Investments include Payment-in-Kind Interest. WIBOR - Warsaw Interbank Offered RateLIBOR—LIBOR - The 1 month1-month USD LIBOR rate as of February 28, 202229, 2024 was 0.23%5.44%.2M3M USD LIBOR—LIBOR - The 2 month3-month USD LIBOR rate as of February 28, 202229, 2024 was 0.50%5.60%.3M USD LIBOR—The 3 month USD LIBOR rate as of February 28, 2022 was 0.51%.6M USD LIBOR—The 6 month USD LIBOR rate as of February 28, 2022 was 0.80%.12M USD LIBOR1M SOFR - The 12 month USD LIBOR rate as of February 28, 2022 was 1.28%.3 PL WIBOR - The 3 month PL WIBOR rate as of February 28, 2022 was 3.65%.Daily SOFR- The daily1-month SOFR rate as of February 28, 202229, 2024 was 0.05%5.32%.1M3M SOFR - The 1 month3-month SOFR rate as of February 28, 202229, 2024 was 0.05%5.33%.3M6M SOFR - The 3 month6-month SOFR rate as of February 28, 202229, 2024 was 0.04%5.27%.Prime—28, 202229, 2024 was 3.25%8.50%.2013 -12013-1, Ltd.20212023Issuer Name Industry Asset Name Asset
Type Reference Rate/Spread LIBOR Floor Current Rate
(All In) Maturity
Date Principal/
Number of Shares Cost Fair Value Covia Holdings C/S (Unimin) Metals & Mining Common Stock Equity - - - - - 49,312 385,327 $ 362,443 Fusion Connect Warrant Telecommunications Warrants Equity - - - - - 32,832 - 328 J Jill Common Stock Retail Common Stock Equity - - - - - 5,085 - 24,966 McDermott International (Americas), Inc. Energy: Oil & Gas Lealand Finance (McDermott International) C/S - Cl Equity - - - - - 141,797 141,797 113,438 ABB Con-Cise Optical Group LLC Consumer goods: Non-durable Term Loan B Loan 6M USD LIBOR+ 5.00 % 1.00 % 6.00 % 6/15/2023 2,060,408 $ 2,046,779 1,952,875 Adtalem Global Education Inc. Services: Business Adtalem Global Education T/L B (02/21) Loan 1M USD LIBOR+ 4.50 % 0.75 % 5.25 % 2/12/2028 2,000,000 1,980,000 1,980,000 Advisor Group, Inc. Banking, Finance, Insurance & Real Estate Advisor Group Holdings T/L B1 Loan 1M USD LIBOR+ 4.50 % 0.00 % 4.61 % 7/31/2026 995,000 994,026 996,383 Aegis Sciences Corporation Healthcare & Pharmaceuticals Term Loan Loan 3M USD LIBOR+ 5.50 % 1.00 % 6.50 % 5/9/2025 3,867,445 3,842,999 3,527,419 Agiliti Health Inc. Healthcare & Pharmaceuticals Term Loan (09/20) Loan 1M USD LIBOR+ 2.75 % 0.75 % 3.50 % 1/4/2026 500,000 495,337 497,500 Agiliti Health Inc. Healthcare & Pharmaceuticals Term Loan (1/19) Loan 1M USD LIBOR+ 2.75 % 0.00 % 2.88 % 1/4/2026 491,250 491,250 487,566 Ahead Data Blue, LLC Services: Business Term Loan (10/20) Loan 6M USD LIBOR+ 5.00 % 1.00 % 6.00 % 9/18/2027 3,000,000 2,885,073 3,017,250 AI Convoy (Luxembourg) S.a.r.l. Aerospace & Defense AI Convoy (Luxembourg) USD T/L B Loan 6M USD LIBOR+ 3.50 % 1.00 % 4.50 % 1/18/2027 1,488,750 1,482,360 1,486,353 AIS HoldCo, LLC Services: Business Term Loan Loan 3M USD LIBOR+ 5.00 % 0.00 % 5.21 % 8/15/2025 5,246,875 5,082,782 5,089,469 Alchemy Copyrights, LLC Media: Diversified & Production Term Loan B Loan 1M USD LIBOR+ 3.25 % 0.75 % 4.00 % 8/16/2027 498,750 495,356 498,750 Alchemy US Holdco 1, LLC Metals & Mining Term Loan Loan 1M USD LIBOR+ 5.50 % 0.00 % 5.61 % 10/10/2025 1,900,000 1,879,839 1,850,923 Alion Science and Technology Corporation Aerospace & Defense Term Loan (2/21) Loan 1M USD LIBOR+ 2.75 % 0.75 % 3.50 % 7/23/2024 3,990,000 3,974,081 3,998,299 AlixPartners, LLP Banking, Finance, Insurance & Real Estate AlixPartners T/L B (01/21) Loan 1M USD LIBOR+ 2.75 % 0.50 % 3.25 % 1/27/2028 250,000 249,375 249,888 Allen Media, LLC Media: Diversified & Production Allen Media T/L B (1/20) Loan 3M USD LIBOR+ 5.50 % 0.00 % 5.75 % 2/10/2027 2,977,027 2,964,383 2,971,460 Altisource Solutions S.a r.l. Banking, Finance, Insurance & Real Estate Term Loan B (03/18) Loan 3M USD LIBOR+ 4.00 % 1.00 % 5.00 % 4/3/2024 1,223,297 1,218,530 1,040,940 Altium Packaging LLC Containers, Packaging & Glass Altium Packaging (Consolidated Container) T/L (01/ Loan 3M USD LIBOR+ 2.75 % 0.50 % 3.25 % 1/29/2028 500,000 497,500 499,000 Altra Industrial Motion Corp. Capital Equipment Term Loan Loan 1M USD LIBOR+ 2.00 % 0.00 % 2.11 % 10/1/2025 1,522,387 1,519,700 1,520,012 American Greetings Corporation Media: Advertising, Printing & Publishing Term Loan Loan 1M USD LIBOR+ 4.50 % 1.00 % 5.50 % 4/6/2024 4,230,503 4,228,066 4,239,302 American Trailer World Corp Automotive American Trailer World T/L Loan 1M USD LIBOR+ 3.75 % 0.75 % 4.50 % 2/17/2028 2,000,000 1,990,000 1,990,000 AmeriLife Holdings LLC Banking, Finance, Insurance & Real Estate AmeriLife T/L Loan 1M USD LIBOR+ 4.00 % 0.00 % 4.12 % 3/18/2027 1,492,642 1,484,080 1,490,149 AmWINS Group, LLC Banking, Finance, Insurance & Real Estate AmWINS Group (2/21) T/L Loan 1M USD LIBOR+ 2.25 % 0.75 % 3.00 % 2/17/2028 2,000,000 1,995,000 1,999,160 Anastasia Parent LLC Consumer goods: Non-durable Term Loan Loan 3M USD LIBOR+ 3.75 % 0.00 % 4.00 % 8/11/2025 977,500 974,191 669,891 Anchor Glass Container Corporation Containers, Packaging & Glass Term Loan (07/17) Loan 3M USD LIBOR+ 2.75 % 1.00 % 3.75 % 12/7/2023 480,088 478,981 407,076 Anchor Packaging, LLC Containers, Packaging & Glass Term Loan B Loan 1M USD LIBOR+ 4.00 % 0.00 % 4.11 % 7/10/2026 997,468 987,853 999,962 APi Group DE, Inc. (J2 Acquisition) Services: Business Term Loan B Loan 1M USD LIBOR+ 2.50 % 0.00 % 2.61 % 10/1/2026 990,000 985,758 990,000 Issuer Name Industry Asset Name Asset
Type Reference Rate/Spread SOFR/
LIBOR
Floor Current
Rate (All In) Maturity
Date Principal/
Number of Shares Cost Fair Value 19TH HOLDINGS GOLF, LLC Consumer goods: Durable Term Loan Loan 1M USD SOFR+ 3.00 % 0.50 % 7.67 % 2/7/2029 $ 1,997,500 $ 1,924,905 $ 1,901,380 888 Acquisitions Limited Hotel, Gaming & Leisure Term Loan B Loan 3M USD SOFR+ 5.25 % 0.00 % 9.93 % 7/8/2028 2,494,565 2,143,085 2,126,617 ADMI Corp. Healthcare & Pharmaceuticals Term Loan B Loan 1M USD LIBOR+ 3.00 % 0.00 % 7.63 % 4/30/2025 1,910,276 1,907,516 1,825,517 Adtalem Global Education Inc. Services: Business Term Loan B (02/21) Loan 1M USD LIBOR+ 4.00 % 0.75 % 8.63 % 8/11/2028 691,846 686,475 689,992 Aegis Sciences Corporation Healthcare & Pharmaceuticals Term Loan Loan 3M USD LIBOR+ 5.50 % 1.00 % 10.36 % 5/9/2025 2,349,601 2,341,307 2,268,540 Agiliti Health Inc. Healthcare & Pharmaceuticals Term Loan (09/20) Loan 1M USD LIBOR+ 2.75 % 0.75 % 7.38 % 1/4/2026 214,286 213,103 212,946 Agiliti Health Inc. Healthcare & Pharmaceuticals Term Loan (1/19) Loan 1M USD LIBOR+ 2.75 % 0.00 % 7.38 % 1/4/2026 1,468,430 1,463,378 1,457,416 AHEAD DB Holdings, LLC Services: Business Term Loan (04/21) Loan 3M USD LIBOR+ 3.75 % 0.75 % 8.48 % 10/18/2027 2,955,000 2,871,299 2,915,285 AI Convoy (Luxembourg) S.a.r.l. Aerospace & Defense Term Loan B (USD) Loan 6M USD LIBOR+ 3.50 % 1.00 % 8.17 % 1/18/2027 - - - Air Canada Transportation: Consumer Term Loan B (07/21) Loan 3M USD LIBOR+ 3.50 % 0.75 % 8.37 % 8/11/2028 1,990,000 1,851,613 1,984,408 AIS HoldCo, LLC Services: Business Term Loan Loan 3M USD LIBOR+ 5.00 % 0.00 % 9.83 % 8/15/2025 4,789,642 4,700,517 4,622,004 AIT Worldwide Logistics Holdings, Inc. Transportation: Cargo Term Loan (04/21) Loan 1M USD LIBOR+ 4.75 % 0.75 % 9.33 % 4/6/2028 2,500,000 2,333,827 2,407,300 AL GCX Holdings (Arclight) T/L B Energy: Oil & Gas Term Loan B Loan 3M USD SOFR+ 3.50 % 0.50 % 8.28 % 5/17/2029 976,802 971,918 975,581 Alchemy US Holdco 1, LLC Metals & Mining Term Loan Loan 1M USD LIBOR+ 5.50 % 0.00 % 5.60 % 10/10/2025 1,654,803 1,644,633 1,551,378 AlixPartners, LLP Banking, Finance, Insurance & Real Estate Term Loan B (01/21) Loan 1M USD LIBOR+ 2.75 % 0.50 % 7.38 % 2/4/2028 245,625 245,275 245,050 Alkermes, Inc. Healthcare & Pharmaceuticals Term Loan B (3/21) Loan 1M USD LIBOR+ 2.50 % 0.50 % 7.11 % 3/12/2026 2,126,218 2,112,914 2,062,432 Allen Media, LLC Media: Diversified & Production Term Loan (7/21) Loan 3M USD SOFR+ 5.50 % 0.00 % 10.23 % 2/10/2027 4,394,261 4,368,566 3,649,434 Alliant Holdings Intermediate, LLC Banking, Finance, Insurance & Real Estate Term Loan B4 Loan 1M USD LIBOR+ 3.50 % 0.50 % 8.09 % 11/5/2027 987,500 986,800 974,781 Allied Universal Holdco LLC Services: Business Term Loan 4/21 Loan 1M USD SOFR+ 3.75 % 0.50 % 8.47 % 5/12/2028 1,975,000 1,967,474 1,900,404 Altisource Solutions S.a r.l. Banking, Finance, Insurance & Real Estate Term Loan B (03/18) Loan 3M USD LIBOR+ 4.00 % 1.00 % 8.73 % 4/3/2024 1,126,283 1,124,635 893,142 Altium Packaging LLC Containers, Packaging & Glass Term Loan (01/21) Loan 1M USD LIBOR+ 2.75 % 0.50 % 7.38 % 1/29/2028 491,250 489,554 480,506 American Airlines T/L (2/23) Transportation: Consumer Term Loan Loan N/A N/A N/A N/A N/A - 27 - American Axle & Manufacturing Inc. Automotive Term Loan (12/22) Loan 1M USD SOFR+ 3.50 % 0.50 % 8.16 % 12/5/2029 500,000 485,367 499,000 American Greetings Corporation Media: Advertising, Printing & Publishing Term Loan Loan 1M USD LIBOR+ 4.50 % 1.00 % 9.07 % 4/6/2024 3,012,861 3,011,462 3,011,596 American Trailer World Corp Automotive Term Loan Loan 1M USD SOFR+ 3.75 % 0.75 % 8.47 % 3/3/2028 1,357,439 1,354,762 1,194,967 AmWINS Group, LLC Banking, Finance, Insurance & Real Estate Term Loan 2/21 Loan 1M USD LIBOR+ 2.25 % 0.75 % 6.88 % 2/17/2028 1,960,017 1,940,778 1,926,462 2013 -12013-1, Ltd.2021Issuer Name Industry Asset Name Asset
Type Reference Rate/Spread LIBOR Floor Current Rate
(All In) Maturity
Date Principal/
Number of Shares Cost Fair Value APLP Holdings Limited Partnership Energy: Electricity APLP Holdings T/L B (01/20) Loan 1M USD LIBOR+ 2.50 % 1.00 % 3.50 % 4/14/2025 1,618,421 1,618,421 1,617,207 Apollo Commercial Real Estate Finance, Inc. Banking, Finance, Insurance & Real Estate Term Loan B Loan 1M USD LIBOR+ 2.75 % 0.00 % 2.86 % 5/15/2026 3,000,000 2,960,051 2,925,000 AppLovin Corporation High Tech Industries Applovin T/L B Loan 1M USD LIBOR+ 3.50 % 0.00 % 3.61 % 8/15/2025 1,000,000 1,000,000 998,100 Aramark Corporation Services: Consumer Term Loan Loan 1M USD LIBOR+ 1.75 % 0.00 % 1.86 % 1/15/2027 2,481,250 2,401,701 2,454,105 Arctic Glacier U.S.A., Inc. Beverage, Food & Tobacco Term Loan (3/18) Loan 3M USD LIBOR+ 3.50 % 1.00 % 4.50 % 3/20/2024 3,350,967 3,337,028 3,140,124 Aretec Group, Inc. Banking, Finance, Insurance & Real Estate Term Loan (10/18) Loan 1M USD LIBOR+ 4.25 % 0.00 % 4.36 % 10/1/2025 1,960,000 1,956,623 1,954,492 ARISTOCRAT LEISURE LIMITED Hotel, Gaming & Leisure Term Loan (5/20) Loan 2M USD LIBOR+ 3.75 % 1.00 % 4.75 % 10/19/2024 995,000 978,205 1,000,184 ASG Technologies Group, Inc High Tech Industries Term Loan Loan 1M USD LIBOR+ 3.50 % 1.00 % 4.50 % 7/31/2024 461,401 460,194 454,480 ASP MSG Acquisition Co., Inc Beverage, Food & Tobacco Term Loan (2/17) Loan 1M USD LIBOR+ 4.00 % 1.00 % 5.00 % 8/16/2023 3,830,991 3,793,847 3,835,779 Aspen Dental Management, Inc. Services: Consumer Term Loan B Loan 1M USD LIBOR+ 2.75 % 0.00 % 2.86 % 4/30/2025 1,950,276 1,944,024 1,926,872 Asplundh Tree Expert, LLC Services: Business Term Loan Loan 1M USD LIBOR+ 2.50 % 0.00 % 2.61 % 9/4/2027 997,500 992,854 998,128 Asurion, LLC Banking, Finance, Insurance & Real Estate Term Loan B6 Loan 1M USD LIBOR+ 3.00 % 0.00 % 3.11 % 11/3/2023 328,929 327,483 328,244 Asurion, LLC Banking, Finance, Insurance & Real Estate Term Loan B8 Loan 1M USD LIBOR+ 3.25 % 0.00 % 3.36 % 12/18/2026 1,525,365 1,515,790 1,520,362 Avast Software S.R.O. (Sybil Finance) High Tech Industries Term Loan B (4/18) Loan 3M USD LIBOR+ 2.25 % 1.00 % 3.25 % 9/29/2023 650,351 642,686 650,351 Avaya, Inc. Telecommunications Term Loan B1 Loan 1M USD LIBOR+ 4.25 % 0.00 % 4.36 % 12/15/2027 1,755,766 1,745,975 1,760,437 Avaya, Inc. Telecommunications Avaya T/L B-2 Loan 1M USD LIBOR+ 4.00 % 0.00 % 4.11 % 12/15/2027 1,000,000 1,000,000 1,001,250 Avison Young (Canada) Inc Services: Business Term Loan Loan 3M USD LIBOR+ 5.00 % 0.00 % 5.19 % 1/31/2026 3,441,108 3,392,968 3,441,108 Avolon TLB Borrower 1 (US) LLC Capital Equipment Term Loan B3 Loan 1M USD LIBOR+ 1.75 % 0.75 % 2.50 % 1/15/2025 1,000,000 869,301 996,390 Avolon TLB Borrower 1 (US) LLC Capital Equipment Term Loan B5 Loan 1M USD LIBOR+ 2.50 % 0.75 % 3.25 % 12/20/2027 500,000 495,171 500,625 Azalea TopCo, Inc. Services: Business Incremental Term Loan Loan 3M USD LIBOR+ 4.00 % 0.75 % 4.75 % 7/24/2026 500,000 495,287 501,250 B&G Foods, Inc. Beverage, Food & Tobacco Term Loan Loan 1M USD LIBOR+ 2.50 % 0.00 % 2.61 % 10/10/2026 706,458 700,750 706,960 B.C. Unlimited Liability Co (Burger King) Beverage, Food & Tobacco Term Loan B4 Loan 1M USD LIBOR+ 1.75 % 0.00 % 1.86 % 11/19/2026 1,485,000 1,447,423 1,469,912 Baldwin Risk Partners, LLC Banking, Finance, Insurance & Real Estate Term Loan Loan 1M USD LIBOR+ 4.00 % 0.75 % 4.75 % 10/14/2027 997,500 983,184 1,002,488 BALL METALPACK, LLC (PE Spray) Containers, Packaging & Glass Term Loan Loan 3M USD LIBOR+ 4.50 % 0.00 % 4.69 % 7/25/2025 3,904,887 3,891,579 3,887,823 Bass Pro Group, LLC Retail Term Loan B (02/21) Loan 1M USD LIBOR+ 4.25 % 0.75 % 5.00 % 2/26/2028 1,000,000 995,000 1,000,780 Berry Plastics Holding Corporation Chemicals, Plastics, & Rubber Term Loan Y Loan 1M USD LIBOR+ 2.00 % 0.00 % 2.12 % 7/1/2026 4,937,374 4,932,962 4,932,980 Blackstone Mortgage Trust, Inc. Banking, Finance, Insurance & Real Estate Term Loan B Loan 1M USD LIBOR+ 2.25 % 0.00 % 2.36 % 4/23/2026 1,000,000 992,500 985,000 Blackstone Mortgage Trust, Inc. Banking, Finance, Insurance & Real Estate Blackstone Mortgage T/L B-2 Loan 1M USD LIBOR+ 4.75 % 1.00 % 5.75 % 4/23/2026 1,494,994 1,484,017 1,498,731 Blount International, Inc. Forest Products & Paper Term Loan B (09/18) Loan 1M USD LIBOR+ 3.75 % 1.00 % 4.75 % 4/12/2023 3,418,806 3,416,907 3,422,225 Blucora, Inc. Services: Consumer Term Loan (11/17) Loan 3M USD LIBOR+ 4.00 % 1.00 % 5.00 % 5/22/2024 2,451,227 2,443,549 2,454,291 Bombardier Recreational Products, Inc. Consumer goods: Durable Term Loan (1/20) Loan 1M USD LIBOR+ 2.00 % 0.00 % 2.12 % 5/24/2027 1,485,050 1,473,875 1,475,620 Boxer Parent Company, Inc. High Tech Industries Boxer Parent Company T/L (BMC Software) (2/21) Loan 1M USD LIBOR+ 3.75 % 0.00 % 3.90 % 10/2/2025 528,897 528,897 528,829 Bracket Intermediate Holding Corp Healthcare & Pharmaceuticals Term Loan Loan 3M USD LIBOR+ 4.25 % 0.00 % 4.49 % 9/5/2025 977,500 974,177 975,868 BrightSpring Health Services (Phoenix Guarantor) Healthcare & Pharmaceuticals Phoenix Guarantor (Brightspring) T/L (02/21) Loan 6M USD LIBOR+ 3.50 % 0.00 % 3.76 % 3/5/2026 1,000,000 1,000,000 1,000,710 Issuer Name Industry Asset Name Asset
Type Reference Rate/Spread SOFR/
LIBOR Floor Current
Rate (All In) Maturity
Date Principal/
Number of Shares Cost Fair Value Anastasia Parent LLC Consumer goods: Non-durable Term Loan Loan 3M USD LIBOR+ 3.75 % 0.00 % 8.48 % 8/11/2025 957,500 955,643 791,134 Anchor Glass Container Corporation Containers, Packaging & Glass Term Loan (07/17) Loan 3M USD LIBOR+ 2.75 % 1.00 % 7.48 % 12/7/2023 470,138 469,901 333,915 Anchor Packaging, LLC Containers, Packaging & Glass Term Loan B Loan 1M USD LIBOR+ 4.00 % 0.00 % 8.63 % 7/18/2026 977,215 971,052 952,785 ANI Pharmaceuticals, Inc. Healthcare & Pharmaceuticals Term Loan B Loan 1M USD LIBOR+ 6.00 % 0.75 % 10.63 % 11/19/2027 2,970,000 2,922,446 2,866,050 AP Core Holdings II LLC High Tech Industries Term Loan B1 Loan 1M USD LIBOR+ 5.50 % 0.75 % 10.13 % 9/1/2027 1,875,000 1,852,824 1,802,344 AP Core Holdings II LLC High Tech Industries Term Loan B2 Loan 1M USD LIBOR+ 5.50 % 0.75 % 10.13 % 9/1/2027 500,000 494,095 480,415 APEX GROUP TREASURY LLC Banking, Finance, Insurance & Real Estate Term Loan Loan 3M USD SOFR+ 5.00 % 0.50 % 9.66 % 7/26/2028 500,000 468,464 497,500 APi Group DE, Inc. (J2 Acquisition) Services: Business Term Loan B Loan 1M USD LIBOR+ 2.50 % 0.00 % 7.13 % 10/1/2026 1,757,184 1,751,429 1,754,548 APLP Holdings Limited Partnership Energy: Electricity Term Loan B (3/21) Loan 3M USD LIBOR+ 3.75 % 1.00 % 8.48 % 5/14/2027 440,541 437,327 440,726 Apollo Commercial Real Estate Finance, Inc. Banking, Finance, Insurance & Real Estate Term Loan B Loan 1M USD LIBOR+ 2.75 % 0.00 % 7.38 % 5/15/2026 2,939,086 2,914,348 2,850,914 Apollo Commercial Real Estate Finance, Inc. Banking, Finance, Insurance & Real Estate Term Loan B1 (2/21) Loan 1M USD LIBOR+ 3.50 % 0.50 % 8.13 % 3/6/2028 982,500 975,109 928,463 AppLovin Corporation High Tech Industries Term Loan (10/21) Loan 3M USD SOFR+ 3.10 % 0.50 % 7.70 % 10/21/2028 1,488,750 1,485,729 1,472,002 AppLovin Corporation High Tech Industries Term Loan B Loan 3M USD SOFR+ 3.35 % 0.00 % 7.94 % 8/15/2025 979,592 979,592 972,245 Aramark Corporation Services: Consumer Term Loan B (4/21) Loan 1M USD LIBOR+ 2.50 % 0.00 % 7.13 % 4/1/2028 1,753,715 1,747,448 1,747,139 Aramark Corporation Services: Consumer Term Loan Loan 1M USD LIBOR+ 1.75 % 0.00 % 6.38 % 1/15/2027 2,331,250 2,280,733 2,305,023 ARC FALCON I INC. Chemicals, Plastics, & Rubber Term Loan Loan 1M USD LIBOR+ 3.75 % 0.50 % 8.38 % 9/23/2028 863,885 860,682 811,836 ARC FALCON I INC. (a) Chemicals, Plastics, & Rubber Delayed Draw Term Loan Loan 3M USD LIBOR+ 1.00 % 0.50 % 1.00 % 9/29/2028 - (512 ) (7,675 ) Arches Buyer Inc. Services: Consumer Term Loan B Loan 1M USD SOFR+ 3.25 % 0.50 % 7.97 % 12/6/2027 1,484,848 1,477,106 1,395,758 Aretec Group, Inc. Banking, Finance, Insurance & Real Estate Term Loan (10/18) Loan 1M USD SOFR+ 4.25 % 0.00 % 8.97 % 10/1/2025 1,916,203 1,913,228 1,887,460 ASP BLADE HOLDINGS, INC. Capital Equipment Term Loan Loan 3M USD LIBOR+ 4.00 % 0.50 % 8.73 % 10/7/2028 99,059 98,658 82,491 Asplundh Tree Expert, LLC Services: Business Term Loan 2/21 Loan 1M USD LIBOR+ 1.75 % 0.00 % 6.38 % 9/7/2027 977,500 974,396 974,010 AssuredPartners Capital, Inc. Banking, Finance, Insurance & Real Estate Term Loan B (2/20) Loan 1M USD LIBOR+ 3.50 % 0.00 % 8.13 % 2/12/2027 989,796 986,847 967,773 AssuredPartners Inc. Banking, Finance, Insurance & Real Estate Term Loan Loan 1M USD SOFR+ 3.50 % 0.50 % 8.12 % 2/12/2027 496,250 495,400 485,084 AssuredPartners Inc. Banking, Finance, Insurance & Real Estate Incremental Term Loan (7/21) Loan 1M USD LIBOR+ 3.50 % 0.50 % 8.13 % 2/12/2027 985,000 985,000 962,838 ASTRO ONE ACQUISITION CORPORATION Consumer goods: Durable Term Loan Loan 3M USD LIBOR+ 5.50 % 0.75 % 10.23 % 9/15/2028 2,970,000 2,946,187 1,767,150 Asurion, LLC Banking, Finance, Insurance & Real Estate Term Loan B10 Loan 3M USD SOFR+ 4.00 % 0.00 % 8.68 % 8/19/2028 1,995,000 1,901,937 1,866,741 2013 -12013-1, Ltd.20212023Issuer Name Industry Asset Name Asset
Type Reference Rate/Spread LIBOR Floor Current Rate
(All In) Maturity
Date Principal/
Number of Shares Cost Fair Value BroadStreet Partners, Inc. Banking, Finance, Insurance & Real Estate Term Loan B3 Loan 1M USD LIBOR+ 3.25 % 0.00 % 3.36 % 1/22/2027 2,009,429 2,007,872 1,996,207 Brookfield WEC Holdings Inc. Energy: Electricity Brookfield WEC T/L (Westinghouse) (1/21) Loan 1M USD LIBOR+ 2.75 % 0.50 % 3.25 % 8/1/2025 1,492,462 1,495,340 1,488,492 Buckeye Partners, L.P. Utilities: Oil & Gas Buckeye Partners T/L (1/21) Loan 1M USD LIBOR+ 2.25 % 0.00 % 2.37 % 11/1/2026 1,989,987 1,975,617 1,987,182 BW Gas & Convenience Holdings LLC Beverage, Food & Tobacco Term Loan Loan 1M USD LIBOR+ 6.25 % 0.00 % 6.37 % 11/18/2024 2,230,357 2,160,253 2,255,449 Cable & Wireless Communications Limited Telecommunications Term Loan B-5 Loan 1M USD LIBOR+ 2.25 % 0.00 % 2.36 % 1/31/2028 2,000,000 2,000,000 1,988,220 Callaway Golf Company Retail Term Loan B Loan 1M USD LIBOR+ 4.50 % 0.00 % 4.61 % 1/4/2026 690,000 679,310 692,298 Cardtronics Inc Banking, Finance, Insurance & Real Estate Term Loan Loan 1M USD LIBOR+ 4.00 % 1.00 % 5.00 % 6/29/2027 1,494,994 1,489,184 1,495,936 CareerBuilder, LLC Services: Business Term Loan Loan 3M USD LIBOR+ 6.75 % 1.00 % 7.75 % 7/31/2023 3,393,388 3,230,834 3,230,505 CareStream Health, Inc. Healthcare & Pharmaceuticals Term Loan Loan 6M USD LIBOR+ 6.75 % 1.00 % 7.75 % 5/8/2023 2,306,786 2,302,501 2,298,136 Casa Systems, Inc Telecommunications Term Loan Loan 6M USD LIBOR+ 4.00 % 1.00 % 5.00 % 12/20/2023 1,440,000 1,433,828 1,435,205 Castle US Holding Corporation Media: Advertising, Printing & Publishing Term Loan B (USD) Loan 3M USD LIBOR+ 3.75 % 0.00 % 4.00 % 1/27/2027 496,875 494,809 493,059 Catalent Pharma Solutions, Inc. Healthcare & Pharmaceuticals Term Loan B3 (2/21) Loan 1M USD LIBOR+ 2.00 % 0.50 % 2.50 % 5/18/2026 500,000 500,000 500,780 CBI BUYER, INC. Consumer goods: Durable New Trojan Parent (Careismatic/CBI Buyer) 1st Lien Loan 1M USD LIBOR+ 3.25 % 0.50 % 3.75 % 1/6/2028 1,000,000 997,597 1,000,630 CCI Buyer, Inc Telecommunications Term Loan Loan 3M USD LIBOR+ 4.00 % 0.75 % 4.75 % 12/17/2027 250,000 247,558 251,720 CCS-CMGC Holdings, Inc. Healthcare & Pharmaceuticals Term Loan Loan 1M USD LIBOR+ 5.50 % 0.00 % 5.61 % 9/25/2025 2,450,000 2,432,841 2,417,856 Cengage Learning Acquisitions, Inc. Media: Advertising, Printing & Publishing Term Loan Loan 6M USD LIBOR+ 4.25 % 1.00 % 5.25 % 6/7/2023 1,432,459 1,424,074 1,410,370 CenturyLink, Inc. Telecommunications Term Loan B (1/20) Loan 1M USD LIBOR+ 2.25 % 0.00 % 2.36 % 3/15/2027 2,970,000 2,967,083 2,957,170 Chemours Company, (The) Chemicals, Plastics, & Rubber Term Loan Loan 1M USD LIBOR+ 1.75 % 0.00 % 1.87 % 4/3/2025 989,822 940,018 979,617 CITADEL SECURITIES LP Banking, Finance, Insurance & Real Estate Citadel Securities T/L B (01/21) Loan 1M USD LIBOR+ 2.50 % 0.00 % 2.61 % 2/27/2028 5,000,000 4,993,750 4,970,300 Clarios Global LP Automotive Term Loan B Loan 1M USD LIBOR+ 3.50 % 0.00 % 3.61 % 4/30/2026 1,454,464 1,442,855 1,455,381 Claros Mortgage Trust, Inc Banking, Finance, Insurance & Real Estate Term Loan B Loan 1M USD LIBOR+ 5.00 % 1.00 % 6.00 % 8/9/2026 997,475 972,272 999,968 CNT Holdings I Corp Retail Term Loan Loan 6M USD LIBOR+ 3.75 % 0.75 % 4.50 % 11/8/2027 500,000 497,627 501,955 Cole Haan Consumer goods: Non-durable Term Loan B Loan 3M USD LIBOR+ 5.50 % 0.00 % 5.69 % 2/7/2025 950,000 942,246 874,000 Compass Power Generation, LLC Utilities: Electric Term Loan B (08/18) Loan 1M USD LIBOR+ 3.50 % 1.00 % 4.50 % 12/20/2024 1,802,012 1,798,648 1,796,390 Concordia Healthcare Corp. Healthcare & Pharmaceuticals Term Loan Loan 1M USD LIBOR+ 5.50 % 1.00 % 6.50 % 9/6/2024 1,159,370 1,118,148 1,156,472 Connect Finco SARL Telecommunications Term Loan (1/21) Loan 1M USD LIBOR+ 3.50 % 1.00 % 4.50 % 12/11/2026 2,977,500 2,831,053 2,987,058 Consolidated Communications, Inc. Telecommunications Term Loan B (10/20) Loan 1M USD LIBOR+ 4.75 % 1.00 % 5.75 % 10/2/2027 997,500 983,260 1,002,328 CoreCivic, Inc. Banking, Finance, Insurance & Real Estate Term Loan (12/19) Loan 1M USD LIBOR+ 4.50 % 1.00 % 5.50 % 12/18/2024 3,454,545 3,404,660 3,340,822 CPI Card Group Banking, Finance, Insurance & Real Estate Term Loan B (1st Lien) Loan 3M USD LIBOR+ 4.50 % 1.00 % 5.50 % 8/17/2022 1,436,782 1,431,179 1,422,414 CSC Holdings LLC (Neptune Finco Corp.) Media: Broadcasting & Subscription Term Loan B Loan 1M USD LIBOR+ 2.25 % 0.00 % 2.36 % 1/15/2026 490,000 489,175 486,849 CSC Holdings LLC (Neptune Finco Corp.) Media: Broadcasting & Subscription Term Loan B (03/17) Loan 1M USD LIBOR+ 2.25 % 0.00 % 2.36 % 7/15/2025 1,954,315 1,936,120 1,941,925 CSC Holdings LLC (Neptune Finco Corp.) Media: Broadcasting & Subscription Term Loan B-5 Loan 1M USD LIBOR+ 2.50 % 0.00 % 2.61 % 4/15/2027 495,000 495,000 492,911 CTS Midco, LLC High Tech Industries Term Loan B Loan 3M USD LIBOR+ 6.00 % 1.00 % 7.00 % 11/2/2027 2,000,000 1,942,014 2,002,500 Issuer Name Industry Asset Name Asset
Type Reference Rate/Spread SOFR/
LIBOR Floor Current
Rate (All In) Maturity
Date Principal/
Number of Shares Cost Fair Value Asurion, LLC Banking, Finance, Insurance & Real Estate Term Loan B8 Loan 1M USD LIBOR+ 3.25 % 0.00 % 7.88 % 12/18/2026 2,964,858 2,956,667 2,817,683 ATHENAHEALTH GROUP INC. Healthcare & Pharmaceuticals Term Loan B (2/22) Loan 1M USD SOFR+ 3.50 % 0.50 % 8.06 % 2/15/2029 1,330,543 1,325,206 1,227,426 ATHENAHEALTH GROUP INC. (a) Healthcare & Pharmaceuticals Delayed Draw Term Loan (02/22) Loan 3M USD LIBOR+ 3.50 % 0.50 % 3.50 % 2/15/2029 - - (12,636 ) Avison Young (Canada) Inc Services: Business Term Loan (08/22) Loan 1M USD SOFR+ 7.00 % 0.00 % 11.73 % 1/31/2026 748,125 708,918 635,906 Avison Young (Canada) Inc Services: Business Term Loan Loan 1M USD SOFR+ 5.75 % 0.00 % 10.48 % 1/31/2026 3,370,882 3,344,831 2,646,142 Avolon TLB Borrower 1 (US) LLC Capital Equipment Term Loan B5 (7/21) Loan 1M USD LIBOR+ 2.25 % 0.50 % 6.85 % 12/1/2027 490,000 486,530 489,539 Avolon TLB Borrower 1 (US) LLC Capital Equipment Term Loan B3 Loan 1M USD LIBOR+ 1.75 % 0.75 % 6.35 % 1/15/2025 1,000,000 932,184 998,440 Axalta Coating Systems Dutch Holding B B.V. Chemicals, Plastics, & Rubber Term Loan B-4 Dollar Loan 3M USD SOFR+ 3.00 % 0.50 % 7.51 % 12/7/2029 1,000,000 990,447 1,003,570 AZURITY PHARMACEUTICALS, INC. Healthcare & Pharmaceuticals Term Loan B Loan 3M USD LIBOR+ 6.00 % 0.75 % 10.75 % 9/20/2027 475,000 463,094 457,188 B&G Foods, Inc. Beverage, Food & Tobacco Term Loan Loan 1M USD LIBOR+ 2.50 % 0.00 % 7.13 % 10/10/2026 642,295 638,890 613,391 B.C. Unlimited Liability Co (Burger King) Beverage, Food & Tobacco Term Loan B4 Loan 1M USD LIBOR+ 1.75 % 0.00 % 6.38 % 11/19/2026 1,455,000 1,430,342 1,440,712 BAKELITE UK INTERMEDIATE LTD. Chemicals, Plastics, & Rubber Term Loan Loan 3M USD SOFR+ 4.00 % 0.50 % 8.73 % 5/29/2029 995,000 990,609 940,275 Baldwin Risk Partners, LLC Banking, Finance, Insurance & Real Estate Term Loan Loan 1M USD LIBOR+ 3.50 % 0.50 % 8.10 % 10/14/2027 1,226,325 1,215,617 1,205,637 Bausch Health Companies Inc. Healthcare & Pharmaceuticals Term Loan B (1/22) Loan 1M USD SOFR+ 5.25 % 0.50 % 9.91 % 2/1/2027 1,950,000 1,764,574 1,534,299 Belfor Holdings Inc. Services: Consumer Term Loan B-2 (3/22) Loan 1M USD SOFR+ 4.25 % 0.50 % 8.87 % 4/6/2026 994,911 971,026 992,424 Belfor Holdings Inc. Services: Consumer Term Loan Loan 1M USD LIBOR+ 4.00 % 0.00 % 8.63 % 4/6/2026 245,547 245,547 244,995 Belron Finance US LLC Automotive Term Loan B (3/21) Loan 3M USD LIBOR+ 2.50 % 0.50 % 7.38 % 4/13/2028 1,965,000 1,950,181 1,960,913 Bengal Debt Merger Sub LLC Beverage, Food & Tobacco Term Loan Loan 3M USD SOFR+ 3.25 % 0.50 % 7.93 % 1/24/2029 1,990,000 1,988,811 1,804,273 Blackstone Mortgage Trust, Inc. Banking, Finance, Insurance & Real Estate Term Loan (6/21) Loan 1M USD LIBOR+ 2.75 % 0.50 % 7.38 % 4/23/2026 1,465,141 1,457,842 1,441,332 Blackstone Mortgage Trust, Inc. Banking, Finance, Insurance & Real Estate Term Loan B Loan 1M USD LIBOR+ 2.25 % 0.00 % 6.88 % 4/23/2026 979,747 975,006 952,804 Blue Tree Holdings, Inc. Chemicals, Plastics, & Rubber Term Loan (2/21) Loan 3M USD LIBOR+ 2.50 % 0.00 % 7.23 % 3/4/2028 982,500 980,692 967,763 Bombardier Recreational Products, Inc. Consumer goods: Durable Term Loan 12/22 Loan 1M USD SOFR+ 3.50 % 0.50 % 8.12 % 12/12/2029 498,750 486,572 496,007 Bombardier Recreational Products, Inc. Consumer goods: Durable Term Loan (1/20) Loan 1M USD LIBOR+ 2.00 % 0.00 % 6.63 % 5/24/2027 1,455,049 1,449,140 1,416,854 Boxer Parent Company, Inc. High Tech Industries Term Loan (2/21) Loan 1M USD LIBOR+ 3.75 % 0.00 % 8.38 % 10/2/2025 516,794 516,794 509,827 Bracket Intermediate Holding Corp Healthcare & Pharmaceuticals Term Loan Loan 3M USD LIBOR+ 4.25 % 0.00 % 9.04 % 9/5/2025 957,500 955,597 929,378 BrightSpring Health Services (Phoenix Guarantor) Healthcare & Pharmaceuticals Term Loan B-3 Loan 1M USD LIBOR+ 3.50 % 0.00 % 8.13 % 3/5/2026 982,500 982,500 967,556 2013 -12013-1, Ltd.20212023Issuer Name Industry Asset Name Asset
Type Reference Rate/Spread LIBOR Floor Current Rate
(All In) Maturity
Date Principal/
Number of Shares Cost Fair Value Daseke Inc Transportation: Cargo Replacement Term Loan Loan 1M USD LIBOR+ 5.00 % 1.00 % 6.00 % 2/27/2024 1,935,738 1,928,854 1,939,978 DCert Buyer, Inc. High Tech Industries DCert Buyer T/L (Digicert) Loan 1M USD LIBOR+ 4.00 % 0.00 % 4.11 % 10/16/2026 1,500,000 1,500,000 1,500,540 Dealer Tire, LLC Automotive Dealer Tire T/L B-1 Loan 1M USD LIBOR+ 4.25 % 0.00 % 4.36 % 12/12/2025 2,970,000 2,963,784 2,966,288 Delek US Holdings, Inc. Utilities: Oil & Gas Term Loan B Loan 1M USD LIBOR+ 2.25 % 0.00 % 2.36 % 3/31/2025 6,380,682 6,326,939 6,247,773 Dell International LLC High Tech Industries Term Loan B-2 Loan 1M USD LIBOR+ 1.75 % 0.75 % 2.00 % 9/19/2025 2,530,374 2,528,058 2,537,763 Delta 2 (Lux) S.a.r.l. Hotel, Gaming & Leisure Term Loan B Loan 1M USD LIBOR+ 2.50 % 1.00 % 3.50 % 2/1/2024 818,289 817,549 813,175 Delta Air Lines, Inc. Transportation: Consumer Term Loan B (4/20) Loan 1M USD LIBOR+ 4.75 % 1.00 % 5.75 % 4/29/2023 2,243,737 2,240,713 2,257,761 DHX Media Ltd. Media: Broadcasting & Subscription Term Loan Loan 1M USD LIBOR+ 4.25 % 1.00 % 5.25 % 12/29/2023 279,282 278,315 278,584 Diamond Sports Group, LLC Media: Broadcasting & Subscription Term Loan Loan 1M USD LIBOR+ 3.25 % 0.00 % 3.37 % 8/24/2026 3,443,844 2,912,847 2,582,883 Digital Room LLC Media: Advertising, Printing & Publishing Term Loan Loan 6M USD LIBOR+ 5.00 % 0.00 % 5.27 % 5/21/2026 2,955,000 2,925,480 2,910,675 Dole Food Company Inc. Beverage, Food & Tobacco Term Loan B Loan 1M USD LIBOR+ 2.75 % 1.00 % 3.75 % 4/6/2024 456,250 455,172 456,410 DRW Holdings, LLC Banking, Finance, Insurance & Real Estate DRW Holdings T/L (2/21) Loan 1M USD LIBOR+ 3.75 % 0.00 % 3.87 % 2/24/2028 552,519 549,756 551,138 DRW Holdings, LLC Banking, Finance, Insurance & Real Estate Term Loan B Loan 1M USD LIBOR+ 4.25 % 0.00 % 4.36 % 11/29/2026 5,947,481 5,897,811 5,932,612 DTZ U.S. Borrower, LLC Construction & Building Term Loan Loan 1M USD LIBOR+ 2.75 % 0.00 % 2.86 % 8/21/2025 3,915,462 3,901,786 3,886,801 EagleTree - Carbride Acquisition (Corsair Components) Consumer goods: Durable Term Loan Loan 1M USD LIBOR+ 3.75 % 1.00 % 4.75 % 8/28/2024 2,868,047 2,867,816 2,868,047 Edelman Financial Group Inc., The Banking, Finance, Insurance & Real Estate Term Loan B (06/18) Loan 1M USD LIBOR+ 3.00 % 0.00 % 3.11 % 7/21/2025 1,225,000 1,220,875 1,214,502 Electrical Components Inter., Inc. Capital Equipment Term Loan (6/18) Loan 1M USD LIBOR+ 4.25 % 0.00 % 4.36 % 6/26/2025 1,950,000 1,947,116 1,903,083 ELO Touch Solutions, Inc. Media: Diversified & Production Term Loan (12/18) Loan 1M USD LIBOR+ 6.50 % 0.00 % 6.61 % 12/14/2025 2,558,602 2,457,436 2,564,999 Encapsys, LLC (Cypress Performance Group) Chemicals, Plastics, & Rubber Term Loan B2 Loan 1M USD LIBOR+ 3.25 % 1.00 % 4.25 % 11/7/2024 492,284 488,655 492,284 Endo Luxembourg Finance Company I S.a.r.l. Healthcare & Pharmaceuticals Term Loan B (4/17) Loan 3M USD LIBOR+ 4.25 % 0.75 % 5.00 % 4/29/2024 3,896,646 3,879,939 3,869,057 Endure Digital, Inc. High Tech Industries Endurance International T/L B Loan 1M USD LIBOR+ 3.50 % 0.75 % 4.25 % 1/27/2028 2,500,000 2,487,500 2,481,250 Ensemble RCM LLC Services: Business Term Loan Loan 3M USD LIBOR+ 3.75 % 0.00 % 3.96 % 7/24/2026 3,000,000 2,992,500 3,004,230 Enterprise Merger Sub Inc. Healthcare & Pharmaceuticals Term Loan B (06/18) Loan 1M USD LIBOR+ 3.75 % 0.00 % 3.86 % 10/10/2025 4,900,000 4,891,890 4,204,200 EVERI Payments Inc. Hotel, Gaming & Leisure Everi Payments T/L B Loan 1M USD LIBOR+ 2.75 % 0.75 % 3.50 % 5/9/2024 3,000,000 3,000,000 2,988,120 EyeCare Partners, LLC Healthcare & Pharmaceuticals EyeCare Partners T/L B Loan 1M USD LIBOR+ 3.75 % 0.00 % 3.86 % 2/18/2027 1,987,838 1,986,442 1,956,032 Finco I LLC Banking, Finance, Insurance & Real Estate FinCo T/L B (9/20) (Fortress Investment) Loan 1M USD LIBOR+ 2.50 % 0.00 % 2.61 % 6/27/2025 1,822,272 1,815,715 1,821,142 First Eagle Investment Management Banking, Finance, Insurance & Real Estate Refinancing Term Loan Loan 3M USD LIBOR+ 2.50 % 0.00 % 2.75 % 2/1/2027 5,395,500 5,375,893 5,378,990 Fitness International, LLC (LA Fitness) Services: Consumer Term Loan B (4/18) Loan 1M USD LIBOR+ 3.25 % 1.00 % 4.25 % 4/18/2025 1,330,058 1,324,204 1,196,813 Flex Acquisition Company (Hilex Poly/Novolex) T/L (02/21) Containers, Packaging & Glass Term Loan Loan 3M USD LIBOR+ 4.00 % 0.50 % 4.50 % 3/2/2028 1,000,000 995,000 997,810 FOCUS FINANCIAL PARTNERS, LLC Banking, Finance, Insurance & Real Estate Focus Financial T/L (1/20) Loan 1M USD LIBOR+ 2.00 % 0.00 % 2.11 % 7/3/2024 500,000 499,435 497,815 Franchise Group, Inc. Services: Consumer Franchise Group First Out T/L Loan 6M USD LIBOR+ 4.75 % 0.75 % 5.50 % 10/25/2026 1,000,000 990,000 1,000,000 Franklin Square Holdings, L.P. Banking, Finance, Insurance & Real Estate Term Loan Loan 1M USD LIBOR+ 2.25 % 0.00 % 2.38 % 8/1/2025 4,398,742 4,374,564 4,382,247 Issuer Name Industry Asset Name Asset
Type Reference Rate/Spread SOFR/
LIBOR Floor Current
Rate (All In) Maturity
Date Principal/
Number of Shares Cost Fair Value BroadStreet Partners, Inc. Banking, Finance, Insurance & Real Estate Term Loan B3 Loan 1M USD LIBOR+ 3.00 % 0.00 % 7.63 % 1/22/2027 2,948,786 2,944,577 2,906,412 Brookfield WEC Holdings Inc. Energy: Electricity Term Loan (1/21) Loan 1M USD LIBOR+ 2.75 % 0.50 % 7.38 % 8/1/2025 1,462,613 1,464,152 1,456,090 BROWN GROUP HOLDING, LLC Aerospace & Defense Term Loan B-2 Loan 1M USD SOFR+ 3.75 % 0.00 % 8.37 % 6/8/2029 498,750 487,209 498,336 Buckeye Partners, L.P. Utilities: Oil & Gas Term Loan (1/21) Loan 1M USD LIBOR+ 2.25 % 0.00 % 6.82 % 11/1/2026 1,950,188 1,941,198 1,946,931 BW Gas & Convenience Holdings LLC Beverage, Food & Tobacco Term Loan B Loan 1M USD LIBOR+ 3.50 % 0.50 % 8.13 % 3/31/2028 2,462,500 2,443,814 2,437,875 Callaway Golf Company Retail Term Loan B Loan 1M USD LIBOR+ 4.50 % 0.00 % 9.13 % 1/4/2026 675,000 668,575 674,582 Camping World, Inc. Retail Term Loan B (5/21) Loan 1M USD LIBOR+ 2.50 % 0.75 % 7.09 % 6/5/2028 2,487,342 2,268,038 2,208,560 CareerBuilder, LLC Services: Business Term Loan Loan 3M USD LIBOR+ 6.75 % 1.00 % 11.48 % 7/31/2023 5,393,388 5,347,671 3,513,792 Castle US Holding Corporation Media: Advertising, Printing & Publishing Term Loan B (USD) Loan 1M USD LIBOR+ 3.75 % 0.00 % 8.38 % 1/27/2027 1,963,384 1,954,023 1,375,469 CASTLELAKE AVIATION LLC Aerospace & Defense Term Loan B Loan 1M USD SOFR+ 2.75 % 0.50 % 7.31 % 10/21/2027 1,000,000 992,500 987,080 CBI BUYER, INC. Consumer goods: Durable Term Loan Loan 1M USD LIBOR+ 3.25 % 0.50 % 7.88 % 1/6/2028 2,969,887 2,814,181 2,026,948 CCC Intelligent Solutions Inc. Services: Business Term Loan B Loan 1M USD LIBOR+ 2.25 % 0.50 % 6.88 % 9/16/2028 247,500 247,017 244,612 CCI Buyer, Inc Telecommunications Term Loan Loan 3M USD SOFR+ 4.00 % 0.75 % 8.58 % 12/17/2027 245,625 243,880 241,223 CCRR Parent, Inc. Healthcare & Pharmaceuticals Term Loan Loan 1M USD SOFR+ 4.25 % 0.50 % 8.97 % 3/5/2028 1,000,000 951,484 975,000 CCRR Parent, Inc. Healthcare & Pharmaceuticals Term Loan B Loan 1M USD LIBOR+ 3.75 % 0.75 % 8.39 % 3/5/2028 982,500 978,899 957,938 CCS-CMGC Holdings, Inc. Healthcare & Pharmaceuticals Term Loan Loan 1M USD LIBOR+ 5.50 % 0.00 % 10.13 % 9/25/2025 2,400,000 2,390,330 1,605,504 CDK GLOBAL, INC. High Tech Industries Term Loan B Loan 3M USD SOFR+ 4.50 % 0.50 % 9.08 % 7/6/2029 1,000,000 971,508 996,150 Cengage Learning, Inc. Media: Advertising, Printing & Publishing Term Loan B (6/21) Loan 6M USD LIBOR+ 4.75 % 1.00 % 9.88 % 7/14/2026 2,962,500 2,942,124 2,794,171 CENTURI GROUP, INC. Construction & Building Term Loan B Loan 3M USD LIBOR+ 2.50 % 0.50 % 7.45 % 8/27/2028 878,330 871,190 870,100 CenturyLink, Inc. Telecommunications Term Loan B (1/20) Loan 1M USD LIBOR+ 2.25 % 0.00 % 6.88 % 3/15/2027 3,887,492 3,883,600 3,208,269 Charlotte Buyer, Inc. Services: Business Term Loan B Loan 1M USD SOFR+ 5.25 % 0.00 % 9.81 % 2/11/2028 1,500,000 1,403,100 1,455,945 Chemours Company, (The) Chemicals, Plastics, & Rubber Term Loan Loan 1M USD LIBOR+ 1.75 % 0.00 % 6.39 % 4/3/2025 905,031 880,859 898,406 Churchill Downs Incorporated Hotel, Gaming & Leisure Term Loan B1 (3/21) Loan 1M USD LIBOR+ 2.00 % 0.00 % 6.64 % 3/17/2028 491,250 490,382 486,952 CIMPRESS PUBLIC LIMITED COMPANY Media: Advertising, Printing & Publishing USD Term Loan Loan 1M USD LIBOR+ 3.50 % 0.50 % 8.13 % 5/17/2028 1,979,950 1,892,607 1,785,419 CITADEL SECURITIES LP Banking, Finance, Insurance & Real Estate Term Loan B (01/21) Loan 1M USD SOFR+ 2.50 % 0.00 % 7.23 % 2/2/2028 4,912,500 4,910,914 4,865,684 Clarios Global LP Automotive Term Loan B1 Loan 1M USD LIBOR+ 3.25 % 0.00 % 7.88 % 4/30/2026 1,267,812 1,261,524 1,260,091 Claros Mortgage Trust, Inc Banking, Finance, Insurance & Real Estate Term Loan B-1 (11/21) Loan 1M USD SOFR+ 4.50 % 0.50 % 9.16 % 8/9/2026 3,439,962 3,421,651 3,401,262 CLYDESDALE ACQUISITION HOLDINGS, INC. Containers, Packaging & Glass Term Loan B Loan 1M USD SOFR+ 4.18 % 0.50 % 8.89 % 4/13/2029 1,492,500 1,458,949 1,469,993 Cole Haan Consumer goods: Non-durable Term Loan B Loan 3M USD LIBOR+ 5.50 % 0.00 % 10.23 % 2/7/2025 875,000 871,486 841,461 Columbus McKinnon Corporation Capital Equipment Term Loan (4/21) Loan 3M USD LIBOR+ 2.75 % 0.50 % 7.50 % 5/14/2028 449,172 448,339 446,926 2013 -12013-1, Ltd.20212023Issuer Name Industry Asset Name Asset
Type Reference Rate/Spread LIBOR Floor Current Rate
(All In) Maturity
Date Principal/
Number of
Shares Cost Fair Value Froneri International (R&R Ice Cream) Beverage, Food & Tobacco Term Loan B-2 Loan 1M USD LIBOR+ 2.25 % 0.00 % 2.36 % 1/29/2027 1,990,000 1,985,937 1,971,453 Fusion Telecommunications International Inc. Telecommunications Take Back 2nd Out Term Loan Loan 6M USD LIBOR+ 1.00 % 2.00 % 3.00 % 7/14/2025 813,105 795,920 412,651 Gemini HDPE LLC Chemicals, Plastics, & Rubber Term Loan B (12/20) Loan 3M USD LIBOR+ 3.00 % 0.50 % 3.50 % 12/31/2027 2,000,000 1,980,103 1,995,000 General Nutrition Centers, Inc. (b) Retail Term Loan B2 Loan Prime+ 7.75 % 0.75 % 11.00 % 3/4/2021 389,896 389,896 292,422 Genesee & Wyoming, Inc. Transportation: Cargo Term Loan (11/19) Loan 3M USD LIBOR+ 2.00 % 0.00 % 2.25 % 12/30/2026 1,488,750 1,482,600 1,489,986 GEO Group, Inc., The Banking, Finance, Insurance & Real Estate Term Loan Refinance Loan 1M USD LIBOR+ 2.00 % 0.75 % 2.75 % 3/22/2024 3,963,971 3,665,551 3,609,710 GGP Inc. Banking, Finance, Insurance & Real Estate Term Loan B Loan 1M USD LIBOR+ 2.50 % 0.00 % 2.61 % 8/27/2025 3,969,542 3,201,121 3,862,603 GI Chill Acquisition LLC Services: Business Term Loan Loan 3M USD LIBOR+ 4.00 % 0.00 % 4.25 % 8/1/2025 2,443,750 2,435,372 2,448,344 Gigamon Inc. Services: Business Term Loan B Loan 6M USD LIBOR+ 3.75 % 0.75 % 4.50 % 12/27/2024 2,930,400 2,913,040 2,930,400 Global Business Travel (GBT) III Inc. Hotel, Gaming & Leisure Term Loan Loan 1M USD LIBOR+ 2.50 % 0.00 % 2.61 % 8/13/2025 4,398,750 4,397,949 4,215,454 Global Tel*Link Corporation Telecommunications Term Loan B Loan 1M USD LIBOR+ 4.25 % 0.00 % 4.36 % 11/29/2025 5,000,167 4,764,345 4,675,956 Go Wireless Holdings, Inc. Telecommunications Term Loan Loan 1M USD LIBOR+ 6.50 % 1.00 % 7.50 % 12/22/2024 3,024,675 2,992,914 3,017,114 Goodyear Tire & Rubber Company, The Chemicals, Plastics, & Rubber Second Lien Term Loan Loan 1M USD LIBOR+ 2.00 % 0.00 % 2.12 % 3/3/2025 3,000,000 2,933,783 2,953,740 Graham Packaging T/L (2/21) Containers, Packaging & Glass Term Loan Loan 1M USD LIBOR+ 3.75 % 0.75 % 4.50 % 8/4/2027 979,661 972,912 980,660 Greenhill & Co., Inc. Banking, Finance, Insurance & Real Estate Term Loan B Loan 1M USD LIBOR+ 3.25 % 0.00 % 3.36 % 4/12/2024 3,419,615 3,393,171 3,398,243 Grosvenor Capital Management Holdings, LLLP Banking, Finance, Insurance & Real Estate Term Loan B Loan 1M USD LIBOR+ 2.75 % 1.00 % 3.75 % 3/31/2025 2,399,991 2,398,303 2,395,791 Guidehouse LLP (fka PricewaterhouseCoopers) Aerospace & Defense Term Loan Loan 1M USD LIBOR+ 4.00 % 0.00 % 4.11 % 5/1/2025 4,924,683 4,903,634 4,951,572 Harbor Freight Tools USA, Inc. Retail Term Loan B (10/20) Loan 1M USD LIBOR+ 3.25 % 0.75 % 4.00 % 10/20/2027 2,992,500 2,967,649 3,004,979 Harland Clarke Holdings Corp. Media: Advertising, Printing & Publishing Term Loan Loan 3M USD LIBOR+ 4.75 % 1.00 % 5.75 % 11/3/2023 1,612,899 1,607,974 1,536,738 Helix Gen Funding, LLc Energy: Electricity Term Loan B (02/17) Loan 1M USD LIBOR+ 3.75 % 1.00 % 4.75 % 6/3/2024 244,627 244,418 243,418 Hillman Group Inc. (The) (New) Consumer goods: Durable Hillman Group T/L B-1 (2/21) Loan 6M USD LIBOR+ 2.75 % 0.50 % 3.25 % 2/23/2028 3,523,207 3,514,399 3,523,207 Hillman Group Inc. (The) (New) Consumer goods: Durable Hillman Group T/L B-2 (2/21) Loan 6M USD LIBOR+ 2.75 % 0.50 % 2.99 % 2/23/2028 632,911 631,329 632,911 Hillman Group Inc. (The) (New)(a) Consumer goods: Durable Unfunded Commitment Loan 3M USD LIBOR+ 2.75 % 0.50 % 0.00 % 2/23/2028 - (2,110 ) - HLF Financing SARL (Herbalife) Consumer goods: Non-durable Term Loan B (08/18) Loan 1M USD LIBOR+ 2.50 % 0.00 % 2.61 % 8/18/2025 3,910,000 3,897,913 3,912,111 Holley Purchaser, Inc Automotive Term Loan B Loan 3M USD LIBOR+ 5.00 % 0.00 % 5.21 % 10/24/2025 2,450,000 2,432,788 2,423,981 Howden Group Holdings Banking, Finance, Insurance & Real Estate Term Loan (1/21) Loan 3M USD LIBOR+ 3.25 % 0.75 % 4.00 % 11/12/2027 1,692,335 1,686,025 1,695,212 Hudson River Trading LLC Banking, Finance, Insurance & Real Estate Term Loan B (01/20) Loan 1M USD LIBOR+ 3.00 % 0.00 % 3.11 % 2/18/2027 5,940,000 5,920,701 5,925,150 Idera, Inc. High Tech Industries Idera T/L (1/21) Loan 1M USD LIBOR+ 3.75 % 0.75 % 4.50 % 6/28/2028 1,000,000 997,500 1,000,000 Idera, Inc. High Tech Industries Term Loan B Loan 6M USD LIBOR+ 4.00 % 1.00 % 5.00 % 6/27/2024 3,896,805 3,886,520 3,896,805 INEOS US PETROCHEM LLC Chemicals, Plastics, & Rubber INEOS US Petrochem T/L (INEOS Quattro) Loan 1M USD LIBOR+ 2.75 % 0.50 % 3.25 % 1/20/2026 1,000,000 995,073 1,003,750 INFINITE BIDCO LLC Wholesale Infinite Bidco T/L Loan 1M USD LIBOR+ 3.75 % 0.75 % 4.50 % 2/22/2028 1,500,000 1,496,250 1,500,000 Inmar Acquisition Sub, Inc. Services: Business Term Loan B Loan 3M USD LIBOR+ 4.00 % 1.00 % 5.00 % 5/1/2024 3,421,586 3,360,370 3,400,920 Innophos, Inc. Chemicals, Plastics, & Rubber Term Loan B Loan 1M USD LIBOR+ 3.50 % 0.00 % 3.61 % 2/4/2027 496,250 494,123 498,424 Intermediate Dutch Holdings Services: Business Nielsen Consumer T/L B Loan 1M USD LIBOR+ 4.00 % 0.00 % 4.13 % 2/3/2028 250,000 248,750 250,313 Issuer Name Industry Asset Name Asset
Type Reference Rate/Spread SOFR/
LIBOR Floor Current
Rate (All In) Maturity
Date Principal/
Number of Shares Cost Fair Value Conduent, Inc. Services: Business Term Loan B Loan 1M USD LIBOR+ 4.25 % 0.50 % 8.88 % 10/16/2028 1,787,985 1,755,247 1,742,177 Connect Finco SARL Telecommunications Term Loan (1/21) Loan 1M USD SOFR+ 3.50 % 1.00 % 8.14 % 12/11/2026 2,917,500 2,816,917 2,863,526 Consolidated Communications, Inc. Telecommunications Term Loan B Loan 1M USD LIBOR+ 3.50 % 0.75 % 8.19 % 10/2/2027 2,714,005 2,520,099 2,435,819 CORAL-US CO-BORROWER LLC Telecommunications Term Loan B-5 Loan 1M USD LIBOR+ 2.25 % 0.00 % 6.84 % 1/31/2028 4,000,000 3,988,733 3,867,160 Corelogic, Inc. Services: Business Term Loan (4/21) Loan 1M USD LIBOR+ 3.50 % 0.50 % 8.19 % 6/2/2028 2,468,750 2,459,383 2,110,164 Cortes NP Acquisition Corp (Vertiv) Capital Equipment Term Loan 2/21 Loan 1M USD LIBOR+ 2.75 % 0.00 % 7.32 % 3/2/2027 1,960,000 1,960,000 1,934,579 COWEN INC. Banking, Finance, Insurance & Real Estate Term Loan Loan 6M USD LIBOR+ 3.25 % 0.00 % 7.43 % 3/24/2028 3,927,406 3,907,308 3,922,496 Creative Artists Agency, LLC Media: Diversified & Production Term Loan B (02/23) Loan 1M USD SOFR+ 3.50 % 0.00 % 8.06 % 11/1/2028 1,600,000 1,588,000 1,595,008 CROCS INC Consumer goods: Durable Term Loan Loan 6M USD SOFR+ 3.50 % 0.50 % 7.73 % 2/20/2029 2,512,500 2,421,039 2,504,133 Cross Financial Corp Banking, Finance, Insurance & Real Estate Term Loan B (3/21) Loan 1M USD LIBOR+ 4.00 % 0.75 % 8.69 % 9/15/2027 492,500 492,174 489,422 Crown Subsea Communications Holding, Inc. Construction & Building Term Loan (4/21) Loan 1M USD LIBOR+ 4.75 % 0.75 % 9.32 % 4/27/2027 3,404,110 3,377,740 3,340,283 CSC Holdings LLC (Neptune Finco Corp.) Media: Broadcasting & Subscription Term Loan B-5 Loan 1M USD LIBOR+ 2.50 % 0.00 % 7.09 % 4/15/2027 485,000 485,000 435,894 CSC Holdings LLC (Neptune Finco Corp.) Media: Broadcasting & Subscription Term Loan 12/22 Loan 1M USD SOFR+ 4.50 % 0.00 % 9.06 % 4/15/2027 2,400,032 2,389,363 2,244,030 CTS Midco, LLC High Tech Industries Term Loan B Loan 3M USD LIBOR+ 6.00 % 1.00 % 10.83 % 11/2/2027 1,960,000 1,917,602 1,666,000 Daseke Inc Transportation: Cargo Term Loan 2/21 Loan 1M USD LIBOR+ 4.00 % 0.75 % 8.64 % 3/5/2028 1,473,750 1,468,500 1,468,223 Dave & Buster’s Inc. Hotel, Gaming & Leisure Term Loan B (04/22) Loan 1M USD SOFR+ 5.00 % 0.50 % 9.75 % 6/29/2029 995,000 948,574 997,736 DCert Buyer, Inc. High Tech Industries Term Loan Loan 6M USD SOFR+ 4.00 % 0.00 % 8.70 % 10/16/2026 1,469,773 1,469,773 1,446,257 Delek US Holdings, Inc. Utilities: Oil & Gas Term Loan B (11/22) Loan 1M USD SOFR+ 3.50 % 0.50 % 8.22 % 11/16/2029 5,400,000 5,285,256 5,298,750 Delta 2 Lux Sarl Hotel, Gaming & Leisure Term Loan B Loan 1M USD SOFR+ 3.25 % 0.50 % 7.87 % 1/15/2030 1,000,000 990,424 1,001,750 DexKo Global, Inc. (Dragon Merger) Automotive Term Loan (9/21) Loan 3M USD LIBOR+ 3.75 % 0.50 % 8.48 % 10/4/2028 992,500 989,236 928,980 DG Investment Intermediate Holdings 2, Inc. Aerospace & Defense Incremental Term Loan (3/22) Loan 1M USD SOFR+ 4.75 % 0.75 % 9.37 % 3/31/2028 498,750 479,659 488,152 Diamond Sports Group, LLC (b) Media: Broadcasting & Subscription Second Lien Term Loan Loan 3M USD SOFR+ 3.40 % 0.00 % 8.03 % 8/24/2026 3,374,880 3,017,273 382,306 Diamond Sports Group, LLC (b) Media: Broadcasting & Subscription 1st Priority Term Loan Loan 6M USD SOFR+ 8.00 % 1.00 % 13.06 % 5/25/2026 342,343 333,975 318,951 DIRECTV FINANCING, LLC Media: Broadcasting & Subscription Term Loan Loan 1M USD LIBOR+ 5.00 % 0.75 % 9.63 % 8/2/2027 3,550,000 3,523,794 3,448,754 DISCOVERY PURCHASER CORPORATION Chemicals, Plastics, & Rubber Term Loan Loan 3M USD SOFR+ 4.38 % 0.50 % 8.96 % 10/4/2029 1,500,000 1,385,334 1,433,310 Dispatch Acquisition Holdings, LLC Environmental Industries Term Loan B (3/21) Loan 3M USD LIBOR+ 4.25 % 0.75 % 8.98 % 3/25/2028 492,500 488,806 434,631 2013 -12013-1, Ltd.20212023Issuer Name Industry Asset Name Asset
Type Reference Rate/Spread LIBOR Floor Current Rate
(All In) Maturity
Date Principal/
Number of Shares Cost Fair Value Isagenix International, LLC Beverage, Food & Tobacco Term Loan Loan 3M USD LIBOR+ 5.75 % 1.00 % 6.75 % 6/14/2025 2,622,582 2,586,650 1,652,227 Ivory Merger Sub, Inc. Healthcare & Pharmaceuticals Term Loan Loan 1M USD LIBOR+ 3.50 % 0.00 % 3.62 % 3/14/2025 957,262 954,285 944,100 J Jill Group, Inc Retail Priming Term Loan Loan 6M USD LIBOR+ 5.00 % 1.00 % 6.00 % 5/8/2024 1,779,081 1,776,970 1,138,612 Jane Street Group Banking, Finance, Insurance & Real Estate Jane Street Group T/L (1/21) Loan 1M USD LIBOR+ 2.75 % 0.00 % 2.86 % 1/31/2028 2,500,000 2,496,997 2,491,975 Jefferies Finance LLC / JFIN Co-Issuer Corp Banking, Finance, Insurance & Real Estate Term Loan Loan 1M USD LIBOR+ 3.00 % 0.00 % 3.13 % 6/3/2026 3,796,822 3,781,950 3,789,380 Journey Personal Care Corp. Consumer goods: Non-durable Journey Personal Care T/L B (Domtar) Loan 6M USD LIBOR+ 4.25 % 0.75 % 5.00 % 2/19/2028 1,000,000 995,000 1,002,500 JP Intermediate B, LLC Consumer goods: Non-durable Term Loan Loan 3M USD LIBOR+ 5.50 % 1.00 % 6.50 % 11/15/2025 4,423,877 4,386,340 4,154,021 KAR Auction Services, Inc. Automotive Term Loan B (09/19) Loan 1M USD LIBOR+ 2.25 % 0.00 % 2.44 % 9/19/2026 246,875 246,391 243,172 Kindred Healthcare, Inc. Healthcare & Pharmaceuticals Term Loan (6/18) Loan 1M USD LIBOR+ 4.50 % 0.00 % 4.63 % 7/2/2025 1,979,747 1,962,749 1,982,222 Klockner-Pentaplast of America, Inc. Containers, Packaging & Glass Klockner Pentaplast T/L (Kleopatra) Loan 1M USD LIBOR+ 4.75 % 0.50 % 5.25 % 2/4/2026 1,500,000 1,492,500 1,500,945 Kodiak BP, LLC Construction & Building Term Loan Loan 1M USD LIBOR+ 3.25 % 0.75 % 4.00 % 2/26/2028 500,000 497,500 499,375 KREF Holdings X LLC Banking, Finance, Insurance & Real Estate Term Loan Loan 3M USD LIBOR+ 4.75 % 1.00 % 5.75 % 8/4/2027 500,000 488,256 501,250 Lakeland Tours, LLC Hotel, Gaming & Leisure 2nd Out Take Back PIK Term Loan Loan 3M USD LIBOR+ 1.50 % 1.25 % 2.75 % 9/25/2025 585,723 478,159 524,222 Lakeland Tours, LLC Hotel, Gaming & Leisure Third Out PIK Term Loan Loan 3M USD LIBOR+ 1.50 % 1.25 % 2.75 % 9/25/2025 777,562 451,283 515,780 Lakeland Tours, LLC Hotel, Gaming & Leisure Holdco Fixed Term Loan Loan Fixed 8.00 % 0.00 % 13.25 % 9/27/2027 763,381 128,938 277,359 Lakeland Tours, LLC Hotel, Gaming & Leisure Priority Exit PIK Term Loan (9/20) Loan 3M USD LIBOR+ 6.00 % 1.25 % 7.25 % 9/25/2023 306,588 292,181 306,076 Lealand Finance Company B.V. Energy: Oil & Gas Exit Term Loan Loan 1M USD LIBOR+ 1.00 % 0.00 % 1.11 % 6/30/2025 324,682 324,682 209,258 Learfield Communications, Inc Media: Advertising, Printing & Publishing Initial Term Loan (A-L Parent) Loan 1M USD LIBOR+ 3.25 % 1.00 % 4.25 % 12/1/2023 480,000 478,959 439,296 Lifetime Brands, Inc Consumer goods: Non-durable Term Loan B Loan 1M USD LIBOR+ 3.50 % 1.00 % 4.50 % 2/28/2025 2,905,639 2,876,036 2,878,413 Liftoff Mobile, Inc. Media: Advertising, Printing & Publishing Liftoff Mobile T/L Loan 1M USD LIBOR+ 3.50 % 0.75 % 4.25 % 2/17/2028 1,000,000 995,000 997,500 Lightstone Generation LLC Energy: Electricity Term Loan B Loan 3M USD LIBOR+ 3.75 % 1.00 % 4.75 % 1/30/2024 1,322,520 1,321,129 1,133,241 Lightstone Generation LLC Energy: Electricity Term Loan C Loan 3M USD LIBOR+ 3.75 % 1.00 % 4.75 % 1/30/2024 74,592 74,517 63,917 Lindblad Expeditions, Inc. Hotel, Gaming & Leisure Cayman Term Loan Loan 1M USD LIBOR+ 3.50 % 0.75 % 4.25 % 3/21/2025 98,191 98,037 90,827 Lindblad Expeditions, Inc. Hotel, Gaming & Leisure US 2018 Term Loan Loan 1M USD LIBOR+ 3.50 % 0.75 % 4.25 % 3/21/2025 392,764 392,147 363,307 Liquidnet Holdings, Inc. Banking, Finance, Insurance & Real Estate Term Loan B Loan 6M USD LIBOR+ 3.25 % 1.00 % 4.25 % 7/11/2024 1,960,766 1,957,232 1,952,237 LogMeIn, Inc. High Tech Industries Term Loan (8/20) Loan 1M USD LIBOR+ 4.75 % 0.00 % 4.87 % 8/31/2027 4,000,000 3,927,780 3,996,680 LPL Holdings, Inc. Banking, Finance, Insurance & Real Estate Term Loan B1 Loan 1M USD LIBOR+ 1.75 % 0.00 % 1.87 % 11/11/2026 1,232,760 1,230,271 1,224,032 MA FinanceCo LLC High Tech Industries Term Loan B4 Loan 3M USD LIBOR+ 4.25 % 1.00 % 5.25 % 5/29/2025 2,474,961 2,466,727 2,502,804 Marriott Ownership Resorts, Inc. Hotel, Gaming & Leisure Term Loan (11/19) Loan 1M USD LIBOR+ 1.75 % 0.00 % 1.86 % 8/29/2025 1,317,074 1,317,074 1,296,080 Match Group, Inc, The Services: Consumer Term Loan (1/20) Loan 3M USD LIBOR+ 1.75 % 0.00 % 1.95 % 2/15/2027 250,000 249,476 247,735 Mayfield Agency Borrower Inc. (FeeCo) Banking, Finance, Insurance & Real Estate Term Loan Loan 1M USD LIBOR+ 4.50 % 0.00 % 4.61 % 2/28/2025 3,427,214 3,397,660 3,380,090 McAfee, LLC Services: Business Term Loan B Loan 1M USD LIBOR+ 3.75 % 0.00 % 3.86 % 9/30/2024 1,928,400 1,921,750 1,932,121 Issuer Name Industry Asset Name Asset
Type Reference Rate/Spread SOFR/
LIBOR Floor Current
Rate (All In) Maturity
Date Principal/
Number of Shares Cost Fair Value DOMTAR CORPORATION Forest Products & Paper Term Loan 9/21 Loan 1M USD LIBOR+ 5.50 % 0.75 % 10.10 % 11/30/2028 1,310,136 1,272,492 1,286,121 DOTDASH MEREDITH, INC. Media: Advertising, Printing & Publishing Term Loan B Loan 1M USD SOFR+ 4.00 % 0.50 % 8.67 % 11/30/2028 1,994,949 1,803,027 1,755,556 DRI HOLDING INC. Media: Advertising, Printing & Publishing Term Loan (12/21) Loan 1M USD LIBOR+ 5.25 % 0.50 % 9.88 % 12/15/2028 3,972,487 3,830,439 3,552,913 DRW Holdings, LLC Banking, Finance, Insurance & Real Estate Term Loan (2/21) Loan 1M USD LIBOR+ 3.75 % 0.00 % 8.38 % 3/1/2028 6,435,000 6,396,896 6,284,164 DTZ U.S. Borrower, LLC Construction & Building Term Loan Loan 1M USD LIBOR+ 2.75 % 0.00 % 7.38 % 8/21/2025 1,612,878 1,609,665 1,602,798 DTZ U.S. Borrower, LLC Construction & Building Term Loan (01/23) Loan 1M USD SOFR+ 3.25 % 0.00 % 7.97 % 1/31/2030 2,034,413 2,031,025 2,021,698 EAB Global, Inc. Services: Business Term Loan (08/21) Loan 1M USD LIBOR+ 3.50 % 0.50 % 8.13 % 8/16/2028 990,000 985,965 969,586 Echo Global Logistics, Inc. Services: Business Term Loan Loan 1M USD LIBOR+ 3.50 % 0.50 % 8.13 % 11/23/2028 1,985,000 1,981,077 1,916,776 Edelman Financial Group Inc., The Banking, Finance, Insurance & Real Estate Term Loan B (3/21) Loan 1M USD LIBOR+ 3.50 % 0.75 % 8.13 % 4/7/2028 2,188,547 2,182,686 2,129,281 Electrical Components Inter., Inc. Capital Equipment Term Loan (6/18) Loan 1M USD LIBOR+ 4.25 % 0.00 % 8.88 % 6/26/2025 1,888,404 1,888,404 1,719,638 ELECTRON BIDCO INC. Healthcare & Pharmaceuticals Term Loan Loan 1M USD LIBOR+ 3.00 % 0.50 % 7.63 % 11/1/2028 496,250 494,396 491,208 ELO Touch Solutions, Inc. Media: Diversified & Production Term Loan (12/18) Loan 1M USD LIBOR+ 6.50 % 0.00 % 11.13 % 12/14/2025 2,175,269 2,121,627 2,169,831 Embecta Corp Healthcare & Pharmaceuticals Term Loan B Loan 6M USD SOFR+ 3.00 % 0.50 % 7.79 % 3/30/2029 614,918 611,634 604,735 Endo Luxembourg Finance Company I S.a.r.l. Healthcare & Pharmaceuticals Term Loan (3/21) Loan Prime 6.00 % 0.75 % 13.75 % 3/27/2028 2,335,285 2,328,380 1,839,037 Endure Digital, Inc. High Tech Industries Term Loan B Loan 1M USD LIBOR+ 3.50 % 0.75 % 8.07 % 2/10/2028 2,462,500 2,453,593 2,276,581 Entain Holdings (Gibraltar) Limited Hotel, Gaming & Leisure Term Loan B (10/22) Loan 3M USD SOFR+ 3.50 % 0.50 % 8.18 % 10/30/2029 1,000,000 987,635 999,060 Envision Healthcare Corporation Healthcare & Pharmaceuticals Term Loan B (06/18) Loan 3M USD LIBOR+ 3.75 % 0.00 % 8.48 % 10/10/2025 4,784,383 4,782,311 1,202,076 EOS U.S. FINCO LLC Transportation: Cargo Term Loan Loan 3M USD SOFR+ 6.00 % 0.50 % 10.60 % 8/3/2029 1,000,000 923,495 986,250 Equiniti Group PLC Services: Business Term Loan B Loan 6M USD SOFR+ 4.50 % 0.50 % 9.54 % 12/11/2028 990,000 981,797 990,624 EyeCare Partners, LLC Healthcare & Pharmaceuticals Term Loan Loan 3M USD LIBOR+ 3.75 % 0.00 % 8.48 % 2/18/2027 1,948,081 1,948,081 1,621,174 Finco I LLC Banking, Finance, Insurance & Real Estate Term Loan B (9/20) Loan 1M USD LIBOR+ 2.50 % 0.00 % 7.13 % 6/27/2025 2,830,950 2,826,805 2,830,950 First Brands Group, LLC Automotive 1st Lien Term Loan (3/21) Loan 6M USD SOFR+ 5.00 % 1.00 % 10.25 % 3/30/2027 4,912,500 4,854,265 4,754,367 First Eagle Investment Management Banking, Finance, Insurance & Real Estate Refinancing Term Loan Loan 3M USD LIBOR+ 2.50 % 0.00 % 7.23 % 2/1/2027 5,146,145 5,133,892 5,055,007 First Student Bidco Inc. Transportation: Consumer Term Loan B Loan 3M USD LIBOR+ 3.00 % 0.50 % 7.73 % 7/21/2028 723,088 718,928 689,255 2013 -12013-1, Ltd.20212023Issuer Name Industry Asset Name Asset
Type Reference Rate/Spread LIBOR Floor Current Rate
(All In) Maturity
Date Principal/
Number of Shares Cost Fair Value McGraw-Hill Global Education Holdings, LLC Media: Advertising, Printing & Publishing Term Loan B Loan 3M USD LIBOR+ 4.75 % 1.00 % 5.75 % 11/1/2024 2,544,391 2,364,344 2,538,666 Meredith Corporation Media: Advertising, Printing & Publishing Term Loan B2 Loan 1M USD LIBOR+ 2.50 % 0.00 % 2.61 % 1/31/2025 578,738 577,965 575,555 Mermaid Bidco Inc. High Tech Industries Term Loan 12/20 Loan 2M USD LIBOR+ 4.25 % 0.75 % 5.00 % 12/1/2027 500,000 497,584 501,565 Messer Industries, LLC Chemicals, Plastics, & Rubber Term Loan B Loan 3M USD LIBOR+ 2.50 % 0.00 % 2.75 % 3/1/2026 3,944,962 3,923,644 3,942,003 Michaels Stores, Inc. Retail Term Loan B (9/20) Loan 1M USD LIBOR+ 3.50 % 0.75 % 4.25 % 10/1/2027 2,571,414 2,565,167 2,567,557 Midwest Physician Administrative Services LLC (Dupage Medical Group) Healthcare & Pharmaceuticals Term Loan (2/18) Loan 1M USD LIBOR+ 2.75 % 0.75 % 3.50 % 8/15/2024 961,003 958,186 960,522 Mitchell International, Inc. Banking, Finance, Insurance & Real Estate Term Loan (7/20) Loan 1M USD LIBOR+ 4.25 % 0.50 % 4.75 % 11/29/2024 997,500 944,391 1,000,991 MKS Instruments, Inc. High Tech Industries Term Loan B6 Loan 1M USD LIBOR+ 1.75 % 0.00 % 1.86 % 2/2/2026 877,977 871,414 878,530 MLN US Holdco LLC Telecommunications Term Loan Loan 1M USD LIBOR+ 4.50 % 0.00 % 4.61 % 12/1/2025 980,000 978,728 913,605 MMM Holdings, Inc. Healthcare & Pharmaceuticals Term Loan B Loan 6M USD LIBOR+ 5.75 % 1.00 % 6.75 % 12/24/2026 6,724,026 6,605,313 6,730,347 MRC Global Inc. Metals & Mining Term Loan B2 Loan 1M USD LIBOR+ 3.00 % 0.00 % 3.11 % 9/20/2024 484,961 484,234 477,687 Murphy USA Inc. Retail Murphy Oil USA T/L (Quick Chek) Loan 1M USD LIBOR+ 1.75 % 0.50 % 2.25 % 1/21/2028 250,000 249,384 250,938 MW Industries, Inc. (Helix Acquisition Holdings) Capital Equipment Term Loan (2019 Incremental) Loan 3M USD LIBOR+ 3.75 % 0.00 % 4.00 % 9/30/2024 2,842,097 2,802,381 2,740,265 Natgasoline LLC Chemicals, Plastics, & Rubber Term Loan Loan 1M USD LIBOR+ 3.50 % 0.00 % 3.63 % 11/14/2025 1,487,455 1,457,602 1,483,737 National Mentor Holdings, Inc. Healthcare & Pharmaceuticals National Mentor /Civitas (2/21) T/L C Loan 1M USD LIBOR+ 4.00 % 0.75 % 4.75 % 2/17/2028 87,464 87,026 87,289 National Mentor Holdings, Inc. Healthcare & Pharmaceuticals Term Loan Loan 1M USD LIBOR+ 4.25 % 0.00 % 4.37 % 3/9/2026 1,880,666 1,866,176 1,878,014 National Mentor Holdings, Inc. Healthcare & Pharmaceuticals Term Loan C Loan 3M USD LIBOR+ 4.25 % 0.00 % 4.51 % 3/9/2026 86,065 85,428 85,943 National Mentor Holdings, Inc. Healthcare & Pharmaceuticals National Mentor/ Civitas (2/21) T/L Loan 1M USD LIBOR+ 4.00 % 0.75 % 4.75 % 2/17/2028 2,623,907 2,610,787 2,618,659 National Mentor/ Civitas (2/21) DDTL (a) Healthcare & Pharmaceuticals National Mentor (Civitas) T/L B (2/19) Loan 1M USD LIBOR+ 4.25 % 0.00 % 4.37 % 3/9/2026 - - (577 ) NeuStar, Inc. Telecommunications Term Loan B4 (03/18) Loan 3M USD LIBOR+ 3.50 % 1.00 % 4.50 % 8/8/2024 2,641,566 2,611,256 2,542,032 NeuStar, Inc. Telecommunications Term Loan B-5 Loan 3M USD LIBOR+ 4.50 % 1.00 % 5.50 % 8/8/2024 885,162 873,202 859,050 Nexstar Broadcasting, Inc. (Mission Broadcasting) Media: Broadcasting & Subscription Nexstar Broadcasting T/L B4 (6/19) Loan 1M USD LIBOR+ 2.75 % 0.00 % 2.87 % 9/18/2026 1,113,795 1,101,160 1,114,842 Next Level Apparel, Inc. Retail Term Loan Loan 3M PL WIBOR+ 6.00 % 1.00 % 7.00 % 8/9/2024 1,866,250 1,853,906 1,716,950 NM Z Parent Inc (Zep Inc) Chemicals, Plastics, & Rubber Term Loan Loan 6M USD LIBOR+ 4.00 % 1.00 % 5.00 % 8/9/2024 2,418,750 2,411,955 2,392,845 NorthPole Newco S.a.r.l Aerospace & Defense Term Loan Loan 3M USD LIBOR+ 7.00 % 0.00 % 7.25 % 3/3/2025 5,312,500 4,890,323 4,774,609 Novetta Solutions, LLC Aerospace & Defense Term Loan Loan 3M USD LIBOR+ 5.00 % 1.00 % 6.00 % 10/16/2022 1,899,870 1,894,609 1,889,193 Novetta Solutions, LLC Aerospace & Defense Second Lien Term Loan Loan 3M USD LIBOR+ 8.50 % 1.00 % 9.50 % 10/16/2023 1,000,000 995,635 997,500 NPC International, Inc. (b) Beverage, Food & Tobacco Term Loan Loan Prime+ 4.50 % 1.00 % 7.75 % 4/19/2024 487,500 487,124 430,463 Nuvei Technologies Corp. High Tech Industries US Term Loan Loan 1M USD LIBOR+ 4.00 % 0.75 % 4.75 % 9/29/2025 250,000 249,712 251,563 Owens & Minor Healthcare & Pharmaceuticals Term Loan B Loan 1M USD LIBOR+ 4.50 % 0.00 % 4.62 % 5/2/2025 487,500 481,151 488,631 Pacific Gas and Electric Company Utilities: Electric PG&E Corp T/L Loan 1M USD LIBOR+ 3.00 % 0.50 % 3.50 % 6/18/2025 1,494,994 1,487,395 1,499,195 PAE Holding Corp Aerospace & Defense Term Loan B (10/20) Loan 3M USD LIBOR+ 4.50 % 0.75 % 5.25 % 10/14/2027 2,000,000 1,971,195 2,009,160 Issuer Name Industry Asset Name Asset
Type Reference Rate/Spread SOFR/
LIBOR Floor Current
Rate (All In) Maturity
Date Principal/
Number of Shares Cost Fair Value First Student Bidco Inc. Transportation: Consumer Term Loan C Loan 3M USD LIBOR+ 3.00 % 0.50 % 7.73 % 7/21/2028 269,608 268,052 256,993 Fitness International, LLC (LA Fitness) Services: Consumer Term Loan B (4/18) Loan 3M USD SOFR+ 3.25 % 1.00 % 8.08 % 4/18/2025 1,330,058 1,326,810 1,268,211 Flutter Financing B.V. Hotel, Gaming & Leisure Term Loan Loan 3M USD LIBOR+ 2.25 % 0.00 % 6.98 % 7/21/2026 1,975,000 1,972,044 1,971,643 Flutter Financing B.V. Hotel, Gaming & Leisure Third Amendment 2028-B Term Loan Loan 3M USD SOFR+ 3.25 % 0.50 % 8.09 % 7/21/2028 748,125 732,248 747,848 FOCUS FINANCIAL PARTNERS, LLC Banking, Finance, Insurance & Real Estate Term Loan B Loan 1M USD SOFR+ 3.25 % 0.50 % 7.87 % 6/30/2028 1,487,298 1,470,684 1,477,765 Franchise Group, Inc. Services: Consumer First Out Term Loan Loan 3M USD LIBOR+ 4.75 % 0.75 % 9.56 % 3/10/2026 799,104 793,938 760,148 Franchise Group, Inc. Services: Consumer Term Loan B Loan 3M USD SOFR+ 4.75 % 0.75 % 9.70 % 3/10/2026 3,000,000 2,852,614 2,857,500 Franklin Square Holdings, L.P. Banking, Finance, Insurance & Real Estate Term Loan Loan 1M USD LIBOR+ 2.25 % 0.00 % 6.94 % 8/1/2025 4,308,730 4,296,025 4,303,344 Froneri International (R&R Ice Cream) Beverage, Food & Tobacco Term Loan B-2 Loan 1M USD LIBOR+ 2.25 % 0.00 % 6.88 % 1/29/2027 1,950,000 1,948,124 1,915,524 Garrett LX III S.a r.l. Automotive Dollar Term Loan Loan 3M USD LIBOR+ 3.25 % 0.50 % 8.08 % 4/30/2028 1,481,250 1,475,822 1,460,261 Gates Global LLC Automotive Term Loan (11/22) Loan 1M USD SOFR+ 3.50 % 0.50 % 8.12 % 11/15/2029 249,375 242,119 249,121 Gemini HDPE LLC Chemicals, Plastics, & Rubber Term Loan B (12/20) Loan 3M USD LIBOR+ 3.00 % 0.50 % 7.83 % 12/31/2027 2,289,884 2,276,592 2,281,297 Genesee & Wyoming, Inc. Transportation: Cargo Term Loan (11/19) Loan 3M USD LIBOR+ 2.00 % 0.00 % 6.73 % 12/30/2026 1,458,750 1,454,820 1,453,892 GGP Inc. Banking, Finance, Insurance & Real Estate Term Loan B Loan 1M USD LIBOR+ 2.50 % 0.00 % 2.96 % 8/27/2025 3,072,992 2,734,560 3,053,141 Global Tel*Link Corporation Telecommunications Term Loan B Loan 3M USD SOFR+ 4.25 % 0.00 % 9.08 % 11/29/2025 4,897,634 4,753,219 4,342,830 Go Daddy Operating Company, LLC High Tech Industries Term Loan 2/21 Loan 1M USD LIBOR+ 2.00 % 0.00 % 6.63 % 8/10/2027 1,959,799 1,959,799 1,950,255 GOLDEN WEST PACKAGING GROUP LLC Forest Products & Paper Term Loan (11/21) Loan 1M USD LIBOR+ 5.25 % 0.75 % 9.88 % 12/1/2027 1,962,500 1,946,411 1,903,625 Graham Packaging Co Inc Containers, Packaging & Glass Term Loan (2/21) Loan 1M USD LIBOR+ 3.00 % 0.75 % 7.63 % 8/7/2027 962,517 957,931 956,501 Great Outdoors Group, LLC Retail Term Loan B2 Loan 1M USD LIBOR+ 3.75 % 0.75 % 8.38 % 3/6/2028 980,094 976,551 964,471 Greenhill & Co., Inc. Banking, Finance, Insurance & Real Estate Term Loan B Loan 3M USD LIBOR+ 3.25 % 0.00 % 8.20 % 4/12/2024 2,844,231 2,836,329 2,789,707 Griffon Corporation Consumer goods: Durable Term Loan B Loan 1M USD SOFR+ 2.50 % 0.50 % 7.20 % 1/24/2029 154,375 154,051 152,959 Grosvenor Capital Management Holdings, LLLP Banking, Finance, Insurance & Real Estate Amendment 5 Term Loan Loan 1M USD LIBOR+ 2.50 % 0.50 % 7.13 % 2/24/2028 2,836,805 2,834,453 2,808,437 Groupe Solmax Inc. Environmental Industries Term Loan (6/21) Loan 3M USD LIBOR+ 4.75 % 0.75 % 9.48 % 5/27/2028 1,994,937 1,625,873 1,720,633 Harbor Freight Tools USA, Inc. Retail Term Loan B (06/21) Loan 1M USD LIBOR+ 2.75 % 0.50 % 7.38 % 10/19/2027 3,438,442 3,420,645 3,324,355 Helix Gen Funding, LLc Energy: Electricity Term Loan B (02/17) Loan 1M USD LIBOR+ 3.75 % 1.00 % 8.38 % 6/3/2024 209,702 209,702 208,332 Hillman Group Inc. (The) (New) Consumer goods: Durable Term Loan B-1 (2/21) Loan 1M USD LIBOR+ 2.75 % 0.50 % 7.38 % 7/14/2028 3,479,167 3,473,274 3,441,105 Hillman Group Inc. (The) (New) (a) Consumer goods: Durable Delayed Draw Term Loan (2/21) Loan 1M USD LIBOR+ 2.75 % 0.50 % 7.38 % 7/14/2028 66,667 66,667 57,444 HLF Financing SARL (Herbalife) Consumer goods: Non-durable Term Loan B (08/18) Loan 1M USD LIBOR+ 2.50 % 0.00 % 7.13 % 8/18/2025 3,510,000 3,504,423 3,452,225 2013 -12013-1, Ltd.20212023Issuer Name Industry Asset Name Asset
Type Reference Rate/Spread LIBOR Floor Current Rate
(All In) Maturity
Date Principal/
Number of Shares Cost Fair Value Panther Guarantor II, L.P. (Forcepoint) High Tech Industries Panther Commercial T/L (1/21) (Forcepoint) Loan 3M USD LIBOR+ 4.50 % 0.50 % 4.71 % 1/7/2028 500,000 496,307 499,375 Pathway Partners Vet Management Company LLC Services: Business Term Loan Loan 1M USD LIBOR+ 3.75 % 0.00 % 3.86 % 3/31/2027 496,437 485,943 496,934 PaySafe Group PLC Services: Business Term Loan B1 (PI UK Holdco II) Loan 1M USD LIBOR+ 3.50 % 1.00 % 4.50 % 1/3/2025 1,458,750 1,453,593 1,457,320 PCI Gaming Authority Hotel, Gaming & Leisure Term Loan Loan 1M USD LIBOR+ 2.50 % 0.00 % 2.61 % 5/29/2026 878,269 874,719 876,803 Penn National Gaming Hotel, Gaming & Leisure Term Loan B-1 Loan 1M USD LIBOR+ 2.25 % 0.75 % 3.00 % 10/15/2025 1,782,979 1,722,678 1,780,109 Peraton Corp. Aerospace & Defense Peraton T/L B Loan 6M USD LIBOR+ 3.75 % 0.75 % 4.50 % 2/22/2028 1,811,655 1,802,597 1,818,449 Peraton Corp. (a) Aerospace & Defense Unfunded Commitment Loan 6M USD LIBOR+ 3.75 % 0.75 % 4.50 % 2/1/2028 - (15,942 ) 11,956 PGX Holdings, Inc. Services: Consumer Term Loan Loan 12M USD LIBOR+ 5.25 % 1.00 % 6.25 % 9/29/2023 3,149,230 3,127,880 2,998,508 Pitney Bowes Inc Services: Business Term Loan B Loan 1M USD LIBOR+ 5.50 % 0.00 % 5.62 % 1/7/2025 2,887,500 2,625,587 2,875,459 Pixelle Specialty Solutions LLC Forest Products & Paper Term Loan Loan 1M USD LIBOR+ 6.50 % 1.00 % 7.50 % 10/31/2024 3,535,026 3,510,411 3,531,491 Plastipak Holdings Inc. Containers, Packaging & Glass Plastipak Packaging T/L B (04/18) Loan 1M USD LIBOR+ 2.50 % 0.00 % 2.62 % 10/14/2024 2,789,599 2,771,753 2,788,288 Playtika Holding Corp. High Tech Industries Trm Loan B (12/19) Loan 6M USD LIBOR+ 6.00 % 1.00 % 7.00 % 12/10/2024 2,837,975 2,793,084 2,850,746 PointClickCare Technologies, Inc. High Tech Industries Term Loan B Loan 6M USD LIBOR+ 3.00 % 0.75 % 3.75 % 12/15/2027 500,000 497,597 502,500 Polymer Process Holdings, Inc. Containers, Packaging & Glass Term Loan Loan 1M USD LIBOR+ 4.75 % 0.75 % 5.50 % 2/12/2028 5,000,000 4,932,905 4,950,000 PPD, Inc. Healthcare & Pharmaceuticals Term Loan (12/20) Loan 1M USD LIBOR+ 2.25 % 0.50 % 2.75 % 1/13/2028 500,000 497,556 501,530 Pre-Paid Legal Services, Inc. Services: Business Incremental Term Loan Loan 1M USD LIBOR+ 4.00 % 0.75 % 4.75 % 5/1/2025 997,500 983,807 1,001,869 Presidio, Inc. Services: Business Term Loan B (1/20) Loan 3M USD LIBOR+ 3.50 % 0.00 % 3.72 % 1/22/2027 497,500 496,508 498,120 Prime Security Services Borrower, LLC (ADT) Services: Consumer Term Loan (1/21) Loan 12M USD LIBOR+ 2.75 % 0.75 % 3.50 % 9/23/2026 3,583,174 3,568,406 3,585,178 Priority Payment Systems LLC High Tech Industries Term Loan Loan 1M USD LIBOR+ 6.50 % 1.00 % 7.50 % 1/3/2023 1,690,068 1,685,378 1,681,615 PriSo Acquisition Corporation Construction & Building Park River Holdings T/L (01/21) Loan 3M USD LIBOR+ 3.25 % 0.75 % 4.00 % 12/28/2027 500,000 497,500 500,535 Project Leopard T/L (Kofax) High Tech Industries Term Loan Loan 3M USD LIBOR+ 5.05 % 1.00 % 5.25 % 7/8/2024 500,000 498,750 500,468 Prometric Inc. (Sarbacane Bidco) Services: Consumer Term Loan Loan 1M USD LIBOR+ 3.00 % 1.00 % 4.00 % 1/29/2025 486,338 484,893 472,961 PUG LLC Services: Consumer Term Loan B (02/20) Loan 1M USD LIBOR+ 3.50 % 0.00 % 3.61 % 2/12/2027 490,025 487,871 475,323 Rackspace Technology Global, Inc. High Tech Industries Rackspace Technology Global T/L B Loan 3M USD LIBOR+ 2.75 % 0.75 % 3.50 % 2/2/2028 500,000 497,527 499,615 Issuer Name Industry Asset Name Asset
Type Reference Rate/Spread SOFR/
LIBOR Floor Current
Rate (All In) Maturity
Date Principal/
Number of Shares Cost Fair Value Holley Purchaser, Inc Automotive Term Loan (11/21) Loan 3M USD LIBOR+ 3.75 % 0.75 % 8.48 % 11/17/2028 2,317,577 2,309,047 1,888,825 Howden Group Holdings Banking, Finance, Insurance & Real Estate Term Loan (1/21) Loan 1M USD LIBOR+ 3.25 % 0.75 % 7.94 % 11/12/2027 2,152,191 2,144,311 2,117,218 Hudson River Trading LLC Banking, Finance, Insurance & Real Estate Term Loan (3/21) Loan 1M USD SOFR+ 3.00 % 0.00 % 7.73 % 3/17/2028 5,895,000 5,850,826 5,619,173 Idera, Inc. High Tech Industries Term Loan (02/21) Loan 3M USD LIBOR+ 3.75 % 0.75 % 8.51 % 3/2/2028 4,811,111 4,802,585 4,635,698 IMA Financial Group, Inc. Banking, Finance, Insurance & Real Estate Term Loan (10/21) Loan 1M USD LIBOR+ 3.50 % 0.50 % 8.13 % 11/1/2028 1,980,000 1,972,160 1,947,825 INDY US BIDCO, LLC Services: Business Term Loan (11/21) Loan 1M USD LIBOR+ 3.75 % 0.00 % 8.38 % 3/6/2028 2,215,703 2,215,226 1,888,200 Ineos US Finance LLC Chemicals, Plastics, & Rubber Term Loan C Loan 1M USD SOFR+ 3.75 % 0.00 % 8.42 % 2/9/2030 1,000,000 990,000 991,560 INEOS US PETROCHEM LLC Chemicals, Plastics, & Rubber Term Loan (1/21) Loan 1M USD LIBOR+ 2.75 % 0.50 % 7.38 % 1/29/2026 1,979,950 1,929,143 1,967,080 Informatica Inc. High Tech Industries Term Loan B (10/21) Loan 1M USD LIBOR+ 2.75 % 0.00 % 7.44 % 10/27/2028 496,250 495,896 494,761 Ingram Micro Inc. Wholesale Term Loan Loan 3M USD LIBOR+ 3.50 % 0.50 % 8.23 % 6/30/2028 1,477,500 1,465,872 1,468,266 Inmar Acquisition Sub, Inc. Services: Business Term Loan B Loan 1M USD LIBOR+ 4.00 % 1.00 % 8.63 % 5/1/2024 3,350,673 3,327,770 3,270,055 Innophos, Inc. Chemicals, Plastics, & Rubber Term Loan B Loan 1M USD LIBOR+ 3.25 % 0.00 % 7.88 % 2/4/2027 486,250 484,966 483,007 INSTANT BRANDS HOLDINGS INC. Consumer goods: Durable Term Loan 4/21 Loan 3M USD LIBOR+ 5.00 % 0.75 % 9.95 % 4/7/2028 4,027,667 4,010,741 2,154,802 IRB Holding Corporation Beverage, Food & Tobacco Term Loan B3 Loan 1M USD SOFR+ 3.00 % 0.75 % 7.57 % 12/14/2027 500,000 495,150 493,125 IRB Holding T/L B (1/22) Beverage, Food & Tobacco Term Loan B Loan 1M USD SOFR+ 3.00 % 0.75 % 7.69 % 12/15/2027 500,000 495,150 493,125 Isagenix International, LLC (b) Beverage, Food & Tobacco Term Loan Loan 3M USD LIBOR+ 7.75 % 1.00 % 11.35 % 6/14/2025 2,330,036 2,311,947 814,068 J Jill Group, Inc Retail Priming Term Loan Loan 3M USD LIBOR+ 5.00 % 1.00 % 9.83 % 5/8/2024 1,553,698 1,553,299 1,464,361 Jane Street Group Banking, Finance, Insurance & Real Estate Term Loan (1/21) Loan 1M USD LIBOR+ 2.75 % 0.00 % 7.38 % 1/31/2028 3,920,000 3,917,671 3,897,970 Journey Personal Care Corp. Consumer goods: Non-durable Term Loan B Loan 3M USD LIBOR+ 4.25 % 0.75 % 8.98 % 3/1/2028 985,000 981,310 731,569 JP Intermediate B, LLC Consumer goods: Non-durable Term Loan Loan 3M USD LIBOR+ 5.50 % 1.00 % 10.33 % 11/15/2025 3,884,160 3,863,896 2,469,199 Klockner-Pentaplast of America, Inc. Containers, Packaging & Glass Term Loan (1/21) (USD) Loan 6M USD SOFR+ 4.75 % 0.50 % 10.13 % 2/12/2026 1,473,750 1,469,605 1,354,936 Kodiak BP, LLC Construction & Building Term Loan Loan 3M USD LIBOR+ 3.25 % 0.75 % 7.98 % 3/13/2028 491,242 490,111 472,083 KREF Holdings X LLC Banking, Finance, Insurance & Real Estate Term Loan (11/21) Loan 1M USD LIBOR+ 3.50 % 0.50 % 8.13 % 9/1/2027 491,288 482,835 482,690 Lakeland Tours, LLC Hotel, Gaming & Leisure Holdco Fixed Term Loan Loan Fixed 0.00 % 0.00 % 13.25 % 9/27/2027 990,775 383,373 644,004 Lealand Finance Company B.V. Energy: Oil & Gas Exit Term Loan Loan 1M USD LIBOR+ 1.00 % 0.00 % 5.63 % 6/30/2025 345,078 345,078 221,426 LHS BORROWER, LLC Construction & Building Term Loan (02/22) Loan 1M USD SOFR+ 4.75 % 0.50 % 9.47 % 2/16/2029 997,487 815,989 817,940 Lifetime Brands, Inc Consumer goods: Non-durable Term Loan B Loan 1M USD SOFR+ 3.50 % 1.00 % 8.23 % 2/28/2025 2,616,496 2,602,628 2,295,975 Liquid Tech Solutions Holdings, LLC Services: Business Term Loan Loan 6M USD LIBOR+ 4.75 % 0.00 % 8.92 % 3/17/2028 985,000 982,312 940,675 2013 -12013-1, Ltd.20212023Issuer Name Industry Asset Name Asset
Type Reference Rate/Spread LIBOR Floor Current Rate
(All In) Maturity
Date Principal/
Number of Shares Cost Fair Value Radiology Partners Holdings, LLC Healthcare & Pharmaceuticals Term Loan Loan 1M USD LIBOR+ 4.25 % 0.00 % 4.37 % 7/4/2025 1,432,727 1,427,557 1,426,466 Ravago Holdings America Chemicals, Plastics, & Rubber Ravago (2/21) T/L Loan 6M USD LIBOR+ 2.50 % 0.00 % 2.75 % 2/9/2028 1,000,000 997,500 999,380 RealPage, Inc. High Tech Industries RealPage T/L (2/21) Loan 1M USD LIBOR+ 3.25 % 0.50 % 3.38 % 2/17/2028 3,000,000 2,992,500 3,001,260 Redstone Buyer, LLC High Tech Industries Term Loan Loan 3M USD LIBOR+ 5.00 % 1.00 % 6.00 % 9/1/2027 997,500 979,386 1,009,141 Renaissance Learning T/L (5/18) Services: Consumer Term Loan Loan 1M USD LIBOR+ 3.25 % 0.00 % 3.36 % 5/30/2025 3,000,000 2,970,900 2,968,740 Rent-A-Center, Inc. Retail Rent-A-Center T/L B (01/21) Loan 1M USD LIBOR+ 4.00 % 0.75 % 4.75 % 1/17/2028 500,000 497,500 503,125 REP WWEX (Worldwide Express) Aquisition Parent, LLC Transportation: Consumer Term Loan B Loan 6M USD LIBOR+ 4.00 % 1.00 % 5.00 % 2/2/2024 1,927,839 1,926,592 1,932,658 Research Now Group, Inc Media: Advertising, Printing & Publishing Term Loan Loan 6M USD LIBOR+ 5.50 % 1.00 % 6.50 % 12/20/2024 3,887,330 3,796,436 3,881,499 Resideo Funding Inc. Services: Consumer Resideo Funding T/L (1/21) (Resideo Technologies) Loan 3M USD LIBOR+ 2.25 % 0.50 % 2.75 % 2/11/2028 1,500,000 1,496,250 1,496,250 Resolute Investment Managers (American Beacon), Inc. Banking, Finance, Insurance & Real Estate Term Loan (10/20) Loan 3M USD LIBOR+ 3.75 % 1.00 % 4.75 % 4/30/2024 2,651,324 2,651,324 2,657,952 Rexnord LLC Capital Equipment Term Loan (11/19) Loan 1M USD LIBOR+ 1.75 % 0.00 % 1.86 % 8/21/2024 862,069 862,069 860,724 Reynolds Consumer Products LLC Containers, Packaging & Glass Reynolds Consumer Products T/L Loan 1M USD LIBOR+ 1.75 % 0.00 % 1.86 % 1/29/2027 1,306,932 1,305,639 1,307,912 Reynolds Group Holdings Inc. Metals & Mining Term Loan B2 Loan 1M USD LIBOR+ 3.25 % 0.00 % 3.36 % 2/5/2026 2,000,000 1,986,099 1,991,660 Robertshaw US Holding Corp. Consumer goods: Durable Term Loan B Loan 1M USD LIBOR+ 3.50 % 1.00 % 4.50 % 2/28/2025 972,500 970,927 916,581 Rocket Software, Inc. High Tech Industries Term Loan (11/18) Loan 1M USD LIBOR+ 4.25 % 0.00 % 4.36 % 11/28/2025 2,935,063 2,925,286 2,939,114 RP Crown Parent, LLC High Tech Industries Term Loan B (07/20) Loan 1M USD LIBOR+ 3.00 % 1.00 % 4.00 % 1/31/2026 1,990,000 1,981,157 1,992,488 Russell Investments US Inst’l Holdco, Inc. Banking, Finance, Insurance & Real Estate Term Loan (10/20) Loan 6M USD LIBOR+ 3.00 % 1.00 % 4.00 % 6/2/2025 5,637,965 5,591,015 5,648,565 RV Retailer LLC Automotive RVR Dealership Holdings T/L (RV Retailer) Loan 3M USD LIBOR+ 4.00 % 0.75 % 4.75 % 1/28/2028 2,000,000 1,980,404 1,992,500 Ryan Specialty Group LLC Banking, Finance, Insurance & Real Estate Term Loan Loan 1M USD LIBOR+ 3.25 % 0.75 % 4.00 % 9/1/2027 498,750 491,823 499,373 Sally Holdings LLC Retail Term Loan B Loan 1M USD LIBOR+ 2.25 % 0.00 % 2.37 % 7/5/2024 768,409 766,247 768,409 Samsonite International S.A. Consumer goods: Non-durable Term Loan B2 Loan 1M USD LIBOR+ 4.50 % 1.00 % 5.50 % 4/25/2025 995,000 968,936 1,002,463 Savage Enterprises, LLC Energy: Oil & Gas Term Loan B (02/20) Loan 1M USD LIBOR+ 3.00 % 0.00 % 3.12 % 8/1/2025 1,769,504 1,754,769 1,771,999 Schweitzer-Mauduit International, Inc. High Tech Industries Schweitzer-Mauduit T/L B Loan 1M USD LIBOR+ 4.00 % 0.75 % 4.75 % 1/27/2028 1,000,000 990,000 997,500 Seadrill Operating LP (b) Energy: Oil & Gas PIK Revolver Loan 1M USD LIBOR+ 0.00 % 1.00 % 1.00 % 3/31/2021 25,683 25,656 27,224 Issuer Name Industry Asset Name Asset
Type Reference Rate/Spread SOFR/
LIBOR Floor Current
Rate (All In) Maturity
Date Principal/
Number of Shares Cost Fair Value LogMeIn, Inc. High Tech Industries Term Loan (8/20) Loan 1M USD LIBOR+ 4.75 % 0.00 % 9.38 % 8/31/2027 3,920,000 3,868,809 2,137,145 LOYALTY VENTURES INC. (b) Services: Business Term Loan B Loan Prime 3.50 % 0.50 % 11.25 % 11/3/2027 3,089,630 3,074,278 926,889 LPL Holdings, Inc. Banking, Finance, Insurance & Real Estate Term Loan B1 Loan 1M USD LIBOR+ 1.75 % 0.00 % 6.32 % 11/11/2026 1,207,856 1,206,501 1,203,701 LSF11 A5 HOLDCO LLC Chemicals, Plastics, & Rubber Term Loan (01/23) Loan 1M USD SOFR+ 4.25 % 0.50 % 8.97 % 10/14/2028 500,000 486,534 489,165 LSF11 A5 HOLDCO LLC Chemicals, Plastics, & Rubber Term Loan Loan 1M USD SOFR+ 3.50 % 0.50 % 8.23 % 10/16/2028 248,125 247,170 241,508 LSF9 Atlantis Holdings, LLC (A Wireless) Retail Term Loan B Loan 3M USD SOFR+ 7.25 % 0.75 % 11.83 % 3/29/2029 2,962,500 2,872,908 2,888,438 MAGNITE, INC. Services: Business Term Loan Loan 1M USD LIBOR+ 5.00 % 0.75 % 9.63 % 4/28/2028 2,964,950 2,901,156 2,826,575 Marriott Ownership Resorts, Inc. Hotel, Gaming & Leisure Term Loan (11/19) Loan 1M USD LIBOR+ 1.75 % 0.00 % 6.38 % 8/29/2025 1,317,074 1,317,074 1,308,842 Match Group, Inc, The Services: Consumer Term Loan (1/20) Loan 3M USD LIBOR+ 1.75 % 0.00 % 6.49 % 2/15/2027 250,000 249,658 247,500 Maxar Technologies Inc Aerospace & Defense Term Loan (6/22) Loan 1M USD SOFR+ 4.25 % 0.50 % 8.97 % 6/14/2029 1,994,987 1,926,722 1,997,641 Mayfield Agency Borrower Inc. (FeeCo) Banking, Finance, Insurance & Real Estate Term Loan B (02/23) Loan 3M USD SOFR+ 5.00 % 0.00 % 8.81 % 2/27/2028 3,450,000 3,346,500 3,363,750 McGraw-Hill Education, Inc. Media: Advertising, Printing & Publishing Term Loan (07/21) Loan 3M USD LIBOR+ 4.75 % 0.50 % 9.70 % 7/28/2028 1,975,000 1,957,770 1,894,025 MedAssets Software Inter Hldg, Inc. High Tech Industries Term Loan (11/21) (USD) Loan 1M USD LIBOR+ 4.00 % 0.50 % 8.63 % 12/18/2028 496,250 493,413 462,753 Mermaid Bidco Inc. High Tech Industries Term Loan B2 Loan 3M USD LIBOR+ 3.50 % 0.75 % 8.30 % 12/22/2027 983,769 981,224 964,093 Messer Industries, LLC Chemicals, Plastics, & Rubber Term Loan B Loan 3M USD LIBOR+ 2.50 % 0.00 % 7.23 % 3/1/2026 2,980,405 2,970,477 2,968,871 Michaels Companies Inc Retail Term Loan B (Magic Mergeco) Loan 3M USD LIBOR+ 4.25 % 0.75 % 8.98 % 4/8/2028 2,467,450 2,452,022 2,254,632 MPH Acquisition Holdings LLC (Multiplan) Services: Business Term Loan B (08/21) Loan 3M USD LIBOR+ 4.25 % 0.50 % 9.20 % 9/1/2028 2,992,424 2,725,679 2,509,148 MW Industries, Inc. (Helix Acquisition Holdings) Capital Equipment Term Loan (2019 Incremental) Loan 3M USD LIBOR+ 3.75 % 0.00 % 8.48 % 9/30/2024 2,842,097 2,823,791 2,778,150 NAB Holdings, LLC (North American Bancard) Banking, Finance, Insurance & Real Estate Term Loan (11/21) Loan 3M USD SOFR+ 3.00 % 0.50 % 7.73 % 11/23/2028 2,970,000 2,963,897 2,927,678 Napa Management Services Corp Healthcare & Pharmaceuticals Term Loan B (02/22) Loan 1M USD SOFR+ 5.25 % 0.75 % 9.95 % 2/22/2029 3,000,000 2,407,500 2,285,640 Natgasoline LLC Chemicals, Plastics, & Rubber Term Loan Loan 1M USD LIBOR+ 3.50 % 0.00 % 8.19 % 11/14/2025 3,436,481 3,419,311 3,395,690 National Mentor Holdings, Inc. Healthcare & Pharmaceuticals Term Loan 2/21 Loan 1M USD SOFR+ 3.75 % 0.75 % 8.47 % 3/2/2028 2,736,043 2,727,702 2,108,477 National Mentor Holdings, Inc. Healthcare & Pharmaceuticals Term Loan C 2/21 Loan 3M USD LIBOR+ 3.75 % 0.75 % 8.48 % 3/2/2028 87,464 87,137 67,402 NEW ERA CAP, LLC Consumer goods: Durable Term Loan (01/22) Loan 3M USD LIBOR+ 6.00 % 0.75 % 10.82 % 7/13/2027 3,628,164 3,627,422 3,483,037 Nexstar Broadcasting, Inc. (Mission Broadcasting) Media: Broadcasting & Subscription Term Loan Loan 1M USD LIBOR+ 2.50 % 0.00 % 7.13 % 9/18/2026 657,625 652,850 655,745 Next Level Apparel, Inc. Retail Term Loan Loan 3M USD LIBOR+ 5.50 % 1.00 % 10.33 % 8/9/2024 1,675,340 1,670,519 1,373,779 2013 -12013-1, Ltd.20212023Issuer Name Industry Asset Name Asset
Type Reference Rate/Spread LIBOR Floor Current Rate
(All In) Maturity
Date Principal/
Number of Shares Cost Fair Value Seadrill Operating LP (b) Energy: Oil & Gas Term Loan B Loan 1M USD LIBOR+ 8.00 % 1.00 % 9.00 % 3/31/2021 897,442 897,442 86,379 Shutterfly Inc Media: Advertising, Printing & Publishing Term Loan B Loan 3M USD LIBOR+ 6.00 % 1.00 % 7.00 % 9/25/2026 800,968 767,474 803,403 Sirius Computer Solutions, Inc. High Tech Industries Term Loan 1/20 Loan 1M USD LIBOR+ 3.50 % 0.00 % 3.61 % 7/1/2026 1,970,100 1,966,584 1,970,809 SMG US Midco 2, Inc. Services: Business Term Loan (01/20) Loan 1M USD LIBOR+ 2.50 % 0.00 % 2.61 % 1/23/2025 495,000 495,000 470,869 Sotheby’s Services: Business Term Loan (1/21) Loan 3M USD LIBOR+ 4.75 % 0.75 % 5.50 % 1/15/2027 3,289,283 3,230,819 3,312,571 Specialty Pharma III Inc. Services: Business Term Loan Loan 1M USD LIBOR+ 4.50 % 0.75 % 5.25 % 2/24/2028 2,000,000 1,980,000 1,980,000 Spectrum Brands, Inc. Consumer goods: Durable Spectrum Brands T/L (2/21) Loan 1M USD LIBOR+ 2.00 % 0.50 % 2.50 % 2/19/2028 500,000 498,750 501,250 SRAM, LLC Consumer goods: Durable Term Loan Loan 1M USD LIBOR+ 2.75 % 1.00 % 3.75 % 3/15/2024 2,221,329 2,219,239 2,225,505 SS&C Technologies, Inc. Services: Business Term Loan B4 Loan 1M USD LIBOR+ 1.75 % 0.00 % 1.86 % 4/16/2025 178,883 178,618 178,212 SS&C Technologies, Inc. Services: Business Term Loan B-5 Loan 1M USD LIBOR+ 1.75 % 0.00 % 1.86 % 4/16/2025 488,567 487,746 486,735 SS&C Technologies, Inc. Services: Business Term Loan B3 Loan 1M USD LIBOR+ 1.75 % 0.00 % 1.86 % 4/16/2025 234,915 234,561 234,034 Staples, Inc. Wholesale Term Loan (03/19) Loan 3M USD LIBOR+ 5.00 % 0.00 % 5.21 % 4/16/2026 4,431,567 4,285,772 4,340,853 Stats LLC Hotel, Gaming & Leisure Term Loan Loan 3M USD LIBOR+ 5.25 % 0.00 % 5.45 % 7/10/2026 1,980,000 1,940,067 1,972,575 Storable, Inc High Tech Industries Term Loan B Loan 1M USD LIBOR+ 3.25 % 0.50 % 3.75 % 2/26/2028 500,000 498,750 500,000 Syncsort Incorporated High Tech Industries Term Loan (1/21) Loan 3M USD LIBOR+ 4.75 % 0.75 % 5.50 % 8/16/2024 1,935,450 1,922,522 1,939,476 Teneo Holdings LLC Banking, Finance, Insurance & Real Estate Term Loan Loan 1M USD LIBOR+ 5.25 % 1.00 % 6.25 % 7/15/2025 2,468,750 2,392,146 2,471,836 Tenneco Inc Capital Equipment Term Loan B Loan 1M USD LIBOR+ 3.00 % 0.00 % 3.11 % 10/1/2025 1,470,000 1,459,901 1,440,233 Ten-X, LLC Banking, Finance, Insurance & Real Estate Term Loan Loan 1M USD LIBOR+ 4.00 % 1.00 % 5.00 % 9/27/2024 1,940,000 1,938,385 1,841,390 The Octave Music Group, Inc (Touchtunes) Services: Business Term Loan B Loan 1M USD LIBOR+ 5.25 % 1.00 % 6.25 % 5/29/2025 3,896,552 3,862,705 3,584,828 Thor Industries, Inc. Automotive Term Loan (USD) Loan 1M USD LIBOR+ 3.75 % 0.00 % 3.88 % 2/1/2026 2,935,080 2,874,260 2,937,839 Tivity Health, Inc. Healthcare & Pharmaceuticals Term Loan A Loan 1M USD LIBOR+ 4.25 % 0.00 % 4.36 % 3/7/2024 558,772 555,085 556,677 Tivity Health, Inc. Healthcare & Pharmaceuticals Term Loan B Loan 1M USD LIBOR+ 5.25 % 0.00 % 5.36 % 3/6/2026 1,064,955 1,044,356 1,060,461 Tosca Services, LLC Containers, Packaging & Glass Term Loan (2/21) Loan 1M USD LIBOR+ 3.50 % 0.75 % 4.25 % 8/18/2027 500,000 493,032 501,565 Transdigm, Inc. Aerospace & Defense Term Loan G (02/20) Loan 1M USD LIBOR+ 2.25 % 0.00 % 2.36 % 8/22/2024 4,065,230 4,068,753 4,014,415 Travel Leaders Group, LLC Hotel, Gaming & Leisure Term Loan B (08/18) Loan 1M USD LIBOR+ 4.00 % 0.00 % 4.11 % 1/25/2024 2,437,500 2,435,050 2,268,411 TRC Companies, Inc. Services: Business Term Loan Loan 1M USD LIBOR+ 3.50 % 1.00 % 4.50 % 6/21/2024 3,315,141 3,307,088 3,311,826 Issuer Name Industry Asset Name Asset
Type Reference Rate/Spread SOFR/
LIBOR Floor Current
Rate (All In) Maturity
Date Principal/
Number of Shares Cost Fair Value NortonLifeLock Inc. High Tech Industries Term Loan B Loan 1M USD SOFR+ 2.00 % 0.50 % 6.72 % 9/12/2029 1,398,374 1,392,077 1,382,391 Novae LLC Automotive Term Loan B Loan 3M USD SOFR+ 5.00 % 0.75 % 9.82 % 12/22/2028 1,985,000 1,972,048 1,692,213 Nuvei Technologies Corp. High Tech Industries US Term Loan Loan 1M USD LIBOR+ 2.50 % 0.50 % 7.13 % 9/29/2025 2,216,250 2,213,211 2,210,709 Olaplex, Inc. Consumer goods: Non-durable Term Loan (2/22) Loan 1M USD SOFR+ 3.50 % 0.50 % 8.20 % 2/23/2029 2,492,500 2,386,817 2,224,556 Open Text Corporation High Tech Industries Term Loan B Loan 1M USD SOFR+ 3.50 % 0.50 % 8.22 % 8/24/2029 1,500,000 1,455,000 1,496,955 Organon & Co. Healthcare & Pharmaceuticals Term Loan USD Loan 3M USD LIBOR+ 3.00 % 0.50 % 7.75 % 6/2/2028 2,327,083 2,318,310 2,297,995 Pacific Gas & Electric Utilities: Electric Term Loan Loan 1M USD LIBOR+ 3.00 % 0.50 % 7.69 % 6/18/2025 1,464,944 1,460,891 1,457,619 PACTIV EVERGREEN GROUP HOLDINGS INC. Containers, Packaging & Glass Term Loan B Loan 1M USD LIBOR+ 3.25 % 0.50 % 7.88 % 9/20/2028 987,500 983,571 981,950 Padagis LLC Healthcare & Pharmaceuticals Term Loan Loan 3M USD LIBOR+ 4.75 % 0.50 % 9.54 % 7/6/2028 941,176 933,570 864,122 Panther Guarantor II, L.P. (Forcepoint) High Tech Industries Term Loan 1/21 Loan 3M USD LIBOR+ 4.25 % 0.50 % 9.08 % 1/7/2028 492,500 489,882 461,719 PAR PETROLEUM LLC Energy: Oil & Gas Term Loan 2/23 Loan 1M USD SOFR+ 4.25 % 0.50 % 8.92 % 2/13/2030 1,500,000 1,477,500 1,479,375 PATAGONIA HOLDCO LLC Telecommunications Term Loan B Loan 3M USD SOFR+ 5.75 % 0.50 % 10.47 % 8/1/2029 1,995,000 1,653,635 1,700,738 Pathway Partners Vet Management Company LLC Services: Business Term Loan Loan 1M USD LIBOR+ 3.75 % 0.00 % 8.38 % 3/30/2027 486,509 479,333 424,630 PCI Gaming Authority Hotel, Gaming & Leisure Term Loan Loan 1M USD LIBOR+ 2.50 % 0.00 % 7.13 % 5/29/2026 809,038 806,994 807,396 PEARLS (Netherlands) Bidco B.V. Chemicals, Plastics, & Rubber USD Term Loan (02/22) Loan 3M USD SOFR+ 3.75 % 0.50 % 8.43 % 2/28/2029 992,500 990,539 975,131 PEDIATRIC ASSOCIATES HOLDING COMPANY, LLC Healthcare & Pharmaceuticals Term Loan (12/22) Loan 1M USD LIBOR+ 3.25 % 0.50 % 7.88 % 12/29/2028 1,292,862 1,287,663 1,272,396 PEDIATRIC ASSOCIATES HOLDING COMPANY, LLC (a) Healthcare & Pharmaceuticals Delayed Draw Term Loan (12/21) Loan 1M USD LIBOR+ 3.25 % 0.50 % 7.88 % 12/29/2028 147,287 147,287 144,174 Penn National Gaming, Inc Hotel, Gaming & Leisure Term Loan B Loan 1M USD SOFR+ 2.75 % 0.50 % 7.47 % 5/3/2029 995,000 990,530 990,851 Peraton Corp. Aerospace & Defense Term Loan B Loan 1M USD LIBOR+ 3.75 % 0.75 % 8.38 % 2/1/2028 5,306,577 5,291,284 5,249,372 PHYSICIAN PARTNERS, LLC Healthcare & Pharmaceuticals Term Loan Loan 1M USD SOFR+ 4.00 % 0.50 % 8.72 % 12/23/2028 1,985,000 1,967,896 1,900,638 Pike Corporation Construction & Building Term Loan (8/22) Loan 1M USD SOFR+ 3.50 % 0.00 % 8.12 % 1/21/2028 498,750 487,274 497,294 Pitney Bowes Inc Services: Business Term Loan B Loan 1M USD SOFR+ 4.00 % 0.00 % 8.73 % 3/17/2028 3,939,924 3,914,651 3,789,734 Plastipak Holdings Inc. Containers, Packaging & Glass Term Loan B (11/21) Loan 1M USD LIBOR+ 2.50 % 0.50 % 7.13 % 12/1/2028 1,921,176 1,913,386 1,911,974 Playtika Holding Corp. High Tech Industries Term Loan B (3/21) Loan 1M USD LIBOR+ 2.75 % 0.00 % 7.38 % 3/13/2028 4,421,250 4,414,119 4,370,804 PMHC II, INC. Chemicals, Plastics, & Rubber Term Loan (02/22) Loan 3M USD SOFR+ 4.25 % 0.50 % 9.08 % 4/21/2029 1,995,000 1,986,056 1,710,912 PointClickCare Technologies, Inc. High Tech Industries Term Loan B Loan 3M USD LIBOR+ 3.00 % 0.75 % 7.75 % 12/29/2027 491,250 489,531 487,566 2013 -12013-1, Ltd.20212023Issuer Name Industry Asset Name Asset
Type Reference Rate/Spread LIBOR Floor Current Rate
(All In) Maturity
Date Principal/
Number of Shares Cost Fair Value TRC Companies, Inc. Services: Business TRC Companies T/L (1/21) Loan 1M USD LIBOR+ 4.50 % 0.75 % 5.25 % 6/21/2024 2,479,433 2,468,047 2,485,631 Trico Group LLC Automotive Term Loan B-3 Loan 3M USD LIBOR+ 7.50 % 1.00 % 8.50 % 2/2/2024 5,070,478 4,962,793 5,150,338 Trident LS Merger Sub Corporation Services: Consumer Term Loan (03/18) Loan 1M USD LIBOR+ 3.25 % 0.00 % 3.36 % 5/1/2025 2,000,000 2,004,987 1,999,500 Truck Hero, Inc. Transportation: Cargo Term Loan (1/21) Loan 1M USD LIBOR+ 3.75 % 0.75 % 4.50 % 1/29/2028 1,500,000 1,500,000 1,501,065 TruGreen Limited Partnership Services: Consumer Term Loan Loan 1M USD LIBOR+ 4.00 % 0.75 % 4.75 % 10/29/2027 973,980 966,347 980,068 Twin River Worldwide Holdings, Inc. Hotel, Gaming & Leisure Term Loan B Loan 3M USD LIBOR+ 2.75 % 0.00 % 3.00 % 5/10/2026 985,000 981,152 975,889 Uber Technologies T/L B (2/21) Transportation: Consumer Term Loan Loan 1M USD LIBOR+ 3.50 % 0.00 % 3.62 % 7/13/2023 1,989,610 1,941,468 1,992,097 Ultimate Software Group, Inc. (The) High Tech Industries Term Loan 1/21 Loan 3M USD LIBOR+ 3.25 % 0.75 % 4.00 % 5/4/2026 1,000,000 1,000,000 1,005,690 Unimin Corporation Metals & Mining Term Loan (12/20) Loan 3M USD LIBOR+ 4.00 % 1.00 % 5.00 % 7/31/2026 496,815 466,608 476,232 United Natural Foods, Inc Beverage, Food & Tobacco Term Loan B Loan 1M USD LIBOR+ 3.50 % 0.00 % 3.61 % 10/22/2025 1,973,611 1,879,449 1,978,545 United Road Services Inc. Transportation: Cargo Term Loan (10/17) Loan 6M USD LIBOR+ 5.75 % 1.00 % 6.75 % 9/1/2024 952,506 944,697 880,592 Univar Inc. Chemicals, Plastics, & Rubber Term Loan B3 (11/17) Loan 1M USD LIBOR+ 2.25 % 0.00 % 2.36 % 7/1/2024 1,627,723 1,623,316 1,628,602 Univision Communications Inc. Media: Broadcasting & Subscription 2020 Replacement Term Loan Loan 1M USD LIBOR+ 3.75 % 1.00 % 4.75 % 3/13/2026 2,517,037 2,508,528 2,527,433 US Ecology, Inc. Environmental Industries Term Loan B Loan 1M USD LIBOR+ 2.50 % 0.00 % 2.61 % 11/2/2026 495,000 494,095 496,445 Utz Quality Foods, LLC Beverage, Food & Tobacco Term Loan B Loan 1M USD LIBOR+ 3.00 % 0.00 % 3.11 % 1/13/2028 100,000 99,764 100,464 Verifone Systems, Inc. Banking, Finance, Insurance & Real Estate Term Loan (7/18) Loan 3M USD LIBOR+ 4.00 % 0.00 % 4.18 % 8/20/2025 1,396,606 1,389,850 1,362,571 VFH Parent LLC Banking, Finance, Insurance & Real Estate Term Loan B Loan 1M USD LIBOR+ 3.00 % 0.00 % 3.11 % 3/1/2026 3,209,493 3,199,747 3,215,526 Virence Intermediate Holdings LLC (Athenahealth / VVC Holding) Healthcare & Pharmaceuticals Athenahealth T/L B (01/21) Loan 3M USD LIBOR+ 4.25 % 0.00 % 4.45 % 2/11/2026 3,965,000 3,935,495 3,986,570 Virtus Investment Partners, Inc. Banking, Finance, Insurance & Real Estate Term Loan B Loan 6M USD LIBOR+ 2.25 % 0.75 % 3.00 % 6/3/2024 2,406,176 2,405,891 2,407,692 Vistra Energy Corp Utilities: Electric 2018 Incremental Term Loan Loan 1M USD LIBOR+ 1.75 % 0.00 % 1.86 % 12/31/2025 917,338 916,645 913,751 Vizient, Inc Healthcare & Pharmaceuticals Term Loan B-6 Loan 1M USD LIBOR+ 2.00 % 0.00 % 2.11 % 5/6/2026 491,250 490,388 490,430 VM Consolidated, Inc. Construction & Building Term Loan B1 (02/20) Loan 1M USD LIBOR+ 3.25 % 0.00 % 3.36 % 2/28/2025 475,444 473,957 475,344 Vouvray US Finance LLC High Tech Industries Term Loan Loan 1M USD LIBOR+ 3.00 % 1.00 % 4.00 % 3/11/2024 481,250 481,250 417,605 Warner Music Group Corp. (WMG Acquisition Corp.) Hotel, Gaming & Leisure Term Loan G Loan 1M USD LIBOR+ 2.13 % 0.00 % 2.24 % 1/20/2028 250,000 249,702 250,403 Wastequip, LLC (HPCC Merger/Patriot Container) Environmental Industries Term Loan (3/18) Loan 1M USD LIBOR+ 3.50 % 1.00 % 4.50 % 3/15/2025 494,911 492,859 492,436 WeddingWire, Inc. Services: Consumer Term Loan Loan 2M USD LIBOR+ 4.50 % 0.00 % 4.66 % 12/19/2025 3,920,000 3,914,114 3,875,900 West Corporation Telecommunications Term Loan B Loan 1M USD LIBOR+ 3.50 % 1.00 % 4.50 % 10/10/2024 2,931,109 2,874,412 2,866,742 West Corporation Telecommunications Term Loan B (Olympus Merger) Loan 3M USD LIBOR+ 4.00 % 1.00 % 5.00 % 10/10/2024 1,224,748 1,166,274 1,207,062 Western Dental Services, Inc. Retail Term Loan (12/18) Loan 1M USD LIBOR+ 5.25 % 1.00 % 6.25 % 6/30/2023 424,019 424,421 416,598 Western Digital Corporation High Tech Industries Term Loan B-4 Loan 1M USD LIBOR+ 1.75 % 0.00 % 1.86 % 4/29/2023 743,135 732,963 742,867 Wirepath LLC Consumer goods: Non-durable Term Loan Loan 3M USD LIBOR+ 4.00 % 0.00 % 4.25 % 8/5/2024 2,925,193 2,906,978 2,897,170 WP CITYMD BIDCO LLC Services: Consumer Term Loan B (1/21) Loan 6M USD LIBOR+ 3.75 % 0.75 % 4.50 % 8/13/2026 3,465,000 3,437,657 3,471,791 Xperi Corporation High Tech Industries Term Loan Loan 1M USD LIBOR+ 4.00 % 0.00 % 4.11 % 6/1/2025 2,854,798 2,706,612 2,874,439 Zekelman Industries, Inc. Metals & Mining Term Loan (01/20) Loan 1M USD LIBOR+ 2.00 % 0.00 % 2.11 % 1/25/2027 970,775 970,775 968,551 $ 595,249,474 $ 592,020,041 Issuer Name Industry Asset Name Asset
Type Reference Rate/Spread SOFR/
LIBOR Floor Current
Rate (All In) Maturity
Date Principal/
Number of Shares Cost Fair Value Polymer Process Holdings, Inc. Containers, Packaging & Glass Term Loan Loan 1M USD LIBOR+ 4.75 % 0.75 % 9.38 % 2/12/2028 5,403,750 5,359,857 5,025,488 Pre-Paid Legal Services, Inc. Services: Consumer Term Loan (12/21) Loan 1M USD LIBOR+ 3.75 % 0.50 % 8.38 % 12/15/2028 2,977,500 2,956,393 2,929,116 Presidio, Inc. Services: Business Term Loan B (1/20) Loan 3M USD SOFR+ 3.50 % 0.00 % 8.28 % 1/22/2027 487,500 486,909 485,267 Prime Security Services Borrower, LLC (ADT) Services: Consumer Term Loan (1/21) Loan 3M USD LIBOR+ 2.75 % 0.75 % 7.52 % 9/23/2026 3,520,468 3,520,468 3,511,667 PRIORITY HOLDINGS, LLC Services: Consumer Term Loan Loan 3M USD LIBOR+ 5.75 % 1.00 % 10.70 % 4/27/2027 2,955,000 2,932,371 2,936,531 PriSo Acquisition Corporation Construction & Building Term Loan (01/21) Loan 3M USD LIBOR+ 3.25 % 0.75 % 8.00 % 12/28/2027 491,245 489,458 450,310 Project Leopard Holdings, Inc. (NEW) High Tech Industries Term Loan B (06/22) Loan 6M USD SOFR+ 5.25 % 0.50 % 9.80 % 7/20/2029 1,000,000 933,902 924,690 Prometric Inc. (Sarbacane Bidco) Services: Consumer Term Loan Loan 1M USD LIBOR+ 3.00 % 1.00 % 7.64 % 1/29/2025 476,438 475,777 444,278 PUG LLC Services: Consumer Term Loan B (02/20) Loan 1M USD LIBOR+ 3.50 % 0.00 % 8.13 % 2/12/2027 480,126 478,777 378,099 QUEST BORROWER LIMITED High Tech Industries Term Loan (1/22) Loan 3M USD SOFR+ 4.25 % 0.50 % 9.08 % 2/1/2029 1,990,000 1,972,710 1,707,539 Rackspace Technology Global, Inc. High Tech Industries Term Loan (1/21) Loan 3M USD LIBOR+ 2.75 % 0.75 % 7.60 % 2/15/2028 2,974,823 2,882,889 1,863,310 RAND PARENT LLC Transportation: Cargo Term Loan B Loan 1M USD SOFR+ 4.25 % 0.00 % 8.80 % 2/7/2030 1,500,000 1,462,500 1,455,000 RealPage, Inc. High Tech Industries Term Loan (04/21) Loan 1M USD LIBOR+ 3.00 % 0.50 % 7.63 % 4/24/2028 987,500 985,860 955,159 Renaissance Learning, Inc. Services: Consumer Term Loan (5/18) Loan 1M USD LIBOR+ 3.25 % 0.00 % 7.88 % 5/30/2025 2,938,373 2,922,432 2,871,025 Rent-A-Center, Inc. Retail Term Loan B2 (9/21) Loan 3M USD LIBOR+ 3.25 % 0.50 % 8.13 % 2/17/2028 1,976,155 1,934,422 1,927,997 Research Now Group, Inc Media: Advertising, Printing & Publishing Term Loan Loan 3M USD LIBOR+ 5.50 % 1.00 % 10.31 % 12/20/2024 4,298,135 4,249,328 3,200,305 Resideo Funding Inc. Services: Consumer Term Loan (1/21) Loan 3M USD LIBOR+ 2.25 % 0.50 % 7.12 % 2/11/2028 1,473,750 1,471,623 1,471,908 Resolute Investment Managers (American Beacon), Inc. Banking, Finance, Insurance & Real Estate Term Loan (10/20) Loan 3M USD LIBOR+ 4.25 % 1.00 % 8.98 % 4/30/2024 3,038,616 3,035,050 2,385,313 Restoration Hardware, Inc. Retail Term Loan (9/21) Loan 1M USD LIBOR+ 2.50 % 0.50 % 7.13 % 10/20/2028 3,462,437 3,456,353 3,320,477 Reynolds Consumer Products LLC Containers, Packaging & Glass Term Loan Loan 1M USD SOFR+ 1.75 % 0.00 % 6.47 % 1/29/2027 1,276,932 1,276,737 1,273,880 Reynolds Group Holdings Inc. Containers, Packaging & Glass Term Loan B2 Loan 1M USD LIBOR+ 3.25 % 0.00 % 7.88 % 2/5/2026 3,124,551 3,114,804 3,114,302 Rocket Software, Inc. High Tech Industries Term Loan (11/18) Loan 1M USD LIBOR+ 4.25 % 0.00 % 8.88 % 11/28/2025 2,875,317 2,870,016 2,818,414 Russell Investments US Inst’l Holdco, Inc. Banking, Finance, Insurance & Real Estate Term Loan (10/20) Loan 1M USD LIBOR+ 3.50 % 1.00 % 8.13 % 6/2/2025 5,590,662 5,565,048 5,499,813 RV Retailer LLC Automotive Term Loan Loan 3M USD SOFR+ 3.75 % 0.75 % 8.55 % 2/8/2028 2,957,631 2,912,519 2,516,441 Ryan Specialty Group LLC Banking, Finance, Insurance & Real Estate Term Loan Loan 1M USD SOFR+ 3.00 % 0.75 % 7.72 % 9/1/2027 1,478,623 1,467,543 1,474,010 S&S HOLDINGS LLC Services: Business Term Loan Loan 3M USD LIBOR+ 5.00 % 0.50 % 9.83 % 3/10/2028 2,458,719 2,409,819 2,349,625 2013 -12013-1, Ltd.20212023 Number of Shares Cost Fair Value Cash and cash equivalents U.S. Bank Money Market (c) 114,145,406 $ 114,145,406 $ 114,145,406 Total cash and cash equivalents 114,145,406 $ 114,145,406 $ 114,145,406 Issuer Name Industry Asset Name Asset
Type Reference Rate/Spread SOFR/
LIBOR Floor Current
Rate (All In) Maturity
Date Principal/
Number of Shares Cost Fair Value Sally Holdings LLC Retail Term Loan B Loan 1M USD SOFR+ 2.50 % 0.00 % 7.06 % 3/24/2030 500,000 496,250 498,750 Samsonite International S.A. Consumer goods: Non-durable Term Loan B2 Loan 1M USD LIBOR+ 3.00 % 0.75 % 7.63 % 4/25/2025 927,537 914,134 927,537 Schweitzer-Mauduit International, Inc. High Tech Industries Term Loan B Loan 1M USD LIBOR+ 3.75 % 0.75 % 8.44 % 4/20/2028 2,955,000 2,942,014 2,895,900 Scientific Games Holdings LP Hotel, Gaming & Leisure Term Loan B Loan 3M USD SOFR+ 3.50 % 0.50 % 8.10 % 4/4/2029 498,750 497,703 489,942 Sedgwick Claims Management Services, Inc. Services: Business Term Loan B 2/23 Loan 1M USD SOFR+ 3.75 % 0.00 % 8.32 % 2/17/2028 1,000,000 990,000 987,500 SETANTA AIRCRAFT LEASING DAC Aerospace & Defense Term Loan Loan 3M USD LIBOR+ 2.00 % 0.00 % 6.73 % 11/2/2028 1,000,000 998,000 991,250 Signify Health, LLC Healthcare & Pharmaceuticals Term Loan B (6/21) Loan 3M USD LIBOR+ 3.00 % 0.50 % 7.73 % 6/16/2028 493,750 491,846 493,750 Sitel Worldwide Corporation Services: Business USD Term Loan (7/21) Loan 1M USD LIBOR+ 3.75 % 0.50 % 8.39 % 8/28/2028 1,975,000 1,967,031 1,966,982 SiteOne Landscape Supply, LLC Services: Business Term Loan (3/21) Loan 1M USD LIBOR+ 2.00 % 0.50 % 6.64 % 3/18/2028 777,852 776,450 774,609 SMG US Midco 2, Inc. Services: Business Term Loan (01/20) Loan 3M USD LIBOR+ 2.50 % 0.00 % 7.33 % 1/23/2025 485,000 485,000 479,243 Smyrna Ready Mix Concrete, LLC Construction & Building Term Loan Loan 1M USD SOFR+ 4.25 % 0.50 % 8.97 % 4/2/2029 1,000,000 992,500 995,000 Solis IV B.V. Consumer goods: Durable Term Loan B-1 Loan 3M USD SOFR+ 3.50 % 0.50 % 8.37 % 2/26/2029 1,994,987 1,724,963 1,826,132 Sotheby’s Services: Business Term Loan (7/21) Loan 3M USD LIBOR+ 4.50 % 0.50 % 9.33 % 1/15/2027 3,223,744 3,183,482 3,209,237 Sparta U.S. HoldCo LLC Chemicals, Plastics, & Rubber Term Loan (04/21) Loan 1M USD LIBOR+ 3.25 % 0.75 % 7.82 % 8/2/2028 1,980,000 1,972,123 1,964,160 Specialty Pharma III Inc. Services: Business Term Loan Loan 1M USD LIBOR+ 4.25 % 0.75 % 8.88 % 3/31/2028 1,975,000 1,959,930 1,821,938 Spectrum Brands, Inc. Consumer goods: Durable Term Loan (2/21) Loan 3M USD LIBOR+ 2.00 % 0.50 % 6.96 % 3/3/2028 491,250 490,363 487,158 Spin Holdco, Inc. Services: Consumer Term Loan 3/21 Loan 3M USD LIBOR+ 4.00 % 0.75 % 8.77 % 3/4/2028 2,947,500 2,935,211 2,475,487 Spirit Aerosystems Inc. Aerospace & Defense Term Loan (11/22) Loan 3M USD SOFR+ 4.50 % 0.50 % 9.18 % 1/14/2027 498,750 484,414 498,541 SRAM, LLC Consumer goods: Durable Term Loan (05/21) Loan 1M USD LIBOR+ 2.75 % 0.50 % 7.38 % 5/12/2028 2,709,091 2,705,948 2,682,000 SS&C Technologies, Inc. Services: Business Term Loan B3 Loan 1M USD LIBOR+ 1.75 % 0.00 % 6.38 % 4/16/2025 167,061 166,987 166,678 SS&C Technologies, Inc. Services: Business Term Loan B4 Loan 1M USD LIBOR+ 1.75 % 0.00 % 6.38 % 4/16/2025 148,146 148,083 147,807 SS&C Technologies, Inc. Services: Business Term Loan B-5 Loan 1M USD LIBOR+ 1.75 % 0.00 % 6.38 % 4/16/2025 458,152 457,773 457,199 STANDARD INDUSTRIES INC. Construction & Building Term Loan B Loan 6M USD LIBOR+ 2.25 % 0.50 % 6.43 % 9/22/2028 630,250 625,240 628,032 Staples, Inc. Wholesale Term Loan (03/19) Loan 3M USD LIBOR+ 5.00 % 0.00 % 9.81 % 4/16/2026 4,341,357 4,246,081 4,013,802 Storable, Inc High Tech Industries Term Loan B Loan 3M USD SOFR+ 3.50 % 0.50 % 8.08 % 4/17/2028 495,000 494,153 482,318 Summit Materials, LLC Metals & Mining Term Loan B (12/22) Loan 3M USD SOFR+ 3.00 % 0.00 % 7.61 % 12/13/2027 250,000 247,640 249,583 Superannuation & Investments US LLC Banking, Finance, Insurance & Real Estate Term Loan Loan 1M USD LIBOR+ 3.75 % 0.50 % 8.38 % 12/1/2028 990,000 981,648 984,515 Sweetwater Borrower, LLC Retail Term Loan (8/21) Loan 1M USD LIBOR+ 4.25 % 0.75 % 8.94 % 8/2/2028 2,000,000 1,905,968 1,880,000 Issuer Name Industry Asset Name Asset
Type Reference Rate/Spread SOFR/
LIBOR Floor Current
Rate (All In) Maturity
Date Principal/
Number of Shares Cost Fair Value Syncsort Incorporated High Tech Industries Term Loan B (10/21) Loan 3M USD LIBOR+ 4.00 % 0.75 % 8.82 % 4/24/2028 2,469,987 2,468,993 2,243,984 Ta TT Buyer LLC Media: Broadcasting & Subscription Term Loan 3/22 Loan 6M USD SOFR+ 5.00 % 0.50 % 8.98 % 4/2/2029 997,500 988,507 982,538 Tenable Holdings, Inc. Services: Business Term Loan B (6/21) Loan 3M USD LIBOR+ 2.75 % 0.50 % 7.58 % 7/7/2028 990,000 988,026 980,922 Teneo Holdings LLC Banking, Finance, Insurance & Real Estate Term Loan Loan 1M USD SOFR+ 5.25 % 1.00 % 9.97 % 7/15/2025 4,383,217 4,330,652 4,322,948 Ten-X, LLC Banking, Finance, Insurance & Real Estate Term Loan Loan 1M USD LIBOR+ 4.00 % 1.00 % 8.63 % 9/27/2024 1,900,000 1,899,296 1,819,250 The Dun & Bradstreet Corporation Services: Business Term Loan B Loan 1M USD SOFR+ 3.25 % 0.00 % 7.85 % 1/18/2029 248,125 246,554 246,636 The Dun & Bradstreet Corporation Services: Business Term Loan Loan 1M USD LIBOR+ 3.25 % 0.00 % 7.87 % 2/6/2026 962,949 962,285 960,021 THE KNOT WORLDWIDE INC. Services: Consumer Term Loan (1/22) Loan 1M USD SOFR+ 4.50 % 0.00 % 9.22 % 12/19/2025 4,845,447 4,840,970 4,833,333 Thor Industries, Inc. Automotive USD Term Loan (3/21) Loan 1M USD LIBOR+ 3.00 % 0.00 % 7.69 % 2/1/2026 2,015,823 1,990,264 2,004,494 Torrid LLC Wholesale Term Loan 5/21 Loan 3M USD LIBOR+ 5.50 % 0.75 % 10.31 % 6/14/2028 2,978,835 2,540,024 2,529,031 TORY BURCH LLC Retail Term Loan Loan 1M USD LIBOR+ 3.50 % 0.50 % 8.13 % 4/15/2028 1,329,211 1,232,469 1,268,147 Tosca Services, LLC Containers, Packaging & Glass Term Loan (2/21) Loan 1M USD SOFR+ 3.50 % 0.75 % 8.23 % 8/18/2027 490,000 485,078 383,180 Trans Union LLC Banking, Finance, Insurance & Real Estate Term Loan Loan 1M USD LIBOR+ 2.25 % 0.50 % 6.88 % 12/1/2028 796,452 794,928 791,203 Transdigm, Inc. Aerospace & Defense Term Loan H Loan 3M USD SOFR+ 3.25 % 0.00 % 7.83 % 2/21/2027 1,993,370 1,990,666 1,989,941 TRITON WATER HOLDINGS, INC. Beverage, Food & Tobacco Term Loan (03/21) Loan 3M USD LIBOR+ 3.50 % 0.50 % 8.23 % 3/31/2028 1,477,502 1,471,933 1,372,422 Tronox Finance LLC Chemicals, Plastics, & Rubber Term Loan Loan 1M USD LIBOR+ 2.25 % 0.00 % 6.88 % 3/10/2028 346,923 346,338 340,907 TruGreen Limited Partnership Services: Consumer Term Loan Loan 1M USD LIBOR+ 4.00 % 0.75 % 8.63 % 10/29/2027 954,501 949,189 873,368 Uber Technologies, Inc. Transportation: Consumer Term Loan B (2/21) Loan 3M USD LIBOR+ 3.50 % 0.00 % 8.45 % 2/25/2027 3,906,277 3,874,854 3,913,620 Ultra Clean Holdings, Inc. High Tech Industries Incremental Term Loan 3/21 Loan 1M USD LIBOR+ 3.75 % 0.00 % 8.38 % 8/27/2025 820,338 817,776 819,928 Unimin Corporation Metals & Mining Term Loan (12/20) Loan 3M USD LIBOR+ 4.00 % 1.00 % 8.78 % 7/31/2026 496,815 476,431 489,984 United Natural Foods, Inc Beverage, Food & Tobacco Term Loan B Loan 1M USD SOFR+ 3.25 % 0.00 % 7.98 % 10/22/2025 1,289,967 1,252,901 1,291,309 United Road Services Inc. Transportation: Cargo Term Loan (10/17) Loan 3M USD LIBOR+ 5.75 % 1.00 % 10.70 % 9/1/2024 889,180 886,242 465,335 Univision Communications Inc. Media: Broadcasting & Subscription Term Loan B (6/21) Loan 1M USD LIBOR+ 3.25 % 0.75 % 7.88 % 3/15/2026 2,446,648 2,441,783 2,426,610 Univision Communications Inc. Media: Broadcasting & Subscription Term Loan B (6/22) Loan 3M USD SOFR+ 4.25 % 0.50 % 8.83 % 6/25/2029 248,750 241,881 248,233 Utz Quality Foods, LLC Beverage, Food & Tobacco Term Loan B Loan 1M USD SOFR+ 3.00 % 0.00 % 7.73 % 1/20/2028 1,828,465 1,827,288 1,825,046 Vaco Holdings, LLC Services: Business Term Loan (01/22) Loan 3M USD SOFR+ 5.00 % 0.75 % 9.73 % 1/19/2029 2,342,210 2,275,198 2,310,989 Issuer Name Industry Asset Name Asset
Type Reference Rate/Spread SOFR/
LIBOR Floor Current
Rate (All In) Maturity
Date Principal/
Number of Shares Cost Fair Value Vericast Corp. Media: Advertising, Printing & Publishing Term Loan Loan 3M USD SOFR+ 7.75 % 1.00 % 12.33 % 6/15/2026 1,201,006 1,199,817 939,787 Verifone Systems, Inc. Banking, Finance, Insurance & Real Estate Term Loan (7/18) Loan 3M USD LIBOR+ 4.00 % 0.00 % 8.96 % 8/20/2025 1,368,031 1,364,137 1,269,875 Vertex Aerospace Services Corp Aerospace & Defense Term Loan (10/21) Loan 1M USD LIBOR+ 3.50 % 0.75 % 8.13 % 12/6/2028 992,500 988,789 987,895 VFH Parent LLC Banking, Finance, Insurance & Real Estate Term Loan (01/22) Loan 1M USD SOFR+ 3.00 % 0.50 % 7.66 % 1/12/2029 3,069,879 3,063,097 3,036,111 Viasat Inc Telecommunications Term Loan (2/22) Loan 1M USD SOFR+ 4.50 % 0.50 % 9.23 % 3/2/2029 1,994,987 1,948,951 1,967,137 Virtus Investment Partners, Inc. Banking, Finance, Insurance & Real Estate Term Loan B (9/21) Loan 1M USD LIBOR+ 2.25 % 0.00 % 6.85 % 9/28/2028 2,853,409 2,845,646 2,834,377 Vistra Energy Corp Utilities: Electric 2018 Incremental Term Loan Loan 1M USD LIBOR+ 1.75 % 0.00 % 6.38 % 12/31/2025 897,014 896,802 895,023 Vizient, Inc Healthcare & Pharmaceuticals Term Loan 4/22 Loan 1M USD SOFR+ 2.25 % 0.50 % 6.91 % 5/16/2029 497,500 492,868 496,525 VM Consolidated, Inc. Construction & Building Term Loan B (3/21) Loan 1M USD LIBOR+ 3.25 % 0.00 % 7.88 % 3/24/2028 2,185,087 2,183,095 2,180,170 Vouvray US Finance LLC High Tech Industries Term Loan Loan 1M USD SOFR+ 6.00 % 1.00 % 10.62 % 9/9/2025 471,250 471,250 442,386 Walker & Dunlop, Inc. Banking, Finance, Insurance & Real Estate Term Loan B (12/22) Loan 1M USD SOFR+ 3.00 % 0.50 % 7.72 % 12/15/2028 500,000 490,249 496,250 Warner Music Group Corp. (WMG Acquisition Corp.) Hotel, Gaming & Leisure Term Loan Incremental (11/22) Loan 1M USD SOFR+ 3.00 % 0.50 % 7.62 % 1/19/2028 500,000 490,562 498,960 Warner Music Group Corp. (WMG Acquisition Corp.) Hotel, Gaming & Leisure Term Loan G Loan 1M USD LIBOR+ 2.13 % 0.00 % 6.76 % 1/20/2028 1,250,000 1,249,851 1,243,750 Watlow Electric Manufacturing Company High Tech Industries Term Loan B Loan 3M USD SOFR+ 3.75 % 0.50 % 8.69 % 3/2/2028 2,456,250 2,447,468 2,417,368 West Corporation Telecommunications Term Loan B-3 Loan 3M USD SOFR+ 4.00 % 1.00 % 8.93 % 4/9/2027 1,189,119 1,172,865 1,044,939 WEX Inc. Services: Business Term Loan B (3/21) Loan 1M USD LIBOR+ 2.25 % 0.00 % 6.88 % 3/31/2028 2,954,924 2,946,492 2,944,582 WildBrain Ltd. Media: Diversified & Production Term Loan Loan 1M USD SOFR+ 4.25 % 0.75 % 8.98 % 3/27/2028 1,965,000 1,935,307 1,864,903 Xperi Corporation High Tech Industries Term Loan Loan 1M USD LIBOR+ 3.50 % 0.00 % 8.13 % 6/8/2028 2,427,446 2,420,580 2,388,752 Zayo Group, LLC Telecommunications Term Loan 4/22 Loan 1M USD SOFR+ 4.25 % 0.50 % 8.87 % 3/9/2027 992,500 971,029 842,027 ZEBRA BUYER (Allspring) LLC Banking, Finance, Insurance & Real Estate Term Loan 4/21 Loan 3M USD LIBOR+ 3.00 % 0.50 % 7.75 % 11/1/2028 880,444 876,985 874,941 Zekelman Industries, Inc. Metals & Mining Term Loan (01/20) Loan 3M USD LIBOR+ 2.00 % 0.00 % 6.73 % 1/25/2027 961,471 961,471 948,251 Zest Acquisition Corp. Healthcare & Pharmaceuticals Term Loan (1/23) Loan 1M USD SOFR+ 5.50 % 0.00 % 10.07 % 1/31/2028 2,000,000 1,901,512 1,928,340 Zodiac Pool Solutions Consumer goods: Durable Term Loan (1/22) Loan 1M USD SOFR+ 2.00 % 0.50 % 6.72 % 1/29/2029 495,000 494,015 490,192 TOTAL INVESTMENTS $ 645,599,001 $ 605,954,468 Number of Shares Cost Fair Value Cash and cash equivalents U.S. Bank Money Market (c) 23,776,950 $ 23,776,950 $ 23,776,950 Total cash and cash equivalents 23,776,950 $ 23,776,950 $ 23,776,950 (a) All or a portion of this investment has an unfunded commitment as of February 28, 20212023.(b) As of February 28, 2021,2023, the investment was in default and on non-accrual status.(c) Included within cash and cash equivalents in Saratoga CLO’s Statements of Assets and Liabilities as of February 28, 2021.2023.(d) Investments include Payment-in-Kind Interest. LIBOR—LIBOR - London Interbank Offered Rate1W1M USD LIBOR—LIBOR - The 1 week1-month USD LIBOR rate as of February 28, 20212023 was 0.09%4.67%.1M3M USD LIBOR—LIBOR - The 1 month3-month USD LIBOR rate as of February 28, 20212023 was 0.12%4.97%.2M6M USD LIBOR—LIBOR - The 2 month6-month USD LIBOR rate as of February 28, 20212023 was 0.15%5.26%.3M USD LIBOR—1M SOFR - The 3 month USD LIBOR1-month SOFR rate as of February 28, 20212023 was 0.19%4.66%.6M USD LIBOR—3M SOFR - The 6 month USD LIBOR3-month SOFR rate as of February 28, 20212023 was 0.20%4.89%.12M USD LIBOR6M SOFR - The 12 month USD LIBOR6-month SOFR rate as of February 28, 20212023 was 0.28%5.15%.3M PL WIBOR - The 3 month PL WIBOR rate as of February 28, 2021, was 0.21%20212023 was 3.25%7.75%.andor “Saratoga CLO”), an exempted company with limited liability incorporated under the laws of the Cayman Islands was formed on November 28, 2007 and commenced operations on January 22, 2008. The Issuer was established to acquire or participate in U.S. dollar-denominated corporate debt obligations. The “Company” refers to Saratoga Investment Corp.there under.thereunder.the Issuer completed the secondin a refinancing andtransaction, the Issuer issued $282.4 million of notes (the “2013-1 Amended CLO Notes”), consisting of Class A-1 Floating Rate Senior Notes, Class A-2 Floating Rate Senior Notes, Class B Floating Rate Senior Notes, Class C Deferrable Floating Rate Notes, Class D Deferrable Floating Rate Notes, Class E Deferrable Floating Rate Notes, and Class F Deferrable Floating Rate Notes. The 2013-1 Amended CLO Notes were issued pursuant to the Indenture with the same Trustee. Proceeds of the issuance of the 2013-1 Amended CLO Notes were used, along with existing assets held by the Trustee, to redeem all of the 2013-1 CLO Notes issued in 2013.Company completedIssuer issued $722.0 million of notes consisting of Class A-1-R-3 Senior Secured Floating Rate Notes (“Class A-1-R-3 Notes”), Class A-2-R-3 Senior Secured Floating Rate Notes (“Class A-2-R-3 Notes”), Class B-FL-R-3 Senior Secured Floating Rate Notes (“Class B-FL-R-3 Notes”), Class B-FXD-R-3 Senior Secured Fixed Rate Notes (“Class B-FXD-R-3 Notes”), Class C-FL-R-3 Deferrable Mezzanine Floating Rate Notes (“Class C-FL-R-3 Notes”), Class C-FXD-R-3 Deferrable Mezzanine Fixed Rate Notes (“Class C-FXD-R-3 Notes”), Class D-R-3 Deferrable Mezzanine Floating Rate Notes (“Class D-R-3 Notes”), Class E-R-3 Deferrable Mezzanine Floating Rate Notes (Class E-R-3 Notes”), Class F-R-3 Deferrable Junior Floating Rate Notes (Class F-R-3 Notes”), and Subordinated Notes. The Class D-R-3 Notes, Class E-R-c Notes and Subordinated Notes were issued at a discount, which is being amortized over the fourth refinancingterm of the Saratoga CLO. This refinancing, among other things, extended the Saratoga CLO reinvestment period to April 2024, and extended its legal maturity to April 2033. A non-call period ending February 2022 was also added. In addition, and as partnotes. Proceeds net of the refinancing, the Saratoga CLO has also been upsized from $500 million inissue discounts were used along with existing trust assets to approximately $650 million. As part of this refinancing and upsizing, the Company invested an additional $14.0 million inredeem all of the newly issued subordinated notesrated note classes of the Saratoga2013-1 Reset CLO and purchased $17.9 million in aggregate principal amount of the Class F-R-3 Notes tranche at par. Concurrently, the existing $2.5Notes. $69.5 million of Class F-R-2Subordinated Notes $7.5 million of Class G-R-2issued in connection with the 2008 CLO Notes, 2013-1 CLO Notes, 2013-1 Amended CLO Notes and $25.0 million2013-1 CLO 2013-1 Warehouse 2 LoanReset Notes were repaid. The Company also paid $2.6 million of transaction costs related to the refinancingnot redeemed and upsizing on behalf of the Saratoga CLO, to be reimbursed from future equity distributions. At February 28, 2022, the outstanding receivable of $2.6 million was repaid in full.remained outstanding.NoteNotes at par as a non cash transaction. On August 11, 2021, the Company sold its Class F-1-R-3 Notes to third parties, resulting in a realized loss of $0.1 million.remains 100.0%is both managed by and a wholly owned and managed bysubsidiary of Saratoga Investment Corp.“Financial Services—Investment Companies.” There has been no change to the Issuer’s status as an investment company during the year ended February 28, 2022.29, 2024.highly liquidhighly-liquid financial instruments with original maturities of three months or less. Cash and cash equivalents may include investments in money market mutual funds, which are carried at fair value. At February 28, 202229, 2024 and February 28, 2021,2023, cash and cash equivalents amounted to $6.2$12.1 million and $114.1$23.8 million, respectively, and are swept on an overnight basis into a U.S. Bank money market deposit account held at the Trustee.The Issuer stops accruing interest on its investments when it is determined that interest is no longer collectible. Discounts and premiums on investments purchased are accreted/amortized over the life of the respective investment using the effective yield method. The amortized cost of investments represents the original cost adjusted for the accretion of discounts and amortizations of premium on investments.AccruedThe Issuer stops accruing interest on its investments when it is determined that interest is generallyno longer collectible, with all outstanding accrued interest reserved when a loan is placed on non-accrual status.immediately. Interest payments received on non-accrual loans may be recognized as a reduction in principal depending upon the Investment Manager’s judgment regarding collectability. Non-accrual loans are restored to accrual status when past due principal and interest isare paid and, in management’s judgment, are likely to remain current, although we may make exceptions to this general rule if the loan has sufficient collateral value and is in the process of collection. The Issuer elected not to measure an allowance for credit losses for accrued interest receivables. At February 29, 2024 and February 28, 2023 we had two and three investments that were on non-accrual status, which we established a reserve of $0.6 million and $0.2 million, respectively, against interest receivable related to portfolio companies that were on non-accrual status and will be written off in a timely manner.February 28, 2021 and February 29, 2020 we recorded $0.6 million, $0.3 million, $0.2 million and $0.4$0.6 in PIK interest. respectively, are structuring fees of the investment bank, rating agency and legal fees, and other various closing costs associated with the issuance of the 2013-1 Reset CLO Notes on December 14, 2018. Such costs have been capitalized and amortized using an effective yield method, as appropriate, over the life of the related notes.Unamortized deferred debt financing costs of $1.6 million incurred in connection with the issuance of the 2013- 1 Reset CLO Notes, were expensed when the 2013-1 Reset CLO Notes were extinguished on February 26, 2021 and included in Realized loss on extinguishment of debt.period.Period. The Subordinated Management Fee is payable in arrears quarterly (subject to availability of funds and to the Priority of Payments) and prior to the second refinancing and the issuance of the 2013-1 Amended CLO Notes, was payable in an amount equal to 0.25% per annum of the fee basis amount at the beginning of the Collection Period. Subsequent to the second refinancing and the issuance of the 2013-1 Amended CLO Notes, the Base Management Fee was changed to be payable in an amount equal to 0.10% per annum of the fee basis amount at the beginning of the Collection period,Period, and the Subordinated Management Fees was changed to be payable in an amount equal to 0.40% per annum of the fee basis amount at the beginning of the Collection period.Period. This remained unchanged during the third refinancing and the issuance of the 2013-1 Reset CLO Notes, as well as the fourth refinancing and issuance of the 2013-1 2021 Reset CLO Notes.incentive management feeIncentive Management Fee target return of 12.0%, in accordance with the Priority of Payments after making the prior distributions on the relevant payment date. The investment managerInvestment Manager is no longer eligible to receive the incentive feeIncentive Management Fee following the third refinancing of the CLO on December 14, 2018.28, 2022,29, 2024, February 28, 20212023 and February 29, 2020,28, 2022, the Issuer paid $0.3 million, $0.2$0.3 million and $0.2$0.3 million, respectively, for trustee services provided and is included on the statements of operations.February 28, 2021 and February 29, 2020, $5.2$6.9 million, $7.9$4.9 million and $4.6$5.2 million of payments to the Subordinated Notes were included in interest and debt financing expenses on the statements of operations, respectively. For the years ended February 28, 202229, 2024 and February 28, 20212023 and February 29, 2020,28, 2022, $4.4 million, $3.2$4.4 million and $2.8$4.4 million, respectively, in discount amortization related to the Subordinated Notes is also included in interest and debt financing expenses on the Issuer’s statementstatements of operations.operations and statements of cash flows.ASU 2020-04, Reference Rate Reform (Topic 848): Facilitation of the Effects of Reference Rate Reform on Financial Reporting(“ (“ASU 2020-04”) to provide optional guidance to ease the potential burden in accounting for (or recognizing the effects of) reference rate reform on financial reporting. ASU 2020-04 established Topic 848 to provide relief during the temporary transition period and includes a sunset provision based on expectations of when the London Interbank Offered Rate (“LIBOR”) would cease being published. In December 2022, the FASB issued ASU No. 2022-06, Reference Rate Reform (Topic 848): Deferral of the Sunset Date of Topic 848, which deferred the sunset day of this guidance to December 31, 2024. With the adoption of ASU 2022-06, there was no significant impact to our consolidated financial position.2020-04 provide optional expedients and exceptions for applying GAAP to contracts, hedging relationships, and other transactions affected by reference rate reform if certain criteria are met. The standard2023-09 is effective for years beginning after December 15, 2024. Early adoption is permitted, however the Company has not elected to adopt this provision as of March 12, 2020 through December 31, 2022. Managementthe date of the financial statements contained in this report. The Company is still assessing the impact of the new guidance. However, it does not believe this optional guidance hasexpect ASU 2023-09 to have a material impact on the Company’s consolidated financial statements and disclosures.the notes thereto.● Level 1— Valuations based on quoted prices in active markets for identical assets or liabilities that the Issuer has the ability to access. ● Level 2— Pricing inputs are other than quoted prices in active markets, which are either directly or indirectly observable as of the reporting date. Such inputs may be quoted prices for similar assets or liabilities, quoted markets that are not active, or other inputs that are observable or can be corroborated by observable market data for substantially the full character of the financial instrument, or inputs that are derived principally from, or corroborated by, observable market information. Investments which are generally included in this category include illiquid debt securities and less liquid, privately held or restricted equity securities, for which some level of recent trading activity has been observed. ● Level 3— Pricing inputs are unobservable for the investment and includesinclude situations where there is little, if any, market activity for the investment. The inputs may be based on the Company’s own assumptions about how market participants would price the asset or liability or may use Level 2 inputs, as adjusted, to reflect specific investment attributes relative to a broader market assumption. These inputs into the determination of fair value may require significant management judgment or estimation. Even if observable market data for comparable performance or valuation measures (earnings multiples, discount rates, other financial/valuation ratios, etc.) are available, such investments are grouped as Level 3 if any significant data point that is not also market observable (private company earnings, cash flows, etc.) is used in the valuation methodology. Fair Value Measurements Level 1 Level 2 Level 3 Total Term loans $ - $ 544,194,304 $ 62,336,885 $ 606,531,189 Equity interests - 44,587 975,998 1,020,585 Total $ - $ 544,238,891 $ 63,312,883 $ 607,551,774 2022,2023, according to the fair value hierarchy: Fair Value Measurements Level 1 Level 2 Level 3 Total Term loans $ - $ 569,454,995 $ 69,474,664 $ 638,929,659 Equity interests - 33,691 - 33,691 Total $ - $ 569,488,686 $ 69,474,664 $ 638,963,350 Fair Value Measurements Level 1 Level 2 Level 3 Total Term loans $ - $ 541,492,510 $ 64,461,958 $ 605,954,468 Total $ - $ 541,492,510 $ 64,461,958 $ 605,954,468 The following table presents fair value measurements of investments, by major class, as of February 28, 2021, according to the fair value hierarchy: Fair Value Measurements Level 1 Level 2 Level 3 Total Term loans $ - $ 519,375,121 $ 72,143,745 $ 591,518,866 Equity interests - 501,175 - 501,175 Total $ - $ 519,876,296 $ 72,143,745 $ 592,020,041 First Lien Term Loan Equity Interests Total Balance as of February 28, 2023 $ 64,461,958 $ - $ 64,461,958 Payment-in-kind and other adjustments to cost - - - Net accretion of discount on investments 76,065 - 76,065 Net change in unrealized appreciation (depreciation) on investments 851,630 (673,988 ) 177,642 Purchases 16,586,078 1,649,986 18,236,064 Sales and repayments (8,762,524 ) - (8,762,524 ) Net realized loss from investments (361,041 ) - (361,041 ) Transfers in (1) 29,342,250 - 29,342,250 Transfers out (2) (39,857,531 ) - (39,857,531 ) Balance as of February 29, 2024 $ 62,336,885 $ 975,998 $ 63,312,883 Net change in unrealized depreciation for the year relating to those Level 3 assets that were still held by the Issuer at the end of the year $ (145,844 ) $ (673,988 ) $ (819,832 ) (1) The Issuer’s investment in Level 3 investments were classified as such during the year ended February 29, 2024, as market quotes for these investments are only provided by one trading desk. (2) The Issuer’s investment in Level 2 investments were classified as such during the year ended February 29, 2024, as the number of observable market quotes for these investments increased. 2022:2023: Term Loans Equity Interests Total Balance as of February 28, 2021 $ 72,143,745 $ - $ 72,143,745 Payment-in-kind and other adjustments to cost 588 - 588 Net accretion of discount on investments 89,461 - 89,461 Net change in unrealized appreciation (depreciation) on investments (439,530 ) - (439,530 ) Purchases 36,918,645 - 36,918,645 Sales and repayments (25,101,621 ) - (25,101,621 ) Net realized gain (loss) from investments 55,350 - 55,350 Transfers in (1) 13,167,311 - 13,167,311 Transfers out (2) (27,359,285 ) - (27,359,285 ) Balance as of February 28, 2022 $ 69,474,664 $ - $ 69,474,664 Net change in unrealized appreciation (depreciation) for the year relating to those Level 3 assets that were still held by the Issuer at the end of the year $ (283,685 ) $ - $ (283,685 ) Term Loans Equity Interests Total Balance as of February 28, 2022 $ 69,474,664 $ - $ 69,474,664 Payment-in-kind and other adjustments to cost - - - Net accretion of discount on investments 97,816 - 97,816 Net change in unrealized depreciation on investments (633,895 ) - (633,895 ) Purchases 15,870,770 - 15,870,770 Sales and repayments (9,192,436 ) - (9,192,436 ) Net realized loss from investments (38,093 ) - (38,093 ) Transfers in (1) 19,263,898 - 19,263,898 Transfers out (2) (30,380,766 ) - (30,380,766 ) Balance as of February 28, 2023 $ 64,461,958 $ - $ 64,461,958 Net change in unrealized depreciation for the year relating to those Level 3 assets that were still held by the Issuer at the end of the year $ (975,369 ) $ - $ (975,369 ) (1) The Issuer’s investment in Level 3 investments were classified as such during the year ended February 28, 2022,2023, as market quotes for these investments are only provided by one trading desk.(2) The Issuer’s investment in Level 2 investments were classified as such during the year ended February 28, 2022,2023, as the number of observable market quotes for these investments increased.The following table provides a reconciliation of the beginning and ending balances for investments that use Level 3 inputs for the year ended February 28, 2021: Term Loans Equity Interests Total Balance as of February 29, 2020 $ 114,304,162 $ - $ 114,304,162 Payment-in-kind and other adjustments to cost 4,609,079 - 4,609,079 Net accretion of discount on investments 83,123 - 83,123 Net change in unrealized appreciation (depreciation) on investments 3,482,259 - 3,482,259 Purchases 35,373,200 - 35,373,200 Sales and repayments (24,187,208 ) - (24,187,208 ) Net realized gain (loss) from investments (758,117 ) - (758,117 ) Transfers in (1) 8,246,171 - 8,246,171 Transfers out (2) (69,008,924 ) - (69,008,924 ) Balance as of February 28, 2021 $ 72,143,745 $ - $ 72,143,745 Net change in unrealized appreciation (depreciation) for the year relating to those Level 3 assets that were still held by the Issuer at the end of the year $ 285,753 $ - $ 285,753 (1)The Issuer’s investment in Level 3 investments were classified as such during the year ended February 28, 2021, as market quotes for these investments are only provided by one trading desk.(2) The Issuer’s investment in Level 2 investments were classified as such during the year ended February 28, 2021, as the number of observable market quotes for these investments increased. Fair Value Valuation Technique Unobservable Inputs Range
(Weighted Average)*Term loans $ 62,336,885 Market Comparables Third-Party Bid 67.50 - 101.25 (96.49) Equity interests 975,998 Market Comparables Third-Party Bid 9.75% - 19.24% (15.78%) Total $ 63,312,883 20222023 were as follows: Fair Value Valuation Technique Unobservable Inputs Range (Weighted Average)* Term loans $ 69,474,663 Market Comparables Third-Party Bid 95.00% - 99.75% (97.37%) Total $ 69,474,663 Fair Value Valuation Technique Unobservable Inputs Range
(Weighted Average)* Term loans $ 64,461,958 Market Comparables Third-Party Bid 82.00 - 100.00 (96.68) Total $ 64,461,958 The valuation techniques and significant unobservable inputs used in recurring Level 3 fair value measurements of assets as of February 28, 2021 were as follows: Fair Value Valuation Technique Unobservable Inputs Range Weighted Average* Term loans $ 72,143,745 Market Comparables Third-Party Bid 71.00% - 106.00% (88.5%) Total $ 72,143,745 * Weighted average represents the arithmetic average of the inputs and is not weighted by the relative fair value or notional amount. $69.5m$69.5 million of Subordinated Notes issued in connection with the 2008 CLO Notes, 2013-1 CLO Notes, 2013-1 Amended CLO Notes and 2013-1 CLO Reset Notes were not redeemed and remained outstanding. On August 9, 2021, the Company exchanged its existing $17.9 million Class F-R-3 Notes for $8.5 million Class F-1-R-3 Notes and $9.4 million Class F-2-R-3 Notes at par.F-R-3F-1-R-3 Notes, Class F-2-R-3 Notes, and tenth the Subordinated Notes, with (a) each class of securities (other than the Subordinated Notes) in such list being senior to each other class of securities that follows such class of securities in such list and (b) each class of securities in such list being subordinate to each other class of securities that precedes such class of securities in such list. The Subordinated Notes are subordinated to the 2013-1 2021 Reset CLO Notes and are entitled to periodic payments from interest proceeds available in accordance with the Priority of Payments.Description Interest Rate Maturity Principal Amount Amount
Outstanding Weighted Average
Interest Rate Saratoga Investment Corp. CLO 2013-1, Ltd. Notes: Class A-1-R-3 Senior Secured Floating Rate Notes 3M SOFR + 1.32% April 20, 2033 $ 357,500,000 $ 357,500,000 6.82 % Class A-2-R-3 Senior Secured Floating Rate Notes 3M SOFR + 1.65% April 20, 2033 65,000,000 65,000,000 7.05 % Class B-FL-R-3 Senior Secured Floating Rate Notes 3M SOFR + 1.80% April 20, 2033 60,500,000 60,500,000 7.19 % Class B-FXD-R-3 Senior Secured Fixed Rate Notes 2.54% April 20, 2033 11,000,000 11,000,000 2.60 % Class C-FL-R-3 Deferrable Mezzanine Floating Rate Notes 3M SOFR + 2.40% April 20, 2033 26,000,000 26,000,000 7.78 % Class C-FXD-R-3 Deferrable Mezzanine Fixed Rate Notes 3.31% April 20, 2033 6,500,000 6,500,000 3.39 % Class D-R-3 Deferrable Mezzanine Floating Rate Notes 3M SOFR + 4.00% April 20, 2033 39,000,000 39,000,000 9.34 % Class E-R-3 Deferrable Mezzanine Floating Rate Notes 3M SOFR + 7.50% April 20, 2033 27,625,000 27,625,000 12.75 % Class F-1-R-3 Notes Deferrable Junior Floating Rate Notes 3M SOFR + 10.00% April 20, 2033 8,500,000 8,500,000 15.19 % Class F-2-R-3 Notes Deferrable Junior Floating Rate Notes 3M SOFR + 10.00% April 20, 2033 9,375,000 9,375,000 15.19 % Subordinated Notes N/A April 20, 2033 111,000,000 111,000,000 N/A $ 722,000,000 $ 722,000,000 2022.2023.Description Interest Rate Maturity Principal
Amount Amount
Outstanding Weighted
Average
Interest
Rate Saratoga Investment Corp. CLO 2013-1, Ltd. Notes: Class A-1-R-3 Senior Secured Floating Rate Notes LIBOR + 1.32% April 20, 2033 $ 357,500,000 $ 357,500,000 1.61 % Class A-2-R-3 Senior Secured Floating Rate Notes LIBOR + 1.65% April 20, 2033 65,000,000 65,000,000 1.95 % Class B-FL-R-3 Senior Secured Floating Rate Notes LIBOR + 1.80% April 20, 2033 60,500,000 60,500,000 2.11 % Class B-FXD-R-3 Senior Secured Fixed Rate Notes 2.54 % April 20, 2033 11,000,000 11,000,000 2.67 % Class C-FL-R-3 Deferrable Mezzanine Floating Rate Notes LIBOR + 2.40% April 20, 2033 26,000,000 26,000,000 2.72 % Class C-FXD-R-3 Deferrable Mezzanine Fixed Rate Notes 3.31 % April 20, 2033 6,500,000 6,500,000 3.48 % Class D-R-3 Deferrable Mezzanine Floating Rate Notes LIBOR + 4.00% April 20, 2033 39,000,000 39,000,000 4.36 % Class E-R-3 Deferrable Mezzanine Floating Rate Notes LIBOR + 7.50% April 20, 2033 27,625,000 27,625,000 7.95 % Class F-1-R-3 Notes Deferrable Junior Floating Rate Notes LIBOR + 10.00% April 20, 2033 8,500,000 8,500,000 10.52 % Class F-2-R-3 Notes Deferrable Junior Floating Rate Notes LIBOR + 10.00% April 20, 2033 9,375,000 9,375,000 10.52 % Subordinated Notes N/A April 20, 2033 111,000,000 111,000,000 N/A $ 722,000,000 $ 722,000,000 The table below sets forth certain information for each outstanding class of notes issued, pursuant to the loan agreements and Indenture on February 26, 2021 at February 28, 2021.Description Interest Rate Maturity Principal
Amount Amount
Outstanding Weighted
Average
Interest
Rate Saratoga Investment Corp. CLO 2013-1, Ltd. Notes: Class A-1-R-3 Senior Secured Floating Rate Notes LIBOR + 1.32% April 20, 2033 $ 357,500,000 $ 357,500,000 2.27 % Class A-2-R-3 Senior Secured Floating Rate Notes LIBOR + 1.65% April 20, 2033 65,000,000 65,000,000 2.77 % Class B-FL-R-3 Senior Secured Floating Rate Notes LIBOR + 1.80% April 20, 2033 60,500,000 60,500,000 2.99 % Class B-FXD-R-3 Senior Secured Fixed Rate Notes 2.54 % April 20, 2033 11,000,000 11,000,000 2.54 % Class C-FL-R-3 Deferrable Mezzanine Floating Rate Notes LIBOR + 2.40% April 20, 2033 26,000,000 26,000,000 3.98 % Class C-FXD-R-3 Deferrable Mezzanine Fixed Rate Notes 3.31 % April 20, 2033 6,500,000 6,500,000 6.13 % Class D-R-3 Deferrable Mezzanine Floating Rate Notes LIBOR + 4.00% April 20, 2033 39,000,000 39,000,000 6.29 % Class E-R-3 Deferrable Mezzanine Floating Rate Notes LIBOR + 7.50% April 20, 2033 27,625,000 27,625,000 11.54 % Class F-R-3 Notes Deferrable Junior Floating Rate Notes LIBOR + 10.00% April 20, 2033 17,875,000 17,875,000 15.29 % Subordinated Notes N/A April 20, 2033 111,000,000 111,000,000 N/A $ 722,000,000 $ 722,000,000 Description Interest Rate Maturity Principal Amount Amount
Outstanding Weighted Average
Interest Rate Saratoga Investment Corp. CLO 2013-1, Ltd. Notes: Class A-1-R-3 Senior Secured Floating Rate Notes LIBOR + 1.32% April 20, 2033 $ 357,500,000 $ 357,500,000 1.61 % Class A-2-R-3 Senior Secured Floating Rate Notes LIBOR + 1.65% April 20, 2033 65,000,000 65,000,000 1.95 % Class B-FL-R-3 Senior Secured Floating Rate Notes LIBOR + 1.80% April 20, 2033 60,500,000 60,500,000 2.11 % Class B-FXD-R-3 Senior Secured Fixed Rate Notes 2.54% April 20, 2033 11,000,000 11,000,000 2.67 % Class C-FL-R-3 Deferrable Mezzanine Floating Rate Notes LIBOR + 2.40% April 20, 2033 26,000,000 26,000,000 2.72 % Class C-FXD-R-3 Deferrable Mezzanine Fixed Rate Notes 3.31% April 20, 2033 6,500,000 6,500,000 3.48 % Class D-R-3 Deferrable Mezzanine Floating Rate Notes LIBOR + 4.00% April 20, 2033 39,000,000 39,000,000 4.36 % Class E-R-3 Deferrable Mezzanine Floating Rate Notes LIBOR + 7.50% April 20, 2033 27,625,000 27,625,000 7.95 % Class F-1-R-3 Notes Deferrable Junior Floating Rate Notes LIBOR + 10.00% April 20, 2033 8,500,000 8,500,000 10.52 % Class F-2-R-3 Notes Deferrable Junior Floating Rate Notes LIBOR + 10.00% April 20, 2033 9,375,000 9,375,000 10.52 % Subordinated Notes N/A April 20, 2033 111,000,000 111,000,000 N/A $ 722,000,000 $ 722,000,000 28, 2022:29, 2024(a):Debt Security February 28,
2022 Saratoga Investment Corp. CLO 2013-1, Ltd. Notes: Class A-1-R-3 Senior Secured Floating Rate Notes $ 358,553,279 Class A-2-R-3 Senior Secured Floating Rate Notes 65,271,765 Class B-FL-R-3 Senior Secured Floating Rate Notes 60,768,540 Class B-FXD-R-3 Senior Secured Fixed Rate Notes 11,011,752 Class C-FL-R-3 Deferrable Mezzanine Floating Rate Notes 26,143,672 Class C-FXD-R-3 Deferrable Mezzanine Fixed Rate Notes 6,511,247 Class D-R-3 Deferrable Mezzanine Floating Rate Notes 39,344,655 Class E-R-3 Deferrable Mezzanine Floating Rate Notes 28,118,353 Class F-2-R-3 Notes Deferrable Junior Floating Rate Notes 9,375,000 F-1-R-3 Notes Deferrable Junior Floating Rate Notes 8,711,167 Subordinated Notes 28,654,905 $ 642,464,335 Debt Security February 29,
2024 Saratoga Investment Corp. CLO 2013-1, Ltd. Notes: Class A-1-R-3 Senior Secured Floating Rate Notes $ 359,983,909 Class A-2-R-3 Senior Secured Floating Rate Notes 65,676,594 Class B-FL-R-3 Senior Secured Floating Rate Notes 61,141,020 Class B-FXD-R-3 Senior Secured Fixed Rate Notes 11,006,154 Class C-FL-R-3 Deferrable Mezzanine Floating Rate Notes 26,295,629 Class C-FXD-R-3 Deferrable Mezzanine Fixed Rate Notes 6,505,936 Class D-R-3 Deferrable Mezzanine Floating Rate Notes 39,532,812 Class E-R-3 Deferrable Mezzanine Floating Rate Notes 28,169,374 Class F-1-R-3 Notes Deferrable Junior Floating Rate Notes 8,564,667 Class F-2-R-3 Notes Deferrable Junior Floating Rate Notes 8,875,227 Subordinated Notes 9,500,627 $ 625,251,949 (a) These notes are fair valued based on a discounted cash flow model, specifically using Intex cash flow models, to form the basis for the valuation and would be classified as Level 3 liabilities within the fair value hierarchy. 2021:2023(a):Debt Security February 28,
2021 Saratoga Investment Corp. CLO 2013-1, Ltd. Notes: Class A-1-R-3 Senior Secured Floating Rate Notes $ 358,224,218 Class A-2-R-3 Senior Secured Floating Rate Notes 65,207,720 Class B-FL-R-3 Senior Secured Floating Rate Notes 60,708,949 Class B-FXD-R-3 Senior Secured Fixed Rate Notes 11,013,911 Class C-FL-R-3 Deferrable Mezzanine Floating Rate Notes 26,118,502 Class C-FXD-R-3 Deferrable Mezzanine Fixed Rate Notes 6,513,328 Class D-R-3 Deferrable Mezzanine Floating Rate Notes 39,312,843 Class E-R-3 Deferrable Mezzanine Floating Rate Notes 28,116,015 Class F-R-3 Notes Deferrable Junior Floating Rate Notes 18,329,025 Subordinated Notes 31,449,732 $ 644,994,243 Debt Security February 28,
2023 Saratoga Investment Corp. CLO 2013-1, Ltd. Notes: Class A-1-R-3 Senior Secured Floating Rate Notes $ 359,565,649 Class A-2-R-3 Senior Secured Floating Rate Notes 65,537,373 Class B-FL-R-3 Senior Secured Floating Rate Notes 61,017,654 Class B-FXD-R-3 Senior Secured Fixed Rate Notes 11,009,371 Class C-FL-R-3 Deferrable Mezzanine Floating Rate Notes 26,253,490 Class C-FXD-R-3 Deferrable Mezzanine Fixed Rate Notes 6,508,929 Class D-R-3 Deferrable Mezzanine Floating Rate Notes 39,515,127 Class E-R-3 Deferrable Mezzanine Floating Rate Notes 28,232,871 Class F-1-R-3 Notes Deferrable Junior Floating Rate Notes 8,749,793 Class F-2-R-3 Notes Deferrable Junior Floating Rate Notes 8,831,406 Subordinated Notes 21,176,578 $ 636,398,241 These notes are fair valued based on a discounted cash flow model, specifically using Intex cash flow models, to form the basis for the valuation and would be classified as Level 3 liabilities within the fair value hierarchy.(a) These notes are fair valued based on a discounted cash flow model, specifically using Intex cash flow models, to form the basis for the valuation and would be classified as Level 3 liabilities within the fair value hierarchy. 28, 2022,29, 2024, the remaining unamortized discount on Class A-1-R-3 Notes, Class A-2-R- 3 Notes, Class B-FL-R-3 Notes, Class B-FXD-R-3 Notes, Class C-FL-R-3 Notes, Class C-FXD-R-3 Notes, Class D-R-3 Notes, Class E-R-3 Notes, Class F-1-R-3 Notes and F-2-R-3 were $0.0 million, $0.0 million, $0.0 million, $0.0 million, $0.0 million, $0.0 million, $0.3$0.2 million, $2.1$2.3 million, $0.0 million and $0.0 million, respectively.2021,2023, the remaining unamortized discount on Class A-1-R-3 Notes, Class A-2-R- 3 Notes, Class B-FL-R-3 Notes, Class B-FXD-R-3 Notes, Class C-FL-R-3 Notes, Class C-FXD-R-3 Notes, Class D-R-3 Notes, Class E-R-3 Notes, Class F-1-R-3 Notes and Class F-R-3 NotesF-2-R-3 were $0.0 million, $0.0 million, $0.0 million, $0.0 million, $0.0 million, $0.0 million, $0.3$0.2 million, $3.0$2.5 million, $0.0 million and $0.0 million, respectively.For the year ended February 28, 2021, costs associated with the 2013-1 CLO Notes of $1.8 million in remaining unamortized deferred debt financing costs and $1.3 million in unamortized discount, were recognized as additional amortization expense when the related notes were extinguished and recorded within realized loss on extinguishment of debt in the statement of operations.2022,2023, remaining capitalized financing costs of $2.1$1.7 million and $1.9 million, respectively, related to the 2013-1 2021 Reset CLO Notes are being amortized over the term of the 2013-1 2021 Reset CLO Notes.On February 11, 2020, CLO 2013-1 Warehouse 2, a wholly-owned subsidiary of Saratoga CLO entered into a loan payable with a third party, pursuant to which CLO 2013-1 Warehouse 2 may borrow from time to time up to $80 million in order to provide capital necessary to support warehouse activities. The loan payable, which expires on August 11, 2021, bears interest at an annual rate of 3M USD LIBOR + 1.25% through November 11, 2020 and 3M USD LIBOR + 1.75% thereafter. For the year ended February 28, 2021, the Saratoga CLO recognized interest expense of $0.2 million related to the loan payable, with a loan payable balance of $0.0 million as February 28, 2021.(2018—2021)(2019—2022). The Issuer identifies its major tax jurisdictions as U.S. Federal, state and foreign jurisdictions where the Issuer makes investments. As of February 28, 202229, 2024 and February 28, 2021,2023, there was no impact to the financial statements as a result of the Issuer’s accounting for uncertainty in income taxes. The Issuer does not have any unrecognized tax benefits or liabilities for the years ended February 28, 2022,29, 2024, February 28, 20212023 and February 29, 2020.28, 2022. Also, the Issuer recognizes interest and, if applicable, penalties for any uncertain tax positions, as a component of income tax expense. No interest or penalty expense was recorded by the Issuer for the years ended February 28, 2022,29, 2024, February 28, 20212023 and February 29, 2020.28, 2022.28, 202229, 2024 and February 28, 2021,2023, the Issuer is not subject to any material legal proceedings. Therefore, the Issuer has not accrued any liabilities in connection with such indemnifications.28, 202229, 2024 and February 28, 2021,2023, the Issuer had $2.1$0.0 million and $4.3$1.9 million of unfunded commitments outstanding, respectively.At February 28, 2022, the global outbreak of the coronavirus pandemic has continued to adversely affect some of the Issuer’s portfolio companies, the Issuer’s business, financial condition, results of operations and cash flows and continues to have adverse consequences on the U.S. and global economies. The ultimate economic fallout from the pandemic, and the long-term impact on economies, markets, industries and individual portfolio companies, remains uncertain. At the time of this filing, there is no indication of a reportable subsequent event impacting the Issuer’s financial statements for the year ended February 28, 2022. The Issuer cannot predict the extent to which its financial condition and results of operations will be adversely affected at this time. The potential impact to its results will depend to a large extent on future developments and new information that may emerge regarding the duration and severity of COVID-19. The Issuer continues to observe and respond to the evolving COVID-19 environment and its potential impact on areas across its business.7. Related Party Transactions7. Related-Party Transactions2021, February 29, 20202023 and February 28, 2019,2022, the Issuer neither bought nor sold investments from related parties.On February 11, 2020, CLO 2013-1 Warehouse 2, a wholly-owned subsidiary of Saratoga CLO entered into CLO 2013-1 Warehouse 2 Loan with the Company, pursuant to which CLO 2013- 1 Warehouse 2 may borrow from time to time up to $25.0 million from the Company in order to provide capital necessary to support warehouse activities. The CLO 2013-1 Warehouse 2 Loan, which expires on August 20, 2021, bears interest at an annual rate of 3M USD LIBOR + 7.5%. As of February 28, 2021, the CLO 2013-1 Warehouse 2 Loan was and interest payable repaid in full, with interest expense of $0.7 million and $0.01 million recognized and included in the interest and debt financing expenses in the Issuer’s statement of operations for the years ended February 28, 2021 and February 29, 2020, respectively.wholly-ownedwholly owned by the Investment Manager. The Subordinated Notes do not have a stated coupon rate but are entitled to residual cash flows from the CLO’s investments after all of the other tranches of debt and certain other fees and expenses are paid. For the years ended February 29, 2024, February 28, 2023 and February 28, 2022, February 28, 2021 and February 29, 2020, $5.2$6.9 million, $7.9$4.9 million and $4.6$5.2 million of payments to the Subordinated Notes were included in interest and debt financing expenses in the statements of operations, respectively. For the years ended February 29, 2024, February 28, 2023 and February 28, 2022, February 28, 2021 and February 29, 2020, $4.4 million, $3.2$4.4 million and $2.4$4.4 million, respectively, in discount amortization related to the Subordinated Notes is also included in interest and debt financing expenses on the Issuer’s statementstatements of operations.operations and statements of cash flows.In addition to refinancing its liabilities, theThe Investment Manager holds aggregate principal amounts of $9.4 million in Class F-2-R-3 Notes of the CLO tranches with a coupon of LIBOR plus 10.00% at February 28, 202229, 2024 and $17.9 million in Class F-R-3 Notes of the CLO tranches with a coupon of LIBOR plus 10.00% at February 28, 2021, respectively.2023. For the years ended February 28, 2022,29, 2024, February 28, 20212023 and February 29, 2020,28, 2022, payments for the Class F-R-3, Class F-R-2 Notes and Class G-R-2F-2-R-3 Notes totaling $0.0$1.5 million, $0.0$1.2 million and $1.2$0.5 million, respectively, are included in interest and debt financing expenses in the Issuer’s statementstatements of operations. Expenses relating to the refinancing were paid for by the Company on behalf of Saratoga CLO and isare included in due to affiliate on the statementstatements of assets and liabilities at February 28, 2021 and were subsequently repaid during fiscal year 2022.28, 202229, 2024 and February 28, 2021,2023, net assets (deficit) were $(37.2)$(71.5) million and $(28.5)$(70.6) million, respectively. These amounts include accumulated losses of $37.2$71.5 million and $28.5$70.6 million, respectively, which includesinclude cumulative net investment income or loss, cumulative amounts of gains and losses realized from investment transactions, net unrealized appreciation or depreciation of investments, as well as the cumulative effect of accounting mismatches between investments accounted for at fair value and amortized cost or accrual-basis assets and liabilities as discussed in Significant Accounting Policies, above. The Issuer’s investments continue to generate sufficient liquidity to satisfy its obligations on periodic payment dates as well as comply with all performance criteria as of the statements of assets and liabilities date.elected early adoption ofadopted Rule 3-04/Rule 8-03(a)(5) under Regulation S-X. Pursuant to the regulation, the Issuer has presented a reconciliation of the changes in each significant caption of stockholders’ equity for each of the three fiscal years ended February 28, 2022,29, 2024, February 28, 20212023 and February 29, 2020,28, 2022, as shown in the tables below: For the Year Ended February 28, 2022 Capital Total Common Stock in Excess Distributable Net Assets Shares Amount of Par Value Earnings (Loss) (Deficit) Balance at February 28, 2021 250 $ 250 $ - $ (28,538,114 ) $ (28,537,864 ) Increase (Decrease) from Operations: Net investment income (loss) 2,315,511 2,315,511 Net realized gain (loss) from investments (565,094 ) (565,094 ) Net change in unrealized appreciation (depreciation) on investments (481,097 ) (481,097 ) Balance at May 31, 2021 250 250 - (27,268,794 ) (27,268,544 ) Increase (Decrease) from Operations: Net investment income 1,397,282 1,397,282 Net realized gain (loss) from investments 175,669 175,669 Net change in unrealized appreciation (depreciation) on investments (662,095 ) (662,095 ) Balance at August 31, 2021 250 250 (26,357,938 ) (26,357,688 ) Increase (Decrease) from Operations: Net investment income (647,430 ) (647,430 ) Net realized gain (loss) from investments (662,289 ) (662,289 ) Net change in unrealized appreciation (depreciation) on investments (4,277,923 ) (4,277,923 ) Balance at November 30, 2021 250 250 (31,945,580 ) (31,945,330 ) Increase (Decrease) from Operations: Net investment income (loss) 168,313 168,313 Net realized gain (loss) from investments (12,099 ) (12,099 ) Net change in unrealized appreciation (depreciation) on investments (5,408,367 ) (5,408,367 ) Balance at February 28, 2022 250 250 (37,197,733 ) (37,197,483 ) For the Year Ended February 29, 2024 Total Capital
in Excess Distributable
Earnings Net Assets Common Stock of Par Value (Loss) (Deficit) Balance at February 28, 2023 250 $ 250 $ - $ (70,627,170 ) $ (70,626,920 ) Increase (Decrease) from Operations: Net investment income - - - 502,662 502,662 Net realized gain (loss) from investments - - - (2,108,567 ) (2,108,567 ) Net change in unrealized depreciation on investments - - - (10,337,238 ) (10,337,238 ) Balance at May 31, 2023 250 250 - (82,570,313 ) (82,570,063 ) Increase (Decrease) from Operations: Net investment income - - - 168,515 168,515 Net realized gain (loss) from investments - - - (641,267 ) (641,267 ) Net change in unrealized appreciation on investments - - - 13,352,743 13,352,743 Balance at August 31, 2023 250 250 - (69,690,322 ) (69,690,072 ) Increase (Decrease) from Operations: Net investment income - - - 359,637 359,637 Net realized gain (loss) from investments - - - (6,298,909 ) (6,298,909 ) Net change in unrealized depreciation on investments - - - (313,230 ) (313,230 ) Balance at November 30, 2023 250 250 - (75,942,824 ) (75,942,574 ) Increase (Decrease) from Operations: Net investment income - - - 498,467 498,467 Net realized gain (loss) from investments - - - (9,532,208 ) (9,532,208 ) Net change in unrealized appreciation on investments - - - 13,498,322 13,498,322 Balance at February 29, 2024 250 $ 250 - $ (71,478,243 ) $ (71,477,993 ) For the Year Ended February 28, 2021 Capital Total Common Stock in Excess Distributable Net Assets Shares Amount of Par Value Earnings (Loss) (Deficit) Balance at February 29, 2020 250 $ 250 $ - $ (35,102,419 ) $ (35,102,169 ) Increase (Decrease) from Operations: Net investment income (loss) - - - (758,157 ) (758,157 ) Net realized gain (loss) from investments - - - (1,803,884 ) (1,803,884 ) Net change in unrealized appreciation (depreciation) on investments - - - (31,575,429 ) (31,575,429 ) Balance at May 31, 2020 250 250 - (69,239,889 ) (69,239,639 ) Increase (Decrease) from Operations: Net investment income - - - 60,339 60,339 Net realized gain (loss) from investments - - - (4,338,586 ) (4,338,586 ) Net change in unrealized appreciation (depreciation) on investments - - - 26,457,779 26,457,779 Balance at August 31, 2020 250 250 - (47,060,357 ) (47,060,107 ) Increase (Decrease) from Operations: Net investment income - - - 221,123 221,123 Net realized gain (loss) from investments - - - (3,089,206 ) (3,089,206 ) Net change in unrealized appreciation (depreciation) on investments - - - 14,923,956 14,923,956 Balance at November 30, 2020 250 250 - (35,004,484 ) (35,004,234 ) Increase (Decrease) from Operations: Net investment income (loss) (823,187 ) (823,187 ) Net realized gain (loss) from investments (1,690,951 ) (1,690,951 ) Net change in unrealized appreciation (depreciation) on investments 11,969,271 11,969,271 Realized losses on extinguishment of debt (2,988,763 ) (2,988,763 ) Balance at February 28, 2021 250 250 - (28,538,114 ) (28,537,864 ) For the Year Ended February 29, 2020 Capital Total Common Stock in Excess Distributable Net Assets Shares Amount of Par Value Earnings (Loss) (Deficit) Balance at February 28, 2019 250 $ 250 $ - $ (17,899,919 ) $ (17,899,669 ) Increase (Decrease) from Operations: Net investment income (loss) - - - 1,125,944 1,125,944 Net realized gain (loss) from investments - - - (943,934 ) (943,934 ) Net change in unrealized appreciation (depreciation) on investments - - - �� (2,205,995 ) (2,205,995 ) Balance at May 31, 2019 250 250 - (19,923,904 ) (19,923,654 ) Increase (Decrease) from Operations: Net investment income (loss) - - - 775,988 775,988 Net realized gain (loss) from investments - - - (1,218,364 ) (1,218,364 ) Net change in unrealized appreciation (depreciation) on investments - - - (2,174,060 ) (2,174,060 ) Balance at August 31, 2019 250 250 - (22,540,340 ) (22,540,090 ) Increase (Decrease) from Operations: Net investment income (loss) - - - (712,398 ) (712,398 ) Net realized gain (loss) from investments - - - - - Net change in unrealized appreciation (depreciation) on investments - - - (7,516,752 ) (7,516,752 ) Balance at November 30, 2019 250 250 - (30,769,490 ) (30,769,240 ) Increase (Decrease) from Operations: Net investment income (loss) - - - 136,535 136,535 Net realized gain (loss) from investments - - - (2,632,887 ) (2,632,887 ) Net change in unrealized appreciation (depreciation) on investments - - - (1,836,577 ) (1,836,577 ) Balance at February 29, 2020 250 $ 250 $ - $ (35,102,419 ) $ (35,102,169 ) For the Year Ended February 28, 2023 Total Common Stock Capital
in Excess Distributable
Earnings Net Assets Shares Amount of Par Value (Loss) (Deficit) Balance at February 28, 2022 250 $ 250 $ - $ (37,197,733 ) $ (37,197,483 ) Increase (Decrease) from Operations: Net investment loss - - - (286,724 ) (286,724 ) Net realized gain (loss) from investments - - - 77,656 77,656 Net change in unrealized depreciation on investments - - - (24,681,988 ) (24,681,988 ) Balance at May 31, 2022 250 250 - (62,088,789 ) (62,088,539 ) Increase (Decrease) from Operations: Net investment loss - - - (507,279 ) (507,279 ) Net realized gain (loss) from investments - - - (1,144,858 ) (1,144,858 ) Net change in unrealized depreciation on investments - - - (1,544,463 ) (1,544,463 ) Balance at August 31, 2022 250 250 - (65,285,389 ) (65,285,139 ) Increase (Decrease) from Operations: Net investment income - - - 586,193 586,193 Net realized gain (loss) from investments - - - (532,640 ) (532,640 ) Net change in unrealized depreciation on investments - - - (10,640,311 ) (10,640,311 ) Balance at November 30, 2022 250 250 - (75,872,147 ) (75,871,897 ) Increase (Decrease) from Operations: Net investment income - - - 1,031,538 1,031,538 Net realized gain (loss) from investments - - - (7,086,473 ) (7,086,473 ) Net change in unrealized appreciation on investments - - - 11,299,912 11,299,912 Balance at February 28, 2023 250 $ 250 - $ (70,627,170 ) $ (70,626,920 ) For the Year Ended February 28, 2022 Total Common Stock Capital
in Excess Distributable
Earnings Net Assets Shares Amount of Par Value (Loss) (Deficit) Balance at February 28, 2021 250 $ 250 $ - $ (28,538,114 ) $ (28,537,864 ) Increase (Decrease) from Operations: Net investment income - - - 2,315,511 2,315,511 Net realized gain (loss) from investments - - - (565,094 ) (565,094 ) Net change in unrealized depreciation on investments - - - (481,097 ) (481,097 ) Balance at May 31, 2021 250 250 - (27,268,794 ) (27,268,544 ) Increase (Decrease) from Operations: Net investment income - - - 1,397,282 1,397,282 Net realized gain (loss) from investments - - - 175,669 175,669 Net change in unrealized depreciation on investments - - - (662,095 ) (662,095 ) Balance at August 31, 2021 250 250 - (26,357,938 ) (26,357,688 ) Increase (Decrease) from Operations: Net investment loss - - - (647,430 ) (647,430 ) Net realized gain (loss) from investments - - - (662,289 ) (662,289 ) Net change in unrealized depreciation on investments - - - (4,277,923 ) (4,277,923 ) Balance at November 30, 2021 250 250 - (31,945,580 ) (31,945,330 ) Increase (Decrease) from Operations: Net investment income - - - 168,313 168,313 Net realized gain (loss) from investments - - - (12,099 ) (12,099 ) Net change in unrealized depreciation on investments - - - (5,408,367 ) (5,408,367 ) Balance at February 28, 2022 250 $ 250 $ - $ (37,197,733 ) $ (37,197,483 ) 2020, February 28, 2019 and February 28, 2018:2020: February 29,
2024(4) February 28,
2023 February 28,
2022 February 28,
2021 February 29,
2020 Year-end subordinated notes’ capital balance(1) $ 3,356,769 $ 242,477 $ 28,742,295 $ 34,422,474 $ 11,498,257 Ratio and supplemental data: Total return(2) NM (94.53) % (9.75 % 150.86 % (46.85) % Net investment income (loss)(3) NM 8.77 % 9.38 % (17.12 )% 0.01 % Total expenses(3) NM 655.20 % 81.89 % 383.67 % 156.62 % Base management fee(3) NM 10.08 % 1.89 % 6.60 % 2.48 % Subordinated management fee(3) NM 40.30 % 7.57 % 26.42 % 9.93 % February 28,
2022 February 28,
2021 February 29,
2020 February 28,
2019 February 28,
2018 Average subordinated notes’ capital balance(1) $ 34,488,787 $ 7,593,452 $ 20,177,254 $ 18,900,592 $ 17,262,714 Ratio and supplemental data: Total return(2) (9.75 )% 150.86 % (46.85 )% (22.41 )% 0.33 % Net investment income (loss)(3) 9.38 % (17.12 )% 0.90 % 0.02 % 8.08 % Total expenses(3) 81.89 % 383.67 % 156.62 % 125.54 % 95.41 % Base management fee(3) 1.89 % 6.60 % 2.48 % 1.82 % 1.75 % Subordinated management fee(3) 7.57 % 26.42 % 9.93 % 7.29 % 6.99 % (1) Subordinated notes’ capital balance is calculated based on the sum of the subordinated notes outstanding amount and total net assets, net of ordinary equity. (2) Total return is calculated based on a time-weighted rate of return methodology. Quarterlymethodology, in which quarterly rates of return are compounded to derive the total return reflected above. Total return is calculated for the subordinated notes’ capital taken as a whole and assumes the purchase of the subordinated notes’ capital on the first day of the period and the sale of the last day of the period.(3) Calculated based on the average subordinated notes’ capital balance. (4) 28, 202229, 2024 through May 4, 2022,6, 2024, the date the financial statements were available for issuance. The Investment Manager has determined that there are no material events that would require the disclosure in the financial statements, other than the following:statements.S-52