Item 1A. Risk Factors.
You should consider and read carefully all of the risks and uncertainties described below, as well as the other information included in this Annual Report, on Form 10-K, including our consolidated financial statements and related notes. The risks described below have been organized under headings that are provided for convenience and intended to organize the risks and uncertainties into related categories to improve readability for investors; no inference should be drawn, however, that the placement of a risk factor under a particular category means that it is not applicable to another category of risks or that it may be more or less material than another risk factor. Regardless, they are also not the only onesrisks and uncertainties facing us. The occurrence of any of the following risks or additional risks and uncertainties not presently known to us or that we currently believe to be immaterial could materially and adversely affect our business, financial condition and results of operations. This Annual Report on Form 10-K also contains forward-looking statements and estimates that involve risks and uncertainties.uncertainties, as discussed above in this Part I under the caption “Disclosure Regarding Forward-Looking Statements”. Our actual results could differ materially from those anticipated in any forward-lookingforward‑looking statements as a result of specificmany factors, including the risksrisk factors and uncertainties described below.
Risks Related to Our BusinessIndustry
Third-party payors, including Medicaid, Medicare and private health insurance providers, provide substantial funding for our services. Other payors, including MCOs, are also dependent upon Medicaid funding. These payors are increasingly seeking to reduce the cost of healthcare, which drives pressure on the reimbursement rates for healthcare services, which include our services. We cannot assure you that our contracts will survive until the end of their stated terms, or that upon their expirationservices will be renewed or extended on satisfactory terms, if at all. Disruptions to, the early expiration of or the failure to renew our contracts could have a material adverse impact on our financial condition and results of operations.
material adverse effect on our ability to maintain current contractssell our services on a profitable basis, if at all. We cannot control reimbursement rates, including Medicare market basket or obtain new contracts. The termination of a contractother rate adjustments. Reimbursement for cause could, for instance, subject us to liabilities for excess costs incurred by a payer in obtaining similar services from another source. In addition, our contracts require us to indemnify payers for our failure to meet standards of care, and some of them contain liquidated damages provisions and financial penalties that we must pay ifprovide is primarily through Medicaid and MCOs and rates can vary state by state and payor by payor. Legislative efforts driving increases in minimum wage levels have been made and continue to be proposed to increase minimum wages in markets in which we breach these contracts.
Many government and commercial payors are transitioning providers to alternative payment models that are designed to promote cost-efficiency, quality and coordination of operationscare. For example, accountable care organizations, or financial condition. ACOs, seek to motivate hospitals, physician groups, and other providers to organize and coordinate patient care while reducing unnecessary costs. Several states have implemented, or have announced that they plan to implement, accountable care models for their Medicaid populations. If we are not included in these programs, or if ACOs establish programs that overlap with the services provided by us, we are at risk for losing market share and of experiencing a loss of business.
We continually review opportunitiesmay be similarly impacted by increased enrollment of Medicare and Medicaid beneficiaries in managed care plans, shifting away from traditional fee-for-service models. Under the Medicare managed care program, also known as Medicare Advantage or MA, the federal government contracts with private health insurers to acquire other businesses that would complement our currentprovide Medicare benefits. Insurers may choose to offer supplemental benefits and impose higher plan costs on beneficiaries. Enrollment in managed Medicaid plans is also growing, as states are increasingly relying on MCOs to deliver Medicaid program services expand our markets or otherwise offer prospectsas a strategy to control costs and manage resources. We may experience increased competition for growth. In connectionmanaged care contracts due to state regulation and limitations. For instance, in October 2018, New York began imposing limits on the number of home healthcare providers with our acquisition strategy, we could issue stock that would dilute existing stockholders’ percentage ownership, or we could incur or assume substantial debt or contingent liabilities. Acquisitions involve numerous risks, including, but not limited to, the following:
a managed Medicaid plan can contract. We cannot assure you that we will be successful in overcoming problems encountered in connection with any acquisition or integration and our inability to do so could disrupt our operations and adversely affect our business. Our failure to address these risks or other problems encountered in connection with past or future acquisitions and investments could cause us to fail
26
In addition, operational processes may not be well defined as a state transitions beneficiaries to managed care. For example, membership, new employeesreferrals and the related authorization for services to be provided may be delayed, which may result in delays in service delivery to customers or retainin payment for services rendered. Difficulties with operational processes may negatively affect our revenue growth rates, cash flow and profitability for services provided. Other alternative payment models, such as value-based billing, capitated rates and per member per month pricing may be required by the government, MCOs and other commercial payors to control their costs while shifting financial risk to us, which could also materially affect our operations and financial condition.
We are limited in our ability to control reimbursement rates received for our services, and if we are not able to maintain or reduce our costs to provide such services, our business could be materially adversely affected.
Medicare and Medicaid are among our most significant payors, and their rates are established through federal and state statutes and regulations. Additionally, reimbursement rates with MCOs and other payors are difficult for us to negotiate as such payors are themselves limited in their ability to control rates and funding received from Medicaid and Medicare and are under pressure to reduce their own costs. We therefore manage our costs to achieve a desired level of profitability, including centralizing various back office processes, using technology to streamline processes and practicing efficient management of our senior management or any other key employees in the future. In particular,workforce. If we are currently seeking to fill several key management positions in our NET Services business, and we expectnot able to continue to needstreamline our processes and reduce our costs, our business and consolidated financial condition, results of operations and cash flows could be materially adversely affected.
Future cost containment initiatives undertaken by private third-party payors, especially if we are unable to attract key employeesmaintain or reduce our cost of services below rates set forth by payors, may limit our future revenue and profitability and cause us to supportexperience reduced or negative margins and our results of operations could be materially adversely affected.
Our commercial payor and managed Medicaid revenue and profitability are affected by continuing efforts of third-party payors to maintain or reduce costs of healthcare by lowering payment rates, narrowing the growthscope and utilization of covered services, increasing case management review of services and negotiating pricing. There can be no assurance that third-party payors will make timely payments for our businesses. Someservices, and there is no assurance that we will continue to maintain our current payor or revenue mix. We will continue our efforts to develop our commercial payor and managed Medicaid sources of the companies with which we compete for experienced personnel may have greater financial, technical, politicalrevenue and marketing resources, name recognition and a larger number of clients and payers than we do, which may prove more attractive to employment candidates. The inability to attract and retain experienced personnelany changes in payment levels from current or future third-party payors could have a material adverse effect on our business.
We may be adversely impactedaffected by inadequacies in, or security breaches of, our information technology systems.systems, including the systems intended to protect our clients’ privacy and confidential information, which could lead to legal liability, adversely affect our reputation and have a material adverse effect on our business, financial condition and results of operations.
Our information technology, or IT, systems are critically important to our operations and we must implement and maintain appropriate and sufficient infrastructure and IT systems to support growth and our existing business processes. We provide services to individuals including servicesand others that require us to collect, process, maintain and retain sensitive and personal client confidential information in our computer systems, including patient identifiable health information, relating to their health, social security numbersfinancial information and other identifyingpersonal information about our customers and end-users, such as names, addresses, phone numbers, email addresses, identification numbers, sensitive health data, and payment account information. As a result, we are subject to complex and evolving United States privacy laws and regulations, including those pertaining to the handling of personal data, such as HIPAA, CCPA, and others. Most states have enacted laws, which vary significantly from jurisdiction to jurisdiction, to safeguard the privacy and security of personal information. An increasing number of states require that impacted individuals and regulatory authorities be notified if a security breach results in the unauthorized access to, or use or disclosure of, personal information. Notifications are also required under HIPAA to the extent there is unauthorized access to, or use or disclosure of, personal health information. California residents and households in particular are afforded significantly expanded privacy protections under the CCPA. The enacted laws often provide for civil penalties for violations, as well as a private right of action for data breaches that may increase data breach litigation. Further, while we are using internal and external resources to monitor compliance with and to continue to modify our data processing practices and policies in order to comply with evolving privacy laws, relevant regulatory authorities could determine that our data handling practices fail to address all the requirements of certain new laws, which could subject us to penalties and/or litigation. In addition, there is no assurance that our security controls over personal data, the training of employees and vendors on data privacy and data security, and the policies, procedures and practices we implemented or may implement in the future will prevent the improper disclosure of personal data. Therefore,Improper disclosure of personal data in violation of the CCPA and/or of other personal data protection laws could harm our information technology systems store client information protected by numerous federal, statereputation, cause loss of consumer confidence, subject us to government enforcement actions (including fines), or result in private litigation against us, which could result in loss of revenue, increased costs, liability for monetary damages, fines and/or
27
criminal prosecution, all of which could adversely affect our business, consolidated results of operations, financial condition and foreign regulations. cash flows.
We also rely on our information technologyIT systems (some of which are outsourced to third parties) to manage the data, communications and business processes for all other business functions, including our marketing, sales, logistics, customer service, accounting and administrative functions. Further,Furthermore, our systems include interfaces to third-party stakeholders, often connected via the Internet.internet. In addition, certainsome of our services or information related to our services are carried out or hosted within our customers’ IT systems, and any failure or weaknesses in their IT systems may negatively impact our ability to deliver the services, for which we may not receive relief from contractual performance obligations or compensation for services provided. In addition, security incidents impacting other companies, such as our vendors, may allow cybercriminals to obtain personal information about our customers and employees. Cybercriminals may then use this information to, among other things, attempt to gain unauthorized access to our customers’ accounts, which could have a material adverse effect on our reputation, business and results of operations or financial condition. As a result of the data we maintain and third-party access, we are subject to increasing cybersecurity risks.risks associated with malicious cyber-attacks intended to gain access to protected personal information. The nature of our business, where services are often performed outside a secured location,of locations where network security can be assured, adds additional risk.
If we do not allocate and effectively manage the resources necessary to build, sustain and protect an appropriate technology infrastructure, our business or financial results could be negatively impacted.
Furthermore, computer hackers and data thieves are increasingly sophisticated and operate large scale and complex automated attacks, and our information technology systems may be vulnerable to material security breaches (including the access to or acquisition of customer, employee or other confidential data), cyber-based attackscyber-attacks or other material system failures.failures arising out of malware or ransomware attacks, denial of services, or other attacks or security incidents, any of which could adversely impact our operations and financial results, our relationships with business partners and customers, and our reputation. Because the techniques used to obtain unauthorized access or sabotage systems change frequently and may be difficult to detect for long periods of time, we may be unable to implement adequate preventative measures sufficient to prevent a breach of our systems and protect sensitive data.data, including confidential personal information. Any breach of our data security could result in an unauthorized release or transfer of customer or employee information, or the loss of valuable business data or cause a disruption in our business. A failure to prevent, detect and respond in a timely manner to a major breach of our data security or to other cybersecurity threats could result in system disruption, business continuity issues or compromised data integrity. These events or any other failure to safeguard personal data could give rise to unwanted media attention, damage our reputation, damage our customer relationships and result in lost sales, fines or lawsuits. We may also be required to expend significant capital and other resources to protect against or respond to or alleviate problems caused by a security breach. If we are unable to prevent material failures, our operations may be impacted, and we may suffer other negative consequences such as reputational damage, litigation, remediation costs, a requirement not to operate our business until defects are remedied, or penalties under various data privacy laws and regulations, any of which could detrimentally affect our business, financial condition and results of operations.
The majority of our end-users are older individuals with complex medical challenges or multiple ongoing diseases or chronic illnesses, many of whom may be more vulnerable than the general public during a pandemic or in a public health emergency. Our employees are also at greater risk of contracting contagious diseases due to their increased exposure to vulnerable end-users. Our employees could also have difficulty attending to our end-users if a program of social distancing or quarantine is instituted in response to a public health emergency, or if “stay at home” orders are perpetuated or reinitiated. In addition, we may expand existing internal policies in a manner that may have a similar effect. If the COVID-19 virus and its potentially more contagious variants cause an additional resurgence of infections of COVID-19, or if new variants continue to develop that are resistant to government approved COVID-19 vaccinations, or if an influenza or other pandemic were to occur, we could suffer significant losses to our consumer population or a willingness by our end-users to utilize our services, in particular in our PCS segment, or a reduction in the availability of our employees and, at an inflated cost, we could be required to hire replacements for affected workers. Accordingly, public health emergencies could have a disproportionate material adverse effect on our financial condition and results of operations.
28
Risks Related to Our Business and Operations
We derive a significant amount of our revenues from a limited number of payors, and any changes in the funding, financial viability or our relationships with these payors could have a material adverse impact on our financial condition and results of operations.
We generate a significant amount of our revenue from a limited number of payors under a relatively small number of contracts. For example, for the year ended December 31, 2023, approximately 30.9% of our NEMT segment revenue was derived from only five payors, and one of which, a single state Medicaid agency, contributed 11.2% to our aggregate NEMT segment revenue during that period. As it relates to our other segments, for the year ended December 31, 2023, approximately 11.3% of our PCS segment revenue was derived from one U.S. state Medicaid program, and approximately 18.5% of our RPM segment revenue was derived from one health plan. The loss of, reduction in amounts generated by, or changes in methods or regulations governing payments for our services under these contracts could have a material adverse impact on our revenue and results of operations. In addition, any consolidation of any of our private payors could increase the impact that any such risks would have on our revenue, financial position, and results of operations.
Delays in collection, or non-collection, of our accounts receivable, particularly during any business integration process, could adversely affect our reputationbusiness, financial position, results of operations and liquidity.
Prompt billing and collection are important factors in our liquidity. Billing and collection of our accounts receivable are subject to the complex regulations that govern Medicare and Medicaid reimbursement and rules imposed by nongovernment payors. Our inability to bill and collect on a timely basis pursuant to these regulations and rules could subject us to payment delays that could have a material adverse effect on our business, financial condition andposition, results of operations.operations and liquidity. It is possible that documentation support, system problems, Medicare, Medicaid or other payor issues, particularly in markets transitioning to managed care for the first time, or industry trends may extend our collection period, which may materially adversely affect our working capital, and our working capital management procedures may not successfully mitigate this risk.
Further, a delay in collecting our accounts receivable, or the non-collection of accounts receivable in connection with our transition and integration of acquired companies and the attendant movement of underlying billing and collection operations from legacy systems to our systems thatcould have a material negative impact on our results in the disclosure of personally identifiable customeroperations and liquidity.
Our reported financial results could suffer if there is an impairment of goodwill or employee information or inadvertent disclosure of any clients’ personal information could damage our reputation, deter people from using our services, expose us to litigation, increase regulatory scrutiny and require us to incur significant technical, legal and other expenses. In addition, data breaches impacting other companies, such as our vendors, may allow cybercriminals to obtain personally identifiable information about our customers. Cybercriminals may then use this information to, among other things, attempt to gain unauthorized access to our customers’ accounts,long-lived assets, which could have a material adverse effect on our reputation, business, results of operations orand financial condition.
We are required under accounting principles generally accepted in the United States, or GAAP, to review the carrying value of long-lived assets to be used in operations whenever events or changes in circumstances indicate that the carrying amount of the assets may be impaired. Factors that may necessitate an impairment assessment include, among others, significant adverse changes in the extent or manner in which an asset is used, significant adverse changes in legal factors or the business climate that could affect the value of an asset or significant declines in the observable market value of an asset. Where the presence or occurrence of those events indicates that an asset may be impaired, we assess its recoverability by determining whether the carrying value of the asset exceeds the sum of the projected undiscounted cash flows expected to result from the use and eventual disposition of the asset over the remaining economic life of the asset. If such testing indicates the carrying value of the asset is not recoverable, we estimate the fair value of the asset using appropriate valuation methodologies, which would typically include an estimate of discounted cash flows. If the fair value of those assets is less than carrying value, we record an impairment loss equal to the excess of the carrying value over the estimated fair value. The use of different estimates or assumptions in determining the fair value of our intangible assets may result in different values for those assets, which could result in an impairment or, in the period in which an impairment is recognized, could result in a materially different impairment charge.
29
In addition, goodwill may be impaired if the estimated fair value of our reporting units is less than the carrying value of the respective reporting unit. As a result of our growth, in part through acquisitions, goodwill and other intangible assets represent a significant portion of our assets. From our largest acquisitions, goodwill generated in relation to the acquisition of Simplura in 2020 was $320.4 million, goodwill generated in relation to the acquisition of Care Finders in 2021 was $232.1 million, goodwill generated in relation to the acquisition of VRI in 2021 was $236.3 million, and goodwill generated in relation to the acquisition of GMM in 2022 was $44.3 million. We perform an analysis on our goodwill balances to test for impairment on an annual basis. Interim impairment tests may also be required in advance of our annual impairment test if events occur or circumstances change that would more likely than not reduce the fair value, including goodwill, of our reporting unit below the reporting unit’s carrying value. Such circumstances could include: (1) loss of significant contracts; (2) a significant adverse change in legal factors or in the climate of our business; (3) unanticipated competition; (4) an adverse action or assessment by a regulator; or (5) a significant decline in our stock price.
During our July 1 annual assessment of goodwill, we determined that based on our qualitative assessment for each reporting unit, factors existed which required us to test our goodwill for impairment. These factors included a decline in the market price of the Company's common stock, industry specific regulatory pressures such as Medicaid redetermination and the Centers for Medicare and Medicaid Services ("CMS") proposed ruling on Ensuring Access to Medicaid Services, and general economic and market volatility. As a result of our quantitative assessment, we determined that the goodwill at our PCS and RPM reporting units was impaired. As a result, we recorded an impairment of goodwill charge of $183.1 million in the second quarter of 2023, of which $137.3 million was recorded at our PCS segment and $45.8 million was recorded at our RPM segment.
As of December 31, 2023, the carrying value of goodwill, intangibles, equity method investments, and property and equipment, net was $785.6 million, $360.9 million, $41.5 million and $85.6 million, respectively. We continue to monitor the carrying value of these long-lived assets. If future conditions are different from management’s estimates at the time of an acquisition or market conditions change subsequently, we may incur future charges for impairment of our goodwill, intangible assets, equity method investments or property and equipment, which could have a material adverse impact on our results of operations and financial position.
Failure to maintain or to develop further reliable, efficient and secure information technologyIT systems would be disruptive to our operations and diminish our ability to compete and successfully grow our business successfully.business.
We are highly dependent on efficient and uninterrupted performance of our information technologyIT and business systems. These systems quote, process and service our business, and perform financial functions necessary for pricing and service delivery. These systems must also be able to undergo periodic modifications and improvements without interruptions or untimely delays in service. Additionally, our ability to integrate our systems with those of our clients is critical to our success. Our information systems rely on the commitment of significant financial and managerial resources to maintain and enhance existing systems as well as develop and create new systems to keep pace with continuing changes in information processing technology or evolving industry and regulatory requirements. However,Nevertheless, we still rely on manual processes and procedures, including accounting, reporting and consolidation processes that may result in errors and may not scale proportionately with our business growth.growth, which could have an adverse effect on our business, financial condition and results of operations.
A failure or delay to achieve improvements in our information technologyIT platforms could interrupt certain processes or degrade business operations and could place us at a competitive disadvantage. If we are unable to implement appropriate systems, procedures and controls, we may not be able to successfully offer our services and grow our business and account for transactions in an appropriate and timely manner, which could have an adverse effect on our business, financial condition and results of operations.
Our business success depends, to the risks of a global market could hindersignificant degree, on our ability to maintainidentify, attract, develop, motivate and expand international operations.retain highly qualified and experienced employees who possess the skills and experience necessary to deliver high-quality services to our clients, with the continued contributions of our senior management being especially critical to our success. Our objective of providing the highest quality of service to our clients is a significant consideration when we evaluate the education, experience and qualifications of potential candidates for employment as direct care and administrative staff. A portion of our staff is made up of professionals with requisite educational backgrounds and professional certifications. These employees are in great demand and are likely to remain a limited resource for the foreseeable future, exacerbated by continued labor shortages in the current economy.
30
Our ability to attract and retain employees with the requisite experience and skills depends on several factors, including our ability to offer competitive wages, benefits and professional growth opportunities. While we have operation centersestablished programs to attract new employees and provide incentives to retain existing employees, particularly our senior management, we cannot assure you that we will be able to attract new employees or retain the services of our senior management or any other key employees in Australia, Canada, France, Germany, Saudi Arabia, Singapore, South Korea, Switzerland, the UKfuture. Some of the companies with which we compete for experienced personnel may have greater financial, technical, political and the U.S.marketing resources, name recognition and a noncontrolling interest inlarger number of clients and payors than we do, which may prove more attractive to employment candidates. The inability to attract and retain experienced personnel could have a joint venture in Spain. In implementingmaterial adverse effect on our international strategy,business.
The performance of our business also depends on the talents and efforts of our highly skilled IT professionals. Our success depends on our ability to recruit, retain and motivate these individuals. Effective succession planning is also important to our future success. If we may face barriersfail to entryensure the effective transfer of senior management knowledge and competition from local companiessmooth transitions involving senior management, our ability to execute short and other companies that already have established global businesses,long-term strategic, financial and operating goals, as well as our business, financial condition and results of operations generally, could be materially adversely affected.
Any acquisition or acquisition integration efforts that we undertake could disrupt our business, not generate anticipated results, dilute stockholder value and have a material adverse impact on our operating results.
Our growth strategy involves the risks generally associatedevaluation of potential entry into complementary markets and service lines through acquisition, particularly with conductingopportunities that may leverage the advantages inherent in our large-scale technology-enabled operations and networks. We have made acquisitions and anticipate that we will continue to consider and pursue strategic acquisition opportunities, the success of which depends in part on our ability to integrate an acquired company into our business internationally.operations. Integration of any acquired company will place significant demands on our management, systems, internal controls and financial and physical resources. This could require us to incur significant expense for, among other things, hiring additional qualified personnel, retaining professionals to assist in developing the appropriate control systems and expanding our IT infrastructure. The successnature of our business is such that qualified management personnel can be difficult to find. Our inability to manage growth effectively could have a material adverse effect on our financial results.
For example, the successful integration of Care Finders into our PCS segment and profitabilitythe remote patient monitoring business acquired in the VRI transaction and expanded with the GMM acquisition and our ability to realize the expected benefits of international operationsthe acquisition are subject to numerousa number of risks and uncertainties, many of which are outside of our control, such as:including:
•the difficulties harmonizing differences in the business cultures;
•the inability to successfully combine our respective businesses in a manner that permits us to achieve the cost savings and other anticipated benefits from the acquisitions;
•the challenges associated with known and unknown legal or financial liabilities associated with the acquisitions;
•the risk of entering markets in which we have little or no experience;
•the challenges associated with the incurrence of indebtedness and the assumption of new contracts associated with the acquisitions;
•the inability to minimize the diversion of management attention from ongoing business concerns during the process of integrating our businesses;
•the inability to resolve potential conflicts that may arise relating to customer, supplier and other important relationships;
•the difficulties in retaining key management and other key employees; and
•the challenge of managing the expanded operations of a larger and more complex company and coordinating geographically separate organizations.
We incurred substantial expenses to complete the acquisitions, but we may not realize the anticipated cost benefits and other benefits to the U.S.
There can also be no assurance that the companies we acquire, will generate income or incur expenses at the historical or projected levels on which we based our acquisition decisions, that we will be able to maintain or renew the acquired companies’ contracts, that we will be able to realize operating and economic efficiencies upon integration of acquired companies or that the acquisitions will not adversely affect our results of operations or financial condition.
31
In addition, as we expand our markets or otherwise take advantage of prospects for growth, in connection with our acquisition strategy, we could issue stock that could dilute existing stockholders’ percentage ownership, or we could incur or assume substantial debt or contingent liabilities. There can be no assurance that we will be successful in overcoming problems encountered in connection with any acquisition or integration and our inability to do so could disrupt our operations and adversely affect our business. Our failure to address these risks or other problems encountered in connection with past or future acquisitions and investments could cause us to fail to realize the anticipated benefits of such acquisitions or investments, incur unanticipated liabilities and harm our business generally.
Weakening of general economic, political, credit and/or capital market conditions in the markets in which we do business could adversely affect our financial performance, our ability to grow or sustain our business, financial condition, and results of operations, and our ability to access capital markets.
The implications of the current macroeconomic environment, which is characterized by high inflation rates, high interest rates, supply chain challenges, labor shortages, volatility in capital markets and growing recession risk, have a materialhad and could continue to have an adverse effect on our business, results of operations, and financial condition. In April 2022, during the COVID-19 pandemic, inflation rates in the United States were the highest they had been since 1981.While post-pandemic inflation rates have decreased since April 2022, there can be no assurance that inflation rates will not increase in the future.Increased inflation rates could result in higher costs related to employee wages and other inputs to our services, including fuel costs, and could result in us incurring higher debt obligations than expected.If we incur higher costs than originally anticipated, including under our FFS contracts, and are unable to adjust the rates to reflect the changes in costs due to the structure of our contracts, our results of operations and financial condition. We have currency exposure arising from both salescondition may be adversely affected.
Further the growing recession risk and purchases denominatedongoing economic uncertainty may lead to increased credit risk, higher borrowing costs, or reduced availability of capital and credit markets, which could impact our access to financing in foreign currencies, including intercompany transactions outside the U.S.,credit and capital markets at reasonable rates in the event we currentlyfind it desirable to do not conduct hedging activities. The valueso. Higher interest rates and borrowing costs as well as increased costs of labor as a result of the U.S. dollar against other foreign currencies has seentight labor market, particularly in the healthcare industry, could create additional economic challenges. With the majority of our payors being governmental healthcare agencies who are also under significant volatility recently. operational and budgetary strain, these significantly increased labor and supply costs without a commensurate increase in revenue may lead to a continued deterioration of operating margins across our business.
Our financial condition and results of operations are reported in multiple currencies, and are then translated into U.S. dollars at the applicable exchange rate for inclusion in our consolidated financial statements. Appreciation of the U.S. dollar against these other currencies will have a negative impact on our reported net revenue and operatingestimated income while depreciation of the U.S. dollar against such currencies will have a positive effect on reported net revenue and operating income. We cannot predict with precision the effect of future exchange-rate fluctuations on our business and operating results, and significant rate fluctuationstaxes could be materially different from income taxes that we ultimately pay, which could have a material adverse effect on our results of operations and financial condition.
Our resultstotal income tax provision is based on our taxable income and the tax laws in the various jurisdictions in which we operate or operated. Significant judgment and estimation is required in determining our annual income tax expense and in evaluating our tax positions and related matters. In the ordinary course of our business, there are many transactions and calculations for which the ultimate tax determinations are uncertain or otherwise subject to interpretation. In addition, we make or were required to make judgments regarding the applicability of tax treaties and the appropriate application of transfer pricing regulations with respect to the operations will continueof our former workforce development services segment. In the event one taxing jurisdiction disagrees with another taxing jurisdiction with respect to fluctuate duethe amount or applicability of a particular type of tax, or the amount or availability of a particular type of tax refund or credit, we could experience temporary or permanent double taxation and increased professional fees to seasonality.resolve such taxation matters.
Our business, results of operations and financial condition may be adversely affected by pandemic infectious diseases, including the COVID-19 pandemic, including our contact center employees who may be disproportionately impacted by health epidemics or pandemics like COVID-19, which could disrupt our business and adversely affect our financial results.
The widespread outbreak of an illness or any other communicable disease, or any other public health crisis that results in economic disruptions such as the COVID-19 pandemic, could materially adversely affect our business and results of
32
operations. COVID-19 and its potentially more contagious variants specifically, as well as measures taken by governmental authorities and private actors to limit the spread of the virus, have interfered with, and may continue to interfere with, the ability of our employees, suppliers, transportation providers and other business providers to carry out their assigned tasks at ordinary levels of performance relative to the conduct of our business, which may cause us to materially curtail portions of our business operations. The ultimate impact of the COVID-19 pandemic on our business will depend on a number of evolving factors that we may not be able to predict, including:
•the duration and scope of the pandemic;
•governmental, business and individuals’ actions that have been and continue to be taken in response to the pandemic;
•the impact of the pandemic on economic activity and actions taken in response;
•the effect on our customers and members and customer and member demand for our services, in particular with respect to our PCS segment services;
•our ability to provide our services as a result of, among other things, travel restrictions, disruptions in our contact centers related to COVID-19, people working from homeand taking the opportunity to provide personal care services that we might otherwise provide through our PCS segment, and the willingness of our employees to return to work due to health concerns, childcare issues or enhanced unemployment benefits, including after “shelter in place” and other related “stay at home restrictions” are lifted or modified;
•issues with respect to our employees’ health, working hours and/or ability to perform their duties;
•increased costs to us in response to these changing conditions and to protect the health and safety of our employees, including increased spending for hazard pay and personal protective equipment; and
•the ability of our payors to pay for our services.
Furthermore, any failure to appropriately respond, or the perception of an inadequate response, could cause reputational harm and/or subject us to claims and litigation, either of which could result in a material adverse effect on our business and results of operations.
When the COVID-19 pandemic emerged in March 2020, we observed a material reduction in trip volume in our NEMT segment as a result of state imposed public health orders. On May 11, 2023, the Department of Health and Human Services ("HHS") declared the end of the public health emergency ("PHE") for the COVID-19 pandemic. During each year following the emergence of the pandemic, we have continued to experience increased utilization and are currently operating at a higher volume of trips in our NEMT segment than before the COVID-19 outbreak. While this increase in trip volume shows increased demand for our services, it also exposes the Company to cost containment risk as labor costs and trip costs are rising at a higher rate than reimbursement, which results in lower profit margins than previously. The increase in trip costs is driven, in part, by the current macroeconomic environment, inflationary pressures, rising interest rates, higher labor costs, and supply chain challenges which limit the NEMT segment's ability to provide services at a reasonable cost to achieve historic profit margins. These macroeconomic trends also put pressure on the availability of transportation providers. Any ongoing impact to our industry as a result of the increased demand despite the headwinds in the summer monthscurrent macroeconomic environment may have a negative financial impact on our transportation providers and may result in lower revenues as the Company adapts to this change in demand for transportation services. As volumes continue to increase, the availability of transportation providers in the winter months, coupled with a primarily fixed revenue stream based on a per-member, per-month payment structure, NET Services normally experiences lower operating margins during the summer season and higher operating margins during the winter season. WD Services typically does not experience seasonal fluctuations in operating results. However, volatility in revenue and earnings is common in the case of WD Servicesfuture may be limited due to the timingcapacity constraints within our network of commencementtransportation providers. Additionally, we may face staffing difficulties in our contact centers as the recruitment of potential employees may be challenging amid the current labor environment, which could negatively impact the customer and expirationmember experience while interfacing with our contact centers and materially adversely affect our reputation and results of certain major contracts as well as fluctuations in referrals provided by its customers.operations.
Our reportedPCS segment also experienced a material reduction in volume of service hours and visits as a result of the pandemic. While this reduction in service hours and visits has continued to improve each year following the pandemic, ongoing impacts of the pandemic including constraints on the labor market, specifically related to strain on healthcare professionals, has led to a shortage of caregivers which will continue to impact the volume of service hours that can be provided. Further, these labor constraints have driven increased wage rates, which limits the Company's ability to be profitable in contracts with set rates for various care services. Any depressed volumes as a result of the labor shortage and the strain on healthcare professionals could reduce the quality with which our caregivers provide services and could result in lower than expected revenue in the PCS segment. As volume continues to increase, we may face difficulty meeting the volume of demand due to staffing challenges in the healthcare industry. Any of these circumstances and factors could have a material adverse effect on our business.
Our RPM segment has not experienced a direct material impact to operations or financial activity as a result of the COVID-19 pandemic. While this segment of the business has proven resilient given the increase in demand for remote healthcare services in a highly contagious infection environment, potential risks could arise that could have a material impact on the financial results of the segment. Specifically, given the strain on the healthcare professionals that serve the healthcare
33
community, we could suffer if there is an impairmentexperience shortages in qualified medical professionals that support our remote care monitoring business. Further, as this segment relies on patients receiving health monitoring devices for use in-home, any impact to the supply chain that ensures these critical devices arrive for active and continued vitals monitoring and data analytic solutions could have a negative impact on our business. Any of long-lived assets.these factors could have a material adverse effect on our reputation and business.
Our contact centers typically seat a significant number of employees in one location. Accordingly, an outbreak or resurgence of a contagious infection or virus, such as COVID-19or its potentially more contagious and/or vaccine resistant variants, in one or more of our reporting units is less than the carrying value of the respective reporting unit. As alocations in which we do business may result in significant worker absenteeism, lower capacity utilization rates, voluntary or mandatory closure of our growth, in part through acquisitions, goodwillcontact centers, transportation restrictions that could make it difficult for our employees to commute to work, travel restrictions on our employees, and other intangible assets representdisruptions to our business. Any prolonged or widespread health epidemic could severely disrupt our business operations and have a significant portion of our assets. We perform an analysismaterial adverse effect on our goodwill balancesbusiness, financial condition and results of operations.
Risks Related to test for impairmentOur NEMT Segment
There can be no assurance that our contracts will survive as contemplated until the end of their stated terms, or that upon their expiration will be renewed or extended on an annual basis. Interim impairment tests may also be required in advance of our annual impairment testsatisfactory terms, if events occur or circumstances change that would more likely than not reduce the fair value, including goodwill, of one or more of our reporting units below the reporting unit’s carrying value. Such circumstances could include but are not limited to: (1) loss of significant contracts, (2) a significant adverse change in legal factors or in the climate of our business, (3) unanticipated competition, (4) an adverse action or assessment by a regulator or (5) a significant decline in our stock price. In the fourth quarter of 2016, we recorded asset impairment charges of $19.6 million related to WD Servicesat all, and an asset impairment of $1.4 million for Corporate and Other relateddisruptions to, the saleearly expiration or renegotiation of, a building, as discussed below in Item 7. “Management’s Discussion and Analysis of Financial Condition and Results of Operations - Critical Accounting Policies and Estimates”. As of December 31, 2017,or the carrying value of goodwill, intangibles and property and equipment, net is $121.7 million, $43.9 million and $50.4 million, respectively. In addition, property and equipment as of December 31, 2017 includes $13.4 million of construction and development in progress, primarily relatedfailure to NET Services’ LCAD NextGen technology system, as discussed above. We continue to monitor the carrying value of these long-lived assets. Any future impairment chargesrenew our contracts could have a material adverse impact on our financial condition and results of operations.
Our NEMT segment contracts are subject to frequent renewal and, from time to time, requests for renegotiation during a contract term. For example, many of our state Medicaid contracts, which represented approximately 37.1% of our NEMT segment revenue for the year ended December 31, 2023, have terms ranging from three to five years and are typically subject to a competitive procurement process near the end of the term. We also contract with MCOs, which represented approximately 62.9% of our NEMT segment revenue for the year ended December 31, 2023. Our MCO contracts for NEMT segment services typically continue until terminated by either party upon reasonable notice in accordance with the terms of the contract, and sometimes a contractual counterparty will seek to renegotiate the pricing and other terms of a contract to our detriment prior to the stated termination date of a contract. We cannot anticipate if, when or to what extent we will be successful in renewing our state Medicaid contracts or retaining our MCO contracts through their contractual duration on terms originally negotiated or at all. For the year ended December 31, 2023, 32.3% of our NEMT segment revenue was generated under state Medicaid contracts that are subject to renewal during 2024.
In addition, with respect to many of our state contracts, the payor may terminate the contract without cause, or for convenience, at will and without penalty to the payor, either immediately or upon the expiration of a short notice period in the event that, among other reasons, government appropriations supporting the programs serviced by the contract are reduced or eliminated. We cannot anticipate if, when or to what extent a payor might terminate a contract with us prior to its expiration, or fail to renew or extend a contract with us. If we are unable to retain or renew our contracts, or replace lost contracts, on satisfactory terms, our financial condition and results of operations could be materially adversely affected. While we pursue new contract awards and also undertake efficiency measures, there can be no assurance that such measures will fully offset the negative impact of contracts that are not renewed or are canceled on our financial condition and results of operations.
Our success depends on our ability to compete effectively in the marketplace, and our results of operations could be materially adversely affected if we are unable to compete effectively in the markets for our services.
We compete for clients and for contracts with a variety of organizations that offer similar services. Many organizations of varying sizes compete with us, including local not-for-profit organizations and community-based organizations, larger companies, organizations that currently provide or may begin to provide similar NEMT services
34
(including transportation network companies such as Uber and Lyft) and CHA providers. Some of these companies may have greater brand recognition as well as greater financial, technical, political, marketing, and other resources that contribute to a larger number of clients or payors than we have. In addition, some of these companies may offer more services than we do. To remain competitive, we must provide superior quality services on a cost-effective basis to our payors and customers.
The market in which we operate is influenced by technological developments that affect cost-efficiency and quality of services, and the needs of our customers change and evolve regularly. Accordingly, our success depends on our ability to develop services that address these changing needs and to provide technology needed to deliver these services on a cost-effective basis. Our competitors may better utilize technology to change the way services in our industry are designed and delivered and they may be able to provide our customers with different or greater capabilities than we can provide, including better contract terms, technical qualifications, price and availability of qualified professional personnel. In addition, new or disruptive technologies and methodologies by our competitors may make our services noncompetitive. For example, the COVID-19 pandemic has driven an industry shift toward virtual health solutions which may reduce the number of in-person visits an end-user may be required to make to healthcare providers in order to receive care, which could reduce the utilization of our NEMT services.
We have experienced, and expect to continue to experience, competition from new entrants into the markets in which we operate. Increased competition may result in pricing pressures, loss of or failure to gain market share, or loss of or failure to gain clients or payors, any of which could have a material adverse effect on our operating results. Our business may also be adversely affected by the consolidation of competitors, which may result in increased pricing pressure or negotiating leverage with payors, or by the provision of our services by payors or clients directly to customers, including through the acquisition of competitors.
We obtain a significant portion of our business through responses to government requests for proposals and we may not be awarded contracts through this process in the future, or contracts we are awarded may not be profitable.
We obtain, and will continue to seek to obtain, a significant portion of our business from state government entities, which generally entails responding to a government request for proposal, or RFP. To propose effectively, we must accurately estimate our cost structure for servicing a proposed contract, the time required to establish operations and submit the most attractive proposal with respect to both technical and price specifications. The accurate estimate of costs is based on historical experience with similar contracts and future expectation around transportation costs, which may be inaccurately forecasted due to uncertainties driven by the post-COVID-19 pandemic supply chain shortages and the current geopolitical environment. We must also assemble and submit a large volume of information within rigid and often short timetables. Our ability to respond successfully to an RFP will greatly affect our business. If we misinterpret bid requirements as to performance criteria or do not accurately estimate performance costs in a binding bid for an RFP, there can be no assurance that we will be able to modify the proposed contract and we may be required to perform under a contract that is not profitable, which could materially adversely affect our results of operations.
If we fail to satisfy our contractual obligations, we could be liable for damages and financial penalties, which may place existing pledged performance and payment bonds at risk as well as harm our ability to keep our existing contracts or obtain new contracts and future bonds, any of which could harm our business and results of operations.
Our failure to comply with our contractual obligations could, in addition to providing grounds for immediate termination of the contract for cause, negatively impact our financial performance and damage our reputation, which, in turn, could have a material adverse effect on our ability to maintain current contracts or obtain new contracts. The termination of a contract for cause could, for instance, subject us to liabilities for excess costs incurred by a payor in obtaining similar services from another source. In addition, our contracts require us to indemnify payors for our failure to meet standards of care, and some of them contain liquidated damages provisions and financial penalties if we breach these contracts, which amounts could be material. Our failure to meet contractual obligations could also result in substantial actual and consequential financial damages, the impact of which could be materially adverse to our business and reputation
If we fail to estimate accurately the cost of performing certain contracts, we may experience reduced or negative margins and our results of operations could be materially adversely affected.
During 2023, 2022, and 2021, 85.3%, 87.8%, and 84.7% of our NEMT segment revenue, respectively, was generated under capitated contracts with the remainder generated through fee for service ("FFS") contracts. Under most of our capitated contracts, we assume the responsibility of managing the needs of a specific geographic population by contracting out transportation services to local transportation companies on a per ride or per mile basis. We use “pricing models” to determine applicable contract rates, which take into account factors such as estimated utilization, state specific data, previous experience
35
in the state or with similar services, the medically covered programs outlined in the contract, identified populations to be serviced, estimated volume, estimated transportation provider rates and availability of mass transit. The amount of the fixed per-member, monthly fee is determined in the bidding process, but is predicated on actual historical transportation data for the subject geographic region as provided by the payor, actuarial work performed in-house as well as by third party actuarial firms and actuarial analysis provided by the payor. If the utilization of our services is more than we estimated, the contract may be less profitable than anticipated, or may not be profitable at all.
Certain capitated contracts are structured in a shared risk format and have provisions for reconciliations, risk corridors or profit rebates. Under this shared risk structure, the amount of the fixed per-member fee is determined based on actual realized transportation volumes or costs. This provides some margin protection against unprofitable contracts, as the rate per member will increase if cost of transportation was to increase above certain specified levels. These shared risk contracts pose certain risks to cash management and liquidity, as contracts under this structure can lead to large contract payables and contract receivables balances on our balance sheet, that have longer payment terms than typical cycles. This can lead to large outflows of cash and impact our liquidity.
Under our FFS contracts, we receive fees based on our interactions with government-sponsored clients. To earn a profit on these contracts, we must accurately estimate costs incurred in providing services. If the client population relating to these contracts is not large enough to cover our fixed costs, such as rent and overhead, our operating results could be materially adversely affected and our profitability impaired. Our FFS contracts are not reimbursed on a cost basis; therefore, if we fail to estimate our costs accurately, we may experience reduced margins or losses on these contracts. Revenue under certain contracts may be adjusted prospectively if client volumes are below expectations. If we are unable to adjust our costs accordingly, our profitability may be negatively affected. In addition, certain contracts with state Medicaid agencies are renewable or extended at the state’s option without an adjustment to pricing terms. If such renewed contracts require us to incur higher costs, including inflation or regulatory changes, than originally anticipated, our results of operations and financial position.condition may be adversely affected.
The NEMT segment may be adversely impacted if the drivers we engage as independent contractors were instead classified as employees.
We believe that the drivers we engage to provide rider benefits are properly classified as independent contractors and that these drivers are not our employees. Changes to federal, state or local laws governing the definition or classification of independent contractors, or judicial or administrative challenges to our classification of these drivers as independent contractors, could affect the status of these drivers as independent contractors. A change in the classification of these drivers from independent contractors to employees could increase materially our expenses associated with the delivery of our services, which could materially adversely affect our business, results of operations and financial condition.
Significant interruptions in communication and data services could adversely affect our business.
Our usecontact centers are significantly dependent on telephone, internet and data service provided by various communication companies. Any disruption of these services could adversely affect our business. We have taken steps to mitigate our exposure to service disruptions by investing in complex and multi-layered redundancies, and we can transition services among our different contact centers. Despite these efforts, there can be no assurance that the redundancies we have in place would be sufficient to maintain the contact centers' operations without disruption. Any disruption could harm our customer relationships and have a reinsurance programmaterial adverse effect on our results of operations.
Risks Related to Our PCS Segment
Competition among in-home personal care, or home healthcare, services companies is significant, and insuranceif we are not successful in executing on our strategies in the face of this competition, our business could be materially adversely affected.
The in-home personal care services industry, which is sometimes referred to as the home healthcare services industry, is highly competitive. Our PCS segment competes with a variety of other companies in providing personal care services, some of which may have greater financial and other resources and may be more established in their respective communities. Competing companies may offer newer or different services from those offered by us, which may attract customers who are presently receiving our in-home personal care services to those other companies. Competing companies may also offer services across a greater continuum of care and therefore may be able to obtain new cases or retain patients that might otherwise choose us. In the areas in which our in-home personal care programs are provided, we also compete with a large number of organizations, including:
36
•community-based home healthcare providers;
•hospital-based home healthcare agencies;
•rehabilitation centers, including those providing home healthcare services;
•adult day care centers;
•assisted living centers;
•skilled nursing facilities; and
•fiscal intermediaries that process payroll and undertake other administrative responsibilities related to cover certain claims for losses sufferedthe provision of care by a patient’s family members or other directly-hired personal assistants.
Some of our current and costspotential competitors have or expenses incurredmay obtain significantly greater marketing and financial resources to promote their programs than we have or may obtain. We compete based on the availability of personnel, the quality of services, the expertise of staff and, in some instances, the price of the services. Relatively few barriers to entry in the personal care industry exist in our local markets. Accordingly, other companies, including hospitals and other healthcare organizations that are not currently providing in-home personal care services, may expand their services to include those services or similar services. We may encounter increased competition in the future that could negatively impact patient referrals to us and limit our ability to maintain or increase our market position, the effect of any of which could have a material adverse effect on our business, financial position, results of operations and liquidity.
If any large, national healthcare entities that do not currently directly compete with us move into the in-home personal care market, competition could significantly increase. Larger, national healthcare entities have significant financial resources and extensive technology infrastructure. In addition, companies that currently compete with respect to some of our personal care services could begin competing with additional services through the acquisition of an existing company or de novo expansion into these services. Additionally, consolidation, especially by way of the acquisition of any of our competitors by any large, national healthcare entity, could also lead to increased competition.
State certificates of need, or CON, laws, which often limit the ability of competitors to enter into a given market, are not uniform throughout the United States and are frequently the subject of efforts to limit or repeal such laws. If states remove existing CON laws, we could face increased competition in these states. Further, we cannot assure you that we will be able to compete successfully against current or future competitors, which could have a material adverse effect on our business, results of operations and financial condition.
If we are unable to maintain relationships with existing patient referral sources, our business and consolidated financial condition, results of operations and cash flows could be materially adversely affected.
Our success in entering the markets we serve depends on referrals from physicians, hospitals, nursing homes, service coordination agencies, MCOs, health plans and other sources in the communities we serve and on our ability to maintain good relationships with existing referral sources. Our referral sources are not contractually obligated to refer patients to us and may refer their patients to other providers. Our growth and profitability depends, in part, on our ability to establish and maintain close working relationships with these patient referral sources and to increase awareness and acceptance of the benefits of personal care services by our referral sources and their patients. Our loss of, or failure to maintain, existing relationships or our failure to develop new referral relationships could have a material adverse effect on our business.
Many states have enacted CON laws that require prior state approval to open new healthcare facilities or expand services at existing facilities. In such states, expansion by existing providers or entry into the market by new providers is permitted only where a given amount of unmet need exists, resulting either from population increases or a reduction in competing providers. These states ration the entry of new providers or services and the expansion of existing providers or services in their markets through a CON process, which is periodically evaluated and updated as required by applicable state law. The process is intended to promote comprehensive healthcare planning, assist in providing high-quality healthcare at the lowest possible cost and avoid unnecessary duplication by ensuring that only those healthcare facilities and operations that are needed will be built and opened. New York, New Jersey, and West Virginia have CON laws applicable to the in-home personal care services we provide.
In every state where required, our home healthcare offices and personal care centers possess a license and/or CON issued by the state health authority that determines the local service areas for the home healthcare office or personal care center. In general, the process for opening a home healthcare office or personal care center begins by a provider submitting an
37
application for licensure and certification to the state and federal regulatory bodies, which is followed by a testing period of transmitting data from the applicant to the CMS. Once this process is complete, the care center receives a provider agreement and corresponding number and can begin billing for services that it provides unless a CON is required. For those states that require a CON, the provider must also complete a separate application process before billing can commence and receive required approvals for capital expenditures exceeding amounts above prescribed thresholds. Our failure or inability to obtain any necessary approvals could adversely affect our ability to expand into new markets and to expand our PCS segment services and facilities in existing markets.
If a state with CON laws finds that there is an over-abundance of one type of Medicaid provider within the state, it may, for a period of time, impose a moratorium against the issuance of new Medicaid licenses for that type of service. While a moratorium would not prohibit us from continuing to provide services for which we are already licensed in that state, it may prevent us from entering a new state de novo, which could limit our expansion opportunities, affect our ability to execute on our business strategies and materially harm our business and operations.
We may not, absent the consent of the New York Department of Health, be able to manage the day to day operations of the licensed in-home personal care services agency business in the State of New York, which would have an adverse impact on our expected results from that acquisition and could result in a material adverse effect on our business and operations.
Our operation of our licensed in-home personal care services agency business in the State of New York is subject to a “no control” affidavit process. We submitted our relevant information associated with this process concurrently with the closing of the Simplura acquisition, but while we wait for necessary approvals, we will be limited in our ability to exercise control over the personal care business there for operational matters until such time that our ownership of that business is approved by the New York Department of Health. We can provide no assurance regarding the timing of the approval of this change of ownership by the New York Department of Health, or that such approval will be obtained at all. During this time, we cannot exercise day to day management of these entities, and the pre-acquisition management of Simplura or individuals hired by the pre-acquisition management of Simplura will continue to operate the business. There is no prohibition on these entities making cash flowsdistributions to us during this interim period, but there can be no assurance that we will obtain the necessary authorization from the New York Department of Health to remove the “no control” affidavit and operate this business ourselves. If we are not able to ultimately take over control of these operations, or if we are only able to do so on a more limited basis than anticipated, we may not achieve the synergies and operational benefits expected from the Simplura acquisition as contemplated and our business and results of operations.operations could be materially adversely affected.
The sources and amounts of our patient revenues are determined by a number of factors, including the deductible limitsmix of patients and the rates of reimbursement among payors. Changes in the case-mix of the patients as well as payor mix among private pay, Medicare and Medicaid, as well as specialty programs, including waiver programs within Medicaid, may significantly affect our traditional insurance programs. Anyprofitability. In particular, any significant increase to these reinsurance and self-insurance programsin our Medicaid population or increasesdecrease in deductible limits increases our risk exposure and therefore increases the risk ofMedicaid payments could have a possible material adverse effect on our financial position, results of operations and cash flow, particularly if states operating these programs continue to limit, or more aggressively seek limits on, reimbursement rates or service levels.
Our loss of existing favorable managed care contracts could have a material adverse effect on our business and consolidated financial condition, liquidity,results of operations and cash flowsflows.
There is a risk that our existing favorable managed care contracts could be terminated. Managed care contracts typically permit us or the payor to terminate the contract without cause, typically within 90 days, which can provide payors leverage to reduce volume or obtain favorable pricing. Our failure to negotiate and put in place favorable managed care contracts, or our failure to maintain favorable managed care contracts, could have a material adverse effect on our business.
The personal care industry has historically experienced shortages in qualified employees and management, which could harm our business.
Our personal care services compete with other healthcare providers for both professional and management level employees. Our ability to attract and retain qualified personnel depends on several factors, including our ability to provide these personnel with attractive assignments for the desired number of hours per week and competitive compensation and benefits. There can be no assurance that we will succeed in any of these areas. As the demand for personal care services continues to exceed the supply of available and qualified personnel, our competitors may be forced to offer more attractive
38
wage and benefit packages to these professionals. Furthermore, the competitive market for this labor force has created turnover as many seek to take advantage of the supply of available positions, each offering new and more attractive wage and benefit packages. In addition to the wage pressures inherent in this environment, including any changes to minimum wage, the cost of training new employees amid the turnover rates may cause added pressure on our operating results and harm our business.
Our personal care business may be adversely impacted by labor relations which could create labor disruptions that impact our ability to perform our obligations.
Approximately 2,700 of our hourly caregivers are unionized in regions of New York. Certain collective bargaining agreements with the 1199 SEIU United Healthcare Workers East are currently being negotiated, and others will require renegotiation upon expiration. We may not be able to negotiate terms that are satisfactory to the labor unions, and ultimate agreement may be on terms unfavorable to us. In addition, a unionized work force poses the risk of work stoppages, which if initiated could materially harm our results of operations as well as our commercial relationships with our customers if we are unable to perform under our contracts with them during any such stoppage.
If additional regions in which we operate become unionized, or if we expand our personal care operations into geographic areas where healthcare workers historically have been unionized, being subject to additional collective bargaining agreements may have a negative impact on our ability to timely and successfully recruit qualified personnel and may increase our operating costs. Generally, if we are unable to attract and retain qualified personnel, the quality of our services may decline and we could lose patients and referral sources, which could have a material adverse effect on our business and consolidated financial condition, results of operations and cash flows.
Our PCS segment may be subject to malpractice or other similar claims, which could adversely impact our brand and our success in the marketplace.
The services our PCS segment offers involve an inherent risk of professional liability and related substantial damage awards. Due to the nature of our personal care business, we, through our employees and caregivers who provide services on our behalf, may be the subject of medical malpractice claims. A court could find that these individuals should be considered our agents, and, as a result, we could be held liable for their acts or omissions. Claims of this nature, regardless of their ultimate outcome, could have a material adverse effect on our business or reputation or on our ability to attract and retain patients and employees. While we maintain malpractice liability coverage that we believe is appropriate given the nature and breadth of our operations, any claims against us in excess of insurance limits, or multiple claims requiring us to pay deductibles, could have a material adverse effect on our business and consolidated financial condition, results of operations and cash flows.
Risks Related to Our RPM Segment
We operate in a competitive industry, and any failure to develop and enhance technology applications could harm our business, financial condition and results of operations.
Some of our competitors may have, or new competitors or alliances may emerge that have, greater name recognition, a larger customer base, longer operating histories, more widely-adopted proprietary technologies, greater marketing expertise, larger sales forces and significantly greater resources than we do. Further, our current or potential competitors may be acquired by third parties with greater available resources. As a result, our competitors may be able to respond more quickly and effectively than we can to new or changing opportunities, technologies, standards or customer requirements and may have the ability to initiate or withstand substantial price competition. In addition, current and potential competitors have established, and may in the future establish, cooperative relationships with vendors of complementary products, technologies or services to increase the availability of their solutions in the marketplace. Our competitors could also be better positioned to serve certain segments of our markets, which could create additional price pressure. In light of these factors, even if our solutions are more
39
effective than those of our competitors, current or potential customers may accept competitive solutions in lieu of purchasing our solutions. If we are unable to successfully compete, our business, financial condition and results of operations could be materially adversely affected.
If we do not continue to innovate and provide services that are useful to customers and achieve and maintain market acceptance, we may not remain competitive, and our revenue and results of operations could suffer.
Our success depends on our ability to keep pace with technological developments, satisfy increasingly sophisticated customer requirements, and achieve and maintain or procure contracts.
If we are not successful in demonstrating to existing and potential customers the benefits of our existing and future services, or if we are not able to achieve the support of health plans and provider partners for our existing and future services, our revenue may decline or we may fail to increase our revenue in line with our forecasts. Our results of operations would also suffer if our technology and other innovations are not responsive to the needs of our customers, are not timed to match the corresponding market opportunity, or are not effectively brought to market.
Risks Related to Our Corporate and Other Segment
Our investment in Matrix could be adversely affected by our lack of sole decision-making authority, our reliance on our equity investment’s financial condition, any disputes that may arise between us and Matrix and our exposure to potential losses from the actions of Matrix, and could materially and adversely affect the value of our consolidated assets.
We hold a non-controlling interest in Matrix, which, as of December 31, 2023, constituted 2.4% of our consolidated assets. We do not have unilateral power to direct the activities that most significantly impact Matrix’s economic performance. The arrangement with Matrix involves risks not present with respect to our wholly-owned subsidiaries and that may negatively impact our financial condition and results of operations or make the arrangement less successful than anticipated. Factors that may negatively impact the success of our Matrix investment include the following:
•we may be unable to take actions that we believe are appropriate but are opposed by Matrix under arrangements that require us to cede or share decision-making authority over major decisions affecting the ownership or operation of the company and any property owned by the company, such as the sale or financing of the business or the making of additional capital contributions for the benefit of the business;
•Matrix management may take actions that we oppose;
•we may be unable to sell or transfer our competitorsinvestment to a third party if we fail to obtain the prior consent of our investment partner;
•Matrix may become bankrupt or the majority member may fail to fund its share of required capital contributions, which could adversely impact the investment or increase our financial commitment to the investment;
•Matrix may have business interests or goals with respect to a business that conflict with our business interests and goals, including with respect to the timing, terms and strategies for investment, which could increase the likelihood of disputes regarding the ownership, management or disposition of the business;
•disagreements with Matrix could result in litigation or arbitration that increases our expenses, distracts our management, and disrupts the day-to-day operations of the business, including the delay of important decisions until the dispute is resolved; and
•we may suffer losses as a result of actions taken by Matrix with respect to our investment.
If any of the foregoing events were to transpire, our results of operations and liquidity position could be materially adversely affected and our business could be materially harmed.
40
As part of our investment in innovation, the MSO provides virtual clinical care management services through the PC, an unaffiliated professional corporation owned and operated by a licensed physician, and our relationships or arrangements with the PC could become subject to legal challenges.
The MSO’s contractual relationships and arrangements with the PC, through which virtual healthcare services are provided, may implicate certain state laws that generally prohibit non-professional entities from providing licensed medical services or exercising control over licensed physicians or other healthcare professionals (such activities are generally referred to as the “corporate practice of medicine”) or engaging in certain practices such as fee-splitting with such licensed professionals. The interpretation and enforcement of these laws vary significantly from state to state. There can be no assurance that these laws will be interpreted in a party to. Inaccurate, misleadingmanner consistent with our practices or negative mediathat other laws or regulations will not be enacted in the future that could have an adverse effect on our business, financial condition and results of operations. Regulatory authorities, state boards of medicine, state attorneys general and other parties may assert that, despite the agreements through which we operate, we are engaged in the provision of medical services and/or that our arrangements with the PC constitute unlawful fee-splitting. If a jurisdiction’s prohibition on the corporate practice of medicine or fee-splitting is interpreted in a manner that is inconsistent with our practices, we would be required to restructure or terminate our arrangements with the PC to bring our activities into compliance with such laws. A determination of non-compliance, or the termination of or failure to successfully restructure these relationships could result in disciplinary action, penalties, damages, fines, and/or a loss of revenue, any of which could have a material and adverse effect on our business, financial condition and results of operations. Some state corporate practice of medicine and fee-splitting prohibitions also authorize penalties on healthcare professionals for aiding in the improper rendering of professional services, which could discourage physicians and other healthcare professionals with whom we contract from providing clinical services.
The MSO, the PC and the medical practitioners providing virtual clinical care services through such PC may become subject to medical liability claims, which could have an adverse impact on our business.
The relationships and arrangements between the MSO, the PC and the medical practitioners providing virtual clinical care services through such PC entail the risk of medical liability claims against the MSO. Although we carry insurance covering medical malpractice claims in amounts that we believe are appropriate in light of the risks attendant to our business, successful medical liability claims could result in substantial damage awards that exceed the limits of our insurance coverage, about us could harm our reputation and, accordingly, our ability to maintain our existing contracts and/or procure new contracts.plaintiffs in these matters may request punitive or other damages that may not be covered by insurance. In addition, negative media coveragesuch liability insurance is expensive and insurance premiums may increase significantly in the future, particularly as we expand the services offered by the MSO. As a result, adequate liability insurance may not be available to the MSO in the future at acceptable costs or at all. Any claims made against the MSO that are not fully covered by insurance could influence government officialsbe costly to slowdefend, result in substantial damage awards against the paceMSO and divert the attention of privatizingour or retendering government services.the MSO’s management, which could have an adverse effect on our business, financial condition and results of operations.
If the MSO or the PC fail to comply with applicable data interoperability and information blocking rules, our consolidated results of operations could be adversely affected.
41
The MSO and the PC remote patient monitoring business model depends on the ability for new patient encounters to occur remotely by means of telehealth, and if the telehealth flexibilities currently permitted under the Consolidated Appropriations Act of 2023 are not extended, this business model may no longer be feasible and our results of operations could be adversely affected.
Under the CMS’ 2021 Physician Fee Schedule final rule, CMS limited the provision of RPM services to “established patients” of a billing physician, which required an initiating in-person visit with the physician. In the CMS’ 2024 Physician Fee Schedule final rule, CMS confirmed that the “established patient” limitation continues to be in place for RPM services.In response to the COVID-19 pandemic, CMS made several changes in the manner in which Medicare will pay for telehealth visits, many of which relax previous requirements, including the “established patient” restriction, initiating site requirements for both the providers and patients and telehealth modality requirements. The Consolidated Appropriations Act of 2023 extended many of the COVID-19 public health emergency provisions related to telehealth until December 31, 2024, including the flexibility to permit a patient’s home to be an originating cite and to permit telehealth by means of audio only communication. State law applicable to telehealth, particularly licensure requirements, has also been relaxed in many jurisdictions as a result of the COVID-19 pandemic. It is unclear which, if any, of these changes will remain in place permanently and which will be rolled-back following the COVID-19 pandemic. If regulations change to restrict the ability of physicians to deliver care through telehealth modalities, including with respect to the initiating visit, our results of operations may be adversely affected.
Risks Related to Governmental Regulations
Healthcare Segments conduct business inis a heavily regulated healthcare industry. Complianceindustry, and compliance with existing Lawslaws is costly, and changes in Laws ornon-compliance has the potential to be even costlier considering that violations of Lawslaws may result in increased costscorrective action or sanctions that could reduce our segments’ revenue and profitability.
The U.S.United States healthcare industry is subject to extensive federal and state Lawsoversight relating to, among other things:
•professional licensure;
•conduct of operations;
•addition of facilities, equipment and services, including certificates of need;need, or CON;
•coding and billing related to our services; and
•payment for services.
Both federal and state government agencies have increased coordinated civil and criminal enforcement efforts related to the healthcare industry. Regulations related to the healthcare industry are extremely complex and, in many instances, the industry does not have the benefit of significant regulatory or judicial interpretation of those laws. The Patient Protection and Affordable Care Act, as well as the anticipated attempts to repeal all or portions of those laws by the President and Congress, has also introduced some degree of regulatory uncertainty as the industry does not know how the changes it introduced or changes to it will affect many aspects of the industry.
Medicare and Medicaid anti-fraud and abuse laws prohibit certain business practices and relationships related to items and services reimbursable under Medicare, Medicaid and other governmental healthcare programs, including the payment or receipt of remuneration to induce or arrange for referral of patients or recommendation for the provision of items or services covered by Medicare or Medicaid or any other federal or state healthcare program.program, often referred to as the Anti-Kickback Statute. Federal and state Lawslaws also prohibit the submission of false or fraudulent claims, including claims to obtain reimbursement under Medicare and Medicaid. Our U.S. Healthcare SegmentsMedicaid, under what is commonly referred to as the False Claims Act. We have implemented compliance policies to help assure theirour compliance with these regulations as they become effective; however,effective, but interpretations different from our interpretations or enforcement of these laws and regulations in the future could subject our practices to allegations of impropriety, or illegality, or could require such segments to make changes in their facilities, equipment, personnel, services or the manner in which they conduct our business.
Changes to the regulatory landscape applicable to Matrixour businesses could have a material adverse effect on our results of operations and financial condition.condition, including the proposed ruling by the Centers for Medicare and Medicaid Services ("CMS") titled Ensuring Access to Medicaid Services
Our PCS segment locations that maintain a Medicare certified home healthcare line of business (for example, in Pennsylvania and Massachusetts) must comply with ever changing federal conditions or participation, where compliance is difficult to achieve and hard to monitor. Recently implemented requirements for which adherence is particularly challenging include the need to:
•provide transfer summary to facility within two days of a planned transfer or within two business days of becoming aware of an unplanned transfer if the patient is still receiving care in the facility;
42
•provide written notice of patient’s rights and responsibilities, and transfer and discharge policies to a patient‑selected representative within four business days of the initial evaluation visit;
•communicate revisions to the plan of care due to change in health status to the patient, representative (if any), caregiver and physicians issuing orders for plan of care; and
•communicate discharge plan revisions to the patient, representative (if any), caregiver, all physicians issuing orders for the plan of care and to the provider expected to care for the patient after discharge (if any).
CMS could adopt new requirements or guidelines that may further increase the costs associated with the provision of certified services, which could harm our business and have a material adverse effect on our results of operations. As an example, components of the 2023 proposed ruling released by CMS titled Ensuring Access to Medicaid Services, which proposes advancements in access to care, quality of care, and improved health outcomes for Medicaid beneficiaries, include stipulations which would require that 80.0% of Medicaid payments for personal care services be spent on compensation for the direct care workforce rather than other administrative or overhead expenses. This requirement would limit our ability to achieve a gross margin that would allow us to continue to invest in technological platforms that would ease the administrative burden and allow our care providers to focus on higher quality of care, which could have a material adverse effect on our results of operations and financial condition.
In New York, we provide Service Coordination, or SC, and/or Home and Community Support Services, or HCSS, to Traumatic Brain Injury, or TBI, and Nursing Home Transition and Diversion, or NHTD, Medicaid waiver participants. These waiver programs were developed based on the philosophy that individuals with disabilities, individuals with traumatic brain injury, and seniors, may be successfully served and included in their surrounding communities so long as the individual is the primary decision maker and works in cooperation with care providers to develop a plan of services that promotes personal independence, greater community inclusion, self-reliance and participation in meaningful activities and services. Examples of activities that are at various stages of implementation that may implicate or materially adversely affect our waiver line of business profitability follow.
•Conflict Free Case Management – The CHANYS DOH, in collaboration with CMS, is implementing mandatory conflict-free case management policies. Conflict-free case management requires the separation of clinical eligibility determinations and care planning assessments (for example, SC) from the direct provision of services (for example, HCSS). Providers in the personal care industry are expected to implement additional conflict of interest standards that may or may not ultimately require the creation of legally separate entities with distinct protocols.
•Managed Long-Term Care Carve-In – Managed Long-Term Care, or MLTC, is a system believed to streamline the delivery of long-term care services to people who are chronically ill or disabled and who wish to reside, or continue to reside, safely in their homes and communities. The entire array of services to which an enrolled member is entitled can be received through the MLTC plan a particular member has chosen. As New York transforms its long-term care system to one that ensures care management for all, enrollment in a MLTC plan may be mandatory or voluntary, depending on individual circumstances. While TBI and NHTD participants are currently excluded from having to enroll in a MLTC plan (for example, SC and HCSS claims are billed and paid on a Medicaid fee-for-service basis), the NYS DOH submitted a transition plan to CMS for consideration that eliminates the exclusion, meaning that TBI and NHTD waiver participants who wish to continue receiving services must enroll in a plan. While the primary goal stated was to improve access to all services across the state, the result may also require our navigation of network participation requirements and typical managed care cost control measures (for example, authorizations, utilization review, rate negotiation).
Regarding in-home personal care generally (including certified or non-certified and waiver or non-waiver), compliance with responsibilities under the Fair Labor Standards Act, or FLSA, remains key. The United States Department of Labor, or DOL, continues its focus on the industry to ensure that personal care workers earn a minimum wage and are afforded various overtime pay protections. We may be sued individually or by a class of workers claiming that a violation has occurred, or a complaint may be filed with the DOL to investigate. If it is ultimately found that we neglected to pay the full amount of wages owed under the FLSA (for meals, breaks, travel, or otherwise), payment for the missing amount and possibly double that amount may be mandated, which could materially increase our costs and harm our results of operations.
With respect to our Matrix investment, the Comprehensive Health Assessment ("CHA") services industry is primarily regulated by federal and state healthcare Lawslaws and the requirements of participation and reimbursement of the MA ProgramMedicare Advantage program established by CMS. From time to time, CMS considers changes to regulatory guidelines with respect to prospective CHAs or the risk adjusted payment system applicable to Matrix’s Medicare Advantage plan customers. CMS could adopt new requirements or guidelines that may, for example, increase the costs associated with CHAs, limit the opportunities and settings available to administer CHAs, or otherwise change the risk adjusted payment system in a way that would adversely
43
State revalidation and potential reduction of eligible Medicaid beneficiaries as a result of the restart of the Medicaid eligibility redetermination process following the expiration of the COVID-19 public health emergency under the Families First Coronavirus Response Act (2020) could diminish the demand for our services, affect the profitability of our capitated contracts with our customers, and have a material adverse effect on our results of operations.operations and financial condition.
The cost of our services is funded substantially by government and private insurance programs, and changes in budgetary priorities of the government entities or private insurance programs that fund these services could experience a significantresult in the loss of contracts, a reduction in reimbursement revenue.rates, or a decrease in amounts payable to us under our contracts.
Currently, many of the states in which we operate are facing budgetary shortfalls or changes in budgetary priorities. While many of these states are dealing with budgetary concerns by shifting costs from institutional care to home and community-based care such as the services we provide, there is no assurance that this trend will continue or be implemented as it has been historically. For example, in New York (one of several states where our PCS segment provides services under the name “All Metro Health Care”), there are Medicaid Redesign Team initiatives taking place aimed at reducing Medicaid expense through provider consolidation and other measures. Our continued ability to provide core services, though expected, is now dependent upon various competitive bid processes, including the following:
•LHCSA Request for referrals of patients and referrals by physicians to healthcare providers with whom the physicians haveProposal (Anticipated) – The FY 2021 enacted New York State Budget created a financial relationship and billingnew Public Health Law, or PHL, Section 3605-c which, if implemented, would prohibit Licensed Home Care Service Agencies, or LHCSAs, such as our PCS segment’s individually-licensed branches, from providing or claiming for services provided pursuant to Medicaid recipients without being authorized to do so by contract with the NYS DOH. This restriction would apply to the provision of such referrals if any occur. Violationservices under the state Medicaid plan, a plan waiver, or through an MCO (for example, managed long-term care plan). If implemented, the statute would require the NYS DOH to contract with only enough LHCSAs to ensure that Medicaid recipients have access to care. The NYS DOH is expected to post an RFP that includes demonstrated cultural and language competencies specific to the population of theserecipients and the available workforce, experience serving individuals with disabilities, and demonstrated compliance with all applicable federal and state laws and regulations among the selection criteria. After contracts are awarded, the NYS DOH could terminate a LHCSA’s contract, or suspend or limit a LHCSA’s rights and privileges under a contract, upon thirty-days' written notice if the Commissioner of Health finds that a LHCSA has failed to comply with the extent applicableprovisions of Section 3605-c or any regulations promulgated under the statute. Also, authorization received by LHCSAs under PHL Section
44
3605-c would not substitute for satisfying existing licensure requirements or the screening and enrollment process required for participation in the Medicaid program.
Consequently, a significant decline in government or private insurance company expenditures or the number of program beneficiaries, a shift of expenditures or funding away from programs that call for the types of services that we provide, or change in government contracting or funding policies could cause payors to terminate their contracts with us or reduce their expenditures or reimbursement rates under those contracts, either of which could have a negative impact on our U.S. Healthcare Segments’ operations, may result in prohibitionfinancial position and operating results.
We are subject to regulations relating to privacy and security of payment for services rendered, loss of licenses, fines, criminal penaltiespatient and exclusion from Medicaidservice user information, and Medicare programs. To the extent such segments do maintain such financial relationships with physicians, they rely on certain exceptions to self-referral laws that they believe will be applicable to such arrangements. Anyour failure to comply with such exceptionsregulations could result in a material adverse impact on our operating results.
There are numerous federal and state regulations addressing patient information privacy and security concerns. In particular, the federal regulations issued under HIPAA contain provisions that:
•protect individual privacy by limiting the uses and disclosures of patient information;
•require the implementation of security safeguards to ensure the confidentiality, integrity and availability of individually identifiable health information in electronic form; and
•prescribe specific transaction formats and data code sets for certain electronic healthcare transactions.
Compliance with state and federal privacy laws and regulations requires considerable resources. These costs and investments could negatively impact our financial position and results of operations. Further, the HIPAA regulations and state privacy laws expose us to increased regulatory risk, as the penalties discussed above.associated with a failure to comply or with information security breaches, even if unintentional, could be substantial and have a material adverse effect on our financial position and results of operations.
If we fail to comply with federal and state documentation, coding and billing rules, we could be subject to criminal or civil penalties, loss of licenses and exclusion from the Medicare and Medicaid programs, which could have a material adverse impact on our financial position and operating results. In billing for our services to third-party clients, we must follow complex documentation, coding and billing rules. These rules are based on federal and state laws, rules and regulations, various government pronouncements, including guidance and notices, and industry practice. Failure to follow these rules could result in potential criminal or civil liability under the federal False Claims Act, under which extensive financial penalties can be imposed, or under various state statutes which prohibit the submission of false claims for services covered. Compliance failure could further result in criminal liability under various federal and state criminal or civil statutes. We may be subject to audits conducted by our clients or their proxies, including the Office of Inspector General, or OIG, for the Department of Health and Human Services, or DHHS, state Medicaid regulatory agencies, state Medicaid fraud enforcement agencies, health departments, CMS, the Unified Program Integrity Contractors and regional federal program integrity contractors for the Medicare and Medicaid programs that may result in recoupment of funds. In addition, our segmentsclients may be subject to certain audits that may result in recoupment of funds from our clients that may, in turn, implicate us. We could be adversely affected in the event such an audit results in negative findings and recoupment from or penalties to our customers.
Our contracts are subject to an increased riskstringent claims and invoice processing regimes which vary depending on the customer and nature of litigationthe payment mechanism. Government entities may take the position that if a transport cannot be matched to a medically necessary healthcare event, or is conducted inconsistently with contractual, regulatory or even policy requirements, payment for such transport may be recouped by such customer. Likewise, a government surveyor may determine that a personal care visit was not sufficiently supported by a time and attendance record and/or that the aide was not qualified on a particular date of service and seek a refund as a result.
While we carefully and regularly review documentation, and coding and billing practices, the rules are frequently vague and confusing and they cannot ensure that governmental investigators, private insurers or private whistleblowers will not challenge our practices. Such a challenge could result in a material adverse effect on our financial position and results of operations.
45
We could be subject to civil penalties and loss of business if we fail to comply with applicable bribery, corruption and other legal actions and liabilities.regulations governing business with public organizations.
Increasing scrutiny and changing expectations with respect to environmental, social and governance (“ESG”) matters may impose additional costs on us, impact our access to capital, or until the organization in question has put in place “self clean” measuresexpose us to the satisfaction of the procuring authority. The occurrence of any of these actions, regardless of the outcome, could disrupt our operationsnew or additional risks.
Increased focus, including from regulators, investors, employees and clients, on ESG matters may result in increased costs (including but not limited to increased costs related to compliance and stakeholder engagement), impact our reputation, or otherwise affect our business performance. Negative public perception, adverse publicity or negative comments in social media could limitdamage our abilityreputation or harm our relationships with regulators, employees or our customers, if we do not, or are not perceived to, obtain additional contracts in other jurisdictions. Further, government tenders inadequately address these issues, including if we fail to demonstrate progress towards any current or future ESG goals. Any harm to our reputation could negatively impact employee engagement and retention and the U.S., the European Union and other countries can be subject to challenge where the procurer has not followed the correct processes, or where they seek to make material amendments to contracts after award. Consequently, it can be very difficult to convince governmentwillingness of customers to amend their contracts, even where circumstances have changed significantly, because they are concerned that if challenged theydo business with us. At the same time, various stakeholders may have divergent views on ESG matters.
This divergence increases the risk that any action or lack thereof with respect to re-procureESG matters will be perceived negatively by at least some stakeholders and adversely impact our reputation and business. It is possible that stakeholders may not be satisfied with our ESG practices or the entire service. This can pose significant risks in termsspeed of their adoption. At the same time, certain stakeholders might not be satisfied if we adopt ESG practices at all. Actual or perceived shortcomings with respect to our ESG practices and reporting could negatively impact our business. We could also incur additional costs and require additional resources to monitor, report, and comply with various ESG practices. In addition, a variety of organizations have developed ratings to measure the performance of companies on ESG topics, and the results of some of these assessments are widely publicized. Such ratings are used by some investors to inform their investment and voting decisions. In addition, many investors have created their own proprietary ratings that inform their investment and voting decisions. Unfavorable ratings of our company or our industry, as well as omission of inclusion of our stock into ESG-oriented investment funds, may lead to negative investor sentiment and the diversion of investment to other companies or industries, which could have a negative impact on our stock price and our access to and cost management and profitability. of capital.
Our segments’ businesses arebusiness is subject to licensing regulations and other regulatory provisions, including provisions governing surveys and audits. Changesaudits, and changes to, or violations of, these regulations could negatively impact our segments’ revenues.us.
In many of the locations where our segmentswe operate, theywe are required by local laws (both U.S. and foreign) to obtain and maintain licenses. The applicable state and local licensing requirements govern the services our segmentswe provide, the credentials of staff, record keeping, treatment planning, client monitoring and supervision of staff. The failure to maintain these licenses or the loss of a license could have a material adverse impact on our segments’ businessesus and could prevent themus from providing services to clients in a given jurisdiction. Our segments’ contracts are subject to surveys or audit by their payersour payors or their clients. Our segmentsWe are also subject to regulations that restrict theirour ability to contract directly with a government agency in certain situations. Such restrictions could affect our segments’ ability to contract with certain payerspayors and clients, and could have a material adverse impact on our segments’financial condition and results of operations.
Our segments’ contracts are subject to audit and modification by the payerspayors with whom our segmentswe contract, at their sole discretion.discretion, and any such audits and modifications could materially and adversely affect our results of operations.
Our segments’ businesses depend on theirour ability to perform successfully perform under various government funded contracts. Under the terms of these contracts, payers,payors, government agencies or their proxy contractors can review our segments’ compliance or performance, as well as our segments’ records and general business practices, at any time, and may in their discretion:
•suspend or prevent our segmentsus from receiving new contracts or extending existing contracts because of violations or suspected violations of procurement laws or regulations;
•terminate or modify our segments’ existing contracts;
•seek to recoup the amount we were paid and/or reduce the amount our segmentswe are paid under our existing contracts; or
46
•audit and object to our segments’ contract related fees.
Any increase in the number or scope of audits could increase our segments’ expenses, and the audit process may disrupt the day-to-day operations of our segments’ businessesbusiness and distract their management. If payerspayors have significant audit findings, or if they make material modifications to our segments’ contracts, it could have a material adverse impact on our segments’ results of operations.
Risks Related to Our Indebtedness and Economic Conditions
Our agreements covering our outstanding indebtedness, including the New Credit Agreement mayand the indentures governing our Notes due 2025 and 2029, respectively, contain various covenants that limit our current and future operations, particularlyor will limit our ability to respond to changesengage in our business or to pursue our business strategies.
•incur additional debt;
•provide guarantees in respect of obligations of other persons;
•issue redeemable stock and preferred stock;
•pay dividends or distributions or redeem or repurchase capital stock;
•make loans, investments and capital expenditures;acquisitions;
•enter into transactions with affiliates;
•create or incur liens;
•make distributions from our subsidiaries;
•permit contractual obligations that burden our ability to make distributions from our subsidiaries;
•sell assets and capital stock of our subsidiaries;
•make acquisitions;prepayments on subordinated debt; and
•consolidate or merge with or into, or sell substantially all of our assets to, another person.
In addition, our agreements covering our outstanding indebtedness, including the New Credit Agreement and the indentures governing our Notes due 2025 and 2029, require us to meet financial covenants associated with that debt, and contain cross-default provisions. For example, the New Credit Agreement contains an affirmative covenant regarding our Total Net Leverage Ratio as of the end of each of our fiscal quarters. See Part II, Item 7. Management’s Discussion and Analysis of Financial Condition and Results of Operations for additional information regarding the New Credit Agreement and the Total Net Leverage Ratio.
A breach of theany of these covenants or restrictions could result in a default under the applicable agreements that govern our indebtedness. Suchindebtedness including as a result of cross default may preclude us from drawing from our senior secured credit facility (the “Credit Facility”) or allow the creditors to accelerate the related debtprovisions, and, may result in the accelerationcase of our New Credit Facility, permit the lenders to cease making loans to us. Upon the occurrence of an event of default under our New Credit Facility, the lenders could elect to declare all amounts outstanding under our New Credit Facility to be immediately due and payable and terminate all commitments to extend further credit. Such actions by those lenders could cause cross defaults under our other indebtedness resulting in our other indebtedness being declared immediately due and payable, including our Notes due 2025 and 2029. We cannot provide any other debtassurance that we may incur to whichthe holders of such indebtedness would waive a default, including as a result of a cross acceleration or cross-default provision applies.default. In the event of acceleration of our lenders accelerateoutstanding indebtedness, we cannot assure you that we will be able to repay the repaymentdebt or obtain new financing to refinance the debt. Even if new financing is made available to us, it may not be on terms acceptable to us. If we were unable to repay these amounts, certain debt holders could proceed against the collateral granted to them to secure the indebtedness, including the equity of subsidiary guarantors that we have pledged as collateral, pursuant to our New Credit Agreement. If any of the foregoing were to occur, our business and results of operations could be materially adversely affected and the value of our equity could be materially diminished.
We have substantial indebtedness and lease obligations that could restrict our financial opportunities and competitive position and we may not be able to generate sufficient cash to service all of our indebtedness which could harm our operations and business.
Our substantial indebtedness and lease obligations could adversely affect our ability to raise additional capital to fund our operations, limit our ability to react to changes in the economy or our industry, expose us to interest rate risk to the extent of our variable rate indebtedness, and prevent us from meeting our obligations under the New Credit Facility and our Notes due 2025 and 2029. Our substantial indebtedness and lease obligations could have important consequences, including:
•increasing our vulnerability to adverse economic, industry or competitive developments;
47
•requiring a substantial portion of cash flow from operations to be dedicated to the payment of principal and interest on our indebtedness and lease payments under our leases, therefore reducing our ability to use our cash flow to fund our operations, capital expenditures and future business opportunities;
•exposing us to the risk of increased interest rates because certain of our borrowings, weincluding borrowings under the New Credit Facility, are at variable rates of interest;
•making it more difficult for us to satisfy our obligations with respect to our indebtedness and any failure to comply with the obligations of any of our debt instruments, including restrictive covenants and borrowing conditions, could result in an event of default, including as a result of a cross-default, under the agreements governing such indebtedness, including the New Credit Facility and the Notes due 2025 and 2029;
•restricting us from making strategic acquisitions or causing us to make non-strategic divestitures;
•imposing restrictions on the operation of our business that may hinder our ability to take advantage of strategic opportunities or to grow our business;
•limiting our ability to obtain additional financing for working capital, capital expenditures (including real estate acquisitions), debt service requirements and general corporate or other purposes, which could be exacerbated by volatility in the credit markets; and
•limiting our flexibility in planning for, or reacting to, changes in our business or market conditions and placing us at a competitive disadvantage compared to any of our competitors who are less leveraged and who therefore may be able to take advantage of opportunities that our leverage prevents us from exploiting.
Our ability to make scheduled payments on and to refinance our indebtedness depends on and is subject to our financial and operating performance, which in turn is affected by general and regional economic, financial, competitive, business and other factors, all of which are beyond our control, including the availability of financing in the international banking and capital markets and the ongoing effects of the COVID-19 pandemic on the global economy. We cannot assure you that weour business will generate sufficient cash flow from operations or that future borrowings will be available to us in an amount sufficient to enable us to service our debt, to refinance our debt or to fund our other liquidity needs. Any refinancing or restructuring of our indebtedness could be at higher interest rates and may require us to comply with more onerous covenants that could further restrict our subsidiaries would have sufficient assetsbusiness operations. Further, in the event of a default, including as a result of a cross-default, the holders of our indebtedness could elect to repaydeclare such indebtedness.indebtedness immediately due and payable, which could materially adversely affect our results of operations and financial condition.
We may incur substantial additional indebtedness, in the future, which could impair our financial condition.
We may incur substantial additional indebtedness in the future to fund our activities, including but not limited to fund share repurchases, acquisitions, cash dividends and business expansion. While our New Credit Agreement contains restrictions on the incurrence of additional indebtedness, these restrictions are subject to a number of significant qualifications and exceptions, and under certain circumstances, the amount of indebtedness that could be incurred in compliance with these restrictions could be substantial. Any existing and futureadditional indebtedness increaseswould increase the risk that we may be unable to generate cash sufficient to pay amounts due in respect of such indebtedness.indebtedness, and the risks that we already face as a result of our leverage would intensify. Future substantial indebtedness could also have other important consequences on our business. For example, it could:
•make it more difficult for us to satisfy our existing obligations;
•make it more difficult to renew or enter into new contracts with existing and potential future clients;
48
•limit our ability to borrow additional amounts to fund, among other things, working capital, capital expenditures, debt service requirements, the execution of our business strategy or acquisitions and other purposes;acquisitions;
•require us to dedicate a substantial portion of our cash flow from operations to pay principal and interest on our debt, which would reduce the funds available to us for other purposes;
•restrict our ability to dispose of assets and use the proceeds from any such dispositions;
•restrict our ability to raise debt or equity capital to be used to repay other indebtedness when it becomes due;
•make us more vulnerable to adverse changes in general economic, industry and competitive conditions, as well as in government regulation and to our business; and
•expose us to risks inherent in interest rate fluctuations because some of our borrowings are at variable rates of interest, which could result in higher interest expensesexpense in the event of increases in interest rates; andrates.
Our ability to satisfy and manage our debt obligations depends on our ability to generate cash flow and on overall financial market conditions. To some extent, this is subject to prevailing economic and competitive conditions and to certain financial, business and other factors, many of which are beyond our control. Our business may not generate sufficient cash flow from operations to permit us to pay principal, premium, if any, or interest on our debt obligations. If we are unable to generate sufficient cash flow from operations to service our debt obligations and meet our other cash needs, we may be forced to reduce or delay capital expenditures, sell or curtail assets or operations, seek additional capital, or seek to restructure or refinance our indebtedness. If we must sell or curtail our assets or operations, it may negatively affect our ability to generate revenue.
Risks Related to Our CapitalCommon Stock
If we are unable to remediate the identified material weaknesses in our internal control over financial reporting, or if we experience additional material weaknesses or other deficiencies or otherwise fail to maintain an effective system of internal controls, we may not be able to accurately and timely report our financial results, in which case our business may be harmed, investors may lose confidence in the accuracy and completeness of our financial reports, and the price of our common stock may decline.
Our management is responsible for establishing and maintaining adequate internal control over financial reporting and for evaluating and reporting on the effectiveness of our system of internal control. Our internal control over financial reporting is a process designed to provide reasonable assurance regarding the reliability of financial reporting and the preparation of financial statements for external reporting purposes in accordance with accounting principles generally accepted in the United States of America (“U.S. GAAP”). We are required to furnish annually a report by management of its assessment of the effectiveness of our internal control over financial reporting as of the end of our most recent fiscal year. In addition, our independent registered public accounting firm is required to provide a related attestation report on our internal control over financial reporting.
In connection with our 2023 year-end assessment of internal control over financial reporting, we determined that, as of December 31, 2023, the material weaknesses related to the ineffective general information technology controls ("GITCs") and process-level control activities in the revenue and payroll processes within the PCS segment were unremediated as of December 31, 2023. The material weaknesses were largely a result of the continued integration of the PCS segment and the high volume of transactions across their disparate systems. For further discussion of the material weaknesses identified and our remedial efforts, see Item 9A, Controls and Procedures.
Remediation efforts place a significant burden on management and add increased pressure to our financial resources and processes. As a result, we may not be successful in making the improvements necessary to remediate the material weaknesses identified by management, or do so in a timely manner, or identify and remediate additional control deficiencies, including material weaknesses, in the future.
If we are unable to remediate successfully our existing or any future material weaknesses or other deficiencies in our internal control over financial reporting: the accuracy and timing of our financial reporting may be adversely affected; our liquidity, our access to capital markets, the perceptions of our creditworthiness, and our ability to complete acquisitions may be adversely affected; we may be unable to maintain compliance with applicable securities laws, NASDAQ listing requirements, and the covenants under our debt instruments or derivative arrangements regarding the timely filing of periodic reports; we may be subject to regulatory investigations and penalties; investors may lose confidence in our financial reporting; and we may suffer defaults, accelerations, or cross-accelerations under our debt instruments or derivative arrangements to the extent we are unable to obtain waivers from the required creditors or counterparties or are unable to cure any breaches. If any such event or circumstance were to occur, our stock price could decline and our business, financial condition and results of operations could be materially adversely affected.
49
Future sales of shares of our common stock by existing stockholders could cause our stock price to decline.
Sales of substantial amounts of our common stock in the public market, or the perception that these sales could occur, could cause the market price of our common stock to decline. As of December 31, 2023, we had 19,775,041 shares of common stock outstanding that were freely transferable without restriction or further registration under the Securities Act, unless held by or purchased by our “affiliates” as that term is defined in Rule 144 under the Securities Act. Shares of our common stock held by or purchased by our affiliates are restricted or “covered” securities within the meaning of Rule 144 under the Securities Act, but will be eligible for resale subject to applicable volume, means of sale, holding period and other limitations of Rule 144 under the Securities Act.
With respect to our stockholders Coliseum Capital Partners, L.P., Coliseum Capital Partners II, L.P. and Blackwell Partners, LLC - Series A, as well as our former stockholder Coliseum Capital Co-Invest, L.P, which we sometimes refer to collectively as the Coliseum Stockholders, any or all of which may continue to be considered an affiliate or affiliates of ours, we have filed a registration statement that has been declared effective under the Securities Act covering the resale by the Coliseum Stockholders of an aggregate of 2,982,751 shares of our common stock that continue to be held by the Coliseum Stockholders. As a result, such shares may be sold pursuant to the registration statement without regard to the volume and other limitations of Rule 144 under the Securities Act that would otherwise be applicable to such sales.
We also filed a registration statement under the Securities Act to register additional shares of common stock to be issued under our Amended and Restated 2006 Long-Term Incentive Plan, or Incentive Plan, and, as a result, all shares of common stock acquired upon exercise of stock options or vesting of shares of restricted stock, restricted stock units or performance-based restricted stock units granted under our Incentive Plan will also be freely tradable under the Securities Act, unless purchased or acquired by our affiliates under the plan. As of December 31, 2023, there were vested stock options outstanding and exercisable to purchase a total of 42,054 shares of our common stock and there were 504,110 shares of our common stock subject to restricted stock awards, restricted stock units, and performance-based restricted stock units under the Incentive Plan. In addition, 792,338 shares of our common stock are reserved for future issuances under the Incentive Plan.
Our annual operating results and stock price may be volatile or may decline significantly regardless of our operating performance.
Our annual operating results and the market price for our Common Stockcommon stock may fluctuate significantly in response to a number of factors, many of which we cannot control, including:
•changes in rates or coverage for services by payers;payors;
•changes in Medicaid, Medicare or other U.S.United States federal or state rules, regulations policies or applicable foreign regulations, policies and technical guidance, including UK health, employment and criminal justice legislation and guidance, Saudi Arabian licensing and Saudization rules, as well as other foreign laws applicable to our business;policies;
•market conditions or trends in our industry or the economy as a whole;whole, including increases in the minimum wage requirements in various jurisdictions in which we operate, and fluctuations in the size of the Medicare member population as well as overall health of its members;
•increased competition, in any of our segments, including through insourcing of services by our clients and new entrants to the market;
•changes in tax law;laws; and
•changes in accounting principles.
If any of these events or circumstances were to impact our results or stock price, our common stock price could decrease and the value of an investment in our common stock would experience a corresponding decrease.
In addition, the stock markets, and in particular the NASDAQ, Global Select Market, have experienced considerable price and volume fluctuations that have affected and continue to affect the market prices of equity securities of many companies. In the past, stockholders have instituted securities class action litigation following periods of market volatility. If we become involved in securities litigation, we could incur substantial costs, and our resources and the attention of management could be diverted from our business.
The Company depends on its subsidiaries for cash to fund all of its operations and expenses, including to make future dividend payments or to fund stock repurchases, if any.any, and there can be no assurance that our subsidiaries will make available to us the funds necessary for us to fund our operations and capital needs.
Our operations are conducted entirely through our subsidiaries and oursubsidiaries. Our ability to generate cash to fund all of our operations and expenses, to pay dividends or complete stock repurchase programs, or to meet any debt service obligations is highly dependent on theour subsidiaries’ earnings and the receipt of funds from our subsidiaries viaby way of dividends or
50
intercompany loans. We dohave not currently expect to declare or paypaid any cash dividends on our Common Stock forcommon stock and do not expect to pay any dividends on our common stock in the foreseeable future; however,future. We currently intend to invest our and our subsidiaries’ future earnings, if any, to fund our growth, to develop our business, invest in our technology, for working capital needs and for general corporate purposes. To the extent that we determine in the future to pay dividends on our Common Stock,common stock, however, none of our subsidiaries will be obligated to make funds available to us for the payment of dividends. Similarly, our subsidiaries are not obligated to make funds available to us to fund stock repurchases. Further, the agreement governing our New Credit Agreement significantly restricts the ability of our subsidiaries to pay dividends, make loans or otherwise transfer assets to us. In addition, Delaware law may impose requirements that may restrictimposes solvency restrictions on our ability to pay dividends to holders of our Common Stock.common stock. Therefore, you are not likely to receive any dividends on our common stock for the foreseeable future and the success of an investment in shares of our common stock will depend upon any future appreciation in their value. There is no guarantee that shares of our common stock will appreciate in value or even maintain the price at which stockholders have purchased their shares. Furthermore, if the subsidiaries are unable or unwilling to fund our cash needs when needed or desired, our results of operations and business and financial condition could be materially adversely affected.
If securities or industry analysts do not publish research or publish misleading or unfavorable research about our business, our stock price and trading volume could decline.
The trading market for our Common Stock will dependcommon stock depends in part on the research and reports that securities or industry analysts publish about us or our business. If one or more analysts downgrade our stock or publish misleading or unfavorable research about our business, our stock price would likely decline.decline in reaction to such information. If one or more of these analysts ceases coverage of our company or fails to publish reports on us regularly, demand for our common stock could decrease, which could cause our common stock price or trading volume to decline.
Anti-takeover provisions in our second amended and restated certificate of incorporation, as amended, and amended and restated by-lawsbylaws could discourage, delay or prevent a change of control of our company and may affect the trading price of our Common Stock.common stock.
Our second amended and restated certificate of incorporation, as amended, and amended and restated bylaws include a number of provisions that may be deemed to have anti-takeover effects, which includeincluding provisions governing when and by whom special meetings of our stockholders may be called, and provisions that may discourage, delay or prevent a change in our management or control over us that stockholders may consider favorable. SuchAs a result of these provisions, holders of our common stock may prevent our stockholders from receivingnot receive the full benefit fromof any premium to the market price of our Common Stockcommon stock offered by a bidder in a takeover context.
Even in the absence of a takeover attempt, the existence of these provisions may adversely affect the prevailing market price of our Common Stockcommon stock if the provisions are viewed as discouraging takeover attempts in the future. Our second amended and restated certificate of incorporation, as amended, and amended and restated by-lawsbylaws, as amended, may also make it difficult for stockholders to replace or remove our management.management, including, no cumulative voting for the election of directors, provisions governing director vacancies, which are filled only by remaining directors (including vacancies resulting from removal or other cause), and, until the phase-out of our staggered Board of Directors (the "Board") is complete in 2025, provisions providing for staggered terms for certain members of the Board. These provisions may facilitate management entrenchment that may delay, deter, render more difficult or prevent a change in our control, which may not be in the best interests of our stockholders.
Item 1B.Unresolved Staff Comments.
None.
Item 1C.Cybersecurity. |
Risk Management and Strategy.
Our information technology ("IT") systems are critically important to our existing business operations and growth strategy. We provide services to individuals and others that require us to collect, process, maintain and retain sensitive and personal client confidential information in our IT systems, including patient identifiable health information, financial information and other personal information about our customers and end-users, such as names, addresses, phone numbers, email addresses, identification numbers, sensitive health data, and payment account information. As a result, we are subject to complex and evolving United States privacy laws and regulations, including those pertaining to the handling of personal data, such as HIPAA and CCPA. In addition to protecting the privacy of all health-related information for our members, our IT infrastructure supports the operations of all aspects of our business and ensures that we are able to continue to serve our
51
members' transportation, personal care, and remote monitoring needs and execute our strategy to better connect people with care.
The Company's Enterprise Risk Management Team (the "ERM Team") works in collaboration with the Company's Information Security Team to set the enterprise risk strategy and make risk-informed decisions, which include the assessment and response to cybersecurity risk. The Company maintains an information security, technology, and cybersecurity risk management program overseen by the Chief Information Security Officer (the "CISO") that uses a risk-based methodology to support the security, confidentiality, integrity, and availability of its information. The Company's information security, technology, and cybersecurity risk management program provides the structure for managing the respective risks utilizing a combination of automated tools, documented processes, and third-party assessments to identify and assess potential cybersecurity risks. The Company engages third parties in connection with its cybersecurity program. Third party monitoring activities include the use of Security Information Event Monitoring ("SIEM") software and regularly scheduled vulnerability assessments performed by an independent third-party to capture and identify vulnerabilities, security events, and potential incidents.The Company also maintains a formal information security training program that includes training on matters such as phishing and email security best practices as well as data privacy which is required for all employees on an annual basis.
While processes are in place to minimize the chance of a successful cyberattack, the Company has established incident response policies and procedures to address a cyber threat that may occur despite these safeguards. In these instances, the Company maintains a cybersecurity incident response policy (the "Incident Response Policy") and cybersecurity incident response plan (the "Incident Response Plan") to help ensure a timely, consistent and compliant response to actual or attempted cybersecurity incidents impacting the Company. The Incident Response Plan includes (1) detection, (2) analysis, which may include timely notice to the Audit Committee of our Board if deemed material or appropriate, (3) containment, (4) eradication, (5) recovery and (6) post-incident review. The Incident Response Plan includes leveraging the Company's cross-functional Cybersecurity Incident Committee that is supported by an organizational structure that includes executives across the Information Security, ERM, Finance, Legal, and Investor Relations functions of the business. The Cybersecurity Incident Committee is responsible for assessing the materiality of any cybersecurity incidents and for communicating any such incidents to the appropriate parties outside the Company.
The Company relies on our IT systems and networks in connection with many of our business activities. Some of these networks and systems are managed by third-party service providers and are not under our direct control. The Company has implemented processes to manage the cybersecurity risks associated with its use of third-party service providers, including processes during the contract review phase by both Information Security and Legal teams providing contractual safeguards as well as ongoing monitoring of third-party service providers for incidents that may affect the Company. To date, no cybersecurity incidents have had such a material adverse effect on us, and we are not presently aware of any cybersecurity threats that are reasonably likely to materially affect us.
Despite the security measures we have implemented, certain cyber incidents could materially disrupt our operational systems, compromise personally identifiable information regarding customers or employees, delay our ability to provide critical services to our customers, and/or jeopardize the security of our facilities. We continuously seek to maintain a robust program of information security and controls, but the impact of a material information technology event could have a material adverse effect on our competitive position, reputation, results of operations, financial condition and cash flows.
Governance.
Board's Roles and Responsibilities
The Audit Committee is responsible for overseeing and monitoring the Company's information security, technology, and cybersecurity program and other IT and data privacy risks, controls, strategies, and procedures. The Audit Committee is comprised of board members with expertise in the areas of risk management, finance and technology, enabling them to effectively oversee such cybersecurity and other IT and data privacy risks. The Audit Committee receives updates from management as needed or at least quarterly which cover the Company's current cybersecurity and other IT and data privacy risk assessments and key risk areas. The Audit Committee also reviews and discusses with management, at least quarterly, and as needed, any material or significant cyber incidents that have occurred or are reasonably likely to occur. In addition, the Audit Committee receives regular updates on cybersecurity trends and emerging threats from the Information Security Team led by the CISO.
Management's Roles and Responsibilities
In collaboration with the ERM team and the Audit Committee, the Company's Information Security Team, overseen by the CISO, is responsible for assessing and managing cybersecurity risks including the prevention, mitigation, detection, and remediation of cybersecurity incidents. The Information Security Team is comprised of various IT groups with the knowledge and expertise needed to execute the technical aspect of the Incident Response Plan. This team is led by the CISO and other
52
technical leaders with significant experience in the information security field. The CISO has over 18 years of experience serving as a CISO and in other security leadership positions in the information security and cybersecurity fields, including roles as VP of Information Security, Director of Infrastructure, Director of Information Security, and Manager of Information Security. In addition to his work experience, the CISO holds a certification as a Certified Information System Security Professional (CISSP). The CISO works closely with other management positions, including the Chief Accounting Officer, Chief Information Officer, Chief Audit Officer, Deputy General Counsel, and VP of Investor Relations through the Cybersecurity Incident Committee in order to ensure that the Company has effective communication and understanding of its cybersecurity risk management.
The processes by which the Information Security Team and CISO monitor the prevention, mitigation, detection, and remediation of cybersecurity incidents include regular vulnerability assessments and penetration testing, security incident and event management, continuous monitoring, and threat and intelligence gathering. The CISO reports to the Audit Committee on a quarterly basis, and as needed, to provide an overview of our cybersecurity risk posture, the effectiveness of our cybersecurity policies, procedures, and strategies, and any material or significant cybersecurity incidents that have occurred or are likely to occur.
Item 2.Properties.
Our principal executive office isoffices are located in Stamford, Connecticut,Denver, Colorado, where we have leased approximately 73,000 square feet of corporate office and operations space through September 2032. In addition, we continue to lease our former principal executive offices located in Atlanta, Georgia, where we have leased through June 2024 approximately 30,000 square feet of corporate office and operations space.The offices in Atlanta, Georgia, as well as 28 other leased facilities that serve as both office and operational space, are utilized substantially in our NEMT segment.
We maintain offices for our PCS segment in Valley Stream, New York, where we have leased through November 2025 corporate office and operations space. This office as well as an additional 83 locations of leased office and operational space support our PCS segment.
We maintain offices for our RPM segment in Franklin, Ohio, where we own the real estate for corporate office and operations space. In addition, we own real estate for our RPM segment in Sullivan, Illinois and we lease additional officerent coworking space in Tucson, Arizona. As of March 2, 2018, NET Services leases space in approximately 40various other locations WD Services leases space in approximately 220 locations, and Matrix leases space in five locations. as needed to support our operations.
The lease terms vary andfor all of our leased facilities, but we believe that they are all generally at market rates. We further believe that our properties are adequate for our current business needs and in any event we believe that we can obtain adequate additional or alternative space at market rates, if needed, to meet our foreseeable business needs.
From time-to-time, we may become involved in legal proceedings arising in the Courtordinary course of Chanceryour business. We record accruals for outstanding legal matters when it is believed to be probable that a loss will be incurred and the amount can be reasonably estimated. Management, following consultation with legal counsel, does not expect the ultimate disposition of any or a combination of any such ongoing or anticipated matters to have a material adverse effect on our business, financial condition or operating results. We cannot predict with certainty, however, the potential for or outcome of any litigation. Regardless of the Stateoutcome of Delaware (the “Court”), captioned Haverhill Retirement System v. Kerley et al., C.A. No. 11149-VCL (the “Haverhill Litigation”). The complaint named Richard A. Kerley, Kristi L. Meints, Warren S. Rustand, Christopher Shackelton (the “Individual Defendants”) and Coliseum Capital Management, LLC (“Coliseum Capital Management”) as defendants, and the Company as a nominal defendant. The complaint purported to allege that the dividend rate increase term originally in the Company’s outstanding Preferred Stock was an impermissibly coercive measure that impaired the voting rights of the Company’s stockholders in connection with the vote on the removal of certain voting and conversion caps previously applicable to the Preferred Stock (the “Caps”), and that the Individual Defendants breached their fiduciary duties by approving the dividend rate increase term and attempting to coerce the stockholder vote relating to the Company’s Preferred Stock, and by failing to disclose all material information necessary to allow the Company’s stockholders to cast an informed vote on the Caps. The complaint also purported to allege derivative claims alleging that the Individual Defendants breached their fiduciary duties to the Company by entering into the subordinated note and standby agreement with Coliseum Capital Management, and granting Coliseum Capital Management certain stock options. The complaint further alleged that Coliseum Capital Management aided and abetted the Individual Defendants in breaching their fiduciary duties. The complaint sought, among other things, an injunction prohibiting the stockholder vote relating to the dividend rate increase, corporate governance reforms, unspecified damages and other relief.
Item 4.Mine Safety Disclosures. |
Not applicable.
53
PART II
Item 5. Market for Registrant’s Common Equity, Related Stockholder Matters and Issuer Purchases of Equity Securities.
Market for our Common Stock
Our Common Stock, our only class of common equity, has beenis quoted on NASDAQ under the symbol “PRSC” since August 19, 2003. Prior to that time there was no public market for our Common Stock."MODV". As of March 5, 2018,February 16, 2024, there were 2211 holders of record of our Common Stock. The following table sets forth the high and low sales prices per share of our Common Stock for the period indicated, as reported on NASDAQ Global Select Market:
| High | Low | ||||||
| 2017 | |||||||
| Fourth Quarter | $ | 60.59 | $ | 53.84 | |||
| Third Quarter | $ | 54.99 | $ | 49.77 | |||
| Second Quarter | $ | 47.47 | $ | 43.73 | |||
| First Quarter | $ | 41.80 | $ | 37.65 | |||
| 2016 | |||||||
| Fourth Quarter | $ | 49.97 | $ | 34.89 | |||
| Third Quarter | $ | 50.30 | $ | 43.01 | |||
| Second Quarter | $ | 53.38 | $ | 43.77 | |||
| First Quarter | $ | 55.28 | $ | 42.03 | |||
Stock Performance Graph
The following graph shows a comparison of the cumulative total return for our Common Stock, Russell 2000 Index, and NASDAQ Health Services Index and Russell 2000 Index assuming an investment of $100 in each on December 31, 2012.2018.
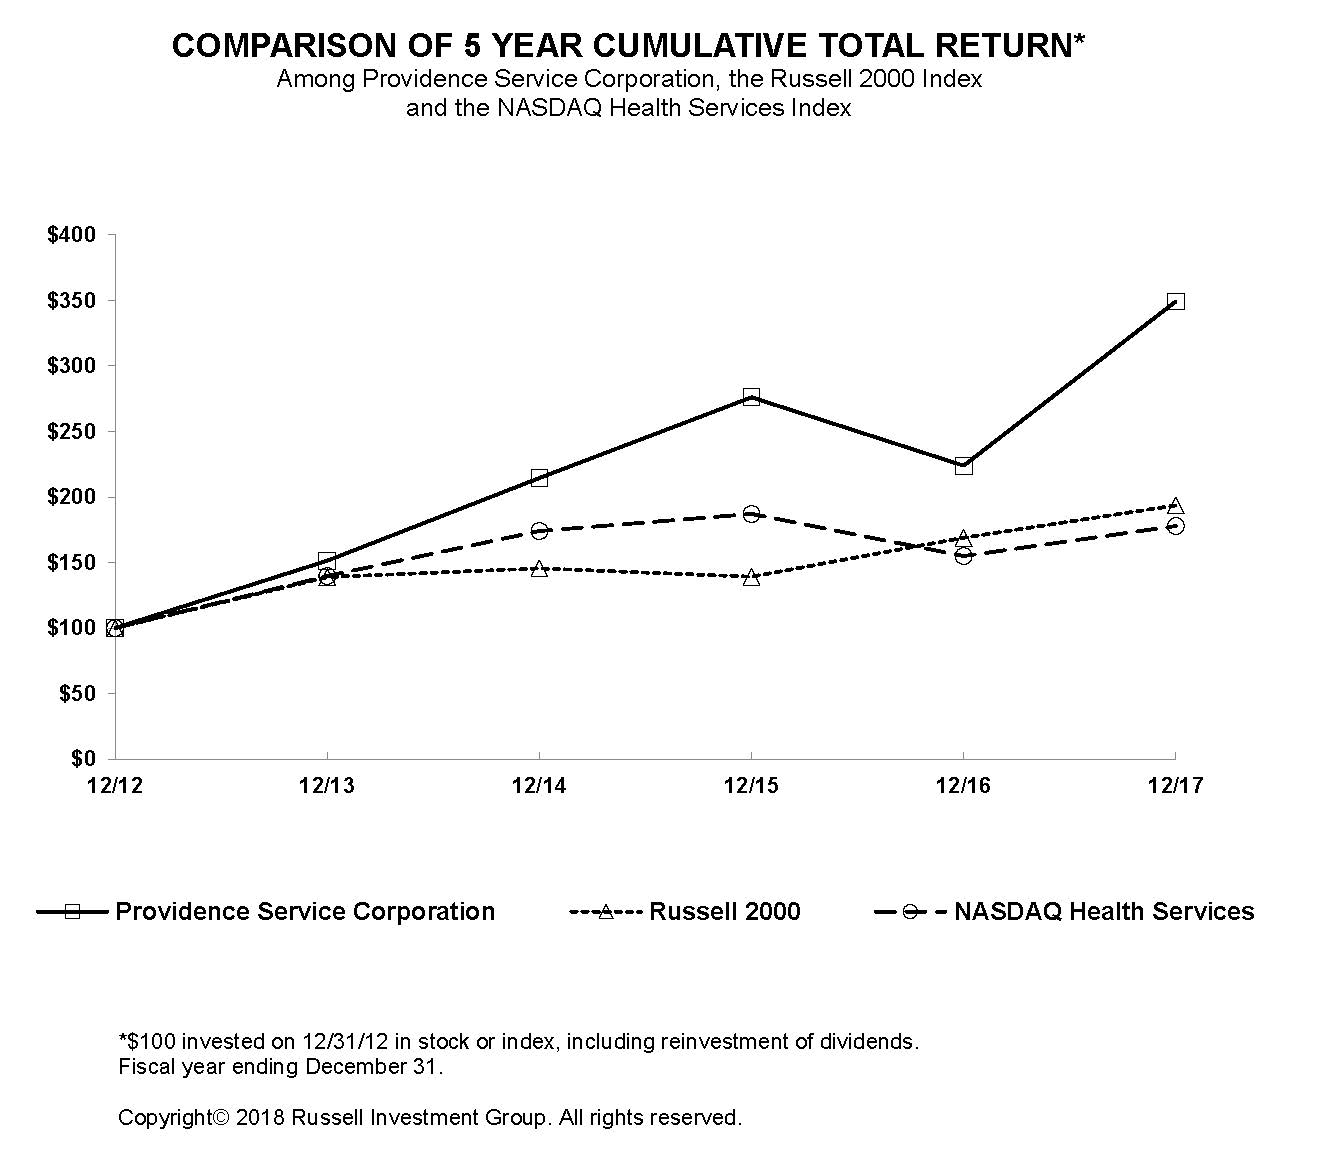

Dividends
We have not paid any cash dividends on our Common Stock and currently do not expect to pay dividends on our Common Stock. In addition, our ability to pay dividends on our Common Stock is limited by the terms of our New Credit Agreement and our Preferred Stock.Agreement. The payment of future cash dividends, if any, will be reviewed periodically by the Board of Directors and will depend upon, among other things, our financial condition, funds from operations, the level of our capital and development expenditures, any restrictions imposed by present or future debt or equity instruments, and changes in federal tax policies, if any.
54
Issuer Sales of Unregistered Securities
There were no sales, including exchanges or conversions, of equity securities by us during the period covered by this Annual Report that were either not registered under the Securities Act or not previously disclosed in a quarterly report on Form 10-Q or current report on Form 8-K previously filed by us with the Securities and Exchange Commission.
Purchases of Equity Securities by the Issuer and Affiliated Purchasers
| Period | Total Number of Shares of Common Stock Purchased (1) | Average Price Paid per Share | Total Number of Shares of Common Stock Purchased as Part of Publicly Announced Program (2) | Maximum Dollar Value of Shares of Common Stock that May Yet Be Purchased Under Program (2) (in thousands) | ||||||||||
| Fourth quarter: | ||||||||||||||
| October 1, 2017 to October 31, 2017 | — | $ | — | — | $ | 69,640 | ||||||||
| November 1, 2017 to November 30, 2017 | 247 | $ | 56.74 | — | $ | 69,640 | ||||||||
| December 1, 2017 to December 31, 2017 | 181,714 | $ | 58.27 | 180,270 | $ | 59,137 | ||||||||
| Total | 181,961 | $ | 58.26 | 180,270 | ||||||||||
55
| Plan category | (a) Number of securities to be issued upon exercise of outstanding options, warrants and rights | Weighted- average exercise price of outstanding options, warrants and rights | (b) Number of securities remaining available for future issuance under equity compensation plans (excluding securities reflected in column (a)) | |||||||
| Equity compensation plans approved by security holders (1) | 606,695 | $ | 48.70 | 1,938,666 | ||||||
| Equity compensation plans not approved by security holders | — | — | — | |||||||
| Total | 606,695 | 48.70 | 1,938,666 | |||||||
6. [Reserved]
56
| Year Ended December 31, | |||||||||||||||||||
| 2017 | 2016 | 2015 | 2014 | 2013 | |||||||||||||||
| (1)(2)(3)(4)(8)(9) | (3)(5)(6)(8)(9) | (7)(8)(9)(11) | (8)(10)(11) | ||||||||||||||||
| (dollars and shares in thousands, except per share data) | |||||||||||||||||||
| Statement of operations data: | |||||||||||||||||||
| Service revenue, net | $ | 1,623,882 | $ | 1,578,245 | $ | 1,478,010 | $ | 1,092,880 | $ | 798,766 | |||||||||
| Operating expenses: | |||||||||||||||||||
| Service expense | 1,489,044 | 1,452,110 | 1,381,154 | 988,600 | 736,669 | ||||||||||||||
| General and administrative expense | 72,336 | 69,911 | 70,986 | 44,080 | 25,590 | ||||||||||||||
| Asset impairment charge | — | 21,003 | — | — | — | ||||||||||||||
| Depreciation and amortization | 26,469 | 26,604 | 23,998 | 17,213 | 9,331 | ||||||||||||||
| Total operating expenses | 1,587,849 | 1,569,628 | 1,476,138 | 1,049,893 | 771,590 | ||||||||||||||
| Operating income | 36,033 | 8,617 | 1,872 | 42,987 | 27,176 | ||||||||||||||
| Non-operating expense: | |||||||||||||||||||
| Interest expense, net | 1,278 | 1,583 | 1,853 | 10,224 | 6,921 | ||||||||||||||
| Other income | (5,363 | ) | — | — | — | — | |||||||||||||
| Loss on extinguishment of debt | — | — | — | — | 525 | ||||||||||||||
| Equity in net (gain) loss of investees | (12,054 | ) | 10,287 | 10,970 | — | — | |||||||||||||
| Gain on sale of investment | (12,377 | ) | — | — | — | — | |||||||||||||
| Loss (gain) on foreign currency transactions | 345 | (1,375 | ) | (857 | ) | (37 | ) | — | |||||||||||
| Income (loss) from continuing operations, before income taxes | 64,204 | (1,878 | ) | (10,094 | ) | 32,800 | 19,730 | ||||||||||||
| Provision for income taxes | 4,401 | 17,036 | 14,583 | 8,289 | 6,625 | ||||||||||||||
| Income (loss) from continuing operations, net of tax | 59,803 | (18,914 | ) | (24,677 | ) | 24,511 | 13,105 | ||||||||||||
| Discontinued operations, net of tax | (5,983 | ) | 108,760 | 107,871 | (4,236 | ) | 6,333 | ||||||||||||
| Net income | 53,820 | 89,846 | 83,194 | 20,275 | 19,438 | ||||||||||||||
| Net (gain) loss attributable to noncontrolling interests | (451 | ) | 2,082 | 502 | — | — | |||||||||||||
| Net income attributable to Providence | $ | 53,369 | $ | 91,928 | $ | 83,696 | $ | 20,275 | $ | 19,438 | |||||||||
| Diluted earnings (loss) per common share: | |||||||||||||||||||
| Continuing operations | $ | 3.50 | $ | (1.45 | ) | $ | (1.83 | ) | $ | 1.63 | $ | 0.95 | |||||||
| Discontinued operations | (0.44 | ) | 6.52 | 6.09 | (0.28 | ) | 0.46 | ||||||||||||
| Total | $ | 3.06 | $ | 5.07 | $ | 4.26 | $ | 1.35 | $ | 1.41 | |||||||||
| Weighted-average number of common shares outstanding: | |||||||||||||||||||
| Diluted | 13,673 | 14,667 | 15,961 | 15,019 | 13,810 | ||||||||||||||
| As of December 31, | |||||||||||||||||||
| 2017 | 2016 | 2015 | 2014 | 2013 | |||||||||||||||
| (9) | (5)(6) | ||||||||||||||||||
| (dollars in thousands) | |||||||||||||||||||
| Balance sheet data: | |||||||||||||||||||
| Cash and cash equivalents | $ | 95,310 | $ | 72,262 | $ | 79,756 | $ | 121,538 | $ | 75,156 | |||||||||
| Total assets | 704,090 | 685,279 | 1,050,202 | 1,168,934 | 425,954 | ||||||||||||||
Long-term obligations, including current portion | 2,984 | 3,611 | 300,071 | 574,613 | 123,500 | ||||||||||||||
| Other liabilities | 287,543 | 306,428 | 382,423 | 372,907 | 151,817 | ||||||||||||||
| Convertible preferred stock | 77,546 | 77,565 | 77,576 | — | — | ||||||||||||||
| Total stockholders' equity | 336,017 | 297,675 | 290,132 | 221,414 | 150,637 | ||||||||||||||
Item 7. Management’s Discussion and Analysis of Financial Condition and Results of Operations.
The following discussion and analysis of our financial condition and results of operations should be read in conjunction with Item 6.“Selected Financial Data” and our consolidated financial statements and related notes included in Item 8. “Financial Statements and Supplementary Data” of this report.Annual Rport. This discussion and analysis contains forward-looking statements that involve risks, uncertainties and other factors that may cause actual results to differ materially from those projected inanyforward-looking statements, as discussed in “Disclosure Regarding Forward-Looking Statements”. These risks and uncertainties include but are not limited to those set forth in Item 1A. “Risk Factors”.
Overview of Our Business
Please refer to Item 1. “Business” of this Annual Report on Form 10-K for a discussion of our services and corporate strategy.
Business Outlook and Trends
Our performance is affected by a number of trends that drive the demand for our services. In particular, the markets in which we operate are exposed to various trends, such as healthcare industry and demographic dynamics in the U.S. and international government outsourcing and employment dynamics. Over the long term, we believe there are numerous factors that could affect growth within the industries in which we operate, including:
•an aging population, which willis expected to increase demand for healthcare services including required transportation to such healthcare services and in-home personal care and remote patient monitoring services;
•increasing prevalence of chronic illnesses that require active and ongoing monitoring of health data which can be accomplished at a lower cost and result in better health outcomes through remote patient monitoring services;
•a movement towards value-based care versus fee for servicefee-for-service and cost plus care and budget pressure on governments, both of which may increase the use of private corporations to provide necessary and innovative services;
•increasing demand for in-home care provision, driven by cost pressures on traditional reimbursement models and technological advances enabling remote engagement;engagement, including remote monitoring and similar internet-based health related services;
•a shift in membership dynamics as a result of Medicaid redetermination efforts, which may decrease membership levels at our NEMT segment;
•advancement of regulatory priorities, which include the Centers for Medicare and Medicaid Services ("CMS") proposed rule, Ensuring Access to Medicaid Services, which may lower profit margins at our PCS segment;
•technological advancements, which may be utilized by us to improve serviceservices and lower costs, but may also be utilized by others, which may increase industry competitiveness;
•uncertain macroeconomic conditions, including rising inflation and interest rates, could have an effect on our debt and short-term borrowings, which may have a negative impact on our results.
57
On May 11, 2023, the Department of Health and Human Services ("HHS") declared the end of the public health emergency ("PHE") for the COVID-19 pandemic. While the Company has continued to experience increased trip volume, service hours, and patient visits each year following the pandemic, structural changes in the industry as a fixed amount per beneficiary, and CMS’ grantresult of waivers to states relativethe pandemic, as well as ongoing constraints on the labor market, specifically related to the parameters of their Medicaid programs. Enactment ofstrain on healthcare professionals, could continue to have an adverse legislation, regulation or agency guidance,impact on the Company's financial statements. For the NEMT segment, trip volume may reducehave a negative impact on our transportation providers and may result in higher transportation costs as the Company adapts to this increase in demand for transportation services and to the availability of transportation providers, should any capacity constraints within our services, ournetwork of transportation providers arise. For the PCS segment, the shortage of caregivers will continue to impact the volume of service hours that can be provided while also driving increased wage rates, which limits the Company's ability to conduct some or allbe profitable in contracts with set rates for various care services. Additionally, changes in membership dynamics at the NEMT segment as a result of our business and/orMedicaid redetermination and reduction in payor reimbursement rates for services performed within our segments.
Our business environment is competitive, the structural changes in our industry related to the COVID-19 pandemic have been lasting, the labor market for healthcare professionals remains constrained, and generate the highest levels of returnmarket price for our shareholders. Incommon stock on the Nasdaq Stock Market continues to be volatile; the continuing effect of all or any of the foregoing could result in an impairment of the goodwill in our reporting units. As discussed elsewhere herein and under the caption “Risk Factors” in the Company’s annual report on Form 10-K filed with the Securities and Exchange Commission for the year ended December 31, 2022, impairment tests may be required in addition to the annual impairment testing as evidenced byof July 1, 2023, if circumstances change that would, more likely than not, reduce the 2016 Matrix Transaction, we may also enter into strategic partnerships if we feel this provides the best opportunity to maximize shareholderfair value of goodwill of a reporting unit below such reporting unit’s carrying value. The pursuit of our strategy may also result inCompany monitors the disposition of current businesses, as demonstrated in 2017 with our sale of our equity investment in Mission Providence and in 2015 with the sale of our Human Services segment. In making these determinations, we base our decisions on a variety of factors, including the availability of alternative opportunities to deploy capital, maximize shareholder value or other strategic considerations. The outcome of our active evaluationperformance of the optimal industry sectors around whichbusiness and the value of its stock price and estimated fair values of its reporting units, among other relevant considerations, to focusdetermine if any impairments to goodwill could exist at any particular time. During our merger and acquisition activity as well as the potential future entry into strategic partnerships or potential dispositionJuly 1, 2023 annual assessment of businesses may impact the extent and manner in whichgoodwill, we deploy resources across Providence, including strategic and administrative resources between Corporate and Other anddetermined that based on our operating segments, and we may incur incremental costs in pursuing these efforts.
Critical Accounting Policies and Estimates
There are certain critical estimates that we believe require significant judgment in the preparation of our consolidated financial statements. We consider an accounting estimate to be critical if:
•it requires us to make an assumption because information was not available at the time or it included matters that were highly uncertain at the time the estimate is made; and
•changes in the estimate or different estimates that could have been selected may have had a material impact on our financial condition or results of operations.
Description.We accrue the cost ofgenerally pay our transportation expense within NET Servicesproviders for completed trips based on documentation submitted after services have been provided. The transportation service is initiated at the time a member submits a request for transportation services from our providers. At this time, we calculate an estimated transportation cost for each trip based on historical experience and contractual terms. This portion of the accrued transportation cost is based on requests for services we have received and the amount we expect to be billed by our transportation providers, as we generally only pay transportation providers forproviders. All completed trips based upon documentation submitted after services(both unbilled and billed) for which we have been provided. not yet issued payment reconcile to our total accrued transportation cost, however the critical accounting estimate that requires significant judgment is the portion of the accrual that is estimated at initiation of the member request.
58
Judgments and Uncertainties. The transportation cost accrual requires significant judgment as the accrualit is based uponcalculated using contractual rates and mileage estimates, as well as an estimated rate for unknown cancellations asgiven that members may have requested transportation but not notified uswithout yet notifying the Company of cancellation. Based upon historical trip experience and contractcontractual terms, we estimate the amount of expensetransportation cost incurred for invoices which have not yet been submitted as of period end.submitted. The estimates are routinely monitored and compared to actual invoiced costs. Actual expensecost could be greater or less than the amounts estimated due to changes in member orfacts and circumstances that differ from historical trends.
Sensitivity of Estimate to Change. The estimates for the transportation provider behavior.
In determining our estimate each period, we use data around historical trip experience, current contractual rates, and mileage estimates and use a third party consultant to assist in development of the accrual. Our December 31, 2023 estimated portion of the accrued transportation costs was $1.9 million lower than our estimated portion at December 31, 2022. The decrease from 2022 to 2023 is driven by faster adjudication of claims as a result of initiatives, such as digitization of claims and increased utilization of ride share. The assumptions used in the estimate inputs include estimated trip costs and estimated trip volume. If we were to assume that our estimate of future transportation costs was changed to the upper end or lower end of the range we developed in the course of formulating our estimate, the estimate for future transportation costs as of December 31, 2023 would range from $35.6 million to $43.5 million.
Recoverability of Goodwill and Definite-Lived Intangible Assets
Judgments and Uncertainties. When performing a quantitative assessment to result from the use and eventual disposition of the assets over the remaining economic life of the asset or the primary asset in the group of assets. If such testing indicates the carrying value of the asset or group of assets is not recoverable, we estimate the fair value of the asset or groupCompany's goodwill, the Company applies a blended approach, which includes a combination of assets using appropriateboth an income approach and a market valuation methodologies, which would typically include an estimate ofapproach. The income approach applies a discounted cash flows. Ifflow method which includes assumptions on the projected future cash flows, discount rates, working capital adjustments, long-term growth rates, and others to estimate the fair value of those assets or groups of assets is less than carryingthe reporting unit. The market valuation approach produces an estimated fair value we record an impairment loss equal to the excess of the carrying value overreporting unit based on a comparison of the estimated fair value.reporting unit to publicly traded entities in similar lines of business.
Sensitivity of Estimate to Change. The use of different estimates or assumptions in determining the fair value of our goodwill and intangible assets may result in a different values for those assets,value recorded, which could result in an impairment or,charge that has the potential to have a material impact to the consolidated statement of operations. During our July 1 annual assessment of goodwill, we determined that based on our qualitative assessment for each reporting unit, factors existed which required us to test our goodwill for impairment. These factors included a decline in the period in which an impairment is recognized, could result in a materially different impairment charge.
Income Taxes
Description. We recordaccount for income taxes under the asset and liability method. DeferredUnder this method, we record income tax expense for the amount of taxes payable or refundable in the current period and deferred tax assets and liabilities to reflect our estimation of the future tax consequences of temporary differences between the carrying amounts of assets and liabilities for book and tax purposes. We determine deferred income taxes based on the differences in accounting methods and timing between financial statementreporting purposes and income tax reporting. Accordingly, wereporting purposes. We determine the deferred tax asset or liability for each temporary difference based on the enacted tax rates expected to be in effect when we realize the underlying items of income and expense. We record a valuation allowance to reduce our deferred tax assets when we estimate that it is more likely than not that a portion of the deferred tax assets will not be realized, and we record liabilities to address uncertain tax positions we have taken in previously filed tax returns or that we expect to take in our current tax returns.
59
Judgments and Uncertainties. Significant assumptions, judgments, and estimates are made by management when determining the income tax provision (benefit) for the current year, the amount of deferred tax assets and liabilities to be recorded, and the necessary valuation allowance to be recorded. These judgements include interpretations of income tax regulations, estimates of future taxable income, tax-planning strategies, and the likelihood of recovery of deferred tax assets or that a tax position will be sustained upon audit.
We consider many factors when assessing the likelihood of future realization of our deferred tax assets, including our recent earnings experience by jurisdiction, expectations of future taxable income, and the carryforward periods available to us for tax reporting purposes, as well as other relevant factors.purposes. We may establish a valuation allowance to reduce deferred tax assets to the amount we believe is more likely than not to be realized. Due to inherent complexities arising from the nature of our businesses, future changes in income tax law, tax sharing agreements or variances between our actual and anticipated operating results, we make certain judgments and estimates. Therefore, actual income taxes could materially vary from these estimates.
We record liabilities to address uncertain tax positions we have taken in previously filed tax returns or that we expect to take in a futureour current tax return.returns. The determination for required liabilities is based upon an analysis of each individual tax position, taking into consideration whether it is more likely than not that our tax position, based on technical merits, will be sustained upon examination. For those positions for which we conclude it is more likely than not itthe position will be sustained, we recognize the largest amount of tax benefit that is greater than 5050.0 percent likely of being realized upon ultimate settlement with the taxing authority. The difference between the amount recognized and the total tax position is recorded as a liability. TheWhile the Company believes all of its tax positions are fully supportable, the ultimate resolution of these tax positions may be greater or less than the liabilities recorded.
Components of Results of Operations
The following results of operations include the accounts of ModivCare and our subsidiaries for the years ended December 31, 2023 and 2022. For our results of operations for the year ended December 31, 2017. The final impact may differ from these provisional amounts, possibly materially, due to, among other things, additional analysis, changes in interpretations2021 see “Part II, Item 7. Management’s Discussion and assumptions we made, additional regulatory guidance that may be issued,Analysis of Financial Condition and actions we may take as a resultResults of the Tax Reform Act. In accordance with SAB 118, the financial reporting impact of the Tax Reform Act will be completed no later than the fourth quarter of 2018.
Revenues
Service revenue, net. Service revenue for our NEMT segment includes the expiring policies. However, SPCIC continuesrevenue generated by providing non-emergency medical transportation services directly to resolve claims under the historical policy years. In addition, under the current policies, the Company retains liability up to the policy deductibles. In addition,our customers. These services are provided on either a capitated basis, which means we maintain self-funded health insurance programsare paid on a per-member, per-month ("PMPM") basis for U.S. based employees witheach eligible member, or on a stop-loss umbrella policy with a third party insurer to limit the maximum potential liability for individual claims and for a maximum potential claim liabilityfee-for-service ("FFS") basis, which means we are paid based on member enrollment. We utilize independent actuarial reports to determine the expected lossesvolume of trips or services performed. Payment for our NEMT services is received from third-party payors, predominately made up of state Medicaid agencies and in order to record the appropriate entries associated with our historical reinsurance programs, our retained exposure for the deductibles under our current policies, and self-funded health insurance programs. We regularly analyze our reserves for incurred but not reported claims, and for reported but not paid claims related to our reinsurance and self-funded insurance programs. We believe our reserves are adequate. However, significant judgment is involved in assessing these reserves such as evaluating historical paid claims, average lag times between the claims’ incurred date, reported dates and paid dates, and the frequency and severity of claims. There may be differences between actual settlement amounts and recorded reserves and any resulting adjustments are recorded once a probable amount is known.MCOs.
60
Service revenue for our RPM segment includes the sale of monitoring equipment to our third-party distributors as well as revenue generated from the hours incurred by our Clinical Team for providing monitoring services to our customers, primarily on a PMPM basis for each eligible member. Payment for our monitoring services is billed to third-party payors which include, but are not limited to, national and regional health plans, government-funded benefit programs, healthcare provider organizations, and individuals.
Grant Income
Grant income. The Company has received distributions, primarily under the CARES Act Provider Relief Fund ("PRF") and the ARPA Coronavirus State and Local Fiscal Relief Fund ("SLFRF") targeted to providing economic relief and stimulus to combat health and economic impacts of the COVID-19 pandemic.
Operating Expenses
Service expense. Service expense for our NEMT segment includes purchased transportation, operational payroll and other operational related costs. Purchased transportation includes the amounts we pay to third-party transportation providers and is typically dependent upon service volume. Operational payroll predominately includes our contact center operations, customer advocacy and transportation network team. Other operating expenses primarily include operational overhead costs, and operating facilities and related charges. Service expense for our PCS segment includes payroll and other operational related costs for our caregivers to provide in-home care. Service expense for our RPM segment primarily consists of salaries of employees in our contact centers, connectivity costs and occupancy costs.
General and administrative expense. General and administrative expense for all segments consists principally of salaries for administrative employees that support the vesting period. The pricing models require various highly judgmental assumptionsoperations, occupancy costs, marketing expenditures, insurance, and professional fees.
Depreciation and amortization expense. Depreciation within this caption includes infrastructure items such as computer hardware and software, office equipment, monitoring and vitals equipment, buildings, and leasehold improvements. Amortization expense is generated primarily from amortization of our finite intangible assets, including volatilitypayor networks, trade names and expected option term. If anydeveloped technology.
Impairment of the assumptions used in the models change significantly, stock-based compensation expense may differ materially in the future fromgoodwill. Based on our qualitative goodwill assessment for each reporting unit, we determined that recorded in the current period.
qualitative factors existed which required us to test our goodwill for impairment. As a result of the adoptionimpairment evaluation, we determined that the goodwill within our PCS and RPM reporting units was impaired.
Other Expenses (Income)
Interest expense, net. Interest expense consists principally of Accounting Standards Update (“ASU”) No. 2016-09, Compensation – Stock Compensation (Topic 718): Improvementsinterest accrued during the period ended December 31, 2023 on the Company’s borrowings outstanding under the Credit Facility and Senior Unsecured Notes, and amortization of deferred financing fees. Refer to Employee Share-Based Payment Accounting (“ASU 2016-09”), effective January 1, 2017, we no longer record stock-based compensation expensethe “Liquidity and Capital Resources” section below for further discussion of these borrowings.
Equity in net income (loss) of investee, net of estimated forfeiturestax. Equity in earnings of equity method investee consists of our proportionate share of equity earnings or losses from our Matrix equity investment held at our Corporate and Other segment, presented net of related taxes, as well as the earnings of our insurance captive held at our NEMT segment, presented net of taxes.
Income tax effects of awards are treated as discrete items in the period in which tax windfalls or shortfalls occur.(provision) benefit. The adoption also impacted the presentation of cash flows and the computation of earnings per share.
61
We operate four reportable business segments: NEMT, PCS, RPM, and Corporate and Other. Effective January 1, 2022, the Company completed its segment reorganization which resulted in the addition of a Corporate and Other segment that includes the costs associated with the Company's corporate operations. The operating results of the two principal business segmentsCorporate and Other segment include revenueactivities related to executive, accounting, finance, internal audit, tax, legal and expenses incurred by thecertain strategic and corporate development functions for each segment, as well as an allocation of direct expenses incurred by our corporate division on behalf of the segment, which primarily relate to insurance and stock-based compensation allocations. Indirect expenses, including unallocated corporate functions and expenses, such as executive, finance, accounting, human resources, information technology and legal, as well as the results of our captive insurance company (the “Captive”) and elimination entries recorded in consolidation are reflected in “Corporate and Other”.
The NEMT segment provides non-emergency medical transportation services throughout the “Discontinued operations, net of tax” section set forth below. For periods subsequentcountry. The PCS segment provides non-medical personal care and home health services. The RPM segment provides remote patient monitoring solutions. The Corporate and Other segment includes activities related to the transaction,Company's corporate operations as well as the results of an investment in innovation that the Matrix Investment are separately discussed inCompany completed during the “Equity in net lossfirst quarter of investees” section set forth below. Additionally, effective November 1, 2015, we completed the sale of our Human Services segment.2023. The Human Services segmentoperating results of the NEMT, PCS and RPM segments include revenue and expenses generated and incurred by the segment, and the Corporate and Other segment includes expenses incurred in relation to the Corporate operations are separatelyof the Company as well as certain revenue and expenses associated with the investment in innovation discussed above.
See Note 4, Segments, in the “Discontinued operations, net of tax” section set forth below.our accompanying consolidated financial statements for further information on our segments.
62
Year ended December 31, 20172023 compared to year ended December 31, 20162022
Consolidated results.The following table sets forth results of operations and the percentage of consolidated total revenuesservice revenue, net, represented by items in our consolidated statements of incomeoperations for 20172023 and 20162022 (in thousands):
| Year Ended December 31, | |||||||||||||||||||||||
| 2023 | 2022 | ||||||||||||||||||||||
| Amount | % of Service Revenue | Amount | % of Service Revenue | ||||||||||||||||||||
| Service revenue, net | $ | 2,751,170 | 100.0% | $ | 2,504,393 | 100.0% | |||||||||||||||||
| Grant income | 5,037 | 0.2% | 7,351 | 0.3% | |||||||||||||||||||
| Operating expenses: | |||||||||||||||||||||||
| Service expense | 2,304,218 | 83.8% | 2,032,074 | 81.1% | |||||||||||||||||||
| General and administrative expense | 304,564 | 11.1% | 322,171 | 12.9% | |||||||||||||||||||
| Depreciation and amortization | 104,271 | 3.8% | 100,415 | 4.0% | |||||||||||||||||||
| Impairment of goodwill | 183,100 | 6.7% | — | —% | |||||||||||||||||||
| Total operating expenses | 2,896,153 | 105.3% | 2,454,660 | 98.0% | |||||||||||||||||||
| Operating income (loss) | (139,946) | (5.1)% | 57,084 | 2.3% | |||||||||||||||||||
| Interest expense, net | 69,120 | 2.5% | 61,961 | 2.5% | |||||||||||||||||||
| Loss before income taxes and equity method investment | (209,066) | (7.6)% | (4,877) | (0.2)% | |||||||||||||||||||
| Income tax benefit | 4,319 | 0.2% | 3,035 | 0.1% | |||||||||||||||||||
| Equity in net income (loss) of investee, net of tax | 287 | —% | (29,964) | (1.2)% | |||||||||||||||||||
| Net loss | $ | (204,460) | (7.4)% | $ | (31,806) | (1.3)% | |||||||||||||||||
| Year ended December 31, | |||||||||||
| 2017 | 2016 | ||||||||||
| $ | Percentage of Revenue | $ | Percentage of Revenue | ||||||||
| Service revenue, net | 1,623,882 | 100.0 | % | 1,578,245 | 100.0 | % | |||||
| Operating expenses: | |||||||||||
| Service expense | 1,489,044 | 91.7 | % | 1,452,110 | 92.0 | % | |||||
| General and administrative expense | 72,336 | 4.5 | % | 69,911 | 4.4 | % | |||||
| Asset impairment charge | — | — | % | 21,003 | 1.3 | % | |||||
| Depreciation and amortization | 26,469 | 1.6 | % | 26,604 | 1.7 | % | |||||
| Total operating expenses | 1,587,849 | 97.8 | % | 1,569,628 | 99.5 | % | |||||
| Operating income | 36,033 | 2.2 | % | 8,617 | 0.5 | % | |||||
| Non-operating expense: | |||||||||||
| Interest expense, net | 1,278 | 0.1 | % | 1,583 | 0.1 | % | |||||
| Other income | (5,363 | ) | (0.3 | )% | — | — | % | ||||
| Equity in net (gain) loss of investees | (12,054 | ) | (0.7 | )% | 10,287 | 0.7 | % | ||||
| Gain on sale of equity investment | (12,377 | ) | (0.8 | )% | — | — | % | ||||
| Loss (gain) on foreign currency transactions | 345 | — | % | (1,375 | ) | (0.1 | )% | ||||
| Income (loss) from continuing operations before income taxes | 64,204 | 4.0 | % | (1,878 | ) | (0.1 | )% | ||||
| Provision for income taxes | 4,401 | 0.3 | % | 17,036 | 1.1 | % | |||||
| Income (loss) from continuing operations | 59,803 | 3.7 | % | (18,914 | ) | (1.2 | )% | ||||
| Discontinued operations, net of tax | (5,983 | ) | (0.4 | )% | 108,760 | 6.9 | % | ||||
| Net income | 53,820 | 3.3 | % | 89,846 | 5.7 | % | |||||
| Net (gain) loss attributable to noncontrolling interest | (451 | ) | — | % | 2,082 | 0.1 | % | ||||
| Net income attributable to Providence | 53,369 | 3.3 | % | 91,928 | 5.8 | % | |||||
Service revenue, net. Consolidated service revenue, net, for 20172023 increased $45.6$246.8 million, or 2.9%9.9%, compared to 2016. Revenue2022. Service revenue, net, increased by $183.0 million for 2017our NEMT segment, increased by $47.9 million for our PCS segment, and increased by $9.7 million for our RPM segment. See our Results of Operations - Segments, for further discussion of the revenue drivers at each respective segment.
Grant income. The Company recognized income of approximately $5.0 million during 2023 compared to 2016 includes$7.4 million during 2022 related to government grant distributions received, primarily under the CARES Act PRF and the ARPA SLFRF. These government grants are targeted to providing economic relief and stimulus to combat health and economic impacts of the COVID-19 pandemic. These funds were received by our PCS segment and are available to eligible providers who have healthcare-related expenses and lost revenues attributable to COVID-19.
Service expense. Service expense components are shown below (in thousands):
| Year Ended December 31, | |||||||||||||||||||||||
| 2023 | 2022 | ||||||||||||||||||||||
| Amount | % of Service Revenue | Amount | % of Service Revenue | ||||||||||||||||||||
| Purchased services | $ | 1,456,796 | 53.0% | $ | 1,267,006 | 50.6% | |||||||||||||||||
| Payroll and related costs | 772,629 | 28.1% | 706,216 | 28.2% | |||||||||||||||||||
| Other operating expenses | 74,793 | 2.7% | 58,852 | 2.3% | |||||||||||||||||||
| Total service expense | $ | 2,304,218 | 83.8% | $ | 2,032,074 | 81.1% | |||||||||||||||||
Service expense for 2023 increased $272.1 million, or 13.4%, compared to 2022 primarily due to higher purchased services for our NEMT segment of $189.8 million driven by an increase in revenuetransportation costs to support higher trip volumes
63
that occurred in 2023. Payroll and related costs across all segments increased by $66.4 million, primarily related to increased labor costs paid to our caregivers and contact center employees and additional hours of NET Services of $84.5 million, which was partially offset by a decrease in revenue of WD Services of $38.7 million. Excluding the effects of changes in currency exchange rates, consolidated service revenue increased 3.4% in 2017 compared to 2016.provided during 2023.
Depreciation and amortization. Depreciation and amortization for 2023 increased $3.9 million, or 3.8%, compared to 2022 primarily as a result $2.2 million of depreciation and amortization expense related to property, equipment and intangible assets brought on under the Guardian Medical Monitoring ("GMM") acquisition in May 2022.
Impairment of goodwill. Impairment of goodwill for 2023 was $183.1 million and is a result of goodwill impairments that were recorded at our PCS and RPM reporting units during the second quarter of 2023. See Note 9, Goodwill and Intangible Assets.
Interest expense, net. Interest expense, net, for 2023 increased $7.2 million, or 11.6%, compared to 2022. During 2023, we incurred interest of $32.3 million and $26.5 million related to the Senior Notes due 2025 and 2029, respectively. The remainder of the interest expense during 2023 is related to interest and fees incurred related to borrowings on the settlement.credit facility, which drove the increase during 2023 due to increased borrowing activity on the credit facility as compared to 2022. Interest expense is recorded at our Corporate and Other segment.
Equity in net (gain) lossincome (loss) of investees.investee, net of tax. Our equity in net (gain) lossincome of investeesinvestee, net of tax for 20172023 of $12.1$0.3 million includes an equity in net loss for Mission Providence of $1.4 million through the sale date on September 29, 2017, and an equity in net gain for Matrix of $13.4 million. Ourour equity in net loss of investeesinvestee, net of tax for 20162022 of $10.3$30.0 million includes an equity in net loss for Mission Providence of $8.5 million and Matrix of $1.8 million. We began reporting Matrix as an equity investment effective October 19, 2016, upon the completion of the Matrix Transaction, and we record our ownership percentage of Matrix’s profit or loss in net loss or gain of investees. Included in Matrix’s 2017 full standalone net income of $26.7 million (which is not consolidated with Providence’s) are depreciation and amortization of $33.5 million, interest expense of $14.8 million, transaction bonuses and other transaction related costs of $3.5 million, equity compensation of $2.6 million, management fees paid to Matrix’s shareholders of $2.3 million, merger and acquisition diligence related costs of $0.7 million and income tax benefit of $29.6 million. Matrix’s significant income tax benefit in 2017 primarily related to the re-measurement of deferred tax liabilities arising from a lower U.S. corporate tax rate aswas a result of our proportional share of the Tax Reform Act. Included in Matrix’s 2016 full standalone net income or loss of $4.2Matrix and our investment in a captive insurance program. The loss during 2022 was the result of our share of an asset impairment that occurred at Matrix for $82.2 million (which is not consolidatedduring 2022 with Providence’s) are depreciation and amortization of $6.4 million, interest expense of $2.9 million, transaction bonuses and other transaction related costs of $6.4 million, equity compensation of $0.4 million, management fees paid to Matrix’s shareholders of $0.4 million and incomeno comparable asset impairment during 2023.
Income tax benefit of $2.8 million.
Year Ended December 31, 2022 compared to year ended December 31, 2021
For a comparison of our results of operations see “Part II, Item 7. Management’s Discussion and Analysis of Financial Condition and Results of Operations” of our Form 10-K for the Tax Reform Act. fiscal year ended December 31, 2022, filed with the SEC on March 7, 2023.
64
Results of Operations - Segments
The tax provision includes a benefit of $16.0 million relatedfollowing tables set forth certain financial information attributable to the enactmentCompany’s business segments for 2023 and 2022:
NEMT Segment
(in thousands, except for Revenue per member per month, Revenue per trip, and Service expense per trip):
| Year Ended December 31, | |||||||||||||||||||||||
| 2023 | 2022 | ||||||||||||||||||||||
| Amount | % of Segment Service Revenue | Amount | % of Segment Service Revenue | ||||||||||||||||||||
| Operating Results | |||||||||||||||||||||||
| Service revenue, net | $ | 1,951,447 | 100.0% | $ | 1,768,442 | 100.0% | |||||||||||||||||
| Service expense | 1,709,790 | 87.6% | 1,487,447 | 84.1% | |||||||||||||||||||
| General and administrative expense | 115,355 | 5.9% | 146,935 | 8.3% | |||||||||||||||||||
| Depreciation and amortization | 27,409 | 1.4% | 28,709 | 1.6% | |||||||||||||||||||
| Operating income | $ | 98,893 | 5.1% | $ | 105,351 | 6.0% | |||||||||||||||||
Business Metrics(1) | |||||||||||||||||||||||
| Total paid trips | 34,559 | 30,795 | |||||||||||||||||||||
| Average monthly members | 33,648 | 34,203 | |||||||||||||||||||||
| Revenue per member per month | $ | 4.83 | $ | 4.31 | |||||||||||||||||||
| Revenue per trip | $ | 56.47 | $ | 57.43 | |||||||||||||||||||
| Service expense per trip | $ | 49.47 | $ | 48.30 | |||||||||||||||||||
| Utilization | 8.6 | % | 7.5 | % | |||||||||||||||||||
(1) These metrics are key performance indicators that Management uses to evaluate our performance. Trends established in these metrics can be used to evaluate current operating results, identify trends affecting our business, determine the allocation of resources and understand the Tax Reform Actunderlying drivers of costs and revenue for our business. We believe these metrics are useful to investors in evaluating and understanding our business but should not be used solely in assessing the Company’s performance. These key performance indicators should not be considered superior to, as a substitute for or as an alternative to, and should be considered in conjunction with, the GAAP financial measures presented herein to fully evaluate and understand the business as a whole.
The NEMT segment is the largest manager of non-emergency medical transportation programs for state governments and MCOs in the U.S.
Service revenue, net. Service revenue, net, increased by $183.0 million, or 10.3%, during 2023 as compared to 2022. This increase is primarily attributable to a 12.1% increase in revenue per member per month, which was driven by a 12.2% increase in trip volume. These two factors correlated due to contract repricing and the fourth quarterpartial pass-through of 2017, consisting of a net tax benefit of $19.4 million fromcosts associated with our reconciliation, risk corridor or profit rebate contracts (which are considered shared-risk contracts due to the re-measurement of deferred tax liabilities from the lower U.S. corporate tax rate,reconciliation provisions). This increase to revenue was partially offset by additional taxa 1.6% decrease in average monthly membership primarily as a result of Medicaid redetermination.
The change in revenue is impacted by both the change in average monthly members as well as the rate received per member. The change in average monthly members is correlated to the change in revenue because a majority of our contracts are capitated, and we receive monthly payments on a per member per month basis in return for full or shared risk of transportation volumes. Declines in membership over the periods presented were anticipated and primarily related to Medicaid redetermination efforts, along with certain contract losses. While membership decreased, revenue increased due to increases in the average rate received per member, which increases in line with increases in utilization or trip volume in our shared risk
65
contracts. As most of our capitated contracts have been restructured to a shared risk format, revenue increased despite the decline in membership. Trip volume increases also positively affected revenue for fee-for-service contracts due to a larger number of services performed.
Service expense. Service expense components for the NEMT segment are shown below (in thousands):
| Year Ended December 31, | |||||||||||||||||||||||
| 2023 | 2022 | ||||||||||||||||||||||
| Amount | % of Segment Revenue | Amount | % of Segment Revenue | ||||||||||||||||||||
| Purchased services | $ | 1,456,796 | 74.7 | % | $ | 1,267,006 | 71.6 | % | |||||||||||||||
| Payroll and related costs | 203,199 | 10.3 | % | 180,382 | 10.2 | % | |||||||||||||||||
| Other service expenses | 49,795 | 2.6 | % | 40,059 | 2.3 | % | |||||||||||||||||
| Total service expense | $ | 1,709,790 | 87.6 | % | $ | 1,487,447 | 84.1 | % | |||||||||||||||
Service expense for our NEMT segment primarily consists of $3.4transportation costs paid to third party transportation providers, salaries of employees within our contact centers and operations centers, and occupancy costs. Service expense increased by $222.3 million, or 14.9%, for the year ended December 31, 2023 as compared to 2022, primarily related to higher purchased services of $189.8 million, or 15.0%, related to an increase in transportation costs due to an increase in trip volume of 12.2% for 2023 as compared to 2022. Purchased service expense per trip increased by 2.5% due to increased wages for our equity in net gaintransportation providers and payroll and related costs and other service expenses increased by 2.2% due to increased wages for our contact center employees, as compared to 2022.
General and administrative expense. General and administrative expense primarily consists of Matrixsalaries for administrative employees that support the operations of the NEMT segment, occupancy costs, marketing expenditures, insurance, and professional fees. General and administrative expense decreased by $31.6 million, or 21.5%, for the year ended December 31, 2023, as compared to 2022, primarily as a result of Matrix's re-measurementvarious cost savings initiatives which resulted in a decrease of deferred tax liabilities. In addition, the Company incurred tax expense of $3.6$6.4 million related to the HoldCo LTIP, for whichpersonnel expense, was recorded for financial reporting purposes based upon fair value of the award at the grant date, but no shares will be issued due to the market condition of the award not being satisfied. This tax expense was the result of the adoption of ASU 2016-09, which subjects our tax rate to quarterly volatility from the effects of stock award exercises and vesting activities, including the adverse impact on our income tax provision for awards which result in a tax deduction less than the amount recorded for financial reporting purposes.
| Year Ended December 31, | |||||||||||
| 2017 | 2016 | ||||||||||
| $ | Percentage of Revenue | $ | Percentage of Revenue | ||||||||
| Service revenue, net | 1,318,220 | 100.0 | % | 1,233,720 | 100.0 | % | |||||
| Service expense | 1,227,426 | 93.1 | % | 1,132,857 | 91.8 | % | |||||
| General and administrative expense | 11,779 | 0.9 | % | 11,406 | 0.9 | % | |||||
| Depreciation and amortization | 13,275 | 1.0 | % | 12,375 | 1.0 | % | |||||
| Operating income | 65,740 | 5.0 | % | 77,082 | 6.2 | % | |||||
| Year Ended December 31, | |||||||||||
| 2017 | 2016 | ||||||||||
| $ | Percentage of Revenue | $ | Percentage of Revenue | ||||||||
| Purchased services | 1,009,518 | 76.6 | % | 927,321 | 75.2 | % | |||||
| Payroll and related costs | 165,666 | 12.6 | % | 162,000 | 13.1 | % | |||||
| Other operating expenses | 51,720 | 3.9 | % | 42,478 | 3.4 | % | |||||
| Stock-based compensation | 522 | — | % | 1,058 | 0.1 | % | |||||
| Total service expense | 1,227,426 | 93.1 | % | 1,132,857 | 91.8 | % | |||||
Depreciation and amortization expense. Depreciation and amortization expense decreased by $1.3 million, or 4.5%, for the transition of the chief executive officer position during 2017. Other operating expenses increased for 2017year ended December 31, 2023, as compared to 2016the year ended December 31, 2022, as a result of certain intangible assets being fully amortized during the period.
66
PCS Segment
(in thousands, except Service revenue per hour and Service expense per hour):
| Year Ended December 31, | |||||||||||||||||||||||
| 2023 | 2022 | ||||||||||||||||||||||
| Amount | % of Segment Service Revenue | Amount | % of Segment Service Revenue | ||||||||||||||||||||
| Operating Results | |||||||||||||||||||||||
| Service revenue, net | $ | 715,615 | 100.0% | $ | 667,674 | 100.0% | |||||||||||||||||
| Grant income | 5,037 | 0.7% | 7,351 | 1.1% | |||||||||||||||||||
| Service expense | 561,919 | 78.5% | 520,065 | 77.9% | |||||||||||||||||||
| General and administrative expense | 86,767 | 12.1% | 91,365 | 13.7% | |||||||||||||||||||
| Depreciation and amortization | 51,402 | 7.2% | 51,025 | 7.6% | |||||||||||||||||||
| Impairment of goodwill | 137,331 | 19.2% | — | —% | |||||||||||||||||||
| Operating income (loss) | $ | (116,767) | (16.3)% | $ | 12,570 | 1.9% | |||||||||||||||||
Business Metrics(1) | |||||||||||||||||||||||
| Total hours | 27,826 | 26,918 | |||||||||||||||||||||
| Service revenue per hour | $ | 25.72 | $ | 24.80 | |||||||||||||||||||
| Service expense per hour | $ | 20.19 | $ | 19.32 | |||||||||||||||||||
(1) These metrics are key performance indicators that Management uses to evaluate our performance. Trends established in these metrics can be used to evaluate current operating results, identify trends affecting our business, determine the allocation of resources and understand the underlying drivers of costs and revenue for our business. We believe these metrics are useful to investors in evaluating and understanding our business but should not be used solely in assessing the Company’s performance. These key performance indicators should not be considered superior to, as a substitute for or as an alternative to, and should be considered in conjunction with, the GAAP financial measures presented herein to fully evaluate and understand the business as a whole.
Our PCS segment’s services include placements of non-medical personal care assistants and home health aides and nurses primarily attributable to an incremental $4.1 millionMedicaid patient populations in need of value enhancementcare monitoring and related costs incurred for external resources usedassistance performing daily living activities in the designhome setting, including senior citizens and implementationdisabled adults.
Service revenue, net. PCS contracts are generally structured as fee-for-service contracts, with revenue driven by the number of NET Services member experience and value enhancement initiativeshours worked by our personal care providers. Service revenue, net, increased by $47.9 million or 7.2% for the year ended December 31, 2023 compared to 2022, primarily due to 3.4% higher hours worked by our personal care providers in 2017,2023 as compared to 2022, as well as 3.7% higher rates per hour during the same period.
Grant income. During the years ended December 31, 2023, and 2022, the Company recognized income for government grant distributions received of $5.0 million and $7.4 million, respectively, primarily from the CARES Act PRF and the ARPA SLFRF. These government grants are targeted to providing economic relief and stimulus to combat health and economic impacts of the COVID-19 pandemic. These funds were received by our PCS segment and are available to eligible providers who have healthcare-related expenses and lost revenues attributable to COVID-19.
67
Service expense. Service expense components for the PCS segment are shown below (in thousands):
| Year Ended December 31, | |||||||||||||||||||||||
| 2023 | 2022 | ||||||||||||||||||||||
| Amount | % of Segment Service Revenue | Amount | % of Segment Service Revenue | ||||||||||||||||||||
| Payroll and related costs | $ | 555,606 | 77.6 | % | $ | 513,748 | 76.9 | % | |||||||||||||||
| Other service expenses | 6,313 | 0.9 | % | 6,317 | 1.0 | % | |||||||||||||||||
| Total service expense | $ | 561,919 | 78.5 | % | $ | 520,065 | 77.9 | % | |||||||||||||||
Service expense for our PCS segment primarily consists of salaries for our employees that provide personal care services and it typically trends with the number of hours worked and total cost per hour of service. Service expense for the year ended December 31, 2023 increased software and hardware maintenance costs associated with increased use of information technology.
| Year Ended December 31, | |||||||||||
| 2017 | 2016 | ||||||||||
| $ | Percentage of Revenue | $ | Percentage of Revenue | ||||||||
| Service revenue, net | 305,662 | 100.0 | % | 344,403 | 100.0 | % | |||||
| Service expense | 265,417 | 86.8 | % | 320,147 | 93.0 | % | |||||
| General and administrative expense | 25,438 | 8.3 | % | 30,300 | 8.8 | % | |||||
| Asset impairment charge | — | — | % | 19,588 | 5.7 | % | |||||
| Depreciation and amortization | 12,851 | 4.2 | % | 13,824 | 4.0 | % | |||||
| Operating income (loss) | 1,956 | 0.6 | % | (39,456 | ) | (11.5 | )% | ||||
| Year Ended December 31, | |||||||||||
| 2017 | 2016 | ||||||||||
| $ | Percentage of Revenue | $ | Percentage of Revenue | ||||||||
| Payroll and related costs | 177,195 | 58.0 | % | 210,293 | 61.1 | % | |||||
| Purchased services | 49,491 | 16.2 | % | 65,363 | 19.0 | % | |||||
| Other operating expenses | 38,675 | 12.7 | % | 44,502 | 12.9 | % | |||||
| Stock-based compensation | 56 | — | % | (11 | ) | — | % | ||||
| Total service expense | 265,417 | 86.8 | % | 320,147 | 93.0 | % | |||||
General and administrative expense. General and administrative expense in 2017primarily consists of salaries for administrative employees that support the operations of the PCS segment, occupancy costs, marketing expenditures, insurance, and professional fees. General and administrative expense decreased $4.9by $4.6 million, or 5.0%, for the year ended December 31, 2023 as compared to 2016. The decrease was due to office closures associated with the restructuring of the UK operations, as well as lower rent for certain offices. Additionally, $2.0 million of the decrease2022, primarily related to the impact of acquisitionlower insurance-related expense and lower legal fees during 2023 along with lower integration related contingencies that were favorably resolved in 2017, resulting in a benefit to general and administrative expense.expenses during 2023.
Depreciation and amortization expense.Depreciation and amortization expense remained consistent for 2017 decreased $1.0the years ended December 31, 2023 and 2022 with an increase of $0.4 million, or 0.7%, for 2023 as compared to 2016,2022.
Impairment of goodwill. As a result of our annual goodwill assessment, we determined that the goodwill within our PCS reporting unit was impaired which resulted in an impairment of goodwill charge of $137.3 million during the second quarter of 2023.
RPM Segment
(in thousands, except Revenue per member per month and Service expense per member per month):
| Year Ended December 31, | |||||||||||||||||||||||
| 2023 | 2022 | ||||||||||||||||||||||
| Amount | % of Segment Service Revenue | Amount | % of Segment Service Revenue | ||||||||||||||||||||
| Operating Results | |||||||||||||||||||||||
| Service revenue, net | $ | 77,941 | 100.0% | $ | 68,277 | 100.0% | |||||||||||||||||
| Service expense | 27,025 | 34.7% | 24,562 | 36.0% | |||||||||||||||||||
| General and administrative expense | 22,971 | 29.5% | 23,156 | 33.9% | |||||||||||||||||||
| Depreciation and amortization | 24,536 | 31.5% | 19,854 | 29.1% | |||||||||||||||||||
| Impairment of goodwill | 45,769 | 58.7% | — | —% | |||||||||||||||||||
| Operating income (loss) | $ | (42,360) | (54.3)% | $ | 705 | 1.0% | |||||||||||||||||
Business Metrics(1) | |||||||||||||||||||||||
| Average monthly members | 244 | 210 | |||||||||||||||||||||
| Revenue per member per month | $ | 26.62 | $ | 27.09 | |||||||||||||||||||
| Service expense per member per month | $ | 9.23 | $ | 9.75 | |||||||||||||||||||
68
(1) These metrics are key performance indicators that Management uses to evaluate our performance. Trends established in these metrics can be used to evaluate current operating results, identify trends affecting our business, determine the allocation of resources and understand the underlying drivers of costs and revenue for our business. We believe these metrics are useful to investors in evaluating and understanding our business but should not be used solely in assessing the Company’s performance. These key performance indicators should not be considered superior to, as a substitute for or as an alternative to, and should be considered in conjunction with, the GAAP financial measures presented herein to fully evaluate and understand the business as a whole.
Our RPM segment is a provider of remote patient monitoring solutions and manages a comprehensive suite of services, including personal emergency response systems, vitals monitoring and data-driven patient engagement solutions.
Service revenue, net. RPM contracts are generally structured as a fixed fee per enrolled member per month and therefore, revenue is generally driven by the number of enrolled members. Service revenue, net, increased by $9.7 million, or 14.2%, for the year ended December 31, 2023 as compared to 2022, primarily duerelated to incremental revenue of $7.5 million from the acquisition of GMM that occurred in May 2022, which also contributed to the asset impairment charges incurred during16.2% increase in average monthly members from 2022 to 2023.
Service expense. Service expense components for the fourth quarter of 2016, which decreased the value of our intangible assets and certain property and equipment.
| Year Ended December 31, | |||||||||||||||||||||||
| 2023 | 2022 | ||||||||||||||||||||||
| Amount | % of Segment Service Revenue | Amount | % of Segment Service Revenue | ||||||||||||||||||||
| Payroll and related costs | $ | 13,539 | 17.4 | % | $ | 12,086 | 17.7 | % | |||||||||||||||
| Other service expenses | 13,486 | 17.3 | % | 12,476 | 18.3 | % | |||||||||||||||||
| Total service expense | $ | 27,025 | 34.7 | % | $ | 24,562 | 36.0 | % | |||||||||||||||
| Year Ended December 31, | |||||
| 2017 | 2016 | ||||
| $ | $ | ||||
| Service revenue, net | — | 122 | |||
| Service expense (a) | (3,799 | ) | (894 | ) | |
| General and administrative expense | 35,119 | 28,205 | |||
| Asset impairment charge | — | 1,415 | |||
| Depreciation and amortization | 343 | 405 | |||
| Operating loss | (31,663 | ) | (29,009 | ) | |
General and administrative expense”, and decreased asset impairment charges, as $1.4 million was recorded in 2016 in relation to the sale of a building.
expense.General and administrative expense includes stock-based compensationprimarily consists of salaries for administrative employees that indirectly support the HoldCo LTIPoperations of $4.7 millionthe RPM segment, occupancy costs, marketing expenditures, insurance, and $3.3 million for 2017 and 2016, respectively. No shares will be distributed under the HoldCo LTIP as the volume weighted average of Providence’s stock price over the 90-day trading period ended on December 31, 2017 was less than $56.79. As such, as of December 31, 2017, we accelerated all remaining unrecognized compensation expense for the Holdco LTIP as there was no further requisite service period associated with the award resulting in an acceleration of expense of $1.1 million.professional fees. General and administrative expense also includes $0.4 million and $1.6 millionremained relatively consistent for 2017 and 2016, respectively, related to a shareholder lawsuit.
Depreciation and administrative expense”.
| Year ended December 31, | |||||||||||
| 2016 | 2015 | ||||||||||
| $ | Percentage of Revenue | $ | Percentage of Revenue | ||||||||
| Service revenue, net | 1,578,245 | 100.0 | % | 1,478,010 | 100.0 | % | |||||
| Operating expenses: | |||||||||||
| Service expense | 1,452,110 | 92.0 | % | 1,381,154 | 93.4 | % | |||||
| General and administrative expense | 69,911 | 4.4 | % | 70,986 | 4.8 | % | |||||
| Asset impairment charge | 21,003 | 1.3 | % | — | — | % | |||||
| Depreciation and amortization | 26,604 | 1.7 | % | 23,998 | 1.6 | % | |||||
| Total operating expenses | 1,569,628 | 99.5 | % | 1,476,138 | 99.9 | % | |||||
| Operating income | 8,617 | 0.5 | % | 1,872 | 0.1 | % | |||||
| Non-operating expense: | |||||||||||
| Interest expense, net | 1,583 | 0.1 | % | 1,853 | 0.1 | % | |||||
| Equity in net loss of investees | 10,287 | 0.7 | % | 10,970 | 0.7 | % | |||||
| Gain on foreign currency transactions | (1,375 | ) | (0.1 | )% | (857 | ) | (0.1 | )% | |||
| Income (loss) from continuing operations before income taxes | (1,878 | ) | (0.1 | )% | (10,094 | ) | (0.7 | )% | |||
| Provision for income taxes | 17,036 | 1.1 | % | 14,583 | 1.0 | % | |||||
| Income (loss) from continuing operations | (18,914 | ) | (1.2 | )% | (24,677 | ) | (1.7 | )% | |||
| Discontinued operations, net of tax | 108,760 | 6.9 | % | 107,871 | 7.3 | % | |||||
| Net income | 89,846 | 5.7 | % | 83,194 | 5.6 | % | |||||
| Net loss attributable to noncontrolling interest | 2,082 | 0.1 | % | 502 | — | % | |||||
| Net income attributable to Providence | 91,928 | 5.8 | % | 83,696 | 5.7 | % | |||||
Impairment of $2.9 million, although WD Services’ new offender rehabilitation program incurred an operating loss in 2016 as compared to operating income in 2015. In addition, France continued to experience a significant operating loss in 2016, consistent with 2015. These changes were partially offset by an increase in the operating loss for Corporate and Other of $2.0 million, driven primarily by the asset impairment charge of $1.4 million in 2016.
| Year Ended December 31, | |||||||||||
| 2016 | 2015 | ||||||||||
| $ | Percentage of Revenue | $ | Percentage of Revenue | ||||||||
| Service revenue, net | 1,233,720 | 100.0 | % | 1,083,015 | 100.0 | % | |||||
| Service expense | 1,132,857 | 91.8 | % | 991,659 | 91.6 | % | |||||
| General and administrative expense | 11,406 | 0.9 | % | 10,704 | 1.0 | % | |||||
| Depreciation and amortization | 12,375 | 1.0 | % | 9,429 | 0.9 | % | |||||
| Operating income | 77,082 | 6.2 | % | 71,223 | 6.6 | % | |||||
| Year Ended December 31, | |||||||||||
| 2016 | 2015 | ||||||||||
| $ | Percentage of Revenue | $ | Percentage of Revenue | ||||||||
| Purchased services | 927,321 | 75.2 | % | 814,632 | 75.2 | % | |||||
| Payroll and related costs | 162,000 | 13.1 | % | 141,669 | 13.1 | % | |||||
| Other operating expenses | 42,478 | 3.4 | % | 34,634 | 3.2 | % | |||||
| Stock-based compensation | 1,058 | 0.1 | % | 724 | 0.1 | % | |||||
| Total service expense | 1,132,857 | 91.8 | % | 991,659 | 91.6 | % | |||||
| Year Ended December 31, | |||||||||||
| 2016 | 2015 | ||||||||||
| $ | Percentage of Revenue | $ | Percentage of Revenue | ||||||||
| Service revenue, net | 344,403 | 100.0 | % | 395,059 | 100.0 | % | |||||
| Service expense | 320,147 | 93.0 | % | 393,803 | 99.7 | % | |||||
| General and administrative expense | 30,300 | 8.8 | % | 29,846 | 7.6 | % | |||||
| Asset impairment charge | 19,588 | 5.7 | % | — | — | % | |||||
| Depreciation and amortization | 13,824 | 4.0 | % | 13,776 | 3.5 | % | |||||
| Operating income (loss) | (39,456 | ) | (11.5 | )% | (42,366 | ) | (10.7 | )% | |||
| Year Ended December 31, | |||||||||||
| 2016 | 2015 | ||||||||||
| $ | Percentage of Revenue | $ | Percentage of Revenue | ||||||||
| Payroll and related costs | 210,293 | 61.1 | % | 249,130 | 63.1 | % | |||||
| Purchased services | 65,363 | 19.0 | % | 78,498 | 19.9 | % | |||||
| Other operating expenses | 44,502 | 12.9 | % | 45,418 | 11.5 | % | |||||
| Stock-based compensation | (11 | ) | — | % | 20,757 | 5.3 | % | ||||
| Total service expense | 320,147 | 93.0 | % | 393,803 | 99.7 | % | |||||
69
Corporate and Other Segment
(in the UK. Partially offsetting these decreasesthousands)
| Year Ended December 31, | |||||||||||
| 2023 | 2022 | ||||||||||
| Service revenue, net | $ | 6,167 | $ | — | |||||||
| Service expense | 5,484 | — | |||||||||
| General and administrative expense | 79,471 | 60,715 | |||||||||
| Depreciation and amortization | 924 | 827 | |||||||||
| Operating loss | $ | (79,712) | $ | (61,542) | |||||||
Our Corporate and Other segment was increased payroll and related costs associated with a significant new offender rehabilitation program that began in 2015 and higher payroll expenses in France associated with new programs implemented in 2015 and 2016. As referenced above, both the segment’s new offender rehabilitation program and operations in France had significant operating losses in 2016. In addition, $8.5 million in termination benefits related to three redundancy plans contributed to losses in 2016. Purchased services decreased in 2016 compared to 2015 primarilyestablished beginning January 1, 2022 as a result of a declinesegment reorganization completed by the Company. The Corporate and Other segment includes the Company's executive, accounting, finance, internal audit, tax, legal, public reporting, and corporate development functions. This segment also includes the results of our equity investment in client referrals under our primary employability programMatrix and the operating results of investments in the UK which required less use of outsourced services. Stock-based compensation decreased $20.8 million in 2016 as compared to 2015 primarily due to expenses totaling $16.1 millioninnovation related to data analytics products and solutions, which contributes to our strategic investment in growth.
Service revenue, net and Service expense: At the settlementend of outstanding awards in the fourthfirst quarter of 20152023, we made an investment in relation to the separation of two executives, who were also sellers of Ingeus to Providence, as further described in Note 13, Stock-Based Compensation and Similar Arrangements¸innovation related to our consolidated financial statements.data analytics capabilities within our Corporate and Other segment, which contributes to service revenue, net and service expense.
Depreciation and amortization expense. Depreciation and amortization expense for 2016 was flat compared to 2015.
amortization: Our Corporate and Other includes the headcount and professional servicesegment holds costs incurred atrelated to strategy and stewardship of the Providence corporate level, our captive insurance company,other operating segments. These expenses are primarily general and elimination entriesadministrative expenses, with a small amount related to account for inter-segment transactions. Corporatedepreciation. The general and Other financial results are as follows for 2016 and 2015 (in thousands):
| Year Ended December 31, | |||||
| 2016 | 2015 | ||||
| $ | $ | ||||
| Service revenue, net (a) | 122 | (64 | ) | ||
| Service expense (a) | (894 | ) | (4,308 | ) | |
| General and administrative expense | 28,205 | 30,436 | |||
| Asset impairment charge | 1,415 | — | |||
| Depreciation and amortization | 405 | 793 | |||
| Operating loss | (29,009 | ) | (26,985 | ) | |
Seasonality
Our quarterlyNEMT and PCS segments' operating resultsincome and operating cash flows normally fluctuate as a result of seasonal variations in our business, principally due in part to seasonal factors, unevenlower demand for servicestransportation and the timing of new contracts, which impact the amount of revenues earned and expenses incurred. NET Services experiences fluctuations in demand during the summer and winter seasons. Due to higher demand in the summer months, lower demandin-home services during the winter months, and a primarily fixed revenue stream based on a per-member, per-month payment structure, NET Services normally experiences lower operating margins during the summer season and higherperiods with major holidays as members and patients may spend more time with family and less time alone needing outside care during those periods. While this fluctuation is noted in terms of the use of our services during these seasonal shifts, it does not have a material impact on our results of operations and therefore is not adjusted for. Our RPM segment’s operating margins during the winter. WD Services is impacted by both the timing of commencement and expiration of major contracts. Under many of WD Services’ contracts, we invest significant sums of money in personnel, leased office space, purchased or developed technology, and other costs, and generally incur these costs prior to commencing services and receiving payments. This results in significant variability in financial performanceincome and cash flows between quarters and for comparative periods. It is expected that future contracts will be structured indo not normally fluctuate as a similar fashion. However, the Company does not expect a large variability in financial performance upon the commencementresult of WD Service’s newly secured Work and Health Programme contracts as the upfront implementation investments needed for these contracts are expected to be significantly less than those associated with other large contract commencements undertakenseasonal variations in the past, such as the offender rehabilitation program in 2016. In addition, under the majority of WD Services’ contracts, the Company relies on its customers, which include government agencies, to provide referrals, for which the Company can provide services and earn revenue. The timing and magnitude of referrals can fluctuate significantly, leading to volatility in revenue.business.
Liquidity and capital resourcesCapital Resources
Short-term capital requirements consist primarily of recurring operating expenses, and new contract start-up costs including workforce restructuring costs.on new revenue contracts, interest expense on outstanding borrowings and costs associated with our strategic initiatives. We expect to meet anyour cash requirements in the next 12 months through available cash on hand, cash generated from our operating segments,operations, net of capital expenditures, and borrowing capacityborrowings under our New Credit Facility (as defined below)Facility. For information regarding our long-term capital requirements, see below under the caption "Liquidity".
Cash flow fromused in operating activities during the year ended December 31, 2023 was our primary source of cash during 2017, and included $5.4 million received from the settlement of the Haverhill Litigation. Additionally, 2017 included $15.6 million in proceeds from the sale of our equity investment in Mission Providence which is included in cash provided by investing activities.$83.0 million. Our balance of cash and cash equivalents, including restricted cash, was $95.3$2.8 million and $72.3$15.0 million at December 31, 20172023 and 2016, respectively, including $40.1 million and $21.4 million held in foreign countries,2022, respectively. The December 31, 2017 foreign cash balance includes the proceeds from the sale of Mission Providence of $15.6 million. Such cash held in foreign countries is generally used to fund foreign operations, although it may also be used to repay intercompany indebtedness existing between Providence and its foreign subsidiaries. As of March 5, 2018, the Company transferred $13.9 million from its foreign operations to its domestic operations since December 31, 2017.
We had restricted cash of $6.3$0.6 million and $14.1$0.5 million at December 31, 20172023 and 2016, respectively, primarily related to contractual obligations and activities of our captive insurance subsidiary. Given expiring policies under our captive insurance subsidiary were not renewed upon expiration in May 2017, we expect our restricted cash balances to decline over time. These restricted2022, respectively. Restricted cash amounts are not included in our balance of cash and cash equivalents. At both December 31, 2017equivalents in the consolidated balance sheets, although they are included in the cash, cash equivalents and 2016, we had no amounts outstanding under our credit facility.restricted cash balance on the accompanying consolidated statements of cash flows.
We may, from time to time, seek to access capital markets to raise equity or debt financing for various business reasons, including acquisitions. We may also raise debt financing to fund futureacquisitions, repurchases of common stock, investments in our Common Stock.business and possible refinancing activity. The timing, term, size, and pricing of any such financing will depend on investor interest and market conditions, and there can be no assurance that we will be able to obtain any such financing. Our current credit facility expiresfinancing on August 2, 2018. On November 2, 2017,terms acceptable to us at the Company’s Board approved the extension of the Company’s existing stock repurchase program, authorizing the Company to engage in a repurchase program to repurchase up to $69.6 million (the amount remaining from the $100.0 million repurchase amount authorized in 2016) in aggregate value of our Common Stock through December 31, 2018. Through December 31, 2017, the Company repurchased 180,270 shares, for $10.5 million, and $59.1 million was available under the plan to repurchase shares. During the period January 1, 2018 to March 5, 2018, the Company repurchased an additional 527,825 shares for $33.3 million, and $25.8 million was available under the plan to repurchase shares.time or at all.
70
Operating activities. Cash provided byused in operating activities was $55.0$83.0 million for 2017,2023 compared to cash used in operating activities of $10.4 million for 2022. The decrease of $72.5 million was primarily a result of a decrease in cash provided by changes in working capital of $74.2 million. The working capital changes were related to an increase in the cash paid for accounts payable and accrued expenses of $13.3$64.9 million, primarily related to timing of vendor payments during 2023 as compared to 2022. Also contributing to the decrease in working capital is a decrease in the cash received from contract receivables of $26.2 million primarily related to a build of receivables related to risk corridor, profit rebate, and reconciliation contracts. These working capital decreases were partially offset by an increase in cash due to a decrease in cash paid for contract payables of $10.5 million primarily related to repayments on previously accrued contract payable amounts made during 2023 combined with 2016. 2017lower liability reserves on risk corridor, profit rebate and 2016reconciliation contracts due to higher trip volumes during 2023. Also offsetting the working capital decreases was an increase in the change in accrued transportation costs of $6.8 million primarily related to timing of vendor payments to our transportation providers in 2023 compared to 2022.
Investing activities. Net cash flow from operationsused in investing activities was $42.3 million in 2023 compared to $111.8 million in 2022. The change in cash used in investing activities was driven by net incomea decrease in cash used for acquisitions of $53.8$78.8 million, primarily due to the Company's acquisitions of GMM and $89.8an asset acquisition in 2022.
Financing activities. Net cash provided by financing activities was $113.1 million respectively, non-cash adjustments to reconcile net incomein 2023 compared to net cash provided by operatingfinancing activities of negative $11.1 million and negative $32.9 million, respectively, and changes in working capital of $12.3 million and negative $15.2 million, respectively.
Obligations and 2015 cash flow from operations was driven by net income of $89.8 million and $83.2 million, respectively, non-cash adjustments to reconcile net income to net cash provided by operating activities of negative $32.9 million and negative $1.2 million, respectively, and changes in working capital of negative $15.2 million and negative $65.9 million, respectively. The change in adjustments to reconcile net income to net cash provided by operating activities was due primarily tocommitments
Senior Unsecured Notes. On November 4, 2020, the impact of the disposition of HA Services in 2016 and Human Services in 2015, as well as, significant stock-based compensation in 2015 and an asset impairment charge in 2016. The change in working capital is primarily driven by the following:
The Notes are senior unsecured obligations and rank senior in right of payment to all of the Company's future subordinated indebtedness, rank equally in right of payment with all of the Company's existing senior indebtedness, are effectively subordinated to any of the Company's existing and future secured indebtedness, including indebtedness under the New Credit Facility, may be irrevocably reduced or terminated by usto the extent of the value of the assets securing such indebtedness, and are structurally subordinated to all of the existing and future liabilities (including trade payables) of each of the Company’s non-guarantor subsidiaries.
The Company will pay interest on the Notes at any time without penalty.
their applicable annual rates until maturity. Interest on the Senior Notes due 2025 is payable semi-annually in arrears on May 15 and November 15 of each year. Interest on the Senior Notes due 2029 is payable semi-annually in arrears on April 1 and October 1 of each year. Principal payments are not required until the maturity date on November 15, 2025 and October 1, 2029 when 100.0% of the outstanding principal amount of any loans accrues, at our election, at a per annum rate equal to LIBOR, plus an applicable margin or the base rate plus an applicable margin. The applicable margin ranges from 2.25% to 3.25% in the case of LIBOR loans and 1.25% to 2.25% in the case of the base rate loans, in each case, based on our consolidated leverage ratio as defined in the Credit Agreement. Interest on any loans is payable quarterly in arrears. In addition, we are obligated to pay a quarterly commitment fee based on a percentage of the unused portion of each lender’s commitment under the Credit Facility and quarterly letter of credit fees based on a percentage of the maximum amount availablewill be required to be drawn under each outstanding letter of credit.repaid on the Senior Notes due 2025 and the Senior Notes due 2029, respectively.
New Credit Facility. The commitment feeCompany is party to the amended and letter ofrestated credit fee range from 0.25% to 0.50% and 2.25% to 3.25%, respectively, in each case, based on our consolidated leverage ratio.
71
thereto. The New Credit Agreement provided usprovides the Company with a senior secured revolving credit facility (the “New Credit Facility”) in an aggregate principal amount of $225.0 million, comprised of a $60.0 million term loan facility and a $165.0 million revolving credit facility.$325.0 million. The New Credit Facility includes sublimits for swingline loans, and letters of credit and alternative currency loans in amounts of up to $10.0$25.0 million, $60.0 million and $25.0$75.0 million, respectively. On August 2, 2013, we borrowedThe Company did not draw any amount of the entire amount availableNew Credit Facility at closing of the New Credit Agreement. At closing of the New Credit Agreement on February 3, 2022, the Company had $22.8 million of outstanding letters of credit under the term loan facilityNew Credit Facility. The proceeds of the New Credit Facility may be used (i) to finance working capital needs of the Company and $16.0 million underits subsidiaries and (ii) for general corporate purposes of the Company and its subsidiaries (including to finance capital expenditures, permitted acquisitions and investments).
The New Credit Agreement contains financial and non-financial covenants, including an affirmative covenant regarding our revolving credit facility and usedTotal Net Leverage Ratio, determined as of the proceeds thereof to refinance certainend of each of our existing indebtedness.
fiscal quarters, which is the ratio of (a) our total net indebtedness to (b) our earnings before interest, taxes, depreciation, amortization, and certain non-recurring charges, fees and expenses, as set forth in the New Credit Agreement. On May 28, 2014, weJune 26, 2023, the Company entered into the first amendmentFirst Amendment to the New Credit Agreement (the “First Amendment”). The First Amendment providedto increase the maximum permitted Total Net Leverage Ratio for among other things, an increaseall fiscal quarters ending on or after June 30, 2023. As of December 31, 2023, we were in compliance with all covenants contained in the aggregate amount of theNew Credit Facility from $165.0 million to $240.0 millionAgreement and other modifications in connection with the consummation of the acquisition of Ingeus.our Total Net Leverage Ratio was 4.74:1.00.
On October 23, 2014, weFebruary 22, 2024, the Company entered into the Second Amendment to the Credit Agreement (the “Second Amendment”) to (i) add a new term loan tranche in aggregate principal amount of up to $250.0 million to partly finance the acquisition of Matrix and make certain other modifications in connection with the consummation of the acquisition of Matrix and (ii) add an excess cash flow mandatory prepayment provision.
Our financial and operating performance, as well as our ability to generate sufficient cash flow to maintain compliance with covenants, are subject to certain risk factors; see Item 1A. “Risk Factors” for further discussion.
For additional information related to the third business day immediately preceding each fiscal quarter, we determine ourCompany's New Credit Facility, refer to Note 11 of the Notes to the condensed consolidated financial statements included in Part II, Item 8, “Financial Statements and Supplementary Data” of this Annual Report.
Insurance Programs
With respect to that ensuing quarter and give notice of our intention to each holder of convertible preferred stock as soon as practicable thereafter.
Further, we had restricted cash of $6.3$0.6 million and $14.1$0.5 million at December 31, 20172023 and December 31, 2016,2022, respectively, which was primarily restricted to secure the reinsured claims losses under the historical automobile, general and professional liability and workers’ compensation reinsurance programs.
Liquidity measures our ability to meet current and future cash flow needs on a timely basis and at a reasonable cost. We offermanage our NET Services, U.S. based WD Services, liquidity position to meet our daily cash flow needs, while maintaining an appropriate balance between assets
72
and corporate employees an optionliabilities to participate in self-funded health insurance programs. Additionally, we historically offered this option tomeet the return on investment objectives of our HA Services and Human Services segments’ employees. During the year ended December 31, 2017, health claims were self-funded with a stop-loss umbrella policy with a third-party insurer to limit the maximum potential liability for individual claims generally to $275,000 per person, subject to an aggregating stop-loss limitshareholders. Our liquidity position is supported by management of $400,000. In addition, the program has a total stop-loss limit for total claims, in order to limit our exposure to catastrophic claims.
We believe that, based on our current forecasts, the cash generated by our operations, amounts available under our New Credit Agreement and our current liquid assets will continue to be sufficient to fund our operations and growth strategies for the next twelve months. Our assessment is based on assumptions that may prove to be incorrect, and our operating projections, including our projected cash generated by our operations, may change as a result of many factors currently unknown to us.
In accordance with Accounting Standards Codification ("ASC") Subtopic 205-40, Presentation of Financial Statements - Going Concern, we have evaluated whether there are conditions and events, considered in the numberaggregate, that raise substantial doubt about our ability to continue as a going concern within one year after the date that the consolidated financial statements are issued. As of claims or costs associated with claims made underthe date of this programAnnual Report, we do not believe that substantial doubt exists about our ability to continue as a going concern. While we believe we have sufficient liquidity to meet our cash obligations for the next twelve months as further discussed above, what we reserve could have a material adverse effectnote that the Notes due 2025, which mature in November 2025 and are classified as long-term debt on our financial results.balance sheet as of December 31, 2023, will become current liabilities beginning in November 2024 and payable within twelve months of such time, which could lead to substantial doubt being raised at that time. Accordingly, we expect that we will need to raise additional capital to repay or refinance this debt prior to its maturity date. Our ability to raise additional capital, including to repay or refinance the Notes due 2025, is subject to certain risk factors; see Item 1A. “Risk Factors” for further discussion.
In the ordinary course of business we have entered into contractual obligations and have made other commitments to make future payments. Our short-term and long-term liquidity requirements are primarily to fund on-going operations. These liquidity requirements are met primarily through cash flow from operations, debt financing, and borrowings under our New Credit Facility. For additional information regarding our operating, investing and financing cash flows, see “Consolidated Financial Statements—Consolidated Statements of Cash Flows,” included in Part II, Item 8 of this Annual Report.
requirements of $706.6 million due in one year or less in addition to $1,218.7 million due in more than one year as of December 31, 2023. The following is a summary of our future contractual cash obligationsrequirements for the next twelve months and the period extending beyond twelve months as of December 31, 2017:2023 (in thousands):
| At December 31, 2023 | ||||||||||||||||||||
| Less than | Greater than | |||||||||||||||||||
| Total | 1 Year | 1 Year | ||||||||||||||||||
Senior Unsecured Notes(1) | $ | 1,000,000 | $ | — | $ | 1,000,000 | ||||||||||||||
Interest(1) | 207,490 | 62,717 | 144,773 | |||||||||||||||||
Guarantees(2) | 34,113 | 33,594 | 519 | |||||||||||||||||
Operating leases(3) | 42,511 | 8,727 | 33,784 | |||||||||||||||||
Letters of credit(2) | 40,409 | 40,409 | — | |||||||||||||||||
Contracts payable(4) | 117,488 | 117,488 | — | |||||||||||||||||
Transportation costs(5) | 97,245 | 97,245 | — | |||||||||||||||||
Deferred tax liabilities(6) | 39,584 | — | 39,584 | |||||||||||||||||
Purchased service commitment(7) | 49,500 | 49,500 | — | |||||||||||||||||
Short-term borrowings(8) | 113,800 | 113,800 | — | |||||||||||||||||
Other current cash obligations(9) | 183,142 | 183,142 | — | |||||||||||||||||
| Total | $ | 1,925,282 | $ | 706,622 | $ | 1,218,660 | ||||||||||||||
(1)See Note 11 of the Notes to the consolidated financial statements included in Part II, Item 8, “Financial Statements and Supplementary Data” for further detail of our Senior Unsecured Notes and the timing of expected future payments. Interest payments on our Senior Unsecured Notes are typically paid semi-annually in arrears and have been calculated
73
| At December 31, 2017 | ||||||||||||||||||||
| Less than | 1-3 | 3-5 | After 5 | |||||||||||||||||
| Contractual cash obligations (000's) | Total | 1 Year | Years | Years | Years | |||||||||||||||
| Capital Leases | $ | 2,984 | $ | 2,400 | $ | 584 | $ | — | $ | — | ||||||||||
| Interest (1) | 467 | 467 | — | — | — | |||||||||||||||
| Purchased services commitments (2) | 8,448 | 2,966 | 5,482 | — | — | |||||||||||||||
| Guarantees (3) | 43,287 | 42,768 | 519 | — | — | |||||||||||||||
| Letters of credit (3) | 11,074 | 11,074 | — | — | — | |||||||||||||||
| Operating Leases (4) | 62,092 | 20,875 | 23,114 | 14,164 | 3,939 | |||||||||||||||
| Total | $ | 128,352 | $ | 80,550 | $ | 29,699 | $ | 14,164 | $ | 3,939 | ||||||||||
(3)The operating leases are for $63.0 million, excluding commission payments.
(4)See Note 5 of the twelve-month period following October 26, 2016. As of October 26, 2017, we spent $30.4 million, excluding commission payments,Notes to purchase 770,808 sharesthe consolidated financial statements included in Part II, Item 8, “Financial Statements and Supplementary Data” for further detail of our Common Stock under this plan.contracts payable.
(6)See Note 16 of the Notes to the consolidated financial statements included in Part II, Item 8, “Financial Statements and Supplementary Data” for further detail of our deferred tax liabilities.
(7)The purchased service commitment includes the maximum penalty we would incur if we do not meet our minimum volume commitment over the remaining term of the agreement under certain contracts. See Note 17 of the Notes to the consolidated financial statements included in Part II, Item 8, “Financial Statements and Supplementary Data” for further detail of our purchased service commitment.
(8)Short-term borrowings shown in the table were provided by our New Credit Facility and reduced our availability under the related New Credit Agreement. See Note 11 of the Notes to the consolidated financial statements included in Part II, Item 8, “Financial Statements and Supplementary Data” for further detail of our New Credit Facility and current borrowings under the New Credit Facility.
(9)These include other current liabilities reflected in our consolidated balance sheets as of December 31, 2017, 180,270 shares were purchased2023, including accounts payable and accrued expenses as detailed at Note 10 to the Consolidated Financial Statements included in Part II, Item 8, “Financial Statements and Supplementary Data”.
Our primary sources of funding include operating cash flows, available borrowing capacity under this plan for $10.5 million, excluding commission payments, after it was extended on November 2, 2017.the New Credit Facility and access to capital markets. In addition, duringthere are statutory, regulatory, and debt covenant limitations that affect our ability to access the period January 1, 2018capital market for funds. Management believes that such limitations will not impact our ability to March 5, 2018,meet our ongoing short-term cash obligations. Management continuously monitors our liquidity position and adjustments are made to the Company repurchased an additional 527,825 shares for $33.3 million,balance between sources and $25.8 million was available under the planuses of funds as deemed appropriate. Our management is not aware of any events that are reasonably likely to repurchase shares.have a material adverse effect on our liquidity, capital resources, or operations. In addition, our management is not aware of any regulatory recommendations regarding liquidity, which if implemented, would have a material adverse effect on us.
Off-balance sheet arrangements
As of December 31, 20172023 and 2016,2022, we did not have any relationships with unconsolidated entities or financial partnerships, such as entities referred to as structured finance or special purpose entities, which would have beenwere established for the purpose of facilitating off-balance sheet arrangements or other contractually narrow or limited purposes.
Item 7A. Quantitative and Qualitative Disclosures About Market Risk.
Interest rate risk
74
Item 8. Financial Statements and Supplementary Data.
INDEX TO CONSOLIDATED FINANCIAL STATEMENTS
Reports of Independent Registered Public Accounting Firm (KPMG LLP, Denver, CO, Auditor Firm ID: 185) | |||||
Report of Independent Registered Public Accounting Firm (Deloitte & Touche LLP, Tempe, AZ, Auditor Firm ID: 34) | |||||
Reports of Independent Registered Public Accounting Firm (KPMG LLP, Denver, CO, Auditor Firm ID: 185) | |||||
| For the years ended December 31, | |||||
Consolidated Statements of Operations | |||||
Report of Independent Registered Public Accounting Firm
To the stockholdersStockholders and boardBoard of directorsDirectors
Opinion on theConsolidated Financial Statements
We have audited the accompanying consolidated balance sheets of The Providence Service CorporationModivCare Inc. and subsidiaries (the “Company”)Company) as of December 31, 20172023 and 2016,2022, the related consolidated statements of income, comprehensive income,operations, stockholders’ equity, and cash flows for each of the years in the three-year period ended December 31, 2017,2023, and the related notes, and financial statement schedule II (collectively, the “consolidatedconsolidated financial statements”)statements). In our opinion, based on our audits and the report of the other auditors, the consolidated financial statements present fairly, in all material respects, the financial position of the Company as of December 31, 20172023 and 2016,2022, and the results of its operations and its cash flows for each of the years in the three-year period ended December 31, 2017,2023, in conformity with U.S. generally accepted accounting principles.
We also have audited, in accordance with the standards of the Public Company Accounting Oversight Board (United States) (“PCAOB”)(PCAOB), the Company’s internal control over financial reporting as of December 31, 2017,2023, based on criteria established in Internal Control -– Integrated Framework (2013) issued by the Committee of Sponsoring Organizations of the Treadway Commission, and our report dated March 9, 2018February 23, 2024 expressed an unqualifiedadverse opinion on the effectiveness of the Company’s internal control over financial reporting.
We did not audit the financial statements of Mercury Parent, LLC (a 46.643.6 percent owned investee company) as of and for the year ended December 31, 2017.2021. The Company’s investment in Mercury Parent, LLC at December 31, 2017 was $169.7 million, and its equity in net gainloss of Mercury Parent, LLC was $13.4$53.1 million for the year ended December 31, 2017. The financial2021. Those statements of Mercury Parent, LLC were audited by other auditors whose report has been furnished to us, and our opinion, insofar as it relates to the amounts included for Mercury Parent, LLC is based solely on the reportreports of the other auditors.
Basis for Opinion
These consolidated financial statements are the responsibility of the Company’s management. Our responsibility is to express an opinion on these consolidated financial statements based on our audits. We are a public accounting firm registered with the PCAOB and are required to be independent with respect to the Company in accordance with the U.S. federal securities laws and the applicable rules and regulations of the Securities and Exchange Commission and the PCAOB.
We conducted our audits in accordance with the standards of the PCAOB. Those standards require that we plan and perform the audit to obtain reasonable assurance about whether the consolidated financial statements are free of material misstatement, whether due to error or fraud. Our audits included performing procedures to assess the risks of material misstatement of the consolidated financial statements, whether due to error or fraud, and performing procedures that respond to those risks. Such procedures included examining, on a test basis, evidence regarding the amounts and disclosures in the consolidated financial statements. Our audits also included evaluating the accounting principles used and significant estimates made by management, as well as evaluating the overall presentation of the consolidated financial statements. We believe that our audits provide and the report of the other auditors provide a reasonable basis for our opinion.
Critical Audit Matters
The critical audit matters communicated below are matters arising from the current period audit of the consolidated financial statements that were communicated or required to be communicated to the audit committee and that: (1) relate to accounts or disclosures that are material to the consolidated financial statements and (2) involved our especially challenging, subjective, or complex judgments. The communication of critical audit matters does not alter in any way our opinion on the consolidated financial statements, taken as a whole, and we are not, by communicating the critical audit matters below, providing separate opinions on the critical audit matters or on the accounts or disclosures to which they relate.
Sufficiency of audit evidence over certain capitated contracts with provisions for reconciliations, risk corridors or profit rebates
As discussed in Note 5 to the consolidated financial statements the Company reported service revenue, net of $2,751.2 million for the year ended December 31, 2023, which included revenue from certain capitated contracts with provisions for reconciliations, risk corridors or profit rebates. The Company records revenue for certain capitated contracts with provisions for reconciliations, risk corridors or profit rebates based on capitated payments received
76
during the month of service and these payments are reconciled based on actual cost and/or trip volume which may result in additional receivables from or payables to the payors. As of December 31, 2023, the Company recorded reconciliation and risk corridor contract receivables of $144.0 million and total contract payables of $117.5 million which included contract payables related to contracts with provisions for reconciliations, risk corridors or profit rebates.
We identified the evaluation of the sufficiency of audit evidence over certain capitated contracts with provisions for reconciliations, risk corridors, or profit rebates as a critical audit matter. Challenging auditor judgement was required in evaluating the sufficiency of audit evidence due to the large volume of data and complexity of the manually maintained information used in the revenue recognition process. Specialized skills and knowledge were needed to assess the Information Technology (IT) systems used to determine and record revenue, contract receivables and contract payables related to these capitated contracts.
The following are the primary procedures we performed to address this critical audit matter. We applied auditor judgment to determine the nature and extent of procedures to be performed over reconciliation, risk corridor and profit rebate contract revenue, contract receivables and contract payables. We evaluated the design and tested the operating effectiveness of certain internal controls over the revenue recognition process related to the aforementioned capitated contracts. We assessed recorded reconciliation, risk corridor and profit rebate contract revenue, contract receivables and contract payables for the aforementioned capitated contracts by comparing a selection of such revenue amounts to third party contracts and cash receipts and comparing a selection of reconciliation, risk corridor or profit rebate revenue, receivable and payable amounts to payor contracts and transportation cost data. Additionally, we compared a selection of reconciliation, risk corridor and profit rebate contract receivable and payable activity during the year to current year revenue activity and cash settlements. We involved IT professionals with specialized skills and knowledge, who assisted in testing certain general IT controls and certain application controls used to determine and record revenue, contract receivables and contract payables related to the aforementioned capitated contracts. We evaluated the sufficiency of audit evidence obtained by assessing the results of procedures performed.
Goodwill impairment assessment for certain reporting units
As discussed in Notes 2 and 9 to the consolidated financial statements, the Company reviews goodwill for impairment annually, and more frequently if events and circumstances indicate that the carrying value of a reporting unit might exceed its fair value. The Company estimates the fair value of each reporting unit using a blend of an income approach, utilizing a discounted cash flow method, and a market approach, utilizing the guideline public company method. During the year ended December 31, 2023, the Company recognized goodwill impairment charges of $183.1 million. As of December 31, 2023, the goodwill balance was $785.6 million.
We identified the evaluation of the goodwill impairment assessment for certain reporting units as a critical audit matter. There was a high degree of subjective auditor judgment required in assessing the Company’s key assumptions used in the income approach to estimate fair value, specifically short-term projected revenue and the discount rate. Minor changes in these assumptions could have had a significant impact on the estimated fair value. Additionally, the audit effort associated with this estimate required specialized skills and knowledge.
The following are the primary procedures we performed to address this critical audit matter. We evaluated the design and tested the operating effectiveness of certain internal controls related to the Company’s goodwill impairment assessment process, including controls over the short-term projected revenue and the discount rate assumptions. We evaluated the short-term projected revenues by comparing them to the historical results of the respective reporting unit, and to external economic data, including publicly available information for guideline public companies. We involved valuation professionals with specialized skills and knowledge, who assisted in evaluating the discount rate by independently calculating the weighted average cost of capital.
/s/ KPMG LLP
We have served as the Company’s auditor since 2008.
77
REPORT OF INDEPENDENT REGISTERED PUBLIC ACCOUNTING FIRM
To the shareholders and the Board of Directors of Mercury Parent, LLC
Opinion on the Financial Statements
We have audited the consolidated balance sheet of Mercury Parent, LLC and subsidiaries (the "Company") as of December 31, 2021, the related consolidated statements of operations, members' equity, and cash flows, for the year ended December 31, 2021, and the related notes (collectively referred to as the "financial statements"). In our opinion, the financial statements present fairly, in all material respects, the financial position of the Company as of December 31, 2021, and the results of its operations and its cash flows for the year ended December 31, 2021, in conformity with accounting principles generally accepted in the United States of America.
Basis for Opinion
These financial statements are the responsibility of the Company's management. Our responsibility is to express an opinion on the Company's financial statements based on our audits. We are a public accounting firm registered with the Public Company Accounting Oversight Board (United States) (PCAOB) and are required to be independent with respect to the Company in accordance with the U.S. federal securities laws and the applicable rules and regulations of the Securities and Exchange Commission and the PCAOB.
We conducted our audits in accordance with the standards of the PCAOB and in accordance with auditing standards generally accepted in the United States of America. Those standards require that we plan and perform the audit to obtain reasonable assurance about whether the financial statements are free of material misstatement, whether due to error or fraud. The Company is not required to have, nor were we engaged to perform, an audit of its internal control over financial reporting. As part of our audits, we are required to obtain an understanding of internal control over financial reporting but not for the purpose of expressing an opinion on the effectiveness of the Company’s internal control over financial reporting. Accordingly, we express no such opinion.
Our audits included performing procedures to assess the risks of material misstatement of the financial statements, whether due to error or fraud, and performing procedures that respond to those risks. Such procedures included examining, on a test basis, evidence regarding the amounts and disclosures in the financial statements. Our audits also included evaluating the accounting principles used and significant estimates made by management, as well as evaluating the overall presentation of the financial statements. We believe that our audits provide a reasonable basis for our opinion.
/s/ Deloitte & Touche LLP
Tempe, Arizona
February 25, 2022
We have served as the Company's auditor since 2017.
78
Report of Independent Registered Public Accounting Firm
To the stockholdersStockholders and boardBoard of directorsDirectors
Opinion on Internal Control Over Financial Reporting
We have audited The Providence Service CorporationModivCare Inc. and subsidiaries’subsidiaries' (the “Company”)Company) internal control over financial reporting as of December 31, 2017,2023, based on criteria established in Internal Control -– Integrated Framework (2013) issued by the Committee of Sponsoring Organizations of the Treadway Commission. In our opinion, because of the effect of the material weaknesses, described below, on the achievement of the objectives of the control criteria, the Company has not maintained in all material respects, effective internal control over financial reporting as of December 31, 2017,2023, based on criteria established in Internal Control -– Integrated Framework (2013) issued by the Committee of Sponsoring Organizations of the Treadway Commission.
We also have audited, in accordance with the standards of the Public Company Accounting Oversight Board (United States) (“PCAOB”)(PCAOB), the consolidated balance sheets of the Company as of December 31, 20172023 and 2016,2022, the related consolidated statements of income, comprehensive income,operations, stockholders’ equity, and cash flows for each of the years in the three-year period ended December 31, 2017,2023, and the related notes and financial statement schedule II (collectively, the “consolidatedconsolidated financial statements”)statements), and our report dated March 9, 2018February 23, 2024 expressed an unqualified opinion on those consolidated financial statements.
A material weakness is a deficiency, or a combination of deficiencies, in internal control over financial reporting, such that there is a reasonable possibility that a material misstatement of the company’s annual or interim financial statements will not be prevented or detected on a timely basis. The material weaknesses described below have been identified and included in management’s assessment:
The Company did not, with respect to its PCS segment, complete before year-end (i) an effective risk assessment to assess and confirm the effectiveness and implementation of the changes identified in its internal control environment related to recently deployed information technology (“IT”) systems and revision of the PCS revenue and payroll processes or (ii) the establishment of all mechanisms expected to be used to enforce accountability in the pursuit of objectives to establish and operate effective internal control over financial reporting.
As a consequence:
•The Company did not establish effective general information technology controls (“GITCs”), specifically change management controls and logical access controls, that support the consistent operation of all of the Company’s IT systems, resulting in automated process-level controls and manual controls dependent upon information derived from those IT systems to be ineffective because they could have been adversely impacted; and
•The Company did not design, implement, and effectively operate process-level control activities related to its revenue processes (including service revenue and accounts receivable) and payroll processes (including payroll expenses recorded within service expense and general and administrative expense) within the PCS segment.
The material weaknesses were considered in determining the nature, timing, and extent of audit tests applied in our audit of the 2023 consolidated financial statements, and this report does not affect our report on those consolidated financial statements.
Basis for Opinion
The Company’s management is responsible for maintaining effective internal control over financial reporting and for its assessment of the effectiveness of internal control over financial reporting, included in the accompanying Management’sManagement's Report on Internal Control overOver Financial Reporting. Our responsibility is to express an opinion on the Company’s internal control over financial reporting based on our audit. We are a public accounting firm registered with the PCAOB and are required to be independent with respect to the Company in accordance with the U.S. federal securities laws and the applicable rules and regulations of the Securities and Exchange Commission and the PCAOB.
We conducted our audit in accordance with the standards of the PCAOB. Those standards require that we plan and perform the audit to obtain reasonable assurance about whether effective internal control over financial reporting was maintained in all material respects. Our audit of internal control over financial reporting included obtaining an understanding of internal control over financial reporting, assessing the risk that a material weakness exists, and testing and evaluating the design and operating
79
effectiveness of internal control based on the assessed risk. Our audit also included performing such other procedures as we considered necessary in the circumstances. We believe that our audit provides a reasonable basis for our opinion.
Definition and Limitations of Internal Control Over Financial Reporting
A company’s internal control over financial reporting is a process designed to provide reasonable assurance regarding the reliability of financial reporting and the preparation of financial statements for external purposes in accordance with generally accepted accounting principles. A company’s internal control over financial reporting includes those policies and procedures that (1) pertain to the maintenance of records that, in reasonable detail, accurately and fairly reflect the transactions and dispositions of the assets of the company; (2) provide reasonable assurance that transactions are recorded as necessary to permit preparation of financial statements in accordance with generally accepted accounting principles, and that receipts and expenditures of the company are being made only in accordance with authorizations of management and directors of the company; and (3) provide reasonable assurance regarding prevention or timely detection of unauthorized acquisition, use, or disposition of the company’s assets that could have a material effect on the financial statements.
Because of its inherent limitations, internal control over financial reporting may not prevent or detect misstatements. Also, projections of any evaluation of effectiveness to future periods are subject to the risk that controls may become inadequate because of changes in conditions, or that the degree of compliance with the policies or procedures may deteriorate.
/s/ KPMG LLP
February 23, 2024
80
ModivCare Inc.
Consolidated Balance Sheets
(in thousands except share and per share data)
| December 31, | |||||||||||
| 2023 | 2022 | ||||||||||
| Assets | |||||||||||
| Current assets: | |||||||||||
| Cash and cash equivalents | $ | 2,217 | $ | 14,451 | |||||||
| Accounts receivable, net of allowance of $969 and $2,078, respectively | 222,537 | 223,210 | |||||||||
| Contract receivables | 143,960 | 71,131 | |||||||||
| Other receivables | 8,616 | 2,506 | |||||||||
| Prepaid expenses and other current assets | 27,028 | 34,332 | |||||||||
| Restricted cash | 565 | 524 | |||||||||
| Total current assets | 404,923 | 346,154 | |||||||||
| Property and equipment, net | 85,629 | 69,138 | |||||||||
| Goodwill | 785,554 | 968,654 | |||||||||
| Payor network, net | 330,738 | 391,980 | |||||||||
| Other intangible assets, net | 30,197 | 47,429 | |||||||||
| Equity investment | 41,531 | 41,303 | |||||||||
| Operating lease right-of-use assets | 39,776 | 39,405 | |||||||||
| Other assets | 48,927 | 40,209 | |||||||||
| Total assets | $ | 1,767,275 | $ | 1,944,272 | |||||||
| Liabilities and stockholders’ equity | |||||||||||
| Current liabilities: | |||||||||||
| Accounts payable | $ | 55,241 | $ | 54,959 | |||||||
| Accrued contract payables | 117,488 | 194,287 | |||||||||
| Accrued transportation costs | 97,245 | 96,851 | |||||||||
| Accrued expenses and other current liabilities | 127,901 | 135,860 | |||||||||
| Current portion of operating lease liabilities | 8,727 | 9,640 | |||||||||
| Short-term borrowings | 113,800 | — | |||||||||
| Total current liabilities | 520,402 | 491,597 | |||||||||
| Long-term debt, net of deferred financing costs of $16,243 and $24,775, respectively | 983,757 | 979,361 | |||||||||
| Deferred tax liabilities | 39,584 | 57,236 | |||||||||
| Operating lease liabilities, less current portion | 33,784 | 32,088 | |||||||||
| Other long-term liabilities | 33,553 | 29,434 | |||||||||
| Total liabilities | 1,611,080 | 1,589,716 | |||||||||
| Commitments and contingencies (Note 17) | |||||||||||
| Stockholders’ equity | |||||||||||
| Common stock: Authorized 40,000,000 shares; $0.001 par value; 19,775,041 and 19,729,923, respectively, issued and outstanding (including treasury shares) | 20 | 20 | |||||||||
| Additional paid-in capital | 450,945 | 444,255 | |||||||||
| Retained earnings (accumulated deficit) | (24,437) | 180,023 | |||||||||
| Treasury shares, at cost, 5,571,004 and 5,573,529 shares, respectively | (270,333) | (269,742) | |||||||||
| Total stockholders’ equity | 156,195 | 354,556 | |||||||||
| Total liabilities and stockholders’ equity | $ | 1,767,275 | $ | 1,944,272 | |||||||
| December 31, | |||||||
| 2017 | 2016 | ||||||
| Assets | |||||||
| Current assets: | |||||||
| Cash and cash equivalents | $ | 95,310 | $ | 72,262 | |||
| Accounts receivable, net of allowance of $5,762 in 2017 and $5,901 in 2016 | 158,926 | 162,115 | |||||
| Other receivables | 5,759 | 12,639 | |||||
| Prepaid expenses and other | 35,243 | 37,895 | |||||
| Restricted cash | 1,091 | 3,192 | |||||
| Total current assets | 296,329 | 288,103 | |||||
| Property and equipment, net | 50,377 | 46,220 | |||||
| Goodwill | 121,668 | 119,624 | |||||
| Intangible assets, net | 43,939 | 49,124 | |||||
| Equity investments | 169,912 | 161,363 | |||||
| Other assets | 12,028 | 8,397 | |||||
| Restricted cash, less current portion | 5,205 | 10,938 | |||||
| Deferred tax asset | 4,632 | 1,510 | |||||
| Total assets | $ | 704,090 | $ | 685,279 | |||
| Liabilities, redeemable convertible preferred stock and stockholders' equity | |||||||
| Current liabilities: | |||||||
| Current portion of long-term obligations | $ | 2,400 | $ | 1,721 | |||
| Accounts payable | 15,404 | 22,177 | |||||
| Accrued expenses | 103,838 | 102,381 | |||||
| Accrued transportation costs | 83,588 | 72,356 | |||||
| Deferred revenue | 17,381 | 20,522 | |||||
| Reinsurance and related liability reserves | 4,319 | 8,639 | |||||
| Total current liabilities | 226,930 | 227,796 | |||||
| Long-term obligations, less current portion | 584 | 1,890 | |||||
| Other long-term liabilities | 21,386 | 22,380 | |||||
| Deferred tax liabilities | 41,627 | 57,973 | |||||
| Total liabilities | 290,527 | 310,039 | |||||
| Commitments and contingencies (Note 18) | |||||||
| Redeemable convertible preferred stock | |||||||
| Convertible preferred stock, net: Authorized 10,000,000 shares; $0.001 par value; 803,200 and 803,398 issued and outstanding; 5.5%/8.5% dividend rate | 77,546 | 77,565 | |||||
| Stockholders' equity | |||||||
| Common stock: Authorized 40,000,000 shares; $0.001 par value; 17,473,598 and 17,315,661 issued and outstanding (including treasury shares) | 17 | 17 | |||||
| Additional paid-in capital | 313,955 | 302,010 | |||||
| Retained earnings | 204,818 | 156,718 | |||||
| Accumulated other comprehensive loss, net of tax | (25,805 | ) | (33,449 | ) | |||
| Treasury shares, at cost, 4,126,132 and 3,478,676 shares | (154,803 | ) | (125,201 | ) | |||
| Total Providence stockholders' equity | 338,182 | 300,095 | |||||
| Noncontrolling interest | (2,165 | ) | (2,420 | ) | |||
| Total stockholders' equity | 336,017 | 297,675 | |||||
| Total liabilities, redeemable convertible preferred stock and stockholders' equity | $ | 704,090 | $ | 685,279 | |||
See accompanying notes to the consolidated financial statements
statements.
81
ModivCare Inc.
Consolidated Statements of IncomeOperations
(in thousands except share and per share data)
| Year ended December 31, | |||||||||||||||||
| 2023 | 2022 | 2021 | |||||||||||||||
| Service revenue, net | $ | 2,751,170 | $ | 2,504,393 | $ | 1,996,892 | |||||||||||
| Grant income (Note 2) | 5,037 | 7,351 | 5,441 | ||||||||||||||
| Operating expenses: | |||||||||||||||||
| Service expense | 2,304,218 | 2,032,074 | 1,584,298 | ||||||||||||||
| General and administrative expense | 304,564 | 322,171 | 271,674 | ||||||||||||||
| Depreciation and amortization | 104,271 | 100,415 | 56,998 | ||||||||||||||
| Impairment of goodwill | 183,100 | — | — | ||||||||||||||
| Total operating expenses | 2,896,153 | 2,454,660 | 1,912,970 | ||||||||||||||
| Operating income (loss) | (139,946) | 57,084 | 89,363 | ||||||||||||||
| Interest expense, net | 69,120 | 61,961 | 49,081 | ||||||||||||||
| Income (loss) before income taxes and equity method investment | (209,066) | (4,877) | 40,282 | ||||||||||||||
| Income tax benefit (provision) | 4,319 | 3,035 | (8,617) | ||||||||||||||
| Equity in net income (loss) of investee, net of tax | 287 | (29,964) | (38,250) | ||||||||||||||
| Net loss | $ | (204,460) | $ | (31,806) | $ | (6,585) | |||||||||||
| Loss per common share: | |||||||||||||||||
| Basic | $ | (14.43) | $ | (2.26) | $ | (0.47) | |||||||||||
| Diluted | $ | (14.43) | $ | (2.26) | $ | (0.47) | |||||||||||
| Weighted-average number of common shares outstanding: | |||||||||||||||||
| Basic | 14,173,957 | 14,061,839 | 14,054,060 | ||||||||||||||
| Diluted | 14,173,957 | 14,061,839 | 14,054,060 | ||||||||||||||
See accompanying notes to the consolidated financial statements.
82
| Year ended December 31, | |||||||||||
| 2017 | 2016 | 2015 | |||||||||
| Service revenue, net | $ | 1,623,882 | $ | 1,578,245 | $ | 1,478,010 | |||||
| Operating expenses: | |||||||||||
| Service expense | 1,489,044 | 1,452,110 | 1,381,154 | ||||||||
| General and administrative expense | 72,336 | 69,911 | 70,986 | ||||||||
| Asset impairment charge | — | 21,003 | — | ||||||||
| Depreciation and amortization | 26,469 | 26,604 | 23,998 | ||||||||
| Total operating expenses | 1,587,849 | 1,569,628 | 1,476,138 | ||||||||
| Operating income | 36,033 | 8,617 | 1,872 | ||||||||
| Other expenses: | |||||||||||
| Interest expense, net | 1,278 | 1,583 | 1,853 | ||||||||
| Other income | (5,363 | ) | — | — | |||||||
| Equity in net (gain) loss of investees | (12,054 | ) | 10,287 | 10,970 | |||||||
| Gain on sale of equity investment | (12,377 | ) | — | — | |||||||
| Loss (gain) on foreign currency transactions | 345 | (1,375 | ) | (857 | ) | ||||||
| Income (loss) from continuing operations before income taxes | 64,204 | (1,878 | ) | (10,094 | ) | ||||||
| Provision for income taxes | 4,401 | 17,036 | 14,583 | ||||||||
| Income (loss) from continuing operations, net of tax | 59,803 | (18,914 | ) | (24,677 | ) | ||||||
| Discontinued operations, net of tax | (5,983 | ) | 108,760 | 107,871 | |||||||
| Net income | 53,820 | 89,846 | 83,194 | ||||||||
| Net (gain) loss attributable to noncontrolling interests | (451 | ) | 2,082 | 502 | |||||||
| Net income attributable to Providence | $ | 53,369 | $ | 91,928 | $ | 83,696 | |||||
| Net income available to common stockholders (Note 14) | $ | 41,865 | $ | 74,374 | $ | 67,999 | |||||
| Basic earnings (loss) per common share: | |||||||||||
| Continuing operations | $ | 3.52 | $ | (1.45 | ) | $ | (1.83 | ) | |||
| Discontinued operations | (0.44 | ) | 6.52 | 6.09 | |||||||
| Basic earnings per common share | $ | 3.08 | $ | 5.07 | $ | 4.26 | |||||
| Diluted earnings (loss) per common share: | |||||||||||
| Continuing operations | $ | 3.50 | $ | (1.45 | ) | $ | (1.83 | ) | |||
| Discontinued operations | (0.44 | ) | 6.52 | 6.09 | |||||||
| Diluted earnings per common share | $ | 3.06 | $ | 5.07 | $ | 4.26 | |||||
| Weighted-average number of common shares outstanding: | |||||||||||
| Basic | 13,602,140 | 14,666,896 | 15,960,905 | ||||||||
| Diluted | 13,673,314 | 14,666,896 | 15,960,905 | ||||||||
ModivCare Inc.
Consolidated Statements of Cash Flows
(in thousands)
| Year ended December 31, | |||||||||||||||||
| 2023 | 2022 | 2021 | |||||||||||||||
| Operating activities | |||||||||||||||||
| Net loss | $ | (204,460) | $ | (31,806) | $ | (6,585) | |||||||||||
| Adjustments to reconcile net loss to net cash provided by (used in) operating activities: | |||||||||||||||||
| Depreciation | 25,038 | 20,055 | 12,747 | ||||||||||||||
| Amortization | 79,233 | 80,360 | 44,251 | ||||||||||||||
| Stock-based compensation | 6,456 | 6,872 | 5,904 | ||||||||||||||
| Deferred income taxes | (17,652) | (36,663) | (17,691) | ||||||||||||||
| Impairment of goodwill | 183,100 | — | — | ||||||||||||||
| Amortization of deferred financing costs and debt discount | 5,246 | 5,125 | 2,730 | ||||||||||||||
| Other assets | (8,719) | (17,987) | (2,128) | ||||||||||||||
| Equity in net loss (income) of investee | (398) | 40,916 | 53,092 | ||||||||||||||
| Reduction of right-of-use assets | 12,344 | 11,640 | 11,330 | ||||||||||||||
| Changes in operating assets and liabilities, net of effects of acquisitions: | |||||||||||||||||
| Accounts receivable and other receivables | (5,268) | (9,130) | (24,993) | ||||||||||||||
| Contract receivables | (72,828) | (46,651) | 11,244 | ||||||||||||||
| Prepaid expenses and other assets | 6,830 | 6,416 | (5,459) | ||||||||||||||
| Accrued contract payables | (76,798) | (87,299) | 107,698 | ||||||||||||||
| Accounts payable and accrued expenses | (7,677) | 57,249 | (16,795) | ||||||||||||||
| Accrued transportation costs | 394 | (6,443) | 23,620 | ||||||||||||||
| Other changes in operating assets and liabilities | (7,812) | (3,096) | (12,125) | ||||||||||||||
| Net cash provided by (used in) operating activities | (82,971) | (10,442) | 186,840 | ||||||||||||||
| Investing activities | |||||||||||||||||
| Purchase of property and equipment | (42,288) | (33,004) | (21,316) | ||||||||||||||
| Acquisitions, net of cash acquired | — | (78,809) | (664,309) | ||||||||||||||
| Net cash used in investing activities | (42,288) | (111,813) | (685,625) | ||||||||||||||
| Financing activities | |||||||||||||||||
| Net proceeds from short-term borrowings | 113,800 | — | — | ||||||||||||||
| Proceeds from long-term debt | — | — | 500,000 | ||||||||||||||
| Repurchase of common stock, for treasury | — | — | (39,994) | ||||||||||||||
| Payment of debt issuance costs | (376) | (2,415) | (13,486) | ||||||||||||||
| Proceeds from common stock issued pursuant to stock option exercise | 31 | 6,789 | 3,227 | ||||||||||||||
| Restricted stock surrendered for employee tax payment | (899) | (792) | (896) | ||||||||||||||
| Other financing activities | 510 | 226 | — | ||||||||||||||
| Net cash provided by financing activities | 113,066 | 3,808 | 448,851 | ||||||||||||||
| Net change in cash, cash equivalents and restricted cash | (12,193) | (118,447) | (49,934) | ||||||||||||||
| Cash, cash equivalents and restricted cash at beginning of year | 14,975 | 133,422 | 183,356 | ||||||||||||||
| Cash, cash equivalents and restricted cash at end of year | $ | 2,782 | $ | 14,975 | $ | 133,422 | |||||||||||
See accompanying notes to the consolidated financial statements.
83
ModivCare Inc.
Supplemental Cash Flow Information
(in thousands)
| Year ended December 31, | |||||||||||||||||
| 2023 | 2022 | 2021 | |||||||||||||||
| Supplemental cash flow information | |||||||||||||||||
| Cash paid for interest | $ | 64,200 | $ | 59,392 | $ | 32,178 | |||||||||||
| Cash paid for income taxes | $ | 9,078 | $ | 15,660 | $ | 13,021 | |||||||||||
| Assets acquired under operating leases | $ | 12,715 | $ | 7,295 | $ | 24,152 | |||||||||||
| Acquisitions: | |||||||||||||||||
| Purchase price | $ | — | $ | 79,200 | $ | 678,655 | |||||||||||
| Less: | |||||||||||||||||
| Cash acquired | — | (391) | (14,346) | ||||||||||||||
| Acquisitions, net of cash acquired | $ | — | $ | 78,809 | $ | 664,309 | |||||||||||
See accompanying notes to the consolidated financial statements.
84
ModivCare Inc.
Consolidated Statements of Stockholders’ Equity
(in thousands except share data)
| Common Stock | Additional | Retained Earnings | Treasury Stock | ||||||||||||||||||||||||||||||||||||||
| Shares | Amount | Paid-In Capital | (Accumulated Deficit) | Shares | Amount | Total | |||||||||||||||||||||||||||||||||||
| Balance at December 31, 2020 | 19,570,598 | $ | 20 | $ | 421,318 | $ | 218,414 | 5,287,283 | $ | (228,141) | $ | 411,611 | |||||||||||||||||||||||||||||
| Net loss | — | — | — | (6,585) | — | — | (6,585) | ||||||||||||||||||||||||||||||||||
| Stock-based compensation | — | — | 5,663 | — | — | — | 5,663 | ||||||||||||||||||||||||||||||||||
| Exercise of employee stock options | 51,798 | — | 3,227 | — | — | — | 3,227 | ||||||||||||||||||||||||||||||||||
| Restricted stock forfeited | (34,472) | — | — | — | — | — | — | ||||||||||||||||||||||||||||||||||
| Restricted stock surrendered for employee tax payment | — | — | — | — | 5,432 | (896) | (896) | ||||||||||||||||||||||||||||||||||
| Shares issued for bonus settlement and director stipends | 1,498 | — | 241 | — | — | — | 241 | ||||||||||||||||||||||||||||||||||
| Stock repurchase plan | — | — | — | — | 276,268 | (39,994) | (39,994) | ||||||||||||||||||||||||||||||||||
| Balance at December 31, 2021 | 19,589,422 | $ | 20 | $ | 430,449 | $ | 211,829 | 5,568,983 | $ | (269,031) | $ | 373,267 | |||||||||||||||||||||||||||||
| Net loss | — | — | — | (31,806) | — | — | (31,806) | ||||||||||||||||||||||||||||||||||
| Stock-based compensation | — | — | 6,491 | — | — | — | 6,491 | ||||||||||||||||||||||||||||||||||
| Exercise of employee stock options | 109,731 | — | 6,789 | — | — | — | 6,789 | ||||||||||||||||||||||||||||||||||
| Restricted stock issued | 27,251 | — | — | — | — | — | — | ||||||||||||||||||||||||||||||||||
| Restricted stock surrendered for employee tax payment | — | — | — | — | 7,486 | (792) | (792) | ||||||||||||||||||||||||||||||||||
| Shares issued for bonus settlement and director stipends | 3,519 | — | 340 | — | — | — | 340 | ||||||||||||||||||||||||||||||||||
| Shares issued for ESPP | — | — | 186 | — | (2,940) | 81 | 267 | ||||||||||||||||||||||||||||||||||
| Balance at December 31, 2022 | 19,729,923 | $ | 20 | $ | 444,255 | $ | 180,023 | 5,573,529 | $ | (269,742) | $ | 354,556 | |||||||||||||||||||||||||||||
| Net loss | — | — | — | (204,460) | — | — | (204,460) | ||||||||||||||||||||||||||||||||||
| Stock-based compensation | — | — | 6,061 | — | — | — | 6,061 | ||||||||||||||||||||||||||||||||||
| Exercise of employee stock options | 549 | — | 31 | — | — | — | 31 | ||||||||||||||||||||||||||||||||||
| Restricted stock issued | 37,609 | — | — | — | — | — | — | ||||||||||||||||||||||||||||||||||
| Restricted stock surrendered for employee tax payment | — | — | — | — | 10,565 | (899) | (899) | ||||||||||||||||||||||||||||||||||
| Shares issued for bonus settlement and director stipends | 6,960 | — | 316 | — | — | — | 316 | ||||||||||||||||||||||||||||||||||
| Shares issued for ESPP | — | — | 282 | — | (13,090) | 308 | 590 | ||||||||||||||||||||||||||||||||||
| Balance at December 31, 2023 | 19,775,041 | $ | 20 | $ | 450,945 | $ | (24,437) | 5,571,004 | $ | (270,333) | $ | 156,195 | |||||||||||||||||||||||||||||
See accompanying notes to the consolidated financial statements
statements.
85
| Year ended December 31, | |||||||||||
| 2017 | 2016 | 2015 | |||||||||
| Net income | $ | 53,820 | $ | 89,846 | $ | 83,194 | |||||
| Net loss (income) attributable to noncontrolling interest | (451 | ) | 2,082 | 502 | |||||||
| Net income attributable to Providence | 53,369 | 91,928 | 83,696 | ||||||||
| Other comprehensive income (loss): | |||||||||||
| Foreign currency translation adjustments, net of tax | 7,117 | (16,618 | ) | (8,075 | ) | ||||||
| Reclassification of translation loss realized upon sale of equity investment | 527 | — | — | ||||||||
| Other comprehensive income (loss) | 7,644 | (16,618 | ) | (8,075 | ) | ||||||
| Comprehensive income | 61,464 | 73,228 | 75,119 | ||||||||
| Comprehensive loss (income) attributable to noncontrolling interest | (255 | ) | 1,968 | 508 | |||||||
| Comprehensive income attributable to Providence | $ | 61,209 | $ | 75,196 | $ | 75,627 | |||||
| Retained | Accumulated Other | ||||||||||||||||||||||||||||||||
| Common Stock | Additional Paid-In | Earnings (Accumulated | Comprehensive Loss, Net of | Treasury Stock | Non- Controlling | ||||||||||||||||||||||||||||
| Shares | Amount | Capital | Deficit) | Tax | Shares | Amount | Interest | Total | |||||||||||||||||||||||||
| Balance at December 31, 2014 | 16,870,285 | $ | 17 | $ | 261,155 | $ | (13,366 | ) | $ | (8,756 | ) | 1,014,108 | $ | (17,686 | ) | $ | 50 | $ | 221,414 | ||||||||||||||
| Stock-based compensation | — | — | 26,622 | — | — | — | — | — | 26,622 | ||||||||||||||||||||||||
| Exercise of employee stock options, including net tax benefit of $2,706 | 247,333 | — | 7,899 | — | — | 5,718 | (299 | ) | — | 7,600 | |||||||||||||||||||||||
| Restricted stock issued | 65,447 | — | — | — | — | 15,961 | (759 | ) | — | (759 | ) | ||||||||||||||||||||||
| Stock repurchase | — | — | — | — | — | 816,468 | (34,111 | ) | — | (34,111 | ) | ||||||||||||||||||||||
| Shares surrendered by employees to pay employee taxes related to shares released from escrow | — | — | — | — | — | 43,743 | (1,968 | ) | — | (1,968 | ) | ||||||||||||||||||||||
| Conversion of convertible preferred stock to common stock | 3,715 | — | 150 | — | — | — | — | — | 150 | ||||||||||||||||||||||||
| Beneficial conversion feature related to preferred stock | — | — | 1,071 | — | — | — | — | — | 1,071 | ||||||||||||||||||||||||
| Convertible preferred stock dividends | — | — | (2,814 | ) | (1,121 | ) | — | — | — | — | (3,935 | ) | |||||||||||||||||||||
| Accretion of convertible preferred stock discount | — | — | (1,071 | ) | — | — | — | — | — | (1,071 | ) | ||||||||||||||||||||||
| Foreign currency translation adjustments, net of tax | — | — | — | — | (8,075 | ) | — | — | — | (8,075 | ) | ||||||||||||||||||||||
| Noncontrolling interests | — | — | — | — | — | — | — | (502 | ) | (502 | ) | ||||||||||||||||||||||
| Net income attributable to Providence | — | — | — | 83,696 | — | — | — | — | 83,696 | ||||||||||||||||||||||||
| Balance at December 31, 2015 | 17,186,780 | 17 | 293,012 | 69,209 | (16,831 | ) | 1,895,998 | (54,823 | ) | (452 | ) | 290,132 | |||||||||||||||||||||
| Stock-based compensation | — | — | 5,154 | — | — | — | — | — | 5,154 | ||||||||||||||||||||||||
| Exercise of employee stock options, including net tax benefit of $276 | 105,788 | — | 3,832 | — | — | — | — | — | 3,832 | ||||||||||||||||||||||||
| Restricted stock issued | 22,793 | — | — | — | — | 2,736 | (130 | ) | — | (130 | ) | ||||||||||||||||||||||
| Stock repurchase | — | — | — | — | — | 1,579,942 | (70,248 | ) | — | (70,248 | ) | ||||||||||||||||||||||
| Conversion of convertible preferred stock to common stock | 300 | — | 12 | — | — | — | — | — | 12 | ||||||||||||||||||||||||
| Convertible preferred stock dividends | — | — | — | (4,419 | ) | — | — | — | — | (4,419 | ) | ||||||||||||||||||||||
| Foreign currency translation adjustments, net of tax | — | — | — | — | (16,618 | ) | — | — | 114 | (16,504 | ) | ||||||||||||||||||||||
| Noncontrolling interests | — | — | — | — | — | — | — | (2,082 | ) | (2,082 | ) | ||||||||||||||||||||||
| Net income attributable to Providence | — | — | — | 91,928 | — | — | — | — | 91,928 | ||||||||||||||||||||||||
| Balance at December 31, 2016 | 17,315,661 | 17 | 302,010 | 156,718 | (33,449 | ) | 3,478,676 | (125,201 | ) | (2,420 | ) | 297,675 | |||||||||||||||||||||
| Stock-based compensation | — | — | 7,619 | — | — | — | — | — | 7,619 | ||||||||||||||||||||||||
| Exercise of employee stock options | 91,400 | — | 2,423 | — | — | 5,665 | (238 | ) | — | 2,185 | |||||||||||||||||||||||
| Restricted stock issued | 36,623 | — | — | — | — | 19,556 | (878 | ) | — | (878 | ) | ||||||||||||||||||||||
| Performance restricted stock issued | 3,773 | — | (96 | ) | — | — | — | — | — | (96 | ) | ||||||||||||||||||||||
| Shares issued for bonus settlement and director stipends | 25,646 | — | 1,107 | — | — | — | — | — | 1,107 | ||||||||||||||||||||||||
| Stock repurchase | — | — | — | — | — | 622,235 | (28,486 | ) | — | (28,486 | ) | ||||||||||||||||||||||
| Conversion of convertible preferred stock to common stock | 495 | — | 20 | (1 | ) | — | — | — | — | 19 | |||||||||||||||||||||||
| Convertible preferred stock dividends | — | — | — | (4,418 | ) | — | — | — | — | (4,418 | ) | ||||||||||||||||||||||
| Foreign currency translation adjustments, net of tax | — | — | — | — | 7,117 | — | — | (196 | ) | 6,921 | |||||||||||||||||||||||
| Reclassification of translation loss realized upon sale of equity investments | — | — | — | — | 527 | — | — | — | 527 | ||||||||||||||||||||||||
| Noncontrolling interests | — | — | — | — | — | — | — | 451 | 451 | ||||||||||||||||||||||||
| Other | — | — | 22 | — | — | — | — | — | 22 | ||||||||||||||||||||||||
| Net income attributable to Providence | — | — | — | 53,369 | — | — | — | — | 53,369 | ||||||||||||||||||||||||
| Cumulative effect adjustment from change in accounting principle | — | — | 850 | (850 | ) | — | — | — | — | — | |||||||||||||||||||||||
| Balance at December 31, 2017 | 17,473,598 | $ | 17 | $ | 313,955 | $ | 204,818 | $ | (25,805 | ) | 4,126,132 | $ | (154,803 | ) | $ | (2,165 | ) | $ | 336,017 | ||||||||||||||
| Year ended December 31, | |||||||||||
| 2017 | 2016 | 2015 | |||||||||
| Operating activities | |||||||||||
| Net income | $ | 53,820 | $ | 89,846 | $ | 83,194 | |||||
| Adjustments to reconcile net income to net cash provided by operating activities: | |||||||||||
| Depreciation | 18,542 | 21,699 | 20,234 | ||||||||
| Amortization | 7,927 | 26,026 | 38,067 | ||||||||
| Provision for doubtful accounts | 1,372 | 3,759 | 2,539 | ||||||||
| Stock-based compensation | 7,543 | 5,136 | 26,622 | ||||||||
| Deferred income taxes | (22,996 | ) | (14,130 | ) | (10 | ) | |||||
| Amortization of deferred financing costs and debt discount | 682 | 1,754 | 2,041 | ||||||||
| Write-off of deferred financing charges | — | 2,302 | — | ||||||||
| Gains on remeasurement of contingent consideration | — | — | (2,469 | ) | |||||||
| Asset impairment charge | — | 21,003 | 1,593 | ||||||||
| Equity in net (gain) loss of investee | (12,054 | ) | 10,287 | 10,970 | |||||||
| Gain on sale of equity investment | (12,377 | ) | — | — | |||||||
| Gain on sale of business | — | (167,895 | ) | (123,129 | ) | ||||||
| Deferred income taxes and income taxes payable on gain on sale of business | — | 58,492 | 22,797 | ||||||||
| Other non-cash charges (credits) | 296 | (1,323 | ) | (419 | ) | ||||||
| Changes in operating assets and liabilities, net of effects of acquisitions: | |||||||||||
| Accounts receivable | 5,715 | (19,332 | ) | (86,627 | ) | ||||||
| Prepaid expenses and other | 15,457 | (4,058 | ) | 14,654 | |||||||
| Reinsurance liability reserve | (5,731 | ) | (4,110 | ) | (611 | ) | |||||
| Accounts payable and accrued expenses | (9,064 | ) | 33,365 | (21,900 | ) | ||||||
| Income taxes payable on gain from sale of business | — | (30,153 | ) | — | |||||||
| Accrued transportation costs | 11,232 | 8,654 | 9,045 | ||||||||
| Deferred revenue | (4,691 | ) | (4,019 | ) | 19,043 | ||||||
| Other long-term liabilities | (629 | ) | 4,462 | 463 | |||||||
| Net cash provided by operating activities | 55,044 | 41,765 | 16,097 | ||||||||
| Investing activities | |||||||||||
| Purchase of property and equipment | (19,923 | ) | (41,216 | ) | (35,072 | ) | |||||
| Proceeds from sale of property | — | 1,039 | — | ||||||||
| Proceeds from sale of equity investment | 15,593 | — | — | ||||||||
| Acquisitions, net of cash acquired | — | — | (3,433 | ) | |||||||
| Sale of business, net of cash sold | — | 371,580 | 199,943 | ||||||||
| Purchase of equity investment | — | (13,663 | ) | (16,072 | ) | ||||||
| Purchase of cost method investments | (3,000 | ) | — | — | |||||||
| Restricted cash for reinsured claims losses | 7,834 | 5,926 | (2,058 | ) | |||||||
| Other investing activities | 310 | 239 | (18 | ) | |||||||
| Net cash provided by investing activities | 814 | 323,905 | 143,290 | ||||||||
| Financing activities | |||||||||||
| Proceeds from issuance of preferred stock, net of issuance costs | — | — | 80,667 | ||||||||
| Preferred stock dividends | (4,418 | ) | (4,419 | ) | (3,928 | ) | |||||
| Repurchase of common stock, for treasury | (29,364 | ) | (70,378 | ) | (36,838 | ) | |||||
| Proceeds from common stock issued pursuant to stock option exercise | 1,921 | 4,108 | 4,894 | ||||||||
| Proceeds from long-term debt | — | 52,500 | 34,000 | ||||||||
| Repayment of long-term debt | — | (357,450 | ) | (305,125 | ) | ||||||
| Payment of contingent consideration | — | — | (7,496 | ) | |||||||
| Other financing activities | (1,927 | ) | (1,182 | ) | (286 | ) | |||||
| Net cash used in financing activities | (33,788 | ) | (376,821 | ) | (234,112 | ) | |||||
| Effect of exchange rate changes on cash | 978 | (1,357 | ) | (911 | ) | ||||||
| Net change in cash | 23,048 | (12,508 | ) | (75,636 | ) | ||||||
| Cash at beginning of period | 72,262 | 84,770 | 160,406 | ||||||||
| Cash at end of period | $ | 95,310 | $ | 72,262 | $ | 84,770 | |||||
| Year ended December 31, | |||||||||||
| Supplemental cash flow information | 2017 | 2016 | 2015 | ||||||||
| Cash included in current assets of discontinued operations held for sale | $ | — | $ | — | $ | 5,014 | |||||
| Cash paid for interest | $ | 987 | $ | 9,768 | $ | 16,699 | |||||
| Cash paid for income taxes | $ | 18,128 | $ | 55,827 | $ | 21,555 | |||||
| Proceeds receivable from option exercise | $ | 562 | $ | — | $ | — | |||||
| Purchases of equipment in accounts payable and accrued liabilities | $ | 1,362 | $ | 983 | $ | 930 | |||||
| Accrued unfunded future equity investment capital contributions | $ | — | $ | — | $ | 4,654 | |||||
| Note receivable issued for sale of property | $ | — | $ | 3,130 | $ | — | |||||
| Purchase of equipment through capital lease obligation | $ | 1,474 | $ | 4,547 | $ | — | |||||
| Acquisitions: | |||||||||||
| Purchase price | $ | — | $ | — | $ | — | |||||
| Less: | |||||||||||
| Working capital adjustments to purchase price | — | — | (3,433 | ) | |||||||
| Acquisitions, net of cash acquired | $ | — | $ | — | $ | 3,433 | |||||
Notes to the Consolidated Financial Statements
December 31, 2017
1. Organization and Basis of Presentation
Description of Business
Basis of Presentation
The Company follows accounting standards setestablished by the Financial Accounting Standards Board (“FASB”). The FASB establishes accounting principles generally accepted in the United States (“GAAP”). Rules and interpretive releases of the Securities and Exchange Commission (“SEC”) under the authority of federal securities laws are also sources of authoritative GAAP for SEC registrants. References to GAAP issued by the FASB in these footnotesnotes are to the FASB Accounting Standards Codification (“ASC”), which serves as athe single source of authoritative non-SEC accounting and applicable reporting standards to be applied byfor non-governmental entities. All amounts are presented in U.S. dollars unless otherwise noted.
The Company holds investments that are accountedaccounts for its investment in Matrix using the equity method. Themethod, as the Company does not control the decision-making process or business management practices of these affiliates.Matrix. While the Company has access to certain information and performs certain procedures to review the reasonableness of information, the Company relies on the management of these affiliatesMatrix to provide accurate financial information prepared in accordance with GAAP. The Company receives audit reports relating to such financial information from the significant affiliates’Matrix’s independent auditors on an annual basis. The Company is not aware of any errors in or possible misstatements of the financial information provided by its equity affiliatesMatrix that would have a material effect on the Company’s consolidated financial statements. See Note 6, Equity Investment, for further information.
Liquidity
As of the issuance date of these consolidated financial statements, the Company expects its current period presentation.cash and cash equivalents of $2.2 million and accounts receivable, contract receivables, and other receivables of $375.1 million as of December 31, 2023, along with and cash flows from operations and amounts currently available under the New Credit Facility will be sufficient to fund its operating expenses and expenditure requirements for the next twelve months. This assessment is based on assumptions, and operating projections, including projected cash generated by operations, may change as a result of many factors currently unknown or unknowable to the Company. The Company does not currently have sufficient available cash flows to repay our Senior Notes due 2025 in full when due. Accordingly, the Company expects to be required to raise additional capital to repay or refinance this debt prior to its maturity date on November 15, 2025.
Impact of the COVID-19 Pandemic
On May 11, 2023, the Department of Health and Human Services ("HHS") declared the end of the public health emergency ("PHE") for the COVID-19 pandemic. While the Company has continued to experience increased trip volume, service hours, and patient visits each year following the pandemic, structural changes in the industry as a result of the pandemic,
86
as well as ongoing constraints on the labor market, specifically related to the strain on healthcare professionals, could continue to have an adverse impact on the Company's financial statements. The Company continues to actively monitor the structural changes to the industry and the impact these have on our business and results of operations with emphasis on protecting the health and safety of its employees, maximizing the availability of its services and products to support SDoH, and supporting the operational and financial stability of its business.
Federal, state, and local authorities have taken several actions designed to assist healthcare providers in providing care to COVID-19 and other patients and to mitigate the adverse economic impact of the COVID-19 pandemic. Legislative actions taken by the federal government include the CARES Act and the American Rescue Plan Act of 2021 ("ARPA"). Through the CARES Act, the federal government has authorized payments to be distributed to healthcare providers through the Public Health and Social Services Emergency Fund ("Provider Relief Fund" or "PRF"). Through ARPA the Coronavirus State and Local Fiscal Recovery Fund ("SLFRF") was established to send relief payments to state and local governments impacted by the pandemic to assist with responding to the PHE including the economic hardships that continue to impact communities and to respond to workers performing essential work during the COVID-19 PHE, including providers. These funds are not subject to repayment; provided we are able to attest to and comply with any terms and conditions of such funding, as applicable. See discussion of grant income at Note 2, Significant Accounting Policies and Recent Accounting Pronouncements, for additional information on other reclassifications..
2. Significant Accounting Policies and Recent Accounting Pronouncements
Principles of Consolidation
The accompanying consolidated financial statements include The Providence Service Corporation,ModivCare Inc., its wholly-owned subsidiaries, and entities it controls, or in which it has a variable interest and is the primary beneficiary of expected cash profits or losses. The Company records its investments in entities that it does not control, but over which it has the ability to exercise significant influence, using the equity method. The Company has eliminated significant intercompany transactions and accounts.
Accounting Estimates
The Company uses estimates and assumptions in the preparation of the consolidated financial statements in accordance with GAAP. Those estimates and assumptions affect the reported amounts of assets and liabilities and disclosure of contingent assets and liabilities as of the date of the Company’s consolidated financial statements. These estimates and assumptions also affect the reported amount of net income or loss during any period. The Company’s actual financial results could differ significantly from these estimates. The significant estimates underlying the Company’s consolidated financial statements include revenue recognition; allowance for doubtful accounts; accrued transportation costs; accrued restructuring; income taxes; recoverability of current and long-lived assets, including equity method investments; intangible assets and goodwill; loss contingencies; accounting for business combinations, including amounts assigned to definite and indefinite lived intangibles and contingent consideration; and loss reserves for reinsurance and self-funded insurance programs;programs.
Fair Value Measurements
The Company follows FASB ASC Topic 820, Fair Value Measurement (“ASC 820”) which establishes a three-level valuation hierarchy for disclosure of fair value measurements. The valuation hierarchy categorizes assets and stock-based compensation.liabilities measured at fair value into one of three different levels depending on the observability of the inputs employed in the measurement. The three levels are defined as follows:
–Level 1: Quoted Prices in Active Markets for Identical Assets – inputs to the valuation methodology are quoted prices in active markets as of the measurement date for identical assets or liabilities.
–Level 2: Significant Other Observable Inputs – inputs to the valuation methodology are based upon quoted prices for similar assets and liabilities in active markets, quoted prices for identical or similar assets and liabilities in markets that are not active, and inputs other than quoted prices that are observable for the asset or liability, either directly or indirectly, for substantially the full term of the financial instrument.
–Level 3: Significant Unobservable Inputs – inputs to the valuation methodology are unobservable and significant to the fair value measurement.
A financial instrument’s categorization within the valuation hierarchy is based upon the lowest level of input that is significant to the fair value measurement. The Company’s assessment of the significance of a particular input to the fair value measurement in its entirety requires judgment and considers factors specific to the asset or liability. As of December 31, 2023
87
and 2022, the carrying amount for cash and cash equivalents, accounts receivable (net of allowance for credit losses), current assets and current liabilities was equal to or approximated fair value due to their short-term nature or proximity to current market rates. Fair values for our publicly traded debt securities are based on quoted market prices, when available. See Note 11, Debt, for the fair value of our long-term debt.
Cash and Cash Equivalents
Cash and cash equivalents include all cash balances and highly liquid investments with an initial maturity of three months or less. Investments in cash equivalents are carried at cost, which approximates fair value. The Company places its temporary cash investments with high credit quality financial institutions. At times, such investments may be in excess of the federally insured limits.
Restricted Cash
| December 31, | |||||||
| 2017 | 2016 | ||||||
| Collateral for letters of credit - Reinsured claims losses | $ | — | $ | 2,265 | |||
| Escrow/Trust - Reinsured claims losses | 6,296 | 11,865 | |||||
| Restricted cash for reinsured claims losses | 6,296 | 14,130 | |||||
| Less current portion | 1,091 | 3,192 | |||||
| Restricted cash, less current portion | $ | 5,205 | $ | 10,938 | |||
Accounts Receivable and Allowance for Doubtful Accounts
The Company records accounts receivable amounts at the contractual amount, less contractual revenue adjustments based on amounts expected to be due from payors and less an allowance for doubtful accounts. The Company maintains an allowance for doubtful accounts at an amount it estimates to be sufficient to cover the risk that an account will not be collected. The Company regularly evaluates itscollected due to credit risk. In order to establish the amount of the allowance related to the credit risk of accounts receivable, especiallythe Company considers information related to receivables that are past due, past loss experience, current and reassesses its allowance for doubtful accounts based on identified customer collection issues.forecasted economic conditions, and other relevant factors. In circumstances where the Company is aware of a customer’s inability to meet its financial obligation, the Company records a specific allowance for doubtful accounts to reduce its net recognized receivable to an amount the Company reasonably expects to collect. TheAs the Company also provides a general allowance, based upon historical experience. Under certainprimarily contracts with Medicaid and Medicare governmental payors, the Company is not subject to significant credit risk in the collection of NET Services, final payment is based on a reconciliation of actual utilization and cost, and the final reconciliation may require a considerable period of time. As of December 31, 2017 and 2016, accounts receivable under these reconciliation contracts totaled $42,054 and $45,287, respectively. In addition, certain government entities which WD Services serves remit payment substantially beyond the payment terms. The Company monitors these amounts due to the aging of receivables, but generally believes the balances are collectible. However, factors within those government entities could change and there can be no assurance that such changes would not result in an inability to collect the receivables.receivable.
The Company’s provision for doubtful accountsbad debt expense from continuing operations for the years ended December 31, 2017, 20162023, 2022 and 20152021 was $1,372, $2,892$4.0 million, $2.7 million and $1,369,$1.7 million, respectively.
Business Combinations
The Company accounts for acquisitions in accordance with ASC Topic 805, Business Combinations. The acquisition method of accounting requires the Company to make significant estimates and assumptions as of the date of the acquisition related to the determination of the fair values (primarily Level 3) of the tangible and intangible assets acquired and liabilities assumed, and related to the determination of estimated lives of the depreciable assets acquired. The Company recognizes goodwill at the amount by which the purchase price exceeds the fair value of identified assets acquired and liabilities assumed. See Note 3, Acquisitions, for further discussion of the Company’s acquisitions.
Property and Equipment
Property and equipment are stated at historical cost, net of accumulated depreciation, or at fair value if the assets were initially recorded as the result of a business combination or if the asset was remeasured due to an impairment. Depreciation is calculated using the straight-line method over the estimated useful life of the asset.asset to the Company. Maintenance and repairs are expensed as incurred. Gains and losses resulting from the disposition of an asset are reflected in operating expense.results of operations.
Internal-use Software
The Company develops and implements software for internal use to enhance the performance and capabilities of the technology infrastructure. The costs incurred for the development of the internal-use software are capitalized when they meet the internal-use software capitalization criteria outlined in ASC 350-40. The capitalized costs are amortized using the straight-line method over the estimated useful life of the software, ranging from 3 to 10 years.
In addition to acquired software, the Company capitalizes costs associated with cloud computing arrangements (“CCA”) that are service contracts. The CCA includes services which are used to support certain internal corporate functions as well as technology associated with revenue-generating activities. The capitalized costs are amortized using the straight-line
88
method over the term of the related CCA. As of December 31, 2023 and 2022, capitalized costs associated with CCA, net of accumulated amortization were $14.6 million and $11.9 million, respectively. The value of accumulated amortization as of December 31, 2023 and 2022 was $5.2 million and $2.2 million, respectively. Amortization expense during the years ended December 31, 2023, 2022, and 2021, totaled $2.9 million, $1.7 million and $0.5 million, respectively.
Recoverability of Goodwill
In accordance with ASC 350, Intangibles-Goodwill and Other, the Company reviews goodwill for impairment annually, orand more frequently if events and circumstances indicate that an asset may be impaired. Such circumstances could include, but are not limited to: (1) the loss or modification of significant contracts, (2) a significant adverse change in legal factors or in business climate, (3) unanticipated competition, (4) an adverse action or assessment by a regulator, or (5) a significant decline in the Company’s stock price. We performIn connection with the 2023 annual assessment of goodwill, the Company changed the date of its annual assessment from October 1 to July 1.
When evaluating goodwill for impairment, test for all reporting units as of October 1.
The Company estimatesperformed a quantitative test comparing the carrying value of the Company's reporting units with their respective fair value. The fair value of the Company’sCompany's reporting units is estimated using either an income approach, a market valuation approach, a transaction valuation approach, or a blended approach. The income approach produces an estimated fair value of a reporting unit based on the present value of the cash flows the Company expects the reporting unit to generate in the future. Estimates included in the discounted cash flow model are primarily Level 3 inputs and include the discount rate, which the Company determines based on adjusting an industry-wide weighted-average cost of capital for size, geography, risk free rates, and company specific risk factors, long-term rates of growth and profitability of the Company’s business, working capital effects and planned capital expenditures. The market approach produces an estimated fair value of a reporting unit based on a comparison of the reporting unit to comparable publicly traded entities in similar lines of business. The transaction valuation approach produces an estimated fair value of a reporting unit
As discussed in Note 6, Goodwilla result of the Company's annual goodwill assessment, the Company recorded a $183.1 million impairment of goodwill within its PCS and Intangibles, theRPM reporting units. The Company determined that based on its qualitative assessment for each reporting unit, factors existed which required the Company to test its goodwill was impairedand indefinite-lived intangible assets for impairment. These factors included a decline in the WD Services segment duringmarket price of the year ended December 31, 2016,Company's common stock, industry specific regulatory pressures such as Medicaid redetermination and the Centers for Medicare and Medicaid Services ("CMS") proposed ruling on Ensuring Access to Medicaid Services, and general economic and market volatility. As a result, the Company recorded an asset impairment charge relatedperformed a quantitative assessment using a blend of both the income approach and the market approach to estimate the fair value of the reporting units and determined that the goodwill at its goodwill of $5,224. The Company did not record any impairment chargesPCS and RPM reporting units was impaired. See Note 9, Goodwill and Intangible Assets, for the year ended December 31, 2017. The Company recorded $1,593 of impairment charges related to its Human Services segment during the year ended December 31, 2015, which is included in "Discontinued operations, net of tax" in the consolidated statements of income.additional details.
Recoverability ofIntangible Assets Subject to Amortization and Other Long-Lived Assets
Intangible assets subject to amortization and other long-lived assets are carried at cost and are amortized or depreciated on a straight-line basis over their estimated useful lives of 52 to 15 years. In accordance with ASC 360, Property, Plant, and Equipment, the Company reviews the carrying value of long-lived assets or groups of assets to be used in operations whenever events or changes in circumstances indicate that the carrying amount of the assets may be impaired. Factors that may necessitate an impairment assessment include, among others, significant adverse changes in the extent or manner in which an asset or group of assets is used, significant adverse changes in legal factors or the business climate that could affect the value of an asset or group of assets or significant declines in the observable market value of an asset or group of assets. The presence or occurrence of those events indicates that an asset or group of assets may be impaired. In those cases, the Company assesses the recoverability of an asset or group of assets by determining whether the carrying value of the asset or group of assets exceeds the sum of the projected undiscounted cash flows expected to result from the use and eventual disposition of the assets over the remaining economic life of the asset or the primary asset in the group of assets. If such testing indicates the carrying value of the asset or group of assets is not recoverable, the Company estimates the fair value of the asset or group of assets using appropriate valuation methodologies, which would typically include an estimate of discounted cash flows. If the fair value of
89
those assets or groups of assets is less than carrying value, the Company records an impairment loss equal to the excess of the carrying value over the estimated fair value. As discussed in Note 6, Goodwill and Intangibles, the Company determined that the WD Services segment’s intangible assets and property and equipment were impaired during the year ended December 31, 2016, and the Company recorded asset impairment charges of $9,983 and $4,381 to property and equipment and customer relationship intangible assets, respectively. The Company did not record any impairment charges for the years ended December 31, 2017 and 2015.
Accrued Transportation Costs
Deferred Financing Costs and Debt Discounts
The Company capitalizes direct expensescosts incurred in connection with its credit facilities and other borrowings, referred to as deferred financing costs, and amortizes such expensescosts over the life of the respective credit facility or other borrowings. Fees charged by lenders onCosts associated with the revolving facility and all fees charged by third parties are recordedcapitalized as deferred financing costs and fees charged by lendersincluded in "Prepaid expenses and other current assets" on the consolidated balance sheets. Costs associated with term loans are recordedcapitalized and included as a reduction to the debt discount.balance on the consolidated balance sheets. Deferred financing costs for the revolving loan, net of amortization, totaling $388totaled $2.6 million and $1,070$3.1 million as of December 31, 20172023 and 2016, respectively,2022, respectively. Debt discounts for the $500.0 million Senior Unsecured Notes due 2025 of $6.0 million and $8.9 million are included in “Prepaid expenses and other” and “Other assets”, respectively,netted against the outstanding balance of the long-term debt on the consolidated balance sheetsheets as there were no borrowingsof December 31, 2023 and 2022, respectively. Debt discounts for the $500.0 million Senior Unsecured Notes due 2029 of $10.3 million and $11.7 million are netted against the outstanding underbalance of the Company’s credit facility.long-term debt on the consolidated balance sheets as of December 31, 2023 and 2022, respectively.
Revenue Recognition
The Company holds different contract types under its different segments of business. In the NEMT segment, there are both capitated contracts, under which payors pay a fixed amount monthly per eligible member and revenue is recognized over each distinct service period, and fee-for-service ("FFS") contracts, under which the Company bills and collects a specified amount for each service that is provided and revenue is recognized using the right to invoice practical expedient. In the PCS segment, contracts are also FFS and service revenue is reported at the estimated net realizable amount from patients and third-party payors for services rendered and revenue is recognized using the right to invoice practical expedient. Under RPM contracts, payors pay per-enrolled-member-per-month, based on the following criteria: persuasive evidence that an arrangement exists, services have been rendered, the price is fixed or determinableenrolled membership, and collectability is reasonably assured.
90
Government Grants
The Company has received government grants primarily under the CARES Act PRF and the ARPA SLFRF to provide economic relief and stimulus to combat health and economic impacts of time general services will be provided (i.e. the personCOVID-19 pandemic. During the third quarter of 2023, the Company also filed amended payroll tax returns for 2020 and 2021 to claim refunds for Employee Retention Credits ("ERC"). ERC is placeda U.S. federal tax credit introduced to support businesses and organizations during the COVID-19 pandemic that was initially established under the CARES Act in 2020 and was later expanded and extended by subsequent legislation, including the Consolidated Appropriations Act of 2021 and the American Rescue Plan Act of 2021. The Company received distributions from government grants of approximately $21.8 million and $16.3 million during the years ended December 31, 2023 and 2022, respectively, of which $5.0 million and $7.4 million were recognized as "Grant income" during the years ended December 31, 2023 and 2022, respectively, with the remaining balance recorded in "Accrued expenses and other current liabilities." Distributions received under these acts are targeted to assist with incremental health care related expenses or lost revenue attributable to the COVID-19 pandemic as well as provide stimulus to support long-term growth and recovery.
The payments from these acts are subject to certain restrictions and possible recoupment if not used for designated purposes. As a job or reachescondition to receiving PRF distributions, providers must agree to certain terms and conditions, including, among other things, that the maximum time periodfunds are being used for healthcare related expenses and lost revenues attributable to COVID-19, as defined by HHS. All recipients of PRF payments are required to comply with the reporting requirements described in the terms and conditions and as determined by HHS. The Company has submitted the required documents to meet reporting requirements for the program).applicable reporting periods. The estimated period of time services will be rendered is based upon historical data. Job placement, job outcome and sustainment fee revenue is recognized when certain milestones are achieved, and amounts become billable. Incentive fee revenue is generally recognized when fixed and determinable, frequently at the endCompany received an audit inquiry letter from HHS related to one of the cumulative calculation period, unless contractualbusiness units that received PRF payments, to which the Company has responded and submitted all requested information and believes that the payments received are substantiated and within the terms allow for earned payments on a fixed or ratable basis.
As a condition to receiving SLFRF, providers must agree to use the funds to respond to the PHE or its costs accordingly, or ifnegative economic impacts, to respond to workers performing essential work by providing premium pay to eligible workers and to offset reduction in revenue due to the volume or typesCOVID-19 PHE as stipulated by the states in which the funds were received. All recipients of referralsSLFRF payments are lower than estimated, our profitability may be negatively impacted. Volume levels are typically not guaranteed under contracts.
The Company recognizes distributions from government grants as "Grant income" or "Accrued expenses and other current liabilities" in line with the loss of revenues or expenses for which the grants are rendered.intended to compensate when there is reasonable assurance that it has complied with the conditions associated with the grant.
Stock-Based Compensation
The Company follows the fair value recognition provisions of ASC Topic 718 – Compensation – Stock Compensation (“ASC 718”), which requires companies to measure and recognize compensation expense for all share basedshare-based payments at fair value.
•The Company calculates the fair value of stock options using the Black-Scholes option-pricing formula. The fair value of non-vested restricted stock grantsawards or units is determined based on the closing market price of the Company’s Common Stock on the date of grant. Stock-based compensation expense charged against income for stock options and stock grants is based on the grant-date fair value. Forfeitures are recorded as they occur. The expense for stock-based compensation awards is amortized on a straight-line basis over the requisite service period, which is typically the vesting period.
•The Company records restricted stock units (“RSUs”) that may be settled by the holder in cash, rather than shares, as a liability and remeasures these liabilities at fair value at the end of each reporting period. Forfeitures are recorded as they occur. Upon settlement of these awards, the totalcumulative compensation expense recorded over the vesting period of the awards will equal the settlement amount, which is based on the Company’s stock price on the settlement date.
period.
Income Taxes
Deferred income taxes are determined by the asset and liability method in accordance with ASC Topic 740 - IncomeTaxes. Under this method, deferred tax assets and liabilities are determined based on differences between the carrying amounts
91
of assets and liabilities for financial reporting purposes and the amounts used for income tax purposes and are measured using the enacted tax rates and laws that are expected to be in effect when the differences are expected to reverse. The Company considers many factors when assessing the likelihood of future realization of deferred tax assets, including recent earnings experience by jurisdiction, expectations of future taxable income, and the carryforward periods available for tax reporting purposes, as well as other relevant factors. The Company establishes a valuation allowance to reduce deferred tax assets to the amount that is more likely than not to be realized. The net amount of deferred tax liabilities and assets, net of the valuation allowance, is presented as non-current in the Company's consolidated balance sheets.
Due to inherent complexities arising from the nature of the Company’s businesses, future changes in income tax law or variances between the Company’s actual and anticipated operating results, the Company makes certain judgments and estimates. Therefore, actual income taxes could materially vary from these estimates.
The Company has recorded a valuation allowance which includes amounts for net operating lossescertain carryforwards and deferred tax credit carryforwards,assets, as more fully described in Note 17, 16, Income Taxes, for which the Company has concluded that it is more likely than not that these net operating losscarryforwards and deferred tax credit carryforwardsassets will not be realized in the ordinary course of operations.
The Company recognizes interest and penalties related to income taxes as a component of income tax expense.
The Company accounts for uncertain tax positions based on a two-step process of evaluating recognition and measurement criteria. The first step assesses whether the tax position is more likely than not to be sustained upon examination by the tax authority, including resolution of any appeals or litigation, based on the technical merits of the position. If the tax position meets the more likely than not criteria, the portion of the tax benefit greater than 50%50.0% likely to be realized upon settlement with the tax authority is recognized in the consolidated financial statements.
On December 22, 2017,March 27, 2020, the U.S. bill commonly referred to as the Tax Cuts and JobsCARES Act (“Tax Reform Act”) was enacted as more fully described inenacted. See Note 17, 16, Income Taxes.
Loss Reserves for Certain Reinsurance and Self-Funded Insurance Programs
The Company historically reinsured a substantial portion of its automobile, general and professional liability and workers’ compensation costs under certain reinsurance programs primarily through the Company’s wholly-owned subsidiary, Social Services Providers Captive Insurance Company (“SPCIC”), a licensed captive insurance company domiciled in the State of Arizona. As of May 16, 2017, SPCIC did not renew the expiring reinsurance policies. SPCIC will continue to resolve claims under the historical policy years.
programs. The Company utilizes a report prepared by an independent actuary to estimate the gross expected losses related to historical automobile, general and professional and workers’ compensation liabilitythese reinsurance policies, including the estimated losses in excess of SPCIC’s insuranceinsured limits, which would be reimbursed to SPCICthe Company to the extent such losses were incurred. As of December 31, 20172023 and 2016,2022, the Company had reserves of $6,699$20.2 million and $11,240,$16.0 million, respectively, for the automobile, general and professional liability and workers’ compensation reinsurance policies, net of expected receivables for losses in excess of SPCIC’s historical insurance limits.policies. The gross reserve as of December 31, 20172023 and 20162022 of $12,448$45.7 million and $16,505,$37.1 million, respectively, is classified as “Reinsurance liability reserves”current liabilities and “Otherother long-term liabilities”liabilities in the consolidated balance sheets. The estimated amount to be reimbursed to SPCICthe Company as of December 31, 20172023 and 20162022 was $5,749$25.5 million and $5,265,$21.1 million, respectively, and is classified as “Other receivables” and “Other assets”other long-term assets in the consolidated balance sheets.
The Company regularly analyzes its reserves for incurred but not reported claims, and for reported but not paid claims related to its reinsurance and self-funded insurance programs. The Company believes its reserves are adequate. However, judgment is involved in assessing these reserves, such as in assessing historical paid claims, average lag times between the claims’ incurred date, reported dates and paid dates, and the frequency and severity of claims. There may be differences between actual settlement amounts and recorded reserves and any resulting adjustments are included in expense once a probable amount is known.
Self-Funded Insurance Programs
The Company also maintains a self-funded health insurance program with a stop-loss umbrella policy with a third-party insurer to limit the maximum potential liability for individual claims generally to $275$0.3 million per person, subject to an aggregating stop-loss limit of $400.$0.4 million. In addition, the program has a total stop-loss limit for total claims, in order to limit the Company’s exposure to catastrophic claims. With respect to this program, the Company considers historical and projected medical utilization data when estimating its health insurance program liability and related expense. As of December 31, 20172023 and 2016,2022, the Company had $2,229$1.8 million and $3,022,$2.1 million, respectively, in reservereserves for its self-funded health insurance programs. The reserves are classified as “Reinsurance“Accrued expenses and related liability reserves”other current liabilities” in the consolidated balance sheets.
92
Earnings (Loss) Per Share
The Company computes basic earnings (loss) per share by taking net income (loss) attributable to the Company available to common stockholders divided by the weighted average number of common shares outstanding during the period, including restricted stock and stock held in escrow if such shares are participating securities. Diluted earnings (loss) per share includes the potential dilution that may occur from stock-based awards and other stock-based commitments using the treasury stock or the as-if converted methods, as applicable. For additional information on how the Company computes earnings (loss) per share, see Note 14, Earnings (Loss) Per Share.
Recent Accounting Pronouncements
In November 2015, the FASB issued Accounting Standards Update (“ASU”) No. 2015-17, Income Taxes (Topic 740): Balance Sheet Classification of Deferred Taxes (“ASU 2015-17”), which changes how deferred taxes are classified on organizations’ balance sheets. The ASU eliminates the current requirement for organizations to present deferred tax liabilities and assets as current and noncurrent in a classified balance sheet. Instead, organizations will be required to classify all deferred tax assets and liabilities as noncurrent. The amendments apply to all organizations that present a classified balance sheet. For public companies, the amendments are effective for financial statements issued for annual periods beginning after December 16, 2016, and interim periods within those annual periods. The Company adopted ASU 2015-17 retrospectively on January 1, 2017, which resulted in the reclassification of the December 31, 2016 deferred tax assets-current balance of $6,825 and non-current deferred tax assets of $2,493 to long-term deferred tax liabilities in the amount of $9,318.
In June 2016,December 2023, the FASB issued ASU No. 2016-13, Financial Instruments – Credit Losses2023-09, Income Taxes (Topic 326) (“740): Improvements to Income Tax Disclosures ("ASU 2016-13”2023-09"). The amendmentsThis update enhances the transparency and decision usefulness of income tax disclosures including updates to the disclosures related to the rate reconciliation and income taxes paid. These updates improve transparency by requiring consistent categories and greater disaggregation of information in the rate reconciliation and requiring income taxes paid to be disaggregated by jurisdiction. ASU 2016-13 will supersede or clarify much of the existing guidance for reporting credit losses for assets held at amortized cost basis and available for sale debt securities. The amendments in ASU 2016-13 affect loans, debt securities, trade receivables, net investments in leases, off balance sheet credit exposures, reinsurance receivables, and any other financial assets not excluded from the scope that have the contractual right to receive cash. ASU 2016-132023-09 is effective for financial statements issued for fiscal years beginning after December 15, 2019, with early adoption permitted for fiscal years beginning after December 15, 2018. The Company has not evaluated the impact of ASU 2016-13 on its consolidated financial statements.
93
3. Acquisitions
Business Combinations
Care Finders Total Care, LLC
On September 14, 2021, the Company acquired Care Finders which is a personal care provider in the Northeast, with operations in New Jersey, Pennsylvania, and interim periods within those fiscal years. Early adoption is permitted, including adoptionConnecticut. The acquisition of Care Finders broadens access to in-home personal care solutions for patients and supports the Company's strategy to expand its personal care platform.
The equity transaction was accounted for in an interim period; however, any adjustments must be reflectedaccordance with ASC 805, Business Combinations in which a wholly-owned subsidiary of ModivCare Inc. acquired 100.0% of the equity securities of Care Finders for $333.4 million (a purchase price of $344.8 million less $11.4 million of cash that was acquired).
The following table summarizes information from the allocation of the consideration transferred to acquired identifiable assets and assumed liabilities as of the beginningacquisition date of September 14, 2021 (in thousands):
| Cash | $ | 11,424 | |||
Accounts receivable(1) | 14,708 | ||||
Prepaid expenses and other(2) | 2,625 | ||||
Property and equipment(3) | 2,527 | ||||
Inventories(4) | 231 | ||||
Operating right of use asset(5) | 1,939 | ||||
Intangibles(6) | 100,750 | ||||
Goodwill(7) | 232,103 | ||||
Other assets(8) | 226 | ||||
Accounts payable(9) | (2,720) | ||||
Accrued expenses and other accrued liabilities(9) | (14,344) | ||||
Operating lease liability(5) | (1,939) | ||||
Deferred tax liabilities(10) | (2,327) | ||||
Other liabilities(9) | (378) | ||||
| Total of assets acquired less liabilities assumed | $ | 344,825 | |||
(1) Management has valued accounts receivable based on the estimated future collectability of the fiscal year that includes that interim period. ASU 2016-18 must be adopted retrospectively. receivables portfolio.
(2) Given the short-term nature of the balance of prepaid expenses, the carrying value represents the fair value.
(3) The acquired property and equipment consists primarily of capitalized software, computer equipment, and automobiles. The fair value of the property and equipment was determined based upon the best and highest use of the property with final values determined using cost and comparable sales methods.
(4) Given the short-term nature of the balance of inventories, the carrying value represents the fair value.
(5) The fair value of the operating lease liability and corresponding right-of-use asset (current and long-term) was recorded at $1.9 million based on market rates available to the Company.
(6) The allocation of consideration exchanged to intangible assets acquired is as follows (in thousands, except useful lives):
| Type | Useful Life | Value | |||||||||
| Payor network | Amortizable | 7 years | $ | 97,200 | |||||||
| Trade name | Amortizable | 3 years | 1,950 | ||||||||
| Non-compete agreement | Amortizable | 5 years | 1,600 | ||||||||
| $ | 100,750 | ||||||||||
94
The Company valued the payor network utilizing the multi-period excess earnings method, trade names utilizing the relief-from-royalty method and non-compete agreement utilizing the with/without method. The weighted average useful life of the acquired intangible assets is approximately 6.9 years.
(7) The acquisition initially resulted in $232.2 million of goodwill as a result of expected synergies due to future customers driven by expansion into different markets, an increase in market share, and a growing demographic that will adopt ASU 2016-15 on January 1, 2018.need home care solutions. In the third quarter of 2022, goodwill decreased by $0.1 million as a result of changes to accounts payable and deferred tax liabilities, as discussed in detail below. All of the acquired goodwill is deductible for tax purposes.
(8) Included in other assets are security deposits with a value of $0.2 million.
(9) Due to the short-term nature of the accounts, the carrying value is assumed to represent the fair value for accounts payable as well as certain other current liabilities as of the acquisition date. The adoption will impactcarrying value for non-current liabilities is also assumed to represent the fair value as of the acquisition date. In the third quarter of 2022, it was determined that an additional $0.2 million of accounts payable existed as of the acquisition date, and therefore, the initial balance of $2.5 million was increased to $2.7 million.
(10) Net deferred tax liabilities represent the expected future tax consequences of temporary differences between the fair values of the assets acquired and liabilities assumed and their tax basis. In the third quarter of 2022, deferred tax liabilities of $2.6 million decreased by $0.3 million due to tax impacts of the acquisition.
VRI Intermediate Holdings, LLC
On September 22, 2021, the Company acquired VRI, a provider of remote patient monitoring solutions that manages a comprehensive suite of services including personal emergency response systems, vitals monitoring and data-driven patient engagement solutions. The acquisition of VRI accelerates the Company's consolidated statementsstrategy to build a holistic suite of supportive care solutions that address SDoH, introduces new technology-enabled in-home solutions that deepen the Company's engagement with payors and patients, and adds a new suite of services and operating team to advance the Company's broader technology and data strategy.
The stock transaction was accounted for in accordance with ASC 805, Business Combinations in which a wholly-owned subsidiary of ModivCare Inc. acquired 100.0% of the equity securities of VRI for $314.6 million (a purchase price of $317.5 million less $2.9 million of cash flowthat was acquired).
The following table summarizes the allocation of the consideration transferred to acquired identifiable assets and assumed liabilities as of the acquisition date of September 22, 2021 (in thousands):
| Cash | $ | 2,922 | |||
Accounts receivable(1) | 6,800 | ||||
Inventory(2) | 1,684 | ||||
Prepaid expenses and other(3) | 805 | ||||
Property and equipment(4) | 14,908 | ||||
Intangible assets(5) | 75,590 | ||||
Goodwill(6) | 236,317 | ||||
Accounts payable and accrued liabilities(7) | (1,884) | ||||
Accrued expense(7) | (2,487) | ||||
Deferred revenue(7) | (67) | ||||
Deferred tax liabilities(8) | (17,070) | ||||
| Total of assets acquired less liabilities assumed | $ | 317,518 | |||
(1) Management has valued accounts receivable based on the estimated future collectability of the receivables portfolio.
(2) Given the short-term nature of the balance of inventories, the carrying value represents the fair value.
(3) Given the short-term nature of the balance of prepaid expenses, the carrying value represents the fair value.
(4) The acquired property and equipment consists primarily of personal emergency response system devices, with the remainder consisting of computer equipment, buildings and other equipment. The Company valued the personal emergency response system devices, computer equipment and other equipment utilizing the cost approach at $12.7
95
million. The carrying value of the remainder of the property and equipment, consisting primarily of buildings and land, is assumed to represent the fair value.
(5) The allocation of consideration exchanged to intangible assets acquired is as follows (in thousands, except useful lives):
| Type | Useful Life | Value | |||||||||
| Payor network | Amortizable | 7 years | $ | 72,150 | |||||||
| Trade name | Amortizable | 3 years | 890 | ||||||||
| Developed technology | Amortizable | 3 years | 2,550 | ||||||||
| $ | 75,590 | ||||||||||
The Company valued payor network utilizing the multi-period excess earnings method, trade names utilizing the relief-from-royalty method and developed technology utilizing the cost approach. The weighted average useful life of the acquired intangible assets is approximately 6.8 years.
(6) The acquisition initially resulted in $236.7 million of goodwill as a result of expected synergies due to future customers driven by expansion into different markets and an increase in market share. In the third quarter of 2022, goodwill decreased by $0.4 million due to a decrease in deferred tax liabilities, as discussed in more detail below. The related goodwill is not deductible for tax purposes.
(7) Due to the short-term nature of the accounts, the carrying value is assumed to represent the fair value for accounts payable as well as certain other current liabilities as of the acquisition date. The carrying value for non-current liabilities is also assumed to represent the fair value as of the acquisition date.
(8) Net deferred tax liabilities represent the expected future tax consequences of temporary differences between the fair values of the assets acquired and liabilities assumed and their tax basis. In the third quarter of 2022, deferred tax liabilities of $17.5 million decreased by $0.4 million due to tax impacts of the acquisition.
Guardian Medical Monitoring
On May 11, 2022, the Company has restricted cash totaling $6,296 at December 31, 2017. Additionally,acquired Guardian Medical Monitoring ("GMM"), a provider of remote patient monitoring solutions that manages a comprehensive suite of services including personal emergency response systems and medication management. The acquisition of GMM supports the Company's strategy to expand its RPM segment and enhances the Company's suite of supportive care solutions that address SDoH.
The stock transaction was accounted for in accordance with ASC 805, Business Combinations in which a wholly-owned subsidiary of the Company will be requiredacquired 100.0% of the equity securities of GMM for $71.2 million (a purchase price of $71.6 million less $0.4 million of cash that was acquired).
The following table summarizes the allocation of the consideration transferred to makeacquired identifiable assets and assumed liabilities as of the acquisition date of May 11, 2022 (in thousands):
Cash(1) | $ | 391 | |||
Accounts receivable(2) | 2,355 | ||||
Prepaid expenses and other(3) | 771 | ||||
Property and equipment(4) | 2,639 | ||||
Intangible assets(5) | 21,950 | ||||
Goodwill(6) | 44,346 | ||||
Accounts payable(7) | (281) | ||||
Accrued expenses and other current liabilities(7) | (577) | ||||
| Total of assets acquired less liabilities assumed | $ | 71,594 | |||
(1) During 2022, the Company received an additional disclosures detailing$0.1 million of cash related to net working capital adjustments, and therefore, the initial balance of $0.3 million was increased to $0.4 million.
96
(2) Management has valued accounts receivable based on the estimated future collectability of the receivables portfolio. During 2022, it was determined that $0.6 million of the initial accounts receivable balance was uncollectible, and therefore, the initial balance of $3.0 million was decreased to $2.4 million.
(3) Given the short-term nature of the balance sheet line itemsof prepaid expenses and other assets, the carrying value represents the fair value.
(4) The acquired property and equipment consists primarily of personal emergency response system devices, with the remainder consisting of computer equipment and furniture and fixtures. The Company valued the personal emergency response system devices utilizing the cost approach. Through this valuation, it was determined that $0.1 million of acquired property and equipment did not exist, and therefore, the initial balance of $2.7 million was decreased to $2.6 million. The carrying value of the remainder of the property and equipment, consisting primarily of computer equipment and furniture and fixtures, is assumed to represent the fair value.
(5) The allocation of consideration exchanged to intangible assets acquired is as follows (in thousands, except useful lives):
| Type | Useful Life | Value | |||||||||
| Payor network | Amortizable | 7 years | $ | 21,600 | |||||||
| Trade name | Amortizable | 2 years | 350 | ||||||||
| $ | 21,950 | ||||||||||
The Company valued the payor network utilizing the multi-period excess earnings method and trade names utilizing the relief-from-royalty method. The weighted average useful life of the acquired intangible assets is approximately 6.9 years.
(6) The acquisition initially resulted in $43.7 million of goodwill as a result of expected synergies due to future customers driven by expansion into different markets and an increase in market share. During the measurement period, accounts receivable was reduced by $0.6 million which caused a corresponding increase to goodwill. Also during the measurement period, cash increased by $0.1 million related to working capital adjustments, which caused a corresponding decrease to goodwill, and acquired property and equipment decreased by $0.1 million, which caused a corresponding increase to goodwill. The result of these adjustments was a total goodwill balance of $44.3 million. All of the acquired goodwill is deductible for tax purposes.
(7) Due to the short-term nature of the accounts, the carrying value is assumed to represent the fair value for accounts payable and accrued expenses and other current liabilities as of the acquisition date.
Since the date of the acquisition, GMM revenue of $11.9 million and net income of $1.8 million are included in the sumCompany's consolidated results of cash, cash equivalentsoperations.
Pro Forma Financial Information (unaudited)
Assuming Care Finders, VRI and restricted cashGMM had been acquired as of January 1, 2021, and the results of each had been included in operations beginning on the assumed acquisition date, the following table provides estimated unaudited pro forma results of operations for the years ended December 31, 2022, and 2021 (in thousands, except earnings per share). The estimated pro forma net income adjusts for the effect of fair value adjustments related to each of the acquisitions, transaction costs and other non-recurring costs directly attributable to the transactions and the impact of the additional debt to finance the applicable acquisitions.
| December 31, | |||||||||||
| 2022 | 2021 | ||||||||||
| Pro forma: | |||||||||||
| Revenue | $ | 2,510,875 | $ | 2,200,339 | |||||||
| Net loss | (32,770) | (21,547) | |||||||||
| Diluted earnings (loss) per share | $ | (2.33) | $ | (1.53) | |||||||
Estimated unaudited pro forma information is not necessarily indicative of the results that actually would have occurred had the acquisitions been completed on the date indicated or of future operating results. The supplemental pro forma
97
earnings were adjusted to exclude the impact of historical interest expense for Care Finders and VRI of $3.7 million and $3.2 million, respectively, for 2021. No adjustment related to interest expense was required for the year ended December 31, 2022.
Acquisition-related costs of approximately $2.0 million for GMM, were expensed as incurred, recorded in selling, general and administrative expenses during the year ended December 31, 2022, and are reflected in the consolidated statementspro forma table above at the assumed acquisition date. Acquisition-related costs of cash flow.
Asset Acquisitions
WellRyde
On May 6, 2021, the Company entered into an asset purchase agreement with nuVizz to purchase the software, WellRyde. Pursuant to the purchase agreement, the WellRyde software was acquired for total consideration of a share-based payment award$12.0 million in cash, subject to certain adjustments.
The consideration paid for the acquisition is as follows (in thousands):
| Value | ||||||||
| Consideration paid | $ | 12,000 | ||||||
| Transaction costs | 463 | |||||||
| Net consideration | $ | 12,463 | ||||||
The fair value allocation of the net consideration is as follows (in thousands, except useful lives):
| Type | Useful Life | Value | |||||||||
| Transportation management software | Amortizable | 10 years | $ | 12,328 | |||||||
| Assembled workforce | Amortizable | 10 years | 135 | ||||||||
| $ | 12,463 | ||||||||||
Other Asset Acquisition
On May 30, 2022, the Company entered into an asset purchase agreement with a private entity to an award should bepurchase certain customer contracts within our PCS segment. Pursuant to the purchase agreement, the contracts were acquired for total consideration of $7.6 million in cash, subject to certain adjustments.
The transaction was accounted for as a modification unless thean asset acquisition in accordance with ASC 805, Business Combinations. The fair value of the modified awardnet consideration is as follows (in thousands, except useful lives):
| Type | Useful Life | Value | |||||||||
| Payor network | Amortizable | 6 years | $ | 7,297 | |||||||
| Assembled workforce | Amortizable | 6 years | 309 | ||||||||
| $ | 7,606 | ||||||||||
4. Segments
The Company’s reportable segments are identified based on a number of factors related to how its Chief Operating Decision Maker ("CODM") determines the allocation of resources and assesses the performance of the Company’s operations. The CODM uses service revenue, net and operating income as the measures of gross revenue and profit or loss to assess
98
segment performance and allocate resources, and uses total assets as the measure of assets attributable to each segment. The Company's operating income for the reportable segments includes an allocated portion of corporate expenses to the respective segments and includes revenues and all other costs directly attributable to the specific segment.
The Company’s reportable segments are strategic units that offer different services under different financial and operating models to the Company’s customers. The segments are managed separately because each requires different technology and marketing strategies. The Company's CODM manages the Company under four reportable segments.
•NEMT - The Company's NEMT segment is the samelargest manager of non-emergency medical transportation programs for state governments and managed care organizations, or MCOs, in the U.S. This segment also holds the results of the Company's captive insurance program;
•PCS - The Company's PCS segment provides in home personal care services to State and Managed Medicaid, Medicare, and Private Pay patient populations in need of care monitoring and assistance performing activities of daily living;
•RPM - The Company's RPM segment provides remote patient monitoring solutions, including personal emergency response systems, vitals monitoring, medication management, and data-driven patient engagement solutions; and
•Corporate and Other - Effective January 1, 2022, the Company completed its segment reorganization which resulted in the addition of a Corporate and Other segment that includes the costs associated with the Company's corporate operations as well as the original award,results of an investment in innovation that the vesting conditions do not change,Company made at the end of the first quarter of 2023 related to our data analytics capabilities, which contributes to service revenue and service expense. The operating results of the Corporate and Other segment include activities related to executive, accounting, finance, internal audit, tax, legal, debt and the classificationrelated interest expense, and certain strategic and corporate development functions for each segment, the results of this investment in innovation, as an equitywell as the results of the Company's Matrix investment. Prior to the segment reorganization, the Company reported the investment in Matrix as a separate operating segment. Based on the relative size of the Matrix investment and all related activity to the overall financial statements, the CODM no longer views it as a separate operating segment but reviews results in conjunction with the other corporate results of the business. The Company reclassified certain costs associated with this reorganization for the year ended December 31, 2021 to conform to this presentation.
The following table sets forth certain financial information attributable to the Company’s business segments for the years ended December 31, 2023, 2022 and 2021 (in thousands):
| Year Ended December 31, 2023 | |||||||||||||||||||||||||||||
| NEMT | PCS | RPM | Corporate and Other | Total | |||||||||||||||||||||||||
| Service revenue, net | $ | 1,951,447 | $ | 715,615 | $ | 77,941 | $ | 6,167 | $ | 2,751,170 | |||||||||||||||||||
Grant income(1) | — | 5,037 | — | — | 5,037 | ||||||||||||||||||||||||
| Service expense | 1,709,790 | 561,919 | 27,025 | 5,484 | 2,304,218 | ||||||||||||||||||||||||
| General and administrative expense | 115,355 | 86,767 | 22,971 | 79,471 | 304,564 | ||||||||||||||||||||||||
| Depreciation and amortization | 27,409 | 51,402 | 24,536 | 924 | 104,271 | ||||||||||||||||||||||||
| Impairment of goodwill | — | 137,331 | 45,769 | — | 183,100 | ||||||||||||||||||||||||
| Operating income (loss) | $ | 98,893 | $ | (116,767) | $ | (42,360) | $ | (79,712) | $ | (139,946) | |||||||||||||||||||
| Equity in net income (loss) of investee, net of tax | $ | 1,057 | $ | — | $ | — | $ | (770) | $ | 287 | |||||||||||||||||||
| Equity investment | $ | 1,653 | $ | — | $ | — | $ | 39,878 | $ | 41,531 | |||||||||||||||||||
| Goodwill | $ | 135,186 | $ | 415,444 | $ | 234,894 | $ | 30 | $ | 785,554 | |||||||||||||||||||
| Total assets | $ | 542,100 | $ | 763,366 | $ | 344,527 | $ | 117,282 | $ | 1,767,275 | |||||||||||||||||||
99
| Year Ended December 31, 2022 | |||||||||||||||||||||||||||||
| NEMT | PCS | RPM | Corporate and Other | Total | |||||||||||||||||||||||||
| Service revenue, net | $ | 1,768,442 | $ | 667,674 | $ | 68,277 | $ | — | $ | 2,504,393 | |||||||||||||||||||
Grant income(1) | — | 7,351 | — | — | 7,351 | ||||||||||||||||||||||||
| Service expense | 1,487,447 | 520,065 | 24,562 | — | 2,032,074 | ||||||||||||||||||||||||
| General and administrative expense | 146,935 | 91,365 | 23,156 | 60,715 | 322,171 | ||||||||||||||||||||||||
| Depreciation and amortization | 28,709 | 51,025 | 19,854 | 827 | 100,415 | ||||||||||||||||||||||||
| Operating income (loss) | $ | 105,351 | $ | 12,570 | $ | 705 | $ | (61,542) | $ | 57,084 | |||||||||||||||||||
| Equity in net income (loss) of investee, net of tax | $ | 71 | $ | — | $ | — | $ | (30,035) | $ | (29,964) | |||||||||||||||||||
| Equity investment | $ | 186 | $ | — | $ | — | $ | 41,117 | $ | 41,303 | |||||||||||||||||||
| Goodwill | $ | 135,186 | $ | 552,775 | $ | 280,663 | $ | 30 | $ | 968,654 | |||||||||||||||||||
| Total assets | $ | 496,605 | $ | 950,181 | $ | 396,944 | $ | 100,542 | $ | 1,944,272 | |||||||||||||||||||
| Year Ended December 31, 2021 | |||||||||||||||||||||||||||||
| NEMT | PCS | RPM | Corporate and Other | Total | |||||||||||||||||||||||||
| Service revenue, net | $ | 1,483,696 | $ | 495,579 | $ | 17,617 | $ | — | $ | 1,996,892 | |||||||||||||||||||
Grant income(1) | — | 5,441 | — | — | 5,441 | ||||||||||||||||||||||||
| Service expense | 1,186,185 | 392,508 | 5,605 | — | 1,584,298 | ||||||||||||||||||||||||
| General and administrative expense | 132,493 | 70,704 | 5,791 | 62,686 | 271,674 | ||||||||||||||||||||||||
| Depreciation and amortization | 29,058 | 23,759 | 4,181 | — | 56,998 | ||||||||||||||||||||||||
| Operating income (loss) | $ | 135,960 | $ | 14,049 | $ | 2,040 | $ | (62,686) | $ | 89,363 | |||||||||||||||||||
| Equity in net loss of investee, net of tax | $ | — | $ | — | $ | — | $ | (38,250) | $ | (38,250) | |||||||||||||||||||
| Equity investment | $ | — | $ | — | $ | — | $ | 83,069 | $ | 83,069 | |||||||||||||||||||
| Goodwill | $ | 135,186 | $ | 552,833 | $ | 236,738 | $ | 30 | $ | 924,787 | |||||||||||||||||||
| Total assets | $ | 546,923 | $ | 1,020,014 | $ | 340,913 | $ | 119,575 | $ | 2,027,425 | |||||||||||||||||||
(1) Grant income for the PCS segment includes funding received on a periodic basis from the PRF in relation to relief under the CARES Act and funding received from the SLFRF under ARPA in relation to economic recovery to combat health and economic impacts of the COVID-19 pandemic. See Note 2, Significant Accounting Policies and Recent Accounting Pronouncements.
5. Revenue Recognition
Under ASC 606, the Company recognizes revenue as it transfers promised services to its customers and generates all of its revenue from contracts with customers. The amount of revenue recognized reflects the consideration to which the Company expects to be entitled in exchange for these services. The Company satisfies substantially all of its performance obligations over time and recognizes revenue over time instead of at points in time.
Revenue Contract Structure
NEMT Capitated Contracts (per-member-per-month)
100
Under capitated contracts, payors pay a fixed amount per eligible member per month. Capitation rates are generally based on expected costs and volume of services. The Company assumes the responsibility of meeting the covered healthcare related transportation requirements based on per-member per-month fees for the number of eligible members in the payor’s program. Revenue is recognized based on the population served during the period. Certain capitated contracts have provisions for reconciliations, risk corridors or profit rebates. For contracts with reconciliation provisions, capitation payment is received as a prepayment during the month service is provided. These prepayments are reconciled based on actual cost and/or trip volume and may result in refunds to the payor, or additional payments due from the payor. Contracts with risk corridor or profit rebate provisions allow for profit within a certain corridor and once the Company reaches profit level thresholds or maximums, it discontinues recognizing revenue and instead records a liability instrumentwithin the accrued contract payable account. This liability may be reduced through future increases in trip volume or periodic settlements with the payor. While a profit rebate provision could only result in a liability from this profit threshold, a risk corridor provision could potentially result in a receivable if the Company does not change. This guidancereach certain profit minimums, which would be recorded in the reconciliation contract receivables account.
NEMT Fee-for-service Contracts
Fee-for-service ("FFS") revenue represents revenue earned under non-capitated contracts in which the Company bills and collects a specified amount for each service that it provides. FFS revenue is effectiverecognized in the period in which the services are rendered and is reduced by the estimated impact of contractual allowances.
PCS Fee-for-service Contracts
PCS FFS revenue is reported at the estimated net realizable amount from clients, patients and third-party payors for fiscal years beginning after December 15, 2017. Early adoptionservices rendered based on actual personal care hours provided. Payment for services received from third-party payors includes, but is permitted.not limited to, insurance companies, hospitals, governmental agencies and other home health care providers who subcontract work to the Company. Certain contracts are subject to retroactive audit and possible adjustment by those payors based on the nature of the contract or costs incurred. The Company will adopt ASU 2016-15makes estimates of adjustments and considers these in the recognition of revenue in the period in which the related services are rendered. The difference between estimated settlement and actual settlement is reported in net service revenues as adjustments become known or as years are no longer subject to such audits, reviews, or investigations.
RPM per-member-per-month Contracts
RPM per-member-per-month ("PMPM") revenue consists of revenue from monitoring services provided to the customer. Under RPM contracts, payors pay per-enrolled-member-per-month based on January 1, 2018. The adoptionenrolled membership. Consideration is generally fixed for each type of ASU 2017-09monitoring service and revenue is not expected to have a material impactrecognized ratably over the contract term based on the Company’smonthly fee paid by customers.
Disaggregation of Revenue by Contract Type
The following table summarizes disaggregated revenue from contracts with customers by contract type for the years ended December 31, 2023, 2022, and 2021 (in thousands):
| Year Ended December 31, | |||||||||||||||||
| 2023 | 2022 | 2021 | |||||||||||||||
| NEMT capitated contracts | $ | 1,663,987 | $ | 1,553,407 | $ | 1,257,390 | |||||||||||
| NEMT FFS contracts | 287,460 | 215,035 | 226,306 | ||||||||||||||
| Total NEMT service revenue, net | 1,951,447 | 1,768,442 | 1,483,696 | ||||||||||||||
| PCS FFS contracts | 715,615 | 667,674 | 495,579 | ||||||||||||||
| RPM PMPM contracts | 77,941 | 68,277 | 17,617 | ||||||||||||||
| Other service revenue | 6,167 | — | — | ||||||||||||||
| Total service revenue, net | $ | 2,751,170 | $ | 2,504,393 | $ | 1,996,892 | |||||||||||
101
Payor Information
Service revenue, net, is derived from state and managed Medicaid contracts, managed Medicare contracts, as well as a small amount from private pay and other contracts. Of the NEMT segment’s revenue, 11.2%, 10.9% and 9.7% were derived from one payor for the years ended December 31, 2023, 2022 and 2021, respectively. Of the PCS segment's revenue, 11.3%, 12.0% and 11.7% were derived from one payor for the years ended December 31, 2023, 2022 and 2021, respectively. Of the RPM segment's revenue, 18.5%, 19.9%, and 27.0% were derived from one payor for the years ended December 31, 2023, 2022 and 2021, respectively.
Revenue Adjustments
During the years ended December 31, 2023, 2022, and 2021 the Company recognized a reduction of $2.8 million, a reduction of $0.9 million, and an increase of $11.4 million in service revenue, respectively, from contractual adjustments relating to performance obligations satisfied in previous periods to which the payor agreed.
Related Balance Sheet Accounts
The following table provides information about accounts receivable, net as of December 31, 2023 and 2022 (in thousands):
| December 31, 2023 | December 31, 2022 | ||||||||||
| Accounts receivable | $ | 223,506 | $ | 225,288 | |||||||
| Allowance for doubtful accounts | (969) | (2,078) | |||||||||
| Accounts receivable, net | $ | 222,537 | $ | 223,210 | |||||||
The following table provides information about other revenue related accounts included on the accompanying consolidated financial statements.balance sheets (in thousands):
| December 31, 2023 | December 31, 2022 | ||||||||||
Accrued contract payables(1) | $ | 117,488 | $ | 194,287 | |||||||
Contract receivables(2) | $ | 143,960 | $ | 71,131 | |||||||
Long-term contract receivables(3) | $ | — | $ | 427 | |||||||
| Deferred revenue, current | $ | 2,629 | $ | 2,202 | |||||||
(1) Accrued contract payables primarily represent overpayments and liability reserves on certain risk corridor, profit rebate and reconciliation contracts. See the contract payables and receivables activity below.
(3) Long-term contract receivables primarily represent future receivable balances on certain risk corridor, profit rebate and reconciliation contracts that may be received in greater than 12 months.
The following table provides the summary activity of total contract payables and receivables as reported within the consolidated balance sheets (in thousands):
| December 31, 2022 | Additional Amounts Recorded | Amounts Paid or Settled | December 31, 2023 | |||||||||||||||||||||||
| Reconciliation contract payables | $ | 25,853 | $ | 17,723 | $ | (31,282) | $ | 12,294 | ||||||||||||||||||
| Profit rebate/corridor contract payables | 155,161 | 61,623 | (122,009) | 94,775 | ||||||||||||||||||||||
| Overpayments and other cash items | 13,273 | 23,322 | (26,176) | 10,419 | ||||||||||||||||||||||
| Total contract payables | $ | 194,287 | $ | 102,668 | $ | (179,467) | $ | 117,488 | ||||||||||||||||||
| Reconciliation contract receivables | $ | 48,153 | $ | 59,184 | $ | (50,335) | $ | 57,002 | ||||||||||||||||||
| Corridor contract receivables | 23,405 | 64,009 | (456) | 86,958 | ||||||||||||||||||||||
| Total contract receivables | $ | 71,558 | $ | 123,193 | $ | (50,791) | $ | 143,960 | ||||||||||||||||||
102
6. Equity Investment
The Company's gross share of Matrix's operations for the years ended December 31, 2023, 2022 and 2021 was a loss of $1.1 million, $41.0 million and $53.1 million, respectively, which is presented net of tax on the consolidated statements of operations for a loss of $0.8 million, $30.0 million and $38.3 million, respectively.
The carrying amount of the assets included in the Company’s consolidated balance sheetsheets and the maximum loss exposure related to the Company’s interest in Matrix as of December 31, 20172023 and 20162022 totaled $169,699$41.5 million and $157,202,$41.3 million, respectively.
Summary financial information for Matrix on a standalone basis is as follows:follows (in thousands):
| December 31, 2023 | December 31, 2022 | ||||||||||
| Current assets | $ | 112,090 | $ | 97,750 | |||||||
| Long-term assets | $ | 351,143 | $ | 373,297 | |||||||
| Current liabilities | $ | 41,584 | $ | 36,913 | |||||||
| Long-term liabilities | $ | 314,316 | $ | 325,613 | |||||||
| Year ended December 31, 2023 | Year ended December 31, 2022 | Year ended December 31, 2021 | |||||||||||||||
| Revenue | $ | 325,192 | $ | 300,306 | $ | 398,260 | |||||||||||
| Operating income (loss) | $ | 30,418 | $ | (83,110) | $ | 1,316 | |||||||||||
| Net loss | $ | (1,689) | $ | (98,187) | $ | (122,898) | |||||||||||
| December 31, | |||||||
| 2017 | 2016 | ||||||
| Current assets | $ | 37,563 | $ | 28,589 | |||
| Long-term assets | 597,613 | 614,841 | |||||
| Current liabilities | 27,718 | 25,791 | |||||
| Long-term liabilities | 240,513 | 281,348 | |||||
| Twelve months ended December 31, 2017 | October 19, 2016 through December 31, 2016 | ||||||
| Revenue | $ | 227,872 | $ | 41,635 | |||
| Operating income (loss) | 11,870 | (4,079 | ) | ||||
| Net income (loss) | 26,665 | (4,200 | ) | ||||
| December 31, 2016 | |||
| Current assets | $ | 4,640 | |
| Long-term assets | 10,473 | ||
| Current liabilities | 12,844 | ||
| Long-term liabilities | 1,655 | ||
| Nine months ended September 30, 2017 | Twelve months ended December 31, 2016 | ||||||
| Revenue | $ | 30,125 | $ | 36,546 | |||
| Operating loss | (1,765 | ) | (9,664 | ) | |||
| Net loss | (1,934 | ) | (8,843 | ) | |||
Prepaid expenses and other current assets were comprised of the following:following (in thousands):
| December 31, 2023 | December 31, 2022 | ||||||||||
| Prepaid insurance | $ | 7,231 | $ | 6,334 | |||||||
| Deferred ERP implementation costs | 2,875 | 5,817 | |||||||||
| Deferred financing costs on credit facility | 2,638 | 3,061 | |||||||||
| Prepaid income taxes | 2,418 | 7,186 | |||||||||
| Other prepaid expenses | 11,866 | 11,934 | |||||||||
| Total prepaid expenses and other current assets | $ | 27,028 | $ | 34,332 | |||||||
103
| December 31, | |||||||
| 2017 | 2016 | ||||||
| Prepaid income taxes | $ | 1,106 | $ | 1,467 | |||
| Escrow funds | 10,000 | 10,000 | |||||
| Prepaid insurance | 2,121 | 3,153 | |||||
| Prepaid taxes and licenses | 906 | 3,570 | |||||
| Note receivable | 3,224 | 3,130 | |||||
| Prepaid rent | 2,268 | 2,013 | |||||
| Deposits held for leased premises and bonds | 2,849 | 2,609 | |||||
| Other | 12,769 | 11,953 | |||||
| Total prepaid expenses and other | $ | 35,243 | $ | 37,895 | |||
Property and equipment consisted of the following:following (in thousands, except useful lives):
| Estimated Useful | Estimated Useful | December 31, | ||||||||||||||||||||||||||||||||||||||||||||||||||||||||||||
| Life (years) | 2023 | 2022 | ||||||||||||||||||||||||||||||||||||||||||||||||||||||||||||
Estimated Useful | December 31, | |||||||||||||||||||||||||||||||||||||||||||||||||||||||||||||
| Life (years) | 2017 | 2016 | ||||||||||||||||||||||||||||||||||||||||||||||||||||||||||||
| Computer and telecom equipment | 3 | — | 5 | $ | 35,915 | $ | 31,854 | |||||||||||||||||||||||||||||||||||||||||||||||||||||||
| Software | 3 | — | 5 | 32,989 | 26,883 | |||||||||||||||||||||||||||||||||||||||||||||||||||||||||
| Computer, office and telecommunications equipment | ||||||||||||||||||||||||||||||||||||||||||||||||||||||||||||||
| Monitoring equipment | ||||||||||||||||||||||||||||||||||||||||||||||||||||||||||||||
| Leasehold improvements | Shorter of 7 years or lease term | 17,890 | 16,720 | |||||||||||||||||||||||||||||||||||||||||||||||||||||||||||
| Construction and development in progress | ||||||||||||||||||||||||||||||||||||||||||||||||||||||||||||||
| Automobiles | ||||||||||||||||||||||||||||||||||||||||||||||||||||||||||||||
| Furniture and fixtures | 5 | — | 10 | 6,416 | 8,070 | |||||||||||||||||||||||||||||||||||||||||||||||||||||||||
| Automobiles | 5 | 3,797 | 3,597 | |||||||||||||||||||||||||||||||||||||||||||||||||||||||||||
| Construction and development in progress | N/A | 13,384 | 5,831 | |||||||||||||||||||||||||||||||||||||||||||||||||||||||||||
| 110,391 | 92,955 | |||||||||||||||||||||||||||||||||||||||||||||||||||||||||||||
| Buildings | ||||||||||||||||||||||||||||||||||||||||||||||||||||||||||||||
| Land | ||||||||||||||||||||||||||||||||||||||||||||||||||||||||||||||
| Total property and equipment | ||||||||||||||||||||||||||||||||||||||||||||||||||||||||||||||
| Less accumulated depreciation | 60,014 | 46,735 | ||||||||||||||||||||||||||||||||||||||||||||||||||||||||||||
| Total property and equipment, net | $ | 50,377 | $ | 46,220 | ||||||||||||||||||||||||||||||||||||||||||||||||||||||||||
Depreciation expense from continuing operations was $18,542, $18,038$25.0 million, $20.1 million and $14,488$12.7 million for the years ended December 31, 2017, 20162023, 2022 and 2015,2021, respectively.
9. Goodwill and Intangible Assets
The Company soldtests goodwill for impairment for its reporting units annually as of July 1 or more frequently when events or changes in circumstances indicate that impairment may have occurred. The Company reviews its intangible assets for impairment whenever events or changes in circumstances indicate that the buildingcarrying value of an asset group may not be recoverable.
Goodwill
Changes in key assumptions from the prior year annual goodwill assessment and landthe resulting reduction in projected future cash flows included in the current year goodwill test resulted in a decrease in the fair values of the Company's PCS and RPM reporting units such that included holding company office space in Arizona effective December 31, 2016 resulting in an assetthe fair value of each respective reporting unit was less than its respective carrying value. As a result, during the second quarter of 2023, the Company recorded a non-cash goodwill impairment charge of $1,415$183.1 million, of which $137.3 million was recorded in the PCS reporting unit and $45.8 million in the RPM reporting unit. This goodwill impairment charge is recorded in “Impairment of goodwill” on the Company’s consolidated statement of operations for the year ended December 31, 2016. The Company recorded an asset2023. There was no such goodwill impairment charge of $9,983 forin the year ended December 31, 2016 related to its WD Services segment based on its review of the carrying value of long-lived assets.2022 or 2021. The current year impairment charges are reflected in “Asset impairment charge”was driven primarily by macroeconomic factors, including a decline in the consolidated statement of income for the year ended December 31, 2016. See Note 6, Goodwill and Intangibles¸ for further discussion of the impairment charges incurred related to the WD Services segment during 2016. Construction in progress as of December 31, 2017 is primarily comprised of NET Services, which has incurred substantial software development costs for its LCAD NextGen technology system. Such amounts are expected to be placed into service during 2018.
Changes in the carrying amount of goodwill were as follows:
by reportable segment are presented in the following table (in thousands):
104
NET Services | WD Services | Consolidated Total | |||||||||
| Balances at December 31, 2015 | |||||||||||
| Goodwill | $ | 191,215 | $ | 40,784 | $ | 231,999 | |||||
| Accumulated impairment losses | (96,000 | ) | (6,041 | ) | (102,041 | ) | |||||
| 95,215 | 34,743 | 129,958 | |||||||||
| Asset impairment charge | — | (5,224 | ) | (5,224 | ) | ||||||
| Foreign currency translation adjustment | — | (5,110 | ) | (5,110 | ) | ||||||
| Balances at December 31, 2016 | |||||||||||
| Goodwill | 191,215 | 35,674 | 226,889 | ||||||||
| Accumulated impairment losses | (96,000 | ) | (11,265 | ) | (107,265 | ) | |||||
| 95,215 | 24,409 | 119,624 | |||||||||
| Foreign currency translation adjustment | — | 2,044 | 2,044 | ||||||||
| Balances at December 31, 2017 | |||||||||||
| Goodwill | 191,215 | 37,718 | 228,933 | ||||||||
| Accumulated impairment losses | (96,000 | ) | (11,265 | ) | (107,265 | ) | |||||
| $ | 95,215 | $ | 26,453 | $ | 121,668 | ||||||
| NEMT | PCS | RPM | Corporate and Other | Total | ||||||||||||||||||||||||||||
| Balances at December 31, 2021 | ||||||||||||||||||||||||||||||||
| Goodwill | $ | 231,186 | $ | 552,833 | $ | 236,738 | $ | 30 | $ | 1,020,787 | ||||||||||||||||||||||
| Accumulated impairment losses | (96,000) | — | — | — | (96,000) | |||||||||||||||||||||||||||
| $ | 135,186 | $ | 552,833 | $ | 236,738 | $ | 30 | $ | 924,787 | |||||||||||||||||||||||
| Balances at December 31, 2022 | ||||||||||||||||||||||||||||||||
| Goodwill acquired in GMM acquisition | $ | — | $ | — | $ | 43,689 | $ | — | $ | 43,689 | ||||||||||||||||||||||
| Purchase accounting adjustments for Care Finders, VRI, and GMM | — | (58) | 236 | — | 178 | |||||||||||||||||||||||||||
| $ | 135,186 | $ | 552,775 | $ | 280,663 | $ | 30 | $ | 968,654 | |||||||||||||||||||||||
| Balances at December 31, 2023 | ||||||||||||||||||||||||||||||||
| Impairment of goodwill | — | (137,331) | (45,769) | — | (183,100) | |||||||||||||||||||||||||||
| $ | 135,186 | $ | 415,444 | $ | 234,894 | $ | 30 | $ | 785,554 | |||||||||||||||||||||||
The total amount of goodwill that was deductible for income tax purposes related to acquisitions as of December 31, 20172023 and 20162022 was $4,222.$317.3 million and $312.6 million, respectively.
Impairment
The Company recorded goodwill impairment charges of $183.1 million for the year ended December 31, 2023 and did not record any goodwill or intangible asset impairment charges for the years ended December 31, 2022 or 2021. The accumulated impairment losses on goodwill totaled $279.1 million as of December 31, 2023 and $96.0 million as of December 31, 2022.
Intangible Assets
Intangible assets are comprised of acquired customer relationships,payor networks, trademarks and trade names, developed technology, non-compete agreements, licenses, and developed technology. Intangiblean assembled workforce. Finite-lived intangible assets are amortized using the straight-line method over the estimated economic lives of the assets. These finite-lived intangible assets are reviewed for impairment whenever events or changes in circumstances indicate that the carrying value of such assets may not be recoverable. Indefinite-lived intangible assets are not amortized, but are tested for impairment annually and more frequently if events occur or circumstances change that indicate an asset may be impaired. Based on the continued value of the definite-lived and indefinite-lived intangible assets acquired, the Company did not identify any circumstances during the years ended December 31, 2023 or 2022 that would require an impairment test for our intangible assets.
As of December 31, 2023 and 2022, intangible assets consisted of the following:following (in thousands, except estimated useful lives):
105
| December 31, | |||||||||||||||||
| 2017 | 2016 | ||||||||||||||||
Estimated Useful Life (Yrs) | Gross Carrying Amount | Accumulated Amortization | Gross Carrying Amount | Accumulated Amortization | |||||||||||||
| Customer relationships | 15 | $ | 48,128 | $ | (33,136 | ) | $ | 48,020 | $ | (29,941 | ) | ||||||
| Customer relationships | 10 | 30,583 | (11,871 | ) | 27,915 | (8,147 | ) | ||||||||||
| Trademarks and Trade Names | 10 | 14,525 | (5,205 | ) | 13,282 | (3,431 | ) | ||||||||||
| Developed technology | 5 | 3,228 | (2,313 | ) | 2,951 | (1,525 | ) | ||||||||||
| Total | $ | 96,464 | $ | (52,525 | ) | $ | 92,168 | $ | (43,044 | ) | |||||||
| December 31, | |||||||||||||||||||||||||||||
| 2023 | 2022 | ||||||||||||||||||||||||||||
| Estimated Useful Life (Yrs) | Gross Carrying Amount | Accumulated Amortization | Gross Carrying Amount | Accumulated Amortization | |||||||||||||||||||||||||
| Payor networks | 3 - 15 | $ | 540,298 | $ | (209,560) | $ | 539,960 | $ | (147,980) | ||||||||||||||||||||
| Trademarks and trade names | 2 - 10 | 48,541 | (34,978) | 48,541 | (20,836) | ||||||||||||||||||||||||
| Developed technology | 3 - 10 | 29,389 | (14,732) | 28,978 | (11,618) | ||||||||||||||||||||||||
| Non-compete agreement | 2 - 5 | 1,610 | (730) | 1,610 | (408) | ||||||||||||||||||||||||
| New York LHCSA Permit | Indefinite | 770 | — | 770 | — | ||||||||||||||||||||||||
| Assembled workforce | 6 - 10 | 444 | (117) | 444 | (52) | ||||||||||||||||||||||||
| Total | $ | 621,052 | $ | (260,117) | $ | 620,303 | $ | (180,894) | |||||||||||||||||||||
The total amortization expense is estimated to be as follows for the next five years and thereafter as of December 31, 2017 based upon the applicable foreign exchange rates as of December 31, 2017:2023 (in thousands):
| Year | Amount | |||||||
| 2024 | $ | 78,583 | ||||||
| 2025 | 64,382 | |||||||
| 2026 | 55,781 | |||||||
| 2027 | 51,226 | |||||||
| 2028 | 44,439 | |||||||
| Total | $ | 294,411 | ||||||
106
| Year | Amount | |||
| 2018 | $ | 8,126 | ||
| 2019 | 7,749 | |||
| 2020 | 7,473 | |||
| 2021 | 7,387 | |||
| 2022 | 7,025 | |||
| Thereafter | 6,179 | |||
| Total | $ | 43,939 | ||
Accrued expenses consistedand other current liabilities were comprised of the following:following (in thousands):
| December 31, | |||||||||||
| 2023 | 2022 | ||||||||||
| Accrued compensation and related liabilities | $ | 48,033 | $ | 47,947 | |||||||
| Insurance reserves | 22,014 | 17,836 | |||||||||
| Accrued operating expenses | 15,884 | 18,432 | |||||||||
| Accrued interest | 10,498 | 10,643 | |||||||||
| Accrued legal fees | 10,148 | 15,574 | |||||||||
Accrued government grants(1) | 9,156 | 7,367 | |||||||||
| Union pension obligation | 1,573 | 3,665 | |||||||||
| Deferred revenue | 2,629 | 2,202 | |||||||||
| Other | 7,966 | 12,194 | |||||||||
| Total accrued expenses and other current liabilities | $ | 127,901 | $ | 135,860 | |||||||
| December 31, | |||||||
| 2017 | 2016 | ||||||
| Accrued compensation and related | $ | 33,653 | $ | 23,050 | |||
| NET Services accrued contract payments | 17,487 | 32,836 | |||||
| Accrued settlement | 15,000 | 6,000 | |||||
| Income taxes payable | 3,723 | 372 | |||||
| Other | 33,975 | 40,123 | |||||
| Total accrued expenses | $ | 103,838 | $ | 102,381 | |||
January 1, 2017 | Costs Incurred | Cash Payments | Foreign Exchange Rate Adjustments | December 31, 2017 | |||||||||||||||
| Ingeus Futures' Program | $ | 2,486 | $ | 1,223 | $ | (3,386 | ) | $ | 159 | $ | 482 | ||||||||
| Offender Rehabilitation Program | 1,380 | (40 | ) | (1,357 | ) | 17 | — | ||||||||||||
| UK Restructuring Program | 50 | (53 | ) | — | 3 | — | |||||||||||||
| Delivery First Program | — | 1,447 | (184 | ) | 24 | 1,287 | |||||||||||||
| Total | $ | 3,916 | $ | 2,577 | $ | (4,927 | ) | $ | 203 | $ | 1,769 | ||||||||
January 1, 2016 | Costs Incurred | Cash Payments | Foreign Exchange Rate Adjustments | December 31, 2016 | |||||||||||||||
| Ingeus Futures' Program | $ | — | $ | 2,515 | $ | — | $ | (29 | ) | $ | 2,486 | ||||||||
| Offender Rehabilitation Program | 6,538 | 4,865 | (8,924 | ) | (1,099 | ) | 1,380 | ||||||||||||
| UK Restructuring Program | 2,059 | 1,131 | (3,031 | ) | (109 | ) | 50 | ||||||||||||
| Total | $ | 8,597 | $ | 8,511 | $ | (11,955 | ) | $ | (1,237 | ) | $ | 3,916 | |||||||
| December 31, 2017 | December 31, 2016 | ||||||
| $200,000 revolving loan, LIBOR plus 2.25% - 3.25% with interest payable at least once every three months through August 2018 | $ | — | $ | — | |||
| Capital lease obligations | 2,984 | 3,611 | |||||
| 2,984 | 3,611 | ||||||
| Less current portion of capital lease obligations | 2,400 | 1,721 | |||||
| Total long-term obligations, less current portion | $ | 584 | $ | 1,890 | |||
| December 31, | ||||||||||||||||||||
| Senior Unsecured Note | Date of Issuance | 2023 | 2022 | |||||||||||||||||
| $500.0 million 5.875% due November 15, 2025 (effective interest rate 6.524%) | 11/4/2020 | $ | 494,011 | $ | 491,098 | |||||||||||||||
| $500.0 million 5.000% due October 1, 2029 (effective interest rate 5.405%) | 8/24/2021 | 489,746 | 488,263 | |||||||||||||||||
| Total | $ | 983,757 | $ | 979,361 | ||||||||||||||||
The Senior Notes due 2025 and the Senior Notes due 2029 (collectively, the "Notes") were issued pursuant to two indentures, dated November 4, 2020 and August 24, 2021, respectively, between the Company and The Bank of New York Mellon Trust Company, N.A., as trustee. The Senior Notes due 2025 relate to the Company’s acquisition of Simplura and the Senior Notes due 2029 relate to the Company’s acquisition of VRI. The fair value of the Notes as of December 31, 2023 and 2022 was $909.2 million and $896.6 million, respectively, which was determined based on quoted prices in active markets, and therefore designated as Level 1 within the valuation hierarchy.
The Notes are senior unsecured obligations and rank senior in right of payment to all of the Company's future subordinated indebtedness, rank equally in right of payment with all of the Company's existing and future senior indebtedness, are effectively subordinated to any of the Company's existing and future secured indebtedness, including indebtedness under the New Credit Facility, to the extent of the value of the assets securing such indebtedness, and are structurally subordinated to all of the existing and future liabilities (including trade payables) of each of the Company’s non-guarantor subsidiaries.
The indentures for the Notes contain covenants that, among other things, restrict the Company’s ability and the ability of its restricted subsidiaries to, among other things: incur additional indebtedness or issue disqualified capital stock; make certain investments; create or incur certain liens; enter into certain transactions with affiliates; merge, consolidate, amalgamate or transfer substantially all of its assets; agree to dividend or other payment restrictions affecting its restricted subsidiaries; and transfer or sell assets, including capital stock of its restricted subsidiaries. These covenants, however, are subject to a number of important exceptions and qualifications, and certain covenants may be suspended in the event the Notes are assigned an investment grade rating from two of three rating agencies. The indentures for both the Senior Notes due 2025 and the Senior Notes due 2029 provide that the notes may become subject to redemption under certain circumstances.
107
In 2024 and thereafter, the Company may redeem all or a part of the Senior Notes due 2025 upon not less than ten days’ nor more than 60 days’ notice, at 100.0% of the principal amount plus accrued and unpaid interest, if any, on the Notes redeemed, to, but excluding, the applicable redemption date.
The Company may also redeem the Senior Notes due 2029, in whole or in part, at any time prior to October 1, 2024, at a price equal to 100.0% of the principal amount of the notes redeemed, plus accrued and unpaid interest, if any, to, but excluding, the date of redemption plus a “make-whole” premium set forth in the Indenture. In addition, the Company may redeem up to 40.0% of the Senior Notes due 2029 prior to October 1, 2024, at a redemption price of 105.0% of the principal amount, plus accrued and unpaid interest, if any, to, but excluding, the date of redemption, with the proceeds of certain equity offerings, subject to certain conditions as specified in the Indenture Agreement.
On or after October 1, 2024, the Company may redeem all or a part of the Senior Notes due 2029 upon not less than ten nor more than 60 days’ notice, at the redemption prices (expressed as percentages of principal amount) set forth below plus accrued and unpaid interest, if any, on the Notes redeemed, to, but excluding, the applicable redemption date, if redeemed during the 12-month period beginning on October 1 of the years indicated below:
| Year | Percentage | ||||
| 2024 | 102.500% | ||||
| 2025 | 101.250% | ||||
| 2026 and thereafter | 100.000% | ||||
The Company will pay interest on the Senior Notes due 2025 at 5.875% per annum until maturity. Interest is payable semi-annually in arrears on May 15 and November 15 of each year, with the first interest payment date being May 15, 2021. Principal payments are not required until the maturity date on November 15, 2025 when 100.0% of the outstanding principal will be required to be repaid.
Pursuant to the Senior Notes due 2029, the Company will pay interest on the notes at 5.0% per annum until maturity. Interest is payable semi-annually in arrears on April 1 and October 1 of each year. Principal payments are not required until the maturity date on October 1, 2029 when 100.0% of the outstanding principal will be required to be repaid. As a part of the bond issuance process, we incurred a $6.6 million bridge commitment fee that provided a potential funding backstop in the event that the Notes did not meet the desired subscription level to be used to acquire VRI. That commitment expired unused upon closing of the Notes and the fee was expensed in the third quarter of 2021.
In relation to the issuance of the Senior Notes due 2025, debt issuance costs of $14.5 million were incurred at the date of issuance and these costs were deferred and are amortized to interest cost over the term of the Notes. Additionally, in relation to the issuance of the Senior Notes due 2029, debt issuance costs of $13.5 millionwere incurred at the date of issuance and these costs were deferred and are amortized to interest cost over the term of the Notes. As of December 31, 2023, $16.2 million of unamortized deferred issuance costs was netted against the long-term debt balance on the consolidated balance sheet. The Company was in compliance with all covenants as of December 31, 2023.
Annual maturities on all long-term debt outstanding at December 31, 2023, are as follows:
| Maturities | ||||||||
| 2024 | $ | — | ||||||
| 2025 | 500,000 | |||||||
| 2026 | — | |||||||
| 2027 | — | |||||||
| 2028 | — | |||||||
| Thereafter | 500,000 | |||||||
| Total maturities | 1,000,000 | |||||||
| Unamortized deferred issuance costs | 16,243 | |||||||
| Total long-term debt | $ | 983,757 | ||||||
108
| Year | Amount | |||
| 2018 | $ | 2,400 | ||
| 2019 | 504 | |||
| 2020 | 80 | |||
| Total | $ | 2,984 | ||
Credit Facility
The Company iswas a party to thean amended and restated credit and guaranty agreement, dated as of August 2, 2013 (as amended, the “Credit“Old Credit Agreement”), with Bank of America, N.A., as administrative agent, swing line lender and letter of credit issuer, and the other lenders party thereto. On September 13, 2021, the Company entered into the Ninth Amendment to the Amended and Restated Credit and Guaranty Agreement (the “Ninth Amendment”), which among other things, amended the Old Credit Facility to permit the incurrence of additional debt to finance the acquisition of VRI and revise financial covenants therein to permit the consummation of the VRI acquisition. The amount available under the revolving credit facility (the “Old Credit Facility”) included an aggregate principal amount of $225.0 million, with a sub-facility for letters of credit of $40.0 million.
On February 3, 2022, the Company terminated its Old Credit Facility and entered into the New Credit Agreement with JPMorgan Chase Bank, N.A., as administrative agent, swing line lender and an issuing bank, Wells Fargo Bank, National Association, as an issuing bank, Truist Bank and Wells Fargo Bank, National Association, as co-syndication agents, Deutsche Bank AG New York Branch, Bank of America, N.A., Regions Bank, Bank of Montreal and Capital One, National Association, as co-documentation agents, and JPMorgan Chase Bank, N.A., Truist Securities, Inc. and Wells Fargo Securities, LLC, as joint bookrunners and joint lead arrangers, and the other lenders party thereto. The New Credit Agreement provides the Company with a $200,000 revolving credit facility (the “Credit Facility”), including a sub-facilitythe New Credit Facility in an aggregate principal amount of $25,000$325.0 million. The New Credit Facility includes sublimits for swingline loans, letters of credit. credit and alternative currency loans in amounts of up to $25.0 million, $60.0 million and $75.0 million, respectively. The New Credit Facility matures on February 3, 2027 and the proceeds may be used (i) to finance working capital needs of the Company and its subsidiaries and (ii) for general corporate purposes of the Company and its subsidiaries (including to finance capital expenditures, permitted acquisitions and investments).
On June 26, 2023, the Company entered into the First Amendment to the New Credit Agreement which amended the maximum permitted Total Net Leverage Ratio under the New Credit Agreement as follows: for the fiscal quarters ending June 30, 2023 through September 30, 2023, 5.25:1.00; for the fiscal quarters ending December 31, 2023 through March 31, 2024, 5.00:1.00; for the fiscal quarter ending June 30, 2024, 4.75:1.00; and for the fiscal quarters ending September 30, 2024 and for the fiscal quarters ending thereafter, 4.50:1.00.
On February 22, 2024, the Company entered into the Second Amendment to the New Credit Agreement, which amended the maximum permitted Total Net Leverage Ratio under the New Credit Agreement as follows: for the fiscal quarters ending March 31, 2024 through June 30, 2024, 5.50:1.00; for the fiscal quarters ending September 30, 2024 through December 31, 2024, 5.25:1.00; for the fiscal quarters ending March 31, 2025 through September 30, 2025, 5.00:1.00, and for the fiscal quarters ending December 31, 2025 through March 31, 2026, 4.75:1.00. The Second Amendment also restricts the Company from permitting its Liquidity (as defined in the Second Amendment and which is determined generally to be, as of any date of determination, the sum of the Company's available borrowing capacity under the New Credit Facility plus the amount of its unencumbered cash), to be less than $100.0 million as of the last day of each fiscal quarter.
As of December 31, 2017,2023, the Company had no$113.8 million of short-term borrowings outstanding on the New Credit Facility and sevenhad $40.4 million of outstanding letters of credit in the amount of $11,074 outstanding under the revolving credit facility. AtNew Credit Facility. The interest rate for short-term borrowings outstanding as of December 31, 2017,2023 was 9.6% per annum. As of December 31, 2022, the Company’s availableCompany did not have any short-term borrowings outstanding on the New Credit Facility and had $38.1 million of outstanding letters of credit under the revolving credit facility was $188,926. New Credit Facility.
Under the New Credit Agreement,Facility, the Company has an option to request an increase in the amount of the revolving credit facilityNew Credit Facility or obtain incremental term loans from time to time (on substantially the same terms as apply to the existing facilities) inby an aggregate amount of up to $75,000 with either additional commitments from lenders under the Credit Agreement at such time or new commitments from financial institutions acceptable to the administrative agent in its reasonable discretion,$175.0 million, so long as, no defaultafter giving effect to the relevant incremental facility, the pro forma secured net leverage ratio does not exceed 3.50:1.00, provided that the lenders agree to increase their existing commitments or event of default exists at the time of anyto participate in such increase.incremental term loans. The Company may not be ableprepay the New Credit Facility in whole or in part, at any time without premium or penalty, subject to access additional funds under this increase optionreimbursement of the lenders’ breakage and redeployment costs in connection with prepayments of Term Benchmark loans or RFR loans, each as no lender is obligated to participatedefined in any such increasethe New Credit Agreement. The unutilized portion of the commitments under the Credit Facility. TheNew Credit Facility matures on August 2, 2018.may be irrevocably reduced or terminated by the Company at any time without penalty.
Interest on the outstanding principal amount of the loans accrues at the Company’s election, at a per annum rate equal to LIBOR, plus an applicable margin,the Alternate Base Rate, the Adjusted Term SOFR Rate, the Adjusted Daily Simple SOFR Rate, the Adjusted EURIBOR Rate or the base rateAdjusted Daily Simple SONIA Rate, as applicable and each as defined in the agreementNew Credit Agreement, in each case, plus an applicable margin. The applicable margin ranges from 2.25%1.75% to 3.25%3.50% in the case of LIBORTerm Benchmark loans or RFR loans, and 1.25%0.75% to 2.25%2.50% in the case of the base rateAlternate Base Rate loans, in each case, based on the Company’s consolidatedtotal net leverage ratio as defined in the New Credit Agreement. Interest on the loans is payable quarterly in arrears.arrears in the case of Alternate Base Rate loans, on the last day
109
of the relevant interest period in the case of Term Benchmark loans, and monthly in arrears in the case of RFR loans. In addition, the Company is obligated to pay a quarterly commitment fee based on a percentage of the unused portion of each lender’s commitment under the Credit Facilityrevolving credit facility and quarterly letter of credit fees based on a percentage of the maximum amount available to be drawn under each outstanding letter of credit. The commitment fee and letter of credit fee range from 0.25%0.30% to 0.50% and 2.25%1.75% to 3.25%3.50%, respectively, in each case, based on the Company’s consolidatedtotal net leverage ratio.
The Company’s obligations under the Credit Facility are guaranteed by all of the Company’s present and future domestic subsidiaries, excluding certain domestic subsidiaries which include the Company’s insurance captive. The Company’s obligations under, and each guarantor’s obligations under its guaranty of, the Credit Facility are secured by a first priority lien on substantially all of the Company’s respective assets, including a pledge of 100% of the issued and outstanding stock of the Company’s domestic subsidiaries, excluding the Company’s insurance captive, and 65% of the issued and outstanding stock of the Company’s first tier foreign subsidiaries.
The Company completed a rights offering on February 5, 2015 (the “Rights Offering”) providingCompany’s obligations under the New Credit Facility are guaranteed by all of the Company’s existing common stock holderspresent and future material domestic subsidiaries, excluding certain material domestic subsidiaries that are excluded from being guarantors pursuant to the non-transferrable right to purchase their pro rata shareterms of $65,500the New Credit Agreement. The Company’s obligations under, and each guarantor’s obligations under its guaranty of, convertible preferred stock atthe New Credit Facility are secured by a price equal to $100.00 per share (“Preferred Stock”). The Preferred Stock is convertible into shares of Providence’s Company’s common stock, $0.001 par value per share (“Common Stock”) at a conversion price equal to $39.88 per share, which was the closing pricefirst priority lien on substantially all of the Company’s Common Stock onor such guarantor’s respective assets. If an event of default occurs, the NASDAQ Global Select Market on October 22, 2014.
| Dollar Value | Share Count | |||||
| Balance at December 31, 2015 | $ | 77,576 | 803,518 | |||
| Conversion to common stock | (12 | ) | (120 | ) | ||
| Allocation of issuance costs | 1 | — | ||||
| Balance at December 31, 2016 | $ | 77,565 | 803,398 | |||
| Conversion to common stock | (20 | ) | (198 | ) | ||
| Allocation of issuance costs | 1 | — | ||||
| Balance at December 31, 2017 | $ | 77,546 | 803,200 | |||
At December 31, 20172023 and 20162022 there were 17,473,59819,775,041 and 17,315,66119,729,923 shares of the Company’s Common Stock issued, respectively, including 4,126,1325,571,004 and 3,478,6765,573,529 treasury shares at December 31, 20172023 and 2016,2022, respectively.
Subject to the rights specifically granted to holders of any then outstanding shares of the Company’s Preferred Stock, the Company’s common stockholders are entitled to vote together as a class on all matters submitted to a vote of the Company’s common stockholders, and are entitled to any dividends that may be declared by the Board. The Company’s common stockholders do not have cumulative voting rights. Upon the Company’s dissolution, liquidation or winding up, holders of the Company’s Common Stock are entitled to share ratably in the Company’s net assets after payment or provision for all liabilities and any
preferential liquidation rights of the Company’s Preferred Stock then outstanding. The Company’s common stockholders do not have preemptive rights to purchase shares of the Company’s stock. The issued and outstanding shares of the Company’s Common Stock are not subject to any redemption provisions and are not convertible into any other shares of the Company’s capital stock. The rights, preferences and privileges of holders of the Company’s Common Stock will be subject to those of the holders of any shares of the Company’s Preferred Stock the Company may issue in the future.
Purchases of Equity Securities
On October 14, 2015, the Company entered into an agreement to repurchase 707,318 of its Common Stock held by former stockholders of Matrix for an aggregate purchase price of $29,000 (or $41.00 per share). The Company funded this purchase through a combination of borrowing on its Credit Facility and cash on hand. The purchase of these shares was completed on October 30, 2015.
Equity Award Withholding
During the years ended December 31, 2017, 20162023, 2022 and 2015,2021, the Company withheld 19,556, 2,73610,565, 7,486 and 15,9615,432 shares, respectively, from employees to cover the settlement of income tax and related benefit withholding obligations arising from vesting of restricted stock awards. In addition, during the years ended December 31, 2017awards and 2015, the Company withheld 5,665 and 5,718 shares, respectively, from employees to cover the settlement of income tax and related benefit withholding obligations and the exercise price upon the exercise of stock options. During the year ended December 31, 2015, the Company withheld 43,743 shares to cover the settlement of income tax and related benefit withholding obligations arising from shares held by employees that were released from escrow related to the Matrix acquisition, which shares are treated as treasury stock.units.
110
13. Stock-Based Compensation and Similar Arrangements
The Company provides stock-based compensation to employees, non-employee directors, consultants and advisors under the Company’s 2006 Long-Term Incentive Plan (“2006 Plan”). The 2006 Plan allows the flexibility to grant or award stock options, stock appreciation rights, restricted stock, unrestricted stock, stock units including restricted stock units and performance awards to eligible persons.
The following table summarizes the activity under the 2006 Plan as of December 31, 2017:2023:
| Number of shares of the Company’s Common Stock authorized for | Number of shares of the Company’s Common Stock remaining for | Number of shares of the Company’s Common Stock subject to | |||||||||||||||||||||
| issuance | future grants | Stock Options | Stock Grants | ||||||||||||||||||||
| 2006 Plan | 5,400,000 | 792,338 | 82,586 | 504,110 | |||||||||||||||||||
Number of shares of the Company's Common Stock authorized for | Number of shares of the Company's Common Stock remaining for | Number of shares of the Company's Common Stock subject to | |||||||||
| issuance | future grants | Stock Options | Stock Grants | ||||||||
| 2006 Plan | 5,400,000 | 1,938,666 | 606,695 | 111,157 | |||||||
| Year Ended December 31, | |||||||||||
| 2017 | 2016 | 2015 | |||||||||
| Service expense | $ | 491 | $ | 830 | $ | 21,480 | |||||
| General and administrative expense | 7,052 | 4,324 | 5,027 | ||||||||
| Equity in net (gain) loss of investees | 76 | 18 | — | ||||||||
| Discontinued operations, net of tax | — | (18 | ) | 115 | |||||||
| Total stock-based compensation | $ | 7,619 | $ | 5,154 | $ | 26,622 | |||||
| Year Ended December 31, | |||||||||||
| 2017 | 2016 | 2015 | |||||||||
| NET Services | $ | 434 | $ | 841 | $ | 724 | |||||
| WD Services (a) | 57 | (11 | ) | 20,756 | |||||||
| Total stock-based compensation in service expense | $ | 491 | $ | 830 | $ | 21,480 | |||||
Stock Options
| Year Ended December 31, | |||||||||||||||||||||||||||||||||||
| 2023 | 2022 | 2021 | |||||||||||||||||||||||||||||||||
| Expected dividend yield | 0.0% | 0.0% | 0.0% | ||||||||||||||||||||||||||||||||
| Expected stock price volatility | 49.6% | - | 49.6% | 39.6% | - | 46.5% | 36.6% | - | 41.6% | ||||||||||||||||||||||||||
| Risk-free interest rate | 3.7% | - | 3.7% | 1.6% | - | 4.4% | 0.3% | - | 0.9% | ||||||||||||||||||||||||||
| Expected life of options (years) | 3.5 | - | 3.5 | 3.5 | - | 4.5 | 3.5 | - | 4.4 | ||||||||||||||||||||||||||
| Year Ended December 31, | |||||||
| 2017 | 2015 | ||||||
| Expected dividend yield | 0.0% | 0.0% | |||||
| Expected stock price volatility | 19.45% | — | 42.95% | 33.8% | — | 46.14% | |
| Risk-free interest rate | 0.95% | — | 2.23% | 0.4% | — | 1.35% | |
| Expected life of options (years) | 0.03 | — | 6.50 | 0.03 | — | 4.00 | |
The risk-free interest rate was based on the U.S. Treasury security rate in effect as of the date of grant which corresponds to the expected life of the award. The expected stock price volatility was based onand expected lives of the Company’s historical data. The expected
During the year ended December 31, 2017,2023, the Company issued 91,400549 shares of its Common Stock in connection with the exercise of employee stock options under the Company’s 2006 Plan.
The following table summarizes the stock option activity for the year ended December 31, 2017:
2023:
111
| Year ended December 31, 2017 | ||||||||||||
Number of Shares Under Option | Weighted- average Exercise Price | Weighted- average Remaining Contractual Term | Aggregate Intrinsic Value | |||||||||
| Balance at beginning of period | 355,598 | $ | 33.48 | |||||||||
| Granted | 371,775 | 57.08 | ||||||||||
| Exercised | (115,825 | ) | 29.77 | |||||||||
| Forfeited/Cancelled | (854 | ) | 46.44 | |||||||||
| Expired | (3,999 | ) | 24.59 | |||||||||
| Outstanding at end of period | 606,695 | $ | 48.70 | 2.62 | $ | 6,705 | ||||||
| Vested or expected to vest at end of period | 606,695 | $ | 48.70 | 2.62 | $ | 6,705 | ||||||
| Exercisable at end of period | 357,984 | $ | 44.65 | 2.10 | $ | 5,508 | ||||||
| Year ended December 31, 2023 | |||||||||||||||||||||||
| Number of Shares Under Option | Weighted- average Exercise Price | Weighted- average Remaining Contractual Term | Aggregate Intrinsic Value (in thousands) | ||||||||||||||||||||
| Balance at beginning of year, January 1 | 125,179 | $ | 115.54 | ||||||||||||||||||||
| Granted | 11,809 | 53.10 | |||||||||||||||||||||
| Exercised | (549) | 56.43 | |||||||||||||||||||||
| Forfeited/Canceled | (32,101) | 117.99 | |||||||||||||||||||||
| Expired | (21,752) | 119.96 | |||||||||||||||||||||
| Outstanding at end of year, December 31 | 82,586 | $ | 104.89 | 2.68 | $ | — | |||||||||||||||||
| Vested or expected to vest at end of year, December 31 | 82,586 | $ | 104.89 | 2.68 | $ | — | |||||||||||||||||
| Exercisable at end of year, December 31 | 42,054 | $ | 113.18 | 1.93 | $ | — | |||||||||||||||||
As of December 31, 2023, there was approximately $1.5 million of unrecognized compensation cost related to share settled stock options that is expected to be recognized over a weighted-average remaining contractual term of 2.68 years, using the simplified method as permitted for plain vanilla options.
The weighted-average grant-dategrant date fair value for options granted, total intrinsic value and cash received by the Company related to options exercised during the years ended December 31, 2017, 20162023, 2022 and 20152021 were as follows:follows (in thousands, except for fair value per share):
| Year ended December 31, | |||||||||||||||||
| 2023 | 2022 | 2021 | |||||||||||||||
| Weighted-average grant date fair value per share | $ | 56.43 | $ | 106.90 | $ | 170.26 | |||||||||||
| Options exercised: | |||||||||||||||||
| Total intrinsic value | $ | (7) | $ | 3,057 | $ | 4,454 | |||||||||||
| Year ended December 31, | |||||||||||
| 2017 | 2016 | 2015 | |||||||||
| Weighted-average grant date fair value per share | $ | 9.05 | $ | — | $ | 8.77 | |||||
| Options exercised: | |||||||||||
| Total intrinsic value | $ | 2,010 | $ | 979 | $ | 6,659 | |||||
| Cash received | $ | 1,921 | $ | 4,108 | $ | 4,894 | |||||
Restricted Stock Awards and Restricted Stock Units
The Board grants restricted stock awards (RSAs) and restricted stock units (RSUs) under the 2006 Plan. RSAs and RSUs vest ratably in equal annual installments over 1 to 4 years, or, for certain grants, over periods designated in the respective employee’s agreements or as determined by the Compensation Committee.
During the year ended December 31, 2017, the Company granted 33,420 shares of restricted stock (“RSAs”) to non-employee directors of its Board, executive officers and certain key employees. The awards primarily vest in three equal installments on the first, second and third anniversaries of the date of grant.
The following table summarizes the activity of the shares and weighted-average grant date fair value of the Company’s unvested restricted Common StockRSAs and RSUs during the year ended December 31, 2017:2023:
| Shares | Weighted-average grant date fair value | ||||||||||
| Non-vested at beginning of year, January 1 | 105,088 | $ | 108.49 | ||||||||
| Granted | 280,314 | $ | 36.63 | ||||||||
| Vested | (48,485) | $ | 99.33 | ||||||||
| Forfeited or cancelled | (38,843) | $ | 91.26 | ||||||||
| Non-vested at end of year, December 31 | 298,074 | $ | 44.65 | ||||||||
112
| Shares | Weighted-average grant date fair value | |||||
| Non-vested at beginning of period | 72,198 | $ | 44.44 | |||
| Granted | 33,420 | $ | 43.91 | |||
| Vested | (36,623 | ) | $ | 43.42 | ||
| Forfeited or cancelled | (4,216 | ) | $ | 47.17 | ||
| Non-vested at end of period | 64,779 | $ | 44.82 | |||
As of December 31, 2017,2023, there was $4,331approximately $14.1 million of unrecognized compensation costcosts related to unvested share settled stock optionsnon-vested RSAs and RSAs granted under the 2006 Plan. The cost is expected to be recognized over a weighted-average period of 1.2 years. The total fair value of stock options and RSAs vested was $3,550, $1,383 and $3,709 for the years ended December 31, 2017, 2016 and 2015, respectively.
| Year ended December 31, | |||||||||||
| 2017 | 2016 | 2015 | |||||||||
| Expected dividend yield | 0.0% | 0.0% | 0.0% | ||||||||
| Expected stock price volatility | 23.36% | — | 32.09% | 35.71% | — | 41.82% | 43.75% | — | 45.3% | ||
| Risk-free interest rate | 1.75% | — | 1.95% | 1.11% | — | 1.64% | 1.2% | — | 1.70% | ||
| Expected life of options (in years) | 0.75 | — | 2.75 | 1.0 | — | 3.00 | 2.75 | — | 4.75 | ||
The following table summarizes the activity of the shares and weighted-average grant date fair value created in excess of an 8.0% compounded annual return between the Award Date andCompany's unvested PRSUs during the year ended December 31, 2017 (the “Extraordinary Shareholder Value”). The Award Date value was calculated on the basis2023:
| Shares | Weighted-average grant date fair value | ||||||||||
| Non-vested at beginning of year, January 1 | 19,810 | $ | 150.33 | ||||||||
| Granted | 205,721 | $ | 38.21 | ||||||||
| Vested | — | $ | — | ||||||||
| Forfeited or cancelled | (19,495) | $ | 99.00 | ||||||||
| Non-vested at end of year, December 31 | 206,036 | $ | 43.24 | ||||||||
As of the Providence stock price equal to the volume weighted average of the common share price over the 90-day trading period ending on the Award Date. The Extraordinary Shareholder Value was calculated on the basis of the Providence stock price equal to the volume weighted average of the common share price
The total fair value of vested stock options, RSUs and RSAs, and PRSUs was created equal to 8.0% of the Extraordinary Shareholder Value.
Employee Stock Purchase Plan
During the fourth quarter of 2022, the Company began offering an Employee Stock Purchase Plan ("ESPP") available to eligible employees. Under terms of the plan, eligible employees may designate a dollar value or percentage of their compensation to be withheld through payroll deductions, up to a maximum of $25,000 in each plan year, for the purchase of common stock at 85.0% of the lower of the market price on the first or last day of the offering period. Purchases under this plan were for a total of 16,030 shares as of December 31, 2023. As of December 31, 2017, the Company accelerated all remaining unrecognized compensation expense2023, 983,970 shares remain available for the Holdco LTIP as there was no further requisite service period associated with the award, resulting in an acceleration of expense of $1,053.
113
| Year ended December 31, | |||||||
| 2016 | 2015 | ||||||
| Forward interest rate | 0.24% | — | 2.71% | 0.04% | — | 2.90% | |
| Expected Volatility | 40.0% | 45.0% | |||||
| Dividend Yield | —% | —% | |||||
| Fair Value of Total Pool | $12,870 | $12,590 | |||||
14. EarningsLoss Per Share
The following table details the computation of basic and diluted earningsloss per share:share (in thousands, except share and per share data):
| Year ended December 31, | |||||||||||||||||
| 2023 | 2022 | 2021 | |||||||||||||||
| Numerator: | |||||||||||||||||
| Net loss | $ | (204,460) | $ | (31,806) | $ | (6,585) | |||||||||||
| Denominator: | |||||||||||||||||
| Denominator for basic earnings per share -- weighted-average shares | 14,173,957 | 14,061,839 | 14,054,060 | ||||||||||||||
| Effect of dilutive securities: | |||||||||||||||||
| Common stock options | — | — | — | ||||||||||||||
| Restricted stock units | — | — | — | ||||||||||||||
| Denominator for diluted earnings per share -- adjusted weighted-average shares assumed conversion | 14,173,957 | 14,061,839 | 14,054,060 | ||||||||||||||
| Loss per share: | |||||||||||||||||
| Basic loss per share | $ | (14.43) | $ | (2.26) | $ | (0.47) | |||||||||||
| Diluted loss per share | $ | (14.43) | $ | (2.26) | $ | (0.47) | |||||||||||
| Year ended December 31, | |||||||||||
| 2017 | 2016 | 2015 | |||||||||
| Numerator: | |||||||||||
| Net income attributable to Providence | $ | 53,369 | $ | 91,928 | $ | 83,696 | |||||
| Less dividends on convertible preferred stock | (4,419 | ) | (4,419 | ) | (3,935 | ) | |||||
| Less accretion of convertible preferred stock discount | — | — | (1,071 | ) | |||||||
| Less income allocated to participating securities | (7,085 | ) | (13,135 | ) | (10,691 | ) | |||||
| Net income available to common stockholders | $ | 41,865 | $ | 74,374 | $ | 67,999 | |||||
| Continuing operations | $ | 47,848 | $ | (21,251 | ) | $ | (29,181 | ) | |||
| Discontinued operations | (5,983 | ) | 95,625 | 97,180 | |||||||
| $ | 41,865 | $ | 74,374 | $ | 67,999 | ||||||
| Denominator: | |||||||||||
| Denominator for basic earnings per share -- weighted-average shares | 13,602,140 | 14,666,896 | 15,960,905 | ||||||||
| Effect of dilutive securities: | |||||||||||
| Common stock options | 66,314 | — | — | ||||||||
| Performance-based restricted stock units | 4,860 | — | — | ||||||||
| Denominator for diluted earnings per share -- adjusted weighted-average shares assumed conversion | 13,673,314 | 14,666,896 | 15,960,905 | ||||||||
| Basic earnings (loss) per share: | |||||||||||
| Continuing operations | $ | 3.52 | $ | (1.45 | ) | $ | (1.83 | ) | |||
| Discontinued operations | (0.44 | ) | 6.52 | 6.09 | |||||||
| $ | 3.08 | $ | 5.07 | $ | 4.26 | ||||||
| Diluted earnings (loss) per share: | |||||||||||
| Continuing operations | $ | 3.50 | $ | (1.45 | ) | $ | (1.83 | ) | |||
| Discontinued operations | (0.44 | ) | 6.52 | 6.09 | |||||||
| $ | 3.06 | $ | 5.07 | $ | 4.26 | ||||||
The following weighted-average shares were not included in the computation of diluted earnings per share as the effect of their inclusion would have been anti-dilutive:
| Year ended December 31, | |||||||||||||||||
| 2023 | 2022 | 2021 | |||||||||||||||
| Stock options to purchase common stock | 100,499 | 118,260 | 56,291 | ||||||||||||||
| Restricted stock awards and restricted stock units | 87,056 | 58,831 | 1,178 | ||||||||||||||
114
| Year ended December 31, | ||||||||
| 2017 | 2016 | 2015 | ||||||
| Stock options to purchase common stock | 362,392 | 22,638 | 173,925 | |||||
| Convertible preferred stock | 803,323 | 803,442 | 700,241 | |||||
15. Operating Leases
The Company has non-cancelable contractual obligations in the form of operating leases forprimarily associated with office space related office equipment and other facilities. The leases expire in various years and generally provide for renewal options. In the normal course of business, it is expectedmanagement expects that these leases will be renewed or replaced by leases on other properties.
Certain operating leases provide for increases in future minimum annual rental payments based on defined increases in the Consumer Price Index, subject to certain minimum increases. Several of these lease agreements contain provisions for periods in which rent payments are reduced. The total amount of rental payments due over the lease term is being charged torecorded as rent expense on a straight-line basis over the term of the lease. The cumulative difference between rent expense recorded
To determine whether a contract contains a lease, the Company evaluates its contracts and verifies that there is an identified asset and that the Company, or the tenant, has the right to obtain substantially all the economic benefits from the use of the asset throughout the contract term and has the right to direct the use of the identified asset. If a contract is determined to contain a lease and the amount paid,Company is a lessee, the lease is evaluated to determine whether it is an operating or financing lease.
The discount rate used for continuing operations,each lease is determined by estimating an appropriate incremental borrowing rate. In estimating an incremental borrowing rate, the Company considers the debt information, credit rating, and interest rate on the revolving credit facility, which is collateralized by the Company's assets. Accordingly, the Company continues discounting its remaining operating lease payments for calculating its lease liability using a weighted-average discount rate of 5.43%. The Company applies this rate to its entire portfolio of leases on the basis that any adjustments to the rate for lease term or asset classification would not affect the interest rate charged under the debt or have a material effect on the discounted lease liability.
A summary of all lease classifications in our consolidated balance sheets is as follows (in thousands):
| Leases | Classification | December 31, 2023 | December 31, 2022 | ||||||||||||||||||||
| Assets | |||||||||||||||||||||||
| Current operating lease assets | Operating lease ROU assets | $ | 39,776 | $ | 39,405 | ||||||||||||||||||
| Liabilities | |||||||||||||||||||||||
| Current: | |||||||||||||||||||||||
| Operating | Current portion of operating lease liabilities | $ | 8,727 | $ | 9,640 | ||||||||||||||||||
| Long-term: | |||||||||||||||||||||||
| Operating | Operating lease liabilities, less current portion | 33,784 | 32,088 | ||||||||||||||||||||
| Total lease liabilities | $ | 42,511 | $ | 41,728 | |||||||||||||||||||
As of December 31, 2017 and 2016 was $3,957 and $3,253, respectively, and is included in “Accrued expenses” and “Other long-term liabilities” in the consolidated balance sheets.2023, future maturities of lease liabilities were as follows (in thousands):
| Operating Leases | |||||
| 2024 | $ | 10,434 | |||
| 2025 | 8,664 | ||||
| 2026 | 7,275 | ||||
| 2027 | 5,894 | ||||
| 2028 | 5,403 | ||||
| Thereafter | 13,121 | ||||
| Total lease payments | 50,791 | ||||
| Less: interest and accretion | (8,280) | ||||
| Present value of minimum lease payments | 42,511 | ||||
| Less: current portion | (8,727) | ||||
| Long-term portion | $ | 33,784 | |||
As of one year or more consisted of the following at December 31, 2017:
2022, future maturities of lease liabilities were as follows (in thousands):
115
| Operating | |||
| Leases | |||
| 2018 | $ | 20,875 | |
| 2019 | 13,376 | ||
| 2020 | 9,738 | ||
| 2021 | 8,022 | ||
| 2022 | 6,142 | ||
| Thereafter | 3,939 | ||
| Total future minimum lease payments | $ | 62,092 | |
| Operating Leases | |||||
| 2023 | $ | 11,347 | |||
| 2024 | 8,509 | ||||
| 2025 | 6,009 | ||||
| 2026 | 4,714 | ||||
| 2027 | 3,599 | ||||
| Thereafter | 15,657 | ||||
| Total lease payments | 49,835 | ||||
| Less: interest and accretion | (8,107) | ||||
| Present value of minimum lease payments | 41,728 | ||||
| Less: current portion | (9,640) | ||||
| Long-term portion | $ | 32,088 | |||
The weighted-average remaining lease terms and $31,191, forweighted-average discount rates are as follows:
| December 31, 2023 | December 31, 2022 | ||||||||||
| Weighted-average remaining lease term (years): | |||||||||||
| Operating lease costs | 4.18 | 4.84 | |||||||||
| Weighted-average discount rate: | |||||||||||
| Operating lease costs | 5.43 | % | 5.31 | % | |||||||
For the years ended December 31, 2017, 20162023 and 2015, respectively. Also, the2022, our operating lease agreements generally require the Company to pay executory costs such as real estate taxes, insurance,cost was $13.0 million and repairs, which are recorded to expense as incurred.$13.8 million, respectively, and is primarily included in "Service expense” on our accompanying consolidated statements of operations.
| Year Ended December 31, 2023 | Year Ended December 31, 2022 | ||||||||||
| Operating cash flows from operating leases | $ | (12,636) | $ | (12,492) | |||||||
| Amortization of operating lease ROU assets | $ | 12,344 | $ | 11,640 | |||||||
| ROU assets obtained through operating lease liabilities | $ | 12,715 | $ | 7,295 | |||||||
16. Income Taxes
| Year Ended December 31, | |||||||||||
| 2017 | 2016 | 2015 | |||||||||
| US | 48,719 | 65,559 | 43,598 | ||||||||
| Foreign | 15,485 | (67,437 | ) | (53,692 | ) | ||||||
| Total | $ | 64,204 | $ | (1,878 | ) | $ | (10,094 | ) | |||
The federal and state and foreign income tax provisionbenefit (provision) is summarized as follows:follows (in thousands):
| Year Ended December 31, | |||||||||||||||||
| 2023 | 2022 | 2021 | |||||||||||||||
| Federal income tax benefit (provision): | |||||||||||||||||
| Current | $ | (10,296) | $ | (22,651) | $ | (6,642) | |||||||||||
| Deferred | 14,431 | 25,291 | 820 | ||||||||||||||
| Total federal income tax benefit (provision) | 4,135 | 2,640 | (5,822) | ||||||||||||||
| State income tax benefit (provision): | |||||||||||||||||
| Current | (3,067) | (11,500) | (5,048) | ||||||||||||||
| Deferred | 3,251 | 11,895 | 2,253 | ||||||||||||||
| Total state income tax benefit (provision) | 184 | 395 | (2,795) | ||||||||||||||
| Total benefit (provision) for income taxes | $ | 4,319 | $ | 3,035 | $ | (8,617) | |||||||||||
116
| Year Ended December 31, | |||||||||||
| 2017 | 2016 | 2015 | |||||||||
| Federal: | |||||||||||
| Current | $ | 18,792 | $ | 21,202 | $ | 15,161 | |||||
| Deferred | (19,767 | ) | (6,477 | ) | (1,606 | ) | |||||
| (975 | ) | 14,725 | 13,555 | ||||||||
| State: | |||||||||||
| Current | 3,975 | 4,580 | 2,644 | ||||||||
| Deferred | 723 | (938 | ) | (38 | ) | ||||||
| 4,698 | 3,642 | 2,606 | |||||||||
| Foreign: | |||||||||||
| Current | 1,197 | 266 | 523 | ||||||||
| Deferred | (519 | ) | (1,597 | ) | (2,101 | ) | |||||
| 678 | (1,331 | ) | (1,578 | ) | |||||||
| Total provision for income taxes | $ | 4,401 | $ | 17,036 | $ | 14,583 | |||||
A reconciliation of the provisionbenefit (provision) for income taxes with amounts determined by applying the statutory U.S. federal income tax rate to income (loss) from continuing operations before income taxes is as follows:follows (in thousands):
| Year Ended December 31, | |||||||||||||||||
| 2023 | 2022 | 2021 | |||||||||||||||
| Federal statutory rates | 21.0 | % | 21.0 | % | 21.0 | % | |||||||||||
| Federal income tax benefit (provision) at statutory rates | $ | 43,904 | $ | 1,024 | $ | (8,459) | |||||||||||
| Change in valuation allowance | (507) | 648 | (385) | ||||||||||||||
| Change in uncertain tax positions | 396 | (390) | 929 | ||||||||||||||
| State income taxes, net of federal benefit | 637 | (521) | (1,717) | ||||||||||||||
| Non-taxable income | — | — | 74 | ||||||||||||||
| Compensation expense | (1,220) | (251) | (1,204) | ||||||||||||||
| Stock-based compensation | (791) | 1,282 | 1,004 | ||||||||||||||
| Legal settlements | (1,608) | — | — | ||||||||||||||
| Meals and entertainment | (154) | (48) | (30) | ||||||||||||||
| Transaction costs | — | — | (89) | ||||||||||||||
| Tax credits | 2,258 | 1,864 | 1,095 | ||||||||||||||
| Goodwill impairment | (38,451) | — | — | ||||||||||||||
| Subsidiary deconsolidation gain | — | (148) | — | ||||||||||||||
| Life insurance expense | 128 | (183) | — | ||||||||||||||
| Political activities | (149) | (197) | — | ||||||||||||||
| Other | (124) | (45) | 165 | ||||||||||||||
| Income tax benefit (provision) | $ | 4,319 | $ | 3,035 | $ | (8,617) | |||||||||||
| Effective income tax rate | 2.1 | % | 62.2 | % | 21.4 | % | |||||||||||
117
| Year Ended December 31, | |||||||||||
| 2017 | 2016 | 2015 | |||||||||
| Federal statutory rates | 35 | % | 35 | % | 35 | % | |||||
| Federal income tax at statutory rates | $ | 22,471 | $ | (657 | ) | $ | (3,533 | ) | |||
| Revaluation of net deferred tax liabilities due to U.S. tax reform | (19,397 | ) | — | — | |||||||
| U.S. tax reform impact on equity income of investee | (1,646 | ) | — | — | |||||||
| Change in valuation allowance | 2,299 | 9,480 | 3,574 | ||||||||
| Change in uncertain tax positions | 7 | 73 | (76 | ) | |||||||
| State income taxes, net of federal benefit | 3,203 | 2,396 | 1,785 | ||||||||
| Difference between federal statutory and foreign tax rate | (1,648 | ) | 9,427 | 4,642 | |||||||
| Stock compensation | 3,400 | — | (184 | ) | |||||||
| Meals and entertainment | 100 | 96 | 81 | ||||||||
| Amortization of deferred consideration | — | — | 9,444 | ||||||||
| Transaction costs | 159 | — | (447 | ) | |||||||
| Contingent consideration liability reversal | — | — | (854 | ) | |||||||
| Nontaxable income | (1,203 | ) | — | (965 | ) | ||||||
| Tax credits | (354 | ) | (947 | ) | (456 | ) | |||||
| Legal expense | (805 | ) | 522 | 284 | |||||||
| Depreciation | — | — | 649 | ||||||||
| Equity in net loss of investee | 569 | 624 | 366 | ||||||||
| Sale of joint venture | (6,021 | ) | — | — | |||||||
| Asset impairment | — | 2,353 | — | ||||||||
| Foreign exchange | 2,925 | (7,001 | ) | — | |||||||
| Other | 342 | 670 | 273 | ||||||||
| Provision for income taxes | $ | 4,401 | $ | 17,036 | $ | 14,583 | |||||
| Effective income tax rate | 7 | % | (907 | )% | (144 | )% | |||||
Deferred income taxes reflect the net tax effects of temporary differences between the carrying amounts of assets and liabilities for financial reporting purposes and the amounts used for income tax purposes. Significant components of the Company’s deferred tax assets and liabilities are as follows:follows (in thousands):
| December 31, | December 31, | ||||||||||||||||||||
| 2017 | 2016 | 2023 | 2022 | ||||||||||||||||||
| Deferred tax assets: | Deferred tax assets: | ||||||||||||||||||||
| Net operating loss carryforwards | $ | 20,496 | $ | 17,742 | |||||||||||||||||
| Capital loss carryforward | |||||||||||||||||||||
| Tax credit carryforwards | 486 | 399 | |||||||||||||||||||
| Interest expense carryforward | |||||||||||||||||||||
| Accounts receivable allowance | 1,134 | 1,341 | |||||||||||||||||||
| Accrued items and reserves | 14,371 | 18,669 | |||||||||||||||||||
| Stock compensation | 1,480 | 4,224 | |||||||||||||||||||
| Stock-based compensation | |||||||||||||||||||||
| Deferred rent | 572 | 915 | |||||||||||||||||||
| Property and equipment depreciation | 300 | — | |||||||||||||||||||
| Deferred revenue | |||||||||||||||||||||
| Project costs | |||||||||||||||||||||
| Software development/implementation costs | |||||||||||||||||||||
| Total deferred tax assets | |||||||||||||||||||||
| Deferred tax liabilities: | Deferred tax liabilities: | ||||||||||||||||||||
| Prepaid expenses | |||||||||||||||||||||
| Property and equipment | |||||||||||||||||||||
| Goodwill and intangible assets | |||||||||||||||||||||
| Equity investment | |||||||||||||||||||||
| Deferred financing costs | |||||||||||||||||||||
| Other | 173 | 180 | |||||||||||||||||||
| 39,012 | 43,470 | ||||||||||||||||||||
| Deferred tax liabilities: | |||||||||||||||||||||
| Deferred financing costs | 38 | 154 | |||||||||||||||||||
| Prepaids | 1,440 | 2,103 | |||||||||||||||||||
| Property and equipment depreciation | — | 1,238 | |||||||||||||||||||
| Goodwill and intangibles amortization | 5,809 | 9,568 | |||||||||||||||||||
| Equity investment | 42,113 | 59,244 | |||||||||||||||||||
| Other | 205 | 203 | |||||||||||||||||||
| 49,605 | 72,510 | ||||||||||||||||||||
| Net deferred tax liabilities | (10,593 | ) | (29,040 | ) | |||||||||||||||||
| Total deferred tax liabilities | |||||||||||||||||||||
| Deferred tax liabilities, net of deferred tax assets | |||||||||||||||||||||
| Less valuation allowance | (26,402 | ) | (27,423 | ) | |||||||||||||||||
| Net deferred tax liabilities | $ | (36,995 | ) | $ | (56,463 | ) | |||||||||||||||
| Net noncurrent deferred tax assets, net of valuation allowance of $26,402 and $27,423 for 2017 and 2016, respectively | 4,632 | 1,510 | |||||||||||||||||||
| Net noncurrent deferred tax liabilities, net of valuation allowance of $0 and $0 for 2017 and 2016, respectively | (41,627 | ) | (57,973 | ) | |||||||||||||||||
| $ | (36,995 | ) | $ | (56,463 | ) | ||||||||||||||||
At December 31, 2017,2023, the Company had no$1.5 million of federal or state net operating loss (“NOL”) carryforwards. The Company also had net operatingapproximately $45.8 million of state NOL carryforwards which expire as follows (in thousands):
| 2024 | $ | 2,430 | |||
| 2025 | 194 | ||||
| 2026 | — | ||||
| 2027 | — | ||||
| 2028 | — | ||||
| 2029 | — | ||||
| 2030 and thereafter | 43,223 | ||||
| Total state net operating loss carryforwards | $ | 45,847 | |||
The federal NOL carryforwards and approximately $16.5 million of the state NOL carryforwards relate to pre-acquisition tax periods and are subject to change of ownership limitations on their use. These limitations are not expected to restrict the ultimate use of these loss carryforwards in the following countries which can be carried forward indefinitely:carryforwards.
| Australia | $ | 41,256 | |
| Canada | 728 | ||
| France | 3,882 | ||
| Saudi Arabia | 82 | ||
| UK | 40,090 | ||
Realization of the Company’s net operating loss carryforwards is dependent on reversing taxable temporary differences and on generating sufficient taxable income. Although realization is not assured, management believes it is more
118
likely than not that all of the deferred tax assets will be realized to the extent they are not covered by a valuation allowance. The amount of the deferred tax assetassets considered realizable, however, could be reduced in the near term if estimates of future taxable income during the carryforward period are reduced.
The net change in the total valuation allowance for the year ended December 31, 20172023 was negative $1,021,an increase of $0.4 million, of which positive $2,299$0.5 million related to current operations and negative $3,320offset by $0.1 million related to the adjustmenta subsidiary disposition. The valuation allowance of the beginning balance. The valuation
On December 22, 2017,March 27, 2020, the Tax ReformCARES Act was enacted which institutes fundamental changesinto law. The CARES Act includes several significant business tax provisions that, among other things, allow businesses to carry back NOLs arising in 2018, 2019 and 2020 to the taxationfive prior years, accelerate refunds of multinational corporations. The Tax Reform Act includes changes to the taxation of foreign earnings by implementing a dividend exemption system, expansion of the current anti-deferral rules, a minimum tax on low-taxed foreign earnings and new measures to deter base erosion. The Tax Reform Act also includes a permanent reduction in the corporate tax rate to 21%, repeal of thepreviously generated corporate alternative minimum tax expensingcredits, deferral of capital investment,employer's share of certain payroll taxes, and generally loosen the business interest limitation of the deduction for interest expense. Furthermore, as part of the transition to the new tax system, a one-time transition tax is imposed on a U.S. shareholder’s historical undistributed earnings and profits (“E&P”) of foreign affiliates. Althoughby the Tax Reform Act.
Pursuant to the CARES Act, is generally effective January 1,the Company carried its 2018 GAAP requires recognition of the tax effects of new legislation during the reporting period that includes the enactment date, which was December 22, 2017.
NOL back five years. As a result, of the reduction in the U.S. corporate income tax rate, the Company revalued its ending net deferred tax liabilities as of December 31, 2017 and recognized a provisional tax benefit of $19,397. The Company has projected net accumulated deficits in foreign E&P; therefore, no provisional tax expense for deemed repatriation has been recognized. For any future foreign earnings, the Company will generally be free of additional U.S. tax consequences due to a dividends received deduction implemented as part of the move to a territorial tax system for foreign subsidiary earnings. The Company continues to assert indefinite reinvestment in outside basis differences. Determination of the amount of unrecognized deferred tax liability on outside basis differences is not practicable because of the complexity of laws and regulations, the varying tax treatment of alternative repatriation scenarios, and the variation due to multiple potential assumptions relating to the timing of any future repatriation.
As of December 31, 2021, the Company has recognizedreceived all of the provisional tax impacts related$27.3 million receivable for the 2018 U.S. NOL carryback. This $27.3 million was also subject to the benefitIRS Joint Committee Review, which was completed in the third quarter of 2021 with no material adjustments being made.
The U.S. House of Representatives has passed bipartisan tax legislation (H.R. 7024, "Tax Relief for American Families and Workers Act of 2024") that would allow for increased current deductions for domestic research and experimentation expenditures, interest expense and fixed asset depreciation. Such legislation, if enacted, would have a favorable impact on our current income taxes payable.
Unrecognized Tax Benefits
The Internal Revenue Service completed its audit of our consolidated U.S. income tax returns for 2015-2018 and no material adjustments were made to the revaluationlarge refunds (total of deferred$47.6 million from capital loss and NOL carrybacks) received from the loss on the WD Services sale. In addition, we are being examined by various states and by the Saudi Arabian tax assetsauthorities. All known adjustments have been fully reserved.
The Company recognizes interest and liabilities in its consolidated financial statements forpenalties as a component of income tax expense. During the year ended December 31, 2017. The final impact2023 and 2022, the Company did not recognize a tax benefit or expense from interest or penalties. During the year ended December 31, 2021, the Company recognized a benefit of approximately $0.2 million in interest and penalties. As of both December 31, 2023 and 2022, the Company had accrued approximately $0.1 million for the payment of penalties and interest.
A reconciliation of the Tax Reform Act may differ from these provisional amounts, possibly materially, due to, among other things, issuance of additional regulatory guidance, changes in interpretations and assumptions the Company has made, and actions the Company may takeliability for unrecognized income tax benefits is as a result of the Tax Reform Act. In accordance with SAB 118, the financial reporting impact of the Tax Reform Act will be completed in the fourth quarter of 2018.follows (in thousands):
| December 31, | |||||||||||||||||
| 2023 | 2022 | 2021 | |||||||||||||||
| Unrecognized tax benefits, beginning of year | $ | 1,680 | $ | 1,290 | $ | 2,219 | |||||||||||
| Increase related to prior year tax positions | 44 | 108 | (1,027) | ||||||||||||||
| Increase related to current year tax positions | 374 | 415 | 148 | ||||||||||||||
| Statute of limitations expiration | (814) | (133) | (50) | ||||||||||||||
| Unrecognized tax benefits, end of year | $ | 1,284 | $ | 1,680 | $ | 1,290 | |||||||||||
119
The entire ending balance in unrecognized tax benefits of $1.3 million as of December 31, 2023 would reduce tax expense and the Company's effective tax rate. The Company expects no material amount of the unrecognized tax benefits to be recognized during the next twelve months. The Company recognizes interest and penalties as a component of income tax expense. During the years ended December 31, 2017, 2016 and 2015, the Company recognized approximately $65, $19 and $27, respectively, in interest and penalties. The Company had approximately $83 and $52 for the payment of penalties and interest accrued as of December 31, 2017 and 2016, respectively.
| December 31, | |||||||||||
| 2017 | 2016 | 2015 | |||||||||
| Unrecognized tax benefits, beginning of year | $ | 1,108 | $ | 271 | $ | 347 | |||||
| Balance upon acquisition/disposition | — | 764 | — | ||||||||
| Increase (decrease) related to prior year positions | 22 | 37 | (47 | ) | |||||||
| Increase related to current year tax positions | 101 | 139 | 48 | ||||||||
| Statute of limitations expiration | (116 | ) | (103 | ) | (77 | ) | |||||
| Unrecognized tax benefits, end of year | $ | 1,115 | $ | 1,108 | $ | 271 | |||||
The Company is subject to taxation in the U.S. and various foreign and state jurisdictions. The statute of limitations is generally three years for the U.S., two to five years in foreign countries and between three and four years for the various states in which the Company operates. The Company is subject to the following material taxing jurisdictions: the U.S., UK, Australia, France, Saudi Arabia and Korea. The tax years that remain open for examination by the U.S. and various foreign countries and states principally include the years 20132019 to 2017.2022.
In addition to the matter described above, in the ordinary course of business, the Company is a partymay from time to time be or become subject to surveys, audits and governmental investigations under or with respect to various lawsuits.governmental programs and state and federal laws. Agencies associated with the programs and other third-party commercial payors periodically conduct extensive pre-payment or post-payment medical reviews or other audits of claims data to identify possible payments made or authorized other than in compliance with the requirements of Medicare or Medicaid. In order to conduct these reviews, documentation is requested from the Company and then that documentation is reviewed to determine compliance with applicable rules and regulations, including the eligibility of clients to receive benefits, the appropriateness of the care provided to those clients, and the documentation of that care. Similarly, other state and federal governmental agencies conduct reviews and investigations to confirm the Company's compliance with applicable laws where it operates, including regarding employment and wage related regulations and matters. The Company cannot predict the ultimate outcome of any regulatory reviews or other governmental surveys, audits or investigations, but management does not expect any ongoing surveys, audits or investigations involving the Company to have a material adverse effect on the business, liquidity, financial condition, or results of operations of the Company. Regardless of the Company's expectations, however, surveys and audits are subject to inherent uncertainties and can have a material adverse impact on the Company due to, among other reasons, potential regulatory orders that inhibit its ability to operate its business, amounts paid as reimbursement or in settlement of any such matter, diversion of management resources and investigative costs.
Legal Proceedings
In the ordinary course of business, the Company may from time to time be or become involved in various lawsuits, some of which may seek monetary damages, including claims for punitive damages. Management does not expect theseany ongoing lawsuits involving the Company to have a material impact on the business, liquidity, financial condition, or results of operations of the Company. Legal proceedings are subject to inherent uncertainties, however, and unfavorable rulings or other events could occur. Unfavorable resolutions could involve substantial monetary damages. In addition, in matters for which conduct remedies are sought, unfavorable resolutions could include an injunction or other order precluding particular business practices or requiring other remedies. An unfavorable outcome might result in a material adverse impact on our business, liquidity, financial conditionposition, or results of Providence.operations.
The Company indemnifiedrecords accruals for loss contingencies related to legal matters when it is probable that a liability will be incurred and the Standby Purchasers from and against any and allamount of the loss can be reasonably estimated. If the Company determines that a range of reasonably possible losses claims, damages, expenses and liabilities relatingcan be estimated, the Company records an accrual for the most probable amount in the range. Due to or arising out of (i) any breachthe inherent difficulty in predicting the outcome of any representation, warranty, covenant or undertaking made by or on behalflegal proceeding, it may not be reasonably possible to estimate a range of potential liability until the matter is closer to resolution. Legal fees related to all legal matters are expensed as incurred.
On September 27, 2022, Daniel Greenleaf, the Company’s former Chief Executive Officer, asserted claims in an arbitration against the Company. His claims alleged that the Company breached Mr. Greenleaf’s employment agreement and included a tort claim against the Company. Mr. Greenleaf’s arbitration complaint sought contractual, extra-contractual, and statutory damages. In May 2023, Mr. Greenleaf and the Company executed a settlement agreement related to both sides' claims in arbitration and a general release of all claims and the Company agreed to pay Mr. Greenleaf $9.6 million. The Company paid the settlement amount in full in May of 2023.
On August 6, 2020, the Company’s subsidiary, ModivCare Solutions, LLC (“ModivCare Solutions”), was served with a putative class action lawsuit filed against it by Mohamed Farah, the owner of transportation provider Dalmar Transportation, in the Standby Purchase Agreement and (ii)Western District of Missouri, seeking to represent all non-employee transportation providers contracted with ModivCare Solutions. The lawsuit alleged claims under the transactions contemplated by the Standby Purchase AgreementFair Labor Standards Act of 1938, as amended (the “FLSA”), and the 14.0% Unsecured Subordinated Note in aggregate principal amount of $65,500, exceptMissouri Minimum Wage Act, and asserted that all transportation providers to the extent that any such losses, claims, damages, expenses and liabilities are attributable to the gross negligence, willful misconduct or fraud of such Standby Purchaser.
120
through their companies, were issued 1099 payments from ModivCare Solutions for providing non-emergency medical transportation services for ModivCare Solutions for the years ended December 31, 2017, 2016
In 2017, one of our PCS segment subsidiaries, All Metro Home Care Services of New York, Inc. d/b/a All Metro Health Care (“All Metro”), received a class action lawsuit in state court claiming that, among other things, it failed to properly pay live-in caregivers who stay in patients’ homes for 24 hours per day (“live-ins”). The Company entered intopays live-ins for 13 hours per day as supported through a memorandumwritten opinion letter from the New York State Department of understanding; andLabor (“NYSDOL”). A similar case involving this issue has been heard by the New York Court of Appeals (New York’s highest court), which on March 1, 2018, Molina26, 2019, issued a ruling reversing earlier lower courts’ decisions that an employer must pay live-ins for 24 hours. The Court of Appeals agreed with the NYSDOL’s interpretation to pay live-ins 13 hours instead of 24 hours if certain conditions were being met. Following All Metro's motion to oppose class certification, which was heard on June 23, 2022, the state court issued an order certifying the class on December 12, 2022. Because the parties to date have been unable to settle their dispute through mediation, discovery in the matter is continuing. If the plaintiffs prove successful in this class action lawsuit, All Metro may be liable for back wages and liquidated damages dating back to November 2021. All Metro believes that it is and has been in compliance in all material respects with the Company entered into a settlement agreement, regarding a settlement of an indemnification claim by Molinalaws and regulations covering pay for live-in caregivers, intends to continue to defend itself vigorously with respect to the Rodriguez Litigationthis matter, and other matters. As of December 31, 2017, the accrual is $15,000 with respect to an estimate of loss for potential indemnification claims. The Company expects to recover a portion of the settlement through insurance coverage, although this cannot be assured.
Purchased Service Commitments
The Company has provided certain standard indemnifications in connection with its Matrix stock subscription transaction whereby Mercury Fortuna Buyer, LLC (“Subscriber”), Providence and Matrix entered into a stock subscription agreement (the “Subscription Agreement”), dated August 28, 2016. The representations and warranties made bycontract related to transportation services that includes a minimum volume requirement. If the Company does not utilize the minimum level of services specified in the Subscription Agreement ended January 19, 2018; however, certain fundamental representations survive throughagreement, a penalty provision applies. Future minimum payments under the 36th month following the closing date. The covenants and agreements of the parties to be performed prior to the closing ended January 19, 2018, and all other covenants and agreements survive until the expiration of the applicable statute of limitations in the event of a breach, or for such lesser periods specified therein. The Company is not aware of any indemnification liabilities with respect to Matrix that require accrualservice commitments totaled $49.5 million at December 31, 2017.2023 and relates to minimum volume requirements through the end of December 31, 2024.
Deferred Compensation Plan
The Company has one deferred compensation plan for management and highly compensated employees of NETNEMT Services as of December 31, 2017.2023. The deferred compensation plan is unfunded, and benefits are paid from the general assets of the Company. The total of participant deferrals, which is reflected in “Other long-term liabilities” in the consolidated balance sheets, was $1,806$2.2 million and $1,430$2.0 million at December 31, 20172023 and 2016,2022, respectively.
Cash Settled Awards
On September 11, 2014, the Company granted 200,000 stock option equivalent units (“SOEUs”) to Coliseum Capital Management, LLC (“Coliseum”) as compensation for the Board service of Christopher Shackelton, Chairman of the Board, for his service on the Board in lieu of the restricted share awards that are given to our other non-employee directors as compensation. These shares were granted at an exercise price of $43.81 per share that were fully vested. The SOEUs were accounted for as liability awards, with the recorded expense adjustment attributable to the Company’s change in stock price from the previous reporting period. On August 12, 2021, Coliseum exercised all of the SOEUs at a stock price of $182.73 per share for a total cash settlement of $27.8 million. The Company incurred legal expenses underrecorded an indemnification agreement with the Standby Purchasers as further discussed in Note 18, Commitments and Contingencies. Preferred Stock dividends earned by the Standby Purchasers during the years ended December 31, 2017 and 2016 totaled $4,213 each year.
| Year ended December 31, 2017 | |||||||||||
Human Services Segment | HA Services Segment | Total Discontinued Operations | |||||||||
| Operating expenses: | |||||||||||
| General and administrative expense | $ | 9,674 | $ | — | $ | 9,674 | |||||
| Total operating expenses | 9,674 | — | 9,674 | ||||||||
| Loss from discontinued operations before income taxes | (9,674 | ) | — | (9,674 | ) | ||||||
| Income tax benefit | 3,691 | — | 3,691 | ||||||||
| Discontinued operations, net of tax | $ | (5,983 | ) | $ | — | $ | (5,983 | ) | |||
| Year ended December 31, 2016 | |||||||||||
Human Services Segment | HA Services Segment | Total Discontinued Operations | |||||||||
| Service revenue, net | $ | — | $ | 166,090 | $ | 166,090 | |||||
| Operating expenses: | |||||||||||
| Service expense | — | 120,906 | 120,906 | ||||||||
| General and administrative expense | 7,966 | 2,148 | 10,114 | ||||||||
| Depreciation and amortization | — | 21,121 | 21,121 | ||||||||
| Total operating expenses | 7,966 | 144,175 | 152,141 | ||||||||
| Operating income (loss) | (7,966 | ) | 21,915 | 13,949 | |||||||
| Other expenses: | |||||||||||
| Write-off of deferred financing fees | — | 2,302 | 2,302 | ||||||||
| Interest expense, net | — | 9,929 | 9,929 | ||||||||
| Income (loss) from discontinued operations before gain on disposition and income taxes | (7,966 | ) | 9,684 | 1,718 | |||||||
| Gain on disposition | — | 167,895 | 167,895 | ||||||||
| (Provision) benefit for income taxes | 2,401 | (63,254 | ) | (60,853 | ) | ||||||
| Discontinued operations, net of tax | $ | (5,565 | ) | $ | 114,325 | $ | 108,760 | ||||
| Year ended December 31, 2015 | |||||||||||
Human Services Segment | HA Services Segment | Total Discontinued Operations | |||||||||
| Service revenue, net | $ | 291,510 | $ | 217,436 | $ | 508,946 | |||||
| Operating expenses: | |||||||||||
| Service expense | 264,293 | 163,211 | 427,504 | ||||||||
| General and administrative expense | 14,975 | 2,630 | 17,605 | ||||||||
| Asset impairment charge | 1,593 | — | 1,593 | ||||||||
| Depreciation and amortization | 4,831 | 29,472 | 34,303 | ||||||||
| Total operating expenses | 285,692 | 195,313 | 481,005 | ||||||||
| Operating income | 5,818 | 22,123 | 27,941 | ||||||||
| Other expenses: | |||||||||||
| Interest expense, net | 2,829 | 14,359 | 17,188 | ||||||||
| Income from discontinued operations before gain on disposition and income taxes | 2,989 | 7,764 | 10,753 | ||||||||
| Gain on disposition | 123,129 | — | 123,129 | ||||||||
| Provision for income taxes | (24,318 | ) | (1,693 | ) | (26,011 | ) | |||||
| Discontinued operations, net of tax | $ | 101,800 | $ | 6,071 | $ | 107,871 | |||||
| Year ended December 31, | |||||||
| 2016 | 2015 | ||||||
| Human Services Segment | $ | — | $ | 2,871 | |||
| HA Services Segment | 9,939 | 14,376 | |||||
| Total | $ | 9,939 | $ | 17,247 | |||
| For the year ended December 31, 2016 | |||||||||||
Human Services Segment | HA Services Segment | Total Discontinued Operations | |||||||||
| Cash flows from discontinued operating activities: | |||||||||||
| Depreciation | $ | — | $ | 3,661 | $ | 3,661 | |||||
| Amortization | — | 17,460 | 17,460 | ||||||||
| Stock-based compensation | — | (18 | ) | (18 | ) | ||||||
| Deferred income taxes | — | 52,338 | 52,338 | ||||||||
| Cash flows from discontinued investing activities: | |||||||||||
| Purchase of property and equipment | $ | — | $ | 9,174 | $ | 9,174 | |||||
| For the year ended December 31, 2015 | |||||||||||
Human Services Segment | HA Services Segment | Total Discontinued Operations | |||||||||
| Cash flows from discontinued operating activities: | |||||||||||
| Depreciation | $ | 2,376 | $ | 3,370 | $ | 5,746 | |||||
| Amortization | 2,455 | 26,102 | 28,557 | ||||||||
| Asset impairment charge | 1,593 | — | 1,593 | ||||||||
| Stock-based compensation | 7 | 108 | 115 | ||||||||
| Deferred income taxes | (5,680 | ) | 730 | (4,950 | ) | ||||||
| Cash flows from discontinued investing activities: | |||||||||||
| Purchase of property and equipment | $ | 2,224 | $ | 8,079 | $ | 10,303 | |||||
| Year Ended December 31, 2017 | |||||||||||||||||||
| NET Services | WD Services | Matrix Investment | Corporate and Other | Total | |||||||||||||||
| Service revenue, net | $ | 1,318,220 | $ | 305,662 | $ | — | $ | — | $ | 1,623,882 | |||||||||
| Service expense | 1,227,426 | 265,417 | — | (3,799 | ) | 1,489,044 | |||||||||||||
| General and administrative expense | 11,779 | 25,438 | — | 35,119 | 72,336 | ||||||||||||||
| Depreciation and amortization | 13,275 | 12,851 | — | 343 | 26,469 | ||||||||||||||
| Operating income (loss) | $ | 65,740 | $ | 1,956 | $ | — | $ | (31,663 | ) | $ | 36,033 | ||||||||
| Equity in net (gain) loss of investees | $ | — | $ | 1,391 | $ | (13,445 | ) | $ | — | $ | (12,054 | ) | |||||||
| Investment in equity method investee | $ | — | $ | 213 | $ | 169,699 | $ | — | $ | 169,912 | |||||||||
| Total assets | $ | 294,127 | $ | 184,805 | $ | 169,699 | $ | 55,459 | $ | 704,090 | |||||||||
| Long-lived asset expenditures | $ | 15,319 | $ | 4,527 | $ | — | $ | 77 | $ | 19,923 | |||||||||
| Year Ended December 31, 2016 | |||||||||||||||||||
| NET Services | WD Services | Matrix Investment | Corporate and Other | Total | |||||||||||||||
| Service revenue, net | $ | 1,233,720 | $ | 344,403 | $ | — | $ | 122 | $ | 1,578,245 | |||||||||
| Service expense | 1,132,857 | 320,147 | — | (894 | ) | 1,452,110 | |||||||||||||
| General and administrative expense | 11,406 | 30,300 | — | 28,205 | 69,911 | ||||||||||||||
| Asset impairment charge | — | 19,588 | — | 1,415 | 21,003 | ||||||||||||||
| Depreciation and amortization | 12,375 | 13,824 | — | 405 | 26,604 | ||||||||||||||
| Operating income (loss) | $ | 77,082 | $ | (39,456 | ) | $ | — | $ | (29,009 | ) | $ | 8,617 | |||||||
| Equity in net (gain) loss of investees | $ | — | $ | 8,498 | $ | 1,789 | $ | — | $ | 10,287 | |||||||||
| Investment in equity method investee | $ | — | $ | 4,161 | $ | 157,202 | $ | — | $ | 161,363 | |||||||||
| Total assets | $ | 313,371 | $ | 160,152 | $ | 157,202 | $ | 54,554 | $ | 685,279 | |||||||||
| Long-lived asset expenditures | $ | 10,845 | $ | 19,810 | $ | — | $ | 1,387 | $ | 32,042 | |||||||||
| Year Ended December 31, 2015 | |||||||||||||||
| NET Services | WD Services | Corporate and Other | Total | ||||||||||||
| Service revenue, net | $ | 1,083,015 | $ | 395,059 | $ | (64 | ) | $ | 1,478,010 | ||||||
| Service expense | 991,659 | 393,803 | (4,308 | ) | 1,381,154 | ||||||||||
| General and administrative expense | 10,704 | 29,846 | 30,436 | 70,986 | |||||||||||
| Depreciation and amortization | 9,429 | 13,776 | 793 | 23,998 | |||||||||||
| Operating income (loss) | $ | 71,223 | $ | (42,366 | ) | $ | (26,985 | ) | $ | 1,872 | |||||
| Equity in net (gain) loss of investees | $ | — | $ | 10,970 | $ | — | $ | 10,970 | |||||||
| Long-lived asset expenditures | $ | 12,232 | $ | 11,869 | $ | 668 | $ | 24,769 | |||||||
| For the year ended December 31, 2017 | |||||||||||||||
United States | United Kingdom | Other Foreign | Consolidated Total | ||||||||||||
| Service revenue, net | $ | 1,335,389 | $ | 187,655 | $ | 100,838 | $ | 1,623,882 | |||||||
| Long-lived assets (a) | 37,700 | 9,354 | 3,323 | 50,377 | |||||||||||
| For the year ended December 31, 2016 | |||||||||||||||
United States | United Kingdom | Other Foreign | Consolidated Total | ||||||||||||
| Service revenue, net | $ | 1,250,043 | $ | 235,061 | $ | 93,141 | $ | 1,578,245 | |||||||
| Long-lived assets (a) | 32,007 | 9,823 | 4,390 | 46,220 | |||||||||||
| For the year ended December 31, 2015 | |||||||||||||||
United States | United Kingdom | Other Foreign | Consolidated Total | ||||||||||||
| Service revenue, net | $ | 1,099,918 | $ | 298,386 | $ | 79,706 | $ | 1,478,010 | |||||||
operations. At December 31, 2017, $99,071 of2023, 2022 and 2021, respectively, there were no SOEU's outstanding and no remaining liability associated with the Company’s net assets from continuing operations were located in countries outside of the U.S. At December 31, 2016, $76,579 of the Company’s net assets from continuing operations were located in countries outside of the U.S.awards.
121
| Quarter ended | |||||||||||||||
| March 31, 2017 (1) | June 30, 2017 | September 30, 2017 (2) | December 31, 2017 (3)(4)(5) | ||||||||||||
| Service revenue, net | $ | 399,494 | $ | 407,983 | $ | 409,517 | $ | 406,888 | |||||||
| Operating Income | 6,788 | 5,999 | 6,309 | 16,937 | |||||||||||
| Income from continuing operations, net of tax | 1,915 | 3,858 | 14,964 | 39,066 | |||||||||||
| Discontinued operations, net of tax | (5,866 | ) | (117 | ) | (16 | ) | 16 | ||||||||
| Net income (loss) attributable to Providence | (4,325 | ) | 3,915 | 14,853 | 38,926 | ||||||||||
| Earnings (loss) per common share (10): | |||||||||||||||
| Basic | $ | (0.40 | ) | $ | 0.18 | $ | 0.88 | $ | 2.43 | ||||||
| Diluted | $ | (0.40 | ) | $ | 0.18 | $ | 0.88 | $ | 2.41 | ||||||
| Quarter ended | |||||||||||||||
| March 31, 2016 | June 30, 2016 | September 30, 2016 (6) | December 31, 2016 (7)(8)(9) | ||||||||||||
| Service revenue, net | $ | 382,036 | $ | 398,119 | $ | 412,271 | $ | 385,819 | |||||||
| Operating Income (loss) | 8,304 | 6,712 | 9,793 | (16,192 | ) | ||||||||||
| Income (loss) from continuing operations, net of tax | 1,376 | 1,624 | 3,743 | (25,657 | ) | ||||||||||
| Discontinued operations, net of tax | 753 | 2,370 | (2,791 | ) | 108,428 | ||||||||||
| Net income attributable to Providence | 2,235 | 4,623 | 650 | 84,420 | |||||||||||
| Earnings (loss) per common share (10): | |||||||||||||||
| Basic | $ | 0.07 | $ | 0.21 | $ | (0.05 | ) | $ | 4.92 | ||||||
| Diluted | $ | 0.07 | $ | 0.21 | $ | (0.05 | ) | $ | 4.92 | ||||||
Item 9. Changes in and Disagreements With Accountants on Accounting and Financial Disclosure.
None.
Item 9A. Controls and Procedures.
Evaluation of Disclosure Controls and Procedures
The Company,Company's management, under the supervision and with the participation of its management (including its principal executive officer and principal financial officer),officer, evaluated the effectiveness of the design and operation of the Company’s disclosure controls and procedures as(as defined in RuleRules 13a-15(e) ofand 15d-15(e) under the Securities Exchange Act of 1934, as amended (the Exchange Act)), as of the end of the period covered by this Annual Report on Form 10-K (December 31, 2017)2023). Based upon this evaluation, the Company’s principal executive officer and principal financial officers haveofficer concluded that, suchas a result of the material weaknesses identified in internal control over financial reporting described below, the Company’s disclosure controls and procedures were not effective as of December 31, 2023.
In light of the material weaknesses described below, management performed additional analysis and other procedures to provide reasonable assuranceensure that (i) information required to be disclosed byour consolidated financial statements were prepared in accordance with U.S. generally accepted accounting principles (GAAP). Accordingly, management believes that the Companyconsolidated financial statements included in this Annual Report fairly present, in all material respects, our financial position, results of operations, and cash flows as of and for the reports that it files or submits under the Exchange Act is recorded, processed, summarized and reported within the time periods specifiedpresented, in the SEC’s rules and forms and (ii) information required to be disclosed by the Company in the reports that it files or submits under the Exchange Act is accumulated and communicated to the Company’s management, including its principal executive and financial officers, or persons performing similar functions, as appropriate to allow timely decisions regarding required disclosure.accordance with GAAP.
Management’s Report on Internal Control Over Financial Reporting
The Company's management, under the supervision and with the participation of its principal executive officer and principal financial officer, and under the oversight of its Board of Directors, conducted an evaluation of the effectiveness of the Company’s internal control over financial reporting as of December 31, 2023 based on the criteria set forth in the Internal Control–Integrated Framework (2013) issued by the Committee of Sponsoring Organizations of the Treadway Commission (“COSO”). Based on such evaluation, management determined that the Company’s internal control over financial reporting was not effective as of December 31, 2023 as a result of the material weaknesses discussed in the paragraphs that follow below.
A material weakness is a deficiency, or a combination of deficiencies, in internal control over financial reporting, such that there is a reasonable possibility that a material misstatement of our annual or interim financial statements will not be prevented or detected on a timely basis.
The Company's management concluded that the Company did not, with respect to its PCS segment, complete before year-end (i) an effective risk assessment to assess and confirm the effectiveness and implementation of the changes previously identified in its internal control environment related to recently deployed information technology ("IT") systems and revision of the PCS revenue and payroll processes, or (ii) the establishment of all mechanisms expected to be used to enforce accountability in the pursuit of objectives to establish and operate effective internal control over financial reporting. Specifically, at the PCS segment:
•The Company did not establish effective general information technology controls ("GITCs"), namely change management controls and logical access controls, that support the consistent operation of all of the Company’s IT systems, resulting in automated process-level controls and manual controls dependent upon
122
information derived from those IT systems to be ineffective because they could have been adversely impacted; and
•The Company did not design, implement and effectively operate process-level control activities related to its revenue processes (including service revenue and accounts receivable) and payroll processes (including payroll expenses recorded within service expense and general and administrative expense) within the PCS segment.
The deficiencies in our internal control over financial reporting and the material weaknesses described above did not result in any misstatement in our consolidated financial statements or other disclosures. These deficiencies created, however, a reasonable possibility that a material misstatement in our consolidated financial statements would not be prevented or detected on a timely basis.
Our independent registered public accounting firm, KPMG LLP, who audited the Company’s consolidated financial statements included in this Annual Report, has issued an adverse opinion on the operating effectiveness of the Company’s internal control over financial reporting. KPMG LLP’s report is presented in Part II, Item 8 of this Annual Report and is hereby incorporated by reference.Report.
In furtherance of the foregoing, the Company has embarked upon an approved remediation plan, the efforts of which include working with our independent third-party internal control specialist, which is helping coordinate the remediation efforts, as well as adding resources within the organization to improve structure and mitigate risks previously identified. The remediation plan designed was a robust, global plan intended to address not only the PCS segment identified weaknesses, but also the weaknesses identified in prior periods with respect to our NEMT and Corporate and Other segments. Approaching the remediation in auniform and enterprise wide manner has required additional time to implement, but it was believed to be the better approach than to adopt a patchwork fix without a view to eliminating future enterprise risk To that end, the Company has completed and/or is in the process of completing, as applicable, the following remediation activities deemed necessary or desirable to eliminate the material weaknesses and restore its internal control over financial reporting as intended:
•Implemented a new revenue cycle management system and designed a new suite of GITCs and process-level controls related to the new system;
•Integrated the PCS segment into our enterprise resource planning software and standardized control activities related to the Company’s financial statement close process;
•Executed an enhanced risk assessment process to identify and assess changes in the Company's internal control environment, specifically related to new IT systems and newly acquired companies;
•Continued to design, enhance and implement GITCs, the efforts with respect to which are ongoing, to support process-level automated controls intended to ensure that information needed for the operation of manual process-level controls and financial reporting is presentedaccurate and complete;
•Continued to design, enhance and implement, the efforts with respect to which are ongoing, process-level control activities in Part II, Item 8,revenue and payroll.
The Company's management continues to focus on projects that automate, standardize, and centralize the Company's control environment as it continues to integrate the PCS segment. Management believes that the remediation measures described above will address the material weaknesses and strengthen the Company's overall internal control over financial reporting. Management will continue to monitor the progress of thisthese efforts, and may take additional measures or modify the remediation plan described above in order to effectively address the control deficiencies. The material weaknesses will not be considered remediated until the remediated controls have operated for a sufficient amount of time for us to conclude, through testing, that the controls are designed and operating effectively.
During the fiscal year ended December 31, 2023, management completed the remediation efforts necessary to fully and effectively remediate and eliminate the material weaknesses previously disclosed by the Company in its Annual Report on Form 10-K for the fiscal year ended December 31, 2022 with respect to its NEMT and is hereby incorporatedCorporate and Other Segments related to the payroll processing function and change management and logical access controls. The remediation efforts necessary to eliminate those material weaknesses included (i) implementing a new personnel management system in 2023 after the sunsetting of the legacy system and designing and implementing a new suite of internal controls in payroll with appropriate
123
authorities within the NEMT and Corporate and Other segments, and (ii) designing, enhancing, and implementing GITCs to support process-level automated controls within the NEMT and Corporate and Other segments. As a result of the foregoing, as of December 31, 2023, management was able to conclude that the material weaknesses previously disclosed at the NEMT and Corporate and Other segments were fully and effectively remediated.
Furthermore, as previously disclosed in Item 9A. “Controls and Procedures” of our Annual Report on Form 10-K for the fiscal year ended December 31, 2022, in addition to the material weaknesses identified at the NEMT and Corporate and Other segments above, management identified material weaknesses in the PCS segment's internal control over financial reporting related to the effectiveness of the new structure adopted for its reporting lines and approved for the identification of appropriate authorities and responsibilities. The remediation efforts necessary to eliminate that material weakness included structuring more effective reporting lines, including the hiring of a President of the PCS segment, a Chief Financial Officer to eliminate the dual role previously also performed by reference.our Chief Executive Officer, a Chief Information Officer, and a Chief People Officer, to promote appropriate authorities and responsibilities and strengthen mechanisms to enforce accountability of internal control over financial reporting. As a result of the foregoing, as of December 31, 2023, management was able to conclude that this material weakness previously disclosed at the PCS segment was fully and effectively remediated.
Changes in Internal Control Over Financial Reporting
Item 9B. Other Information.
PART III
Item 10. Directors, Executive Officers and Corporate Governance. |
Code of Ethics
We have adopted a code of ethics that applies to our senior management, including our chief executive officer, chief financial officer, controller and persons performing similar functions, as well as our directors, officers and employees. This code of ethics is part of our broader Compliance and Ethics Plan and Code of Conduct, which is available free of charge in the Investor Relations“Investors” section of our website at www.prscholdings.com.www.modivcare.com. We intend to disclose any amendment to, or waiver from, a provision of the code of ethics that applies to our principal executive officer, principal financial officer or principal accounting officer on our website. The information contained on our website is not part of, and is not incorporated in, this Annual Report on Form 10-K or any other report we file with or furnish to the SEC.
Item 11. Executive Compensation. |
Item 12. Security Ownership of Certain Beneficial Owners and Management and Related Stockholder Matters. |
The following table provides information, as of December 31, 2023, regarding our 2006 Plan and the ESPP.
124
| Plan category | Number of Securities to be Issued Upon Exercise of Outstanding Options, Warrants and Rights(1) | Weighted-Average Exercise Price of Outstanding Options, Warrants and Rights | Number of Securities Remaining Available for Future Issuance Under Equity Compensation Plans (excluding securities reflected in the first column)(2) | |||||||||||||||||
| Equity compensation plans approved by security holders | 586,696 | $ | 52.63 | 1,776,308 | ||||||||||||||||
| Equity compensation plans not approved by security holders | — | — | — | |||||||||||||||||
| Total | 586,696 | $ | 52.63 | 1,776,308 | ||||||||||||||||
(1) The number of shares shown in this column represents the number of shares available for issuance pursuant to stock options and other stock-based awards that were previously granted and were outstanding as of December 31, 2023 under the 2006 Plan.
(2) The number of shares shown in this column represents 792,338 shares available for issuance under the 2006 Plan and 983,970 shares available for issuance under the ESPP.
Item 13. Certain Relationships and Related Transactions, and Director Independence.
Item 14. Principal Accounting Fees and Services. |
PART IV
Item 15. Exhibits, Financial Statement Schedules.
(a)(1) Financial Statements
The following consolidated financial statements including footnotes are included in Item 8.
•Consolidated Balance Sheets at December 31, 20172023 and 2016; 2022;
•Consolidated Statements of IncomeOperations for the years ended December 31, 2017, 20162023, 2022 and 2015;2021;
•Consolidated Statements of Comprehensive IncomeCash Flows for the years ended December 31, 2017, 20162023, 2022 and 2015;2021; and
•Consolidated Statements of Stockholders’ Equity for the years ended December 31, 2017, 20162023, 2022 and 2015; and
(2) Financial Statement Schedules
Schedule II Valuation and Qualifying Accounts
125
| Additions | |||||||||||||||||||
| Balance at beginning of period | Charged to costs and expenses | Charged to other accounts | Deductions | Balance at end of period | |||||||||||||||
| Year Ended December 31, 2017: | |||||||||||||||||||
| Allowance for doubtful accounts | $ | 5,901 | $ | 815 | $ | (466 | ) | (1) | $ | 488 | (2) | $ | 5,762 | ||||||
| Year Ended December 31, 2016: | |||||||||||||||||||
| Allowance for doubtful accounts | $ | 4,380 | $ | 3,298 | $ | 1,058 | (1) | $ | 2,835 | (2) | $ | 5,901 | |||||||
| Year Ended December 31, 2015: | |||||||||||||||||||
| Allowance for doubtful accounts | $ | 3,198 | $ | 1,928 | $ | 1,152 | (1) | $ | 1,898 | (2) | $ | 4,380 | |||||||
| Additions | |||||||||||||||||||||||||||||
| Balance at beginning of period | Charged to costs and expenses | Charged to other accounts | Deductions | Balance at end of period | |||||||||||||||||||||||||
| Year Ended December 31, 2023: | |||||||||||||||||||||||||||||
| Allowance for doubtful accounts | $ | 2,078 | $ | 4,001 | $ | — | $ | (5,110) | (1) | $ | 969 | ||||||||||||||||||
| Year Ended December 31, 2022: | |||||||||||||||||||||||||||||
| Allowance for doubtful accounts | $ | 2,296 | $ | 2,690 | $ | — | $ | (2,908) | (1) | $ | 2,078 | ||||||||||||||||||
| Year Ended December 31, 2021: | |||||||||||||||||||||||||||||
| Allowance for doubtful accounts | $ | 2,403 | $ | 1,740 | $ | — | $ | (1,847) | (1) | $ | 2,296 | ||||||||||||||||||
Notes:
All other schedules are omitted because they are not applicable or the required information is shown in our financial statements or the related notes thereto.
126
(3) Exhibits
| Exhibit Number | Description | |||||||
| 2.1 | ||||||||
| 3.2 | ||||||||
| 3.3 | ||||||||
| 3.4 | ||||||||
| 3.5 | ||||||||
| 4.1* | ||||||||
| 4.2 | ||||||||
| 4.3 | ||||||||
127
| 10.6* | ||||||||
| 10.7+ | ||||||||
| 10.8+ | ||||||||
| 10.9+ | ||||||||
| 10.10+ | ||||||||
| 10.12+ | ||||||||
| 10.13+ | ||||||||
| 10.14+ | ||||||||
128
| 21.1* | ||||||||
| 23.1* | ||||||||
| 23.2* | ||||||||
| 31.1* | ||||||||
| 31.2* | ||||||||
| 32.1** | ||||||||
| 32.2** | ||||||||
| 101. INS* | Inline XBRL Instance Document | |||||||
| 101.SCH* | Inline XBRL Schema Document | |||||||
| 101.CAL* | Inline XBRL Calculation Linkbase Document | |||||||
| 101.LAB* | Inline XBRL Label Linkbase Document | |||||||
| 101.PRE* | Inline XBRL Presentation Linkbase Document | |||||||
| 101.DEF* | Inline XBRL Definition Linkbase Document | |||||||
| 104 | Cover page Interactive Data File (formatted as Inline XBRL and contained in Exhibit 101) |
| + | Management contract or compensatory plan or arrangement. | |||||||
| * | Filed herewith other than by incorporation by reference. | |||||||
| ** | Furnished herewith. | |||||||
| † | Certain schedules and exhibits have been omitted pursuant to Item 601(a)(5) of Regulation S-K. The descriptions of the omitted schedules and exhibits are contained within the agreement. The Company hereby agrees to furnish a copy of any omitted schedule or exhibit to the SEC upon request. | |||||||
129
Item 16. Form 10-K Summary.
None.
130
SIGNATURES
Pursuant to the requirements of Section 13 or 15(d) of the Securities Exchange Act of 1934, the registrant has duly caused this report to be signed on its behalf by the undersigned, thereunto duly authorized.
| ModivCare Inc. | ||||||||
| /s/ L. Heath Sampson | ||||||||
Chief Executive Officer | ||||||||
Dated: March 9, 2018February 23, 2024
Pursuant to the requirements of the Securities Exchange Act of 1934, this report has been signed below by the following persons on behalf of the registrant and in the capacities and on the dates indicated.
131
| Signature | Title | Date | ||||||||||||
| /s/ L. HEATH SAMPSON | ||||||||||||||
| (Principal Executive Officer) | ||||||||||||||
| / | Chief Financial Officer | |||||||||||||
| (Principal Financial Officer) | ||||||||||||||
| / | Chief Accounting Officer | |||||||||||||
| (Principal Accounting Officer) | ||||||||||||||
| / | Chairman of the Board | |||||||||||||
| Christopher S. Shackelton | ||||||||||||||
| / | Director | |||||||||||||
| Todd J. Carter | ||||||||||||||
| / | Director | |||||||||||||
| David A. Coulter | ||||||||||||||
| / | Director | |||||||||||||
| Richard A. Kerley | ||||||||||||||
| / | ||||||||||||||
| Director | ||||||||||||||
| Leslie V. Norwalk | ||||||||||||||
| / | Director | |||||||||||||
| Frank J. Wright | ||||||||||||||
| /s/ RAHUL SAMANT | Director | February 23, 2024 | ||||||||||||
| Rahul Samant | ||||||||||||||
| /s/ GARTH GRAHAM | Director | February 23, 2024 | ||||||||||||
| Garth Graham | ||||||||||||||
132