UNITED STATES
SECURITIES AND EXCHANGE COMMISSION
Washington, D.C. 20549
Form 10-K
|
| | | | | | | |
| (Mark One) | |
þ☑ | ANNUAL REPORT PURSUANT TO SECTION 13 OR 15(d) OF THE SECURITIES EXCHANGE ACT OF 1934 |
| For the fiscal yearannual period ended | June 30, 20182021 |
| or |
o☐ | TRANSITION REPORT PURSUANT TO SECTION 13 OR 15(d) OF THE SECURITIES EXCHANGE ACT OF 1934 |
| For the transition period from to |
Commission file number 000-51539
Cimpress N.V.plc
(Exact Name of Registrant as Specified in Its Charter)
|
| | | | | | | | | | |
The NetherlandsIreland | | 98-0417483 |
(State or Other Jurisdiction of
Incorporation or Organization)
| | (I.R.S. Employer Identification No.) |
Hudsonweg 8Building D, Xerox Technology Park A91 H9N9,
5928 LW VenloDundalk, Co. Louth
The NetherlandsIreland
(Address of Principal Executive Offices) (Zip Code)
Registrant’s telephone number, including area code: 31-77-850-7700353 42 938 8500
Securities Registered Pursuant to Section 12(b) of the Act: |
| | | | | | | | | | | | | |
| Title of Each Class | | Trading Symbol(s) | | Name of Exchange on Which Registered |
Ordinary Shares, nominal value of €0.01 par valueper share | | CMPR | | NASDAQ Global Select Market |
Securities registered pursuant to Section 12(g) of the Act: None
Indicate by check mark if the registrant is a well-known seasoned issuer, as defined in Rule 405 of the Securities Act. Yes þ No o
Indicate by check mark if the registrant is not required to file reports pursuant to Section 13 or 15(d) of the Securities Exchange Act of 1934.Act. Yes o No þ
Indicate by check mark whether the registrant: (1) has filed all reports required to be filed by Section 13 or 15(d) of the Securities Exchange Act of 1934 during the preceding 12 months (or for such shorter period that the registrant was required to file such reports), and (2) has been subject to such filing requirements for the past 90 days. Yes þ No o
Indicate by check mark whether the registrant has submitted electronically and posted on its corporate Web site, if any, every Interactive Data File required to be submitted and posted pursuant to Rule 405 of Regulation S-T (§ 232.405 of this chapter) during the preceding 12 months (or for such shorter period that the registrant was required to submit and post such files). Yes þ No o
Indicate by check mark if disclosure of delinquent filers pursuant to Item 405 of Regulation S-K is not contained herein, and will not be contained, to the best of the registrant's knowledge, in definitive proxy or information statements incorporated by reference in Part III of this Form 10-K or any amendment to this Form 10-K. þ
Indicate by check mark whether the registrant is a large accelerated filer, an accelerated filer, a non-accelerated filer, smaller reporting company, or an emerging growth company. See definitions of "large accelerated filer," "accelerated filer," "smaller reporting company," and "emerging growth company" in Rule 12b-2 of the Exchange Act. |
| | | | | | | | | | | | | | | | |
Large accelerated filer | þ | | Accelerated filero | ☐ | Non-accelerated filero | ☐ |
| | Smaller reporting companyo | ☐ | (Do not check if a smaller reporting company) | |
| | Emerging growth companyo | ☐ | | |
If an emerging growth company, indicate by check mark if the registrant has elected not to use the extended transition period for complying with any new or revised financial accounting standards provided pursuant to Section 13(a) of the Exchange Act. o
Indicate by check mark whether the registrant has filed a report on and attestation to its management’s assessment of the effectiveness of its internal control over financial reporting under Section 404(b) of the Sarbanes-Oxley Act (15U.S.C. 7262(b)) by the registered public accounting firm that prepared or issued its audit report. þ
Indicate by check mark whether the registrant is a shell company (as defined in Exchange Act Rule 12b-2). Yes o☐ No þ
The aggregate market value of the ordinary shares held by non-affiliates of the registrant was approximately $3.21$1.87 billion on December 31, 20172020 (the last business day of the registrant's most recently completed second fiscal quarter) based on the last reported sale price of the registrant's ordinary shares on the NASDAQ Global Select Market.
As of August 6, 2018,3, 2021, there were 30,885,64225,054,075Cimpress N.V.plc ordinary shares par value €0.01 per share, outstanding.
DOCUMENTS INCORPORATED BY REFERENCE
The registrant intends to file a definitive proxy statement pursuant to Regulation 14A within 120 days of the end of the fiscal year ended June 30, 2018.2021. Portions of such proxy statement are incorporated by reference into Items 10, 11, 12, 13, and 14 of Part III of this Annual Report on Form 10-K.
CIMPRESS N.V.PLC
ANNUAL REPORT ON FORM 10-K
For the Fiscal Year Ended June 30, 20182021
TABLE OF CONTENTS
| | | | | | | | |
| | Page |
| Part I | | |
| Item 1. | Business | |
| Item 1A. | Risk Factors | |
| Item 1B. | Unresolved Staff Comments | |
| Item 2. | Properties | |
| Item 3. | Legal Proceedings | |
| Item 4. | Mine Safety Disclosure | |
| | |
| Part II | | Page |
| |
Item 1. | Business | |
Item 1A. | Risk Factors | |
Item 1B. | Unresolved Staff Comments | |
Item 2. | Properties | |
Item 3. | Legal Proceedings | |
Item 4. | Mine Safety Disclosure | |
| |
| |
| Item 5. | Market for Registrant's Common Equity, Related Stockholder Matters and Issued Purchases of Equity Securities | |
| Item 6. | Selected Financial Data | |
| Item 7. | Management's Discussion and Analysis of Financial Condition and Results of Operations | |
| Item 7A. | Quantitative and Qualitative Disclosures About Market Risk | |
| Item 8. | Financial Statements and Supplementary Data | |
| Item 9. | Changes in and Disagreements with Accountants and Financial Disclosures | |
| Item 9A. | Controls and Procedures | |
| Item 9B. | Other Information | |
| | |
| Part III | | |
| Item 10. | Directors, Executive Officers and Corporate Governance | |
| Item 11. | Executive Compensation | |
| Item 12. | Security Ownership of Certain Beneficial Owners and Management and Related Stockholder Matters | |
| Item 13. | Certain Relationships and Related Transactions, and Director Independence | |
| Item 14. | Principal Accountant Fees and Services | |
| | |
| Part IV | | |
| Item 15. | Exhibits and Financial Statement Schedules | |
SignaturesItem 16. | Summary | |
| Signatures | |
PART I
Item 1. Business
Overview & Strategy
Cimpress is a strategically-focusedstrategically focused group of more than a dozen businesses that specialize in mass customization, via which we deliver large volumes of individually small-sized customized orders for a broad spectrum of print, signage, photo merchandise, invitations and announcements, writing instruments, packaging, apparel and other categories. Mass customization is a core element of the business model of each Cimpress business. Stan Davis, in his 1987business and is a competitive strategy manifesto “Future Perfect” coined the term mass customizationwhich seeks to describe “generating an infinite variety of goods and services, uniquely tailored to customers”. In 2001, Tseng & Jiao defined mass customization as “producingproduce goods and services to meet individual customers’customer needs with near mass production efficiency”.efficiency. We discuss mass customization in more detail further below.
We have grown substantially over the past decade,our history, from $0.4$0.2 billion of revenue in fiscal year 2008 revenue2006 to $2.6 billion of revenue in fiscal year 2018 revenue,2021, and as we have grown we have achieved important benefits of scale. However, we also believe it is critical for us to “stay small as we get big”. By this we mean that we need to serve customers and act and compete with focus, nimbleness and speed that is typical of smaller, entrepreneurial firms but often not typical of larger firms. This is because we face intense competition across all our businesses, and we must constantly and rapidly improve the value we deliver to customers. To stay small as we get big, our strategy calls for us to pursue a deeply decentralized organizational structure which delegates responsibility, authority and resources to the CEOs and managing directors of our various businesses.
Specifically, our strategy is to invest in and build customer-focused, entrepreneurial mass customization businesses for the long term, which we manage in a decentralized, autonomous manner. We drive competitive advantage across Cimpress through a select few shared strategic capabilities that have the greatest potential to create Cimpress-wide value. We limit all other central activities to only those which absolutely must be performed centrally.
This decentralized structure is beneficial in many ways. We believe that, in comparison to a more centralized structure, decentralization enables our businesses to be more customer focused, to make better decisions faster, to manage a holistic cross-functional value chain required to serve customers well, to be more agile, to be held more accountable for driving investment returns, and to understand where we are successful and where we are not. In addition to these operational benefits, our decentralization has also enabled us to take significant complexity and cost out of our business in comparison to our previous centralized structure.
The select few shared strategic capabilities into which we invest include our (1) mass customization platform ("MCP"), (2) talent infrastructure in India, (3) central procurement of large-scale capital equipment, shipping services, and major categories of our raw materials and other categories of spend, and (4) peer-to-peer knowledge sharing betweenamong our businesses. We encourage each of our businesses to leverage these capabilities, but each business is free to choose whether or not to use these services. This optionality, we believe, creates healthy pressure on the central teams who provide such services to deliver compelling value to our businesses.
We limit all other central activities to only those which must be performed centrally. Out of more than12,000than14,000 employees we have fewer than80that who work in central activities that fall into this category, which includes tax, treasury, internal audit, general counsel, sustainability, corporate communications, consolidated reporting and compliance, information security, investor relations, capital allocation and the functions of our CEO and CFO. We seek to avoid bureaucratic behavior in the corporate center.center; however we have developed, through experience, guardrails and accountability mechanisms in key areas of governance including cultural aspects such as a focus on customers or being socially responsible, as well as operational aspects such as the processes by which we set strategy and financial budgets and review performance, or the policies by which we ensure compliance with information privacy laws.
This strategy has proven to be of great value to us during the COVID-19 crisis; we could not have reacted as proactively, effectively or quickly had we not put in place our strategy and organizational structure several years ago. Our decentralized model allowed our businesses to respond quickly to local restrictions, customer needs, and the health and safety of our team members, and leaders shared information and best practices across the group. Our shared strategic capabilities in procurement helped us to address supply chain risks and partner with our suppliers to delay our payments to them, the mass customization platform helped us to route orders between production facilities when needed due to temporary closures, and our central finance and legal teams secured the financial flexibility to navigate this period of uncertainty.
Our Uppermost Financial Objective
Our uppermost financial objective is to maximize our intrinsic value per share. We define intrinsic value per share as (a) the unlevered free cash flow per diluted share that, in our best judgment, will occur between now and the long-term future, appropriately discounted to reflect our cost of capital, minus (b) net debt per diluted share. We define unlevered free cash flow as free cash flow plus interest expense related to borrowings.
This financial objective is inherently long-term in nature. Thus an explicit outcome of this is that we accept fluctuations in our financial metrics as we make investments that we believe will deliver attractive long-term returns on investment.
We ask investors and potential investors in Cimpress to understand our uppermost financial objective by which we endeavor to make all financially evaluated decisions. We often make decisions in service of this priority that could be considered non-optimal were they to be evaluated based on other financial criteria such as (but not limited to) near- and mid-term revenue, operating income, net income, EPS, Adjusted Net Operating Profit (Adjusted NOP), Adjustedadjusted EBITDA, and cash flow.
Mass Customization
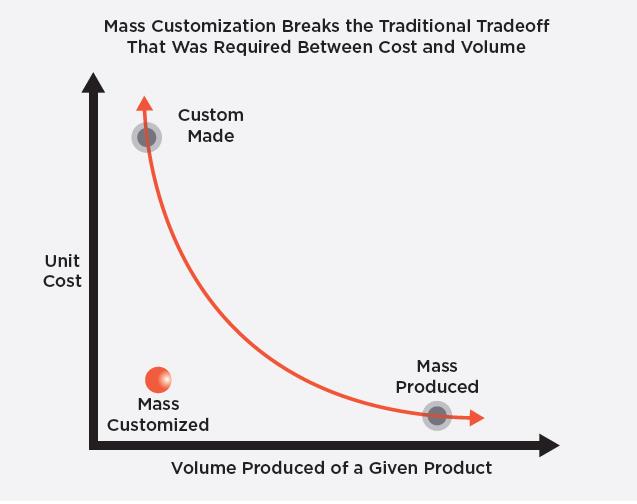
Mass customization is a business model that allows companies to deliver major improvements to customer value across a wide variety of customized product categories. Companies that master mass customization can automatically direct high volumes of orders into smaller streams of homogeneous orders that are then sent to specialized production lines. If done with structured data flows and the digitization of the configuration and manufacturing processes, setup costs become very small, and small volume orders become economically feasible.
|
| | | | | | | |
| | The chart illustrates this concept. The horizontal axis represents the volume of production of a given product; the vertical axis represents the cost of producing one unit of that product. Traditionally, the only way to manufacture at a low unit cost was to produce a large volume of that product: mass-produced products fall in the lower right handright-hand corner of the chart. Custom-made products (i.e., those produced in small volumes for a very specific purpose) historically incurred very high unit costs: they fall in the upper left-hand side of the chart.
Mass customization breaks this trade off, enabling low-volume, low-cost production of individually unique products. Very importantly, relative to traditional alternatives mass customization creates value in many ways, not just lower cost. Other advantages can include faster production, greater personal relevance, elimination of obsolete stock, better design, flexible shipping options, more product choice, and higher quality.
|
Mass customization delivers a breakthrough in customer value particularly well in markets in which the worth of a physical product is inherently tied to a specific, unique use or application. For instance, there is limited value to a sign that is the same as is used by many other companies: the business owner needs to describe what is unique about his or her business. Likewise, a photo mug is more personally relevant if it shows pictures of someone’s own friends and family. Before mass customization, producing a high qualityhigh-quality custom product required high per-order setup costs, so it simply was not economical to produce a customized product in low quantities.
We believe that the business cards sold by our Vistaprint business provide a concrete example of the potential of our mass customization business model to deliver significant customer value and to develop strong profit franchises in large markets that were previously low growth and commoditized. Millions of very small customers (for example, home-based businesses) rely on Vistaprint to design and procure aesthetically pleasing, high-quality, quickly-delivered and low-priced business cards. The Vistaprint production operations for a typical order of 250 standard business cards in Europe and North America require less than 14 seconds of labor for all of pre-press, printing, cutting and packaging, versus an hour or more for traditional printers. Combined with advantages of scale in graphic design support services, purchasing of materials, our self-service online ordering, pre-press automation, auto-scheduling and automated manufacturing processes, we allow customers to design,
configure, and procure business cards at a fraction of the cost of typical traditional printers with very consistent quality and delivery reliability. Customers have very extensive, easily configurable, customization options such as rounded corners, different shapes, specialty papers, “spot varnish”, reflective foil, folded cards, or different paper thicknesses. Achieving this type of product variety while also being very cost efficient took us almost two decades and requires massive volume, significant engineering investments and significant capital. Business cards is a mature market that, at the overall market level, has experienced continual declines over the past two decades. Yet, for Vistaprint, pre-pandemic, this remainsremained a growing category and iswas highly profitable, and thus provides an example of the power of mass customization. Even though we do not expect many other products to reach this extreme level of automation,
we do currently produce many other product categories (such as flyers, brochures, signage, mugs, calendars, pens, t-shirts, hats, embroidered soft goods, rubber stamps, photobooks, labels and holiday cards) via analogous methods whose volume and processes are well along the spectrum of mass customization relative to traditional suppliers and thus provide great customer value and a strong, profitable and growing revenue stream.
Market and Industry Background
Mass Customization Opportunity
Mass customization is not a market itself, but rather a competitive strategybusiness model that can be applied across manyglobal geographic markets, to customers from varying businesses (micro, small, medium and large), graphic designers, resellers, printers, teams, associations, groups, consumers and families, to which we offer products such as the following:
|
| | |
Product: | Geography: | Customer: |
- Small format printing | - North America | - Businesses (micro, small, medium, |
- Large format printing | - Europe | large) |
- Promotional products and gifts | - Australia/New Zealand | - Graphic designers, resellers, printers |
- Decorated apparel | - South America | - Traditional providers who choose to |
- Packaging | - Asia Pacific | outsource these products |
- Photo merchandise | | - Teams, associations and groups |
- Invitations and announcements | | - Consumers (home and family) |
Large traditional markets undergoing disruptive innovation
The products, geographies and customer applications listed above constitute a large market opportunity that is highly fragmented. We believe that the vast majority of the markets to which mass customization could apply are still served by traditional business models that force customers either to produce in large quantities per order or to pay a high price per unit.
We believe that these large and fragmented markets are moving away from small traditional suppliers that employ job shop business models to fulfill a relatively small number of customer orders and toward businesses such as those owned by Cimpress that aggregate a relatively large number of orders and fulfill them via a focused supply chain and production capabilities at relatively high volumes, thereby achieving the benefits of mass customization. We believe we are early in the process of what will be a multi-decade shift from job-shop business models to mass customization.
Cimpress’ current revenue represents a very small fraction of this market opportunity. We believe that Cimpress and competitors who have built their business around a mass customization model are “disruptive innovators” to these large markets because we enable small-volume production of personalized, high-quality products at an affordable price. Disruptive innovation, a term coined by Harvard Business School professor Clayton Christensen, describes a process by which a product or service takes root initially in simple applications at the
bottom of a market (such as free business cards for the most price sensitive of micro-businesses or low-quality white t-shirts) and then moves up market, eventually displacing established competitors (such as those in the markets mentioned above).
We believe that a large opportunity exists for major markets to shift to a mass customization paradigm and, even though we are largely decentralized, the select few shared strategic capabilities into which we centrally invest provide a significant scale-based competitive advantageadvantages for Cimpress.
We believe this opportunity to deliver substantially better customer value and to therefore disrupt very large traditional industries can translate into tremendous future opportunity for Cimpress. Until approximately our fiscal year 2012, we focused primarily on a narrow set of customers within the list above (highly price-sensitive and discount-driven micro businesses and consumers) with a very limited product offering. Through acquisitions and via significant investments in our Vistaprint business, we have expanded the breadth and depth of our product offerings, extended our ability to serve our traditional customers and gained a capability to serve a vast range of customer types.
As we continue to evolve and grow Cimpress, our understanding of these markets and their relative attractiveness is also evolving. Our expansion of product breadth and depth as well as new geographic markets has
significantly increased the size of our addressable market opportunity. We base our market size and attractiveness estimates upon considerable research and analysis; however, our estimates are only approximate. Despite the imprecise nature of our estimates, we believe that our understanding is directionally correct and that we operate in an enormous aggregate market with significant opportunity for Cimpress to grow shouldas we be successful incontinue delivering a differentiated and attractive value proposition to customers.
Today, we believe that the revenue opportunity for low-to-medium order quantities (i.e., still within our focus of small-sized individual orders) in the four product categories below is over $100 billion annually in North America and Europe combined and at least $150 billion annually if you include other geographies and consumer products:
•Small format marketing materials such as business cards, flyers, leaflets, inserts, brochures and magazines. Businesses of all sizes are the main end users of short-and-medium run lengths (per order quantities below 2,500 units for business cards and below 20,000 units for other materials).
•Large format products such as banners, signs, tradeshow displays, and point-of-sale displays. Businesses of all sizes are the main end users of short-and-medium run lengths (less than 1,000 units).
•Promotional products, apparel and gifts including decorated apparel, bags and textiles, and hard goods such as pens, USB sticks, and drinkware. The end users of short-and-medium runs of these products range from businesses to teams, associations and groups, as well as consumers.
•Packaging products, such as corrugated board packaging, folded cartons, bags and labels. Businesses are the primary end users for short-and-medium runs (below 10,000 units).
Cimpress’ recent acquisition of 99designs, which operates within our Vistaprint business, combined with organic investment in design services, has extended our total addressable market. Vistaprint researched the design spend in two of its largest markets, the U.S. and Germany, and found that small businesses spend approximately $6 billion annually on design services in these two markets, exclusive of the purchases of the print or digital products that the designs enhance. Even more importantly, this research found that small businesses in these markets that purchase design services represent the majority of the addressable market for print and digital marketing materials. We believe that a broader complement of design services should enable Vistaprint to retain customers longer as their needs evolve, as well as both attract new customers and serve existing customers with more complex products and therefore access more of our total addressable market.
Our Businesses
Cimpress businesses include those weour organically developed organically (Vistaprint, Vistaprint Corporate Solutions, Vistaprint India)business, plus previously independent businesses either that we have fully acquired or in which we have a majority equity stake. Prior to its acquisition, each of our acquired companies pursued business models that embodied the principles of mass customization. In other words, each provided a standardized set of products that could be configured and customized by customers, ordered in relatively low volumes, and produced via relatively standardized, homogeneous production processes, at prices lower than those charged by traditional producers.
Our businesses collectively operate across North America and Europe, as well as in India, Japan, Brazil, China and Australia. Their websites typically offer a broad assortment of tools and features allowing customers to create a product design or upload their own complete design and place an order, either on a completely self-service basis or with varying levels of assistance. Some of our businesses also use offline techniques to acquire customers (e.g., mail order, telesales). The combined product assortment across our businesses is extensive, including offerings in the following product categories: business cards, marketing materials such as flyers and postcards, digital and marketing services, writing instruments, signage, canvas-print wall décor, decorated apparel, promotional products and gifts, packaging, design services, textiles and magazines and catalogs. Also, we have responded to customer needs with new pandemic-related design templates for existing products as well as launching new products like face masks.
The majority of our revenue is driven by standardized processes and enabled by software. We endeavor to design these processes and technologies to readily scale as the number of orders received per day increases. In particular, the more individual jobs we receive in a given time period, the more efficiently we can sort and route jobs with homogeneous production processes to given nodes of our internal production systems or of our third-party supply chain. This sortation and subsequent process automation improves production efficiency. We believe that our strategy of systematizing our service and production systems enables us to deliver value to customers much more effectively than traditional competitors.
Our businesses operate production facilities throughout the geographies listed above, with over 3.3 million square feet of production space in Australia, Austria, Brazil, Canada, China, France, India, Ireland, Italy, Japan, Mexico, the Netherlands, the United Kingdomaggregate across our owned and the United States.operated facilities. We also work extensively with several hundred external fulfillers located across the globe. We believe that the improvements we have made and the future improvements we intend to make in software technologies that support the design, sortation, scheduling, production and delivery processes provide us with significant competitive advantage. In many cases our businesses can produce and ship an order the same day they receive it. Our supply chain systems and processes seek to drive reducedreduce inventory and working capital as well as fasterand improve delivery speeds to customers.customers relative to traditional suppliers. In certain of our company-owned manufacturing facilities, software schedules the near-simultaneous production of different customized products that have been ordered by the same customer, allowing us to produce and deliver multi-part orders quickly and efficiently.
We believe that the potential for scale-based advantages is not limited to focused, automated production lines. Other advantages include the ability to systematically and automatically sort through the voluminous “long tail” of diverse and uncommon orders in order to group them into more homogeneous categories, and to route them to production nodes that are specialized for that category of operations and/or which are geographically proximate to the customer. In such cases, even though the daily production volume of a given production node is small in comparison to our highest-volume production lines, the homogeneity and volume we are able to achieve is nonetheless significant relative to traditional suppliers of the long tail product in question; thus, our relative efficiency gains remain substantial. For this type of long-tail production, we rely heavily on third-party fulfillment partnerships, which allow us to offer a very diverse set of products. We acquired most of our capabilities in this area via our investments in Exaprint, Printdeal, Pixartprinting and WIRmachenDRUCK. For instance, the product assortment of each of these four businesses is measured in the tens of thousands, versus justVistaprint where product assortment is dramatically smaller on a few hundred at Vistaprint traditionally.relative basis. This deep and broad product offering is important to many customers.
Our businesses are currently organized into the following fourfive reportable segments:
1.Vistaprint:
|
| |
| Consists of the operations of our Vistaprint-branded websites in North America, Europe, Australia, New Zealand, India and New Zealand.Japan. This business also includes our WebsVistaprint Corporate Solutions business which is managed with the Vistaprint Digital business.serves medium-sized businesses and large corporations and our 99designs business which provides graphic design services. |
Our Vistaprint business helps more than 1715 million micro businesses (companies with fewer than 10 employees) create attractive, professional-quality marketing products at affordable prices and at low volumes. With Vistaprint, small businesses are able to create and customize their marketing with easy-to-use digital tools and design-templates, or by receiving expert graphic design support. In October 2020, Vistaprint acquired 99designs to expand its design offering via a worldwide community of more than
Consists150,000 talented designers to make it easy for designers and clients to work together to create designs they love. Vistaprint’s average order value is about $50, and customers spend about $100 per year; yet Vistaprint has historically had gross margins of our druck.at, Easyflyer, Exagroup, Pixartprinting, Printdeal, Tradeprint,about 60% and WIRmachenDRUCK businesses.advertising spend as a percent of revenue of about 15%. Vistaprint has had strong free cash flow conversion as its e-commerce model leads to collections from customers prior to the production and shipment of customer orders.
These CimpressUpload & Print:
Our Upload & Print businesses focusare organized in two sub-groups. We refer to these reportable segments as PrintBrothers and The Print Group, each of which focuses on serving graphic professionals: local printers, print resellers, graphic artists, advertising agencies and other customers with professional desktop publishing skill sets. Upload and print businesses have an average order value of about €100 and annual per customer revenue of over €600. Gross margins vary by business but average about 30% due to wholesale-like pricing and the wide variety of products produced both in owned facilities as well as via third-party fulfillers. Advertising spend as a percent of revenue is about 5%.
2.PrintBrothers: Consists of our druck.at, Printdeal, and WIRmachenDRUCK businesses. PrintBrothers businesses serve customers throughout Europe, and primarily in Austria, Belgium, Germany, the Netherlands, and Switzerland.
3.The Print Group: Consists of our Easyflyer, Exaprint, Pixartprinting, and Tradeprint businesses. The Print Group businesses serve customers throughout Europe, and primarily in France, Italy, Spain and the UK.
4.National Pen:
| | | | | |
| Consists of our National Pen business and a few smaller brands operated by National Pen that are focused on customized writing instruments and promotional products, apparel and gifts for small- and medium-sized businesses.
|
National Pen serves more than a million small businesses annually across more than 20 countries. Marketing methods are typically direct mail and telesales, as well as a small yet growing e-commerce site. National Pen operates several brands focused on customized writing instruments and promotional products, apparel and gifts for small- and medium-sized businesses. National Pen’s average order value is about $200 - $250, and annual revenue per customer is about $300. Gross margins have historically been about 55% with highly seasonal profits driven in the December quarter. Significant inventory and customer invoicing requirements in this business drive different working capital needs compared to our other businesses.
5.All Other Businesses:
Includes a collection of multiple small, rapidly evolving early-stage businesses by which Cimpress is expanding to new markets. These businesses have been combined into one reportable segment based on materiality,materiality: BuildASign, the fact that they arelargest of the these businesses with strong profitability and cash flow, and Printi and YSD, small early-stage businesses subject to high degrees of risk, and our expectation that each of their business models will rapidly evolve in function of future trials and entrepreneurial pivoting. Although not a comprehensive list, our All Other Businesses reportable segment includes the following:
operating at modest losses, by which Cimpress is expanding into new markets. |
| | | | |
| Vistaprint Corporate Solutions serves medium-sized businessesBuildASign is an e-commerce provider of canvas-print wall décor, business signage and large corporations, as well asother large-format printed products, based in Austin, Texas. In the fourth quarter of fiscal year 2021, we closed a legacy revenue stream with retail partners and franchise businesses.
small acquisition under BuildASign in a new product category. |
| As the online printing leader in Brazil, Printi offers a superior customer experience with transparent and attractive pricing, reliable service and quality. Printi is also expanding into the U.S. market.
|
India | Vistaprint India operates a derivative of the Vistaprint business model, albeit with higher service levels and quality, fully domestic-Indian content, pricing thatYSD is a slight premiumstartup operation that provides end-to-end mass customization solutions to many traditional offline alternatives,brands and almost no discounting.
|
Japan
| Vistaprint Japan operates a derivative of the Vistaprint business model with a differentiated position relativeintellectual property owners in China, supporting multiple channels including retail stores, websites, WeChat and e-commerce platforms to competitors who tend to focus on uploadenhance brand awareness and print, not the self-service, micro-business customer which Vistaprint Japan serves.
competitiveness, and develop new markets. |
Central Procurement
Given the scale of purchasing that happens across Cimpress’ businesses, there is significant value to coordinating our negotiations and purchasing to gain the benefit of scale. Our central procurement team negotiates and manages Cimpress-wide contracts for large-scale capital equipment, shipping services and major categories of raw materials (e.g., paper, plates, ink, etc.)ink). The Cimpress procurement team is also available on an as-requested basis to help with procurement improvements, tools and approaches across other aspects of our businesses’ purchases.
We are focused on achieving the lowest total cost in our strategic sourcing efforts by concentrating on quality, logistics, technology and cost, while also striving to use responsible sourcing practices within our supply chain. Our efforts include the procurement of high-quality materials and equipment that meet our strict specifications at a low total cost across a growing number of manufacturing locations, with an increasing focus on supplier compliance with our sustainable paper procurement policy as well as our Supplier Code of Conduct. Additionally, we work to develop and implement logistics, warehousing, and outbound shipping strategies to provide a balance of low-cost material availability while limiting our inventory exposure.
Technology
Our businesses typically rely on advanced proprietary technology to attract and retain our customers, to enable customers to create graphic designs and place orders on our websites, and to aggregate and produce multiple orders in standardized, scalable processes. Technology is core to our competitive advantage, as without it our businesses would not be able to produce custom orders in small quantities while achieving the economics that are more analogous to mass-produced items.
We are building and using our mass customization platform (“MCP”)MCP which is a cloud-based collection of software services, APIs, web applications and related technology offerings that can be leveraged independently or together by our businesses and third parties to perform common tasks that are important to mass customization. Cimpress businesses, and increasingly third-party fulfillers to our various businesses, can leverage different combinations of MCP services, depending on what capabilities they need to complement their business-specific technology. MCP is a multi-year investment that remains in its early stages, however many of our businesses are leveraging some of the technologies that have already been developed and/or shared by other businesses. The capabilities that are available in the mass customization platformMCP today include customer-facing technologies, such as those that enable customers to visualize their designs on various products, as well as manufacturing, supply chain, and logistics technologies that automate various stages of the production and delivery of a product to a customer. The benefits of the mass customization platformMCP include improved speed to market for new product introduction, reduction in fulfillment costs, and improvement of product delivery or geographic expansion.expansion, improved site experience, automating manual tasks and avoiding IT expense (through a reduction in expenses related to maintaining/licensing software). Over time, we believe we can generate significant customer and shareholder value from increased specialization of production facilities, aggregated scale from multiple businesses, increased product offerings and shared technology development costs.
We intend to continue developing and enhancing our MCP-based customer-facing and manufacturing, supply chain and logistics technologies and processes. We develop our MCP technology centrally typically at our offices in Switzerland, India, the Netherlands, the Czech Republic and the United States.
Wewe also have software and production engineering capabilities in each of our businesses. Our businesses are constantly seeking to strengthen our manufacturing and supply chain capabilities through engineering
improvements in areas like
automation, lean manufacturing, choice of equipment, product manufacturability, materials science, process control and color control.
Each of our businesses uses a mix of proprietary and third-party technology that supports the specific needs of that business. Their technology intensity ranges from significant to light, depending on their specific needs. Over the past few years, an increasing number of our businesses have begun to modernize and modularize their business-specific technology to enable them to launch more new products faster, provide a better customer experience, more easily connect to our mass customization platformMCP technologies, and to leverage third-party technologies where we do not need to bear the cost of developing and maintaining proprietary technologies. For example, our businesses are increasingly using third-party software for capabilities such as a shopping cart or customer reviews,content management, multivariate testing tools and data warehousing, which are areas that we can benefit from providing a more e-commerce standard experience,specialized best-in-class technologies are better than the proprietary technologies they have replaced. This allows our own engineering and better leverage engineering resourcesdevelopment talent to focus on artwork technologies, product information management and marketplace technologies from which we derive competitive advantage.
In our central Cimpress Technology team and in an increasing number of our decentralized businesses, we have adopted an agile, micro-services-based approach to technology development that enables multiple businesses or use cases to leverage this API technology regardless of where it was originally developed. We believe this development approach can help our businesses serve customers and scale operations more rapidly than could have been done as an individual business outside Cimpress.
Information Privacy and Security
Each Cimpress business is responsible for ensuring that customer, company and team member information is secure and handled in ways that are fully compliant with relevant laws and regulations. Because there are many aspects of this topic that apply to all of our businesses, Cimpress has a central security team that defines security policies, deploys security controls, and provides services and embeds security into the development processes of our businesses. This team works in partnership with each of our businesses and the corporate center to measure security maturity and risk, and provides managed security services in a way that allows each business to address their unique challenges, lower their cost, and become more efficient in using their resources.
Shared Talent Infrastructure
We make it easy, low cost, and efficient for Cimpress businesses to set up and grow teams in India via a central infrastructure that provides all the local recruiting, onboarding, day-to-day administration, HR, and facilities management to support these teams, whether for technology, graphic services, or other business functions. Most of our businesses have established teams in India leveraging this central capability, with those teams working directly for the respective Cimpress business. This is another example of scale advantage, albeit with talent, relative to both traditional suppliers and smaller online competitors that we can leverage across Cimpress.
Competition
We estimate that Cimpress has a total addressable market of over $100 billion in North America and Europe, where it is the market leader in the transformation from traditional highly fragmented off-line production to online/mass customized approaches that deliver higher quality, faster speed and lower cost. We believe that this market is at least $150 billion annually if you include other geographies and consumer products. Additionally, as described above, through the acquisition of 99designs and organic investment in Vistaprint, we have also expanded this total addressable market to now include the large market for design services. Though Cimpress is the largest business in our space, we still represent a small fraction of the overall market, and believe there is significant room for growth over the long-term future.
The markets for the products our businesses produce and sell are intensely competitive, highly fragmented and geographically dispersed, with many existing and potential competitors. We have very low market share relative to the total. Within this highly competitive context, our businesses compete on the basis of breadth and depth of product offerings; price; convenience; quality; technology; design content, tools, and assistance; customer service; ease of use; and production and delivery speed. It is our intention to offer a broad selection of high-quality products as well as related services at lowcompetitive price points and in doing so, offer our customers an attractive value proposition. Our current competition includes a combination of the following:
•traditional offline suppliers and graphic design providers;providers
•online printing and graphic design companies many of which provide products and services similar to ours;
•office superstores, drug store chains, food retailers, and other major retailers targeting small business and consumer markets;markets
•wholesale printers;printers
•self-service desktop design and publishing using personal computer software;software
•email marketing services companies;companies
•website design and hosting companies;companies
•suppliers of customized apparel, promotional products, gifts, and gifts;packaging
•online photo product companies;companies
•internet firms and retailers;retailers
•online providers of custom printing services that outsource production to third party printers; andprinters
•providers of other digital marketing such as social media and local search directories
Today’s market has evolved to be much tougher in terms of competition. This evolution, which has been going on for 20 years, has led to major benefits for customers in terms of lower prices, faster lead times, and easier customer experience. Cimpress and its businesses have proactively driven, and benefited from, this dynamic. The mass customization business model first took off with small format products like business cards, post cards and flyers, and consumer products like holiday cards. As the model has become better understood and more prevalent, and online advertising approaches more common, the competition has become more intense. We are seeing these types of small format products growing at rates slower than some other providers.
Asproduct categories, and we expand our geographic reach,continue to derive significant profits from these small format products. Conversely, there are other product and service portfolio and customer base, our competition increases. Our geographic expansion creates competition with companiesareas that have only more recently begun to benefit from mass customization, such as signage, promotional products, apparel and gifts, textiles and packaging. Here, we see higher rates of growth, but with a multi-national presencewider variety of profit outcomes as wellwe continue to scale our offering in these areas. There is also a geographic overlay to these trends. For example, in developing markets like India and Brazil where these products are more recently available in an online marketplace, we see stronger growth across all product areas, whereas the market in countries such as experienced local firmsGermany is far more mature and therefore more slow growing. Some of these trends were distorted over the last year because of the pandemic, which temporarily altered demand and behavior patterns.
We anticipate that the overall competitive landscape described above has already begun to change as a result of the pandemic, in the following ways:
•New business formation: Economic data shows that new business formation has increased meaningfully during the pandemic in our top markets: U.S., UK, France, and Germany. This often happens in a recession out of necessity: people who lose employment need to make ends meet and so start their own businesses. We have an excellent understandingopportunity to serve millions of customer needs specific to each country. Product offerings such as photo products, packaging, websites, email marketing, signage, apparel and promotional products have resulted in new competition as we entered those markets. We encounter competition from large retailers offering
a wide breadth of products and highly focused companies specializing in a subsetindividuals who take up self-employment or freelance roles because of our ability to serve the needs of those customers or product offerings. Given the state of maturity of the online mass customization market,– we believe thathave demonstrated this in aggregate, offline providers remain our biggest competition.past recessions and expect to be able to do so again.
Barriers to entry have been lowered in many of our markets, and new players have entered the mass customization space, enabled by asset-light models, software-driven print-fulfillment platforms, innovation in production technology, and/or benefits of an intense focus on a niche product or geographic market.•E-commerce acceleration: We believe that the long-term leaders in terms of transforming these markets viashift from traditional to mass customization will be the companies thatcustomized models has accelerated as shelter-at-home experiences are innovativemaking e-commerce and agile, but also bring significant scale-based advantages to drive value to customersservice-at-a-distance experiences like ours more mainstream. For example, McKinsey has estimated in the formU.S. that 10 years of e-commerce adoption was compressed into three months during the pandemic[1]. There are similar trends in other countries around the world, according to an OECD policy brief[2], among other sources.
•Accelerated shift from traditional production to mass customized sources: Conditions have been very difficult for small traditional suppliers and we believe some of these businesses are unlikely to last beyond the period of time that they are receiving government aid. We see this through industry news coverage[3] and research[4] and through some of our businesses that sell to these suppliers as bookings from those channels have been harder hit. One of the reasons for this is small traditional suppliers have a narrower
range of products than Cimpress so as demand for those products dropped significantly, even if temporary, there was less room to maneuver.
•Share gains versus online players: Additionally, we believe that some of the online competitors that offer a more limited product selection, quality and cost, as well as service.portfolio or lack scale advantages have had less flexibility to navigate changing customer demand levels. We saw online competitors[5] who report their revenue publicly down year over year 35% - 40% during the 6-month period from July 1, 2020 to December 31, 2020, while our own revenue declined just 10% in the same period.
[1] https://www.mckinsey.com/business-functions/marketing-and-sales/our-insights/survey-us-consumer-sentiment-during-the-coronavirus-crisis#
[2] http://www.oecd.org/coronavirus/policy-responses/e-commerce-in-the-time-of-covid-19-3a2b78e8/
[3] https://www.printweek.com/news/article/industry-bodies-warn-on-carnage-in-print
[4] https://store.whattheythink.com/downloads/printing-outlook-2021/
[5] We note that we have three known competitors with publicly reported revenue
Social and Environmental Responsibility
Above and beyond compliance with applicable laws and regulations, we expect all parts of Cimpress to conduct business in a socially responsible, ethical manner. Examples of these efforts are:
Environmental - •Environmental: We regularly evaluate ways to minimize the impact of our operations on the environment. In terms of combating CO2 pollution,climate change, we have established and centrally fund a company-wide carbon emissions reduction program to lower the emissions associated with our operations at a rate in line with - or better than - science-based targetsslightly exceeding the 1.5oC target pathway, and expect to achieve carbon neutrality by 2040. This commitment expands upon our previous 2°C target, established in alignment with the 2015 at the United Nations Global Change Conference (COP21 “Paris Climate Accord”), and now includes the emissions from our supply chain (Scope 3). Our plan includes investments in energy-reducing infrastructure and equipment, and renewable energy sourcing. In 2017 we reducedsourcing, and examination of our carbon intensity per million USD of revenue by 12%substrate and logistics choices for further opportunities to reduce total emissions. We are on track to meet this commitment, and we seek to make further improvements each year going forward for the foreseeable future.
forward.In terms of responsible forestry, weWe have converted the vast majority of the paper we print on in our Cimpress ownedCimpress-owned production facilities to FSC-certified paper (FSC® C143124, FSC® C125299), the leading certification of responsible forestry practices. This certification confirms that the paper we print on comes from responsibly managed forests that meet high environmental and social standards. Currently over 85% of the paper that we print on in our facilities is FSC-certified, and we seek to move that to 100% over time. We have also committed to influencing our third-party suppliers to materially expand their use of responsibly forested paper for the products that they customize on our behalf, as well as using either FSC-certified corrugate or packaging materials containing recycled content from post-consumer sources to help ensure our packaging does not contribute to deforestation.
We also have also recently committed to improve the profile of our plastic-based packaging and products in line with the targets set by the New Plastics Economy Global Commitment, co-sponsored by the United Nations Environment Programme. This includes a focus on reduced plastic usage, increased recyclability, and support of products that contain recycled materials.
•Fair labor practices -practices: We make recruiting, retention, and other performance management related decisions based solely on merit, and other organizational needs and considerations, such asbased on an individual’s ability to do their job with excellence and in alignment with the company’s strategic and operational objectives. We do not tolerate discrimination on any basis protected by human rights laws or anti-discrimination regulations, and we strive to do more in this regard than the law requires. We are committed to a work environment where team members are treated with respect and fairness.fairness, and have invested in education and awareness programs for team members to make further improvements in this area. We value individual differences, unique perspectives and the distinct contributions that each one of us can make to the company.
•Team member health and safety -safety: We do not tolerate unsaferequire safe working conditions that may endangerat all times to ensure our team members orand other parties.parties are protected, and require legal compliance at a minimum at all times. We require training on – and compliance with – safe work practices and procedures at all manufacturing facilities to ensure the safety of team members and visitors to our plant floors. Given the global impacts of the COVID-19 pandemic, we have held our team member health and safety as a top priority, and have implemented measures such as remote working for members who are able to and increased safety
measures at our manufacturing and customer service centers including additional cleaning and sanitary protocols.
•Ethical supply chain -chain: It is important to us that our supply chain reflects our commitment to doing business with the highest standards of ethics and integrity. Each Cimpress business seeksis responsible to ensure its supply chain does not allow for unacceptable practices such as environmental crimes, child labor, slavery or unsafe working conditions.
More information can be found at www.cimpress.com in our Corporate Social Responsibility section, including links to reports and documents such as our supplier code of conduct, compliance with the UK anti-slavery act and our supply chain transparency disclosure.
Intellectual Property
We seek to protect our proprietary rights through a combination of patents, copyrights, trade secrets, trademarks and contractual restrictions. We enter into confidentiality and proprietary rights agreements with our employees, consultants and business partners, and control access to, and distribution of, our proprietary information. We have registered, or applied for the registration of, a number of U.S. and international domain names, trademarks, and copyrights. Additionally, we have filed U.S. and international patent applications for certain of our proprietary technology.
Additional information regarding the risks associated with our intellectual property is contained in “Item 1A. Risk Factors” of this Form 10-K.
Business Segment and Geographic Information
For information about our reporting segments and geographic information about our revenues, segment profit and long-lived assets, see Item 8 of Part II, “Financial Statements and Supplementary Data — Note 16 — Segment Information” and Item 7 of Part II, “Management’s Discussion and Analysis of Financial Condition and Results of Operations.” The descriptions of our business, products, and markets in this section apply to all of our operating segments.
Seasonality
Our profitability has historically been highly seasonal. Our second fiscal quarter, ending December 31, includes the majority of the holiday shopping season and has becomeis our strongest quarter for sales of our consumer-oriented products, such as holiday cards, calendars, photo books,canvas prints, photobooks, and personalized gifts.
Operating income during the second fiscal quarter represented 46% and 86% of annual operating income in the years ended June 30, 2018 and 2016, respectively. During the year ended June 30, 2017, in a period we recognized a loss from operations, the second quarter was the only profitable quarter during the year. Our National Pen business, which we acquired on December 30, 2017, is highly seasonal and we expect their second quarter to include the majority of the profits generated in the fiscal year.
Employees
As of June 30, 2018,2021, we had approximately 10,80013,000 full-time and approximately 1,2001,000 temporary employees worldwide.
Corporate Information
Cimpress plc was incorporated on July 5, 2017 as a private company limited by shares under the laws of Ireland and on November 18, 2019 was re-registered as a public limited company under the laws of Ireland. On December 3, 2019, Cimpress N.V. (formerly named Vistaprint, the former publicly traded parent company of the Cimpress group of entities, merged with and into Cimpress plc, with Cimpress plc surviving the merger and becoming the publicly traded parent company of the Cimpress group of entities. Cimpress N.V.), the predecessor company to Cimpress plc, was incorporated under the laws of the Netherlands on June 5, 2009 and on August 30, 2009 became the publicly traded parent company of the Cimpress group of entities. We maintain our2009. The registered office of Cimpress plc is at Hudsonweg 8, 5928 LW Venlo, the Netherlands. OurBuilding D, Xerox Technology Park, Dundalk, Co. Louth, Ireland, and its telephone number inat the Netherlandsregistered office is +31-77-850-7700.+353-42-938-8500.
Available Information
We make available, free of charge through our United States website, the reports, proxy statements, amendments and other materials we file with or furnish to the SEC as soon as reasonably practicable after we electronically file or furnish such materials with or to the SEC. The address of our United States website is www.cimpress.com. We are not including the information contained on our website, or information that can be accessed by links contained on our website, as a part of, or incorporating it by reference into, this Annual Report on Form 10-K.
Item 1A. Risk Factors
Our future results may vary materially from those contained in forward-looking statements that we make in this Report and other filings with the SEC, press releases, communications with investors, and oral statements due to the following important factors, among others. Our forward-looking statements in this Report and in any other public statements we make may turn out to be wrong. These statements can be affected by, among other things, inaccurate assumptions we might make or by known or unknown risks and uncertainties or risks we currently deem immaterial. Consequently, no forward-looking statement can be guaranteed. We undertake no obligation to update any forward-looking statements, whether as a result of new information, future events, or otherwise, except as required by law.
Risks Related to Our Business
If our long-term growth strategy is not successful, our business and financial results could be harmed.
We may not achieve our long-term objectives, and our investments in our business may fail to impact our results and growth as anticipated. Some of the factors that could cause our business strategy to fail to achieve our objectives include the following, among others:
our failure to adequately execute our strategy or anticipate and overcome obstacles to achieving our strategic goals
our failure to develop our mass customization platform or the failure of the platform to drive the efficiencies and competitive advantage we expect
our failure to manage the growth, complexity, and pace of change of our business and expand our operations
our failure to acquire, at a value-accretive price or at all, businesses that enhance the growth and development of our business or to effectively integrate the businesses we do acquire into our business
our inability to purchase or develop technologies and other key assets and capabilities to increase our efficiency, enhance our competitive advantage, and scale our operations
our failure to realize the anticipated benefits of the decentralization of our operations
the failure of our current supply chain to provide the resources we need at the standards we require and our inability to develop new or enhanced supply chains
our failure to acquire new customers and enter new markets, retain our current customers, and sell more products to current and new customers
our failure to address inefficiencies and performance issues in some of our businesses and markets
our failure to sustain growth in relatively mature markets
our failure to promote, strengthen, and protect our brands
our failure to effectively manage competition and overlap within our brand portfolio
the failure of our current and new marketing channels to attract customers
our failure to realize expected returns on our capital allocation decisions
unanticipated changes in our business, current and anticipated markets, industry, or competitive landscape
our failure to attract and retain skilled talent needed to execute our strategy and sustain our growth
general economic conditions
If our strategy is not successful, then our revenue, earnings, cash flows and value may not grow as anticipated, be negatively impacted, or decline, our reputation and brands may be damaged, and the price of our shares may decline. In addition, we may change our strategy from time to time, which can cause fluctuations in our financial results and volatility in our share price.
Purchasers of customized products may not choose to shop online, which would limit our acquisition of new customers that are necessary to the success of our business.
We sell most of our products and services through the Internet. Because the online market for most of our products and services is not mature, our success depends in part on our ability to attract customers who have historically purchased products and services we offer through offline channels. Specific factors that could prevent prospective customers from purchasing from us online include the following:
concerns about buying customized products without face-to-face interaction with design or sales personnel
the inability to physically handle and examine product samples before making a purchase
delivery time associated with Internet orders
concerns about the security of online transactions and the privacy of personal information
delayed or lost shipments or shipments of incorrect or damaged products
a desire to support and buy from local businesses
limited access to the Internet
the inconvenience associated with returning or exchanging purchased items
In addition, our internal research shows that an increasing number of current and potential customers access our websites using smart phones or tablets and that our website visits using traditional computers may decline. Designing and purchasing custom designed products on a smart phone, tablet, or other mobile device is more difficult than doing so with a traditional computer due to limited screen sizes and bandwidth constraints. If our customers and potential customers have difficulty accessing and using our websites and technologies, then our revenue could decline.
We may not succeed in promoting and strengthening our brands, which could prevent us from acquiring new customers and increasing revenues.
A primary component of our business strategy is to promote and strengthen our brands to attract new and repeat customers, and we face significant competition from other companies in our markets who also seek to establish strong brands. To promote and strengthen our brands, we must incur substantial marketing expenses and establish a relationship of trust with our customers by providing a high-quality customer experience, which requires us to invest substantial amounts of our resources. Our ability to provide a high-quality customer experience is also dependent on external factors over which we may have little or no control, such as the reliability and performance of our suppliers, third-party fulfillers, third-party carriers, and communication infrastructure providers. If we are unable to promote our brands or provide customers with a high-quality customer experience, we may fail to attract new customers, maintain customer relationships, and sustain or increase our revenues.
We manage our business for long-term results, and our quarterly and annual financial results often fluctuate, which may lead to volatility in our share price.
Our revenuesrevenue and operating results often vary significantly from period to period due to a number of factors, and as a result comparing our financial results on a period-to-period basis may not be meaningful. We prioritize our uppermost financial objective of maximizing our intrinsic value per share even at the expense of shorter-term results and do not manage our business to maximize current period reported financial results, including our GAAPsuch as (but not limited to) near- and mid-term revenue, operating income, net income, EPS, adjusted EBITDA, and operating cash flow and other results we report.flow. Many of the factors that lead to period-to-period fluctuations are outside of our control; however, some factors are inherent in our business strategies. Some of the specific factors that could cause our operating results to fluctuate from quarter to quarter or year to year include among others:
•investments in our business in the current period intended to generate longer-term returns, where the costs in the near term will not be offset by revenue or cost savings until future periods, if at all;all
seasonality-driven or other •the effects of the COVID-19 pandemic on our customers, suppliers, business, and operations
•variations in the demand for our products and services, in particular during our second fiscal quarter;quarter, which may be driven by seasonality, performance issues in some of our businesses and markets, or other factors
•currency and interest rate fluctuations, which affect our revenues,revenue, costs, and fair value of our assets and liabilities;liabilities
•our hedging activity;activity
•our ability to attract and retain customers and generate purchases;purchases
•shifts in revenue mix toward less profitable products and brands;brands
•the commencement or termination of agreements with our strategic partners, suppliers, and others;others
•our ability to manage our production, fulfillment, and support operations;operations
•costs to produce and deliver our products and provide our services, including the effects of inflation;inflation and the rising costs of raw materials such as paper
•our pricing and marketing strategies and those of our competitors;competitors
•expenses and charges related to our compensation arrangements with our executives and employees;employees
•costs and charges resulting from litigation;litigation
significant increases in credits, beyond our estimated allowances, for customers who are not satisfied with our products;
•changes in our effective income tax rate;rate or tax-related benefits or costs
•costs to acquire businesses or integrate our acquired businesses;businesses
•financing costs;costs
•impairments of our tangible and intangible assets including goodwill; andgoodwill
•the results of our minority investments and joint ventures.ventures
Some of our expenses, such as office leases, depreciation related to previously acquired property and equipment, and personnel costs, are relatively fixed, and we may be unable to, or may not choose to, adjust operating expenses to offset any revenue shortfall. Accordingly, any shortfall in revenue may cause significant variation in operating results in any period. Our operating results may sometimes be below the expectations of public market analysts and investors, in which case the price of our ordinary shares may decline.
The COVID-19 pandemic has had, and may continue to have, a major adverse impact on our operations, financial results, customers, markets, and employees, and future pandemics or other large-scale events could have similar major adverse impacts.
The COVID-19 pandemic has negatively impacted our business in a number of material ways including material declines in demand for our products and services, leading to major adverse effects on our revenue, earnings, cash flows, and other financial results. Although we are seeing increased signs of recovery in many of our markets, we cannot predict what new variants of the COVID-19 virus may emerge, whether there will be additional waves of increased infection rates, how long the pandemic and its impacts on economic activity and our business, operations, and markets will continue, or whether the pandemic will lead to a prolonged economic downturn. Accordingly, it is possible that we could see see additional or continuing negative impacts on our business and financial results in the future. In addition, if another pandemic or other event occurs that limits commerce on a large scale, such as climate change or war, our business, operations, and financial results could be materially impacted.
We need to hire and retain talented personnel in key roles in order to be successful, and we face intense competition for talent.
If we are unable to recruit, retain, and motivate our employees in senior management and key roles such as technology, marketing, data science, and production, then we may not be able to execute on our strategy and grow our business as planned. Our current management and employees may cease their employment with us at any time with minimal advance notice, and we are seeing increased competition for talent that is making it more difficult for us to retain the employees we have and to recruit new employees
If we are not successful in transforming the Vistaprint business, then we could lose market share and our financial results could be adversely impacted.
The Vistaprint business is undertaking a multi-year transformation, and we are investing heavily to rebuild Vistaprint's technology infrastructure, improve our customer experience, and recruit new talent. If our investments do not have the effects we expect, the new technology infrastructure does not perform well or is not as transformational as we expect, or the transformation is otherwise unsuccessful, then we could fail to attract new and repeat customers, Vistaprint's reputation and brand could be damaged, and our revenue and earnings could fail to grow or could decline.
We may not be successfulsucceed in developingpromoting, strengthening, and evolving our mass customization platform or in realizing the anticipated benefits of the platform.brands, which could prevent us from acquiring new customers and increasing revenues.
A keyprimary component of our business strategy is the development of a mass customization platform. The process of developingto promote and strengthen our brands to attract new technology is complex, costly, and uncertain,repeat customers, and the development effort could be disruptive to our business and existing systems. We must make long-term investments, develop or obtain appropriate intellectual property, and commitwe face significant resources before knowing whether our mass customization platform will be successful and make us more effective and competitive. As a result, there can be no assurance that we will successfully complete the development of the platform, that our diverse businesses will realize valuecompetition from the platform, or that we will realize expected returns on the capital expended to develop the platform.
In addition, we are aware that other companies are developing platforms that could competein our markets who also seek to establish strong brands. To promote and strengthen our brands, we must incur substantial marketing expenses and establish a relationship of trust with ours. Ifour customers by providing a competitor werehigh-quality customer experience, which requires us to develop and reach scale with a platform before we do,invest substantial amounts of our competitive position could be harmed.resources.
Our global operations, decentralized organizational structure, and expansion place a significant strain on our management, employees, facilities, and other resources and subject us to additional risks.
We are a global company with production facilities, offices, and localized websites in many countries across six continents, and we have decentralizedmanage our organizational structure and operations. We expect to establish operations, acquire or invest in businesses and sell our products and servicesoperations in additional geographic regions, including emerging markets, where we may have limited or no experience. We may not be successful in all regions and markets in which we invest or where we establish operations, which may be costly to us.a decentralized, autonomous manner. We are subject to a number of risks and challenges that relate to our global operations, decentralization, expansion, and expansion,complexity including, among others:
•difficulty managing operations in, and communications among, multiple businesses, locations, and time zones;zones
•challenges of ensuring speed, nimbleness, and entrepreneurialism in a large and complex organization
•difficulty complying with multiple tax laws, treaties, and regulations and limiting our exposure to onerous or unanticipated taxes, duties, tariffs, and other costs;costs
•our failure to improve and adapt our financial and operational controls and systems to manage our decentralized businessbusinesses and comply with our legal obligations;obligations as a public company
•the challenge of complying with disparate laws in multiple countries, such as local regulations that may impair our ability to conduct our business as planned, protectionist laws that favor local businesses, and restrictions imposed by local labor laws;laws
•the challenge of maintaining management's focus on our inexperience in marketingstrategic and selling our productsoperational priorities and services within unfamiliar countries and cultures;minimizing lower priority distractions
challenges of working with local business partners;
our failure to properly understand and develop graphic design content and product formats and attributes appropriate for local tastes;
•disruptions caused by political and social instability that may occur in some countries;countries
•exposure to corrupt business practices such as bribery or the willful infringement of intellectual property rights, that may be common in some countries or in some sales channels and markets;markets, such as bribery or the willful infringement of intellectual property rights
•difficulty repatriating cash from some countries;countries
•difficulty importing and exporting our products across country borders and difficulty complying with customs regulations in the many countries where we sell products;products
•disruptions or cessation of important components of our international supply chain; andchain
•failure of local laws to provide a sufficient degree of protection against infringement of our intellectual property.property
There is considerable uncertainty about the economic and regulatory effects of the United Kingdom's exit from the European Union (commonly referred to as "Brexit"). The UK is one of our largest markets in Europe, but we currently ship products to UK customers primarily from continental Europe. If Brexit results in greater restrictions on imports and exports between the UK and the EU or increased regulatory complexity, then our operations and financial results could be negatively impacted.
In addition, we are exposed to fluctuations in currency exchange rates that may impact items such as the translation of our revenuesrevenue and expenses, remeasurement of our intercompany balances, and the value of our cash and cash equivalents and other assets and liabilities denominated in currencies other than the U.S. dollar, our reporting currency. The hedging activities we engage in may not mitigate the net impact of currency exchange rate fluctuations, and our financial results may differ materially from expectations as a result of such fluctuations.
Failure to protect our information systems and the confidential information of our customers, employees, and business partners against security breaches or thefts could damage our reputation and brands, subject us to litigation and enforcement actions, and substantially harm our business and results of operations.
Our business involves the receipt, storage, and transmission of customers' personal and payment information, as well as confidential information about our business, employees, suppliers, and business partners, some of which is entrusted to third-party service providers, partners, and vendors. Our information systems and those of third parties with which we share information are vulnerable to an increasing threat of cyber security risks, including physical and electronic break-ins, computer viruses, ransomware attacks, and phishing and other social engineering scams, among other risks.risks, and these vulnerabilities may be heightened with many of our employees working remotely. As security threats evolve and become more sophisticated and more difficult to detect and defend against, a hacker or thief may defeat our security measures, or those of our third-party service provider, partner, or vendor, and obtain confidential or personal information. We or the third party may not discover the security breach and theft of information for a significant period of time after the breach occurs. We may need to
expend significant resources to protect against security breaches and thefts of data or to address problems caused by breaches or thefts, and we may not be able to anticipate cyber attacks or implement adequate preventative measures. Any compromise or breach of our information systems or the information systems of third parties with which we share information could, among other things:
•damage our reputation and brands;brands
•expose us to losses, remediation costs, litigation, enforcement actions, and possible liability;liability
•result in a failure to comply with legal and industry privacy regulations and standards;standards
•lead to the misuse of our and our customers' and employees' confidential or personal information;information
•cause interruptions in our operations; andoperations
•cause us to lose revenue if existing and potential customers believe that their personal and payment information may not be safe with us.us
We are subject to the laws of many states, countries, and regions and industry guidelines and principles governing the collection, use, retention, disclosure, sharing, and security of data that we receive from and about our customers and employees. Any failure or perceived failure by us to comply with any of these laws, guidelines, or principles could result in actions against us by governmental entities or others, a loss of customer confidence, and damage to our brands, any of which could have an adverse effect on our business.brands. In addition, the regulatory landscape is constantly changing, as various regulatory bodies throughout the world enact new laws concerning privacy, data retention, data transfer and data protection. For example, the recent General Data Protection Regulation in Europe includes operational and compliance requirements that are different than those previously in place and also includes significant penalties for non-compliance. Complying with these varying and changing requirements could cause us to incur substantial costs or require us to change our business practices in a manner adverse to our business and operating results.
Acquisitions and strategic investments may be disruptive to our business.business, may fail to achieve our goals, and can negatively impact our financial results.
An important way in which we pursue our strategy is to selectively acquire businesses, technologies, and services and make minority investments in businesses and joint ventures. The time and expense associated with finding suitable businesses, technologies, or services to acquire or invest in can be disruptive to our ongoing business and divert our management's attention. In addition, we have needed in the past, and may need in the future, to seek financing for acquisitions and investments, which may not be available on terms that are favorable to us, or at all, and can cause dilution to our shareholders, cause us to incur additional debt, or subject us to covenants restricting the activities we may undertake.
Our acquisitions and strategic investments may fail to achieve our goals.
An acquisition, minority investment, or joint venture may fail to achieve our goals and expectations forand may have a negative impact on our business and financial results in a number of reasonsways including the following:
•The business we acquired or invested in may not perform or fit with our strategy as well as we expected.
We•Acquisitions and minority investments can be costly and can result in increased expenses including impairments of goodwill and intangible asserts if financial goals are not achieved, assumptions of contingent or unanticipated liabilities, amortization of certain acquired assets, and increased tax costs, In addition. we may overpay for acquired businesses, which can, among other things, negatively affect our intrinsic value per share.businesses.
We may fail to integrate acquired businesses, technologies, services, or internal systems effectively, or the integration may be more expensive or take more time than we anticipated.
•The management of our acquired businesses, minority investments, and joint ventures may be more expensive or may take more resources than we expected. In addition, continuing to devote resources to a struggling business can take resources away from other investment areas and priorities.
We may not realize the anticipated benefits of integrating acquired businesses into our mass customization platform.
We may encounter cultural or language challenges in integrating an acquired business or managing our minority investment in a business.
•We may not be able to retain customers and key employees of the acquired businesses, and we and the businesses we acquire or invest in may not be able to cross sell products and services to each other's customers.
We generally assume the liabilities of businesses we acquire, which could include liability for an acquired business' violation of law that occurred before we acquired it.businesses. In addition, we have historically acquired smaller, privately held companies that may not have as strong a culture of legal compliance or as robust financial controls as a larger, publicly traded company like Cimpress, and if we fail to implement adequate training, controls, and monitoring of the acquired companies, we could also be liable for post-acquisition legal violations.
Our acquisitions and minority investments can negatively impact our financial results.
Acquisitions and minority investmentsparticular, it can be costly, and some of our acquisitions and investments may be dilutive, leadingchallenging to reduced earnings. Acquisitions and investments can result in increased expenses including impairments of goodwill and intangible assets if financial goals are not achieved, assumptions of contingent or unanticipated liabilities, amortization of acquired intangible assets, and increased tax costs.motivate the founders who built a business to continue to lead the business after they sell it to us.
In addition, theThe accounting for our acquisitions and minority investments requires us to make significant estimates, judgments, and assumptions that can change from period to period, based in part on factors outside of our control, which can create volatility in our financial results. For example, we often pay a portion of the purchase price for our acquisitions in the form of an earn out based on performance targets for the acquired companies or enter into obligations or options to purchase non-controllingnoncontrolling interests in our acquired companies or minority investments, which can be difficult to forecast. If in the future our assumptions change and we determine that higher levels of achievement are likely under our earn outs or future purchase obligations, we will need to pay and record additional amounts to reflect the increased purchase price. These additional amounts could be significant and could adversely impact our results of operations.
Furthermore, earn-out provisions for future payments to sellers based on the performance or valuation of the acquired businesses, such as earn outs and options to purchase noncontrolling interests, can lead to disputes with the sellers about the achievement of the earn-out performance targets earn-out performance targets can sometimesor valuation or create inadvertent incentives for the acquired company's management to take short-term actions designed to maximize the earn outpayments they receive instead of benefiting the business, andbusiness. In addition, strong performance of the underlying business could result in material payments pursuant to earn-out provisions or future purchase obligations that may or may not reflect the fair market value of the asset at that time.
If we are unable to attract new and repeat customers in a cost-effective manner, our business and results of operations could be harmed.
Our success dependsvarious businesses rely on our abilitya variety of marketing methods to attract new and repeat customers in a cost-effective manner. We rely on a variety of methods to do this including drawing visitors to our websites, promoting our products and services through search engines such as Google Bing, and Yahoo!,Bing, email, direct mail, advertising banners and other online links, broadcast media telesales and word-of-mouth customer referrals.streaming platforms, social media platforms, and telesales. If the search engines on which we relyor social media platforms modify their algorithms or terminate their relationships with us, or increase the prices at which we may purchase listings, our costs could increase, and fewer customers may click through to our websites. If links to our websites are not displayed prominently in online search results, if fewer customers click through to our websites, if our direct mail marketing campaigns are not effective, or if the costs of attracting customers using any of our current methods significantly increase, then our ability to efficiently attract new and repeat customers would be reduced, our revenue and net income could decline, and our business and results of operations would be harmed.
Developing and deploying our mass customization platform is costly and resource-intensive, and we may not realize all of the anticipated benefits of the platform.
A key component of our strategy is the development and deployment of a mass customization platform, which is a cloud-based collection of software services, APIs, web applications and related technology offerings that can be leveraged independently or together by our businesses and third parties to perform common tasks that are important to mass customization. The process of developing new technology is complex, costly, and uncertain and requires us to commit significant resources before knowing whether our businesses will adopt components of our mass customization platform or whether the platform will make us more effective and competitive. As a result, there can be no assurance that we will find new capabilities to add to the growing set of technologies that make up our platform, that our diverse businesses will realize value from the platform, or that we will realize expected returns on the capital expended to develop the platform.
Seasonal fluctuations in our business place a strain on our operations and resources.
Our profitability has historically been highly seasonal. Our second fiscal quarter includes the majority of the holiday shopping season and accounts for a disproportionately high portion of our earnings for the year, primarily due to higher sales of home and family products such as holiday cards, calendars, photo books, and personalized gifts. In addition, theour National Pen business we acquired in December 2016 has historically generated nearly all of its profits during the December quarter. Our operating income during the second fiscal quarter represented 46% and 86% of annual operating income in the years ended June 30, 2018 and 2016, respectively, and during the year
ended June 30, 2017, in a period we recognized a loss from operations, the second quarter was the only profitable quarter. In anticipation of increased sales activity during our second fiscal quarter holiday season, we typically incur significant additional capacity related expenses each year to meet our seasonal needs, including facility expansions, equipment purchases and leases, and increases in the number of temporary and permanent employees. Lower than expected sales during the second quarter would likely have a disproportionately large impact on our operating results and financial condition for the full fiscal year. In addition, if our manufacturing and other operations are unable to keep up with the high volume of orders during our second fiscal quarter or we experience inefficiencies in our production, then our costs may be significantly higher, and we and our customers can experience delays in order fulfillment and delivery and other disruptions. If we are unable to accurately forecast and respond to seasonality in our business, our business and results of operations may be materially harmed.
Our hedging activity could negatively impact our results of operations, cash flows, or leverage.
We have entered into derivatives to manage our exposure to interest rate and currency movements. If we do not accurately forecast our results of operations, execute contracts that do not effectively mitigate our economic exposure to interest rates and currency rates, elect to not apply hedge accounting, or fail to comply with the complex accounting requirements for hedging, our results of operations and cash flows could be volatile, as well as negatively impacted. Also, our hedging objectives may be targeted at improving our non-GAAP financial metrics, which could result in increased volatility in our GAAP results. Since some of our hedging activity addresses long-term exposures, such as our net investment in our subsidiaries, the gains or losses on those hedges could be recognized before the offsetting exposure materializes to offset them. This could result in our having to borrow to settle a loss on a derivative without an offsetting cash inflow,them, potentially causing volatility in our cash or debt balances and therefore our leverage.
Our businesses face risks related to interruption of our operations and lack of redundancy.
Our businesses' production facilities, websites, infrastructure, supply chain, customer service centers, and operations may be vulnerable to interruptions, and our businesseswe do not have redundancies or alternatives in all cases to carry on these operations in the event of an interruption. In addition, because our businesses are dependent in part on third parties for the implementation and maintenance of certain aspects of theirour communications and production systems, theywe may not be able to remedy interruptions to these systems in a timely manner or at all due to factors outside of theirour control. Some of the events that could cause interruptions in our businesses' operations or systems are the following, among others:
•fire, natural disasters, or extreme weather, which could be exacerbated by climate change
•pandemic or other public health crisis
•labor strike, work stoppage, or other issues with our workforce
•political instability or acts of terrorism or war
•power loss or telecommunication failure
•attacks on our external websites or internal network by hackers or other malicious parties
undetected errors or design faults in our technology, infrastructure, and processes that may cause our websites to fail
•inadequate capacity in our systems and infrastructure to cope with periods of high volume and demand
human error, including poor managerial judgment or oversight
Any interruptions to our businesses' systems or operations could result in lost revenue, increased costs, negative publicity, damage to our businesses' reputationreputations and brands, and an adverse effect on our business and results of operations. Building redundancies into our businesses' infrastructure, systems, and supply chain to mitigate these risks may require us to commit substantial financial, operational, and technical resources, in some cases before the volume of their business increases with no assurance that their revenues will increase.resources.
We face intense competition, and we expect our competition tomay continue to increase.
The markets for our products and services are intensely competitive, highly fragmented, and geographically dispersed. The competitive landscape for e-commerce companies and the mass customization market continues to change as new e-commerce businesses are introduced, established e-commerce businesses enter the mass customization market, and traditional “bricks“brick and mortar” businesses establish an online presence. Competition may result in price pressure, increased advertising expense, reduced profit margins, and loss of market share and brand recognition, any of which could substantially harm our business and financial results. Current and potential competitors include the following (in no particular order):
traditional offline suppliers and graphic design providers
online printing and graphic design companies
office superstores, drug store chains, food retailers, and other major retailers targeting small business and consumer markets
wholesale printers
self-service desktop design and publishing using personal computer software
email marketing services companies
website design and hosting companies
suppliers of customized apparel, promotional products, gifts, and packaging
online photo product companies
Internet retailers
online providers of custom printing services that outsource production to third party printers
providers of digital marketing such as social media and local search directories
ManySome of our current and potential competitors have advantages over us, including longer operating histories, greater brand recognition or loyalty, more focus on a given subset of our business, or significantly greater financial, marketing, and other resources. Many of our competitors currently work together, and additional competitors may do so in the future through strategic business agreementsresources, or acquisitions. In addition, we have in the past and may in the future choosewillingness to collaborate with some of our existing and potential competitors in strategic partnerships that we believe will improve our competitive position and financial results. It is possible, however, that such ventures will be unsuccessful and that our competitive position and financial results will be adversely affected asoperate at a result of such collaboration.loss while building market share.
Failure to meet our customers' price expectations would adversely affect our business and results of operations.
Demand for our products and services is sensitive to price for almost all of our businesses, and changes in our pricing strategies, including shipping pricing, have had a significant impact on the numbers of customers and orders in some regions, which in turn affects our revenues,revenue, profitability, and results of operations. Many factors can significantly impact our pricing and marketing strategies, including the costs of running our business, the costs of raw materials, our competitors' pricing and marketing strategies, and the effects of inflation. If we fail to meet our customers' price expectations, our business and results of operations may suffer.
We are subject to safety, health, and environmental laws and regulations, which could result in liabilities, cost increases, or restrictions on our operations.
We are subject to a variety of safety, health and environmental, or SHE, laws and regulations in each of the jurisdictions in which we operate. These laws and regulations govern, among other things, air emissions, wastewater discharges, the storage, handling and disposal of hazardous and other regulated substances and
wastes, soil and groundwater contamination and employee health and safety. We use regulated substances such as inks and solvents, and generate air emissions and other discharges at our manufacturing facilities, and some of our facilities are required to hold environmental permits. If we fail to comply with existing SHE requirements, or new, more stringent SHE requirements applicable to us are imposed, we may be subject to monetary fines, civil or criminal sanctions, third-party claims, or the limitation or suspension of our operations. In addition, if we are found to be responsible for hazardous substances at any location (including, for example, offsite waste disposal facilities or facilities at which we formerly operated), we may be responsible for the cost of cleaning up contamination, regardless of fault, as well as for claims for harm to health or property or for natural resource damages arising out of contamination or exposure to hazardous substances.
In some cases we pursue self-imposed socially responsible policies that are more stringent than is typically required by laws and regulations, for instance in the areas of worker safety, team member social benefits and
environmental protection such as carbon reduction initiatives. The costs of this added SHE effort are often substantial and could grow over time.
The lossfailure of key personnel or an inabilityour business partners to attractuse legal and retain additional personnelethical business practices could affect our ability to successfully grownegatively impact our business.
We are highly dependent uponcontract with multiple suppliers, fulfillers, merchants, and other business partners in many jurisdictions worldwide. We require our business partners to operate in compliance with all applicable laws, including those regarding corruption, working conditions, employment practices, safety and health, and environmental compliance, but we cannot control their business practices. We may not be able to adequately vet, monitor, and audit our many business partners (or their suppliers) throughout the continued serviceworld, and performanceour decentralized structure heightens this risk, as not all of our senior management and key technical, marketing, and production personnel,businesses have equal resources to manage their business partners. If any of whom may cease their employmentthem violates labor, environmental, or other laws or implements business practices that are regarded as unethical or inconsistent with us at any time with minimal advance notice. We face intense competition for qualified individuals from many other companies in diverse industries. The loss of one or more of our key employees may significantly delay or prevent the achievement ofvalues, our business objectives,reputation could be severely damaged, and our failure to attractsupply chain and retain suitably qualified individuals or to adequately plan for successionorder fulfillment process could have an adverse effect onbe interrupted, which could harm our ability to implement our business plan.sales and results of operations.
Our credit facility and the indentureindentures that governsgovern our senior notes restrict our current and future operations, particularly our ability to respond to changes or to take certain actions.
Our senior secured credit facility which we refer to asthat governs our Term Loan B and revolving credit facility, and the indenture that governs our 7.0% senior unsecured notes due 2026, which we collectively refer to as our senior notes,debt documents, contain a number of restrictive covenants that impose significant operating and financial restrictions on us and may limit our ability to engage in acts that may be in our best interest, including restrictions on our ability to:
incur additional indebtedness, guarantee indebtedness, and incur liens;
pay dividends or make other distributions or repurchase or redeem capital stock;
prepay, redeem, or repurchase certain subordinated debt;
issue certain preferred stock or similar redeemable equity securities;
make loans and investments;
sell assets;
enter into transactions with affiliates;
alter the businesses we conduct;
enter into agreements restricting our subsidiaries’ ability to pay dividends; and
consolidate, merge, or sell all or substantially all of our assets.
As a result of these restrictions, we may be limited in how we conduct our business, grow in accordance with our strategy, compete effectively, or take advantage of new business opportunities. In addition,opportunities, including restrictions on our ability to:
•incur additional indebtedness, guarantee indebtedness, and incur liens
•pay dividends or make other distributions or repurchase or redeem capital stock
•prepay, redeem, or repurchase certain subordinated debt
•issue certain preferred stock or similar redeemable equity securities
•make loans and investments
•sell assets
•enter into transactions with affiliates
•alter the restrictive covenants in the credit facility require us to maintain specified financial ratios and satisfy other financial condition tests. Ourbusinesses we conduct
•enter into agreements restricting our subsidiaries’ ability to meet those financial ratios and tests can be affected by events beyondpay dividends
•consolidate, merge, or sell all or substantially all of our control, and we may be unable to meet them.assets
A default under any of our indenture or credit facilitydebt documents would have a material, adverse effect on our business.
Our failure to make scheduled payments on our debt or our breach of the covenants or restrictions under the indenture that governsany of our senior notes or under our credit facilitydebt documents could result in an event of default under the applicable indebtedness. Such a default would have a material, adverse effect on our business and financial condition, including the following, among others:
•Our lenders could declare all outstanding principal and interest to be due and payable, and we and our subsidiaries may not have sufficient assets to repay that indebtedness.
•Our secured lenders could foreclose against the assets securing their borrowings.
•Our lenders under theour revolving credit facility could terminate all commitments to extend further credit under that facility.
•We could be forced into bankruptcy or liquidation.
Our material indebtedness and interest expense could adversely affect our financial condition.
As of June 30, 2018,2021, our total debt was $839.4 million, made up of $400.0 million of senior notes,$432.4 million of loan obligations under our credit facility and $7.0 million of other debt. We had unused commitments of $689.7 million under our credit facility (after giving effect to letter of credit obligations).$1,764.9 million.
Subject to the limits contained in the credit facility, the indenture that governs our senior notes, and our other debt instruments,documents, we may be able to incur substantial additional debt from time to time, to finance working capital, capital expenditures, investments or acquisitions, or for other purposes. Ifand if we do so, the risks related to our level of debt could intensify. Specifically, our level of debt could have important consequences, including the following:
•making it more difficult for us to satisfy our obligations with respect to our debt;debt
•limiting our ability to obtain additional financing to fund future working capital, capital expenditures, acquisitions, or other general corporate requirements;requirements
•requiring a substantial portion of our cash flows to be dedicated to debt service payments instead of other purposes, thereby reducing the amount of cash flows available for working capital, capital expenditures, acquisitions, and other general corporate purposes;purposes
•increasing our vulnerability to general adverse economic and industry conditions;conditions
•exposing us to the risk of increased interest rates as some of our borrowings, including borrowings under our credit facility, are at variable rates of interest;interest
limiting our flexibility in planning for and reacting to changes in the industry and marketplaces in which we compete;
•placing us at a disadvantage compared to other, less leveraged competitors; andcompetitors
•increasing our cost of borrowing.borrowing
We may not be able to generate sufficient cash to service all of our indebtedness and may be forced to take other actions to satisfy our obligations under our indebtedness, which may not be successful.
Our ability to make scheduled payments on or refinance our debt obligations depends on our financial condition and operating performance, which are subject to economic and competitive conditions and to various financial, business, legislative, regulatory, and other factors beyond our control. We may be unable to maintain a level of cash flows from operating activities sufficient to permit us to pay the principal, premium, if any, and interest
on our indebtedness. If our cash flows and capital resources are insufficient to fund our debt service obligations, we could face substantial liquidity problems and could be forced to reduce or delay investments and capital expenditures or to dispose of material assets or operations, seek additional debt or equity capital, or restructure or refinance our indebtedness. We may not be able to effect any such alternative measures, if necessary, on commercially reasonable terms or at all.
Ifall, and if we cannot make scheduled payments on our debt, we will be in default. Our inability to generate sufficient cash flows to satisfy our debt obligations, or to refinance our indebtedness on commercially reasonable terms or at all, would materially and adversely affect our financial position and results of operations.
Our variable rate indebtedness subjects us to interest rate risk, which could cause our debt service obligations to increase significantly.
Borrowings under our credit facility are at variable rates of interest and expose us to interest rate risk, and any interest rate swaps we enter into in order to reduce interest rate volatility may not fully mitigate our interest rate risk. If interest rates were to increase, our debt service obligations on the variable rate indebtedness would increase even if the amount borrowed remained the same, and our net income and cash flows, including cash available for servicing our indebtedness, will correspondingly decrease. As of June 30, 2018,2021, a hypothetical 100 basis point increase in rates, inclusive of our outstanding interest rate swaps, would result in an increase of interest expense of approximately $2.4$4 millionover the next 12 months.
Border controls and duties and restrictions on cross-border commerce may negatively impact our business.
Many governments impose restrictions on shipping goods into their countries, as well as protectionist measures such as customs duties and tariffs that may apply directly to product categories comprising a material portion of our revenues. The customs laws, rules and regulations that we are required to comply with are complex and subject to unpredictable enforcement and modification. As a result of these restrictions, we have from time to time experienced delays in shipping our manufactured products into certain countries, and changes in cross-border regulations could have a significant negative effect on our business. For example, the current United States administration has made, and may continue to make, major changes in trade policy between the United States and other countries, such as the imposition of additional tariffs and duties on imported products. Because we produce most physical products for our United States customers at our facilities in Canada and Mexico and we source most materials for our products outside the United States, including material amounts of sourcing from China, future changes in tax policy or trade relations could adversely affect our business and results of operations.
If we are unable to protect our intellectual property rights, our reputation and brands could be damaged, and others may be able to use our technology, which could substantially harm our business and financial results.
We rely on a combination of patents, trademarks, trade secrets, copyrights, and contractual restrictions to protect our intellectual property, but these protective measures afford only limited protection. Despite our efforts to protect our proprietary rights, unauthorized parties may be able to copy or use technology or information that we consider proprietary. There can be no guarantee that any of our pending patent applications or continuation patent applications will be granted, and from time to time we face infringement, invalidity, intellectual property ownership, or similar claims brought by third parties with respect to our patents. In addition, despite our trademark registrations throughout the world, our competitors or other entities may adopt names, marks, or domain names similar to ours, thereby impeding our ability to build brand identity and possibly leading to customer confusion. Enforcing our
intellectual property rights can be extremely costly, and a failure to protect or enforce these rights could damage our reputation and brands and substantially harm our business and financial results.
Intellectual property disputes and litigation are costly and could cause us to lose our exclusive rights, subject us to liability, or require us to stop some of our business activities.
From time to time, we receive claims from third parties that we infringe their intellectual property rights, that we are required to enter into patent licenses covering aspects of the technology we use in our business, or that we improperly obtained or used their confidential or proprietary information. Any litigation, settlement, license, or other proceeding relating to intellectual property rights, even if we settle it or it is resolved in our favor, could be costly, divert our management's efforts from managing and growing our business, and create uncertainties that may make
it more difficult to run our operations. If any parties successfully claim that we infringe their intellectual property rights, we might be forced to pay significant damages and attorney's fees, and we could be restricted from using certain technologies important to the operation of our business.
Our business is dependent on the Internet, and unfavorable changes in government regulation of the Internet, e-commerce, and email marketing could substantially harm our business and financial results.
Due toBecause most of our dependencebusinesses depend primarily on the Internet for most of our sales, laws specifically governing the Internet, e-commerce, and email marketing may have a greater impact on our operations than other more traditional businesses. Existing and future laws, such as laws covering pricing, customs, privacy, consumer protection, or commercial email, may impede the growth of e-commerce and our ability to compete with traditional “bricks and mortar” retailers. Existing and future laws or unfavorable changes or interpretations of these laws could substantially harm our business and financial results.
The failure of our business partners to use legal and ethical business practices could negatively impact our business.
We contract with multiple business partners in an increasing number of jurisdictions worldwide, including sourcing the raw materials for the products we sell from an expanding number of suppliers and contracting with third-party merchants and manufacturers for the placement and fulfillment of customer orders. We require our suppliers, fulfillers, and merchants to operate in compliance with all applicable laws, including those regarding corruption, working conditions, employment practices, safety and health, and environmental compliance, but we cannot control their business practices. We may not be able to adequately vet, monitor, and audit our many business partners (or their suppliers) throughout the world, and our decentralized structure heightens this risk, as not all of our businesses have equal resources to manage their business partners. If any of them violates labor, environmental, or other laws or implements business practices that are regarded as unethical or inconsistent with our values, our reputation could be severely damaged, and our supply chain and order fulfillment process could be interrupted, which could harm our sales and results of operations.
If we were required to reviewscreen the content that our customers incorporate into our products, and interdict the shipment of products that violate copyright protections or other laws, our costs wouldcould significantly increase, which would harm our results of operations.
Because of our focus on automation and high volumes, the vast majoritymany of our sales do not involve any human-based review of content. Although our websites' terms of use specifically require customers to make representations about the legality and ownership of the content they upload for production, there is a risk that a customer may supply an image or other content for an order we produce that is the property of another party used without permission, that infringes the copyright or trademark of another party, or that would be considered to be defamatory, hateful, obscene, or otherwise objectionable or illegal under the laws of the jurisdiction(s) where that customer lives or where we operate. If the machine-learning tools we werehave developed to become legally obligatedaid our content review fail to performfind instances of intellectual property infringement or objectionable or illegal content in customer orders, we could be required to increase the amount of manual screening of customer orders,we perform, which could significantly increase our costs, would increase significantly, and we could be required to pay substantial penalties or monetary damages for any failure in our screening process.
We are subject to customer payment-related risks.
We accept payments for our products and services on our websites by a variety of methods, including credit or debit card, PayPal, check, wire transfer, or other methods. In some geographic regions, we rely on one or two third party companies to provide payment processing services. If any of the payment processing or other companies with which we have contractual arrangements became unwilling or unable to provide these services to us or they or we are unable to comply with our contractual requirements under such arrangements, then we would need to find and engage replacement providers, which we may not be able to do on terms that are acceptable to us or at all, or to process the payments ourselves. Any of these scenarios could be disruptive to our business as they could be costly and time consuming and may unfavorably impact our customers.
As we offer new payment options to our customers, we may be subject to additional regulations, compliance requirements and fraud risk. For some payment methods, including credit and debit cards, we pay interchange and other fees, which may increase over time and raise our operating costs and lower our profit margins or require that we charge our customers more for our products. We are also subject to payment card association and similar operating rules and requirements, which could change or be reinterpreted to make it difficult
or impossible for us to comply. If we fail to comply with these rules and requirements, we may be subject to fines and higher transaction fees and lose our ability to accept credit and debit card payments from our customers or facilitate other types of online payments, and our business and operating results could be materially adversely affected.
In addition, we may be liable for fraudulent transactions conducted on our websites, such as through the use of stolen credit card numbers. To date, quarterly losses from payment fraud have not exceeded 1% of total revenues in any quarter, but we continue to face the risk of significant losses from this type of fraud.
We may be subject to product liability or environmental compliance claims if people, property, or the environment are harmed by the products we sell.
Some of the products we sell may expose us to product liability or environmental compliance claims relating to issues such as personal injury, death, property damage, or the use or disposal of environmentally harmful substances and may require product recalls or other actions. Any claims, litigation, or recalls could be costly to us and damage our brands and reputation.
Our inabilityfailure to use or maintain domain names in each country or region where we currently or intend to do business could negatively impact our brands and our ability to sell our products and services in that country or region.
We may not be able to prevent third parties from acquiring domain names that use our brand names or other trademarks or that otherwise infringe or decrease the value of our trademarks and other proprietary rights. If we are unable to use or maintain a domain name in a particular country or region, then we could be forced to purchase the domain name from an entity that owns or controls it, which we may not be able to do on commercially acceptable terms or at all; we may incur significant additional expenses to develop a new brand to market our products within that country; or we may elect not to sell products in that country.
We do not collect indirect taxes in all jurisdictions whichwhere we are required to do so could expose us to tax liabilities.
In someThe application of the jurisdictions where we sell products and services, we do not collect or have imposed upon us sales, value added or other consumption taxes which we refer to as indirect taxes. The application of indirect taxes(indirect taxes) to e-commerce businesses such as Cimpress is a complex and evolving issue, and in many cases, it is not clear how existing tax statutes apply to the Internet or e-commerce.issue. If a government entity claims that we should have been collecting indirect taxes on the sale of our products in a jurisdiction where we have not been doing so, then we could incur substantial tax liabilities for past sales.
For example, certainsome of our businesses domay not currently collect sales tax in all U.S. states where they sell products. Many state governments in the United States have imposed or are seeking to impose sales tax collection responsibility on out-of-state, online retailers, and the recent U.S. Supreme Court ruling in South Dakota v. Wayfair, Inc. et al. enablesenabled states to consider adoptingadopt laws requiring remote sellers to collect and remit sales tax, even in states in which the seller has no physical presence. To the extent that individual states decide to adopt similar legislation, this could significantly increase the collection and compliance burden on Cimpress businesses operating in the U.S. In addition, there is risk that a state government in which a Cimpress business currently is not registered to collect and remit sales tax may attempt to assess tax, interest and penalties relating to prior periods.
Risks Related to Our Corporate Structure
Challenges by various tax authorities to our international structure could, if successful, increase our effective tax rate and adversely affect our earnings.
We are a Dutchan Irish public limited liability company that operates through various subsidiaries in a number of countries throughout the world. Consequently, we are subject to tax laws, treaties and regulations in the countries in which we
operate, and these laws and treaties are subject to interpretation. From time to time, we are subject to tax audits, and the tax authorities in these countries could claim that a greater portion of the income of the Cimpress N.V.plc group should be subject to income or other tax in their respective jurisdictions, which could result in an increase to our effective tax rate and adversely affect our results of operations.
Changes in tax laws, regulations and treaties could affect our tax rate and our results of operations.
A change in tax laws, treaties or regulations, or their interpretation, of any country in which we operate could result in a higher tax rate on our earnings, which could result in a significant negative impact on our earnings and cash flow from operations. In addition to the passage of the Tax Cuts and Jobs Act in the United States, there are currently multiple initiatives for comprehensive tax reform underway in other key jurisdictions where we have operations. We continue to assess the impact of the U.S. Tax Cuts and Jobs Act as well as various international tax reform proposals and modifications to existing tax treaties in all jurisdictions where we have operations that could result in a material impact on our income taxes. We cannot predict whether any other specific legislation will be enacted or the terms of any such legislation. However, if such proposals were enacted, or if modifications were to be made to certain existing treaties, the consequences could have a materially adverse impact on us, including increasing our tax burden, increasing costs of our tax compliance or otherwise adversely affecting our financial condition, results of operations and cash flows. There are currently multiple initiatives for comprehensive tax reform underway in key jurisdictions where we have operations, and we cannot predict whether any other specific legislation will be enacted or the terms of any such legislation.
Our intercompany arrangements may be challenged, which could result in higher taxes or penalties and an adverse effect on our earnings.
We operate pursuant to written transfer pricing agreements among Cimpress N.V.plc and its subsidiaries, which establish transfer prices for various services performed by our subsidiaries for other Cimpress group companies. If two or more affiliated companies are located in different countries, the tax laws or regulations of each country generally will require that transfer prices be consistent with those between unrelated companies dealing at arm's length. With the exception of certain jurisdictions where we have obtained rulings or advance pricing agreements, our transfer pricing arrangements are not binding on applicable tax authorities, and no official authority in any other country has made a determination as to whether or not we are operating in compliance with its transfer pricing laws.authorities. If tax authorities in any country were successful in challenging our transfer prices as not reflecting arm's length transactions, they could require us to adjust our transfer prices and thereby reallocate our income to reflect these revised transfer prices. A reallocation of taxable income from a lower tax jurisdiction to a higher tax jurisdiction would result in a higher tax liability to us. In addition, if the country from which the income is reallocated does not agree with the reallocation, both countries could tax the same income, resulting in double taxation.
Our Articles of Association, Dutch law and the independent foundation, Stichting Continuïteit Cimpress, may make it difficult to replace or remove management, may inhibit or delay a change of control or may dilute shareholder voting power.
Our Articles of Association, or Articles, as governed by Dutch law, limit our shareholders' ability to suspend or dismiss the members of our management board and supervisory board or to overrule our supervisory board's nominees to our management board and supervisory board by requiring a supermajority vote to do so under most circumstances. As a result, there may be circumstances in which shareholders may not be able to remove members of our management board or supervisory board even if holders of a majority of our ordinary shares favor doing so.
In addition, an independent foundation, Stichting Continuïteit Cimpress, or the Foundation, exists to safeguard the interests of Cimpress N.V. and its stakeholders, which include but are not limited to our shareholders, and to assist in maintaining Cimpress' continuity and independence. To this end, we have granted the Foundation a call option pursuant to which the Foundation may acquire a number of preferred shares equal to the same number of ordinary shares then outstanding, which is designed to provide a protective measure against unsolicited take-over bids for Cimpress and other hostile threats. If the Foundation were to exercise the call option, it may prevent a change of control or delay or prevent a takeover attempt, including a takeover attempt that might result in a premium over the market price for our ordinary shares. Exercise of the preferred share option would also effectively dilute the voting power of our outstanding ordinary shares by one half.
We have limited flexibility with respect to certain aspects of capital management and certain corporate transactions.
Dutch law imposes limitations and requirements on corporate actions such as the payment of dividends, issuance of new shares, repurchase of outstanding shares, and corporate acquisitions of a certain size, among other actions. For example, Dutch law requires shareholder approval for many corporate actions that would not be subject to shareholder approval if we were incorporated in the United States. Situations may arise where the flexibility to issue shares, pay dividends, purchase shares, acquire other companies, or take other corporate actions would be beneficial to us, but is subject to limitations, subject to delay due to shareholder approval requirements, or unavailable under Dutch law.
Because of our corporate structure, our shareholders may find it difficult to pursue legal remedies against the members of our supervisory board or management board.
Our Articles and our internal corporate affairs are governed by Dutch law, and the rights of our shareholders and the responsibilities of our supervisory board and management board are different from those established under United States laws. For example, under Dutch law derivative lawsuits are generally not available, and our supervisory board and management board are responsible for acting in the best interests of the company, its business and all of its stakeholders generally (including employees, customers and creditors), not just shareholders. As a result, our shareholders may find it more difficult to protect their interests against actions by members of our supervisory board or management board than they would if we were a U.S. corporation.
Because of our corporate structure, our shareholders may find it difficult to enforce claims based on United States federal or state laws, including securities liabilities, against us or our management team.
We are incorporated under the laws of Ireland. There can be no assurance that the Netherlands, andcourts of Ireland would recognize or enforce judgments of U.S. courts obtained against us or our directors or officers based on the vast majority of our assets are located outsidecivil liabilities provisions of the United States. In addition, someU.S. federal or state securities laws or that the courts of our officersIreland would hear actions against us or those persons based on those laws. There is currently no treaty between the U.S. and management reside outsideIreland providing for the reciprocal recognition and enforcement of judgments in civil and commercial matters, and Irish common law rules govern the United States. In most cases,process by which a U.S. judgment will be enforced in Ireland. Therefore, a final judgment for the payment of money rendered by aany U.S. federal or state court based on civil liability, whether or not based solely on U.S. federal or state securities laws, would not automatically or necessarily be directly enforceable in the Netherlands. Although there is a process under Dutch law for petitioning a Dutch court to enforce a judgment rendered in the United States, there can be no assurance that a Dutch court would impose civil liability on us or our management team in any lawsuit predicated solely upon U.S. securities or other laws. Ireland.
In addition, because most of our assets are located outside of the United States and some of our directors and management reside outside of the United States, it could be difficult for investors to place a lien on our assets or those of our directors and officers in connection with a claim of liability under U.S. laws. As a result, it may be difficult for investors to enforce U.S. court judgments or rights predicated upon U.S. laws against us or our management team outside of the United States.
We may not be able to make distributions or purchaseOur past purchases of our ordinary shares without subjectingcould subject our shareholders to Dutch withholding tax.
ACimpress’ publicly traded parent company was historically subject to Dutch tax laws, including the 15% Dutch withholding tax that may be levied on dividends and similar distributions made by Cimpress N.V. to its shareholders, at the statutory rateand purchased a number of 15% if we cannot structure such distributions as being made to shareholders in relation to a reduction of par value, which would be non-taxable for Dutch withholding tax purposes. We have purchased our shares and may seek to purchase additional shares in the future.ordinary shares. Under our Dutch Advanced Tax Ruling, a purchase of shares should not result in any Dutch withholding tax if we hold the purchased shares in treasury for the purpose of issuing shares pursuant to employee share awards or for the funding of acquisitions. However, if the shares cannot be used for these purposes, or the Dutch tax authorities successfully challenge the use of the shares for these purposes, such a purchase of shares may be treated as a partial liquidation subject to the 15% Dutch withholding tax to be levied on the difference between our average paid in capital per share for Dutch tax purposes and the redemption price per share, if higher.
We may be treated as a passive foreign investment company for United States tax purposes, which may subject United States shareholders to adverse tax consequences.
If our passive income, or our assets that produce passive income, exceed levels provided by law for any taxable year, we may be characterized as a passive foreign investment company, or a PFIC, for United States federal income tax purposes. If we are treated as a PFIC, U.S. holders of our ordinary shares would be subject to a disadvantageous United States federal income tax regime with respect to the distributions they receive and the gain, if any, they derive from the sale or other disposition of their ordinary shares.
We believe that we were not a PFIC for the tax year ended June 30, 20182021 and we expect that we will not become a PFIC in the foreseeable future. However, whether we are treated as a PFIC depends on questions of fact as to our assets and revenues that can only be determined at the end of each tax year. Accordingly, we cannot be certain that we will not be treated as a PFIC in future years.
If a United States shareholder owns 10% or more of our ordinary shares, it may be subject to increased United States taxation under the “controlled"controlled foreign corporation”corporation" rules. Additionally, this may negatively impact the demand for our ordinary shares.
If a United States shareholder owns 10% or more of our ordinary shares, it may be subject to increased United States federal income taxation (and possibly state income taxation) under the “controlled"controlled foreign corporation”corporation" rules. In general, if a U.S. person owns (or is deemed to own) at least 10% of the voting power or value of a non-U.S. corporation, or “10%"10% U.S. Shareholder,”" and if such non-U.S. corporation is a “controlled"controlled foreign corporation,”" or “CFC,”"CFC," then such 10% U.S. Shareholder who owns (or is deemed to own) shares in the CFC on the last day of the CFC's taxable year must include in its gross income for United States federal income tax (and possibly state income tax) purposes its pro rata share of the CFC's “subpart"subpart F income,”" even if the "subpartsubpart F income"income is not distributed. In addition, a 10% U.S. shareholder's pro rata share of other income of a CFC, even if not distributed, might also need to be included in a 10% U.S. Shareholder’s gross income for United States federal income tax (and possibly state income tax) purposes under the “global"global intangible low-taxed income”income," or “GILTI”"GILTI," provisions of the U.S. tax law. In general, a non-U.S. corporation is considered a CFC if one or more 10% U.S. Shareholders together own more than 50% of the voting power or value of the corporation on any day during the taxable year of the corporation. “Subpart"Subpart F income”income" consists of, among other things, certain types of dividends, interest, rents, royalties, gains, and certain types of income from services and personal property sales.
The rules for determining ownership for purposes of determining 10% U.S. Shareholder and CFC status are complicated, depend on the particular facts relating to each investor, and are not necessarily the same as the rules for determining beneficial ownership for SEC reporting purposes. For taxable years in which we are a CFC, each of our 10% U.S. Shareholders will be required to include in its gross income for United States federal income tax (and possibly state income tax) purposes its pro rata share of our "subpart F income," even if the subpart F income is not distributed by us, and might also be required to include its pro rata share of other income of ours, even if not distributed by us, under the GILTI provisions of the U.S. tax law. We currently do not believe we are a CFC. However, whether we are treated as a CFC can be affected by, among other things, facts as to our share ownership that may change. Accordingly, we cannot be certain that we will not be treated as a CFC in future years.
The risk of being subject to increased taxation as a CFC may deter our current shareholders from acquiring additional ordinary shares or new shareholders from establishing a position in our ordinary shares. Either of these scenarios could impact the demand for, and value of, our ordinary shares.
The ownership of our ordinary shares is highly concentrated, which could cause or exacerbate volatility in our share price.
More than 70%Approximately 85% of our ordinary shares are held by our top 10 shareholders, and we may repurchase shares in the future (subject to the restrictions in our debt documents), which could further increase the concentration of our share ownership. Because of this reduced liquidity, the trading of relatively small quantities of shares by our shareholders could disproportionately influence the price of those shares in either direction. The price for our shares could, for example, decline precipitously if a large number of our ordinary shares were sold on the market without commensurate demand, as compared to a company with greater trading liquidity that could better absorb those sales without adverse impact on its share price.
Item 1B. Unresolved Staff Comments
None.
Item 2. Properties
We own real property including the following manufacturing operations that provide support across our businesses:
•A 582,000 square foot facility located near Windsor, Ontario, Canada that primarily services our Vistaprint business.
•A 492,000 square foot facility located in Shelbyville, Tennessee, USA, that primarily services our National Pen business.
•A 362,000 square foot facility located in Venlo, the Netherlands that primarily services our Vistaprint business.
•A 130,000 square foot facility located in Kisarazu, Japan that primarily services our Vistaprint and National Pen businesses in the Japanese market.
•A 124,000 square foot facility located in Deer Park, Australia that primarily services our Vistaprint business.
•A 97,000 square feet,foot facility, located near Montpellier, France that primarily services our Upload andThe Print Group businesses.
As of June 30, 2018,2021, a summary of our currently occupied leased spaces is as follows:
|
| | | | | | | | | | | | | | | | | | | |
| Business Segment (1) | | Square Feet | | Type | | Lease Expirations |
| Vistaprint | | 674,459736,780 | | Technology development, marketing, customer service, manufacturing and administrative | | December 2018July 2021 - November 20262034 |
Upload and PrintPrintBrothers | | 713,595298,574 | | Technology development, marketing, customer service, manufacturing and administrative | | February 2019November 2021 - December 20252030 |
National PenThe Print Group | | 314,533442,377 | | Marketing, customer service, manufacturing and administrative | | April 2021 - April 2027 |
All Other Businesses | | 329,773 | | Technology development, marketing, customer service, manufacturing and administrative | | August 2021 - December 2019 - August 20232025 |
| National Pen | | 411,288 | | Marketing, customer service, manufacturing and administrative | | April 2022 -December 2027 |
| All Other Businesses | | 549,256 | | Technology development, marketing, customer service, manufacturing and administrative | | August 2021 - July 2025 |
| Other (2) | | 86,90883,140 | | Corporate strategy and technology development | | July 2020January 2022 - June 2023 |
___________________
(1) Many of our leased properties are utilized by multiple business segments, but each have been assigned to the segment that occupies the majority of our leased space.
(2) Includes locations that are used exclusively for corporate or central functions.function activities.
We believe that the total space available to us in the facilities we own or lease, and space that is obtainable by us on commercially reasonable terms, will meet our needs for the foreseeable future.
Item 3. Legal Proceedings
The information required by this item is incorporated by reference to the information set forth in Item 8 of Part II, “Financial Statements and Supplementary Data — Note 17 — Commitments and Contingencies,” in the accompanying notes to the consolidated financial statements included in this Report.
Item 4. Mine Safety Disclosures
None.
PART II
Item 5. Market for Registrant’s Common Equity, Related Stockholder Matters and Issuer Purchases of Equity Securities
The ordinary shares of Cimpress N.V.plc are traded on the NASDAQ Global Select Market (the "NASDAQ") under the symbol “CMPR.” As of July 31, 2018,2021, there were approximately 1210 holders of record of our ordinary shares, although there is a much larger number of beneficial owners. The following table sets forth, for the periods indicated, the high and low sale price per share of our ordinary shares on the NASDAQ:
|
| | | | | | | |
| | High | | Low |
| Fiscal 2017: | |
| | |
|
| First Quarter | $ | 104.18 |
| | $ | 88.31 |
|
| Second Quarter | $ | 102.95 |
| | $ | 80.47 |
|
| Third Quarter | $ | 99.99 |
| | $ | 79.15 |
|
| Fourth Quarter | $ | 94.47 |
| | $ | 78.80 |
|
| | | | |
| Fiscal 2018: | |
| | |
|
| First Quarter | $ | 99.99 |
| | $ | 80.61 |
|
| Second Quarter | $ | 123.95 |
| | $ | 98.00 |
|
| Third Quarter | $ | 171.76 |
| | $ | 119.52 |
|
| Fourth Quarter | $ | 163.94 |
| | $ | 133.77 |
|
Dividends
We have never paid or declared any cash dividends on our ordinary shares, and we do not anticipate paying any cash dividends in the foreseeable future. We currently intend to retain all future earnings to finance the growth and operations of our business, investment in or acquisition of other businesses, purchase of our ordinary shares, or pay down of our debt. Under Dutch law, we may pay dividends only out of profits shown on our annual accounts prepared in accordance with Dutch law and adopted by our shareholders rather than the financial statements regularly filed with the SEC, and only to the extent our equity exceeds the sum of the paid and called up portion of our ordinary share capital and the reserves that must be maintained in accordance with provisions of Dutch law and our articles of association. In addition, the terms of our outstanding indebtedness restrict our ability to pay dividends, as further described in Item 8 of Part II, "Financial Statements and Supplementary Data - Note 10 - Debt," and in "Item 7. Management's Discussion and Analysis of Financial Condition and Results of Operations" section of this Report.
Issuer Purchases of Equity Securities
On November 14, 2017, our Supervisory Board authorized the repurchase of up to 6,300,000 of our issued and outstanding ordinary shares on the open market (including block trades that satisfy the safe harbor provisions of Rule 10b-18 pursuant to the U.S. Securities Exchange Act of 1934), through privately negotiated transactions, or in one or more self-tender offers. ThisThe share repurchase authorization expiresprogram that we announced on November 25, 2019 expired on May 14, 2019, and we may suspend or discontinue our share repurchases at any time.
22, 2021. We did not repurchase any of our ordinary shares during the three monthsquarter ended June 30, 2018, and 5,857,443 shares remain available for repurchase under this program, subject to certain limitations imposed by our debt covenants.2021.
Performance Graph
The following graph compares the cumulative total return to shareholders of Cimpress N.V.plc ordinary shares relative to the cumulative total returns of the NASDAQ Composite index and the Research Data Group (RDG) Internet Composite index. An investment of $100 (with reinvestment of all dividends) is assumed to have been made in our ordinary shares and in each of the indexes on June 30, 20132016 and the relative performance of each investment is tracked through June 30, 2018.2021.
COMPARISON OF 5 YEAR CUMULATIVE TOTAL RETURN
Among Cimpress N.V.,plc, the NASDAQ Composite Index
and the RDG Internet Composite Index
| | | | Year Ended June 30, | | 2016 | | 2017 | | 2018 | | 2019 | | 2020 | | 2021 |
| | | 2013 | | 2014 | | 2015 | | 2016 | | 2017 | | 2018 | |
| Cimpress N.V. | | $ | 100.00 |
| | $ | 81.95 |
| | $ | 170.47 |
| | $ | 187.32 |
| | $ | 191.47 |
| | $ | 293.62 |
| |
| Cimpress plc | | Cimpress plc | $ | 100.00 | | | $ | 102.22 | | | $ | 156.75 | | | $ | 98.28 | | | $ | 82.55 | | | $ | 117.23 | |
| NASDAQ Composite | | 100.00 |
| | 132.45 |
| | 151.00 |
| | 148.88 |
| | 189.66 |
| | 233.12 |
| NASDAQ Composite | 100.00 | | | 128.30 | | | 158.57 | | | 170.91 | | | 216.96 | | | 315.10 | |
| RDG Internet Composite | | 100.00 |
| | 139.66 |
| | 153.13 |
| | 186.25 |
| | 251.39 |
| | 350.12 |
| RDG Internet Composite | 100.00 | | | 139.43 | | | 196.44 | | | 201.56 | | | 271.11 | | | 385.88 | |
The share price performance included in this graph is not necessarily indicative of future share price performance.
Item 6. Selected Financial Data
The following financial data should be read in conjunction with our consolidated financial statements, the related notes and “Item 7. Management’s Discussion and Analysis of Financial Condition and Results of Operations” included elsewhere in this Report. The historical results are not necessarily indicative of the results to be expected for any future period.
|
| | | | | | | | | | | | | | | | | | | |
| | Year Ended June 30, |
| | 2018 (a) | | 2017 (b) | | 2016 (c) | | 2015 (d) | | 2014 (e) |
| | (In thousands, except share and per share data) |
| Consolidated Statements of Operations Data: | | | | | | | |
| | |
|
| Revenue | $ | 2,592,541 |
| | $ | 2,135,405 |
| | $ | 1,788,044 |
| | $ | 1,494,206 |
| | $ | 1,270,236 |
|
| Net income (loss) attributable to Cimpress N.V. | 43,733 |
| | (71,711 | ) | | 54,349 |
| | 92,212 |
| | 43,696 |
|
| Net income (loss) per share attributable to Cimpress N.V.: | | | | | | | | | |
| Basic | $ | 1.41 |
| | $ | (2.29 | ) | | $ | 1.72 |
| | $ | 2.82 |
| | $ | 1.33 |
|
| Diluted (f) | $ | 1.36 |
| | $ | (2.29 | ) | | $ | 1.64 |
| | $ | 2.73 |
| | $ | 1.28 |
|
| Shares used in computing net income (loss) per share attributable to Cimpress N.V.: | | | | | | | | | |
| Basic | 30,948,081 |
| | 31,291,581 |
| | 31,656,234 |
| | 32,644,870 |
| | 32,873,234 |
|
| Diluted (f) | 32,220,401 |
| | 31,291,581 |
| | 33,049,454 |
| | 33,816,498 |
| | 34,239,909 |
|
|
| | | | | | | | | | | | | | | | | | | |
| | Year Ended June 30, |
| | 2018 (a) | | 2017 (b) | | 2016 (c) | | 2015 (d) | | 2014 (e) |
| | (In thousands) |
| Consolidated Statements of Cash Flows Data: | | | | | | | |
| | |
|
| Net cash provided by operating activities | $ | 192,332 |
| | $ | 156,736 |
| | $ | 247,358 |
| | $ | 242,022 |
| | $ | 153,739 |
|
| Purchases of property, plant and equipment | (60,930 | ) | | (74,157 | ) | | (80,435 | ) | | (75,813 | ) | | (72,122 | ) |
| Purchases of ordinary shares | (94,710 | ) | | (50,008 | ) | | (153,467 | ) | | — |
| | (42,016 | ) |
| Business acquisitions, net of cash acquired | (110 | ) | | (204,875 | ) | | (164,412 | ) | | (123,804 | ) | | (216,384 | ) |
| Proceeds from the sale of subsidiaries, net of transaction costs and cash divested | 93,779 |
| | — |
| | — |
| | — |
| | — |
|
| Net (payments) proceeds of debt and debt issuance costs | (54,415 | ) | | 196,933 |
| | 167,316 |
| | 54,207 |
| | 207,946 |
|
|
| | | | | | | | | | | | | | | | | | | |
| | Year Ended June 30, |
| | 2018 (a) | | 2017 (b) | | 2016 (c) | | 2015 (d) | | 2014 (e) |
| | (In thousands) |
| Consolidated Balance Sheet Data: | | | | | | | |
| | |
|
| Cash, cash equivalents and marketable securities | $ | 44,227 |
| | $ | 25,697 |
| | $ | 85,319 |
| | $ | 110,494 |
| | $ | 76,365 |
|
| Net current liabilities (g) | (241,728 | ) | | (203,482 | ) | | (135,095 | ) | | (89,580 | ) | | (83,560 | ) |
| Total assets | 1,652,217 |
| | 1,679,869 |
| | 1,463,869 |
| | 1,299,794 |
| | 985,495 |
|
| Total long-term debt, excluding current portion (h) | 767,585 |
| | 847,730 |
| | 656,794 |
| | 493,039 |
| | 408,150 |
|
| Total shareholders’ equity | 93,947 |
| | 75,212 |
| | 166,076 |
| | 249,419 |
| | 232,457 |
|
___________________
(a) Includes the Albumprinter results through the divestiture date of August 31, 2017. See Note 7 in our accompanying financial statements in this Report for a discussion of this divestiture.
| |
(b) | Includes the impact of the acquisition of National Pen on December 30, 2016. See Note 7 in our accompanying financial statements in this Report for a discussion of this acquisition. During December 2016, we purchased the remaining noncontrolling interest of our Japan business from our joint business partner, Plaza Create Co. Ltd. |
(c) Includes the impact of the acquisitions of Litotipografia Alcione S.r.l. on July 29, 2015, Tradeprint Distribution Limited on July 31, 2015, and WIRmachenDRUCK GmbH on February 1, 2016. See Note 7 in our accompanying financial statements in this Report for a discussion of these acquisitions.
During fiscal 2016, we adopted Accounting Standards Update (ASU) 2016-09 requiring the recognition of excess tax benefits as a component of income tax expense; these benefits were historically recognized in equity. As the standardPart II, Item 6 is no longer required a prospective method of adoption, our fiscal 2018, 2017 and 2016 net income includes $12.8 million, $8.0 million and $3.5 million of income tax benefits, respectively, due to the adoption that did not occur in the prior comparable periods presented above.
(d) Includes the impact of the acquisitions of FotoKnudsen AS on July 1, 2014, FL Print SAS on April 9, 2015, Exagroup SAS on April 15, 2015 and druck.at Druck-und Handelsgesellschäft mbH on April 17, 2015, as well as our investment in Printi LLC on August 7, 2014.
(e) Includes the impact of the acquisitions of Printdeal B.V. on April 1, 2014 and Pixartprinting S.p.A. on April 3, 2014, as well as our investment in a joint business arrangement with Plaza Create Co. Ltd. in February 2014.
(f) In the periods we report a net loss, the impact of share options, RSUs, and RSAs is not included as they are anti-dilutive.
(g) Our net current liabilities (current assets minus current liabilities) have increased over recent years as we have made long-term investmentsadopted certain provisions within the amendments to Regulation S-K that seek to drive shareholder value through acquisitions, ordinary share purchases, and other strategic initiatives. We have financed these investments through a mix of cash on hand, cash flows generated from operations and external debt financing. Additionally, many of our businesses have a cash conversion cycle that results in current liabilities being higher than current assets.eliminate Item 301.
(h) On June 15, 2018, we completed a private placement of $400.0 million of 7.0% senior unsecured notes due 2026. The proceeds from the sales of the notes were used to repay our existing $275.0 million senior unsecured notes that were due 2022, a portion of our indebtedness outstanding under our senior secured credit facility and other related transaction fees. See Note 10 in our accompanying financial statements in this Report for additional discussion. Increases in long-term debt during the periods presented have largely been driven by the funding of acquisitions outlined including those outlined in Note 7 and share repurchases.
Item 7. Management’s Discussion and Analysis of Financial Condition and Results of Operations
This Report contains forward-looking statements that involve risks and uncertainties. The statements contained in this Report that are not purely historical are forward-looking statements within the meaning of Section 27A of the Securities Act of 1933 and Section 21E of the Securities Exchange Act of 1934, including but not limited to our statements about the anticipated revenue growth rates, plannedand development of our businesses and revenues, the size of our market and opportunity, our expectations with respect to our business, markets, competitive position, and demand for our products post-pandemic, our expectations for economic recovery post-pandemic, our expectations for design services in the Vistaprint business and the success of the 99designs acquisition, the anticipated effects of our investments in our business andincluding the expected effectshiring of those investments, seasonality of certaintalented personnel, sufficiency of our businesses, the impacts of changes in accounting standards, the impact of the U.S. Tax Cutsliquidity position, legal proceedings, and Jobs Act, the sufficiency of our tax reserves, sufficiency of our cash, legal proceedings, expected operating losses at newer businesses, expected allocations of capital, the anticipated competitive position of certain of our businesses, and the impact of exchange rate and currency volatility.reserves. Without limiting the foregoing, the words “may,” “should,” “could,” “expect,” “plan,” “intend,” “anticipate,” “believe,” “estimate,” “predict,” “designed,” “potential,” “continue,” “target,” “seek” and similar expressions are intended to identify forward-looking statements. All forward-looking statements included in this Report are based on information available to us up to, and including the date of this document, and we disclaim any obligation to update any such forward-looking statements. Our actual results could differ materially from those anticipated in these forward-looking statements as a result of certainvarious important factors, including but not limited to flaws in the assumptions and judgments upon which our forecasts and estimates are based; the development, severity, and duration of the COVID-19 pandemic and the timing and pace of economic recovery; our failure to anticipate and react to the effects of the pandemic on our customers, supply chain, markets, team members, and business; our inability to make the investments that we plan to make or the failure of those set forthinvestments to achieve the results we expect; loss or unavailability of key personnel or our inability to recruit talented personnel to drive performance of our businesses; the failure of businesses we acquire or invest in to perform as expected; unanticipated changes in our markets, customers, or businesses; changes in the laws and regulations, or in the interpretation of laws and regulations, that affect our businesses; our failure to manage the growth and complexity of our business and expand our operations; our failure to maintain compliance with the covenants in our debt documents or to pay our debts when due; competitive pressures; general economic conditions; and other factors described in this “Management's DiscussionReport and Analysis of Financial Condition and Results of Operations” and “Risk Factors” and elsewhere in this Report. You should carefully review those factors and also carefully review the risks outlined in other documents that we periodically file from time to time with the United States Securities and Exchange Commission.SEC.
Executive Overview
Cimpress is a strategically-focusedstrategically focused group of more than a dozen businesses that specialize in mass customization, via which we deliver large volumes of individually small-sized customized orders for a broad spectrum of print, signage, photo merchandise, invitations and announcements, writing instruments, packaging, apparel and other categories. We invest in and build customer-focused, entrepreneurial mass customization businesses for the long term, which we manage in a decentralized, autonomous manner. We drive competitive advantage across Cimpress through a select few shared strategic capabilities that have the greatest potential to create Cimpress wideCimpress-wide value. We limit all other central activities to only those which absolutely must be performed centrally.
As of June 30, 2018,2021, we have numerous operating segments under our management reporting structure that are reported in the following fourfive reportable segments: Vistaprint, Upload andPrintBrothers, The Print Group, National Pen, and All Other Businesses. Vistaprint represents our Vistaprint websites focused on the North America, Europe, Australia and New Zealand markets, and our Webs business, which is managed with the Vistaprint digital business. Upload and Print includes the druck.at, Easyflyer, Exagroup, Pixartprinting, Printdeal, Tradeprint, and WIRmachenDRUCK businesses. National Pen includes the global operations of our National Pen business. All Other Businesses segment includes the operations of our Printi, Vistaprint India, Vistaprint Japan and Vistaprint Corporate Solutions businesses, and the Albumprinter business, through its divestiture on August 31, 2017.
During the first quarter of fiscal 2018, we began presenting inter-segment fulfillment activity as revenue for the fulfilling business for purposes of measuring and reporting our segment financial performance. This change in presentation was driven by our recent transition to a decentralized organizational structure, and this presentation aligns with our internal reporting and the way in which our business' performance is evaluated. We have revised historical results to reflect the consistent application of our current accounting methodology. In addition, we adjusted our historical segment profitability for the allocation of certain IT costs that are allocated to each of our businesses in fiscal 2018, to better reflect where those resources are consumed.Refer to Note 16 of the15 in our accompanying consolidated financial statements for additional detailsinformation relating to our reportable segments and our segment financial measures.
COVID-19
Throughout fiscal year 2021, the pandemic and related restrictions had a negative impact on most of these changes.our businesses, customers and the markets that we serve. We've experienced improving trends in customer demand throughout the fiscal year, and we have experienced stronger recovery in demand in markets where pandemic restrictions have been lifted or are less severe. During the second half of the fiscal year we've lapped the early periods of the pandemic which had the most severe impacts on customer demand. The improving trends give us confidence that demand will continue to pick up as activity resumes in our markets around the world. We continue to hire talent and make investments in technology, data, new product introduction, customer experience
improvements, and branding that are designed to build on our competitive advantages and drive growth in our businesses as we come out of the pandemic, although we can't forecast how long that will take. We continue to maintain flexibility in our cost structure, while at the same time increasing investment in areas we believe will generate high return on investment beyond the pandemic.
Financial Summary
The primary financial metric by which we set quarterly and annual budgets both for individual businesses and Cimpress-wideCimpress wide is our adjusted free cash flow prior tobefore cash interest costs;expense related to borrowing; however, in evaluating the financial condition and operating performance of our business, management considers a number of metrics including revenue growth, organic constant-currency revenue growth, operating income, adjusted net operating profit,EBITDA, cash flow from operations and adjusted free cash flow. A summary of these key financial metrics for the year ended June 30, 20182021 as compared to the year ended June 30, 20172020 follows:
Fiscal year 2018Year 2021
•Revenue increased by 21%4% to $2,592.5 million.
Consolidated•Organic constant-currency revenue (a non-GAAP financial measure) increased by 17%1% and decreased by 1% when excluding acquisitions and divestitures completed in the last four quarters,quarters.
•Operating income increased by11%.
Operating income (loss) increased by $203.5 $67.5 million to $157.8$123.5 million.
•Adjusted net operating profitEBITDA (a non-GAAP financial measure which we refer to as adjusted NOP) increasedmeasure) decreased by $69.8$50.7 million to $165.5$349.1 million.
•Diluted net (loss) income per share attributable to Cimpress plc decreased to a loss per share in fiscal year 2021 of $2.99 from income per share of $3.00 in fiscal year 2020.
•Cash provided by operating activities increaseddecreased by $35.6$73.2 million to $192.3$265.2 million.
Free•Adjusted free cash flow (a non-GAAP financial measure) increaseddecreased by $94.4$78.2 million to $139.5$165.8 million.
For our fiscal year 2018,2021, the increase in reported revenue includes the impact of a full year of National Pen revenue as compared to a portion of the prior yearis primarily due to timing of the acquisition, continued growth in our various businesses,positive exchange rate fluctuations that benefited revenue, as well as positivethe addition of the revenue of 99designs, which was acquired on October 1, 2020 and is included in our Vistaprint business. Organic constant-currency revenue decreased as we continued to realize negative impacts from currency exchange rate fluctuations. This wasCOVID-19, as pandemic-related restrictions in certain markets throughout the year reduced customer demand. As restrictions started to ease in certain markets during the second half of the fiscal year, we began to see a strong correlation between markets with less pandemic-related restrictions and the recovery of customer demand. Revenue from event-driven small business products were most impacted during the fiscal year, and were partially offset by the loss of Albumprinter revenue as we divested this business as of August 31, 2017. Our constant-currency revenue growth excluding acquisitions and divestitures was driven primarily by continued growth in our Vistaprintrevenue from home decor and Uploadpackaging products, as well as contributions from new products introduced in reaction to the pandemic such as face masks. For fiscal year 2021, face masks contributed approximately 4% to total revenue, for which demand during the second half of fiscal year 2021 declined significantly due to increases in vaccination rates and Print businesses.reduction of mask requirements.
In addition to incremental profits generated from the revenue growth described above, the following items positively impacted our operating income forFor the year ended June 30, 2018, leading to the increase in2021, operating income as compared toincreased by $67.5 million, primarily driven by the non-recurrence of a $100.8 million goodwill impairment charge in the prior period:
Significant year-over-year operating expense savings of approximately $55 million related to the restructuring actions announced in January and November 2017,fiscal year, as well as a reduction ofvariable cost controls, fixed cost savings and lower restructuring charges of $11.5 million.
Recognized gain on the sale of subsidiaries of $47.5 million, related to the August 2017 sale of Albumprinter.
Decrease of acquisition-related expenses of $46.6 million, due to the following:
| |
◦ | Reduction to earn-out related charges of $40.7 million, related primarily to the WIRmachenDRUCK contingent earn-out arrangement that was paid in fiscal year 2018.
|
| |
◦ | Impairment charges of $9.6 million recognized during the prior period, which did not recur during the current period.
|
| |
◦ | Increased amortization of acquired intangible assets of $3.7 million, due to the timing of our fiscal year 2017 acquisition of National Pen, which partially offset the above decreases.
|
Increase in National Pen segment profit of $24.4 million, primarily due to the timing of the acquisition in fiscal year 2017.
Decreased impact ofcharges. These items were partially offset by increased organic investments in fiscal year 2018 as compared to fiscal year 2017,hiring, technology, and upper-funnel brand and performance-based advertising spend primarily in Vistaprint. Operating income was negatively impacted by $19.9 million of lease-related impairment and abandonment charges due to reduced net investmentschanges in various areas including "Columbus"our intended use of two leased locations, which was the name of a project to organically build our businesswe expect will deliver substantial cost savings in promotional products and logo apparel, new product introduction, and the businesses within our All Other Businesses segment.future periods.
Adjusted NOP increased significantlyEBITDA decreased year over year, primarily due to the same reasonsincreased organic investments outlined above as operating income mentioned above, although adjusted NOPwell as the non-recurrence of of temporary cost reductions and the salary restructuring program that benefited the fourth quarter of fiscal 2020 by $9.0 million, which more than offset the gross profit increase from reported revenue growth. Adjusted EBITDA excludes the impact of the gain from the purchase or sale of subsidiaries,goodwill and other impairment charges, restructuring charges and acquisition-related charges,share-based compensation expense, and includes the realized gains or losses on our currency hedges.derivatives intended to hedge adjusted EBITDA. The net year-over-year impact of currency on consolidated adjusted NOPEBITDA was unfavorable by approximately $14.7 million.
Diluted net (loss) income per share attributable to Cimpress plc decreased to a loss per share in fiscal year 2021 of $2.99 from income per share of $3.00 in fiscal year 2020. The decrease is primarily due to the non-recurrence of a prior year tax benefit, the recognition in fiscal year 2021 of a loss on extinguishment of debt of $48.3
million, as well as increased interest expense and negative for the year ended June 30, 2018.year-over-year realized and unrealized currency impacts.
Consolidated Results of Operations
Consolidated Revenue
Our businesses generate revenue primarily from the sale and shipment of customized manufactured products. ToWe also generate revenue, to a much lesser extent (and onlyprimarily in our Vistaprint business) we provide, from digital services, graphic design services, website design and hosting, and email marketing services, as well as generate a small percentage of revenue from order referral fees and other third-party offerings.
For the year ended June 30, 2018, our reportedadditional discussion relating to segment revenue increased as comparedresults, refer to the prior comparable period. This includes the full year revenue benefit of the National Pen business as results were"Reportable Segment Results" section included for only a portion of the prior period. We also delivered continued growth in our Vistaprint and Upload and Print businesses. Our reported revenue was negatively impacted by the divestiture of our Albumprinter business, which was completed during the first quarter of fiscal year 2018. The remaining businesses within our All Other Businesses segment continue to grow strongly off small bases. Currency fluctuations positively impacted our fiscal 2018 reported revenue as compared to the prior year.
For the year ended June 30, 2017, our reported revenue increased primarily due to the addition of revenue from our WIRmachenDRUCK business acquired on February 1, 2016 and our National Pen business acquired on December 30, 2016. The increase in reported revenue other than the impact of acquisitions for which there is no comparable prior period was driven by continued growth in our Vistaprint business, as well as growth in our other Upload and Print businesses, which was partially offset by declines from the termination of two partner contracts within our Albumprinter and Vistaprint Corporate Solutions businesses. Currency fluctuations negatively impacted our fiscal year 2017 reported revenue as compared to the prior year.below.
Total revenue and revenue growth by reportable segment for the years ended June 30, 2018, 20172021 and 20162020 are shown in the following tables:table:
| | | | | | | | | | | | | | | | | | | | | | | | | | | | | | | | | | | | | | | | | |
| In thousands | Year Ended June 30, | | | | Currency
Impact: | | Constant-
Currency | | Impact of Acquisitions/Divestitures: | | Constant- Currency Revenue Growth |
| 2021 | | 2020 | | %
Change | | (Favorable)/Unfavorable | | Revenue Growth (1) | | (Favorable)/Unfavorable | | Excluding Acquisitions/Divestitures (2) |
| Vistaprint (3) | $ | 1,444,807 | | | $ | 1,337,291 | | | 8% | | (3)% | | 5% | | (4)% | | 1% |
| PrintBrothers | 421,766 | | | 417,921 | | | 1% | | (7)% | | (6)% | | (1)% | | (7)% |
| The Print Group | 275,534 | | | 275,214 | | | —% | | (7)% | | (7)% | | —% | | (7)% |
| National Pen | 313,528 | | | 299,474 | | | 5% | | (3)% | | 2% | | —% | | 2% |
| All Other Businesses | 192,038 | | | 173,789 | | | 11% | | 1% | | 12% | | —% | | 12% |
| Inter-segment eliminations | (55,160) | | | (22,331) | | | | | | | | | | | |
| Total revenue | $ | 2,592,513 | | | $ | 2,481,358 | | | 4% | | (3)% | | 1% | | (2)% | | (1)% |
|
| | | | | | | | | | | | | | | | | |
| In thousands | Year Ended June 30, | | | | Currency
Impact: | | Constant-
Currency | | Impact of Acquisitions/Divestitures: | | Constant- Currency Revenue Growth |
| | 2018 | | 2017 | | %
Change | | (Favorable)/Unfavorable | | Revenue Growth (1) | | (Favorable)/Unfavorable | | Excluding Acquisitions/Divestitures (2) |
| Vistaprint | $ | 1,462,686 |
| | $ | 1,310,975 |
| | 12% | | (3)% | | 9% | | —% | | 9% |
| Upload and Print | 730,010 |
| | 588,613 |
| | 24% | | (11)% | | 13% | | —% | | 13% |
| National Pen | 333,266 |
| | 112,712 |
| | 196% | | (6)% | | 190% | | (165)% | | 25% |
| All Other Businesses (3) | 87,583 |
| | 128,795 |
| | (32)% | | —% | | (32)% | | 72% | | 40% |
| Inter-segment eliminations | (21,004 | ) | | (5,690 | ) | | | | | | | | | | |
| Total revenue | $ | 2,592,541 |
| | $ | 2,135,405 |
| | 21% | | (4)% | | 17% | | (6)% | | 11% |
| | | In thousands | Year Ended June 30, | | Currency
Impact: | | Constant-
Currency | | Impact of Acquisitions/Divestitures: | | Constant- Currency Revenue Growth | In thousands | Year Ended June 30, | | Currency
Impact: | | Constant-
Currency | | Impact of Acquisitions: | | Constant- Currency revenue growth |
| | 2017 | | 2016 | | %
Change | | (Favorable)/Unfavorable | | Revenue Growth (1) | | (Favorable)/Unfavorable | | Excluding Acquisitions/Divestitures (2) | | 2020 | | 2019 | | %
Change | | (Favorable)/Unfavorable | | Revenue Growth (1) | | (Favorable)/Unfavorable | | Excluding Acquisitions (2) |
| Vistaprint | $ | 1,310,975 |
| | $ | 1,220,751 |
| | 7% | | 2% | | 9% | | —% | | 9% | Vistaprint | $ | 1,337,291 | | | $ | 1,508,322 | | | (11)% | | 1% | | (10)% | | —% | | (10) | % |
| Upload and Print | 588,613 |
| | 432,638 |
| | 36% | | 3% | | 39% | | (26)% | | 13% | |
| PrintBrothers | | PrintBrothers | 417,921 | | | 443,987 | | | (6)% | | 3% | | (3)% | | (2)% | | (5) | % |
| The Print Group | | The Print Group | 275,214 | | | 325,872 | | | (16)% | | 3% | | (13)% | | —% | | (13) | % |
| National Pen | 112,712 |
| | — |
| | 100% | | —% | | 100% | | (100)% | | —% | National Pen | 299,474 | | | 348,409 | | | (14)% | | 1% | | (13)% | | —% | | (13) | % |
All Other Businesses (3) | 128,795 |
| | 138,244 |
| | (7)% | | —% | | (7)% | | —% | | (7)% | 173,789 | | | 136,202 | | | 28% | | 1% | | 29% | | (25)% | | 4 | % |
| Inter-segment eliminations | (5,690 | ) | | (3,589 | ) | |
| |
| |
| |
| |
| Inter-segment eliminations | (22,331) | | | (11,716) | | |
| Total revenue | $ | 2,135,405 |
| | $ | 1,788,044 |
| | 19% | | 2% | | 21% | | (13)% | | 8% | Total revenue | $ | 2,481,358 | | | $ | 2,751,076 | | | (10)% | | 1% | | (9)% | | (2)% | | (11) | % |
_________________
(1) Constant-currency revenue growth, a non-GAAP financial measure, represents the change in total revenue between current and prior year periods at constant-currency exchange rates by translating all non-U.S. dollar denominated revenue generated in the current period using the prior year period’s average exchange rate for each currency to the U.S. dollar. Our reportable segments-related growth is inclusive of inter-segment revenues, which are eliminated in our consolidated results.
(2) Constant-currency revenue growth excluding acquisitions/divestitures, a non-GAAP financial measure, excludes revenue results for businesses in the period in which there is no comparable year-over-year revenue. Revenue from our fiscal year 2017 acquisitions is excluded from fiscal year 2018 revenue growth for quarters with no comparable year-over-year revenue. For example, revenue from National Pen, which we acquired on December 30, 2016 in Q2 2017, is excluded from revenue growth in Q1 and Q2 of fiscal year 2018 since there are no full quarter results in the comparable periods, but revenue is included in revenue growth for Q3 and Q4 of fiscal year 2018. Our reportable segments-related growth is inclusive of inter-segment revenues, which are eliminated in our consolidated results.
(3) The All Other BusinessesVistaprint segment includes the revenue of the Albumprinterfrom our 99designs business until the sale completionsince its acquisition date of August 31, 2017. Constant-currency revenue growth excluding acquisitions/divestitures, excludes the revenue results for Albumprinter through the divestiture date.October 1, 2020.
We have provided these non-GAAP financial measures because we believe they provide meaningful information regarding our results on a consistent and comparable basis for the periods presented. Management uses these non-GAAP financial measures, in addition to GAAP financial measures, to evaluate our operating results. These non-GAAP financial measures should be considered supplemental to and not a substitute for our reported financial results prepared in accordance with GAAP.
Consolidated Cost of Revenue
Cost of revenue includes materials used by our businesses to manufacture their products, payroll and related expenses for production and design services personnel, depreciation of assets used in the production process and in support of digital marketing service offerings, shipping, handling and processing costs, third-party production and design costs, costs of free products and other related costs of products our businesses sell. Cost of revenue as a percent of revenue increased during the year ended June 30, 2018, compared to the prior year, primarily due to the divestiture of our Albumprinter business which had a higher gross margin than our consolidated gross margin percentage, as well as the increased weight of our Upload and Print portfolio, which has higher cost of revenue as a percentage of revenue than our Vistaprint and National Pen businesses.
|
| | | | | | | | | | | |
In thousands | Year Ended June 30, |
| | 2018 | | 2017 | | 2016 |
| Cost of revenue | $ | 1,279,799 |
| | $ | 1,036,975 |
| | $ | 773,640 |
|
| % of revenue | 49.4 | % | | 48.6 | % | | 43.3 | % |
For the year ended June 30, 2018, cost of revenue for our Upload and Print businesses increased by$103.6 million primarily driven by revenue growth in our Exagroup, Pixartprinting, Printdeal and WIRmachenDRUCK businesses, as well as unfavorable currency impacts. We also recognized an additional $91.6 million of costs primarily due to the timing of our National Pen acquisition and the inclusion of operating results for only part of the prior comparable period. In our Vistaprint business, cost of revenue increased by $71.5 million primarily due to increased production volume, as well as unfavorable currency impacts. These increases were partially offset by a decrease in cost of revenue of $29.2 million resulting from the divestiture of our Albumprinter business on August 31, 2017. | | | | | | | | | | | | | | | | | | | | | |
In thousands | | | Year Ended June 30, |
| | | | | | 2021 | | 2020 | | 2019 |
| Cost of revenue | | | | | $ | 1,316,441 | | | $ | 1,248,871 | | | $ | 1,401,344 | |
| % of revenue | | | | | 50.8 | % | | 50.3 | % | | 50.9 | % |
For the year ended June 30, 2017, our2021, consolidated cost of revenue increased due to $123.6 million of additional costs from our Upload and Print businesses, primarily due to the impact of our fiscal year 2016 WIRmachenDRUCK acquisition which only partially contributed to the prior comparable period. In addition, the costs from our Vistaprint
business increased by $91.1$67.6 million, primarily due to increased production volume; product mix; and planned investments including expanded design services, new product introduction, and shipping price reductionschanges in currency that also result in higher shipping costs. Vistaprintnegatively impacted the current fiscal year, as well as the addition of cost of revenue from our 99designs business that is included from the acquisition date of October 1, 2020. During the year ended June 30, 2021, we also recognized higher costs from production inefficiencies in the second fiscal quarter of 2017 resulting from higher temporary labor costs at our Canadian production facility. We recognized an additional $48.6$12.2 million of costs fromlosses associated with the decline in market demand and pricing for certain masks and related personal protective equipment (PPE) products, primarily in our National Pen business, which was acquired on Decemberand Vistaprint businesses. These increases were partially offset by reductions in demand-dependent cost of goods sold including third-party fulfillment, material, and shipping costs in our segments that experienced year-over-year pandemic-related revenue declines. For the years ended June 30, 20162021 and was therefore not included2020, we realized approximately $10.9 million and $11.6 million, respectively, of wage offset benefits from government incentives in the comparable period.locations where demand decreased materially but roles were maintained.
Consolidated Operating Expenses
The following table summarizes our comparative operating expenses for the following periods:
| | | | | | | | | | | | | | | | | | | | | | | | |
In thousands | | | | | Year Ended June 30, | |
| | | | | | | | 2021 | | 2020 | | 2019 | |
| Technology and development expense | | | | | | | $ | 253,060 | | | $ | 253,252 | | | $ | 236,797 | | |
| % of revenue | | | | | | | 9.8 | % | | 10.2 | % | | 8.6 | % | |
| Marketing and selling expense | | | | | | | $ | 648,391 | | | $ | 574,041 | | | $ | 713,863 | | |
| % of revenue | | | | | | | 25.0 | % | | 23.1 | % | | 25.9 | % | |
| General and administrative expense (1) | | | | | | | $ | 195,652 | | | $ | 183,054 | | | $ | 162,652 | | |
| % of revenue | | | | | | | 7.5 | % | | 7.4 | % | | 5.9 | % | |
| Amortization of acquired intangible assets (2) | | | | | | | $ | 53,818 | | | $ | 51,786 | | | $ | 53,256 | | |
| % of revenue | | | | | | | 2.1 | % | | 2.1 | % | | 1.9 | % | |
| Restructuring expense (3) | | | | | | | $ | 1,641 | | | $ | 13,543 | | | $ | 12,054 | | |
| % of revenue | | | | | | | 0.1 | % | | 0.5 | % | | 0.4 | % | |
| Impairment of Goodwill (2) | | | | | | | $ | — | | | $ | 100,842 | | | $ | 7,503 | | |
| % of revenue | | | | | | | — | % | | 4.1 | % | | 0.3 | % | |
|
| | | | | | | | | | | |
In thousands | Year Ended June 30, |
| | 2018 | | 2017 | | 2016 |
| Technology and development expense | $ | 245,758 |
| | $ | 243,230 |
| | $ | 210,080 |
|
| % of revenue | 9.5 | % | | 11.4 | % | | 11.7 | % |
| Marketing and selling expense | $ | 714,654 |
| | $ | 610,932 |
| | $ | 508,502 |
|
| % of revenue | 27.6 | % | | 28.6 | % | | 28.3 | % |
| General and administrative expense | $ | 176,958 |
| | $ | 207,569 |
| | $ | 145,844 |
|
| % of revenue | 6.8 | % | | 9.7 | % | | 8.2 | % |
| Amortization of acquired intangible assets | $ | 49,881 |
| | $ | 46,145 |
| | $ | 40,563 |
|
| % of revenue | 1.9 | % | | 2.2 | % | | 2.3 | % |
| Restructuring expense | $ | 15,236 |
| | $ | 26,700 |
| | $ | 381 |
|
| % of revenue | 0.6 | % | | 1.3 | % | | — | % |
| (Gain) on sale of subsidiaries | $ | (47,545 | ) | | $ | — |
| | $ | — |
|
| % of revenue | (1.8 | )% | | — | % | | — | % |
| Impairment of goodwill and acquired intangible assets | $ | — |
| | $ | 9,556 |
| | $ | 30,841 |
|
| % of revenue | — | % | | 0.4 | % | | 1.7 | % |
(1) General and administrative expense for the year ended June 30, 2021 includes lease impairment and abandonment charges for two leased locations totaling $19.9 million. Refer to Note 16 for additional details.
(2) Refer to Note 8 in our accompanying consolidated financial statements for additional details related to the amortization of acquired intangibles and goodwill impairment charges.
(3) Refer to Note 18 in our accompanying consolidated financial statements for additional details relating to restructuring expense.
Technology and development expense
Technology and development expense consists primarily of payroll and related expenses for employees engaged in software and manufacturing engineering, information technology operations and content development, as well as amortization of capitalized software and website development costs, including hosting of our websites, asset depreciation, patent amortization, legal settlements in connection with patent-related claims, and other technology infrastructure-related costs. Depreciation expense for information technology equipment that directly supports the delivery of our digital marketing services products is included in cost of revenue.
During the year ended June 30, 2018, technology
Technology and development expenses increaseddecreased by $2.5 million as compared to the prior year, primarily due to our fiscal year 2017 acquisition of National Pen, which resulted in $7.3 million of additional expense in fiscal 2018 due to the timing of the acquisition in fiscal 2017. We also recognized additional costs related to technology enhancements intended to enable rapid product introduction and improved connection points to the mass customization platform, as well as increased depreciation expense related to past investments in infrastructure-related assets. These increases were partially offset by a decrease in costs of $9.4 million, resulting from the divestiture of our Albumprinter business on August 31, 2017, as well as cost savings realized as a result of our recent restructuring initiatives.
The growth in our technology and development expenses of $33.2$0.2 million for the year ended June 30, 20172021, as compared to the prior comparative period was primarily due to increased headcount-related expensesperiod. Both periods benefited from decreases in costs from our technology development and information technology support organizations of $15.8 million. The increase in headcount supported the continued developmentfiscal year 2020 reorganization of our software-based mass customization platformcentral and Vistaprint technology teams as well as investments to enhance capabilitiesreductions in discretionary spend including travel and address each of our businesses' specific needs. This increase wastraining expenses. These decreases were partially offset by headcount reductions as a resultincreased investments during the second half of the third quarter fiscal 2017 restructuring initiative. All employee severance related charges were reflected separately in restructuring expense. Additionally, the acquisition of National Pen resulted in increased technology and development expenses of $5.9 million for the year ended June 30, 2017, without costs2021, primarily in the prior comparable period. Other increases inVistaprint business and our central technology and development expense
included technology infrastructure-related costs, primarily due to increased IT cloud service costs, as well as software maintenance and licensing costs.group.
Marketing and selling expense
Marketing and selling expense consists primarily of advertising and promotional costs; payroll and related expenses for our employees engaged in marketing, sales, customer support and public relations activities; direct-mail advertising costs; and third-party payment processing fees. Our Vistaprint, and National Pen and BuildASign businesses have higher marketing and selling costs as a percentage of revenue as compared to our UploadPrintBrothers and The Print businesses.Group businesses due to differences in the customers that they serve.
OurFor the year ended June 30, 2021, marketing and selling expenses increased by $103.7$74.4 million, during the year ended June 30, 2018 as compared to the prior year. We recognized an additional $84.3 million of costs for our National Pen business,The increase from the prior comparative period is primarily due to the timingincrease of the acquisitionadvertising and marketing spend in fiscal 2017. For the year ended June 30, 2018,our Vistaprint business of $75.1 million. The increase was driven by new investments in brand sponsorships and upper-funnel advertising, expenses for the remaining businesses increased by $35.1 million primarily as a resultexpansion of additionalour required return thresholds on our advertising spend, as well as investment in hiring new talent, including for user experience and data and analytics roles that should help us continue to improve the Vistaprint businesseffectiveness of our marketing, merchandising, and customer care activities. The increase was also due to support continued growth.negative impacts from fluctuations in currency exchange rates. These increases were partially offset by a decrease in marketing costs in our National Pen business of $21.7$9.2 million, primarily due to the sale of our Albumprinter business on August 31, 2017. In addition, internal marketingreductions to direct mail prospecting activities and customer service costs within the Vistaprint business decreased by $3.7 million as a result of realized cost savings from our recent restructuring initiatives.
Our marketing and selling expenses increased by $102.4 million during the year ended June 30, 2017 as comparedinitiatives to the prior comparative period, largely due to the addition of National Pen which incurred $47.9 million of marketing and selling expense for direct-mail advertising and telesalesreduce costs that were not in the prior comparable period. In addition, advertising expense increased by $31.8 million, which was primarily a result of additional advertising spend in the Vistaprint business. Other increases included payroll and employee-related costs, inclusive of share-based compensation, as we expanded our marketing, customer service and sales support organization through our recent acquisitions and continued investment in the Vistaprint business customer service resources in order to provide higher value services to our customers.centers.
General and administrative expense
General and administrative expense consists primarily of transaction costs, including third-party professional fees, insurance and payroll and related expenses of employees involved in executive management, finance, legal, strategy, human resources and procurement.
For the year ended June 30, 2018, general and administrative expenses decreased by $30.6 million primarily due to a decline in acquisition-related charges of $40.7 million, as compared to the prior year. The decrease in acquisition-related charges is due to significant expense in the prior comparable period for the WIRmachenDRUCK contingent earn-out arrangement, which was paid during fiscal 2018. We also recognized cost savings from our recent restructuring actions, which were partially offset by an additional $13.0 million of expense from our fiscal 2017 acquisition of National Pen as the prior year did not include a full year of results.
During the year ended June 30, 2017,2021, general and administrative expenses increased by $61.7$12.6 million, as compared to the prior comparative period, due to $19.9 million of lease-related impairment and abandonment charges driven by $37.3 million of incremental expense for the WIRmachenDRUCK earn-out duechanges in our office footprint at two leased locations. The changes to strong performance during fiscal 2017 and our expectation that a maximum payout would be achieved. Payroll, share-based compensation and facility-related costsleased facility footprint are expected to result in substantial cost savings in future periods. These increased by $12.0 million due to additional expense recognized for the acceleration of vesting terms of certain restricted share awards associated with our investment in Printi and acquisition of Tradeprint, as well as an increase in share-based compensation resulting from our new long-term incentive program. These increasesexpenses were partially offset by the decrease in compensation expense due to headcount reductionslower professional fees as a result of the third quarter fiscal 2017 restructuring initiative. Fiscal 2017 also included $12.4 million of expense for National Pen's partial year results.
Amortization of acquired intangible assets
Amortization of acquired intangible assets consists of amortization expense associated with separately identifiable intangible assets capitalized as part of our acquisitions, including customer relationships, trade names, developed technologies, print networks, and customer and referral networks.
Amortization of acquired intangible assets increased by $3.7 million during the year ended June 30, 2018, as compared to the prior comparable period, due to a full year of amortization expense for the December 30, 2016
acquisition of National Pen that was not included in our results for the entire prior comparable period. Amortization of acquired intangible assets increased by $5.6 million during the year ended June 30, 2017, as compared to the year ended June 30, 2016, due to amortization for our fiscal 2017 acquisition of National Pen and fiscal 2016 acquisition of WIRmachenDRUCK.
Restructuring expense
Restructuring expense consistsnon-recurrence of costs directly incurred as a result of restructuring initiatives, including employee-related termination costs, third party professional fees, facility exit costs and write-off of abandoned assets.
During the year ended June 30, 2018, we recognized restructuring expense of $15.2 million for employee-related termination benefits. The restructuring expense during the current period relates primarily to the reorganization ofstrategic projects in our Vistaprint business, that we announced in November 2017, which resulted in a reduction in headcount and other operating costs. Refer to Note 18in the accompanying consolidated financial statements for additional details regarding the reorganization.
The restructuring costs of $26.7 million recognized in the year ended June 30, 2017 were primarily related to our January 2017 restructuring initiative.
Gain on sale of subsidiaries
During the year ended June 30, 2018, we recognized a gain on the sale of our Albumprinter business of $47.5 million, net of transaction costs. The amount of our gain on the sale of Albumprinter was impacted by the partial allocation of goodwill to our Vistaprint business in past periods, as well as minimal carrying value of Albumprinter's acquired intangible assets at the time of the sale, as well as currency impacts. ReferCimpress cross-border merger to Note 7Ireland in the accompanying consolidated financial statements for additional details.
Impairment of goodwill and acquired intangible assets
There were no impairment charges relatedfiscal year 2020. We also realized lower discretionary spend due to goodwill or acquired intangible assets during the year ended June 30, 2018. For the years ended June 30, 2017 and 2016, we recognized an impairment charge of $9.6 million for our Tradeprint reporting unit and $30.8 million for our Exagroup reporting unit, respectively. These impairments were a result of their under performance during the impairment period, combined with lower cash flow outlooks when comparedcost control measures implemented in response to the initial deal model upon which we based our purchase accounting. Refer to Note 8 in the accompanying consolidated financial statements for additional information relating to the impairments.pandemic.
Other Consolidated Results
Other (expense) income, net
Other (expense) income, net generally consists of gains and losses from currency exchange rate fluctuations on transactions or balances denominated in currencies other than the functional currency of our subsidiaries, as well as the realized and unrealized gains and losses on some of our derivative instruments. In evaluating our currency hedging programprograms and ability to qualify for hedge accounting in light of our legal entity cash flows, we considered the benefits of hedge accounting relative to the additional economic cost of trade execution and administrative burden. Based on this analysis, we decided to execute certain currency derivative contracts that do not qualify for hedge accounting.
The following table summarizes the components of other (expense) income, net:
| | | | | | | | | | | | | | | | | | | | | |
In thousands | | | Year Ended June 30, |
| | | | | 2021 | | 2020 | | 2019 |
| (Losses) gains on derivatives not designated as hedging instruments | | | | | $ | (20,728) | | | $ | 20,564 | | | $ | 23,494 | |
| Currency-related gains, net | | | | | 8,523 | | | 2,309 | | | 2,506 | |
| Other gains | | | | | 370 | | | 1 | | | 476 | |
| Total other (expense) income, net | | | | | $ | (11,835) | | | $ | 22,874 | | | $ | 26,476 | |
|
| | | | | | | | | | | |
In thousands | Year Ended June 30, |
| | 2018 | | 2017 | | 2016 |
| (Losses) gains on derivatives not designated as hedging instruments | $ | (2,687 | ) | | $ | 936 |
| | $ | 14,026 |
|
| Currency-related (losses) gains, net | (19,500 | ) | | 5,577 |
| | 6,864 |
|
| Other gains | 1,155 |
| | 3,849 |
| | 5,208 |
|
| Total other (expense) income, net | $ | (21,032 | ) | | $ | 10,362 |
| | $ | 26,098 |
|
During the year ended June 30, 2018, we recognized a net loss of $21.0 million as compared to net gains during the prior comparable periods. The decrease in other (expense) income, net iswas primarily due to the currency exchange rate volatility impacting our derivatives that are not designated as hedging instruments.instruments, of which our Euro and British Pound contracts are the most significant exposures that we economically hedge. We also recognize the impact from de-designated interest swap contracts that are no longer highly effective, which resulted in unrealized losses during the current period. We expect volatility to continue in future periods, as we do not apply hedge accounting for most of our derivative currency contracts.
We also experienced currency-related losses due to currency exchange rate volatility on our non-functional currency intercompany relationships, which we may alter from time to time. The impact of certain cross-currency swap contracts designated as cash flow hedges is included in our currency-related (losses) gains, net, offsetting the impact of certain non-functional currency intercompany relationships.
In addition, during the years ended June 30, 2018 and 2016, we recognized other gains related to insurance recoveries. During fiscal year 2017, other gains were primarily related to the sale of marketable securities.
Interest expense, net
Interest expense, net primarily consists of interest paid on outstanding debt balances, amortization of debt issuance costs, debt discounts, interest related to capitalfinance lease obligations and realized gains (losses) on effective interest rate swap contracts and certain cross-currency swap contracts. As part of interest expense, net, we also recognize adjustments to our mandatorily redeemable noncontrolling interests, which reflects changes to the estimated future redemption value.
Interest expense, net was$53.0increased by $43.5 million $44.0 million, and $38.2 million forduring the yearsyear ended June 30, 2018, 20172021, as compared to the prior year. This is primarily due to the additional $200.0 million offering of our 7.0% Senior Notes due 2026 (the "2026 Notes") in February 2020 and 2016, respectively. Interestissuance of $300.0 million of our 12% Senior Secured Notes due 2025 (the "Second Lien Notes") in May 2020. During the fourth quarter of fiscal year 2021, we amended and restated our senior secured credit agreement that resulted in borrowings under a Term Loan B and the early redemption of our Second Lien Notes in addition to paying down our Term Loan A due 2024 and the remaining amounts under our previous revolver due 2024. We expect interest expense was higher thisto decrease during the next fiscal year relativedue to historical trends primarily as a result of higher interest rates.the refinancing. Refer to Note 10 for additional details.
Loss on extinguishment of debt
As part of the amendment and restatement of our senior secured credit agreement described above, we redeemed all of the $300.0 million of our Second Lien Notes, which also required the payment of an early redemption premium of $9.0 million. The loss on extinguishment of debt of $48.3 million included $39.4 million related to the early redemption of our Second Lien Notes. This loss consisted of the early redemption premium, write-off of unamortized financing fees of $8.1 million and an accretion adjustment of $22.3 million to increase the carrying value of the Second Lien Notes to the principal amount. The accretion adjustment is driven primarily by the previous allocation of proceeds to the warrants we issued in conjunction with the Second Lien notes, which reduced the carrying value of the Second Lien Notes. As of June 30, 2021 the warrants remain outstanding. In addition, we recognized a loss of $8.9 million for unamortized financing fees associated with the senior secured credit agreement. Refer to Note 10 for additional details.
Income tax expense
| | | | | | | | | | | | | | | | | | | | | |
In thousands | | | Year Ended June 30, |
| | | | | | 2021 | | 2020 | | 2019 |
| Income tax expense (benefit) | | | | | $ | 18,903 | | | $ | (80,992) | | | $ | 33,432 | |
| Effective tax rate | | | | | (33.7) | % | | (2,697.0) | % | | 26.3 | % |
Income tax expense (benefit) for the year ended June 30, 2021 increased as compared to the prior year primarily due to significant Swiss Tax Reform benefits of $113.5 million recognized in the accompanying consolidated financial statements for additional details regarding our debt arrangements.year ended June 30, 2020. Also, in addition to decreased pre-tax profits and a less favorable mix of earnings year over year, we recognized tax benefits of $2.1 million related to excess tax benefits from share based compensation, as compared to $15.7 million in fiscal year 2020. During the year ended June 30, 2018,2021 we recognized $2.2a tax benefit of $6.7 million of interest expense for adjustments to our Printi noncontrolling interest, which reflects an increase to the estimated future redemption value. We recognized no expense during the prior comparable periods.
Loss on early extinguishment of debt
During the fourth quarter of fiscal 2018, we redeemed allrelease of our senior notes due 2022 and satisfied the indenture governing those senior notes using funds from the senior notes due 2026 that we issued on June 15, 2018. Asvaluation allowance in India as a result of the redemption, we incurred a loss on the extinguishment of debt of $17.4 million, which included an early redemption premium for the senior notes due 2022 of $14.4 million and the write-off of unamortized debt issuance costs related to the redeemed notes of $3.0 million.
Income tax expense
|
| | | | | | | | | | | |
In thousands | Year Ended June 30, |
| | 2018 | | 2017 | | 2016 |
| Income tax expense (benefit) | $ | 19,578 |
| | $ | (7,118 | ) | | $ | 15,684 |
|
| Effective tax rate | 29.5 | % | | 9.0 | % | | 23.7 | % |
Income tax expense for the year ended June 30, 2018 was higher than the prior year primarily due to pre-tax income in the current period as compared to pre-tax losses in the prior period. In fiscal 2018, we adopted ASU 2016-16, "Income Taxes (Topic 740): Intra-Entity Transfers of Assets Other Than Inventory." If we had not adopted ASU 2016-16increased profitability. Additionally in fiscal year 2018, tax expense would have been lower by $8.4 million. Additionally,2020, we recognized tax benefits of $11.2 million for the re-measurement of U.S. tax losses that were carried back to tax years with higher U.S. federal tax rates under the US CARES Act and tax expense of $5.8$41.9 million related to U.S. tax reform in the year ended June 30, 2018, primarily due to the impact of the reduction in the federal tax rate onrecord a full valuation allowance against our U.S. deferred tax assets. We also recognizedassets and a reductionportion for our Irish deferred tax assets.The change in judgment to ourno longer recognize the deferred tax assets of $4.9 million related to expected changes to our U.S. state apportionment. These impacts were offsetwas driven by increased share based compensation tax benefits of $12.8 million as compared to $8.0 million in fiscal 2017.
A tax benefit was recognized for the year ended June 30, 2017 primarilydecreased profits due to pre-tax losses as compared to pre-tax income for the year ended June 30, 2016. Additionally, the effective tax rate was higher in fiscal 2016 as compared to fiscal 2017 due to a large nondeductible goodwill impairment charge in fiscal 2016.
On December 22, 2017, H.R. 1, originally known as the Tax Cuts and Jobs Act, ("The Act") was signed into
law, resulting in significant changes to U.S. federal tax law for corporations. Among these changes is the immediate reduction in the federal statutory tax rate from 35% to 21%. As discussed in Note 13 in our accompanying consolidated financial statements, the impact of The Act was unfavorable to our fiscal 2018 tax provision mainly due to a one-time reduction to our existing U.S. deferred tax assets. The reduction in our net deferred tax assets reduces the future cash tax benefit on existing timing differences asimpacts of the date of enactment; however, we will also benefit from a reduced tax rate that will apply to future taxable earnings. Overall, we expect our future U.S. cash taxes to be lower based solely on the reduction in the U.S. federal tax rate to 21%. For context, going forward we expect the annualized impact of the U.S. federal tax rate reduction alone on our cash taxes (excluding the impact of other tax reform items) to be approximately $2 million. Our tax balances were adjusted for the year ended June 30, 2018 based upon our interpretation of The Act, although the final impact on our tax balances may change due to the issuance of additional guidance, changes in our interpretation of The Act, changes in assumptions,COVID-19 pandemic and actions we may take as a result of The Act. We will continue to review and assess the potential impact of any new information on our financial statement positions.goodwill impairments.
We expect certain other aspects of the The Act will impact Cimpress beyond fiscal 2018, including the beneficial impact of immediate expensing of certain qualified capital expenditures in the U.S., unfavorable changes to, and limitations on, the deductibility of meals and entertainment expense, limitations on the deductibility of interest expense, and unfavorable changes to the deductibility of executive compensation. Most notably, we expect changes in the deductibility of “performance based” executive compensation to impact Cimpress negatively in the longer term. Historically, certain compensation awards issued to our top executives, such as stock options, were considered "performance based" as defined under Section 162(m) of the Internal Revenue Code and, therefore, were not subject to the annual $1 million deduction limitation per individual, as defined under prior law. The new law eliminates the "performance-based" exception for these types of awards to the extent they are not "grandfathered" in and granted under a written binding agreement in effect on November 2, 2017. Prior to this change, Cimpress had not been limited on the deductibility of “performance based” awards, which resulted in sizable cash and GAAP tax benefits in past years. We believe that most of the share-based compensation awards to date meet the "grandfather" requirement and will not be subject to the annual $1 million deduction limitation. However, future equity awards to our named executive officers may no longer be fully deductible upon vest or exercise over the long term. This will negatively impact our GAAP and cash taxes in the year of vest or exercise. As an example, performance share units (PSUs) granted to named executive officers under our current PSU plan that are subject to this limitation will vest no earlier than fiscal 2024 and may be subject to limited deductibility for U.S. tax purposes in that year.
Our cash paid for income taxes for fiscal 2018 and 2017 was higher than our income tax expense primarily as a result of non-cash tax benefits recognized in our income tax expense relating to timing differences for which the cash benefit is expected to occur in a future period.
We believe that our income tax reserves are adequately maintained by taking into consideration both the technical merits of our tax return positions and ongoing developments in our income tax audits. However, the final determination of our tax return positions, if audited, is uncertain and therefore there is a possibility that final resolution of these matters could have a material impact on our results of operations or cash flows. SeeRefer to Note 13 in our accompanying consolidated financial statements for additional discussion.
Reportable Segment Results
Our segment financial performance is measured based on segment profit (loss)EBITDA, which excludesis defined as operating income plus depreciation and amortization; plus proceeds from insurance; plus share-based compensation expense related to investment consideration; plus earn-out related charges; plus certain non-operational items including acquisition-related expenses, certain impairments andimpairments; plus restructuring charges.related charges; less gain on purchase or sale of subsidiaries.
| | In thousands | Year Ended June 30, | | | | | In thousands | | Year Ended June 30, | |
| | 2018 | | 2017 | | 2016 | | 2018 vs. 2017 | | 2017 vs. 2016 | | | 2021 | | 2020 | | 2019 | | 2021 vs. 2020 | | 2020 vs. 2019 |
| Reported Revenue | $ | 1,462,686 |
|
| $ | 1,310,975 |
| | $ | 1,220,751 |
| | 12% | | 7% | Reported Revenue | | $ | 1,444,807 | | | $ | 1,337,291 | | | $ | 1,508,322 | | | 8% | | (11)% |
| Segment Profit | 241,479 |
|
| 167,687 |
| | 214,947 |
| | 44% | | (22)% | |
| Segment EBITDA | | Segment EBITDA | | 324,715 | | | 366,334 | | | 349,697 | | | (11)% | | 5% |
| % of revenue | 17 | % | | 13 | % | | 18 | % | | % of revenue | | 22 | % | | 27 | % | | 23 | % | |
Segment Revenue
Vistaprint's reported revenue growth for the year ended June 30, 20182021 was positively affected by a currency impactsimpact of 3%, resulting. When excluding the benefit from the recent acquisition of 99designs, Vistaprint's organic constant-currency revenue growth was 1%. Vistaprint's revenue continued to be influenced by the severity of pandemic-related restrictions. Our per-customer economics continued to improve, though our new and repeat customer count remain impacted by the pandemic. Revenue grew significantly year over year during the months of March through June 2021 as restrictions loosened in constant-currency growthsome markets and we lapped the earliest periods impacted by the pandemic in fiscal year 2020. Prior to March 2021, our revenue declined year over year because the prior-year comparable periods were not affected by the pandemic. Revenue during the current year benefited from the sale of 9%. The Vistaprint constant-currency growthpandemic-related products such as masks, but we do not expect to have significant revenue from these products in fiscal year 2022.
Segment Profitability
For the year ended June 30, 2021, the declinein segment EBITDA was due to continuedthe pandemic impacts on revenue, as well as increased organic growth investments. As our confidence in repeat customer bookingsthe recovery improved we expanded payback thresholds for performance based advertising and layered on upper-funnel advertising investment. We also increased investment in hiring particularly in the second half of the fiscal year as we increase our capabilities to deliver against our mission of establishing Vistaprint as the expert marketing and design partner for small businesses. These were partially offset by technology savings from our fiscal year 2020 restructuring, reduced spend for consulting projects compared to the prior year period, and year-over-year reductions in office-related costs as we reduced our office footprint in our move to a remote-first work approach. Vistaprint's segment EBITDA was positively impacted by strategic initiatives, including new productcurrency movements during the current year. During each of the current and service introductions.prior fiscal year, we received government incentives of more than $9.0 million to offset wages in locations where demand decreased materially but roles were maintained. We expect these government incentives to decrease in fiscal year 2022 if the effects of the pandemic continue to be less significant.
PrintBrothers
| | | | | | | | | | | | | | | | | | | | | | | | | | | | | | | | | | | |
In thousands | | | | | Year Ended June 30, | | | | |
| | | | | | | | 2021 | | 2020 | | 2019 | | 2021 vs. 2020 | | 2020 vs. 2019 |
| Reported Revenue | | | | | | | $ | 421,766 | | | $ | 417,921 | | | $ | 443,987 | | | 1% | | (6)% |
| Segment EBITDA | | | | | | | 43,144 | | | 39,373 | | | 43,474 | | | 10% | | (9)% |
| % of revenue | | | | | | | 10 | % | | 9 | % | | 10 | % | | | | |
Segment Revenue
PrintBrothers' reported revenue growth for the year ended June 30, 20172021 was positively affected by a currency impact of 7% was negatively affected by currency impacts of 2%, resulting in a constant-currency growthrevenue decline of 9%6%. The Vistaprint constant-currency growthrevenue decline was due to growthpandemic-related decreases in both repeat customersdemand. Throughout the year, segment revenue was strongly influenced by the changing severity of restrictions in most European countries. The negative impacts of the pandemic were partially offset by a continued focus on new product introduction. Revenue grew significantly year over year during the fourth quarter of fiscal year 2021 as restrictions loosened in some markets and new customer bookings. Performance continued to be strongerwe lapped the earliest periods impacted by the pandemic in the North America and Australian markets with improving results in certain European markets. In addition, some of our customer value proposition efforts, including our continued roll-out of shipping price reductions, created revenue headwinds in certain markets, including France, Germany, the Netherlands, United Kingdom and the United States, but we expect these investments will attract higher-value customers and improve customer loyalty in future periods.fiscal year 2020.
Segment Profitability
Vistaprint'sThe increase in PrintBrothers' segment EBITDA during the year ended June 30, 2021, as compared to the prior period, was driven by variable and discretionary cost controls, production efficiencies and positive impacts from currency movements, which more than offset the decrease in gross profit increasedthat was driven by the constant-currency revenue decline described above.
The Print Group
| | | | | | | | | | | | | | | | | | | | | | | | | | | | | | | | | | | |
In thousands | | | | | Year Ended June 30, | | | | |
| | | | | | | | 2021 | | 2020 | | 2019 | | 2021 vs. 2020 | | 2020 vs. 2019 |
| Reported Revenue | | | | | | | $ | 275,534 | | | $ | 275,214 | | | $ | 325,872 | | | —% | | (16)% |
| Segment EBITDA | | | | | | | 43,126 | | | 51,606 | | | 63,997 | | | (16)% | | (19)% |
| % of revenue | | | | | | | 16 | % | | 19 | % | | 20 | % | | | | |
Segment Revenue
The Print Group's reported revenue for the year ended June 30, 2018 as compared to the prior period, driven primarily by operating expense savings as a result of recent reorganization initiatives and incremental profit from revenue growth. In the current period, Vistaprint's segment profit was positively impacted by currency movements. Our investments in new products and services positively impacted revenue but have had a more limited benefit to segment profit as we continue to scale and optimize these new offerings.
Vistaprint's segment profit decreased for the year ended June 30, 2017 as compared to the prior period, primarily due to the roll-out of planned investments including shipping price reductions, expanded design services and new product production that had negatively impacted gross profit. While these investments reduced profitability in fiscal 2017, we expect these investments will attract higher-value customers and improve customer loyalty in future periods. The increases in planned investments were partially offset by operating expense efficiencies and incremental profits from revenue growth.
|
| | | | | | | | | | | | | | | |
In thousands | Year Ended June 30, | | | | |
| | 2018 | | 2017 | | 2016 | | 2018 vs. 2017 | | 2017 vs. 2016 |
| Reported Revenue | $ | 730,010 |
| | $ | 588,613 |
| | $ | 432,638 |
| | 24% | | 36% |
| Segment Profit | 79,310 |
| | 63,189 |
| | 58,207 |
| | 26% | | 9% |
| % of revenue | 11 | % | | 11 | % |
| 13 | % | | | | |
Segment Revenue
Upload and Print's reported revenue growth for the year ended June 30, 20182021 was positively affected by a currency impactsimpact of 11%7%, resulting in a decrease in revenue on a constant-currency growthbasis of 13%. During fiscal 2018, we owned all7% due to pandemic-related decreases in demand. Despite these pressures, our businesses have found pockets of our Uploadstrength in demand and Print businessespivoted quickly over the last year to deliver quality offerings to help fill in some of the reduced demand in other areas, including the launch of new products for the full comparable period, so all businesses are included in the constant-currency growth rate. The Upload and Print constant-currency revenue growth was primarily driven by continued growth from our Exagroup, Pixartprinting, Printdeal and WIRmachenDRUCKother Cimpress businesses. During the fourth quarter of fiscal 2018,2021, revenue grew significantly year over year as restrictions loosened in some of our businesses experienced increased price-focused competition in certain markets and products. We believe that we are well positioned for long-term successlapped the earliest periods impacted by the pandemic in the European market and that our geographic diversity, profitability and scale would enable us to reduce pricesfiscal year 2020.
Segment Profitability
The decrease in the near term, if and when appropriate, to address any price-focused competition. Any such price reductions could create fluctuations in growth and, sometimes, profit; however we believe we remain poised to outperform and outlast these competitors in the long term.
Upload and Print's reported revenue growth forPrint Group's segment EBITDA during the year ended June 30, 2017 of 36% was primarily due to the addition of revenue from our fiscal 2016 acquisition of WIRmachenDRUCK. The reported revenue growth was negatively impacted by currency impacts of 3%. The segment's constant-currency revenue growth excluding revenue from businesses acquired in fiscal 2017 was 13%, primarily driven by continued growth from our Pixartprinting, Printdeal and Exagroup businesses. Our growth in constant currency revenue excluding recent acquisitions moderated2021, as we passed the acquisition anniversary of some of the slower-growing acquisitions, and we also saw moderation in the growth rates of businesses acquired during prior years.
Segment Profitability
Upload and Print's segment profit for the year ended June 30, 2018 increased compared to the prior year, was primarily due to incremental gross profits driven by the revenue growthdecline described aboveabove. This was partially offset by discretionary cost controls and operating expense efficiencies in several businesses. Segment profit was also influenced by lower investments due in part to prior year investments related to certain technology enhancements and improved connection points to theefficiency gains from leveraging our mass customization platform. Upload andplatform to shift production to lower-cost sources. The Print Group's segment profitEBITDA was positively impacted by currency movements.
Upload and Print segment profitability for the year ended June 30, 2017 increasedmovements as compared to the prior year primarily due our acquisition of WIRmachenDRUCK, which did not have a full comparable fiscal year in 2016. This increase was partially offset by a decline in the profitability of our Tradeprint business, as well as continued investments in oversight, technology and marketing.year.
| | | In thousands | Year Ended June 30, | | | | | In thousands | | Year Ended June 30, | |
| | 2018 |
| 2017 |
| 2016 | | 2018 vs. 2017 | | 2017 vs. 2016 | | | 2021 | | 2020 | | 2019 | | 2021 vs. 2020 | | 2020 vs. 2019 |
| Reported Revenue | $ | 333,266 |
| | $ | 112,712 |
| | n/a | | 196% | | n/a | Reported Revenue | | $ | 313,528 | | | $ | 299,474 | | | $ | 348,409 | | | 5% | | (14)% |
| Segment Profit (Loss) | 22,165 |
| | (2,225 | ) | | n/a | | 1,096% | | n/a | |
| Segment EBITDA | | Segment EBITDA | | 11,644 | | | 7,605 | | | 17,299 | | | 53% | | (56)% |
| % of revenue | 7 | % | | (2 | )% | | n/a | | % of revenue | | 4 | % | | 3 | % | | 5 | % | |
Segment Segment Revenue
National Pen's reported revenue growth for the year ended June 30, 20182021 was positively affected by a currency impactsimpact of 6%3%, resulting in a constant-currency revenue growth of 190%2%. Fiscal 2017 included only a partial year of National Pen results due to the timing of the acquisition. The constant-currency revenue growth, excluding the impacts of quarters with no comparable results, was 25% and driven by increases across channels and geographies, as we have seen improved marketing performance, increased marketing and prospecting activities, and increasedProduct sales to other Cimpress businesses. We expect revenue growthbusinesses continued to supplement some of the lost volume from lower demand, but to a lesser extent during the second half of the fiscal year as the demand for face masks has declined. Revenue during the fourth quarter of fiscal year 2021 grew significantly year over year as we lapped the earliest periods impacted by the pandemic in future periods will moderate from the recent high-growth trend, which was influenced by easier comparisons versus the year-ago period during which National Pen had reduced marketing investments and therefore had lower revenue.
For thefiscal year ended June 30, 2017, our reported revenue was $112.7 million. As we acquired National Pen on December 30, 2016, there are no comparative operating results presented for fiscal 2016.2020, while also experiencing improving trends in customer demand as restrictions loosened in some markets.
Segment Profitability
Segment profit increased $24.4 millionThe increase in National Pen's segment EBITDA for the year ended June 30, 2018 as fiscal 2017 included only a partial period of results,2021 was due in part to the revenue increase described above, as well as reduced variable cost, advertising and other discretionary spend. Segment EBITDA increased for the revenue growth described abovefiscal year ended June 30, 2021 as a result of a focused effort to improve efficiency across multiple areas, including telesales and cost savings from post-acquisition synergies. These increases werecustomer service. The improved profit was partially offset by increased customer prospecting activities, as well as planned technology investments. Duea negative impact of $8.2 million of losses and reserves due to our adoptionshifts in demand for masks and other PPE products, which led to us selling disposable masks at a loss and to record an inventory reserve to reduce the carrying value of the new revenue standard on July 1, 2018, we will no longer capitalize and amortize direct-response advertising costs, which is expected to create volatility in our profitability results as costs will be expensed earlier, as incurred.
Forcertain PPE products. National Pen's segment EBITDA was positively impacted by currency movements for the year ended June 30, 2017, our adjusted net operating loss was $2.2 million. As we acquired National Pen on December 30, 2016, there are no comparative operating results presented for fiscal 2016.2021.
| | In thousands | Year Ended June 30, | | | | | In thousands | | Year Ended June 30, | |
| | 2018 | | 2017 | | 2016 | | 2018 vs. 2017 | | 2017 vs. 2016 | | | 2021 | | 2020 | | 2019 | | 2021 vs. 2020 | | 2020 vs. 2019 |
| Reported Revenue | $ | 87,583 |
| | $ | 128,795 |
| | $ | 138,244 |
| | (32)% | | (7)% | |
| Segment Loss | (34,620 | ) | | (31,307 | ) | | (9,328 | ) | | (11)% | | (236)% | |
| Reported Revenue (1) | | Reported Revenue (1) | | $ | 192,038 | | | $ | 173,789 | | | $ | 136,202 | | | 11% | | 28% |
| Segment EBITDA (1) | | Segment EBITDA (1) | | 31,707 | | | 17,474 | | | (6,317) | | | 81% | | 377% |
| % of revenue | (40 | )% | | (24 | )% |
| (7 | )% | | % of revenue | | 17 | % | | 10 | % | | (5) | % | |
___________________
(1) Our All Other Businesses segment includes the results of our VIDA acquisition from July 2, 2018 through the divestiture date of April 10, 2020.
This segment consists of multiple small, rapidly evolving early-stageBuildASign, which is a larger and profitable business, and smaller businesses bythrough which Cimpress is expanding to new markets. These businesses are subject to high degrees of risk and we expect that each of their business models will rapidly evolve in function of future trials and entrepreneurial pivoting. Therefore, in all of these
businesses wemarkets or new product categories, which continue to operate at a significanthave operating losslosses as previously described and as planned,planned.
Segment Revenue
All Other Businesses' constant-currency revenue excluding the impact of acquisitions increased by 12% during the year ended June 30, 2021. This was primarily driven by continued growth at BuildASign, whose home décor and we expectcertain applications for signage products continued to continuegenerate strong results. BuildASign's strong execution was aided by the business increasingly leveraging our mass customization platform to do so infulfill orders for other Cimpress businesses, avoid capacity constraints, drive new product introduction, and improve customer experience.
Segment Profitability
Each business within the next several years. Our All Other Businesses segment also includes Albumprinter results through the divestiture date of August 31, 2017.
Segment Revenue
The All Other Businesses segment revenue decline was caused by the divestiture of our Albumprinter business, which was completed on August 31, 2017. Constant-currency growth, excluding the impact of the Albumprinter business, was 40%improved its profitability for the year ended June 30, 20182021 as compared to the prior year, with the overall improvement primarily driven by continuedrevenue growth and manufacturing efficiency in BuildASign. Printi and YSD reduced losses through revenue growth and improved efficiency. Our divestiture of loss-making VIDA in the remainingfourth quarter of fiscal year 2020 also contributed to year-over-year profit improvements in fiscal year 2021.
Central and Corporate Costs
Central and corporate costs consist primarily of the team of software engineers that is building our mass customization platform; shared service organizations such as global procurement; technology services such as hosting and security; administrative costs of our Cimpress India offices where numerous Cimpress businesses inhave dedicated business-specific team members; and corporate functions including our Board of Directors, CEO, and the segment.team members necessary for managing corporate activities, such as treasury, tax, capital allocation, financial consolidation, internal audit and legal. These costs also include certain unallocated share-based compensation costs.
The All Other Businesses revenue decline forCentral and corporate costs decreasedby $5.0 million during the year ended June 30, 2017 was due to the termination of certain partner contracts in both our Vistaprint Corporate Solutions and Albumprinter businesses. These declines were partially offset by growth in Albumprinter's direct to consumer business and Vistaprint Corporate Solutions' new lines of business, as well as growth in our remaining businesses in the segment that continued to grow off a relatively small base.
Segment Profitability
The segment loss increased by $3.3 million for the year ended June 30, 2018,2021, as compared to the prior period, primarilyyear, due to our first quarter fiscal 2018 divestiture of our Albumprinter business,lower professional fees, share-based compensation expense and discretionary spend, including travel and training costs, as well as additional investments in our Vistaprint Corporate Solutions business. The increase to segment loss was offset by volume absorption and advertising spend efficiencies in the other businesses in this segment.
The increase in segment loss for the year ended June 30, 2017 as compared tosavings from the prior period is primarily due to the reduction in partner related profits of $17.8 million, as well as increased investment in eachyear reorganization of our businesses, partially offset by growth in the direct to consumer part of the Albumprinter business.central technology team.
Liquidity and Capital Resources
Consolidated Statements of Cash Flows Data:Data
| | | | | | | | | | | | | | | | | |
In thousands | Year Ended June 30, |
| | 2021 | | 2020 | | 2019 |
| Net cash provided by operating activities | $ | 265,221 | | | $ | 338,444 | | | $ | 331,095 | |
| Net cash used in investing activities | (354,316) | | | (66,864) | | | (420,166) | |
| Net cash provided by (used in) financing activities | 224,128 | | | (258,255) | | | 81,989 | |
|
| | | | | | | | | | | |
In thousands | Year Ended June 30, |
| | 2018 | | 2017 |
| 2016 |
| Net cash provided by operating activities | $ | 192,332 |
| | $ | 156,736 |
| | $ | 247,358 |
|
| Net cash used in investing activities | (10,594 | ) | | (301,789 | ) | | (265,538 | ) |
| Net cash (used in) provided by financing activities | (177,757 | ) | | 104,578 |
| | (5,338 | ) |
At June 30, 2018, we had $44.2 million of cash and cash equivalents and $839.4 million of debt, excluding debt issuance costs and debt discounts. We expect cash and cash equivalents and debt levels to fluctuate over time depending on our working capital needs, our organic investment levels, share repurchases and acquisition activity. The cash flows during the year ended June 30, 20182021 related primarily to the following items:
Cash inflows:
Net income of $46.8 million
•Adjustments for non-cash items of $168.2$285.3 million primarily related to positive adjustments for depreciation and amortization of $169.0$173.2 million, loss on early extinguishment of debt of $48.3 million, share-based compensation costs of $50.5$37.0 million, $19.9 million of lease-related long-lived asset impairments and unrealized currency-related losses of $3.9$10.0 million
•Proceeds from borrowings and the changeissuance of our contingent earn-out liabilityTerm Loan B of $1.8 million partially offset by negative adjustments for our gain on the sale of our Albumprinter business of $47.5 million and non-cash tax related items of $14.0 million
Proceeds from the sale of our Albumprinter business of $93.8$251.9 million, net of transactionborrowings and repayment of our senior secured revolver, term loan A, and Second Lien Notes and inclusive of debt issuance costs
Proceeds from the sale of a noncontrolling interest related due to our WIRmachenDRUCK businessMay 2021 refinancing; a portion of $35.4these proceeds have resulted in an increase to our cash and marketable securities balances
•Total net working capital impacts of $54.9 million
Proceeds from the issuance of ordinary shares from the exercise of share options of $12.0 million
Excluding the impact of the earn-out and restructuring payments described in the cash outflows section below, the changes in operating assets and liabilities were a source of cash during the period.cash. Inventory, accounts payable, and accrued expenses inflows were partially offset by accounts receivable and other asset outflows
Cash outflows:
Purchases•Net loss of $74.9 million
•Purchase of held to maturity securities of $203.6 million, driven by the additional liquidity provided by the May 2021 refinancing
•Internal and external costs of $60.9 million for software and website development that we have capitalized
•Purchase consideration for acquisitions of $53.4 million, net of cash acquired, which primarily relates to our ordinary sharesacquisition of $94.7 million99designs, excluding the deferred payment and post-closing adjustment that are payable February 15, 2022
•Capital expenditures of $60.9$38.5 million of which the majority of these assets were related to the purchase of manufacturing and automation equipment for our production facilities and computer and office equipment
•Payments for finance lease arrangements of acquisition-related earn-outs of $51.3$8.0 million primarily for our WIRmachenDRUCK acquisition. The portion of the earn-out payment contingent upon employment, as well as the contingent consideration payment in excess of acquisition date fair value, is $49.2 million and presented within operating activities. The remaining $2.1 million cash outflow representing the purchase consideration included in the acquisition date fair value is a financing activity.
Payments of debt and debt issuance costs of $54.4 million, net of proceeds
Internal costs for software and website development that we have capitalized of $40.8 million
Issuance of loans of $21.0 millionto two equity holders of our Printi business (refer to Note 15 in the accompanying consolidated financial statements for additional details)
Payments•Payment of withholding taxes in connection with share awards of $19.7$5.8 million
Payments for capital lease arrangements•Purchase of $17.6noncontrolling interest of $5.1 million and distribution to noncontrolling interest holders of $4.7 million
Payments related to our recent restructuring actions was $17.3 million
Payment of an early redemption premium of $14.4 million, related to the refinancing of our senior unsecured notes
Additional Liquidity and Capital Resources Information. At June 30, 2021, we had $183.0 million of cash and cash equivalents, $203.0 million of marketable securities and $1,764.9 million of debt, excluding debt issuance costs and debt premiums and discounts. During the year ended June 30, 2018,2021, we financed our operations and strategic investments through internally generated cash flows from operations and debt financing. We expect to finance our future operations through our cash, investments, operating cash flow and borrowings under our debt arrangements.
As of June 30, 2018,2021, a significant portion of our cash and cash equivalents were held by our subsidiaries, and undistributed earnings of our subsidiaries that are considered to be indefinitely reinvested were $29.4$43.4 million. We do not intend to repatriate these funds as the cash and cash equivalent balances are generally used and available, without legal restrictions, to fund ordinary business operations and investments of the respective subsidiaries. If there is a change in the future, the repatriation of undistributed earnings from certain subsidiaries, in the form of dividends or otherwise, could have tax consequences that could result in material cash outflows.
Debt.On As of June 15, 2018,30, 2021, we completed a debt offeringhave borrowings under our amended and restated senior secured credit agreement dated as of $400.0May 17, 2021 (the "Restated Credit Agreement") of $1,152.0 million in aggregate principal amount of 7.0% senior notes due 2026. We used a portionconsisting of the net proceedsTerm Loan B, which amortizes over the loan period, with a final maturity date of this offering to redeemMay 17, 2028. Our $250.0 million revolver under our Restated Credit Agreement has $244.4 million unused as of June 30, 2021. There are no drawn amounts on the $275.0 millionrevolver that would trigger financial maintenance covenants, but our outstanding letters of senior notes due 2022 and fund the satisfaction of the indenture governing those notes.credit reduce our unused balance. Our unused balance can be drawn at any time so long as we are in compliance with our debt covenants.
Debt Covenants. We used the remaining portionproceeds of the net proceedsTerm Loan B under the Restated Credit Agreement to repay indebtednessall outstanding borrowings under theour previous credit facility, to redeem our Second Lien Notes and fundto bring our primary source of liquidity onto our balance sheet in the paymentform of all related feescash, cash equivalents and expenses.marketable securities. The Restated Credit Agreement contains covenants that restrict or limit certain activities and transactions by Cimpress and our subsidiaries. Refer to Note 10 in theour accompanying consolidated financial statements for additional details.information.
In conjunction with the senior notes offering described above, we executed an amendment to our senior secured credit facility that expanded the total capacity from $1,045.0 million to $1,128.2 million. The amendment made changes to the senior secured credit agreement, including:
The aggregate revolving loan commitments under the agreement were increased from $745.0 million to $839.4 million. The capacity of term loans remained unchanged, of which $285.0 million remained outstanding as of June 30, 2018.
The amendment extended the maturity date of all loans under the agreement from July 13, 2022 to June 14, 2023.
The interest rate at which LIBOR borrowings bear interest was lowered from LIBOR plus 1.50% to 2.25% to LIBOR plus 1.375% to 2.0%, depending on our leverage ratio, which is the ratio of our consolidated total indebtedness to our consolidated trailing twelve-month EBITDA.
Our maximum leverage ratio under the agreement was increased from 4.50 to 4.75, and we may increase our leverage ratio to up to 5.00 (4.75 allowed before the amendment) for up to four consecutive fiscal quarters after certain corporate acquisitions as defined within the agreement.
The amendment decreased the maximum commitment fee paid on unused balances from 0.40% to 0.35%, depending upon our leverage ratio.
We expect to use our expanded credit facility to fund investments and working capital needs. Refer to Note 10 in the accompanying consolidated financial statements for additional details.
As of June 30, 2018, we had aggregate loan commitments from our senior secured credit facility totaling $1,124.4 million. The loan commitments consisted of revolving loans of $839.4 million and term loans of $285.0 million. We have other financial obligations that constitute additional indebtedness based on the definitions within the credit facility. As of June 30, 2018, the amount available for borrowing under our senior secured credit facility was as follows:
|
| | | |
| In thousands | June 30, 2018 |
| Maximum aggregate available for borrowing | $ | 1,124,422 |
|
| Outstanding borrowings of senior secured credit facilities | (432,414 | ) |
| Remaining amount | 692,008 |
|
| Limitations to borrowing due to debt covenants and other obligations (1) | (124,467 | ) |
| Amount available for borrowing as of June 30, 2018 (2) | $ | 567,541 |
|
_________________
(1) The debt covenants of our senior secured credit facility limit our borrowing capacity each quarter, depending on our leverage and other indebtedness, such as notes, capital leases, letters of credit, and any other debt, as well as other factors that are outlined in the credit agreement.
(2) Share purchases, dividend payments, and corporate acquisitions are subject to more restrictive covenants, and therefore we may not be able to use the full amount available for borrowing for these purposes.
Debt Covenants. Our credit agreement and senior unsecured notes indenture contain financial and other covenants as well as customary representations, warranties and events of default, which are detailed in Note 10 of the accompanying consolidated financial statements. As of June 30, 2018, we were in compliance with all financial and other covenants under the credit agreement and senior unsecured notes indenture.
Other debt. Debt.Other debt primarily consists of term loans acquired through our various acquisitions.acquisitions or used to fund certain capital investments. As of June 30, 20182021, we had$7.0 $12.8 million outstanding for other debt payable through September 2024.January 2026.
Our expectations for fiscal year 2019. We believe that our available cash, cash flows generated from operations, and cash available under our committed debt financing will be sufficient to satisfy our liabilities and planned investments to support our long-term growth strategy. We endeavor to invest large amounts of capital that we believe will generate returns that are above, or well above, our weighted average cost of capital. We consider any use of cash that we expect to require more than twelve months to return our invested capital to be an allocation of capital. For fiscal 2019, we expect to have opportunities to allocate capital to the following broad categories and consider our capital to be fungible across all of these categories:
Organic investments will continue to be made across a wide spectrum of activities. These range from large, discrete projects that we believe can provide us with materially important competitive capabilities and/or market positions over the longer term to smaller investments intended to maintain or improve our competitive position and support value-creating revenue growth.
Purchases of our ordinary shares
Corporate acquisitions and similar investments
Reduction of debt
Contractual Obligations
Contractual obligations at June 30, 20182021 are as follows:
|
| | | | | | | | | | | | | | | | | | | |
| In thousands | Payments Due by Period |
| | Total | | Less than 1 year | | 1-3 years | | 3-5 years | | More than 5 years |
| Operating leases, net of subleases | $ | 76,838 |
| | $ | 22,623 |
| | $ | 31,705 |
| | $ | 14,808 |
| | $ | 7,702 |
|
| Build-to-suit lease | 96,680 |
| | 12,569 |
| | 25,138 |
| | 23,357 |
| | 35,616 |
|
| Purchase commitments | 57,291 |
| | 29,161 |
|
| 28,130 |
| | — |
|
| — |
|
| Senior unsecured notes and interest payments | 624,000 |
| | 29,167 |
| | 56,000 |
| | 56,000 |
| | 482,833 |
|
| Other debt and interest payments | 550,068 |
| | 78,522 |
| | 101,724 |
| | 368,540 |
| | 1,282 |
|
| Capital leases | 27,596 |
| | 10,850 |
| | 11,563 |
| | 2,895 |
| | 2,288 |
|
| Other | 5,559 |
| | 2,761 |
| | 2,473 |
| | 325 |
| | — |
|
| Total (1) | $ | 1,438,032 |
| | $ | 185,653 |
| | $ | 256,733 |
| | $ | 465,925 |
| | $ | 529,721 |
|
___________________ | | | | | | | | | | | | | | | | | | | | | | | | | | | | | |
| In thousands | Payments Due by Period |
| Total | | Less
than 1
year | | 1-3
years | | 3-5
years | | More
than 5
years |
| Operating leases, net of subleases (1) | $ | 99,398 | | | $ | 28,407 | | | $ | 44,425 | | | $ | 19,667 | | | $ | 6,899 | |
| Purchase commitments | 245,149 | | | 137,963 | | | 81,062 | | | 26,124 | | | — | |
| Senior unsecured notes and interest payments | 810,000 | | | 42,000 | | | 84,000 | | | 684,000 | | | — | |
| Senior secured credit facility and interest payments (2) | 1,495,424 | | | 66,821 | | | 126,690 | | | 119,850 | | | 1,182,063 | |
| Other debt | 12,212 | | | 2,587 | | | 7,120 | | | 2,505 | | | — | |
| Finance leases, net of subleases (1) | 46,668 | | | 31,570 | | | 9,643 | | | 4,463 | | | 992 | |
| Other | 45,025 | | | 44,989 | | | 36 | | | — | | | — | |
| Total (3) | $ | 2,753,876 | | | $ | 354,337 | | | $ | 352,976 | | | $ | 856,609 | | | $ | 1,189,954 | |
___________________
(1) Operating and finance lease payments above include only amounts which are fixed under lease agreements. Our leases may also incur variable expenses which are not reflected in the contractual obligations above.
(2) Senior secured credit facility and interest payments include the effects of interest rate swaps, whether they are expected to be payments or receipts of cash.
(3) We may be required to make cash outlays related to our uncertain tax positions. However, due to the uncertainty of the timing of future cash flows associated with our uncertain tax positions, we are unable to make reasonably reliable estimates of the period of cash settlement, if any, with the respective taxing authorities. Accordingly, uncertain tax positions of$4.9 $9.2 millionas of June 30, 20182021 have been excluded from the contractual obligations table above. ForSee Note 13 in our accompanying consolidated financial statements for further information on uncertain tax positions, see Note 13to the accompanying consolidated financial statements.positions.
Operating Leases.Leases. We rent office space under operating leases expiring on various dates through 2026. Future minimum rental payments required under our leases are an aggregate of approximately$76.8 million.2034. The terms of certain lease agreements require security deposits in the form of bank guarantees and letters of credit in the amount of $2.6 million.
Build-to-suit lease. Represents the cash payments for our leased facility in Waltham, Massachusetts, USA. Please refer to Note 2$0.9 million in the accompanying consolidated financial statements for additional details.aggregate.
Purchase Commitments. At June 30, 2018,2021, we had unrecorded commitments under contract of$57.3 $245.1 million. Purchase commitments consisted of third-party web services of $21.0$95.5 million, software of $47.7 million, inventory and third-party fulfillment purchase commitments of $8.4$55.5 million, production and computer equipment purchasesadvertising of approximately $8.2$13.0 million, commitments for professional and consulting fees of $3.6$7.4 million, commitments for advertising campaignsproduction and computer equipment purchases of $2.2$14.7 million and other unrecorded purchase commitments of $14.0$11.2 million.
Senior unsecured notesUnsecured Notes and interest payments. Interest Payments. Our 7.0% senior unsecured notes due$600.0 million of 2026 Notes bear interest at a rate of 7.0% per annum and mature on June 15, 2026. Interest on the notes is payable semi-annually on June 15 and December 15 of each year and has been included in the table above.
Other debtSenior Secured Credit Facility and interest payments.Interest Payments. At June 30, 2018,2021, the term loansTerm Loan B of $285.0$1,152.0 million outstanding under our credit agreement haveRestated Credit Agreement had repayments due on various dates through June 14, 2023, with theMay 17, 2028, and we did not have any amounts drawn under our revolving loans outstanding of $147.4 millioncredit facility due on June 14, 2023.May 17, 2026. Interest payable included in this table is based on the interest rate as of June 30, 20182021, and assumes all LIBOR basedLIBOR-based revolving loan amounts outstanding will not be paid until maturity, but that the term loan amortization payments will be made according to our defined schedule and all Prime rate based revolving loan amounts will be paid within a year. Interest payable includes the estimated impact of our interest rate swap agreements. schedule.
Other Debt.In addition, we have other debt which consists primarily of debt assumed as part ofterm loans acquired through our various acquisitions or used to fund certain of our fiscal 2015 acquisitions,capital investments, and as of June 30, 20182021 we had$7.0 $12.8 million outstanding for those obligations that have repayments due on various dates through September 2024.January 2026.
Capital leases. Finance Leases.We lease certain machinery and plant equipment under capitalfinance lease agreements that expire at various dates through 2022.2034. The aggregate carrying value of the leased equipment under capitalfinance leases included in property, plant and equipment, net in our consolidated balance sheet at June 30, 2018,2021 is $31.0$35.4 million, net of accumulated depreciation of $36.7$37.9 million. The present value of lease installments not yet due included in other current liabilities and other liabilities in our consolidated balance sheet at June 30, 20182021 amounts to $27.6$50.8 million.
Other Obligations.Obligations. Other obligations include deferred payments related to previous acquisitions of $3.5$45.0 million in the aggregate. We also have an installment obligation of $2.1 millionThis balance includes the deferred payment related to the fiscal 2012 intra-entity transfer of the intellectual property of our subsidiary Webs, Inc., which resulted in tax being paid over a 7.5 year term and has been classified as a deferred tax liability99designs acquisition totaling $44.4 million. Refer to Note 7 in our accompanying consolidated balance sheet as of June 30, 2018.financial statements for additional details.
Additional Non-GAAP Financial Measures
Adjusted net operating profit (NOP)EBITDA and adjusted free cash flow presented below, and constant-currency revenue growth and constant-currency revenue growth excluding acquisitions/divestitures presented on page 7in the consolidated results of operations section above, are supplemental measures of our performance that are not required by, or presented in accordance with, GAAP. Adjusted NOPEBITDA is defined as GAAP operating income excluding certain items such as acquisition-relatedplus depreciation and amortization and depreciation,plus share-based compensation expense recognized forplus proceeds from insurance plus earn-out related charges including the change in fair value of contingent consideration and compensationplus certain impairments plus restructuring related charges plus realized gains or losses on currency derivatives less interest expense related to cash-based earn-out mechanisms dependent upon continued employment, share-based compensation related to investment consideration, certain impairment expense, restructuring charges, and theour Waltham, Massachusetts office lease less gain on purchase or sale of subsidiaries. The interest expense associated with our Waltham lease, as well as realized gains (losses) on currency forward contracts that do not qualify for hedge accounting, are included in Adjusted NOP.
Adjusted NOPEBITDA is the primary profitability metric by which we measure our consolidated financial performance and is provided to enhance investors' understanding of our current operating results from the underlying and ongoing business for the same reasons it is used by management. For example, as we have become more acquisitive over recent years we believe excluding the costs related to the purchase of a business (such as amortization of acquired intangible assets, contingent consideration, or impairment of goodwill) provides further insight into the performance of the underlying acquired business in addition to that provided by our GAAP operating income. As another example, as we do not apply hedge accounting for our currency forwardcertain derivative contracts, we believe inclusion of realized gains and losses on these contracts that are intended to be matched against operational currency fluctuations provides further insight into our operating performance in addition to that provided by our GAAP operating income. We do not, nor do we suggest that investors should, consider such non-GAAP financial measures in isolation from, or as a substitute for, financial information prepared in accordance with GAAP.
FreeAdjusted free cash flow is usedthe primary financial metric by management to assess the cash flow generation of the company. Freewhich we set quarterly and annual budgets both for individual businesses and Cimpress-wide. Adjusted free cash flow is defined as net cash provided by operating activities less purchases of property, plant and equipment, purchases of intangible assets not related to acquisitions, and capitalization of software and website development costs that are included in net cash used in investing activities, plus the payment of contingent consideration in excess of acquisition-date fair value and gains on proceeds from insurance that are included in net cash provided by operating activities, if any. The primary financialWe use this cash flow metric because we believe that this methodology can provide useful supplemental information to help investors better understand our ability to generate cash flow after considering certain investments required to maintain or grow our business, as well as eliminate the impact of certain cash flow items presented as operating cash flows that we do not believe reflect the cash flow generated by which we set quarterly and annual budgets both for individual businesses and Cimpress-wide is ourthe underlying business.
Our adjusted free cash flow priormeasure has limitations as it may omit certain components of the overall cash flow statement and does not represent the residual cash flow available for discretionary expenditures. For example, adjusted free cash flow does not incorporate our cash payments to reduce the principal portion of our debt or cash interest costs.payments for business acquisitions. Additionally, the mix of property, plant and equipment purchases that we choose to finance may change over time. We believe it is important to view our adjusted free cash flow measure only as a complement to our entire consolidated statement of cash flows.
The table below sets forth operating income and adjusted net operating profitEBITDA for the years ended June 30, 2018, 20172021, 2020 and 2016:2019:
|
| | | | | | | | | | | |
| In thousands | Year Ended June 30, |
| | 2018 | | 2017 | | 2016 |
| GAAP operating income (loss) | $ | 157,800 |
| | $ | (45,702 | ) | | $ | 78,193 |
|
| Exclude expense (benefit) impact of: | | |
|
| | |
| Acquisition-related amortization and depreciation | 50,149 |
| | 46,402 |
| | 40,834 |
|
| Earn-out related charges (1) | 2,391 |
| | 40,384 |
| | 6,378 |
|
| Share-based compensation related to investment consideration | 6,792 |
| | 9,638 |
| | 4,835 |
|
| Certain impairments (2) | — |
| | 9,556 |
| | 41,820 |
|
| Restructuring related charges | 15,236 |
| | 26,700 |
| | 381 |
|
| Less: Interest expense associated with Waltham, MA lease | (7,489 | ) | | (7,727 | ) | | (6,287 | ) |
| Less: Gains on the purchase or sale of subsidiaries (3) | (47,945 | ) | | — |
| | — |
|
| Include: Realized (losses) gains on certain currency derivatives not included in operating income (loss) | (11,445 | ) | | 16,474 |
| | 5,863 |
|
| Adjusted NOP | $ | 165,489 |
| | $ | 95,725 |
| | $ | 172,017 |
|
| | | | | | | | | | | | | | | | | | | | | |
| In thousands | | | Year Ended June 30, |
| | | | | 2021 | | 2020 | | 2019 |
| GAAP operating income | | | | | $ | 123,510 | | | $ | 55,969 | | | $ | 163,607 | |
| Exclude expense (benefit) impact of: | | | | | | | | | |
| Depreciation and amortization | | | | | 173,212 | | | 167,943 | | | 172,957 | |
| Waltham, MA lease depreciation adjustment (1) | | | | | — | | | — | | | (4,120) | |
| Proceeds from insurance | | | | | 122 | | | — | | | — | |
| Share-based compensation expense (2) | | | | | 37,034 | | | 33,252 | | | 18,296 | |
| Earn-out related charges | | | | | — | | | (54) | | | — | |
| Certain impairments and other adjustments (3) | | | | | 20,453 | | | 104,593 | | | 10,700 | |
| Restructuring-related charges | | | | | 1,641 | | | 13,543 | | | 12,054 | |
| Interest expense for Waltham, MA lease (1) | | | | | — | | | — | | | (7,236) | |
| | | | | | | | | |
| Realized (losses) gains on currency derivatives not included in operating (loss) income | | | | | (6,854) | | | 24,533 | | | 20,289 | |
| Adjusted EBITDA | | | | | $ | 349,118 | | | $ | 399,779 | | | $ | 386,547 | |
_________________
(1) IncludesUpon the adoption of the new leasing standard on July 1, 2019, our Waltham, MA lease, which was previously classified as build-to-suit, was classified as an operating lease. Therefore, the Waltham depreciation and interest expense adjustments that were made in fiscal year 2019 are no longer being made beginning in fiscal year 2020, as any impact from the Waltham lease is reflected in operating income.
(2) The adjustment for share-based compensation expense excludes the portion of share-based compensation expense included in restructuring related charges, if any, to avoid double counting.
(3) During the year ended June 30, 2021, we recognized impairment and abandonment charges of $19.9 million for the change in fair valuenature of contingent considerationuse for two of our leased locations. These impairment and compensation expense related to cash-based earn-out mechanisms dependent upon continued employment.
(2) Includes the impact of certain impairments of goodwill and other long-lived assets as defined by ASC 350 - "Intangibles - Goodwill and Other".
(3) Includes the impact of the gain on the sale of Albumprinter, as well as a bargain purchase gain as defined by ASC 805-30 - "Goodwill or Gain from Bargain Purchase" for an acquisition in which the identifiable assets acquired and liabilities assumedabandonment charges are greater than the consideration transferred, that was recognized inclassified within general and administrative expense in ourthe consolidated statement of operationsoperations. Refer to Note 16 in our accompanying financial statements for more information. We also recognized $0.6 million of loss for the routine disposal of fixed assets and impairment of capitalized software during the year ended June 30, 2018.2021.
The table below sets forth net cash provided by operating activities and adjusted free cash flow for the years ended June 30, 2018, 20172021, 2020 and 2016:2019:
|
| | | | | | | | | | | |
| In thousands | Year Ended June 30, |
| | 2018 | | 2017 | | 2016 |
| Net cash provided by operating activities | $ | 192,332 |
| | $ | 156,736 |
| | $ | 247,358 |
|
| Purchases of property, plant and equipment | (60,930 | ) | | (74,157 | ) | | (80,435 | ) |
| Purchases of intangible assets not related to acquisitions | (308 | ) | | (197 | ) | | (476 | ) |
| Capitalization of software and website development costs | (40,847 | ) | | (37,307 | ) | | (26,324 | ) |
| Payment of contingent consideration in excess of acquisition-date fair value (1) | 49,241 |
| | — |
| | 8,613 |
|
| Proceeds from insurance related to investing activities | — |
| | — |
| | 3,624 |
|
| Free cash flow | $ | 139,488 |
| | $ | 45,075 |
| | $ | 152,360 |
|
_________________
(1) Includes a portion of the earn-out payment that is presented within net cash provided by operating activities as part of the change in accrued expenses and other liabilities. This portion of the earn-out was deemed to be a compensation arrangement since it included an employment-related contingency. | | | | | | | | | | | | | | | | | | | | | |
| In thousands | | | Year Ended June 30, |
| | | | | 2021 | | 2020 | | 2019 |
| Net cash provided by operating activities | | | | | $ | 265,221 | | | $ | 338,444 | | | $ | 331,095 | |
| Purchases of property, plant and equipment | | | | | (38,524) | | | (50,467) | | | (70,563) | |
| Purchases of intangible assets not related to acquisitions | | | | | — | | | — | | | (64) | |
| Capitalization of software and website development costs | | | | | (60,937) | | | (43,992) | | | (48,652) | |
| | | | | | | | | |
| Adjusted free cash flow | | | | | $ | 165,760 | | | $ | 243,985 | | | $ | 211,816 | |
Critical Accounting Policies and Estimates
Our financial statements are prepared in accordance with U.S. generally accepted accounting principles (“GAAP”). To apply these principles, we must make estimates and judgments that affect our reported amounts of assets, liabilities, revenues and expenses, and related disclosure of contingent assets and liabilities. In some instances, we reasonably could have used different accounting estimates and, in other instances, changes in the accounting estimates are reasonably likely to occur from period to period. Accordingly, actual results could differ significantly from our estimates. We base our estimates and judgments on historical experience and other assumptions that we believe to be reasonable at the time under the circumstances, and we evaluate these estimates and judgments on an ongoing basis. We refer to accounting estimates and judgments of this type as critical accounting policies and estimates, which we discuss further below. This section should be read in
conjunction with Note 2, "Summary of Significant Accounting Policies," of our audited consolidated financial statements included elsewhere in this Report.
Revenue Recognition. Our businessesRecognition. We generate revenue primarily from the sale and shippingshipment of customized manufactured products, as well as providingproducts. To a much lesser extent (and only in our Vistaprint business) we provide digital services, website design and hosting, and email marketing services, andas well as a small percentage from order referral fees. We recognize revenue arising from salesfees and other third-party offerings. Revenues are recognized when control of the promised products andor services netis
transferred to the customer in an amount that reflects the consideration we expect to be entitled to in exchange for those products or services.
Under the terms of discounts and applicable indirect taxes, when it is realized or realizable and earned. We consider revenue realized or realizable and earned when there is persuasive evidencemost of an arrangement, a product has been shipped or service rendered with no significant post-delivery obligation on our part, the net sales price is fixed or determinable and collection is reasonably assured. For arrangements with multiple deliverables,our customers we allocate revenue to each deliverable based onprovide satisfaction guarantees, which give our customers an option for a refund or reprint over a specified period of time if the relative selling price for each deliverable. We determine the relative selling price usingcustomer is not fully satisfied. As such, we record a hierarchy of (1) company specific objective and reliable evidence, then (2) third-party evidence, then (3) best estimate of selling price. Shipping, handling and processing charges billed to customers are included in revenue at the time of shipment or rendering of service. Revenues from sales of prepaid orders on our websites are deferred until shipment of fulfilled orders or until the prepaid service has been rendered.
A reserve for estimated sales returns and allowances is recorded as a reduction of revenue, based on historical experience or the specific identification of an event necessitating a reserve. This reserve is dependent upon customer return practices and will vary during the year due to volume or specific reserve requirements. SalesActual sales returns have historically not historically been significantsignificant.
We have elected to recognize shipping and handling activities that occur after transfer of control of the products as fulfillment activities and not as a separate performance obligation. Accordingly, we recognize revenue for our single performance obligation upon the transfer of control of the fulfilled orders, which generally occurs upon delivery to the shipping carrier. If revenue is recognized prior to completion of the shipping and handling activities, we accrue the costs of those activities. We do have some arrangements whereby the transfer of control, and thus revenue recognition, occurs upon delivery to the customer. If multiple products are ordered together, each product is considered a separate performance obligation, and the transaction price is allocated to each performance obligation based on the standalone selling price. Revenue is recognized upon satisfaction of each performance obligation. We generally determine the standalone selling prices based on the prices charged to our netcustomers.
Our products are customized for each individual customer with no alternative use except to be delivered to that specific customer; however, we do not have an enforceable right to payment prior to delivering the items to the customer based on the terms and conditions of our arrangements with customers and therefore we recognize revenue at a point in time.
We record deferred revenue when cash payments are received in advance of our satisfaction of the related performance obligation. The satisfaction of performance obligations generally occur shortly after cash payment and we expect to recognize our deferred revenue balance as revenue within three months subsequent to June 30, 2021.
We periodically provide marketing materials and promotional offers to new customers and existing customers that are intended to improve customer retention. These incentive offers are generally available to all customers and, therefore, do not represent a performance obligation as customers are not required to enter into a contractual commitment to receive the offer. These discounts are recognized as a reduction to the transaction price when used by the customer. Costs related to free products are included within cost of revenue and sample products are included within marketing and selling expense.
We have beenelected to apply the practical expedient under ASC 340-40-25-4 to expense incremental direct costs as incurred, which primarily includes sales commissions, since our contract periods generally are less than one year and the related performance obligations are satisfied within our estimates.a short period of time.
Share-Based Compensation.Compensation. We measure share-based compensation costs at fair value, and recognize the expense over the period that the recipient is required to provide service in exchange for the award, which generally is the vesting period. We recognize the impact of forfeitures as they occur.
We primarily issue performance share units, or PSUs, which are estimated at fair value on the date of grant, which is fixed throughout the vesting period. The fair value is determined using a Monte Carlo simulation valuation model. As the PSUs include both a service and market condition the related expense is recognized using the accelerated expense attribution method over the requisite service period for each separately vesting portion of the award. For PSUs that meet the service vesting condition, the expense recognized over the requisite service period will not be reversed if the market condition is not achieved.
The compensation expense for these awards is estimated at fair value using a Monte Carlo simulation valuation model and compensation costs are recorded only if it is probable that the performance condition will be achieved.
In addition to a service vesting and market condition requirements,(based on the three year moving average of the Cimpress share price) contained in our standard performance share units, we have certain PSUsalso issue awards that contain an additionalfinancial performance conditions. These awards with a discretionary performance condition based on a multi-yearare subject to mark-to-market accounting throughout the performance target.vesting period. The compensation expense for these awards is estimated at fair value using a Monte Carlo simulation valuation model and compensation costs are recorded only if it is probable that the performance condition will be achieved. We are required to reassess the probability each
reporting period. If we determine the awards are not probable at some point during the performance vesting period, we would reverse any expense recognized to date. During fiscal 2018, we issued PSUs that contain a performance condition that we deemed probable of achievement and recognized $13,503 of expense. If the performance condition is determined to not be probable in a future period, we will reverse this expense in the period they are no longer considered probable.
Income Taxes.Taxes. As part of the process of preparing our consolidated financial statements, we calculate our income taxes in each of the jurisdictions in which we operate. This process involves estimating our current tax expense, including assessing the risks associated with tax positions, together with assessing temporary and permanent differences resulting from differing treatment of items for tax and financial reporting purposes. We recognize deferred tax assets and liabilities for the temporary differences using the enacted tax rates and laws that will be in effect when we expect temporary differences to reverse. We assess the ability to realize our deferred tax assets based upon the weight of available evidence both positive and negative. To the extent we believe that it is more likely than not that some portion or all of the deferred tax assets will not be realized, we establish a valuation allowance. Our estimates can vary due to the profitability mix of jurisdictions, foreign exchange movements, changes in tax law, regulations or accounting principles, as well as certain discrete items. In the event that actual results differ from our estimates or we adjust our estimates in the future, we may need to increase or decrease income tax expense, which could have a material impact on our financial position and results of operations.
We establish reserves for tax-related uncertainties based on estimates of whether, and the extent to which, additional taxes will be due. These reserves are established when we believe that certain positions might be challenged despite our belief that our tax return positions are in accordance with applicable tax laws. We adjust these reserves in light of changing facts and circumstances, such as the closing of a tax audit, new tax legislation, or the change of an estimate based on new information. To the extent that the final outcome of these matters is different than the amounts recorded, such differences will affect the provision for income taxes in the period in which such determination is made. Interest and, if applicable, penalties related to unrecognized tax benefits are recorded in the provision for income taxes. Stranded income tax effects in accumulated other comprehensive income or loss are released on an item-by-item basis based on when the applicable derivative is recognized in earnings.
Software and Website Development Costs.Costs. We capitalize eligible salaries and payroll-related costs of employees and third-party consultants who devote time to the development of our websites and internal-use computer software. Capitalization begins when the preliminary project stage is complete, management with the relevant authority authorizes and commits to the funding of the software project, and it is probable that the project will be completed and the software will be used to perform the function intended. These costs are amortized on a straight-line basis over the estimated useful life of the software, which is three years. Our judgment is required in determiningevaluating whether a project provides new or additional functionality, determining the point at which various projects enter the stages at which costs may be capitalized, assessing the ongoing value and impairment of the capitalized costs, and determining the estimated useful lives over which the costs are amortized. Historically we have not had any significant impairments of our capitalized software and website development costs.
Business Combinations. Combinations. We recognize the tangible and intangible assets acquired and liabilities assumed based on their estimated fair values at the date of acquisition. The fair value of identifiable intangible assets is based on detailed cash flow valuations that use information and assumptions provided by management. The valuations are dependent upon a myriad of factors including historical financial results, forecasted revenue growth rates, estimated customer renewal rates, projected operating costsmargins, royalty rates and discount rates. We estimate the fair value of any contingent consideration at the time of the acquisition using all pertinent information known to us at the time to assess the probability of payment of contingent amounts or through the use of a Monte Carlo simulation model. We allocate any excess purchase price over the fair value of the net tangible and intangible assets acquired and liabilities assumed to goodwill. The assumptions used in the valuations for our acquisitions may differ materially from actual results depending on performance of the acquired businesses and other factors. While we believe the assumptions used were appropriate, different assumptions in the valuation of assets acquired and liabilities assumed could have a material impact on the timing and extent of impact on our statements of operations.
Goodwill is assigned to reporting units as of the date of the related acquisition. If goodwill is assigned to more than one reporting unit, we utilize a method that is consistent with the manner in which the amount of goodwill in a business combination is determined. Costs related to the acquisition of a business are expensed as incurred.
Goodwill, Indefinite-Lived Intangible Assets, and Other Definite Lived Long-Lived Assets. Assets. We evaluate goodwill and indefinite-lived intangible assets for impairment annually or more frequently when an event occurs or circumstances change that indicate that the carrying value may not be recoverable. We have the option to first assess qualitative factors to determine whether it is more likely than not that the fair value of a reporting unit is less than its carrying amount. We consider the timing of our most recent fair value assessment and associated headroom, the actual operating results as compared to the cash flow forecasts used in those fair value
assessments, the current long-term forecasts for each reporting unit, and the general market and economic environment of each reporting unit. In addition to the specific factors mentioned above, we assess the following individual factors on an ongoing basis such as:
• A significant adverse change in legal factors or the business climate;
• An adverse action or assessment by a regulator;
• Unanticipated competition;
• A loss of key personnel; and
• A more-likely-than-not expectation that a reporting unit or a significant portion of a reporting unit will be sold or otherwise disposed of.
If the results of the qualitative analysis were to indicate that the fair value of a reporting unit is less than its carrying value, the quantitative test is required. Under the quantitative approach, we estimate the fair values of our reporting units using a discounted cash flow methodology.methodology and in certain circumstances a market-based approach. This analysis requires significant judgment and is based on our strategic plans and estimation of future cash flows, which is dependent on internal forecasts. Our annual analysis also requires significant judgment including the identification and aggregation of reporting units, as well as the determination of our discount rate and perpetual growth rate assumptions.
We are required to compare the fair value of the reporting unit with its carrying value and recognize an impairment charge for the amount by which the carrying amount exceeds the reporting unit's fair value.
We are required to evaluate the estimated useful lives and recoverability of definite lived long-lived assets (for example, customer relationships, developed technology, property, and equipment) on an ongoing basis when indicators of impairment are present. For purposes of the recoverability test, long-lived assets are grouped with other assets and liabilities at the lowest level for which identifiable cash flows are largely independent of the cash flows of other assets and liabilities. The test for recoverability compares the undiscounted future cash flows of the long-lived asset group to its carrying value. If the carrying values of the long-lived asset group exceed the undiscounted future cash flows, the assets are considered to be potentially impaired. The next step in the impairment measurement process is to determine the fair value of the individual net assets within the long-lived asset group. If the aggregate fair values of the individual net assets of the group are less than the carrying values, an impairment charge is recorded equal to the excess of the aggregate carrying value of the group over the aggregate fair value. The loss is allocated to each long-lived asset within the group based on their relative carrying values, with no asset reduced below its fair value. The identification and evaluation of a potential impairment requires judgment and is subject to change if events or circumstances pertaining to our business change. We evaluated our long-lived assets for impairment and during the year ended June 30, 2018,2021, and we recognized no impairments.
Recently Issued or Adopted Accounting Pronouncements
See Item 8 of Part II, “Financial Statements and Supplementary Data — Note 2 — Summary of Significant Accounting Policies — Recently Issued or Adopted Accounting Pronouncements."
Item 7A. Quantitative and Qualitative Disclosures About Market Risk
Interest Rate Risk. Our exposure to interest rate risk relates primarily to our cash, cash equivalents and debt.
As of June 30, 2018,2021, our cash and cash equivalents consisted of standard depository accounts which are held for working capital purposes.purposes, money market funds, and marketable securities with an original maturity of less than 90 days. We do not believe we have a material exposure to interest rate fluctuations related to our cash and cash equivalents.
As of June 30, 2018,2021, we had$432.41,152.0 million of variable-rate debt and $2.1 million of variable rate installment obligation related to the fiscal 2012 intra-entity transfer of Webs' intellectual property.debt. As a result, we have exposure to market risk for changes in interest rates related to these obligations. In order to mitigate our exposure to interest rate changes related to our variable rate debt, we execute interest rate swap contracts to fix the interest rate on a portion of our outstanding or forecasted long-term debt with varying maturities. As of June 30, 2018,2021, a hypothetical 100 basis point increase in rates, inclusive of our outstanding interest rate swaps, would result in an increasea $4.1 million impact to interest expense of approximately $2.4 millionover the next 12 months.
Currency Exchange Rate Risk. We conduct business in multiple currencies through our worldwide operations but report our financial results in U.S. dollars. We manage these currency risks through normal operating activities and, when deemed appropriate, through the use of derivative financial instruments. We have policies governing the use of derivative instruments and do not enter into financial instruments for trading or speculative purposes. The use of derivatives is intended to reduce, but does not entirely eliminate, the impact of adverse currency exchange rate movements. A summary of our currency risk is as follows:
•Translation of our non-U.S. dollar revenues and expenses: Revenue and related expenses generated in currencies other than the U.S. dollar could result in higher or lower net income when, upon consolidation, those transactions are translated to U.S. dollars. When the value or timing of revenue and expenses in a given currency are materially different, we may be exposed to significant impacts on our net income and non-GAAP financial metrics, such as adjusted EBITDA.
Our currency hedging objectives are targeted at reducing volatility in our forecasted U.S. dollar-equivalent adjusted EBITDA in order to protectmaintain stability on our incurrence-based debt covenants. Since adjusted EBITDA excludes non-cash items such as depreciation and amortization that are included in net income, we may experience increased, not decreased, volatility in our GAAP results due to our hedging approach. Our most significant net currency exposures by volume are in the Euro and British Pound.
In addition, we elect to execute currency derivatives contracts that do not qualify for hedge accounting. As a result, we may experience volatility in our consolidated statements of operations due to (i) the impact of unrealized gains and losses reported in other (expense) income, net on the mark-to-market of outstanding contracts and (ii) realized gains and losses recognized in other (expense) income, net, whereas the offsetting economic gains and losses are reported in the line item of the underlying activity, for example, revenue.
•Translation of our non-U.S. dollar assets and liabilities: Each of our subsidiaries translates its assets and liabilities to U.S. dollars at current rates of exchange in effect at the balance sheet date. The resulting gains and losses from translation are included as a component of accumulated other comprehensive loss on the consolidated balance sheet. Fluctuations in exchange rates can materially impact the carrying value of our assets and liabilities.
We have currency exposure arising from our net investments in foreign operations. We enter into currency derivatives to mitigate the impact of currency rate changes on certain net investments.
•Remeasurement of monetary assets and liabilities: Transaction gains and losses generated from remeasurement of monetary assets and liabilities denominated in currencies other than the functional currency of a subsidiary are included in other (expense) income, net on the consolidated statements of operations. Certain of our subsidiaries hold intercompany loans denominated in a currency other than their functional currency. Due to the significance of these balances, the revaluation of intercompany loans can have a material impact on other (expense) income, net. We expect these impacts may be volatile in the future, although our largest intercompany loans do not have a U.S. dollar cash impact for the consolidated
group because they are either 1) U.S. dollar loans or 2) we elect to hedge certain non-U.S. dollar loans with cross currency swaps.cross-currency swaps and forward contracts. A hypothetical 10% change in currency exchange rates was applied to total net monetary assets denominated in currencies other than the functional currencies at the balance sheet dates to compute the impact these changes would have had on our income before taxes in the near term. The balances are inclusive of the notional value of any cross currencycross-currency swaps designated as cash flow hedges. A hypothetical decrease in exchange rates of 10% against the functional currency of our subsidiaries would have resulted in an increase of$51.1 $6.0 million, $61.3$15.8 million,and $21.3$33.3 million, on our (loss) income before income taxes for the years ended June 30, 2018, 20172021, 2020 and 2016,2019, respectively.
Item 8. Financial Statements and Supplementary Data
CIMPRESS N.V.PLC
INDEX TO CONSOLIDATED FINANCIAL STATEMENTS
|
| | | | | | | |
| Report of Independent Registered Public Accounting Firm | | |
| Consolidated Balance Sheets | | |
| Consolidated Statements of Operations | | |
Consolidated Statements of Comprehensive (Loss) Income (Loss) | | |
| Consolidated Statements of Shareholders’ Equity (Deficit) | | |
| Consolidated Statements of Cash Flows | | |
| Notes to Consolidated Financial Statements | | |
REPORT OF INDEPENDENT REGISTERED PUBLIC ACCOUNTING FIRM
Report of Independent Registered Public Accounting Firm
TotheSupervisory Board of Directors and Shareholders of Cimpress N.V.
plc
Opinions on the Financial Statements and Internal Control over Financial Reporting
We have audited the accompanying consolidated balance sheets of Cimpress N.V.plc and its subsidiaries (the “Company”) as of June 30, 20182021 and June 30, 2017,2020, and the related consolidated statements of operations, consolidated statements of comprehensive income, (loss), consolidated statements of shareholders’shareholders' equity and consolidated statements of cash flows for each of the three years in the period ended June 30, 2018,2021, including the related notes and financial statement schedules listed in the accompanying index (collectively referred to as the “consolidated financial statements”).We also have audited the Company's internal control over financial reporting as of June 30, 2018,2021, based on criteria established in Internal Control - Integrated Framework(2013) issued by the Committee of Sponsoring Organizations of the Treadway Commission (COSO).
In our opinion, the consolidatedfinancial statements referred to above present fairly, in all material respects, the financial position of the Company as of June 30, 20182021 and June 30, 2017, 2020, and the results of theirits operations and theirits cash flows for each of the three years in the period ended June 30, 20182021 in conformity with accounting principles generally accepted in the United States of America. Also in our opinion, the Company maintained, in all material respects, effective internal control over financial reporting as of June 30, 2018,2021, based on criteria established in Internal Control - Integrated Framework(2013)issued by the COSO.
Basis for Opinions
The Company's management is responsible for these consolidated financial statements, for maintaining effective internal control over financial reporting, and for its assessment of the effectiveness of internal control over financial reporting, included in Management'sManagement’s Report on Internal Control over Financial Reporting appearing under Item 9A. Our responsibility is to express opinions on the Company’s consolidated financial statements and on the Company's internal control over financial reporting based on our audits. We are a public accounting firm registered with the Public Company Accounting Oversight Board (United States) ("PCAOB")(PCAOB) and are required to be independent with respect to the Company in accordance with the U.S. federal securities laws and the applicable rules and regulations of the Securities and Exchange Commission and the PCAOB.
We conducted our audits in accordance with the standards of the PCAOB. Those standards require that we plan and perform the audits to obtain reasonable assurance about whether the consolidatedfinancial statements are free of material misstatement, whether due to error or fraud, and whether effective internal control over financial reporting was maintained in all material respects.
Our audits of the consolidated financial statements included performing procedures to assess the risks of material misstatement of the consolidated financial statements, whether due to error or fraud, and performing procedures that respond to those risks. Such procedures included examining, on a test basis, evidence regarding the amounts and disclosures in the consolidated financial statements. Our audits also included evaluating the accounting principles used and significant estimates made by management, as well as evaluating the overall presentation of the consolidatedfinancial statements. Our audit of internal control over financial reporting included obtaining an understanding of internal control over financial reporting, assessing the risk that a material weakness exists, and testing and evaluating the design and operating effectiveness of internal control based on the assessed risk. Our audits also included performing such other procedures as we considered necessary in the circumstances. We believe that our audits provide a reasonable basis for our opinions.
Definition and Limitations of Internal Control over Financial Reporting
A company’s internal control over financial reporting is a process designed to provide reasonable assurance regarding the reliability of financial reporting and the preparation of financial statements for external purposes in accordance with generally accepted accounting principles. A company’s internal control over financial reporting includes those policies and procedures that (i) pertain to the maintenance of records that, in reasonable detail, accurately and fairly reflect the transactions and dispositions of the assets of the company; (ii) provide reasonable assurance that transactions are recorded as necessary to permit preparation of financial statements in accordance with generally accepted accounting principles, and that receipts and expenditures of the company are being made only in accordance with authorizations of management and directors of the company; and (iii) provide
reasonable assurance regarding prevention or timely detection of unauthorized acquisition, use, or disposition of the company’s assets that could have a material effect on the financial statements.
Because of its inherent limitations, internal control over financial reporting may not prevent or detect misstatements. Also, projections of any evaluation of effectiveness to future periods are subject to the risk that controls may become inadequate because of changes in conditions, or that the degree of compliance with the policies or procedures may deteriorate.
Critical Audit Matters
The critical audit matter communicated below is a matter arising from the current period audit of the consolidated financial statements that was communicated or required to be communicated to the audit committee and that (i) relates to accounts or disclosures that are material to the consolidated financial statements and (ii) involved our especially challenging, subjective, or complex judgments. The communication of critical audit matters does not alter in any way our opinion on the consolidated financial statements, taken as a whole, and we are not, by communicating the critical audit matter below, providing a separate opinion on the critical audit matter or on the accounts or disclosures to which it relates.
Goodwill - Quantitative Impairment Assessments - Druck and Exaprint Reporting Units
As described in Note 8 to the consolidated financial statements, the Company’s goodwill balance was $727 million as of June 30, 2021. During the third quarter of fiscal year 2021, management evaluated whether any triggering events existed across each of its reporting units to determine whether an impairment analysis was necessary. Management identified triggering events for the Druck and Exaprint reporting units, due in part to the reemergence of new pandemic-related lockdowns and restrictions in certain European countries, which resulted in a more prolonged reduction to cash flows when compared to the cash flows forecasted in the most recent impairment analysis that was performed during the third quarter of fiscal year 2020. Management performed a quantitative assessment of goodwill of the reporting units and compared the carrying value to the estimated fair value. For each reporting unit, the estimated fair value of the reporting unit exceeded the related carrying value and management concluded that no impairment existed. Management used the income approach, specifically the discounted cash flow method, to derive the fair value. This approach calculates fair value by estimating the after-tax cash flows attributable to a reporting unit and then discounting the after-tax cash flows to a present value using a risk-adjusted discount rate. The cash flow projections in the fair value analysis are considered Level 3 inputs, and consist of management's estimates of revenue growth rates and operating margins, taking into consideration historical results, as well as industry and market conditions. The discount rate used in the fair value analysis is based on a weighted average cost of capital. The principal considerations for our determination that performing procedures relating to the goodwill quantitative impairment assessments for the Druck and Exaprint reporting units is a critical audit matter are the significant judgment by management when developing the fair value measurement of the reporting units, which in turn led to a high degree of auditor judgment, subjectivity, and effort in performing procedures and evaluating management’s significant assumptions related to the revenue growth rates, operating margins, and discount rates.
Addressing the matter involved performing procedures and evaluating audit evidence in connection with forming our overall opinion on the consolidated financial statements. These procedures included testing the effectiveness of controls relating to management’s goodwill impairment assessment, including controls over the valuation of the Druck and Exaprint reporting units. These procedures also included, among others, (i) testing management’s process for developing the fair value estimates of the reporting units; (ii) evaluating the appropriateness of the discounted cash flow model; (iii) testing the completeness and accuracy of underlying data used in the model; and (iv) evaluating the reasonableness of the significant assumptions used by management related to the revenue growth rates, operating margins, and discount rates.
Evaluating management’s assumptions related to the revenue growth rates and operating margins involved evaluating whether the assumptions used by management were reasonable considering the current and past performance of the reporting units, the consistency with external market and industry data, and whether these assumptions were consistent with evidence obtained in other areas of the audit. The discount rates were evaluated by considering the weighted cost of capital of comparable businesses, other industry factors and prior discounted cash flow analyses.
/s/ PricewaterhouseCoopers LLP
Boston, Massachusetts
August 10, 20186, 2021
We have served as the Company’s auditor since 2014.
CIMPRESS N.V.PLC
CONSOLIDATED BALANCE SHEETS
(in thousands, except share and per share data)
| | | | | | | | | | | |
| June 30,
2021 | | June 30,
2020 |
| Assets | | | |
| Current assets: | | | |
| Cash and cash equivalents | $ | 183,023 | | | $ | 45,021 | |
| Marketable securities | 152,248 | | | 0 | |
| Accounts receivable, net of allowances of $9,404 and $9,651, respectively | 50,679 | | | 34,596 | |
| Inventory | 70,044 | | | 80,179 | |
| Prepaid expenses and other current assets | 72,504 | | | 88,608 | |
| | | |
| Total current assets | 528,498 | | | 248,404 | |
| Property, plant and equipment, net | 328,679 | | | 338,659 | |
| Operating lease assets, net | 87,626 | | | 156,258 | |
| Software and website development costs, net | 87,690 | | | 71,465 | |
| Deferred tax assets | 149,618 | | | 143,496 | |
| Goodwill | 726,979 | | | 621,904 | |
| Intangible assets, net | 186,744 | | | 209,228 | |
| Marketable securities, non-current | 50,713 | | | 0 | |
| Other assets | 35,951 | | | 25,592 | |
| Total assets | $ | 2,182,498 | | | $ | 1,815,006 | |
| Liabilities, noncontrolling interests and shareholders’ deficit | | | |
| Current liabilities: | | | |
| Accounts payable | $ | 199,831 | | | $ | 163,891 | |
| Accrued expenses | 247,513 | | | 210,764 | |
| Deferred revenue | 50,868 | | | 39,130 | |
| Short-term debt | 9,895 | | | 17,933 | |
| Operating lease liabilities, current | 26,551 | | | 41,772 | |
| Other current liabilities | 103,515 | | | 13,268 | |
| | | |
| Total current liabilities | 638,173 | | | 486,758 | |
| Deferred tax liabilities | 27,433 | | | 33,811 | |
| Long-term debt | 1,732,511 | | | 1,415,657 | |
| | | |
| Operating lease liabilities, non-current | 66,222 | | | 128,963 | |
| Other liabilities | 96,410 | | | 88,187 | |
| Total liabilities | 2,560,749 | | | 2,153,376 | |
| Commitments and contingencies (Note 17) | | | |
| Redeemable noncontrolling interests | 71,120 | | | 69,106 | |
| Shareholders’ deficit: | | | |
| Preferred shares, nominal value €0.01 per share, 100,000,000 shares authorized; none issued and outstanding | 0 | | | 0 | |
| Ordinary shares, nominal value €0.01 per share, 100,000,000 shares authorized; 44,080,627 shares issued; 26,035,910 and 25,885,675 shares outstanding, respectively | 615 | | | 615 | |
| Deferred ordinary shares, nominal value €1.00 per share, 25,000 shares authorized, issued and outstanding | 28 | | | 28 | |
| Treasury shares, at cost, 18,044,717 and 18,194,952 shares, respectively | (1,368,595) | | | (1,376,496) | |
| Additional paid-in capital | 459,904 | | | 438,616 | |
| Retained earnings | 537,677 | | | 618,437 | |
| Accumulated other comprehensive loss | (79,000) | | | (88,676) | |
| | | |
| | | |
| Total shareholders' deficit | (449,371) | | | (407,476) | |
| Total liabilities, noncontrolling interests and shareholders’ deficit | $ | 2,182,498 | | | $ | 1,815,006 | |
|
| | | | | | | |
| June 30,
2018 |
| June 30,
2017 |
| Assets | |
|
| |
|
| Current assets: | |
|
| |
|
| Cash and cash equivalents | $ | 44,227 |
|
| $ | 25,697 |
|
| Accounts receivable, net of allowances of $6,898 and $3,590, respectively | 55,621 |
|
| 48,630 |
|
| Inventory | 60,602 |
|
| 46,563 |
|
| Prepaid expenses and other current assets | 78,846 |
|
| 78,835 |
|
| Assets held for sale | — |
| | 46,276 |
|
| Total current assets | 239,296 |
|
| 246,001 |
|
| Property, plant and equipment, net | 483,664 |
|
| 511,947 |
|
| Software and website development costs, net | 56,199 |
|
| 48,470 |
|
| Deferred tax assets | 67,087 |
|
| 48,004 |
|
| Goodwill | 520,843 |
|
| 514,963 |
|
| Intangible assets, net | 230,201 |
|
| 275,924 |
|
| Other assets | 54,927 |
|
| 34,560 |
|
| Total assets | $ | 1,652,217 |
|
| $ | 1,679,869 |
|
| Liabilities, noncontrolling interests and shareholders’ equity | |
|
| |
|
| Current liabilities: | |
|
| |
|
| Accounts payable | $ | 152,436 |
|
| $ | 127,386 |
|
| Accrued expenses | 186,661 |
|
| 175,567 |
|
| Deferred revenue | 27,697 |
|
| 30,372 |
|
| Short-term debt | 59,259 |
| | 28,926 |
|
| Other current liabilities | 54,971 |
| | 78,435 |
|
| Liabilities held for sale | — |
| | 8,797 |
|
| Total current liabilities | 481,024 |
|
| 449,483 |
|
| Deferred tax liabilities | 51,243 |
|
| 60,743 |
|
| Lease financing obligation | 102,743 |
| | 106,606 |
|
| Long-term debt | 767,585 |
|
| 847,730 |
|
| Other liabilities | 69,524 |
|
| 94,683 |
|
| Total liabilities | 1,472,119 |
|
| 1,559,245 |
|
| Commitments and contingencies (Note 17) | | | |
| Redeemable noncontrolling interests | 86,151 |
|
| 45,412 |
|
| Shareholders’ equity: | |
|
| |
|
| Preferred shares, par value €0.01 per share, 100,000,000 shares authorized; none issued and outstanding | — |
|
| — |
|
| Ordinary shares, par value €0.01 per share, 100,000,000 shares authorized; 44,080,627 shares issued; and 30,876,193 and 31,415,503 shares outstanding, respectively | 615 |
|
| 615 |
|
| Treasury shares, at cost, 13,204,434 and 12,665,124 shares, respectively | (685,577 | ) |
| (588,365 | ) |
| Additional paid-in capital | 395,682 |
|
| 361,376 |
|
| Retained earnings | 452,756 |
|
| 414,771 |
|
| Accumulated other comprehensive loss | (69,814 | ) |
| (113,398 | ) |
| Total shareholders’ equity attributable to Cimpress N.V. | 93,662 |
|
| 74,999 |
|
| Noncontrolling interests (Note 14) | 285 |
| | 213 |
|
| Total shareholders' equity | 93,947 |
| | 75,212 |
|
| Total liabilities, noncontrolling interests and shareholders’ equity | $ | 1,652,217 |
|
| $ | 1,679,869 |
|
See accompanying notes.
CIMPRESS N.V.PLC
CONSOLIDATED STATEMENTS OF OPERATIONS
(in thousands, except share and per share data)
| | | | Year Ended June 30, | | | Year Ended June 30, | |
| | 2018 | | 2017 | | 2016 | | | 2021 | | 2020 | | 2019 | |
| Revenue | $ | 2,592,541 |
| | $ | 2,135,405 |
| | $ | 1,788,044 |
| Revenue | | $ | 2,592,513 | | | $ | 2,481,358 | | | $ | 2,751,076 | | |
| Cost of revenue (1) | 1,279,799 |
| | 1,036,975 |
| | 773,640 |
| Cost of revenue (1) | | 1,316,441 | | | 1,248,871 | | | 1,401,344 | | |
| Technology and development expense (1) | 245,758 |
| | 243,230 |
| | 210,080 |
| Technology and development expense (1) | | 253,060 | | | 253,252 | | | 236,797 | | |
| Marketing and selling expense (1) | 714,654 |
| | 610,932 |
| | 508,502 |
| Marketing and selling expense (1) | | 648,391 | | | 574,041 | | | 713,863 | | |
| General and administrative expense (1) | 176,958 |
| | 207,569 |
| | 145,844 |
| General and administrative expense (1) | | 195,652 | | | 183,054 | | | 162,652 | | |
| Amortization of acquired intangible assets | 49,881 |
| | 46,145 |
| | 40,563 |
| Amortization of acquired intangible assets | | 53,818 | | | 51,786 | | | 53,256 | | |
| Restructuring expense (1) | 15,236 |
| | 26,700 |
| | 381 |
| Restructuring expense (1) | | 1,641 | | | 13,543 | | | 12,054 | | |
| (Gain) on sale of subsidiaries | (47,545 | ) | | — |
| | — |
| |
| Impairment of goodwill and acquired intangible assets | — |
| | 9,556 |
| | 30,841 |
| |
| Income (loss) from operations | 157,800 |
| | (45,702 | ) | | 78,193 |
| |
| Impairment of goodwill | | Impairment of goodwill | | 0 | | | 100,842 | | | 7,503 | | |
| | Income from operations | | Income from operations | | 123,510 | | | 55,969 | | | 163,607 | | |
| Other (expense) income, net | (21,032 | ) | | 10,362 |
| | 26,098 |
| Other (expense) income, net | | (11,835) | | | 22,874 | | | 26,476 | | |
| Interest expense, net | (53,043 | ) | | (43,977 | ) | | (38,196 | ) | Interest expense, net | | (119,368) | | | (75,840) | | | (63,171) | | |
| Loss on early extinguishment of debt | (17,359 | ) |
| — |
|
| — |
| Loss on early extinguishment of debt | | (48,343) | | | 0 | | | 0 | | |
| Income (loss) before income taxes | 66,366 |
| | (79,317 | ) | | 66,095 |
| |
| (Loss) income before income taxes | | (Loss) income before income taxes | | (56,036) | | | 3,003 | | | 126,912 | | |
| Income tax expense (benefit) | 19,578 |
| | (7,118 | ) | | 15,684 |
| Income tax expense (benefit) | | 18,903 | | | (80,992) | | | 33,432 | | |
| Net income (loss) | 46,788 |
| | (72,199 | ) | | 50,411 |
| |
| Net (loss) income | | Net (loss) income | | (74,939) | | | 83,995 | | | 93,480 | | |
| Add: Net (income) loss attributable to noncontrolling interest | (3,055 | ) | | 488 |
| | 3,938 |
| Add: Net (income) loss attributable to noncontrolling interest | | (2,772) | | | (630) | | | 1,572 | | |
| Net income (loss) attributable to Cimpress N.V. | $ | 43,733 |
| | $ | (71,711 | ) | | $ | 54,349 |
| |
| Basic net income (loss) per share attributable to Cimpress N.V. | $ | 1.41 |
| | $ | (2.29 | ) | | $ | 1.72 |
| |
| Diluted net income (loss) per share attributable to Cimpress N.V. | $ | 1.36 |
| | $ | (2.29 | ) | | $ | 1.64 |
| |
| Net (loss) income attributable to Cimpress plc | | Net (loss) income attributable to Cimpress plc | | $ | (77,711) | | | $ | 83,365 | | | $ | 95,052 | | |
| Basic net (loss) income per share attributable to Cimpress plc | | Basic net (loss) income per share attributable to Cimpress plc | | $ | (2.99) | | | $ | 3.07 | | | $ | 3.09 | | |
| Diluted net (loss) income per share attributable to Cimpress plc | | Diluted net (loss) income per share attributable to Cimpress plc | | $ | (2.99) | | | $ | 3.00 | | | $ | 3.00 | | |
| Weighted average shares outstanding — basic | 30,948,081 |
| | 31,291,581 |
| | 31,656,234 |
| Weighted average shares outstanding — basic | | 25,996,572 | | | 27,180,744 | | | 30,786,349 | | |
| Weighted average shares outstanding — diluted | 32,220,401 |
| | 31,291,581 |
| | 33,049,454 |
| Weighted average shares outstanding — diluted | | 25,996,572 | | | 27,773,286 | | | 31,662,705 | | |
(1) Share-based compensation is allocated as follows:
| | | | | | | | | | | | | | | | | | | | | |
| | | | Year Ended June 30, |
| | | | | | 2021 | | 2020 | | 2019 |
| Cost of revenue | | | | | $ | 387 | | | $ | 486 | | | $ | 455 | |
| Technology and development expense | | | | | 9,063 | | | 9,003 | | | 3,765 | |
| Marketing and selling expense | | | | | 6,947 | | | 2,703 | | | 1,193 | |
| General and administrative expense | | | | | 20,637 | | | 21,061 | | | 12,882 | |
| Restructuring expense | | | | | 0 | | | 1,621 | | | 3,421 | |
|
| | | | | | | | | | | |
| | Year Ended June 30, |
| | 2018 | | 2017 | | 2016 |
| Cost of revenue | $ | 361 |
| | $ | 289 |
| | $ | 72 |
|
| Technology and development expense | 10,580 |
| | 8,724 |
| | 5,892 |
|
| Marketing and selling expense | 6,683 |
| | 4,857 |
| | 1,591 |
|
| General and administrative expense | 31,515 |
| | 28,500 |
| | 16,273 |
|
| Restructuring expense | 1,327 |
| | 6,257 |
| | — |
|
See accompanying notes.
CIMPRESS N.V.PLC
CONSOLIDATED STATEMENTS OF COMPREHENSIVE (LOSS) INCOME (LOSS)
(in thousands)
|
| | | | | | | | | | | |
| | Year Ended June 30, |
| | 2018 | | 2017 | | 2016 |
| Net income (loss) | $ | 46,788 |
| | $ | (72,199 | ) | | $ | 50,411 |
|
| Other comprehensive income (loss), net of tax: | | | | | |
| Foreign currency translation gains (losses), net of hedges | 35,148 |
| | (4,681 | ) | | (7,537 | ) |
| Net unrealized gain (loss) on derivative instruments designated and qualifying as cash flow hedges | 11,521 |
| | (1,297 | ) | | (2,504 | ) |
| Amounts reclassified from accumulated other comprehensive loss to net income (loss) on derivative instruments | (960 | ) | | 1,369 |
| | 1,587 |
|
| Unrealized (loss) gain on available-for-sale-securities | — |
| | (5,756 | ) | | 517 |
|
| Amounts reclassified from accumulated other comprehensive loss to net income (loss) for realized gains on available-for-sale securities | — |
|
| 2,268 |
| | — |
|
| Gain on pension benefit obligation, net | 357 |
| | 2,194 |
| | 561 |
|
| Comprehensive income (loss) | 92,854 |
| | (78,102 | ) | | 43,035 |
|
| Add: Comprehensive (income) loss attributable to noncontrolling interests | (5,421 | ) | | 1,008 |
| | 2,208 |
|
| Total comprehensive income (loss) attributable to Cimpress N.V. | $ | 87,433 |
| | $ | (77,094 | ) | | $ | 45,243 |
|
| | | | | | | | | | | | | | | | | | | | | |
| | | Year Ended June 30, |
| | | | | 2021 | | 2020 | | 2019 |
| Net (loss) income | | | | | $ | (74,939) | | | $ | 83,995 | | | $ | 93,480 | |
| Other comprehensive (loss) income, net of tax: | | | | | | | | | |
| Foreign currency translation gains, net of hedges | | | | | 5,397 | | | 10,933 | | | 6,667 | |
| Net unrealized gains (losses) on derivative instruments designated and qualifying as cash flow hedges | | | | | 10,336 | | | (24,570) | | | (23,409) | |
| Amounts reclassified from accumulated other comprehensive (loss) income to net (loss) income on derivative instruments | | | | | (4,089) | | | 5,774 | | | 3,932 | |
| | | | | | | | | |
| | | | | | | | | |
| Loss on pension benefit obligation, net | | | | | (336) | | | (1,195) | | | (204) | |
| Comprehensive (loss) income | | | | | (63,631) | | | 74,937 | | | 80,466 | |
| Add: Comprehensive (income) loss attributable to noncontrolling interests | | | | | (4,404) | | | (391) | | | 4,537 | |
| Total comprehensive (loss) income attributable to Cimpress plc | | | | | $ | (68,035) | | | $ | 74,546 | | | $ | 85,003 | |
See accompanying notes.
CIMPRESS N.V.49
CONSOLIDATED STATEMENTS OF SHAREHOLDERS' EQUITY
(in thousands)
|
| | | | | | | | | | | | | | | | | | | | | | | | | | | | | |
| | Ordinary Shares | | Treasury Shares | | | | | | | | |
| | Number of Shares
Issued | | Amount | | Number
of
Shares | | Amount | | Additional
Paid-in
Capital | | Retained
Earnings | | Accumulated Other
Comprehensive
Loss | | Total
Shareholders’
Equity |
| Balance at June 30, 2015 | 44,080 |
| | $ | 615 |
| | (10,878 | ) | | $ | (412,132 | ) | | $ | 324,281 |
| | $ | 435,052 |
| | $ | (98,909 | ) | | $ | 248,907 |
|
| Cumulative effect adjustment related to adoption of share-based compensation standard (ASU 2016-09) |
|
| |
|
| |
|
| |
|
| | 546 |
| | 2,000 |
| |
|
| | 2,546 |
|
| Issuance of ordinary shares due to share option exercises, net of shares withheld for taxes |
|
| |
|
| | 120 |
| | 5,199 |
| | (493 | ) | |
|
| |
|
| | 4,706 |
|
| Issuance of ordinary shares in conjunction with WIRmachenDRUCK acquisition |
|
| |
|
| | 112 |
| | 4,900 |
| | 3,910 |
| |
|
| |
|
| | 8,810 |
|
| Restricted share units vested, net of shares withheld for taxes |
|
| |
|
| | 180 |
| | 3,857 |
| | (11,326 | ) | |
|
| |
|
| | (7,469 | ) |
| Grant of restricted share awards |
|
| |
|
| | 82 |
| | 3,094 |
| | (3,094 | ) | |
|
| |
|
| | — |
|
| Share-based compensation expense |
|
| |
|
| |
|
| |
|
| | 21,368 |
| |
|
| |
|
| | 21,368 |
|
| Purchase of ordinary shares |
|
| |
|
| | (2,160 | ) | | (153,467 | ) | |
|
| |
|
| |
|
| | (153,467 | ) |
| Redeemable noncontrolling interest accretion to redemption value |
|
| |
|
| |
|
| |
|
| |
|
| | (4,919 | ) | |
|
| | (4,919 | ) |
| Net income attributable to Cimpress N.V. |
|
| |
|
| |
|
| |
|
| |
|
| | 54,349 |
| |
|
| | 54,349 |
|
| Net unrealized loss on derivative instruments designated and qualifying as cash flow hedges |
|
| |
|
| |
|
| |
|
| |
|
| |
|
| | (917 | ) | | (917 | ) |
| Unrealized gain on marketable securities |
|
| |
|
| |
|
| |
|
| |
|
| |
|
| | 517 |
| | 517 |
|
| Foreign currency translation, net of hedges |
|
| |
|
| |
|
| |
|
| |
|
| |
|
| | (9,267 | ) | | (9,267 | ) |
| Unrealized gain on pension benefit obligation, net of tax |
|
| |
|
| |
|
| |
|
| |
|
| |
|
| | 561 |
| | 561 |
|
| Balance at June 30, 2016 | 44,080 |
| | $ | 615 |
| | (12,544 | ) | | $ | (548,549 | ) | | $ | 335,192 |
| | $ | 486,482 |
| | $ | (108,015 | ) | | $ | 165,725 |
|
| Issuance of ordinary shares due to share option exercises, net of shares withheld for taxes |
|
| |
|
| | 319 |
| | 6,949 |
| | (3,455 | ) | |
|
| |
| | 3,494 |
|
| Restricted share units vested, net of shares withheld for taxes |
|
| |
|
| | 154 |
| | 3,243 |
| | (10,576 | ) | |
|
| |
| | (7,333 | ) |
| Share-based compensation expense |
|
| |
|
| |
|
| |
|
| | 43,504 |
| |
|
| |
| | 43,504 |
|
| Purchase of ordinary shares |
|
| |
|
| | (594 | ) | | (50,008 | ) | |
|
| |
|
| |
| | (50,008 | ) |
| Net loss attributable to Cimpress N.V. |
|
| |
|
| |
|
| |
|
| |
|
| | (71,711 | ) | |
| | (71,711 | ) |
| Redeemable noncontrolling interest accretion to redemption value |
|
| |
|
| |
|
| |
|
| | 68 |
| |
|
| |
| | 68 |
|
| Reclassification of mandatorily redeemable noncontrolling interest |
|
| |
|
| |
|
| |
|
| | (3,357 | ) | |
|
| |
| | (3,357 | ) |
| Net unrealized gain on derivative instruments designated and qualifying as cash flow hedges |
|
| |
|
| |
|
| |
|
| |
|
| |
|
| | 72 |
| | 72 |
|
| Unrealized loss on marketable securities |
|
| |
|
| |
|
| |
|
| |
|
| |
|
| | (5,756 | ) | | (5,756 | ) |
| Realized gain on sale of marketable securities |
|
| |
|
| |
|
| |
|
| |
|
| |
|
| | 2,268 |
| | 2,268 |
|
| Foreign currency translation, net of hedges |
|
| |
|
| |
|
| |
|
| |
|
| |
|
| | (4,161 | ) | | (4,161 | ) |
| Unrealized gain on pension benefit obligation, net of tax |
|
| |
|
| |
|
| |
|
| |
|
| |
|
| | 2,194 |
| | 2,194 |
|
| Balance at June 30, 2017 | 44,080 |
| | $ | 615 |
| | (12,665 | ) | | $ | (588,365 | ) | | $ | 361,376 |
| | $ | 414,771 |
| | $ | (113,398 | ) | | $ | 74,999 |
|
See accompanying notes.
CIMPRESS N.V.PLC
CONSOLIDATED STATEMENTS OF SHAREHOLDERS' EQUITY (DEFICIT)
(in thousands)
| | | | | | | | | | | | | | | | | | | | | | | | | | | | | | | | | | | | | | | | | | | | | | | | | | | | | | | | | | | |
| Ordinary Shares | | Deferred Ordinary Shares | | Treasury Shares | | | | | | | | |
| Number of
Shares
Issued | | Amount | | Number of
Shares
Issued | | Amount | | Number
of
Shares | | Amount | | Additional
Paid-in
Capital | | Retained
Earnings | | Accumulated Other
Comprehensive
Loss | | Total
Shareholders’
Equity (Deficit) |
| Balance at June 30, 2018 | 44,080 | | | $ | 615 | | | 0 | | | $ | 0 | | | (13,206) | | | $ | (685,577) | | | $ | 395,682 | | | $ | 452,756 | | | $ | (69,814) | | | $ | 93,662 | |
| Issuance of ordinary shares due to share option exercises, net of shares withheld for taxes | — | | | — | | | — | | | — | | | 123 | | | 3,100 | | | (3,106) | | | — | | | — | | | (6) | |
| Restricted share units vested, net of shares withheld for taxes | — | | | — | | | — | | | — | | | 38 | | | 573 | | | (2,866) | | | — | | | — | | | (2,293) | |
| Grant of restricted share awards | — | | | — | | | — | | | — | | | 4 | | | 24 | | | | | — | | | — | | | 24 | |
| Share-based compensation expense | — | | | — | | | — | | | — | | | — | | | — | | | 18,064 | | | — | | | — | | | 18,064 | |
| Purchase of ordinary shares | — | | | — | | | — | | | — | | | (594) | | | (55,567) | | | — | | | — | | | — | | | (55,567) | |
| Net income attributable to Cimpress plc | — | | | — | | | — | | | — | | | — | | | — | | | — | | | 95,052 | | | | | 95,052 | |
| Adjustment for purchase of noncontrolling interest | — | | | — | | | — | | | — | | | — | | | — | | | 2,714 | | | — | | | — | | | 2,714 | |
| Adjustment to noncontrolling interest for share forfeiture | — | | | — | | | — | | | — | | | — | | | — | | | 591 | | | — | | | — | | | 591 | |
| Adoption of new accounting standard | — | | | — | | | — | | | — | | | — | | | — | | | — | | | (3,246) | | | — | | | (3,246) | |
| Noncontrolling interest accretion to redemption value | — | | | — | | | — | | | — | | | — | | | — | | | — | | | (7,140) | | | — | | | (7,140) | |
| Net unrealized loss on derivative instruments designated and qualifying as cash flow hedges | — | | | — | | | — | | | — | | | — | | | — | | | — | | | — | | | (19,477) | | | (19,477) | |
| Foreign currency translation, net of hedges | — | | | — | | | — | | | — | | | — | | | — | | | — | | | — | | | 9,638 | | | 9,638 | |
| Unrealized loss on pension benefit obligation, net of tax | — | | | — | | | — | | | — | | | — | | | — | | | — | | | — | | | (204) | | | (204) | |
| Balance at June 30, 2019 | 44,080 | | | $ | 615 | | | 0 | | | $ | 0 | | | (13,635) | | | $ | (737,447) | | | $ | 411,079 | | | $ | 537,422 | | | $ | (79,857) | | | $ | 131,812 | |
See accompanying notes.
CIMPRESS PLC
CONSOLIDATED STATEMENTS OF SHAREHOLDERS' EQUITY (DEFICIT) (CONTINUED)
(in thousands)
| | | | | | | | | | | | | | | | | | | Ordinary Shares | | Deferred Ordinary Shares | | Treasury Shares | |
| | Ordinary Shares | | Treasury Shares | | | | | | | | | | Number of
Shares
Issued | | Amount | | Number of
Shares
Issued | | Amount | | Number
of
Shares | | Amount | | Additional
Paid-in
Capital | | Retained
Earnings | | Accumulated Other
Comprehensive
Loss | | Total
Shareholders’
Equity (Deficit) |
| | Number of Shares
Issued | | Amount | | Number
of
Shares | | Amount | | Additional
Paid-in
Capital | | Retained
Earnings | | Accumulated Other
Comprehensive
Loss | | Total
Shareholders’
Equity | |
| Cumulative effect adjustment related to adoption of income tax standard (ASU 2016-16) |
|
| |
|
| |
|
| |
|
| |
|
| | (5,864 | ) | |
| | (5,864 | ) | |
| Balance at June 30, 2019 | | Balance at June 30, 2019 | 44,080 | | | $ | 615 | | | 0 | | | $ | 0 | | | (13,635) | | | $ | (737,447) | | | $ | 411,079 | | | $ | 537,422 | | | $ | (79,857) | | | $ | 131,812 | |
| Issuance of ordinary shares due to share option exercises, net of shares withheld for taxes |
|
| |
|
| | 293 |
| | (3,174 | ) | | (4,999 | ) | |
|
| |
| | (8,173 | ) | Issuance of ordinary shares due to share option exercises, net of shares withheld for taxes | — | | | — | | | — | | | — | | | 432 | | | (12,518) | | | (28,388) | | | — | | | — | | | (40,906) | |
| Restricted share units vested, net of shares withheld for taxes |
|
| |
|
| | 63 |
| | 840 |
| | (4,784 | ) | |
|
| |
| | (3,944 | ) | Restricted share units vested, net of shares withheld for taxes | — | | | — | | | — | | | — | | | 13 | | | 712 | | | (1,317) | | | — | | | — | | | (605) | |
| Issuance of deferred ordinary shares | | Issuance of deferred ordinary shares | — | | | — | | | 25 | | | 28 | | | — | | | — | | | — | | | — | | | — | | | 28 | |
| Grant of restricted share awards |
|
| |
|
| | (2 | ) | | (168 | ) | |
|
| |
|
| |
| | (168 | ) | Grant of restricted share awards | — | | | — | | | — | | | — | | | (2) | | | (187) | | | — | | | — | | | — | | | (187) | |
| Share-based compensation expense |
|
| |
|
| |
|
| |
|
| | 44,089 |
| |
|
| |
| | 44,089 |
| Share-based compensation expense | — | | | — | | | — | | | — | | | — | | | — | | | 34,810 | | | — | | | — | | | 34,810 | |
| Purchase of ordinary shares |
|
| |
|
| | (895 | ) | | (94,710 | ) | |
|
| |
|
| |
| | (94,710 | ) | Purchase of ordinary shares | — | | | — | | | — | | | — | | | (5,003) | | | (627,056) | | | — | | | — | | | — | | | (627,056) | |
| Net income attributable to Cimpress N.V. |
|
| |
|
| |
|
| |
|
| |
|
| | 43,733 |
| |
| | 43,733 |
| |
| Net unrealized gain on derivative instruments designated and qualifying as cash flow hedges |
|
| |
|
| |
|
| |
|
| |
|
| |
|
| | 10,561 |
| | 10,561 |
| |
| Net income attributable to Cimpress plc | | Net income attributable to Cimpress plc | — | | | — | | | — | | | — | | | — | | | — | | | — | | | 83,365 | | | — | | | 83,365 | |
| Redeemable noncontrolling interest accretion to redemption value | | Redeemable noncontrolling interest accretion to redemption value | — | | | — | | | — | | | — | | | — | | | — | | | — | | | (5,493) | | | — | | | (5,493) | |
| Adoption of new accounting standards | | Adoption of new accounting standards | — | | | — | | | — | | | — | | | — | | | — | | | — | | | 3,143 | | | — | | | 3,143 | |
| Issuance of warrants | | Issuance of warrants | — | | | — | | | — | | | — | | | — | | | — | | | 22,432 | | | — | | | — | | | 22,432 | |
| Net unrealized loss on derivative instruments designated and qualifying as cash flow hedges | | Net unrealized loss on derivative instruments designated and qualifying as cash flow hedges | — | | | — | | | — | | | — | | | — | | | — | | | — | | | — | | | (18,796) | | | (18,796) | |
| Foreign currency translation, net of hedges |
|
| |
|
| |
|
| |
|
| |
|
| |
|
| | 32,782 |
| | 32,782 |
| Foreign currency translation, net of hedges | — | | | — | | | — | | | — | | | — | | | — | | | — | | | — | | | 11,172 | | | 11,172 | |
| Unrealized gain on pension benefit obligation, net of tax |
|
| |
|
| |
|
| |
|
| |
|
| |
|
| | 357 |
| | 357 |
| |
| Balance at June 30, 2018 | 44,080 |
| | $ | 615 |
| | (13,206 | ) | | $ | (685,577 | ) | | $ | 395,682 |
| | $ | 452,756 |
| | $ | (69,814 | ) | | $ | 93,662 |
| |
| Unrealized loss on pension benefit obligation, net of tax | | Unrealized loss on pension benefit obligation, net of tax | — | | | — | | | — | | | — | | | — | | | — | | | — | | | — | | | (1,195) | | | (1,195) | |
| Balance at June 30, 2020 | | Balance at June 30, 2020 | 44,080 | | | $ | 615 | | | 25 | | | $ | 28 | | | (18,195) | | | $ | (1,376,496) | | | $ | 438,616 | | | $ | 618,437 | | | $ | (88,676) | | | $ | (407,476) | |
See accompanying notes.
CIMPRESS N.V.PLC
CONSOLIDATED STATEMENTS OF SHAREHOLDERS' EQUITY (DEFICIT) (CONTINUED)
(in thousands)
| | | | | | | | | | | | | | | | | | | | | | | | | | | | | | | | | | | | | | | | | | | | | | | | | | | | | | | | | | | |
| Ordinary Shares | | Deferred Ordinary Shares | | Treasury Shares | | | | | | | | |
| Number of
Shares
Issued | | Amount | | Number of
Shares
Issued | | Amount | | Number
of
Shares | | Amount | | Additional
Paid-in
Capital | | Retained
Earnings | | Accumulated Other
Comprehensive
Loss | | Total
Shareholders’
Equity (Deficit) |
| Balance at June 30, 2020 | 44,080 | | | $ | 615 | | | 25 | | | $ | 28 | | | (18,195) | | | $ | (1,376,496) | | | $ | 438,616 | | | $ | 618,437 | | | $ | (88,676) | | | $ | (407,476) | |
| Issuance of ordinary shares due to share option exercises, net of shares withheld for taxes | — | | | — | | | — | | | — | | | 30 | | | 3 | | | (2,283) | | | — | | | — | | | (2,280) | |
| Restricted share units vested, net of shares withheld for taxes | — | | | — | | | — | | | — | | | 120 | | | 7,898 | | | (13,655) | | | — | | | — | | | (5,757) | |
| | | | | | | | | | | | | | | | | | | |
| Share-based compensation expense | — | | | — | | | — | | | — | | | — | | | — | | | 37,226 | | | — | | | — | | | 37,226 | |
| Net loss attributable to Cimpress plc | — | | | — | | | — | | | — | | | — | | | — | | | — | | | (77,711) | | | — | | | (77,711) | |
| Redeemable noncontrolling interest accretion to redemption value | — | | | — | | | — | | | — | | | — | | | — | | | — | | | (3,049) | | | — | | | (3,049) | |
| | | | | | | | | | | | | | | | | | | |
| Net unrealized gain on derivative instruments designated and qualifying as cash flow hedges | — | | | — | | | — | | | — | | | — | | | — | | | — | | | — | | | 6,247 | | | 6,247 | |
| Foreign currency translation, net of hedges | — | | | — | | | — | | | — | | | — | | | — | | | — | | | — | | | 3,765 | | | 3,765 | |
| Unrealized loss on pension benefit obligation, net of tax | — | | | — | | | — | | | — | | | — | | | — | | | — | | | — | | | (336) | | | (336) | |
| Balance at June 30, 2021 | 44,080 | | | $ | 615 | | | 25 | | | $ | 28 | | | (18,045) | | | $ | (1,368,595) | | | $ | 459,904 | | | $ | 537,677 | | | $ | (79,000) | | | $ | (449,371) | |
See accompanying notes.
CIMPRESS PLC
CONSOLIDATED STATEMENTS OF CASH FLOWS
(in thousands)
| | | | | | | | | | | | | | | | | | |
| Year Ended June 30, |
| | 2021 | | 2020 | | | 2019 |
| Operating activities | | | | | | |
| Net (loss) income | $ | (74,939) | | | $ | 83,995 | | | | $ | 93,480 | |
| Adjustments to reconcile net (loss) income to net cash provided by operating activities: | | | | | | |
| Depreciation and amortization | 173,212 | | | 167,943 | | | | 173,771 | |
| Impairment of goodwill | 0 | | | 100,842 | | | | 7,503 | |
| Share-based compensation expense | 37,034 | | | 34,874 | | | | 21,716 | |
| Impairment of long-lived assets | 19,882 | | | — | | | | — | |
| Deferred taxes | (10,284) | | | (106,864) | | | | 6,838 | |
| | | | | | |
| | | | | | |
| Loss on early extinguishment of debt | 48,343 | | | 0 | | | | 0 | |
| | | | | | |
| Unrealized loss (gain) on derivatives not designated as hedging instruments included in net (loss) income | 17,323 | | | 7,731 | | | | (5,358) | |
| Effect of exchange rate changes on monetary assets and liabilities denominated in non-functional currency | (7,278) | | | (802) | | | | (4,364) | |
| | | | | | |
| Other non-cash items | 7,041 | | | 11,229 | | | | 9,209 | |
| | | | | | |
| Changes in operating assets and liabilities: | | | | | | |
| Accounts receivable | (11,474) | | | 26,659 | | | | (4,186) | |
| Inventory | 16,382 | | | (18,328) | | | | (3,627) | |
| Prepaid expenses and other assets | (2,606) | | | 11,946 | | | | 4,475 | |
| Accounts payable | 29,367 | | | (17,547) | | | | 19,835 | |
| Accrued expenses and other liabilities | 23,218 | | | 36,766 | | | | 11,803 | |
| Net cash provided by operating activities | 265,221 | | | 338,444 | | | | 331,095 | |
| Investing activities | | | | | | |
| Purchases of property, plant and equipment | (38,524) | | | (50,467) | | | | (70,563) | |
| Proceeds from the sale of subsidiaries, net of transaction costs and cash divested | 0 | | | (1,124) | | | | 0 | |
| Business acquisitions, net of cash acquired | (53,410) | | | (4,272) | | | | (289,920) | |
| | | | | | |
| Capitalization of software and website development costs | (60,937) | | | (43,992) | | | | (48,652) | |
| Purchases of marketable securities | (203,581) | | | 0 | | | | 0 | |
| Proceeds from the sale of assets | 5,696 | | | 1,644 | | | | 640 | |
| | | | | | |
| | | | | | |
| | | | | | |
| (Payments of) proceeds from settlement of derivatives designated as hedging instruments | (3,291) | | | 29,791 | | | | (12,016) | |
| Other investing activities | (269) | | | 1,556 | | | | 345 | |
| Net cash used in investing activities | (354,316) | | | (66,864) | | | | (420,166) | |
| Financing activities | | | | | | |
| Proceeds from borrowings of debt | 665,682 | | | 1,281,490 | | | | 1,140,607 | |
| Proceeds from Term Loan B | 1,149,751 | | | 0 | | | | 0 | |
| Proceeds from issuance of senior notes | 0 | | | 210,500 | | | | 0 | |
| Proceeds from issuance of second lien notes | 0 | | | 271,568 | | | | 0 | |
| Proceeds from issuance of warrants | 0 | | | 22,432 | | | | 0 | |
| Payments of debt | (1,242,606) | | | (1,337,334) | | | | (947,696) | |
| | | | | | |
| | | | | | |
| Payments for early redemption of second lien notes | (309,000) | | | 0 | | | | 0 | |
| Payments of debt issuance costs | (11,963) | | | (22,570) | | | | (2,729) | |
| Payments of purchase consideration included in acquisition-date fair value | (1,205) | | | (358) | | | | (3,282) | |
| Payments of withholding taxes in connection with equity awards | (5,757) | | | (41,709) | | | | (5,979) | |
| Payments of finance lease obligations | (8,000) | | | (9,511) | | | | (17,063) | |
| Purchase of noncontrolling interests | (5,063) | | | 0 | | | | (85,520) | |
| Proceeds from sale of noncontrolling interest | 0 | | | 0 | | | | 57,046 | |
| Purchase of ordinary shares | 0 | | | (627,056) | | | | (55,567) | |
| Proceeds from issuance of ordinary shares | (2,280) | | | 6 | | | | 3,403 | |
| | | | | | |
|
| | | | | | | | | | | |
| Year Ended June 30, |
| | 2018 |
| 2017 | | 2016 |
| Operating activities | |
|
| |
| | |
| Net income (loss) | $ | 46,788 |
|
| $ | (72,199 | ) | | $ | 50,411 |
|
| Adjustments to reconcile net income (loss) to net cash provided by operating activities: | |
|
| |
| | |
| Depreciation and amortization | 169,005 |
|
| 158,400 |
| | 131,918 |
|
| Impairment of goodwill and acquired intangible assets | — |
| | 9,556 |
| | 30,841 |
|
| Share-based compensation expense | 50,466 |
|
| 48,627 |
| | 23,772 |
|
| Deferred taxes | (14,039 | ) |
| (41,358 | ) | | (15,922 | ) |
| Abandonment of long-lived assets | — |
| | 2,408 |
| | 10,979 |
|
| Gain on sale of subsidiaries | (47,545 | ) | | — |
| | — |
|
| Loss on early extinguishment of debt | 17,359 |
|
| — |
|
| — |
|
| Change in contingent earn-out liability | 1,774 |
| | 39,377 |
| | — |
|
| Gain on sale of available-for-sale securities | — |
|
| (2,268 | ) | | — |
|
| Unrealized (gain) loss on derivatives not designated as hedging instruments included in net income (loss) | (15,540 | ) |
| 15,813 |
| | (8,163 | ) |
| Payments of contingent consideration in excess of acquisition date fair value | (4,639 | ) | | — |
| | (8,613 | ) |
| Effect of exchange rate changes on monetary assets and liabilities denominated in non-functional currency | 19,460 |
|
| (5,690 | ) | | (9,199 | ) |
| Other non-cash items | 4,668 |
|
| 2,886 |
| | 5,784 |
|
| Gain on proceeds from insurance | — |
| | — |
| | (3,136 | ) |
| Changes in operating assets and liabilities: | |
|
| |
| | |
| Accounts receivable | (5,123 | ) |
| 4,701 |
| | 6,766 |
|
| Inventory | (7,068 | ) |
| (8,699 | ) | | (11 | ) |
| Prepaid expenses and other assets | (2,472 | ) |
| 521 |
| | (7,668 | ) |
| Accounts payable | 21,782 |
|
| 25,332 |
| | 25,670 |
|
| Accrued expenses and other liabilities | (42,544 | ) |
| (20,671 | ) | | 13,929 |
|
| Net cash provided by operating activities | 192,332 |
|
| 156,736 |
| | 247,358 |
|
| Investing activities | |
|
| |
| | |
| Purchases of property, plant and equipment | (60,930 | ) | | (74,157 | ) | | (80,435 | ) |
| Proceeds from the sale of subsidiaries, net of transaction costs and cash divested | 93,779 |
|
| — |
| | — |
|
| Business acquisitions, net of cash acquired | (110 | ) | | (204,875 | ) | | (164,412 | ) |
| Purchases of intangible assets | (308 | ) | | (197 | ) | | (476 | ) |
| Capitalization of software and website development costs | (40,847 | ) | | (37,307 | ) | | (26,324 | ) |
| Proceeds from the sale of assets | 886 |
|
| 4,513 |
| | — |
|
| Proceeds from insurance related to investing activities | — |
|
| — |
| | 3,624 |
|
| Proceeds from sale of available-for-sale securities | — |
| | 6,346 |
| | — |
|
| Other investing activities | (3,064 | ) | | 3,888 |
| | 2,485 |
|
| Net cash (used in) provided by investing activities | (10,594 | ) |
| (301,789 | ) | | (265,538 | ) |
| Financing activities | | | | | |
| Proceeds from borrowings of debt | 805,995 |
| | 737,075 |
| | 598,008 |
|
| Proceeds from issuance of senior notes | 400,000 |
| | — |
| | — |
|
| Payments of debt | (974,781 | ) | | (539,913 | ) | | (430,622 | ) |
| Payments for early redemption of senior notes | (275,000 | ) |
| — |
|
| — |
|
| Payments of early redemption fees for senior notes | (14,438 | ) |
| — |
|
| — |
|
| Payments of debt issuance costs | (10,629 | ) |
| (229 | ) |
| (70 | ) |
| Payments of purchase consideration included in acquisition-date fair value | (2,105 | ) | | (539 | ) | | (7,330 | ) |
See accompanying notes.
53
CIMPRESS N.V.PLC
CONSOLIDATED STATEMENTS OF CASH FLOWS (CONTINUED)
(in thousands)
|
| | | | | | | | | | | |
| | Year Ended June 30, |
| | 2018 | | 2017 | | 2016 |
| Financing activities (continued) | | | | | |
| Payments of withholding taxes in connection with equity awards | (19,698 | ) | | (14,568 | ) | | (7,467 | ) |
| Payments of capital lease obligations | (17,618 | ) | | (15,887 | ) | | (13,933 | ) |
| Purchase of ordinary shares | (94,710 | ) | | (50,008 | ) | | (153,467 | ) |
| Purchase of noncontrolling interests | (1,144 | ) | | (20,230 | ) | | — |
|
| Proceeds from issuance of ordinary shares | 11,981 |
| | 6,192 |
| | 4,705 |
|
| Issuance of loans | (21,000 | ) |
| — |
| | — |
|
| Proceeds from sale of noncontrolling interest | 35,390 |
| | — |
| | — |
|
| Capital contribution from noncontrolling interest | — |
| | 1,404 |
| | 5,141 |
|
| Other financing activities | — |
| | 1,281 |
| | (303 | ) |
| Net cash (used in) provided by financing activities | (177,757 | ) | | 104,578 |
| | (5,338 | ) |
| Effect of exchange rate changes on cash | 2,507 |
| | 788 |
| | (2,640 | ) |
| Change in cash held for sale | 12,042 |
| | (12,042 | ) | | — |
|
| Net increase (decrease) in cash and cash equivalents | 18,530 |
| | (51,729 | ) | | (26,158 | ) |
| Cash and cash equivalents at beginning of period | 25,697 |
| | 77,426 |
| | 103,584 |
|
| Cash and cash equivalents at end of period | $ | 44,227 |
| | $ | 25,697 |
| | $ | 77,426 |
|
| | | | | | | | | | | | | | | | | | |
| Year Ended June 30, |
| 2021 | | 2020 | | | 2019 |
| | | | | | |
| | | | | | |
| Distribution to noncontrolling interest | (4,747) | | | (3,955) | | | | (3,375) | |
| Other financing activities | (684) | | | (1,758) | | | | 2,144 | |
| Net cash provided by (used in) financing activities | 224,128 | | | (258,255) | | | | 81,989 | |
| Effect of exchange rate changes on cash | 2,969 | | | (3,583) | | | | (1,866) | |
| | | | | | |
| Net increase (decrease) in cash and cash equivalents | 138,002 | | | 9,742 | | | | (8,948) | |
| Cash and cash equivalents at beginning of period | 45,021 | | | 35,279 | | | | 44,227 | |
| Cash and cash equivalents at end of period | $ | 183,023 | | | $ | 45,021 | | | | $ | 35,279 | |
| | | | | | | | | | | | | | | | | |
| Supplemental disclosures of cash flow information | | | | | |
| Cash paid during the period for: | | | | | |
| Interest | $ | 116,977 | | | $ | 72,906 | | | $ | 63,940 | |
| Income taxes | 27,870 | | | 13,520 | | | 26,369 | |
| Non-cash investing and financing activities | | | | | |
| Capitalization of construction costs related to financing lease obligation (1) | — | | | — | | | 13,448 | |
| Property and equipment acquired under finance leases | 6,996 | | | 1,605 | | | 11,871 | |
| Amounts accrued related to business acquisitions | 45,025 | | | 2,289 | | | 5,564 | |
|
| | | | | | | | | | | |
| Supplemental disclosures of cash flow information: | | | | | |
| Cash paid during the period for: | | | | | |
| Interest | $ | 56,614 |
| | $ | 45,275 |
|
| $ | 37,623 |
|
| Income taxes | 32,278 |
| | 49,342 |
|
| 19,750 |
|
| Non-cash investing and financing activities: | | | | | |
| Capitalization of construction costs related to financing lease obligation | — |
| | — |
| | 19,264 |
|
| Property and equipment acquired under capital leases | 531 |
| | 14,422 |
| | 7,535 |
|
| Amounts accrued related to business acquisitions | 3,457 |
| | 46,124 |
| | 5,868 |
|
(1) Due to our adoption of the new leasing standard on July 1, 2019, any costs previously capitalized for a build-to-suit lease and included in the financing lease obligation are now classified as an operating lease and the lease financing obligation has been de-recognized.
See accompanying notes.
CIMPRESS N.V.PLC
NOTES TO CONSOLIDATED FINANCIAL STATEMENTS
Years Ended June 30, 2018, 2017 and 2016
(in thousands, except share and per share data)
1. Description of the Business
Cimpress is a strategically-focusedstrategically focused group of more than a dozen businesses that specialize in mass customization, via which we deliver large volumes of individually small-sized customized orders for a broad spectrum of print, signage, photo merchandise, invitations and announcements, writing instruments, packaging, apparel and other categories. We invest in and build customer-focused, entrepreneurial mass customization businesses for the long term, which we manage in a decentralized, autonomous manner. Mass customization is a core element of the business model of each Cimpress business. We drive competitive advantage across Cimpress through a select few shared strategic capabilities that have the greatest potential to create Cimpress-wide value. We limit all other central activities to only those which absolutely must be performed centrally.
2.Summary of Significant Accounting Policies
Basis of Presentation
The consolidated financial statements include the accounts of Cimpress N.V.,plc, its wholly owned subsidiaries, entities in which we maintain a controlling financial interest, and those entities in which we have a variable interest and are the primary beneficiary. Intercompany balances and transactions have been eliminated. Investments in entities in which we cannot exercise significant influence, and the related equity securities do not have a readily determinable fair value, are accounted for using the cost method and are included in other assets on the consolidated balance sheets.
Use of Estimates
The preparation of financial statements in conformity with GAAPU.S. generally accepted accounting principles (“GAAP”) requires management to make estimates and assumptions that affect the amounts reported in the consolidated financial statements and accompanying notes. We believe our most significant estimates are associated with the ongoing evaluation of the recoverability of our long-lived assets and goodwill, estimated useful lives of assets, share-based compensation, accounting for business combinations, and income taxes and related valuation allowances, among others. By their nature, estimates are subject to an inherent degree of uncertainty. Actual results could differ from those estimates.
Throughout fiscal year 2021, the COVID-19 pandemic had a negative impact on most of our businesses, but we've experienced improving trends in customer demand throughout the fiscal year. We evaluated our liquidity position as of the date of the issuance of these consolidated financial statements. Based on this evaluation, management believes, despite the ongoing impact of COVID-19 on our business, that our financial position, net cash provided by operations combined with our cash and cash equivalents, marketable securities and borrowing availability under our revolving credit facility, will be sufficient to fund our current obligations, capital spending, debt service requirements and working capital requirements over at least the next twelve months.
Cash and Cash Equivalents
We consider all highly liquid investments purchased with an original maturity of three months or less to be the equivalent of cash for the purpose of balance sheet and statement of cash flows presentation. Cash equivalents consist of depository accounts and money market funds. Cash and cash equivalents restricted for use were $90$537and $520$86 as of June 30, 20182021 and 2017,2020, respectively, and are included in other assets in the accompanying consolidated balance sheets.
Marketable Securities
We determine the appropriate classification of marketable securitiesFor bank accounts that are overdrawn at the dateend of purchase and reevaluate the classification at eacha reporting period, including any net negative balance sheet date. Our marketable securities are classified as "available-for-sale" and carried at fair value, with the unrealized gains and losses, net of taxes if applicable, reported as a separate component of accumulated other comprehensive loss. On December 22, 2016,in our notional cash pool, we sold allreclassify these overdrafts to short-term debt on our consolidated balance sheets. Book overdrafts that result from outstanding checks in excess of our Plaza Create Co. Ltd. common shares, which were classified as held for sale.bank balance are reclassified to other current liabilities. We recognizeddid not have a net gain of $2,268 as part of other (expense) income, net on our statement of operationsbank overdraw for the year ended June 30, 2017. We did not sell marketable securities during2021, while for the yearsyear ended June 30, 20182020, we reclassified an overdraw of $3,768 to short-term debt within our consolidated balance sheets and presented the overdraw within financing activities in our consolidated statement of cash flows. As of June 30, 2021 and 2020, we did not record a book overdraft.
Marketable Securities
We hold certain investments that are classified as held-to-maturity (HTM) as we have the intent and ability to hold them to their maturity dates. Our policy is to invest in the following permitted classes of assets: overnight money market funds invested in U.S. Treasury securities and U.S. government agency securities, U.S Treasury securities-specifically U.S Treasury bills, notes, and bonds, U.S. government agency securities, bank time deposits, commercial paper, corporate notes and bonds, and medium term notes. We generally invest in securities with a maturity of two years or 2016.less. As the investments are classified as held-to-maturity they are recorded at amortized cost and interest income is recorded as it is earned within interest (expense) income.
We will continue to assess our securities for impairment when the fair value is less than amortized cost to determine if any risk of credit loss exists. As our intent is to hold the securities to maturity, we must assess whether any credit losses related to our investments are recoverable, and determine if it is more likely than not that we will be required to sell the security before recovery of its amortized cost basis. For the year ended June 30, 2021 we did not record an allowance for credit losses and we recognized no impairments for these marketable securities.
The following is a summary of the held-to-maturity securities by type as of June 30, 2021 and as of June 30, 2020 we held no marketable securities:
| | | | | | | | | | | | | | | | | | | |
| Amortized cost | | | | Unrealized losses | | Fair value |
| June 30, 2021 | | | | | | | |
| Commercial paper | $ | 74,463 | | | | | $ | (28) | | | $ | 74,435 | |
| Corporate debt securities | 128,498 | | | | | (147) | | | 128,351 | |
| Total | $ | 202,961 | | | | | $ | (175) | | | $ | 202,786 | |
The following table summarizes the net carrying amount and fair value of the held-to maturity securities by contractual maturity.
| | | | | | | | | | | |
| Amortized cost | | Fair value |
| Due within one year or less | | | |
| Commercial paper and corporate debt securities | $ | 152,248 | | | $ | 152,163 | |
| Due after one year through two years | | | |
| Corporate debt securities | 50,713 | | | 50,623 | |
| Total | $ | 202,961 | | | $ | 202,786 | |
Accounts Receivable
Accounts receivable includes amounts due from customers. We offset gross trade accounts receivable with an allowance for doubtful accounts, which is our best estimate of the amount of probable credit losses in existing accounts receivable. Account balances are charged off against the allowance when the potential for recovery is no longer reasonably assured.
Inventories
Inventories consist primarily of raw materials and are recorded at the lower of cost or net realizable value using the first-in, first-out method. Costs to produce free products are included in cost of revenues as incurred.
Property, Plant and Equipment
Property, plant and equipment are stated at cost less accumulated depreciation and amortization. Additions and improvements that substantially extend the useful life of a particular asset are capitalized while repairs and maintenance costs are expensed as incurred. Assets that qualify for the capitalization of interest cost during their construction period are evaluated on a per project basis and, if material, the costs are capitalized. No interest costs associated with our construction projects were capitalized in fiscal 2018 or 2017any of the years presented as the amounts were not material. Depreciation of plant and equipment is recorded on a straight-line basis over the estimated useful lives of the assets.
Software and Web Site Development Costs
We capitalize eligible salaries and payroll-related costs of employees and third-party consultants who devote time to the development of websites and internal-use computer software. Capitalization begins when the preliminary project stage is complete, management with the relevant authority authorizes and commits to the funding of the software project, and it is probable that the project will be completed and the software will be used to perform the function intended. These costs are amortized on a straight-line basis over the estimated useful life of the software, which is generally over a three year period. Costs associated with preliminary stage software development, repair, maintenance or the development of website content are expensed as incurred.
Amortization of previously capitalized amounts in the years ended June 30, 2018, 20172021, 2020 and 20162019 was $31,332, $24,571$47,560, $40,753 and $14,355,$35,068, respectively, resulting in accumulated amortization of $231,482 and$84,279 and $59,554180,993 at June 30 20182021 and 2017,2020, respectively.
Leases
We categorize leases at their inception as either operating or capital leases. Costs for operating leases that include incentives such as payment escalations or rent abatements are recognized on a straight-line basis over the term of the lease. Additionally, inducements received are treated as a reduction of our costs over the term of the agreement. Leasehold improvements are capitalized at cost and amortized over the shorter of their expected useful life or the life of the lease, excluding renewal periods.
Capital leases are accounted for as an acquisition of an asset and incurrence of an obligation. Assets held under capital leases are recorded at the lower of the present value of the minimum lease payments or the fair value of the leased asset at the inception of the lease, and amortized over the useful life of the asset. The corresponding capital lease obligation is recorded at the present value of the minimum lease payments at inception of the lease.
For lease arrangements where we are deemed to be involved in the construction of structural improvements prior to the commencement of the lease or take some level of construction risk, we are considered the owner of the assets during the construction period. Accordingly, as the lessor incurs the construction project costs, the assets and corresponding financial obligation are recorded in our consolidated balance sheet. Once the construction is completed, if the lease meets certain “sale-leaseback” criteria, we will remove the asset and related financial obligation from the balance sheet and treat the building lease as either an operating or capital lease based on our assessment of the guidance. If, upon completion of construction, the project does not meet the “sale-leaseback” criteria, the lease will be treated as a financing obligation and we will depreciate the asset over its estimated useful life for financial reporting purposes.
Insurance Recoveries
Insurance proceeds related to incurred losses are recognized when recovery is probable, while business interruption recoveries follow the gain contingency model and are recognized when realized or realizable and earned. During the years ended June 30, 2018, 2017 and 2016, we received insurance proceeds of $327, $829 and $11,943, respectively, which were used to offset any incurred losses, relating to the write-off of the net book value of damaged machinery, equipment and inventory and property-related cleanup costs, as well as claim preparation costs. We also recognized net gains within other (expense) income, net of $675, $807 and $3,947, respectively, which includes the recovery of business interruption lost profits and the recovery of the replacement value of damaged machinery and equipment in excess of carrying value. As of June 30, 2018, all of these claims are closed.
Intangible Assets
We capitalize the costs of purchasing patents from unrelated third parties and amortize these costs over the estimated useful life of the patent. The costs related to patent applications, pursuing others who we believe infringe on our patents, and defending against patent-infringement claims are expensed as incurred.
We record acquired intangible assets at fair value on the date of acquisition using the income approach to value the trade names, customer relationships and customer network and a replacement cost approach to value developed technology and our print network. The income approach calculates fair value by discounting the forecasted after-tax cash flows back to a present value using an appropriate discount rate. The baseline data for this analysis was the cash flow estimates used to price the transaction. We amortize such assets using the straight-line method over the expected useful life of the asset, unless another amortization method is deemed to be more appropriate. In estimating the useful life of the acquired assets, we reviewed the expected use of the assets acquired, factors that may limit the useful life of an acquired asset or may enable the extension of the useful life of an acquired asset without substantial cost, the effects of obsolescence, demand, competition and other economic factors, and the level of maintenance expenditures required to obtain the expected future cash flows from the asset.
We evaluate the remaining useful life of intangible assets on a periodic basis to determine whether events and circumstances warrant a revision to the remaining useful life. If the estimate of an intangible asset’s remaining useful life is changed, we amortize the remaining carrying value of the intangible asset prospectively over the revised remaining useful life.
Long-Lived Assets
Long-lived assets with a finite life are reviewed for impairment whenever events or changes in circumstances indicate that the carrying amount of the assets might not be recoverable. Conditions that would necessitate an impairment assessment include a significant decline in the observable market value of an asset, a significant change in the extent or manner in which an asset is used, or any other significant adverse change that would indicate that the carrying amount of an asset or group of assets may not be recoverable. During the year ended June 30, 2017, we recognized a partialWe did not recognize any impairment charge for the acquired intangible assets of our Tradeprint reporting unit of $3,211. Refer to Note 8 for additional information. We recognized no impairmentor abandonment charges for acquired intangible assets in any of the other periods presented.
During the years ended June 30, 2017 and 2016 we committed to plans to abandon certain manufacturing equipment and recognized losses of $2,408 and $10,979, respectively. The related loss during the year ended June 30, 2017 was recognized in cost of revenue, technology and development expense, and restructuring expense for $1,119, $678, and $611, respectively, while the entire loss for the previous year was allocated to cost of revenue. We did not recognize any abandonment charges during the fiscal year ended June 30, 2018.
Business Combinations
We recognize the assets acquired and liabilities assumed in business combinations on the basis of their fair values at the date of acquisition. We assess the fair value of assets, including intangible assets, using a variety of methods and each asset is measured at fair value from the perspective of a market participant. The method used to estimate the fair values of intangible assets incorporates significant assumptions regarding the estimates a market participant would make in order to evaluate an asset, including a market participant’s use of the asset and the appropriate discount rates. Assets acquired that are determined to not have economic use for us are expensed immediately. Any excess purchase price over the fair value of the net tangible and intangible assets acquired is
allocated to goodwill. Transaction costs and restructuring costs associated with a business combination are expensed as incurred.
The consideration for our acquisitions often includes future payments that are contingent upon the occurrence of a particular event. For acquisitions that qualify as business combinations, we record an obligation for such contingent payments at fair value on the acquisition date. We estimate the fair value of contingent consideration obligations through valuation models that incorporate probability adjusted assumptions related to the achievement of the milestones and thus likelihood of making related payments or by using a Monte Carlo simulation model. We revalue these contingent consideration obligations each reporting period. Changes in the fair value of our contingent consideration obligations are recognized within general and administrative expense in our consolidated statements of operations.
Goodwill
The evaluation of goodwill for impairment is performed at a level referred to as a reporting unit. A reporting unit is either the “operating segment level” or one level below, which is referred to as a “component.” The level at which the impairment test is performed requires an assessment as to whether the operations below the operating segment should be aggregated as one reporting unit due to their similarity or reviewed individually. Goodwill is evaluated for impairment on an annual basis or more frequently when an event occurs or circumstances change that indicate that the carrying value may not be recoverable. Goodwill is considered to be impaired when the carrying amount of a reporting unit exceeds its estimated fair value.
We have the option to first assess qualitative factors to determine whether it is more likely than not that the fair value of a reporting unit is less than its carrying value. If the results of this analysis indicate that the fair value of a reporting unit is less than its carrying value, the quantitative impairment test is required; otherwise, no further assessment is necessary. To perform the quantitative approach, we estimate the fair value of our reporting units using a discounted cash flow methodology. If the carrying value of the net assets assigned to the reporting unit exceeds the fair value of the reporting unit, then a second step of the impairment test is performed in order to determine the implied fair value of our reporting unit’s goodwill. If the carrying value of a reporting unit’s goodwill exceeds its implied fair value, then we record an impairment loss equal to the difference. Refer to Note 8 for additional information.
Debt Issuance Costs
ExpensesCosts associated with the issuance of debt instruments are capitalized and are amortized over the termsterm of the respective financing arrangement on a straight-line basis through the maturity date of the related debt instrument. DuringWe evaluate all changes to our debt arrangements, to determine whether the years ended June 30, 2018 and 2017, we capitalized debt issuance costs relatedchanges represent a modification or extinguishment to the refinancingold debt arrangement. If a debt instrument is deemed to be modified, we capitalize all new lenders fees and expense all third-party fees. If we determine that an extinguishment of one of our debt instruments has occurred, the unamortized financing fees associated with the extinguished instrument are expensed. For the revolving loans associated with our senior secured credit facility, all lender and senior unsecured notes of $11,666third-party fees are capitalized, and $229, respectively. Amortization expense and the write-off of costs related to debt modifications are included in interest expense, net in the consolidated statements of operations and amounted to $1,821, $1,578, and $1,588, forevent an amendment reduces the years ended June 30, 2018, 2017 and 2016, respectively. Duringcommitted capacity under the year ended June 30, 2018,revolving loans, we also expensed $2,921 of unamortized costs related to the extinguishment of our senior unsecured notes, which has been presented separately in the consolidated statements of operations as part of loss on early extinguishment of debt. Refer to Note 10 for additional information.
Unamortized debt issuance costs were $12,585 and $5,661 as of June 30, 2018 and 2017, respectively. When we make changes to our financing arrangements, we re-evaluate the capitalization of these costs which could result in the immediate recognitionexpense a portion of any unamortized debt issuance costsfees on a pro-rata basis in our statement of operations.proportion to the decrease in the committed capacity.
Derivative Financial Instruments
We record all derivatives on the consolidated balance sheet at fair value. We apply hedge accounting to arrangements that qualify and are designated for hedge accounting treatment, which includes cash flow and net investment hedges. Hedge accounting is discontinued prospectively if the hedging relationship ceases to be effective or the hedging or hedged items cease to exist as a result of maturity, sale, termination or cancellation.
Derivatives designated and qualifying as hedges of the exposure to variability in expected future cash flows, or other types of forecasted transactions, are considered cash flow hedges which could include interest rate swap contracts and cross-currency swap contracts. In a cash flow hedging relationship, the effective and ineffective portion of the change
in the fair value of the hedging derivative is initially recorded in accumulated other comprehensive loss, while any ineffective portion is recognized directly in earnings, as a component of other (expense) income, net.(loss) income. The portion of gain or loss on the derivative instrument previously recorded in accumulated other comprehensive (loss) income remains in accumulated other comprehensive (loss) income until the forecasted transaction is recognized in earnings. For derivatives designated as cash flow hedges, we present the settlement amount of these contracts within cash from investing activities in our consolidated statement of cash flows, if the hedged item continues after contract settlement.
Derivatives designated and qualifying as hedges of currency exposure of a net investment in a foreign operation are considered net investment hedges which could include cross-currency swap and currency forward contracts. In hedging the currency exposure of a net investment in a foreign operation, the effective and ineffective portion of gains and losses on the hedging instruments is recognized in accumulated other comprehensive (loss) income as part of currency translation adjustment, while any ineffective portion is recognized directly in earnings, as a component of other (expense) income, net.adjustment. The portion of gain or loss on the derivative instrument previously recorded in accumulated other comprehensive (loss) income remains in accumulated other comprehensive (loss) income until we reduce our investment in the hedged foreign operation through a sale or substantial liquidation.
We also enter into derivative contracts that are intended to economically hedge certain of our risks, even though we may not elect to apply hedge accounting or the instrument may not qualify for hedge accounting. When hedge accounting is not applied, the changes in the fair value of the derivatives are recorded directly in earnings as a component of other (expense) income, net.
In accordance with the fair value measurement guidance, our accounting policy is to measure the credit risk of our derivative financial instruments that are subject to master netting agreements on a net basis by counterparty portfolio. We execute our derivative instruments with financial institutions that we judge to be credit-worthy, defined as institutions that hold an investment grade credit rating.
Mandatorily Redeemable Noncontrolling InterestShareholders' Equity (Deficit)
Noncontrolling interests held by third parties in consolidated subsidiaries are considered mandatorily redeemable when they are subject to an unconditional obligation to be redeemed by both parties. The redeemable noncontrolling interest must be required to be repurchased on a specified date or on the occurrence of a specified event that is certain to occur and are to be redeemed via the transfer of assets. Mandatorily redeemable noncontrolling interests are presented as liability-based financial instruments and are re-measured on a recurring basis to the expected redemption value. During the year ended June 30, 2017, the terms of our arrangement with the shareholders of Printi LLC were amended, resulting in the inclusion of a mandatory redemption feature as part of the amended arrangement. Refer to Note 15 for additional details.
Shareholders’ Equity
Comprehensive Income (loss)(Loss)
Comprehensive income (loss) is defined as the change in equity of a business enterprise during a period from transactions and other events and circumstances from non-owner sources. Comprehensive income (loss) is composed of net income, (loss), unrealized gains and losses on marketable securities and derivatives, unrealized loss on pension benefit obligation, and cumulative foreign currency translation adjustments, which are included in the accompanying consolidated statements of comprehensive income.
Treasury Shares
Treasury shares are accounted for using the cost method and are included as a component of shareholders' equity. We reissue treasury shares as part of our share-based compensation programs and as consideration for some of our acquisition transactions. Upon issuance of treasury shares we determine the cost using the average cost method.
Warrants
We bifurcate and separately account for a detachable warrant as a separate equity instrument. The value assigned to the warrants was determined based on a relative fair value allocation between the warrants and related debt. The fair value of the warrants was determined using a Monte Carlo valuation and applying a discount for the lack of marketability for the warrants. We present the allocated value for the warrants within additional paid-in capital in our consolidated balance sheet. Refer to Note 10 for additional details.
Revenue Recognition
Our businessesWe generate revenue primarily from the sale and shippingshipment of customized manufactured products, as well as providingproducts. We also generate revenue, to a much lesser extent (and primarily in our Vistaprint business) from digital services, website design and hosting, professional design services, and email marketing services, as well as a small percentage from order referral fees and other third partythird-party offerings. WeRevenues are recognized when control of the promised products or services is transferred to the customer in an amount that reflects the consideration we expect to be entitled to in exchange for those products or services. Shipping revenues are recognized when control of the related products is transferred to the customer. For design service arrangements, we recognize revenue arising from saleswhen the services are complete. A portion of products and services whenthis revenue relates to design contests in which we have persuasive evidencedetermined that we are the principal in the arrangement as we satisfy our contractual performance obligation to provide the customer with the benefit of our platform and network of designers.
Under the terms of most of our arrangements with our customers we provide satisfaction guarantees, which give our customers an option for a refund or reprint over a specified period of time if the customer is not fully satisfied. As such, we record a reserve for estimated sales returns and allowances as a reduction of revenue, based on historical experience or the specific identification of an arrangement,event necessitating a reserve. Actual sales returns have historically not been significant.
We have elected to recognize shipping and handling activities that occur after transfer of control of the product has been shipped or service rendered with no significant post-delivery obligations on our part, the net sales price is fixed or determinableproducts as fulfillment activities and collectability is reasonably
assured. For subscription servicesnot as a separate performance obligation. Accordingly, we recognize revenue for our single performance obligation upon the fees charged to customers ratably over the termtransfer of control of the service arrangement.fulfilled orders, which generally occurs upon delivery to the shipping carrier. If revenue is recognized prior to completion of the shipping and handling activities, we accrue the costs of those activities. We do have some arrangements whereby the transfer of control, and thus
revenue recognition, occurs upon delivery to the customer. If multiple products are ordered together, each product is considered a separate performance obligation, and the transaction price is allocated to each performance obligation based on the standalone selling price. Revenue is recognized netupon satisfaction of discounts we offereach performance obligation. We generally determine the standalone selling prices based on the prices charged to our customers as part of advertising campaigns. Revenue from sales of prepaid orders on our websitescustomers.
Our products are deferred until shipment of fulfilled orders or untilcustomized for each individual customer with no alternative use except to be delivered to that specific customer; however, we do not have an enforceable right to payment prior to delivering the prepaid service has been rendered.
For arrangements with multiple deliverables, we allocate revenue to each deliverable if the delivered item(s) has valueitems to the customer based on the terms and conditions of our arrangements with customers and therefore we recognize revenue at a standalone basispoint in time.
We record deferred revenue when cash payments are received in advance of our satisfaction of the related performance obligation. The satisfaction of performance obligations generally occurs shortly after cash payment and ifwe expect to recognize our deferred revenue balance as revenue within three months subsequent to June 30, 2021.
We periodically provide marketing materials and promotional offers to new customers and existing customers that are intended to improve customer retention. These incentive offers are generally available to all customers and, therefore, do not represent a performance obligation as customers are not required to enter into a contractual commitment to receive the arrangement includesoffer. These discounts are recognized as a general right of return relativereduction to the delivered item, delivery or performance oftransaction price when used by the undelivered item(s) is considered probable and substantially within our control. The stand-alone selling price for a deliverable is determined using a hierarchy of (1) Company specific objective and reliable evidence, then (2) third-party evidence, then (3) best estimate of selling price. We allocate total arrangement feecustomer. Costs related to each of the deliverables based on their relative stand-alone selling prices.
Shipping, handling and processing costs billed to customersfree products are included inwithin cost of revenue and sample products are included within marketing and selling expense.
We have elected to expense incremental direct costs as incurred, which primarily includes sales commissions, since our contract periods generally are less than one year and the related costsperformance obligations are included in costsatisfied within a short period of revenue at the time of shipment or rendering of service. Sales and purchases in jurisdictions which are subject to indirect taxes, such as value added tax (“VAT”), are recorded net of tax collected and paid as we act as an agent for the government.time.
For promotions through discount voucher websites, we recognize revenue on a gross basis, as we are the primary obligor, when redeemed items are shipped. As the vouchers do not expire, any unredeemed vouchers are recorded as deferred revenue. We recognize revenue on the portion of unredeemed vouchers when the likelihood of redemption becomes remote (referred to as "breakage"), and we determine there is no legal obligation to remit the value of the unredeemed coupons to government agencies. We estimate the breakage rate based upon the pattern of historical redemptions.
Restructuring
Restructuring costs are recorded in connection with initiatives designed to improve efficiency or enhance competitiveness. Restructuring initiatives require us to make estimates in several areas, including expenses for severance and other employee separation costs and our ability to generate sublease income to enable us to terminate lease obligations at the estimated amounts. One-time termination benefits are expensed at the date we notify the employee, unless the employee must provide future service beyond the statutory minimum retention period, in which case the benefits are expensed ratably over the future service period. Liabilities for costs associated with a facility exit or disposal activity are recognized when the liability is incurred, as opposed to when management commits to an exit plan, and are measured at fair value. Restructuring costs are presented as a separate financial statement line within our consolidated statement of operations.
For jurisdictions in which there are statutorily required minimum benefits for involuntary terminations, or severance benefits documented in an employee manual or labor contract, we evaluate these benefits as ongoing benefit arrangements. We recognize the liability for these arrangements when it is probable that the employee would be entitled to the benefits and the amounts can be reasonably estimated.
Advertising Expense
Our advertising costs are primarily expensed as incurred and included in marketing and selling expense. We capitalize direct response advertising, which consists of customized product sample mailings, and amortize over the expected future revenue stream. Amortization of capitalized advertising costs is determined using historical revenue data. The capitalized costs of direct response advertising are amortized, commencing with the date the product samples are mailed. Capitalized direct response advertising costs included in prepaid expenses and other current assets as of June 30, 2018 and June 30, 2017 was $4,220 and $4,861, respectively. These capitalized costs relate to direct response marketing initiatives of our National Pen business. As part of our adoption of Accounting Standards Update No. 2014-09, "Revenue from Contracts with Customers" (ASU 2014-09) in the first quarter of fiscal 2019, these costs will no longer be capitalized as direct response advertising costs, and will be expensed as incurred. Refer below to the recently issued or adopted accounting pronouncements section for additional details relating to the new standard.
Advertising expense for the years ended June 30 2018, 20172021, 2020 and 20162019 was $432,546, $363,936,$333,665, $302,449 and $305,701,$427,673, respectively, which consisted of external costs related to customer acquisition and retention marketing campaigns.
Research and Development Expense
Research and development costs are expensed as incurred and included in technology and development expense. Research and development expense for the years ended June 30 2018, 20172021, 2020 and 20162019 was $41,451,
$51,811,$49,254, $49,201, and $35,449,$40,976, respectively, which consisted of costs related to enhancing our manufacturing engineering and technology capabilities.
Income Taxes
As part of the process of preparing our consolidated financial statements, we calculate our income taxes in each of the jurisdictions in which we operate. This process involves estimating our current tax expense and deferred tax expense based on assessing temporary and permanent differences resulting from differing treatment of items for tax and financial reporting purposes. We recognize deferred tax assets and liabilities for the temporary differences using the enacted tax rates and laws that will be in effect when we expect temporary differences to reverse. We assess the ability to realize our deferred tax assets based upon the weight of available evidence both positive and negative. To the extent we believe that it is more likely than not that some portion or all of the deferred tax assets will not be realized, we establish a valuation allowance. In the event that actual results differ from our estimates or we adjust our estimates in the future, we may need to increase or decrease income tax expense, which could have a material impact on our financial position and results of operations.
We recognize the tax benefit from an uncertain tax position only if it is more likely than not that the tax position will be sustained upon examination by the taxing authorities, based on the technical merits of the tax position. The tax benefits recognized in our financial statements from such positions are measured as the largest benefit that has a greater than 50% likelihood of being realized upon ultimate resolution. The unrecognized tax benefits will reduce our effective tax rate if recognized. Interest and, if applicable, penalties related to unrecognized tax benefits are recorded in the provision for income taxes. Stranded income tax effects in accumulated other comprehensive income or loss are released on an item-by-item basis based on when the applicable derivative is recognized in earnings. We account for investment tax credits using the “deferral” method, under which the tax benefit from an investment tax credit is deferred and amortized over the book life of the related property.
During the three months ended December 31, 2020, the tax on Global Intangible Low-Taxed Income (“GILTI”) provision of the Tax Cuts and Jobs Act became applicable to our operations. Companies subject to GILTI have the option to account for the GILTI tax as a period cost if and when incurred, or to recognize deferred taxes for temporary differences, including outside basis differences, expected to reverse as GILTI. We elected to account for GILTI as a period cost, as incurred. We do not expect GILTI to have a material impact on our consolidated financial statements.
Foreign Currency Translation
Our non-U.S. dollar functional currency subsidiaries translate their assets and liabilities denominated in their functional currency to U.S. dollars at current rates of exchange in effect at the balance sheet date, and revenues and expenses are translated at average rates prevailing throughout the period. The resulting gains and losses from translation are included as a component of accumulated other comprehensive loss. Transaction gains and losses and remeasurement of assets and liabilities denominated in currencies other than an entity’s functional currency are included in other (expense) income, net in our consolidated statements of operations.
Other (expense) income, net(Expense) Income, Net
The following table summarizes the components of other (expense) income, net: | | | | Year Ended June 30, | | | Year Ended June 30, |
| | 2018 |
| 2017 |
| 2016 | | | 2021 | | 2020 | | 2019 |
| (Losses) gains on derivatives not designated as hedging instruments (1) | $ | (2,687 | ) |
| $ | 936 |
|
| $ | 14,026 |
| (Losses) gains on derivatives not designated as hedging instruments (1) | | $ | (20,728) | | | $ | 20,564 | | | $ | 23,494 | |
| Currency-related (losses) gains, net (2) | (19,500 | ) |
| 5,577 |
|
| 6,864 |
| |
| Other gains (3) | 1,155 |
|
| 3,849 |
|
| 5,208 |
| |
| Currency-related gains (losses), net (2) | | Currency-related gains (losses), net (2) | | 8,523 | | | 2,309 | | | 2,506 | |
| Other gains | | Other gains | | 370 | | | 1 | | | 476 | |
| Total other (expense) income, net | $ | (21,032 | ) |
| $ | 10,362 |
|
| $ | 26,098 |
| Total other (expense) income, net | | $ | (11,835) | | | $ | 22,874 | | | $ | 26,476 | |
_____________________
(1) Primarily relates to both realized and unrealized (losses) gains and losses on derivative currency forward and option contracts and interest rate swaps not designated as hedging instruments.instruments, including losses of $3,422 for the year ended June 30, 2021, related to certain interest rate swap contracts that were de-designated from hedge accounting during the year due to their ineffectiveness, which had an immaterial impact in the comparative periods. As of June 30, 2021 we have redesignated several of our previously dedesignated hedge contracts. Refer to Note 4 for additional information.
(2) We have significant non-functional currency intercompany financing relationships that we may change at times and are subject to currency exchange rate volatility. The currency-related (losses) gains, (losses), net for the years ended June 30, 2018 and 2017 are primarily driven by this intercompany activity.activity for the periods presented. In addition, we have certain cross-currency swaps designated as cash flow hedges which hedge the remeasurement of certain intercompany loans,loans; both are presented in the same component above. Unrealized losses related to cross-currency swaps were $2,722, $3,737 and $1,991$7,211 for the yearsyear ended
June 30, 2018, 2017 and 2016, respectively.
(3) The2021 as compared to unrealized gains recognized during the years ended June 30, 2018 and 2016, were primarily related to insurance recoveries of $675 and $3,947, respectively. During$929 for the year ended June 30, 2017, we recognized a gain2020, and unrealized losses of $2,268 related to$3,484 for the sale of Plaza Create Co. Ltd. available for sale securities.year ended June 30, 2019.
Net (Loss) Income (Loss) Per Share Attributable to Cimpress N.V.plc
Basic net (loss) income (loss) per share attributable to Cimpress N.V.plc is computed by dividing net (loss) income (loss) attributable to Cimpress N.V.plc by the weighted-average number of ordinary shares outstanding for the respective period. Diluted net (loss) income (loss) per share attributable to Cimpress N.V.plc gives effect to all potentially dilutive
securities, including share options, restricted share units (“RSUs”), restricted share awards ("RSAs")warrants, and performance share units ("PSUs"), if the effect of the securities is dilutive using the treasury stock method. Awards with performance or market conditions are included using the treasury stock method only if the conditions would have been met as of the end of the reporting period and their effect is dilutive.
The following table sets forth the reconciliation of the weighted-average number of ordinary shares:
| | | | | | | | | | | | | | | | | | | | | |
| | | | Year Ended June 30, |
| | | | | | 2021 | | 2020 | | 2019 |
| Weighted average shares outstanding, basic | | | | | 25,996,572 | | | 27,180,744 | | | 30,786,349 | |
| Weighted average shares issuable upon exercise/vesting of outstanding share options/RSUs/warrants (1) | | | | | 0 | | | 592,542 | | | 876,356 | |
| Shares used in computing diluted net (loss) income per share attributable to Cimpress plc | | | | | 25,996,572 | | | 27,773,286 | | | 31,662,705 | |
| Weighted average anti-dilutive shares excluded from diluted net (loss) income per share attributable to Cimpress plc (2) | | | | | 494,329 | | | 1,325 | | | 0 | |
|
| | | | | | | | |
| | Year Ended June 30, |
| | 2018 | | 2017 | | 2016 |
| Weighted average shares outstanding, basic | 30,948,081 |
| | 31,291,581 |
| | 31,656,234 |
|
| Weighted average shares issuable upon exercise/vesting of outstanding share options/RSUs/RSAs (1) | 1,272,320 |
| | — |
| | 1,393,220 |
|
| Shares used in computing diluted net income (loss) per share attributable to Cimpress N.V. | 32,220,401 |
| | 31,291,581 |
| | 33,049,454 |
|
| Weighted average anti-dilutive shares excluded from diluted net income (loss) per share attributable to Cimpress N.V. | 2,291 |
| | 21,978 |
| | 35,725 |
|
___________________________(1) In the periods we reportin which a net loss is recognized, the impact of share options, RSUs and RSAswarrants is not included as they are anti-dilutive.
(2) On May 1, 2020, we entered into a financing arrangement with Apollo Global Management, Inc., which included 7-year warrants with a strike price of $60 that have a potentially dilutive impact on our weighted average shares outstanding. For the years ended June 30 2021 and 2020, the weighted average anti-dilutive effect of the warrants was 368,933 and 73,719 shares, respectively. Refer to Note 10 for additional details about the arrangement.
Compensation Expense
Share-based Compensation
Share-based compensation
Compensation expense for all share-based awards is measured at fair value on the date of grant and recognized over the requisite service period. We recognize the impact of forfeitures as they occur. The fair value of share options is determined using the Black-Scholes valuation model, or lattice model for share options with a market condition or subsidiary share options. The fair value of RSUs and RSAs is determined based on the quoted price of our ordinary shares on the date of the grant. Such value is recognized ratably as expense over the requisite service period, or on an accelerated method for awards with a performance or market condition. For awards that are ultimately settleable in cash, we treat them as liability awards and mark the award to market each reporting period recognizing any gain or loss in our statements of operations. For awards with a performance condition vesting feature, compensation cost is recorded if it is probable that the performance condition will be achieved.
In addition to a service vesting
We have issued PSUs, and market condition (based onwe calculate the three year moving average of the Cimpress share price) contained in our standard performance share units, we also issue awards that contain financial performance conditions. These awards with a discretionary performance condition are subject to mark-to-market accountingfair value at grant which is fixed throughout the performance vesting period. The compensation expense for these awardsfair value is estimated at fair valuedetermined using a Monte Carlo simulation valuation modelmodel. As the PSUs include both a service and compensation costs are recorded only if itmarket condition the related expense is probablerecognized using the accelerated expense attribution method over the requisite service period for each separately vesting portion of the award. For PSUs that meet the performanceservice vesting condition, will be achieved. We are required to reassess the probability each reporting period. If we determine the awards are not probable at some point during the performance vesting period we would reverse any expense recognized to date.over the requisite service period will not be reversed if the market condition is not achieved.
Total share-based compensation expense was $37,034, $34,874 and $21,716 for the years ended June 30 2021, 2020 and 2019, respectively.
Sabbatical Leave
Compensation expense associated with a sabbatical leave, or other similar benefit arrangements, is accrued over the requisite service period during which an employee earns the benefit, net of estimated forfeitures, and is included in other liabilities on our consolidated balance sheets.
Concentrations of Credit Risk
We monitor the creditworthiness of our customers to which we grant credit terms in the normal course of business. We do not have any customers that accounted for greater than 10% of our accounts receivable as of June 30, 20182021 and 2017.2020. We do not have any customers that accounted for greater than 10% of our revenue for the years ended June 30, 2018, 20172021, 2020 and 2016.2019.
We maintain an allowance for doubtful accounts for potential credit losses based upon specific customer accounts and historical trends, and such losses to date in the aggregate have not materially exceeded our expectations.
Waltham Lease ArrangementAccounting
In July 2013, we executed
We determine if an arrangement contains a lease agreement to move our Lexington, Massachusetts, USA operations to a then yetat contract inception. We consider an arrangement to be constructed facility in Waltham, Massachusetts, USA. Duringa lease if it conveys the first quarterright to control an identifiable asset for a period of fiscal 2016, the building was completed and we commenced lease payments in September 2015 and will make lease payments through September 2026.
For accounting purposes, we were deemed to be the owner of the Waltham building during the construction period, and accordingly we recorded the construction project costs incurred by the landlordtime. Costs for operating leases that include incentives such as an asset withpayment escalations or rent abatements are recognized on a corresponding financing obligation on our balance sheet. We evaluated the Waltham lease in the first quarter of fiscal 2016 and determined that the transaction did not meet the criteria for "sale-leaseback" treatment due to our planned subleasing activitystraight-line basis over the term of the lease. Accordingly,Additionally, inducements received are treated as a reduction of our costs over the term of the agreement. Leasehold improvements are capitalized at cost and amortized over the shorter of their expected useful life or the lease term, excluding renewal periods.
Lease right-of-use ("ROU") assets and liabilities for operating and finance leases are recognized based on the present value of the future lease payments over the lease term at lease commencement date. As most of our leases do not provide an implicit interest rate, we began depreciatinguse our incremental borrowing rate based on the information available at the lease commencement date. Our incremental borrowing rate approximates the interest rate on a collateralized basis for the economic environments where our leased assets are located, and is established by considering the credit spread associated with our existing debt arrangements, as well as observed market rates for instruments with a similar term to that of the lease payments. ROU assets also include any lease payments made at or before the lease commencement, as well as any initial direct costs incurred. Lease incentives received from the lessor are recognized as a reduction to the ROU asset.
Our initial determination of the lease term is based on the facts and circumstances that exist at lease commencement. The lease term may include the effect of options to extend or terminate the lease when it is reasonably certain that those options will be exercised. We consider these options reasonably certain to be exercised based on our assessment of economic incentives, including the fair market rent for equivalent properties under similar terms and conditions, costs of relocating, availability of comparable replacement assets, and any related disruption to operations that would be experienced by not renewing the lease.
Finance leases are accounted for as an acquisition of an asset and incurring interestincurrence of an obligation. Assets held under finance leases are recorded at the lower of the present value of the minimum lease payments or the fair value of the leased asset at the inception of the lease, and amortized over the useful life of the asset. The corresponding finance lease obligation is recorded at the present value of the minimum lease payments at inception of the lease.
Operating leases are included in operating lease assets and current and non-current operating lease liabilities in the consolidated balance sheets. Finance lease assets are included in property, plant, and equipment, net, and the related liabilities are included in other current liabilities and other liabilities in the consolidated balance sheets.
Variable lease payments are excluded from the operating lease assets and liabilities and are recognized as expense relatedin the period in which the obligation is incurred. Variable lease payments primarily include index-based rent escalation associated with some of our real estate leases, as well as property taxes and common area maintenance payments for most real estate leases, which are determined based on the costs incurred by the lessor. We also make variable lease payments for certain print equipment leases that are determined based on production volumes.
For lease arrangements where we are deemed to be involved in the construction of structural improvements prior to the financingcommencement of the lease or take some level of construction risk, we are considered the owner of the assets during the construction period. Accordingly, as the lessor incurs the construction project costs, the assets and corresponding financial obligation are recorded onin our consolidated balance sheet. We bifurcateOnce the construction is completed, if the lease payments pursuant tomeets certain “sale-leaseback” criteria, we will remove the Waltham lease into (i) a portion that is allocated toasset and related financial obligation from the balance sheet and treat the building and (ii) a portion that is allocated to the landlease as either an operating or finance lease based on which the building was constructed. The portionour
assessment of the guidance. If, upon completion of construction, the project does not meet the “sale-leaseback” criteria, the lease obligations allocated to the land iswill be treated as ana financing obligation and we will depreciate the asset over its estimated useful life for financial reporting purposes.
We have subleased a small amount of our equipment and real estate lease portfolio to third parties, making us the lessor. Most of these subleases meet the criteria for operating lease that commencedclassification and the related sublease income is recognized on a straight-line basis over the lease term within the consolidated statement of operations. To a lesser extent, we have leases in fiscal 2014.
Property, plantwhich we are the lessees, classify the leases as finance leases and equipment, net, included $111,926have subleased the asset under similar terms, resulting in their classification as direct financing leases. For direct financing leases, we recognize a sublease receivable within prepaid expenses and $116,045 as of June 30, 2018other current assets and June 30, 2017, respectively, related toother assets in the building. The financing lease obligation and deferred rent credit related to the building on our consolidated balance sheets was $115,312 and $119,176 as of June 30, 2018 and June 30, 2017, respectively.sheets.
Recently Issued or Adopted Accounting Pronouncements
New Accounting Standards Adopted
In OctoberDecember 2019, the FASB issued Accounting Standards Update No. 2019-12 "Income Taxes (Topic 740): Simplifying the Accounting for Income Taxes" (ASU 2019-12), which modifies certain aspects of income tax accounting. We early adopted the standard on July 1, 2020. For the year ended June 30, 2021, adopting ASU 2019-12 resulted in a $2,771 increased tax expense in our consolidated financial statements, related to the intraperiod allocation rules. Under the intraperiod allocation rules, an entity generally allocates total income tax expense or benefit by first determining the amount attributable to continuing operations and then allocating the remaining tax expense or benefit to items other than continuing operations. An exception existed that required an entity with a loss from continuing operations to consider all components when determining the benefit from continuing operations. ASU 2019-12 removes this exception.
In June 2016, the FASB issued Accounting Standards Update No. 2016-16, "Income Taxes2016-13 "Financial Instruments—Credit Losses (Topic 740): Intra-Entity Transfers of Assets Other Than Inventory"326)" (ASU 2016-16)2016-13), which requires the recognitionintroduces a new accounting model for income tax consequencesrecognizing credit losses on certain financial instruments based on an estimate of an intra-entity transfer of an asset other than inventory when the transfer occurs.current expected credit losses. We elected to early adopt the new standard during the first quarter of fiscal 2018, and recognized a reduction to prepaid and other current assets of $24,573, an increase in deferred tax assets of $18,710 and a cumulative-effect adjustment to retained earnings of $5,863. If we had not early adopted the fiscal 2018 tax expense would be lower by $8,363.
In February 2018, the FASB issued Accounting Standards Update No. 2018-02, "Income Statement - Reporting Comprehensive Income (Topic 220): Reclassificationstandard on its effective date of Certain Tax Effects from Accumulated Other Comprehensive Income" (ASU 2018-02), which allows a reclassification from accumulated other comprehensive income to retained earnings for stranded tax effects resulting from the U.S. Tax Cuts and Jobs Act. We elected to early adopt the new standard during the fourth quarter of fiscal 2018, and reclassified the income tax effects from accumulated other comprehensive income to retained earnings in the amount of $116. We do not expect any additional impacts from the new standard.
Issued Accounting Standards to be Adopted
In August 2017, the FASB issued Accounting Standards Update No. 2017-12, "Derivatives and Hedging: Targeted Improvements to Accounting for Hedging Activities (Topic 815)," (ASU 2017-12), which better aligns a company’s financial reporting for hedging activities with the economic objectives of those activities. The amendment is effective for us on July 1, 2019 and permits early adoption, including adoption in an interim period.2020. The standard requires a modified retrospective transition approach, in which the Company will recognize the cumulative effect of the change on the opening balance of each affected component of equity in the statement of financial position as of the date of adoption. We dodid not expect this standard to have material impact on our consolidated financial statements.
In May 2017, the FASB issued Accounting Standards Update No. 2017-09, "Compensation - Stock Compensation (Topic 718)," (ASU 2017-09), which clarifies the application of Topic 718 when accounting for changes in the terms and conditions of a share-based payment award. The new standard requires changes to the terms or conditions of a share-based payment award to be accounted for under modification accounting unless there is no change to the fair value, vesting conditions and classification of the award after modification. The amendment is effective for us and will be adopted on July 1, 2018. The amendment is to be applied prospectively, and we do not expect it to have a material impact on our consolidated financial statements.
In November 2016,March 2020, the FASB issued Accounting Standards Update No. 2016-18, "StatementASU 2020-04 "Reference Rate Reform ("ASC 848"): Facilitation of Cash Flows (Topic 230) Restricted Cash" (ASU 2016-18)the Effects of Reference Rate Reform on Financial Reporting", which requirescontains optional expedients and exceptions for applying GAAP to contracts, hedging relationships, and other transactions that a statement of cash flows explain the change during the period in the total of cash, cash equivalents, and amounts generally described as restricted cashreference LIBOR or restricted cash equivalents. Therefore, amounts generally described as restricted cash and restricted cash equivalents should be included with cash and cash equivalents when reconciling the beginning-of-period and end-of-period total amounts shown on the statement of cash flows. The amendment is effective for us and will be adopted on July 1, 2018. This amendment will affect the presentation of our statement of cash flows once adopted, and we do not expect it to have material impact on our consolidated financial statements.
In March 2016, the FASB issued Accounting Standards Update No. 2016-04, "Liabilities - Extinguishment of Liabilities (Subtopic 405-20): Recognition of Breakage for Certain Prepaid Stored-Value Products" (ASU 2016-04), which requires an entity to recognize breakage for a liability resulting from the sale of a prepaid stored-value product in proportion to the pattern of rightsanother reference rate expected to be exerciseddiscontinued due to reference rate reform. We adopted the standard on October 1, 2020. We elected to amend our hedge documentation, without dedesignating and redesignating, for all outstanding cash flow hedges by applying two practical expedients. We elected the product holder onlyexpedient in ASC 848-50-25-2 to the extent that it is probable that a significant reversalassert probability of the recognized breakage amount will not subsequently occur. The new standard is effective for ushedged interest payments regardless of any expected modification in terms related to reference rate reform. In addition, we elected to continue the method of assessing effectiveness as documented in the original hedge documentation and elected to apply the expedient in ASC 848-50-35-17, so that the reference rate on July 1, 2018.the hypothetical derivative matches the reference rate on the hedging instrument. The standard permits early adoption and should be applied either retrospectively to each period presented or by means of a cumulative adjustment to retained earnings as of the beginning of the fiscal year adopted. We dodid not expect the effect of ASU 2016-04 to have a material impact on our consolidated financial statements.
Issued Accounting Standards to be Adopted
In March 2016,May 2021, the FASB issued Accounting Standards Update No. 2016-02, "Leases2021-04 "Earnings Per Share (Topic 842)260), Debt—Modifications and Extinguishments (Subtopic 470-50), Compensation—Stock Compensation (Topic 718), and Derivatives and Hedging—Contracts in Entity’s Own Equity (Subtopic 815-40)" (ASU 2016-02)2021-04), which requiresprovides authoritative guidance for the recognitionaccounting for modifications or exchanges of lease assets and lease liabilities by lessees for those leases currentlyfreestanding equity-classified written call options (for example, warrants) that remain equity classified as operating leases.after modification or exchange. The standard also retains a distinction between finance leases and operating leases. The new standard is effective for us on July 1, 20192022, and we expect to adopt the new standard using the modified retrospective approach. We also plan to use the transition relief package, in which we will not reassess the classification of our existing leases, whether any expired or existing contracts contain leases and if our existing leases have any initial direct costs.early adoption is permitted. We are currently evaluatingassessing the requirements of the standard and we have not yet determined the impact of adoption on our consolidated financial statements.
In May 2014, the FASB issued Accounting Standards Update No. 2014-09, "Revenue from Contracts with Customers" (ASU 2014-09), which requires an entity to recognize the amount of revenue to which it expects to be entitled for the transfer of promised goods or services to customers. This guidance will replace most existing revenue recognition guidance in U.S. GAAP when it becomes effective. The new standard is effective for fiscal years beginning after December 15, 2017, which would result in an effective date for us of July 1, 2018. The standard permits the use of either the retrospective or modified retrospective method. We will adopt the new standard in the first quarter of fiscal 2019, and we will apply the modified retrospective approach.
We have completed our impact assessment of the new standard, which was performed on a business by business basis through a review of contract terms and material revenue streams. We have identified an impact related to direct-response advertising costs, which are costs currently capitalized and expensed based on the guidance outlined in ASC 340 - "Other Assets and Deferred Assets". The guidance included in ASC 340 has been eliminated, and under the new revenue standard these costs will be expensed as incurred because they do not meet the requirements for capitalization since they are not direct and incremental to obtaining a contract. We expect this change to impact the timing for a portion of advertising expenses within our National Pen business, but we do not expect it to have a material impact on our consolidated results. By applying the modified retrospective approach for implementing the standard, we expect to adjust approximately $3,800 of capitalized costs as of June 30, 2018 to retained earnings during the first quarter of fiscal 2019.We have also identified an impact related to customer loyalty programs that are offered by several of our businesses. Under the new revenue standard, the rewards associated with these programs will be recognized as an additional performance obligation, resulting in an allocation of the transaction price and deferral of revenue until the subsequent reward redemption. We do not expect this change to have a material impact on our consolidated results.
We are continuing to make changes to certain processes and internal controls, in order to address the impacts of the new standard, which we expect to finalize during the first quarter of fiscal 2019. Lastly, we are continuing to evaluate the disclosure requirements of the new standard.
3. Fair Value Measurements
We use a three-level valuation hierarchy for measuring fair value and include detailed financial statement disclosures about fair value measurements. The valuation hierarchy is based upon the transparency of inputs to the valuation of an asset or liability as of the measurement date. The three levels are defined as follows:
•Level 1: Inputs to the valuation methodology are quoted prices (unadjusted) for identical assets or liabilities in active markets.
•Level 2: Inputs to the valuation methodology include quoted prices for similar assets and liabilities in active markets, quoted prices for identical or similar assets in markets that are not active and inputs that are observable for the asset or liability, either directly or indirectly, for substantially the full term of the financial instrument.
•Level 3: Inputs to the valuation methodology are unobservable and significant to the fair value measurement.
A financial instrument’s categorization within the valuation hierarchy is based upon the lowest level of input that is significant to the fair value measurement. The following tables summarize our assets and liabilities that are measured at fair value on a recurring basis and are categorized using the fair value hierarchy:
| | | | | | | | | | | | | | | | | | | | | | | |
| | June 30, 2021 |
| Total | | Quoted Prices in
Active
Markets for
Identical Assets
(Level 1) | | Significant Other
Observable Inputs
(Level 2) | | Significant
Unobservable
Inputs
(Level 3) |
| Assets | | | | | | | |
| | | | | | | |
| | | | | | | |
| Currency forward contracts | $ | 1,679 | | | $ | — | | | $ | 1,679 | | | $ | — | |
| | | | | | | |
| Total assets recorded at fair value | $ | 1,679 | | | $ | — | | | $ | 1,679 | | | $ | — | |
| | | | | | | |
| Liabilities | | | | | | | |
| Interest rate swap contracts | $ | (25,193) | | | $ | — | | | $ | (25,193) | | | $ | — | |
| Cross-currency swap contracts | (9,914) | | | — | | | (9,914) | | | — | |
| Currency forward contracts | (19,651) | | | — | | | (19,651) | | | — | |
| Currency option contracts | (3,080) | | | — | | | (3,080) | | | — | |
| Total liabilities recorded at fair value | $ | (57,838) | | | $ | — | | | $ | (57,838) | | | $ | — | |
|
| | | | | | | | | | | | | | | |
| | June 30, 2018 |
| | Total | | Quoted Prices in Active Markets for Identical Assets (Level 1) | | Significant Other Observable Inputs (Level 2) | | Significant Unobservable Inputs (Level 3) |
| Assets | | | | | | | |
| Interest rate swap contracts | $ | 13,370 |
| | $ | — |
| | $ | 13,370 |
| | $ | — |
|
| Currency forward contracts | 9,202 |
| | — |
| | 9,202 |
| | — |
|
| Currency option contracts | 1,782 |
| | — |
| | 1,782 |
| | — |
|
| Total assets recorded at fair value | $ | 24,354 |
| | $ | — |
| | $ | 24,354 |
| | $ | — |
|
| | | | | | | | |
| Liabilities | | | | | | | |
| Cross-currency swap contracts | $ | (25,348 | ) | | $ | — |
| | $ | (25,348 | ) | | $ | — |
|
| Currency forward contracts | (14,201 | ) | | — |
| | (14,201 | ) | | — |
|
| Currency option contracts | (85 | ) | | — |
| | (85 | ) | | — |
|
| Total liabilities recorded at fair value | $ | (39,634 | ) | | $ | — |
| | $ | (39,634 | ) | | $ | — |
|
| | | | June 30, 2017 | | June 30, 2020 |
| | Total | | Quoted Prices in Active Markets for Identical Assets (Level 1) | | Significant Other Observable Inputs (Level 2) | | Significant Unobservable Inputs (Level 3) | | Total | | Quoted Prices in
Active
Markets for
Identical Assets
(Level 1) | | Significant Other
Observable Inputs
(Level 2) | | Significant
Unobservable
Inputs
(Level 3) |
| Assets | | | | | | | | Assets | | | | | | | |
| Interest rate swap contracts | $ | 1,717 |
| | $ | — |
| | $ | 1,717 |
| | $ | — |
| Interest rate swap contracts | $ | 4,462 | | | $ | — | | | $ | 4,462 | | | $ | — | |
| Currency forward contracts | | Currency forward contracts | 7,949 | | | — | | | 7,949 | | | — | |
| Currency option contracts | | Currency option contracts | 1,429 | | | — | | | 1,429 | | | — | |
| Total assets recorded at fair value | $ | 1,717 |
| | $ | — |
| | $ | 1,717 |
| | $ | — |
| Total assets recorded at fair value | $ | 13,840 | | | $ | — | | | $ | 13,840 | | | $ | — | |
| | | | | | | | | | | | | | | | |
| Liabilities | | | | | | | | Liabilities | |
| Interest rate swap contracts | $ | (483 | ) | | $ | — |
| | $ | (483 | ) | | $ | — |
| Interest rate swap contracts | $ | (39,520) | | | $ | — | | | $ | (39,520) | | | $ | — | |
| Cross-currency swap contracts | (19,760 | ) | | — |
| | (19,760 | ) | | — |
| Cross-currency swap contracts | (4,746) | | | — | | | (4,746) | | | — | |
| Currency forward contracts | (14,700 | ) | | — |
| | (14,700 | ) | | — |
| Currency forward contracts | (8,519) | | | — | | | (8,519) | | | — | |
| Currency option contracts | (651 | ) | | — |
| | (651 | ) | | — |
| Currency option contracts | (38) | | | — | | | (38) | | | — | |
| Contingent consideration | (5,453 | ) | | — |
| | — |
| | (5,453 | ) | |
| Total liabilities recorded at fair value | $ | (41,047 | ) | | $ | — |
| | $ | (35,594 | ) | | $ | (5,453 | ) | Total liabilities recorded at fair value | $ | (52,823) | | | $ | — | | | $ | (52,823) | | | $ | — | |
During the years ended June 30, 20182021 and 2017,2020, there were no significant transfers in or out of Level 1, Level 2 and Level 3 classifications.
The valuations of the derivatives intended to mitigate our interest rate and currency risk are determined using widely accepted valuation techniques, including discounted cash flow analysis on the expected cash flows of each instrument. This analysis utilizes observable market-based inputs, including interest rate curves, interest rate volatility, or spot and forward exchange rates, and reflects the contractual terms of these instruments, including the period to maturity. We incorporate credit valuation adjustments to appropriately reflect both our own nonperformance risk and the respective counterparties' nonperformance risk in the fair value measurements. In adjusting the fair value of our derivative contracts for the effect of nonperformance risk, we have considered the impact of netting and any applicable credit enhancements.
Although we have determined that the majority of the inputs used to value our derivatives fall within Level 2 of the fair value hierarchy, the credit valuation adjustments associated with our derivatives utilize Level 3 inputs, such as estimates of current credit spreads, to appropriately reflect both our own nonperformance risk and the respective counterparties' nonperformance risk in the fair value measurement. However, as of June 30, 2018,2021, we have assessed the significance of the impact of the credit valuation adjustments on the overall valuation of our derivative positions and have determined that the credit valuation adjustments are not significant to the overall valuation of our derivatives. As a result, we have determined that our derivative valuations in their entirety are classified in Level 2 in the fair value hierarchy.
Contingent consideration obligations are measured at fair value and are based on significant inputs not observable in the market, which represents a Level 3 measurement within the fair value hierarchy. The valuation of contingent consideration uses assumptions and estimates to forecast a range of outcomes and probabilities for the contingent consideration. Certain contingent consideration obligations are valued using a Monte Carlo simulation model. We assess these assumptions and estimates on a quarterly basis as additional data impacting the assumptions is obtained. Any changes in the fair value of contingent consideration related to updated assumptions and estimates will be recognized within general and administrative expenses in the consolidated statements of operations during the period in which the change occurs.
Our acquisition of WIRmachenDRUCK on February 1, 2016 included a variable contingent payment up to €40,000 based on the achievement of a cumulative gross profit target for calendar years 2016 and 2017. During the fourth quarter of fiscal 2017, we determined it was reasonably certain, based on recent performance, that the maximum earn-out would be achieved. On January 2, 2018, we paid the maximum amount of €40,000 ($48,069 based on the exchange rate on the day of payment) and $5,951 of the amount paid is considered contingent consideration and included in the table below.
The following table represents the changes in fair value of Level 3 contingent consideration: |
| | | |
| | Total Contingent Consideration |
| Balance at June 30, 2016 (1) | $ | 1,212 |
|
| Fair value adjustment | 4,030 |
|
| Foreign currency impact | 211 |
|
| Balance at June 30, 2017 (1) | $ | 5,453 |
|
| Fair value adjustment | 220 |
|
| Cash payments | (5,951 | ) |
| Foreign currency impact | 278 |
|
| Balance at June 30, 2018 (1) | $ | — |
|
_____________________
(1) The contingent consideration relates to the WIRmachenDUCK earn-out arrangement, which was paid on January 2, 2018. As of June 30, 2017, contingent consideration was classified as a current liability on the consolidated balance sheet. As of June 30, 2016 the liability was classified as a long-term liability on the consolidated balance sheet.
As of June 30, 20182021 and June 30, 2017,2020, the carrying amounts of our cash and cash equivalents, accounts receivable, accounts payable and other current liabilities approximated their estimated fair values. As of June 30, 20182021 and June 30, 20172020, the carrying value of our debt, excluding debt issuance costs and debt premiums and discounts, was$839,4291,764,856 and $882,578,$1,482,177, respectively, and the fair value was $847,520$1,767,209 and $906,744,$1,450,719, respectively. Our debt at June 30, 20182021 includes variable ratevariable-rate debt instruments indexed to LIBOR that resets periodically, and fixed rateas well as fixed-rate debt instruments. The estimated fair value of our debt was determined using available market information based on recent trades or activity of debt instruments with substantially similar risks, terms and maturities, which fall within Level 2 under the fair value hierarchy.
As of June 30, 2021 our held-to-maturity marketable securities are held at an amortized cost of $202,961 and the fair value was $202,786, and we did not hold any such securities as of June 30, 2020. The securities are valued using quoted prices for identical assets in active markets, which fall into Level 1 under the fair value hierarchy.
The estimated fair value of assets and liabilities disclosed above may not be representative of actual values that could have been or will be realized in the future.
4. Derivative Financial Instruments
We use derivative financial instruments, such as interest rate swap contracts, cross-currency swap contracts, and currency forward and option contracts, to manage interest rate and foreign currency exposures. Derivatives are recorded in the consolidated balance sheets at fair value. If the derivative is designated as a cash flow hedge or net investment hedge, then the effective portion of changeschange in the fair value of the derivative is recorded in accumulated other comprehensive loss and is subsequently reclassified into earnings in the period the hedged forecasted transaction affects earnings. If a derivative is deemed to be ineffective, then the ineffective portion of the change in fair value of the derivativeAdditionally, any ineffectiveness associated with an effective and designated hedge is recognized directly in earnings. within accumulated other comprehensive loss.
The change in the fair value of derivatives not designated as hedges is recognized directly in earnings as a component of other (expense) income, net.
Hedges of Interest Rate Risk
We enter into interest rate swap contracts to manage variability in the amount of our known or expected cash payments related to a portion of our debt. Our objective in using interest rate swaps is to add stability to interest expense and to manage our exposure to interest rate movements. We designate our interest rate swaps as cash flow hedges. Interest rate swaps designated as cash flow hedges involve the receipt of variable amounts from a counterparty in exchange for us making fixed-rate payments over the life of the contract agreements without exchange of the underlying notional amount. Realized gains or losses from interest rate swaps are recorded in earnings as a component of interest expense, net. A portion of six of our interest rate swap contracts was deemed to be ineffective during the year ended June 30, 2018 and during the year ended June 30, 2017 a portion of two of our interest rate swap contracts was deemed to be ineffective.
Amounts reported in accumulated other comprehensive loss related to interest rate swap contracts will be reclassified to interest expense, net as interest payments are accrued or made on our variable-rate debt. As of June 30, 2018,2021, we estimate that $730 of income$10,942 will be reclassified from accumulated other comprehensive loss to interest expense during the twelve months ending June 30, 2019.2022. As of June 30, 2018,2021, we had nine14 outstanding interest rate swap contracts indexed to USD LIBOR.LIBOR, threeof which are not highly effective and are therefore not designated for hedge accounting. These instruments were designated as cash flow hedges of interest rate risk and have varying start dates and maturity dates through December 2025.April 2028.
|
| | | | |
| Interest rate swap contracts outstanding: | | Notional Amounts |
| Contracts accruing interest as of June 30, 2018 | | $ | 115,000 |
|
| Contracts with a future start date | | 300,000 |
|
| Total | | $ | 415,000 |
|
| | | | | | | | |
| Interest rate swap contracts outstanding: | | Notional Amounts |
| Contracts accruing interest as of June 30, 2021 | | $ | 500,000 | |
| Contracts with a future start date | | 330,000 | |
| Total | | $ | 830,000 | |
Hedges of Currency Risk
Cross-Currency Swap Contracts
From time to time, we execute cross-currency swap contracts designated as cash flow hedges or net investment hedges. Cross-currency swaps involve an initial receipt of the notional amount in the hedge currency in exchange for our reporting currency based on a contracted exchange rate. Subsequently, we receive fixed rate payments in our reporting currency in exchange for fixed rate payments in the hedged currency over the life of the contract. At maturity, the final exchange involves the receipt of our reporting currency in exchange for the notional amount in the hedged currency.
Cross-currency swap contracts designated as cash flow hedges are executed to mitigate our currency exposure to the interest receipts as well as the principal remeasurement and repayment associated with certain intercompany loans denominated in a currency other than our reporting currency, the U.S. Dollar.dollar. As of June 30, 2018,2021, we had two2 outstanding cross-currency swap contracts designated as cash flow hedges with a total notional amount of $120,011,$120,874, both maturing during June 2019.2024. We entered into the two cross-currency swap contracts to hedge the risk of changes in one Euro denominatedEuro-denominated intercompany loan entered into with one of our consolidated subsidiaries that has the Euro as its functional currency.
Amounts reported in accumulated other comprehensive loss will be reclassified to other (expense) income, net as interest payments are accrued or paid and upon remeasuring the intercompany loan. As of June 30, 2018,2021, we estimate that $1,387 $2,488of income will be reclassified from accumulated other comprehensive loss to interest expense, net during the twelve months ending June 30, 2019.
Cross-currency swap contracts designated as net investment hedges are executed to mitigate our currency exposure of net investments in subsidiaries that have reporting currencies other than the U.S. Dollar. As of June 30, 2018, we had two outstanding cross-currency swap contracts designated as net investment hedges with a total notional amount of $122,969, both maturing during April 2019. We entered into the two cross-currency swap contracts to hedge the risk of changes in the U.S. Dollar equivalent value of a portion of our net investment in a consolidated subsidiary that has the Euro as its functional currency. Amounts reported in accumulated other comprehensive loss are recognized as a component of our cumulative translation adjustment.
We did not hold any ineffective cross-currency swaps during the years ended June 30, 2018, 2017 and 2016.2022.
Other Currency Contracts
We execute currency forward and option contracts in order to mitigate our exposure to fluctuations in various currencies against our reporting currency, the U.S. Dollar.dollar.
As of June 30, 2018,2021, we had six4 currency forward contracts designated as net investment hedges with a total notional amount of $175,262,$118,203, maturing during various dates through October 2022. April 2023. We entered into these contracts to hedge the risk of changes in the U.S. Dollardollar equivalent value of a portion of our net investment in two consolidated subsidiariesthat have the Euro as their functional currency. Amounts reported in accumulated other comprehensive loss are recognized as a component of our cumulative translation adjustment.
We have elected to not apply hedge accounting for all other currency forward and option contracts. During the years ended June 30, 2018, 20172021, 2020 and 2016,2019, we have experienced volatility within other (expense) income, net in our consolidated statements of operations from unrealized gains and losses on the mark-to-market of outstanding currency forward and option contracts. We expect this volatility to continue in future periods for contracts for which we do not apply hedge accounting. Additionally, since our hedging objectives may be targeted at non-GAAP
financial metrics that exclude non-cash items such as depreciation and amortization, we may experience increased, not decreased, volatility in our GAAP results as a result of our currency hedging program.
As of June 30,
2018,2021, we had the following outstanding currency derivative contracts that were not designated for hedge accounting and were used to hedge fluctuations in the U.S.
Dollardollar value of forecasted transactions
or balances denominated in Australian Dollar, British Pound, Canadian Dollar, Danish Krone, Euro, Indian Rupee,
Japanese Yen, Mexican Peso, New Zealand Dollar, Norwegian Krone, Philippine Peso, Swiss Franc and Swedish Krona: | | | Notional Amount | | Effective Date | | Maturity Date | | Number of Instruments | | Index | Notional Amount | | Effective Date | | Maturity Date | | Number of Instruments | | Index |
| $606,461 | | March 2017 through June 2018 | | Various dates through June 2020 | | 518 | | Various | |
| $499,084 | | $499,084 | | September 2019 through June 2021 | | Various dates through October 2024 | | 596 | | Various |
Financial Instrument Presentation
The table below presents the fair value of our derivative financial instruments as well as their classification on the balance sheet as of June 30, 20182021 and June 30, 2017.2020. Our derivative asset and liability balances will fluctuate with interest rate and currency exchange rate volatility.
| | | | | | | | | | | | | | | | | | | | | | | | | | | | | | | | | | | | | | | | | | | | | | | |
| June 30, 2021 |
| Asset Derivatives | | Liability Derivatives |
| Balance Sheet line item | | Gross amounts of recognized assets | | Gross amount offset in Consolidated Balance Sheet | | Net amount | | Balance Sheet line item | | Gross amounts of recognized liabilities | | Gross amount offset in Consolidated Balance Sheet | | Net amount |
| Derivatives designated as hedging instruments | | | | | | | | | | | | | | | |
| Derivatives in cash flow hedging relationships | | | | | | | | | | | | | | | |
| Interest rate swaps | Other current assets / other assets | | $ | 0 | | | $ | 0 | | | $ | 0 | | | Other current liabilities / other liabilities | | $ | (23,527) | | | $ | 176 | | | $ | (23,351) | |
| Cross-currency swaps | Other assets | | 0 | | | — | | | 0 | | | Other liabilities | | (9,914) | | | 0 | | | (9,914) | |
| Derivatives in net investment hedging relationships | | | | | | | | | | | | | | | |
| | | | | | | | | | | | | | | |
| Currency forward contracts | Other assets | | 0 | | | 0 | | | 0 | | | Other current liabilities / other liabilities | | (11,379) | | | 0 | | | (11,379) | |
| Total derivatives designated as hedging instruments | | | $ | 0 | | | $ | 0 | | | $ | 0 | | | | | $ | (44,820) | | | $ | 176 | | | $ | (44,644) | |
| | | | | | | | | | | | | | | |
| Derivatives not designated as hedging instruments | | | | | | | | | | | | | | | |
| Interest rate swaps | Other assets | | $ | — | | | $ | — | | | $ | — | | | Other liabilities | | $ | (1,842) | | | $ | 0 | | | $ | (1,842) | |
| Currency forward contracts | Other current assets / other assets | | 1,796 | | | (117) | | | 1,679 | | | Other current liabilities / other liabilities | | (11,510) | | | 3,238 | | | (8,272) | |
| Currency option contracts | Other current assets / other assets | | 0 | | | 0 | | | 0 | | | Other current liabilities / other liabilities | | (3,315) | | | 235 | | | (3,080) | |
| Total derivatives not designated as hedging instruments | | | $ | 1,796 | | | $ | (117) | | | $ | 1,679 | | | | | $ | (16,667) | | | $ | 3,473 | | | $ | (13,194) | |
|
| | | | | | | | | | | | | | | | | | | | | | | | | | | |
| | June 30, 2018 |
| | Asset Derivatives | | Liability Derivatives |
| Derivatives designated as hedging instruments | Balance Sheet line item | | Gross amounts of recognized assets | | Gross amount offset in Consolidated Balance Sheet | | Net amount | | Balance Sheet line item | | Gross amounts of recognized liabilities | | Gross amount offset in Consolidated Balance Sheet | | Net amount |
| Derivatives in cash flow hedging relationships | | | | | | | | | | | | | | | |
| Interest rate swaps | Other current assets / other assets | | $ | 13,374 |
| | $ | (4 | ) | | $ | 13,370 |
| | Other current liabilities / other liabilities | | $ | — |
| | $ | — |
| | $ | — |
|
| Cross-currency swaps | Other current assets | | — |
| | — |
| | — |
| | Other current liabilities | | (10,659 | ) | | — |
| | (10,659 | ) |
| Derivatives in net investment hedging relationships | | | | | | | | | | | | | | | |
| Cross-currency swaps | Other current assets | | — |
| | — |
| | — |
| | Other current liabilities | | (14,689 | ) | | — |
| | (14,689 | ) |
| Currency forward contracts | Other non-current assets | | — |
| | — |
| | — |
| | Other current liabilities / other liabilities | | (13,387 | ) | | — |
| | (13,387 | ) |
| Total derivatives designated as hedging instruments |
| | $ | 13,374 |
| | $ | (4 | ) | | $ | 13,370 |
| |
| | $ | (38,735 | ) | | $ | — |
| | $ | (38,735 | ) |
| | | | | | | | | | | | | | | | |
| Derivatives not designated as hedging instruments | | | | | | | | | | | | | | | |
| Currency forward contracts | Other current assets / other assets | | $ | 10,433 |
| | $ | (1,231 | ) | | $ | 9,202 |
| | Other current liabilities / other liabilities | | $ | (1,080 | ) | | $ | 266 |
| | $ | (814 | ) |
| Currency option contracts | Other current assets / other assets | | 1,782 |
| | — |
| | 1,782 |
| | Other current liabilities / other liabilities | | (85 | ) | | — |
| | (85 | ) |
| Total derivatives not designated as hedging instruments | | | $ | 12,215 |
| | $ | (1,231 | ) | | $ | 10,984 |
| |
| | $ | (1,165 | ) | | $ | 266 |
| | $ | (899 | ) |
| | | | | | | | | | | | | | | | | | | June 30, 2020 |
| June 30, 2017 | | Asset Derivatives | | Liability Derivatives |
| Asset Derivatives |
| Liability Derivatives | | Balance Sheet line item | | Gross amounts of recognized assets | | Gross amount offset in Consolidated Balance Sheet | | Net amount | | Balance Sheet line item | | Gross amounts of recognized liabilities | | Gross amount offset in Consolidated Balance Sheet | | Net amount |
| Derivatives designated as hedging instruments | Balance Sheet line item |
| Gross amounts of recognized assets |
| Gross amount offset in Consolidated Balance Sheet |
| Net amount |
| Balance Sheet line item |
| Gross amounts of recognized liabilities |
| Gross amount offset in Consolidated Balance Sheet |
| Net amount | Derivatives designated as hedging instruments | | | | | | | | | | | | | | | |
| Derivatives in cash flow hedging relationships | | | | | | | | | | | | | | | Derivatives in cash flow hedging relationships | |
| Interest rate swaps | Other non-current assets |
| $ | 2,072 |
|
| $ | (355 | ) |
| $ | 1,717 |
|
| Other current liabilities / other liabilities |
| $ | (483 | ) |
| $ | — |
|
| $ | (483 | ) | Interest rate swaps | Other current assets / other assets | | $ | 0 | | | $ | 0 | | | $ | 0 | | | Other liabilities | | $ | (31,161) | | | $ | 0 | | | $ | (31,161) | |
| Cross-currency swaps | Other non-current assets |
| — |
|
| — |
|
| — |
|
| Other liabilities |
| (7,640 | ) |
| — |
|
| (7,640 | ) | Cross-currency swaps | Other assets | | 4,462 | | | 0 | | | 4,462 | | | Other liabilities | | (4,746) | | | 0 | | | (4,746) | |
| Derivatives in net investment hedging relationships | | | | | | | | | | | | | Derivatives in net investment hedging relationships | |
| Cross-currency swaps | Other non-current assets |
| — |
|
| — |
|
| — |
|
| Other liabilities |
| (12,120 | ) |
| — |
|
| (12,120 | ) | |
| Currency forward contracts | Other non-current assets |
| — |
|
| — |
|
| — |
|
| Other liabilities |
| (9,896 | ) |
| — |
|
| (9,896 | ) | Currency forward contracts | Other assets | | — | | | — | | | — | | | Other current liabilities / other liabilities | | (6,829) | | | 0 | | | (6,829) | |
| Total derivatives designated as hedging instruments |
| $ | 2,072 |
|
| $ | (355 | ) |
| $ | 1,717 |
|
|
| $ | (30,139 | ) |
| $ | — |
|
| $ | (30,139 | ) | Total derivatives designated as hedging instruments | | $ | 4,462 | | | $ | 0 | | | $ | 4,462 | | | $ | (42,736) | | | $ | 0 | | | $ | (42,736) | |
|
|
|
|
|
|
|
|
|
|
|
|
|
| | | | | | | | | | | | |
| Derivatives not designated as hedging instruments |
|
|
|
|
|
|
|
|
|
|
|
|
| Derivatives not designated as hedging instruments | |
| Interest rate swaps | | Interest rate swaps | Other assets | | $ | — | | | $ | — | | | $ | — | | | Other liabilities | | $ | (8,359) | | | $ | 0 | | | $ | (8,359) | |
| Currency forward contracts | Other current assets / other assets |
| $ | — |
|
| $ | — |
|
| $ | — |
|
| Other current liabilities / other liabilities |
| $ | (8,033 | ) |
| $ | 3,229 |
|
| $ | (4,804 | ) | Currency forward contracts | Other current assets / other assets | | 9,702 | | | (1,753) | | | 7,949 | | | Other current liabilities / other liabilities | | (2,136) | | | 446 | | | (1,690) | |
| Currency option contracts | Other current assets / other assets | | — |
| | — |
| | — |
| | Other current liabilities / other liabilities | | (651 | ) | | — |
| | (651 | ) | Currency option contracts | Other current assets / other assets | | 1,699 | | | (270) | | | 1,429 | | | Other current liabilities / other liabilities | | (38) | | | 0 | | | (38) | |
| Total derivatives not designated as hedging instruments |
| $ | — |
|
| $ | — |
|
| $ | — |
|
|
| $ | (8,684 | ) |
| $ | 3,229 |
|
| $ | (5,455 | ) | Total derivatives not designated as hedging instruments | | $ | 11,401 | | | $ | (2,023) | | | $ | 9,378 | | | $ | (10,533) | | | $ | 446 | | | $ | (10,087) | |
The following table presents the effect of the effective portion of our derivative financial instruments designated as hedging instruments and their classification within comprehensive (loss) income (loss) for the years ended June 30, 2018, 20172021, 2020 and 2016:2019:
| | | | | | | | | | | | | | | | | | | | | | | |
| | | | | Amount of Net Gain (Loss) on Derivatives Recognized in Comprehensive Income | | |
| | | Year Ended June 30, | | |
| | | | | 2021 | | 2020 | | 2019 | | |
| Derivatives in cash flow hedging relationships | | | | | | | | | | | |
| Interest rate swaps | | | | | $ | 3,340 | | | $ | (28,259) | | | $ | (20,400) | | | |
| Cross-currency swaps | | | | | 6,996 | | | 3,689 | | | (3,009) | | | |
| Derivatives in net investment hedging relationships | | | | | | | | | | | |
| Cross-currency swaps | | | | | 0 | | | 0 | | | 6,557 | | | |
| Currency forward contracts | | | | | (19,052) | | | 21,240 | | | 14,726 | | | |
| Total | | | | | $ | (8,716) | | | $ | (3,330) | | | $ | (2,126) | | | |
|
| | | | | | | | | | | |
| Derivatives in Hedging Relationships | Amount of Gain (Loss) Recognized in Comprehensive Income (Loss) on Derivatives |
| | Year Ended June 30, |
| | 2018 | | 2017 | | 2016 |
| Derivatives in cash flow hedging relationships | | | | | |
| Interest rate swaps | $ | 8,545 |
| | $ | 2,287 |
| | $ | (1,736 | ) |
| Cross-currency swaps | 2,976 |
| | (3,584 | ) | | (769 | ) |
| Derivatives in net investment hedging relationships | | | | | |
| Cross-currency swaps | (1,476 | ) | | (3,721 | ) | | 2,951 |
|
| Currency forward contracts | (3,490 | ) | | (8,362 | ) | | (81 | ) |
| | $ | 6,555 |
| | $ | (13,380 | ) | | $ | 365 |
|
The following table presents reclassifications out of accumulated other comprehensive loss for the years ended June 30, 2018, 20172021, 2020 and 2016:2019: | | | | | | | | | | | | Amount of Net Gain (Loss) Reclassified from Accumulated Other Comprehensive Income (Loss) into Income | Affected line item in the
Statement of Operations |
Details about Accumulated Other Comprehensive Loss Components | Amount of Net Gain (Loss) Reclassified from Accumulated Other Comprehensive Income (Loss) into Income | | Affected line item in the Statement of Operations | |
| | Year Ended June 30, | | | | | Year Ended June 30, | |
| | 2018 | | 2017 | | 2016 | | | | 2021 | | 2020 | | 2019 | |
| Derivatives in cash flow hedging relationships | | | | | | | Derivatives in cash flow hedging relationships | | | | | | | |
| Interest rate swaps | $ | 70 |
| | $ | (205 | ) | | $ | (947 | ) | | Interest expense, net | Interest rate swaps | | $ | 6,967 | | | $ | 3,041 | | | $ | 144 | | Interest expense, net |
| Cross-currency swaps | (1,379 | ) | | (1,621 | ) | | (1,171 | ) | | Other (expense) income, net | Cross-currency swaps | | (10,950) | | | 4,583 | | | 5,098 | | Other (expense) income, net |
| Total before income tax | (1,309 | ) | | (1,826 | ) | | (2,118 | ) | | Income (loss) before income taxes | Total before income tax | | (3,983) | | | 7,624 | | | 5,242 | | (Loss) income before income taxes |
| Income tax | 349 |
| | 457 |
| | 531 |
| | Income tax expense | Income tax | | (106) | | | (1,850) | | | (1,310) | | Income tax expense (benefit) |
| Total | $ | (960 | ) | | $ | (1,369 | ) | | $ | (1,587 | ) | | Total | | $ | (4,089) | | | $ | 5,774 | | | $ | 3,932 | | |
The following table presents the adjustment to fair value recorded within the consolidated statements of operations for the years ended June 30, 2021, 2020 and 2019 for derivative instruments for which we did not elect hedge accounting as well as the effect of the ineffective portion and de-designated derivative financial instruments that no longer qualify as hedging instruments in the period:instruments.
| | | | | | | | | | | | | | | | | | | | | | | | | |
| | | | | | Amount of Gain (Loss) Recognized in Net (Loss) Income | Affected line item in the
Statement of Operations |
| | | | Year Ended June 30, | |
| | | | | | 2021 | | 2020 | | 2019 | |
| Currency contracts | | | | | | $ | (24,235) | | | $ | 20,882 | | | $ | 24,215 | | Other (expense) income, net |
| Interest rate swaps | | | | | | 3,507 | | | (318) | | | (721) | | Other (expense) income, net |
| Total | | | | | | $ | (20,728) | | | $ | 20,564 | | | $ | 23,494 | | |
|
| | | | | | | | | | | | | |
| | Amount of Gain (Loss) Recognized in Net Income (Loss) | | Location of Gain (Loss) Recognized in Income (Ineffective Portion) |
| | Year Ended June 30, | | |
| | 2018 | | 2017 | | 2016 | | |
| Derivatives not designated as hedging instruments | | | | | | | |
| Currency contracts | $ | (2,942 | ) | | $ | 663 |
| | $ | 14,037 |
| | Other (expense) income, net |
| Interest rate swaps | 255 |
| | 273 |
| | (11 | ) | | Other (expense) income, net |
| | $ | (2,687 | ) | | $ | 936 |
| | $ | 14,026 |
| | |
5. Accumulated Other Comprehensive LossIncome (Loss)
The following table presents a roll forward of amounts recognized in accumulated other comprehensive lossincome (loss) by component, net of tax of$1,371, $(710),764, $1,709, and$293 $5,901 for the years ended June 30, 2018, 20172021, 2020 and 20162019, respectively: | | | | | | | | | | | | | | Gains (losses) on cash flow hedges (1) | | | Losses on pension benefit obligation | | Translation adjustments, net of hedges (2) | | Total |
| Gains (losses) on cash flow hedges (1) | | Gains (losses) on available for sale securities | | Gains (losses) on pension benefit obligation | | Translation adjustments, net of hedges (2) | | Total | |
| Balance as of June 30, 2015 | $ | (1,405 | ) | | $ | 2,971 |
| | $ | (3,112 | ) | | $ | (97,363 | ) | | $ | (98,909 | ) | |
| Balance as of June 30, 2018 | | Balance as of June 30, 2018 | $ | 8,195 | | | | $ | 0 | | | $ | (78,009) | | | $ | (69,814) | |
| Other comprehensive (loss) income before reclassifications | | Other comprehensive (loss) income before reclassifications | (23,409) | | | | (204) | | | 9,638 | | | (13,975) | |
| Amounts reclassified from accumulated other comprehensive loss to net income | | Amounts reclassified from accumulated other comprehensive loss to net income | 3,932 | | | | — | | | — | | | 3,932 | |
| Net current period other comprehensive (loss) income | | Net current period other comprehensive (loss) income | (19,477) | | | | (204) | | | 9,638 | | | (10,043) | |
| Balance as of June 30, 2019 | | Balance as of June 30, 2019 | (11,282) | | | | (204) | | | (68,371) | | | (79,857) | |
| Other comprehensive (loss) income before reclassifications | | Other comprehensive (loss) income before reclassifications | (24,570) | | | | (1,195) | | | 11,172 | | | (14,593) | |
| Amounts reclassified from accumulated other comprehensive loss to net income | | Amounts reclassified from accumulated other comprehensive loss to net income | 5,774 | | | | — | | | — | | | 5,774 | |
| Net current period other comprehensive (loss) income | | Net current period other comprehensive (loss) income | (18,796) | | | | (1,195) | | | 11,172 | | | (8,819) | |
| Balance as of June 30, 2020 | | Balance as of June 30, 2020 | (30,078) | | | | (1,399) | | | (57,199) | | | (88,676) | |
| Other comprehensive income (loss) before reclassifications | (2,504 | ) | | 517 |
| | 561 |
| | (9,267 | ) | | (10,693 | ) | Other comprehensive income (loss) before reclassifications | 10,336 | | | | (336) | | | 3,765 | | | 13,765 | |
| Amounts reclassified from accumulated other comprehensive loss to net income (loss) | 1,587 |
| | — |
| | — |
| | — |
| | 1,587 |
| |
| Amounts reclassified from accumulated other comprehensive loss to net (loss) income | | Amounts reclassified from accumulated other comprehensive loss to net (loss) income | (4,089) | | | | — | | | — | | | (4,089) | |
| Net current period other comprehensive income (loss) | (917 | ) | | 517 |
| | 561 |
| | (9,267 | ) | | (9,106 | ) | Net current period other comprehensive income (loss) | 6,247 | | | | (336) | | | 3,765 | | | 9,676 | |
| Balance as of June 30, 2016 | (2,322 | ) | | 3,488 |
| | (2,551 | ) | | (106,630 | ) | | (108,015 | ) | |
| Other comprehensive income (loss) before reclassifications | (1,297 | ) | | (5,756 | ) | | 2,194 |
| | (4,161 | ) | | (9,020 | ) | |
| Amounts reclassified from accumulated other comprehensive loss to net income (loss) | 1,369 |
| | 2,268 |
| | — |
| | — |
| | 3,637 |
| |
| Net current period other comprehensive income (loss) | 72 |
| | (3,488 | ) | | 2,194 |
| | (4,161 | ) | | (5,383 | ) | |
| Balance as of June 30, 2017 | (2,250 | ) | | — |
| | (357 | ) | | (110,791 | ) | | (113,398 | ) | |
| Amounts reclassified from accumulated other comprehensive loss to retained earnings | (116 | ) | | — |
| | — |
| | — |
| | (116 | ) | |
| Other comprehensive income (loss) before reclassifications | 11,521 |
| | — |
| | 59 |
| | 32,782 |
| | 44,362 |
| |
| Amounts reclassified from accumulated other comprehensive loss to net income (loss) | (960 | ) | | — |
| | 298 |
| | — |
| | (662 | ) | |
| Net current period other comprehensive income (loss) | 10,561 |
| | — |
| | 357 |
| | 32,782 |
| | 43,700 |
| |
| Balance as of June 30, 2018 | $ | 8,195 |
| | $ | — |
| | $ | — |
| | $ | (78,009 | ) | | $ | (69,814 | ) | |
| Balance as of June 30, 2021 | | Balance as of June 30, 2021 | $ | (23,831) | | | | $ | (1,735) | | | $ | (53,434) | | | $ | (79,000) | |
________________________
(1) Gains (losses) on cash flow hedges include our interest rate swap and cross-currency swap contracts designated in cash flow hedging relationships.
(2) As of June 30, 2018, 20172021 and 2016,June 30, 2020, the translation adjustment is inclusive of the effects of our net investment hedges, of which, unrealized lossesgains of $22,014, $17,048,$1,457 and $4,965$20,509, respectively, net of tax, have been included in accumulated other comprehensive loss.
6. Property, Plant and Equipment, Net
Property, plant, and equipment, net consists of the following:
| | | | | | | | | | | | | | | | | |
| | | | June 30, |
| | Estimated useful lives | | 2021 | | 2020 |
| Land improvements | 10 years | | $ | 5,053 | | | $ | 4,975 | |
| Building and building improvements (1) | 10 - 30 years | | 191,653 | | | 186,873 | |
| | | | | |
| Machinery and production equipment | 4 - 10 years | | 380,013 | | | 362,341 | |
| Machinery and production equipment under finance lease | 4 - 10 years | | 73,321 | | | 64,337 | |
| Computer software and equipment | 3 - 5 years | | 119,742 | | | 160,728 | |
| Furniture, fixtures and office equipment | 5 - 7 years | | 38,357 | | | 47,823 | |
| Leasehold improvements | Shorter of lease term or expected life of the asset | | 64,060 | | | 73,072 | |
| Construction in progress | | | 7,242 | | | 10,752 | |
| | | 879,441 | | | 910,901 | |
| Less accumulated depreciation, inclusive of assets under finance lease | | | (583,752) | | | (604,061) | |
| | | | 295,689 | | | 306,840 | |
| Land | | | 32,990 | | | 31,819 | |
| Property, plant, and equipment, net | | | $ | 328,679 | | | $ | 338,659 | |
|
| | | | | | | | | |
| | | | June 30, |
| | Estimated useful lives | | 2018 | | 2017 |
| Land improvements | 10 years | | $ | 3,440 |
| | $ | 2,235 |
|
| Building and building improvements | 10 - 30 years | | 310,947 |
| | 319,822 |
|
| Machinery and production equipment | 4 - 10 years | | 299,760 |
| | 274,813 |
|
| Machinery and production equipment under capital lease | 4 - 10 years | | 67,702 |
| | 54,673 |
|
| Computer software and equipment | 3 - 5 years | | 166,523 |
| | 165,812 |
|
| Furniture, fixtures and office equipment | 5 - 7 years | | 43,010 |
| | 41,612 |
|
| Leasehold improvements | Shorter of lease term or expected life of the asset | | 53,753 |
| | 51,582 |
|
| Construction in progress | | | 11,734 |
| | 12,240 |
|
| | | | 956,869 |
| | 922,789 |
|
| Less accumulated depreciation, inclusive of assets under capital lease | | | (505,803 | ) | | (443,273 | ) |
| | | | 451,066 |
| | 479,516 |
|
| Land | | | 32,598 |
| | 32,431 |
|
| Property, plant, and equipment, net | | | $ | 483,664 |
| | $ | 511,947 |
|
(1) Building and building improvements assets as of June 30, 2021, increased by $15,860 as compared to the prior year due to the change in classification of one of our leased facilities from an operating lease to a finance lease due to our intention to exercise the existing purchase option. Refer to Note 16 for further details. This increase was offset by our building and building improvements depreciation expense recorded during the year.
Depreciation expense, inclusive of assets under capitalfinance leases, totaled $87,956,$71,057, $87,145,74,665 and $76,435$84,558 for the years ended June 30 2018, 20172021, 2020, and 2016,2019, respectively.
7. Business Combinations and Divestitures
Fiscal 2018 divestiture
Divestiture of Albumprinter
On August 31, 2017 we sold our Albumprinter business, including FotoKnudsen AS, for a total of €78,382 ($93,071 based on the exchange rate as of the date of sale) in cash, net of transaction costs and cash divested (after $11,874 in pre-closing dividends). As a result of the sale, we recognized a gain of $47,545, net of transaction costs, within our consolidated statement of operations for the year ended June 30, 2018. In connection with the divestiture, we entered into an agreement with Albumprinter under which Albumprinter will continue to fulfill photo book orders for our Vistaprint business. Additionally, we agreed to provide Albumprinter with certain transitional support services for a period of up to one year from the date of the sale.
The transaction did not qualify for discontinued operations presentation, and as of June 30, 2017, the Albumprinter business assets and liabilities were presented as held-for-sale in our consolidated balance sheet.
Fiscal 2017 acquisition
Acquisition of National Pen Co. LLC99designs, Inc.
On December 30, 2016,October 1, 2020, we acquired 100%99designs, Inc. and its subsidiaries ("99designs"), a global creative platform for graphic design. We acquired all outstanding shares of the equity interestscompany for a purchase price of National Pen Co. LLC, a manufacturer and marketer of custom writing instruments for small- and medium-sized businesses. At closing, we paid $214,573 in cash,$90,000, subject to post closing adjustmentsa post-closing adjustment based on acquired cash, debt, and working capital balances. Duringas of the third quarter of fiscal 2017, we finalizedclosing date. We paid $45,000 in cash at closing and received payment forwill pay the post closingremaining purchase consideration, including the post-closing adjustment, which reduced the purchase price by $1,941.on February 15, 2022. The acquisition supportsis managed within our strategyVistaprint business and provides a global platform that connects designers and clients, making it easier for small businesses to build competitively differentiated supply chain capabilities that we can make available via our mass customization platform, which we bring to market through a portfolio of focused brands.access both professional design services and marketing products in one place. We expect National Pen will also complementthe synergies achieved through integration with the 99designs designer network to provide significant benefits to our organic investments in technology and supply chain capabilities for promotional products, apparel and gift offerings.Vistaprint business.
The table below details the consideration transferred to acquire National Pen:99designs:
|
| | | | | | |
| Cash consideration | $ | 214,573 |
|
| Final post closing adjustment | (1,941 | ) |
| Total purchase price | $ | 212,632 |
|
The excess | | | | | |
| Cash consideration (paid at closing) | $ | 45,000 | |
| Fair value of deferred payment | 43,381 | |
| Final post closing adjustment | 310 | |
| Total purchase price | $ | 88,691 | |
We recognized the assets and liabilities on the basis of their fair values at the date of the acquisition with any excess of the purchase price paid over the fair value of National Pen'sthe net assets was recorded as goodwill, which is primarily attributable to the value of its workforce, its manufacturing and marketing process and know-how, as well as synergies which include leveraging National Pen's scale-based sourcing channels, integrating into our mass customization platform, and supportingthat we expect to achieve through the development of its e-commerce platform. Weacquisition. The goodwill balance has been attributed $34,520 of goodwill to the National Pen reportable segment, and allocated $23,200 of goodwill to the Vistaprint segment for certain synergies that are expected to be realized by the Vistaprint segment asreporting unit and a resultportion of the acquisition. The amount ofsuch goodwill thatbalance is deductible for tax purposes is approximately $19,000.purposes. Additionally, we identified and valued 99designs intangible assets which include their trade name, designer network, and developed technology.
The fair value of the assets acquired and liabilities assumed was:
| | | | | | | | | | | | | | |
| | Amount | | Weighted Average Useful Life in Years |
| Tangible assets acquired and liabilities assumed: | | | | |
| Cash and cash equivalents | | $ | 8,603 | | | n/a |
| Accounts receivable, net | | 494 | | | n/a |
| Prepaid expenses and other current assets | | 787 | | | n/a |
| Property, plant and equipment, net | | 73 | | | n/a |
| Other assets | | 142 | | | n/a |
| Accounts payable | | (220) | | | n/a |
| Accrued expenses | | (6,299) | | | n/a |
| Deferred revenue | | (5,806) | | | n/a |
| Other liabilities | | (625) | | | n/a |
| Identifiable intangible assets: | | | | |
| Trade name | | 1,550 | | | 2 years |
| Developed technology | | 13,400 | | | 3 years |
| Designer network | | 5,800 | | | 7 years |
| Goodwill | | 70,792 | | | n/a |
| Total purchase price | | $ | 88,691 | | | n/a |
|
| | | | | |
| | Amount | | Weighted Average Useful Life in Years |
| Tangible assets acquired and liabilities assumed (1): | | | |
| Cash and cash equivalents | $ | 8,337 |
| | n/a |
| Accounts receivable, net | 20,921 |
| | n/a |
| Inventory | 19,854 |
| | n/a |
| Other current assets | 11,281 |
| | n/a |
| Property, plant and equipment, net | 29,472 |
| | n/a |
| Other non-current assets | 1,270 |
| | n/a |
| Accounts payable | (12,590 | ) | | n/a |
| Accrued expenses | (17,805 | ) | | n/a |
| Other current liabilities | (908 | ) | | n/a |
| Deferred tax liabilities | (3,255 | ) | | n/a |
| Long-term liabilities | (9,665 | ) | | n/a |
| Identifiable intangible assets: | | | |
| Developed Technology | 19,000 |
| | 6 |
| Trade Name | 33,000 |
| | 11 |
| Customer Relationships | 56,000 |
| | 7 |
| Goodwill | 57,720 |
| | n/a |
| Total purchase price | $ | 212,632 |
| | |
(1) National Pen has materially impacted our working capital balances post-acquisition, resulting in increased accounts receivable, inventory, accounts payable and accrued expenses balances in our consolidated balance sheet.
National Pen Pro Forma Financial Information
National Pen99designs has been included in our consolidated financial statements starting on its acquisition date. The following unaudited pro formarevenue and earnings of 99designs included in our consolidated financial statements for the year ended June 30, 2021 are not material, and therefore no proforma financial information presentsis presented. We used our results as if the National Pen acquisition had occurred on July 1, 2015. The pro forma financial information for all periods presented adjusts for the effects of material business combination items, including estimated amortization of acquired intangible assets and transaction related costs. The unaudited pro forma results are not necessarily indicative of what actually would have occurred had the acquisition been in effect for the periods presented as the pre-acquisition results include revenue and profit related to certain operations that are no longer active:
|
| | | | | | | | |
| | Year Ended June 30, |
| 2017 | | 2016 |
| Pro forma revenue | $ | 2,294,347 |
| | $ | 2,060,426 |
|
| Pro forma net (loss) income attributable to Cimpress N.V. | (71,084 | ) | | 41,370 |
|
We utilized proceeds from ournow amended senior secured credit facility in order to finance the acquisition. In connection with the acquisition, we incurred $2,005$1,183 in general and administrative expenses during the year ended June 30, 2017,2021, primarily related to legal, financial, and other professional services.
Fiscal 2016 acquisitions
Other Acquisition
Acquisition of WIRmachenDRUCK GmbH
On February 1, 2016,April 23, 2021 we acquired 100%completed a tuck-in acquisition of a fast growing company with an attractive product capability as part of our BuildASign business, acquiring approximately 81% of the outstandingcompany's shares for the total consideration of WIRmachenDRUCK GmbH, a web-to-print business focused primarily$18,535. We recognized the assets, liabilities and noncontrolling interest on the German market. At closing, we paid €138,383 ($150,128 based on the exchange rate asbasis of their fair values at the date of acquisition) in cash and transferred €8,121 ($8,810 based on the exchange rate as of the date of acquisition) in ordinary shares of Cimpress N.V. We paid €1,850 in cash ($2,082 based on the exchange rate on the date of payment) during the fourth quarter of fiscal 2016 as a post-closing adjustment based on WIRmachenDRUCK's net cash and working capital position as of the acquisition, date.
In addition, we agreed to a sliding scale earn-outresulting in goodwill of up to €40,000 ($43,395 based on the exchange rate as of the date of acquisition) based on the achievement of a cumulative gross profit target$14,208 which is not deductible for calendar years 2016tax purposes. This acquisition will be presented within our All Other Businesses segment. The revenue and 2017. The maximum earn-out was paid in cash during the third quarter of 2018. Refer to Note 9 for additional discussion relating to the earn-out arrangement.
The acquisition supports our strategy to invest in and build customer-focused entrepreneurial, mass customization businesses for the long-term, which we manage in a decentralized and autonomous manner and complements similar previous investments in Europe. WIRmachenDRUCK brings internet-based capabilities that aggregate and route large numbers of small orders to a network of specialized production partners. Their outsourced supply chain model allows them to compete across a vast selection of product types, formats, sizes, finishing options and delivery choices.
Our consolidated financial statements include WIRmachenDRUCK from February 1, 2016, the date of acquisition. WIRmachenDRUCK's revenueearnings included in our consolidated revenuesfinancial statements for the year ended June 30, 2016 was $72,620. WIRmachenDRUCK's net income included in our consolidated net income attributable to Cimpress N.V. for the year ended June 30, 2016 was $3,420, inclusive of amortization of identifiable intangible assets but exclusive of earn-out related compensation expense and corporate level interest expense.
The table below details the consideration transferred to acquire WIRmachenDRUCK:
|
| | | |
| Cash consideration | $ | 152,100 |
|
| Cimpress N.V. shares transferred | 8,810 |
|
| Fair value of contingent consideration | 1,185 |
|
| Total consideration | $ | 162,095 |
|
The excess of the purchase price paid over the fair value of WIRmachenDRUCK's net assets was recorded as goodwill, which is primarily attributed to expected expansion of the customer base and value of the workforce of WIRmachenDRUCK. Goodwill is2021 are not expected to be deductible for tax purposes, and has been attributed to our Upload and Print reportable segment. The fair value of the assets acquired and liabilities assumed was:
|
| | | | | |
| | Amount | | Weighted Average Useful Life in Years |
| Tangible assets acquired and liabilities assumed | | | |
| Cash and cash equivalents | $ | 15,220 |
| | n/a |
| Other current assets | 5,231 |
| | n/a |
| Other non-current assets | 1,259 |
| | n/a |
| Accounts payable and other current liabilities | (17,566 | ) | | n/a |
| Deferred tax liability | (26,863 | ) | | n/a |
| Identifiable intangible assets: | | | |
| Customer relationships | 24,952 |
| | 7 |
| Trade name | 24,952 |
| | 15 |
| Print network | 23,867 |
| | 9 |
| Referral network | 10,849 |
| | 7 |
| Developed technology | 8,679 |
| | 3 |
| Goodwill | 91,515 |
| | n/a |
| Total purchase price | $ | 162,095 |
| | |
Other fiscal 2016 acquisitions
During fiscal 2016, we acquired two businesses that were not material to our results either individually or in the aggregate. Complementing our Upload and Print segment, we acquired all of the outstanding capital stock of Tradeprint Distribution Limited (formerly known as Fairprint Distribution Limited) and Litotipografia Alcione S.r.l. on July 31, 2015 and July 29, 2015, respectively. The aggregate consideration for these two acquisitions was $25,547, net of cash acquired. The consideration was allocated to the fair value of the assets acquired and liabilities assumed based on estimated fair values as of the respective acquisition dates. The aggregate allocation to goodwill, intangible assets, and net tangible assets was $9,571, $14,359 and $1,617, respectively. During the third quarter of fiscal 2017 we recognized a charge for the full impairment of goodwill and a portion of the intangible assets related to the Tradeprint reporting unit. Refer to our discussion in Note 8 for additional details of the impairment loss.
Goodwill is calculated as the excess of the consideration over the fair value of the net assets, including intangible assets, and is primarily related to expected synergies from the transactions. The goodwill for these two acquisitions is not deductible for tax purposes, and has been attributed to our Upload and Print reportable segment. The results of these acquisitions have been included in the consolidated financial statements from the date of purchase and were not material for the year ended June 30, 2016.material. We utilized proceeds from our now amended senior secured credit facility to finance our fiscal 2016 acquisitions. In connection with these acquisitions, we incurred transaction costs related to investment banking, legal, financial, and other professional services of $1,289 during the year ended June 30, 2016. We have not presented pro forma results of the operations of the companies we acquired in fiscal 2016 because the effects of the acquired companies are not material to our consolidated financial statements.acquisition.
8. Goodwill and Acquired Intangible AssetsIntangibles
Goodwill
The carrying amount of goodwill by reportable segment as of June 30, 20182021 and June 30, 2017 is2020 was as follows: |
| | | | | | | | | | | | | | | | | | | |
| Vistaprint |
| Upload and Print |
| National Pen | | All Other Businesses |
| Total |
| Balance as of June 30, 2016 | $ | 121,752 |
|
| $ | 319,373 |
|
| $ | — |
| | $ | 24,880 |
|
| $ | 466,005 |
|
| Acquisitions (1) | — |
|
| — |
|
| 57,720 |
| | — |
|
| 57,720 |
|
| Impairments (2) | — |
| | (6,345 | ) | | — |
| | — |
| | (6,345 | ) |
| Adjustments (3)(4) | 23,200 |
|
| (228 | ) |
| (23,200 | ) | | (13,540 | ) |
| (13,768 | ) |
| Effect of currency translation adjustments (5) | 2,255 |
| | 9,005 |
|
| — |
| | 91 |
|
| 11,351 |
|
| Balance as of June 30, 2017 | 147,207 |
|
| 321,805 |
|
| 34,520 |
| | 11,431 |
|
| 514,963 |
|
| Adjustments | (58 | ) | | — |
| | (86 | ) | | — |
| | (144 | ) |
| Effect of currency translation adjustments (5) | (942 | ) | | 6,966 |
| | — |
| | — |
| | 6,024 |
|
| Balance as of June 30, 2018 | $ | 146,207 |
| | $ | 328,771 |
| | $ | 34,434 |
| | $ | 11,431 |
| | $ | 520,843 |
|
| | | | | | | | | | | | | | | | | | | | | | | | | | | | | | | |
| Vistaprint | | PrintBrothers | | The Print Group | | | | All Other Businesses | | Total |
| Balance as of June 30, 2019 | $ | 145,961 | | | $ | 124,089 | | | $ | 198,363 | | | | | $ | 216,033 | | | $ | 718,880 | |
| Acquisitions (1) | 0 | | | 6,879 | | | 0 | | | | | 0 | | | 6,879 | |
| | | | | | | | | | | |
| Impairment (2) | — | | | — | | | (40,391) | | | | | (26,017) | | | (100,842) | |
| Adjustments (3) | 3,919 | | | — | | | — | | | | | (3,919) | | | 0 | |
| Effect of currency translation adjustments (4) | 966 | | | (1,204) | | | (2,775) | | | | | 0 | | | (3,013) | |
| Balance as of June 30, 2020 | $ | 150,846 | | | $ | 129,764 | | | $ | 155,197 | | | | | $ | 186,097 | | | $ | 621,904 | |
| Acquisitions (1) | 70,792 | | | 0 | | | 0 | | | | | 14,208 | | | 85,000 | |
| | | | | | | | | | | |
| | | | | | | | | | | |
| | | | | | | | | | | |
| Effect of currency translation adjustments (4) | 3,509 | | | 7,543 | | | 9,023 | | | | | 0 | | | 20,075 | |
| Balance as of June 30, 2021 | $ | 225,147 | | | $ | 137,307 | | | $ | 164,220 | | | | | $ | 200,305 | | | $ | 726,979 | |
_________________
(1) In fiscal year 2021, we acquired 99designs, which is included in our Vistaprint reportable segment, and an immaterial acquisition included within our All Other Businesses reportable segment. In fiscal year 2020, we recognized goodwill related to an immaterial acquisition within our PrintBrothers reportable segment. Refer to Note 7 for additional details related to our acquisitions.information.
(2) InDuring the third quarter of fiscal 2017year 2020 we recordedrecognized an impairment charge of $6,345 related to our Tradeprint reporting unit. Seegoodwill; please refer below for additional details.further detail.
(3) We allocated $23,200 of goodwillDue to changes in the Vistaprint segment for certain synergies that are expected to be realized by the Vistaprint segment as a result of the National Pen acquisition. Refer to Note 7 for additional details.
(4) Our Albumprinter business, partcomposition of our All Other Businesses reportable segment, was reclassified as held for sale on the consolidated balance sheet at June 30, 2017. The Albumprinter business was soldsegments during the first quarter of fiscal 2018. Referyear 2020, we reclassified the goodwill associated with our Vistaprint Corporate Solutions reporting unit from All Other Businesses to Note 7 for additional details.our Vistaprint reportable segment.
(5)(4) Related to goodwill held by subsidiaries whose functional currency is not the U.S. Dollar.dollar.
Impairment Review
Fiscal 2018Year 2021 Annual Impairment Test
For ourOur goodwill accounting policy establishes an annual goodwill impairment test asdate of May 31, 2018,31. As described below, we evaluated eachidentified triggering events during the third quarter of fiscal year 2021 that required an interim period impairment analysis for three of our tenreporting units in response to disruptions associated with the prolonged impacts of the COVID-19 pandemic. For our annual impairment assessment, we performed a qualitative test for all nine reporting units with goodwill, individually. We consideredwhich focused on comparing key performance indicators between the timingpandemic-related financial models used in our quantitative test during the prior year assessment, to the actual performance through our annual test date. For the three reporting units that were tested based on the third quarter triggering event, we evaluated any new information since March 2021 and assessed if any facts and circumstances have changed since that assessment that would provide any indication of impairment, and noted no such indicators.
For each of our most recent fair value assessmentremaining six reporting units, we compared our current performance and associated headroom, the actual operating resultsprojections as compared to the prior year models. We assessed key financial metrics as compared to the prior year projections in addition to assessing any changes to long term forecasts versus the prior year. Our goodwill analysis requires significant judgment, including the identification of reporting units and the amount and timing of expected future cash flow forecasts used in thoseflows. While we believe our assumptions are reasonable, actual results could differ from our projections. Lastly, we considered macroeconomic factors, as well as the headroom between our estimated fair value assessments,and carrying value from our prior year impairment analysis. Based on the current long-term forecasts for each reporting unit, and the general market and economic environment of each reporting unit. After performing this qualitative assessment for seven of our reporting units,analysis performed, we determinedconcluded that there was no indication the carrying values of those reporting units exceeded their respective fair values.
Some of our reporting units are early-stage businesses that are subject to high degrees of risk and their business models continually evolve as they seek to establish foundations in large markets, resulting in greater volatility in their actual results and forecasted future results. We have a number of investments that fit this profile and we expect this type of volatility to prompt a quantitative analysis in our goodwill impairment testing from time to time. We performed a quantitative analysis for three such reporting units during this testing cycle in order to gain additional assurance there were no impairments. We estimated the fair value of each reporting unit, using the income approach, which was determined based on the present value of estimated future cash flows. The cash flow projections are based on our estimates of revenue growth rates and operating margins, taking into consideration recent business and market trends. The discount rates used were based on the weighted-average cost of capital adjusted for the related business-specific risks. For eachany of these reporting units, we compared the estimated fair value to the carrying value, and considered the estimated level of headroom. Based on the substantial level of headroom associated with each of these reporting units, we concluded there was no impairment. As a result of these qualitative and quantitative tests, there have been no identified impairments for the year ended June 30, 2018.units.
Q3 Fiscal 2017Year 2021 Triggering Event
During the third quarter of fiscal 2017,year 2021, we changed the compositionevaluated whether any triggering events exist across each of our Tradeprint reporting unit (aunits to determine whether an impairment analysis is necessary. We identified triggering events for our Druck, Easyflyer and Exaprint reporting units, due in part to the reemergence of new pandemic-related lockdowns and restrictions in certain European countries which has resulted in a more prolonged reduction to cash flows when compared to the cash flows forecasted in our Upload and Print reportable segment). This change, when combined with an updated profit outlookmost recent impairment analysis that was lower than originally forecasted asperformed during the third quarter of the acquisition date, indicated that it was more likely than not that the fair value of the reporting unit was below the carrying amount.fiscal 2020.
As required, prior to performing the quantitative goodwill impairment test, we first evaluated the recoverability of the Tradeprint long-lived assets as the change in expected long-term cash flows wasis indicative of a potential impairment. We performed the recoverability test using undiscounted cash flows for our Tradeprintthe asset groupgroups of all three reporting units and concluded that anno impairment of long-lived assets existed. We proceeded to estimate the fair value the assets, using an income and cost approach based on market participant assumptions and recognized a partial impairment charge for our acquired intangible assets of $3,211.exists.
Subsequent to
After performing the long-lived asset impairmentassets recoverability test, we performed our goodwill impairment test which resulted in an additional impairment chargea quantitative assessment of the total goodwill of the Tradeprintthree reporting units and compared the carrying value to the estimated fair value. For each reporting unit, of $6,345. In order to execute the quantitative goodwill impairment test, we compared theestimated fair value of the Tradeprint reporting unit to itsexceeded the related carrying value.value and we concluded that no impairment exists. We used the income approach, specifically the discounted cash flow method, to derive the fair value. This approach calculates fair value by estimating the after-tax cash flows attributable to a reporting unit and then discounting the after-tax cash flows to a present value using a risk-adjusted discount rate. We selected this method as being the most meaningful in preparing our goodwill assessment as we believedbelieve the income approach most appropriately measuredmeasures our income producing assets. We considered using the market approach but concluded it was not appropriate in valuing thisthese particular reporting unitunits given the lack of relevant market comparisons available for application of the market approach. available.
The cash flow projections in the Tradeprint fair value analysis are based onconsidered Level 3 inputs, and consist of management's estimates of revenue growth rates and operating margins, taking into consideration historical results, as well as industry and market conditions. The discount rate used in the fair value analysis is based on a weighted average cost of capital (“WACC”),capital.
Although some of our businesses are experiencing prolonged impacts from the pandemic that we expect will have a negative impact on near-term cash flows, we believe that these negative impacts are temporary. We did not identify triggering events for the reporting units that are performing better than previously estimated or maintained significant headroom in our most recent analysis.
Fiscal Year 2020
During the third quarter of fiscal year 2020, nearly all of our businesses had experienced significant declines in revenue during the month of March, due to the disruptions associated with the COVID-19 pandemic. As a result, we concluded that a triggering event existed for all ten reporting units with goodwill, which representedrequired us to perform an impairment test in the average ratecurrent quarter. We estimated the near-term financial impacts of this economic disruption and utilized different scenarios that evaluate outcomes that would indicate more or less severe demand declines, as well as different time horizons for the post-pandemic recovery period.
For seven of our reporting units, a business must pay its providerssignificant level of debtheadroom existed between the estimated fair value and equity, pluscarrying value of the reporting units at our May 31, 2019 test date, and significant headroom remained after considering the deterioration in cash flow due to COVID-19 or the reporting unit was recently acquired, resulting in no indication of impairment. For three of our reporting units, we identified triggering events that extend beyond the near-term impacts of the pandemic, which include reductions to the long-term profitability outlooks for our Exaprint, National Pen and VIDA reporting units. As a risk premium.result of the considerations noted, we concluded it was more likely than not that the fair value of each of these three reporting units are below each of their respective carrying amount.
Our goodwill impairment test resulted in impairment charges to our Exaprint reporting unit, included within The WACCPrint Group reportable segment, the National Pen reporting unit, and our VIDA reporting unit, included within our All Other Business reportable segment. Based on the goodwill impairment test performed, we recognized the following impairment charges during the three months ended March 31, 2020:
•A partial impairment of 11.5% used to test the Tradeprint goodwill was derived from a group of comparable companies.our Exaprint reporting unit of $40,391
•A full impairment of the goodwill of our National Pen reporting unit of $34,434
•A full impairment of the goodwill of our VIDA reporting unit of $26,017
Acquired Intangible Assets
| | | | June 30, 2018 | | June 30, 2017 | | June 30, 2021 | | June 30, 2020 |
| | Gross
Carrying
Amount | | Accumulated
Amortization | | Net
Carrying
Amount | | Gross Carrying Amount | | Accumulated Amortization | | Net Carrying Amount | | Gross
Carrying
Amount | | Accumulated
Amortization | | Net
Carrying
Amount | | Gross
Carrying
Amount | | Accumulated
Amortization | | Net
Carrying
Amount |
| Trade name | $ | 99,102 |
| | $ | (23,821 | ) | | $ | 75,281 |
| | $ | 97,728 |
| | $ | (14,839 | ) | | $ | 82,889 |
| Trade name | $ | 152,347 | | | $ | (59,432) | | | $ | 92,915 | | | $ | 144,168 | | | $ | (45,570) | | | $ | 98,598 | |
| Developed technology | 55,460 |
| | (39,218 | ) | | 16,242 |
| | 55,423 |
| | (28,943 | ) | | 26,480 |
| Developed technology | 99,905 | | | (71,255) | | | 28,650 | | | 84,171 | | | (56,763) | | | 27,408 | |
| Customer relationships | 182,545 |
| | (70,655 | ) | | 111,890 |
| | 179,715 |
| | (44,475 | ) | | 135,240 |
| Customer relationships | 199,294 | | | (152,410) | | | 46,884 | | | 190,329 | | | (123,857) | | | 66,472 | |
| Customer network and other | 16,289 |
| | (8,312 | ) | | 7,977 |
| | 16,291 |
| | (6,185 | ) | | 10,106 |
| Customer network and other | 22,301 | | | (14,431) | | | 7,870 | | | 15,847 | | | (11,696) | | | 4,151 | |
| Print network | 25,716 |
| | (6,905 | ) | | 18,811 |
| | 25,171 |
| | (3,962 | ) | | 21,209 |
| Print network | 26,182 | | | (15,757) | | | 10,425 | | | 24,743 | | | (12,144) | | | 12,599 | |
| Total intangible assets | $ | 379,112 |
| | $ | (148,911 | ) | | $ | 230,201 |
| | $ | 374,328 |
| | $ | (98,404 | ) | | $ | 275,924 |
| Total intangible assets | $ | 500,029 | | | $ | (313,285) | | | $ | 186,744 | | | $ | 459,258 | | | $ | (250,030) | | | $ | 209,228 | |
Acquired intangible assets amortization expense for the years ended June 30 2018, 20172021, 2020 and 2016 was$49,881,$46,1452019 was $53,818, $51,786 and $40,563. During the year ended June 30, 2018, the increase in acquired intangible asset amortization is primarily related to our fiscal 2017 acquisition of National Pen.$53,256 respectively. Estimated intangible assets amortization expense for each of the five succeeding fiscal years and thereafter is as follows:
|
| | | | |
| 2019 | | $ | 42,582 |
|
| 2020 | | 37,967 |
|
| 2021 | | 37,859 |
|
| 2022 | | 36,297 |
|
| 2023 | | 28,386 |
|
| | | $ | 183,091 |
|
| | | | | | | | |
| | |
| 2022 | | $ | 50,749 | |
| 2023 | | 41,425 | |
| 2024 | | 27,263 | |
| 2025 | | 15,103 | |
| 2026 | | 10,827 | |
| Thereafter | | 41,377 | |
| | $ | 186,744 | |
9. Other Balance Sheet Components
Accrued expenses included the following:
| | | | | | | | | | | |
| | June 30, 2021 | | June 30, 2020 |
| Compensation costs | $ | 73,861 | | | $ | 67,307 | |
| Income and indirect taxes | 46,074 | | | 53,161 | |
| Advertising costs (1) | 35,093 | | | 14,746 | |
| Shipping costs | 9,401 | | | 5,080 | |
| Production costs | 6,881 | | | 7,012 | |
| Sales returns | 5,636 | | | 5,166 | |
| Professional fees | 4,210 | | | 3,452 | |
| Interest payable (2) | 2,399 | | | 8,359 | |
| Purchases of property, plant and equipment | 1,110 | | | 1,685 | |
| Other (3) | 62,848 | | | 44,796 | |
| Total accrued expenses | $ | 247,513 | | | $ | 210,764 | |
_________________
(1) The increase in advertising costs is primarily due to expanded return thresholds for performance advertising channels in our Vistaprint business as compared to the fourth quarter of fiscal 2020, in addition to investment in upper-funnel advertising.
(2) The decrease in interest payable is due to the redemption of our 12% second lien notes during the fourth quarter of fiscal year 2021. Refer to Note 10 for additional details.
(3) The increase in other accrued expenses is due to an increase in accrued expenses for third-party cloud computing as compared to fiscal year 2020.
|
| | | | | | | |
| | June 30, 2018 | | June 30, 2017 |
| Compensation costs | $ | 57,024 |
| | $ | 54,487 |
|
| Income and indirect taxes | 33,557 |
| | 34,469 |
|
| Advertising costs | 28,140 |
| | 26,641 |
|
| Production costs | 8,903 |
| | 7,472 |
|
| Shipping costs | 5,241 |
| | 6,651 |
|
| Sales returns | 5,076 |
| | 4,474 |
|
| Purchases of property, plant and equipment | 4,489 |
| | 3,786 |
|
| Professional fees | 3,802 |
| | 3,021 |
|
| Interest payable | 1,653 |
| | 5,263 |
|
| Other | 38,776 |
| | 29,303 |
|
| Total accrued expenses | $ | 186,661 |
| | $ | 175,567 |
|
Other current liabilities included the following:
| | | | | | | | | | | |
| June 30, 2021 | | June 30, 2020 |
| Current portion of finance lease obligations (1) | $ | 32,314 | | | $ | 8,055 | |
| Short-term derivative liabilities | 20,530 | | | 3,521 | |
| | | |
| | | |
| Other (2) | 50,671 | | | 1,692 | |
| Total other current liabilities | $ | 103,515 | | | $ | 13,268 | |
|
| | | | | | | |
| | June 30, 2018 | | June 30, 2017 |
| Short-term derivative liabilities | $ | 31,054 |
| | $ | 7,243 |
|
| Current portion of lease financing obligation | 12,569 |
| | 12,569 |
|
| Current portion of capital lease obligations | 10,747 |
| | 11,573 |
|
| Contingent earn-out liability (1) | — |
| | 44,049 |
|
| Mandatorily redeemable noncontrolling interest (2) | — |
| | 901 |
|
| Other | 601 |
| | 2,100 |
|
| Total other current liabilities | $ | 54,971 |
| | $ | 78,435 |
|
(1) The current portion of finance lease obligations as of June 30, 2021, increased by $23,959 as compared to the prior year due to the change in classification of one of our leased facilities from an operating lease to a finance lease due to our intention to exercise the existing purchase option. Refer to Note 16 for further details.
(2) The increase in other current liabilities is driven by the deferred payment related to the 99designs acquisition totaling $44,423 due in February 2022. Refer to Note 7 for additional details.
Other liabilities included the following:
| | | | | | | | | | | |
| June 30, 2021 | | June 30, 2020 |
| Long-term finance lease obligations | $ | 18,528 | | | $ | 18,617 | |
| Long-term derivative liabilities | 41,074 | | | 51,800 | |
| | | |
| | | |
| Other | 36,808 | | | 17,770 | |
| Total other liabilities | $ | 96,410 | | | $ | 88,187 | |
|
| | | | | | | |
| | June 30, 2018 | | June 30, 2017 |
| Long-term capital lease obligations | $ | 16,883 |
| | $ | 28,306 |
|
| Long-term derivative liabilities | 10,080 |
| | 31,936 |
|
| Mandatorily redeemable noncontrolling interest (2) | 4,366 |
| | 2,456 |
|
| Other (3) | 38,195 |
| | 31,985 |
|
| Total other liabilities | $ | 69,524 |
| | $ | 94,683 |
|
_______________________
(1) On January 2, 2018, we paid the WIRmachenDRUCK contingent earn-out liability, refer to the summary below for additional details.
(2) Relates to the mandatorily redeemable noncontrolling interest of Printi LLC. The short-term liability as of June 30, 2017 was redeemed during the fourth quarter of fiscal 2018. Refer to Note 15 for additional details.
(3) As of June 30, 2018 and 2017, other liabilities includes $15,464 and $8,713, respectively, related to share-based compensation awards associated with our investment in Printi LLC. Refer to Note 15 for additional details.
Contingent earn-out liability
Under the original terms of the WIRmachenDRUCK earn-out arrangement, a portion of the earn-out attributed to the minority selling shareholders was included as a component of purchase consideration as of the acquisition date, with any subsequent changes to fair value recognized within general and administrative expense. This earn-out was previously calculated on a sliding scale, based on the achievement of cumulative gross profit against a predetermined target.The liability represented the present value of the agreed payment amount as of the respective date. We recognized $1,774, $32,550 and $1,961 of expense during the years ended June 30, 2018, 2017 and 2016, respectively, as part of general and administrative expense. We paid the maximum amount on January 2, 2018. Refer to Note 3 of the consolidated financial statements for additional details of this payment.
| | | | | | | | June 30, 2021 | | June 30, 2020 |
| June 30, 2018 | | June 30, 2017 | |
| 7.0% Senior notes due 2026 | | 7.0% Senior notes due 2026 | $ | 600,000 | | | $ | 600,000 | |
| Senior secured credit facility | $ | 432,414 |
| | $ | 600,037 |
| Senior secured credit facility | 1,152,021 | | | 570,483 | |
| 7.0% Senior unsecured notes due 2026 (1) | 400,000 |
| | — |
| |
| 7.0% Senior unsecured notes due 2022 (1) | — |
| | 275,000 |
| |
| 12.0% Senior secured notes due 2025 | | 12.0% Senior secured notes due 2025 | 0 | | | 300,000 | |
| Other | 7,015 |
| | 7,541 |
| Other | 12,835 | | | 11,694 | |
| Debt issuance costs and debt discounts (2) | (12,585 | ) | | (5,922 | ) | |
| Debt issuance costs and debt premiums (discounts) | | Debt issuance costs and debt premiums (discounts) | (22,450) | | | (48,587) | |
| Total debt outstanding, net | 826,844 |
| | 876,656 |
| Total debt outstanding, net | 1,742,406 | | | 1,433,590 | |
| Less: short-term debt (3) | 59,259 |
| | 28,926 |
| |
| Less: short-term debt (1) | | Less: short-term debt (1) | 9,895 | | | 17,933 | |
| Long-term debt | $ | 767,585 |
| | $ | 847,730 |
| Long-term debt | $ | 1,732,511 | | | $ | 1,415,657 | |
_____________________
(1) On June 15, 2018, we completed a debt offering of $400,000 in aggregate principal amount of 7.0% senior notes due 2026. We used a portion of the net proceeds of this offering to extinguish the $275,000 of senior notes due 2022 and fund the satisfaction of the indenture governing those notes.
(2) During the year ended June 30, 2018, we capitalized $11,666 in debt issuance costs, which related to the private placement of our 7.0% senior unsecured notes due 2026, as well as the amendment to our senior secured credit facility. We wrote-off $3,164 of unamortized costs related to the redemption of our 7.0% Senior unsecured notes due 2022 and amendment to our senior unsecured credit facility. Refer below for additional details.
(3) Balances as of June 30, 20182021 and June 30, 20172020 are inclusive of short-term debt issuance costs, debt premiums and debt discounts of $2,012$3,435 and $1,693,$10,362, respectively.
Our Debt
Our various debt arrangements described below contain customary representations, warranties and events of default. As of June 30, 2018,2021, we were in compliance with all financial and other covenants related to our debt.
Indenture and Senior Unsecured Notes
On June 15, 2018, we completed a private placement of $400,000 in aggregate principal amount of 7.0% senior unsecured notes due 2026 (the “2026 Notes”). We issuedunder the 2026 Notes pursuant to a senior notes indenture dated as of June 15, 2018, among Cimpress N.V., our subsidiary guarantors, and MUFG Union Bank, N.A., as trustee (the "Indenture"). We used a portion of the net proceeds from the 2026 Notes to redeem all of the outstanding 7.0% senior unsecured notes due 2022 at a redemption price equal to 105.25% of the principal amount and all accrued unpaid interest. As a result of the redemption, we incurred a loss on the extinguishment of debt of $17,359, which included the early redemption premium of $14,438Restated Credit Agreement and the write-off of unamortized debt issuance costs of $2,921. The remaining proceeds were used to repay a portion of the indebtedness outstanding underindenture governing our revolving credit facility and pay all related fees and expenses.
The 2026 Notes bear interest at a rate of 7.0% per annum and mature on June 15, 2026. Interest on the Notes is payable semi-annually on June 15 and December 15 of each year, commencing on December 15, 2018, to the holders of record of the 2026 Notes at the close of business on June 1 and December 1, respectively, preceding such interest payment date.
The 2026 Notes are senior unsecured obligations and rank equally in right of payment to all our existing and future senior unsecured debt and senior in right of payment to all of our existing and future subordinated debt. The Notes are effectively subordinated to any of our existing and future secured debt to the extent of the value of the assets securing such debt. Subject to certain exceptions, each of our existing and future subsidiaries that is a borrower under or guarantees our senior secured credit facilities will guarantee the 2026 Notes.
The indenture under which the 2026 Notes are issued contains various covenants, including covenants that, subject to certain exceptions, limit our and our restricted subsidiaries’ ability to incur and/or guarantee additional debt; pay dividends, repurchase shares or make certain other restricted payments; enter into agreements limiting dividends and certain other restricted payments; prepay, redeem or repurchase subordinated debt; grant liens on assets; enter into sale and leaseback transactions; merge, consolidate or transfer or dispose of substantially all of our consolidated assets; sell, transfer or otherwise dispose of property and assets; and engage in transactions with affiliates.
We have the right to redeem, at any time prior to June 15, 2021, some or all of the 2026 Notes at a redemption price equal to 100% of the principal amount redeemed, plus a make-whole amount as set forth in the Indenture, plus, in each case, accrued and unpaid interest to, but not including, the redemption date. In addition, we have the right to redeem, at any time prior to June 15, 2021, up to 40% of the aggregate outstanding principal amount of the 2026 Notes at a redemption price equal to 107% of the principal amount thereof, plus accrued and unpaid interest to, but not including, the redemption date, with the net proceeds of certain equity offerings by Cimpress. At any time on or after June 15, 2021, we may redeem some or all of the Notes at the redemption prices specified in the Indenture, plus accrued and unpaid interest to, but not including, the redemption date.
Senior Secured Credit Facility
On June 14, 2018,May 17, 2021, we entered into an amendment to ouramended and restated senior secured credit facility resulting in an increase to aggregate loan commitments underagreement ("Restated Credit Agreement") consisting of the credit agreement to a total of $1,128,172. The amendment also extended the tenor of our borrowings tofollowing:
•A senior secured Term Loan B with a maturity date of June 14, 2023May 17, 2028 (the “Term Loan B”), consisting of:
◦a $795,000 tranche that bears interest at LIBOR (with a LIBOR floor of 0.50%) plus 3.50%, and changed some
◦a €300,000 EUR tranche that bears interest at EURIBOR (with a EURIBOR floor of 0%) plus 3.50%; and
•A $250,000 senior secured revolving credit facility with a maturity date of May 17, 2026 (the “Revolving Credit Facility”). Borrowings under the Revolving Credit Facility bear interest at LIBOR (with a LIBOR floor
of 0%) plus 2.50% to 3.00% depending on the Company’s First Lien Leverage Ratio, a net leverage calculation, as defined in the Restated Credit Agreement.
We utilized the proceeds from the Term Loan B to redeem all of the $300,000 principal of our Second Lien Notes and to repay amounts under our previous credit facility including the $150,000 Term Loan A and amounts drawn under our revolving credit facility due in 2024.
The Restated Credit Agreement contains covenants that restrict or limit certain activities and transactions by Cimpress and our subsidiaries, including, but not limited to, the incurrence of additional terms.indebtedness and liens; certain fundamental organizational changes; asset sales; certain intercompany activities; and certain investments and restricted payments, including purchases of the Company’s ordinary shares and payment of dividends. In addition, if any loans made under the Revolving Credit Facility are outstanding on the last day of any fiscal quarter, then we are subject to a financial maintenance covenant that the First Lien Leverage Ratio calculated as of the last day of such quarter does not exceed 3.25 to 1.00.
As of June 30, 2018,2021, we have a committed credit facilityborrowings under the Restated Credit Agreement of $1,124,422 as follows:
Revolving loans$1,152,021 consisting of $839,422 with a maturity date of June 14, 2023
the Term loan of $285,000 amortizingLoan B, which amortizes over the loan period, with a final maturity date of May 17, 2028. We have no outstanding borrowings under our Revolving Credit Facility as of June 14, 202330, 2021.
Under the terms of our credit agreement, borrowings bear interest at a variable rate of interest based on LIBOR plus 1.375% to 2.0%. Interest rates prior to and after the amendment depend on our leverage ratio, which is the ratio of our consolidated total indebtedness to our consolidated EBITDA, as defined by the credit agreement. As of June 30, 2018,2021, the weighted-average interest rate on outstanding borrowings under the Restated Credit Agreement was 3.77%4.66%, inclusive of interest rate swap rates. We are also required to pay a commitment fee on unused balances of 0.225%0.35% to 0.35%0.45% depending on our leverage ratio.First Lien Leverage Ratio. We have pledged the assets and/or share capital of severala number of our subsidiaries as collateral for our outstanding debt as of June 30, 2018.2021.
Our credit agreement contains financialSecond Lien Notes and other covenants, includingWarrants
We utilized the proceeds from our Restated Credit Agreement to pay down the $300,000 in aggregate principal of 12% Senior Secured Notes due 2025 (the "Second Lien Notes"). The warrants we issued in conjunction with the Second Lien Notes are detachable and therefore will remain. The 7-year warrants allow the holders to purchase 1,055,377 ordinary shares of Cimpress, representing approximately 3.875% of our outstanding diluted ordinary shares at the time of issuance. Refer to Note 11 for additional details.
Senior Unsecured Notes
We have issued $600,000 in aggregate principal of 7.0% Senior Notes due 2026 (the "2026 Notes"), which are unsecured. At any time on or after June 15, 2021, we may redeem some or all of the 2026 Notes at the redemption prices specified in the indenture that governs the 2026 Notes, plus accrued and unpaid interest to, but not limitedincluding, the redemption date. As of June 30, 2021, we have not redeemed any of the 2026 Notes.
Debt Issuance Costs
During the years ended June 30 2021 and 2020, we capitalized debt issuance costs related to limitations on (1) our incurrencethe Restated Credit Agreement, issuance of additional indebtedness2026 Notes, and liens, (2)issuance of Second Lien Notes of $12,200 and $23,208, respectively.
Amortization expense and the consummationwrite-off of certain fundamental organizational changes or intercompany activities, for example acquisitions, (3) investmentscosts related to debt amendments and restricted payments includingmodifications are included in interest expense, net in the amountconsolidated statements of purchases of our ordinary shares or payments of dividends,operations and (4) the amount of consolidated capital expenditures that we may make in each of our fiscal years through June 30, 2023. The credit agreement also contains financial covenants calculated on a trailing twelve month, or TTM, basis that:
our consolidated leverage ratio, which is the ratio of our consolidated indebtedness (*) to our TTM consolidated EBITDA (*), will not exceed 4.75, but may, on no more than three occasions duringamortized over the term of the Credit Agreement,related instrument. For the years ended June 30, 2021, 2020 and 2019, we amortized $5,757, $3,240, and $2,367, respectively. We wrote off $17,072 in unamortized debt issuance costs related to the former credit facility and Second Lien Notes which are recognized in loss on extinguishment of debt. As part of the transaction we capitalized $10,560 of third-party and lender fees associated with the issuance of the Term Loan B which will be increased to 5.00 for four consecutive quarters for certain permitted acquisitions;
our senior secured leverage ratio, which isamortized over the ratio of our consolidated senior secured indebtedness (*) to our TTM consolidated EBITDA (*), will not exceed 3.25 to 1.00, but may, on no more than three occasions during theseven year term of the loan and $313 of fees associated with the modification of the revolver, due to the reduction in commitment, which will be amortized over the five year term of the revolver.
Unamortized debt issuance costs and debt premiums (discounts) were $22,450 and $48,587 as of June 30, 2021 and 2020, respectively.
Loss on Extinguishment
Due to our entering into the Restated Credit Agreement be increased to 3.50 for four consecutive quarters for certain permitted acquisitions.
our interest coverage ratio, which is the ratioin May 2021 and redemption of our Second Lien Notes, we recorded a loss on extinguishment of $48,343 which was presented separately in the consolidated EBITDA (*)statements of operations as part of loss on early extinguishment of debt. This includes a loss of $39,400 for the redemption of our Second Lien Notes, which was impacted by a lower carrying value due in part to our consolidated interest expense, will be at least 3.00.the allocation of value to the warrants which remain outstanding, as well as the early redemption fee of $9,000 that was paid upon redemption.
(*) The definitions of EBITDA and consolidated indebtedness are maintained in our credit agreement included as an exhibit to our Form 8-K filed on June 18, 2018.
Other debtDebt
Other debt consists primarily of term loans acquired through our various acquisitions.acquisitions or used to fund certain capital investments. As of June 30, 20182021 and June 30, 20172020, we had $12,835and$7,015 and $7,541,11,694, respectively, outstanding for those obligations that are payable through September 2024.January 2026.
11. Shareholders’Shareholders' Equity (Deficit)
Treasury shares
On March 22, 2017,November 25, 2019, we announced that our Supervisory Board authorized the purchase ofhad approved a new share repurchase program under which we mayrepurchase up to 6,300,0005,500,000 of our issued and outstanding ordinary shares on the open market (including block trades), through privately negotiated transactions, or in one or more self-tender offers. This repurchase program expired on May 22, 2021, and during the year ended June 30, 2018,2021 we purchased 452,820did not repurchase any shares under this authorization for a costprogram.
Warrants
In conjunction with our issuance of $40,674. On November 14, 2017, our Supervisory Board authorized the repurchaseSecond Lien Notes in fiscal year 2020, we also issued 7-year warrants, to purchase 1,055,377 ordinary shares of up to 6,300,000Cimpress, representing approximately 3.875% of our outstanding diluted ordinary shares. The warrants are accounted for as equity, as they are redeemable only in our own shares, with an exercise price of $60 per share. The warrants may be exercised by cash payment or through cashless exercise by the surrender of warrant shares having a value equal to the exercise price of the portion of the warrant being exercised.
The fair value used for the warrants in this allocation was calculated using the Monte Carlo valuation model. The valuation of the notes and warrants resulted in a carrying value allocated to the warrants of $22,432, which, replacedin addition to be being accounted for as an equity instrument recorded in additional paid in capital, was included as a discount to the previous authorization. During the year endedSecond Lien Notes. As of June 30, 2018, we purchased 442,557 shares under this authorization for a cost of $54,036.2021 the warrants remain outstanding.
Share-based awards
TheOn November 25, 2020, our shareholders approved our 2020 Equity Incentive Plan, or the 2020 Plan. Upon approval, we ceased granting any new awards under any of our prior equity plans that had shares available for future grant, consisting of our 2016 Performance Equity Plan, (the "2016 Plan") became effective upon shareholder approval on May 27,2011 Equity Incentive Plan, and 2005 Non-Employee Directors' Share Option Plan. We will make future equity awards under the 2020 Plan. The maximum number of ordinary shares to be issued under the 2020 Plan is 3,500,000 plus an additional number of ordinary shares equal to the number of PSUs currently outstanding under the 2016 andPerformance Equity Plan that expire, terminate or are otherwise surrendered, canceled or forfeited. The 2020 Plan allows us to grant PSUs, entitling the recipient to receive Cimpress ordinaryshare options, share appreciation rights, restricted shares, based upon continued service to Cimpressrestricted share units, other share-based awards, and the achievement of objective, predetermined appreciation of Cimpress' three-year moving average share price. We may grant PSUs under the 2016 Plandividend equivalent rights to our employees, officers, non-employee directors, (including members of the Management and Supervisory Boards), consultants, and advisors. Subject
As noted above, all future awards will be granted under our 2020 Plan. Our 2016 Performance Equity Plan previously allowed us to adjustment in the event of stock splits, stock dividendsgrant PSUs to our employees, officers, non-employee directors, consultants, and other similar events, we may make awards under the 2016 Plan for up to 8,000,000 of our ordinary shares.
advisors. The 2011 Equity Incentive Plan (the “2011 Plan”) became effective upon shareholder approval on June 30, 2011 and allowspreviously allowed us to grant share options, share appreciation rights, restricted shares, restricted share units and other awards based on our ordinary shares to our employees, officers, non-employee directors, consultants and advisors. Among other terms, the 2011 Plan requires that the exercise price of any share option or share appreciation right granted under the 2011 Plan be at least 100% of the fair market value of the ordinary shares on the date of grant; limits the term of any share option or share appreciation right to a maximum period of 10 years; provides that shares underlying outstanding awards under the Amended and Restated 2005 Equity Incentive Plan that are canceled, forfeited, expired or otherwise terminated without having been issued in full will become available for the grant of new awards under the 2011 Plan; and prohibits the repricing of any share options or share appreciation rights without shareholder approval. In addition, the 2011 Plan provides that the number of ordinary shares available for issuance under the plan will be reduced by (i) 1.56 ordinary shares for each share subject to a restricted share or other share-based award with a per share or per unit purchase price lower than 100% of the fair market value of the ordinary shares on the date of grant and (ii) one ordinary share for each share subject to any other award under the 2011 Plan.
Our 2005 Non-Employee Directors’ Share Option Plan allowspreviously allowed us to grant share options to our non-employee directors upon initial appointment as a director and annually thereafter in connection with our annual general meeting of shareholders if they are continuingcontinued to serve as a director at such time. We also have two additional plans with outstanding awards from which we will not grant any additional awards.
As of 8,771,434June 30, 2021, 2,710,926 ordinary shares were available for future awards under all of our share-based award plans as of June 30, 2018.2020 Plan. For PSUs, under our 2016 Plan, we assumed that we would issue ordinary shares equal to 250% of the outstanding PSUs, which is the maximum potential share issuance. A combination of newTreasury shares and treasury shares hashave historically been used in fulfillment of our share-based awards.
Performance share units
PSU awards entitle the recipient to receive Cimpress ordinary shares between 0% and 250% of the number of units, based awards.upon continued service to Cimpress and the achievement of a compounded annual growth rate target based on Cimpress' three-year moving average share price. Awards with a grant date prior to fiscal year 2020 and all awards granted to our Chief Executive Officer and Board of Directors will be assessed annually in years 6 - 10 following the grant date and awards with a grant date in or after fiscal year 2020 (other than to the CEO and Board) will be assessed annually in years 4 - 8 following the grant date. The fair value of the PSUs is based on a Monte Carlo simulation, and the resulting expense is recognized on an accelerated basis over the requisite service period.
A summary of our PSU activity and related information for the fiscal year ended June 30, 2021 is as follows:
| | | | | | | | | | | | | | | | | |
| PSUs | | Weighted-
Average
Grant Date Fair
Value | | Aggregate
Intrinsic
Value |
| Outstanding at the beginning of the period | 1,034,197 | | | $ | 133.89 | | | |
| Granted | 228,132 | | | 129.25 | | | |
| Vested and distributed | — | | | — | | | |
| Forfeited | (103,613) | | | 117.40 | | | |
| Outstanding at the end of the period | 1,158,716 | | | $ | 134.45 | | | $ | 125,616 | |
The weighted average fair value of PSUs granted during the fiscal years ended June 30, 2021, 2020, and 2019 was $129.25, $142.90, and $176.16, respectively. The total intrinsic value of PSUs outstanding at the fiscal years ended June 30, 2021, 2020, and 2019 was $125,616, $78,951 and $74,688, respectively. As of June 30, 2021 the number of shares subject to PSUs included in the table above assumes the issuance of one share for each PSU, but based on actual performance that amount delivered can range from zero shares to a maximum of 2,896,790 shares.
Restricted share units
The fair value of an RSU award is equal to the fair market value of our ordinary shares on the date of grant and the expense is recognized on a straight-line basis over the requisite service period. RSUs generally vest over 4 years.
A summary of our RSU activity and related information for the fiscal year ended June 30, 2021 is as follows:
| | | | | | | | | | | | | | | | | |
| RSUs | | Weighted-
Average
Grant Date Fair
Value | | Aggregate
Intrinsic
Value |
| Unvested at the beginning of the period | 177,233 | | | $ | 47.06 | | | |
| Granted | 453,916 | | | 93.64 | | | |
| Vested and distributed | (180,494) | | | 47.92 | | | |
| Forfeited | (16,266) | | | 96.03 | | | |
| Unvested at the end of the period | 434,389 | | | $ | 93.54 | | | $ | 47,092 | |
The weighted average fair value of RSUs granted during the fiscal years ended June 30, 2021 and 2020 was $93.64 and $46.94, respectively. We did not grant any RSUs during the year ended June 30, 2019. The total intrinsic value of RSUs vested during the fiscal years ended June 30, 2021, 2020, 2019 was $17,231, $1,905 and $6,749, respectively.
Share options
We have previously granted options to purchase ordinary shares at prices that are at least equal to the fair market value of the shares on the date the option is granted and have a contractual term of approximately eight to ten years. Options generally vestvested over 3 years for non-employee supervisory directors and over 4 years for employees.
The fair value of each option award subject only to service period vesting is estimated on the date of grant using the Black-Scholes option pricing model and is recognized as expense on a straight-line basis over the requisite service period. Use of a valuation model requires management to make certain assumptions with respect to inputs. The expected volatility assumption is based upon historical volatility of our share price. The expected term assumption is based on the contractual and vesting term of the option and historical experience. The risk-free interest rate is based on the U.S. Treasury yield curve with a maturity equal to the expected life assumed at the grant date. We value share options with a market condition using a lattice model with compensation expense recorded on an accelerated basis over the requisite service period.
We did not grant any share options in fiscal 2018 or 2017. Weighted-average values used for option awards in fiscal 2016 were as follows: |
| | | |
| | Year Ended June 30, |
| | 2016 |
| Risk-free interest rate | 1.84 | % |
| Expected dividend yield | — | % |
| Expected term (years) | 6.00 |
|
| Expected volatility | 47 | % |
| Weighted average fair value of options granted | $ | 38.18 |
|
year 2021. A summary of our share option activity and related information for the year ended June 30, 20182021 is as follows:
| | | | Shares Pursuant to Options | | Weighted- Average Exercise Price | | Weighted- Average Remaining Contractual Term (years) | | Aggregate Intrinsic Value | | Shares Pursuant to Options | | Weighted-
Average
Exercise
Price | | Weighted-
Average
Remaining
Contractual
Term (years) | | Aggregate
Intrinsic
Value |
| Outstanding at the beginning of the period | 2,138,426 |
| | $ | 46.68 |
| | 2.6 | |
|
| Outstanding at the beginning of the period | 110,538 | | | $ | 55.27 | | | 1.0 | | |
| Granted | — |
| | — |
| | | | |
| Granted | 0 | | | 0 | | | | | |
| Exercised | (485,323 | ) | | 39.63 |
| | | | |
| Exercised | (105,240) | | | 54.02 | | | | | |
| Forfeited/expired | (1,795 | ) | | 57.67 |
| | | | |
| Forfeited/expired | 0 | | | 0 | | | | | |
| Outstanding at the end of the period | 1,651,308 |
| | $ | 48.74 |
| | 1.9 | | $ | 158,887 |
| Outstanding at the end of the period | 5,298 | | | 80.01 | | | 3.8 | | $ | 150 | |
| Exercisable at the end of the period | 1,563,489 |
| | $ | 48.64 |
| | 1.9 | | $ | 150,589 |
| Exercisable at the end of the period | 5,298 | | | $ | 80.01 | | | 3.8 | | $ | 150 | |
The intrinsic value in the table above represents the total pre-tax amount, net of exercise price, which would have been received if all option holders exercised in-the-money options on June 30, 2018.2021. The total intrinsic value of options exercised during the fiscal years ended June 30, 2018, 20172021, 2020, and 20162019 was $46,853, $25,566,$5,460, $92,582 and $5,494,$12,498, respectively.
Performance share units - 2016 Performance Equity Plan
We began granting PSUs under our 2016 Plan during the first quarter of fiscal 2017. The PSU awards entitle the recipient to receive Cimpress ordinary shares between 0% and 250% of the number of units, based upon continued service to Cimpress and the achievement of a compounded annual growth rate target based on Cimpress' three-year moving average share price that will be assessed annually in years 6 - 10 following the grant date. The fair value of the PSUs is based on a Monte Carlo simulation, and the resulting expense is recognized on an accelerated basis over the requisite service period.
During the first quarter of fiscal 2018, we issued supplemental performance share unit awards to certain members of management. In addition to a service vesting and market condition (based on the three year moving average of the Cimpress share price) contained in our PSUs, these supplemental awards also contain a multi-year financial performance condition. The evaluation of achievement of the performance condition is at the discretion of the Compensation Committee and, therefore, the awards are subject to mark-to-market accounting throughout the three year performance vesting period. As of June 30, 2018, we concluded that the achievement of the performance condition is probable.
A summary of our PSU activity and related information for the fiscal year ended June 30, 2018 is as follows:
|
| | | | | | | | | | |
| | PSUs | | Weighted-
Average
Grant Date Fair
Value | | Aggregate
Intrinsic
Value |
| Outstanding at the beginning of the period | 375,038 |
| | $ | 123.06 |
| | |
| Granted | 361,582 |
| | 115.02 |
| | |
| Vested and distributed | — |
| | — |
| | |
| Forfeited | (55,857 | ) | | 120.04 |
| | |
| Outstanding at the end of the period | 680,763 |
| | $ | 119.04 |
| | $ | 98,683 |
|
The weighted average fair value of PSUs granted during the fiscal years ended June 30, 2018 and 2017, was $115.02 and $123.51, respectively. The total intrinsic value of PSUs outstanding at the fiscal years ended June 30, 2018 and 2017, was $98,683 and $35,452, respectively. As of June 30, 2018, the number of shares subject to PSUs included in the table above assumes the issuance of one share for each PSU, but based on actual performance that amount delivered can range from zero shares to a maximum of 1,701,908 shares.
Restricted share units
The fair value of an RSU award is equal to the fair market value of our ordinary shares on the date of grant and the expense is recognized on a straight-line basis over the requisite service period. RSUs generally vest over 2 years for non-employee directors and over 4 years for employees. For awards with a performance condition, we recognize compensation cost on an accelerated basis over the requisite service period when achievement of the performance condition is deemed probable. As of June 30, 2018, we had 156,000 RSUs outstanding that were subject to various performance conditions. In July 2018, 140,000 of these RSUs were forfeited and the remaining shares vested during that period.
A summary of our RSU activity and related information for the fiscal year ended June 30, 2018 is as follows:
|
| | | | | | | | | | |
| | RSUs | | Weighted-
Average
Grant Date Fair
Value | | Aggregate
Intrinsic
Value |
| Unvested at the beginning of the period | 334,370 |
| | $ | 74.57 |
| | |
| Granted | — |
| | — |
| | |
| Vested and distributed | (98,039 | ) | | 69.03 |
| | |
| Forfeited | (26,463 | ) | | 78.39 |
| | |
| Unvested at the end of the period | 209,868 |
| | $ | 76.67 |
| | $ | 30,422 |
|
The weighted average fair value of RSUs granted during the fiscal years ended June 30, 2017 and 2016 was $97.25 and $75.63, respectively. We did not grant any RSUs during the fiscal year ended June 30, 2018. The total intrinsic value of RSUs vested during the fiscal years ended June 30, 2018, 2017 and 2016 was $11,581, $21,130 and $21,810, respectively.
Restricted share awards
As part of our acquisition of Tradeprint during the first quarter of fiscal 2016, we issued 65,050 restricted ordinary shares. The fair value of the RSAs was determined based on our share price on the date of grant and is recognized as share-based compensation expense over the applicable service period. These awards generally vest over a 2 to 4 year period.
A summary of our RSA activity and related information for the fiscal year ended June 30, 2018 is as follows:
|
| | | | | | | | | | |
| | RSAs | | Weighted-
Average
Grant Date Fair
Value | | Aggregate
Intrinsic
Value |
| Unvested at the beginning of the period | 12,437 |
| | $ | 64.53 |
| | |
| Granted | — |
| | — |
| | |
|
| Vested and distributed | (4,146 | ) | | 64.53 |
| | |
|
| Forfeited | — |
| | — |
| | |
|
| Unvested at the end of the period | 8,291 |
| | $ | 64.53 |
| | $ | 1,202 |
|
Share-based compensation
Total share-based compensation costs were$50,466, $48,627 $37,034, $34,874 and $23,828$21,716 for the years ended June 30, 2018, 20172021, 2020, and 2016,2019, respectively, and we elected to recognize the impact of forfeitures as they occur. During the year ended June 30, 2018, we recognized $13,503 of share-based compensation expense related to the supplemental performance units issued during fiscal 2018.
From time to time we issue awards that are considered liability-based awards as they are settleable in cash. As of June 30, 2018, we have a liability-based award associated with our Printi LLC investment, accrued as part of other liabilities in the amount of $15,464. Refer toNote 15 for additional details.
Share-based compensation costs capitalized as part of software and website development costs were $1,607, $1,546$1,338, $1,157 and $832$1,141 for the years ended June 30 2018, 20172021, 2020, and 2016,2019, respectively.
As of June 30, 2018,2021, there was $36,213$61,127 of total unrecognized compensation cost related to non-vested, share-based compensation arrangements. This cost is expected to be recognized over a weighted average period of 1.62.5 years.
12. Employees’Employees' Savings Plans
Defined contribution plans
We maintain certain government-mandated and defined contribution plans throughout the world. Our most significant defined contribution retirement plans are in the U.S. and comply with Section 401(k) of the Internal Revenue Code. We offer eligible employees in the U.S. the opportunity to participate in one of these plans and match most employees' eligible contributions at various rates subject to service vesting as specified in each of the related plan documents. This matching program was temporarily suspended from March 2020 through December 31, 2020 and was reinstated on January 1, 2021.
We expensed $11,723, $11,691$12,228, $10,710 and $9,073$11,401 for our government-mandated and defined contribution plans in the years ended June 30, 2018, 20172021, 2020 and 2016,2019, respectively.
Defined benefit plan
We currently have a defined benefit plan that covers substantially all of our employees in Switzerland. Our Swiss plan is a government-mandated retirement fund with benefits generally earned based on years of service and compensation during active employment; however, the level of benefits varies within the plan. Eligibility is determined in accordance with local statutory requirements. Under this plan, both we and certain of our employees with annual earnings in excess of government determined amounts are required to make contributions into a fund managed by an independent investment fiduciary. Employer contributions must be in an amount at least equal to the employee’s contribution. Minimum employee contributions are based on the respective employee’s age, salary, and gender. As of June 30 20182021 and 2017,2020, the plan had an unfunded net pension obligation of approximately $1,268$2,883, and $1,658,$2,743, respectively, and plan assets which totaled approximately $3,050$4,128 and $3,920,$3,403, respectively. For the years ended June 30, 2018, 20172021, 2020 and 20162019 we recognized expense totaling $55, $1,191,$667, $399 and $1,820,$424, respectively, related to our Swiss plan.
13. Income Taxes
The following is a summary of our income (loss) before income taxes by geography:
| | | | Year Ended June 30, | | Year Ended June 30, |
| | 2018 | | 2017 | | 2016 | | 2021 | | 2020 | | 2019 |
| U.S. | $ | 9,183 |
| | $ | 13,390 |
| | $ | 23,057 |
| U.S. | $ | 2,546 | | | $ | (58,765) | | | $ | (10,879) | |
| Non-U.S. | 57,183 |
| | (92,707 | ) | | 43,038 |
| Non-U.S. | (58,582) | | | 61,768 | | | 137,791 | |
| Total | $ | 66,366 |
| | $ | (79,317 | ) | | $ | 66,095 |
| Total | $ | (56,036) | | | $ | 3,003 | | | $ | 126,912 | |
The components of the provision (benefit) for income taxes are as follows:
| | | | Year Ended June 30, | | Year Ended June 30, |
| | 2018 | | 2017 | | 2016 | | 2021 | | 2020 | | 2019 |
| Current: | |
| | |
| | |
| Current: | | | | | |
| U.S. Federal | $ | 446 |
| | $ | (1,144 | ) | | $ | 7,915 |
| U.S. Federal | $ | (93) | | | $ | (16,269) | | | $ | 84 | |
| U.S. State | (117 | ) | | 1,344 |
| | 116 |
| U.S. State | 546 | | | 213 | | | 1,130 | |
| Non-U.S. | 33,065 |
| | 26,191 |
| | 23,164 |
| Non-U.S. | 28,205 | | | 22,361 | | | 26,862 | |
| Total current | 33,394 |
| | 26,391 |
| | 31,195 |
| Total current | 28,658 | | | 6,305 | | | 28,076 | |
| Deferred: | |
| | |
| | |
| Deferred: | | | | | |
| U.S. Federal | (6,673 | ) | | (1,999 | ) | | (2,353 | ) | U.S. Federal | (1,573) | | | 12,980 | | | (1,347) | |
| U.S. State | 2,306 |
| | (1,497 | ) | | 13 |
| U.S. State | (31) | | | 3,213 | | | (183) | |
| Non-U.S. | (9,449 | ) | | (30,013 | ) | | (13,171 | ) | Non-U.S. | (8,151) | | | (103,490) | | | 6,886 | |
| Total deferred | (13,816 | ) | | (33,509 | ) | | (15,511 | ) | Total deferred | (9,755) | | | (87,297) | | | 5,356 | |
| Total | $ | 19,578 |
| | $ | (7,118 | ) | | $ | 15,684 |
| Total | $ | 18,903 | | | $ | (80,992) | | | $ | 33,432 | |
The following is a reconciliation of the standard U.S. federal statutory tax rate and our effective tax rate: |
| | | | | | | | |
| | Year Ended June 30, |
| | 2018 | | 2017 | | 2016 |
| U.S. federal statutory income tax rate | 28.0 | % | | 35.0 | % | | 35.0 | % |
| State taxes, net of federal effect | (2.4 | ) | | (0.1 | ) | | 0.1 |
|
| Tax rate differential on non-U.S. earnings | (1.3 | ) | | (15.5 | ) | | (35.7 | ) |
| Goodwill impairment | — |
| | (1.6 | ) | | 16.1 |
|
| Gain on sale of subsidiary | 4.0 |
| | 0.4 |
| | — |
|
| Compensation related items | (15.1 | ) | | 7.4 |
| | (2.2 | ) |
| Change in valuation allowance | 6.7 |
| | (21.9 | ) | | 26.9 |
|
| Nondeductible acquisition-related payments | 3.6 |
| | (18.0 | ) | | 4.0 |
|
| U.S. tax reform | 10.4 |
| | — |
| | — |
|
| Notional interest deduction (Italy) | (1.9 | ) | | 5.0 |
| | (5.3 | ) |
| Net tax benefit on intellectual property transfer | — |
| | 13.8 |
| | (17.7 | ) |
| Bonus depreciation | (1.9 | ) | | 0.5 |
| | — |
|
| Tax on unremitted earnings | 0.7 |
| | (1.6 | ) | | 4.6 |
|
| Nondeductible interest expense | 2.9 |
| | (1.3 | ) | | 0.2 |
|
| Tax credits and incentives | (4.8 | ) | | 7.1 |
| | (4.0 | ) |
| Other | 0.6 |
| | (0.2 | ) | | 1.7 |
|
| Effective income tax rate | 29.5 | % | | 9.0 | % | | 23.7 | % |
| | | | | | | | | | | | | | | | | |
| | Year Ended June 30, |
| | 2021 | | 2020 | | 2019 |
| U.S. federal statutory income tax rate | 21.0 | % | | 21.0 | % | | 21.0 | % |
| State taxes, net of federal effect | 3.6 | | | (130.1) | | | (1.0) | |
| Tax rate differential on non-U.S. earnings | (21.8) | | | (408.4) | | | (7.2) | |
| Swiss tax reform | 0 | | | (3,779.0) | | | 0 | |
| Compensation related items | 0.2 | | | (420.7) | | | 0.7 | |
| U.S. tax reform | 0 | | | (372.6) | | | 3.7 | |
| Goodwill impairment | 0 | | | 759.1 | | | 2.0 | |
| Change in valuation allowance | (30.8) | | | 1,277.5 | | | (1.7) | |
| Irish foreign tax credit | 10.0 | | | 262.3 | | | (19.1) | |
| Tax on repatriated earnings | (4.4) | | | 154.1 | | | 8.0 | |
| Gain/loss on sale of subsidiary | 0 | | | (189.2) | | | 0 | |
| Notional interest deduction (Italy) | 1.6 | | | (47.9) | | | (0.8) | |
| Patent box (Italy) | 0 | | | (24.2) | | | (3.4) | |
| Tax credits and incentives | 4.0 | | | (88.3) | | | (3.6) | |
| Non-US tax rate changes | 1.4 | | | 81.7 | | | 0.1 | |
| Business and withholding taxes | (0.4) | | | 28.7 | | | 0.8 | |
| Uncertain tax positions | (1.1) | | | 28.8 | | | (0.1) | |
| Nondeductible interest expense | (19.4) | | | 157.4 | | | 1.3 | |
| Other non-deductible expenses | 0.6 | | | 47.5 | | | 1.5 | |
| Tax on unremitted earnings | (1.0) | | | 31.4 | | | 8.0 | |
| Change in tax residence | 0 | | | 0 | | | 20.5 | |
| Changes to variable interest entities | 0 | | | 0 | | | (2.5) | |
| Changes to derivative instruments | 1.8 | | | 0 | | | 4.5 | |
| Other | 1.0 | | | (86.1) | | | (6.4) | |
| Effective income tax rate | (33.7) | % | | (2,697.0) | % | | 26.3 | % |
For the year ended June 30, 2018, our U.S. federal statutory tax rate was reduced from 35% to 28% as a result of the passage of U.S. tax reform during our second quarter of fiscal year 2018. Our effective tax rate for the year was slightly above our U.S. federal statutory tax rate primarily as a result of one-time tax adjustments described below. Excluding these adjustments,2021, our effective tax rate would have been lower than thewas below our U.S. federal statutory tax rate primarily due to the majority of our pretax income being earnednon-deductible interest expense and losses in certain jurisdictions outside the U.S. where the applicablefor which we cannot recognize a tax rates are lower than the U.S. federal statutory tax rate.benefit. The jurisdictions that have the most significant impact to our non-U.S. tax provision include Australia, Canada, France, Germany, India, Ireland, Italy, the Netherlands, Spain and Switzerland. The applicable tax rates in these jurisdictions range from 10% - 34%to 30%. The total tax rate benefit from operating in non-U.S. jurisdictions is included in the line “Tax rate differential on non-U.S. earnings” in the above tax rate reconciliation table.
For the year ended June 30, 2018,2021, our effective tax rate was 29.5%(33.7)% as compared to the prior year effective tax rate of 9.0%(2,697.0)%. The increase in our effective tax rate as compared to the prior year is primarily due to Swiss Tax Reform benefits of $113,482 in the year ended June 30, 2020. Also, in addition to decreased pre-tax profits and a less favorable geographic mix on increased profits,of earnings year over year, we recognized tax benefits of $2,143 related to excess tax benefits from share based compensation, as compared to $15,705 in fiscal year 2020. During the unfavorable impact toyear ended June 30, 2021 we recognized a tax benefit of $6,700 for the release of our deferred tax assetsvaluation allowance in India as a result of U.S. tax reform, and the adoption of ASU 2016-16 that is described further below. If we had not adopted ASU 2016-16increased profitability. Additionally in fiscal year 2018,2020, we recognized tax benefits of $11,188 for the re-measurement of U.S. tax losses that were carried back to tax years with higher U.S. federal tax rates under the US CARES Act and tax expense would have been lower by $8,363. In addition, we recognizedof $41,900 to record a reduction tofull valuation allowance against our U.S. deferred tax assets and a portion for our Irish deferred tax assets.The change in judgment to no longer recognize the deferred tax assets was driven by decreased profits due to impacts of $4,908 related to expected future changes to our U.S. state apportionment. These impacts were offset by increased share based compensation tax benefits of $12,802 as compared to $8,003 in fiscal 2017.the COVID-19 pandemic and goodwill impairments. Our fiscal year 20172020 effective tax rate was lower than fiscal year 2016 due primarily to a consolidated loss and more favorable geographical mix of earnings in fiscal 2017 as compared to fiscal 2016. In addition, we recorded a larger goodwill impairment charge in fiscal year 2016 as compared to fiscal year 2017, which is non-deductible for tax purposes. This was offset by increased nondeductible acquisition-related charges in fiscal year 2017 as compared to fiscal year 2016.
On December 22, 2017, H.R.1, originally known as the Tax Cuts and Jobs Act, ("The Act"), was signed into law, resulting in significant changes to U.S. federal tax law for corporations. Among these changes was the immediate reduction in the federal statutory tax rate from 35% to 21%. The impact of The Act to our fiscal 2018 tax provision was $5,752 of additional tax expense,2019 primarily due to Swiss Tax Reform.
On October 25, 2019, the canton of Zurich enacted tax law changes by publishing the results of its referendum to adopt the Federal Act on Tax Reform and AHV Financing (TRAF), which we refer to as Swiss Tax Reform. Swiss Tax Reform was effective as of January 1, 2020 and included the abolishment of various favorable
federal and cantonal tax regimes. Swiss Tax Reform provided transitional relief measures for companies that lost the tax benefit of a one-time reductionruling, including a "step-up" for amortizable goodwill, equal to the amount of future tax benefit they would have received under their existing ruling, subject to certain limitations. We recognized a tax benefit of $113,482to establish new Swiss deferred tax assets related to transitional relief measures and to remeasure our existing U.S.Swiss deferred tax assets. In addition, weassets and liabilities. We do not expect some impact on our future taxes as it relates to certain other aspectsrealize the majority of The Act, including limitations on the deductibility of executive share-based compensation awards, U.S. interest expense and meals and entertainment expenses as well as immediate expensing of certain fixed assets. Due to our current operating structure, we expect many of the international aspects of The Act will have little to no effect on our tax
balances in the future including, but not limited to, the mandatory one-time deemed repatriation tax on accumulated non-U.S. earnings ("Transition Tax") and the base-erosion anti-avoidance tax on excessive payments to non-U.S. related parties ("BEAT").
In response to The Act, the Securities and Exchange Commission issued Staff Accounting Bulletin 118 ("SAB 118"), to address the application of U.S. GAAP in situations where a company does not have the necessary information available, prepared, or analyzed (including computations) in reasonable detail to complete the accounting for certain income tax effects of The Act. SAB 118 allows us to record provisional amounts during a measurement period not to extend beyond one year of the enactment date. Our tax balances have been adjusted based upon our interpretation of The Act, although the final impact on our tax balances may change due to the issuance of additional guidance, changes in our interpretation of The Act, changes in assumptions made by Cimpress, and actions Cimpress may take as a result of The Act. There have been no material changes to our tax balances as of June 30, 2018 as a result of changes to our interpretation of nor the issuance of new guidance on The Act. We will continue to review and assess the potential impact of any new information on our financial statement positions.
In the first quarter ofthis benefit until fiscal year 2018, we elected to early adopt ASU 2016-16, "Income Taxes (Topic 740): Intra-Entity Transfers of Assets Other Than Inventory," which requires the immediate recognition for income tax consequences of an intra-entity transfer of assets other than inventory when the transfer occurs. Under the prior accounting rules, any resulting gain or loss and immediate tax impact on an intra-entity transfer is eliminated and not recognized in the consolidated financial statements. Instead, the tax effects are deferred and recognized over the economic lives of the transferred assets. The adoption of ASU 2016-16 has a significant impact to our tax balances, primarily as it relates to transfers of intellectual property from subsidiaries within the Cimpress group to our subsidiary based in Switzerland. Our subsidiary based in Switzerland is entitled to amortize the fair market value of the intellectual property received over five years for Swiss tax purposes. Following the adoption of ASU 2016-16, we eliminated $24,573 of tax assets associated with the deferred tax costs of the transferor entities and recorded $18,710 of deferred tax asset for the unamortized value of intellectual property of our subsidiary in Switzerland, with a cumulative-effect adjustment to retained earnings of $5,863. The intellectual property amortization will reduce our deferred tax asset and will no longer impact our effective tax rate in2025 through fiscal 2018 and beyond. The net tax benefit recognized under the prior accounting associated with the amortization of the intellectual property was $12,926 and $12,764 in fiscal years 2017 and 2016, respectively and is included in the line "Net tax benefit on intellectual property transfer" in the above tax rate reconciliation table.
In fiscal 2016 we adopted ASU No. 2016-09, "Compensation - Stock Compensation (Topic 718): Improvement to Employee Share-Based Payment Accounting." This resulted in tax benefits of $12,802, $8,003 and $3,456 recognized in income tax expense (benefit) in the consolidated statement of operations for the years ended June 30, 2018, 2017 and 2016, respectively, which previously would have been recognized in additional paid-in capital in the consolidated balance sheet.
In fiscal 2012, one of our subsidiaries purchased certain intellectual property and intangible assets of Webs,Inc. We elected to fund the transfer of these assets using an installment obligation payable over a 7.5-year period, and accordingly we recorded a deferred tax liability for the entire tax liability owed but not yet paid as of the date of the transaction. Refer to Note 17 for additional information regarding this obligation.
year 2030.
Significant components of our deferred income tax assets and liabilities consisted of the following at June 30, 20182021 and 2017:2020:
| | | | Year Ended June 30, | | | | | | | | | | |
| | 2018 | | 2017 | | June 30, 2021 | | June 30, 2020 |
| Deferred tax assets: | |
| | |
| Deferred tax assets: | | | |
| Swiss tax reform amortizable goodwill | | Swiss tax reform amortizable goodwill | $ | 124,372 | | | $ | 127,965 | |
| Net operating loss carryforwards | $ | 94,925 |
| | $ | 85,728 |
| Net operating loss carryforwards | 73,534 | | | 62,374 | |
| Leases | | Leases | 31,363 | | | 33,078 | |
| Depreciation and amortization | 3,211 |
| | 2,331 |
| Depreciation and amortization | 9,136 | | | 4,308 | |
| Accrued expenses | 6,023 |
| | 6,478 |
| Accrued expenses | 9,538 | | | 6,253 | |
| Share-based compensation | 17,194 |
| | 20,999 |
| Share-based compensation | 11,192 | | | 9,482 | |
| Credit and other carryforwards | 6,649 |
| | 2,688 |
| Credit and other carryforwards | 39,109 | | | 29,216 | |
| Derivative financial instruments | 7,552 |
| | 7,121 |
| Derivative financial instruments | 8,226 | | | 6,739 | |
| Other | 3,206 |
| | 3,060 |
| Other | 5,774 | | | 7,551 | |
| Subtotal | 138,760 |
| | 128,405 |
| Subtotal | 312,244 | | | 286,966 | |
| Valuation allowance | (58,716 | ) | | (56,953 | ) | Valuation allowance | (113,917) | | | (91,575) | |
| Total deferred tax assets | 80,044 |
| | 71,452 |
| Total deferred tax assets | 198,327 | | | 195,391 | |
| Deferred tax liabilities: | |
| | |
| Deferred tax liabilities: | | | |
| Depreciation and amortization | (54,102 | ) | | (71,477 | ) | Depreciation and amortization | (28,187) | | | (41,017) | |
| IP installment obligation | (2,103 | ) | | (6,460 | ) | |
| | Leases | | Leases | (24,920) | | | (30,433) | |
| Investment in flow-through entity | | Investment in flow-through entity | (5,003) | | | (3,550) | |
| Tax on unremitted earnings | (4,592 | ) | | (4,374 | ) | Tax on unremitted earnings | (6,877) | | | (6,203) | |
| Derivative financial instruments | (1,034 | ) | | — |
| |
| | Italy tax suspension reserve | | Italy tax suspension reserve | (4,528) | | | 0 | |
| Other | (2,369 | ) | | (1,880 | ) | Other | (6,627) | | | (4,502) | |
| Total deferred tax liabilities | (64,200 | ) | | (84,191 | ) | Total deferred tax liabilities | (76,142) | | | (85,705) | |
| Net deferred tax assets (liabilities) | $ | 15,844 |
| | $ | (12,739 | ) | |
| Net deferred tax assets | | Net deferred tax assets | $ | 122,185 | | | $ | 109,686 | |
In assessing the realizability of deferred tax assets, we consider whether it is more likely than not that some or all of the deferred tax assets will not be realized. The increase in the valuation allowance from the prior year relates primarily to losses incurred in certain jurisdictions (mainly the United States, Ireland, Brazil, China, India,Japan and Japan)France) for which management has determined we cannot recognize the related deferred tax assets based on current profitability projections,trailing three-year pre-tax profit or loss adjusted for permanent book versus tax differences. Also, Cimpress plc generated $5,587 of Irish foreign tax credit carryforwards which do not expire, but for which management has determined it is more likely than not that these will not be utilized upon future repatriation. Other increases in our valuation allowance include increased U.S. research and development credits of $3,209 and acquired net operating losses of $5,424. The increase in valuation allowance was offset by the release of Indian valuation allowance of $6,700.
We have recorded a full valuation allowance against $8,226 of deferred tax asset related to derivative financial instruments for which management has determined that it is more likely than not that the deferred tax asset will not be recognized in the foreseeable future. The impact of this deferred tax asset and associated valuation allowance has been recorded in accumulated other comprehensive loss on the balance sheet. Additionally, we have recorded valuation allowances of $25,389 and $3,805 against deferred tax assets related to U.S. research and development credits and U.S. capital loss carryforwards, respectively, for which management has determined that it is more likely than not that these losses will not be utilized within the applicable carryforward periods available under local law. In addition, we recognized a decrease in our valuation allowance related to the utilization of Dutch net operating losses against the taxable gain from the sale of our Albumprinter business.
We have not recorded a valuation allowance against $44,092$14,235 of deferred tax asset associated with current and prior year tax losses generated in Switzerland. Management believes there is sufficient positive evidence in the form of historical and future projected profitability to conclude that it is more likely than not that all of the losses in Switzerland will be utilized against future taxable profits within the available carryforward period. Our assessment isassessments are reliant on the attainment of our future operating profit goals. Failure to achieve these operating profit goals may change our assessment of thisthese deferred tax asset,assets, and such change would result in an additional valuation allowance and an increase in income tax expense to be recorded in the period of the change in assessment. We will continue to review our forecasts and profitability trends on a quarterly basis.
We have recorded a full valuation allowance against $7,552 of deferred tax asset related to an interest rate derivative instrument for which management has determined, based on current profitability projections, that it is more likely than not that the deferred tax asset will not be recognized in the foreseeable future. The impact of this deferred tax asset and associated valuation allowance has been recorded in accumulated other comprehensive loss on the balance sheet. Additionally, we have recorded a partial valuation allowance of $2,311 against a deferred tax asset related to U.S. state research and development credits for which management has determined that it is more likely than not that these credits will not be utilized within the applicable carryforward periods available under local law.
No valuation allowance has been recorded against the $17,194 deferred tax asset associated with share-based compensation charges at June 30, 2018. However, in the future, if the underlying awards expire, are
released or are exercised with an intrinsic value less than the fair value of the awards on the date of grant, some or all of the benefit may not be realizable.
Based on the weight of available evidence at June 30, 2018,2021, management believes that it is more likely than not that all other net deferred tax assets will be realized in the foreseeable future. We will continue to assess the realization of the deferred tax assets based on operating results on a quarterly basis.
A reconciliation of the beginning and ending amount of the valuation allowance for the year ended June 30, 20182021 is as follows:
|
| | | |
| Balance at June 30, 2017 | $ | 56,953 |
|
| Charges to earnings (1) | 3,171 |
|
| Charges to other accounts (2) | (1,408 | ) |
| Balance at June 30, 2018 | $ | 58,716 |
|
| | | | | |
| Balance at June 30, 2020 | $ | 91,575 | |
| Charges to earnings (1) | 17,214 | |
| Charges to other accounts (2) | 5,128 | |
| Balance at June 30, 2021 | $ | 113,917 | |
_________________
(1) Amount is primarily related to increased U.S. stateand non-U.S. net operating losses, increased U.S. research and development credits, increased Irish foreign tax credits, and non-U.S. net operating losses.release of India valuation allowance.
(2) Amount is primarily related to unrealized gains on cross-currency swap contracts included in other comprehensive income (loss) and a decreaseincrease in deferred tax assets on non-U.S. net operating losses due to currency exchange rate changes.changes, acquired net operating losses recorded in purchase accounting, and unrealized losses on derivative financial instruments included in Accumulated Other Comprehensive Loss.
The increase in net deferred tax assets during fiscal 2018 is primarily attributable to the adoption of ASU 2016-16 and increased tax losses in Switzerland, offset by the impact of U.S. tax reform.
As of June 30, 2018,2021, we had gross U.S. federal and apportioned state net operating losses of approximately $2,348 $12,124 and $25,179, respectively,that expire on various dates from fiscal 2030year 2024 through fiscal 2038.year 2041 or with unlimited carryforward. We also had gross non-U.S. net operating loss and other carryforwards of $621,297, $422,072, a significant amount of which begin to expire in fiscal 2021,year 2024, with the remaining amounts expiring on various dates from fiscal 2019year 2022 through fiscal 2038year 2030 or with unlimited carryforward.carryforward. In addition, we have $6,649had $30,693 of tax credit carryforwards primarily related to U.S. federal and state research and development credits, expiringwhich expire on various dates beginning in fiscal 2030.year 2031 or with unlimited carryforward. We also had $18,118, $7,934 and $3,291 of U.S. federal, apportioned state, and non-U.S. capital loss carryforwards, respectively. The U.S. capital losses expire in fiscal year 2025 and the non-U.S. capital losses have unlimited carryforward. Lastly, we had $8,030 of Irish foreign tax credits with unlimited carryforward. The benefits of these carryforwards are dependent upon the generation of taxable income in the jurisdictions where they arose.
We consider the following factors, among others, in evaluating our plans for indefinite reinvestment of our subsidiaries’ earnings: (i) the forecasts, budgets and financial requirements of both our parent company and its subsidiaries, both for the long term and for the short term; (ii) the ability of Cimpress plc to fund its operations and (ii)obligations with earnings from other businesses within the global group without incurring substantial tax costs; and (iii) the tax consequences of any decision to reinvest earnings of any subsidiary. As of June 30, 2018,2021, no tax provision has been made for $29,406$43,401 of undistributed earnings of certain of our subsidiaries as these earnings are considered indefinitely reinvested. If, in the future, we decide to repatriate the undistributed earnings from these subsidiaries in the form of dividends or otherwise, we could be subject to withholding taxes payable in the range of $7,000$10,000 to $8,000$11,000 at that time. A cumulative deferred tax liability of $4,592$6,877 has been recorded attributable to undistributed earnings that we have deemed are no longernot indefinitely reinvested. The remaining undistributed earnings of our subsidiaries are not deemed to be indefinitely reinvested and can be repatriated atwith notax cost. Accordingly, there has been no provision for income or withholding taxes on these earnings.
We currently benefit from various income tax holidays in certain jurisdictions. The tax holidays expire on various dates through August 2022. When the tax holidays expire, we will be subject to tax at rates ranging from 15% to 30%. As a result of the tax holidays, our net income was higher by $181 for fiscal year 2021.
A reconciliation of the gross beginning and ending amount of unrecognized tax benefits is as follows:
| | | | | |
| Balance June 30, 2018 | $ | 4,705 | |
| Additions based on tax positions related to the current tax year | 702 | |
| Additions based on tax positions related to prior tax years | 201 | |
| Reductions based on tax positions related to prior tax years | (117) | |
| Reductions due to lapse of statute of limitations | (763) | |
| Cumulative translation adjustment | (7) | |
| Balance June 30, 2019 | 4,721 | |
| Additions based on tax positions related to the current tax year | 586 | |
| Additions based on tax positions related to prior tax years | 769 | |
| Reductions based on tax positions related to prior tax years | (102) | |
| Reductions due to audit settlements | (52) | |
| Reductions due to lapse of statute of limitations | (71) | |
| Cumulative translation adjustment | (4) | |
| Balance June 30, 2020 | 5,847 | |
| Additions based on tax positions related to the current tax year | 1,428 | |
| Additions based on tax positions related to prior tax years | 7,448 | |
| Reductions based on tax positions related to prior tax years | (51) | |
| Reductions due to audit settlements | (83) | |
| Reductions due to lapse of statute of limitations | (229) | |
| Cumulative translation adjustment | 19 | |
| Balance June 30, 2021 | $ | 14,379 | |
|
| | | |
| Balance June 30, 2015 | $ | 5,710 |
|
| Additions based on tax positions related to the current tax year | 328 |
|
| Additions based on tax positions related to prior tax years | 132 |
|
| Reductions based on tax positions related to prior tax years | (363 | ) |
| Reductions due to audit settlements | (1,129 | ) |
| Reductions due to lapse of statute of limitations | (429 | ) |
| Balance June 30, 2016 | 4,249 |
|
| Additions based on tax positions related to the current tax year | 632 |
|
| Additions based on tax positions related to prior tax years | 1,580 |
|
| Reductions based on tax positions related to prior tax years | (30 | ) |
| Reductions due to audit settlements | (1,048 | ) |
| Balance June 30, 2017 | 5,383 |
|
| Additions based on tax positions related to the current tax year | 612 |
|
| Additions based on tax positions related to prior tax years | 93 |
|
| Reductions based on tax positions related to prior tax years | (261 | ) |
| Reductions due to audit settlements | (31 | ) |
| Reductions due to lapse of statute of limitations | (1,105 | ) |
| Cumulative translation adjustment | 14 |
|
| Balance June 30, 2018 | $ | 4,705 |
|
For the year ended June 30, 2018,2021, the amount of unrecognized tax benefits (exclusive of interest) that, if recognized, would impact the effective tax rate is $4,442.$1,307. We recognize interest and, if applicable, penalties related to unrecognized tax benefits in income tax expense. The accrued interest and penalties recognized as of June 30, 2018, 20172021, 2020 and 20162019 were $448,$1,014, $384 and $142,$515, respectively. It is reasonably possible that a further change in unrecognized tax benefits in the range of $700$300 to $900$310 may occur within the next twelve months related to the settlement of one or more audits or the lapse of applicable statutes of limitations. We believe we have appropriately provided for all tax uncertainties.
We conduct business in a number of tax jurisdictions and, as such, are required to file income tax returns in multiple jurisdictions globally. The years 20152014 through 20172020 remain open for examination by the United States Internal Revenue Service (“IRS”("IRS") and the years 20122015 through 20172020 remain open for examination in the various states and non-US tax jurisdictions in which we file tax returns.
We are currently under income tax audit in certain jurisdictions globally. We believe that our income tax reserves are adequately maintained taking into consideration both the technical merits of our tax return positions and ongoing developments in our income tax audits. However, the final determination of our tax return positions, if audited, is uncertain and therefore there is a possibility that final resolution of these matters could have a material impact on our results of operations or cash flows.
14. Noncontrolling InterestsInterest
In certainFor some of our strategic investmentssubsidiaries, we own a controlling equity stake, butand a third party or key member of the business' management team owns a minority portion of the equity. The balance sheet and operating activity of these entities are included in our consolidated financial statements and we adjust the net income in our consolidated statement of operations to exclude the noncontrolling interests' proportionate share of results. We present the proportionate share of equity attributable to the redeemable noncontrolling interests as temporary equity within our consolidated balance sheet and the proportionate share of noncontrolling interests not subject to a redemption provision that is outside of our control as equity. We recognize redeemable noncontrolling interests at fair value on the sale or acquisition date and adjust to the redemption value on a periodic basis with the offset to retained earnings in the consolidated balance sheet. If the formulaic redemption value exceeds the fair value of the noncontrolling interest, then the accretion to redemption value is offset to the net (income) loss attributable to noncontrolling interest in our consolidated statement of operations.
Redeemable Noncontrolling Interests
PrintBrothers
Members of the PrintBrothers management team hold a minority equity interest ranging from 11% to 12% in each of the three businesses within the segment. The put options associated with the redeemable noncontrolling interest are exercisable beginning in 2021, while the associated call options become exercisable in 2026. During the second quarter of fiscal year 2021, we repurchased equity interests ranging from 0.56% to 1.15% in each of the three businesses for a total of $5,063. During the year ended June 30, 2021, the redemption value of a PrintBrothers business increased above the carrying value due to growth in the fourth quarter of fiscal year 2021 as we've lapped the earliest periods that were more negatively impacted by the pandemic, resulting in an adjustment to the redeemable noncontrolling interest of $2,035, which was recognized as an adjustment to retained earnings.
All Other Businesses
On April 15, 2015,October 1, 2018, we acquired 70%approximately 99% of the outstanding sharesequity interests of Exagroup SAS.BuildASign LLC. The remaining 30%1% is considered a redeemable noncontrolling equity interest, as it is redeemable in the future and not solely within our
control. The Exagroup noncontrolling interest, redeemable at a fixed amount of €39,000, was recorded at its fair value as of the acquisition date and will be adjusted to its redemption value on a periodic basis, if that amount exceeds its carrying value. As of June 30, 2018, the redemption value was less than the carrying value, and therefore no adjustment was required.
On August 23, 2017, we sold approximately 12% of the outstanding shares of our WIRmachenDRUCK subsidiary for a total of €30,000 ($35,390 based on the exchange rate on the date we received the proceeds). The minority equity interest is considered a redeemable noncontrolling interest, as it is redeemable for cash based on future financial results through put and call rights and not solely within our control. TheDuring the year ended June 30, 2021, the redemption value increased above the carrying value due to continued strong financial performance, resulting in an adjustment to the redeemable noncontrolling interest of $1,072, which was recorded at its fair valuerecognized as an adjustment to retained earnings.
On April 23, 2021, we acquired 81% of the saleoutstanding equity interests of a US-based company that provides supply chain expertise and sells into a growing product category. The remaining 19% is considered a redeemable noncontrolling equity interest as it is redeemable for cash based on future financial results through put and call rights and not solely within our control. On the acquisition date, and will be adjusted to its redemption value on a periodic basis, with an offset to retained earnings, if that amount exceeds its carrying value. Ifwe recognized the formulaic redemption value exceeds theredeemable noncontrolling interest at fair value of the noncontrolling interest, then the accretion to redemption value will be offset to the net (income) loss attributable to noncontrolling interest in our consolidated statement of operations.$4,370. As of June 30, 2018,2021, the redemption value was less than the carrying value, and therefore no adjustment was required. Refer to Note 7 for additional details.
The following table presents the reconciliation of changes in our
redeemable noncontrolling interests:
|
| | | | | | | | |
| | | Redeemable noncontrolling interests | | Noncontrolling interest |
| Balance as of June 30, 2016 | | $ | 65,301 |
| | $ | 351 |
|
| Capital contribution from noncontrolling interest | | 1,404 |
| | — |
|
| Accretion to redemption value recognized in net loss attributable to noncontrolling interest (1) | | 372 |
| | — |
|
| Net (loss) income attributable to noncontrolling interest | | (864 | ) | | 4 |
|
| Purchase of noncontrolling interests (2) | | (20,299 | ) | | — |
|
| Sale of noncontrolling interest | | — |
| | (90 | ) |
| Foreign currency translation | | (502 | ) | | (52 | ) |
| Balance as of June 30, 2017 | | 45,412 |
| | 213 |
|
| Net income attributable to noncontrolling interest | | 2,983 |
| | 72 |
|
| Proceeds from sale of noncontrolling interest | | 35,390 |
| | — |
|
| Foreign currency translation | | 2,366 |
| | — |
|
| Balance as of June 30, 2018 | | $ | 86,151 |
| | $ | 285 |
|
| | | | | | | | | | | |
| | Redeemable noncontrolling interests | | | |
| Balance as of June 30, 2019 | | $ | 63,182 | | | | |
| | | | | |
| Acquisition of noncontrolling interest (1) | | 3,995 | | | | |
| | | | | |
| Accretion to redemption value recognized in retained earnings (2) | | 5,493 | | | | |
| Net income attributable to noncontrolling interest | | 630 | | | | |
| Distribution to noncontrolling interest (3) | | (3,955) | | | | |
| | | | | |
| | | | | |
| Foreign currency translation | | (239) | | | | |
| Balance as of June 30, 2020 | | 69,106 | | | | |
| | | | | |
| Acquisition of noncontrolling interest (1) | | 4,370 | | | | |
| | | | | |
| Accretion to redemption value recognized in retained earnings (2) | | 3,049 | | | | |
| Net income attributable to noncontrolling interest | | 2,772 | | | | |
| Distribution to noncontrolling interest (3) | | (4,746) | | | | |
| Purchase of noncontrolling interest | | (5,063) | | | | |
| | | | | |
| Foreign currency translation | | 1,632 | | | | |
| Balance as of June 30, 2021 | | $ | 71,120 | | | | |
___________________________________
(1) During fiscal year 2020, we acquired majority equity interests related to two immaterial businesses within our PrintBrothers reportable segment and in fiscal year 2021, we acquired the majority equity interest in an immaterial business within our All Other reportable segment.
(2) Accretion of redeemable noncontrolling interests to redemption value recognized in net loss attributable to noncontrolling interestretained earnings is the result of the redemption amount estimated to be greater than both the carrying value andbut less than fair valuevalue. Refer above for additional details.
(3) Distributions to noncontrolling interests include contractually required profit sharing payments made annually to the minority interest holders in one of the noncontrolling interest.PrintBrothers businesses.
(2) During fiscal 2017, we purchased the Pixartprinting and Japanese joint venture noncontrolling interests for $10,947 and $9,352, respectively.
15. Variable Interest Entity ("VIE")
On August 7, 2014, we made a capital investment in Printi LLC, which operates in Brazil. This investment provided us access to a new market and the opportunity to drive longer-term growth in Brazil and other geographies as Printi expands internationally in the future. The shareholders of Printi share profits and voting control on a pro-rata basis. While we do not manage the day-to-day operations of Printi, we do have the unilateral ability to exercise participating voting rights for specific transactions, and as such no one shareholder is considered to be the primary beneficiary. Based upon the level of equity investment at risk, Printi is considered a variable interest entity. Due to certain unilateral participating voting rights for certain transactions and the presence of a de facto agency relationship, we concluded that we were most exposed to the variability of the economics and therefore considered the primary beneficiary.
During fiscal 2018, we purchased an additional 3.7% economic interest for $1,144, resulting in a 53.69% equity interest as of June 30, 2018. In addition, we will acquire the remaining equity interest in Printi through a reciprocal put and call structure, exercisable from March 31, 2021 through a mandatory redemption date of July 31, 2023. As the remaining equity interests are mandatorily redeemable by all parties no later than a specified future date, the noncontrolling interest is within the scope of ASC 480 - "Distinguishing Liabilities from Equity" and is required to be presented as a liability on our consolidated balance sheet. As of June 30, 2018 and 2017, we adjusted the liability to fair value of $4,366 and $3,357, respectively, using an option pricing model. The offsetting adjustments were recognized within interest expense, net during the year ended June 30, 2018 and additional paid in capital during the year ended June 30, 2017. During the year ended June 30, 2018, we recognized $2,153 within interest expense, net. We will continue to adjust the liability to its estimated redemption value each reporting period and recognize any changes within interest expense, net in our consolidated statement of operations.
We also have liability-based awards for Printi restricted stock held by Printi employees that are fully vested and marked to fair value each reporting period until cash settlement. As of June 30, 2018, through the use of an option pricing model, we estimated the current fair value of the restricted stock to be $15,464 and we have recognized $6,792, $5,803 and $1,517 in general and administrative expense for the years ended June 30, 2018, 2017 and 2016.
We also have an arrangement to lend two Printi equity holders up to $24,000 that is payable on the date the put or call option is exercised, which will occur no later than July 31, 2023. As of June 30, 2018, the long-term loan receivable, including accrued interest, is $22,234 and classified within other assets in our consolidated balance sheets. We did not have a long-term loan receivable as of June 30, 2017. The loans carry 8.5% annual interest, and are not contingent upon continued employment. We expect that the loan proceeds will be used to offset our purchase of the remaining noncontrolling interest in the future.
16. Segment Information
Our operating segments are based upon the manner in which our operations are managed and the availability of separate financial information reported internally to the Chief Executive Officer, who is our Chief Operating Decision Maker (“CODM”) for purposes of making decisions about how to allocate resources and assess performance.
As of June 30, 2018,2021, we have numerous operating segments under our management reporting structure which are reported in the following four5 reportable segments:
•Vistaprint - Includes the operations of our global Vistaprint websites focused on the North America, Europe, Australia and New Zealand markets, and our Webs-branded business, which is managed with the Vistaprint-branded digital business. Also included is our Vistaprint Corporate Solutions business in the previously listed geographies.
which serves medium-sized businesses and large corporations, our 99designs business which was acquired on October 1, 2020, as well as a legacy revenue stream with retail partners and franchise businesses.Upload and Print•PrintBrothers - Includes the results of our druck.at, Easyflyer, Exagroup, Pixartprinting, Printdeal, Tradeprint, and WIRmachenDRUCK businesses.
•The Print Group - Includes the results of our Easyflyer, Exaprint, Pixartprinting, and Tradeprint businesses.
•National Pen - Includes the global operations of our National Pen businesses,business, which manufacturemanufactures and marketmarkets custom writing instruments and promotional products, apparel and gifts.
•All Other Businesses - Includes a collection of businesses grouped together based on materiality. With the operationsexception of our Printi, Vistaprint India, Vistaprint JapanBuildASign, which is a larger and Corporate Solutions businesses. profitable business, the All Other Businesses reportable segment consists of two smaller businesses that we continue to manage at a relatively modest operating loss and the addition of a newly acquired company that provides supply chain expertise and sells into a growing product category.
◦BuildASign is an internet-based provider of canvas-print wall décor, business signage and other large-format printed products, based in Austin, Texas. In the fourth quarter of fiscal year 2021, we closed a small acquisition under BuildASign in a new product category.
◦Printi is an online print businessprinting leader in Brazil, which offers a superior customer experience with transparent and attractive pricing, reliable service and quality.
◦YSD is a startup operation that operates primarilyprovides end-to-end mass customization solutions to brands and intellectual property owners in the Brazil market, but is also expanding into the U.S. market. In JapanChina, supporting multiple channels including retail stores, websites, WeChat and India, we primarily operate under close derivatives of the Vistaprint business modele-commerce platforms to enhance brand awareness and technology, albeit with decentralized, locally managed cross-functional operations in each country,competitiveness and with product, content and service offerings which we tailor to the Japanese and Indiandevelop new markets. Our Vistaprint Corporate Solutions business serves medium-sized businesses and larger corporations, as well as our legacy business with retail partners and franchise businesses, primarily through the "Vistaprint Corporate" brand. Our All Other Businesses segment also includes Albumprinter results through the divestiture date of August 31, 2017.
Central and corporate consistscosts consist primarily of the team of software engineers that is building our mass customization platform; shared service organizations such as global procurement; technology services such as hosting and security; administrative costs of our Cimpress India offices where numerous Cimpress businesses have dedicated business-specific team members; and corporate functions including our Supervisory Board of Directors, CEO, and the team members necessary for managing corporate activities, such as treasury, tax, capital allocation, financial
consolidation, internal audit and legal. These costs also include certain unallocated share-based compensation costs.
During the first quarter of fiscal 2018, we began presenting inter-segment fulfillment activity as revenue for the fulfilling business for purposes of measuring and reporting our segment financial performance. Any historical inter-segment fulfillment transactions were previously recognized as cost relief for the fulfilling business unit in our presentation to the CODM. We now recognize these transactions as inter-segment revenue for presentation to the CODM; for example, a third-party customer order received by our Corporate Solutions business that is fulfilled at oneThe expense value of our Vistaprint production facilities is recognized as inter-segment revenue for our Vistaprint business based on pricing and terms agreed upon between segment management. Inter-segment revenues are recognized only for transactions between our reportable segments and do not include any transactions between businesses within a reportable segment, which are eliminated within each reportable segment. Intercompany revenues are eliminated in our consolidated results.
As part of these changes, we also recast historical segment results to ensure the consistent application of our current inter-segment revenue presentation. For the years ended June 30, 2017 and 2016, we increased revenue for our Vistaprint business by $5,690 and $3,589, respectively, with a corresponding increase to inter-segment eliminations. We also recast historical segment profitability for the allocation of certain IT costs, which previously burdened our Vistaprint business, but have now been allocated to each of our businesses. For the year ended June 30, 2017, the cost allocation change resulted in an increase to Vistaprint segment profit of $2,494, with a corresponding decrease to segment profit for Upload and Print of $644, and All Other Businesses of $560, and an increase to our Central and corporate cost center of $1,290. For the year ended June 30, 2016, the cost allocation change increased Vistaprint segment profit by $1,919, decreased Upload and Print segment profit by $436, and decreased All Other Businesses segment profit by $402. The Central and corporate cost center absorbed an additional $1,080 of costs for the year ended June 30, 2016 as a result of the cost allocation change.
ForPSU awards granted under our 2016 Performance Equity Plan, the PSU expense value is based on a Monte Carlo fair value analysis and is required to be expensed on an accelerated basis. In order to ensure comparability in measuring our businesses' results, we allocate the straight-line portion of the fixed grant value to our businesses. Any expense in excess of the amount as a result of the fair value measurement of the PSUs and the accelerated expense profile of the awards is recognized within Centralcentral and corporate costs.
Segment profit (loss)Our definition of segment EBITDA is the primary profitability metric by which our CODM measures segment financial performance and allocates resources. CertainGAAP operating income excluding certain items, are excluded from segment profit (loss), such as acquisition-relateddepreciation and amortization, and depreciation, expense recognized for contingent earn-out related charges including the changes in fair value of contingent consideration and compensation expense related to cash-based earn-out mechanisms dependent upon continued employment, share-based compensation related to investment consideration, certain impairment expense, and restructuring charges. A portion of the interest expense associated with our Waltham lease is included as expense in segment profit (loss) and allocated based on headcount to the appropriate business or corporate and global function. The interest expense represents a portion of the cash rent payment and is considered anWe include insurance proceeds that are not recognized within operating expense for purposes of measuring our segment performance.income. We do not allocate non-operating income, including realized gains and losses on currency hedges, to our segment results.
Our All Other Businesses reportable segment includes our Printi, Vistaprint India, Vistaprint Japan and Vistaprint Corporate Solutions businesses that have operating losses as they are in the early stage of investment relative to the scale of the underlying businesses, which may limit its comparability to other segments regarding profit (loss).
Our balance sheet information is not presented to the CODM on an allocated basis, and therefore we do not present asset information by segment. We do present other segment information to the CODM, which includes purchases of property, plant and equipment and capitalization of software and website development costs, and therefore include that information in the tables below.
Revenue by segment is based on the business-specific websites or sales channel through which the customer’s order was transacted. The following tables set forth revenue by reportable segment, profit (loss),as well as disaggregation of revenue by major geographic region and reportable segment.
| | | | | | | | | | | | | | | | | | | | | | | |
| | | | Year Ended June 30, | | |
| | | | | | 2021 | | 2020 | | 2019 | | |
| Revenue: | | | | | | | | | | | |
| Vistaprint | | | | | $ | 1,444,807 | | | $ | 1,337,291 | | | $ | 1,508,322 | | | |
| PrintBrothers | | | | | 421,766 | | | 417,921 | | | 443,987 | | | |
| The Print Group | | | | | 275,534 | | | 275,214 | | | 325,872 | | | |
| National Pen | | | | | 313,528 | | | 299,474 | | | 348,409 | | | |
| All Other Businesses | | | | | 192,038 | | | 173,789 | | | 136,202 | | | |
| Total segment revenue | | | | | 2,647,673 | | | 2,503,689 | | | 2,762,792 | | | |
| Inter-segment eliminations (1) | | | | | (55,160) | | | (22,331) | | | (11,716) | | | |
| Total consolidated revenue | | | | | $ | 2,592,513 | | | $ | 2,481,358 | | | $ | 2,751,076 | | | |
_____________________
(1) Refer to the "Revenue by Geographic Region" tables below for detail of the inter-segment revenue within each respective segment.
| | | | | | | | | | | | | | | | | | | | | | | | | | | | | | | | | | | |
| Year Ended June 30, 2021 |
| Vistaprint | | PrintBrothers | | The Print Group | | National Pen | | All Other | | Total |
| Revenue by Geographic Region: | | | | | | | | | | | |
| North America | $ | 955,280 | | | $ | 0 | | | $ | 0 | | | $ | 154,857 | | | $ | 171,398 | | | $ | 1,281,535 | |
| Europe | 350,270 | | | 420,946 | | | 258,230 | | | 106,004 | | | 0 | | | 1,135,450 | |
| Other | 136,919 | | | — | | | — | | | 20,762 | | | 17,847 | | | 175,528 | |
| Inter-segment | 2,338 | | | 820 | | | 17,304 | | | 31,905 | | | 2,793 | | | 55,160 | |
| Total segment revenue | 1,444,807 | | | 421,766 | | | 275,534 | | | 313,528 | | | 192,038 | | | 2,647,673 | |
| Less: inter-segment elimination | (2,338) | | | (820) | | | (17,304) | | | (31,905) | | | (2,793) | | | (55,160) | |
| Total external revenue | $ | 1,442,469 | | | $ | 420,946 | | | $ | 258,230 | | | $ | 281,623 | | | $ | 189,245 | | | $ | 2,592,513 | |
| | | | | | | | | | | | | | | | | | | | | | | | | | | | | | | | | | | |
| Year Ended June 30, 2020 |
| Vistaprint | | PrintBrothers | | The Print Group | | National Pen | | All Other | | Total |
| Revenue by Geographic Region: | | | | | | | | | | | |
| North America | $ | 928,668 | | | $ | 0 | | | $ | 0 | | | $ | 154,632 | | | $ | 153,795 | | | $ | 1,237,095 | |
| Europe | 325,239 | | | 416,987 | | | 269,220 | | | 112,046 | | | 0 | | | 1,123,492 | |
| Other | 77,204 | | | — | | | — | | | 24,990 | | | 18,577 | | | 120,771 | |
| Inter-segment | 6,180 | | | 934 | | | 5,994 | | | 7,806 | | | 1,417 | | | 22,331 | |
| Total segment revenue | 1,337,291 | | | 417,921 | | | 275,214 | | | 299,474 | | | 173,789 | | | 2,503,689 | |
| Less: inter-segment elimination | (6,180) | | | (934) | | | (5,994) | | | (7,806) | | | (1,417) | | | (22,331) | |
| Total external revenue | $ | 1,331,111 | | | $ | 416,987 | | | $ | 269,220 | | | $ | 291,668 | | | $ | 172,372 | | | $ | 2,481,358 | |
| | | | | | | | | | | | | | | | | | | | | | | | | | | | | | | | | | | |
| Year Ended June 30, 2019 |
| Vistaprint | | PrintBrothers | | The Print Group | | National Pen | | All Other | | Total |
| Revenue by Geographic Region: | | | | | | | | | | | |
| North America | $ | 1,040,928 | | | $ | 0 | | | $ | 0 | | | $ | 179,425 | | | $ | 112,216 | | | $ | 1,332,569 | |
| Europe | 373,768 | | | 442,760 | | | 325,076 | | | 134,381 | | | 0 | | | 1,275,985 | |
| Other | 87,775 | | | — | | | — | | | 30,874 | | | 23,873 | | | 142,522 | |
| Inter-segment | 5,851 | | | 1,227 | | | 796 | | | 3,729 | | | 113 | | | 11,716 | |
| Total segment revenue | 1,508,322 | | | 443,987 | | | 325,872 | | | 348,409 | | | 136,202 | | | 2,762,792 | |
| Less: inter-segment elimination | (5,851) | | | (1,227) | | | (796) | | | (3,729) | | | (113) | | | (11,716) | |
| Total external revenue | $ | 1,502,471 | | | $ | 442,760 | | | $ | 325,076 | | | $ | 344,680 | | | $ | 136,089 | | | $ | 2,751,076 | |
The following table includes segment EBITDA by reportable segment, total income from operations and total (loss) income before income taxes.taxes:
| | | | | | | | | | | | | | | | | | | | | | | |
| | | | Year Ended June 30, |
| | | | | | 2021 | | 2020 | | | | 2019 |
| Segment EBITDA: | | | | | | | | | | | |
| Vistaprint | | | | | $ | 324,715 | | | $ | 366,334 | | | | | $ | 349,697 | |
| PrintBrothers | | | | | 43,144 | | | 39,373 | | | | | 43,474 | |
| The Print Group | | | | | 43,126 | | | 51,606 | | | | | 63,997 | |
| National Pen | | | | | 11,644 | | | 7,605 | | | | | 17,299 | |
| All Other Businesses | | | | | 31,707 | | | 17,474 | | | | | (6,317) | |
| Total segment EBITDA | | | | | 454,336 | | | 482,392 | | | | | 468,150 | |
| Central and corporate costs | | | | | (135,398) | | | (140,398) | | | | | (117,295) | |
| Depreciation and amortization | | | | | (173,212) | | | (167,943) | | | | | (172,957) | |
| Waltham, MA lease depreciation adjustment (1) | | | | | 0 | | | 0 | | | | | 4,120 | |
| Proceeds from insurance | | | | | (122) | | | 0 | | | | | 0 | |
| Earn-out related charges | | | | | 0 | | | 54 | | | | | 0 | |
| Share-based compensation related to investment consideration | | | | | 0 | | | 0 | | | | | (2,893) | |
| Certain impairments and other adjustments (2) | | | | | (20,453) | | | (104,593) | | | | | (10,700) | |
| Restructuring-related charges | | | | | (1,641) | | | (13,543) | | | | | (12,054) | |
| Interest expense for Waltham, MA lease (1) | | | | | 0 | | | 0 | | | | | 7,236 | |
| | | | | | | | | | | |
| Total income from operations | | | | | 123,510 | | | 55,969 | | | | | 163,607 | |
| Other (expense) income, net | | | | | (11,835) | | | 22,874 | | | | | 26,476 | |
| Interest expense, net | | | | | (119,368) | | | (75,840) | | | | | (63,171) | |
| Loss on early extinguishment of debt | | | | | (48,343) | | | 0 | | | | | 0 | |
| (Loss) income before income taxes | | | | | $ | (56,036) | | | $ | 3,003 | | | | | $ | 126,912 | |
|
| | | | | | | | | | | |
| | Year Ended June 30, |
| | 2018 | | 2017 | | 2016 |
| Revenue: | | | | | |
| Vistaprint (1) | $ | 1,462,686 |
| | $ | 1,310,975 |
| | $ | 1,220,751 |
|
| Upload and Print (2) | 730,010 |
| | 588,613 |
| | 432,638 |
|
| National Pen (3) | 333,266 |
| | 112,712 |
| | — |
|
| All Other Businesses (4) | 87,583 |
| | 128,795 |
| | 138,244 |
|
| Total segment revenue | 2,613,545 |
| | 2,141,095 |
| | 1,791,633 |
|
| Inter-segment eliminations | (21,004 | ) | | (5,690 | ) | | (3,589 | ) |
| Total consolidated revenue | $ | 2,592,541 |
| | $ | 2,135,405 |
| | $ | 1,788,044 |
|
________________________________________
(1) Vistaprint segment revenues include inter-segment revenueUpon the adoption of $10,542, $5,690the new leasing standard on July 1, 2019, our Waltham, MA lease, which was previously classified as build-to-suit, is now classified as an operating lease under the new standard. Therefore, the Waltham depreciation and $3,589 forinterest expense adjustments that were made in comparative periods are no longer made after such adoption as any impact from the years ended June 30, 2018, 2017 and 2016.Waltham lease is now reflected in operating income.
(2) Upload and Print segment revenues include inter-segment revenue of $1,521forFor the year ended June 30, 2018. No inter-segment revenue was recognized in the prior comparable periods.
(3) National Pen segment revenues include inter-segment revenue of $2,9562021, certain impairments and other adjustments includes lease impairment and abandonment charges for two leased locations totaling $19,882. Refer to Note 16 for additional details. For the year ended June 30, 2018. No inter-segment revenue was recognized in the prior comparable periods.
(4) All Other Businesses segment revenues include inter-segment revenue of $5,985 for the year ended June 30, 2018. No inter-segment revenue was recognized in the prior comparable periods.
|
| | | | | | | | | | | |
| | Year Ended June 30, |
| | 2018 | | 2017 | | 2016 |
| Segment profit (loss): |
|
| |
|
| | |
| Vistaprint | $ | 241,479 |
| | $ | 167,687 |
| | $ | 214,947 |
|
| Upload and Print | 79,310 |
| | 63,189 |
| | 58,207 |
|
| National Pen | 22,165 |
| | (2,225 | ) | | — |
|
| All Other Businesses | (34,620 | ) | | (31,307 | ) | | (9,328 | ) |
| Total segment profit | 308,334 |
| | 197,344 |
| | 263,826 |
|
| Central and corporate costs | (131,400 | ) | | (118,093 | ) | | (97,672 | ) |
| Acquisition-related amortization and depreciation | (50,149 | ) | | (46,402 | ) | | (40,834 | ) |
| Earn-out related charges (1) | (2,391 | ) | | (40,384 | ) | | (6,378 | ) |
| Share-based compensation related to investment consideration | (6,792 | ) | | (9,638 | ) | | (4,835 | ) |
| Certain impairments (2) | — |
| | (9,556 | ) | | (41,820 | ) |
| Restructuring-related charges | (15,236 | ) | | (26,700 | ) | | (381 | ) |
| Interest expense for Waltham, MA lease | 7,489 |
| | 7,727 |
| | 6,287 |
|
| Gain on the purchase or sale of subsidiaries (3) | 47,945 |
| | — |
| | — |
|
| Total income (loss) from operations | 157,800 |
| | (45,702 | ) | | 78,193 |
|
| Other (expense) income, net | (21,032 | ) | | 10,362 |
| | 26,098 |
|
| Interest expense, net | (53,043 | ) | | (43,977 | ) | | (38,196 | ) |
| Loss on early extinguishment of debt | (17,359 | ) |
| — |
|
| — |
|
| Income (loss) before income taxes | $ | 66,366 |
| | $ | (79,317 | ) | | $ | 66,095 |
|
___________________
(1) Includes expense recognized for the change in fair value of contingent consideration and compensation expense related to cash-based earn-out mechanisms dependent upon continued employment.
(2) Includes the impact for2020, certain impairments or abandonmentsand other adjustments includes impairments of goodwill and other long-lived assets as defined by ASC 350 - "Intangibles - Goodwill and Other" or ASC 360 - "Property, Plant, and Equipment."
(3) Includes the impact of the gain on the sale of Albumprinter,$100,842, as well as a bargain purchase gainlosses of $1,520 recognized for fair value adjustments to the disposal group related to our VIDA sale. During the year ended June 30, 2019 we recognized reserves for loans as defined by ASC 805-30326 - "Goodwill or Gain from Bargain Purchase" for an acquisition in which the identifiable assets acquired and liabilities assumed are greater than the consideration transferred, that was recognized in general and administrative expense in our consolidated statement of operations during the year ended June 30, 2018."Financial Instruments - Credit Losses".
| | | | | | | | | | | | | | | | | | | | | |
| | | | Year Ended June 30, |
| | | | | | 2021 | | 2020 | | 2019 |
| Depreciation and amortization: | | | | | | | | | |
| Vistaprint | | | | | $ | 58,513 | | | $ | 59,029 | | | $ | 67,317 | |
| PrintBrothers | | | | | 22,089 | | | 21,010 | | | 22,108 | |
| The Print Group | | | | | 27,066 | | | 24,769 | | | 29,437 | |
| National Pen | | | | | 25,123 | | | 23,654 | | | 21,642 | |
| All Other Businesses | | | | | 19,811 | | | 23,755 | | | 17,068 | |
| Central and corporate costs | | | | | 20,610 | | | 15,726 | | | 16,199 | |
| Total depreciation and amortization | | | | | $ | 173,212 | | | $ | 167,943 | | | $ | 173,771 | |
| | | | | | | | | | | Year Ended June 30, |
| | Year Ended June 30, | | | 2021 | | 2020 | | 2019 |
| | 2018 | | 2017 | | 2016 | |
| Depreciation and amortization: | | | | | | |
| Purchases of property, plant and equipment: | | Purchases of property, plant and equipment: | | | | | | |
| Vistaprint | $ | 65,311 |
| | $ | 63,923 |
| | $ | 40,686 |
| Vistaprint | | $ | 12,332 | | | $ | 15,986 | | | $ | 32,820 | |
| Upload and Print | 59,599 |
| | 56,073 |
| | 47,696 |
| |
| PrintBrothers | | PrintBrothers | | 3,609 | | | 4,315 | | | 3,521 | |
| The Print Group | | The Print Group | | 11,847 | | | 17,136 | | | 7,908 | |
| National Pen | 21,546 |
| | 10,269 |
| | — |
| National Pen | | 3,603 | | | 5,016 | | | 8,346 | |
| All Other Businesses | 9,609 |
| | 15,074 |
| | 18,111 |
| All Other Businesses | | 5,466 | | | 4,242 | | | 16,996 | |
| Central and corporate costs | 12,940 |
| | 13,061 |
| | 25,425 |
| Central and corporate costs | | 1,667 | | | 3,772 | | | 972 | |
| Total depreciation and amortization | $ | 169,005 |
| | $ | 158,400 |
| | $ | 131,918 |
| |
| Total purchases of property, plant and equipment | | Total purchases of property, plant and equipment | | $ | 38,524 | | | $ | 50,467 | | | $ | 70,563 | |
|
| | | | | | | | | | | |
| | Year Ended June 30, |
| | 2018 | | 2017 | | 2016 |
| Purchases of property, plant and equipment: | | | | | |
| Vistaprint | $ | 35,265 |
| | $ | 38,434 |
| | $ | 32,028 |
|
| Upload and Print | 16,212 |
| | 14,875 |
| | 15,652 |
|
| National Pen | 6,565 |
| | 3,714 |
| | — |
|
| All Other Businesses | 1,680 |
| | 12,735 |
| | 19,160 |
|
| Central and corporate costs | 1,208 |
| | 4,399 |
| | 13,595 |
|
| Total purchases of property, plant and equipment | $ | 60,930 |
| | $ | 74,157 |
| | $ | 80,435 |
|
| | | | Year Ended June 30, | | | Year Ended June 30, |
| | 2018 | | 2017 | | 2016 | | | 2021 | | 2020 | | 2019 |
| Capitalization of software and website development costs: | | | | | | Capitalization of software and website development costs: | | | | | | |
| Vistaprint | $ | 24,794 |
| | $ | 23,624 |
| | $ | 11,390 |
| Vistaprint | | $ | 28,297 | | | $ | 18,381 | | | $ | 23,369 | |
| Upload and Print | 4,010 |
| | 4,173 |
| | 3,000 |
| |
| PrintBrothers | | PrintBrothers | | 1,465 | | | 990 | | | 1,787 | |
| The Print Group | | The Print Group | | 1,603 | | | 1,484 | | | 2,327 | |
| National Pen | 1,482 |
| | — |
| | — |
| National Pen | | 3,115 | | | 3,290 | | | 3,624 | |
| All Other Businesses | 2,336 |
| | 1,568 |
| | 2,032 |
| All Other Businesses | | 3,746 | | | 3,684 | | | 2,948 | |
| Central and corporate costs | 8,225 |
| | 7,942 |
| | 9,902 |
| Central and corporate costs | | 22,711 | | | 16,163 | | | 14,597 | |
| Total capitalization of software and website development costs | $ | 40,847 |
| | $ | 37,307 |
| | $ | 26,324 |
| Total capitalization of software and website development costs | | $ | 60,937 | | | $ | 43,992 | | | $ | 48,652 | |
Enterprise Wide Disclosures:
The following tables set forth revenues by geographic area and groups of similar products and services:
|
| | | | | | | | | | | |
| | Year Ended June 30, |
| | 2018 | | 2017 | | 2016 |
| United States | $ | 1,078,544 |
| | $ | 901,061 |
| | $ | 781,335 |
|
| Germany (1) | 340,881 |
| | 256,069 |
| | 125,356 |
|
| Other (2) | 1,173,116 |
| | 978,275 |
| | 881,353 |
|
| Total revenue | $ | 2,592,541 |
| | $ | 2,135,405 |
| | $ | 1,788,044 |
|
|
| | | | | | | | | | | |
| | Year Ended June 30, |
| | 2018 | | 2017 | | 2016 |
| Physical printed products and other (3) | $ | 2,537,201 |
| | $ | 2,076,564 |
| | $ | 1,724,676 |
|
| Digital products/services | 55,340 |
| | 58,841 |
| | 63,368 |
|
| Total revenue | $ | 2,592,541 |
| | $ | 2,135,405 |
| | $ | 1,788,044 |
|
| | | | | | | | | | | | | | | | | | | | | |
| | | | Year Ended June 30, |
| | | | | | 2021 | | 2020 | | 2019 |
| United States | | | | | $ | 1,199,436 | | | $ | 1,251,531 | | | $ | 1,361,438 | |
| Germany (1) | | | | | 350,281 | | | 351,348 | | | 367,375 | |
| Other (2) | | | | | 1,042,796 | | | 878,479 | | | 1,022,263 | |
| Total revenue | | | | | $ | 2,592,513 | | | $ | 2,481,358 | | | $ | 2,751,076 | |
| | | | | | | | | | | | | | | | | | | | | |
| | | Year Ended June 30, |
| | | | | 2021 | | 2020 | | 2019 |
| Physical printed products and other (3) | | | | | $ | 2,477,158 | | | $ | 2,431,367 | | | $ | 2,700,167 | |
| Digital products/services (4) | | | | | 115,355 | | | 49,991 | | | 50,909 | |
| Total revenue | | | | | $ | 2,592,513 | | | $ | 2,481,358 | | | $ | 2,751,076 | |
__________________
(1) Our revenues within the German market exceeded 10% of our total consolidated revenue. Therefore, we have presented Germany as a significant geographic area.
(2) Our other revenue includes the Netherlands,Ireland, our country of domicile.
(3) Other revenue includes miscellaneous items which account for less than 1% of revenue.
(4) Digital products/service revenue includes revenue associated with design services and for the year ended June 30, 2021 includes revenue from our 99designs business which was acquired on October 1, 2020. Refer to Note 7 for additional details.
The following tables settable sets forth long-lived assets by geographic area:
| | | | June 30, 2018 | | June 30, 2017 | | June 30, 2021 | | June 30, 2020 |
| Long-lived assets (1): | |
| | |
| Long-lived assets (1): | | | |
| United States | | United States | $ | 107,868 | | | $ | 161,853 | |
| Netherlands | $ | 109,556 |
| | $ | 83,223 |
| Netherlands | 75,996 | | | 82,897 | |
| Canada | 81,334 |
| | 85,926 |
| Canada | 60,779 | | | 67,367 | |
| Switzerland | 52,523 |
| | 49,017 |
| Switzerland | 68,880 | | | 58,013 | |
| United States | 45,709 |
| | 64,034 |
| |
| Italy | 42,514 |
| | 44,423 |
| Italy | 47,776 | | | 46,317 | |
| Jamaica | | Jamaica | 20,550 | | | 21,563 | |
| Australia | 22,418 |
| | 22,961 |
| Australia | 21,298 | | | 19,695 | |
| Jamaica | 21,720 |
| | 21,492 |
| |
| France | 20,131 |
| | 22,794 |
| France | 25,417 | | | 23,917 | |
| Japan | 19,117 |
| | 20,686 |
| Japan | 14,891 | | | 15,430 | |
| Other | 67,842 |
| | 64,377 |
| Other | 96,063 | | | 94,922 | |
| Total | $ | 482,864 |
| | $ | 478,933 |
| Total | $ | 539,518 | | | $ | 591,974 | |
___________________
(1) Excludes goodwill of $520,843$726,979 and $514,963,$621,904, intangible assets, net of $230,201$186,744 and $275,924, the Waltham lease asset of $111,926 and $116,045, and$209,228, deferred tax assets of $67,087 $149,618and $48,004$143,496, and marketable securities, non-current of $50,713 and zero as of June 30, 20182021 and June 30, 2017,2020, respectively.
17. Commitments and Contingencies16. Leases
Lease Commitments
We have commitments under operating leases for our facilities that expire on various dates through 2026, including the Waltham lease arrangement discussed in Note 2. Total lease expense, net of sublease income, for the years ended June 30, 2018, 2017 and 2016 was $14,231, $13,959 and $12,943, respectively.
We lease certain machinery and plant equipment, as well as buildings,office space, and production and warehouse facilities under both capital andnon-cancelable operating lease agreementsleases that expire aton various dates through 2027. 2034. Our finance leases primarily relate to machinery and plant equipment.
The aggregate carrying valuefollowing table presents the classification of right-of-use assets and lease liabilities as of June 30, 2021 and 2020: | | | | | | | | | | | | | | | | | | | | |
| Leases | | Consolidated Balance Sheet Classification | | June 30, 2021 | | June 30, 2020 |
| | | | | | |
| Assets: | | | | | | |
| Operating right-of-use assets | | Operating lease assets, net (1) | | $ | 87,626 | | | $ | 156,258 | |
| Finance right-of-use assets | | Property, plant, and equipment, net (2) | | 35,384 | | | 20,842 | |
| Total lease assets | | | | $ | 123,010 | | | $ | 177,100 | |
| Liabilities: | | | | | | |
| Current: | | | | | | |
| Operating lease liabilities | | Operating lease liabilities, current (1) | | $ | 26,551 | | | $ | 41,772 | |
| Finance lease liabilities | | Other current liabilities (2) | | 32,314 | | | 8,055 | |
| Non-current: | | | | | | |
| Operating lease liabilities | | Operating lease liabilities, non-current | | 66,222 | | | 128,963 | |
| Finance lease liabilities | | Other liabilities | | 18,528 | | | 18,617 | |
| Total lease liabilities | | | | $ | 143,615 | | | $ | 197,407 | |
__________________
(1) The decrease in operating lease assets and liabilities is due primarily to the Waltham lease modifications described below.
(2) The increase in finance lease assets and liabilities is due primarily to the lease modification described below within the "Other Lease Modification" section.
The following table represents the lease expenses for the years ended June 30, 2021 and 2020: | | | | | | | | | | | | | | |
| | Year Ended |
| | June 30, 2021 | | June 30, 2020 |
| Operating lease expense (1) | | $ | 36,803 | | | $ | 43,058 | |
| Finance lease expense: | | | | |
| Amortization of finance lease assets | | 5,557 | | | 5,766 | |
| Interest on lease liabilities | | 211 | | | 698 | |
| Variable lease expense | | 7,846 | | | 10,775 | |
| Less: sublease income | | (2,309) | | | (3,545) | |
| Net operating and finance lease cost | | $ | 48,108 | | | $ | 56,752 | |
__________________
(1) The decrease in operating lease expense for the fiscal year ended June 30, 2021 is driven primarily by the Waltham lease modification described below.
Future minimum lease payments under non-cancelable leases as of June 30, 2021 were as follows: | | | | | | | | | | | | | | | | | |
| Payments Due by Period | Operating lease obligations | | Finance lease obligations | | Total lease obligations |
| Less than 1 year | $ | 29,527 | | | $ | 32,873 | | | $ | 62,400 | |
| 2 years | 25,125 | | | 6,738 | | | 31,863 | |
| 3 years | 20,377 | | | 5,511 | | | 25,888 | |
| 4 years | 12,397 | | | 4,326 | | | 16,723 | |
| 5 years | 7,270 | | | 2,181 | | | 9,451 | |
| Thereafter | 6,899 | | | 1,293 | | | 8,192 | |
| Total | 101,595 | | | 52,922 | | | 154,517 | |
| Less: present value discount | (8,822) | | | (2,080) | | | (10,902) | |
| Lease liability | $ | 92,773 | | | $ | 50,842 | | | $ | 143,615 | |
Other information about leases is as follows: | | | | | | | | | | | | | | |
| Lease Term and Discount Rate | | June 30, 2021 | | June 30, 2020 |
| Weighted-average remaining lease term (years): | | | | |
| Operating leases | | 4.28 | | 6.18 |
| Finance leases (1) | | 10.71 | | 4.61 |
| Weighted-average discount rate: | | | | |
| Operating leases | | 3.17 | % | | 2.83 | % |
| Finance leases | | 3.93 | % | | 2.62 | % |
__________________
(1) The increase to finance leases' weighted-average lease term is largely due to the reclassification of an operating lease to a finance lease upon giving notice to a landlord to exercise our purchase option under an existing lease. Refer to the "Other Lease Modification" section below for more details.
Our leases have remaining lease terms of 1 year to 14 years, inclusive of renewal or termination options that we are reasonably certain to exercise.
| | | | | | | | | | | | | | |
| | Year Ended |
| Supplemental Cash Flow Information | | June 30, 2021 | | June 30, 2020 |
| Cash paid for amounts included in measurement of lease liabilities: | | | | |
| Operating cash flows from operating leases (1) | | $ | 47,327 | | | $ | 40,777 | |
| Operating cash flows from finance leases | | 211 | | | 698 | |
| Financing cash flows from finance leases | | 8,001 | | | 9,511 | |
__________________(1) The operating lease cash flows included $8,761 of termination fees for the Waltham lease modification as described below.
Waltham Lease Modification
On January 6, 2021, we entered into an arrangement that modifies the lease agreement for our Waltham, Massachusetts office location, which results in us retaining a small portion of the previously leased buildingsoffice space in exchange for a reduction to our monthly rent payments for the space we no longer lease. As part of the agreement, we were required to pay a termination fee of $8,761 in two equal installments. The first payment was made on January 6, 2021, and equipment under capital leasesthe remaining amount was paid on April 1, 2021. The termination fee is inclusive of the rent that would have otherwise been paid on the leased space through June 2021 while it remained vacant. We separately entered into a lease agreement for a new office location in Waltham, Massachusetts which commenced on June 1, 2021. Prior to the amendment, the total remaining lease commitments through September 2026 were $64,811. Under the modified lease term, combined with the new lease arrangement, the total lease commitments through September 2026 will be $20,183, excluding the termination penalties included above.
Due to the partial termination of the lease, we recorded a decrease to the operating lease liabilities of $47,801 to reflect the reduced lease payments, including the termination penalties. We also recorded a decrease to the operating lease asset of $46,645 based on the proportionate decrease in the right-of-use asset, which resulted in a gain of $1,156, recognized in general and administrative expense on the consolidated statement of operations for the year ended June 30, 2021.
Due to our plans to no longer occupy the remaining leased office space and instead market the space to be subleased, we identified a triggering event with regards to the modified right-of-use asset. Therefore, we performed a discounted cash flow analysis that considered market-based rent assumptions, which resulted in an impairment of the right-of-use asset of $7,489 which was recognized in general and administrative expense on the consolidated statement of operations for the year ended June 30, 2021. Additionally, we recorded an impairment to general and administrative expense for abandoned assets related to the vacated space totaling $4,483, which included $2,787 in subtenant allowances, $1,312 in leasehold improvements, and $384 in furniture and fixtures.
Other Lease Modification
During the quarter ended March 31, 2021, we identified a triggering event due to a change in our intended use of the right-of-use asset of another one of our leased facilities, as we have committed to plans to exit the space and instead market it to be subleased or sold. We assessed the lease for impairment and performed a discounted cash flow analysis using current market-based rent assumptions, which resulted in an impairment of $7,420 that was recognized in general and administrative expense on the consolidated statement of operations for the year ended June 30, 2021. This impairment resulted in a decrease to the right of use asset totaling $5,280 and to the related leasehold improvements included within property, plant and equipment nettotaling $2,140. Additionally, we recorded an impairment for abandoned equipment in our consolidated balance sheet atthe amount of $1,680 that was recognized in general and administrative expense for the year ended June 30, 2018,2021.
On June 1, 2021, we gave notice to the landlord of one of our leased facilities to exercise our purchase option under the existing lease, which triggered a remeasurement event as the purchase option is $31,032, netnow considered reasonably certain of accumulated depreciationoccurring. We also executed a letter of$36,670; intent during the presentcurrent quarter to sell the building to an unrelated third-party, which would occur simultaneously with our exercise of the purchase option. The lease was previously recognized as an operating lease and our intent to now purchase the leased facility resulted in a modification of the lease and reclassification to a finance lease. The modification increased our lease liability to include the estimated purchase option amount, which remains subject to change as the purchase option amount is based on fair market value with an embedded floor. This modification resulted in an increase to the lease liability and asset of $8,201 and recognition of a finance lease installments not yet due included in other current liabilitiesasset of $15,860 and other liabilities in our consolidated balance sheet at June 30, 2018 amounts to $27,630.a corresponding liability of $23,959.
|
| | | | | | | | | | | | | | | |
| | Operating lease obligations | | Build-to-suit lease obligation (1) | | Capital lease obligation | | Total lease obligations |
| 2019 | $ | 22,623 |
| | $ | 12,569 |
| | $ | 10,850 |
| | $ | 46,042 |
|
| 2020 | 18,562 |
| | 12,569 |
| | 7,527 |
| | 38,658 |
|
| 2021 | 13,143 |
| | 12,569 |
| | 4,037 |
| | 29,749 |
|
| 2022 | 8,282 |
| | 12,569 |
| | 1,869 |
| | 22,720 |
|
| 2023 | 6,526 |
| | 10,788 |
| | 1,026 |
| | 18,340 |
|
| Thereafter | 7,702 |
| | 35,616 |
| | 2,287 |
| | 45,605 |
|
| Total | $ | 76,838 |
| | $ | 96,680 |
| | $ | 27,596 |
| | $ | 201,114 |
|
__________
(1) Minimum payments relate to our Waltham lease obligation, refer to Note 2 for additional details.17. Commitments and Contingencies
Purchase Obligations
At June 30, 2018,2021, we had unrecorded commitments under contract of $57,291$245,149, including commitments for third-party web services of $21,000. In addition, we had purchase commitments for production and computer equipment purchases of approximately $8,231,$95,497, inventory and third-party fulfillment purchase commitments of $8,361, commitments for$55,530, software of $47,694, advertising campaigns of $2,153,$13,047, production and computer equipment purchases of $14,722, professional and consulting fees of $3,559,$7,438, and other unrecorded purchase commitments of $13,987.$11,221.
Debt
The required principal payments due during the next five fiscal years and thereafter under our outstanding long-term debt obligations at June 30, 20182021 are as follows: |
| | | | |
| 2019 | | $ | 61,225 |
|
| 2020 | | 31,405 |
|
| 2021 | | 38,713 |
|
| 2022 | | 45,902 |
|
| 2023 | | 261,775 |
|
| Thereafter | | 400,409 |
|
| Total | | $ | 839,429 |
|
On June 14, 2018, we executed an amendment to our senior secured credit facility, and we expanded the total capacity to $1,128,172, which included $839,422 of revolving loans and $288,750 of term loans. The amendment also extended the maturity date of the senior secured credit facility to June 14, 2023. Refer to Note 10 for additional details related to the amendment. | | | | | | | | |
| 2022 | | $ | 13,330 | |
| 2023 | | 15,614 | |
| 2024 | | 15,247 | |
| 2025 | | 13,718 | |
| 2026 | | 612,527 | |
| Thereafter | | 1,094,420 | |
| Total | | $ | 1,764,856 | |
Other Obligations
We have an outstanding installment obligation of $2,103related to the fiscal 2012 intra-entity transfer of the intellectual propertydeferred payments for several of our subsidiary Webs, Inc., which resultsacquisitions resulting in tax being paid overthe recognition of a 7.5 year term and has been classified as a deferred tax liability of $45,025 in our consolidated balance sheetaggregate as of June 30, 2018. In addition, we have2021. As of June 30, 2021, this balance includes the deferred paymentspayment related to our other acquisitionsthe 99designs acquisition in the amount of $3,457$44,423 due in aggregate.February 2022. Refer to Note 7 for additional details.
Legal Proceedings
We are not currently party to any material legal proceedings. Although we cannot predict with certainty the results of litigation and claims to which we may be subject from time to time, we do not expect the resolution of any of our current matters to have a material adverse impact on our consolidated results of operations, cash flows or financial position. InFor all cases,legal matters, at each reporting period, we evaluate whether or not a potential loss amount or a potential range of loss is probable and reasonably estimable under the provisions of the authoritative guidance that addresses accounting for contingencies. We expense the costs relating to our legal proceedings as those costs are incurred.
18. Restructuring Charges
Restructuring costs include one-time employee termination benefits, acceleration of share-based compensation, write-off of assets and other related costs including third-party professional and outplacement services. The restructuring charges included in our consolidated statement of operations for the years ended June 30, 2018, 20172021, 2020, and 20162019 were $15,236, $26,700$1,641,$13,543, and $381,$12,054, respectively.
During the year ended June 30, 2018,2021 we recognized restructuring charges of $15,236, which included $12,112of $1,641, primarily due to organizational changes within The Print Group segment totaling $1,966 intended to streamline certain activities. This was partially offset by changes in estimate related to our Vistaprint reorganization for reductions in headcount and other operating costs. These changes simplified operations and more closely aligned functions to increase the speedprior period actions of execution. We also recognized $2,249 of restructuring charges within the central and corporate group, as well as $819 of expense for an initiative within our All Other Businesses reportable segment. During the year ended June 30, 2018, we recognized changes in estimates of $56 from our January 2017 restructuring initiative.$325. We do not expect any material charges to be incurred in future periods related to each of these initiatives.
During the year ended June 30, 2017, the Supervisory Board2020, we recognized restructuring charges of Cimpress N.V. approved a plan to restructure the company and implement organizational changes that decentralized the company’s operations in order to improve accountability for customer satisfaction and capital returns, simplify decision-making, and improve the speed$13,543, consisting of execution. This restructuring event resulted in additional costs,charges of $5,734 within our Vistaprint reportable segment as we evolved our organizational structure, including our reorganization of the technology team. We also recognized $3,532 in charges within our central and corporate costs, due to the coordinated reorganization of technology teams with our Vistaprint business. We also incurred charges of $3,211, $535, and global functions cost center of $25,584 for$475 in our National Pen, All Other Businesses and The Print Group reportable segments, respectively during the year ended June 30, 2017. In addition,2020, for various cost reduction measures primarily in response to the pandemic. These restructuring actions were completed during fiscal year 2020.
During the year ended June 30, 20172019, we recognized $1,116restructuring charges of restructuring costs within our National Pen business$12,054, primarily related to a separate initiative.restructuring action within our Vistaprint business, resulting in $8,467 of charges. The Vistaprint action included changes to the leadership team, as well as other reductions in headcount and associated costs. We also incurred individually immaterial restructuring charges in The Print Group, All Other Businesses reportable segments, and Central and Corporate cost center of $2,223, $1,197, and $167, respectively. These restructuring initiativesactions were completed during fiscal 2017.year 2019.
The following table summarizes the restructuring activity during the years ended June 30, 20182021 and 2017:2020:
|
| | | | | | | | | | | |
| | Severance and Related Benefits | | Other Restructuring Costs | | Total |
| Accrued restructuring liability as of June 30, 2016 | $ | — |
| | $ | — |
| | $ | — |
|
| Restructuring charges | 24,020 |
| | 2,680 |
| | 26,700 |
|
| Cash payments | (13,161 | ) | | (1,861 | ) | | (15,022 | ) |
| Non-cash charges (1) | (6,257 | ) | | (611 | ) | | (6,868 | ) |
| Accrued restructuring liability as of June 30, 2017 (1) | 4,602 |
| | 208 |
| | 4,810 |
|
| Restructuring charges | 15,236 |
| | — |
| | 15,236 |
|
| Cash payments | (17,136 | ) | | (206 | ) | | (17,342 | ) |
| Non-cash charges (1) | (1,317 | ) | | — |
| | (1,317 | ) |
| Accrued restructuring liability as of June 30, 2018 | $ | 1,385 |
| | $ | 2 |
| | $ | 1,387 |
|
___________________ | | | | | | | | | | | | | | | | | |
| Severance and Related Benefits | | Other Restructuring Costs | | Total |
| Accrued restructuring liability as of June 30, 2019 | $ | 3,045 | | | $ | 167 | | | $ | 3,212 | |
| Restructuring charges | 13,193 | | | 350 | | | 13,543 | |
| Cash payments | (8,647) | | | (440) | | | (9,087) | |
| Non-cash charges (1) | (1,622) | | | 0 | | | (1,622) | |
| Accrued restructuring liability as of June 30, 2020 | 5,969 | | | 77 | | | 6,046 | |
| Restructuring charges | 998 | | | 643 | | | 1,641 | |
| Cash payments | (6,565) | | | — | | | (6,565) | |
| Non-cash charges (1) | — | | | (720) | | | (720) | |
| Accrued restructuring liability as of June 30, 2021 | $ | 402 | | | $ | 0 | | | $ | 402 | |
| | | | | |
__________________(1) Non-cash charges primarily include the write-off of property, plant and equipment, net, which was recognized as part of the actions taken in The Print Group segment during the year ended June 30, 2021, and also includes the acceleration of share-basedshare based compensation expenses.expenses for the year ended June 30, 2020.
19. Quarterly Financial Data (unaudited)
|
| | | | | | | | | | | | | | | |
| Year Ended June 30, 2018 | First Quarter | | Second Quarter | | Third Quarter | | Fourth Quarter |
| Revenue | $ | 563,284 |
| | $ | 762,054 |
| | $ | 636,069 |
| | $ | 631,134 |
|
| Cost of revenue | 283,755 |
| | 360,285 |
| | 319,209 |
| | 316,550 |
|
| Net income (loss) | 23,406 |
| | 30,623 |
| | (1,602 | ) | | (5,639 | ) |
| Net income (loss) attributable to Cimpress N.V. | 23,363 |
| | 29,935 |
| | (2,265 | ) | | (7,300 | ) |
| Net income (loss) per share attributable to Cimpress N.V.: | | | | | | | |
| Basic | $ | 0.75 |
| | $ | 0.96 |
| | $ | (0.07 | ) | | $ | (0.24 | ) |
| Diluted | $ | 0.72 |
| | $ | 0.93 |
| | $ | (0.07 | ) | | $ | (0.24 | ) |
|
| | | | | | | | | | | | | | | |
| Year Ended June 30, 2017 | First Quarter | | Second Quarter | | Third Quarter | | Fourth Quarter |
| Revenue | $ | 443,713 |
| | $ | 576,851 |
| | $ | 550,585 |
| | $ | 564,256 |
|
| Cost of revenue | 213,050 |
| | 276,366 |
| | 268,482 |
| | 279,077 |
|
| Net income (loss) | (30,030 | ) | | 35,022 |
| | (42,678 | ) | | (34,513 | ) |
| Net income (loss) attributable to Cimpress N.V. | (29,103 | ) | | 35,028 |
| | (42,934 | ) | | (34,702 | ) |
| Net income (loss) per share attributable to Cimpress N.V.: | | | | | | | |
| Basic | $ | (0.92 | ) | | $ | 1.12 |
| | $ | (1.38 | ) | | $ | (1.11 | ) |
| Diluted | $ | (0.92 | ) | | $ | 1.07 |
| | $ | (1.38 | ) | | $ | (1.11 | ) |
Basic and diluted net income (loss) per share attributable to Cimpress N.V. are computed independently for each of the quarters presented. Therefore, the sum of quarterly basic and diluted per share information may not equal annual basic and diluted net income per share.
20. Subsequent Events
On July 2, 2018, we invested $29,000 in exchange for approximately 74% in VIDA Group Co., a rapidly growing startup that brings manufacturing access and an e-commerce marketplace to artists, thereby enabling artists to convert ideas into beautiful, original products for customers, ranging from custom fashion, jewelry and accessories to home accent pieces.
Item 9. Changes in and Disagreement with Accountants on Accounting and Financial Disclosure
None.
Item 9A. Controls and Procedures
Disclosure Controls and Procedures
Our management, with the participation of our chief executive officer and chief financial officer, evaluated the effectiveness of our disclosure controls and procedures as of June 30, 2018.2021. The term “disclosure controls and procedures,” as defined in Rules 13a-15(e) and 15d-15(e) under the Securities Exchange Act of 1934, or the Exchange Act, means controls and other procedures of a company that are designed to ensure that information required to be disclosed by a company in the reports that it files or submits under the Exchange Act is recorded, processed, summarized and reported, within the time periods specified in the SEC’s rules and forms. Disclosure controls and procedures include, without limitation, controls and procedures designed to ensure that information required to be disclosed by a company in the reports that it files or submits under the Exchange Act is accumulated and communicated to the company’s management, including its principal executive and principal financial officers, as appropriate to allow timely decisions regarding required disclosure. Management recognizes that any controls and procedures, no matter how well designed and operated, can provide only reasonable assurance of achieving their objectives and management necessarily applies its judgment in evaluating the cost-benefit relationship of possible controls and procedures. Based on the evaluation of our disclosure controls and procedures as of June 30, 2018,2021, our chief executive officer and chief financial officer concluded that, as of such date, our disclosure controls and procedures were effective at the reasonable assurance level.
Changes in Internal Control Over Financial Reporting
There were no significant changes in our internal control over financial reporting (as defined in Rules 13a-15(f) and 15d-15(f) under the Exchange Act) during the three months ended June 30, 20182021 that materially affected, or are reasonably likely to materially affect, our internal control over financial reporting.
Management's Report on Internal Control Over Financial Reporting
Our management is responsible for establishing and maintaining adequate internal control over financial reporting for the company. Internal control over financial reporting is defined in Rules 13a-15(f) and 15d-15(f) promulgated under the Exchange Act as a process designed by, or under the supervision of, the company’s chief executive officer and chief financial officer and effected by the company’s supervisory board,our Board of Directors, management and other personnel, to provide reasonable assurance regarding the reliability of financial reporting and the preparation of financial statements for external purposes in accordance with generally accepted accounting principles and includes those policies and procedures that:
•Pertain to the maintenance of records that in reasonable detail accurately and fairly reflect the transactions and dispositions of the assets of the company;
•Provide reasonable assurance that transactions are recorded as necessary to permit preparation of financial statements in accordance with generally accepted accounting principles, and that receipts and expenditures of the company are being made only in accordance with authorizations of management and directors of the company; and
•Provide reasonable assurance regarding prevention or timely detection of unauthorized acquisition, use or disposition of the company’s assets that could have a material effect on the financial statements.
Because of its inherent limitations, internal control over financial reporting may not prevent or detect misstatements. Projections of any evaluation of effectiveness to future periods are subject to the risk that controls may become inadequate because of changes in conditions, or that the degree of compliance with the policies or procedures may deteriorate.
Our management assessed the effectiveness of our internal control over financial reporting as of June 30, 2018.2021. In making this assessment, our management used the criteria set forth in the Internal Control — Integrated Framework (2013) issued by the Committee of Sponsoring Organizations of the Treadway Commission (COSO). Based on our assessment, management concluded that, as of June 30, 2018,2021, our internal control over financial reporting is effective based on criteria in Internal Control - Integrated Framework (2013) issued by the COSO. PricewaterhouseCoopers LLP, our independent registered public accounting firm, has audited the effectiveness of our internal control over financial reporting as of June 30, 2018,2021, as stated in their report included on pages 53 - 54.
45-46.
Item 9B. Other Information
None.
PART IIIIII.
Item 10. Directors, Executive Officers and Corporate Governance
The information required by this item is incorporated by reference to the information in the sections captioned “Information about our Supervisory Board membersDirectors and Executive Officers,” “Corporate Governance” and “Section“Delinquent Section 16(a) Beneficial Ownership Reporting Compliance”Reports” contained in our definitive proxy statement for our 20182021 Annual General Meeting of Shareholders, which we refer to as our 20182021 Proxy Statement.
We have adopted a written code of business conduct and ethics that applies to all of our employees, including our principal executive officer and principal financial and accounting officer, and is available on our website at www.cimpress.com. We did not waive any provisions of this code during the fiscal year ended June 30, 2018.2021. If we amend, or grant a waiver under, our code of business conduct and ethics that applies to our principal executive, financial or accounting officers, or persons performing similar functions, we will post information about such amendment or waiver on our website at www.cimpress.com.
Item 11. Executive Compensation
The information required by this item is incorporated by reference to the information contained in the sections of our 20182021 Proxy Statement captioned “Compensation Discussion and Analysis," "Summary Compensation Tables",Tables," “Compensation of Supervisoryour Board Members”of Directors" and “Compensation Committee Interlocks and Insider Participation.”
Item 12. Security Ownership of Certain Beneficial Owners and Management and Related Stockholder
Matters
The information required by this item is incorporated by reference to the information contained in the sections of our 20182021 Proxy Statement captioned “Security Ownership of Certain Beneficial Owners and Management” and “Securities Authorized for Issuance Under Equity Compensation Plans.”
Item 13. Certain Relationships and Related Transactions, and Director Independence
The information required by this item is incorporated by reference to the information contained in the sections of our 20182021 Proxy Statement captioned “Certain Relationships and Related Transactions” and “Corporate Governance.”
Item 14. Principal Accountant Fees and Services
The information required by this item is incorporated by reference to the information contained in the section of our 20182021 Proxy Statement captioned “Independent Registered Public Accounting Firm Fees and Other Matters.”
PART IVIV.
Item 15. 6. Exhibits and Financial Statement Schedules
(a) Consolidated Financial Statements.
For a list of the consolidated financial information included herein, see Index to the Consolidated Financial Statements on page 52 of this Report.
(b) Exhibits.
|
| | | | | | | |
| Exhibit No. | | Description |
No.3.1 | | Description |
| 4.1 | | Articles of Association of Cimpress N.V., as amended |
| | is incorporated by reference to our Current Report on Form 8-K filed with the SEC on June 18, 2018 |
| 4.2 | | 2005 Non-Employee Directors’ Share Option Plan,Second Supplemental Indenture, dated as amended,of December 3, 2019, with respect to the 7.0% senior notes due 2026, between Cimpress plc, certain subsidiaries of Cimpress plc as guarantors thereto, and U.S. Bank National Association, as successor trustee, is incorporated by reference to our Quarterly Report on Form 10-Q for the fiscal quarter ended September 30, 2010December 31, 2019 |
| 4.3 | |
|
| 4.4 | | |
| 4.5 | | |
| 10.1* | | |
| 10.2* | | |
| 10.3* | | Amended and Restated 2005 Equity Incentive Plan, as amended, is incorporated by reference to our Quarterly Report on Form 10-Q for the fiscal quarter ended September 30, 2010 |
| | Form of Nonqualified Share Option Agreement under our Amended and Restated 2005 Equity Incentive Plan is incorporated by reference to our Quarterly Report on Form 10-Q for the fiscal quarter ended September 30, 2009 |
| | 2011 Equity Incentive Plan is incorporated by reference to Appendix A to our Definitive Proxy Statement on Schedule 14A dated and filed with the SEC on June 8, 2011 |
| | Form of Nonqualified Share Option Agreement under our 2011 Equity Incentive Plan is incorporated by reference to our Quarterly Report on Form 10-Q for the fiscal quarter ended September 30, 2011 |
| | Form of Restricted Share Unit Agreement for employees and executives under our 2011 Equity Incentive Plan is incorporated by reference to our Quarterly Report on Form 10-Q for the fiscal quarter ended September 30, 2011 |
| | 2016 Performance Equity Plan, as amended, is incorporated by reference to our Current Report on Form 8-K filed with the SEC on November 16, 2016December 3, 2019 |
| 10.4* | | |
| 10.5* | | |
| 10.6* | | |
| 10.7* | | |
| 10.8* | | |
| 10.9* | | |
| 10.10* | | |
| 10.11* | | |
| 10.12* | | |
| 10.13* | | |
| 10.14* | | |
| 10.15* | | |
| 10.16* | | |
| 10.17* | | |
| 10.18* | | |
| | | | | | | | |
| 10.19* | | |
| 10.20* | | |
| 10.21* | 2015 Inducement Share Plan | |
| | Form of Restricted Share Award Agreement under 2015 Inducement Share Plan is incorporated by reference to our Annual Report on Form 10-K for the fiscal year ended June 30, 2015 |
| | Form of Indemnification Agreement between Cimpress N.V. and each of our executive officers and members of our Supervisory Board and Management Board is incorporated by reference to our Current Report on Form 8-K filed with the SEC on August 31, 2009 |
| | Amended and Restated Executive Retention Agreement between Cimpress N.V. and Robert Keane dated as of October 23, 2009 is incorporated by reference to our Quarterly Report on Form 10-Q for the fiscal quarter ended September 30, 2009 |
| | Form of Amended and Restated Executive Retention Agreement between Cimpress N.V. and Katryn Blake is incorporated by reference to our Quarterly Report on Form 10-Q for the fiscal quarter ended September 30, 2009 (File No. 000-51539) |
| | Form of Executive Retention Agreement between Cimpress N.V. and each of Donald LeBlanc and Sean Quinn is incorporated by reference to our Quarterly Report on Form 10-Q for the fiscal quarter ended September 30, 2016 |
| | Employment Agreement between Cimpress USA Incorporated and Robert Keane effective September 1, 2009 is incorporated by reference to our Quarterly Report on Form 10-Q for the fiscal quarter ended March 31, 2010 |
|
| 10.22* | | |
| | Amendment No. 1 to Employment Agreement between Cimpress USA Incorporated and Robert Keane dated June 14, 2010 is incorporated by reference to our Annual Report on Form 10-K for the fiscal year ended June 30, 2010 |
| | Amendment No. 2 to Employment Agreement between Cimpress USA Incorporated and Robert Keane dated September 28, 2011 is incorporated by reference to our Quarterly Report on Form 10-Q for the fiscal quarter ended September 30, 2011 |
| | Amendment No. 3 to Employment Agreement between Cimpress USA Incorporated and Robert Keane dated July 25, 2012 is incorporated by reference to our Annual Report on Form 10-K for the fiscal year ended June 30, 2012 |
| | Amendment No. 4 to Employment Agreement between Cimpress USA Incorporated and Robert Keane dated September 1, 2013 is incorporated by reference to our Quarterly Report on Form 10-Q for the fiscal quarter ended September 30, 2013 |
| | Amendment No. 5 to Employment Agreement between Cimpress USA Incorporated and Robert Keane dated September 30, 2014 is incorporated by reference to our Quarterly Report on Form 10-Q for the fiscal quarter ended September 30, 2014 |
| | Amendment No. 6 to Employment Agreement between Cimpress USA Incorporated and Robert Keane dated September 30, 2015 is incorporated by reference to our Quarterly Report on Form 10-Q for the fiscal quarter ended December 31, 2015 |
| | Amendment No. 7 to Employment Agreement between Cimpress USA Incorporated and Robert Keane dated August 23, 2016 is incorporated by reference to our Quarterly Report on Form 10-Q for the fiscal quarter ended September 30, 2016 |
| | Amendment No. 8 to Employment Agreement between Cimpress USA Incorporated and Robert Keane dated September 30, 2017 is incorporated by reference to our Quarterly Report on Form 10-Q for the fiscal quarter ended September 30, 2017 |
| | Amendment No. 9 to Employment Agreement between Cimpress USA Incorporated and Robert Keane dated July 31, 2018 |
| | Memorandum clarifying relative precedence of agreements between Cimpress N.V. and Robert Keane dated May 6, 2010 is incorporated by reference to our Annual Report on Form 10-K for the fiscal year ended June 30, 2010 |
| | Agreement Limiting PSU Awards dated May 13, 2016 between Cimpress plc (as successor to Cimpress N.V.) and Robert Keane is incorporated by reference to our Current Report on Form 8-K filed with the SEC on May 17, 2016 |
| 10.23* | | Employment |
| | Amendment to Employment Agreement between Cimpress N.V. and Cornelis David Arends dated December 18, 2017Robert Keane is incorporated by reference to our Current Report on Form 8-K filed with the SEC on December 20, 2017September 30, 2020 |
| 10.24* | | Long Term International Assignment Agreement between Cimpress N.V. and Cornelis David Arends dated December 9, 2015 is incorporated by reference to our Quarterly Report on Form 10-Q for the fiscal quarter ended September 30, 2016 |
| | Amendment to Long Term Assignment Agreement between Cimpress N.V. and Cornelis David Arends dated December 18, 2017 is incorporated by reference to our Current Report on Form 8-K filed with the SEC on December 20, 2017 |
| | Form of Invention and Non-Disclosure Agreement between Cimpress and each of Robert Keane, Katryn Blake, Donald LeBlanc,Sean Quinn, and Sean QuinnMaarten Wensveen is incorporated by reference to our Registration Statement on Form S-1, as amended |
| 10.25* | | |
| 10.26 | | Summary of Compensatory Arrangements with Members of the Supervisory Board is incorporated by reference to our Quarterly Report on Form 10-Q for the fiscal quarter ended December 31, 2016 |
| | Call Option Agreement between Cimpress N.V. and Stichting Continuïteit Cimpress (formerly Stichting Continuïteit Vistaprint) dated November 16, 2009 is incorporated by reference to our Current Report on Form 8-K filed with the SEC on November 19, 2009 |
| | Amendment and Restatement Agreement dated as of July 13, 2017May 17, 2021 among Cimpress N.V.plc, Vistaprint Limited, Cimpress Schweiz GmbH, Vistaprint B.V., Vistaprint Netherlands B.V., and Cimpress USA Incorporated, as borrowers (the “Borrowers”); the lenders named therein as lenders; and JPMorgan Chase Bank N.A., as administrative agent for the lenders (the “Administrative Agent”), which amends and restates the senior Credit Agreement dated as of October 21, 2011, as amended and restated as of February 8, 2013, among the Borrowers, the lenders named therein, and the Administrative Agent,as further amended and restated as of July 13, 2017, is incorporated by reference to our Current Report on Form 8-K filed with the SEC on July 14, 2017May 19, 2021 |
| | Amendment No. 1, dated as of June 14, 2018, among Cimpress N.V., Vistaprint Limited, Cimpress Schweiz GmbH, Vistaprint B.V., and Cimpress USA Incorporated, as borrowers (the “Borrowers”); the lenders named therein as lenders; and JPMorgan Chase Bank N.A., as administrative agent for the lenders (the “Administrative Agent”), to the senior Credit Agreement dated as of October 21, 2011, as amended and restated as of February 8, 2013, and as further amended and restated as of July 13, 2017, among the Borrowers, the lenders named therein, and the Administrative Agent, is incorporated by reference to our Current Report on Form 8-K filed with the SEC on June 18, 2018 |
|
| 10.27 | | |
| | Second Amended and Restated Guaranty dated as of July 13, 2017 between Cimpress' subsidiary guarantors named therein as guarantors (the "Subsidiary Guarantors") and the Administrative Agent, which amends and restates the Amended and Restated Guaranty dated as of February 8, 2013, between the Subsidiary Guarantors and the Administrative Agent, is incorporated by reference to our Current Report on Form 8-K filed with the SEC on July 14, 2017 |
| 10.28 | | Amended and Restated Pledge and Security Agreement dated as of July 13, 2017 between Cimpress USA Incorporated, Vistaprint Limited, Cimpress Schweiz GmbH, and Vistaprint B.V., ascertain Borrowers and Cimpress USA Manufacturing Incorporated, National Pen Co. LLC, National Pen Tennessee LLC, NP Corporate Services LLC, Pixartprinting USA Incorporated, Vistaprint Corporate Solutions Incorporated, and Webs, Inc., as Subsidiary Guarantors, on one hand, and the Administrative Agent, on the other hand, which amends and restates the Pledge and Security Agreement dated as of February 8, 2013, between such Borrowers and Subsidiary Guarantors and the Administrative Agent, is incorporated by reference to our Current Report on Form 8-K filed with the SEC on July 14, 2017 |
| | |
| | |
| | |
| | |
| | |
| 101 | | The following materials from this Annual Report on Form 10-K, formatted in Inline Extensible Business Reporting Language (XBRL)(iXBRL): (i) Condensed Consolidated Balance Sheets, (ii) Condensed Consolidated Statements of Operations, (iii) Condensed Statements of Shareholder's Equity, (iv) Condensed Consolidated Statements of Cash Flows and (v) Notes to Condensed Consolidated Financial Statements. |
| 104 | | Cover Page Interactive Data File (formatted as iXBRL and contained in Exhibit 101) |
__________________
*Management contract or compensatory plan or arrangement
Item 16. Form 10-K Summary
None.
|
| | |
* | | Management contract or compensatory plan or arrangement |
(c) Financial Statement Schedules.
All schedules have been omitted because the information required to be set forth therein is not applicable or is shown in the accompanying consolidated financial statements or notes thereto.
SIGNATURES
Pursuant to the requirements of the Securities Exchange Act of 1934, the registrant has duly caused this report to be signed on its behalf by the undersigned, thereunto duly authorized.
August 10, 20186, 2021 Cimpress N.V.
|
| | | | | | | |
| By: | /s/ Robert S. Keane |
| | Robert S. Keane |
| | Founder &and Chief Executive Officer |
Pursuant to the requirements of the Securities Exchange Act of 1934, this report has been signed below by the following persons on behalf of the registrant and in the capacities and on the dates indicated.
|
| | | | | | | | | | | | | |
| Signature | | Title | | Date |
| | | | |
| /s/ Robert S. Keane | | Founder & Chief Executive Officer | | August 10, 20186, 2021 |
| Robert S. Keane | | (Principal(Principal executive officer) | | |
| | | | |
| /s/ Sean E. Quinn | | Chief Financial Officer | | August 10, 20186, 2021 |
| Sean E. Quinn | | (Principal financial and accounting officer) | | |
| | | | |
/s/ Paolo De Cesare | | Member, Supervisory Board | | August 10, 2018 |
Paolo De Cesare | | | | |
| | | | |
| /s/ Sophie A. Gasperment | | Member, Supervisory BoardDirector | | August 10, 20186, 2021 |
| Sophie A. Gasperment | | | | |
| | | | |
| /s/ John J. Gavin Jr. | | Member, Supervisory BoardDirector | | August 10, 20186, 2021 |
| John J. Gavin Jr. | | | | |
| | | | |
/s/ Richard T. Riley | | Chairman, Supervisory Board | | August 10, 2018 |
Richard T. Riley | | | | |
| | | | |
/s/ Nadia Shouraboura | | Member, Supervisory Board | | August 10, 2018 |
Nadia Shouraboura | | | | |
| | | | |
| /s/ Zachary S. Sternberg | | Member, Supervisory BoardDirector | | August 10, 20186, 2021 |
| Zachary S. Sternberg | | | | |
| | | | |
/s/ Mark T. Thomas | | Member, Supervisory Board | | August 10, 2018 |
Mark T. Thomas | | | | |
| | | | |
| /s/ Scott Vassalluzzo | | Member, Supervisory BoardDirector | | August 10, 20186, 2021 |
| Scott Vassalluzzo | | | | |