Table of Contents

 
UNITED STATES
SECURITIES AND EXCHANGE COMMISSION
Washington, D.C. 20549

FORM 10-K
ý ANNUAL REPORT UNDER SECTION 13 OR 15(d) OF THE SECURITIES EXCHANGE ACT OF 1934
For the fiscal year ended December 31, 20152016
Or
o TRANSITION REPORT PURSUANT TO SECTION 13 OR 15(d) OF THE SECURITIES EXCHANGE ACT OF 1934
For the transition period from to
Commission File Number 001-32141
ASSURED GUARANTY LTD.
(Exact name of Registrant as specified in its charter)
Bermuda
(State or other jurisdiction of
incorporation or organization)
 
98-0429991
(I.R.S. Employer Identification No.)
30 Woodbourne Avenue
Hamilton HM 08 Bermuda
(441) 279-5700
(Address, including zip code, and telephone number,
including area code, of Registrant's principal executive office)
None
(Former name, former address and former fiscal year, if changed since last report)
Securities registered pursuant to Section 12(b) of the Act:
Title of each class  
Name of each exchange on which registered 
Common Shares, $0.01 per share New York Stock Exchange, Inc.
Securities registered pursuant to Section 12(g) of the Act: None
Indicate by check mark if the registrant is a well-known seasoned issuer, as defined in Rule 405 of the Securities Act. Yes ý    No o
Indicate by check mark if the registrant is not required to file reports pursuant to Section 13 or Section 15(d) of the Act. Yes o    No ý
Indicate by check mark whether the registrant: (1) has filed all reports required to be filed by Section 13 or 15(d) of the Securities Exchange Act of 1934 during the preceding 12 months (or for such shorter period that the Registrant was required to file such reports), and (2) has been subject to such filing requirements for the past 90 days. Yes ý    No o
Indicate by check mark whether the registrant has submitted electronically and posted on its corporate Web site, if any, every Interactive Data File required to be submitted and posted pursuant to Rule 405 of Regulation S-T during the preceding 12 months (or for such shorter period that the registrant was required to submit and post such files). Yes ý    No o
Indicate by check mark if disclosure of delinquent filers pursuant to Item 405 of Regulation S-K is not contained herein, and will not be contained, to the best of registrant's knowledge, in definitive proxy or information statements incorporated by reference in Part III of this Form 10-K or any amendment to this Form 10-K. ýo
Indicate by check mark whether the registrant is a large accelerated filer, an accelerated filer, a non-accelerated filer, or a smaller reporting company. See the definitions of "large accelerated filer," "accelerated filer," and "smaller reporting company" in Rule 12b-2 of the Exchange Act.
Large accelerated filer ý
 
Accelerated filer o
 
Non-accelerated filer o
 (Do not check if a
smaller reporting company)
 
Smaller reporting company o


Indicate by check mark whether the registrant is a shell company (as defined in Rule 12b-2 of the Exchange Act). Yes o    No ý
The aggregate market value of Common Shares held by non-affiliates of the Registrant as of the close of business on June 30, 20152016 was $3,501,022,807$3,310,230,030 (based upon the closing price of the Registrant's shares on the New York Stock Exchange on that date, which was $23.99)$25.37). For purposes of this information, the outstanding Common Shares which were owned by all directors and executive officers of the Registrant were deemed to be the only shares of Common Stock held by affiliates.
As of February 23, 2016, 135,925,92121, 2017, 125,017,614 Common Shares, par value $0.01 per share, were outstanding (including 62,14558,858 unvested restricted shares).
DOCUMENTS INCORPORATED BY REFERENCE
Certain portions of Registrant's definitive proxy statement relating to its 2016 Annual General Meeting of Shareholders are incorporated by reference to Part III of this report.


Forward Looking Statements

This Form 10-K contains information that includes or is based upon forward looking statements within the meaning of the Private Securities Litigation Reform Act of 1995. Forward looking statements give the expectations or forecasts of future events of Assured Guaranty Ltd. (“AGL”)(AGL) and its subsidiaries (collectively with AGL, “Assured Guaranty”Assured Guaranty or the “Company”)Company). These statements can be identified by the fact that they do not relate strictly to historical or current facts and relate to future operating or financial performance.
 
Any or all of Assured Guaranty’s forward looking statements herein are based on current expectations and the current economic environment and may turn out to be incorrect. Assured Guaranty’s actual results may vary materially. Among factors that could cause actual results to differ adversely are:
 
reduction in the amount of available insurance opportunities and/or in the demand for Assured Guaranty's insurance;
rating agency action, including a ratings downgrade, a change in outlook, the placement of ratings on watch for downgrade, or a change in rating criteria, at any time, of AGL or any of its subsidiaries, and/or of any securities AGL or any of its subsidiaries have issued, and/or of transactions that AGL’s subsidiaries have insured;
reduction in the amount of available insurance opportunities and/or in the demand for Assured Guaranty's insurance;
developments in the world’s financial and capital markets that adversely affect obligors’ payment rates, Assured Guaranty’s loss experience, or its exposure to refinancing risk in transactions (which could result in substantial liquidity claims on its guarantees);
the possibility that budget or pension shortfalls or other factors will result in credit losses or impairments on obligations of state, territorial and local governments and their related authorities and public corporations that Assured Guaranty insures or reinsures;
the failure of Assured Guaranty to realize loss recoveries that are assumed in its expected loss estimates;
deterioration in the financial condition of Assured Guaranty’s reinsurers, the amount and timing of reinsurance recoverables actually received and the risk that reinsurers may dispute amounts owed to Assured Guaranty under its reinsurance agreements;
increased competition, including from new entrants into the financial guaranty industry;
rating agency action on obligors, including sovereign debtors, resulting in a reduction in the value of securities in Assured Guaranty's investment portfolio and in collateral posted by and to Assured Guaranty;
the inability of Assured Guaranty to access external sources of capital on acceptable terms;
changes in the world’s credit markets, segments thereof, interest rates or general economic conditions;
the impact of market volatility on the mark-to-market of Assured Guaranty’s contracts written in credit default swap form;
changes in applicable accounting policies or practices;
changes in applicable laws or regulations, including insurance, bankruptcy and tax laws, or other governmental actions;
the impact of changes in the world’s economy and credit and currency markets and in applicable laws or regulations relating to the decision of the United Kingdom to exit the European Union;
the possibility that acquisitions or alternative investments made by Assured Guaranty do not result in the benefits anticipated or subject Assured Guaranty to unanticipated consequences;
deterioration in the financial condition of Assured Guaranty’s reinsurers, the amount and timing of reinsurance recoverables actually received and the risk that reinsurers may dispute amounts owed to Assured Guaranty under its reinsurance agreements;
difficulties with the execution of Assured Guaranty’s business strategy;
loss of key personnel;
the effects of mergers, acquisitions and divestitures;

natural or man-made catastrophes;
other risks and uncertainties that have not been identified at this time;
management’s response to these factors; and


other risk factors identified in AGL’s filings with the U.S. Securities and Exchange Commission (the “SEC”).SEC);
other risks and uncertainties that have not been identified at this time; and
management’s response to these factors.
 The foregoing review of important factors should not be construed as exhaustive, and should be read in conjunction with the other cautionary statements that are included in this Form 10-K. The Company undertakes no obligation to update publicly or review any forward looking statement, whether as a result of new information, future developments or otherwise, except as required by law. Investors are advised, however, to consult any further disclosures the Company makes on related subjects in the Company’s reports filed with the SEC.
 
If one or more of these or other risks or uncertainties materialize, or if the Company’s underlying assumptions prove to be incorrect, actual results may vary materially from what the Company projected. Any forward looking statements in this Form 10-K reflect the Company’s current views with respect to future events and are subject to these and other risks, uncertainties and assumptions relating to its operations, results of operations, growth strategy and liquidity.
 
For these statements, the Company claims the protection of the safe harbor for forward looking statements contained in Section 27A of the Securities Act of 1933, as amended (the “Securities Act”)Securities Act), and Section 21E of the Securities Exchange Act of 1934, as amended (the “Exchange Act”)Exchange Act).

Convention
 
Unless otherwise noted, ratings on Assured Guaranty's insured portfolio and on bonds or notes purchased pursuant to loss mitigation strategies ("loss mitigation securities") or other risk management strategies (loss mitigation securities) are Assured Guaranty’s internal ratings. Internal credit ratings are expressed on a rating scale similar to that used by the rating agencies and generally reflect an approach similar to that employed by the rating agencies, except that Assured Guaranty's internal credit ratings focus on future performance, rather than lifetime performance.

In addition, unless otherwise noted, the Company excludes amounts attributable to loss mitigation securities from par and debt service outstanding because itas a result of loss mitigation strategies, including loss mitigation securities held in the investment portfolio. The Company manages suchthe loss mitigation securities as investments and not insurance exposure.


ASSURED GUARANTY LTD.
FORM 10-K
TABLE OF CONTENTS 
  Page


PART I

ITEM 1.BUSINESS

Overview

Assured Guaranty Ltd. (“AGL”(AGL and, together with its subsidiaries, “Assured Guaranty”Assured Guaranty or the “Company”)Company) is a Bermuda-based holding company incorporated in 2003 that provides, through its operating subsidiaries, credit protection products to the United States (“U.S.”(U.S.) and international public finance (including infrastructure) and structured finance markets. The Company applies its credit underwriting judgment, risk management skills and capital markets experience primarily to offer financial guaranty insurance that protects holders of debt instruments and other monetary obligations from defaults in scheduled payments. If an obligor defaults on a scheduled payment due on an obligation, including a scheduled principal or interest payment (“Debt Service”)(Debt Service), the Company is required under its unconditional and irrevocable financial guaranty to pay the amount of the shortfall to the holder of the obligation. The Company markets its financial guaranty insurance directly to issuers and underwriters of public finance and structured finance securities as well as to investors in such obligations. The Company guarantees obligations issued principally in the U.S. and the United Kingdom ("U.K"(U.K.), and also guarantees obligations issued in other countries and regions, including Australia and Western Europe. The Company also provides other forms of insurance that are in line with its risk profile and benefit from its underwriting experience.

The Company conducts its financial guaranty business on a direct basis from the following companies: Assured Guaranty Municipal Corp. ("AGM")(AGM), Municipal Assurance Corp. ("MAC")(MAC), Assured Guaranty Corp. ("AGC")(AGC), and Assured Guaranty (Europe) Ltd. ("AGE")(AGE). It also conducts business through Assured Guaranty Re Ltd. ("AG Re")(AG Re) and Assured Guaranty Re Overseas Ltd. (AGRO), a Bermuda-based reinsurer.reinsurers. The following is a description of AGL's principal operating subsidiaries:

Assured Guaranty Municipal Corp. AGM is located and domiciled in New York, was organized in 1984 and commenced operations in 1985. Since mid-2008, AGM has provided financial guaranty insurance only on debt obligations issued in the U.S. public finance and global infrastructure markets, including bonds issued by U.S. state or governmental authorities or notes issued to finance infrastructure projects. Previously, AGM also offered insurance and reinsurance in the global structured finance market, including asset-backed securities issued by special purpose entities. AGM formerly was named Financial Security Assurance Inc. Assured Guaranty acquired AGM, together with its holding company Financial Security Assurance Holdings Ltd. (renamed Assured Guaranty Municipal Holdings Inc., "AGMH")AGMH) and the subsidiaries owned by that holding company, on July 1, 2009.

Municipal Assurance Corp. MAC is located and domiciled in New York and was organized in 2008. Assured Guaranty acquired MAC on May 31, 2012. On July 16, 2013, Assured Guaranty completed a series of transactions that increased the capitalization of MAC and resulted in MAC assuming a portfolio of geographically diversified U.S. public finance exposure from AGM and AGC. MAC offers insurance and reinsurance on bonds issued by U.S. state or municipal governmental authorities, focusing on investment grade obligations in select sectors of the municipal market.

Assured Guaranty Corp. AGC is located in New York and domiciled in Maryland, was organized in 1985 and commenced operations in 1988. It provides insurance and reinsurance on debt obligations in the global structured finance market and also offers guarantees on obligations in the U.S. public finance and international infrastructure markets.

On July 1, 2016, AGC acquired all of the issued and outstanding capital stock of CIFG Holding Inc. (together with its subsidiaries, CIFGH) (the CIFG Acquisition). AGC merged CIFG Assurance North America, Inc. (CIFGNA), a financial guaranty insurer subsidiary of CIFGH, with and into AGC, with AGC as the surviving company, on July 5, 2016. The CIFG Acquisition added $4.2 billion of net par insured on July 1, 2016.

On April 1, 2015 (“(Radian Acquisition Date”)Date), AGC completed the acquisition (“Radian Asset Acquisition”) of all of the issued and outstanding capital stock of financial guaranty insurer Radian Asset Assurance Inc. (“Radian Asset”) for $804.5 million; the cash consideration was paid from AGC's available funds and from the proceeds of a $200 million loan from AGC’s direct parent, Assured Guaranty US Holdings Inc. ("AGUS")(Radian Asset) (Radian Asset Acquisition). AGC repaid the loan in full to AGUS on April 14, 2015. Radian Asset was merged with and into AGC, with AGC as the surviving company of the merger. The Radian Asset Acquisition added $13.6 billion to the Company's net par outstanding on April 1, 2015, and is consistent with one of the Company's key business strategies of supplementing its book of business through acquisitions.2015.

On January 10, 2017, AGC completed its acquisition of MBIA UK Insurance Limited (MBIA UK) (MBIA UK Acquisition), the European operating subsidiary of MBIA Insurance Corporation (MBIA). As of December 31, 2016, MBIA UK had an insured portfolio of approximately $12 billion of net par. MBIA UK has changed its name to Assured Guaranty (London) Ltd. (AGLN). Assured Guaranty currently maintains AGLN as a stand-alone

entity. Assured Guaranty is actively working to combine AGLN with its other affiliated European insurance companies. Any such combination will be subject to regulatory and court approvals; as a result, Assured Guaranty cannot predict when, or if, such a combination will be completed.

Assured Guaranty (Europe) Ltd. AGE is a U.K. incorporated company licensed as a U.K. insurance company and authorized to operate in various countries throughout the European Economic Area ("EEA")(EEA). It was organized in 1990 and issued its first financial guarantee in 1994. AGE offers financial guarantees in both the international public finance and structured finance markets and is the primary entity from which the Company writes business in the EEA. As discussed further under "Business" below, AGE has agreed with its regulator that new business it writes would be guaranteed using a co-insurance structure pursuant to which AGE would co-insure municipal and infrastructure transactions with AGM, and structured finance transactions with AGC. AGE must obtain the approval of the Prudential Regulation Authority ("PRA")(PRA) before it can guarantee any new structured finance transaction.


6


Assured Guaranty Re Ltd. and Assured Guaranty Re Overseas Ltd. AG Re is incorporated under the laws of Bermuda and is licensed as a Class 3B insurer under the Insurance Act 1978 and related regulations of Bermuda. AG Re owns, indirectly, Assured Guaranty Re Overseas Ltd. ("AGRO"),AGRO, which is a Bermuda Class 3A and Class C insurer. AG Re and AGRO underwrite financial guaranty reinsurance. Theyreinsurance, and AGRO also underwrites other reinsurance that is in line with the Company's risk profile and benefits from its underwriting experience. AG Re and AGRO write business as reinsurers of third-party primary insurers and of certain affiliated companies.

Assured Guaranty is the market leader in the financial guaranty industry. The Company's position in the market has benefited from its acquisition of AGMH in 2009 as well as subsequent acquisitions of financial guarantors, its ability to maintain strong financial strength ratings, its strong claims-paying resources, its proven willingness to make claim payments to policyholders after obligors have defaulted, and its ability to achieve recoveries in respect of the claims that it has paid on insured residential mortgage-backed and other securities and to resolve troubled municipal credits to which it had exposure.

The Company faces challengescompetition in maintaining itsthe U.S. public finance financial guaranty market. The Company estimates, based on third party industry compilations, that of the insured U.S. public finance bonds issued in the primary market penetration.in 2016, the Company insured approximately 56% of the par, while Build America Mutual Assurance Company (BAM), insured 40% of the par. National Public Finance Guarantee Corporation (National), an affiliate of MBIA, insured the remaining 4% of the balance. The challengescontinued presence in 2015 were primarily due to:the market of BAM affects the Company's insured volume as well as the amount of premium the Company is able to charge.

SustainedThe sustained low interest rate environment in the U.S. also presents the Company with challenges. Over the last several years, interest rates generally have been lower than historical norms. In 2015, average daily 30-yearAverage municipal interest rates as reflected bywere extremely low during 2016, with the benchmark AAA 30-year Municipal Market Data index published by Thomson Reuters ("MMD Index")(MMD Index), were approximately 35 basis points lower than their levelsat times below 2%, a threshold not previously crossed in 2014, a year in which rates were already low by historical standards.the modern era.  As a result, the difference in yield (or the credit spread) between a bond insured by Assured Guaranty and an uninsured bond has provided comparatively little room for issuer savings and insurance premium, and Assured Guaranty has seen a lower demand for its financial guaranty insurance from issuers over the past several years than it saw historically.

Increased competition. The Company estimates, based on third party industry compilations, that of the insured U.S. public finance bonds issued in the primary market in 2015, the Company insured approximately 60% of the par, while Build America Mutual Assurance Company ("BAM"), insured 38% of the par. National Public Finance Guarantee Corporation ("National"), an affiliate of MBIA Insurance Corporation ("MBIA"), insured the remaining 2% of the balance. The continued presence in the market of BAM affects the Company's insured volume as well as the amount of premium the Company is able to charge.

In addition, the Company's business continues to be affected by negative perceptions of the value of the financial guaranty insurance sold by other companies that had been active in the industry. The losses suffered by such other insurers resulted in those companies being downgraded to below-investment-grade ("BIG")(BIG) levels by the rating agencies and/or subject to intervention by their state insurance regulators. In a number of cases, the state insurance regulators prevented the distressed financial guaranty insurers from paying claims or paying such claims in full; in addition,also, such financial guaranty insurers were perceived by market participants not to be actively conducting surveillance on transactions or fully exercising rights and remedies to mitigate losses.

The Company believes that issuers and investors in securities will continue to purchase financial guaranty insurance, especially if interest rates rise and credit spreads widen. U.S. municipalities have budgetary requirements that are best met through financings in the fixed income capital markets. In particular, smaller municipal issuers frequently use financial guaranties in order to access the capital markets with new debt offerings at a lower all-in interest rate than on an unguaranteed basis. In addition, the Company expects long-term debt financings for infrastructure projects will grow throughout the world, as will the financing needs associated with privatization initiatives or refinancing of infrastructure projects in developed countries.


During 2016, the Company established an alternative investments group to focus on deploying a portion of the Company's excess capital to pursue acquisitions and develop new business opportunities that complement the Company's financial guaranty business, are in line with its risk profile and benefit from its core competencies. The alternative investments group has been investigating a number of such opportunities, including, among others, both controlling and non-controlling investments in investment managers. In February 2017, the Company agreed to purchase up to $100 million of limited partnership interests in a fund that invests in the equity of private equity managers. The Company also considers opportunities to acquire financial guaranty portfolios, whether by acquiring financial guarantors who are no longer actively writing new business or their insured portfolios, or by commuting business that it had previously ceded. The Company continues to investigate additional opportunities.
Financial Guaranty Portfolio

The Company primarily conducts its business through subsidiaries located in the U.S., Europe and Bermuda. The Company generally insures obligations issued in the U.S., although it has also guaranteed securities issued in Europe, Australia and other international markets.

Financial guaranty insurance generally provides an unconditional and irrevocable guaranty that protects the holder of a debt instrument or other monetary obligation against non-payment of scheduled principal and interest payments when due. Upon an obligor's default on scheduled principal or interest payments due on the debt obligation, whether due to its insolvency or otherwise, the Company is generally required under the financial guaranty contract to pay the investor the principal or interest shortfall then due.

Financial guaranty insurance may be issued to all of the investors of the guaranteed series or tranche of a municipal bond or structured finance security at the time of issuance of those obligations or it may be issued in the secondary market to only specific individual holders of such obligations who purchase the Company's credit protection.

7


Both issuers of and investors in financial instruments may benefit from financial guaranty insurance. Issuers benefit when they purchase financial guaranty insurance for their new issue debt transaction because the insurance may have the effect of lowering an issuer's interest cost over the life of the debt transaction to the extent that the insurance premium charged by the Company is less than the net present value of the difference between the yield on the obligation insured by Assured Guaranty (which carries the credit rating of the specific subsidiary that guarantees the debt obligation) and the yield on the debt obligation if sold on the basis of its uninsured credit rating. The principal benefit to investors is that the Company's guaranty provides certainty that scheduled payments will be received when due. The guaranty may also improve the marketability of obligations issued by infrequent or unknown issuers, as well as obligations with complex structures or backed by asset classes new to the market. This benefit to market liquidity, which we call a "liquidityliquidity benefit," results from the increase in secondary market trading values for Assured Guaranty-insured obligations as compared with uninsured obligations by the same issuer. In general, the liquidity benefit of financial guaranties is that investors are able to sell insured bonds more quickly and, depending on the financial strength rating of the insurer, at a higher secondary market price than for uninsured debt obligations.

As an alternative to traditional financial guaranty insurance, in the past the Company also provided credit protection relating to a particular security or obligor through a credit derivative contract, such as a credit default swap ("CDS")(CDS). Under the terms of a CDS, the seller of credit protection agreed to make a specified payment to the buyer of credit protection if one or more specified credit events occurs with respect to a reference obligation or entity. In general, the credit events specified in the Company's CDS are for interest and principal defaults on the reference obligation. One difference between CDS and traditional primary financial guaranty insurance is that credit default protection was typically provided to a particular buyer of credit protection, who is not always required to own the reference obligation, rather than to all investors in the reference obligation. As a result, the Company's rights and remedies under a CDS may be different and more limited than on a financial guaranty of an entire issuance. Credit derivatives were preferred by some investors, however, because they generally offered the investor ease of execution and standardized terms as well as more favorable accounting or capital treatment. Due to changes in the regulatory environment, the Company has not provided credit protection in the U.S. through a CDS since March 2009, other than in connection with loss mitigation and other remediation efforts relating to its existing book of business. See the Risk Factor captioned "Changes in or inability to comply with applicable law could adversely affect the Company's ability to do business" under Risks Related to GAAP and Applicable Law in "Item 1A. Risk Factors" for additional detail about the regulatory environment.

The Company also offers credit protection through reinsurance, and in the past has provided reinsurance to other financial guaranty insurers with respect to their guaranty of public finance, infrastructure and structured finance obligations. The Company believes that the opportunities currently available to it in the reinsurance market consist primarily of potentially assuming portfolios of transactions from inactive primary insurers and recapturing portfolios that it has previously ceded to third party reinsurers.

The Company's financial guaranty direct and assumed businesses provide credit protection on public finance, infrastructure and structured finance obligations. For information on the geographic breakdown of the Company's financial guaranty portfolio and on its income and revenue by jurisdiction, see "GeographicPart II, Item 8, Financial Statements and Supplementary

Data, Note 4, Outstanding Exposure, Geographic Distribution of Net Par Outstanding" in Note 4, Outstanding Exposure, and "Provision for Income Taxes" in Note 12, Income Taxes, of the Financial Statements and Supplementary Data.Provision for Income Taxes.

U.S. Public Finance Obligations   The Company insures and reinsures a number of different types of U.S. public finance obligations, including the following:

General Obligation Bonds are full faith and credit bonds that are issued by states, their political subdivisions and other municipal issuers, and are supported by the general obligation of the issuer to pay from available funds and by a pledge of the issuer to levy ad valorem taxes in an amount sufficient to provide for the full payment of the bonds.
     
Tax-Backed Bonds are obligations that are supported by the issuer from specific and discrete sources of taxation. They include tax-backed revenue bonds, general fund obligations and lease revenue bonds. Tax-backed obligations may be secured by a lien on specific pledged tax revenues, such as a gasoline or excise tax, or incrementally from growth in property tax revenue associated with growth in property values. These obligations also include obligations secured by special assessments levied against property owners and often benefit from issuer covenants to enforce collections of such assessments and to foreclose on delinquent properties. Lease revenue bonds typically are general fund obligations of a municipality or other governmental authority that are subject to annual appropriation or abatement; projects financed and subject to such lease payments ordinarily include real estate or equipment serving an essential public purpose. Bonds in this category also include moral obligations of municipalities or governmental authorities.

8


Municipal Utility Bonds are obligations of all forms of municipal utilities, including electric, water and sewer utilities and resource recovery revenue bonds. These utilities may be organized in various forms, including municipal enterprise systems, authorities or joint action agencies.

Transportation Bonds include a wide variety of revenue-supported bonds, such as bonds for airports, ports, tunnels, municipal parking facilities, toll roads and toll bridges.

Healthcare Bonds are obligations of healthcare facilities, including community based hospitals and systems, as well as of health maintenance organizations and long-term care facilities.

Higher Education Bonds are obligations secured by revenue collected by either public or private secondary schools, colleges and universities. Such revenue can encompass all of an institution's revenue, including tuition and fees, or in other cases, can be specifically restricted to certain auxiliary sources of revenue.

Housing Revenue Bonds are obligations relating to both single and multi-family housing, issued by states and localities, supported by cash flow and, in some cases, insurance from entities such as the Federal Housing Administration.

Infrastructure Bonds include obligations issued by a variety of entities engaged in the financing of infrastructure projects, such as roads, airports, ports, social infrastructure and other physical assets delivering essential services supported by long-term concession arrangements with a public sector entity.

Housing Revenue Bonds are obligations relating to both single and multi-family housing, issued by states and localities, supported by cash flow and, in some cases, insurance from entities such as the Federal Housing Administration.

Investor-Owned Utility Bonds are obligations primarily backed by investor-owned utilities, first mortgage bond obligations of for-profit electric or water utilities providing retail, industrial and commercial service, and also include sale-leaseback obligation bonds supported by such entities.

Other Public Finance Bonds include other debt issued, guaranteed or otherwise supported by U.S. national or local governmental authorities, as well as student loans, revenue bonds, and obligations of some not-for-profit organizations.

A portion of the Company's exposure to tax-backed bonds, municipal utility bonds and transportation bonds constitutes "special revenue" bonds under the U.S. Bankruptcy Code. Even if an obligor under a special revenue bond were to seek protection from creditors under Chapter 9 of the U.S. Bankruptcy Code, holders of the special revenue bond should continue to receive timely payments of principal and interest during the bankruptcy proceeding, subject to the special revenues being sufficient to pay debt service and the lien on the special revenues being subordinate to the necessary operating expenses of the project or system from which the revenues are derived. While "special revenues" acquired by the obligor after bankruptcy remain subject to the pre-petition pledge, special revenue bonds may be adjusted if their claim is determined to be "undersecured."

Non-U.S. Public Finance Obligations    The Company insures and reinsures a number of different types of non-U.S. public finance obligations, which consist of both infrastructure projects and other projects essential for municipal function such as regulated utilities. Credit support for the exposures written by the Company may come from a variety of sources, including some combination of subordinated tranches, over-collateralization or cash reserves. Additional support also may be provided by transaction provisions intended to benefit noteholders or credit enhancers. The types of non-U.S. public finance securities the Company insures and reinsures include the following:

Infrastructure Finance Obligations are obligations issued by a variety of entities engaged in the financing of international infrastructure projects, such as roads, airports, ports, social infrastructure, and other physical assets delivering essential services supported either by long-term concession arrangements with a public sector entity or a regulatory regime. The majority of the Company's international infrastructure business is conducted in the U.K.

Regulated Utilities Obligations are issued by government-regulated providers of essential services and commodities, including electric, water and gas utilities. The majority of the Company's international regulated utility business is conducted in the U.K.

Pooled Infrastructure Obligations are synthetic asset-backed obligations that take the form of CDS obligations or credit-linked notes that reference either infrastructure finance obligations or a pool of such obligations, with a defined deductible to cover credit risks associated with the referenced obligations.

9


Other Public Finance Obligations include obligations of local, municipal, regional or national governmental authorities or agencies.

U.S. and Non-U.S. Structured Finance Obligations    The Company insures and reinsures a number of different types of U.S. and non-U.S. structured finance obligations. Credit support for the exposures written by the Company may come from a variety of sources, including some combination of subordinated tranches, excess spread, over-collateralization or cash reserves. Additional support also may be provided by transaction provisions intended to benefit noteholders or credit enhancers. The types of U.S. and Non-U.S. Structured Finance obligations the Company insures and reinsures include the following:

Pooled Corporate Obligations are securities primarily backed by various types of corporate debt obligations, such as secured or unsecured bonds, bank loans or loan participations and trust preferred securities ("TruPS")(TruPS). These securities are often issued in "tranches," with subordinated tranches providing credit support to the more senior tranches. The Company's financial guaranty exposures generally are to the more senior tranches of these issues.

Residential Mortgage-Backed Securities ("RMBS")(RMBS) are obligations backed by closed-end and open-end first and second lien mortgage loans on one-to-four family residential properties, including condominiums and cooperative apartments. First lien mortgage loan products in these transactions include fixed rate, adjustable rate and option adjustable-rate mortgages. The credit quality of borrowers covers a broad range, including "prime", "subprime" and "Alt-A". A prime borrower is generally defined as one with strong risk characteristics as measured by factors such as payment history, credit score, and debt-to-income ratio. A subprime borrower is a borrower with higher risk characteristics, usually as determined by credit score and/or credit history. An Alt-A borrower is generally defined as a prime quality borrower that lacks certain ancillary characteristics, such as fully documented income. The Company has not insured a RMBS transaction since January 2008.

Insurance Securitization Obligations are obligations secured by the future earnings from pools of various types of insurance/reinsurance policies and income produced by invested assets.

Consumer Receivables Securities are obligations backed by non-mortgage consumer receivables, such as student loans, automobile loans and leases, manufactured home loans and other consumer receivables.

"Financial Products Business" is how the Company refers to the guaranteed investment contracts ("GICs")(GICs) portion of a line of business previously conducted by AGMH that the Company did not acquire when it purchased AGMH in 2009 from Dexia SA and that is being run off. That line of business was comprised of AGMH's guaranteed investment contracts business, its medium term notes business and the equity payment agreements associated with AGMH's leveraged lease business. Assured Guaranty is indemnified by Dexia SA and certain of its affiliates ("Dexia")(Dexia) against loss from the former Financial Products Business.

Consumer Receivables Securities are obligations backed by non-mortgage consumer receivables, such as student loans, automobile loans and leases, manufactured home loans and other consumer receivables.

Commercial Mortgage-Backed Securities ("CMBS") are obligations backed by pools of commercial mortgages on office, multi-family, retail, hotel, industrial and other specialized or mixed-use properties.

Commercial Receivables Securities are obligations backed by equipment loans or leases, aircraft and aircraft engine financings, business loans and trade receivables. Credit support is derived from the cash flows generated by the underlying obligations, as well as property or equipment values as applicable.

Insurance Securitization ObligationsCommercial Mortgage-Backed Securities (CMBS) are obligations securedbacked by the future earnings from pools of various types of insurance/reinsurance policiescommercial mortgages on office, multi-family, retail, hotel, industrial and income produced by invested assets.other specialized or mixed-use properties.

Other Structured Finance Obligations are obligations backed by assets not generally described in any of the other described categories. One such type of asset is a tax benefit to be realized by an investor in one of the Federal or state programs that permit such investor to receive a credit against taxes (such as Federal corporate income tax or state insurance premium tax) for making qualified investments in specified enterprises, typically located in designated low-income areas.


10


Credit Policy and Underwriting Procedure

Credit Policy

The Company establishes exposure limits and underwriting criteria for obligors, sectors and countries, and in the case of structured finance and infrastructure exposures, for individual transactions. Risk exposure limits for single obligors are based on the Company's assessment of potential frequency and severity of loss as well as other factors, such as historical and stressed collateral performance. Sector limits are based on the Company’s view of stress losses for the sector and on its assessment of intra-sector correlation. Country limits are based on the size and stability of the relevant economy, and the Company’s view of the political environment and legal system. All of the foregoing limits are established in relation to the Company's capital base.

For U.S. public finance transactions, the Company focuses principally on the credit quality of the obligor based on population size and trends, wealth factors, and strength of the economy. The Company evaluates the obligor’s liquidity position; its fiscal management policies and track record; its ability to raise revenues and control expenses; and its exposure to derivative contracts and to debt subject to acceleration. The Company assesses the obligor’s pension and other post-employment benefits obligations and funding policies and evaluates the obligor’s ability to adequately fund such obligations in the future. The Company analyzes other critical risk factors including the type of issue; the repayment source; pledged security, if any; the presence of restrictive covenants and the tenor of the risk. The Company also considers the ability of obligors to file for bankruptcy or receivership under applicable statutes (and on related statutes that provide for state oversight or fiscal control over financially troubled obligors). In addition, the Company weighs the risk of a rating agency downgrade of an obligation's underlying uninsured rating.

For certain transactions, underwriting considerations may also include: the importance of the proposed project to the community; the financial management of a specific project; the potential refinancing risk; and legal or administrative risks.
In cases of not-for-profit institutions, such as healthcare issuers and private higher education issuers, the Company emphasizes the financial stability of the institution, its competitive position and its management experience.
For U.S. infrastructure transactions, the Company's due diligence is generally the same as it is for international infrastructure transactions, as described below.

U.S. structured finance obligations generally present three distinct forms of risk: asset risk, pertaining to the amount and quality of assets underlying an issue; structural risk, pertaining to the extent to which an issue's legal structure provides protection from loss; and execution risk, which is the risk that poor performance by a servicer or collateral manager contributes to a decline in the cash flow available to the transaction. Each of these risks is addressed through the Company's underwriting process.

Generally, the amount and quality of asset coverage required with respect to a structured finance exposure is dependent upon both the historic performance of the asset class, as well as the Company’s view of the future performance of the subject assets. Future performance expectations are developed from historical loss experience, taking into account economic, social and political factors affecting that asset class as well as, to the extent feasible, the subject assets themselves. Conclusions are then drawn about the amount of over-collateralization or other credit enhancement necessary in a particular transaction in order to protect investors (and therefore the insurer or reinsurer) against poor asset performance. In addition, structured securities usually are designed to protect investors (and therefore the insurer or reinsurer) from the bankruptcy or

insolvency of the entity that originated the underlying assets, as well as the bankruptcy or insolvency of the servicer or manager of those assets.

The Company conducts extensive due diligence on the collateral that supports its insured transactions. The principal focus of the due diligence is to confirm the underlying collateral was originated in accordance with the stated underwriting criteria of the asset originator. To this end, such collateral is reviewed, either internally by the Company or by outside consultants that the Company engages. The Company also conducts audits of servicing or other management procedures, reviewing critical aspects of these procedures such as including cash management and collections. The Company may, for certain transactions, obtain background checks on key managers of the originator, servicer or manager of the obligations underlying that transaction.
In general, non-U.S. transactions are comprised of structured finance transactions, transactions with regulated utilities, or infrastructure transactions. For these transactions, the Company undertakes an analysis of the country or countries in which the risk resides, which includes political risk as well as economic and demographic characteristics. For each transaction, the

11


Company also performs an assessment of the legal framework governing the transaction and the laws affecting the underlying assets supporting the obligations to be insured.

The underwriting of structured finance and regulated utilities is generally the same as for U.S. transactions, but for considerations related to the specific country as described in the previous paragraph. For infrastructure transactions, the Company reviews the type of project (e.g., hospital, road, social housing, transportation or student accommodation) and the source of repayment of the debt. For certain transactions, debt service and operational expenses are covered by availability payments made by either a governmental entity or a not-for-profit entity. The availability payments are due if the project is available for use, regardless of whether the project actually is in use. The principal risks for such transactions are construction risk and operational risk. The project must be completed on time and must be available for use during the life of the concession. For other transactions, notably transactions secured by toll-roads, revenues derived from the project must be sufficient to make debt service payments as well as cover operating expenses during the concession period. The Company undertakes due diligence to assess demand risks in such projects and often uses consultants to help assess future demand and revenue and expense projections.

The Company’s due diligence for infrastructure projects also includes: a financial review of the entity seeking the development of the project (usually a governmental entity or university); a financial and operational review of the developer, the construction companies, and the project operator; and a financial review of the various providers of operational financial protection for the bondholders (and therefore the insurer), including construction surety providers, letter-of-credit providers, liquidity banks or account banks. The Company uses outside consultants to review the construction program and to assess whether the project can be completed on time and on budget. The Company projects the cost of replacing the construction company, including delays in construction, in the event that a construction company is unable to complete the construction for any reason. Construction security packages are sized appropriately to cover these risks and the Company requires such coverage from credit-worthy institutions.

Underwriting Procedure

Each transaction underwritten by the Company involves persons with different expertise across various departments within the Company. The Company's transaction underwriting teams include both underwriting and legal personnel, who analyze the structure of a potential transaction and the credit and legal issues pertinent to the particular line of business or asset class, and accounting and finance personnel, who review the more complex transactions for compliance with applicable accounting standards and investment guidelines.

In the public finance portion of the Company's financial guaranty direct business, underwriters generally analyze the issuer's historical financial statements and, where warranted, develop stress case projections to test the issuers' ability to make timely debt service payments under stressful economic conditions. In the structured and infrastructure finance portions of the Company's financial guaranty direct business, underwriters generally use computer-based financial models in order to evaluate the ability of the transaction to generate adequate cash flow to service the debt under a variety of scenarios. The models include economically stressed scenarios that the underwriters use for their assessment of the potential credit risk inherent in a particular transaction. Stress models developed internally by the Company's underwriters reflect both empirical research and information gathered from third parties, such as rating agencies or investment banks. The Company may also engage advisors such as consultants and external counsel to assist in analyzing a transaction's financial or legal risks. The Company may also conduct a due diligence review that includes, among other things, a site visit to the project or facility, meetings with issuer management, review of underwriting and operational procedures, file reviews, and review of financial procedures and computer systems.


Upon completion of the underwriting analysis, the underwriter prepares a formal credit report that is submitted to a credit committee for review. An oral presentation is usually made to the committee, followed by questions from committee members and discussion among the committee members and the underwriters. In some cases, additional information may be presented at the meeting or required to be submitted prior to approval. Each credit committee decision is documented and any further requirements, such as specific terms or evidence of due diligence, are noted. The Company's credit committees are composed of senior officers of the Company. The committees are organized by asset class, such as for public finance or structured finance, or along regulatory lines, to assess the various potential exposures.


12


Risk Management Procedures

Organizational Structure

The Company's policies and procedures relating to risk assessment and risk management are overseen by its Board of Directors.Directors (the Board). The Board takes an enterprise-wide approach to risk management that is designed to support the Company's business plans at a reasonable level of risk. A fundamental part of risk assessment and risk management is not only understanding the risks a company faces and what steps management is taking to manage those risks, but also understanding what level of risk is appropriate for the Company. The Board of Directors annually approves the Company's business plan, factoring risk management into account. It also approves the Company's risk appetite statement, which articulates the Company's tolerance for risk and describes the general types of risk that the Company accepts or attempts to avoid. The involvement of the Board in setting the Company's business strategy is a key part of its assessment of management's risk tolerance and also a determination of what constitutes an appropriate level of risk for the Company.

While the Board of Directors has the ultimate oversight responsibility for the risk management process, various committees of the Board also have responsibility for risk assessment and risk management. The Risk Oversight Committee of the Board of Directors oversees the standards, controls, limits, underwriting guidelines and policies that the Company establishes and implements in respect of credit underwriting and risk management. It focuses on management's assessment and management of both (i) credit risks and (ii) other risks, including, but not limited to, financial, legal and operational risks, and risks relating to the Company's reputation and ethical standards. In addition, the Audit Committee of the Board of Directors is responsible for, among other matters, reviewing policies and processes related to the evaluation of risk assessment and risk management, including the Company's major financial risk exposures and the steps management has taken to monitor and control such exposures. It also reviews compliance with legal and regulatory requirements. The Compensation Committee of the Board of Directors reviews compensation-related risks to the Company. The Finance Committee of the Board of Directors oversees the investment of the Company's investment portfolio and the Company's capital structure, liquidity, financing arrangements, rating agency matters, and any corporate development activities in support of the Company's financial plan. The Nominating and Governance Committee of the Board of Directors oversees risk at the Company by developing appropriate corporate governance guidelines and identifying qualified individuals to become board members.

The Company has established a number of management committees to develop underwriting and risk management guidelines, policies and procedures for the Company's insurance and reinsurance subsidiaries that are tailored to their respective businesses, providing multiple levels of credit review and analysis.

Portfolio Risk Management Committee—This committee establishes company-wide credit policy for the Company's direct and assumed business. It implements specific underwriting procedures and limits for the Company and allocates underwriting capacity among the Company's subsidiaries. The Portfolio Risk Management Committee focuses on measuring and managing credit, market and liquidity risk for the overall company. All transactions in new asset classes or new jurisdictions must be approved by this committee.

U.S. Management Committee—This committee establishes strategic policy and reviews the implementation of strategic initiatives and general business progress in the U.S. The U.S. Management Committee approves risk policy at the U.S. operating company level.

Risk Management Committees—The U.S., U.K. and AG Re risk management committees conduct an in-depth review of the insured portfolios of the relevant subsidiaries, focusing on varying portions of the portfolio at each meeting. They assign internal ratings of the insured transactions and review sector reports, monthly product line surveillance reports and compliance reports.

Workout Committee—This committee receives reports from Surveillancesurveillance and Workoutworkout personnel on transactions that might benefit from active loss mitigation or risk reduction, and approves loss mitigation or risk reduction strategies for such transactions.

Reserve Committees—Oversight of reserving risk is vested in the U.S. Reserve Committee, the AG Re Reserve Committee and the U.K. Reserve Committee. The committees review the reserve methodology and assumptions for each major asset class or significant BIG transaction, as well as the loss projection scenarios used and the probability weights assigned to those scenarios. The reserve committees establish reserves for the relevant subsidiaries, taking into consideration supporting information provided by Surveillancesurveillance personnel.


13


The Company's surveillance personnel are responsible for monitoring and reporting on all transactions in the insured portfolio, including exposures in both the financial guaranty direct and assumed businesses. The primary objective of the surveillance process is to monitor trends and changes in transaction credit quality, detect any deterioration in credit quality, and recommend remedial actions to management. All transactions in the insured portfolio are assigned internal credit ratings, and surveillance personnel recommend adjustments to those ratings to reflect changes in transaction credit quality.

The Company's workout personnel are responsible for managing workout, loss mitigation and risk reduction situations. They work together with the Company's surveillance personnel to develop and implement strategies on transactions that are experiencing loss or could possibly experience loss. They develop strategies designed to enhance the ability of the Company to enforce its contractual rights and remedies and mitigate potential losses. The Company's workout personnel also engage in negotiation discussions with transaction participants and, when necessary, manage (along with legal personnel) the Company's litigation proceedings. They may also make open market or negotiated purchases of securities that the Company has insured, or negotiate or otherwise implement consensual terminations of insurance coverage prior to contractual maturity. The Company's workout personnel work with servicers of residential mortgage-backed securitiesRMBS transactions to enhance their performance.

Direct Business

The Company monitors the performance of each risk in its portfolio and tracks aggregation of risk. The review cycle and scope vary based upon transaction type and credit quality. In general, the review process includes the collection and analysis of information from various sources, including trustee and servicer reports, financial statements, general industry or sector news and analyses, and rating agency reports. For public finance risks, the surveillance process includes monitoring general economic trends, developments with respect to state and municipal finances, and the financial situation of the issuers. For structured finance transactions, the surveillance process can include monitoring transaction performance data and cash flows, compliance with transaction terms and conditions, and evaluation of servicer or collateral manager performance and financial condition. Additionally, the Company uses various quantitative tools and models to assess transaction performance and identify situations where there may have been a change in credit quality. For all transactions, surveillance activities may include discussions with or site visits to issuers, servicers or other parties to a transaction.

Assumed Business

For transactions that the Company has assumed, the ceding insurers are responsible for conducting ongoing surveillance of the exposures that have been ceded to the Company. The Company's surveillance personnel monitor the ceding insurer's surveillance activities on exposures ceded to the Company through a variety of means, including reviews of surveillance reports provided by the ceding insurers, and meetings and discussions with their analysts. The Company's surveillance personnel also monitor general news and information, industry trends and rating agency reports to help focus surveillance activities on sectors or credits of particular concern. For certain exposures, the Company also will undertake an independent analysis and remodeling of the exposure. In the event of credit deterioration of a particular exposure, more frequent reviews of the ceding company's risk mitigation activities are conducted. The Company's surveillance personnel also take steps to ensure that the ceding insurer is managing the risk pursuant to the terms of the applicable reinsurance agreement. To this end, the Company conducts periodic reviews of ceding companies' surveillance activities and capabilities. That process may include the review of the insurer's underwriting, surveillance and claim files for certain transactions.

Ceded Business

As part of its risk management strategy prior to the financial crisis, the Company seeks to obtainobtained third party reinsurance or retrocessions and may also periodically enter into other arrangements to reduce its exposure to risk concentrations, such as for single risk limits, portfolio credit rating or exposure limits, geographic limits or other factors. At December 31, 2015, the Company had ceded approximately 4% of its principal amount outstanding to third party reinsurers.

The Company has obtained reinsurancefactors, to increase its underwriting capacity, both on an aggregate-risk and a single-risk basis, to meet internal, rating agency and regulatory risk limits, diversify risks, reduce the need for additional capital, and strengthen financial ratios. The Company receives capital credit for ceded reinsurance based on the reinsurer's ratings in the capital models used by the rating agencies to evaluate the Company's capital position for its financial strength ratings. In addition, a numberratings and in its own internal capital models. The amount of the Company's reinsurers are required to pledgecredit depends on the reinsurer's rating and any collateral to secure their reinsurance obligations toit may post. During and after the Company. In some cases, the pledged collateral augments the rating agency credit for the reinsurance provided. In recent years,financial crisis, most of the Company's reinsurers have beenwere downgraded by one or more rating agency,agencies, and consequently, the financial strength ratings of many of the reinsurers are below those of the Company's insurance subsidiaries. While ceding commissions or premium allocation adjustments may compensate in part for such downgrades, the effect of such downgrades, in general, iswas to

14


decrease the financial benefits of using reinsurance under rating agency capital adequacy models. However, toreinsurance. Over the extent a reinsurer still haspast several years the financial wherewithal to pay, the Company could still benefit from the reinsurance provided.

The Company's ceded reinsurance may be on a quota share, first-loss or excess-of-loss basis. Quota share reinsurance generally provides protection against a fixed percentage of losses incurred by the Company. First-loss reinsurance generally provides protection against losses incurred up to a specified limit. Excess-of-loss reinsurance generally provides protection against a fixed percentage of losses incurred to the extent that losses incurred exceed a specified limit. Reinsurance arrangements typically require the Company to retain a minimum portion of the risks reinsured. The Company has entered into commutation agreements reassuming portions of the previously ceded business from certain reinsurers.reinsurers; as of December 31, 2016, approximately 4%, or $11.2 billion, of its principal amount outstanding was still ceded to third party reinsurers, down from 12%, or $86.5 billion, as of December 31, 2009.

More recently the Company has obtained excess-of-loss reinsurance in part to augment its capital in the capital model used by S&P Global Ratings, a division of Standard & Poor's Financial Services LLC (S&P) to evaluate its financial strength ratings. Specifically, AGC, AGM and MAC entered into a $360 million aggregate excess of loss reinsurance facility with a number of reinsurers, effective as of January 1, 2016. This facility replaces a similar $450 million aggregate excessAt its inception effective as of loss reinsurance facility that AGC, AGM and MAC had entered into effective January 1, 2014 and which terminated on December 31, 2015. The new2016, the facility coverscovered losses occurring either from January 1, 2016 through December 31, 2023,2022, or from January 1, 2017 through December 31, 2024,2023, at the option of AGC, AGM and MAC. It terminates on January 1, 2018, unless AGC, AGM and MAC choose to extend it. Thedid not elect coverage under the new facility covers certain U.S. public finance credits insured or reinsured by AGC, AGM and MAC as of September 30, 2015, excluding credits that were rated non-investment grade as of December 31, 2015 by Moody’s Investors Service, Inc. ("Moody’s") or Standard & Poor's Ratings Services ("S&P") or internally by AGC, AGM or MAC and is subject to certain per credit limits. Among the credits excluded are those associated with the Commonwealth of Puerto Rico and its related authorities and public corporations. The new facility attaches when AGC’s, AGM’s and MAC’s net losses (net of AGC’s and AGM's reinsurance (including from affiliates) and net of recoveries) exceed $1.25 billion in the aggregate. The new facility covers a portion of the next $400 million of losses, with the reinsurers assuming pro rata in the aggregate $360 million of the $400 million of losses and AGC, AGM and MAC jointly retaining the remaining $40 million. The reinsurers are required to be rated at least AA- or to post collateral sufficient to provide AGM, AGC and MAC with the same reinsurance credit as reinsurers rated AA-. AGM, AGC and MAC are obligated to pay the reinsurers their share of recoveries relating to losses during the coverage period in the covered portfolio. AGC, AGM and MAC paid approximately $9 million of premiums in 2016 for the termseven year period commencing January 1, 2016, through December 31, 2016but they retain an option, which must be exercised prior to January 1, 2018, and deposited approximately $9 millionwhich requires the payment of securities into trust accountsadditional premium, to elect coverage for the benefit of the reinsurers to be used to pay the premium forseven year period commencing January 1, 2017 through December 31, 2017. See Part II, Item 8, Financial Statements and Supplementary Data, Note 13, Reinsurance and Other Monoline Exposures, for more information.

The main differences betweenCompany may in the future enter into new facilitythird party reinsurance or retrocessions or other arrangements to reduce its exposure to risk concentrations, such as for single risk limits, portfolio credit rating or exposure limits, geographic limits or other factors, to increase its underwriting capacity, both on an aggregate-risk and a single-risk basis, to meet internal, rating agency and regulatory risk limits, diversify risks, reduce the prior facility that terminated on December 31, 2015 areneed for additional capital, or strengthen financial ratios. The Company may also in the reinsurance attachment point ($1.25 billion versus $1.5 billion), the total reinsurance coverage ($360 million partfuture enter into new commutation agreements reassuming portions of $400 million versus $450 million part of $500 million) and the annual premium ($9 million versus $19 million).its remaining previously ceded business.

Importance of Financial Strength Ratings

Low financial strength ratings or uncertainty over the Company's ability to maintain its financial strength ratings would have a negative impact on issuers' and investors' perceptions of the value of the Company's insurance product. Therefore, the Company manages its business with the goal of achieving high financial strength ratings, preferably the highest that an agency will assign to a financial guarantor. However, the models used by rating agencies differ, presenting conflicting goals that may make it inefficient or impractical to reach the highest rating level. In addition, the models are not fully transparent, contain subjective factors and change frequently.may change.

Historically, insurance financial strength ratings reflect an insurer's ability to pay under its insurance policies and contracts in accordance with their terms. The rating is not specific to any particular policy or contract. Historically, insurance financial strength ratings doIt does not refer to an insurer's ability to meet non-insurance obligations and areis not a recommendation to purchase any policy or contract issued by an insurer or to buy, hold, or sell any security insured by an insurer. The insurance financial strength ratings assigned by the rating agencies are based upon factors that the rating agencies believe are relevant to policyholders and are not directed toward the protection of investors in AGL's common shares. Ratings reflect only the views of the respective rating agencies assigning them and are subject to continuous review and revision or withdrawal at any time.

Following the financial crisis, the rating process has been challenging for the Company due to a number of factors, including:

Instability of Rating Criteria and Methodologies. Rating agencies purport to issue ratings pursuant to published rating criteria and methodologies. In recent years, the rating agencies have made material changes to their rating criteria and methodologies applicable to financial guaranty insurers, sometimes through formal changes and other times through ad hoc adjustments to the conclusions reached by existing criteria. Furthermore, these criteria and methodology changes arewere typically implemented without any transition period, making it difficult for an insurer to comply quickly with new standards.


15


Instability of Severe Stress Case Loss Assumptions. A major component in arriving at a financial guaranty insurer's rating has been the rating agency’s assessment of the insurer’s capital adequacy, with each rating agency employing its own proprietary model. These capital adequacy approaches include “stress case” loss assumptions for various risks or risk categories. Since the financial crisis, the rating agencies have at various times materially increased stress case loss assumptions for various risks or risk categories, in some cases later reducing such stress case losses. This approach has made predicting the amount of capital required to maintain or attain a certain rating more difficult.

More Reliance on Qualitative Rating Criteria. In prior years, the financial strength ratings of the Company’s insurance company subsidiaries were largely consistent with the rating agency’s assessment of the insurers’ capital adequacy, such that a rating downgrade could generally be avoided by raising additional capital or otherwise

improving capital adequacy under the rating agency’s model. In recent years, however, both S&P and Moody’s have applied other factors, some of which are subjective, such as the insurer's business strategy and franchise value or the anticipated future demand for its product, to justify ratings for the Company’s insurance company subsidiaries significantly below the ratings implied by their own capital adequacy models. Currently, for example, S&P has concluded that AGM has “AAA” capital adequacy under the S&P model (but subject to a downward adjustment due to a “large obligor test”) and Moody’s has concluded that AGM has “Aa” capital adequacy under the Moody’s model (offset by other factors including the rating agency’s assessment of competitive profile, future profitability and market share).

Despite the difficult rating agency process following the financial crisis, the Company has been able to maintain strong financial strength ratings. However, if a substantial downgrade of the financial strength ratings of the Company's insurance subsidiaries were to occur in the future, such downgrade would adversely affect its business and prospects and, consequently, its results of operations and financial condition. The Company believes that if the financial strength ratings of AGM, AGC and/or MAC were downgraded from their current levels, such downgrade could result in downward pressure on the premium that such insurance subsidiary would be able to charge for its insurance. Currently, AGM, AGC and MAC all have AA (Stable Outlook) financial strength ratings from S&P. Each of AGM and MAC also has a AA+ (Stable Outlook) financial strength rating from Kroll Bond Rating Agency ("KBRA")(KBRA), while AGC has a AA (Stable Outlook) financial strength rating from KBRA. AGM and AGC have financial strength ratings in the single-A category from Moody's (A2 (Stable Outlook) and A3 (Negative(Stable Outlook), respectively)., although AGC announced on January 13, 2017 that it had requested that Moody's withdraw its financial strength rating of AGC. In addition, AGRO has been assigned a rating of A+ (Stable) from A.M. Best Company, Inc. ("Best")(Best), which is Best's second highest rating. The Company periodically assesses the value of each rating assigned to each of its companies, and may as a result of such assessment request that a rating agency add or drop a rating from certain of its companies. For example, the KBRA ratings were first assigned to MAC in 2013 and to AGM in 2014 and the Best rating was first assigned to AGRO in 2015, while a Moody's rating was never requested for MAC, and was dropped from AG Re and AGRO in 2015.2015, and, as noted above, is the subject of a rating withdrawal request in the case of AGC.

The Company believes that so long as AGM, AGC and/or MAC continue to have financial strength ratings in the double-A category from at least one of the legacy rating agencies (S&P or Moody’s), they are likely to be able to continue writing financial guaranty business with a credit quality similar to that historically written. However, if neither legacy rating agency maintained financial strength ratings of AGM, AGC and/or MAC in the double-A category, or if either legacy rating agency were to downgrade AGM, AGC and/or MAC below the single-A level, it could be difficult for the Company to originate the current volume of new business with comparable credit characteristics. See the"Item 1A. Risk Factors", Risk Factor captioned "Risks Related to the Company's Financial Strength and Financial Enhancement Ratings" in "Item 1A. Risk Factors" and "Item 7.Part II, Item 7, Management's Discussion and Analysis of Financial Condition, and Results of Operations"Operations, for more information about the Company's ratings.

Investments

Investment income from the Company's investment portfolio is one of the primary sources of cash flow supporting its operations and claim payments. The Company's total investment portfolio was $11.2$11.0 billion and $11.4$11.2 billion as of December 31, 20152016 and 2014,2015, respectively, and generated net investment income of $408 million, $423 million and $403 million in 2016, 2015 and $393 million in 2015, 2014, and 2013, respectively.

The Company's principal objectives in managing its investment portfolio are to support the highest possible ratings for each operating company; maintain sufficient liquidity to cover unexpected stress in the insurance portfolio; and maximize total after-tax net investment income. If the Company's calculations with respect to its policy liabilities are incorrect or other unanticipated payment obligations arise, or if the Company improperly structures its investments to meet these liabilities, it could have unexpected losses, including losses resulting from forced liquidation of investments before their maturity. The investment policies of the Company's insurance subsidiaries are subject to insurance law requirements, and may change depending upon regulatory, economic and market conditions and the existing or anticipated financial condition and operating requirements, including the tax position, of the businesses.


16


Approximately 85%83% of the Company's investment portfolio is externally managed by its investment managers: BlackRock Financial Management, Inc., Goldman Sachs Asset Management, L.P., General Re-New England Asset Management, Inc. and Wellington Management Company, LLP. The performance of the Company's invested assets is subject to the ability of the investment managers to select and manage appropriate investments. The Company's investment managers have discretionary authority over the Company's investment portfolio within the limits of the Company's investment guidelines approved by the Company's Board of Directors.Board. The Company's portfolio is allocated approximately equally among the four investment managers and each manager is compensated based upon a fixed percentage of the market value of the portion of the portfolio

being managed by such manager. During the years ended December 31, 2016, 2015 2014 and 2013,2014, the Company recorded investment management fee expenses of $9 million, $10 million, $9 million, and $8$9 million, respectively.

TheAs of December 31, 2016, the Company internally managed 15%17% of the investment portfolio, either in connection with its loss mitigation or risk management strategy, or because the Company believes a particular security or asset presents an attractive investment opportunity. During 2016, the Company established an alternative investments group to focus on deploying a portion of the Company's excess capital to pursue acquisitions and develop new business opportunities that complement the Company's financial guaranty business, are in line with its risk profile and benefit from its core competencies. The alternative investments group has been investigating a number of such opportunities, including both controlling and non-controlling investments in investment managers.

The largest component of the Company’s internally managed portfolio consists of obligations that the Company purchases in connection with its loss mitigation or risk management strategy for its insured exposure. Purchasing such obligations enables the Company to exercise rights available to holders of the obligations. The Company also holds other invested assets that were obtained or purchased as part of negotiated settlements with insured counterparties or under the terms of its financial guaranties. The Company held approximately $1,440$1,600 million and $881$1,440 million of securities based on their fair value, after elimination of the benefit of any insurance provided by the Company, that were obtained for loss mitigation or risk management purposes in its internally managed investment accounts as of December 31, 20152016 and December 31, 2014,2015, respectively.

Competition

Assured Guaranty is the market leader in the financial guaranty industry. Assured Guaranty believes its financial strength, protection against defaults, credit selection policies, underwriting standards, history of making claim payments and surveillance procedures make it an attractive provider of financial guaranties.
    
Assured Guaranty's principal competition is in the form of obligations that issuers decide to issue on an uninsured basis. In the U.S. public finance market, when interest rates are low, investors may prefer greater yield over insurance protection, and issuers may find the cost savings from insurance less compelling. Over the last several years, interest rates generally have been lower than historical norms. In 2015, average dailyAverage municipal interest rates were extremely low during 2016, with the benchmark AAA 30-year municipal interest rates as reflectedMunicipal Market Data index published by Thomson Reuters (MMD Index), at times below 2%, a threshold not previously crossed in the MMD Index were approximately 35 basis points lower that their levelsmodern era. As a result, the difference in 2014,yield (or the credit spread) between a year in which rates were already lowbond insured by historical standards.

Nevertheless, inAssured Guaranty and an uninsured bond has provided comparatively little room for issuer savings and insurance premium. In the U.S. public finance market in 2015, usage2016, market penetration of municipal bond insurance increaseddecreased to approximately 6.7%6.0% of the par amount of new issues sold, compared with approximately 5.9%6.7% in 2014.2015. The Company believes this decrease was due in large part to the increase in market penetration despite fallingextremely low interest rates indicates greater demand for bond insurance based on investors’ heightened awarenessprevailing during most of municipal issuers’ potential to come under financial stress (due to such high-profile cases as Detroit’s bankruptcy) and evidence that Assured Guaranty insured bonds held their market value better than comparable uninsured bonds in distressed situations.2016.

In the international infrastructure finance market, the uninsured execution serving as the Company’s principal competition occurs primarily in privately funded transactions where no bonds are sold in the public markets. In the structured finance market, the uninsured execution occurs in both public and primary transactions primarily where bonds are sold with sufficient credit or structural enhancement embedded in transactions, such as through overcollateralization, first loss insurance, excess spread or other terms, to make the bonds attractive to investors without bond insurance.     
    
Assured Guaranty is the only financial guaranty company active before the global financial crisis of 2008 that has maintained sufficient financial strength to write new business continuously since the crisis began. As a result of rating agency downgrades of the financial strength ratings of financial guaranty competitors active before the crisis, Assured Guaranty’sGuaranty has only significanttwo direct competitors for financial guaranty, competitor in 2015the most significant of which was BAM, a mutual insurance company that commenced business in 2012.

Based on industry statistics, the Company estimates that, of the new U.S. public finance bonds sold with insurance in 2015,2016, the Company insured approximately 60%56% of the par, while BAM insured approximately 38%40%. BAM is effective in competing with the Company for small to medium sized U.S. public finance transactions in certain sectors,sectors. BAM sometimes prices its guarantees for such transactions at levels the Company does not believe produces an adequate rate of return and itsso does not match, but BAM's pricing and underwriting strategies may have a negative impact on the amount of premium the Company is able to charge for its insurance for such transactions. However, the Company believes it has competitive advantages over BAM due to: AGM's and MAC's

17


larger capital base; AGM's ability to insure larger transactions and issuances in more diverse U.S. bond sectors; BAM's inability to date to generate profits and to increase its statutory capital meaningfully, its higher leverage ratios than those of AGM and MAC, and its increasing unpaid debt obligations; and AGM's and MAC's strong financial strength ratings from multiple rating agencies (in the case of AGM, AA+ from KBRA, AA from S&P and A2

from Moody's, and in the case of MAC, AA+ from KBRA and AA from S&P, compared with BAM's AA solely from S&P). Additionally, as a public company with access to both the equity and debt capital markets, Assured Guaranty may have greater flexibility to raise capital, if needed.
    
Another potentially significant competitor to the Company on U.S. public finance transactions is National, which the Company estimates insured approximately 2%4% of the par of public finance bonds sold with insurance in 2015.2016. In 2009, MBIA, one of the legacy insurers that is not writing new business, transferred its U.S. public finance exposures to its affiliate National. The transfer was challenged in litigation that was not settled until May 2013. Subsequently, S&P has raised National’s financial strength rating from BBB to AA-, noting that S&P no longer viewed MBIA’s rating as a limitation on National’s rating, and Moody’s has upgraded National's financial strength rating from Baa2 to A3.
    
In the global structured finance and infrastructure markets, Assured Guaranty is the only financial guaranty insurance company currently writing new guarantees. Management considers the Company’s greater diversification to be a competitive advantage in the long run because it means the Company is not wholly dependent on conditions in any one market.
    
In the future, additional new entrants into the financial guaranty industry could reduce the Company's new business prospects, including by furthering price competition or offering financial guaranty insurance on transactions with structural and security features that are more favorable to the issuers than those required by Assured Guaranty. However, the Company believes that the presence of multiple guarantors might also increase the overall visibility and acceptance of the product by a broadening group of investors, and the fact that investors are willing to commit fresh capital to the industry may promote market confidence in the product.
    
In addition to monoline insurance companies, Assured Guaranty competes with other forms of credit enhancement, such as letters of credit or credit derivatives provided by banks and other financial institutions, some of which are governmental enterprises, or direct guaranties of municipal, structured finance or other debt by federal or state governments or government sponsored or affiliated agencies. Alternative credit enhancement structures, and in particular federal government credit enhancement or other programs, can interfere with the Company's new business prospects, particularly if they provide direct governmental-level guaranties, restrict the use of third-party financial guaranties or reduce the amount of transactions that might qualify for financial guaranties.


18


Regulation

General

The business of insurance and reinsurance is regulated in most countries, although the degree and type of regulation varies significantly from one jurisdiction to another. Reinsurers are generally subject to less direct regulation than primary insurers. The Company is subject to regulation under applicable statutes in the U.S., the U.K. and Bermuda, as well as applicable statutes in Australia.

United States

AGL has three operating insurance subsidiaries domiciled in the U.S., which the Company refers to collectively as the "AssuredAssured Guaranty U.S. Subsidiaries."

AGM is a New York domiciled insurance company licensed to write financial guaranty insurance and reinsurance in 50 U.S. states, the District of Columbia, Guam, Puerto Rico and the U.S. Virgin Islands.

MAC is a New York domiciled insurance company licensed to write financial guaranty insurance and reinsurance in 50 U.S. states and the District of Columbia. MAC will only insure U.S. public finance debt obligations, focusing on investment grade bonds in select sectors of that market.

AGC is a Maryland domiciled insurance company licensed to write financial guaranty insurance and reinsurance in 50 U.S. states, the District of Columbia and Puerto Rico.
Insurance Holding Company Regulation

AGL and the Assured Guaranty U.S. Subsidiaries are subject to the insurance holding company laws of their jurisdiction of domicile, as well as other jurisdictions where these insurers are licensed to do insurance business. These laws

generally require each of the Assured Guaranty U.S. Subsidiaries to register with its respective domestic state insurance department and annually to furnish financial and other information about the operations of companies within their holding company system. Generally, all transactions among companies in the holding company system to which any of the Assured Guaranty U.S. Subsidiaries is a party (including sales, loans, reinsurance agreements and service agreements) must be fair and, if material or of a specified category, such as reinsurance or service agreements, require prior notice and approval or non-disapproval by the insurance department where the applicable subsidiary is domiciled.

Change of Control

Before a person can acquire control of a U.S. domestic insurance company, prior written approval must be obtained from the insurance commissioner of the state where the domestic insurer is domiciled. Generally, state statutes provide that control over a domestic insurer is presumed to exist if any person, directly or indirectly, owns, controls, holds with the power to vote, or holds proxies representing, 10% or more of the voting securities of the domestic insurer. Prior to granting approval of an application to acquire control of a domestic insurer, the state insurance commissioner will consider such factors as the financial strength of the applicant, the integrity and management of the applicant's board of directors and executive officers, the acquirer's plans for the management of the applicant's board of directors and executive officers, the acquirer's plans for the future operations of the domestic insurer and any anti-competitive results that may arise from the consummation of the acquisition of control. These laws may discourage potential acquisition proposals and may delay, deter or prevent a change of control involving AGL that some or all of AGL's stockholders might consider to be desirable, including in particular unsolicited transactions.


19


State Insurance Regulation

State insurance authorities have broad regulatory powers with respect to various aspects of the business of U.S. insurance companies, including licensing these companies to transact business, accreditation of reinsurers, admittance of assets to statutory surplus, regulating unfair trade and claims practices, establishing reserve requirements and solvency standards, regulating investments and dividends and, in certain instances, approving policy forms and related materials and approving premium rates. State insurance laws and regulations require the Assured Guaranty U.S. Subsidiaries to file financial statements with insurance departments everywhere they are licensed, authorized or accredited to conduct insurance business, and their operations are subject to examination by those departments at any time. The Assured Guaranty U.S. Subsidiaries prepare statutory financial statements in accordance with Statutory Accounting Practices, or SAP, and procedures prescribed or permitted by these departments. State insurance departments also conduct periodic examinations of the books and records, financial reporting, policy filings and market conduct of insurance companies domiciled in their states, generally once every three to five years. Market conduct examinations by regulators other than the domestic regulator are generally carried out in cooperation with the insurance departments of other states under guidelines promulgated by the National Association of Insurance Commissioners.

The New York State Department of Financial Services (the "NYDFS")NYDFS), the regulatory authority of the domiciliary jurisdiction of AGM and MAC, conducts a periodic examination of insurance companies domiciled in New York, usually at five-year intervals. In 2012, the NYDFS commenced examinations of AGM MAC, Assured Guaranty Municipal Insurance Company and AG MortgageMAC in order for its examinations of these companies to coincide with the Maryland Insurance Administration (the "MIA's")MIA's) examination of AGC. In 2013, the NYDFS completed its examinations and issued Reports on Examination of AGM for the four-year period ending December 31, 2011 and MAC for the period September 26, 2008 through June 30, 2012. The reports did not note any significant regulatory issues concerning those companies.

The MIA, the regulatory authority of the domiciliary jurisdiction of AGC, conducts a periodic examination of insurance companies domiciled in Maryland every five years. In 2013, the MIA issued an Examination Report with respect to AGC for the five year period ending December 31, 2011; no significant regulatory issues were noted in such report.

Assured Guaranty has been notified that the NYDFS and MIA will formally commence an examination, respectively, of AGM and MAC, and AGC, in 2017 for the period covering the end of the last applicable examination period for each company through December 31, 2016.
   
State Dividend Limitations

New York.    One of the primary sources of cash for repurchases of shares and the payment of debt service and dividends by the Company is the receipt of dividends from AGM. Under the New York Insurance Law, AGM and MAC may only pay dividends out of "earned surplus," which is the portion of the company's surplus that represents the net earnings, gains or profits (after deduction of all losses) that have not been distributed to shareholders as dividends, or transferred to stated capital

or capital surplus, or applied to other purposes permitted by law, but does not include unrealized appreciation of assets. AGM and MAC may each pay dividends without the prior approval of the New York Superintendent of Financial Services ("New(New York Superintendent")Superintendent) that, together with all dividends declared or distributed by it during the preceding 12 months, doesdo not exceed the lesser of 10% of its policyholders' surplus (as of its last annual or quarterly statement filed with the New York Superintendent) or 100% of its adjusted net investment income during that period. The maximum amount available during 20162017 for AGM to pay dividends to its parent AGMH without regulatory approval is estimated to be approximately $244$232 million, of which approximately $95$81 million is available for distribution in the first quarter of 2016.2017. AGM paid dividends of $247 million, $215 million and $160 million during 2016, 2015 and $163 million during 2015, 2014, and 2013, respectively, to AGMH. The maximum amount available during 2017 for MAC to distribute as dividends to its shareholders (AGM and AGC) without regulatory approval is estimated to be approximately $49 million; MAC currently intends to allocate the distribution of such amount quarterly in 2017. 

Maryland.    Another primary source of cash for the repurchases of shares and payment of debt service and dividends by the Company is the receipt of dividends from AGC. Under Maryland's insurance law, AGC may, with prior notice to the MIA, pay an ordinary dividend that, together with all dividends paid in the prior 12 months, does not exceed the lesser of 10% of its policyholders' surplus (as of the prior December 31) or 100% of its adjusted net investment income during that period. The maximum amount available during 20162017 for AGC to pay ordinary dividends to its parent AGUSAssured Guaranty U.S. Holdings Inc. (AGUS) will be approximately $79$107 million, of which approximately $9$29 million is available for distribution in the first quarter of 2016.2017. A dividend or distribution to a stockholder in excess of this limitation would constitute an "extraordinary dividend," which must be paid out of "earned surplus" and reported to, and approved by, the MIA prior to payment. "Earned surplus" is that portion of the company's surplus that represents the net earnings, gains or profits (after deduction of all losses) that have not been distributed to shareholders as dividends or transferred to stated capital or capital surplus, or applied to other purposes permitted by law, but does not include unrealized capital gains and appreciation of assets. Currently, AGC does not have any earned surplus and therefore the Company expects AGC only to pay ordinary dividends in 2016. AGC may not pay any dividend or make any distribution, including ordinary dividends, unless it notifies the MIA of the proposed payment within five business days following declaration and at least ten days before payment. The MIA may declare that such dividend not be paid if it finds that AGC's policyholders' surplus would be inadequate after payment of the dividend or the dividend could lead AGC to a hazardous financial condition. AGC paid dividends of $79 million, $90 million and $69 million during 2016, 2015 and $67 million during 2015, 2014, and 2013, respectively, to AGUS.

20


Contingency Reserves

New York.Under the New York Insurance Law, each of AGM and MAC must establish a contingency reserve to protect policyholders. As financial guaranty insurers, each is required to maintain a contingency reserve:

with respect to policies written prior to July 1, 1989, in an amount equal to 50%New York Insurance Law determines the calculation of earned premiums less permitted reductions; and

with respect to policies written on and after July 1, 1989, quarterly on a pro rata basis over a period of 20 years for municipal bonds and 15 years for all other obligations, in an amount equal to the greater of 50% of premiums written for the relevant category of insurance or a percentage of the principal guaranteed, varying from 0.55% to 2.50%, depending on the type of obligation guaranteed, until the contingency reserve amount forand the category equals the applicable percentage of net unpaid principal. The contingency reserve is then taken down over the same period of time thatover which it was established.must be established and, subsequently, can be taken down.

Maryland.    InLikewise, in accordance with Maryland insurance law and regulations, AGC also maintains a statutory contingency reserve for the protection of policyholders. The contingency reserve is maintained quarterly on a pro rata basis over a periodMaryland insurance law determines the calculation of 20 years for municipal bonds and 15 years for all other obligations, in an amount equal to the greater of 50% of premiums written for the relevant category of insurance or a percentage of the principal guaranteed, varying from 0.55% to 2.50%, depending on the type of obligation guaranteed, until the contingency reserve amount forand the category equals the applicable percentage of net unpaid principal. The contingency reserve is then taken down over the same period of time thatover which it was established.must be established, and subsequently, can be taken down.
 
In both New York and Maryland, when considering the principal amount guaranteed, the insurer is permitted to take into account amounts that it has ceded to reinsurers. In addition, releases from the insurer's contingency reserve may be permitted under specified circumstances in the event that actual loss experience exceeds certain thresholds or if the reserve accumulated is deemed excessive in relation to the insurer's outstanding insured obligations.

From time to time, AGM and AGC have obtained the approval of their regulators to release contingency reserves based on losses or because the accumulated reserve is deemed excessive in relation to the insurer's outstanding insured obligations. In 2015,2016, on the latter basis, AGM obtained the NYDFS's approval for a contingency reserve release of approximately $253$175 million and AGC obtained the MIA's approval for a contingency reserve release of approximately $134$152 million. In addition, MAC also released approximately $56$53 million of contingency reserves, which consisted of the assumed contingency reserves maintained by MAC, as reinsurer of AGM, in respect of the same obligations that were the subject of AGM's $253$175 million release.

With respect to theApplicable Maryland and New York laws and regulations require regular, quarterly contributions to contingency reserves required by the applicable Maryland and New York laws and regulations,while they are being established, but such laws and regulations permit the discontinuation of such quarterly contributions to a company’san insurer's contingency reserves when such company’sinsurer's aggregate contingency reserves for a particular line of business (i.e., municipal or non-municipal) exceed the sum of the company’sinsurer's outstanding principal for each specified category of obligations within the particular line of business multiplied by the specified contingency reserve factor for each such category.  In accordance with such laws and regulations, and with the approval of the MIA and the NYDFS, respectively, AGC ceased making quarterly contributions to its contingency reserves for both municipal and non-municipal business and AGM ceased making quarterly contributions to its contingency reserves for non-municipal business, in each case beginning in the fourth

quarter of 2014. Such cessations are expected to continue for as long as AGC and AGM satisfy the foregoing condition for their applicable line(s) of business.

OnIn July 15, 2013, AGM and its wholly-owned subsidiary AGE (together, the "AGM Group") and AGC were notified that the NYDFS and MIA dodid not object to the AGM, GroupAGE and AGC respectively, reassuming all of the outstanding contingency reserves that the AGM Group and AGCthey had ceded to AG Re and electing to cease ceding future contingency reserves to AG Re. The insurance regulators permitted the AGM, GroupAGE and AGC to reassume the contingency reserves in increments over three years. In the third quarter of 2015, the AGM Group and AGC each reassumed their respective final installments and asAs of December 31, 2015, the AGM, GroupAGE and AGC had collectively reassumed an aggregate of approximately $522 million.


21


Financial guaranty insurers are also required to maintain a loss and loss adjustment expense ("LAE")(LAE) reserve (on a case-by-case basis) and unearned premium reserve.

Single and Aggregate Risk Limits

The New York Insurance Law and the Code of Maryland Regulations establish single risk limits for financial guaranty insurers applicable to all obligations issued by a single entity and backed by a single revenue source. For example, under the limit applicable to qualifying asset-backed securities, the lesser of:

the insured average annual debt service for a single risk, net of qualifying reinsurance and collateral, or

the insured unpaid principal (reduced by the extent to which the unpaid principal of the supporting assets exceeds the insured unpaid principal) divided by nine, net of qualifying reinsurance and collateral,

may not exceed 10% of the sum of the insurer's policyholders' surplus and contingency reserves, subject to certain conditions.

Under the limit applicable to municipal obligations, the insured average annual debt service for a single risk, net of qualifying reinsurance and collateral, may not exceed 10% of the sum of the insurer's policyholders' surplus and contingency reserves. In addition, insured principal of municipal obligations attributable to any single risk, net of qualifying reinsurance and collateral, is limited to 75% of the insurer's policyholders' surplus and contingency reserves. Single-risk limits are also specified for other categories of insured obligations, and generally are more restrictive than those listed for asset-backed or municipal obligations. Obligations not qualifying for an enhanced single-risk limit are generally subject to the "corporate" limit (applicable to insurance of unsecured corporate obligations) equal to 10% of the sum of the insurer's policyholders' surplus and contingency reserves. For example, "triple-X" and "future flow" securitizations, as well as unsecured investor-owned utility obligations, are generally subject to these "corporate" single-risk limits.

The New York Insurance Law and the Code of Maryland Regulations also establish aggregate risk limits on the basis of aggregate net liability insured as compared with statutory capital. "Aggregate net liability" is defined as outstanding principal and interest of guaranteed obligations insured, net of qualifying reinsurance and collateral. Under these limits, policyholders' surplus and contingency reserves must not be less than the sum of various percentages of aggregate net liability for various categories of specified obligations. The percentage varies from 0.33% for certain municipal obligations to 4% for certain non-investment-grade obligations. As of December 31, 2015,2016, the aggregate net liability of each of AGM, MAC and AGC utilized approximately 27.0%23.7%, 30.3%27.6% and 16.1%10.7% of their respective policyholders' surplus and contingency reserves.

The New York Superintendent has broad discretion to order a financial guaranty insurer to cease new business originations if the insurer fails to comply with single or aggregate risk limits. In practice, the New York Superintendent has shown a willingness to work with insurers to address these concerns.

Group Regulation

In connection with AGL’s establishment of tax residence in the United Kingdom,U.K., as discussed in greater detail under "Tax Matters" below, AGL has been discussing the regulation of AGL and its subsidiaries as a group with the Prudential Regulation Authority in the U.K. and with the NYDFS. The NYDFS has assumed responsibility for regulation of the Assured Guaranty group. Group supervision by the NYDFS results in additional regulatory oversight over Assured Guaranty, and may subject Assured Guaranty to new regulatory requirements and constraints.


Investments

The Assured Guaranty U.S. Subsidiaries are subject to laws and regulations that require diversification of their investment portfolio and limit the amount of investments in certain asset categories, such as BIG fixed-maturity securities, equity real estate, other equity investments, and derivatives. Failure to comply with these laws and regulations would cause investments exceeding regulatory limitations to be treated as non-admitted assets for purposes of measuring surplus, and, in some instances, would require divestiture of such non-qualifying investments. The Company believes that the investments made by the Assured Guaranty U.S. Subsidiaries complied with such regulations as of December 31, 2015.2016. In addition, any investment must be approved by the insurance company's board of directors or a committee thereof that is responsible for supervising or making such investment.


22


Operations of the Company's Non-U.S. Insurance Subsidiaries

In addition to the regulatory requirements imposed by the jurisdictions in which they are licensed, the business operations of the Company's reinsurance subsidiaries are affected by regulatory requirements in various states of the United States governing "credit for reinsurance", which are imposed on the ceding companies of the reinsurers. The Nonadmitted and Reinsurance Reform Act (“NRRA”)(NRRA) of the Dodd-Frank Wall Street Reform and Consumer Protection Act (the “Dodd-Frank Act”)Dodd-Frank Act) streamlined the regulation of reinsurance by applying single state regulation for credit for reinsurance. Under the NRRA, credit for reinsurance determinations are controlled by the ceding company’s state of domicile and non-domiciliary states are prohibited from applying their reinsurance laws extraterritorially. In general, a ceding company which obtains reinsurance from a reinsurer that is licensed, accredited or approved by the ceding company's state of domicile is permitted to reflect in its statutory financial statements a credit in an aggregate amount equal to the ceding company's liability for unearned premiums (which are that portion of premiums written which applies to the unexpired portion of the policy period), loss and loss expense reserves ceded to the reinsurer. The great majority of states, however, permit a credit on the statutory financial statements of a ceding insurer for reinsurance obtained from a non-licensed or non-accredited reinsurer to the extent that the reinsurer secures its reinsurance obligations to the ceding insurer by providing a letter of credit, trust fund or other acceptable security arrangement. A few states do not allow credit for reinsurance ceded to non-licensed reinsurers except in certain limited circumstances and others impose additional requirements that make it difficult to become accredited. The Company's reinsurance subsidiaries AG Re and AGRO are not licensed, accredited or approved in any state and have established trusts to secure their reinsurance obligations.

U.S. Federal Regulation

The Company’s businesses are subject to direct and indirect regulation under U.S. federal law. In particular, the Company’s derivatives activities are directly and indirectly subject to a variety of regulatory requirements under the Dodd-Frank Act. Rules that have been adopted byBased on the SEC could require certainsize of AGL's subsidiaries to register and be regulated as "major security-based swap participants" when those registration rules take effect. If such registration is required, these entities would likely be subject to regulatory capital requirements, margin requirements with respect to their transactions in “security-based swaps" and additional requirements relating to business conduct and risk management in connection with such transactions. While the SEC adopted final rules for registration of major security-based swap participants in August 2015, most of the substantive rules for these entities have not yet been adopted and it is therefore unclear what impact registration would have or when such requirements would become effective. The mandatory compliance date is not likely to occur before late 2016.

In addition, whileits subsidiaries' remaining legacy derivatives portfolios, AGL does not believe any of its subsidiaries areis required to register with the Commodity Futures Trading Commission ("CFTC")(CFTC) as a “major swap participants,” certainparticipant” or with the SEC as a "major securities-based swap participant". Certain of AGL'sthe Company's subsidiaries may be indirectly subject to CFTC and other regulationsDodd-Frank Act requirements to post margin or to clear on a regulated execution facility future swap transactions or with respect to “swaps” including interest rate swaps.  When rules relating to margin take effect in March 2017, AGL's subsidiary may be required to post margin on future transactions with a swap dealer counterparty, if any, or on certain amendments to legacy swap transactions, with a swap dealer counterparty. These entities’ swaps must also be reported to central data repositories, and various documentation requirements also indirectly apply through their counterparties.if they enter into such transactions.

Bermuda

AG Re and AGRO are each an insurance company currently registered and licensed under the Insurance Act 1978 of Bermuda, amendments thereto and related regulations (collectively, the "Insurance Act")Insurance Act). AG Re is registered and licensed as a Class 3B insurer and AGRO is registered and licensed as a Class 3A insurer and a Class C long-term insurer.

Bermuda Insurance Regulation

The Insurance Act imposes on insurance companies solvency and liquidity standards; restrictions on the declaration and payment of dividends and distributions; restrictions on the reduction of statutory capital; restrictions on the winding up of long-term insurers; and auditing and reporting requirements; and the need to have a principal representative and a principal office (as understood under the Insurance Act) in Bermuda. The Insurance Act grants to the Bermuda Monetary Authority (the "Authority")Authority) the power to cancel insurance licenses, supervise, investigate and intervene in the affairs of insurance companies and in certain circumstances share information with foreign regulators. Class 3A and Class 3B insurers are authorized to carry on general insurance business (as understood under the Insurance Act), subject to conditions attached to the license and to compliance with minimum capital and surplus requirements, solvency margin, liquidity ratio and other requirements imposed by the Insurance Act. Class C long-term insurers are permitted to carry on long-term business (as understood under the

Insurance Act) subject to conditions attached to the license and to similar compliance requirements and the requirement to maintain its long-term business fund (a segregated fund).

23


Each of AG Re and AGRO is required annually to file statutorily mandated financial statements and returns, audited by an auditor approved by the Authority (no approved auditor of an insurer may have an interest in that insurer, other than as an insured, and no officer, servant or agent of an insurer shall be eligible for appointment as an insurer's approved auditor), together with an annual loss reserve opinion of the Authority, approved loss reserve specialist, who is approved by the Authority, and in respect of AGRO, the required actuary's certificate with respect to the long-term business. When each of AG Re and AGRO files its statutory financial statements, it is also required to deliver to the Authority a declaration of compliance, declaring whether or not the insurer has, with respect to the preceding financial year complied with all requirements of the minimum criteria applicable to it; complied with the minimum margin of solvency as at its financial year end; complied with the applicable enhanced capital requirements as at its financial year end; complied with the minimum liquidity ratio for general business as at its financial year end; and complied with applicable conditions, directions and restrictions imposed on, or approvals granted to the insurer. AG Re and AGRO are also required to file annual financial statements prepared in conformity with accounting principles generally accepted in the United States of America ("GAAP")(GAAP), which must be available to the public. As a Class 3A insurer, AGRO has filed for an exemption from the Authority from making such filing for its December 31, 2015 year-end, but it will be subject to this requirement going forward.

In addition, AG Re isand AGRO are required to file a capital and solvency return that includes its Bermuda Solvency Capital Requirement ("BSCR")(BSCR) model (or an approved internal capital model in lieu thereof), a schedule of fixed income investments by BSCR rating, categories,a schedule of funds held by ceding reinsurers in segregated accounts/trusts by BSCR rating, a schedule of net reserves for losses and loss expense provisions by line of business, a schedule of premiums written by line of business, a schedule of geographic diversification of net premiums written by line of business, a schedule of risk management, a schedule of fixed income securities, a schedule of commercial insurer's solvency self-assessment ("CISSA")(CISSA), a schedule of catastrophe risk return, a schedule of loss triangles or reconciliation of net loss reserves, a schedule of eligible capital, a statutory economic balance sheet, the loss reserve specialist's opinion, a schedule of regulated non-insurance financial operating entities and a schedule of eligible capital. AGRO is also required to file asolvency. AGRO’s capital and solvency return that includes,must also include, among other details, the company's Bermuda Solvency Capital Requirementa schedule of long-term premiums written by line of business, a schedule of long-term business data, a schedule of long-term variable annuity guarantees data and reconciliation, a schedule of long-term variable annuity guarantees - Small and Medium Entities ("BSCR-SME") model (or an approved internal capital model in lieu thereof),and the CISSA and a schedule of eligible capital.approved actuary’s opinion.

Further, eachEach of AG Re and AGRO is subjectare also required to filing (within four months alongprepare and file with the capitalAuthority, and solvency return) a mandatory trial run of an economic balance sheet ("EBS") with their respective capital and solvency returns. The underlying premise of the EBS is that both assets and liabilities are valued using market or fair values. Included within the EBS is a requirement to producepublish on its website, a financial condition report, disclosing information relatingreport. The Authority has discretion to approve modifications and exemptions to the viewpublic disclosure rules, on application by the insurer if, among other things, the Authority is satisfied that the disclosure of eachcertain information will result in a competitive disadvantage or compromise confidentiality obligations of AG Re’s and AGRO’s management regarding each respective entity’s business performance, governance, risk profile, solvency valuation, capital management and potential subsequent events of significance. For the 2016 year-end and onwards, the financial condition report must be published on the Company's website within 14 days of filing with the Authority.insurer.

Finally, AG Re is required to file with the Authority, on a quarterly basis, financial returns consisting of (i) quarterly unaudited financial statements for each financial quarter (which must minimally include a balance sheet and income statement and must also be recent and not reflect a financial position that exceeds two months), and (ii) a list and details of material intra‑group transactions and risk concentrations that have materialized since the most recent quarterly or annual financial returns, which would also include, among other things, details surrounding all intra group reinsurance and retrocession arrangements and other intra group risk transfer insurance business arrangements that have materialized since the most recent quarterly or annual financial returns and (iii) details of the ten largest exposures to unaffiliated counterparties and any other counterparty exposures exceeding 10% of the insurer’s statutory capital and surplus.
 
Shareholder Controllers

Pursuant to provisions in the Insurance Act, any person who becomes a holder of 10% or more, 20% or more, 33% or more or 50% or more of the Company's common shares must notify the Authority in writing within 45 days of becoming such a holder. The Authority has the power to object to such a person if it appears to the Authority that the person is not fit and proper to be such a holder. In such a case, the Authority may require the holder to reduce their shareholding in the Company and may direct, among other things, that the voting rights attachingattached to their common shares shallare not be exercisable. A person that does not comply with such a notice or direction from the Authority will be guilty of an offense.

Notification of Material Changes

All registered insurers are required to give notice to the Authority of their intention to effect a material change within the meaning of the Insurance Act. For the purposes of the Insurance Act, the following changes are material: (i) the transfer or acquisition of insurance business being part of a scheme falling within, or any transaction relating to a scheme of arrangement under section 25 of the Insurance Act or section 99 of the Companies Act 1981 of Bermuda (the "Companies Act")Companies Act), (ii) the

amalgamation or merger with or acquisition of another firm, (iii)  engaging in unrelated business that is retail business, (iv) the acquisition of a controlling interest in an undertaking that is engaged in non-insurance business which offers services or products to non-affiliated persons, (v) outsourcing all or substantially all of the functions of actuarial, risk management, compliance and internal audit functions, (vi) outsourcing all or a material part of an insurer's underwriting activity, (vii) transferring other than by way of reinsurance all or substantially all of a line of business (viii) expanding into a material new line of business, (ix) the sale of an insurer, and (x) outsourcing an officer role (in this context meaning a chief executive or senior executive performing the roles of underwriting, actuarial, risk management, compliance, internal audit, finance or investment matters).


24


No registered insurer shallRegistered insurers are not permitted to take any steps to give effect to thea material changeschange listed in items (ii) to (viii) above unless it has first served notice on the Authority that it intends to effect such material change and, before the end of 30 days, either the Authority has notified such company in writing that it has no objection to such change or that period has lapsed without the Authority having issued a notice of objection. A person who fails to give the required notice or who effects a material change, or allows such material change to be effected, before the prescribed period has elapsed or after having received a notice of objection shall beis guilty of an offence.

Minimum Solvency Margin and Enhanced Capital Requirements

Under the Insurance Act, AG Re and AGRO must each ensure that the value of its general business statutory assets exceeds the amount of its general business statutory liabilities by an amount greater than the prescribed minimum solvency margin and each company's applicable enhanced capital requirement.

The minimum solvency margin for Class 3A and Class 3B insurers is the greater of (i) $1 million, or (ii) 20% of the first $6 million of net premiums written; if in excess of $6 million, the figure is $1.2 million plus 15% of net premiums written in excess of $6 million, or (iii) 15% of net discounted aggregate loss and loss expense provisions and other insurance reserves, or (iv) 25% of that insurersinsurer's applicable enhanced capital requirement reported at the end of its relevant year.

In addition, as a Class C long-term insurer, AGRO is required, with respect to its long-term business, to maintain a minimum solvency margin equal to the greater of (i) $500,000, or(ii) 1.5% of its assets.assets or (iii) 25% its enhanced captial requirement reported at the end of the relevant year. For the purpose of this calculation, assets are defined as the total assets pertaining to its long-term business reported on the balance sheet in the relevant year less the amounts held in a segregated account. AGRO is also required to keep its accounts in respect of its long-term business separate from any accounts kept in respect of any other business and all receipts of its long-term business form part of its long-term business fund.

Each of AG Re and AGRO is required to maintain available statutory capital and surplus at a level equal to or in excess of its applicable enhanced capital requirement, which is established by reference to either its BSCR model or an approved internal capital model. The BSCR model is a risk-based capital model which provides a method for determining an insurer's capital requirements (statutory economic capital and surplus) by taking into account the risk characteristics of different aspects of the insurer's business. The BSCR formula establishestablishes capital requirements for eightten categories of risk: fixed income investment risk, equity investment risk, interest rate/liquidity risk, currency risk, concentration risk, premium risk, reserve risk, credit risk, catastrophe risk and operational risk. For each category, the capital requirement is determined by applying factors to asset, premium, reserve, creditor, probable maximum loss and operation items, with higher factors applied to items with greater underlying risk and lower factors for less risky items.

While not specifically referred to in the Insurance Act, the Authority has also established a target capital level ("TCL")(TCL) for each insurer subject to an enhanced capital requirement equal to 120% of its enhanced capital requirement. While such an insurer is not currently required to maintain its statutory capital and surplus at this level, the TCL serves as an early warning tool for the Authority and failure to maintain statutory capital at least equal to the TCL will likely result in increased regulatory oversight.

For each insurer subject to an enhanced capital requirement, there is a three-tiered capital system designed to assess the quality of capital resources that a company has available to meet its capital requirements. Under this system, all of an insurer's capital instruments will be classified as either basic or ancillary capital which in turn will be classified into one of three tiers based on their “loss absorbency” characteristics. Highest quality capital is classified as Tier 1 Capital; lesser quality capital is classified as either Tier 2 Capital or Tier 3 Capital. Under this regime, up to certain specified percentages of Tier 1, Tier 2 and Tier 3 Capital (determined by registration classification) may be used to support the company's minimum solvency margin, enhanced capital requirement and TCL.


Restrictions on Dividends and Distributions

The Insurance Act limits the declaration and payment of dividends and other distributions by AG Re and AGRO.
Under the Insurance Act:

The minimum share capital must be always issued and outstanding and cannot be reduced. For AG Re, which is registered as a Class 3B insurer, the minimum share capital is $120,000. For AGRO, which is registered both as a Class 3A and a Class C long-term insurer, the minimum share capital is $370,000.


25


With respect to the distribution (including repurchase of shares) of any share capital, contributed surplus or other statutory capital:

(a)any such distribution that would reduce AG Re's or AGRO's total statutory capital by 15% or more of their respective total statutory capital as set out in their previous year's financial statements requires the prior approval of the Authority. Any application for such approval must include an affidavit stating that the company will continue to meet the required margins;margins and such other information as the Authority may require; and

(b)as a Class C long-term insurer, AGRO may not use the funds allocated to its long-term business fund, directly or indirectly, for any purpose other than a purpose of its long-term business except in so far as such payment can be made out of any surplus certified by AGRO's approved actuary to be available for distribution otherwise than to policyholders;

With respect to the declaration and payment of dividends:

(a)each of AG Re and AGRO is prohibited from declaring or paying any dividends during any financial year if it is in breach of its solvency margin, minimum liquidity ratio or enhanced capital requirement, or if the declaration or payment of such dividends would cause such a breach (if it has failed to meet its minimum solvency margin or minimum liquidity ratio on the last day of any financial year, the insurer will be prohibited, without the approval of the Authority, from declaring or paying any dividends during the next financial year). Dividends, are paid out of each insurer's statutory surplus and, therefore, dividends cannot exceed such surplus. See "—Minimum Solvency Margin and Enhanced Capital Requirements" above and "—Minimum Liquidity Ratio" below;

(b)an insurer which at any time fails to meet its minimum solvency margin or comply with the enhanced capital requirement may not declare or pay any dividend until the failure is rectified, and also in such circumstances the insurer must report, within 14 days after becoming aware of its failure or having reason to believe that such failure has occurred, to the Authority in writing giving particulars of the circumstances leading to the failure and giving a plan detailing the manner, specific actions to be taken and time frame in which the insurer intends to rectify the failure. A failure to comply with the enhanced capital requirement will also result in the insurer furnishing certain other information to the Authority within 45 days after becoming aware of its failure or having reason to believe that such failure has occurred;

(c)each of AG Re and AGRO is prohibited from declaring or paying in any financial year dividends of more than 25% of its total statutory capital and surplus (as shown on its previous financial year's statutory balance sheet) unless it files (at least seven days before payments of such dividends) with the Authority an affidavit signed by at least 2two directors (one of whom must be a Bermuda resident director if any of the insurer's directors are resident in Bermuda) and the principal representative stating that it will continue to meet its solvency margin and minimum liquidity ratio. Where such an affidavit is filed, it shall be available for public inspection at the offices of the Authority; and

(d)as a Class C long-term insurer, AGRO may not declare or pay a dividend to any person other than a policyholder unless the value of the assets of its long-term business fund, as certified by AGRO's approved actuary, exceeds the extent (as so certified) of the liabilities of AGRO's long-term business, and the amount of any such dividend shall not exceed the aggregate of (1) that excess; and (2) any other funds properly available for the payment of dividends being funds arising out of AGRO's business other than its long-term business.


The Companies Act also limits the declaration and payment of dividends and other distributions by Bermuda companies such as AGL and its Bermuda subsidiaries (including AG Re and AGRO). Such companies may only declare and pay a dividend or make a distribution out of contributed surplus (as understood under the Companies Act) if there are reasonable grounds for believing that the company is and after the payment will be able to meet and pay its liabilities as they become due and the realizable value of the company's assets will not be less than its liabilities. The Companies Act also regulates and restricts the reduction and return of capital and paid in share premium, including the repurchase of shares and imposes minimum issued and outstanding share capital requirements.shares.

Based on the limitations above, in 20162017 AG Re has the capacity to (i) make capital distributions in an aggregate amount up to $127$128 million without the prior approval of the Authority and (ii) declare and pay dividends in an aggregate amount up to the limit of its outstanding statutory surplus, which is $174$314 million. Such dividend capacity may be further

26


limited by the actual amount of AG Re’s unencumbered assets, which amount changes from time to time due in part to collateral posting requirements. As of December 31, 2015,2016, AG Re had unencumbered assets of approximately $640$596 million. AG Re declared and paid dividends of $100 million, $150 million and $82 million during 2016, 2015 and $144 million during 2015, 2014, and 2013, respectively, to AGL. For more information concerning AG Re’s capacity to pay dividends and or other distributions, see Note 11, Insurance Company Regulatory Requirements, of the Financial Statements and Supplementary Data. The Company does not expect AGRO to declare or pay any dividends or other distributions at this time.
  
Minimum Liquidity Ratio

The Insurance Act provides a minimum liquidity ratio for general business. An insurer engaged in general business is required to maintain the value of its relevant assets at not less than 75% of the amount of its relevant liabilities. Relevant assets include cash and time deposits, quoted investments, unquoted bonds and debentures, first liens on real estate, investment income due and accrued, accounts and premiums receivable, reinsurance balances receivable, and funds held by ceding reinsurers.reinsurers and any other assets which the Authority on application in any particular case made to it with reasons, accepts in that case. There are certain categories of assets which, unless specifically permitted by the Authority, do not automatically qualify as relevant assets, such as unquoted equity securities, investments in and advances to affiliates and real estate and collateral loans.

The relevant liabilities are total general business insurance reserves and total other liabilities less deferred income tax and sundry liabilities (by interpretation, those not specifically defined) and letters of credit, corporate guarantees and corporate guarantees.other instruments.

Insurance Code of Conduct

Each of AG Re and AGRO is subject to the Insurance Code of Conduct, which establishes duties, standards, procedures and sound business principles which must be complied with to ensure sound corporate governance, risk management and internal controls are implemented by all insurers registered under the Insurance Act. The Authority will assess an insurer's compliance with the Code of Conduct in a proportionate manner relative to the nature, scale and complexity of its business. Failure to comply with the requirements under the Insurance Code of Conduct will be a factor taken into account by the Authority in determining whether an insurer is conducting its business in a sound and prudent manner as prescribed by the Insurance Act. Such failure to comply with the requirements of the Insurance Code of Conduct could result in the Authority exercising its powers of intervention and investigation and will be a factor in calculating the operational risk charge applicable in accordance with the insurer's BSCR model or approved internal model.

Certain Other Bermuda Law Considerations

Although AGL is incorporated in Bermuda, it is classified as a non-resident of Bermuda for exchange control purposes by the Authority. Pursuant to its non-resident status, AGL may engage in transactions in currencies other than Bermuda dollars and there are no restrictions on its ability to transfer funds (other than funds denominated in Bermuda dollars) in and out of Bermuda or to pay dividends to U.S. residents who are holders of its common shares.

Under Bermuda law, "exempted" companies are companies formed for the purpose of conducting business outside Bermuda from a principal place of business in Bermuda. As an "exempted" company, AGL (as well as each of AG Re and AGRO) may not, without the express authorization of the Bermuda legislature or under a license or consent granted by the Minister of Finance (the "Minister")Minister), participate in certain business and other transactions, including: (1) the acquisition or holding of land in Bermuda (except that held by way of lease or tenancy agreement which is required for its business and held for a term not exceeding 50 years, or which is used to provide accommodation or recreational facilities for its officers and employees and held with the consent of the Minister, for a term not exceeding 21 years), (2) the taking of mortgages on land in Bermuda to secure a principal amount in excess of $50,000 unless the Minister consents to a higher amount, and (3) the carrying on of business of any kind or type for which it is not duly licensed in Bermuda, except in certain limited circumstances, such as doing business with another exempted undertaking in furtherance of AGL's business carried on outside Bermuda.

The Bermuda government actively encourages foreign investment in "exempted" entities like AGL that are based in Bermuda, but which do not operate in competition with local businesses. AGL is not currently subject to taxes computed on profits or income or computed on any capital asset, gain or appreciation. Bermuda companies pay, as applicable, annual government fees, business fees, payroll tax and other taxes and duties. See "—Tax Matters—Taxation of AGL and Subsidiaries—Bermuda."


27


Special considerations apply to the Company's Bermuda operations. Under Bermuda law, non-Bermudians, other than spouses of Bermudians and individuals holding permanent resident certificates or working resident certificates, are not permitted to engage in any gainful occupation in Bermuda without a work permit issued by the Bermuda government. A work permit is only granted or extended if the employer can show that, after a proper public advertisement, no Bermudian, spouse of a Bermudian or individual holding a permanent resident certificate or working resident certificate is available who meets the minimum standards for the position. A waiver from advertising is automatically granted in respect of any chief executive officer position and other chief officer positions. The employer can also make a request for a waiver from the requirement to advertise in certain other cases, as expressed in the Bermuda government's work permit policies. Currently, all of the Company's Bermuda based professional employees who require work permits have been granted work permits by the Bermuda government.

United Kingdom

This section concerns AGE and its affiliates Assured Guaranty (UK)(U.K.) Ltd. ("AGUK")(AGUK), Assured Guaranty (London) Ltd. (AGLN) and Assured Guaranty Finance Overseas Ltd (“AGFOL”)(AGFOL), each of which is regulated in the U.K., as well as Assured Guaranty Credit Protection Ltd. ("AGCPL")(AGCPL), which is an authorized representative of AGE. Both AGE, AGUK and AGUKAGLN are regulated by the PRA as insurers, althoughinsurers. AGUK has been placed into runoff.AGLN (formerly MBIA UK Insurance Limited and renamed on January 13, 2017) was acquired as an authorized insurer in run-off by AGC on January 10, 2017. The Company is actively working to combine AGE, AGUK, AGLN and its affiliate CIFG Europe S.A. (CIFGE). Any such combination will be subject to regulatory and court approvals. As a result, the Company has elected to place AGUK into runoff.cannot predict when, or if, such combination will be completed.

General

Each of AGE, AGUK, AGLN and AGFOL are subject to the U.K.'s Financial Services and Markets Act 2000 ("FSMA")(FSMA), which covers financial services relating to deposits, insurance, investments and certain other financial products .products.
Under FSMA, effecting or carrying out contracts of insurance by way of business in the U.K. each constitutes a “regulated activity” requiring authorization by the appropriate regulator. An authorized insurance company must have permission for each class of insurance business it intends to write.
Insurance companies in the U.K. are authorized and regulated by the PRA and the Financial Conduct Authority ("FCA")(FCA). The PRA and the FCA were established on April 1, 2013 and are the main regulatory authorities responsible for financial regulation in the U.K. These two regulatory bodies cover the following areas:
the PRA, a part of the Bank of England, is responsible for prudential regulation of key systemically important firms (which includes insurance companies, among others), and
the FCA is responsible for the conduct of business regulation of all firms and the regulation of market conduct and the prudential regulation of all non-PRA firms.
While the two regulators coordinate and cooperate in some areas, they have separate and independent mandates and separate rule-making and enforcement powers. AGE, AGUK and AGUKAGLN are regulated by both the PRA and the FCA. AGFOL is regulated by the FCA.
The PRA carries out the prudential supervision of insurance companies through a variety of methods, including the collection of information from statistical returns, the review of accountants' reports and insurers' annual reports and disclosures, visits to insurance companies and regular formal interviews. The PRA takes a risk-based approach to the supervision of insurance companies.
The PRA'sprimary source of rules arerelating to the prudential supervision of AGE, AGUK and AGLN is the Solvency II Directive (Directive 2009/138/EC) as amended by the Omnibus II Directive (Directive 2014/51/EU) (together, Solvency II),

which came into force and effect on January 1, 2016. The PRA remains the prudential regulator for U.K. insurers such as AGE, AGUK and AGLN under Solvency II. Solvency II provides rules on capital adequacy, governance and risk management and regulatory reporting and public disclosure. It is intended to align capital requirements with the risk profile of each EEA insurance company and to ensure adequate diversification of an insurer's or reinsurer's exposures to any credit risks of its reinsurers. Each of AGE, AGUK and AGUKAGLN has calculated its minimum required capital according to the PRA's individual capital adequacySolvency II criteria and is in compliance.
The PRA applies threshold conditions, which insurers must meet, and against which the PRA assesses them on a continuous basis. At a high level, these conditions are that:
an insurer's head office, and in particular its mind and management, must be in the United KingdomU.K. if it is incorporated in the United Kingdom;U.K.;
an insurer's business must be conducted in a prudent manner — in particular, the insurer must maintain appropriate financial and non-financial resources;

28


the insurer must be fit and proper, and be appropriately staffed; and
the insurer and its group must be capable of being effectively supervised.
The PRA assesses, on an ongoing basis, whether insurers are acting in a manner consistent with safety and soundness and appropriate policyholder protection, and so whether they meet, and are likely to continue to meet, the threshold conditions. It weights its supervision towards those issues and those insurers that, in its judgment, pose the greatest risk to its objectives. It is forward-looking, assessing its objectives not just against current risks, but also against those that could plausibly arise further ahead and will rely significantly on judgments based on evidence and analysis. Its risk assessment framework looks at the potential impact of failure of the insurer, its risk context and mitigating factors. The Solvency II
AGFOL’s Markets in Financial Instruments Directive (Directive 2009/138/EC) as amended by(MiFID) activities are limited to receiving and transmitting orders and giving investment advice and it cannot hold client money. Accordingly, although it is subject to MiFID, AGFOL is exempt from the Omnibus IICapital Requirements Directive (2014/51/EU) (together, "Solvency II") (discussed below)and Capital Requirements Regulations (CRD III and CRD IV), which are the EU regulations on capital for certain MiFID firms. AGFOL has brought further changestherefore calculated its minimum required capital according to the supervisory frameworkFCA’s rules for insurers. The Company has beennon-CRD firms, and is in consultation with the PRA for several months on the implementation of Solvency II and believes that its current plans are consistent with Solvency II requirements. Future, ongoing consultation with the PRA is anticipated.compliance.
The regulatory regime in the U.K. must be consistent with relevant European Union (“EU”)(EU) legislation, which is either directly applicable in, or must be implemented into national law by, all EU member states. The key EU legislation that is relevant to AGE, AGUK and AGUKAGLN is Solvency II, which provides the framework for a new solvency and supervisory regime for insurers in the EEA. The key EU legislation that is relevant to AGFOL is Markets in Financial Instruments Directive (“MiFID”),MiFID, which harmonizes the regulatory regime for investment services and activities across the EEA.EEA and the Insurance Mediation Directive.
Position of U.K. Regulated Entities within the AGL Group
AGE is authorized by the PRA to effect and carry out certain classes of general insurance, specifically: classes 14 (credit), 15 (suretyship) and 16 (miscellaneous financial loss) for eligible counterparties and professional clients only (i.e., not retail clients). This scope of permission is sufficient to enable AGE to effect and carry out financial guaranty insurance and reinsurance. The insurance and reinsurance businesses of AGE are subject to close supervision by the PRA. AGE also has permission to arrange and advise on transactions it guarantees, and to take deposits in the context of its insurance business.
Following the Company's decision in 2010 to place AGUK into run-off, the Company has been utilizing AGE as the entity from which to write business in the EEA. It was agreed between management and AGE's then regulator, the Financial Services Authority (now the PRA), that any new business written by AGE would be guaranteed using a co-insurance structure pursuant to which AGE would co-insure municipal and infrastructure transactions with AGM, and structured finance transactions with AGC. AGE must obtain the approval of the PRA before it can guarantee any new structured finance transaction. AGE's financial guaranty for each transaction covers a proportionate share (expected to be approximately 3 to 10%) of the total exposure, and AGM or AGC, as the case may be, guarantees the remaining exposure under the transaction (subject to compliance with EEA licensing requirements). AGM or AGC, as the case may be, will also provide a second-to-pay guaranty to cover AGE's financial guaranty.

AGE also is the principal of AGCPL. AGCPL is not PRA or FCA authorized, but is an appointed representative of AGE. This means AGCPL can carry on advising and arranginginsurance mediation activities without a license, because AGE has regulatory responsibility for it.
AGCPL is subject to the requirements of Regulation (EU) No 648/2012 of the European Parliament and of the Council of July 4, 2012 on OTC derivatives, central counterparties and trade repositories ("EMIR")(EMIR) which, as a European regulation, is directly applicable in all the member states of the European Union.EU. AGCPL is the only European entity within the AGL group which has entered into derivative contracts and as such it is the only entity in the group which is directly subject to EMIR. AGCPL has notified the European Securities and Markets Authority ("ESMA")(ESMA) and the FCA of its status under EMIR as a non-financial counterparty which has exceeded the clearing threshold (an “NFC+”NFC+) as described in Article 10 of EMIR. AGCPL is subject to certain requirements under EMIR with respect to its portfolio of derivative contracts including: (i) the requirement to centrally clear standardized OTC derivatives (although AGCPL does not currently enter into such derivatives, and so this requirement is not currently relevant) (ii) an obligation to employ certain risk mitigation techniques relating to derivatives that cannot be centrally cleared; and (iii) a requirement to report derivative transactions to a trade depository.  The Company is aware that circumstances exist in which EMIR may apply directly to non-European entities when transacting derivatives, but has determined that these circumstances do not apply to the non-European entities in AGL’s group.
AGFOL, a subsidiary of AGL, is authorized by the FCA to carry out designated investment business activities (including insurance mediation) in that it may “advise on investments (except on pension transfers and pension opt outs)” relating to most investment instruments. In addition, it may arrange or bring about transactions in investments and make “arrangements with a view to transactions in

29


investments.” In all cases, it may deal only with clients who are eligible counterparties or professional customers (i.e., not retail clients), or, when arranging in relation to insurance contracts, commercial customers. AGFOL is not authorized as an insurer and does not itself take risk in the transactions it arranges or places, and may not hold funds on behalf of its customers. AGFOL's permissions also allow it to introduce business to AGC and AGM, so that AGFOL can arrange financial guaranties underwritten by AGC and AGM.
AGFOL’s MiFID activities are limited to receiving and transmitting orders and giving investment advice and it cannot hold client money. Accordingly, although it is subject to MiFID, AGFOL is exempt from the Capital Requirements Directive and Capital Requirements Regulations (CRD III and CRD IV), which are the EU regulations on capital for certain MiFID firms.
Solvency II and Solvency Requirements
Solvency II came into force for insurers within its remit on January 1, 2016. In the U.K., Solvency II has been transposed into national law through changes to existing provisions in the FCA and the PRA’s respective handbooks and rulebook and through amendments to primary legislation. The Solvency II “Delegated Acts”, which set out more detailed rules underlying Solvency II have direct effect in all EEA member states, including the U.K. Among other things, Solvency II introduces a revised risk-based prudential regime which includes the following "Pillar 1" regulatory capital rules:
assets and liabilities are generally to be valued at their market value;
the amount of required economic capital is intended to ensure, with a probability of 99.5%, that regulated firms are able to meet their obligations to policyholders and beneficiaries over the following 12 months; and
reinsurance recoveries will be treated as a separate asset (rather than being netted against the underlying insurance liabilities).
In many instances, Solvency II is expected to require insurers to maintain a somewhat increased amount of capital to satisfy the new solvency capital requirements. AGE and AGUK have agreed with the PRA that they will use the "Standard Formula" prescribed by Solvency II for calculation of their capital requirements. AGLN is still using a bespoke internal model for calculation of its capital requirements, which was approved by the PRA prior to the acquisition of AGLN (then MBIA UK Insurance Limited) by AGC.
In addition to new regulatory capital rules, Solvency II also contains a number of “Pillar 2” qualitative requirements, obliging firms to develop and embed systems to identify, measure and proactively manage the risks they are, or may be, exposed to. Among other things, firms must:
have in place an effective system of governance that provides for the sound and prudent management of its business;
establish effective risk-management systems; and
take a comprehensive approach to considering their risks through an Own Risk and Solvency Assessment (“ORSA”)(ORSA) as proportionate to the nature, scale and complexity of the risks inherent in their business.

“Pillar 3” reporting and disclosure requirements also exist, including a requirement to publish a public Solvency and Financial Condition Report (“SFCR”)(SFCR) and a private Regular Supervisory Report (“RSR”)(RSR). For more information on reporting requirements and the ORSA, see “Reporting Requirements” below.

Solvency II contains a new regime for the supervision of groups, including groups in which the parent undertaking has its head office in a country whichthat is outside the EEA. The treatment of such groups in part depends on whether the jurisdiction in which the non-EEA parent has its head office is determined to have a supervisory regime which is equivalent to the Solvency II regime. In the absence of such a determination, the Solvency II rules on supervision apply to the group on a worldwide basis, unless the PRA elects to apply “other methods” which ensure appropriate supervision. Both AGE and AGUK are subsidiaries of U.S. parent companies. As the U.S. has not been determined to be equivalent for the purposes of group supervision, if the PRA were not to elect to apply “other methods”, AGE and AGUK would therefore be required to perform and submit to the PRA a group capital adequacy return in respect of their ultimate insurance parent and that calculation would have to show a positive result.
However, theThe PRA has issued a Direction to AGE and AGUK which confirms the “other methods” that the PRA will apply to ensure appropriate supervision. These include, among other things, requirements for AGE and AGUK to notify the PRA in advance of any material changes in their intra-group arrangements and any payments of dividends or capital extractions to a group undertaking outside the EEA. AGE and AGUK must also provide the PRA with certain other information, such as internal and external solvency, capital adequacy and risk assessment reports. The Direction applies from January 1, 2016 until January 1, 2019, unless it is revoked earlier or no longer applicable.

30


Restrictions on Dividend Payments
U.K. company law prohibits each of AGE, AGUK, AGLN and AGUKAGFOL from declaring a dividend to its shareholders unless it has “profits available for distribution.” The determination of whether a company has profits available for distribution is based on its accumulated realized profits less its accumulated realized losses. While the U.K. insurance regulatory laws impose no statutory restrictions on a general insurer's ability to declare a dividend, the PRA's capital requirements may in practice act as a restriction on dividends. The Company does not expectdividends for AGE, or AGUK to distribute any dividends at this time.and AGLN.
Reporting Requirements
U.K. insurance companies must prepare their financial statements under the Companies Act 2006, which requires the filing with Companies House of audited financial statements and related reports. In addition, as from January 1, 2016, the reporting requirements for UKU.K. insurance companies were modified by Solvency II. AGE, AGUK and AGUKAGLN are required to produce certain key reports including an annual SFCR, RSR and an ORSA, the latter as part of the so-called “Pillar 2” individual capital assessment requirements. Although the SFCR will take the place of a number of existing regulatory returns, Solvency II is likely to result in an overall increase in the quantity and quality of disclosures that firms make.
The PRA will review each firm’s ORSA and then consider whether in its view the firm needs to hold capital in excess of its Pillar 1 capital (see “Solvency II and Solvency Requirements” above) and, if so, will impose a “capital add-on”. The prescribed information to be contained in the ORSA, as well as the frequency with which the assessment must be carried out, is subject to guidance issued by the European Insurance and Occupational Pensions Authority (“EIOPA”)(EIOPA) in September 2015 and a supervisory statement issued by the PRA in October 2015. The PRA has advised AGE, AGUK and AGUKAGLN that it is not imposing a capital add-on for those companies at this time. The PRA may determine to impose a capital add-on in relation to AGE, AGUK and AGUKAGLN in the future.
Supervision of Management
IndividualsAGE, AGUK and AGLN are subject to the rules contained in the Senior Insurance Managers Regime (SIMR). This requires that individuals undertaking particular roles need to be registered with the PRA as undertaking a “Senior Insurance Manager Function”. This broadly includes individuals undertaking the executive functions and the oversight functions of each entity. Directors of those entities not serving in the roles specified in the SIMR will be required to become “approved persons” with the FCA (as detailed further in respect of AGFOL below).
In respect of AGFOL, individuals who perform one or more “controlled functions” such as significant influence functions (which includes all board members and other senior managers) or the customer function within authorized firms must be approved by PRA orthe FCA (as appropriate) to carry out that function. The management of insurance companies falls within the scope of significant influence functions, which require approval from the PRA. Individuals performing these functions are “Approved Persons” for the purpose of Part V of FSMA and staff performing these specified “controlled functions” within an authorized firm must be approved by the PRA. The PRA is in the process of implementing a new "Senior Insurance Managers Regime", part of which was driven by high level requirements on governance and fitness and propriety of certain individuals contained in Solvency II. The new regime may result in further or different individuals requiring authorization from the regulators.FCA.

Change of Control
Under FSMA, when a person decides to acquire or increase “control” of a U.K. authorized firm (including an insurance company) they must give the PRA notice in writing before making the acquisition. The PRA has up to 60 working days (without including any period of interruption) in which to assess a change of control case. Any person (a company or individual) that directly or indirectly acquires 10% or 20% (depending on the type of firm, the “Control Percentage Threshold”) or more of the shares, or is entitled to exercise or control the exercise of the Control Percentage Threshold or more of the voting power, in a U.K. authorized firm or its parent undertaking is considered to “acquire control” of the authorized firm. Broadly speaking, the 10% threshold applies to banks, insurers and reinsurers (but not brokers) and MiFID investment firms, and the 20% threshold to insurance brokers and certain other firms that are non-directive firms.
Intervention and Enforcement
The PRA has extensive powers to intervene in the affairs of an authorized firm, culminating in the sanction of the suspension of authorization to carry on a regulated activity. The PRA can also vary or cancel a firm's permissions under its own initiative if it considers that the firm is failing, or is likely to fail, to satisfy the Threshold Conditions. FSMA gives the PRA significant investigation and enforcement powers. It also gives the PRA a rule-making power, under which it makes the various rules that constitute its Handbook of Rules.
The PRA also has the power to prosecute criminal offenses arising under FSMA. The FCA has the power to prosecute offenses under FSMA and to prosecute insider dealing under Part V of the Criminal Justice Act of 1993, and breaches by authorized firms of money laundering and terrorist financing regulations.

31


“Passporting”
EU directives allow AGFOL,AGE, AGUK, AGLN and AGEAGFOL to conduct business in EU states other than the U.K. where they are authorized by the PRA or FCA under a single market directive. This right extends to the EEA. A firm taking advantage of a right under a single market directive to conduct business in another EEA state can rely on its "home state" authorization. This ability to operate in other jurisdictions of the EEA on the basis of home state authorization and supervision is sometimes referred to as “passporting.” Each of AGFOL,AGE, AGUK, AGLN and AGEAGFOL is passported to conduct business in EEA states other than the U.K. Passporting is not applicable to firms not authorized in the EEA, such as AGM and AGC. Accordingly, the co-insurance model described above cannot be “passported” throughout the EEA. Instead, it is a question of local law in each EEA member state as to whether AGM's or AGC’s participation in a co-insurance structure, protecting insureds or risks located in that jurisdiction, would amount to the conduct of insurance business in that jurisdiction. (See also “U.K. referendum vote to leave the EU” below.)
FeesUnited States

AGL has three operating insurance subsidiaries domiciled in the U.S., which the Company refers to collectively as the Assured Guaranty U.S. Subsidiaries.

AGM is a New York domiciled insurance company licensed to write financial guaranty insurance and Leviesreinsurance in 50 U.S. states, the District of Columbia, Guam, Puerto Rico and the U.S. Virgin Islands.

MAC is a New York domiciled insurance company licensed to write financial guaranty insurance and reinsurance in 50 U.S. states and the District of Columbia. MAC will only insure U.S. public finance debt obligations, focusing on investment grade bonds in select sectors of that market.

AGC is a Maryland domiciled insurance company licensed to write financial guaranty insurance and reinsurance in 50 U.S. states, the District of Columbia and Puerto Rico.
Insurance Holding Company Regulation

AGL and the Assured Guaranty U.S. Subsidiaries are subject to the insurance holding company laws of their jurisdiction of domicile, as well as other jurisdictions where these insurers are licensed to do insurance business. These laws

generally require each of the Assured Guaranty U.S. Subsidiaries to register with its respective domestic state insurance department and annually to furnish financial and other information about the operations of companies within their holding company system. Generally, all transactions among companies in the holding company system to which any of the Assured Guaranty U.S. Subsidiaries is a party (including sales, loans, reinsurance agreements and service agreements) must be fair and, if material or of a specified category, such as reinsurance or service agreements, require prior notice and approval or non-disapproval by the insurance department where the applicable subsidiary is domiciled.

Change of Control

Before a person can acquire control of a U.S. domestic insurance company, prior written approval must be obtained from the insurance commissioner of the state where the domestic insurer is domiciled. Generally, state statutes provide that control over a domestic insurer is presumed to exist if any person, directly or indirectly, owns, controls, holds with the power to vote, or holds proxies representing, 10% or more of the voting securities of the domestic insurer. Prior to granting approval of an application to acquire control of a domestic insurer, the state insurance commissioner will consider such factors as the financial strength of the applicant, the integrity and management of the applicant's board of directors and executive officers, the acquirer's plans for the management of the applicant's board of directors and executive officers, the acquirer's plans for the future operations of the domestic insurer and any anti-competitive results that may arise from the consummation of the acquisition of control. These laws may discourage potential acquisition proposals and may delay, deter or prevent a change of control involving AGL that some or all of AGL's stockholders might consider to be desirable, including in particular unsolicited transactions.

State Insurance Regulation

State insurance authorities have broad regulatory powers with respect to various aspects of the business of U.S. insurance companies, including licensing these companies to transact business, accreditation of reinsurers, admittance of assets to statutory surplus, regulating unfair trade and claims practices, establishing reserve requirements and solvency standards, regulating investments and dividends and, in certain instances, approving policy forms and related materials and approving premium rates. State insurance laws and regulations require the Assured Guaranty U.S. Subsidiaries to file financial statements with insurance departments everywhere they are licensed, authorized or accredited to conduct insurance business, and their operations are subject to examination by those departments at any time. The Assured Guaranty U.S. Subsidiaries prepare statutory financial statements in accordance with Statutory Accounting Practices, or SAP, and procedures prescribed or permitted by these departments. State insurance departments also conduct periodic examinations of the books and records, financial reporting, policy filings and market conduct of insurance companies domiciled in their states, generally once every three to five years. Market conduct examinations by regulators other than the domestic regulator are generally carried out in cooperation with the insurance departments of other states under guidelines promulgated by the National Association of Insurance Commissioners.

The New York State Department of Financial Services (the NYDFS), the regulatory authority of the domiciliary jurisdiction of AGM and MAC, conducts a periodic examination of insurance companies domiciled in New York, usually at five-year intervals. In 2012, the NYDFS commenced examinations of AGM and MAC in order for its examinations of these companies to coincide with the Maryland Insurance Administration (the MIA's) examination of AGC. In 2013, the NYDFS completed its examinations and issued Reports on Examination of AGM for the four-year period ending December 31, 2011 and MAC for the period September 26, 2008 through June 30, 2012. The reports did not note any significant regulatory issues concerning those companies.

The MIA, the regulatory authority of the domiciliary jurisdiction of AGC, conducts a periodic examination of insurance companies domiciled in Maryland every five years. In 2013, the MIA issued an Examination Report with respect to AGC for the five year period ending December 31, 2011; no significant regulatory issues were noted in such report.

Assured Guaranty has been notified that the NYDFS and MIA will formally commence an examination, respectively, of AGM and MAC, and AGC, in 2017 for the period covering the end of the last applicable examination period for each company through December 31, 2016.
State Dividend Limitations

New York.   One of the primary sources of cash for repurchases of shares and the payment of debt service and dividends by the Company is the receipt of dividends from AGM. Under the New York Insurance Law, AGM and MAC may only pay dividends out of "earned surplus," which is the portion of the company's surplus that represents the net earnings, gains or profits (after deduction of all losses) that have not been distributed to shareholders as dividends, transferred to stated capital

or capital surplus, or applied to other purposes permitted by law, but does not include unrealized appreciation of assets. AGM and MAC may each pay dividends without the prior approval of the New York Superintendent of Financial Services (New York Superintendent) that, together with all dividends declared or distributed by it during the preceding 12 months, do not exceed the lesser of 10% of its policyholders' surplus (as of its last annual or quarterly statement filed with the New York Superintendent) or 100% of its adjusted net investment income during that period. The maximum amount available during 2017 for AGM to pay dividends to its parent AGMH without regulatory approval is estimated to be approximately $232 million, of which approximately $81 million is available for distribution in the first quarter of 2017. AGM paid dividends of $247 million, $215 million and $160 million during 2016, 2015 and 2014, respectively, to AGMH. The maximum amount available during 2017 for MAC to distribute as dividends to its shareholders (AGM and AGC) without regulatory approval is estimated to be approximately $49 million; MAC currently intends to allocate the distribution of such amount quarterly in 2017. 

Maryland.    Another primary source of cash for the repurchases of shares and payment of debt service and dividends by the Company is the receipt of dividends from AGC. Under Maryland's insurance law, AGC may, with prior notice to the MIA, pay an ordinary dividend that, together with all dividends paid in the prior 12 months, does not exceed the lesser of 10% of its policyholders' surplus (as of the prior December 31) or 100% of its adjusted net investment income during that period. The maximum amount available during 2017 for AGC to pay ordinary dividends to its parent Assured Guaranty U.S. Holdings Inc. (AGUS) will be approximately $107 million, of which approximately $29 million is available for distribution in the first quarter of 2017. A dividend or distribution to a stockholder in excess of this limitation would constitute an "extraordinary dividend," which must be paid out of "earned surplus" and reported to, and approved by, the MIA prior to payment. "Earned surplus" is that portion of the company's surplus that represents the net earnings, gains or profits (after deduction of all losses) that have not been distributed to shareholders as dividends or transferred to stated capital or capital surplus, or applied to other purposes permitted by law, but does not include unrealized capital gains and appreciation of assets. AGC may not pay any dividend or make any distribution, including ordinary dividends, unless it notifies the MIA of the proposed payment within five business days following declaration and at least ten days before payment. The MIA may declare that such dividend not be paid if it finds that AGC's policyholders' surplus would be inadequate after payment of the dividend or the dividend could lead AGC to a hazardous financial condition. AGC paid dividends of $79 million, $90 million and $69 million during 2016, 2015 and 2014, respectively, to AGUS.

Contingency Reserves

Under the New York Insurance Law, each of AGM and MAC must establish a contingency reserve to protect policyholders. New York Insurance Law determines the calculation of the contingency reserve and the period of time over which it must be established and, subsequently, can be taken down.

Likewise, in accordance with Maryland insurance law and regulations, AGC also maintains a statutory contingency reserve for the protection of policyholders. Maryland insurance law determines the calculation of the contingency reserve and the period of time over which it must be established, and subsequently, can be taken down.
In both New York and Maryland, when considering the principal amount guaranteed, the insurer is permitted to take into account amounts that it has ceded to reinsurers. In addition, releases from the insurer's contingency reserve may be permitted under specified circumstances in the event that actual loss experience exceeds certain thresholds or if the reserve accumulated is deemed excessive in relation to the insurer's outstanding insured obligations.

From time to time, AGM and AGC have obtained the approval of their regulators to release contingency reserves based on losses or because the accumulated reserve is deemed excessive in relation to the insurer's outstanding insured obligations. In 2016, on the latter basis, AGM obtained the NYDFS's approval for a contingency reserve release of approximately $175 million and AGC obtained the MIA's approval for a contingency reserve release of approximately $152 million. In addition, MAC also released approximately $53 million of contingency reserves, which consisted of the assumed contingency reserves maintained by MAC, as reinsurer of AGM, in respect of the same obligations that were the subject of AGM's $175 million release.

Applicable Maryland and New York laws and regulations require regular, quarterly contributions to contingency reserves while they are being established, but such laws and regulations permit the discontinuation of such quarterly contributions to an insurer's contingency reserves when such insurer's aggregate contingency reserves for a particular line of business (i.e., municipal or non-municipal) exceed the sum of the insurer's outstanding principal for each specified category of obligations within the particular line of business multiplied by the specified contingency reserve factor for each such category.  In accordance with such laws and regulations, and with the approval of the MIA and the NYDFS, respectively, AGC ceased making quarterly contributions to its contingency reserves for both municipal and non-municipal business and AGM ceased making quarterly contributions to its contingency reserves for non-municipal business, in each case beginning in the fourth

quarter of 2014. Such cessations are expected to continue for as long as AGC and AGM satisfy the foregoing condition for their applicable line(s) of business.

In July 2013, AGM and AGC were notified that the NYDFS and MIA did not object to AGM, AGE and AGC reassuming all of the outstanding contingency reserves that they had ceded to AG Re and electing to cease ceding future contingency reserves to AG Re. The insurance regulators permitted AGM, AGE and AGC to reassume the contingency reserves in increments over three years. As of December 31, 2015, AGM, AGE and AGC had collectively reassumed an aggregate of approximately $522 million.

Financial guaranty insurers are also required to maintain a loss and loss adjustment expense (LAE) reserve (on a case-by-case basis) and unearned premium reserve.

Single and Aggregate Risk Limits

The New York Insurance Law and the Code of Maryland Regulations establish single risk limits for financial guaranty insurers applicable to all obligations issued by a single entity and backed by a single revenue source. For example, under the limit applicable to qualifying asset-backed securities, the lesser of:

the insured average annual debt service for a single risk, net of qualifying reinsurance and collateral, or

the insured unpaid principal (reduced by the extent to which the unpaid principal of the supporting assets exceeds the insured unpaid principal) divided by nine, net of qualifying reinsurance and collateral,

may not exceed 10% of the sum of the insurer's policyholders' surplus and contingency reserves, subject to certain conditions.

Under the limit applicable to municipal obligations, the insured average annual debt service for a single risk, net of qualifying reinsurance and collateral, may not exceed 10% of the sum of the insurer's policyholders' surplus and contingency reserves. In addition, insured principal of municipal obligations attributable to any single risk, net of qualifying reinsurance and collateral, is limited to 75% of the insurer's policyholders' surplus and contingency reserves. Single-risk limits are also specified for other categories of insured obligations, and generally are more restrictive than those listed for asset-backed or municipal obligations. Obligations not qualifying for an enhanced single-risk limit are generally subject to the "corporate" limit (applicable to insurance of unsecured corporate obligations) equal to 10% of the sum of the insurer's policyholders' surplus and contingency reserves. For example, "triple-X" and "future flow" securitizations, as well as unsecured investor-owned utility obligations, are generally subject to these "corporate" single-risk limits.

The New York Insurance Law and the Code of Maryland Regulations also establish aggregate risk limits on the basis of aggregate net liability insured as compared with statutory capital. "Aggregate net liability" is defined as outstanding principal and interest of guaranteed obligations insured, net of qualifying reinsurance and collateral. Under these limits, policyholders' surplus and contingency reserves must not be less than the sum of various percentages of aggregate net liability for various categories of specified obligations. The percentage varies from 0.33% for certain municipal obligations to 4% for certain non-investment-grade obligations. As of December 31, 2016, the aggregate net liability of each of AGM, MAC and AGC utilized approximately 23.7%, 27.6% and 10.7% of their respective policyholders' surplus and contingency reserves.

The New York Superintendent has broad discretion to order a financial guaranty insurer to cease new business originations if the insurer fails to comply with single or aggregate risk limits. In practice, the New York Superintendent has shown a willingness to work with insurers to address these concerns.

Group Regulation

In connection with AGL’s establishment of tax residence in the U.K., as discussed in greater detail under "Tax Matters" below, the NYDFS has assumed responsibility for regulation of the Assured Guaranty group. Group supervision by the NYDFS results in additional regulatory oversight over Assured Guaranty, and may subject Assured Guaranty to new regulatory requirements and constraints.


Investments

The Assured Guaranty U.S. Subsidiaries are subject to laws and regulations that require diversification of their investment portfolio and limit the amount of investments in certain asset categories, such as BIG fixed-maturity securities, equity real estate, other equity investments, and derivatives. Failure to comply with these laws and regulations would cause investments exceeding regulatory limitations to be treated as non-admitted assets for purposes of measuring surplus, and, in some instances, would require divestiture of such non-qualifying investments. The Company believes that the investments made by the Assured Guaranty U.S. Subsidiaries complied with such regulations as of December 31, 2016. In addition, any investment must be approved by the insurance company's board of directors or a committee thereof that is responsible for supervising or making such investment.

Operations of the Company's Non-U.S. Insurance Subsidiaries

In addition to the regulatory requirements imposed by the jurisdictions in which they are licensed, the business operations of the Company's reinsurance subsidiaries are affected by regulatory requirements in various states of the United States governing "credit for reinsurance", which are imposed on the ceding companies of the reinsurers. The Nonadmitted and Reinsurance Reform Act (NRRA) of the Dodd-Frank Wall Street Reform and Consumer Protection Act (the Dodd-Frank Act) streamlined the regulation of reinsurance by applying single state regulation for credit for reinsurance. Under the NRRA, credit for reinsurance determinations are controlled by the ceding company’s state of domicile and non-domiciliary states are prohibited from applying their reinsurance laws extraterritorially. In general, a ceding company which obtains reinsurance from a reinsurer that is licensed, accredited or approved by the ceding company's state of domicile is permitted to reflect in its statutory financial statements a credit in an aggregate amount equal to the ceding company's liability for unearned premiums (which are that portion of premiums written which applies to the unexpired portion of the policy period), loss and loss expense reserves ceded to the reinsurer. The great majority of states, however, permit a credit on the statutory financial statements of a ceding insurer for reinsurance obtained from a non-licensed or non-accredited reinsurer to the extent that the reinsurer secures its reinsurance obligations to the ceding insurer by providing a letter of credit, trust fund or other acceptable security arrangement. A few states do not allow credit for reinsurance ceded to non-licensed reinsurers except in certain limited circumstances and others impose additional requirements that make it difficult to become accredited. The Company's reinsurance subsidiaries AG Re and AGRO are not licensed, accredited or approved in any state and have established trusts to secure their reinsurance obligations.

U.S. Federal Regulation

The Company’s businesses are subject to direct and indirect regulation under U.S. federal law. In particular, the Company’s derivatives activities are directly and indirectly subject to a variety of regulatory requirements under the Dodd-Frank Act. Based on the size of its subsidiaries' remaining legacy derivatives portfolios, AGL does not believe any of its subsidiaries is required to register with the Commodity Futures Trading Commission (CFTC) as a “major swap participant” or with the SEC as a "major securities-based swap participant". Certain of the Company's subsidiaries may be subject to Dodd-Frank Act requirements to post margin or to clear on a regulated execution facility future swap transactions or with respect to certain amendments to legacy swap transactions, if they enter into such transactions.

Bermuda

AG Re and AGRO are each an insurance company currently registered and licensed under the Insurance Act 1978 of Bermuda, amendments thereto and related regulations (collectively, the Insurance Act). AG Re is registered and licensed as a Class 3B insurer and AGRO is registered and licensed as a Class 3A insurer and a Class C long-term insurer.

Bermuda Insurance Regulation

The Insurance Act imposes on insurance companies solvency and liquidity standards; restrictions on the declaration and payment of dividends and distributions; restrictions on the reduction of statutory capital; restrictions on the winding up of long-term insurers; and auditing and reporting requirements; and the need to have a principal representative and a principal office (as understood under the Insurance Act) in Bermuda. The Insurance Act grants to the Bermuda Monetary Authority (the Authority) the power to cancel insurance licenses, supervise, investigate and intervene in the affairs of insurance companies and in certain circumstances share information with foreign regulators. Class 3A and Class 3B insurers are authorized to carry on general insurance business (as understood under the Insurance Act), subject to conditions attached to the license and to compliance with minimum capital and surplus requirements, solvency margin, liquidity ratio and other requirements imposed by the Insurance Act. Class C long-term insurers are permitted to carry on long-term business (as understood under the

Insurance Act) subject to conditions attached to the license and to similar compliance requirements and the requirement to maintain its long-term business fund (a segregated fund).

Each of AGUK, AGEAG Re and AGFOLAGRO is required annually to file statutorily mandated financial statements and returns, audited by an auditor approved by the Authority (no approved auditor of an insurer may have an interest in that insurer, other than as an insured, and no officer, servant or agent of an insurer shall be eligible for appointment as an insurer's approved auditor), together with an annual loss reserve opinion of the loss reserve specialist, who is approved by the Authority, and in respect of AGRO, the required actuary's certificate with respect to the long-term business. When each of AG Re and AGRO files its statutory financial statements, it is also required to deliver to the Authority a declaration of compliance, declaring whether or not the insurer has, with respect to the preceding financial year complied with all requirements of the minimum criteria applicable to it; complied with the minimum margin of solvency as at its financial year end; complied with the applicable enhanced capital requirements as at its financial year end; complied with the minimum liquidity ratio for general business as at its financial year end; and complied with applicable conditions, directions and restrictions imposed on, or approvals granted to the insurer. AG Re and AGRO are also required to file annual financial statements prepared in conformity with accounting principles generally accepted in the United States of America (GAAP), which must be available to the public.

In addition, AG Re and AGRO are required to file a capital and solvency return that includes its Bermuda Solvency Capital Requirement (BSCR) model (or an approved internal capital model in lieu thereof), a schedule of fixed income investments by BSCR rating, a schedule of funds held by ceding reinsurers in segregated accounts/trusts by BSCR rating, a schedule of net reserves for losses and loss expense provisions by line of business, a schedule of premiums written by line of business, a schedule of geographic diversification of net premiums written by line of business, a schedule of risk management, a schedule of fixed income securities, a schedule of commercial insurer's solvency self-assessment (CISSA), a schedule of catastrophe risk return, a schedule of loss triangles or reconciliation of net loss reserves, a schedule of eligible capital, a statutory economic balance sheet, the loss reserve specialist's opinion, a schedule of regulated non-insurance financial operating entities and a schedule of solvency. AGRO’s capital and solvency return must also include, among other details, a schedule of long-term premiums written by line of business, a schedule of long-term business data, a schedule of long-term variable annuity guarantees data and reconciliation, a schedule of long-term variable annuity guarantees - internal capital model and the approved actuary’s opinion.

Each of AG Re and AGRO are also required to prepare and file with the Authority, and publish on its website, a financial condition report. The Authority has discretion to approve modifications and exemptions to the public disclosure rules, on application by the insurer if, among other things, the Authority is satisfied that the disclosure of certain information will result in a competitive disadvantage or compromise confidentiality obligations of the insurer.
Finally, AG Re is required to file with the Authority, on a quarterly basis, financial returns consisting of (i) quarterly unaudited financial statements for each financial quarter (which must minimally include a balance sheet and income statement and must also be recent and not reflect a financial position that exceeds two months), and (ii) a list and details of material intra‑group transactions and risk concentrations that have materialized since the most recent quarterly or annual financial returns, which would also include, among other things, details surrounding all intra group reinsurance and retrocession arrangements and other intra group risk transfer insurance business arrangements that have materialized since the most recent quarterly or annual financial returns and (iii) details of the ten largest exposures to unaffiliated counterparties and any other counterparty exposures exceeding 10% of the insurer’s statutory capital and surplus.
Shareholder Controllers

Pursuant to provisions in the Insurance Act, any person who becomes a holder of 10% or more, 20% or more, 33% or more or 50% or more of the Company's common shares must notify the Authority in writing within 45 days of becoming such a holder. The Authority has the power to object to such a person if it appears to the Authority that the person is not fit and proper to be such a holder. In such a case, the Authority may require the holder to reduce their shareholding in the Company and may direct, among other things, that the voting rights attached to their common shares are not exercisable. A person that does not comply with such a notice or direction from the Authority will be guilty of an offense.

Notification of Material Changes

All registered insurers are required to give notice to the Authority of their intention to effect a material change within the meaning of the Insurance Act. For the purposes of the Insurance Act, the following changes are material: (i) the transfer or acquisition of insurance business being part of a scheme falling within, or any transaction relating to a scheme of arrangement under section 25 of the Insurance Act or section 99 of the Companies Act 1981 of Bermuda (the Companies Act), (ii) the

amalgamation or merger with or acquisition of another firm, (iii)  engaging in unrelated business that is retail business, (iv) the acquisition of a controlling interest in an undertaking that is engaged in non-insurance business which offers services or products to non-affiliated persons, (v) outsourcing all or substantially all of the functions of actuarial, risk management, compliance and internal audit functions, (vi) outsourcing all or a material part of an insurer's underwriting activity, (vii) transferring other than by way of reinsurance all or substantially all of a line of business (viii) expanding into a material new line of business, (ix) the sale of an insurer, and (x) outsourcing an officer role (in this context meaning a chief executive or senior executive performing the roles of underwriting, actuarial, risk management, compliance, internal audit, finance or investment matters).

Registered insurers are not permitted to take any steps to give effect to a material change listed above unless it has first served notice on the Authority that it intends to effect such material change and, before the end of 30 days, either the Authority has notified such company in writing that it has no objection to such change or that period has lapsed without the Authority having issued a notice of objection. A person who fails to give the required notice or who effects a material change, or allows such material change to be effected, before the prescribed period has elapsed or after having received a notice of objection is guilty of an offence.

Minimum Solvency Margin and Enhanced Capital Requirements

Under the Insurance Act, AG Re and AGRO must each ensure that the value of its general business statutory assets exceeds the amount of its general business statutory liabilities by an amount greater than the prescribed minimum solvency margin and each company's applicable enhanced capital requirement.

The minimum solvency margin for Class 3A and Class 3B insurers is the greater of (i) $1 million, or (ii) 20% of the first $6 million of net premiums written; if in excess of $6 million, the figure is $1.2 million plus 15% of net premiums written in excess of $6 million, or (iii) 15% of net discounted aggregate loss and loss expense provisions and other insurance reserves, or (iv) 25% of that insurer's applicable enhanced capital requirement reported at the end of its relevant year.

In addition, as a Class C long-term insurer, AGRO is required, with respect to its long-term business, to maintain a minimum solvency margin equal to the greater of (i) $500,000, (ii) 1.5% of its assets or (iii) 25% its enhanced captial requirement reported at the end of the relevant year. For the purpose of this calculation, assets are defined as the total assets pertaining to its long-term business reported on the balance sheet in the relevant year less the amounts held in a segregated account. AGRO is also required to keep its accounts in respect of its long-term business separate from any accounts kept in respect of any other business and all receipts of its long-term business form part of its long-term business fund.

Each of AG Re and AGRO is required to maintain available statutory capital and surplus at a level equal to or in excess of its applicable enhanced capital requirement, which is established by reference to either its BSCR model or an approved internal capital model. The BSCR model is a risk-based capital model which provides a method for determining an insurer's capital requirements (statutory economic capital and surplus) by taking into account the risk characteristics of different aspects of the insurer's business. The BSCR formula establishes capital requirements for ten categories of risk: fixed income investment risk, equity investment risk, interest rate/liquidity risk, currency risk, concentration risk, premium risk, reserve risk, credit risk, catastrophe risk and operational risk. For each category, the capital requirement is determined by applying factors to asset, premium, reserve, creditor, probable maximum loss and operation items, with higher factors applied to items with greater underlying risk and lower factors for less risky items.

While not specifically referred to in the Insurance Act, the Authority has also established a target capital level (TCL) for each insurer subject to an enhanced capital requirement equal to 120% of its enhanced capital requirement. While such an insurer is not currently required to maintain its statutory capital and surplus at this level, the TCL serves as an early warning tool for the Authority and failure to maintain statutory capital at least equal to the TCL will likely result in increased regulatory oversight.

For each insurer subject to an enhanced capital requirement, there is a three-tiered capital system designed to assess the quality of capital resources that a company has available to meet its capital requirements. Under this system, all of an insurer's capital instruments will be classified as either basic or ancillary capital which in turn will be classified into one of three tiers based on their “loss absorbency” characteristics. Highest quality capital is classified as Tier 1 Capital; lesser quality capital is classified as either Tier 2 Capital or Tier 3 Capital. Under this regime, up to certain specified percentages of Tier 1, Tier 2 and Tier 3 Capital (determined by registration classification) may be used to support the company's minimum solvency margin, enhanced capital requirement and TCL.


Restrictions on Dividends and Distributions

The Insurance Act limits the declaration and payment of dividends and other distributions by AG Re and AGRO.
Under the Insurance Act:

The minimum share capital must be always issued and outstanding and cannot be reduced. For AG Re, which is registered as a Class 3B insurer, the minimum share capital is $120,000. For AGRO, which is registered both as a Class 3A and a Class C long-term insurer, the minimum share capital is $370,000.

With respect to the distribution (including repurchase of shares) of any share capital, contributed surplus or other statutory capital:

(a)any such distribution that would reduce AG Re's or AGRO's total statutory capital by 15% or more of their respective total statutory capital as set out in their previous year's financial statements requires the prior approval of the Authority. Any application for such approval must include an affidavit stating that the company will continue to meet the required margins and such other information as the Authority may require; and

(b)as a Class C long-term insurer, AGRO may not use the funds allocated to its long-term business fund, directly or indirectly, for any purpose other than a purpose of its long-term business except in so far as such payment can be made out of any surplus certified by AGRO's approved actuary to be available for distribution otherwise than to policyholders;

With respect to the declaration and payment of dividends:

(a)each of AG Re and AGRO is prohibited from declaring or paying any dividends during any financial year if it is in breach of its solvency margin, minimum liquidity ratio or enhanced capital requirement, or if the declaration or payment of such dividends would cause such a breach (if it has failed to meet its minimum solvency margin or minimum liquidity ratio on the last day of any financial year, the insurer will be prohibited, without the approval of the Authority, from declaring or paying any dividends during the next financial year). Dividends, are paid out of each insurer's statutory surplus and, therefore, dividends cannot exceed such surplus. See "—Minimum Solvency Margin and Enhanced Capital Requirements" above and "—Minimum Liquidity Ratio" below;

(b)an insurer which at any time fails to meet its minimum solvency margin or comply with the enhanced capital requirement may not declare or pay any dividend until the failure is rectified, and also in such circumstances the insurer must report, within 14 days after becoming aware of its failure or having reason to believe that such failure has occurred, to the Authority in writing giving particulars of the circumstances leading to the failure and giving a plan detailing the manner, specific actions to be taken and time frame in which the insurer intends to rectify the failure. A failure to comply with the enhanced capital requirement will also result in the insurer furnishing certain other information to the Authority within 45 days after becoming aware of its failure or having reason to believe that such failure has occurred;

(c)each of AG Re and AGRO is prohibited from declaring or paying in any financial year dividends of more than 25% of its total statutory capital and surplus (as shown on its previous financial year's statutory balance sheet) unless it files (at least seven days before payments of such dividends) with the Authority an affidavit signed by at least two directors (one of whom must be a Bermuda resident director if any of the insurer's directors are resident in Bermuda) and the principal representative stating that it will continue to meet its solvency margin and minimum liquidity ratio. Where such an affidavit is filed, it shall be available for public inspection at the offices of the Authority; and

(d)as a Class C long-term insurer, AGRO may not declare or pay a dividend to any person other than a policyholder unless the value of the assets of its long-term business fund, as certified by AGRO's approved actuary, exceeds the extent (as so certified) of the liabilities of AGRO's long-term business, and the amount of any such dividend shall not exceed the aggregate of (1) that excess; and (2) any other funds properly available for the payment of dividends being funds arising out of AGRO's business other than its long-term business.


The Companies Act also limits the declaration and payment of dividends and other distributions by Bermuda companies such as AGL and its Bermuda subsidiaries (including AG Re and AGRO). Such companies may only declare and pay a dividend or make a distribution out of contributed surplus (as understood under the Companies Act) if there are reasonable grounds for believing that the company is and after the payment will be able to meet and pay its liabilities as they become due and the realizable value of the company's assets will not be less than its liabilities. The Companies Act also regulates and restricts the reduction and return of capital and paid in share premium, including the repurchase of shares.

Based on the limitations above, in 2017 AG Re has the capacity to (i) make capital distributions in an aggregate amount up to $128 million without the prior approval of the Authority and (ii) declare and pay dividends in an aggregate amount up to the limit of its outstanding statutory surplus, which is $314 million. Such dividend capacity may be further limited by the actual amount of AG Re’s unencumbered assets, which amount changes from time to time due in part to collateral posting requirements. As of December 31, 2016, AG Re had unencumbered assets of approximately $596 million. AG Re declared and paid dividends of $100 million, $150 million and $82 million during 2016, 2015 and 2014, respectively, to AGL. The Company does not expect AGRO to declare or pay any dividends or other distributions at this time.
Minimum Liquidity Ratio

The Insurance Act provides a minimum liquidity ratio for general business. An insurer engaged in general business is required to maintain the value of its relevant assets at not less than 75% of the amount of its relevant liabilities. Relevant assets include cash and time deposits, quoted investments, unquoted bonds and debentures, first liens on real estate, investment income due and accrued, accounts and premiums receivable, reinsurance balances receivable, funds held by ceding reinsurers and any other assets which the Authority on application in any particular case made to it with reasons, accepts in that case. There are certain categories of assets which, unless specifically permitted by the Authority, do not automatically qualify as relevant assets, such as unquoted equity securities, investments in and advances to affiliates and real estate and collateral loans.

The relevant liabilities are total general business insurance reserves and total other liabilities less deferred income tax and sundry liabilities (by interpretation, those not specifically defined) and letters of credit, corporate guarantees and other instruments.

Insurance Code of Conduct

Each of AG Re and AGRO is subject to regulatory feesthe Insurance Code of Conduct, which establishes duties, standards, procedures and levies basedsound business principles which must be complied with to ensure sound corporate governance, risk management and internal controls are implemented by all insurers registered under the Insurance Act. The Authority will assess an insurer's compliance with the Code of Conduct in a proportionate manner relative to the nature, scale and complexity of its business. Failure to comply with the requirements under the Insurance Code of Conduct will be a factor taken into account by the Authority in determining whether an insurer is conducting its business in a sound and prudent manner as prescribed by the Insurance Act. Such failure to comply with the requirements of the Insurance Code of Conduct could result in the Authority exercising its powers of intervention and investigation and will be a factor in calculating the operational risk charge applicable in accordance with the insurer's BSCR model or approved internal model.

Certain Other Bermuda Law Considerations

Although AGL is incorporated in Bermuda, it is classified as a non-resident of Bermuda for exchange control purposes by the Authority. Pursuant to its non-resident status, AGL may engage in transactions in currencies other than Bermuda dollars and there are no restrictions on its gross premium incomeability to transfer funds (other than funds denominated in Bermuda dollars) in and gross technical liabilities. These feesout of Bermuda or to pay dividends to U.S. residents who are collectedholders of its common shares.

Under Bermuda law, "exempted" companies are companies formed for the purpose of conducting business outside Bermuda from a principal place of business in Bermuda. As an "exempted" company, AGL (as well as each of AG Re and AGRO) may not, without the express authorization of the Bermuda legislature or under a license or consent granted by the Minister of Finance (the Minister), participate in certain business and other transactions, including: (1) the acquisition or holding of land in Bermuda (except that held by way of lease or tenancy agreement which is required for its business and held for a term not exceeding 50 years, or which is used to provide accommodation or recreational facilities for its officers and employees and held with the consent of the Minister, for a term not exceeding 21 years), (2) the taking of mortgages on land in Bermuda to secure a principal amount in excess of $50,000 unless the Minister consents to a higher amount, and (3) the carrying on of business of any kind or type for which it is not duly licensed in Bermuda, except in certain limited circumstances, such as doing business with another exempted undertaking in furtherance of AGL's business carried on outside Bermuda.

The Bermuda government actively encourages foreign investment in "exempted" entities like AGL that are based in Bermuda, but which do not operate in competition with local businesses. AGL is not currently subject to taxes computed on profits or income or computed on any capital asset, gain or appreciation. Bermuda companies pay, as applicable, annual government fees, business fees, payroll tax and other taxes and duties. See "—Tax Matters—Taxation of AGL and Subsidiaries—Bermuda."

Special considerations apply to the Company's Bermuda operations. Under Bermuda law, non-Bermudians, other than spouses of Bermudians and individuals holding permanent resident certificates or working resident certificates, are not permitted to engage in any gainful occupation in Bermuda without a work permit issued by the Bermuda government. A work permit is only granted or extended if the employer can show that, after a proper public advertisement, no Bermudian, spouse of a Bermudian or individual holding a permanent resident certificate or working resident certificate is available who meets the minimum standards for the position. A waiver from advertising is automatically granted in respect of any chief executive officer position and other chief officer positions. The employer can also make a request for a waiver from the requirement to advertise in certain other cases, as expressed in the Bermuda government's work permit policies. Currently, all of the Company's Bermuda based professional employees who require work permits have been granted work permits by the Bermuda government.

United Kingdom

This section concerns AGE and its affiliates Assured Guaranty (U.K.) Ltd. (AGUK), Assured Guaranty (London) Ltd. (AGLN) and Assured Guaranty Finance Overseas Ltd (AGFOL), each of which is regulated in the U.K., as well as Assured Guaranty Credit Protection Ltd. (AGCPL), which is an authorized representative of AGE. AGE, AGUK and AGLN are regulated by the PRA as insurers. AGUK has been placed into runoff.AGLN (formerly MBIA UK Insurance Limited and renamed on January 13, 2017) was acquired as an authorized insurer in run-off by AGC on January 10, 2017. The Company is actively working to combine AGE, AGUK, AGLN and its affiliate CIFG Europe S.A. (CIFGE). Any such combination will be subject to regulatory and court approvals. As a result, the Company cannot predict when, or if, such combination will be completed.

General

Each of AGE, AGUK, AGLN and AGFOL are subject to the U.K.'s Financial Services and Markets Act 2000 (FSMA), which covers financial services relating to deposits, insurance, investments and certain other financial products.
Under FSMA, effecting or carrying out contracts of insurance by way of business in the U.K. each constitutes a “regulated activity” requiring authorization by the appropriate regulator. An authorized insurance company must have permission for each class of insurance business it intends to write.
Insurance companies in the U.K. are authorized and regulated by the PRA and the Financial Conduct Authority (FCA). The PRA and the FCA (thoughwere established on April 1, 2013 and are the main regulatory authorities responsible for financial regulation in the U.K. These two regulatory bodies cover the following areas:
the PRA, a part of the Bank of England, is responsible for prudential regulation of key systemically important firms (which includes insurance companies, among others), and
the FCA is responsible for the conduct of business regulation of all firms and the regulation of market conduct and the prudential regulation of all non-PRA firms.
While the two regulators coordinate and cooperate in some areas, they relate to regulationhave separate and independent mandates and separate rule-making and enforcement powers. AGE, AGUK and AGLN are regulated by both the PRA and the FCA). FCA. AGFOL is regulated by the FCA.
The PRA also requires authorized firms, including authorized insurers, to participate in an investors' protection fund, known ascarries out the Financial Services Compensation Scheme. The Financial Services Compensation Scheme was established to compensate consumersprudential supervision of financial services firms,insurance companies through a variety of methods, including the buyerscollection of information from statistical returns, the review of accountants' reports and insurers' annual reports and disclosures, visits to insurance companies and regular formal interviews. The PRA takes a risk-based approach to the supervision of insurance companies.
The primary source of rules relating to the prudential supervision of AGE, AGUK and AGLN is the Solvency II Directive (Directive 2009/138/EC) as amended by the Omnibus II Directive (Directive 2014/51/EU) (together, Solvency II),

which came into force and effect on January 1, 2016. The PRA remains the prudential regulator for U.K. insurers such as AGE, AGUK and AGLN under Solvency II. Solvency II provides rules on capital adequacy, governance and risk management and regulatory reporting and public disclosure. It is intended to align capital requirements with the risk profile of each EEA insurance company and to ensure adequate diversification of an insurer's or reinsurer's exposures to any credit risks of its reinsurers. Each of AGE, AGUK and AGLN has calculated its minimum required capital according to the Solvency II criteria and is in compliance.
The PRA applies threshold conditions, which insurers must meet, and against failureswhich the PRA assesses them on a continuous basis. At a high level, these conditions are that:
an insurer's head office, and in particular its mind and management, must be in the financial services industry. Eligible claimants (identifiedU.K. if it is incorporated in the Compensation SourcebookU.K.;
an insurer's business must be conducted in a prudent manner — in particular, the insurer must maintain appropriate financial and non-financial resources;
the insurer must be fit and proper, and be appropriately staffed; and
the insurer and its group must be capable of being effectively supervised.
The PRA assesses, on an ongoing basis, whether insurers are acting in a manner consistent with safety and soundness and appropriate policyholder protection, and so whether they meet, and are likely to continue to meet, the threshold conditions. It weights its supervision towards those issues and those insurers that, in its judgment, pose the greatest risk to its objectives. It is forward-looking, assessing its objectives not just against current risks, but also against those that could plausibly arise further ahead and will rely significantly on judgments based on evidence and analysis. Its risk assessment framework looks at the potential impact of failure of the PRA Handbook) mayinsurer, its risk context and mitigating factors.
AGFOL’s Markets in Financial Instruments Directive (MiFID) activities are limited to receiving and transmitting orders and giving investment advice and it cannot hold client money. Accordingly, although it is subject to MiFID, AGFOL is exempt from the Capital Requirements Directive and Capital Requirements Regulations (CRD III and CRD IV), which are the EU regulations on capital for certain MiFID firms. AGFOL has therefore calculated its minimum required capital according to the FCA’s rules for non-CRD firms, and is in compliance.
The regulatory regime in the U.K. must be compensatedconsistent with relevant European Union (EU) legislation, which is either directly applicable in, or must be implemented into national law by, all EU member states. The key EU legislation that is relevant to AGE, AGUK and AGLN is Solvency II, which provides the framework for a new solvency and supervisory regime for insurers in the EEA. The key EU legislation that is relevant to AGFOL is MiFID, which harmonizes the regulatory regime for investment services and activities across the EEA and the Insurance Mediation Directive.
Position of U.K. Regulated Entities within the AGL Group
AGE is authorized by the Financial Services Compensation Scheme when an authorized insurer is unable, or likelyPRA to be unable, to satisfy policyholder claims. Generaleffect and carry out certain classes of general insurance, in classspecifically: classes 14 (credit) is not protected by the Financial Services Compensation Scheme, nor is reinsurance in any class; however, other direct insurance classes written by AGUK and AGE are covered (namely, classes, 15 (suretyship) and 16 (miscellaneous financial loss)) for eligible counterparties and professional clients only (i.e., not retail clients). This scope of permission is sufficient to enable AGE to effect and carry out financial guaranty insurance and reinsurance. The insurance and reinsurance businesses of AGE are subject to close supervision by the PRA. AGE also has permission to arrange and advise on transactions it guarantees, and to take deposits in the context of its insurance business.
Material Contracts

AGE’s New York affiliate, AGM, currently provides supportFollowing the Company's decision in 2010 to place AGUK into run-off, the Company has been utilizing AGE throughas the entity from which to write business in the EEA. It was agreed between management and AGE's then regulator, the Financial Services Authority (now the PRA), that any new business written by AGE would be guaranteed using a quota share and excess of loss reinsurance agreement (the “Reinsurance Agreement”) and a net worth maintenance agreement (the "Net Worth Agreement"). Such agreements replace and supersede the second amended and restated quota share and stop loss reinsurance agreement and the second amended and restated net worth maintenance agreement, respectively, previously in place between the parties. For transactions closed prior to 2011, AGE typically guaranteed all of the guaranteed obligations directly and AGM reinsured under the quota share cover of the Reinsurance Agreement approximately 92% of AGE's retention after cessions to other reinsurers. In 2011, AGE and AGM implemented a co-guaranteeco-insurance structure pursuant to which (i) AGE directly guarantees a portionwould co-insure municipal and infrastructure transactions with AGM, and structured finance transactions with AGC. AGE must obtain the approval of the guaranteed obligations in an amount equalPRA before it can guarantee any new structured finance transaction. AGE's financial guaranty for each transaction covers a proportionate share (expected to what would have been AGE's pro rata retention percentagebe approximately 3 to 10%) of the total exposure, and AGM or AGC, as the case may be, guarantees the remaining exposure under the quota sharetransaction (subject to compliance with EEA licensing requirements). AGM or AGC, as the case may be, will also provide a second-to-pay guaranty to cover (ii) AGM directly guaranteesAGE's financial guaranty.

AGE also is the balanceprincipal of AGCPL. AGCPL is not PRA or FCA authorized, but is an appointed representative of AGE. This means AGCPL can carry on insurance mediation activities without a license, because AGE has regulatory responsibility for it.
AGCPL is subject to the requirements of Regulation (EU) No 648/2012 of the guaranteed obligations,European Parliament and of the Council of July 4, 2012 on OTC derivatives, central counterparties and trade repositories (EMIR) which, as a European regulation, is directly applicable in all the member states of the EU. AGCPL is the only European entity within the AGL group which has entered into derivative contracts and as such it is the only entity in the group which is directly subject to EMIR. AGCPL has notified the European Securities and Markets Authority (ESMA) and the FCA of its status under EMIR as a non-financial counterparty which has exceeded the clearing threshold (an NFC+) as described in Article 10 of EMIR. AGCPL is subject to certain requirements under EMIR with respect to its portfolio of derivative contracts including: (i) the requirement to centrally clear standardized OTC derivatives (although AGCPL does not currently enter into such derivatives, and so this requirement is not currently relevant) (ii) an obligation to employ certain risk mitigation techniques relating to derivatives that cannot be centrally cleared; and (iii) a requirement to report derivative transactions to a trade depository.  The Company is aware that circumstances exist in which EMIR may apply directly to non-European entities when transacting derivatives, but has determined that these circumstances do not apply to the non-European entities in AGL’s group.
AGFOL, a subsidiary of AGL, is authorized by the FCA to carry out designated investment business activities (including insurance mediation) in that it may “advise on investments (except on pension transfers and pension opt outs)” relating to most investment instruments. In addition, it may arrange or bring about transactions in investments and make “arrangements with a view to transactions in investments.” In all cases, it may deal only with clients who are eligible counterparties or professional customers (i.e., not retail clients), or, when arranging in relation to insurance contracts, commercial customers. AGFOL is not authorized as an insurer and does not itself take risk in the transactions it arranges or places, and may not hold funds on behalf of its customers. AGFOL's permissions also allow it to introduce business to AGC and AGM, also provides a second-to-pay guarantee for AGE's portion of the guaranteed obligations. AGM's ability to provide such directso that AGFOL can arrange financial guaranties outside ofunderwritten by AGC and AGM.
Solvency II and Solvency Requirements
In the U.K. is uncertain. See "Passporting" above., Solvency II has been transposed into national law through changes to existing provisions in the FCA and the PRA’s respective handbooks and rulebook and through amendments to primary legislation. The Solvency II “Delegated Acts”, which set out more detailed rules underlying Solvency II have direct effect in all EEA member states, including the U.K. Among other things, Solvency II introduces a revised risk-based prudential regime which includes the following "Pillar 1" regulatory capital rules:

assets and liabilities are generally to be valued at their market value;
Under the excess of loss cover of the Reinsurance Agreement, AGM pays AGE quarterly the amount by which (i)of required economic capital is intended to ensure, with a probability of 99.5%, that regulated firms are able to meet their obligations to policyholders and beneficiaries over the sumfollowing 12 months; and
reinsurance recoveries will be treated as a separate asset (rather than being netted against the underlying insurance liabilities).
In many instances, Solvency II is expected to require insurers to maintain a somewhat increased amount of (a) AGE’s incurred losses calculated in accordance with UK GAAP as reported bycapital to satisfy the new solvency capital requirements. AGE in its financial returns filedand AGUK have agreed with the PRA and (b) AGE’s paid losses and loss adjustment expenses, in both cases netthat they will use the "Standard Formula" prescribed by Solvency II for calculation of all other performing reinsurance, including the reinsurance provided by the Company under the quota share covertheir capital requirements. AGLN is still using a bespoke internal model for calculation of the Reinsurance Agreement, exceeds (ii) an amount equal to (a) AGE’sits capital resources under U.K. law minus (b) the greatest of the amounts as may be requiredrequirements, which was approved by the PRA prior to the acquisition of AGLN (then MBIA UK Insurance Limited) by AGC.
In addition to new regulatory capital rules, Solvency II also contains a number of “Pillar 2” qualitative requirements, obliging firms to develop and embed systems to identify, measure and proactively manage the risks they are, or may be, exposed to. Among other things, firms must:
have in place an effective system of governance that provides for the sound and prudent management of its business;
establish effective risk-management systems; and
take a comprehensive approach to considering their risks through an Own Risk and Solvency Assessment (ORSA) as proportionate to the nature, scale and complexity of the risks inherent in their business.
“Pillar 3” reporting and disclosure requirements also exist, including a requirement to publish a public Solvency and Financial Condition Report (SFCR) and a private Regular Supervisory Report (RSR). For more information on reporting requirements and the ORSA, see “Reporting Requirements” below.

Solvency II contains a new regime for the supervision of groups, including groups in which the parent undertaking has its head office in a country that is outside the EEA. The treatment of such groups in part depends on whether the jurisdiction in which the non-EEA parent has its head office is determined to have a supervisory regime which is equivalent to the Solvency II regime. In the absence of such a determination, the Solvency II rules on supervision apply to the group on a worldwide basis, unless the PRA elects to apply “other methods” which ensure appropriate supervision. Both AGE and AGUK are subsidiaries of U.S. parent companies.
The PRA has issued a Direction to AGE and AGUK which confirms the “other methods” that the PRA will apply to ensure appropriate supervision. These include, among other things, requirements for AGE and AGUK to notify the PRA in advance of any material changes in their intra-group arrangements and any payments of dividends or capital extractions to a group undertaking outside the EEA. AGE and AGUK must also provide the PRA with certain other information, such as internal and external solvency, capital adequacy and risk assessment reports. The Direction applies from January 1, 2016 until January 1, 2019, unless it is revoked earlier or no longer applicable.
Restrictions on Dividend Payments
U.K. company law prohibits each of AGE, AGUK, AGLN and AGFOL from declaring a dividend to its shareholders unless it has “profits available for distribution.” The determination of whether a company has profits available for distribution is based on its accumulated realized profits less its accumulated realized losses. While the U.K. insurance regulatory laws impose no statutory restrictions on a general insurer's ability to declare a dividend, the PRA's capital requirements may in practice act as a conditionrestriction on dividends for AGE, AGUK and AGLN.
Reporting Requirements
U.K. insurance companies must prepare their financial statements under the Companies Act 2006, which requires the filing with Companies House of audited financial statements and related reports. In addition, as from January 1, 2016, the reporting requirements for U.K. insurance companies were modified by Solvency II. AGE, AGUK and AGLN are required to maintainproduce certain key reports including an annual SFCR, RSR and an ORSA, the latter as part of the so-called “Pillar 2” individual capital assessment requirements. Although the SFCR will take the place of a number of existing regulatory returns, Solvency II is likely to result in an overall increase in the quantity and quality of disclosures that firms make.
The PRA will review each firm’s ORSA and then consider whether in its view the firm needs to hold capital in excess of its Pillar 1 capital (see “Solvency II and Solvency Requirements” above) and, if so, will impose a “capital add-on”. The prescribed information to be contained in the ORSA, as well as the frequency with which the assessment must be carried out, is subject to guidance issued by the European Insurance and Occupational Pensions Authority (EIOPA) in September 2015 and a supervisory statement issued by the PRA in October 2015. The PRA has advised AGE, AGUK and AGLN that it is not imposing a capital add-on for those companies at this time. The PRA may determine to impose a capital add-on in relation to AGE, AGUK and AGLN in the future.
Supervision of Management
AGE, AGUK and AGLN are subject to the rules contained in the Senior Insurance Managers Regime (SIMR). This requires that individuals undertaking particular roles need to be registered with the PRA as undertaking a “Senior Insurance Manager Function”. This broadly includes individuals undertaking the executive functions and the oversight functions of each entity. Directors of those entities not serving in the roles specified in the SIMR will be required to become “approved persons” with the FCA (as detailed further in respect of AGFOL below).
In respect of AGFOL, individuals who perform one or more “controlled functions” such as significant influence functions (which includes all board members and other senior managers) or the customer function within authorized firms must be approved the FCA to carry out that function. Individuals performing these functions are “Approved Persons” for the purpose of Part V of FSMA and staff performing these specified “controlled functions” within an authorized firm must be approved by the FCA.

Change of Control
Under FSMA, when a person decides to acquire or increase “control” of a U.K. authorized firm (including an insurance company) they must give the PRA notice in writing before making the acquisition. The PRA has up to 60 working days (without including any period of interruption) in which to assess a change of control case. Any person (a company or individual) that directly or indirectly acquires 10% or 20% (depending on the type of firm, the “Control Percentage Threshold”) or more of the shares, or is entitled to exercise or control the exercise of the Control Percentage Threshold or more of the voting power, in a U.K. authorized firm or its parent undertaking is considered to “acquire control” of the authorized firm. Broadly speaking, the 10% threshold applies to banks, insurers and reinsurers (but not brokers) and MiFID investment firms, and the 20% threshold to insurance brokers and certain other firms that are non-directive firms.
Intervention and Enforcement
The PRA has extensive powers to intervene in the affairs of an authorized firm, culminating in the sanction of the suspension of authorization to carry on a financial guarantee business inregulated activity. The PRA can also vary or cancel a firm's permissions under its own initiative if it considers that the U.K. The Reinsurance Agreement permits AGEfirm is failing, or is likely to terminate the Reinsurance Agreement upon the following events: a downgrade of AGM’s ratings by Moody’s below Aa3 or by S&P below AA- if AGM fails to restore its rating(s) to the required level within a prescribed period of time; AGM's insolvency; failure by AGM to maintain the minimum capital required by its domiciliary jurisdiction; or AGM filing a petition in bankruptcy, going into liquidation or rehabilitation or having a receiver appointed.

The quota share and excess loss covers each exclude transactions guaranteed by AGE on or after July 1, 2009 that are not municipal, utility, project finance or infrastructure risks or similar types of risks.

The Reinsurance Agreement also contemplates the establishment of collateral by AGM to support AGM’s reinsurance obligations to AGE.  In December 2014,fail, to satisfy the PRA’s collateral requirements, AGMThreshold Conditions. FSMA gives the PRA significant investigation and AGE entered intoenforcement powers. It also gives the PRA a trust agreement pursuantrule-making power, under which it makes the various rules that constitute its Handbook of Rules.
The PRA also has the power to which AGM establishedprosecute criminal offenses arising under FSMA. The FCA has the power to prosecute offenses under FSMA and deposited assets into a reinsurance trust account for the benefit of AGE. AGM’s collateral requirement was measured during 2015, asto prosecute insider dealing under Part V of the endCriminal Justice Act of each calendar quarter,1993, and breaches by (i) usingauthorized firms of money laundering and terrorist financing regulations.
“Passporting”
EU directives allow AGE, AGUK, AGLN and AGFOL to conduct business in EU states other than the PRA’s FG Benchmark Model to calculate at the 99.5% confidence interval the losses expected to be borne collectively by AGE’s three affiliated reinsurers, AGM, AG Re and AGRO; (ii) deducting from such calculation AGE’s capital resources under such model;

32


and (iii) requiring AGM, AG Re and AGRO collectively to maintain collateral equal to fifty percent (50%) of such difference, i.e., the excess of AGM’s, AG Re’s and AGRO’s assumed modeled losses over AGE’s capital resources.  As of January 1, 2016, the FG Benchmark Model is no longer applicable and the PRA has agreed to allow AGM’s collateral requirement to be determined using AGE’s internal capital requirement model under the same formula described above. This change in the calculation of AGM's required collateral must be reflected in an amendment to the Reinsurance Agreement; such an amendment to a transaction between affiliates requires the approval of the NYDFS under the New York Insurance Law.

Pursuant to the current Net Worth Agreement, AGM is obligated to cause AGE to maintain capital resources equal to 110% of the greatest of the amounts as may be requiredU.K. where they are authorized by the PRA asor FCA under a condition for AGEsingle market directive. This right extends to maintain its authorizationthe EEA. A firm taking advantage of a right under a single market directive to carry on a financial guaranteeconduct business in the U.K., provided that AGM's contributions (a) do not exceed 35% of AGM's policyholders' surplusanother EEA state can rely on an accumulated basis as determined by the lawsits "home state" authorization. This ability to operate in other jurisdictions of the StateEEA on the basis of New York,home state authorization and (b) are in compliance with Section 1505 of the New York Insurance Law. AGM has never been required to make any contributions to AGE's capital under the current Net Worth Agreement or the prior net worth maintenance agreement. Subject to the approval of the NYDFS, AGE and AGM will amend the Net Worth Agreement to provide for use of the internal capital requirement model.

AGUK’s parent company, AGC, currently provides support to AGUK through an amended and restated quota share reinsurance agreement (the “Quota Share Agreement”), an amended and restated excess of loss reinsurance agreement (the “XOL Agreement”), and an amended and restated net worth maintenance agreement (the "AGUK Net Worth Agreement"). Pursuant to the Quota Share Agreement, AGUK cedes 90% of its financial guaranty insurance and reinsurance exposure to AGC. Pursuant to the XOL Agreement, AGC indemnifies AGUK for 100% of losses (net of the quota share reinsurance agreement discussed above) incurred by AGUK in excess of an amount equal to (a) AGUK’s capital resources less (b) 110% of the greatest of the amounts as may be required by the PRA as a condition for AGUK maintaining its authorization to carry on a financial guarantee business in the U.K. Pursuant to the AGUK Net Worth Agreement, if AGUK's net worth falls below 110% of the minimum level of capital required by the PRA, AGC must invest additional funds in order to bring the capital of AGUK back into compliance with the required amount.

AGC and AGUK recently reached an agreement with the PRA that, in order for AGC to secure its outstanding reinsurance of AGUK under the Quota Share Agreement and XOL Agreement, AGC shall post as collateral its share of AGUK-guaranteed triple-X insurance bonds that have been purchased by AGC for loss mitigation and an additional amount to be determined by (i) using AGUK’s internal capital requirement model to calculate at the 99.5% confidence interval the losses expected to be borne by AGC for the exposures it has assumed from AGUK that do not have loss reserves (“non-reserve exposures”); (ii) adding the amount of loss reserves ceded by AGUK to AGC under UK GAAP; (iii) subtracting from such sum AGUK’s capital resources under its internal capital requirement model (the result of clauses (i) through (iii) beingsupervision is sometimes referred to as “passporting.” Each of AGE, AGUK, AGLN and AGFOL is passported to conduct business in EEA states other than the “resulting amount”);U.K. Passporting is not applicable to firms not authorized in the EEA, such as AGM and then (iv) reducingAGC. Accordingly, the resultingco-insurance model described above cannot be “passported” throughout the EEA. Instead, it is a question of local law in each EEA member state as to whether AGM's or AGC’s participation in a co-insurance structure, protecting insureds or risks located in that jurisdiction, would amount by 50% of the portion of the resulting amount that was contributed by the non-reserve exposures. AGC and AGUK intend to enter into a trust agreement pursuant to which AGC will establish a reinsurance trust account for the benefit of AGUK and will deposit therein on a quarterly basis sufficient assets to satisfy the above-described collateral requirement recently agreed with the PRA. The new collateral requirement must be reflected in amendments to the Quota Share Agreement and XOL Agreement; such amendmentsconduct of insurance business in that jurisdiction. (See also “U.K. referendum vote to transactions between affiliates requireleave the approval of the MIA under the Maryland insurance law.EU” below.)
Tax Matters

Taxation of AGL and Subsidiaries

Bermuda

Under current Bermuda law, there is no Bermuda income, corporate or profits tax or withholding tax, capital gains tax or capital transfer tax payable by AGL or its Bermuda subsidiaries. AGL, AG Re and AGRO have each obtained from the Minister of Finance under the Exempted Undertakings Tax Protection Act 1966, as amended, an assurance that, in the event that Bermuda enacts legislation imposing tax computed on profits, income, any capital asset, gain or appreciation, or any tax in the nature of estate duty or inheritance, then the imposition of any such tax shall not be applicable to AGL, AG Re or AGRO or to any of their operations or their shares, debentures or other obligations, until March 31, 2035. This assurance is subject to the proviso that it is not to be construed so as to prevent the application of any tax or duty to such persons as are ordinarily resident in Bermuda, or to prevent the application of any tax payable in accordance with the provisions of the Land Tax Act 1967 or otherwise payable in relation to any land leased to AGL, AG Re or AGRO. AGL, AG Re and AGRO each pays annual Bermuda government fees, and AG Re and AGRO pay annual insurance license fees. In addition, all entities employing individuals in Bermuda are required to pay a payroll tax and there are other sundry taxes payable, directly or indirectly, to the Bermuda government.


33


United States

AGL has three operating insurance subsidiaries domiciled in the U.S., which the Company refers to collectively as the Assured Guaranty U.S. Subsidiaries.

AGM is a New York domiciled insurance company licensed to write financial guaranty insurance and reinsurance in 50 U.S. states, the District of Columbia, Guam, Puerto Rico and the U.S. Virgin Islands.

MAC is a New York domiciled insurance company licensed to write financial guaranty insurance and reinsurance in 50 U.S. states and the District of Columbia. MAC will only insure U.S. public finance debt obligations, focusing on investment grade bonds in select sectors of that market.

AGC is a Maryland domiciled insurance company licensed to write financial guaranty insurance and reinsurance in 50 U.S. states, the District of Columbia and Puerto Rico.
Insurance Holding Company Regulation

AGL and the Assured Guaranty U.S. Subsidiaries are subject to the insurance holding company laws of their jurisdiction of domicile, as well as other jurisdictions where these insurers are licensed to do insurance business. These laws

generally require each of the Assured Guaranty U.S. Subsidiaries to register with its respective domestic state insurance department and annually to furnish financial and other information about the operations of companies within their holding company system. Generally, all transactions among companies in the holding company system to which any of the Assured Guaranty U.S. Subsidiaries is a party (including sales, loans, reinsurance agreements and service agreements) must be fair and, if material or of a specified category, such as reinsurance or service agreements, require prior notice and approval or non-disapproval by the insurance department where the applicable subsidiary is domiciled.

Change of Control

Before a person can acquire control of a U.S. domestic insurance company, prior written approval must be obtained from the insurance commissioner of the state where the domestic insurer is domiciled. Generally, state statutes provide that control over a domestic insurer is presumed to exist if any person, directly or indirectly, owns, controls, holds with the power to vote, or holds proxies representing, 10% or more of the voting securities of the domestic insurer. Prior to granting approval of an application to acquire control of a domestic insurer, the state insurance commissioner will consider such factors as the financial strength of the applicant, the integrity and management of the applicant's board of directors and executive officers, the acquirer's plans for the management of the applicant's board of directors and executive officers, the acquirer's plans for the future operations of the domestic insurer and any anti-competitive results that may arise from the consummation of the acquisition of control. These laws may discourage potential acquisition proposals and may delay, deter or prevent a change of control involving AGL that some or all of AGL's stockholders might consider to be desirable, including in particular unsolicited transactions.

State Insurance Regulation

State insurance authorities have broad regulatory powers with respect to various aspects of the business of U.S. insurance companies, including licensing these companies to transact business, accreditation of reinsurers, admittance of assets to statutory surplus, regulating unfair trade and claims practices, establishing reserve requirements and solvency standards, regulating investments and dividends and, in certain instances, approving policy forms and related materials and approving premium rates. State insurance laws and regulations require the Assured Guaranty U.S. Subsidiaries to file financial statements with insurance departments everywhere they are licensed, authorized or accredited to conduct insurance business, and their operations are subject to examination by those departments at any time. The Assured Guaranty U.S. Subsidiaries prepare statutory financial statements in accordance with Statutory Accounting Practices, or SAP, and procedures prescribed or permitted by these departments. State insurance departments also conduct periodic examinations of the books and records, financial reporting, policy filings and market conduct of insurance companies domiciled in their states, generally once every three to five years. Market conduct examinations by regulators other than the domestic regulator are generally carried out in cooperation with the insurance departments of other states under guidelines promulgated by the National Association of Insurance Commissioners.

The New York State Department of Financial Services (the NYDFS), the regulatory authority of the domiciliary jurisdiction of AGM and MAC, conducts a periodic examination of insurance companies domiciled in New York, usually at five-year intervals. In 2012, the NYDFS commenced examinations of AGM and MAC in order for its examinations of these companies to coincide with the Maryland Insurance Administration (the MIA's) examination of AGC. In 2013, the NYDFS completed its examinations and issued Reports on Examination of AGM for the four-year period ending December 31, 2011 and MAC for the period September 26, 2008 through June 30, 2012. The reports did not note any significant regulatory issues concerning those companies.

The MIA, the regulatory authority of the domiciliary jurisdiction of AGC, conducts a periodic examination of insurance companies domiciled in Maryland every five years. In 2013, the MIA issued an Examination Report with respect to AGC for the five year period ending December 31, 2011; no significant regulatory issues were noted in such report.

Assured Guaranty has been notified that the NYDFS and MIA will formally commence an examination, respectively, of AGM and MAC, and AGC, in 2017 for the period covering the end of the last applicable examination period for each company through December 31, 2016.
State Dividend Limitations

New York.   One of the primary sources of cash for repurchases of shares and the payment of debt service and dividends by the Company is the receipt of dividends from AGM. Under the New York Insurance Law, AGM and MAC may only pay dividends out of "earned surplus," which is the portion of the company's surplus that represents the net earnings, gains or profits (after deduction of all losses) that have not been distributed to shareholders as dividends, transferred to stated capital

or capital surplus, or applied to other purposes permitted by law, but does not include unrealized appreciation of assets. AGM and MAC may each pay dividends without the prior approval of the New York Superintendent of Financial Services (New York Superintendent) that, together with all dividends declared or distributed by it during the preceding 12 months, do not exceed the lesser of 10% of its policyholders' surplus (as of its last annual or quarterly statement filed with the New York Superintendent) or 100% of its adjusted net investment income during that period. The maximum amount available during 2017 for AGM to pay dividends to its parent AGMH without regulatory approval is estimated to be approximately $232 million, of which approximately $81 million is available for distribution in the first quarter of 2017. AGM paid dividends of $247 million, $215 million and $160 million during 2016, 2015 and 2014, respectively, to AGMH. The maximum amount available during 2017 for MAC to distribute as dividends to its shareholders (AGM and AGC) without regulatory approval is estimated to be approximately $49 million; MAC currently intends to allocate the distribution of such amount quarterly in 2017. 

Maryland.    Another primary source of cash for the repurchases of shares and payment of debt service and dividends by the Company is the receipt of dividends from AGC. Under Maryland's insurance law, AGC may, with prior notice to the MIA, pay an ordinary dividend that, together with all dividends paid in the prior 12 months, does not exceed the lesser of 10% of its policyholders' surplus (as of the prior December 31) or 100% of its adjusted net investment income during that period. The maximum amount available during 2017 for AGC to pay ordinary dividends to its parent Assured Guaranty U.S. Holdings Inc. (AGUS) will be approximately $107 million, of which approximately $29 million is available for distribution in the first quarter of 2017. A dividend or distribution to a stockholder in excess of this limitation would constitute an "extraordinary dividend," which must be paid out of "earned surplus" and reported to, and approved by, the MIA prior to payment. "Earned surplus" is that portion of the company's surplus that represents the net earnings, gains or profits (after deduction of all losses) that have not been distributed to shareholders as dividends or transferred to stated capital or capital surplus, or applied to other purposes permitted by law, but does not include unrealized capital gains and appreciation of assets. AGC may not pay any dividend or make any distribution, including ordinary dividends, unless it notifies the MIA of the proposed payment within five business days following declaration and at least ten days before payment. The MIA may declare that such dividend not be paid if it finds that AGC's policyholders' surplus would be inadequate after payment of the dividend or the dividend could lead AGC to a hazardous financial condition. AGC paid dividends of $79 million, $90 million and $69 million during 2016, 2015 and 2014, respectively, to AGUS.

Contingency Reserves

Under the New York Insurance Law, each of AGM and MAC must establish a contingency reserve to protect policyholders. New York Insurance Law determines the calculation of the contingency reserve and the period of time over which it must be established and, subsequently, can be taken down.

Likewise, in accordance with Maryland insurance law and regulations, AGC also maintains a statutory contingency reserve for the protection of policyholders. Maryland insurance law determines the calculation of the contingency reserve and the period of time over which it must be established, and subsequently, can be taken down.
In both New York and Maryland, when considering the principal amount guaranteed, the insurer is permitted to take into account amounts that it has ceded to reinsurers. In addition, releases from the insurer's contingency reserve may be permitted under specified circumstances in the event that actual loss experience exceeds certain thresholds or if the reserve accumulated is deemed excessive in relation to the insurer's outstanding insured obligations.

From time to time, AGM and AGC have obtained the approval of their regulators to release contingency reserves based on losses or because the accumulated reserve is deemed excessive in relation to the insurer's outstanding insured obligations. In 2016, on the latter basis, AGM obtained the NYDFS's approval for a contingency reserve release of approximately $175 million and AGC obtained the MIA's approval for a contingency reserve release of approximately $152 million. In addition, MAC also released approximately $53 million of contingency reserves, which consisted of the assumed contingency reserves maintained by MAC, as reinsurer of AGM, in respect of the same obligations that were the subject of AGM's $175 million release.

Applicable Maryland and New York laws and regulations require regular, quarterly contributions to contingency reserves while they are being established, but such laws and regulations permit the discontinuation of such quarterly contributions to an insurer's contingency reserves when such insurer's aggregate contingency reserves for a particular line of business (i.e., municipal or non-municipal) exceed the sum of the insurer's outstanding principal for each specified category of obligations within the particular line of business multiplied by the specified contingency reserve factor for each such category.  In accordance with such laws and regulations, and with the approval of the MIA and the NYDFS, respectively, AGC ceased making quarterly contributions to its contingency reserves for both municipal and non-municipal business and AGM ceased making quarterly contributions to its contingency reserves for non-municipal business, in each case beginning in the fourth

quarter of 2014. Such cessations are expected to continue for as long as AGC and AGM satisfy the foregoing condition for their applicable line(s) of business.

In July 2013, AGM and AGC were notified that the NYDFS and MIA did not object to AGM, AGE and AGC reassuming all of the outstanding contingency reserves that they had ceded to AG Re and electing to cease ceding future contingency reserves to AG Re. The insurance regulators permitted AGM, AGE and AGC to reassume the contingency reserves in increments over three years. As of December 31, 2015, AGM, AGE and AGC had collectively reassumed an aggregate of approximately $522 million.

Financial guaranty insurers are also required to maintain a loss and loss adjustment expense (LAE) reserve (on a case-by-case basis) and unearned premium reserve.

Single and Aggregate Risk Limits

The New York Insurance Law and the Code of Maryland Regulations establish single risk limits for financial guaranty insurers applicable to all obligations issued by a single entity and backed by a single revenue source. For example, under the limit applicable to qualifying asset-backed securities, the lesser of:

the insured average annual debt service for a single risk, net of qualifying reinsurance and collateral, or

the insured unpaid principal (reduced by the extent to which the unpaid principal of the supporting assets exceeds the insured unpaid principal) divided by nine, net of qualifying reinsurance and collateral,

may not exceed 10% of the sum of the insurer's policyholders' surplus and contingency reserves, subject to certain conditions.

Under the limit applicable to municipal obligations, the insured average annual debt service for a single risk, net of qualifying reinsurance and collateral, may not exceed 10% of the sum of the insurer's policyholders' surplus and contingency reserves. In addition, insured principal of municipal obligations attributable to any single risk, net of qualifying reinsurance and collateral, is limited to 75% of the insurer's policyholders' surplus and contingency reserves. Single-risk limits are also specified for other categories of insured obligations, and generally are more restrictive than those listed for asset-backed or municipal obligations. Obligations not qualifying for an enhanced single-risk limit are generally subject to the "corporate" limit (applicable to insurance of unsecured corporate obligations) equal to 10% of the sum of the insurer's policyholders' surplus and contingency reserves. For example, "triple-X" and "future flow" securitizations, as well as unsecured investor-owned utility obligations, are generally subject to these "corporate" single-risk limits.

The New York Insurance Law and the Code of Maryland Regulations also establish aggregate risk limits on the basis of aggregate net liability insured as compared with statutory capital. "Aggregate net liability" is defined as outstanding principal and interest of guaranteed obligations insured, net of qualifying reinsurance and collateral. Under these limits, policyholders' surplus and contingency reserves must not be less than the sum of various percentages of aggregate net liability for various categories of specified obligations. The percentage varies from 0.33% for certain municipal obligations to 4% for certain non-investment-grade obligations. As of December 31, 2016, the aggregate net liability of each of AGM, MAC and AGC utilized approximately 23.7%, 27.6% and 10.7% of their respective policyholders' surplus and contingency reserves.

The New York Superintendent has broad discretion to order a financial guaranty insurer to cease new business originations if the insurer fails to comply with single or aggregate risk limits. In practice, the New York Superintendent has shown a willingness to work with insurers to address these concerns.

Group Regulation

In connection with AGL’s establishment of tax residence in the U.K., as discussed in greater detail under "Tax Matters" below, the NYDFS has assumed responsibility for regulation of the Assured Guaranty group. Group supervision by the NYDFS results in additional regulatory oversight over Assured Guaranty, and may subject Assured Guaranty to new regulatory requirements and constraints.


Investments

The Assured Guaranty U.S. Subsidiaries are subject to laws and regulations that require diversification of their investment portfolio and limit the amount of investments in certain asset categories, such as BIG fixed-maturity securities, equity real estate, other equity investments, and derivatives. Failure to comply with these laws and regulations would cause investments exceeding regulatory limitations to be treated as non-admitted assets for purposes of measuring surplus, and, in some instances, would require divestiture of such non-qualifying investments. The Company believes that the investments made by the Assured Guaranty U.S. Subsidiaries complied with such regulations as of December 31, 2016. In addition, any investment must be approved by the insurance company's board of directors or a committee thereof that is responsible for supervising or making such investment.

Operations of the Company's Non-U.S. Insurance Subsidiaries

In addition to the regulatory requirements imposed by the jurisdictions in which they are licensed, the business operations of the Company's reinsurance subsidiaries are affected by regulatory requirements in various states of the United States governing "credit for reinsurance", which are imposed on the ceding companies of the reinsurers. The Nonadmitted and Reinsurance Reform Act (NRRA) of the Dodd-Frank Wall Street Reform and Consumer Protection Act (the Dodd-Frank Act) streamlined the regulation of reinsurance by applying single state regulation for credit for reinsurance. Under the NRRA, credit for reinsurance determinations are controlled by the ceding company’s state of domicile and non-domiciliary states are prohibited from applying their reinsurance laws extraterritorially. In general, a ceding company which obtains reinsurance from a reinsurer that is licensed, accredited or approved by the ceding company's state of domicile is permitted to reflect in its statutory financial statements a credit in an aggregate amount equal to the ceding company's liability for unearned premiums (which are that portion of premiums written which applies to the unexpired portion of the policy period), loss and loss expense reserves ceded to the reinsurer. The great majority of states, however, permit a credit on the statutory financial statements of a ceding insurer for reinsurance obtained from a non-licensed or non-accredited reinsurer to the extent that the reinsurer secures its reinsurance obligations to the ceding insurer by providing a letter of credit, trust fund or other acceptable security arrangement. A few states do not allow credit for reinsurance ceded to non-licensed reinsurers except in certain limited circumstances and others impose additional requirements that make it difficult to become accredited. The Company's reinsurance subsidiaries AG Re and AGRO are not licensed, accredited or approved in any state and have established trusts to secure their reinsurance obligations.

U.S. Federal Regulation

The Company’s businesses are subject to direct and indirect regulation under U.S. federal law. In particular, the Company’s derivatives activities are directly and indirectly subject to a variety of regulatory requirements under the Dodd-Frank Act. Based on the size of its subsidiaries' remaining legacy derivatives portfolios, AGL does not believe any of its subsidiaries is required to register with the Commodity Futures Trading Commission (CFTC) as a “major swap participant” or with the SEC as a "major securities-based swap participant". Certain of the Company's subsidiaries may be subject to Dodd-Frank Act requirements to post margin or to clear on a regulated execution facility future swap transactions or with respect to certain amendments to legacy swap transactions, if they enter into such transactions.

Bermuda

AG Re and AGRO are each an insurance company currently registered and licensed under the Insurance Act 1978 of Bermuda, amendments thereto and related regulations (collectively, the Insurance Act). AG Re is registered and licensed as a Class 3B insurer and AGRO is registered and licensed as a Class 3A insurer and a Class C long-term insurer.

Bermuda Insurance Regulation

The Insurance Act imposes on insurance companies solvency and liquidity standards; restrictions on the declaration and payment of dividends and distributions; restrictions on the reduction of statutory capital; restrictions on the winding up of long-term insurers; and auditing and reporting requirements; and the need to have a principal representative and a principal office (as understood under the Insurance Act) in Bermuda. The Insurance Act grants to the Bermuda Monetary Authority (the Authority) the power to cancel insurance licenses, supervise, investigate and intervene in the affairs of insurance companies and in certain circumstances share information with foreign regulators. Class 3A and Class 3B insurers are authorized to carry on general insurance business (as understood under the Insurance Act), subject to conditions attached to the license and to compliance with minimum capital and surplus requirements, solvency margin, liquidity ratio and other requirements imposed by the Insurance Act. Class C long-term insurers are permitted to carry on long-term business (as understood under the

Insurance Act) subject to conditions attached to the license and to similar compliance requirements and the requirement to maintain its long-term business fund (a segregated fund).

Each of AG Re and AGRO is required annually to file statutorily mandated financial statements and returns, audited by an auditor approved by the Authority (no approved auditor of an insurer may have an interest in that insurer, other than as an insured, and no officer, servant or agent of an insurer shall be eligible for appointment as an insurer's approved auditor), together with an annual loss reserve opinion of the loss reserve specialist, who is approved by the Authority, and in respect of AGRO, the required actuary's certificate with respect to the long-term business. When each of AG Re and AGRO files its statutory financial statements, it is also required to deliver to the Authority a declaration of compliance, declaring whether or not the insurer has, with respect to the preceding financial year complied with all requirements of the minimum criteria applicable to it; complied with the minimum margin of solvency as at its financial year end; complied with the applicable enhanced capital requirements as at its financial year end; complied with the minimum liquidity ratio for general business as at its financial year end; and complied with applicable conditions, directions and restrictions imposed on, or approvals granted to the insurer. AG Re and AGRO are also required to file annual financial statements prepared in conformity with accounting principles generally accepted in the United States of America (GAAP), which must be available to the public.

In addition, AG Re and AGRO are required to file a capital and solvency return that includes its Bermuda Solvency Capital Requirement (BSCR) model (or an approved internal capital model in lieu thereof), a schedule of fixed income investments by BSCR rating, a schedule of funds held by ceding reinsurers in segregated accounts/trusts by BSCR rating, a schedule of net reserves for losses and loss expense provisions by line of business, a schedule of premiums written by line of business, a schedule of geographic diversification of net premiums written by line of business, a schedule of risk management, a schedule of fixed income securities, a schedule of commercial insurer's solvency self-assessment (CISSA), a schedule of catastrophe risk return, a schedule of loss triangles or reconciliation of net loss reserves, a schedule of eligible capital, a statutory economic balance sheet, the loss reserve specialist's opinion, a schedule of regulated non-insurance financial operating entities and a schedule of solvency. AGRO’s capital and solvency return must also include, among other details, a schedule of long-term premiums written by line of business, a schedule of long-term business data, a schedule of long-term variable annuity guarantees data and reconciliation, a schedule of long-term variable annuity guarantees - internal capital model and the approved actuary’s opinion.

Each of AG Re and AGRO are also required to prepare and file with the Authority, and publish on its website, a financial condition report. The Authority has discretion to approve modifications and exemptions to the public disclosure rules, on application by the insurer if, among other things, the Authority is satisfied that the disclosure of certain information will result in a competitive disadvantage or compromise confidentiality obligations of the insurer.
Finally, AG Re is required to file with the Authority, on a quarterly basis, financial returns consisting of (i) quarterly unaudited financial statements for each financial quarter (which must minimally include a balance sheet and income statement and must also be recent and not reflect a financial position that exceeds two months), and (ii) a list and details of material intra‑group transactions and risk concentrations that have materialized since the most recent quarterly or annual financial returns, which would also include, among other things, details surrounding all intra group reinsurance and retrocession arrangements and other intra group risk transfer insurance business arrangements that have materialized since the most recent quarterly or annual financial returns and (iii) details of the ten largest exposures to unaffiliated counterparties and any other counterparty exposures exceeding 10% of the insurer’s statutory capital and surplus.
Shareholder Controllers

Pursuant to provisions in the Insurance Act, any person who becomes a holder of 10% or more, 20% or more, 33% or more or 50% or more of the Company's common shares must notify the Authority in writing within 45 days of becoming such a holder. The Authority has the power to object to such a person if it appears to the Authority that the person is not fit and proper to be such a holder. In such a case, the Authority may require the holder to reduce their shareholding in the Company and may direct, among other things, that the voting rights attached to their common shares are not exercisable. A person that does not comply with such a notice or direction from the Authority will be guilty of an offense.

Notification of Material Changes

All registered insurers are required to give notice to the Authority of their intention to effect a material change within the meaning of the Insurance Act. For the purposes of the Insurance Act, the following changes are material: (i) the transfer or acquisition of insurance business being part of a scheme falling within, or any transaction relating to a scheme of arrangement under section 25 of the Insurance Act or section 99 of the Companies Act 1981 of Bermuda (the Companies Act), (ii) the

amalgamation or merger with or acquisition of another firm, (iii)  engaging in unrelated business that is retail business, (iv) the acquisition of a controlling interest in an undertaking that is engaged in non-insurance business which offers services or products to non-affiliated persons, (v) outsourcing all or substantially all of the functions of actuarial, risk management, compliance and internal audit functions, (vi) outsourcing all or a material part of an insurer's underwriting activity, (vii) transferring other than by way of reinsurance all or substantially all of a line of business (viii) expanding into a material new line of business, (ix) the sale of an insurer, and (x) outsourcing an officer role (in this context meaning a chief executive or senior executive performing the roles of underwriting, actuarial, risk management, compliance, internal audit, finance or investment matters).

Registered insurers are not permitted to take any steps to give effect to a material change listed above unless it has first served notice on the Authority that it intends to effect such material change and, before the end of 30 days, either the Authority has notified such company in writing that it has no objection to such change or that period has lapsed without the Authority having issued a notice of objection. A person who fails to give the required notice or who effects a material change, or allows such material change to be effected, before the prescribed period has elapsed or after having received a notice of objection is guilty of an offence.

Minimum Solvency Margin and Enhanced Capital Requirements

Under the Insurance Act, AG Re and AGRO must each ensure that the value of its general business statutory assets exceeds the amount of its general business statutory liabilities by an amount greater than the prescribed minimum solvency margin and each company's applicable enhanced capital requirement.

The minimum solvency margin for Class 3A and Class 3B insurers is the greater of (i) $1 million, or (ii) 20% of the first $6 million of net premiums written; if in excess of $6 million, the figure is $1.2 million plus 15% of net premiums written in excess of $6 million, or (iii) 15% of net discounted aggregate loss and loss expense provisions and other insurance reserves, or (iv) 25% of that insurer's applicable enhanced capital requirement reported at the end of its relevant year.

In addition, as a Class C long-term insurer, AGRO is required, with respect to its long-term business, to maintain a minimum solvency margin equal to the greater of (i) $500,000, (ii) 1.5% of its assets or (iii) 25% its enhanced captial requirement reported at the end of the relevant year. For the purpose of this calculation, assets are defined as the total assets pertaining to its long-term business reported on the balance sheet in the relevant year less the amounts held in a segregated account. AGRO is also required to keep its accounts in respect of its long-term business separate from any accounts kept in respect of any other business and all receipts of its long-term business form part of its long-term business fund.

Each of AG Re and AGRO is required to maintain available statutory capital and surplus at a level equal to or in excess of its applicable enhanced capital requirement, which is established by reference to either its BSCR model or an approved internal capital model. The BSCR model is a risk-based capital model which provides a method for determining an insurer's capital requirements (statutory economic capital and surplus) by taking into account the risk characteristics of different aspects of the insurer's business. The BSCR formula establishes capital requirements for ten categories of risk: fixed income investment risk, equity investment risk, interest rate/liquidity risk, currency risk, concentration risk, premium risk, reserve risk, credit risk, catastrophe risk and operational risk. For each category, the capital requirement is determined by applying factors to asset, premium, reserve, creditor, probable maximum loss and operation items, with higher factors applied to items with greater underlying risk and lower factors for less risky items.

While not specifically referred to in the Insurance Act, the Authority has also established a target capital level (TCL) for each insurer subject to an enhanced capital requirement equal to 120% of its enhanced capital requirement. While such an insurer is not currently required to maintain its statutory capital and surplus at this level, the TCL serves as an early warning tool for the Authority and failure to maintain statutory capital at least equal to the TCL will likely result in increased regulatory oversight.

For each insurer subject to an enhanced capital requirement, there is a three-tiered capital system designed to assess the quality of capital resources that a company has available to meet its capital requirements. Under this system, all of an insurer's capital instruments will be classified as either basic or ancillary capital which in turn will be classified into one of three tiers based on their “loss absorbency” characteristics. Highest quality capital is classified as Tier 1 Capital; lesser quality capital is classified as either Tier 2 Capital or Tier 3 Capital. Under this regime, up to certain specified percentages of Tier 1, Tier 2 and Tier 3 Capital (determined by registration classification) may be used to support the company's minimum solvency margin, enhanced capital requirement and TCL.


Restrictions on Dividends and Distributions

The Insurance Act limits the declaration and payment of dividends and other distributions by AG Re and AGRO.
Under the Insurance Act:

The minimum share capital must be always issued and outstanding and cannot be reduced. For AG Re, which is registered as a Class 3B insurer, the minimum share capital is $120,000. For AGRO, which is registered both as a Class 3A and a Class C long-term insurer, the minimum share capital is $370,000.

With respect to the distribution (including repurchase of shares) of any share capital, contributed surplus or other statutory capital:

(a)any such distribution that would reduce AG Re's or AGRO's total statutory capital by 15% or more of their respective total statutory capital as set out in their previous year's financial statements requires the prior approval of the Authority. Any application for such approval must include an affidavit stating that the company will continue to meet the required margins and such other information as the Authority may require; and

(b)as a Class C long-term insurer, AGRO may not use the funds allocated to its long-term business fund, directly or indirectly, for any purpose other than a purpose of its long-term business except in so far as such payment can be made out of any surplus certified by AGRO's approved actuary to be available for distribution otherwise than to policyholders;

With respect to the declaration and payment of dividends:

(a)each of AG Re and AGRO is prohibited from declaring or paying any dividends during any financial year if it is in breach of its solvency margin, minimum liquidity ratio or enhanced capital requirement, or if the declaration or payment of such dividends would cause such a breach (if it has failed to meet its minimum solvency margin or minimum liquidity ratio on the last day of any financial year, the insurer will be prohibited, without the approval of the Authority, from declaring or paying any dividends during the next financial year). Dividends, are paid out of each insurer's statutory surplus and, therefore, dividends cannot exceed such surplus. See "—Minimum Solvency Margin and Enhanced Capital Requirements" above and "—Minimum Liquidity Ratio" below;

(b)an insurer which at any time fails to meet its minimum solvency margin or comply with the enhanced capital requirement may not declare or pay any dividend until the failure is rectified, and also in such circumstances the insurer must report, within 14 days after becoming aware of its failure or having reason to believe that such failure has occurred, to the Authority in writing giving particulars of the circumstances leading to the failure and giving a plan detailing the manner, specific actions to be taken and time frame in which the insurer intends to rectify the failure. A failure to comply with the enhanced capital requirement will also result in the insurer furnishing certain other information to the Authority within 45 days after becoming aware of its failure or having reason to believe that such failure has occurred;

(c)each of AG Re and AGRO is prohibited from declaring or paying in any financial year dividends of more than 25% of its total statutory capital and surplus (as shown on its previous financial year's statutory balance sheet) unless it files (at least seven days before payments of such dividends) with the Authority an affidavit signed by at least two directors (one of whom must be a Bermuda resident director if any of the insurer's directors are resident in Bermuda) and the principal representative stating that it will continue to meet its solvency margin and minimum liquidity ratio. Where such an affidavit is filed, it shall be available for public inspection at the offices of the Authority; and

(d)as a Class C long-term insurer, AGRO may not declare or pay a dividend to any person other than a policyholder unless the value of the assets of its long-term business fund, as certified by AGRO's approved actuary, exceeds the extent (as so certified) of the liabilities of AGRO's long-term business, and the amount of any such dividend shall not exceed the aggregate of (1) that excess; and (2) any other funds properly available for the payment of dividends being funds arising out of AGRO's business other than its long-term business.


The Companies Act also limits the declaration and payment of dividends and other distributions by Bermuda companies such as AGL and its Bermuda subsidiaries (including AG Re and AGRO). Such companies may only declare and pay a dividend or make a distribution out of contributed surplus (as understood under the Companies Act) if there are reasonable grounds for believing that the company is and after the payment will be able to meet and pay its liabilities as they become due and the realizable value of the company's assets will not be less than its liabilities. The Companies Act also regulates and restricts the reduction and return of capital and paid in share premium, including the repurchase of shares.

Based on the limitations above, in 2017 AG Re has the capacity to (i) make capital distributions in an aggregate amount up to $128 million without the prior approval of the Authority and (ii) declare and pay dividends in an aggregate amount up to the limit of its outstanding statutory surplus, which is $314 million. Such dividend capacity may be further limited by the actual amount of AG Re’s unencumbered assets, which amount changes from time to time due in part to collateral posting requirements. As of December 31, 2016, AG Re had unencumbered assets of approximately $596 million. AG Re declared and paid dividends of $100 million, $150 million and $82 million during 2016, 2015 and 2014, respectively, to AGL. The Company does not expect AGRO to declare or pay any dividends or other distributions at this time.
Minimum Liquidity Ratio

The Insurance Act provides a minimum liquidity ratio for general business. An insurer engaged in general business is required to maintain the value of its relevant assets at not less than 75% of the amount of its relevant liabilities. Relevant assets include cash and time deposits, quoted investments, unquoted bonds and debentures, first liens on real estate, investment income due and accrued, accounts and premiums receivable, reinsurance balances receivable, funds held by ceding reinsurers and any other assets which the Authority on application in any particular case made to it with reasons, accepts in that case. There are certain categories of assets which, unless specifically permitted by the Authority, do not automatically qualify as relevant assets, such as unquoted equity securities, investments in and advances to affiliates and real estate and collateral loans.

The relevant liabilities are total general business insurance reserves and total other liabilities less deferred income tax and sundry liabilities (by interpretation, those not specifically defined) and letters of credit, corporate guarantees and other instruments.

Insurance Code of Conduct

Each of AG Re and AGRO is subject to the Insurance Code of Conduct, which establishes duties, standards, procedures and sound business principles which must be complied with to ensure sound corporate governance, risk management and internal controls are implemented by all insurers registered under the Insurance Act. The Authority will assess an insurer's compliance with the Code of Conduct in a proportionate manner relative to the nature, scale and complexity of its business. Failure to comply with the requirements under the Insurance Code of Conduct will be a factor taken into account by the Authority in determining whether an insurer is conducting its business in a sound and prudent manner as prescribed by the Insurance Act. Such failure to comply with the requirements of the Insurance Code of Conduct could result in the Authority exercising its powers of intervention and investigation and will be a factor in calculating the operational risk charge applicable in accordance with the insurer's BSCR model or approved internal model.

Certain Other Bermuda Law Considerations

Although AGL is incorporated in Bermuda, it is classified as a non-resident of Bermuda for exchange control purposes by the Authority. Pursuant to its non-resident status, AGL may engage in transactions in currencies other than Bermuda dollars and there are no restrictions on its ability to transfer funds (other than funds denominated in Bermuda dollars) in and out of Bermuda or to pay dividends to U.S. residents who are holders of its common shares.

Under Bermuda law, "exempted" companies are companies formed for the purpose of conducting business outside Bermuda from a principal place of business in Bermuda. As an "exempted" company, AGL (as well as each of AG Re and AGRO) may not, without the express authorization of the Bermuda legislature or under a license or consent granted by the Minister of Finance (the Minister), participate in certain business and other transactions, including: (1) the acquisition or holding of land in Bermuda (except that held by way of lease or tenancy agreement which is required for its business and held for a term not exceeding 50 years, or which is used to provide accommodation or recreational facilities for its officers and employees and held with the consent of the Minister, for a term not exceeding 21 years), (2) the taking of mortgages on land in Bermuda to secure a principal amount in excess of $50,000 unless the Minister consents to a higher amount, and (3) the carrying on of business of any kind or type for which it is not duly licensed in Bermuda, except in certain limited circumstances, such as doing business with another exempted undertaking in furtherance of AGL's business carried on outside Bermuda.

The Bermuda government actively encourages foreign investment in "exempted" entities like AGL that are based in Bermuda, but which do not operate in competition with local businesses. AGL is not currently subject to taxes computed on profits or income or computed on any capital asset, gain or appreciation. Bermuda companies pay, as applicable, annual government fees, business fees, payroll tax and other taxes and duties. See "—Tax Matters—Taxation of AGL and Subsidiaries—Bermuda."

Special considerations apply to the Company's Bermuda operations. Under Bermuda law, non-Bermudians, other than spouses of Bermudians and individuals holding permanent resident certificates or working resident certificates, are not permitted to engage in any gainful occupation in Bermuda without a work permit issued by the Bermuda government. A work permit is only granted or extended if the employer can show that, after a proper public advertisement, no Bermudian, spouse of a Bermudian or individual holding a permanent resident certificate or working resident certificate is available who meets the minimum standards for the position. A waiver from advertising is automatically granted in respect of any chief executive officer position and other chief officer positions. The employer can also make a request for a waiver from the requirement to advertise in certain other cases, as expressed in the Bermuda government's work permit policies. Currently, all of the Company's Bermuda based professional employees who require work permits have been granted work permits by the Bermuda government.

United Kingdom

This section concerns AGE and its affiliates Assured Guaranty (U.K.) Ltd. (AGUK), Assured Guaranty (London) Ltd. (AGLN) and Assured Guaranty Finance Overseas Ltd (AGFOL), each of which is regulated in the U.K., as well as Assured Guaranty Credit Protection Ltd. (AGCPL), which is an authorized representative of AGE. AGE, AGUK and AGLN are regulated by the PRA as insurers. AGUK has been placed into runoff.AGLN (formerly MBIA UK Insurance Limited and renamed on January 13, 2017) was acquired as an authorized insurer in run-off by AGC on January 10, 2017. The Company is actively working to combine AGE, AGUK, AGLN and its affiliate CIFG Europe S.A. (CIFGE). Any such combination will be subject to regulatory and court approvals. As a result, the Company cannot predict when, or if, such combination will be completed.

General

Each of AGE, AGUK, AGLN and AGFOL are subject to the U.K.'s Financial Services and Markets Act 2000 (FSMA), which covers financial services relating to deposits, insurance, investments and certain other financial products.
Under FSMA, effecting or carrying out contracts of insurance by way of business in the U.K. each constitutes a “regulated activity” requiring authorization by the appropriate regulator. An authorized insurance company must have permission for each class of insurance business it intends to write.
Insurance companies in the U.K. are authorized and regulated by the PRA and the Financial Conduct Authority (FCA). The PRA and the FCA were established on April 1, 2013 and are the main regulatory authorities responsible for financial regulation in the U.K. These two regulatory bodies cover the following areas:
the PRA, a part of the Bank of England, is responsible for prudential regulation of key systemically important firms (which includes insurance companies, among others), and
the FCA is responsible for the conduct of business regulation of all firms and the regulation of market conduct and the prudential regulation of all non-PRA firms.
While the two regulators coordinate and cooperate in some areas, they have separate and independent mandates and separate rule-making and enforcement powers. AGE, AGUK and AGLN are regulated by both the PRA and the FCA. AGFOL is regulated by the FCA.
The PRA carries out the prudential supervision of insurance companies through a variety of methods, including the collection of information from statistical returns, the review of accountants' reports and insurers' annual reports and disclosures, visits to insurance companies and regular formal interviews. The PRA takes a risk-based approach to the supervision of insurance companies.
The primary source of rules relating to the prudential supervision of AGE, AGUK and AGLN is the Solvency II Directive (Directive 2009/138/EC) as amended by the Omnibus II Directive (Directive 2014/51/EU) (together, Solvency II),

which came into force and effect on January 1, 2016. The PRA remains the prudential regulator for U.K. insurers such as AGE, AGUK and AGLN under Solvency II. Solvency II provides rules on capital adequacy, governance and risk management and regulatory reporting and public disclosure. It is intended to align capital requirements with the risk profile of each EEA insurance company and to ensure adequate diversification of an insurer's or reinsurer's exposures to any credit risks of its reinsurers. Each of AGE, AGUK and AGLN has calculated its minimum required capital according to the Solvency II criteria and is in compliance.
The PRA applies threshold conditions, which insurers must meet, and against which the PRA assesses them on a continuous basis. At a high level, these conditions are that:
an insurer's head office, and in particular its mind and management, must be in the U.K. if it is incorporated in the U.K.;
an insurer's business must be conducted in a prudent manner — in particular, the insurer must maintain appropriate financial and non-financial resources;
the insurer must be fit and proper, and be appropriately staffed; and
the insurer and its group must be capable of being effectively supervised.
The PRA assesses, on an ongoing basis, whether insurers are acting in a manner consistent with safety and soundness and appropriate policyholder protection, and so whether they meet, and are likely to continue to meet, the threshold conditions. It weights its supervision towards those issues and those insurers that, in its judgment, pose the greatest risk to its objectives. It is forward-looking, assessing its objectives not just against current risks, but also against those that could plausibly arise further ahead and will rely significantly on judgments based on evidence and analysis. Its risk assessment framework looks at the potential impact of failure of the insurer, its risk context and mitigating factors.
AGFOL’s Markets in Financial Instruments Directive (MiFID) activities are limited to receiving and transmitting orders and giving investment advice and it cannot hold client money. Accordingly, although it is subject to MiFID, AGFOL is exempt from the Capital Requirements Directive and Capital Requirements Regulations (CRD III and CRD IV), which are the EU regulations on capital for certain MiFID firms. AGFOL has therefore calculated its minimum required capital according to the FCA’s rules for non-CRD firms, and is in compliance.
The regulatory regime in the U.K. must be consistent with relevant European Union (EU) legislation, which is either directly applicable in, or must be implemented into national law by, all EU member states. The key EU legislation that is relevant to AGE, AGUK and AGLN is Solvency II, which provides the framework for a new solvency and supervisory regime for insurers in the EEA. The key EU legislation that is relevant to AGFOL is MiFID, which harmonizes the regulatory regime for investment services and activities across the EEA and the Insurance Mediation Directive.
Position of U.K. Regulated Entities within the AGL Group
AGE is authorized by the PRA to effect and carry out certain classes of general insurance, specifically: classes 14 (credit), 15 (suretyship) and 16 (miscellaneous financial loss) for eligible counterparties and professional clients only (i.e., not retail clients). This scope of permission is sufficient to enable AGE to effect and carry out financial guaranty insurance and reinsurance. The insurance and reinsurance businesses of AGE are subject to close supervision by the PRA. AGE also has permission to arrange and advise on transactions it guarantees, and to take deposits in the context of its insurance business.
Following the Company's decision in 2010 to place AGUK into run-off, the Company has been utilizing AGE as the entity from which to write business in the EEA. It was agreed between management and AGE's then regulator, the Financial Services Authority (now the PRA), that any new business written by AGE would be guaranteed using a co-insurance structure pursuant to which AGE would co-insure municipal and infrastructure transactions with AGM, and structured finance transactions with AGC. AGE must obtain the approval of the PRA before it can guarantee any new structured finance transaction. AGE's financial guaranty for each transaction covers a proportionate share (expected to be approximately 3 to 10%) of the total exposure, and AGM or AGC, as the case may be, guarantees the remaining exposure under the transaction (subject to compliance with EEA licensing requirements). AGM or AGC, as the case may be, will also provide a second-to-pay guaranty to cover AGE's financial guaranty.

AGE also is the principal of AGCPL. AGCPL is not PRA or FCA authorized, but is an appointed representative of AGE. This means AGCPL can carry on insurance mediation activities without a license, because AGE has regulatory responsibility for it.
AGCPL is subject to the requirements of Regulation (EU) No 648/2012 of the European Parliament and of the Council of July 4, 2012 on OTC derivatives, central counterparties and trade repositories (EMIR) which, as a European regulation, is directly applicable in all the member states of the EU. AGCPL is the only European entity within the AGL group which has entered into derivative contracts and as such it is the only entity in the group which is directly subject to EMIR. AGCPL has notified the European Securities and Markets Authority (ESMA) and the FCA of its status under EMIR as a non-financial counterparty which has exceeded the clearing threshold (an NFC+) as described in Article 10 of EMIR. AGCPL is subject to certain requirements under EMIR with respect to its portfolio of derivative contracts including: (i) the requirement to centrally clear standardized OTC derivatives (although AGCPL does not currently enter into such derivatives, and so this requirement is not currently relevant) (ii) an obligation to employ certain risk mitigation techniques relating to derivatives that cannot be centrally cleared; and (iii) a requirement to report derivative transactions to a trade depository.  The Company is aware that circumstances exist in which EMIR may apply directly to non-European entities when transacting derivatives, but has determined that these circumstances do not apply to the non-European entities in AGL’s group.
AGFOL, a subsidiary of AGL, is authorized by the FCA to carry out designated investment business activities (including insurance mediation) in that it may “advise on investments (except on pension transfers and pension opt outs)” relating to most investment instruments. In addition, it may arrange or bring about transactions in investments and make “arrangements with a view to transactions in investments.” In all cases, it may deal only with clients who are eligible counterparties or professional customers (i.e., not retail clients), or, when arranging in relation to insurance contracts, commercial customers. AGFOL is not authorized as an insurer and does not itself take risk in the transactions it arranges or places, and may not hold funds on behalf of its customers. AGFOL's permissions also allow it to introduce business to AGC and AGM, so that AGFOL can arrange financial guaranties underwritten by AGC and AGM.
Solvency II and Solvency Requirements
In the U.K., Solvency II has been transposed into national law through changes to existing provisions in the FCA and the PRA’s respective handbooks and rulebook and through amendments to primary legislation. The Solvency II “Delegated Acts”, which set out more detailed rules underlying Solvency II have direct effect in all EEA member states, including the U.K. Among other things, Solvency II introduces a revised risk-based prudential regime which includes the following "Pillar 1" regulatory capital rules:
assets and liabilities are generally to be valued at their market value;
the amount of required economic capital is intended to ensure, with a probability of 99.5%, that regulated firms are able to meet their obligations to policyholders and beneficiaries over the following 12 months; and
reinsurance recoveries will be treated as a separate asset (rather than being netted against the underlying insurance liabilities).
In many instances, Solvency II is expected to require insurers to maintain a somewhat increased amount of capital to satisfy the new solvency capital requirements. AGE and AGUK have agreed with the PRA that they will use the "Standard Formula" prescribed by Solvency II for calculation of their capital requirements. AGLN is still using a bespoke internal model for calculation of its capital requirements, which was approved by the PRA prior to the acquisition of AGLN (then MBIA UK Insurance Limited) by AGC.
In addition to new regulatory capital rules, Solvency II also contains a number of “Pillar 2” qualitative requirements, obliging firms to develop and embed systems to identify, measure and proactively manage the risks they are, or may be, exposed to. Among other things, firms must:
have in place an effective system of governance that provides for the sound and prudent management of its business;
establish effective risk-management systems; and
take a comprehensive approach to considering their risks through an Own Risk and Solvency Assessment (ORSA) as proportionate to the nature, scale and complexity of the risks inherent in their business.
“Pillar 3” reporting and disclosure requirements also exist, including a requirement to publish a public Solvency and Financial Condition Report (SFCR) and a private Regular Supervisory Report (RSR). For more information on reporting requirements and the ORSA, see “Reporting Requirements” below.

Solvency II contains a new regime for the supervision of groups, including groups in which the parent undertaking has its head office in a country that is outside the EEA. The treatment of such groups in part depends on whether the jurisdiction in which the non-EEA parent has its head office is determined to have a supervisory regime which is equivalent to the Solvency II regime. In the absence of such a determination, the Solvency II rules on supervision apply to the group on a worldwide basis, unless the PRA elects to apply “other methods” which ensure appropriate supervision. Both AGE and AGUK are subsidiaries of U.S. parent companies.
The PRA has issued a Direction to AGE and AGUK which confirms the “other methods” that the PRA will apply to ensure appropriate supervision. These include, among other things, requirements for AGE and AGUK to notify the PRA in advance of any material changes in their intra-group arrangements and any payments of dividends or capital extractions to a group undertaking outside the EEA. AGE and AGUK must also provide the PRA with certain other information, such as internal and external solvency, capital adequacy and risk assessment reports. The Direction applies from January 1, 2016 until January 1, 2019, unless it is revoked earlier or no longer applicable.
Restrictions on Dividend Payments
U.K. company law prohibits each of AGE, AGUK, AGLN and AGFOL from declaring a dividend to its shareholders unless it has “profits available for distribution.” The determination of whether a company has profits available for distribution is based on its accumulated realized profits less its accumulated realized losses. While the U.K. insurance regulatory laws impose no statutory restrictions on a general insurer's ability to declare a dividend, the PRA's capital requirements may in practice act as a restriction on dividends for AGE, AGUK and AGLN.
Reporting Requirements
U.K. insurance companies must prepare their financial statements under the Companies Act 2006, which requires the filing with Companies House of audited financial statements and related reports. In addition, as from January 1, 2016, the reporting requirements for U.K. insurance companies were modified by Solvency II. AGE, AGUK and AGLN are required to produce certain key reports including an annual SFCR, RSR and an ORSA, the latter as part of the so-called “Pillar 2” individual capital assessment requirements. Although the SFCR will take the place of a number of existing regulatory returns, Solvency II is likely to result in an overall increase in the quantity and quality of disclosures that firms make.
The PRA will review each firm’s ORSA and then consider whether in its view the firm needs to hold capital in excess of its Pillar 1 capital (see “Solvency II and Solvency Requirements” above) and, if so, will impose a “capital add-on”. The prescribed information to be contained in the ORSA, as well as the frequency with which the assessment must be carried out, is subject to guidance issued by the European Insurance and Occupational Pensions Authority (EIOPA) in September 2015 and a supervisory statement issued by the PRA in October 2015. The PRA has advised AGE, AGUK and AGLN that it is not imposing a capital add-on for those companies at this time. The PRA may determine to impose a capital add-on in relation to AGE, AGUK and AGLN in the future.
Supervision of Management
AGE, AGUK and AGLN are subject to the rules contained in the Senior Insurance Managers Regime (SIMR). This requires that individuals undertaking particular roles need to be registered with the PRA as undertaking a “Senior Insurance Manager Function”. This broadly includes individuals undertaking the executive functions and the oversight functions of each entity. Directors of those entities not serving in the roles specified in the SIMR will be required to become “approved persons” with the FCA (as detailed further in respect of AGFOL below).
In respect of AGFOL, individuals who perform one or more “controlled functions” such as significant influence functions (which includes all board members and other senior managers) or the customer function within authorized firms must be approved the FCA to carry out that function. Individuals performing these functions are “Approved Persons” for the purpose of Part V of FSMA and staff performing these specified “controlled functions” within an authorized firm must be approved by the FCA.

Change of Control
Under FSMA, when a person decides to acquire or increase “control” of a U.K. authorized firm (including an insurance company) they must give the PRA notice in writing before making the acquisition. The PRA has up to 60 working days (without including any period of interruption) in which to assess a change of control case. Any person (a company or individual) that directly or indirectly acquires 10% or 20% (depending on the type of firm, the “Control Percentage Threshold”) or more of the shares, or is entitled to exercise or control the exercise of the Control Percentage Threshold or more of the voting power, in a U.K. authorized firm or its parent undertaking is considered to “acquire control” of the authorized firm. Broadly speaking, the 10% threshold applies to banks, insurers and reinsurers (but not brokers) and MiFID investment firms, and the 20% threshold to insurance brokers and certain other firms that are non-directive firms.
Intervention and Enforcement
The PRA has extensive powers to intervene in the affairs of an authorized firm, culminating in the sanction of the suspension of authorization to carry on a regulated activity. The PRA can also vary or cancel a firm's permissions under its own initiative if it considers that the firm is failing, or is likely to fail, to satisfy the Threshold Conditions. FSMA gives the PRA significant investigation and enforcement powers. It also gives the PRA a rule-making power, under which it makes the various rules that constitute its Handbook of Rules.
The PRA also has the power to prosecute criminal offenses arising under FSMA. The FCA has the power to prosecute offenses under FSMA and to prosecute insider dealing under Part V of the Criminal Justice Act of 1993, and breaches by authorized firms of money laundering and terrorist financing regulations.
“Passporting”
EU directives allow AGE, AGUK, AGLN and AGFOL to conduct business in EU states other than the U.K. where they are authorized by the PRA or FCA under a single market directive. This right extends to the EEA. A firm taking advantage of a right under a single market directive to conduct business in another EEA state can rely on its "home state" authorization. This ability to operate in other jurisdictions of the EEA on the basis of home state authorization and supervision is sometimes referred to as “passporting.” Each of AGE, AGUK, AGLN and AGFOL is passported to conduct business in EEA states other than the U.K. Passporting is not applicable to firms not authorized in the EEA, such as AGM and AGC. Accordingly, the co-insurance model described above cannot be “passported” throughout the EEA. Instead, it is a question of local law in each EEA member state as to whether AGM's or AGC’s participation in a co-insurance structure, protecting insureds or risks located in that jurisdiction, would amount to the conduct of insurance business in that jurisdiction. (See also “U.K. referendum vote to leave the EU” below.)
Fees and Levies
Each of AGE, AGUK, AGLN and AGFOL is subject to regulatory fees and levies based on its gross premium income and gross technical liabilities. These fees are collected by the FCA (though they relate to regulation by both the PRA and the FCA). The PRA also requires authorized firms, including authorized insurers, to participate in an investors' protection fund, known as the Financial Services Compensation Scheme. The Financial Services Compensation Scheme was established to compensate consumers of financial services firms, including the buyers of insurance, against failures in the financial services industry. Eligible claimants (identified in the Compensation Sourcebook of the PRA Handbook) may be compensated by the Financial Services Compensation Scheme when an authorized insurer is unable, or likely to be unable, to satisfy policyholder claims. General insurance in class 14 (credit) is not protected by the Financial Services Compensation Scheme, nor is reinsurance in any class; however, other direct insurance classes written by AGUK and AGE are covered (namely, classes 15 (suretyship) and 16 (miscellaneous financial loss)).
Material Contracts

AGE’s New York affiliate, AGM, currently provides support to AGE, through a quota share and excess of loss reinsurance agreement (the Reinsurance Agreement) and a net worth maintenance agreement (the AGE Net Worth Agreement). For transactions closed prior to 2011, AGE typically guaranteed all of the guaranteed obligations directly and AGM reinsured under the quota share cover of the Reinsurance Agreement approximately 92% of AGE's retention after cessions to other reinsurers. In 2011, AGE and AGM implemented a co-guarantee structure pursuant to which (i) AGE directly guarantees a portion of the guaranteed obligations in an amount equal to what would have been AGE's pro rata retention percentage under the quota share cover, (ii) AGM directly guarantees the balance of the guaranteed obligations, and (iii) AGM also provides a

second-to-pay guarantee for AGE's portion of the guaranteed obligations. AGM's ability to provide such direct guaranties outside of the U.K. is uncertain. See "Passporting" above.

Under the excess of loss cover of the Reinsurance Agreement, AGM pays AGE quarterly the amount by which (i) the sum of (a) AGE’s incurred losses calculated in accordance with U.K. GAAP as reported by AGE in its financial returns filed with the PRA and (b) AGE’s paid losses and loss adjustment expenses (LAE), in both cases net of all other performing reinsurance, including the reinsurance provided by the Company under the quota share cover of the Reinsurance Agreement, exceeds (ii) an amount equal to (a) AGE’s capital resources under U.K. law minus (b) 110% of the greatest of the amounts as may be required by the PRA as a condition for AGE to maintain its authorization to carry on a financial guarantee business in the U.K. The Reinsurance Agreement permits AGE to terminate the Reinsurance Agreement upon the following events: a downgrade of AGM’s ratings by Moody’s below Aa3 or by S&P below AA- if AGM fails to restore its rating(s) to the required level within a prescribed period of time; AGM's insolvency; failure by AGM to maintain the minimum capital required by its domiciliary jurisdiction; or AGM filing a petition in bankruptcy, going into liquidation or rehabilitation or having a receiver appointed.

The quota share and excess loss covers each exclude transactions guaranteed by AGE on or after July 1, 2009 that are not municipal, utility, project finance or infrastructure risks or similar types of risks.

The Reinsurance Agreement also contemplates the establishment of collateral by AGM to support AGM’s reinsurance obligations to AGE.  In December 2014, to satisfy the PRA’s collateral requirements, AGM and AGE entered into a trust agreement pursuant to which AGM established and deposited assets into a reinsurance trust account for the benefit of AGE. AGM’s collateral requirement was measured during 2015, as of the end of each calendar quarter, by (i) using the PRA’s FG Benchmark Model to calculate at the 99.5% confidence interval the losses expected to be borne collectively by AGE’s three affiliated reinsurers, AGM, AG Re and AGRO; (ii) deducting from such calculation AGE’s capital resources under such model; and (iii) requiring AGM, AG Re and AGRO collectively to maintain collateral equal to fifty percent (50%) of such difference, i.e., the excess of AGM’s, AG Re’s and AGRO’s assumed modeled losses over AGE’s capital resources.  As of January 1, 2016, the PRA agreed to allow AGM’s collateral requirement to be determined using AGE’s internal capital requirement model instead of the FG Benchmark Model under the same formula described above. This change in the calculation of AGM's required collateral was reflected in an amendment to the Reinsurance Agreement approved by the NYDFS and made effective in April 2016.

Pursuant to the AGE Net Worth Agreement, AGM is obligated to cause AGE to maintain capital resources equal to 110% of the greatest of the amounts as may be required by the PRA as a condition for AGE to maintain its authorization to carry on a financial guarantee business in the U.K., provided that AGM's contributions (a) do not exceed 35% of AGM's policyholders' surplus on an accumulated basis as determined by the laws of the State of New York, and (b) are in compliance with Section 1505 of the New York Insurance Law. AGM has never been required to make any contributions to AGE's capital under the AGE Net Worth Agreement or the prior net worth maintenance agreement. With the approval of the NYDFS, AGE and AGM amended the AGE Net Worth Agreement effective in April 2016 to provide for use of the internal capital requirement model.

AGUK’s parent company, AGC, currently provides support to AGUK through a further amended and restated quota share reinsurance agreement (the Quota Share Agreement), a further amended and restated excess of loss reinsurance agreement (the XOL Agreement), and a further amended and restated net worth maintenance agreement (the "AGUK Net Worth Agreement"). Pursuant to the Quota Share Agreement, AGUK cedes 90% of its financial guaranty insurance and reinsurance exposure to AGC. Pursuant to the XOL Agreement, AGC indemnifies AGUK for 100% of losses (net of the quota share reinsurance agreement discussed above) incurred by AGUK in excess of an amount equal to (a) AGUK’s capital resources minus (b) 110% of the greatest of the amounts as may be required by the PRA as a condition for AGUK maintaining its authorization to carry on a financial guarantee business in the U.K. Pursuant to the AGUK Net Worth Agreement, if AGUK's net worth falls below 110% of the minimum level of capital required by the PRA, AGC must invest additional funds in order to bring the capital of AGUK back into compliance with the required amount.

In 2016, AGC and AGUK reached an agreement with the PRA that, in order for AGC to secure its outstanding reinsurance of AGUK under the Quota Share Agreement and XOL Agreement, AGC shall post as collateral its share of AGUK-guaranteed triple-X insurance bonds that have been purchased by AGC for loss mitigation and an additional amount to be determined by (i) using AGUK’s internal capital requirement model to calculate at the 99.5% confidence interval the losses expected to be borne by AGC for the exposures it has assumed from AGUK that do not have loss reserves (non-reserve exposures); (ii) adding the amount of loss reserves ceded by AGUK to AGC under U.K. GAAP; (iii) subtracting from such sum AGUK’s capital resources under its internal capital requirement model (the result of clauses (i) through (iii) being referred to as the resulting amount); and then (iv) reducing the resulting amount by 50% of the portion of the resulting amount that was contributed by the non-reserve exposures. Accordingly, AGC and AGUK entered into a trust agreement pursuant to which AGC established a reinsurance trust account for the benefit of AGUK and deposits therein sufficient assets to satisfy the above-

described collateral requirement agreed with the PRA. This new collateral requirement is reflected in the Quota Share Agreement and XOL Agreement, which were approved by the MIA and made effective in July 2016.

U.K. referendum vote to leave the European Union

On June 23, 2016, the U.K. voted in a national referendum to withdraw from the EU. The result of the referendum does not legally oblige the U.K. to exit the European Union (a so-called Brexit). However, the U.K. government has indicated that it intends to formally serve notice to the European Council of its desire to withdraw in accordance with Article 50 of the Treaty on European Union (Article 50) by the end of March 2017.

Article 50 envisages a negotiation period leading to an exit on a mutually agreed date. However, in the absence of such mutual agreement, the default date for exit is two years after the member state serves the Article 50 notice. EU treaties will therefore cease to apply to the U.K. on the earlier of (i) the entry into force of any withdrawal agreement or (ii) two years after the giving of notice (unless the U.K. and all remaining Member States unanimously agree to extend the negotiation period), currently contemplated to be March 2019.

Until the U.K. formally withdraws from the EU, EU legislation will remain in force and the role of EU institutions will be unchanged. On withdrawal of the U.K. from the EU, in the absence of any agreement to the contrary, all treaty obligations would lapse, directives, directly effective decisions and regulations (as well as rulings of the Court of Justice of the EU) would cease to apply and the competencies of EU institutions would fall away.

The U.K. Government has announced its intention to bring all aspects of European law into U.K. law prior to the U.K. exiting the EU. It seems most likely, given the relatively short timescales available, that initially Solvency II will be brought into U.K. law in its current form. Retaining Solvency II in its current form would also make it easier for the U.K. to obtain a ruling of “equivalence” from the European Commission under Solvency II, which would accord insurers certain advantages when it comes to the Solvency II rules on reinsurance, the calculation of group capital and group supervision.

The U.K. Government could take time to review whether there might be any changes which are desired on a national level. The Treasury Select Committee of the House of Commons is currently reviewing Solvency II and has indicated that it will do so against the backdrop of Brexit, taking into account certain features which are regarded as unsuitable by the U.K. industry. The results of the Treasury Select Committee’s work may feed in to future discussions about potential changes to the Solvency II regime.

Any changes to Solvency II following Brexit could reduce the chances of the U.K. obtaining (or subsequently preserving) a ruling of equivalence.

A further question arising from Brexit is whether U.K. authorised financial services firms such as AGE and AGUK will continue to enjoy passporting rights to the other 27 EEA states after Brexit. In the event that passporting rights are not retained, Assured Guaranty is assessing a number of options in order to continue with the ability to write new business, and to run off existing business, in those EEA states.

France

In connection with the CIFG Acquisition in July 2016, the Company acquired a French insurer called CIFG Europe S.A. which is now in run off. CIFGNA had reinsured all of CIFGE’s outstanding financial guaranty business and also had issued a “second-to-pay policy” pursuant to which CIFGNA guaranteed the full and complete payment of any shortfall in amounts due from CIFGE on its insured portfolio. AGC assumed these obligations as part of the CIFGNA merger with and into AGC. CIFGE remains a separate subsidiary in run off, now owned by AGC.  Prior to the CIFG Acquisition, CIFGE had prepared a run off plan which was approved by its French regulator, theAutorité de contrôle prudentiel et de résolution (ACPR).  CIFGE has been in run off for more than two years, and therefore has surrendered its licence under French law to write new insurance business.  The withdrawal of the licence has no practical impact on the level of supervision exercised by the ACPR over CIFGE as an insurer.


Tax Matters

Taxation of AGL and Subsidiaries

Bermuda

Under current Bermuda law, there is no Bermuda income, corporate or profits tax or withholding tax, capital gains tax or capital transfer tax payable by AGL or its Bermuda subsidiaries. AGL, AG Re and AGRO have each obtained from the Minister of Finance under the Exempted Undertakings Tax Protection Act 1966, as amended, an assurance that, in the event that Bermuda enacts legislation imposing tax computed on profits, income, any capital asset, gain or appreciation, or any tax in the nature of estate duty or inheritance, then the imposition of any such tax shall not be applicable to AGL, AG Re or AGRO or to any of their operations or their shares, debentures or other obligations, until March 31, 2035. This assurance is subject to the proviso that it is not to be construed so as to prevent the application of any tax or duty to such persons as are ordinarily resident in Bermuda, or to prevent the application of any tax payable in accordance with the provisions of the Land Tax Act 1967 or otherwise payable in relation to any land leased to AGL, AG Re or AGRO. AGL, AG Re and AGRO each pays annual Bermuda government fees, and AG Re and AGRO pay annual insurance license fees. In addition, all entities employing individuals in Bermuda are required to pay a payroll tax and there are other sundry taxes payable, directly or indirectly, to the Bermuda government.

United States

AGL has conducted and intends to continue to conduct substantially all of its foreign operations outside the U.S. and to limit the U.S. contacts of AGL and its foreign subsidiaries (except AGRO and AGE, which have elected to be taxed as U.S. corporations) so that they should not be engaged in a trade or business in the U.S. A foreign corporation, such as AG Re, that is deemed to be engaged in a trade or business in the United States would be subject to U.S. income tax at regular corporate rates, as well as the branch profits tax, on its income which is treated as effectively connected with the conduct of that trade or business, unless the corporation is entitled to relief under the permanent establishment provision of an applicable tax treaty, as discussed below. Such income tax, if imposed, would be based on effectively connected income computed in a manner generally analogous to that applied to the income of a U.S. corporation, except that a foreign corporation would generally be entitled to deductions and credits only if it timely files a U.S. federal income tax return. AGL, AG Re and certain of the other foreign subsidiaries have and will continue to file protective U.S. federal income tax returns on a timely basis in order to preserve the right to claim income tax deductions and credits if it is ever determined that they are subject to U.S. federal income tax. The highest marginal federal income tax rates currently are 35% for a corporation's effectively connected income and 30% for the "branch profits" tax.

Under the income tax treaty between Bermuda and the U.S. (the "Bermuda Treaty")Bermuda Treaty), a Bermuda insurance company would not be subject to U.S. income tax on income found to be effectively connected with a U.S. trade or business unless that trade or business is conducted through a permanent establishment in the U.S. AG Re currently intends to conduct its activities so that it does not have a permanent establishment in the U.S.

An insurance enterprise resident in Bermuda generally will be entitled to the benefits of the Bermuda Treaty if (i) more than 50% of its shares are owned beneficially, directly or indirectly, by individual residents of the U.S. or Bermuda or U.S. citizens and (ii) its income is not used in substantial part, directly or indirectly, to make disproportionate distributions to, or to meet certain liabilities of, persons who are neither residents of either the U.S. or Bermuda nor U.S. citizens.

Foreign insurance companies carrying on an insurance business within the U.S. have a certain minimum amount of effectively connected net investment income, determined in accordance with a formula that depends, in part, on the amount of U.S. risk insured or reinsured by such companies. If AG Re or another of the Company's Bermuda subsidiaries is considered to be engaged in the conduct of an insurance business in the U.S. and is not entitled to the benefits of the Bermuda Treaty in general (because it fails to satisfy one of the limitations on treaty benefits discussed above), the Internal Revenue Code of 1986, as amended (the "Code")Code), could subject a significant portion of AG Re's or another of the Company's Bermuda subsidiary's investment income to U.S. income tax.

AGL, as a U.K. tax resident, would not be subject to U.S. income tax on any income found to be effectively connected with a U.S. trade or business under the income tax treaty between the U.S. and the U.K. (the “U.K. Treaty”)U.K. Treaty), unless that trade or business is conducted through a permanent establishment in the United States. AGL intends to conduct its activities so that it does not have a permanent establishment in the United States. 


Foreign corporations not engaged in a trade or business in the U.S., and those that are engaged in a U.S. trade or business with respect to their non-effectively connected income are nonetheless subject to U.S. withholding tax on certain "fixed or determinable annual or periodic gains, profits and income" derived from sources within the U.S. (such as dividends and certain interest on investments), subject to exemption under the Code or reduction by applicable treaties. The standard non-treaty rate of U.S. withholding tax is currently 30%. The Bermuda Treaty does not reduce the U.S. withholding rate on U.S.-sourced investment income. The U.K. Treaty reduces or eliminates U.S. withholding tax on certain U.S. sourced investment income, including dividends from U.S. companies to U.K. resident persons entitled to the benefit of the U.K. Treaty.
    
The U.S. also imposes an excise tax on insurance and reinsurance premiums paid to foreign insurers with respect to risk of a U.S. person located wholly or partly within the U.S. or risks of a foreign person engaged in a trade or business in the U.S. which are located within the U.S. The rates of tax applicable to premiums paid are 4% for direct casualty insurance premiums and 1% for reinsurance premiums.

AGRO and AGE have elected to be treated as U.S. corporations for all U.S. federal tax purposes and, as such, each of AGRO and AGE, together with AGL's U.S. subsidiaries, is subject to taxation in the U.S. at regular corporate rates.

If AGRO were to pay dividends to its U.S. holding company parent and that U.S. holding company were to pay dividends to its Bermudian parent AG Re, such dividends would be subject to U.S. withholding tax at a rate of 30%.


34


United Kingdom

In November 2013, AGL became tax resident in the U.K. AGL remains a Bermuda-based company and its administrative and head office functions continue to be carried on in Bermuda. The AGL common shares have not changed and continue to be listed on the New York Stock Exchange ("NYSE")(NYSE).

As a company that is not incorporated in the U.K., AGL will be considered tax resident in the U.K. only if it is “centrally managed and controlled” in the U.K. Central management and control constitutes the highest level of control of a company’s affairs. Effective November 6, 2013, the AGL board of directorsBoard intends to manage the affairs of AGL in such a way as to maintain its status as a company that is tax resident in the U.K.

As a U.K. tax resident company, AGL is subject to the tax rules applicable to companies resident in the U.K., including the benefits afforded by the U.K.’s tax treaties.

As a U.K. tax resident, AGL is required to file a corporation tax return with Her Majesty’s Revenue & Customs (“HMRC”)(HMRC). AGL will be subject to U.K. corporation tax in respect of its worldwide profits (both income and capital gains), subject to any applicable exemptions. The main rate of corporation tax is currently 20%. It will be further reduced to 19% with effect from April 1, 2017 and 18%17% with effect from April 1, 2020. AGL has also registered in the U.K. to report its value added tax (“VAT”)(VAT) liability. The current rate of VAT is 20%.

The dividends AGL receives from its direct subsidiaries should be exempt from U.K. corporation tax due to the exemption in section 931D of the U.K. Corporation Tax Act 2009. In addition, any dividends paid by AGL to its shareholders should not be subject to any withholding tax in the U.K. The non-U.K. resident subsidiaries intend to operate in such a manner that their profits are outside the scope of the charge under the "controlled foreign companies" ("CFC regime").(CFC) regime. Accordingly, Assured Guaranty does not expect any profits of non-U.K. resident members of the group to be attributed to AGL and taxed in the U.K. under the CFC regime and has obtained clearance from HMRC confirming this on the basis of current facts and intentions.

Taxation of Shareholders

Bermuda Taxation

Currently, there is no Bermuda capital gains tax, or withholding or other tax payable on principal, interest or dividends paid to the holders of the AGL common shares.

United States Taxation

This discussion is based upon the Code, the regulations promulgated thereunder and any relevant administrative rulings or pronouncements or judicial decisions, all as in effect on the date hereof and as currently interpreted, and does not

take into account possible changes in such tax laws or interpretations thereof, which may apply retroactively. This discussion does not include any description of the tax laws of any state or local governments within the U.S. or any foreign government.

The following summary sets forth the material U.S. federal income tax considerations related to the purchase, ownership and disposition of AGL's shares. Unless otherwise stated, this summary deals only with holders that are U.S. Persons (as defined below) who purchase and hold their shares and who hold their shares as capital assets within the meaning of section 1221 of the Code. The following discussion is only a discussion of the material U.S. federal income tax matters as described herein and does not purport to address all of the U.S. federal income tax consequences that may be relevant to a particular shareholder in light of such shareholder's specific circumstances. For example, special rules apply to certain shareholders, such as partnerships, insurance companies, regulated investment companies, real estate investment trusts, dealers or traders in securities, tax exempt organizations, expatriates, persons that do not hold their securities in the U.S. dollar, persons who are considered with respect to AGL or any of its foreign subsidiaries as "United States shareholders" for purposes of the controlled foreign corporation ("CFC")(CFC) rules of the Code (generally, a U.S. Person, as defined below, who owns or is deemed to own 10% or more of the total combined voting power of all classes of AGL or the stock of any of AGL's foreign subsidiaries entitled to vote (i.e., 10% U.S. Shareholders)), or persons who hold the common shares as part of a hedging or conversion transaction or as part of a short-sale or straddle. Any such shareholder should consult their tax advisor.

If a partnership holds AGL's shares, the tax treatment of the partners will generally depend on the status of the partner and the activities of the partnership. Partners of a partnership owning AGL's shares should consult their tax advisers.


35


For purposes of this discussion, the term "U.S. Person" means: (i) a citizen or resident of the U.S., (ii) a partnership or corporation, created or organized in or under the laws of the U.S., or organized under any political subdivision thereof, (iii) an estate the income of which is subject to U.S. federal income taxation regardless of its source, (iv) a trust if either (x) a court within the U.S. is able to exercise primary supervision over the administration of such trust and one or more U.S. Persons have the authority to control all substantial decisions of such trust or (y) the trust has a valid election in effect to be treated as a U.S. Person for U.S. federal income tax purposes or (v) any other person or entity that is treated for U.S. federal income tax purposes as if it were one of the foregoing.

Taxation of Distributions.    Subject to the discussions below relating to the potential application of the CFC, related person insurance income ("RPII")(RPII) and passive foreign investment company ("PFIC")(PFIC) rules, cash distributions, if any, made with respect to AGL's shares will constitute dividends for U.S. federal income tax purposes to the extent paid out of current or accumulated earnings and profits of AGL (as computed using U.S. tax principles). Dividends paid by AGL to corporate shareholders will not be eligible for the dividends received deduction. To the extent such distributions exceed AGL's earnings and profits, they will be treated first as a return of the shareholder's basis in the common shares to the extent thereof, and then as gain from the sale of a capital asset.

AGL believes dividends paid by AGL on its common shares to non-corporate holders will be eligible for reduced rates of tax at the rates applicable to long-term capital gains as "qualified dividend income," provided that AGL is not a PFIC and certain other requirements, including stock holding period requirements, are satisfied.

Classification of AGL or its Foreign Subsidiaries as a Controlled Foreign Corporation.    Each 10% U.S. Shareholder (as defined below) of a foreign corporation that is a CFC for an uninterrupted period of 30 days or more during a taxable year, and who owns shares in the foreign corporation, directly or indirectly through foreign entities, on the last day of the foreign corporation's taxable year onin which it is a CFC, must include in its gross income for U.S. federal income tax purposes its pro rata share of the CFC's "subpart F income," even if the subpart F income is not distributed. "Subpart F income" of a foreign insurance corporation typically includes foreign personal holding company income (such as interest, dividends and other types of passive income), as well as insurance and reinsurance income (including underwriting and investment income). A foreign corporation is considered a CFC if 10% U.S. Shareholders own (directly, indirectly through foreign entities or by attribution by application of the constructive ownership rules of section 958(b) of the Code (i.e., "constructively")constructively)) more than 50% of the total combined voting power of all classes of voting stock of such foreign corporation, or more than 50% of the total value of all stock of such corporation on any day during the taxable year of such corporation. For purposes of taking into account insurance income, a CFC also includes a foreign insurance company in which more than 25% of the total combined voting power of all classes of stock (or more than 25% of the total value of the stock) is owned by 10% U.S. Shareholders, on any day during the taxable year of such corporation. A "10% U.S. Shareholder" is a U.S. Person who owns (directly, indirectly through foreign entities or constructively) at least 10% of the total combined voting power of all classes of stock entitled to vote of the foreign corporation. AGL believes that because of the dispersion of AGL's share ownership, provisions in AGL's organizational documents that limit voting power (these provisions are described in "Description of Share Capital") and other factors, no U.S. Person who owns shares of AGL directly or indirectly through one or more foreign entities should be treated as owning (directly, indirectly through foreign entities, or constructively), 10% or more of the total voting power of all classes of shares of

AGL or any of its foreign subsidiaries. It is possible, however, that the Internal Revenue Service ("IRS")(IRS) could challenge the effectiveness of these provisions and that a court could sustain such a challenge. In addition, the direct and indirect subsidiaries of AGUS are characterized as CFCs and any subpart F income generated will be included in the gross income of the applicable domestic subsidiaries in the AGL group.

The RPII CFC Provisions.    The following discussion generally is applicable only if the RPII of AG Re or any other foreign insurance subsidiary that has not made an election under section 953(d) of the Code to be treated as a U.S. corporation for all U.S. federal tax purposes or are CFCs owned directly or indirectly by AGUS (each a "Foreign Insurance Subsidiary" or collectively, with AG Re, the "Foreign Insurance Subsidiaries") determined on a gross basis, is 20% or more of the Foreign Insurance Subsidiary's gross insurance income for the taxable year and the 20% Ownership Exception (as defined below) is not met. The following discussion generally would not apply for any taxable year in which the Foreign Insurance Subsidiary's gross RPII falls below the 20% threshold or the 20% Ownership Exception is met. Although the Company cannot be certain, it believes that each Foreign Insurance Subsidiary has been, in prior years of operations, and will be, for the foreseeable future, either below the 20% threshold or in compliance with the requirements of 20% Ownership Exception for each tax year.

RPII is any "insurance income" (as defined below) attributable to policies of insurance or reinsurance with respect to which the person (directly or indirectly) insured is a "RPII shareholder" (as defined below) or a "related person" (as defined below) to such RPII shareholder. In general, and subject to certain limitations, "insurance income" is income (including premium and investment income) attributable to the issuing of any insurance or reinsurance contract which would be taxed under the portions of the Code relating to insurance companies if the income were the income of a domestic insurance

36


company. For purposes of inclusion of the RPII of a Foreign Insurance Subsidiary in the income of RPII shareholders, unless an exception applies, the term "RPII shareholder" means any U.S. Person who owns (directly or indirectly through foreign entities) any amount of AGL's common shares. Generally, the term "related person" for this purpose means someone who controls or is controlled by the RPII shareholder or someone who is controlled by the same person or persons which control the RPII shareholder. Control is measured by either more than 50% in value or more than 50% in voting power of stock applying certain constructive ownership principles. A Foreign Insurance Subsidiary will be treated as a CFC under the RPII provisions if RPII shareholders are treated as owning (directly, indirectly through foreign entities or constructively) 25% or more of the shares of AGL by vote or value.

RPII Exceptions.    The special RPII rules do not apply if (i) at all times during the taxable year less than 20% of the voting power and less than 20% of the value of the stock of AGL (the "20%20% Ownership Exception")Exception) is owned (directly or indirectly through entities) by persons who are (directly or indirectly) insured under any policy of insurance or reinsurance issued by a Foreign Insurance Subsidiary or related persons to any such person, (ii) RPII, determined on a gross basis, is less than 20% of a Foreign Insurance Subsidiary's gross insurance income for the taxable year (the "20%20% Gross Income Exception), (iii) a Foreign Insurance Subsidiary elects to be taxed on its RPII as if the RPII were effectively connected with the conduct of a U.S. trade or business, and to waive all treaty benefits with respect to RPII and meet certain other requirements or (iv) a Foreign Insurance Subsidiary elects to be treated as a U.S. corporation and waive all treaty benefits and meet certain other requirements. The Foreign Insurance Subsidiaries do not intend to make either of these elections. Where none of these exceptions applies, each U.S. Person owning or treated as owning any shares in AGL (and therefore, indirectly, in a Foreign Insurance Subsidiary) on the last day of AGL's taxable year will be required to include in its gross income for U.S. federal income tax purposes its share of the RPII for the portion of the taxable year during which a Foreign Insurance Subsidiary was a CFC under the RPII provisions, determined as if all such RPII were distributed proportionately only to such U.S. Persons at that date, but limited by each such U.S. Person's share of a Foreign Insurance Subsidiary's current-year earnings and profits as reduced by the U.S. Person's share, if any, of certain prior-year deficits in earnings and profits. The Foreign Insurance Subsidiaries intend to operate in a manner that is intended to ensure that each qualifies for either the 20% Gross Income Exception or 20% Ownership Exception.

Computation of RPII.    For any year in which a Foreign Insurance Subsidiary does not meet the 20% Ownership Exception or the 20% Gross Income Exception, AGL may also seek information from its shareholders as to whether beneficial owners of shares at the end of the year are U.S. Persons so that the RPII may be determined and apportioned among such persons; to the extent AGL is unable to determine whether a beneficial owner of shares is a U.S. Person, AGL may assume that such owner is not a U.S. Person, thereby increasing the per share RPII amount for all known RPII shareholders. The amount of RPII includable in the income of a RPII shareholder is based upon the net RPII income for the year after deducting related expenses such as losses, loss reserves and operating expenses. If a Foreign Insurance Subsidiary meets the 20% Ownership Exception or the 20% Gross Income Exception, RPII shareholders will not be required to include RPII in their taxable income.

Apportionment of RPII to U.S. Holders.    Every RPII shareholder who owns shares on the last day of any taxable year of AGL in which a Foreign Insurance Subsidiary does not meet the 20% Ownership Exception or the 20% Gross Income Exception should expect that for such year it will be required to include in gross income its share of a Foreign Insurance

Subsidiary's RPII for the portion of the taxable year during which the Foreign Insurance Subsidiary was a CFC under the RPII provisions, whether or not distributed, even though it may not have owned the shares throughout such period. A RPII shareholder who owns shares during such taxable year but not on the last day of the taxable year is not required to include in gross income any part of the Foreign Insurance Subsidiary's RPII.

Basis Adjustments.    An RPII shareholder's tax basis in its common shares will be increased by the amount of any RPII the shareholder includes in income. The RPII shareholder may exclude from income the amount of any distributions by AGL out of previously taxed RPII income. The RPII shareholder's tax basis in its common shares will be reduced by the amount of such distributions that are excluded from income.

Uncertainty as to Application of RPII.    The RPII provisions are complex and have never been interpreted by the courts or the Treasury Department in final regulations; regulations interpreting the RPII provisions of the Code exist only in proposed form. It is not certain whether these regulations will be adopted in their proposed form or what changes or clarifications might ultimately be made thereto or whether any such changes, as well as any interpretation or application of RPII by the IRS, the courts or otherwise, might have retroactive effect. These provisions include the grant of authority to the Treasury Department to prescribe "such regulations as may be necessary to carry out the purpose of this subsection including regulations preventing the avoidance of this subsection through cross insurance arrangements or otherwise." Accordingly, the meaning of the RPII provisions and the application thereof to the Foreign Insurance Subsidiaries is uncertain. In addition, the Company cannot be certain that the amount of RPII or the amounts of the RPII inclusions for any particular RPII shareholder, if any, will not be subject to adjustment based upon subsequent IRS examination. Any prospective investor which does business

37


with a Foreign Insurance Subsidiary and is considering an investment in common shares should consult his tax advisor as to the effects of these uncertainties.

Information Reporting.    Under certain circumstances, U.S. Persons owning shares (directly, indirectly or constructively) in a foreign corporation are required to file IRS Form 5471 with their U.S. federal income tax returns. Generally, information reporting on IRS Form 5471 is required by (i) a person who is treated as a RPII shareholder, (ii) a 10% U.S. Shareholder of a foreign corporation that is a CFC for an uninterrupted period of 30 days or more during any tax year of the foreign corporation and who owned the stock on the last day of that year; and (iii) under certain circumstances, a U.S. Person who acquires stock in a foreign corporation and as a result thereof owns 10% or more of the voting power or value of such foreign corporation, whether or not such foreign corporation is a CFC. For any taxable year in which AGL determines that the 20% Gross Income Exception and the 20% Ownership Exception does not apply, AGL will provide to all U.S. Persons registered as shareholders of its shares a completed IRS Form 5471 or the relevant information necessary to complete the form. Failure to file IRS Form 5471 may result in penalties. In addition, U.S. shareholders should consult their tax advisors with respect to other information reporting requirements that may be applicable to them.

U.S. Persons holding our shares should consider their possible obligation to file FINCEN Form 114, Foreign Bank and Financial Accounts Report, with respect to their shares. Additionally, such U.S. and non-U.S. persons should consider their possible obligations to annually report certain information with respect to us with their U.S. federal income tax returns. Shareholders should consult their tax advisors with respect to these or any other reporting requirement which may apply with respect to their ownership of our shares.

Tax-Exempt Shareholders.    Tax-exempt entities will be required to treat certain subpart F insurance income, including RPII, that is includibleincludable in income by the tax-exempt entity as unrelated business taxable income. Prospective investors that are tax exempt entities are urged to consult their tax advisors as to the potential impact of the unrelated business taxable income provisions of the Code. A tax-exempt organization that is treated as a 10% U.S. Shareholder or a RPII Shareholder also must file IRS Form 5471 in certain circumstances.

Dispositions of AGL's Shares.    Subject to the discussions below relating to the potential application of the Code section 1248 and PFIC rules, holders of shares generally should recognize capital gain or loss for U.S. federal income tax purposes on the sale, exchange or other disposition of shares in the same manner as on the sale, exchange or other disposition of any other shares held as capital assets. If the holding period for these shares exceeds one year, any gain will be subject to tax at a current maximum marginal tax rate of 20% for individuals and 35% for corporations. Moreover, gain, if any, generally will be a U.S. source gain and generally will constitute "passive income" for foreign tax credit limitation purposes.

Code section 1248 provides that if a U.S. Person sells or exchanges stock in a foreign corporation and such person owned, directly, indirectly through foreign entities or constructively, 10% or more of the voting power of the corporation at any time during the five-year period ending on the date of disposition when the corporation was a CFC, any gain from the sale or exchange of the shares will be treated as a dividend to the extent of the CFC's earnings and profits (determined under U.S. federal income tax principles) during the period that the shareholder held the shares and while the corporation was a CFC (with

certain adjustments). The Company believes that because of the dispersion of AGL's share ownership, provisions in AGL's organizational documents that limit voting power and other factors that no U.S. shareholder of AGL should be treated as owning (directly, indirectly through foreign entities or constructively) 10% of more of the total voting power of AGL; to the extent this is the case this application of Code Section 1248 under the regular CFC rules should not apply to dispositions of AGL's shares. It is possible, however, that the IRS could challenge the effectiveness of these provisions and that a court could sustain such a challenge. A 10% U.S. Shareholder may in certain circumstances be required to report a disposition of shares of a CFC by attaching IRS Form 5471 to the U.S. federal income tax or information return that it would normally file for the taxable year in which the disposition occurs. In the event this is determined necessary, AGL will provide a completed IRS Form 5471 or the relevant information necessary to complete the Form. Code section 1248 in conjunction with the RPII rules also applies to the sale or exchange of shares in a foreign corporation if the foreign corporation would be treated as a CFC for RPII purposes regardless of whether the shareholder is a 10% U.S. Shareholder or whether the 20% Ownership Exception or 20% Gross Income Exception applies. Existing proposed regulations do not address whether Code section 1248 would apply if a foreign corporation is not a CFC but the foreign corporation has a subsidiary that is a CFC and that would be taxed as an insurance company if it were a domestic corporation. The Company believes, however, that this application of Code section 1248 under the RPII rules should not apply to dispositions of AGL's shares because AGL will not be directly engaged in the insurance business. The Company cannot be certain, however, that the IRS will not interpret the proposed regulations in a contrary manner or that the Treasury Department will not amend the proposed regulations to provide that these rules will apply to dispositions of common shares. Prospective investors should consult their tax advisors regarding the effects of these rules on a disposition of common shares.


38


Passive Foreign Investment Companies.    In general, a foreign corporation will be a PFIC during a given year if (i) 75% or more of its gross income constitutes "passive income" (the "75% test")75% test) or (ii) 50% or more of its assets produce passive income (the "50% test")50% test).

If AGL were characterized as a PFIC during a given year, each U.S. Person holding AGL's shares would be subject to a penalty tax at the time of the sale at a gain of, or receipt of an "excess distribution" with respect to, their shares, unless such person (i) is a 10% U.S. Shareholder and AGL is a CFC or (ii) made a "qualified electing fund election" or "mark-to-market" election. It is uncertain that AGL would be able to provide its shareholders with the information necessary for a U.S. Person to make a qualified electing fund election. In addition, if AGL were considered a PFIC, upon the death of any U.S. individual owning common shares, such individual's heirs or estate would not be entitled to a "step-up" in the basis of the common shares that might otherwise be available under U.S. federal income tax laws. In general, a shareholder receives an "excess distribution" if the amount of the distribution is more than 125% of the average distribution with respect to the common shares during the three preceding taxable years (or shorter period during which the taxpayer held common shares). In general, the penalty tax is equivalent to an interest charge on taxes that are deemed due during the period the shareholder owned the common shares, computed by assuming that the excess distribution or gain (in the case of a sale) with respect to the common shares was taken in equal portion at the highest applicable tax rate on ordinary income throughout the shareholder's period of ownership. The interest charge is equal to the applicable rate imposed on underpayments of U.S. federal income tax for such period. In addition, a distribution paid by AGL to U.S. shareholders that is characterized as a dividend and is not characterized as an excess distribution would not be eligible for reduced rates of tax as qualified dividend income. A U.S. Person that is a shareholder in a PFIC may also be subject to additional information reporting requirements, including the annual filing of IRS Form 8621.

For the above purposes, passive income generally includes interest, dividends, annuities and other investment income. The PFIC rules provide that income "derived in the active conduct of an insurance business by a corporation which is predominantly engaged in an insurance business... is not treated as passive income." The PFIC provisions also contain a look-through rule under which a foreign corporation shall be treated as if it "received directly its proportionate share of the income..." and as if it "held its proportionate share of the assets..." of any other corporation in which it owns at least 25% of the value of the stock.

The insurance income exception is intended to ensure that income derived by a bona fide insurance company is not treated as passive income, except to the extent such income is attributable to financial reserves in excess of the reasonable needs of the insurance business. The Company expects, for purposes of the PFIC rules, that each of AGL's insurance subsidiaries will be predominantly engaged in an insurance business and is unlikely to have financial reserves in excess of the reasonable needs of its insurance business in each year of operations. Accordingly, none of the income or assets of AGL's insurance subsidiaries should be treated as passive. Additionally, the Company expects that in each year of operations the passive income and assets of AGL's non-insurance subsidiaries will not exceed the 75% test or 50% test amounts in each year of operations with respect to the overall income and assets of AGL and its subsidiaries. Under the look-through rule AGL should be deemed to own its proportionate share of the assets and to have received its proportionate share of the income of its direct and indirect subsidiaries for purposes of the 75% test and the 50% test. As a result, the Company believes that AGL was

not and should not be treated as a PFIC. The Company cannot be certain that the IRS will not successfully challenge this position, however, as there are currently no final or temporary regulations regarding the application of the PFIC provisions to an insurance company. The IRS recently issued proposed regulations intended to clarify the application of the PFIC provisions to an insurance company. These proposed regulations provide that a non-U.S. insurance company may only qualify for an exception to the PFIC rules if, among other things, the non-U.S. insurance company’s officers and employees perform its substantial managerial and operational activities.  This proposed regulation will not be effective until adopted in final form. In addition, Senator Wyden recently introduced the “Offshore Reinsurance Tax Fairness Act” that, if enacted, would characterize a non-U.S. insurance company with insurance liabilities of 25% or less of such company’s assets as a PFIC unless it can qualify for a temporary exception which would require its insurance liabilities to equal or exceed 10% of its assets and the satisfaction of a facts and circumstances test. Because of the legal uncertainties relating to how the proposed regulations will be interpreted and the form in which such regulations or any legislative proposal may be finalized, or whether any legislation will be proposed to limit the insurance company exception, the Company cannot predict what impact, if any, such guidance or legislation would have on an investor that is subject to USU.S. federal income tax. Prospective investors should consult their tax advisor as to the effects of the PFIC rules.

Foreign tax credit.    If U.S. Persons own a majority of AGL's common shares, only a portion of the current income inclusions, if any, under the CFC, RPII and PFIC rules and of dividends paid by AGL (including any gain from the sale of common shares that is treated as a dividend under section 1248 of the Code) will be treated as foreign source income for purposes of computing a shareholder's U.S. foreign tax credit limitations. The Company will consider providing shareholders with information regarding the portion of such amounts constituting foreign source income to the extent such information is reasonably available. It is also likely that substantially all of the "subpart F income," RPII and dividends that are foreign source income will constitute either "passive" or "general" income. Thus, it may not be possible for most shareholders to utilize excess foreign tax credits to reduce U.S. tax on such income.

39


Information Reporting and Backup Withholding on Distributions and Disposition Proceeds.    Information returns may be filed with the IRS in connection with distributions on AGL's common shares and the proceeds from a sale or other disposition of AGL's common shares unless the holder of AGL's common shares establishes an exemption from the information reporting rules. A holder of common shares that does not establish such an exemption may be subject to U.S. backup withholding tax on these payments if the holder is not a corporation or non-U.S. Person or fails to provide its taxpayer identification number or otherwise comply with the backup withholding rules. The amount of any backup withholding from a payment to a U.S. Person will be allowed as a credit against the U.S. Person's U.S. federal income tax liability and may entitle the U.S. Person to a refund, provided that the required information is furnished to the IRS.

Changes in U.S. Federal Income Tax Law Could Materially Adversely Affect AGL or AGL's Shareholders. Legislation has been introduced from time to time in the U.S. Congress intended to eliminate certain perceived tax advantages of companies (including insurance companies) that have legal domiciles outside the U.S. but have certain U.S. connections. It is possible that legislation could be introduced in and enacted by the current Congress or future Congress that could have an adverse impact on AGL or AGL's shareholders. For example, legislation has been introduced in Congress to limit the deductibility of reinsurance premiums paid by U.S. companies to foreign affiliates. It is possible that this or similarFurther, legislation couldbased on the Tax Reform Task-Force Blueprint dated June 24, 2016, which recommends moving to a cash flow consumption-based tax system and provides for border adjustments taxing imports may be introduced in and enacted by the current Congress or future Congresses that could have an adverseand its impact on AGL or AGL's shareholders.the insurance industry may adversely impact the results of our operations.

Additionally, tax laws and interpretations regarding whether a company is engaged in a U.S. trade or business or whether a company is a CFC or a PFIC or has RPII are subject to change, possibly on a retroactive basis. There are currently only recently proposed regulations regarding the application of the PFIC rules to an insurance company. Additionally, the regulations regarding RPII have been in proposed form since 1991. New regulations or pronouncements interpreting or clarifying such rules may be forthcoming. The Company cannot be certain if, when or in what form such regulations or pronouncements may be provided and whether such guidance will have a retroactive effect.

United Kingdom

The following discussion is intended to be only a general guide to certain U.K. tax consequences of holding AGL common shares, under current law and the current practice of HMRC, either of which is subject to change at any time, possibly with retrospective effect. Except where otherwise stated, this discussion applies only to shareholders who are not (and have not recently been) resident or (in the case of individuals) domiciled for tax purposes in the U.K., who hold their AGL common shares as an investment and who are the absolute beneficial owners of their common shares. This discussion may not apply to certain shareholders, such as dealers in securities, life insurance companies, collective investment schemes, shareholders who are exempt from tax and shareholders who have (or are deemed to have) acquired their shares by virtue of an office or employment. Such shareholders may be subject to special rules.


The following statements do not purport to be a comprehensive description of all the U.K. considerations that may be relevant to any particular shareholder. Any person who is in any doubt as to their tax position should consult an appropriate professional tax adviser.

AGL's Tax Residency. AGL is not incorporated in the U.K., but effective November 6, 2013, the AGL Board of Directors intends to managemanages its affairs with the affairs of AGL in such a way asintent to maintain its status as a company that is tax resident in the U.K.

Dividends. Under current U.K. tax law, AGL is not required to withhold tax at source from dividends paid to the holders of the AGL common shares.

Capital gains. U.K. tax is not normally charged on any capital gains realized by non-U.K. shareholders in AGL unless, in the case of a corporate shareholder, at or before the time the gain accrues, the shareholding is used in or for the purposes of a trade carried on by the non-resident shareholder through a permanent establishment in the U.K. or for the purposes of that permanent establishment. Similarly, an individual shareholder who carries on a trade, profession or vocation in the U.K. through a branch or agency may be liable for U.K. tax on the gain if such shareholder disposes of shares that are, or have been, used, held or acquired for the purposes of such trade, profession or vocation or for the purposes of such branch or agency. This treatment applies regardless of the U.K. tax residence status of AGL.

Stamp Taxes. On the basis that AGL does not currently intend to maintain a share register in the U.K., there should be no U.K. stamp duty reserve tax on a purchase of common shares in AGL. A conveyance or transfer on sale of common shares in AGL will not be subject to U.K. stamp duty, provided that the instrument of transfer is not executed in the U.K. and does not relate to any property situate,situated, or any matter or thing done, or to be done, in the U.K.


40


Description of Share Capital

The following summary of AGL's share capital is qualified in its entirety by the provisions of Bermuda law, AGL's memorandum of association and its Bye-Laws, copies of which are incorporated by reference as exhibits to this Annual Report on Form 10-K.

AGL's authorized share capital of $5,000,000 is divided into 500,000,000 shares, par value U.S. $0.01 per share, of which 135,863,776124,958,756 common shares were issued and outstanding as of February 23, 2016.21, 2017. Except as described below, AGL's common shares have no pre-emptive rights or other rights to subscribe for additional common shares, no rights of redemption, conversion or exchange and no sinking fund rights. In the event of liquidation, dissolution or winding-up, the holders of AGL's common shares are entitled to share equally, in proportion to the number of common shares held by such holder, in AGL's assets, if any remain after the payment of all AGL's debts and liabilities and the liquidation preference of any outstanding preferred shares. Under certain circumstances, AGL has the right to purchase all or a portion of the shares held by a shareholder. See "—Acquisition of Common Shares by AGL" below.

Voting Rights and Adjustments

In general, and except as provided below, shareholders have one vote for each common share held by them and are entitled to vote with respect to their fully paid shares at all meetings of shareholders. However, if, and so long as, the common shares (and other of AGL's shares) of a shareholder are treated as "controlled shares" (as determined pursuant to section 958 of the Code) of any U.S. Person and such controlled shares constitute 9.5% or more of the votes conferred by AGL's issued and outstanding shares, the voting rights with respect to the controlled shares owned by such U.S. Person shall be limited, in the aggregate, to a voting power of less than 9.5% of the voting power of all issued and outstanding shares, under a formula specified in AGL's Bye-laws. The formula is applied repeatedly until there is no U.S. Person whose controlled shares constitute 9.5% or more of the voting power of all issued and outstanding shares and who generally would be required to recognize income with respect to AGL under the Code if AGL were a controlled foreign corporationCFC as defined in the Code and if the ownership threshold under the Code were 9.5% (as defined in AGL's Bye-Laws as a "9.5%9.5% U.S. Shareholder")Shareholder). In addition, AGL's Board of Directors may determine that shares held carry different voting rights when it deems it appropriate to do so to (i) avoid the existence of any 9.5% U.S. Shareholder; and (ii) avoid adverse tax, legal or regulatory consequences to AGL or any of its subsidiaries or any direct or indirect holder of shares or its affiliates. "Controlled shares" includes, among other things, all shares of AGL that such U.S. Person is deemed to own directly, indirectly or constructively (within the meaning of section 958 of the Code). Further, these provisions do not apply in the event one shareholder owns greater than 75% of the voting power of all issued and outstanding shares.

Under these provisions, certain shareholders may have their voting rights limited to less than one vote per share, while other shareholders may have voting rights in excess of one vote per share. Moreover, these provisions could have the effect of

reducing the votes of certain shareholders who would not otherwise be subject to the 9.5% limitation by virtue of their direct share ownership. AGL's Bye-laws provide that it will use its best efforts to notify shareholders of their voting interests prior to any vote to be taken by them.

AGL's Board of Directors is authorized to require any shareholder to provide information for purposes of determining whether any holder's voting rights are to be adjusted, which may be information on beneficial share ownership, the names of persons having beneficial ownership of the shareholder's shares, relationships with other shareholders or any other facts AGL's Board of Directors may deem relevant. If any holder fails to respond to this request or submits incomplete or inaccurate information, AGL's Board of Directors may eliminate the shareholder's voting rights. All information provided by the shareholder will be treated by AGL as confidential information and shall be used by AGL solely for the purpose of establishing whether any 9.5% U.S. Shareholder exists and applying the adjustments to voting power (except as otherwise required by applicable law or regulation).

Restrictions on Transfer of Common Shares

AGL's Board of Directors may decline to register a transfer of any common shares under certain circumstances, including if they have reason to believe that any adverse tax, regulatory or legal consequences to the Company, any of its subsidiaries or any of its shareholders or indirect holders of shares or its Affiliates may occur as a result of such transfer (other than such as AGL's Board of Directors considers de minimis). Transfers must be by instrument unless otherwise permitted by the Companies Act.

The restrictions on transfer and voting restrictions described above may have the effect of delaying, deferring or preventing a change in control of Assured Guaranty.

41


Acquisition of Common Shares by AGL

Under AGL's Bye-Laws and subject to Bermuda law, if AGL's Board of Directors determines that any ownership of AGL's shares may result in adverse tax, legal or regulatory consequences to AGL, any of AGL's subsidiaries or any of AGL's shareholders or indirect holders of shares or its Affiliates (other than such as AGL's Board of Directors considers de minimis), AGL has the option, but not the obligation, to require such shareholder to sell to AGL or to a third party to whom AGL assigns the repurchase right the minimum number of common shares necessary to avoid or cure any such adverse consequences at a price determined in the discretion of the Board of Directors to represent the shares' fair market value (as defined in AGL's Bye-Laws).

Other Provisions of AGL's Bye-Laws

AGL's Board of Directors and Corporate Action

AGL's Bye-Laws provide that AGL's Board of Directors shall consist of not less than three and not more than 21 directors, the exact number as determined by the Board of Directors.Board. AGL's Board of Directors consists of ten persons who are elected for annual terms.

Shareholders may only remove a director for cause (as defined in AGL's Bye-Laws) at a general meeting, provided that the notice of any such meeting convened for the purpose of removing a director shall contain a statement of the intention to do so and shall be provided to that director at least two weeks before the meeting. Vacancies on the Board of Directors can be filled by the Board of Directors if the vacancy occurs in those events set out in AGL's Bye-Laws as a result of death, disability, disqualification or resignation of a director, or from an increase in the size of the Board of Directors.Board.

Generally under AGL's Bye-Laws, the affirmative votes of a majority of the votes cast at any meeting at which a quorum is present is required to authorize a resolution put to vote at a meeting of the Board, of Directors, including one relating to a merger, acquisition or business combination. Corporate action may also be taken by a unanimous written resolution of the Board of Directors without a meeting. A quorum shall be at least one-half of directors then in office present in person or represented by a duly authorized representative, provided that at least two directors are present in person.

Shareholder Action

At the commencement of any general meeting, two or more persons present in person and representing, in person or by proxy, more than 50% of the issued and outstanding shares entitled to vote at the meeting shall constitute a quorum for the transaction of business. In general, any questions proposed for the consideration of the shareholders at any general meeting shall be decided by the affirmative votes of a majority of the votes cast in accordance with the Bye-Laws.

The Bye-Laws contain advance notice requirements for shareholder proposals and nominations for directors, including when proposals and nominations must be received and the information to be included.

Amendment

The Bye-Laws may be amended only by a resolution adopted by the Board of Directors and by resolution of the shareholders.

Voting of Non-U.S. Subsidiary Shares

If AGL is required or entitled to vote at a general meeting of any of AG Re, AGFOL or any other of its directly held non-U.S. subsidiaries, AGL's Board of Directors shall refer the subject matter of the vote to AGL's shareholders and seek direction from such shareholders as to how they should vote on the resolution proposed by the non-U.S. subsidiary. AGL's Board of Directors in its discretion shall require substantially similar provisions are or will be contained in the bye-laws (or equivalent governing documents) of any direct or indirect non-U.S. subsidiaries other than U.K. and AGRO.

Employees

As of December 31, 2015,2016, the Company had approximately 300 employees. None of the Company's employees are subject to collective bargaining agreements. The Company believes that employee relations are satisfactory.


42


Available Information

The Company maintains an Internet web site at www.assuredguaranty.com. The Company makes available, free of charge, on its web site (under assuredguaranty.com/sec-filings) the Company's annual report on Form 10-K, quarterly reports on Form 10-Q, current reports on Form 8-K, and amendments to those reports filed or furnished pursuant to Section 13 (a) or 15 (d) of the Exchange Act as soon as reasonably practicable after the Company files such material with, or furnishes it to, the SEC. The Company also makes available, free of charge, through its web site (under assuredguaranty.com/governance) links to the Company's Corporate Governance Guidelines, its Code of Conduct, AGL's Bye-Laws and the charters for its Board committees.

The Company routinely posts important information for investors on its web site (under assuredguaranty.com/company-statements and, more generally, under the Investor Information and Businesses pages). The Company uses this web site as a means of disclosing material information and for complying with its disclosure obligations under SEC Regulation FD (Fair Disclosure). Accordingly, investors should monitor the Company Statements, Investor Information and Businesses portions of the Company's web site, in addition to following the Company's press releases, SEC filings, public conference calls, presentations and webcasts.

The information contained on, or that may be accessed through, the Company's web site is not incorporated by reference into, and is not a part of, this report.


43


ITEM 1A.RISK FACTORS

You should carefully consider the following information, together with the information contained in AGL's other filings with the SEC. The risks and uncertainties discussed below are not the only ones the Company faces. However, these are the risks that the Company's management believes are material. The Company may face additional risks or uncertainties that are not presently known to the Company or that management currently deems immaterial, and such risks or uncertainties also may impair its business or results of operations. The risks discussed below could result in a significant or material adverse effect on the Company's financial condition, results of operations, liquidity or business prospects.

Risks Related to the Company's Expected Losses

Estimates of expected losses are subject to uncertainties and may not be adequate to cover potential paid claims.

The financial guaranties issued by the Company's insurance subsidiaries insure the credit performance of the guaranteed obligations over an extended period of time, in some cases over 30 years, and in most circumstances, the Company has no right to cancel such financial guaranties. As a result, the Company's estimate of ultimate losses on a policy is subject to significant uncertainty over the life of the insured transaction. Credit performance can be adversely affected by economic, fiscal and financial market variability over the long duration of most contracts. If the Company's actual losses exceed its current estimate, this may result in adverse effects on the Company's financial condition, results of operations, liquidity, business prospects, financial strength ratings and ability to raise additional capital.

In addition, if the Company is required to make claim payments, even if it is reimbursed in full over time and does not experience ultimate loss on a particular policy, such claim payments would reduce the Company's invested assets and result in reduced liquidity and net investment income. If the amount of claim payments is significant, the Company's ability to make other claim payments and its financial condition, financial strength ratings and business prospects could be adversely affected.

The Company had exposure of approximately $2.9 billion to infrastructure transactions with refinancing risk as of December 31, 2015. These transactions generally involve long-term infrastructure projects that were financed at least in part by bonds that mature well before the expiration of the project concession and which were originally expected to be refinanced. The Company generally expects the cash flows from these projects to be sufficient to repay all of the bonds over the life of the project concession, but if, due to market conditions, the issuer is unable to refinance insured bonds maturing well before the expiration of the project concession, the Company may have to pay a claim at that time and then recover from cash flows produced by the project in the future. However, the recovery of such amounts is uncertain and may take from 10 to 35 years, depending on the transaction and the performance of the underlying collateral. As of December 31, 2015, the Company estimated total claims for the two largest transactions with significant refinancing risk, assuming no refinancing, and based on certain performance assumptions, could be $1.9 billion on a gross basis; such claims would occur from 2017 through 2022. Of such $1.9 billion in estimated gross claims, an estimated $1.3 billion related to obligations of Skyway Concession Company LLC (“SCC”), which owned the concession for the Chicago Skyway toll road. In November 2015, a consortium of three Canadian pension plans announced that they had reached agreement, subject to regulatory approvals and customary closing conditions, to purchase SCC for $2.8 billion. The sale was completed on February 25, 2016 and the various SCC obligations insured by the Company were retired without a claim on the Company.

The determination of expected loss is an inherently subjective process involving numerous estimates, assumptions and judgments by management, using both internal and external data sources with regard to frequency, severity of loss, economic projections, governmental actions, negotiations and other factors that affect credit performance. The Company does not use traditional actuarial approaches to determine its estimates of expected losses. Actual losses will ultimately depend on future events or transaction performance. As a result, the Company's current estimates of probable and estimable losses may not reflect the Company's future ultimate claims paid.

Certain sectors and large risks within the Company's insured portfolio have experienced credit deterioration in excess of the Company’s initial expectations, which has led or may lead to losses in excess of the Company’s initial expectations.  The Company's expected loss models take into account current and expected future trends, which contemplate the impact of current and probable developments in the performance of the credit.  These factors, which are integral elements of the Company's reserve estimation methodology, are updated on a quarterly basis based on current information.  Because such information changes, sometimes materially, from quarter to quarter, the Company’s projection of losses may also change materially.  Since the financial crisis, much of the development in the Company’s loss projections has beenwas with respect to insured U.S. RMBS securities.  While the Company's net par outstanding of U.S. RMBS rated BIG under the Company's rating methodology as of December 31, 20152016 and December 31, 20142015 was still $4.0$3.2 billion and $5.6$4.0 billion, respectively, and may still be a source of loss development, the Company believes the performance of this portfolio has stabilized.  More recently, there has been credit

44


deterioration with respect to certain insured Puerto Rico credits.  The Company had net par outstanding to general obligation bonds of the Commonwealth of Puerto Rico and various obligations of its related authorities and public corporations aggregating of $5.1to $4.8 billion and $4.9$5.1 billion, respectively, as of December 31, 20152016 and December 31, 2014,2015, all of which was rated BIG under the Company’s rating methodology as of December 31, 2015.2016. For a discussion of the Company's review of its Puerto Rico risks and RMBS transactions, see "Item 7. Management's DiscussionPart II, Item 8, Financial Statements and Analysis of Financial Condition and Results of Operations-Results of Operations-Consolidated Results of Operations-Economic Loss Development."Supplementary Data, Note 4, Outstanding Exposure.

Risks Related to the Company's Financial Strength and Financial Enhancement Ratings

A downgrade of the financial strength or financial enhancement ratings of any of the Company's insurance and reinsurance subsidiaries would adversely affect its business and prospects and, consequently, its results of operations and financial condition.

The financial strength and financial enhancement ratings assigned by S&P, Moody's, KBRA and Best to AGL's insurance and reinsurance subsidiaries represent the rating agencies' opinions of the insurer's financial strength and ability to meet ongoing obligations to policyholders and cedants in accordance with the terms of the financial guaranties it has issued or the reinsurance agreements it has executed. The ratings also reflect qualitative factors, such as the rating agencies' opinion of an insurer's business strategy and franchise value, the anticipated future demand for its product, the composition of its insured portfolio, and its capital adequacy, profitability and financial flexibility. Issuers, investors, underwriters, ceding companies and others consider the Company's financial strength or financial enhancement ratings an important factor when deciding whether or not to utilize a financial guaranty or purchase reinsurance from one of the insurance or reinsurance subsidiaries. A downgrade by a rating agency of the financial strength or financial enhancement ratings of one or more of AGL's subsidiaries

could impair the Company's financial condition, results of operation, liquidity, business prospects or other aspects of the Company's business.

The ratings assigned by the rating agencies that publish financial strength or financial enhancement ratings on AGL's insurance subsidiaries are subject to frequent review and may be lowered by a rating agency as a result of a number of factors, including, but not limited to, the rating agency's revised stress loss estimates for the Company's insurance portfolio, adverse developments in the Company's or the subsidiary's financial conditions or results of operations due to underwriting or investment losses or other factors, changes in the rating agency's outlook for the financial guaranty industry or in the markets in which the Company operates, or a revision in the rating agency's capital model or ratings methodology. Their reviews can occur at any time and without notice to the Company and could result in a decision to downgrade, revise or withdraw the financial strength or financial enhancement ratings of AGL's insurance and reinsurance subsidiaries. For example, while all of the rating agencies that rate AGL subsidiaries with exposure to Puerto Rico have indicated that their evaluations of such AGL subsidiaries already take into account stress scenarios related to developments in Puerto Rico, actual developments in Puerto Rico beyond what a rating agency considered could cause that rating agency to review its ratings of such AGL subsidiaries.

Since 2008, each of S&P and Moody's has reviewed and downgraded the financial strength ratings of AGL's insurance and reinsurance subsidiaries, including AGC, AGM and AG Re. In addition, S&P and Moody's have from time to time changed the ratings outlook for certain of the Company's subsidiaries to "negative" from "stable" or have placed such ratings on watch for possible downgrade. Currently, AGM, AGC, MAC and AG Re all have AA (Stable Outlook) financial strength ratings from S&P, with the most recent change by S&P being an upgrade of AGC, AGM and AG Re from AA- (Stable Outlook) in November 2011.  Each of AGM and MAC also has a AA+ (Stable Outlook) and AGC also has a AA (Stable Outlook) financial strength rating from KBRA, while AGM and AGC have financial strength ratings in the single-A category from Moody's (A2 (Stable Outlook) and A3 (Negative(Stable Outlook), respectively), with the most recent ratings change by Moody's being a change in the outlook of AGC to NegativeStable in February 2015.August 2016. In addition, AGRO has been assigned a rating of A+ (Stable) from Best, which is Best's second highest rating. The Company periodically assesses the value of each rating assigned to each of its companies, and may as a result of such assessment request that a rating agency add or drop a rating from certain of its companies. For example, the KBRA ratings were first assigned to MAC in 2013 and to AGM in 2014 and the Best rating was first assigned to AGRO in 2015, while a Moody's rating was never requested for MAC and was dropped from AG Re and AGRO in 2015. On January 13, 2017, AGC announced that it had requested that Moody's withdraw its financial strength rating of AGC.

The Company believes that the uncertainty introduced by S&P and Moody's various actions and proposals have reduced the Company's new business opportunities and have also affected the value of the Company's product to issuers and investors. The insurance subsidiaries' financial strength ratings are an important competitive factor in the financial guaranty insurance and reinsurance markets. If the financial strength or financial enhancement ratings of one or more of the Company's insurance subsidiaries were reduced below current levels, the Company expects that would reduce the number of transactions that would benefit from the Company's insurance; consequently, a downgrade by rating agencies could harm the Company's new business production, results of operations and financial condition.

45


In addition, a downgrade may have a negative impact on the Company in respect of transactions that it has insured or reinsurance that it has assumed. For example, a downgrade of one of the Company's insurance subsidiaries may result in increased claims under financial guaranties such subsidiary has issued. Under variable rate demand obligations insured by AGM, further downgrades past rating levels specified in the transaction documents could result in the municipal obligor paying a higher rate of interest and in such obligations amortizing on a more accelerated basis than expected when the obligations originally were issued; if the municipal obligor is unable to make such interest or principal payments, AGM may receive a claim under its financial guaranty. Under interest rate swaps insured by AGM, further downgrades past specified rating levels could entitle the municipal obligor's swap counterparty to terminate the swap; if the municipal obligor owed a termination payment as a result and were unable to make such payment, AGM may receive a claim if its financial guaranty guaranteed such termination payment. For more information about increased claim payments the Company may potentially make, see "RatingsPart II, Item 8, Financial Statements and Supplementary Data, Note 6, Contracts Accounted for as Insurance, Ratings Impact on Financial Guaranty Business" in Note 6, Financial Guaranty Insurance, of the Financial Statements and Supplementary Data.Business. In certain other transactions, beneficiaries of financial guaranties issued by the Company's insurance subsidiaries may have the right to cancel the credit protection offered by the Company, which would result in the loss of future premium earnings and the reversal of any fair value gains recorded by the Company. In addition, a downgrade of AG Re or AGC could result in certain ceding companies recapturing business that they had ceded to these reinsurers. See "The downgrade of the financial strength ratings of AG Re or of AGC gives certain reinsurance counterparties the right to recapture ceded business, which would lead to a reduction in the Company's unearned premium reserve and related earnings on such reserve" below.

If AGC's financial strength or financial enhancement ratings were downgraded, the Company could be required to post additional collateral under certain of its credit derivative contracts. See "If AGC's financial strength or financial enhancement ratings were downgraded, the Company could be required to post collateral under certain of its credit derivative contracts, which could impair its liquidity and results of operations" below.

If AGM's financial strength or financial enhancement ratings were downgraded, AGM-insured GICs issued by the former AGMH subsidiaries that conducted AGMH's Financial Products Business (the "FinancialFinancial Products Companies")Companies) may

come due or may come due absent the provisionposting of collateral by the GIC issuers. The Company relies on agreements pursuant to which Dexia has agreed to guarantee or lend certain amounts, or to post liquid collateral, in regards to AGMH's former financial products business. See "Risks Related to the Company's Business—Business, Acquisitions may subject the Company to non-monetary consequences."

Furthermore, if the financial strength ratings of AGE or AGUK were downgraded, AGM or AGC may be required to contribute additional capital to their respective subsidiary pursuant to the terms of the support arrangements for such subsidiaries, including those described under "Material Contracts" in the "Regulation—United Kingdom" section of "Item 1. Business.Business, Regulation, United Kingdom, Material Contracts."

If AGC's financial strength or financial enhancement ratings were downgraded, the Company could be required to post collateral under certain of its credit derivative contracts, which could impair its liquidity and results of operations.

Within the Company’s insured CDS portfolio, the transaction documentation for approximately $3.8 billion in CDS gross par insured as of December 31, 2015 requires AGC to post eligible collateral to secure its obligations to make payments under such contracts. Eligible collateral is generally cash or U.S. government or agency securities; eligible collateral other than cash is valued at a discount to the face amount.

For approximately $3.6 billion of such contracts, AGC has negotiated caps such that the posting requirement cannot exceed a certain fixed amount, regardless of the mark-to-market valuation of the exposure or the financial strength ratings of AGC. For such contracts, AGC need not post on a cash basis more than $575 million, although the value of the collateral posted may exceed such fixed amount depending on the advance rate agreed with the counterparty for the particular type of collateral posted.

For the remaining approximately $221 million of such contracts, AGC could be required from time to time to post additional collateral without such cap based on movements in the mark-to-market valuation of the underlying exposure. 

As of December 31, 2015, the Company was posting approximately $305 million to secure its obligations under CDS, of which approximately $23 million related to the $221 million of notional described above, as to which the obligation to collateralize is not capped. In contrast, as of December 31, 2014, the Company was posting approximately $376 million to secure its obligations under CDS, of which approximately $25 million related to $242 million of notional as to which the

46


obligation to collateralize was not capped. The obligation to post collateral could impair the Company's liquidity and results of operations.

The downgrade of the financial strength ratings of AG Re or of AGC gives certain reinsurance counterparties the right to recapture ceded business, which would lead to a reduction in the Company's unearned premium reserve and related earnings on such reserve.

The downgrade of the financial strength ratings of AG Re or of AGC gives certain reinsurance counterparties the right to recapture ceded business, which would lead to a reduction in the Company's unearned premium reserve and related earnings on such reserve. With respect to a significant portion of the Company's in-force financial guaranty assumed business, based on AG Re's and AGC's current ratings and subject to the terms of each reinsurance agreement, the third party ceding company may have the right to recapture assumed business ceded to AG Re and/or AGC, and in connection therewith, to receive payment from the assuming reinsurer of an amount equal to the reinsurer’s statutory unearned premium (net of ceding commissions) and statutory loss reserves (if any) associated with that business, plus, in certain cases, an additional ceding commission. As of December 31, 2015,2016, if each third party company ceding business to AG Re and/or AGC had a right to recapture such business, and chose to exercise such right, the aggregate amounts that AG Re and AGC could be required to pay to all such companies would be approximately $55$45 million and $34$18 million, respectively.

Actions taken by the rating agencies with respect to capital models and rating methodology of the Company's business or changes in capital charges or downgrades of transactions within its insured portfolio may adversely affect its ratings, business prospects, results of operations and financial condition.

The rating agencies from time to time have evaluated the Company's capital adequacy under a variety of scenarios and assumptions. The rating agencies do not always supply clear guidance on their approach to assessing the Company's capital adequacy and the Company may disagree with the rating agencies' approach and assumptions. For example, S&P assesses each individual credit (including potential new credits) insured by the Company based on a variety of factors, including the nature of the credit, the nature of the support or credit enhancement for the credit, its tenor, and its expected and actual performance. This assessment determines the amount of capital the Company is required to maintain against that credit to maintain its financial strength ratings under S&P's capital adequacy model. Sometimes the rating agencies consider the amount of additional capital that could be required for certain risks or sectors under certain stress scenarios based on their views of developments in the market, as each have done recently with respect to the Company's exposures to Puerto Rico. Factors influencing the rating agencies are beyond management's control and not always known to the Company. In the event of an actual or perceived deterioration in creditworthiness, or a change in a rating agency's capital model or rating methodology, that rating agency may require the Company to increase the amount of capital allocated to support the affected credits, regardless of whether losses actually occur, or against potential new business. Significant reductions in the rating agencies' assessments of credits in the Company's insured portfolio can produce significant increases in the amount of capital required for the Company to maintain its financial strength ratings under the rating agencies' capital adequacy models, which may require the Company to seek additional capital. The amount of such capital required may be substantial, and may not be available to the Company on favorable terms and conditions or at all. Accordingly, the Company cannot ensure that it will seek to, or be able to, raise additional capital. The failure to raise additional required capital could result in a downgrade of the Company's ratings and thus have an adverse impact on its business, results of operations and financial condition. See "Risks Related to the Company's Capital and Liquidity Requirements—The Company may require additional capital from time to time, including from soft capital and liquidity credit facilities, which may not be available or may be available only on unfavorable terms."

Since 2009, Moody's and S&P have downgraded a number of structured finance securities and public finance bonds, including obligations that the Company insures. Additional obligations in the Company's insured portfolio may be reviewed and downgraded in the future. Downgrades of the Company's insured credits will result in higher capital requirements for the Company under the relevant rating agency capital adequacy model. If the additional amount of capital required to support such exposures is significant, the Company may need to undertake certain actions in order to maintain its ratings, including, but not limited to, raising additional capital (which, if available, may not be available on terms and conditions that are favorable to the Company); curtailing new business; or paying to transfer a portion of its in-force business to generate rating agency capital. If the Company is unable to complete any of these capital initiatives, it could suffer ratings downgrades. These capital actions or ratings downgrades could adversely affect the Company's results of operations, financial condition, ability to write new business or competitive positioning.


47


Risks Related to the Financial, Credit and Financial Guaranty Markets

Improvement in the recent difficult conditions in the U.S. and world-wide financial markets has been gradual, and theThe Company's business, liquidity, financial condition and stock price may continue to be adversely affected.affected by developments in the U.S. and world-wide financial markets.

The Company's loss reserves, profitability, financial position, insured portfolio, investment portfolio, cash flow, statutory capital and stock price could be materially affected by the U.S. and global financial markets. Upheavals in the financial markets affect economic activity and employment and therefore can affect the Company's business. The global economic outlook remains uncertain, including the overall growth rate of the U.S. economy, the fragile economic recovery in

Europe and the impact of recent political trends on the gradual tightening of global monetary conditions on emerging markets.economic order. These and other risks could materially and negatively affect the Company’s ability to access the capital markets, the cost of the Company's debt, the demand for its products, the amount of losses incurred on transactions it guarantees, the value of its investment portfolio (including its alternative investments), its financial ratings and the price of its common shares.

Some of the state and local governments and entities that issue obligations the Company insures are experiencing significant budget deficits and pension funding and revenue shortfalls that could result in increased credit losses or impairments and capital charges on those obligations.

Some of the state and local governments that issue the obligations the Company insures have experienced significant budget deficits and pension funding and revenue collection shortfalls that required them to significantly raise taxes and/or cut spending in order to satisfy their obligations. While the U.S. government has provided some financial support and although overall state revenues have increased in recent years, significant budgetary pressures remain, especially at the local government level and in relation to retirement obligations. Certain local governments, including ones that have issued obligations insured by the Company, have sought protection from creditors under chapter 9 of the U.S. Bankruptcy Code as a means of restructuring their outstanding debt. In some recent instances where local governments were seeking to restructure their outstanding debt, and partially in response to concerns that materially reducing pension payments would lead to employee flight and, therefore, an inadequate level of local government services, pension and other obligations owed to workers were treated more favorably than senior bond debt owed to the capital markets. If the issuers of the obligations in the Company's public finance portfolio do not have sufficient funds to cover their expenses and are unable or unwilling to raise taxes, decrease spending or receive federal assistance, the Company may experience increased levels of losses or impairments on its public finance obligations, which could materially and adversely affect its business, financial condition and results of operations. If such issuers succeed in restructuring pension and other obligations owed to workers so that they are treated more favorably than obligations insured by the Company, such losses or impairments could be greater than the Company otherwise anticipated when the insurance was written.

The Company's risk of loss on and capital charges for municipal credits could also be exacerbated by rating agency downgrades of municipal credit ratings. A downgraded municipal issuer may be unable to refinance maturing obligations or issue new debt, which could reduce the municipality's ability to service its debt. Downgrades could also affect the interest rate that the municipality must pay on its variable rate debt or for new debt issuance. Municipal credit downgrades, as with other downgrades, result in an increase in the capital charges the rating agencies assess when evaluating the Company's capital adequacy in their rating models. Significant municipal downgrades could result in higher capital requirements for the Company in order to maintain its financial strength ratings.

The Company insures general obligation bondshas an aggregate $4.8 billion net par exposure as of December 31, 2016 to the Commonwealth of Puerto Rico (Puerto Rico or the Commonwealth) and various obligations of its related authorities and public corporations. The Commonwealth faces a challenging economic environmentcorporations, and claim payments on such insured exposures in recent years, has experienced significant general fund budget deficits, which it had attempted to address by issuing debt. In June 2014, the Puerto Rico legislature passed the Puerto Rico Public Corporation Debt Enforcement and Recovery Act (the "Recovery Act") in order to provide a legislative framework for certain public corporations experiencing severe financial stress to restructure their debt. Investors filed suit in the United States District Court for the Districtexcess of Puerto Rico challenging the Recovery Act. On February 6, 2015, the U.S. District Court for the District of Puerto Rico ruled the Recovery Act is preemptedthat expected by the U.S. Bankruptcy CodeCompany could have a negative effect on the Company's liquidity and is therefore void. On July 6, 2015, the U.S. Courtresults of Appeals for the First Circuit upheld that ruling, and on December 4, 2015, the U.S. Supreme Court granted petitions for writs of certiorari relating to that ruling. On June 28, 2015, Governor García Padilla of Puerto Rico (the "Governor") publicly stated that the Commonwealth’s public debt, considering the current level of economic activity, is unpayable and that a comprehensive debt restructuring may be necessary, and he has made similar statements since then.operations. On January 1, 2016, Puerto Rico Infrastructure Finance Authority ("PRIFA")(PRIFA) defaulted on payment of a portion of the interest due on its bonds on that date. For those PRIFA bondsThere have been additional payment defaults by Puerto Rico issuers since then, and the Company had insured, the Company paid approximately $451 thousandhas made claim payments with respect to several Puerto Rico credits. On April 6, 2016, Governor García Padilla of claims for the interest payments on which PRIFA had defaulted. On November 30, 2015, and December 8, 2015, the Governor issued executive orders (“Clawback Orders”) directingPuerto Rico (the Former Governor) signed into law the Puerto Rico DepartmentEmergency Moratorium & Financial Rehabilitation Act (the Moratorium Act). The Moratorium Act purportedly empowers the governor to declare, entity by entity, states of Treasuryemergencies and the Puerto Rico Tourism Company to retain or transfer certain taxes and revenues pledged to

48


secure the payment of bonds issued by certain authorities. On January 7, 2016, the Company sued various Puerto Rico governmental officials in the United State District Court, District of Puerto Rico asserting that this attempt to “claw back” pledged taxes and revenues is unconstitutional, and demanding declaratory and injunctive relief. There have been a number of other proposals, plans and legislative initiatives offered in Puerto Rico and in the United States aimed at addressing Puerto Rico’s fiscal issues. Among the responses proposed is a federal financial control board and access to bankruptcy courts or another restructuring mechanism. S&P, Moody’s and Fitch Ratings have lowered the credit ratingmoratoriums on debt service payments on obligations of the Commonwealth’s bonds and on its public corporations several times over the past approximately two years, and the Commonwealth has disclosed its liquidity has been adversely affected by rating agency downgrades and by the limited market access for its debt, and also noted it has relied on short-term financings and interim loans from the Government Development Bank for Puerto Rico (“GDB”) and other private lenders, which reliance has constrained its liquidity and increased its near-term refinancing risk. The Company has an aggregate $5.1 billion net par exposure to the Commonwealth and various obligations of its related authorities and public corporations, and ifas well as instituting a stay against related litigation, among other things. The Former Governor used the authority of the Moratorium Act to take a number of actions related to issuers of obligations the Company were requiredinsures. On June 30, 2016, the Puerto Rico Oversight, Management, and Economic Stability Act (PROMESA) was signed into law by the President of the United States. PROMESA establishes a seven-member federal financial oversight board (Oversight Board) with authority to make claim paymentsrequire that balanced budgets and fiscal plans be adopted and implemented by Puerto Rico. PROMESA provides a legal framework under which the debt of the Commonwealth and its related authorities and public corporations may be voluntarily restructured, and grants the Oversight Board the sole authority to file restructuring petitions in a federal court to restructure the debt of the Commonwealth and its related authorities and public corporations if voluntary negotiations fail, provided that any such restructuring must be in accordance with an Oversight Board approved fiscal plan that respects the liens and priorities provided under Puerto Rico law. The Oversight Board has begun meeting and has hired Ramón Ruiz-Comas as interim executive director. On January 2, 2017, Ricardo Antonio Rosselló Nevares (the Governor) took office, replacing the Former Governor. On January 29, 2017, the Governor signed the Puerto Rico Emergency and Fiscal Responsibility Act (Emergency Act) that, among other things, repeals portions of the Moratorium Act, defines an emergency period until May 1, 2017, continues diversion of collateral away from bonds the Company insures, and defines the powers and duties of the Fiscal Agency and Financial Advisory Authority (FAFAA). The final shape, timing and validity of responses to Puerto Rico’s distress eventually enacted or implemented under the auspices of PROMESA and the Oversight Board or

otherwise, and the impact of any such responses on suchobligations insured exposures, such payments could have a negative effect onby the Company, is uncertain. Additional information about the Company's liquidityexposure to Puerto Rico may be found in Part II, Item 8, Financial Statements and results of operations.Supplementary Data, Note 4, Outstanding Exposure, Exposure to Puerto Rico.
 
In addition, obligations supported by specified revenue streams, such as revenue bonds issued by toll road authorities, municipal utilities or airport authorities, may be adversely affected by revenue declines resulting from reduced demand, changing demographics or other factors associated with an economy in which unemployment remains high, housing prices have not yet stabilized and growth is slow. These obligations, which may not necessarily benefit from financial support from other tax revenues or governmental authorities, may also experience increased losses if the revenue streams are insufficient to pay scheduled interest and principal payments.

Persistently low interest rate levels and credit spreads could adversely affect demand for financial guaranty insurance as well as the Company's financial condition.

Demand for financial guaranty insurance generally fluctuates with changes in market credit spreads. Credit spreads, which are based on the difference between interest rates on high-quality or "risk free" securities versus those on lower-rated or uninsured securities, fluctuate due to a number of factors and are sensitive to the absolute level of interest rates, current credit experience and investors' risk appetite. Over the last several years, interest rates generally have been lower than historical norms. In 2015, average daily AAA benchmark 30-yearAverage municipal interest rates as reflectedwere extremely low during 2016, with the benchmark AAA 30-year Municipal Market Data index published by Thomson Reuters (MMD Index), at times below 2%, a threshold not previously crossed in the MMD Index were approximately 35 basis points lower that their levels in 2014, a year in which rates were already low by historical standards.modern era. When interest rates are low, or when the market is relatively less risk averse, the credit spread between high-quality or insured obligations versus lower- rated or uninsured obligations typically narrows. As a result, financial guaranty insurance typically provides lower interest cost savings to issuers than it would during periods of relatively wider credit spreads. When issuers are less likely to use financial guaranties on their new issues when credit spreads are narrow, this results in decreased demand or premiums obtainable for financial guaranty insurance, and a resulting reduction in the Company's results of operations. The continued persistence of low interest rate levels and credit spreads could continue to dampen demand for financial guaranty insurance.

Conversely, in a deteriorating credit environment, credit spreads increase and become "wide", which increases the interest cost savings that financial guaranty insurance may provide and can result in increased demand for financial guaranties by issuers. However, if the weakening credit environment is associated with economic deterioration, the Company's insured portfolio could generate claims and loss payments in excess of normal or historical expectations. In addition, increases in market interest rate levels could reduce new capital markets issuances and, correspondingly, a decreased volume of insured transactions.

Competition in the Company's industry may adversely affect its revenues.

As described in greater detail under "Competition" in "Item 1. Business," the Company can face competition, either in the form of current or new providers of credit enhancement or in terms of alternative structures, including uninsured offerings, or pricing competition. Increased competition could have an adverse effect on the Company's insurance business.


49


The Company's financial position, results of operations and cash flows may be adversely affected by fluctuations in foreign exchange rates.

The Company's reporting currency is the U.S. dollar. The functional currencies of AGL's primary insurance and reinsurance subsidiaries are the U.S. dollar and U.K.pound sterling. Exchange rate fluctuations relative to the functional currencies may materially impact the Company's financial position, results of operations and cash flows. The Company's non-U.S. subsidiaries maintain both assets and liabilities in currencies different thanfrom their functional currency, which exposes the Company to changes in currency exchange rates. In addition, locally-required capital levels are invested in local currencies in order to satisfy regulatory requirements and to support local insurance operations regardless of currency fluctuations.

The principal currencies creating foreign exchange risk are the British pound sterling and the European Union euro. The Company cannot accurately predict the nature or extent of future exchange rate variability between these currencies or relative to the U.S. dollar. Foreign exchange rates are sensitive to factors beyond the Company's control. The Company does not engage in active management, or hedging, of its foreign exchange rate risk. Therefore, fluctuation in exchange rates between these currencies and the U.S. dollar could adversely impact the Company's financial position, results of operations and cash flows.


The Company's international operations expose it to less predictable credit and legal risks.

The Company pursues new business opportunities in international markets. The underwriting of obligations of an issuer in a foreign country involves the same process as that for a domestic issuer, but additional risks must be addressed, such as the evaluation of foreign currency exchange rates, foreign business and legal issues, and the economic and political environment of the foreign country or countries in which an issuer does business. Changes in such factors could impede the Company's ability to insure, or increase the risk of loss from insuring, obligations in the countries in which it currently does business and limit its ability to pursue business opportunities in other countries.

The Company's investment portfolio may be adversely affected by credit, interest rate and other market changes.

The Company's operating results are affected, in part, by the performance of its investment portfolio which consists primarily of fixed-income securities and short-term investments. As of December 31, 2015,2016, the fixed-maturity securities and short-term investments had a fair value of approximately $11.0$10.8 billion. Credit losses and changes in interest rates could have an adverse effect on its shareholders' equity and net income. Credit losses result in realized losses on the Company's investment portfolio, which reduce net income and shareholders' equity. Changes in interest rates can affect both shareholders' equity and investment income. For example, if interest rates decline, funds reinvested will earn less than expected, reducing the Company's future investment income compared to the amount it would earn if interest rates had not declined. However, the value of the Company's fixed-rate investments would generally increase if interest rates decreased, resulting in an unrealized gain on investments included in shareholders' equity. Conversely, if interest rates increase, the value of the investment portfolio will be reduced, resulting in unrealized losses that the Company is required to include in shareholders' equity as a change in accumulated other comprehensive income. Accordingly, interest rate increases could reduce the Company's shareholders' equity.

Interest rates are highly sensitive to many factors, including monetary policies, domestic and international economic and political conditions and other factors beyond the Company's control. The Company does not engage in active management, or hedging, of interest rate risk, and may not be able to mitigate interest rate sensitivity effectively.

The market value of the investment portfolio also may be adversely affected by general developments in the capital markets, including decreased market liquidity for investment assets, market perception of increased credit risk with respect to the types of securities held in the portfolio, downgrades of credit ratings of issuers of investment assets and/or foreign exchange movements which impactimpacting investment assets. In addition, the Company invests in securities insured by other financial guarantors, the market value of which may be affected by the rating instability of the relevant financial guarantor.

The Company also invests a portion of its excess capital in alternative investments, which also may be affected by credit, interest rate and other market changes as well as factors specific to those investments. See "Risks Related to the Company's Business - Alternative investments may not result in the benefits anticipated."

‘Brexit’ may adversely impact credits insured by the Company and may also adversely impact the Company through currency exchange rates.

On June 23, 2016, a referendum was held in the U.K. in which a majority voted to exit the EU, known as “Brexit”. The U.K. government has indicated that it intends to formally serve notice to the European Council by March 2017 of its desire to withdraw in accordance with Article 50 of the Treaty on European Union. Negotiations between the U.K. and the EU will determine the future terms of the U.K’s relationship with the EU, including the terms of trade between the U.K. and the EU. Any resulting political, social and economic uncertainty and changes arising from Brexit may have a negative impact on the economies of the U.K. as well as non-U.K. EU and EEA countries, which may increase the probability of losses on obligations insured by the Company that are exposed to risks in the U.K. and non-U.K. EU and EEA countries.

Brexit may also impact currency exchange rates. The Company reports its accounts in U.S. dollars, while some of its income, expenses and assets are denominated in other currencies, primarily the pound sterling and the euro. From December 31, 2015, to December 31, 2016, which period encompasses the Brexit vote, the value of pound sterling changed from £0.68 per dollar to £0.81 per dollar, while the euro changed from €0.83 per dollar to €0.95 per dollar. For the year ended 2016 the Company recognized losses of approximately $21 million in the consolidated statement of operations, net of tax, and approximately $32 million in OCI, net of tax, for foreign currency translation, that were primarily driven by the exchange rate fluctuations of the pound sterling. If the Company had owned AGLN during 2016, these impacts would have been greater.


Risks Related to the Company's Capital and Liquidity Requirements

Significant claim payments may reduce the Company's liquidity.

Claim payments reduce the Company's invested assets and result in reduced liquidity and net investment income, even if the Company is reimbursed in full over time and does not experience ultimate loss on a particular policy. Since the financial crisis, many of the claims paid by the Company were with respect to insured U.S. RMBS securities. More recently, there has been credit deterioration with respect to certain insured Puerto Rico credits. The Company had net par outstanding to general obligation bonds of the Commonwealth of Puerto Rico and various obligations of its related authorities and public corporations aggregating of $4.8 billion and $5.1 billion, respectively, as of December 31, 2016 and December 31, 2015, all of which was rated BIG under the Company’s rating methodology as of December 31, 2016. For a discussion of the Company's Puerto Rico risks and RMBS transactions, see Part II, Item 8, Financial Statements and Supplementary Data, Note 4, Outstanding Exposure.

As of December 31, 2016, the Company had exposure of approximately $528 million to a long-term infrastructure project that was financed by bonds that mature prior to the expiration of the project concession. The Company expects the cash flows from the project to be sufficient to repay all of the debt over the life of the project concession, and also expects the debt to be refinanced in the market at or prior to its maturity. If the issuer is unable to refinance the debt due to market conditions, the Company may have to pay claims when the debt matures from 2018 to 2022, and then recover from cash flows produced by the project in the future. The Company generally projects that in most scenarios it will be fully reimbursed for such claim payments. However, the recovery of such amounts is uncertain and may take from 10 to 35 years, depending on the performance of the underlying collateral.

The Company plans for future claim payments. If the amount of future claim payments is significantly more than projected by the Company, however, the Company's ability to make other claim payments and its financial condition, financial strength ratings and business prospects could be adversely affected.

The Company may require additional capital from time to time, including from soft capital and liquidity credit facilities, which may not be available or may be available only on unfavorable terms.

The Company's capital requirements depend on many factors, primarily related to its in-force book of business and rating agency capital requirements. The Company needs liquid assets to make claim payments on its insured portfolio and to write new business. For example, as discussed in the Risk Factor captioned "Estimates of expected losses are subject to

50


uncertainties and may not be adequate to cover potential paid claims" under Risks Related to the Company's Expected Losses, the Company has substantial exposure to infrastructure transactions with refinancing risk as to which the Company may need to make large claim payments that it did not anticipate paying when the policies were issued. Failure to raise additional capital as needed may result in the Company being unable to write new business and may result in the ratings of the Company and its subsidiaries being downgraded by one or more ratings agency. The Company's access to external sources of financing, as well as the cost of such financing, is dependent on various factors, including the market supply of such financing, the Company's long-term debt ratings and insurance financial strength ratings and the perceptions of its financial strength and the financial strength of its insurance subsidiaries. The Company's debt ratings are in turn influenced by numerous factors, such as financial leverage, balance sheet strength, capital structure and earnings trends. If the Company's need for capital arises because of significant losses, the occurrence of these losses may make it more difficult for the Company to raise the necessary capital.

Future capital raises for equity or equity-linked securities could also result in dilution to the Company's shareholders. In addition, some securities that the Company could issue, such as preferred stock or securities issued by the Company's operating subsidiaries, may have rights, preferences and privileges that are senior to those of its common shares.

Financial guaranty insurers and reinsurers typically rely on providers of lines of credit, credit swap facilities and similar capital support mechanisms (often referred to as "soft capital") to supplement their existing capital base, or "hard capital." The ratings of soft capital providers directly affect the level of capital credit which the rating agencies give the Company when evaluating its financial strength. The Company currently maintains soft capital facilities with providers having ratings adequate to provide the Company's desired capital credit. For example, effective January 1, 2016, AGC, AGM and MAC entered into a $360 million aggregate excess of loss reinsurance facility with a number of reinsurers, that covers certain U.S. public finance credits insured or reinsured by those companiescompanies. (For additional information, see Part II, Item 8, Financial Statements and Supplementary Data, Note 13, Reinsurance and Other Monoline Exposures, of the Financial Statements and Supplementary Data)Exposures). However, no assurance can be given that the Company will be able to renew any existing soft capital facilities or that one or more of the rating agencies will not downgrade or withdraw the applicable ratings of such providers in the future. In addition, the Company may not be able to replace a downgraded soft capital provider with an acceptable replacement provider for a variety of reasons, including if an acceptable replacement provider is willingunwilling to provide the Company with soft capital commitments or if anyno adequately-rated institutions are actively providing soft capital facilities. Furthermore, the rating agencies may in the future change their methodology and no longer give credit for soft capital, which may necessitate the Company having to raise additional capital in order to maintain its ratings.

An increase in AGL's subsidiaries' leverage ratio may prevent them from writing new insurance.

Insurance regulatory authorities impose capital requirements on AGL's insurance subsidiaries. These capital requirements, which include leverage ratios and surplus requirements, may limit the amount of insurance that the subsidiaries may write. The insurance subsidiaries have several alternatives available to control their leverage ratios, including obtaining capital contributions from the Company, purchasing reinsurance or entering into other loss mitigation agreements, or reducing the amount of new business written. However, a material reduction in the statutory capital and surplus of a subsidiary, whether resulting from underwriting or investment losses, a change in regulatory capital requirements or otherwise, or a disproportionate increase in the amount of risk in force, could increase a subsidiary's leverage ratio. This in turn could require that subsidiary to obtain reinsurance for existing business (which may not be available, or may be available on terms that the Company considers unfavorable), or add to its capital base to maintain its financial strength ratings. Failure to maintain regulatory capital levels could limit that subsidiary's ability to write new business.

The Company's holding companies' ability to meet its obligations may be constrained.

Each of AGL, AGUS and AGMH is a holding company and, as such, has no direct operations of its own. None of the holding companies expects to have any significant operations or assets other than its ownership of the shares of its subsidiaries.

The insurance company subsidiaries’ ability to pay dividends and make other payments depends, among other things, upon their financial condition, results of operations, cash requirements, and compliance with rating agency requirements, and is also subject to restrictions contained in the insurance laws and related regulations of their states of domicile. Restrictions applicable to AGM, AGC and AGM,MAC, and to AG Re and AGRO, are described under the "Regulation—"Regulation, United States—States, State Dividend Limitations" and "Regulation—Bermuda—"Regulation, Bermuda, Restrictions on Dividends and Distributions" sections of “Item 1. Business.” Such dividends and permitted payments are expected to be the primary source of funds for the holding companies to meet ongoing cash requirements, including operating expenses, any future debt service payments and other expenses, and to pay dividends to their respective shareholders. Accordingly, if the insurance subsidiaries cannot pay sufficient dividends or make other permitted payments at the times or in the amounts that are required, that would have an adverse effect on the ability of AGL, AGUS and AGMH to satisfy their ongoing cash requirements and on their ability to pay dividends to shareholders.

51


If AGRO were to pay dividends to its U.S. holding company parent and that U.S. holding company were to pay dividends to its Bermudian parent AG Re, such dividends would be subject to U.S. withholding tax at a rate of 30%.

The ability of AGL and its subsidiaries to meet their liquidity needs may be limited.

Each of AGL, AGUS and AGMH requires liquidity, either in the form of cash or in the ability to easily sell investment assets for cash, in order to meet its payment obligations, including, without limitation, its operating expenses, interest on debt and dividends on common shares, and to make capital investments in operating subsidiaries. The Company's operating subsidiaries require substantial liquidity in order to meet their respective payment and/or collateral posting obligations, including under financial guaranty insurance policies, CDS contracts or reinsurance agreements. They also require liquidity to pay operating expenses, reinsurance premiums, dividends to AGUS or AGMH for debt service and dividends to the Company, as well as, where appropriate, to make capital investments in their own subsidiaries. The Company cannot give any assurance that the liquidity of AGL and its subsidiaries will not be adversely affected by adverse market conditions, changes in insurance regulatory law or changes in general economic conditions.

AGL anticipates that its liquidity needs will be met by the ability of its operating subsidiaries to pay dividends or to make other payments; external financings; investment income from its invested assets; and current cash and short-term investments. The Company expects that its subsidiaries' need for liquidity will be met by the operating cash flows of such subsidiaries; external financings; investment income from their invested assets; and proceeds derived from the sale of its investment portfolio, a significant portion of which is in the form of cash or short-term investments. All of these sources of liquidity are subject to market, regulatory or other factors that may impact the Company's liquidity position at any time. As discussed above, AGL's insurance subsidiaries are subject to regulatory and rating agency restrictions limiting their ability to declare and to pay dividends and make other payments to AGL. As further noted above, external financing may or may not be available to AGL or its subsidiaries in the future on satisfactory terms.

In addition, investment income at AGL and its subsidiaries may fluctuate based on interest rates, defaults by the issuers of the securities AGL or its subsidiaries hold in their respective investment portfolios, the performance of alternative investments, or other factors that the Company does not control. Finally,Also, the value of the Company's investments may be adversely affected by changes in interest rates, credit risk and capital market conditions and therefore may adversely affect the

Company's potential ability to sell investments quickly and the price which the Company might receive for those investments. Alternative investments may be particularly difficult to sell at adequate prices or at all.

Risks Related to the Company's Business

The Company's financial guaranty products may subject it to significant risks from individual or correlated credits.

The Company is exposed to the risk that issuers of debt that it insures or other counterparties may default in their financial obligations, whether as a result of insolvency, lack of liquidity, operational failure or other reasons. Similarly, the Company could be exposed to corporate credit risk if a corporation's securities are contained in a portfolio of collateralized debt obligations ("CDOs")(CDOs) it insures, or if the corporation or financial institution is the originator or servicer of loans, mortgages or other assets backing structured securities that the Company has insured.

In addition, because the Company insures or reinsures municipal bonds, it can have significant exposures to single municipal risks; see Part II, Item 7, Management's Discussion and Analysis, Insured Portfolio, for a list of the Company's largest ten municipal risks (e.g., the Commonwealth of Puerto Rico).by revenue source. While the Company's risk of a complete loss, where it would have to pay the entire principal amount of an issue of bonds and interest thereon with no recovery, is generally lower for municipal bonds than for corporate bonds as most municipal bonds are backed by tax or other revenues, there can be no assurance that a single default by a municipality would not have a material adverse effect on its results of operations or financial condition.

The Company's ultimate exposure to a single name may exceed its underwriting guidelines, and an event with respect to a single name may cause a significant loss. The Company seeks to reduce this risk by managing exposure to large single risks, as well as concentrations of correlated risks, through tracking its aggregate exposure to single names in its various lines of business and establishing underwriting criteria to manage risk aggregations. It has also in the past obtained third party reinsurance for such exposure. The Company may insure and has insured individual public finance and asset-backed risks well in excess of $1 billion. Should the Company's risk assessments prove inaccurate and should the applicable limits prove inadequate, the Company could be exposed to larger than anticipated losses, and could be required by the rating agencies to hold additional capital against insured exposures whether or not downgraded by the rating agencies.

The Company is exposed to correlation risk across the various assets the Company insures. During periods of strong macroeconomic performance, stress in an individual transaction generally occurs in a single asset class or for idiosyncratic

52


reasons. During a broad economic downturn, a wider range of the Company's insured portfolio could be exposed to stress at the same time. This stress may manifest itself in ratings downgrades, which may require more capital, or in actual losses. In addition, while the Company has experienced catastrophic events in the past without material loss, unexpected catastrophic events may have a material adverse effect upon the Company's insured portfolio and/or its investment portfolios.

Some of the Company's direct financial guaranty products may be riskier than traditional financial guaranty insurance.

As of December 31, 20152016 and 2014,2015, 6% and 7% and 9%, respectively, of the Company's financial guaranty direct exposures were executed as credit derivatives. Traditional financial guaranty insurance provides an unconditional and irrevocable guaranty that protects the holder of a municipal finance or structured finance obligation against non-payment of principal and interest, while credit derivatives provide protection from the occurrence of specified credit events, including non-payment of principal and interest. In general, the Company structures credit derivative transactions such that circumstances giving rise to its obligation to make payments are similar to that for financial guaranty policies and generally occur when issuers fail to make payments on the underlying reference obligations. The tenor of credit derivatives exposures, like exposure under financial guaranty insurance policies, is also generally for as long as the reference obligation remains outstanding.

Nonetheless, credit derivative transactions are governed by International Swaps and Derivatives Association, Inc. ("ISDA")(ISDA) documentation and operate differently from financial guaranty insurance policies. For example, the Company's control rights with respect to a reference obligation under a credit derivative may be more limited than when it issues a financial guaranty insurance policy on a direct primary basis. In addition, a credit derivative may be terminated for a breach of the ISDA documentation or other specific events, unlike financial guaranty insurance policies. In addition, under a limited number of credit derivative contracts, the Company may be required to post eligible securities as collateral, generally cash or U.S. government or agency securities, under specified circumstances. The need to post collateral under many of these transactions is subject to caps that the Company has negotiated with its counterparties, but there are some transactions as to which the Company could be required to post collateral without such a cap based on movements in the mark-to-market valuation of the underlying exposure in excess of contractual thresholds. See "Risks Related to the Company'sPart II, Item 8, Financial StrengthStatements and Financial Enhancement Ratings—If AGC's financial strength or financial enhancement ratings were downgraded, the Company could be required to post collateral under certainSupplementary Data, Note 8, Contracts Accounted for as Credit Derivatives, Rating Sensitivities of its credit derivative contracts, which could impair its liquidity and results of operations."Credit Derivatives Contracts.


Further downgrades of one or more of the Company's reinsurers could reduce the Company's capital adequacy and return on equity. The impairment of other financial institutions also could adversely affect the Company.

At December 31, 2015,2016, the Company had ceded approximately 4% of its principal amount of insurance outstanding to third party reinsurers. In evaluating the credits insured by the Company, securities rating agencies allow capital charge "credit" for reinsurance based on the reinsurers' ratings. In recent years, a number of the Company's reinsurers were downgraded by one or more rating agencies, resulting in decreases in the credit allowed for reinsurance and in the financial benefits of using reinsurance under existing rating agency capital adequacy models. Many of the Company's reinsurers have already been downgraded to single-A or below by one or more rating agencies. The Company could be required to raise additional capital to replace the lost reinsurance credit in order to satisfy rating agency and regulatory capital adequacy and single risk requirements. The rating agencies' reduction in credit for reinsurance could also ultimately reduce the Company's return on equity to the extent that ceding commissions paid to the Company by the reinsurers were not adequately increased to compensate for the effect of any additional capital required. In addition, downgraded reinsurers may default on amounts due to the Company and such reinsurer obligations may not be adequately collateralized, resulting in additional losses to the Company and a reduction in its shareholders' equity and net income.

The Company also has exposure to counterparties in various industries, including banks, hedge funds and other investment vehicles in its insured transactions. Many of these transactions expose the Company to credit risk in the event its counterparty fails to perform its obligations.

Acquisitions may not result in the benefits anticipated.anticipated and may subject the Company to non-monetary consequences.

                From time to time and in order to deploy excess capital the Company evaluates financial guaranty portfolio and company acquisition opportunities and conducts diligence activities with respect to transactions with other financial guarantors and financial services companies. For example, during 2015 the Company acquired Radian Asset and in 2016 the Company acquired CIFG, and in each case merged it with and into AGC, with AGC as the surviving company of the merger. In January 2017, the Company acquired MBIA UK. Acquiring other financial guaranty portfolios or companies or other financial services companies may involve some or all of the various risks commonly associated with acquisitions, including, among other things: (a) failure to adequately identify and value potential exposures and liabilities of the target portfolio or entity; (b) difficulty in estimating the value of the target portfolio or entity; (c) potential diversion of management’s time and

53


attention; (d) exposure to asset quality issues of the target entity; and (e) difficulty and expense of integrating the operations, systems and personnel of the target entity. Such acquisitions may also have unintended consequences on ratings assigned by the rating agencies to the Company or its subsidiaries (see “- Risks Related to the Company’s Ratings”) or on the applicability of laws and regulations to the Company’s existing businesses. These or other factors may cause any future acquisitions of financial guaranty portfolios or companies or other financial services companies not to result in the benefits to the Company anticipated when the acquisition was agreed.

Acquisitions may subject the Company to non-monetary consequences.

Past or future acquisitions may also subject the Company to non-monetary consequences that may or may not have been anticipated or fully mitigated at the time of the acquisition. For example, as noted under "Item 3. Legal Proceedings—Proceedings Related to AGMH's Former Financial Products Business," in November 2006, AGMH received a subpoena from the Antitrust Division of the Department of Justice issued in connection with an ongoing criminal investigation of bid rigging of awards of municipal GICs and other municipal derivatives. AGMH responded to the subpoena and has had limited contact with the DOJ on the matter since late 2011. Although the subpoena relatesrelated to AGMH's former Financial Products Business, which the Company did not acquire, it was issued to AGMH, which the Company did acquire. Furthermore, while Dexia SA

Alternative investments may not result in the benefits anticipated.

From time to time in order to deploy a portion of the Company's excess capital the Company may invest in business opportunities that complement the Company's financial guaranty business, are in line with its risk profile and Dexia Crédit Local S.A., jointlybenefit from its core competencies. The alternative investments group has been investigating a number of such opportunities, including, among others, both controlling and severally, havenon-controlling investments in investment managers. For example, in February 2017 the Company agreed to indemnifypurchase up to $100 million of limited partnership interests in a fund that invests in the equity of private equity managers. The Company continues to investigate additional opportunities. Alternative investments may be riskier than many of the other investments the Company against liability arising outmakes, and may not result in the benefits anticipated at the time of these proceedings,the investment. In addition, although the Company uses what it believes to be excess capital to make alternative investments, measures of required capital can fluctuate and such indemnification mightinvestments may not be sufficientgiven much, or any, value under the various rating agency, regulatory and internal capital models to fully holdwhich the Company harmless against any injunctive reliefis subject. Also, alternative investments may be less liquid than most of the Company's other investments and so may be difficult to convert to cash or civil or criminal sanctioninvestments that do receive credit under the capital models to which the Company is imposed against AGMH orsubject. See "Risks Related to the Company's Capital and Liquidity Requirements -- The ability of AGL and its subsidiaries.subsidiaries to meet their liquidity needs may be limited."


The Company is dependent on key executives and the loss of any of these executives, or its inability to retain other key personnel, could adversely affect its business.

The Company's success substantially depends upon its ability to attract and retain qualified employees and upon the ability of its senior management and other key employees to implement its business strategy. The Company believes there are only a limited number of available qualified executives in the business lines in which the Company competes. The Company relies substantially upon the services of Dominic J. Frederico, President and Chief Executive Officer, and other executives. Although the Company has designed its executive compensation with the goal of retaining and creating incentives for its executive officers, the Company may not be successful in retaining their services. The loss of the services of any of these individuals or other key members of the Company's management team could adversely affect the implementation of its business strategy.

The Company is dependent on its information technology and that of certain third parties, and a cyber-attack, security breach or failure in such systems could adversely affect the Company’s business.

                The Company relies upon information technology and systems, including technology and systems provided by or interfacing with those of third parties, to support a variety of its business processes and activities.  In addition, the Company has collected and stored confidential information including, in connection with certain loss mitigation and due diligence activities related to its structured finance business, personally identifiable information.  While the Company does not believe that the financial guaranty industry is as inherently prone to cyber-attacks as industries relating to, for example, payment card processing, banking, critical infrastructure or defense contracting, the Company’s data systems and those of third parties on which it relies are still vulnerable to security breaches due to cyber-attacks, viruses, malware, hackers and other external hazards, as well as inadvertent errors, equipment and system failures, and employee misconduct.  Problems in or security breaches of these systems could, for example, result in lost business, reputational harm, the disclosure or misuse of confidential or proprietary information, incorrect reporting, inaccurate loss projections, legal costs and regulatory penalties. 

                The Company’s business operations rely on the continuous availability of its computer systems as well as those of certain third parties.  In addition to disruptions caused by cyber-attacks or other data breaches, such systems may be adversely affected by natural and man-made catastrophes.  The Company’s failure to maintain business continuity in the wake of such events, particularly if there were an interruption for an extended period, could prevent the timely completion of critical processes across its operations, including, for example, claims processing, treasury and investment operations and payroll.  These failures could result in additional costs, loss of business, fines and litigation.


54

TableThe Company and its subsidiaries are subject to numerous laws and regulations of Contentsa number of jurisdictions regarding its information systems, particularly with regard to personally identifiable information. The Company's failure to comply with these requirements, even absent a security breach, could result in penalties, reputational harm or difficulty in obtaining desired consents from regulatory authorities.


Risks Related to GAAP and Applicable Law

Changes in the fair value of the Company's insured credit derivatives portfolio may subject net income to volatility.

The Company is required to mark-to-market certain derivatives that it insures, including CDS that are considered derivatives under GAAP. Although there is no cash flow effect from this "marking-to-market," net changes in the fair value of the derivative are reported in the Company's consolidated statements of operations and therefore affect its reported earnings. As a result of such treatment, and given the large principal balance of the Company's CDS portfolio, small changes in the market pricing for insurance of CDS will generally result in the Company recognizing material gains or losses, with material market price increases generally resulting in large reported losses under GAAP. Accordingly, the Company's GAAP earnings will be more volatile than would be suggested by the actual performance of its business operations and insured portfolio.

The fair value of a credit derivative will be affected by any event causing changes in the credit spread (i.e., the difference in interest rates between comparable securities having different credit risk) on an underlying security referenced in the credit derivative. Common events that may cause credit spreads on an underlying municipal or corporate security referenced in a credit derivative to fluctuate include changes in the state of national or regional economic conditions, industry cyclicality, changes to a company's competitive position within an industry, management changes, changes in the ratings of the underlying security, movements in interest rates, default or failure to pay interest, or any other factor leading investors to revise expectations about the issuer's ability to pay principal and interest on its debt obligations. Similarly, common events that may cause credit spreads on an underlying structured security referenced in a credit derivative to fluctuate may include the occurrence and severity of collateral defaults, changes in demographic trends and their impact on the levels of credit

enhancement, rating changes, changes in interest rates or prepayment speeds, or any other factor leading investors to revise expectations about the risk of the collateral or the ability of the servicer to collect payments on the underlying assets sufficient to pay principal and interest. The fair value of credit derivative contracts also reflects the change in the Company's own credit cost, based on the price to purchase credit protection on AGC and AGM. For discussion of the Company's fair value methodology for credit derivatives, see Part II, Item 8, Financial Statements and Supplementary Data, Note 7, Fair Value Measurement, of the Financial Statements and Supplementary Data.Measurement.

If a credit derivative is held to maturity and no credit loss is incurred, any unrealized gains or losses previously reported would be offset as the transactions reach maturity. Due to the complexity of fair value accounting and the application of GAAP requirements, future amendments or interpretations of relevant accounting standards may cause the Company to modify its accounting methodology in a manner which may have an adverse impact on its financial results.

Change in industry and other accounting practices could impair the Company's reported financial results and impede its ability to do business.

Changes in or the issuance of new accounting standards, as well as any changes in the interpretation of current accounting guidance, may have an adverse effect on the Company's reported financial results, including future revenues, and may influence the types and/or volume of business that management may choose to pursue.

Changes in or inability to comply with applicable law could adversely affect the Company's ability to do business.

The Company’s businesses are subject to direct and indirect regulation under state insurance laws, federal securities, commodities and tax laws affecting public finance and asset backed obligations, and federal regulation of derivatives, as well as applicable laws in the other countries in which the Company operates. Future legislative, regulatory, judicial or other legal changes in the jurisdictions in which the Company does business may adversely affect its ability to pursue its current mix of business, thereby materially impacting its financial results by, among other things, limiting the types of risks it may insure, lowering applicable single or aggregate risk limits, increasing required reserves or capital, increasing the level of supervision or regulation to which the Company’s operations may be subject, imposing restrictions that make the Company’s products less attractive to potential buyers, lowering the profitability of the Company’s business activities, requiring the Company to change certain of its business practices and exposing it to additional costs (including increased compliance costs).

In particular, regulations under the Dodd-Frank Act impose requirements on activities that AGL's subsidiaries may engage in that involve “swaps” or “security-based swaps” as defined under that Act. Although final product rules published by the CFTC and SEC in August 2012 established an insurance safe-harbor that provides that AGM’s and AGC's financial guaranty insurance policies are not generally deemed swaps or security-based swaps under the Dodd-Frank Act and are therefore not subject to derivatives regulation under the Act, regulations under the Act could require certain of AGL's subsidiaries to register with the CFTC or the SEC as a “major swap participant” (“MSP”) or “major security-based swap participant” (“MSBSP”), respectively, as a result of either the legacy financial guaranty insurance policies and derivatives

55


portfolios or new activities. Subsidiaries required to register as MSPs or MSBSPs would need to satisfy the regulatory margin and capital requirements of the applicable agency and would be subject to additional compliance requirements.
The Company has analyzed the exposures created by its legacy financial guaranty insurance policies and derivatives portfolio and determined that the sizes of these exposures are not sufficiently high at the current time to require its subsidiaries to register as MSPs under the CFTC rules. However, in the event such swap exposures exceed the triggers, then one or more of AGL's subsidiaries may be required to register as an MSP with the CFTC. With respect to registration as an MSBSP, the SEC adopted final rules in August 2015, but is not yet clear when the mandatory compliance date under such rules will occur whether one or more of AGL's subsidiaries will be above the applicable triggers at that time, or, if so, what substantive regulations may be applicable.
In addition, certain of AGL's subsidiaries may be required by their counterparties to post margin with respect to either future or legacy derivative transactions when U.S. and European rules relating to margin take effect. U.S. bank regulators and the CFTC have adopted margin requirements for new derivative transactions under their jurisdiction, but declined to provide any guidance on the applicability of those requirements on non-material amendments of legacy derivative transactions. The SEC and European regulators have not yet adopted margin requirements for new derivative transactions under their jurisdiction. It is possible that some or all of the relevant regulators will take the position that amendments to existing transactions under their jurisdiction will cause the amended transactions to be treated as new derivatives for purposes of these margin rules and certain other new regulatory requirements. Such an expansion of the margin and other regulatory requirements to amendments of existing derivatives may impede the Company's ability to amend insured derivative transactions in connection with loss mitigation efforts or municipal refunding transactions.
The magnitude of capital and/or margin requirements could be substantial and, as discussed in “Risks Related to the Company's Capital and Liquidity Requirements — The Company may require additional capital from time to time, including from soft capital and liquidity credit facilities, which may not be available or may be available only on unfavorable terms,” there can be no assurance that the Company will be able to obtain, or obtain on favorable terms, such additional capital as may be required to meet these capital and/or margin requirements. 
The foregoing requirements, as well as others that could be applied to the Company as a result of the legislation, could limit the Company’s ability to conduct certain lines of business and/or subject the Company to enhanced business conduct standards and/or otherwise adversely affect its future results of operations. Because many provisions of the Dodd-Frank Act are being implemented through agency rulemaking processes, a number of which have not been completed, the Company's assessment of the legislation’s impact on its business remains uncertain and is subject to change.

In addition, the decline in the financial strength of many financial guaranty insurers has caused government officials to examine the suitability of some of the complex securities guaranteed by financial guaranty insurers. For example, NYDFS had announced that it would develop new rules and regulations for the financial guaranty industry. On September 22, 2008, the NYDFS issued Circular Letter No. 19 (2008) (the “Circular Letter”), which established best practices guidelines for financial guaranty insurers effective January 1, 2009. Although the Company is not aware of any current efforts by the NYDFS to propose legislation to formalize these guidelines, any such legislation may limit the amount of new structured finance business that AGC may write.

Furthermore, ifIf the Company fails to comply with applicable insurance laws and regulations it could be exposed to fines, the loss of insurance licenses, limitations on the right to originate new business and restrictions on its ability to pay dividends, all of which could have an adverse impact on its business results and prospects. If an insurance company’s surplus declines below minimum required levels, the insurance regulator could impose additional restrictions on the insurer or initiate insolvency proceedings. AGM, AGC and AGMMAC may increase surplus by various means, including obtaining capital contributions from the Company, purchasing reinsurance or entering into other loss mitigation arrangements, reducing the amount of new business written or obtaining regulatory approval to release contingency reserves. From time to time, AGM, MAC and AGC have obtained approval from their regulators to release contingency reserves based on losses and, in the case of AGM and MAC, also based on the expiration of itstheir insured exposure.

From time to time, legislators have called for changes to the Internal Revenue Code in order to limit or eliminate the Federal income tax exclusion for municipal bond interest. Such a change would increase the cost of borrowing for state and local governments, and as a result, could cause a decrease in infrastructure spending by states and municipalities. Municipalities may issue a lower volume of bonds, and in particular may be less likely to refund existing debt, in which case, the amount of bonds that can benefit from insurance might also be reduced.


56


AGL's ability to pay dividends may be constrained by certain insurance regulatory requirements and restrictions.

AGL is subject to Bermuda regulatory requirements that affect its ability to pay dividends on common shares and to make other payments. Under the Bermuda Companies Act 1981, as amended, AGL may declare or pay a dividend only if it has reasonable grounds for believing that it is, and after the payment would be, able to pay its liabilities as they become due, and if the realizable value of its assets would not be less than its liabilities. While AGL currently intends to pay dividends on its common shares, investors who require dividend income should carefully consider these risks before investing in AGL. In addition, if, pursuant to the insurance laws and related regulations of Bermuda, Maryland and New York, AGL's insurance subsidiaries cannot pay sufficient dividends to AGL at the times or in the amounts that it requires, it would have an adverse effect on AGL's ability to pay dividends to shareholders. See "Risks Related to the Company's Capital and Liquidity Requirements—The ability of AGL and its subsidiaries to meet their liquidity needs may be limited."


Applicable insurance laws may make it difficult to effect a change of control of AGL.

Before a person can acquire control of a U.S. or U.K. insurance company, prior written approval must be obtained from the insurance commissioner of the state or country where the insurer is domiciled. Because a person acquiring 10% or more of AGL's common shares would indirectly control the same percentage of the stock of its U.S. insurance company subsidiaries, the insurance change of control laws of Maryland, New York and the U.K. would likely apply to such a transaction. These laws may discourage potential acquisition proposals and may delay, deter or prevent a change of control of AGL, including through transactions, and in particular unsolicited transactions, that some or all of its shareholders might consider to be desirable. While AGL's Bye-Laws limit the voting power of any shareholder to less than 10%, we cannot assure you that the applicable regulatory body would agree that a shareholder who owned 10% or more of its common shares did not control the applicable insurance company subsidiary, notwithstanding the limitation on the voting power of such shares.

Changes in applicable laws and regulations resulting from Brexit may adversely affect the Company.

Brexit could lead to legal uncertainty and politically divergent national laws and regulations as the U.K. determines which EU laws to replace or replicate. Depending on the terms of Brexit, AGE may lose the ability to insure new transactions from London in non-U.K. EU and EEA countries without obtaining additional licenses, which may require a presence in another EU country. Brexit-related changes in laws and regulations may also adversely affect the Company’s surveillance and loss mitigation activities with respect to existing insured transactions in non-U.K. EU and EEA countries, especially to the extent Brexit inhibits the issuance of new guaranties in distressed situations. Brexit may also impact laws, rules and regulations applicable to U.K. entities with obligations insured by the Company and could adversely impact the ability of non-U.K. EU or EEA citizens to continue to be employed at AGE in London.

Risks Related to Taxation

Changes in U.S. tax laws could reduce the demand or profitability of financial guaranty insurance, or negatively impact the Company's investment portfolio.

Press reports indicate that the U.S. Congress is considering making major changes to the Internal Revenue Code in 2017. Any material change in the U.S. tax treatment of municipal securities, the imposition of a national sales tax or a flat tax in lieu of the current federal income tax structure in the U.S., or changes in the treatment of dividends, could adversely affect the market for municipal obligations and, consequently, reduce the demand for financial guaranty insurance and reinsurance of such obligations. Limiting or eliminating the Federal income tax exclusion for municipal bond interest would increase the cost of borrowing for state and local governments, and as a result, could cause a decrease in infrastructure spending by states and municipalities. Municipalities may issue a lower volume of bonds, and in particular may be less likely to refund existing debt, in which case, the amount of bonds that can benefit from insurance might also be reduced.

Changes in U.S. federal, state or local laws that materially adversely affect the tax treatment of municipal securities or the market for those securities, or other changes negatively affecting the municipal securities market, also may adversely impact the Company's investment portfolio, a significant portion of which is invested in tax-exempt instruments. These adverse changes may adversely affect the value of the Company's tax-exempt portfolio, or its liquidity.

Certain of the Company's foreign subsidiaries may be subject to U.S. tax.

The Company manages its business so that AGL and its foreign subsidiaries (other than AGRO and AGE) operate in such a manner that none of them should be subject to U.S. federal tax (other than U.S. excise tax on insurance and reinsurance premium income attributable to insuring or reinsuring U.S. risks, and U.S. withholding tax on certain U.S. source investment income). However, because there is considerable uncertainty as to the activities which constitute being engaged in a trade or business within the U.S., the Company cannot be certain that the IRS will not contend successfully that AGL or any of its foreign subsidiaries (other than AGRO and AGE) is/are engaged in a trade or business in the U.S. If AGL and its foreign subsidiaries (other than AGRO and AGE) were considered to be engaged in a trade or business in the U.S., each such company could be subject to U.S. corporate income and branch profits taxes on the portion of its earnings effectively connected to such U.S. business.


57


AGL, AG Re and AGRO may become subject to taxes in Bermuda after March 2035, which may have a material adverse effect on the Company's results of operations and on an investment in the Company.

The Bermuda Minister of Finance, under Bermuda's Exempted Undertakings Tax Protection Act 1966, as amended, has given AGL, AG Re and AGRO an assurance that if any legislation is enacted in Bermuda that would impose tax computed

on profits or income, or computed on any capital asset, gain or appreciation, or any tax in the nature of estate duty or inheritance tax, then subject to certain limitations the imposition of any such tax will not be applicable to AGL, AG Re or AGRO, or any of AGL's or its subsidiaries' operations, shares, debentures or other obligations until March 31, 2035. Given the limited duration of the Minister of Finance's assurance, the Company cannot be certain that it will not be subject to Bermuda tax after March 31, 2035.

U.S. Persons who hold 10% or more of AGL's shares directly or through foreign entities may be subject to taxation under the U.S. controlled foreign corporation rules.

Each 10% U.S. shareholder of a foreign corporation that is a CFC for an uninterrupted period of 30 days or more during a taxable year, and who owns shares in the foreign corporation directly or indirectly through foreign entities on the last day of the foreign corporation's taxable year on which it is a CFC, must include in its gross income for U.S. federal income tax purposes its pro rata share of the CFC's "subpart F income," even if the subpart F income is not distributed. In addition, upon a sale of shares of a CFC, 10% U.S. shareholders may be subject to U.S. federal income tax on a portion of their gain at ordinary income rates.

The Company believes that because of the dispersion of the share ownership in AGL, provisions in AGL's Bye-Laws that limit voting power, contractual limits on voting power and other factors, no U.S. Person who owns AGL's shares directly or indirectly through foreign entities should be treated as a 10% U.S. shareholder of AGL or of any of its foreign subsidiaries. It is possible, however, that the IRS could challenge the effectiveness of these provisions and that a court could sustain such a challenge, in which case such U.S. Person may be subject to taxation under U.S. tax rules.

U.S. Persons who hold shares may be subject to U.S. income taxation at ordinary income rates on their proportionate share of the Company's related person insurance income.

If the following conditions are true, then a U.S. Person who owns AGL's shares (directly or indirectly through foreign entities) on the last day of the taxable year would be required to include in its income for U.S. federal income tax purposes such person's pro rata share of the RPII of such Foreign Insurance Subsidiary (as defined below) for the entire taxable year, determined as if such RPII were distributed proportionately only to U.S. Persons at that date, regardless of whether such income is distributed:

the Company is 25% or more owned directly, indirectly through foreign entities or by attribution by U.S. Persons;

the gross RPII of AG Re or any other AGL foreign subsidiary engaged in the insurance business that has not made an election under section 953(d) of the Code to be treated as a U.S. corporation for all U.S. tax purposes or are CFCs owned directly or indirectly by AGUS (each, with AG Re, a "ForeignForeign Insurance Subsidiary")Subsidiary) were to equal or exceed 20% of such Foreign Insurance Subsidiary's gross insurance income in any taxable year; and

direct or indirect insureds (and persons related to such insureds) own (or are treated as owning directly or indirectly through entities) 20% or more of the voting power or value of the Company's shares.

In addition, any RPII that is includible in the income of a U.S. tax-exempt organization may be treated as unrelated business taxable income.

The amount of RPII earned by a Foreign Insurance Subsidiary (generally, premium and related investment income from the direct or indirect insurance or reinsurance of any direct or indirect U.S. holder of shares or any person related to such holder) will depend on a number of factors, including the geographic distribution of a Foreign Insurance Subsidiary's business and the identity of persons directly or indirectly insured or reinsured by a Foreign Insurance Subsidiary. The Company believes that each of its Foreign Insurance Subsidiaries either should not in the foreseeable future have RPII income which equals or exceeds 20% of its gross insurance income or have direct or indirect insureds, as provided for by RPII rules, that directly or indirectly own 20% or more of either the voting power or value of AGL's shares. However, the Company cannot be certain that this will be the case because some of the factors which determine the extent of RPII may be beyond its control.


58


U.S. Persons who dispose of AGL's shares may be subject to U.S. income taxation at dividend tax rates on a portion of their gain, if any.

The meaning of the RPII provisions and the application thereof to AGL and its Foreign Insurance Subsidiaries is uncertain. The RPII rules in conjunction with section 1248 of the Code provide that if a U.S. Person disposes of shares in a foreign insurance corporation in which U.S. Persons own (directly, indirectly, through foreign entities or by attribution) 25% or more of the shares (even if the amount of gross RPII is less than 20% of the corporation's gross insurance income and the ownership of its shares by direct or indirect insureds and related persons is less than the 20% threshold), any gain from the disposition will generally be treated as dividend income to the extent of the holder's share of the corporation's undistributed earnings and profits that were accumulated during the period that the holder owned the shares. This provision applies whether or not such earnings and profits are attributable to RPII. In addition, such a holder will be required to comply with certain reporting requirements, regardless of the amount of shares owned by the holder.

In the case of AGL's shares, these RPII rules should not apply to dispositions of shares because AGL is not itself directly engaged in the insurance business. However, the RPII provisions have never been interpreted by the courts or the U.S. Treasury Department in final regulations, and regulations interpreting the RPII provisions of the Code exist only in proposed form. It is not certain whether these regulations will be adopted in their proposed form, what changes or clarifications might ultimately be made thereto, or whether any such changes, as well as any interpretation or application of the RPII rules by the IRS, the courts, or otherwise, might have retroactive effect. The U.S. Treasury Department has authority to impose, among other things, additional reporting requirements with respect to RPII.

U.S. Persons who hold common shares will be subject to adverse tax consequences if AGL is considered to be a "passive foreign investment company" for U.S. federal income tax purposes.

If AGL is considered a PFIC for U.S. federal income tax purposes, a U.S. Person who owns any shares of AGL will be subject to adverse tax consequences that could materially adversely affect its investment, including subjecting the investor to both a greater tax liability than might otherwise apply and an interest charge. The Company believes that AGL is not, and currently does not expect AGL to become, a PFIC for U.S. federal income tax purposes; however, there can be no assurance that AGL will not be deemed a PFIC by the IRS.

There are currently no final or temporary regulations regarding the application of the PFIC provisions to an insurance company. The IRS recently issued proposed regulations intended to clarify the application of the PFIC provisions to an insurance company. These proposed regulations provide that a non-U.S. insurance company may only qualify for an exception to the PFIC rules if, among other things, the non-U.S. insurance company’s officers and employees perform its substantial managerial and operational activities.  This proposed regulation will not be effective until adopted in final form. In addition, Senator Wyden recently introduced the “Offshore Reinsurance Tax Fairness Act” that, if enacted, would characterize a non-U.S. insurance company with insurance liabilities of 25% or less of such company’s assets as a PFIC unless it can qualify for a temporary exception which would require its insurance liabilities to equal or exceed 10% of its assets and the satisfaction of a facts and circumstances test. Because of the legal uncertainties relating to how the proposed regulations will be interpreted and the form in which such regulations or any legislative proposal may be finalized, the Company cannot predict what impact, if any, such guidance or legislation would have on an investor that is subject to USU.S. federal income tax.

Changes in U.S. federal income tax law could materially adversely affect an investment in AGL's common shares.

Legislation has been introduced in the U.S. Congress intended to eliminate certain perceived tax advantages of companies (including insurance companies) that have legal domiciles outside the U.S. but have certain U.S. connections. For example, legislation has been introduced in Congress to limit the deductibility of reinsurance premiums paid by U.S. insurance companies to foreign affiliates and impose additional limits on deductibility of interest of foreign owned U.S. corporations. Another legislative proposal would treat a foreign corporation that is primarily managed and controlled in the U.S. as a U.S. corporation for U.S federal income tax purposes. Further, legislation based on the Tax Reform Task-Force Blueprint dated June 24, 2016, which recommends moving to a cash flow consumption-based tax system and provides for border adjustments taxing imports, may be introduced and enacted and its impact on the insurance industry may adversely impact the results of our operations. Also, legislation has previously been introduced to override the reduction or elimination of the U.S. withholding tax on certain U.S. source investment income under a tax treaty in the case of a deductible related party payment made by a U.S. member of a foreign controlled group to a foreign member of the group organized in a tax treaty country to the extent that the ultimate foreign parent corporation would not enjoy the treaty benefits with respect to such payments. It is possible that this or similar legislation could be introduced in and enacted by the current Congress or future Congresses that could have an adverse impact on the Company or the Company's shareholders.

U.S. federal income tax laws and interpretations regarding whether a company is engaged in a trade or business within the U.S. is a PFIC, or whether U.S. Persons would be required to include in their gross income the "subpart F income" of a CFC or RPII are subject to change, possibly on a retroactive basis. There currently are only recently proposed regulations

59


regarding the application of the PFIC rules to insurance companies, and the regulations regarding RPII have been in proposed form since 1991. New regulations or pronouncements interpreting or clarifying such rules may be forthcoming. The Company cannot be certain if, when, or in what form such regulations or pronouncements may be implemented or made, or whether such guidance will have a retroactive effect.

Recharacterization by the Internal Revenue Service of the Company's U.S. federal tax treatment of losses on the Company's CDS portfolio can adversely affect the Company's financial position.

As part of the Company's financial guaranty business, the Company has sold credit protection by insuring CDS entered into with various financial institutions. Assured Guaranty's CDS portfolio has experienced significant cumulative fair value losses which are only deductible for U.S. federal income tax purposes upon realization and, consequently, generate a significant deferred tax asset based on the Company's intended treatment of such losses as ordinary insurance losses upon realization. The U.S. federal income tax treatment of CDS is an unsettled area of the tax law. As such, it is possible that the Internal Revenue ServiceIRS may decide that the losses generated by the Company's CDS business should be characterized as capital rather than ordinary insurance losses, which could materially adversely affect the Company's financial condition.

An ownership change under Section 382 of the Code could have adverse U.S. federal tax consequences.

If AGL were to issue equity securities in the future, including in connection with any strategic transaction, or if previously issued securities of AGL were to be sold by the current holders, AGL may experience an "ownership change" within the meaning of Section 382 of the Code. In general terms, an ownership change would result from transactions increasing the aggregate ownership of certain stockholders in AGL's stock by more than 50 percentage points over a testing period (generally three years). If an ownership change occurred, the Company's ability to use certain tax attributes, including certain built-in losses, credits, deductions or tax basis and/or the Company's ability to continue to reflect the associated tax benefits as assets on AGL's balance sheet, may be limited. The Company cannot give any assurance that AGL will not undergo an ownership change at a time when these limitations could materially adversely affect the Company's financial condition.

AGMH likely experienced an ownership change under Section 382 of the Code.

In connection with the acquisition of AGMH, AGMH likely experienced an "ownership change" within the meaning of Section 382 of the Code. The Company has concluded that the Section 382 limitations as discussed in "An ownership change under Section 382 of the Code could have adverse U.S. federal tax consequences" are unlikely to have any material tax or accounting consequences. However, this conclusion is based on a variety of assumptions, including the Company's estimates regarding the amount and timing of certain deductions and future earnings, any of which could be incorrect. Accordingly, there can be no assurance that these limitations would not have an adverse effect on the Company's financial condition or that such adverse effects would not be material.

A change in AGL’s U.K. tax residence or its ability to otherwise qualify for the benefits of income tax treaties to which the U.K. is a party could adversely affect an investment in AGL’s common shares.
AGL is not incorporated in the U.K. and, accordingly, is only resident in the U.K. for U.K. tax purposes if it is “centrally managed and controlled” in the U.K. Central management and control constitutes the highest level of control of a company’s affairs. AGL believes it is entitled to take advantage of the benefits of income tax treaties to which the U.K. is a party on the basis that it is has established central management and control in the U.K. AGL has obtained confirmation that there is a low risk of challenge to its residency status from HMRC under the facts as they stand today. The board of directorsBoard intends to manage the affairs of AGL in such a way as to maintain its status as a company that is tax-resident in the U.K. for U.K. tax purposes and to qualify for the benefits of income tax treaties to which the U.K. is a party. However, the concept of central management and control is a case-law concept that is not comprehensively defined in U.K. statute. In addition, it is a question of fact. Moreover, tax treaties may be revised in a way that causes AGL to fail to qualify for benefits thereunder. Accordingly, a change in relevant U.K. tax law or in tax treaties to which the U.K. is a party, or in AGL’s central management and control as a factual matter, or other events, could adversely affect the ability of Assured Guaranty to manage its capital in the efficient manner that it contemplated in establishing U.K. tax residence.
Changes in U.K. tax law or in AGL’s ability to satisfy all the conditions for exemption from U.K. taxation on dividend income or capital gains in respect of its direct subsidiaries could affect an investment in AGL’s common shares.
As a U.K. tax resident, AGL is subject to U.K. corporation tax in respect of its worldwide profits (both income and capital gains), subject to applicable exemptions. The main rate of corporation tax is currently 20%.

60


With respect to income, the dividends that AGL receives from its subsidiaries should be exempt from U.K. corporation tax under the exemption contained in section 931D of the Corporation Tax Act 2009.
With respect to capital gains, if AGL were to dispose of shares in its direct subsidiaries or if it were deemed to have done so, it may realize a chargeable gain for U.K. tax purposes. Any tax charge would be based on AGL’s original acquisition cost. It is anticipated that any such future gain should qualify for exemption under the substantial shareholding exemption in Schedule 7AC to the Taxation of Chargeable Gains Act 1992. However, the availability of such exemption would depend on facts at the time of disposal, in particular the “trading” nature of the activitiesrelevant subsidiary (and, in respect of disposal before April 1, 2017 only, the Assured Guaranty group and of the relevant subsidiary.group). There is no statutory definition of what constitutes “trading” activities for this purpose and in practice reliance is placed on the published guidance of HMRC.
A change in U.K. tax law or its interpretation by HMRC, or any failure to meet all the qualifying conditions for relevant exemptions from U.K. corporation tax, could affect Assured Guaranty’s financial results of operations or its ability to provide returns to shareholders.
Assured Guaranty's financial results may be affected by measures taken in response to the OECD BEPS project.
The Organization for Economic Co-operation and Development published its final reports on Base Erosion and Profit Shifting (the “BEPS Reports”)BEPS Reports) in October 2015. The recommended actions include an examination of the definition of a “permanent establishment” and the rules for attributing profit to a permanent establishment. There are also recommended actions relating to the goal of ensuring that transfer pricing outcomes are in line with value creation, noting that the current rules may facilitate the transfer of risks or capital away from countries where the economic activity takes place. In response to this, the U.K. Government has already made or proposed draft legislation to implement changes to transfer pricing. Other recommendations have been published with respect topricing, hybrid financial instruments and the deductibility of intra-group interest and the U.K. Government has launched consultations with respect to both these matters.interest. Any further changes in U.K. tax law or changes in U.S. tax law in response to the BEPS Reports could adversely affect Assured Guaranty’s tax liability.
A new U.K. tax, the diverted profits tax ("DPT")(DPT), which is levied at 25%, came into effect from April 1, 2015, and, in substance, effectively anticipated some of the recommendations emerging from the BEPS Reports. This is an anti-avoidance measure, aimed at protecting the U.K. tax base against the diversion of profits away from the U.K. tax charge. In particular, DPT may apply to profits generated by economic activities carried out in the U.K., that are not taxed in the U.K. by reason of arrangements between companies in the same multinational group and involving a low-tax jurisdiction.jurisdiction, including co-insurance and reinsurance. It is currently unclear whether DPT would constitute a creditable tax for U.S. foreign tax credit purposes. If any member of the Assured Guaranty group is liable to DPT, this could adversely affect the Company's results of operations.

An adverse adjustment under U.K. legislation governing the taxation of U.K. tax resident holding companies on the profits of their foreign subsidiaries could adversely impact Assured Guaranty’s tax liability.

Under the U.K. “controlled foreign company” regime, the income profits of non-U.K. resident companies may, in certain circumstances, be attributed to controlling U.K. resident shareholders for U.K. corporation tax purposes. The non-U.K. resident members of the Assured Guaranty group intend to operate and manage their levels of capital in such a manner that their profits would not be taxed on AGL under the U.K. CFC regime. Assured Guaranty has obtained clearance from HMRC that none of the profits of the non-U.K. resident members of the Assured Guaranty group should be subject to U.K. tax as a result of attribution under the CFC regime on the facts as they currently stand. However, a change in the way in which Assured Guaranty operates or any further change in the CFC regime, resulting in an attribution to AGL of any of the income profits of any of AGL’s non-U.K. resident subsidiaries for U.K. corporation tax purposes, could adversely affect Assured Guaranty’s financial results of operations.

61


Risks Related to AGL's Common Shares

The market price of AGL's common shares may be volatile, which could cause the value of an investment in the Company to decline.

The market price of AGL's common shares has experienced, and may continue to experience, significant volatility. Numerous factors, including many over which the Company has no control, may have a significant impact on the market price of its common shares. These risks include those described or referred to in this "Risk Factors" section as well as, among other things:


investor perceptions of the Company, its prospects and that of the financial guaranty industry and the markets in which the Company operates;

the Company's operating and financial performance;

the Company's access to financial and capital markets to raise additional capital, refinance its debt or replace existing senior secured credit and receivables-backed facilities;

the Company's ability to repay debt;

the Company's dividend policy;

the amount of share repurchases authorized by the Company;

future sales of equity or equity-related securities;

changes in earnings estimates or buy/sell recommendations by analysts; and

general financial, economic and other market conditions.

In addition, the stock market in recent years has experienced extreme price and trading volume fluctuations that often have been unrelated or disproportionate to the operating performance of individual companies. These broad market fluctuations may adversely affect the price of AGL's common shares, regardless of its operating performance.

Furthermore, future sales or other issuances of AGL equity may adversely affect the market price of its common shares.

AGL's common shares are equity securities and are junior to existing and future indebtedness.

As equity interests, AGL's common shares rank junior to indebtedness and to other non-equity claims on AGL and its assets available to satisfy claims on AGL, including claims in a bankruptcy or similar proceeding. For example, upon liquidation, holders of AGL debt securities and shares of preferred stock and creditors would receive distributions of AGL's available assets prior to the holders of AGL common shares. Similarly, creditors, including holders of debt securities, of AGL's subsidiaries, have priority on the assets of those subsidiaries. Future indebtedness may restrict payment of dividends on the common shares.

Additionally, unlike indebtedness, where principal and interest customarily are payable on specified due dates, in the case of common shares, dividends are payable only when and if declared by AGL's board of directorsBoard or a duly authorized committee of the board.Board. Further, the common shares place no restrictions on its business or operations or on its ability to incur indebtedness or engage in any transactions, subject only to the voting rights available to stockholders generally.

Provisions in the Code and AGL's Bye-Laws may reduce or increase the voting rights of its common shares.

Under the Code, AGL's Bye-Laws and contractual arrangements, certain shareholders have their voting rights limited to less than one vote per share, resulting in other shareholders having voting rights in excess of one vote per share. Moreover, the relevant provisions of the Code may have the effect of reducing the votes of certain shareholders who would not otherwise be subject to the limitation by virtue of their direct share ownership.

More specifically, pursuant to the relevant provisions of the Code, if, and so long as, the common shares of a shareholder are treated as "controlled shares" (as determined under section 958 of the Code) of any U.S. Person (as defined below) and such controlled shares constitute 9.5% or more of the votes conferred by AGL's issued shares, the voting rights with

62


respect to the controlled shares of such U.S. Person (a "9.5%9.5% U.S. Shareholder")Shareholder) are limited, in the aggregate, to a voting power of less than 9.5%, under a formula specified in AGL's Bye-Laws. The formula is applied repeatedly until the voting power of all 9.5% U.S. Shareholders has been reduced to less than 9.5%. For these purposes, "controlled shares" include, among other things, all shares of AGL that such U.S. Person is deemed to own directly, indirectly or constructively (within the meaning of section 958 of the Code).

In addition, the Board of Directors may limit a shareholder's voting rights where it deems appropriate to do so to (1) avoid the existence of any 9.5% U.S. Shareholders, and (2) avoid certain material adverse tax, legal or regulatory consequences to the

Company or any of the Company's subsidiaries or any shareholder or its affiliates. AGL's Bye-Laws provide that shareholders will be notified of their voting interests prior to any vote taken by them.

As a result of any such reallocation of votes, the voting rights of a holder of AGL common shares might increase above 5% of the aggregate voting power of the outstanding common shares, thereby possibly resulting in such holder becoming a reporting person subject to Schedule 13D or 13G filing requirements under the Securities Exchange Act of 1934. In addition, the reallocation of votes could result in such holder becoming subject to the short swing profit recovery and filing requirements under Section 16 of the Exchange Act.

AGL also has the authority under its Bye-Laws to request information from any shareholder for the purpose of determining whether a shareholder's voting rights are to be reallocated under the Bye-Laws. If a shareholder fails to respond to a request for information or submits incomplete or inaccurate information in response to a request, the Company may, in its sole discretion, eliminate such shareholder's voting rights.

Provisions in AGL's Bye-Laws may restrict the ability to transfer common shares, and may require shareholders to sell their common shares.

AGL's Board of Directors may decline to approve or register a transfer of any common shares (1) if it appears to the Board, of Directors, after taking into account the limitations on voting rights contained in AGL's Bye-Laws, that any adverse tax, regulatory or legal consequences to AGL, any of its subsidiaries or any of its shareholders may occur as a result of such transfer (other than such as the Board of Directors considers to be de minimis), or (2) subject to any applicable requirements of or commitments to the NYSE, if a written opinion from counsel supporting the legality of the transaction under U.S. securities laws has not been provided or if any required governmental approvals have not been obtained.

AGL's Bye-Laws also provide that if the Board of Directors determines that share ownership by a person may result in adverse tax, legal or regulatory consequences to the Company, any of the subsidiaries or any of the shareholders (other than such as the Board of Directors considers to be de minimis), then AGL has the option, but not the obligation, to require that shareholder to sell to AGL or to third parties to whom AGL assigns the repurchase right for fair market value the minimum number of common shares held by such person which is necessary to eliminate such adverse tax, legal or regulatory consequences.

Existing reinsurance agreement terms may make it difficult to effect a change of control of AGL.

Some of the Company's reinsurance agreements have change of control provisions that are triggered if a third party acquires a designated percentage of AGL's shares. If a change of control provision is triggered, the ceding company may recapture some or all of the reinsurance business ceded to the Company in the past. Any such recapture could adversely affect the Company's shareholders' equity, future income or financial strength or debt ratings. These provisions may discourage potential acquisition proposals and may delay, deter or prevent a change of control of AGL, including through transactions that some or all of the shareholders might consider to be desirable.

ITEM 1B.UNRESOLVED STAFF COMMENTS

None.
ITEM 2.PROPERTIES

The principal executive offices of AGL and AG Re consist of approximately 8,250 square feet of office space located in Hamilton, Bermuda; the lease for this space expires in April 2021 and is renewable at the option of the Company.


63


In addition, the Company hashad been occupying offices at 31 West 52nd Street in New York City. In September 2015, the Company entered into a lease for 88,000 square feet of office space at 1633 Broadway in New York City;City, and later an additional 15,500 square feet for a total of 103,500 square feet; the new lease expires in February 2032, with an option, subject to certain conditions, to renew for five years at a fair market rent. The Company agreed to terminate its existing lease in August 2016 and plans to relocaterelocated its U.S. affiliates into the new office space in the summer of 2016.

Furthermore, the Company has offices in San Francisco and London. Previously,During 2016, the Company had an office in Sydney, which it closed in March 2015, and in Irvine, California, which it closed in July 2015.moved its London offices from 1 Finsbury Square to 6 Bevis Marks.

Management believes its office space is adequate for its current and anticipated needs.

ITEM 3.LEGAL PROCEEDINGS

Lawsuits arise in the ordinary course of the Company's business. It is the opinion of the Company's management, based upon the information available, that the expected outcome of litigation against the Company, individually or in the aggregate, will not have a material adverse effect on the Company's financial position or liquidity, although an adverse resolution of litigation against the Company in a fiscal quarter or year could have a material adverse effect on the Company's results of operations in a particular quarter or year.


In addition, in the ordinary course of their respective businesses, certain of the Company's subsidiaries assert claims in legal proceedings against third parties to recover losses paid in prior periods or prevent losses in the future, including those described in Part II, Item 8, Financial Statements and Supplementary Data, Note 5, Expected Loss to be Paid, Recovery Litigation. For example, as described there, in January 2016 the Company commenced an action for declaratory judgment and injunctive relief in the U.S. District Court for the District of Puerto Rico to invalidate executive orders issued by the Governor of Puerto Rico directing the retention or transfer of certain taxes and revenues pledged to secure the payment of certain bonds insured by the Company, and in July 2016, the Company filed a motion and form of complaint in the U.S. District Court for the District of Puerto Rico seeking relief from the PROMESA stay in order to file a complaint to protect its interest in certain pledged PRHTA toll revenues. As another example, in December 2008, the Company filed a claim in the Supreme Court of the State of New York against an investment manager in a transaction it insured alleging breach of fiduciary duty, gross negligence and breach of contract. The amounts, if any, the Company will recover in these and other proceedings to recover losses are uncertain, and recoveries, or failure to obtain recoveries, in any one or more of these proceedings during any quarter or year could be material to the Company's results of operations in that particular quarter or year.

The Company establishes accruals for litigation and regulatory matters to the extent it is probable that a loss has been incurred and the amount of that loss can be reasonably estimated. For litigation and regulatory matters where a loss may be reasonably possible, but not probable, or is probable but not reasonably estimable, no accrual is established, but if the matter is material, it is disclosed, including matters discussed below. The Company reviews relevant information with respect to its litigation and regulatory matters on a quarterly, and annual basis and updates its accruals, disclosures and estimates of reasonably possible loss based on such reviews.

In addition, in the ordinary course of their respective businesses, certain of the Company's subsidiaries assert claims in legal proceedings against third parties to recover losses paid in prior periods or prevent losses in the future. For example, as described in the "Recovery Litigation," section of Note 5, Expected Loss to be Paid, of the Financial Statements and Supplementary Data, in January 2016 the Company commenced an action for declaratory judgment and injunctive relief in the U.S. District Court for the District of Puerto Rico to invalidate executive orders issued by the Governor of Puerto Rico directing the retention or transfer of certain taxes and revenues pledged to secure the payment of certain bonds insured by the Company. Also, in December 2008, the Company filed a claim in the Supreme Court of the State of New York against an investment manager in a transaction it insured alleging breach of fiduciary duty, gross negligence and breach of contract. The amounts, if any, the Company will recover in proceedings to recover losses are uncertain, and recoveries, or failure to obtain recoveries, in any one or more of these proceedings during any quarter or year could be material to the Company's results of operations in that particular quarter or year.


64


Proceedings Relating to the Company's Financial Guaranty Business

The Company receives subpoenas duces tecum and interrogatories from regulators from time to time.

On November 28, 2011, Lehman Brothers International (Europe) (in administration) ("LBIE")(LBIE) sued AG Financial Products Inc. ("AGFP")(AGFP), an affiliate of AGC which in the past had provided credit protection to counterparties under credit default swaps. AGC acts as the credit support provider of AGFP under these credit default swaps. LBIE's complaint, which was filed in the Supreme Court of the State of New York, alleged that AGFP improperly terminated nine credit derivative transactions between LBIE and AGFP and improperly calculated the termination payment in connection with the termination of 28 other credit derivative transactions between LBIE and AGFP. Following defaults by LBIE, AGFP properly terminated the transactions in question in compliance with the agreement between AGFP and LBIE, and calculated the termination payment properly. AGFP calculated that LBIE owes AGFP approximately $29 million in connection with the termination of the credit derivative transactions, whereas LBIE asserted in the complaint that AGFP owes LBIE a termination payment of approximately $1.4 billion. On February 3, 2012, AGFP filed a motion to dismiss certain of the counts in the complaint, and on March 15, 2013, the court granted AGFP's motion to dismiss the count relating to improper termination of the nine credit derivative transactions and denied AGFP's motion to dismiss the counts relating to the remaining transactions. On February 22, 2016, AGFP filed a motion for summary judgment on the remaining causes of action asserted by LBIE and on AGFP's counterclaims. LBIE’s administrators disclosed in an April 10, 2015 report to LBIE’s unsecured creditors that LBIE's valuation expert has calculated LBIE's damages in aggregate for the 28 transactions to range between a minimum of approximately $200 million and a maximum of approximately $500 million, depending on what adjustment, if any, is made for AGFP's credit risk and excluding any applicable interest. Notwithstanding the range calculated by LBIE's valuation expert, the Company cannot reasonably estimate the possible loss, if any, that may arise from this lawsuit.

On September 25, 2013, Wells Fargo Bank, N.A., as trust administrator of the MASTR Adjustable Rate Mortgages Trust 2007-3 (Wells Fargo), filed an interpleader complaint in the U.S. District Court for the Southern District of New York againstseeking adjudication of a dispute between Wales LLC (Wales) and AGM among others, relatingas to the right ofwhether AGM is entitled to be reimbursedreimbursement from certain cashflows for principal claims paid in respect of insured certificates. On September 30, 2016, the court issued an opinion denying a motion for judgment on the pleadings filed by Wales. On January 3, 2017, the Court approved a Stipulation and Order of Dismissal of Wales from the action due to Wales having sold its interests in the MASTR Adjustable Rate Mortgages Trust 2007-3 certificates. On February 9, 2017, the remaining parties submitted a Stipulation and (Proposed) Order of Voluntary Dismissal, which the Court has not yet so-ordered. The Company estimates that an adverse outcome to the interpleader proceeding could increase losses on the transaction by approximately $10 - $20 million, net of expected settlement payments and reinsurance in force.

Proceedings Resolved Since September 30, 2015

On May 28,December 22, 2014, Houston CasualtyDeutsche Bank National Trust Company, Europe, Seguros y Reseguros, S.A. (“HCCE”) notified Radian Asset that it was demanding arbitration against Radian Asset in connection with housing cooperative losses presented to Radian Asset by HCCE under several years of quota-share surety reinsurance contracts. Through November 30, 2015, HCCE had presented AGC, as successor to Radian Asset, with approximately €15 million in claims.  In January 2016, Assured Guaranty and HCCE settled all the claims related to the Spanish housing cooperative losses.

Proceedings Related to AGMH's Former Financial Products Business

The following is a description of legal proceedings involving AGMH's former Financial Products Business. Although the Company did not acquire AGMH's former Financial Products Business, which included AGMH's former GIC business, medium term notes business and portions of the leveraged lease businesses, certain legal proceedings relating to those businesses are against entities that the Company did acquire. While Dexia SA and Dexia Crédit Local S.A., jointly and severally, have agreed to indemnify the Company against liability arising out of the proceedings described below in the "—Proceedings Related to AGMH's Former Financial Products Business" section, such indemnification might not be sufficient to fully hold the Company harmless against any injunctive relief or civil or criminal sanction that is imposed against AGMH or its subsidiaries.

Governmental Investigations into Former Financial Products Business

AGMH and/or AGM have received subpoenas duces tecum and interrogatories or civil investigative demands from the Attorneys General of the States of Connecticut, Florida, Illinois, Massachusetts, Missouri, New York, Texas and West Virginia relating to their investigations of alleged bid rigging of municipal GICs. AGMH has been responding to such requests. AGMH may receive additional inquiries from these or other regulators and expects to provide additional information to such regulators regarding their inquiries in the future. In addition, AGMH received a subpoena from the Antitrust Division of the Department of Justice in November 2006 issued in connection with an ongoing criminal investigation of bid rigging of awards of municipal GICs and other municipal derivatives. Pursuant to that subpoena, AGMH has furnished to the Department of Justice records and other information with respect to AGMH’s municipal GIC business. The ultimate loss that may arise from these investigations remains uncertain.

65


Lawsuits Relating to Former Financial Products Business

During 2008, nine putative class action lawsuits were filed in federal court alleging federal antitrust violations in the municipal derivatives industry, seeking damages and alleging, among other things, a conspiracy to fix the pricing of, and manipulate bids for, municipal derivatives, including GICs. These cases have been coordinated and consolidated for pretrial proceedings in the U.S. District Courtindenture trustee for the Southern District of New York as MDL 1950, In re Municipal Derivatives Antitrust Litigation, Case No. 1:08-cv-2516 (“MDL 1950”). Five of these cases named both AGMH and AGM: (a) Hinds County, Mississippi v. Wachovia Bank, N.A.; (b) Fairfax County, Virginia v. Wachovia Bank, N.A.; (c) Central Bucks School District, Pennsylvania v. Wachovia Bank, N.A.; (d) Mayor and City Council of Baltimore, Maryland v. Wachovia Bank, N.A.; and (e) Washington County, Tennessee v. Wachovia Bank, N.A. In April 2009, the MDL 1950 court granted the defendants’ motion to dismiss on the federal claims for these five cases, but granted leave for the plaintiffs to file an amended complaint. The Corrected Third Consolidated Amended Class Action Complaint, filed on October 9, 2013, lists neither AGM nor AGMH as a named defendant or a co-conspirator. The complaint generally seeks unspecified monetary damages, interest, attorneys’ fees and other costs. The other four cases named AGMH (but not AGM) and also alleged that the defendants violated California state antitrust law and common law by engaging in illegal bid-rigging and market allocation, thereby depriving the cities or municipalities of competition in the awarding of GICs and ultimately resulting in the cities paying higher fees for these products: (f) City of Oakland, California v. AIG Financial Products Corp.; (g) County of Alameda, California v. AIG Financial Products Corp.; (h) City of Fresno, California v. AIG Financial Products Corp.; and (i) Fresno County Financing Authority v. AIG Financial Products Corp. When the four plaintiffsAAA Trust 2007-2 Re-REMIC (the Trustee), filed a consolidated complaint“trust instructional proceeding” petition in September 2009, the plaintiffs did not name AGMH as a defendant. However, the complaint does describe some of AGMH’s and AGM’s activities. The consolidated complaint generally seeks unspecified monetary damages, interest, attorneys’ fees and other costs. In April 2010, the MDL 1950 court granted in part and denied in part the named defendants’ motions to dismiss this consolidated complaint. On September 22, 2015, the remaining parties to the putative class action reported to the MDL 1950 Court that settlements in principle had been reached, and a motion for preliminary approval of those putative class claims was filed on February 24, 2016. The parties have reported that final settlement with those remaining defendants would resolve the putative class case. The Company cannot reasonably estimate the possible loss, if any, or range of loss that may arise from these lawsuits.
In 2008, AGMH and AGM also were named in five non-class action lawsuits originally filed in the California Superior Courts alleging violations of California law related to the municipal derivatives industry: (a) City of Los Angeles, California v. Bank of America, N.A.; (b) City of Stockton, California v. Bank of America, N.A.; (c) County of San Diego, California v. Bank of America, N.A.; (d) County of San Mateo, California v. Bank of America, N.A.; and (e) County of Contra Costa, California v. Bank of America, N.A. Amended complaints in these actions were filed in September 2009, adding a federal antitrust claim and naming AGM (but not AGMH) and AGUS, among other defendants. These cases have been transferred to the Southern District of New York and consolidated with MDL 1950 for pretrial proceedings. In late 2009, AGM and AGUS, among other defendants, were named in six additional non-class action cases filed in federal court, which also have been coordinated and consolidated for pretrial proceedings with MDL 1950; one was voluntarily dismissed with prejudice in October 2010, leaving five that are currently pending: (f) City of Riverside, California v. Bank of America, N.A.; (g) Los Angeles World Airports v. Bank of America, N.A.; (h) Redevelopment Agency of the City of Stockton v. Bank of America, N.A.; (i) Sacramento Suburban Water District v. Bank of America, N.A.; and (j) County of Tulare, California v. Bank of America, N.A. The MDL 1950 court denied AGM and AGUS's motions to dismiss the eleven complaints that were pending as of April 2010. Amended complaints were filed in May 2010. The complaints in these lawsuits generally seek or sought unspecified monetary damages, interest, attorneys’ fees, costs and other expenses. The Company cannot reasonably estimate the possible loss, if any, or range of loss that may arise from the remaining lawsuits.
In May 2010, AGM and AGUS, among other defendants, were named in five additional non-class action cases filed in federal court in California: (a) City of Richmond, California v. Bank of America, N.A. (filed on May 18, 2010, N.D. California); (b) City of Redwood City, California v. Bank of America, N.A. (filed on May 18, 2010, N.D. California); (c) Redevelopment Agency of the City and County of San Francisco, California v. Bank of America, N.A. (filed on May 21, 2010, N.D. California); (d) East Bay Municipal Utility District, California v. Bank of America, N.A. (filed on May 18, 2010, N.D. California); and (e) City of San Jose and the San Jose Redevelopment Agency, California v. Bank of America, N.A (filed on May 18, 2010, N.D. California). These cases have also been transferred to the Southern District of New York and consolidated with MDL 1950 for pretrial proceedings. In September 2010, AGM and AGUS, among other defendants, were named in a sixth additional non-class action filed in federal court in New York, but which alleges violation of New York’s Donnelly Act in addition to federal antitrust law: Active Retirement Community, Inc. d/b/a Jefferson’s Ferry v. Bank of America, N.A. (filed on September 21, 2010, E.D. New York), which has also been transferred to the Southern District of New York and consolidated with MDL 1950 for pretrial proceedings. In December 2010, AGM and AGUS, among other defendants, were named in a seventh additional non-class action filed in federal court in the Central District of California, Los Angeles Unified School District v. Bank of America, N.A., and in an eighth additional non-class action filed in federal court in the Southern District of New York, Kendal on

66


Hudson, Inc. v. Bank of America, N.A. These cases also have been consolidated with MDL 1950 for pretrial proceedings. The complaints in these lawsuits generally seek unspecified monetary damages, interest, attorneys’ fees, costs and other expenses. The Company cannot reasonably estimate the possible loss, if any, or range of loss that may arise from these lawsuits.
In January 2011, AGM and AGUS, among other defendants, were named in an additional non-class action case filed in federal court in New York, which alleges violation of New York’s Donnelly Act in addition to federal antitrust law: Peconic Landing at Southold, Inc. v. Bank of America, N.A. This case has been consolidated with MDL 1950 for pretrial proceedings. The complaint in this lawsuit generally seeks unspecified monetary damages, interest, attorneys’ fees, costs and other expenses. The Company cannot reasonably estimate the possible loss, if any, or range of loss that may arise from this lawsuit.
In September 2009, the Attorney General of the State of West Virginia filed a lawsuit (Circuit Ct. Mason County, W. Va.) against BankCalifornia Superior Court (Probate Division, Orange County), seeking the court’s instruction as to how it should allocate the losses resulting from its December 2014 sale of America, N.A. alleging West Virginia state antitrust violationsfour RMBS owned by the AAA Trust 2007-2 Re-REMIC. This sale of approximately $70 million principal balance of RMBS was made pursuant to AGC’s liquidation direction in the municipal derivatives industry, seeking damagesNovember 2014, and alleging, among other things, a conspiracy to fix the pricingresulted in approximately $27 million of and manipulate bids for, municipal derivatives, including GICs. An amended complaint in this action was filed in June 2010, adding a federal antitrust claim and naming AGM (but not AGMH) and AGUS, among other defendants. This case has been removed to federal court as well as transferredgross proceeds to the S.D.N.Y. and consolidated with MDL 1950 for pretrial proceedings. AGM and AGUS answered West Virginia's Second Amended Complaint on November 11, 2013. The complaint in this lawsuit generally seeks civil penalties, unspecified monetary damages, interest, attorneys’ fees, costs and other expenses. The Company cannot reasonably estimateRe-REMIC. On December 22, 2014, AGC directed the possible loss, if any, or range of loss that may ariseindenture trustee to allocate to the uninsured Class A-3 Notes the losses realized from this lawsuit.the sale. On May 4, 2015, the Superior Court rejected AGC’s allocation

direction, and ordered the Trustee to allocate to the Class A-3 noteholders a pro rata share of the $27 million of gross proceeds. AGC is appealing the Superior Court’s decision to the California Court of Appeal.

ITEM 4.MINE SAFETY DISCLOSURES

Not applicable.

Executive Officers of the Company

The table below sets forth the names, ages, positions and business experience of the executive officers of Assured Guaranty Ltd.

NameAge Position(s)
Dominic J. Frederico6364 President and Chief Executive Officer; Deputy Chairman
James M. Michener6364 General Counsel and Secretary
Russell B. Brewer II5859 Chief Surveillance Officer
Robert A. Bailenson4950 Chief Financial Officer
Bruce E. Stern6162 Executive Officer
Howard W. Albert5657 Chief Risk Officer

Dominic J. Frederico has been a director of AGL since the Company's 2004 initial public offering and the President and Chief Executive Officer of AGL since December 2003. Mr. Frederico served as Vice Chairman of ACE Limited from 2003 until 2004 and served as President and Chief Operating Officer of ACE Limited and Chairman of ACE INA Holdings, Inc. from 1999 to 2003. Mr. Frederico was a director of ACE Limited from 2001 through 2005. From 1995 to 1999 Mr. Frederico served in a number of executive positions with ACE Limited. Prior to joining ACE Limited, Mr. Frederico spent 13 years working for various subsidiaries of American International Group.

James M. Michener has been General Counsel and Secretary of AGL since February 2004. Prior to joining Assured Guaranty, Mr. Michener was General Counsel and Secretary of Travelers Property Casualty Corp. from January 2002 to February 2004. From April 2001 to January 2002, Mr. Michener served as general counsel of Citigroup's Emerging Markets business. Prior to joining Citigroup's Emerging Markets business, Mr. Michener was General Counsel of Travelers Insurance from April 2000 to April 2001 and General Counsel of Travelers Property Casualty Corp. from May 1996 to April 2000.

Russell B. Brewer II has been Chief Surveillance Officer of AGL since November 2009 and Chief Surveillance Officer of AGC and AGM since July 2009 and has also been responsible for information technology at Assured Guaranty since April 2015. Mr. Brewer has been with AGM since 1986. Mr. Brewer was Chief Risk Management Officer of AGM from September 2003 until July 2009 and Chief Underwriting Officer of AGM from September 1990 until September 2003. Mr. Brewer was also a member of the Executive Management Committee of AGM. He was a Managing Director of AGMH

67


from May 1999 until July 2009. From March 1989 to August 1990, Mr. Brewer was Managing Director, Asset Finance Group, of AGM. Prior to joining AGM, Mr. Brewer was an Associate Director of Moody's Investors Service, Inc.

Robert A. Bailenson has been Chief Financial Officer of AGL since June 2011. Mr. Bailenson has been with Assured Guaranty and its predecessor companies since 1990. Mr. Bailenson became Chief Accounting Officer of AGM in July 2009 and has been Chief Accounting Officer of AGL since May 2005 and Chief Accounting Officer of AGC since 2003. He was Chief Financial Officer and Treasurer of AG Re from 1999 until 2003 and was previously the Assistant Controller of Capital Re Corp., the Company's predecessor.

Bruce E. Stern has been Executive Officer of AGC and AGM since July 2009. Mr. Stern was General Counsel, Managing Director, Secretary and Executive Management Committee member of AGM from 1987 until July 2009. Prior to joining AGM, Mr. Stern was an associate at the New York office of Cravath, Swaine & Moore. Mr. Stern has served as Chairman of the Association of Financial Guaranty Insurers since April 2010.

Howard W. Albert has been Chief Risk Officer of AGL since May 2011. Prior to that, he was Chief Credit Officer of AGL from 2004 to April 2011. Mr. Albert joined Assured Guaranty in September 1999 as Chief Underwriting Officer of Capital Re Company, the predecessor to AGC. Before joining Assured Guaranty, he was a Senior Vice President with Rothschild Inc. from February 1997 to August 1999. Prior to that, he spent eight years at Financial Guaranty Insurance Company from May 1989 to February 1997, where he was responsible for underwriting guaranties of asset-backed securities

and international infrastructure transactions. Prior to that, he was employed by Prudential Capital, an investment arm of The Prudential Insurance Company of America, from September 1984 to April 1989, where he underwrote investments in asset-backed securities, corporate loans and project financings.


68


PART II
 
ITEM 5.MARKET FOR REGISTRANT'S COMMON EQUITY, RELATED STOCKHOLDER MATTERS AND ISSUER PURCHASES OF EQUITY SECURITIES

AGL's common shares are listed on the NYSE under symbol "AGO." The table below sets forth, for the calendar quarters indicated, the reported high and low sales prices and amount of any cash dividends declared.

Common Stock Prices and Dividends

2015 20142016 2015
Sales Price Cash Sales Price CashSales Price Cash Sales Price Cash
High Low Dividends High Low DividendsHigh Low Dividends High Low Dividends
First Quarter$26.96
 $24.21
 $0.12
 $26.76
 $20.44
 $0.11
$26.82
 $21.79
 $0.13
 $26.96
 $24.21
 $0.12
Second Quarter29.75
 22.55
 0.12
 26.78
 23.10
 0.11
27.45
 23.43
 0.13
 29.75
 22.55
 0.12
Third Quarter26.87
 22.86
 0.12
 24.91
 21.61
 0.11
28.07
 24.69
 0.13
 26.87
 22.86
 0.12
Fourth Quarter29.62
 24.39
 0.12
 26.79
 20.02
 0.11
39.03
 27.42
 0.13
 29.62
 24.39
 0.12

On February 23, 2016,21, 2017, the closing price for AGL's common shares on the NYSE was $23.81,$41.36, and the approximate number of shareholders of record at the close of business on that date was 81.76.

AGL is a holding company whose principal source of income is dividends from its operating subsidiaries. The ability of the operating subsidiaries to pay dividends to AGL and AGL's ability to pay dividends to its shareholders are each subject to legal and regulatory restrictions. The declaration and payment of future dividends will be at the discretion of AGL's Board of Directors and will be dependent upon the Company's profits and financial requirements and other factors, including legal restrictions on the payment of dividends and such other factors as the Board of Directors deems relevant. For more information concerning AGL's dividends, please refer to Part II, Item 7. Management's Discussion and Analysis of Financial Condition and Results of Operations, under the caption "LiquidityLiquidity and Capital Resources"Resources and Item 8, Financial Statements and Supplementary Data, Note 11, Insurance Company Regulatory Requirements, of the Financial Statements and Supplementary Data.Requirements.

20152016 Share Purchases

In 2015,2016, the Company repurchased a total of 21.010.7 million common shares for approximately $555$306 million, at an average price of $26.43$28.53 per share. After additional repurchases in 2016,From time to time, the Company exhausted its previous $400 million authorization toBoard authorizes the repurchase of common sharesshares. Most recently, on February 9, 2016. On February 24, 2016,22, 2017, the Board approved an incremental $300 million in share repurchases, which brings the current authorization, as of Directors approved a $250 million share repurchase authorization.February 23, 2017, to $407 million. The Company expects future common share repurchases under the current authorization to be made from time to time in the open market or in privately negotiated transactions. The timing, form and amount of the share repurchases are at the discretion of management and will depend on a variety of factors, including availability of funds at the holding companies, market conditions, the Company's capital position, legal requirements and other factors. The repurchase authorization may be modified, extended or terminated by the Board of Directors at any time. It does not have an expiration date. See Part II, Item 8, Financial Statements and Supplementary Data, Note 18, Shareholders' Equity for additional information about share repurchases and authorizations.

69


Issuer’s Purchases of Equity Securities
 
The following table reflects purchases of AGL common shares made by the Company during Fourth Quarter 2015.2016.
 
Period 
Total
Number of
Shares
Purchased
 
Average
Price Paid
Per Share
 
Total Number of
Shares Purchased as
Part of Publicly
Announced Program (1)
 
Maximum Number (or Approximate Dollar Value)
of Shares that
May Yet Be
Purchased
Under the Program(2)
 
Total
Number of
Shares
Purchased
 
Average
Price Paid
Per Share
 
Total Number of
Shares Purchased as
Part of Publicly
Announced Program (1)
 
Maximum Number (or Approximate Dollar Value)
of Shares that
May Yet Be
Purchased
Under the Program(2)
October 1 - October 31 1,660,310
 $27.10
 1,660,310
 $145,035,556
 692,002
 $28.90
 692,002
 $95,000,101
November 1 - November 30 1,628,406
 $27.63
 1,628,406
 $100,036,984
 703,510
 $33.21
 703,510
 $321,635,067
December 1 - December 31 1,746,921
 $25.76
 1,746,921
 $55,035,579
 1,905,105
 $38.03
 1,905,105
 $249,175,822
Total 5,035,637
 $26.81
 5,035,637
  
 3,300,617
 $35.09
 3,300,617
  
____________________
(1)After giving effect to repurchases since the beginning of 2013 through February 9, 2016,23, 2017, the Company has repurchased a total of 60.272.2 million common shares for approximately $1,464$1,857 million, excluding commissions, at an average price of $24.33$25.71 per share. On February 24, 2016, the Company's Board of Directors approved a $250 million share repurchase authorization; as of the filing date, the Company has not repurchased any common shares under this authorization.

(2)Excludes commissions.

70


Performance Graph

Set forth below are a line graph and a table comparing the dollar change in the cumulative total shareholder return on AGL's common shares from December 31, 20102011 through December 31, 20152016 as compared to the cumulative total return of the Standard & Poor's 500 Stock Index and the cumulative total return of the Standard & Poor's 500 Financials Index. The chart and table depict the value on December 31, 2010, December 31, 2011, December 31, 2012, December 31, 2013, December 31, 2014, December 31, 2015 and December 31, 20152016 of a $100 investment made on December 31, 2010,2011, with all dividends reinvested:
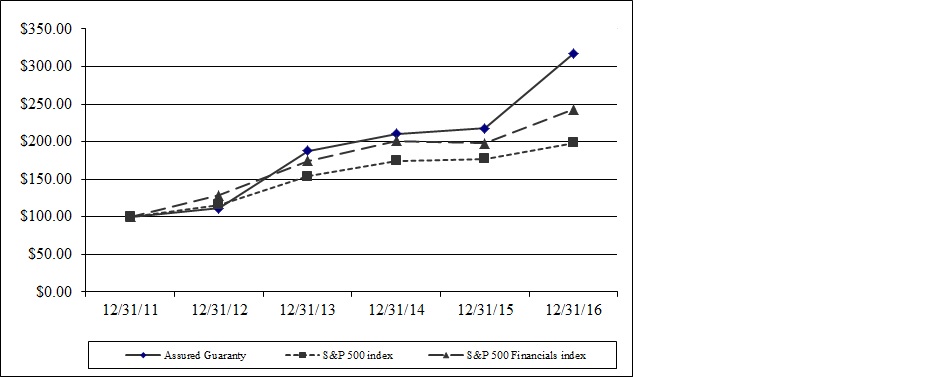
Assured Guaranty S&P 500 Index 
S&P 500
Financial Index
Assured Guaranty S&P 500 Index 
S&P 500
Financial Index
12/31/2010$100.00
 $100.00
 $100.00
12/31/201175.22
 102.11
 82.94
$100.00
 $100.00
 $100.00
12/31/201283.62
 118.44
 106.78
111.17
 115.99
 128.74
12/31/2013141.19
 156.79
 144.78
187.70
 153.54
 174.56
12/31/2014158.40
 178.24
 166.76
210.58
 174.54
 201.06
12/31/2015163.95
 180.66
 164.15
217.95
 176.93
 197.92
12/31/2016317.34
 198.07
 242.95
___________________
Source: Bloomberg


71


ITEM 6.SELECTED FINANCIAL DATA

The following selected financial data should be read together with the other information contained in this Form 10-K, including "Management's Discussion and Analysis of Financial Condition and Results of Operations" and the consolidated financial statements and related notes included elsewhere in this Form 10-K.

Year Ended December 31,Year Ended December 31,
2015 2014 2013 2012 20112016 2015 2014 2013 2012
(dollars in millions, except per share amounts)(dollars in millions, except per share amounts)
Statement of operations data:                  
Revenues:                  
Net earned premiums$766
 $570
 $752
 $853
 $920
$864
 $766
 $570
 $752
 $853
Net investment income423
 403
 393
 404
 396
408
 423
 403
 393
 404
Net realized investment gains (losses)(26) (60) 52
 1
 (18)(29) (26) (60) 52
 1
Realized gains and other settlements on credit derivatives(18) 23
 (42) (108) 6
29
 (18) 23
 (42) (108)
Net unrealized gains (losses) on credit derivatives746
 800
 107
 (477) 554
69
 746
 800
 107
 (477)
Fair value gains (losses) on committed capital securities27
 (11) 10
 (18) 35
0
 27
 (11) 10
 (18)
Fair value gains (losses) on financial guaranty variable interest entities38
 255
 346
 191
 (146)38
 38
 255
 346
 191
Bargain purchase gain and settlement of pre-existing relationships214


259
 214


Other income (loss)37
 14
 (10) 108
 58
39
 37
 14
 (10) 108
Total revenues2,207
 1,994
 1,608
 954
 1,805
1,677
 2,207
 1,994
 1,608
 954
Expenses:                  
Loss and loss adjustment expenses424
 126
 154
 504
 448
295
 424
 126
 154
 504
Amortization of deferred acquisition costs(1)
20
 25
 12
 14
 17
18
 20
 25
 12
 14
Interest expense101
 92
 82
 92
 99
102
 101
 92
 82
 92
Other operating expenses(1)
231
 220
 218
 212
 212
245
 231
 220
 218
 212
Total expenses776
 463
 466
 822
 776
660
 776
 463
 466
 822
Income (loss) before (benefit) provision for income taxes1,431

1,531

1,142

132

1,029
1,017

1,431

1,531

1,142

132
Provision (benefit) for income taxes375
 443
 334
 22
 256
136
 375
 443
 334
 22
Net income (loss)1,056
 1,088
 808
 110
 773
881
 1,056
 1,088
 808
 110
Earnings (loss) per share:                  
Basic$7.12
 $6.30
 $4.32
 $0.58
 $4.21
$6.61
 $7.12
 $6.30
 $4.32
 $0.58
Diluted$7.08
 $6.26
 $4.30
 $0.57
 $4.16
$6.56
 $7.08
 $6.26
 $4.30
 $0.57
Dividends per share$0.48
 $0.44
 $0.40
 $0.36
 $0.18
$0.52
 $0.48
 $0.44
 $0.40
 $0.36

72


As of December 31,As of December 31,
2015 2014 2013 2012 20112016 2015 2014 2013 2012
(dollars in millions, except per share amounts)(dollars in millions, except per share amounts)
Balance sheet data (end of period):                  
Assets:                  
Investments and cash$11,358
 $11,459
 $10,969
 $11,223
 $11,314
$11,103
 $11,358
 $11,459
 $10,969
 $11,223
Premiums receivable, net of commissions payable693
 729
 876
 1,005
 1,003
576
 693
 729
 876
 1,005
Ceded unearned premium reserve232
 381
 452
 561
 709
206
 232
 381
 452
 561
Salvage and subrogation recoverable126
 151
 174
 456
 368
365
 126
 151
 174
 456
Credit derivative assets81
 68
 94
 141
 153
13
 81
 68
 94
 141
Total assets(2)
14,544
 14,919
 16,285
 17,240
 17,705
14,151
 14,544
 14,919
 16,285
 17,240
Liabilities and shareholders' equity:                  
Unearned premium reserve3,996
 4,261
 4,595
 5,207
 5,963
3,511
 3,996
 4,261
 4,595
 5,207
Loss and loss adjustment expense reserve1,067
 799
 592
 601
 679
1,127
 1,067
 799
 592
 601
Reinsurance balances payable, net51
 107
 148
 219
 171
64
 51
 107
 148
 219
Long-term debt(2)
1,300
 1,297
 814
 834
 1,034
1,306
 1,300
 1,297
 814
 834
Credit derivative liabilities446
 963
 1,787
 1,934
 1,457
402
 446
 963
 1,787
 1,934
Total liabilities(2)
8,481
 9,161
 11,170
 12,246
 13,053
7,647
 8,481
 9,161
 11,170
 12,246
Accumulated other comprehensive income237
 370
 160
 515
 368
149
 237
 370
 160
 515
Shareholders' equity6,063
 5,758
 5,115
 4,994
 4,652
6,504
 6,063
 5,758
 5,115
 4,994
Book value per share43.96
 36.37
 28.07
 25.74
 25.52
50.82
 43.96
 36.37
 28.07
 25.74
Consolidated statutory financial information:                  
Contingency reserve$2,263
 $2,330
 $2,934
 $2,364
 $2,571
$2,008
 $2,263
 $2,330
 $2,934
 $2,364
Policyholders' surplus4,550
 4,142
 3,202
 3,579
 3,116
5,036
 4,550
 4,142
 3,202
 3,579
Claims-paying resources(3)(1)
12,306
 12,189
 12,147
 12,328
 12,839
11,701
 12,306
 12,189
 12,147
 12,328
Outstanding Exposure:                  
Net debt service outstanding$536,341
 $609,622
 $690,535
 $780,356
 $844,447
$437,535
 $536,341
 $609,622
 $690,535
 $780,356
Net par outstanding358,571
 403,729
 459,107
 518,772
 556,830
296,318
 358,571
 403,729
 459,107
 518,772
___________________
(1)Accounting guidance restricting the types and amounts of financial guaranty insurance contract acquisition costs that may be deferred was adopted and retrospectively applied effective January 1, 2012.
(2)Accounting guidance (a) requiring that debt issuance costs related to a recognized debt liability be presented in the balance sheet as a direct deduction from the carrying amount of that debt liability and (b) resulting in reclassification of its debt issuance costs from other assets to long-term debt, was adopted and retrospectively applied effective December 31, 2015.
(3)
Prepared in accordance withBased on accounting practices prescribed or permitted by U.S. insurance regulatory authorities, for all insurance subsidiaries. Claims-paying resources is calculated as the sum of statutory policyholders' surplus, statutory contingency reserve, statutory unearned premium reserves, statutory loss and LAE reserves, present value of installment premium on financial guaranty and credit derivatives, discounted at 6%, and standby lines of credit/stop loss. Total claims-paying resources is used by the Company to evaluate the adequacy of capital resources. The December 31, 2015 amount includes Includes an aggregate $360 million excess-of-loss reinsurance facility for the benefit of AGC, AGM$360 million for December 31, 2016 and MAC, which became effective January 1, 2016. The facility terminates on January 1, 2018 unless AGC, AGM and MAC choose to extend it. The2015, $450 million for December 31, 2014 amount includes an aggregate $450and $435 million excess-of-loss reinsurance facility for the benefit of AGC, AGM and MAC. The December 31, 2013 2012 and 2011 amounts include an aggregate $435 million excess-of-loss reinsurance facility for the benefit of AGC2012. See Part II, Item 8, Financial Statements and AGM.Supplementary Data, Note 13, Reinsurance and Other Monoline Exposures.


73


ITEM 7.MANAGEMENT'S DISCUSSION AND ANALYSIS OF FINANCIAL CONDITION AND RESULTS OF OPERATIONS

The following discussion and analysis of the Company’s financial condition and results of operations should be read in conjunction with the Company’s consolidated financial statements and accompanying notes which appear elsewhere in this Form 10-K. It contains forward looking statements that involve risks and uncertainties. Please see “Forward Looking Statements” for more information. The Company's actual results could differ materially from those anticipated in these forward looking statements as a result of various factors, including those discussed below and elsewhere in this Form 10-K, particularly under the headings “Risk Factors” and “Forward Looking Statements.”

Introduction
 
The Company provides credit protection products to the U.S. and international public finance (including infrastructure) and structured finance markets. The Company applies its credit underwriting judgment, risk management skills and capital markets experience primarily to offer financial guaranty insurance that protects holders of debt instruments and other monetary obligations from defaults in scheduled payments. If an obligor defaults on a scheduled payment due on an obligation, including a scheduled principal or interest payment, the Company is required under its unconditional and irrevocable financial guaranty to pay the amount of the shortfall to the holder of the obligation. The Company markets its financial guaranty insurance directly to issuers and underwriters of public finance and structured finance securities as well as to investors in such obligations. The Company guarantees obligations issued principally in the U.S. and the U.K., and also guarantees obligations issued in other countries and regions, including Australia and Western Europe. The Company also provides other forms of insurance that are in line with its risk profile and benefit from its underwriting experience.

Executive Summary
  
This executive summary of management’s discussion and analysis highlights selected information and may not contain all of the information that is important to readers of this Annual Report. For a more detailed description of events, trends and uncertainties, as well as the capital, liquidity, credit, operational and market risks and the critical accounting policies and estimates affecting the Company, this Annual Report should be read in its entirety.

Economic Environment
 
The amount and pricing of new business the Company originates, as well as the financial health of the issuers whose obligations it insures, depend in part on the economic environment in the markets it serves, including the level of interest rates and credit spreads in those markets.

The overall U.S. economic environment continued improving during 2015 by a number of measures.2016. The U.S. Department of Commerce Bureau of Economic Analysis reported an advanced estimate that real gross domestic product increased 2.4%1.6% during 2015.2016. According to the U.S. Bureau of Labor Statistics ("BLS")(BLS), the estimated unemployment rate fell to 5.0% in each of the last three months of 2015, down six-tenths of a percentage point since December 2014 and the lowest monthly level since April 2008. The BLS also reported that the U.S. economy added more than 2.6an estimated 2.2 million jobs during 2015, with2016, and the greatest quarterly growth occurringestimated monthly unemployment rate did not exceed 5.0% in any month of the year, falling in the fourth quarter to levels not seen since 2007. Federal Reserve Board Chairman Janet Yellen stated in January 2017 that labor utilization was close to a normal level and other measures of labor utilization had improved appreciably.

The U.S. stock market trended higher during 2016 in response to continuing signs of economic improvement, although investors experienced considerable volatility related to oil prices, global economic uncertainty, and political developments such as the British electorate's vote in favor of Britain exiting the European Union (Brexit) and the U.S. presidential election. Stock market indices rose to record levels in the fourth quarter.

U.S. home prices, as measured by the S&P CoreLogic Case-Shiller index, rose inU.S. National Home Price Index, continued to rise at a 5.6% rate over the first several12 months ended November 30, 2016.

From the beginning of the year, subsequently stabilized, and then resumed growth, continuing the generally positive trend that emerged at the beginning of 2012.

The Federal Open Market Committee ("FOMC")(FOMC) supported further improvement in labor market conditions and a return to 2% inflation. It maintained the target range for the federal funds rate near zero for most ofat 1/4 to 1/2 percent until mid-December, when it raised it a quarter point to 1/2 to 3/4 percent and projected three additional increases during 2017. Average municipal interest rates were extremely low during the year, as inflation remained belowwith the committee’s 2% target, but raised the target range by one-quarter point in December 2015. Also during 2015, the benchmark interest rates reflected by the30-year AAA MMD Index fluctuatedfalling at times below 2%, a threshold not previously crossed in a narrow range bordering historic lows. Overall, the Company believes that the MMD Index will gradually rise further as the economy continues to improve, but the prospects for such additional economic recovery and higher interestmodern era. The low rates are clouded by weak global economic performance and geopolitical risk, accompanied by strengthening of the dollar, deflationary pressure arising from a drop in global oil prices, and volatilityhelped produce record issuance in the U.S. and international stock markets. Therefore,municipal bond market while constraining the Company believes that the FOMC is likelyopportunities for bond insurers to exercise caution in 2016, and that the pace of further rate increases is uncertain.add financial value.
     
The City Fiscal Condition survey of city finance officers conducted in the fall of 2015 and published by the National League of Cities showed continued improvement in cities’ fiscal health. The same survey concluded that, at the state level, revenues continued to grow in 2015. In general, however, the Company believes that states and cities face long-term spending pressures in areas such as health care, education, infrastructure, and pensions.

Outside the U.S., the number of new infrastructure financings coming to market, including those appropriate for financial guarantees, remained limited. In an effort to stimulate growth as well as inflation, the European Central Bank continued its program of quantitative easing and held its interest rates for bank deposits below zero. The United Kingdom's Office for National Statistics reports that, in the United Kingdom, the pace of economic growth was slightly slower in 2015 than in 2014, and while the employment rate reached a record high, inflation was generally flat.

74


Financial Performance of Assured Guaranty
 
Financial Results

Year Ended December 31,Year Ended December 31,
2015 2014 20132016 2015 2014
(in millions, except per share amounts)(in millions, except per share amounts)
Net income (loss)$1,056
 $1,088
 $808
$881
 $1,056
 $1,088
Operating income(1)699
 491
 609
Operating income (non-GAAP)(1)895
 710
 647
Gain (loss) related to the effect of consolidating FG VIEs (FG VIE consolidation) included in operating income12
 11
 156
          
Net income (loss) per diluted share7.08
 6.26
 4.30
6.56
 7.08
 6.26
Operating income per share(1)4.69
 2.83
 3.25
Operating income per share (non-GAAP)(1)6.68
 4.76
 3.73
Gain (loss) related to FG VIE consolidation included in operating income per share0.10
 0.07
 0.90
     
Diluted shares149.0
 173.6
 187.6
134.1
 149.0
 173.6
          
Present value of new business production (“PVP”)(1)179
 168
 141
Gross written premiums (GWP)154
 181
 104
Present value of new business production (PVP)(1)214
 179
 168
Gross par written17,336
 13,171
 9,350
17,854
 17,336
 13,171
 As of December 31, 2015 As of December 31, 2014 As of December 31, 2016 As of December 31, 2015
 Amount Per Share Amount Per Share Amount Per Share Amount Per Share
 (in millions, except per share amounts) (in millions, except per share amounts)
Shareholders' equity $6,063
 $43.96
 $5,758
 $36.37
 $6,504
 $50.82
 $6,063
 $43.96
Operating shareholders' equity(1) 5,946
 43.11
 5,933
 37.48
Adjusted book value(1) 8,439
 61.18
 8,495
 53.66
Non-GAAP operating shareholders' equity(1) 6,386
 49.89
 5,925
 42.96
Non-GAAP adjusted book value(1) 8,506
 66.46
 8,396
 60.87
Gain (loss) related to FG VIE consolidation included in non-GAAP operating shareholders' equity (7) (0.06) (21) (0.15)
Gain (loss) related to FG VIE consolidation included in non-GAAP adjusted book value (24) (0.18) (43) (0.31)
Common shares outstanding (2) 137.9
   158.3
   128.0
   137.9
  
____________________
(1)Please refer to “—Non-GAAP Financial Measures” for a definition of the financial measures that were not determined in accordance with GAAP and a reconciliation of the non-GAAP financial measure to the most directly comparable GAAP measure, if available. Please note that the Company changed its definition of Operating Income, Non-GAAP Operating Shareholders' Equity and Non-GAAP Adjusted Book Value starting in fourth quarter 2016 in response to new non-GAAP guidance issued by the SEC in 2016. Please refer to “—Non-GAAP Financial Measures” for additional details.

(2)Please refer to "Key Business Strategies – Capital Management" below for information on common share repurchases.

Year Ended December 31, 20152016

There are severalSeveral primary drivers of volatility in net income or loss that are not necessarily indicative of credit impairment or improvement, or ultimate economic gains or losses: changes in credit spreads of insured credit derivative obligations; changes in fair value of assets and liabilities of financial guaranty variable interest entities ("FG VIEs")(FG VIEs) and committed capital securities ("CCS")(CCS); changes in the Company's own credit spreads; and changes in risk-free rates used to discount expected losses. Changes in credit spreads generally have the most significant effect on the fair value of credit derivatives and FG VIE assets and liabilities. In addition to non-economic factors, other factors such as: changes in expected losses, the amount and timing of refunding transactions and terminations, realized gains and losses on the investment portfolio (including other-than-temporary impairments), the effects of large settlements and transactions, acquisitions, and the effects of the Company's various loss mitigation strategies, among others, may also have a significant effect on reported net income or loss in a given reporting period. 

Net income for 20152016 was $1.06 billion$881 million compared with $1.09 billion$1,056 million in 2014. Higher loss expense attributable mainly2015. The decrease was due primarily to Puerto Rico and lower fair value gains on credit derivatives in FG VIEs2016 compared with 2015. This was offset in 2015 were mostly offsetpart by the bargain purchase gainlower loss and settlement of pre-existing relationships from the acquisition of Radian AssetLAE and higher net earned premiums due to refundings and terminations.premium accelerations.

Non-GAAPUnder the revised calculation of non-GAAP measures explained in "Non-GAAP Financial Measures" below, the Company reported operating income of $895 million in 2015 was $699 million,2016, compared with $491$710 million in 2014.2015. The increase in operating income was primarily due to the acquisition of Radian Asset, including the bargain purchase gainlower operating loss and settlement of pre-existing relationships,LAE and higher premium accelerations.

Shareholders' equity increased since December 31, 2015 due primarily to positive net earned premiumsincome (including the effect of the CIFG Acquisition), which was partially offset by share repurchases, lower net unrealized gains on available for sale investment securities recorded in AOCI, and credit derivative revenuesdividends. Non-GAAP operating shareholders' equity and non-GAAP adjusted book value also increased since December 31, 2015 due to refundings and terminations,positive operating income (including the effect of the CIFG Acquisition), offset in part by higher losses attributable primarily to Puerto Rico. Operating incomeshare repurchases and dividends. Book value, non-GAAP operating shareholders' equity per share and non-GAAP adjusted book value per share also benefited from the repurchase of 10.7 million common shares in 2015 was the highest that the Company has reported.2016.
    

75


Key Business Strategies

The Company continually evaluates its primary business strategies. Currently.Currently, the Company is pursuing the following primary business strategies, each described in more detail below:

New business production
Capital management
Alternative strategies to create value, including through acquisitions, investments and commutations
Loss mitigation

New Business Production

The Company believes high-profile defaults by municipal obligors, such as the Commonwealth of Puerto Rico, Detroit, Michigan and Stockton, California both of which filed for protection under chapter 9 of the U.S. Bankruptcy Code, and the deteriorating financial condition of Puerto Rico, have led to increased awareness of the value of bond insurance and stimulated demand for the product. The Company believes there will be continued demand for its insurance in this market because, for those exposures that the Company guarantees, it undertakes the tasks of credit selection, analysis, negotiation of terms, surveillance and, if necessary, loss mitigation. The Company believes that its insurance:

encourages retail investors, who typically have fewer resources than the Company for analyzing municipal bonds, to purchase such bonds;
enables institutional investors to operate more efficiently; and
allows smaller, less well-known issuers to gain market access on a more cost-effective basis.

On the other hand, the persistently low interest rate environment continues to dampenhas dampened demand for bond insurance and, after a number of years in which the Company was essentially the only financial guarantor, there are now two other financial guarantors active in one of its markets.


U.S. Municipal Market Data and Penetration Rates (1)
Based on Sale Date

 Year Ended December 31,
 2016 2015 2014
 (dollars in billions, except number of issues and percent)
Par:     
New municipal bonds issued$423.7
 $377.6
 $314.9
Total insured$25.3
 $25.2
 $18.5
Insured by Assured Guaranty$14.2
 $15.1
 $10.7
Number of issues:     
New municipal bonds issued12,271
 12,076
 10,162
Total insured1,889
 1,880
 1,403
Insured by Assured Guaranty904
 1,009
 697
Market penetration based on:     
Par6.0% 6.7% 5.9%
Number of issues15.4% 15.6% 13.8%
Single A par sold22.6% 22.1% 19.7%
Single A transactions sold55.8% 54.1% 49.3%
$25 million and under par sold17.8% 18.7% 16.5%
$25 million and under transactions sold17.5% 17.6% 15.4%
____________________
 Year Ended December 31,
 2015 2014 2013
 Par 
Number of
issues
 Par 
Number of
issues
 Par 
Number of
issues
 (dollars in billions, except number of issues)
New municipal bonds issued$377.6
 12,076
 $314.9
 10,162
 $311.9
 10,558
Total insured25.2
 1,880
 18.5
 1,403
 12.1
 1,025
Insured by Assured Guaranty15.1
 1,009
 10.7
 697
 7.5
 488
(1)    Source: Thomson Reuters.


Industry Penetration Rates
U.S. Municipal Market

 Year Ended December 31,
 2015 2014 2013
Market penetration based on par6.7% 5.9% 3.9%
Market penetration based on number of issues15.6 13.8 9.7
% of single A par sold22.1 19.7 11.0
% of single A transactions sold54.1 49.3 30.6
% of $25 million and under par sold18.7 16.5 10.9
% of $25 million and under transactions sold17.6 15.4 10.7


76


New Business Production

Year Ended December 31,Year Ended December 31,
2015 2014 20132016 2015 2014
(in millions)(in millions)
GWP     
Public Finance—U.S.$142
 $119
 $122
Public Finance—non-U.S.15
 41
 6
Structured Finance—U.S.(1) 23
 (32)
Structured Finance—non-U.S.(2) (2) 8
Total GWP$154
 $181
 $104
PVP(1):          
Public Finance—U.S.$124
 $128
 $116
$161
 $124
 $128
Public Finance—non-U.S.27
 7
 18
25
 27
 7
Structured Finance—U.S.22
 24
 7
Structured Finance—U.S. (2)27
 22
 24
Structured Finance—non-U.S.6
 9
 
1
 6
 9
Total PVP$179
 $168
 $141
$214
 $179
 $168
Gross Par Written:          
Public Finance—U.S.$16,377
 $12,275
 $8,671
$16,039
 $16,377
 $12,275
Public Finance—non-U.S.567
 128
 392
677
 567
 128
Structured Finance—U.S.327
 418
 287
Structured Finance—U.S. (2)1,114
 327
 418
Structured Finance—non-U.S.65
 350
 
24
 65
 350
Total gross par written$17,336
 $13,171
 $9,350
$17,854
 $17,336
 $13,171
____________________
(1)PVP represents the present value of estimated future earnings primarily on new financial guaranty contracts written in the period, before consideration of cessions to reinsurers. PVP and Gross Par Written in the table above are based on "close date," when the transaction settles. See “– Non-GAAP Financial Measures – PVP or Present Value of New Business Production.”

(2)Includes a structured capital relief Triple-X excess of loss life reinsurance transaction written in 2016.

GWP include amounts collected in the current year on upfront new business written, the present value of contractual or expected premiums on new business written (discounted at risk free rates), and the effects of changes in the estimated lives of transactions in the inforce book of business. The decrease in GWP to $154 million in 2016 from $181 million in 2015, was due primarily to changes in estimated lives.

For the year ended December 31, 20152016 compared with the year ended December 31, 2014, excluding business written2015, PVP increased by approximately 20% to $214 million, primarily due to an increase in 2014 as part of the restructuring of Detroit's water and sewer bonds, the Company'ssecondary market U.S. public finance PVP increased, primarily due to higher issuance and greater bond insurance penetration in the U.S. public finance market. Issuance for 2015 in the U.S. public finance market increased approximately 20% compared with 2014, primarily driven by refundings. Insured municipal par for the same period was up 36% and represented a 6.7% market penetration, compared with 5.9% in 2014. The Company wrote 60% of the total insured par and 54% of the total number of new issues in 2015.business.

Outside the U.S., the Company'sCompany generated $26 million of PVP in 2016 compared with $33 million of PVP in 2015. Non-U.S. public finance PVP also increased, due to an increase inbusiness generally represents European infrastructure transactions. The Company believes the U.K. currently presents the most new business opportunities for financial guarantees of infrastructure financings, which have typically required such guarantees for capital market access. These transactions typically have long lead times. The Company believes it is the only company in the private sector offering such financial guarantees outside the United States.

Structured finance PVP decreased slightly in both U.S and non-U.S. markets. Structured finance transactions tend to be large withhave long lead times and may vary from period to period.period In general, the Company expects that structured finance opportunities will increase in the future as the global economy recovers, interest rates rise, more issuers return to the capital markets for financings and institutional investors again utilize financial guaranties. The Company considers its involvement in both structured finance and international infrastructure transactions to be beneficial because such transactions diversify both the Company's business opportunities and its risk profile beyond public finance. This category also includes a structured capital relief Triple-X excess of loss life reinsurance transaction.

The difference between GWP and PVP relates primarily to the difference in discount rates used in the calculation of PVP compared with GWP and the inclusion in GWP of the effects of changes in lives of the existing insured portfolio.


Capital Management
    
In recent years, the Company has developed strategies to manage capital within the Assured Guaranty group more efficiently.

In 2013,2016, AGM sought and received approval from the NYDFS to repurchase $300 million of its common stock from its parent, Assured Guaranty Municipal Holdings Inc. (AGMH). The repurchase was effectuated on December 19, 2016. Subsequently, AGMH distributed the proceeds as dividends to its immediate parent, AGUS, and in 2017, AGUS began using these proceeds to pay dividends to AGL. AGL became tax resident in the United Kingdom, while remaining a Bermuda-based companyintends to use these funds predominantly to repurchase its publicly traded common shares. AGM and continuingAGC have also been paying dividends to carry ontheir parents, and MAC may also pay dividends to its administrativeparents. See Part II, Item 8, Financial Statements and head office functions in Bermuda. As a U.K. tax resident company, AGL is subject to the tax rules applicable to companies resident in the U.K. MoreSupplementary Data, Note 11, Insurance Company Regulatory Requirements for additional information about AGL becoming a U.K. tax resident is set out individends the "Tax Matters" section of "Item 1. Business."Company's insurance companies may and have paid.

In 2014, AGUS issued 5.0% Senior Notes for net proceeds of $495 million. The net proceeds from the sale of the notes were used for general corporate purposes, including the purchaserepurchase of common shares of AGL.


77


In 2015,From 2013 through February 23, 2017, the Company has repurchased a total of 2172.2 million common shares for approximately $555$1,857 million, at an average price of $26.43 per share. Year to date through February 9, 2016, the Company repurchased a total of 2.3 million common shares for $55 million at an average price of $24.37 per share. With the purchase of common shares in 2016, the Company exhausted the share repurchase authorization that its Board of Directors approved in May 2015.

excluding commissions. On February 24, 2016,22, 2017 the Board of Directors approved a $250authorized an additional $300 million in share repurchases. As of February 23, 2017, $407 million of authority remains under the Company's share repurchase authorization.authorizations. The Company expects the repurchases to be made from time to time in the open market or in privately negotiated transactions. The timing, form and amount of the share repurchases under the program are at the discretion of management and will depend on a variety of factors, including free funds available at the parent company, market conditions, the Company's capital position, legal requirements and other factors. The repurchase program may be modified, extended or terminated by the Board of Directors at any time. It does not have an expiration date. See Note 18, Shareholders' Equity, of thePart II, Item 8, Financial Statements and Supplementary Data, Note 18, Shareholders' Equity, for additional information about the Company's repurchases of its common shares.

Summary of Share Repurchases

Amount Number of Shares Average price per shareAmount Number of Shares Average price per share
(in millions, except per share data)(in millions, except per share data)
2013$264
 12.5
 $21.12
$264
 12.5
 $21.12
2014590
 24.4
 24.17
590
 24.4
 24.17
2015555
 21.0
 26.43
555
 21.0
 26.43
2016 (through February 9, 2016)55
 2.3
 24.37
2016306
 10.7
 28.53
2017 (through February 23, 2017)142
 3.6
 39.65
Cumulative repurchases since the beginning of 2013$1,464
 60.2
 $24.33
$1,857
 72.2
 $25.71


Accretive Effect of Cumulative Repurchases(1)

 Year Ended December 31,     Year Ended December 31,    
 2015 2014 As of
December 31, 2015
 As of
December 31, 2014
 2016 2015 As of
December 31, 2016
 As of
December 31, 2015
 (per share) (per share)
Net income $1.56
 $0.71
     $1.90
 $1.56
    
Operating income 0.98
 0.32
     1.94
 1.00
    
Shareholders' equity     $5.75
 $2.56
     $8.92
 $5.75
Operating shareholders' equity     5.49
 2.78
Adjusted book value     10.83
 5.84
Non-GAAP operating shareholders' equity     8.59
 5.45
Non-GAAP adjusted book value     14.38
 10.74
_________________
(1)Cumulative repurchases since the beginning of 2013.


In order to reduce leverage, and possibly rating agency capital charges, the Company has mutually agreed with beneficiaries to terminate selected financial guaranty insurance and credit derivative contracts. In particular, the Company has targeted investment grade securities for which claims are not expected but which carry a disproportionately large rating agency capital charge. The Company terminated investment grade securitiesfinancial guaranty and CDS contracts with net par of $6.6 billion in 2016, $2.8 billion in 2015 and $3.1 billion in 2014 and $6.3 billion in 2013 of financial guaranty and CDS contracts.2014.

Alternative Strategies

The Company considers alternative strategies in order to create long-term shareholder value. For example, the Company considers opportunities to acquire financial guaranty portfolios, whether by acquiring financial guarantors who are no longer actively writing new business or their insured portfolios, or by commuting business that it had previously ceded. These transactions enable the Company to improve its future earnings and deploy some of its excess capital. During 2016, the Company established an alternative investments group to focus on deploying a portion of the Company's excess capital to pursue acquisitions and develop new business opportunities that complement the Company's financial guaranty business, are in line with its risk profile and benefit from its core competencies.

CIFG Holding Inc. On AprilJuly 1, 2015 (the "Acquisition Date"),2016, AGC completedacquired all of the acquisitionissued and outstanding capital stock of Radian Asset Acquisition andCIFGH, for $450.6 million in cash. AGUS previously owned 1.6% of the outstanding shares of CIFGH, for which it received $7.1 million in consideration from AGC, resulting in a net consolidated purchase price of $443 million. AGC merged Radian AssetCIFGNA with and into AGC, with AGC as the surviving company, on July 5, 2016. The CIFG Acquisition added $4.2 billion of net par insured on July 1, 2016. In 2016, the acquisition contributed net income and operating income of approximately $2.41 per share and $2.38 per share, respectively, including the bargain purchase gain, loss on settlement of pre-existing relationships and activity since the the date of the merger. TheCIFG Acquisition (CIFG Acquisition Date). Shareholders' equity benefited by $2.23 per share, non-GAAP operating shareholders' equity benefited by $2.23 per share and non-GAAP adjusted book value benefited by $3.85 per share as of the CIFG Acquisition Date.

Radian Asset Assurance Inc. On April 1, 2015 (the Radian Acquisition Date), AGC completed the acquisition of Radian Asset for a cash purchase price of $804.5 million

78


paid by AGC to Radian Guaranty Inc. reflected certain adjustments, for corporate overhead and interest payment expenses, to the $810 million purchase price previously announced. AGC paid the purchase price out of available funds and from the proceeds of a $200 million note from its parent AGUS. On April 14, 2015, AGC repaid in full the $200 million note.million. In connection with the acquisition, AGC acquired Radian Asset’s entire insured portfolio, which resulted in an increase in net par outstanding as of the Radian Acquisition Date of approximately $13.6 billion, consisting of $9.4 billion of public finance net par outstanding and $4.2 billion of structured finance net par outstanding. In 2015, the acquisition contributed net income of approximately $2.46 per share and operating income of approximately $2.13 per share, including the bargain purchase gain, settlement of pre-existing relationships and activity since the Radian Acquisition Date. Shareholders' equity benefited by $1.04 per share, non-GAAP operating shareholders' equity benefited by $1.26 per share and non-GAAP adjusted book value benefited by $3.73 per share as of the Radian Acquisition Date.

MBIA UK Insurance Limited.On January 10, 2017, AGC completed its acquisition of MBIA UK Insurance Limited (MBIA UK), the European operating subsidiary of MBIA. As consideration for the outstanding shares of MBIA UK plus $23 million in cash, AGC exchanged all its holdings of notes issued in the Zohar II 2005-1 transaction. AGC’s Zohar II 2005-1 notes had a total outstanding principal of approximately $347 million and fair value of $334 million as of the date of acquisition. MBIA insured all of the notes issued in the Zohar II 2005-1 transaction. As of December 31, 2016, MBIA UK had an insured portfolio of approximately $12 billion of net par. MBIA UK has changed its name to Assured Guaranty (London) Ltd. (AGLN). Assured Guaranty currently maintains AGLN as a stand-alone entity. Assured Guaranty is actively working to combine AGLN with its other affiliated European insurance companies. Any such combination will be subject to regulatory and court approvals; as a result, Assured Guaranty cannot predict when, or if, such a combination will be completed.

Alternative Investments. The alternative investments group has been investigating a number of new business opportunities that complement the Company's financial guaranty business, are in line with its risk profile and benefit from its core competencies, including, among others, both controlling and non-controlling investments in investment managers. In February 2017 the Company agreed to purchase up to $100 million of limited partnership interests in a fund that invests in the equity of private equity managers. The Company continues to investigate additional opportunities.

Commutations. The Company entered into various commutation agreements to reassume previously ceded business in 2016, 2015 and 2014 that resulted in gains of $8 million in 2016, $28 million in 2015 and $23 million in 2014 and additional net unearned premium reserve of $0 in 2016, $23 million in 2015 and $20 million in 2014. The commutation gains were recorded in other income. The Company may also in the future enter into new commutation agreements reassuming portions of its remaining previously ceded business.

Loss Mitigation
    
In an effort to avoid or reduce potential losses in its insurance portfolios, the Company employs a number of strategies.

In the public finance area, the Company believes that its experience and the resources it is prepared to deploy, as well as its ability to provide bond insurance or other contributions as part of a solution, has resulted in more favorable outcomes in distressed public finance situations than would have been the case without its participation, as illustrated, for example, by the Company's role in the Detroit, Michigan; Stockton, California; and Jefferson County, Alabama financial crises. Currently, the Company is an active participant in discussions with the Commonwealth of Puerto Rico and its advisors with respect to a number of Puerto Rico credits. For example, on December 24, 2015, AGC and AGM entered into a Restructuring Support Agreement (“RSA”)(RSA) with Puerto Rico Electric Power Authority ("PREPA")(PREPA), an ad hoc group of uninsured bondholders and a group of fuel-line lenders that would, subject to certain conditions, result in, among other things, modernization of the utility and a restructuring of current debt. Legislation meeting the requirements of the RSA was enacted on February 16, 2016, and a transition charge to be paid by PREPA rate payers for debt service on the securitization bonds as contemplated by the RSA was approved by the Puerto Rico Energy Commission on June 20, 2016. The closing of the restructuring transaction and the issuance of the surety bonds are subject to certain conditions, including execution of acceptable documentation and legal opinions. There can be no assurance that the conditions in the RSA will be met or that, if the conditions are met, the RSA’sRSA's other provisions, including those related to the restructuring of the insured PREPA revenue bonds, will be implemented. Thereimplemented as currently agreed. In addition, there also can be no assurance that the negotiations with respect to other Puerto Rico credits will result in agreements on a consensual recovery plans.

In an effort to recover lossesThe Company is currently working with the Company experienced in its insured U.S. RMBS portfolio, the Company pursued providersservicers of representations and warranties ("R&W") by enforcing R&W provisions in contracts, negotiating agreements with R&W providers relating to those provisions and, where appropriate, initiating litigation against R&W providers. Through December 31, 2015, the Company's loss mitigation efforts on its U.S. RMBS exposure over the past several years have resulted in R&W providers paying, or agreeing to pay, or terminating insurance protection on future projected losses of, approximately $4.2 billion (gross of reinsurance) in respect of their R&W liabilities for transactions in which the Company has provided insurance. By reaching agreements with certain R&W providers in October 2015, the Company has completed its pursuit of R&W claims. See Note 5, Expected Loss to be Paid,some of the Financial Statements.RMBS it insures to encourage the servicers to provide alternatives to distressed borrowers that will encourage them to continue making payments on their loans and so improve the performance of the related RMBS. Many of the home equity lines of credit (HELOC) loans underlying the HELOC RMBS have entered or are entering their amortization periods, which results in material increases to the size of the monthly payments the borrowers are required to make.

The Company is also continuingcontinues to purchase attractively priced obligations, including BIG obligations, that it has insured and for which it has expected losses to be paid, in order to mitigate the economic effect of insured losses ("loss(loss mitigation securities")securities). These purchases resulted in a reduction of net expected loss to be paid of $557 million as of December 31, 2015. The fair value of assets purchased for loss mitigation purposes in the Company's investment portfolio as of December 31, 20152016 (excluding the value of the Company's insurance) was $1,017$1,299 million, with a par of $1,871$2,243 million (including bonds related to FG VIEs of $83$49 million in fair value and $282$236 million in par).

In some instances, the terms of the Company's policy gives it the option to pay principal on an accelerated basis on an obligation on which it has paid a claim, thereby reducing the amount of guaranteed interest due in the future. The Company has at times exercised this option, which uses cash but reduces projected future losses.

In an effort to recover losses the Company experienced in its insured U.S. RMBS portfolio, the Company also continues to pursue providers of representations and warranties (R&W) by enforcing R&W provisions in contracts, negotiating agreements with R&W providers relating to those provisions and, where appropriate, pursuing litigation against R&W providers. See Part II, Item 8, Financial Statements and Supplementary Data, Note 5, Expected Loss to be Paid.

Other Events

Brexit

The Company is evaluating the impact on its business of the referendum held in the U.K on June 23, 2016, in which a majority voted to exit the EU, known as “Brexit”. Negotiations are expected to commence soon to determine the future terms of the U.K’s relationship with the EU, including the terms of trade between the U.K. and the EU. The negotiations, once commenced, are likely to last for two years, or possibly more. Brexit may impact laws, rules and regulations applicable to the Company’s U.K. subsidiaries and U.K. operations.

The Company cannot predict the direction Brexit-related developments will take nor the impact of those developments on the economies of the markets the Company serves, which may materially adversely affect the Company’s business, results of operations and financial condition, but the Company has identified certain areas where Brexit may impact its business:

79Currency Impact.The Company reports its accounts in U.S. dollars, while some of its income, expenses, assets and liabilities are denominated in other currencies, primarily the pound sterling and the euro. From December 31,


2015 to December 31, 2016, the value of pound sterling dropped from £0.68 per dollar to £0.81 per dollar, while the euro dropped from €0.83 per dollar to €0.95 per dollar. For the year ended 2016 the Company recognized losses of approximately $21 million in the consolidated statement of operations, net of tax, and approximately $32 million in OCI, net of tax, for foreign currency translation, that were primarily driven by the exchange rate fluctuations of the pound sterling. If the Company had owned AGLN during 2016, these impacts would have been greater.

TableU.K. Business. As of ContentsDecember 31, 2016, approximately $15.9 billion of the Company’s insured net par is to risks located in the U.K., and most of that exposure is to utilities, with much of the rest to hospital facilities, toll roads, government accommodation, housing associations, universities and other public purpose enterprises that the Company believes are not overly vulnerable to Brexit pressures. AGE is currently authorized by the PRA of the Bank of England with permissions sufficient to enable AGE to effect and carry out financial guaranty insurance and reinsurance in the U.K. Most of the new transactions insured by AGE since 2008 have been in the U.K. As of December 31, 2016, approximately $10.0 billion of insured net par of AGLN, which the Company acquired in January 2017, is to risks located in the U.K.

Business Elsewhere in the EU. As of December 31, 2016, approximately $5.5 billion of the Company’s insured net par is to risks located in EU and EEA countries other than the U.K. As of December 31, 2016, approximately $1.5 billion of insured net par of AGLN, which the Company acquired in January 2017, is to risks located in EU and EEA countries other than the U.K. Currently, EU directives allow AGE to conduct business in other EU or EEA states based on its PRA permissions. This is sometimes called “passporting”. Depending on the terms of Brexit, AGE may, once Brexit is implemented, lose the ability to insure new transactions from London in non-U.K. EU and EEA countries without obtaining additional licenses, which may require a presence in another EU country. While pertinent laws and regulations have yet to be adopted or passed, the Company does not believe Brexit will adversely affect its surveillance and loss mitigation activities with respect to existing insured transactions in non-U.K. EU and EEA countries, except to the extent Brexit inhibits the issuance of new guaranties in distressed situations in non-U.K. EU or EEA countries. As noted above, most of the new transactions insured by AGE since 2008 have been in the U.K.

Employees.While nearly one-third of the employees working in AGE’s London office are non-U.K. EU or EEA citizens, most of those employees currently qualify, and the Company expects the rest to qualify within the next two years, to become permanent residents under current U.K. law.


Results of Operations
 
Estimates and Assumptions
 
The Company’s consolidated financial statements include amounts that are determined using estimates and assumptions. The actual amounts realized could ultimately be materially different from the amounts currently provided for in the Company’s consolidated financial statements. Management believes the most significant items requiring inherently subjective and complex estimates are expected losses, fair value estimates, other-than-temporary impairment, deferred income taxes, and premium revenue recognition. The following discussion of the results of operations includes information regarding the estimates and assumptions used for these items and should be read in conjunction with the notes to the Company’s consolidated financial statements.
 
An understanding of the Company’s accounting policies is of critical importance to understanding its consolidated financial statements. See Part II, Item 8. “Financial8, Financial Statements and Supplementary Data”Data, for a discussion of the significant accounting policies, the loss estimation process, and the fair value methodologies.

The Company carries a portionsignificant amount of its assets and a portion of its liabilities at fair value, the majority of which are measured at fair value on a recurring basis.  Level 3 assets, consisting primarily of financial guaranty variable interest entities’FG VIE’ assets, credit derivative assets and investments, represented approximately 19% and 20% and 17% of the total assets that are measured at fair value on a recurring basis as of December 31, 20152016 and 2014,2015, respectively. All of the Company's liabilities that are measured at fair value are Level 3. See Part II, Item 8, Financial Statements and Supplementary Data, Note 7, Fair Value Measurement, of the Financial Statements and Supplementary Datain for additional information about assets and liabilities classified as Level 3.


80


Consolidated Results of Operations

Consolidated Results of Operations
 
Year Ended December 31,Year Ended December 31,
2015 2014 20132016 2015 2014
(in millions)(in millions)
Revenues:          
Net earned premiums$766
 $570
 $752
$864
 $766
 $570
Net investment income423
 403
 393
408
 423
 403
Net realized investment gains (losses)(26) (60) 52
(29) (26) (60)
Net change in fair value of credit derivatives:          
Realized gains (losses) and other settlements(18) 23
 (42)29
 (18) 23
Net unrealized gains (losses)746
 800
 107
69
 746
 800
Net change in fair value of credit derivatives728
 823
 65
98
 728
 823
Fair value gains (losses) on CCS27
 (11) 10
0
 27
 (11)
Fair value gains (losses) on FG VIEs38
 255
 346
38
 38
 255
Bargain purchase gain and settlement of pre-existing relationships214
 
 
259
 214
 
Other income (loss)37
 14
 (10)39
 37
 14
Total revenues2,207
 1,994
 1,608
1,677
 2,207
 1,994
Expenses:          
Loss and loss adjustment expenses424
 126
 154
Loss and LAE295
 424
 126
Amortization of deferred acquisition costs20
 25
 12
18
 20
 25
Interest expense101
 92
 82
102
 101
 92
Other operating expenses231
 220
 218
245
 231
 220
Total expenses776
 463
 466
660
 776
 463
Income (loss) before provision for income taxes1,431
 1,531
 1,142
1,017
 1,431
 1,531
Provision (benefit) for income taxes375
 443
 334
136
 375
 443
Net income (loss)$1,056
 $1,088
 $808
$881
 $1,056
 $1,088


81


Net Earned Premiums

Net earned premiums are recognized over the contractual lives, or in the case of homogeneous pools of insured obligations, the remaining expected lives, of financial guaranty insurance contracts. The Company estimates remaining expected lives of its insured obligations and makes prospective adjustments for such changes in expected lives. Scheduled net earned premiums are expected to decrease each year unless replaced by a higher amount of new business, reassumptions of previously ceded business or books of business acquired in a business combination. See "Financial Guaranty Insurance Premiums" in Note 6, Financial Guaranty Insurance, of thePart II, Item 8, Financial Statements and Supplementary Data, Note 6, Contracts Accounted for as Insurance, Financial Guaranty Insurance Premiums, for additional information and the expected timing of future premium earnings.
 
Net Earned Premiums
 
Year Ended December 31,Year Ended December 31,
2015 2014 20132016 2015 2014
(in millions)(in millions)
Financial guaranty:     
Financial guaranty insurance:     
Public finance          
Scheduled net earned premiums and accretion$308
 $279
 $292
$299
 $308
 $279
Accelerations (1)317
 135
 207
Accelerations:     
Refundings390
 294
 133
Terminations34
 23
 2
Total accelerations424
 317
 135
Total public finance625
 414
 499
723
 625
 414
Structured finance (2)     
Structured finance(1)     
Scheduled net earned premiums and accretion125
 152
 195
96
 125
 152
Accelerations (1)14
 1
 56
Terminations45
 14
 1
Total structured finance139
 153
 251
141
 139
 153
Other2
 3
 2
0
 2
 3
Total net earned premiums$766
 $570
 $752
$864
 $766
 $570
____________________
(1)Reflects the unscheduled refunding or termination of the insurance on an insured obligation as well as changes in scheduled earnings due to changes in the expected lives of the insured obligations. 

(2)
Excludes $21$16 million,$21 million and $32 million for 2016, 2015 and $60 million for 2015, 2014, and 2013, respectively, on consolidated FG VIEs.

2016 compared with 2015: Net earned premiums increased in 2016 compared with 2015 due primarily to higher accelerations, partially offset by the lower earned premiums resulting from the scheduled decline in par outstanding. At December 31, 2016, $3.3 billion of net deferred premium revenue remained to be earned over the life of the insurance contracts. The CIFG Acquisition increased deferred premium revenue by $296 million at the date of the acquisition.

2015 compared with 2014: Net earned premiums increased in 2015 compared with 2014 due primarily to higher accelerations and the addition of the Radian Asset book of business, offset in part by lower earned premiums resulting from the scheduled decline in par outstanding. The Radian Asset Acquisition on April 1, 2015 increased deferred premium revenue by $549 million at the date of acquisition. At December 31, 2015, $3.8 billion of net deferred premium revenue remained to be earned over the life of the insurance contracts.

2014 compared with 2013: NetThe increase in net earned premiums decreaseddue to accelerations is attributable to changes in 2014 compared with 2013the expected lives of insured obligations driven by (a) refundings of insured obligations or (b) terminations of insured obligations either through negotiated agreements or the exercise of our contractual rights to make claim payments on an accelerated basis.
Refundings occur in the public finance market and have been at historically high levels in recent years due primarily to the low interest rate environment, which has allowed many municipalities and other public finance issuers to refinance their debt obligations at lower accelerationsrates. The premiums associated with the insured obligations of municipalities and other public finance issuers are generally received upfront when the obligations are issued and insured. When such issuers pay down insured obligations prior to their originally scheduled declinematurities, the Company is no longer on risk for payment defaults, and therefore accelerates the recognition of the nonrefundable unearned premiums remaining from the original upfront payment.

Terminations are generally negotiated agreements with issuers resulting in the extinguishment of the Company’s insurance obligation with respect to the insured obligations. Terminations are more common in the structured finance par outstanding, as shownasset class, but may also occur in the table above. At December 31, 2014, $3.8 billion of net deferred premium revenue remained to be earned overpublic finance asset class. While each termination may have different terms, they all result in the lifeexpiration of the Company’s insurance contracts.risk, such that the Company accelerates the recognition of the associated unearned premiums.

Net Investment Income
 
Net investment income is a function of the yield that the Company earns on invested assets and the size of the portfolio. The investment yield is a function of market interest rates at the time of investment as well as the type, credit quality and maturity of the invested assets.


82


Net Investment Income (1)
 
Year Ended December 31,Year Ended December 31,
2015 2014 20132016 2015 2014
(in millions)(in millions)
Income from fixed-maturity securities managed by third parties$335
 $324
 $322
$306
 $335
 $324
Income from internally managed securities:          
Fixed maturities61
 74
 74
103
 61
 74
Other37
 14
 5
7
 37
 14
Other1
 0
 0
Gross investment income433
 412
 401
417
 433
 412
Investment expenses(10) (9) (8)(9) (10) (9)
Net investment income$423
 $403
 $393
$408
 $423
 $403
____________________
(1)Net investment income excludes $10 million for 2016 and $32 million for 2015 and $11 million forin 2014, and $13 million in 2013, related to securities in the investment portfolio owned by AGC and AGM that were issued by consolidated FG VIEs.

2016 compared with 2015: Net investment income decreased due primarily to lower average investment balance and lower average investment yield. The overall pre-tax book yield was 3.80% as of December 31, 2016 and 4.56% as of December 31, 2015, respectively. Excluding the internally managed portfolio, pre-tax book yield was 3.30% as of December 31, 2016 compared with 3.58% as of December 31, 2015.

2015 compared with 2014: Net investment income increased due primarily to additional income on the Radian Asset investment portfolio and loss mitigation strategies resulting in additional income on securities within the internally managed portfolio. The overall pre-tax book yield was 4.56% as of December 31, 2015 and 3.65% as of December 31, 2014, respectively. Excluding the internally managed portfolio, pre-tax book yield was 3.58% as of December 31, 2015 compared with 3.36% as of December 31, 2014.

2014 compared with 2013: Net investment income increased primarily due to income on certain loss mitigation and other risk management assets as well as higher average asset balance. The overall pre-tax book yield was 3.65% as of December 31, 2014 and 3.79% as of December 31, 2013, respectively. Excluding the internally managed portfolio, pre-tax yield was 3.36% as of December 31, 2014 compared with 3.42% as of December 31, 2013.

Net Realized Investment Gains (Losses)

The table below presents the components of net realized investment gains (losses). See Part II, Item 8, Financial Statements and Supplementary Data, Note 10, Investments and Cash, of the Financial Statements and Supplementary Data.Cash.

Net Realized Investment Gains (Losses)
 
 Year Ended December 31,
 2015 2014 2013
 (in millions)
Gross realized gains on the investment portfolio$46
 $22
 $113
Gross realized losses on the investment portfolio(25) (7) (19)
Other-than-temporary impairment(47) (75) (42)
Net realized investment gains (losses) (1)$(26) $(60) $52
 Year Ended December 31,
 2016 2015 2014
 (in millions)
Gross realized gains on available-for-sale securities$28
 $44
 $14
Gross realized losses on available-for-sale securities(8) (15) (5)
Net realized gains (losses) on other invested assets2
 (8) 6
Other-than-temporary impairment(51) (47) (75)
Net realized investment gains (losses)$(29) $(26) $(60)
____________________
(1)Excludes realized gains (losses) related to fixed maturity securities purchased in the investment portfolio that were issued by consolidated FG VIEs of $(10) million for 2015, $5 million for 2014 and $(2) million for 2013.
Other-than-temporary-impairments in 2016 were primarily attributable to securities purchased for loss mitigation purposes and changes in foreign exchange rates. Realized gains in 2016 were due primarily to sales of securities in order to fund the purchase of CIFGH by AGC.

Net realized investment losses for 2015 include a loss on a forward contractcontract. Other-than-temporary-impairments in 2015 were primarily attributable to purchase asecurities purchased for loss mitigation bond,purposes. The realized gains in 2015 were due primarily to sales of securities in order to fund the purchase of Radian Asset by AGC and other-than-temporary-impairments primarily attributable to securities purchased for loss mitigation purposes. AGC.

Net realized investment losses for 2014 included an other-than-temporary impairment that was primarily attributable to securities in the internally managed portfolio received as part of a restructuring of an insured transaction. Net realized investment gains in 2013 included gains due primarily to sales of (i) assets acquired as part of negotiated settlements, (ii) bonds purchased for loss mitigation purposes and (iii) other invested assets and other-than-temporary-impairments primarily attributable to securities acquired for loss mitigation purposes.


83


Bargain Purchase Gain and Settlement of Pre-existing Relationships 

On July 1, 2016, AGC acquired all of the issued and outstanding capital stock of CIFGH, the parent of financial guaranty insurer CIFGNA, and merged CIFGNA with and into AGC, with AGC as the surviving company, on July 5, 2016. In connection with the acquisition, in 2016, the Company recognized a $357 million bargain purchase gain and a $98 million loss on settlement of pre-existing relationships.

On April 1, 2015, AGC completed the acquisition of Radian Asset and merged Radian Asset with and into AGC, with AGC as the surviving company of the merger. In connection with the acquisition, in 2015, the Company recognized a $55 million in a bargain purchase gain and a $159 million ingain on settlement of pre-existing relationships.

The excess of the fair value of net assets acquired over the consideration transferred was recorded as a bargain purchase gain in "bargain purchase gain and settlement of pre-existing relationships" in net income. In addition, the Company and Radian Asset had pre-existing reinsurance relationships, which were also effectively settled at fair value on the Acquisition Date. The gain on settlement of these pre-existing reinsurance relationships primarily represents the net difference between the historical ceded balances that were recorded by AGM and the fair value of assumed balances acquired from Radian Asset. The Company believes the bargain purchase resulted from the announced desire of Radian Guaranty Inc. to focus its business strategy on the mortgage and real estate markets and to monetize its investment in Radian Asset and thereby accelerate its ability to comply with the financial requirements of the final Private Mortgage Insurer Eligibility Requirements. See Note 2, Acquisition of Radian Asset Assurance Inc., of thePart II, Item 8, Financial Statements and Supplementary Data, Note 2, Acquisitions, for additional information.

Other Income (Loss)
 
Other income (loss) is comprised ofcomprises recurring items such as foreign exchange remeasurement gains and losses, ancillary fees on financial guaranty policies such as commitment and consent, and processing fees, as well asif applicable, other revenue items on financial guaranty insurance and reinsurance contracts such as commutation gains on re-assumptions of previously ceded business, (see Note 13, Reinsuranceloss mitigation recoveries and Other Monoline Exposures,certain non-recurring items. In 2016, other income primarily comprised a benefit due to loss mitigation recoveries, offset in part by a loss on foreign exchange mainly due to the decline in the exchange rate of the Financial Statementspound sterling. In 2015 and Supplementary Data)2014, other income primarily comprised a commutation gain on the reassumption of ceded books of business from certain reinsurers and other non-recurring items.benefits due to loss mitigation recoveries.


 Other Income (Loss)

Year Ended December 31,Year Ended December 31,
2015 2014 20132016 2015 2014
(in millions)(in millions)
Foreign exchange gain (loss) on remeasurement of premium receivable and loss reserves$(15) $(21) $(1)$(33) $(15) $(21)
Commutation gains28
 23
 2
8
 28
 23
Other24
 12
 (11)64
 24
 12
Total other income (loss)$37
 $14
 $(10)$39
 $37
 $14
 

Economic Loss Development

     The insured portfolio includes policies accounted for under three separate accounting models depending on the characteristics of the contract and the Company’s control rights. Please refer to Part II, Item 8, Financial Statements and Supplementary Data, Note 5, Expected Loss to be Paid, of the Financial Statements and Supplementary Data, for a discussion of the assumptions and methodologies used in calculating the expected loss to be paid for all contracts. For a discussion of the loss estimation process, approach to projecting losses and the measurement and recognition accounting policies under GAAP for each type of contract, see the following in Part II, Item 8, Financial Statements and Supplementary Data:

Note 5 for expected loss to be paid,
��Note 6 for financial guaranty insurance,
Note 7 for fair value methodologies for credit derivatives and FG VIE assets and liabilities,
Note 8 for credit derivatives, and
Note 9 for consolidated FG VIEs.
    
The discussion of losses that follows encompasses losses on all contracts in the insured portfolio regardless of accounting model, unless otherwise specified. In order to effectively evaluate and manage the economics of the entire insured portfolio, management compiles and analyzes expected loss information for all policies on a consistent basis. That is, management monitors and assigns ratings and calculates expected losses in the same manner for all its exposures. Management also considers contract specific characteristics that affect the estimates of expected loss.


84


The surveillance process for identifying transactions with expected losses is described in the notesPart II, Item 8, Financial Statements and Supplementary Data, Note 5, Expected Losses to the consolidated financial statements.be Paid. More extensive monitoring and intervention is employed for all BIG surveillance categories, with internal credit ratings reviewed quarterly.
    
Net expected loss to be paid consists primarily of the present value of future: expected claim and LAE payments, expected recoveries from excess spread and other collateral in the transaction structures, cessions to reinsurers, and expected recoveries for breaches of R&W and the effects of other loss mitigation strategies. Current risk free rates are used to discount expected losses at the end of each reporting period and therefore changes in such rates from period to period affect the expected loss estimates reported. Assumptions used in the determination of the net expected loss to be paid such as delinquency, severity, and discount rates and expected timeframestime frames to recovery in the mortgage market were consistent by sector regardless of the accounting model used. The primary drivers of economic loss development are discussed below. Changes in risk free rates used to discount losses affect economic loss development, loss and LAE, and non-GAAPoperating loss expense,and LAE; however, the effect of changes in discount rates are not indicative of actual credit impairment or improvement in the period.

The primary differences between net economic loss development and loss and LAE reported under GAAP are that GAAP (1) the amount reported in the Consolidated Statements of Operations:

considers deferred premium revenue in the calculation of loss reserves and loss expenseand LAE for financial guaranty insurance contracts, (2)

eliminates lossesloss and LAE related to FG VIEs and (3)

does not include estimated losses on credit derivatives.


Loss expenseand LAE reported in operating income (i.e. operating loss and LAE) includes losses on financial guaranty insurance contracts, other than those eliminated due to consolidation of FG VIEs, and credit derivatives and does not eliminate losses on FG VIEs.derivatives.

For financial guaranty insurance contracts, a GAAPthe loss and LAE reported in the Consolidated Statements of Operations is generally recorded only when expected losses exceed deferred premium revenue. Therefore, the timing of loss recognition in income does not necessarily coincide with the timing of the actual credit impairment or improvement reported in net economic loss development. Transactions acquired in a business combination generally have the largest deferred premium revenue balances because of the purchase accounting adjustments made at acquisition. Therefore the largest differences between net economic loss development and loss expenseand LAE on financial guaranty insurance contracts generally relate to these policies. See "–Loss"Loss and LAE (Financial Guaranty Insurance Contracts)" below.

Net Expected Loss to be Paid 
 
As of
December 31, 2015
 As of
December 31, 2014
As of
December 31, 2016
 As of
December 31, 2015
(in millions)(in millions)
Public finance$809
 $348
$904
 $809
Structured finance      
U.S. RMBS before benefit for recoveries for breaches of R&W488
 901
Net benefit for recoveries for breaches of R&W (1)(79) (317)
U.S. RMBS after benefit for recoveries for breaches of R&W409
 584
U.S. RMBS before R&W payable (recoverable)200
 488
R&W payable (recoverable) (1)6
 (79)
U.S. RMBS after R&W206
 409
Other structured finance173
 237
88
 173
Structured finance582
 821
294
 582
Total$1,391
 $1,169
$1,198
 $1,391
____________________
(1)As of December 31, 2015, the remaining estimated benefit for recoveries for breaches of R&W are subject to contractual settlement agreements.
The Company is no longer actively pursuing anyCompany’s agreements with R&W providers generally provide that, as the Company makes claim payments, the R&W providers reimburse it for breaches.those claims; if the Company later receives reimbursement through the transaction (for example, from excess spread), the Company repays the R&W providers. When the Company projects receiving more reimbursements in the future than it projects paying in claims on transactions covered by R&W settlement agreements, the Company will have a net R&W payable.


85

Table of Contents

Economic Loss Development (Benefit) (1)

Year Ended December 31,Year Ended December 31,
2015 2014 20132016 2015 2014
(in millions)(in millions)
Public finance$405
 $171
 $256
$269
 $405
 $171
Structured finance          
U.S. RMBS before benefit for recoveries for breaches of R&W(149) 0
 140
Net development (benefit) for recoveries for breaches of R&W67
 (268) (296)
U.S. RMBS after benefit for recoveries for breaches of R&W(82) (268) (156)
U.S. RMBS before R&W payable (recoverable)(108) (149) 0
R&W payable (recoverable)17
 67
 (268)
U.S. RMBS after R&W(91) (82) (268)
Other structured finance(4) 67
 (44)(39) (4) 67
Structured finance(86) (201) (200)(130) (86) (201)
Total$319
 $(30) $56
$139
 $319
 $(30)
____________________
(1)Economic loss development includes the effects of changes in assumptions based on observed market trends, changes in discount rates, accretion of discount and the economic effects of loss mitigation efforts.


2016 Net Economic Loss Development

The total economic loss development of $139 million in 2016 was primarily related to the public finance sector, offset in part by improvements in the structured finance sector. The risk-free rates used to discount expected losses ranged from 0.0% to 3.23% as of December 31, 2016 and 0.0% to 3.25% as of December 31, 2015. The effect of changes in the risk-free rates used to discount expected losses was a benefit of $15 million in 2016.

U.S. Public Finance Economic Loss Development: The net par outstanding for U.S. public finance obligations rated BIG by the Company was $7.4 billion as of December 31, 2016 compared with $7.8 billion as of December 31, 2015. The Company projects that its total net expected loss across its troubled U.S. public finance credits as of December 31, 2016 will be $871 million, compared with $771 million as of December 31, 2015. Economic loss development in 2016 was $276 million, which was primarily attributable to Puerto Rico exposures. See "Insured Portfolio-Exposure to Puerto Rico" below for details about significant developments that have taken place in Puerto Rico.

U.S. RMBS Economic Loss Development: The net benefit attributable to U.S. RMBS was $91 million and was due mainly to the acceleration of claim payments as a means of mitigating future losses on certain Alt-A transactions.

Other Structured Finance Economic Loss Development: The net benefit attributable to structured finance (excluding U.S. RMBS) was $39 million, due primarily to a benefit from the purchase of a portion of an insured obligation as part of a loss mitigation strategy and and the commutation of certain assumed student loan exposures.

2015 Net Economic Loss Development

Total economic loss development was $319 million in 2015, due primarily to higher U.S. public finance losses on Puerto Rico exposures, partially offset by a net benefit in the U.S. RMBS sector. The risk-free rates used to discount expected losses ranged from 0.0% to 3.25% as of December 31, 2015 compared with 0.0% to 2.95% as of December 31, 2014. The change in the risk-free rates used to discount expected losses was a benefit of $23 million in 2015.

U.S. Public Finance Economic Loss Development: The net par outstanding for U.S. public finance obligations rated BIG by the Company was $7.8 billion as of December 31, 2015 compared with $7.9 billion as of December 31, 2014. The Company projectsprojected that its total net expected loss across its troubled U.S. public finance credits as of December 31, 2015 willwould be $771 million, compared with $303 million as of December 31, 2014. Economic loss development in 2015 was approximately $416 million, which was primarily attributable to certain Puerto Rico exposures. See "Insured Portfolio-Exposure to Puerto Rico" below for details about significant developments that have taken place in Puerto Rico over the course of 2015.

U.S. RMBS Economic Loss Development: The net benefit attributable to U.S. RMBS of $82 million was primarily due to the R&W settlements during the year and a benefit due to the acceleration of claim payments as a means of mitigating future losses on certain Alt-A transactions, which was partially offset by losses in certain second lien U.S. RMBS transactions due to rising delinquencies and collateral deterioration associated with the increase in monthly payments when their loans reach their principal amortization period. Please refer to Note 5, Expected Loss to be Paid, of the Financial Statements and Supplementary Data, for additional information.

Based on its observation during the period of the performance of its insured transactions (including early stage delinquencies, late stage delinquencies and loss severity) as well as the residential property market and economy in general, the Company chose to use the same general assumptions to project RMBS losses as of December 31, 2015 as it used as of December 31, 2014, except that, for its first lien RMBS loss projections for 2015 it shortened by twelve months the period it is projecting it will take in the base case to reach the final conditional default rate ("CDR") as compared with December 31, 2014.

Infrastructure: The Company has insured exposure of approximately $2.9 billion to infrastructure transactions with refinancing risk as to which the Company may need to make claim payments that it did not anticipate paying when the policies were issued. For more information about this risk, see the Risk Factor captioned "Estimates of expected losses are subject to uncertainties and may not be adequate to cover potential paid claims" under Risks Related to the Company's Expected Losses in "Item 1A. Risk Factors."

2014 Net Economic Loss Development

Total economic loss development was a favorable $30 million in 2014, due primarily to the various U.S. RMBS R&W settlements during the year and improvements in some of the Company's insured TruPS transactions. This was partially offset by U.S. public finance losses related to Puerto Rico and Detroit and structured finance losses that resulted primarily from changes in underlying assumptions on life insurance securitization transactions and the decrease in discount rates used. The

86

Table of Contents

risk-free rates used to discount expected losses ranged from 0.0% to 2.95% as of December 31, 2014 compared with 0.0% to 4.44% as of December 31, 2013.

U.S. Public Finance Economic Loss Development: The net par outstanding for U.S. public finance obligations rated BIG by the Company was $7.9 billion as of December 31, 2014 compared with $9.1 billion as of December 31, 2013. The Company projected that its total net expected loss across its troubled U.S. public finance credits as of December 31, 2014 would be $303 million, compared with $264 million as of December 31, 2013. Economic loss development in 2014 was approximately $183 million, which was primarily attributable to Puerto Rico and Detroit exposures.

U.S. RMBS Economic Loss Development: The net benefit attributable to U.S. RMBS of $268 million was primarily due to the R&W settlements during the year. Please refer to Note 5, Expected Loss to be Paid, of the Financial Statements and Supplementary Data, for additional information.

Based on its observations of the performance of its insured transactions (including early stage delinquencies, late stage delinquencies and loss severity) as well as the residential property market and economy in general, the Company chose to use the same general methodology to project first lien RMBS losses as of December 31, 2014 as it used as of December 31, 2013, but it made a number of refinements to reflect its observations, notably:

updated the liquidation rates it uses on delinquent loans based on observations and on an assumption that loan modifications (which improve liquidation rates) would over the next year be less frequent than they were over the most recent year

updated the liquidation rate it uses for loans reported as current but that had been reported as modified over the previous twelve months, based on observed data

established a liquidation rate assumption for loans reported as current and not modified in the past twelve months but that had been reported as delinquent in the previous twelve months

established loss severity assumptions by vintage category as well as product type, rather than just product type as done previously

beginning with the third quarter 2014, each quarter shortened by three months the period it is projecting it will take in the base case to reach the final CDR

The methodology and revised assumptions the Company used to project first lien RMBS losses and the scenarios it employed are described in more detail in Note 5, Expected Loss to be Paid, of the Financial Statements and Supplementary Data under " - U.S. First Lien RMBS Loss Projections: Alt A First Lien, Option ARM, Subprime and Prime". The Company estimated the impact of all of the refinements to its first lien RMBS assumptions described above to be a decrease of expected losses of approximately $42 million (before adjustments for settlements or loss mitigation purchases) in 2014. Based on its observations of the performance of its insured transactions (including early stage delinquencies, late stage delinquencies and loss severity) as well as the residential property market and economy in general, the Company chose to use the same general methodology to project second lien RMBS losses as of December 31, 2014 as it used as of December 31, 2013, but it made a number of refinements to reflect its observations, notably with respect to most home equity lines of credit ("HELOC")projections to:

reflect increased recoveries on newly defaulted loans as well as previously defaulted loans

project incremental defaults associated with increased monthly payments that occur when interest-only periods end

increase the assumed final conditional prepayment rate from 10% to 15%

The methodology and assumptions the Company uses to project second lien RMBS losses and the scenarios it employs are described in more detail in Note 5, Expected Loss to be Paid, of the Financial Statements and Supplementary Data under " - U.S. Second Lien RMBS Loss Projections."


87

Table of Contents

2013 Net Economic Loss Development

Total economic loss development was $56 million in 2013, primarily due to U.S. public finance losses related to Detroit, Puerto Rico and Harrisburg, partially offset by favorable development in U.S. RMBS due to the various settlements during the year. Excluding the settlements, U.S. RMBS loss development was primarily due to the change in assumptions for first liens. The risk-free rates used to discount expected losses ranged from 0.0% to 4.44% as of December 31, 2013 compared with 0.0% to 3.28% as of December 31, 2012.

U.S. Public Finance Economic Loss Development: The Company insured general obligation bonds of the Commonwealth of Puerto Rico and various obligations of its related authorities and public corporations aggregating $5.4 billion net par as of December 31, 2013. The Company rated $5.2 billion net par of that amount BIG. Debt obligations of the Commonwealth of Puerto Rico and various obligations of its related authorities and public corporations came under increasing pressure during 2013 and in February 2014, S&P, Moody's and Fitch Ratings downgraded much of the debt of Puerto Rico and its related authorities and public corporations to BIG.

Many U.S. municipalities and related entities continued to be under increased pressure in 2013, and a few had filed for protection under the U.S. Bankruptcy Code, entered into state processes designed to help municipalities in fiscal distress or otherwise indicated they may consider not meeting their obligations to make timely payments on their debts. The municipalities whose obligations the Company had insured that had filed for protection under Chapter 9 of the U.S Bankruptcy Code were: Detroit, Michigan; Jefferson County, Alabama; and Stockton, California. The City Council of Harrisburg, Pennsylvania had also filed a purported bankruptcy petition, which was later dismissed by the bankruptcy court; a receiver for the City of Harrisburg was appointed by the Commonwealth Court of Pennsylvania on December 2, 2011. In 2013, the Company reached agreements with Jefferson County, Harrisburg and Stockton.

The net par outstanding for these and all other BIG rated U.S. public finance obligations was $9.1 billion as of December 31, 2013. The Company projected that its total future expected net loss across its troubled U.S. public finance credits as of December 31, 2013 was $264 million, up from $7 million as of December 31, 2012. The net increase of $257 million in expected loss was primarily attributable to deterioration in the credit of Puerto Rico and its related authorities and public corporations, the bankruptcy filing by the City of Detroit, and a final resolution in Harrisburg that was somewhat worse for the Company than it projected as of December 31, 2012, offset in part primarily by the final resolution of the Company's Jefferson County exposure.

U.S. RMBS Economic Loss Development: Based on its observations of the performance of its insured transactions (including early stage delinquencies, late stage delinquencies and loss severity) as well as the residential property market and economy in general, the Company chose to use the same general approach (with the refinements described below) to project RMBS losses as of December 31, 2013 as it used as of December 31, 2012. The Company's use of the same general methodology to project RMBS losses as of December 31, 2013 as it used as of December 31, 2012 was consistent with its view at December 31, 2013 that the housing and mortgage market recovery was occurring at a slower pace than it anticipated at December 31, 2012.

The Company refined its first lien RMBS loss projection methodology as of December 31, 2013 to model explicitly the behavior of borrowers with loans that had been modified. The Company had observed that mortgage loan servicers were modifying more mortgage loans (reducing or forbearing from collecting interest or principal or both due on mortgage loans) to reduce the borrowers’ monthly payments and so improve their payment performance than was the case before the mortgage crisis. Borrowers who are current based on their new, reduced monthly payments are generally reported as current, but are more likely to default than borrowers who are current and whose loans have not been modified. The Company believed modified loans are most likely to default again during the first year after modification. The Company set its liquidation rate assumptions as of December 31, 2012 based on observed roll rates and with modification activity in mind. As of December 31, 2013, the Company made a number of refinements to its first lien RMBS loss projection assumptions to treat loan modifications explicitly. Specifically, in the base case approach, it:

established a liquidation rate assumption for loans reported as current but that had been reported as modified in the previous 12 months

assumed that currently delinquent loans that did not roll to liquidation would behave like modified loans, and so applied the modified loan liquidation rate to them

increased from two to three years the period over which it calculates the initial CDR based on assumed liquidations of non-performing loans and modified loans, to account for the longer period modified loans will take to default

88

Table of Contents


increased the period it assumes the transactions will experience the initial loss severity assumption before it improves and the period during which the transaction will experience low voluntary prepayment rates

established an assumption for servicers not to advance loan payments on all delinquent loans

The methodology and revised assumptions the Company used to project first lien RMBS losses and the scenarios it employed are described in more detail Note 5, Expected Loss to be Paid, of the Financial Statements and Supplementary Data. The refinement in assumptions described above resulted in a reduction of the initial CDRs but the application of the initial CDRs for a longer period generally resulted in a higher amount of loans being liquidated at the initial CDR under the refined assumptions than under the initial CDR under the previous assumptions. The Company estimated the impact of all of the refinements to its assumptions described above to be an increase of expected losses of approximately $8 million (before adjustments for settlements or loss mitigation purchases) by running on the first lien RMBS portfolio as of December 31, 2013 base case assumptions similar to what it used as of December 31, 2012 and comparing those results to the results from the refined assumptions.

During 2013 the Company observed improvements in the performance of its second lien RMBS transactions that, when viewed in the context of their performance prior to 2013, suggested those transactions were beginning to respond to the improvements in the residential property market and economy being widely reported by market observers. Based on such observations, in projecting losses for second lien RMBS the Company chose to decrease by two months in its base scenario and by three months in its optimistic scenario the period it assumed it would take the mortgage market to recover as compared to December 31, 2012. Also during 2013 the Company observed material improvements in the delinquency measures of certain second lien RMBS for which the servicing had been transferred, and made certain adjustments on just those transactions to reflect its view that much of this improvement was due to loan modifications and reinstatements made by the new servicer and that such recently modified and reinstated loans may have a higher likelihood of defaulting again.
Loss and LAE (Financial Guaranty Insurance Contracts)
 
For transactionsThe amount of loss and LAE recognized in the consolidated statements of operations for financial guaranty contracts accounted for as financial guaranty insurance, under GAAP,is dependent on the amount of economic loss development discussed above and the deferred premium revenue amortization in a given period, on a contract-by-contract basis. For these transactions, each transaction’s expected loss to be expensed, net of estimated recoveries, is compared with the deferred premium revenue of that transaction. Generally, when the expected loss to be expensed exceeds the deferred premium revenue, a loss is recognized in the income statementconsolidated statements of operations for the amount of such excess. When the Company measures operating income, a non-GAAP financial measure, it calculates the credit derivative and FG VIE losses incurred in a similar manner.

While expected loss to be paid is an important liquidity measure that provides the present value of amounts that the Company expects to pay or recover in future periods on all contracts, expected loss to be expensed is important because it presents the Company’s projection of incurred lossesloss and LAE that will be recognized in future periods as deferred premium revenue amortizes into income onin the Consolidated Statements of Operations for financial guaranty insurance policies. Expected loss to be paid for FG VIEs pursuant to AGC’s and AGM’s financial guaranty policies is calculated in a manner consistent with financial guaranty insurance contracts, but eliminated in consolidation under GAAP.


89

Table of Contents

The following table presents the loss and LAE recorded in the consolidated statements of operations. These amounts are based on economic loss development and expected losses to be paid that are discussed above, and the amortization of unearned premium reserve on a transaction by transaction basis. Amounts presented are net of reinsurance.

Loss and LAE Reported
on the Consolidated Statements of Operations

Year Ended December 31,Year Ended December 31,
2015 2014 20132016 2015 2014
(in millions)(in millions)
Public finance$393
 $191
 $214
$304
 $393
 $191
Structured finance          
U.S. RMBS54
 (129) (4)37
 54
 (129)
Other structured finance5
 94
 (35)(39) 5
 94
Structured finance59
 (35) (39)(2) 59
 (35)
Total insurance contracts before FG VIE consolidation452
 156
 175
302
 452
 156
Effect of consolidating FG VIEs(28) (30) (21)
Elimination of losses attributable to FG VIEs(7) (28) (30)
Total loss and LAE (1)$424
 $126
 $154
$295
 $424
 $126
____________________
(1)Excludes credit derivative benefit of $20 million for 2016, credit derivative loss expense of $22 million for 2015 and credit derivative benefit of $77 million and $1 million for 2014 and 2013, respectively, which are included in non-GAAP loss expense.2014.

Loss and LAE in 2016 was mainly driven by higher loss reserves on certain Puerto Rico exposures.

Loss and LAE in 2015 includescomprised mainly changes in loss estimates on Puerto Rico exposures, second lien U.S. RMBS HELOC transactions and Triple-X life insurance transactions. Some of the increases were partially offset by improvements in first lien U.S. RMBS and student loan transactions.

In 2014, losses and LAE primarily includesincluded higher U.S. public finance loss estimates on Puerto Rico and Detroit, and higher structured finance losses attributable to Triple-X life insurance transactions. In 2014, loss and LAE also includesincluded benefits in the U.S. RMBS portfolio due primarily to the settlement of several R&W claims. Changes in risk-free rates used to discount losses also adversely affected loss expense for long-dated transactions, however this component of loss expense does not reflect actual credit impairment or improvement in the period.

In 2013, losses incurred were due primarily to U.S. public finance, including Detroit, Puerto Rico and Harrisburg partially offset by positive developments in structured finance, primarily Triple-X life insurance transactions and U.S. RMBS. The positive developments in U.S. RMBS were primarily due to the settlement of several R&W claims.

For financial guaranty contracts accounted for as insurance, the amounts reported in the GAAP financial statements may only reflect a portion of the current period’s economic loss development and may also include a portion of prior-period economic loss development. The difference between economic loss development on financial guaranty insurance contracts and loss and LAE recognized in GAAP incomethe Consolidated Statements of Operations relates to the effect of taking deferred premium revenue into account for GAAP loss and LAE, which is not considered in economic loss development.


90

TableThe following table provides a schedule of Contents

The table below presents the expected timing of net expected losses to be expensed. The amount and timing of actual loss recognition for insurance contracts on both a reported GAAP net income and non-GAAP operating income basis.LAE may differ from the estimates shown below due to factors such as accelerations, commutations, changes in expected lives and updates to loss estimates. This table excludes $64 million related to FG VIEs, which are eliminated in consolidation.

Financial Guaranty Insurance
Net Expected Loss to be Expensed
As of December 31, 2015
 
In GAAP
Reported
Income
 
In Non-GAAP
Operating
Income
 (in millions)
2016$38
 $48
201731
 40
201830
 38
201929
 36
202027
 32
2021-2025102
 117
2026-203070
 79
2031-203541
 50
After 203519
 24
Net expected loss to be expensed387
 464
Discount286
 327
Total expected future loss and LAE$673
 $791
____________________
(1)Net expected loss to be expensed for GAAP reported income is different than operating income, a non-GAAP financial measure, by the amount related to consolidated FG VIEs and credit derivatives.

Net Change in Fair Value of Credit DerivativesFinancial Guaranty Insurance Contracts
 
Changes in the fair value of credit derivatives occur primarily because of changes in interest rates, credit spreads, notional amounts, credit ratings of the referenced entities, expected terms, realized gains (losses) and other settlements, and the issuing company's own credit rating and credit spreads, and other market factors. With considerable volatility continuing in the market, unrealized gains (losses) on credit derivatives may fluctuate significantly in future periods.
 As of December 31, 2016
 (in millions)
2017 (January 1 – March 31)$8
2017 (April 1 – June 30)10
2017 (July 1 – September 30)8
2017 (October 1 – December 31)9
Subtotal 201735
201834
201932
202032
202128
2022-2026117
2027-203182
2032-203644
After 203617
Net expected loss to be expensed421
Future accretion373
Total expected future loss and LAE$794

Except for net estimated credit impairments (i.e., net expected payments), the unrealized gains and losses on credit derivatives are expected to reduce to zero as the exposure approaches its maturity date. Changes in the fair value of the Company’s credit derivatives that do not reflect actual or expected claims or credit losses have no impact on the Company’s statutory claims-paying resources, rating agency capital or regulatory capital positions. Expected losses to be paid in respect of contracts accounted for as credit derivatives are included in the discussion above “—Economic Loss Development.”
The impact of changes in credit spreads will vary based upon the volume, tenor, interest rates, and other market conditions at the time these fair values are determined. In addition, since each transaction has unique collateral and structural terms, the underlying change in fair value of each transaction may vary considerably. The fair value of credit derivative contracts also reflects the change in the Company’s own credit cost based on the price to purchase credit protection on AGC and AGM. The Company determines its own credit risk based on quoted CDS prices traded on the Company at each balance sheet date. Generally, a widening of credit spreads of the underlying obligations results in unrealized losses and the tightening of credit spreads of the underlying obligations results in unrealized gains. A widening of the CDS prices traded on AGC and AGM has an effect of offsetting unrealized losses that result from widening general market credit spreads, while a narrowing of the CDS prices traded on AGC and AGM has an effect of offsetting unrealized gains that result from narrowing general market credit spreads.
The valuation of the Company’s credit derivative contracts requires the use of models that contain significant, unobservable inputs, and are classified as Level 3 in the fair value hierarchy. The models used to determine fair value are primarily developed internally based on market conventions for similar transactions that the Company observed in the past. There has been very limited new issuance activity in this market over the past several years and as of December 31, 2015, market prices for the Company’s credit derivative contracts were generally not available. Inputs to the estimate of fair value

91

Table of Contents

include various market indices, credit spreads, the Company’s own credit spread, and estimated contractual payments. See Note 7, Fair Value Measurement, of the Financial Statements and Supplemental Data for additional information.
Net Change in Fair Value of Credit Derivatives
Changes in the fair value of credit derivatives occur primarily because of changes in interest rates, credit spreads, notional amounts, credit ratings of the referenced entities, expected terms, realized gains (losses) and other settlements, and the issuing company's own credit rating and credit spreads, and other market factors. With considerable volatility continuing in the market, unrealized gains (losses) on credit derivatives may fluctuate significantly in future periods.

Except for net estimated credit impairments (i.e., net expected payments), the unrealized gains and losses on credit derivatives are expected to reduce to zero as the exposure approaches its maturity date. Changes in the fair value of the Company’s credit derivatives that do not reflect actual or expected claims or credit losses have no impact on the Company’s statutory claims-paying resources, rating agency capital or regulatory capital positions. Expected losses to be paid in respect of contracts accounted for as credit derivatives are included in the discussion above “Economic Loss Development.”
The impact of changes in credit spreads will vary based upon the volume, tenor, interest rates, and other market conditions at the time these fair values are determined. In addition, since each transaction has unique collateral and structural terms, the underlying change in fair value of each transaction may vary considerably. The fair value of credit derivative contracts also reflects the change in the Company’s own credit cost based on the price to purchase credit protection on AGC and AGM. The Company determines its own credit risk based on quoted CDS prices traded on the Company at each balance sheet date. Generally, a widening of credit spreads of the underlying obligations results in unrealized losses and the tightening of credit spreads of the underlying obligations results in unrealized gains. A widening of the CDS prices traded on AGC and AGM has an effect of offsetting unrealized losses that result from widening general market credit spreads, while a narrowing of the CDS prices traded on AGC and AGM has an effect of offsetting unrealized gains that result from narrowing general market credit spreads.
The valuation of the Company’s credit derivative contracts requires the use of models that contain significant, unobservable inputs, and are classified as Level 3 in the fair value hierarchy. The models used to determine fair value are primarily developed internally based on market conventions for similar transactions that the Company observed in the past.

There has been very limited new issuance activity in this market over the past several years and as of December 31, 2016, market prices for the Company’s credit derivative contracts were generally not available. Inputs to the estimate of fair value include various market indices, credit spreads, the Company’s own credit spread, and estimated contractual payments. See Part II, Item 8, Financial Statements and Supplemental Data, Note 7, Fair Value Measurement, for additional information.
Net Change in Fair Value of Credit Derivatives
Gain (Loss)
 
Year Ended December 31,Year Ended December 31,
2015 2014 20132016 2015 2014
(in millions)(in millions)
Realized gains on credit derivatives$63
 $73
 $121
$56
 $63
 $73
Net credit derivative losses (paid and payable) recovered and recoverable and other settlements(81) (50) (163)(27) (81) (50)
Realized gains (losses) and other settlements on credit derivatives(1)(18) 23
 (42)
Net change in unrealized gains (losses) on credit derivatives:     
Realized gains (losses) and other settlements (1)29
 (18) 23
Net unrealized gains (losses):     
Pooled corporate obligations147
 (18) (32)(16) 147
 (18)
U.S. RMBS396
 814
 (69)22
 396
 814
CMBS42
 2
 
Commercial mortgage-backed securities (CMBS)0
 42
 2
Other161
 2
 208
63
 161
 2
Net change in unrealized gains (losses) on credit derivatives746
 800
 107
Net unrealized gains (losses)69
 746
 800
Net change in fair value of credit derivatives$728
 $823
 $65
$98
 $728
 $823
____________________
(1)Includes realized gains and losses due to terminations and settlements of CDS contracts.

Net credit derivative premiums included in the realized gains on credit derivatives line in the table above, have declined in 2016, 2015 and 2014 due primarily to the decline in the net par outstanding to $17.0 billion at December 31, 2016 from $25.6 billion at December 31, 2015 fromand $35.0 billion at December 31, 20142014. As part of its strategic initiative, the Company has been negotiating terminations of investment grade and $54.5 billion at December 31, 2013. TheBIG CDS contracts with its counterparties.The following table presentpresents the effect of terminations on realized gains (losses) and other settlements on credit derivatives.

Net ParTerminations and Realized Gain and LossesSettlements
from Terminations of Direct Credit Derivative Contracts

Year Ended December 31,Year Ended December 31,
2015 2014 20132016 2015 2014
(in millions)(in millions)
Net par of terminated credit derivative contracts$2,777
 $3,591
 $4,054
$3,811
 $2,777
 $3,591
Realized gains on credit derivatives13
 1
 21
20
 13
 1
Net credit derivative losses (paid and payable) recovered and recoverable and other settlements116
 26
 

 (116) (26)
Net unrealized gains (losses) on credit derivatives103
 465
 546

During 2016, unrealized fair value gains were generated primarily as a result of CDS terminations in the U.S. RMBS and other sectors, run-off of CDS par and price improvements on the underlying collateral of the Company’s CDS. The majority of the CDS transactions were terminated as a result of settlement agreements with several CDS counterparties. The unrealized fair value gains were partially offset by unrealized losses resulting from wider implied net spreads across all sectors. The wider implied net spreads were primarily a result of the decreased cost to buy protection in AGC’s and AGM’s name, as the market cost of AGC’s and AGM’s credit protection decreased significantly during the period. These transactions were pricing at or above their floor levels (or the minimum rate at which the Company would consider assuming these risks based on historical experience); therefore when the cost of purchasing CDS protection on AGC and AGM, which management refers to as the CDS spread on AGC and AGM, decreased the implied spreads that the Company would expect to receive on these transactions increased.


During 2015, unrealized fair value gains were generated primarily as a result of CDS terminations. The Company reached a settlement agreement with one CDS counterparty to terminate five Alt-A first lien CDS transactions resulting in unrealized fair value gains of $213 million and was the primary driver of the unrealized fair value gains in the U.S. RMBS sector. The Company also terminated a CMBS transaction, a Triple-X life insurance securitization transaction, and a distressed middle market collateralized loan obligation ("CLO")CLO securitization during the period and recognized unrealized fair value gains of $41 million, $99 million and $99 million, respectively. These were the primary drivers of the unrealized fair value gains in the CMBS, Other, and pooled corporate CLOcollateralized loan obligation (CLO) sectors, respectively, during the period. The remainder of the fair value gains for the period were a result of tighter implied net spreads across all sectors. The tighter implied net spreads were primarily a result of the increased cost to buy protection in AGC’s and AGM’s name, particularly for the one year CDS spread. These transactions were pricing at or above their floor levels, therefore when the cost of purchasing CDS protection on AGC and AGM increased, the implied spreads that the Company would expect to receive on these transactions decreased. Finally, during 2015, there was a refinement in methodology to address an instance in a U.S. RMBS transaction where the Company now expects recoveries. This refinement resulted in approximately $49 million in fair value gains in 2015.


92

Table of Contents

During 2014, unrealized fair value gains were generated primarily in the U.S. RMBS prime first lien, Option ARM and subprime sectors. This is primarily due to a significant unrealized fair value gain in the Option ARM and Alt-A first lien sector of approximately $543 million, as a result of the terminations of three large Alt-A first lien resecuritization transactions and one Option ARM first lien transaction during the period. In addition, there was an unrealized gain of approximately $346 million related to the change in index used to determine fair value during the fourth quarter of 2014. In the fourth quarter of 2014, new market indices were published on Option ARM and Alt-A first lien securitizations. As part of the Company’s normal review process the Company reviewed these indices and based upon the collateral make-up, collateral vintage, and collateral loss experience, determined it to be a better market indication for the Company’s Option ARM and Alt-A first lien securitizations. The unrealized fair value gains were partially offset by unrealized fair value losses generated by wider implied net spreads. The wider implied net spreads were primarily a result of the decreased cost to buy protection in AGC’s and AGM’s name, as the market cost of AGC's and AGM’s credit protection decreased during the period. These transactions were pricing at or above their floor levels (or the minimum rate at which the Company would consider assuming these risks based on historical experience);levels; therefore when the cost of purchasing CDS protection on AGC and AGM decreased, the implied spreads that the Company would expect to receive on these transactions increased.

During 2013, unrealized fair value gains were generated in the “other” sector primarily as a result of the termination of a film securitization transaction and a U.K. infrastructure transaction, as well as price improvement on a Triple-X life insurance transaction. These unrealized gains were partially offset by unrealized fair value losses in the prime first lien, Alt-A, Option ARM and subprime RMBS sectors due to wider implied net spreads. The wider implied net spreads were primarily a result of the decreased cost to buy protection in AGC’s name as the market cost of AGC’s credit protection decreased. These transactions were pricing above their floor levels; therefore when the cost of purchasing CDS protection on AGC decreased, the implied spreads that the Company would expect to receive on these transactions increased. The cost of AGM’s credit protection also decreased slightly during 2013, but did not lead to significant fair value losses, as the majority of AGM policies continue to price at floor levels. The company terminated a film securitization CDS for a payment of $120 million which was recorded in realized gains (losses) and other settlements on credit derivatives, with a corresponding release of the unrealized loss recorded in unrealized gains (losses) on credit derivatives of $127 million for a net change in fair value of credit derivatives of $7 million.

CDS Spread on AGC and AGM
Quoted price of CDS contract (in basis points)
 
As of
December 31, 2015
 As of
December 31, 2014
 As of
December 31, 2013
As of
December 31, 2016
 As of
December 31, 2015
 As of
December 31, 2014
Five-year CDS spread:          
AGC376
 323
 460
158
 376
 323
AGM366
 325
 525
158
 366
 325
          
One-year CDS spread          
AGC139
 80
 185
35
 139
 80
AGM131
 85
 220
29
 131
 85


Effect of Changes in the Company’s Credit Spread on
Net Unrealized Gains (Losses) on Credit Derivatives
 
Year Ended December 31,Year Ended December 31,
2015 2014 20132016 2015 2014
(in millions)(in millions)
Change in unrealized gains (losses) of credit derivatives:          
Before considering implication of the Company’s credit spreads$663
 $1,396
 $1,374
$183
 $663
 $1,396
Resulting from change in the Company’s credit spreads83
 (596) (1,267)(114) 83
 (596)
After considering implication of the Company’s credit spreads$746
 $800
 $107
$69
 $746
 $800
 

93


Management believes that the trading level of AGC’s and AGM’s credit spreads isover the past several years has been due to the correlation between AGC’s and AGM’s risk profile and the current risk profile of the broader financial markets, and to increased demand for credit protection against AGC and AGM as the result of its financial guaranty volume, as well as the overall lack of liquidity in the CDS market. Offsetting the benefit attributable to AGC’s and AGM’s credit spread were higher credit spreads in the fixed income security markets relative to pre-financial crisis levels. The higher credit spreads in the fixed income security market are due to the lack of liquidity in the high-yield CDO, trust preferred securities CDO ("TruPS CDOs"),CDOs, and CLO markets as well as continuing market concerns over the 2005-2007 vintages of RMBS.

Interest Expense

Changes in interest expense between 2015 and 20132014 relate to the timing of debt issuance. In June 2014, the Company issued $500 million aggregate principal amount of 5.0%5% Senior Notes due 2024. All other long term debt of the U.S. holding companies was outstanding throughout all three years presented. See Part II, Item 8, Financial Statements and Supplementary Data, Note 16, Long-Term Debt and Credit Facilities, of the Financial Statements and Supplementary Data.Facilities. The following table presents the components of interest expense.

Interest Expense

Year Ended December 31,Year Ended December 31,
2015 2014 20132016 2015 2014
(in millions)(in millions)
Debt issued by AGUS$49
 $36
 $23
$48
 $49
 $36
Debt issued by AGMH54
 54
 54
54
 54
 54
Notes payable by AGM(2) 2
 5
0
 (2) 2
Total$101
 $92
 $82
$102
 $101
 $92

In December 2016, $150 million of debt became floating rate interest debt, that resets quarterly, at a rate equal to three month LIBOR plus a margin equal to 2.38%.

Other Operating Expenses and Amortization of Deferred Acquisition Costs
 
2016 compared with 2015: Other operating expenses increased in 2016 compared to 2015 due primarily to higher compensation expense and accelerated amortization of leasehold improvements as a result of the Company's move of its New York offices.

2015 compared with 2014: Other operating expenses increased in 2015 compared to 2014 due primarily to $12 million in expenses related to the Radian Asset Acquisition and expenses related to the planned relocation of the New York offices in the summer of 2016. The Radian Asset Acquisition expenses were comprised mainly of fees paid to financial and legal advisors and to the independent auditor. Relocation expenses include broker fees and accelerated depreciation of unamortized improvements in the current New York office.

2014 compared with 2013: Other operating expenses increased primarily due to higher employee compensation and severance expense, partially offset by the reduction in the credit facility fee with Dexia (see Note 16, Long-Term Debt and Credit Facilities, of the Financial Statements and Supplementary Data) and lower premium tax expense. In addition, amortization of deferred acquisition costs increased due primarily to certain premium accelerations.

Financial Guaranty Variable Interest Entities
 
As of December 31, 20152016 and 2014,2015, the Company consolidated 3432 and 3234 VIEs, respectively. The table below presents the effects on reported GAAP income resulting from consolidating these FG VIEs and eliminating their related insurance and investment accounts and, in total, represents a difference between GAAP reported net income and non-GAAP operating income attributable to FG VIEs.amounts. The consolidation of FG VIEs has a significantan effect on net income and shareholders' equity due to (1) to:

changes in fair value gains (losses) on FG VIE assets and liabilities, (2) 

the eliminations of premiums and losses related to the AGC and AGM FG VIE liabilities with recourse, and (3) 

the elimination of investment balances related to the Company’s purchase of AGC and AGM insured FG VIE debt.

Upon consolidation of a FG VIE, the related insurance and, if applicable, the related investment balances, are considered intercompany transactions and therefore eliminated. See “—Non-GAAPPart II, Item 8, Financial Measures—Operating Income” belowStatements and Supplementary Data, Note 9, Consolidated Variable Interest Entities, of the Financial Statements and Supplementary Data for more details.
 

94


Effect of Consolidating FG VIEs on Net Income (Loss) 

Year Ended December 31,Year Ended December 31,
2015 2014 20132016 2015 2014
(in millions)(in millions)
Net earned premiums$(21) $(32) $(60)$(16) $(21) $(32)
Net investment income(32) (11) (13)(10) (32) (11)
Net realized investment gains (losses)10
 (5) 2
1
 10
 (5)
Fair value gains (losses) on FG VIEs38
 255
 346
38
 38
 255
Bargain purchase gain
 2
 
Loss and LAE28
 30
 21
7
 28
 30
Bargain purchase gain2
 
 
Other income (loss)0
 (2) 
0
 0
 (2)
Effect on net income before tax25
 235
 296
Effect on income before tax20
 25
 235
Less: tax provision (benefit)8
 82
 103
7
 8
 82
Effect on net income (loss)$17
 $153
 $193
$13
 $17
 $153
 
Fair value gains (losses) on FG VIEs represent the net change in fair value on the consolidated FG VIEs’ assets and liabilities. In 2016, the Company recorded a pre-tax net fair value gain on consolidated FG VIEs of $38 million. The primary driver of the 2016 gain in fair value of FG VIE assets and liabilities was net mark-to-market gains due to price appreciation resulting from improvements in the underlying collateral of HELOC RMBS assets of the FG VIEs.

In 2015, the Company recorded a pre-tax net fair value gain on consolidated FG VIEs of $38 million which was primarily driven by price appreciation on the Company's FG VIE assets during the year that resulted from improvements in the underlying collateral, as well as large principal paydowns made on the Company's FG VIEs.

In 2014, the Company recorded a pre-tax net fair value gain on consolidated FG VIEs of $255 million. The primary driver of this gain, $120 million, was a result of the deconsolidation of seven VIEs. There was an additional gain of $37 million resulting from the Company exercising its option to accelerate two second lien RMBS VIEs. These two VIEs were treated as maturities during the period. The remainder of the gain for the period was driven by the price appreciation on the Company's FG VIE assets during the year resulting from improvements in the underlying collateral, as well as large principal paydowns made on the Company's FG VIEs.

In 2013, the Company recorded a pre-tax net fair value gain of consolidated FG VIEs of $346 million. The gain was primarily driven by R&W benefits received on several VIE assets as a result of settlements with various counterparties throughout the year. These R&W settlements resulted in a gain of approximately $265 million. The remainder of the gain was driven by price appreciation on the Company's FG VIE assets during the year resulting from improvements in the underlying collateral, as well as large principal paydowns made on the Company's FG VIEs.

Provision for Income Tax
 
Deferred income tax assets and liabilities are established for the temporary differences between the financial statement carrying amounts and tax bases of assets and liabilities using enacted rates in effect for the year in which the differences are expected to reverse. Such temporary differences relate principally to unrealized gains and losses on investments and credit derivatives, FG VIE fair value adjustments, loss and LAE reserve, unearned premium reserve and tax attributes for net operating losses, alternative minimum tax credits and foreign tax credits. As of December 31, 20152016 and December 31, 2014,2015, the Company had a net deferred income tax asset of $497 million and $276 million, and $260 million, respectively. As of December 31,The increase in 2016 from 2015 the Company had alternative minimum tax credits of $55 million which do not expire.is mainly attributable to CIFG Acquisition.

Provision for Income Taxes and Effective Tax Rates 

Year Ended December 31,Year Ended December 31,
2015 2014 20132016 2015 2014
(in millions)(in millions)
Total provision (benefit) for income taxes$375
 $443
 $334
$136
 $375
 $443
Effective tax rate26.2% 28.9% 29.2%13.4% 26.2% 28.9%
 

95

Table of Contents

The Company’s effective tax rates reflect the proportion of income recognized by each of the Company’s operating subsidiaries, with U.S. subsidiaries taxed at the U.S. marginal corporate income tax rate of 35%, U.K. subsidiaries taxed at the U.K. blended marginal corporate tax rate of 20.25%20% unless subject to U.S. tax by election or as a U.S. controlled foreign corporation,CFC, and no taxes for the Company’s Bermuda subsidiaries unless subject to U.S tax by election or as a U.S. controlled foreign corporation.CFC. The Company’s overall corporate effective tax rate fluctuates based on the distribution of taxable income across these jurisdictions. In each of the periods

presented, the portion of taxable income from each jurisdiction varied. The non-taxable book-to-tax differences were mostly consistent as compared to the prior period except forwith the exception of the benefit on bargain purchase gain that was not recognized for tax purposes.from the CIFG Acquisition and Radian Asset Acquisition. See Note 12, Income Taxes, of thePart II, Item 8, Financial Statements and Supplementary Data, Note 12, Income Taxes, for more details.

Non-GAAP Financial Measures
 
To reflect the key financial measures that management analyzes in evaluating the Company’s operations and progress towards long-term goals, the Company discussesdiscloses both financial measures determined in accordance with GAAP and financial measures not promulgateddetermined in accordance with GAAP (“non-GAAP(non-GAAP financial measures”)measures). Although the financial

Financial measures identified as non-GAAP should not be considered substitutes for GAAP measures, management considers them key performance indicators and employs them as well as other factors in determining compensation. Non-GAAP financial measures, therefore, provide investors with important information about the key financial measures management utilizes in measuring its business.measures. The primary limitation of non-GAAP financial measures is the potential lack of comparability to thosefinancial measures of other companies, which may define non-GAAP measures differently because there is limited literature with respect to such measures. Threewhose definitions of the primary non-GAAP financial measures analyzed bymay differ from those of Assured Guaranty. Beginning in fourth quarter 2016, the Company’s senior management are: operating income, adjusted book value and PVP.
Management and the board of directors utilizepublicly disclosed non-GAAP financial measures are different from the financial measures used by management in evaluatingits decision making process and in its calculation of certain components of management compensation (core financial measures). The Company had previously excluded the Company’seffect of consolidating FG VIEs (FG VIE consolidation) in its calculation of its non-GAAP financial performance. By providing thesemeasures of operating income, non-GAAP operating shareholders’ equity and non-GAAP adjusted book value. Starting in fourth quarter 2016, based on the SEC's May 17, 2016 release of updated Compliance and Disclosure Interpretations of the rules and regulations on the use of non-GAAP financial measures, the Company gives investors, analysts andwill no longer adjust for FG VIE consolidation. However, wherever possible, the Company has separately disclosed the effect of FG VIE consolidation that is included in its non-GAAP financial news reporters access to the same information that management reviews internally. In addition, Assured Guaranty’s presentation ofmeasures. The prior-year non-GAAP financial measures is consistent with how analysts calculate their estimates of Assured Guaranty’s financial results in their research reports on Assured Guaranty and with how investors, analystshave been updated to reflect the revised calculation.
Management and the Board use core financial news media evaluate Assured Guaranty’s financial results.
The following paragraphs define eachmeasures, which are based on non-GAAP financial measure and describe why it is useful. A reconciliation of the non-GAAP financial measure and the most directly comparablemeasures adjusted to remove FG VIE consolidation, as well as GAAP financial measure, is also presented below.
Operating Income
Management believes that operating income is a useful measure because it clarifies the understanding of the underwriting results of the Company’s financial guaranty business,measures and also includes financing costs and net investment income, and enables investors and analystsother factors, to evaluate the Company’s results of operations, financial results as compared with the consensus analyst estimates distributed publicly bycondition and progress towards long-term goals. The Company removes FG VIE consolidation in its core financial databases. Operating income is defined as net income (loss) attributable to AGL, as reported under GAAP, adjusted for the following:
1)Elimination of the after-tax realized gains (losses) on the Company’s investments, except for gains and losses on securities classified as trading. The timing of realized gains and losses, which depends largely on market credit cycles, can vary considerably across periods. The timing of sales is largely subject to the Company’s discretion and influenced by market opportunities, as well as the Company’s tax and capital profile. Trends in the underlying profitability of the Company’s business can be more clearly identified without the fluctuating effects of these transactions.

2)Elimination of the after-tax non-credit impairment unrealized fair value gains (losses) on credit derivatives, which is the amount in excess of the present value of the expected estimated economic credit losses, and non-economic payments. Such fair value adjustments are heavily affected by, and in part fluctuate with, changes in market interest rates, credit spreads and other market factors and are not expected to result in an economic gain or loss. Additionally, such adjustments present all financial guaranty contracts on a more consistent basis of accounting, whether or not they are subject to derivative accounting rules.
3)Elimination of the after-tax fair value gains (losses) on the Company’s CCS. Such amounts are heavily affected by, and in part fluctuate with, changes in market interest rates, credit spreads and other market factors and are not expected to result in an economic gain or loss.

96


4)Elimination of the after-tax foreign exchange gains (losses) on remeasurement of net premium receivables and loss and LAE reserves. Long-dated receivables constitute a significant portion of the net premium receivable balance and represent the present value of future contractual or expected collections. Therefore, the current period’s foreign exchange remeasurement gains (losses) are not necessarily indicative of the total foreign exchange gains (losses) that the Company will ultimately recognize.
5)Elimination of the effects of consolidating FG VIEs in order to present all financial guaranty contracts on a more consistent basis of accounting, whether or not GAAP requires consolidation.measures because, although GAAP requires the Company to consolidate certain VIEs that have issued debt obligations insured by the Company, even though the Company does not own such VIEs.

ReconciliationVIEs and its exposure is limited to its obligation under its financial guaranty insurance contract. By disclosing non-GAAP financial measures, along with FG VIE consolidation, the Company gives investors, analysts and financial news reporters access to information that management and the Board review internally. Assured Guaranty believes its presentation of Net Income (Loss)
non-GAAP financial measures and FG VIE consolidation provides information that is necessary for analysts to Operating Incomecalculate their estimates of Assured Guaranty’s financial results in their research reports on Assured Guaranty and for investors, analysts and the financial news media to evaluate Assured Guaranty’s financial results.
 
 Year Ended December 31,
 2015 2014 2013
 (dollars in millions)
Net income (loss)$1,056
 $1,088
 $808
Less after-tax adjustments:     
Realized gains (losses) on investments(25) (34) 40
Non-credit impairment unrealized fair value gains (losses) on credit derivatives358
 500
 (40)
Fair value gains (losses) on CCS17
 (7) 7
Foreign exchange gains (losses) on remeasurement of premiums receivable and loss and LAE reserves(10) (15) (1)
Effect of consolidating FG VIEs17
 153
 193
Operating income$699
 $491
 $609
      
Effective tax rate on operating income24.5% 29.0% 26.7%

Adjusted Book Value and Operating Shareholders’ Equity
Management also uses adjusted book value to measure the intrinsic value of the Company, excluding franchise value. Growth in adjusted book value per share is one of the key financial measures used in determining the amount of certain long term compensation to management and employees and used by rating agencies and investors.
     Management believes that operating shareholders’ equity is a useful measure because it presents the equity of the Company with all financial guaranty contracts accounted for on a more consistent basis and excludes fair value adjustments that are not expected to result in economic gain or loss. Many investors, analysts and financial news reporters use non-GAAP operating shareholders’ equity, adjusted for FG VIE consolidation, as the principal financial measure for valuing AGL’s current share price or projected share price and also as the basis of their decision to recommend, buy or sell AGL’s common shares. Many of the Company’s fixed income investors also use operating shareholders’ equitythis measure to evaluate the Company’s capital adequacy.
Many investors, analysts and financial news reporters also use non-GAAP adjusted book value, adjusted for FG VIE consolidation, to evaluate AGL’s share price and as the basis of their decision to recommend, buy or sell the AGL common shares. Operating income adjusted for the effect of FG VIE consolidation enables investors and analysts to evaluate the Company’s financial results as compared with the consensus analyst estimates distributed publicly by financial databases.
The core financial measures that are used to help determine compensation are: (1) operating income, adjusted for FG VIE consolidation, (2) non-GAAP operating shareholders' equity, adjusted for FG VIE consolidation, (3) growth in non-GAAP adjusted book value per share, adjusted for FG VIE consolidation, and (4) PVP.

 The following paragraphs define each non-GAAP financial measure disclosed by the Company and describe why it is useful. A reconciliation of the non-GAAP financial measure and the most directly comparable GAAP financial measure is presented below.

Operating Income
Management believes that operating income is a useful measure because it clarifies the understanding of the underwriting results and financial conditions of the Company and presents the results of operations of the Company excluding the fair value adjustments on credit derivatives and CCS that are not expected to result in economic gain or loss, as well as

other adjustments described below. Management adjusts operating income further by removing FG VIE consolidation to arrive at its core operating income measure. Operating income is defined as net income (loss) attributable to AGL, as reported under GAAP, adjusted for the following:
1)
Elimination of realized gains (losses) on the Company’s investments, except for gains and losses on securities classified as trading. The timing of realized gains and losses, which depends largely on market credit cycles, can vary considerably across periods. The timing of sales is largely subject to the Company’s discretion and influenced by market opportunities, as well as the Company’s tax and capital profile.

2)
Elimination of non-credit-impairment unrealized fair value gains (losses) on credit derivatives, which is the amount of unrealized fair value gains (losses) in excess of the present value of the expected estimated economic credit losses, and non-economic payments. Such fair value adjustments are heavily affected by, and in part fluctuate with, changes in market interest rates, the Company's credit spreads, and other market factors and are not expected to result in an economic gain or loss.
3)
Elimination of fair value gains (losses) on the Company’s CCS. Such amounts are affected by changes in market interest rates, the Company's credit spreads, price indications on the Company's publicly traded debt, and other market factors and are not expected to result in an economic gain or loss.
4)
Elimination of foreign exchange gains (losses) on remeasurement of net premium receivables and loss and LAE reserves. Long-dated receivables and loss and LAE reserves represent the present value of future contractual or expected cash flows. Therefore, the current period’s foreign exchange remeasurement gains (losses) are not necessarily indicative of the total foreign exchange gains (losses) that the Company will ultimately recognize.
5)
Elimination of the tax effects related to the above adjustments, which are determined by applying the statutory tax rate in each of the jurisdictions that generate these adjustments.

Reconciliation of Net Income (Loss)
to Operating Income
 Year Ended December 31,
 2016 2015 2014
 (in millions)
Net income (loss)$881
 $1,056
 $1,088
Less pre-tax adjustments:     
Realized gains (losses) on investments(30) (27) (56)
Non-credit impairment unrealized fair value gains (losses) on credit derivatives36
 505
 687
Fair value gains (losses) on CCS0
 27
 (11)
Foreign exchange gains (losses) on remeasurement of premiums receivable and loss and LAE reserves(33) (15) (21)
Total pre-tax adjustments(27) 490
 599
Less tax effect on pre-tax adjustments13
 (144) (158)
Operating income$895
 $710
 $647
      
Gain (loss) related to FG VIE consolidation (net of tax provision of $7, $4 and $84) included in operating income$12
 $11
 $156

Non-GAAP Operating Shareholders’ Equity and Non-GAAP Adjusted Book Value
     Management believes that non-GAAP operating shareholders’ equity is a useful measure because it presents the equity of the Company excluding the fair value adjustments on investments, credit derivatives and CCS, that are not expected to result in economic gain or loss, along with other adjustments described below. Management adjusts non-GAAP operating shareholders’ equity further by removing FG VIE consolidation to arrive at its core operating shareholders' equity and core adjusted book value.

Non-GAAP operating shareholders’ equity is the basis of the calculation of non-GAAP adjusted book value (see below). OperatingNon-GAAP operating shareholders’ equity is defined as shareholders’ equity attributable to Assured Guaranty Ltd.,AGL, as reported under GAAP, adjusted for the following:
 
1)
Elimination of non-credit-impairment unrealized fair value gains (losses) on credit derivatives, which is the amount of unrealized fair value gains (losses) in excess of the present value of the expected estimated economic credit losses, and non-economic payments. Such fair value adjustments are heavily affected by, and in part fluctuate with, changes in market interest rates, credit spreads and other market factors and are not expected to result in an economic gain or loss.
2)
Elimination of fair value gains (losses) on the Company’s CCS. Such amounts are affected by changes in market interest rates, the Company's credit spreads, price indications on the Company's publicly traded debt, and other market factors and are not expected to result in an economic gain or loss.
3)
Elimination of unrealized gains (losses) on the Company’s investments that are recorded as a component of accumulated other comprehensive income (AOCI) (excluding foreign exchange remeasurement). The AOCI component of the fair value adjustment on the investment portfolio is not deemed economic because the Company generally holds these investments to maturity and therefore should not recognize an economic gain or loss.

1) 4) Elimination of the effectstax asset or liability related to the above adjustments, which are determined by applying the statutory tax rate in each of consolidating FG VIEs in order to present all financial guaranty contracts on a more consistent basis of accounting, whether or not GAAP requires consolidation. GAAP requires the Company to consolidate certain VIEsjurisdictions that have issued debt obligations insured by the Company even though the Company does not own such VIEs.generate these adjustments.
 
2)Elimination ofManagement uses non-GAAP adjusted book value, adjusted for FG VIE consolidation, to measure the after-tax non-credit impairment unrealized fair value gains (losses) on credit derivatives, which is the amount in excess of the presentintrinsic value of the expected estimated economic credit losses, and non-economic payments. Such fairCompany, excluding franchise value. Growth in non-GAAP adjusted book value adjustments are heavily affected by, and in part fluctuate with, changes in market interest rates, credit spreads and other market factors and are not expected to result in an economic gain or loss.

97

Table of Contents

3)Eliminationper share adjusted for FG VIE consolidation (core adjusted book value) is one of the after-tax fair value gains (losses) onkey financial measures used in determining the Company’s CCS. Such amounts are heavily affectedamount of certain long-term compensation elements to management and employees and used by rating agencies and in part fluctuate with, changes in market interest rates, credit spreads and other market factors and are not expected to result in an economic gain or loss.
4)Elimination of the after-tax unrealized gains (losses) on the Company’s investments that are recorded as a component of accumulated other comprehensive income (“AOCI”) (excluding foreign exchange remeasurement). The AOCI component of the fair value adjustment on the investment portfolio is not deemed economic because the Company generally holds these investments to maturity and therefore should not recognize an economic gain or loss.
investors. Management believes that adjusted book valuethis is a useful measure because it enables an evaluation of the net present value of the Company’s in-force premiums and revenues in addition tonet of expected losses. Non-GAAP adjusted book value is non-GAAP operating shareholders’ equity. equity, as defined above, further adjusted for the following:
1)
Elimination of deferred acquisition costs, net. These amounts represent net deferred expenses that have already been paid or accrued and will be expensed in future accounting periods.
2)
Addition of the net present value of estimated net future credit derivative revenue. See below.
3)
Addition of the deferred premium revenue on financial guaranty contracts in excess of expected loss to be expensed, net of reinsurance. This amount represents the expected future net earned premiums, net of expected losses to be expensed, which are not reflected in GAAP equity.

4) Elimination of the tax asset or liability related to the above adjustments, which are determined by applying the statutory tax rate in each of the jurisdictions that generate these adjustments.

The premiums and revenues included in non-GAAP adjusted book value will be earned in future periods, but actual earnings may differ materially from the estimated amounts used in determining current non-GAAP adjusted book value due to changes in foreign exchange rates, prepayment speeds, terminations, credit defaults and other factors. Many investors, analysts and financial news reporters use adjusted book value


Reconciliation of Shareholders’ Equity
to evaluate AGL’s share price and as the basis of their decision to recommend, buy or sell the AGL common shares.Non-GAAP Adjusted book value is operating shareholders’ equity, as defined above, further adjusted for the following:Book Value
 
1)Elimination of after-tax deferred acquisition costs, net. These amounts represent net deferred expenses that have already been paid or accrued and will be expensed in future accounting periods.
2)Addition of the after-tax net present value of estimated net future credit derivative revenue. See below.
3)Addition of the after-tax value of the unearned premium reserve on financial guaranty contracts in excess of expected loss to be expensed, net of reinsurance. This amount represents the expected future net earned premiums, net of expected losses to be expensed, which are not reflected in GAAP equity.
 As of December 31, 2016 As of December 31, 2015
 Total Per Share Total Per Share
 
(dollars in millions, except
per share amounts)
Shareholders’ equity$6,504
 $50.82
 $6,063
 $43.96
Less pre-tax adjustments:       
Non-credit impairment unrealized fair value gains (losses) on credit derivatives(189) (1.48) (241) (1.75)
Fair value gains (losses) on CCS62
 0.48
 62
 0.45
Unrealized gain (loss) on investment portfolio excluding foreign exchange effect316
 2.47
 373
 2.71
Less taxes(71) (0.54) (56) (0.41)
Non-GAAP operating shareholders’ equity6,386
 49.89
 5,925
 42.96
Pre-tax adjustments:       
Less: Deferred acquisition costs106
 0.83
 114
 0.83
Plus: Net present value of estimated net future credit derivative revenue136
 1.07
 169
 1.23
Plus: Net unearned premium reserve on financial guaranty contracts in excess of expected loss to be expensed2,922
 22.83
 3,384
 24.53
Plus taxes(832) (6.50) (968) (7.02)
Non-GAAP adjusted book value$8,506
 $66.46
 $8,396
 $60.87
        
Gain (loss) related to FG VIE consolidation included in non-GAAP operating shareholders' equity (net of tax benefit of $(4) and $(11))$(7) $(0.06) $(21) $(0.15)
        
Gain (loss) related to FG VIE consolidation included in non-GAAP adjusted book value (net of tax benefit of $(12) and $(22))$(24) $(0.18) $(43) $(0.31)

Net Present Value of Estimated Net Future Credit Derivative Revenue

Management believes that this amount is a useful measure because it enables an evaluation of the value of future estimated credit derivative revenue. There is no corresponding GAAP financial measure. This amount represents the present value of estimated future revenue from the Company’s credit derivative in-force book of business, net of reinsurance, ceding commissions and premium taxes, for contracts without expected economic losses, and is discounted at 6%. Estimated net future credit derivative revenue may change from period to period due to changes in foreign exchange rates, prepayment speeds, terminations, credit defaults or other factors that affect par outstanding or the ultimate maturity of an obligation.


98


Reconciliation of Shareholders’ Equity
to Adjusted Book Value
 As of December 31, 2015 As of December 31, 2014
 Total Per Share Total Per Share
 
(dollars in millions, except
per share amounts)
Shareholders’ equity$6,063
 $43.96
 $5,758
 $36.37
Less after-tax adjustments:       
Effect of consolidating FG VIEs(23) (0.16) (44) (0.28)
Non-credit impairment unrealized fair value gains (losses) on credit derivatives(160) (1.16) (527) (3.33)
Fair value gains (losses) on CCS40
 0.29
 23
 0.14
Unrealized gain (loss) on investment portfolio excluding foreign exchange effect260
 1.88
 373
 2.36
Operating shareholders’ equity5,946
 43.11
 5,933
 37.48
After-tax adjustments:       
Less: Deferred acquisition costs147
 1.06
 156
 0.99
Plus: Net present value of estimated net future credit derivative revenue116
 0.84
 109
 0.69
Plus: Net unearned premium reserve on financial guaranty contracts in excess of expected loss to be expensed2,524
 18.29
 2,609
 16.48
Adjusted book value$8,439
 $61.18
 $8,495
 $53.66

Shareholder's equity and operating shareholders' equity increased since December 31, 2014 due mainly to the Radian Asset Acquisition and positive income, partially offset by share repurchases and dividends. Adjusted book value decreased due mainly to share repurchases and dividends. Operating shareholders' equity per share and adjusted book value per share benefited from the repurchase of 21 million common shares in 2015.


99

Table of Contents

PVP or Present Value of New Business Production

Management believes that PVP is a useful measure because it enables the evaluation of the value of new business production for the Company by taking into account the value of estimated future installment premiums on all new contracts underwritten in a reporting period as well as premium supplements and additional installment premium on existing contracts as to which the issuer has the right to call the insured obligation but has not exercised such right, whether in insurance or credit derivative contract form, which GAAP gross written premiums written and the net credit derivative premiums received and receivable portion of net realized gains and other settlements on credit derivatives (“Credit(Credit Derivative Revenues”Realized Gains (Losses)) do not adequately measure. PVP in respect of financial guaranty contracts written in a specified period is defined as gross upfront and installment premiums received and the present value of gross estimated future installment premiums, discounted, in each case, discounted at 6%. For purposes of the PVP calculation, management discounts estimated future installment premiums on insurance contracts at 6%, while under GAAP, these amounts are discounted at a risk free rate. Additionally, under GAAP, management records future installment premiums on financial guaranty insurance contracts covering non-homogeneous pools of assets

based on the contractual term of the transaction, whereas for PVP purposes, management records an estimate of the future installment premiums the Company expects to receive, which may be based upon a shorter period of time than the contractual term of the transaction. Actual future net earned or written premiums and Credit Derivative RevenuesRealized Gains (Losses) may differ from PVP due to factors including, but not limited to, changes in foreign exchange rates, prepayment speeds, terminations, credit defaults, or other factors that affect par outstanding or the ultimate maturity of an obligation.


Reconciliation of PVPGWP to Gross Written PremiumsPVP
 
 Year Ended December 31, 2016
 Public Finance Structured Finance  
 U.S. Non - U.S. U.S. Non - U.S. Total
 (in millions)
GWP$142
 $15
 $(1) $(2) $154
Less: Installment GWP and other GAAP adjustments(1)(19) 15
 (4) (2) (10)
Plus: Financial guaranty installment premium PVP0
 25
 1
 1
 27
Plus: PVP of non-financial guaranty insurance
 
 23
 
 23
PVP$161
 $25
 $27
 $1
 $214

 Year Ended December 31,
 2015 2014 2013
 (in millions)
Total PVP$179
 $168
 $141
Less: PVP of non-financial guaranty insurance7
 
 
PVP of financial guaranty insurance172
 168
 141
Less: Financial guaranty installment premium PVP46
 42
 26
Total: Financial guaranty upfront gross written premiums126
 126
 115
Plus: Installment gross written premiums and other GAAP adjustments55
 (22) 8
Total gross written premiums$181
 $104
 $123
 Year Ended December 31, 2015
 Public Finance Structured Finance  
 U.S. Non - U.S. U.S. Non - U.S. Total
 (in millions)
GWP$119
 $41
 $23
 $(2) $181
Less: Installment GWP and other GAAP adjustments(1)(5) 41
 21
 (2) 55
Plus: Financial guaranty installment premium PVP0
 27
 18
 1
 46
Plus: PVP of non-financial guaranty insurance
 
 2
 5
 7
PVP$124
 $27
 $22
 $6
 $179

 Year Ended December 31, 2014
 Public Finance Structured Finance  
 U.S. Non - U.S. U.S. Non - U.S. Total
 (in millions)
GWP$122
 $6
 $(32) $8
 $104
Less: Installment GWP and other GAAP adjustments(1)(2) 5
 (33) 8
 (22)
Plus: Financial guaranty installment premium PVP4
 6
 23
 9
 42
Plus: PVP of non-financial guaranty insurance
 
 0
 
 0
PVP$128
 $7
 $24
 $9
 $168
_____________
(1)Includes present value of new business on installment policies discounted at the prescribed GAAP discount rates, GWP adjustments on existing installment policies due to changes in assumptions, any cancellations of assumed reinsurance contracts, and other GAAP adjustments.


Insured Portfolio
 
The following tables present the insured portfolio by asset class net of cessions to reinsurers. It includes all financial guaranty contracts outstanding as of the dates presented, regardless of the form written (i.e., credit derivative form or traditional financial guaranty insurance form) or the applicable accounting model (i.e., insurance, derivative or VIE consolidation). The Company excludes amounts attributable to loss mitigation securities (unless otherwise indicated) from par and Debt Serviceprincipal and interest (debt service) outstanding because it manages such securities as investments, not insurance exposures. As of December 31, 2016 and December 31, 2015, the Company excluded $2.1 billion and $1.5 billion, respectively, of net par as a result of loss mitigation strategies, including loss mitigation securities held in the investment portfolio, which are primarily BIG.


100


Net Par Outstanding and Average Internal Rating by Sector

 As of December 31, 2015 As of December 31, 2014 As of December 31, 2016 As of December 31, 2015
Sector 
Net Par
Outstanding
 
Avg.
Rating
 
Net Par
Outstanding
 
Avg.
Rating
 
Net Par
Outstanding
 
Avg.
Rating
 
Net Par
Outstanding
 
Avg.
Rating
 (dollars in millions) (dollars in millions)
Public finance:    
      
  
U.S.:    
      
  
General obligation $126,255
 A $140,276
 A $107,717
 A $126,255
 A
Tax backed 58,062
 A 62,525
 A 49,931
 A- 58,062
 A
Municipal utilities 45,936
 A 52,090
 A 37,603
 A 45,936
 A
Transportation 23,454
 A 27,823
 A 19,403
 A- 23,454
 A
Healthcare 15,006
 A 14,848
 A 11,238
 A 15,006
 A
Higher education 11,936
 A 13,099
 A 10,085
 A 11,936
 A
Infrastructure finance 4,993
 BBB 4,181
 BBB 3,769
 BBB+ 4,993
 BBB
Housing 2,037
 A 2,779
 A+ 1,559
 A- 2,037
 A
Investor-owned utilities 916
 A- 944
 A- 697
 BBB+ 916
 A-
Other public finance 3,271
 A 3,558
 A
Other public finance—U.S. 2,796
 A 3,271
 A
Total public finance—U.S. 291,866
 A 322,123
 A 244,798
 A 291,866
 A
Non-U.S.:    
      
  
Infrastructure finance 12,728
 BBB 12,808
 BBB 10,731
 BBB 12,728
 BBB
Regulated utilities 10,048
 BBB+ 10,914
 BBB+ 9,263
 BBB+ 10,048
 BBB+
Pooled infrastructure 1,879
 AA 2,420
 AA 1,513
 AAA 1,879
 AA
Other public finance 4,922
 A 5,217
 A 4,874
 A 4,922
 A
Total public finance—non-U.S. 29,577
 BBB+ 31,359
 BBB+ 26,381
 BBB+ 29,577
 BBB+
Total public finance 321,443
 A 353,482
 A 271,179
 A- 321,443
 A
Structured finance:    
      
  
U.S.:    
      
  
Pooled corporate obligations 16,008
 AAA 20,646
 AAA 10,050
 AAA 16,008
 AAA
RMBS 7,067
 BBB- 9,417
 BBB- 5,637
 BBB- 7,067
 BBB-
Insurance securitizations 3,000
 A+ 3,433
 A- 2,308
 A+ 3,000
 A+
Consumer receivables 2,099
 A- 2,099
 BBB+ 1,652
 BBB+ 2,099
 A-
Financial products 1,906
 AA- 2,276
 AA- 1,540
 AA- 1,906
 AA-
Commercial receivables 230
 BBB- 427
 BBB+
CMBS and other commercial real estate related exposures 533
 AAA 1,957
 AAA 43
 A 533
 AAA
Commercial receivables 427
 BBB+ 560
 BBB+
Other structured finance 730
 AA- 783
 AA-
Other structured finance—U.S. 597
 AA- 730
 AA-
Total structured finance—U.S. 31,770
 AA- 41,171
 AA- 22,057
 A+ 31,770
 AA-
Non-U.S.:    
      
  
Pooled corporate obligations 3,645
 AA 6,604
 AA+ 1,535
 AA 3,645
 AA
RMBS 604
 A- 492
 BBB
Commercial receivables 600
 BBB+ 944
 BBB 356
 BBB+ 600
 BBB+
RMBS 492
 BBB 794
 A
Other structured finance 621
 AA- 734
 AA 587
 AA 621
 AA-
Total structured finance—non-U.S. 5,358
 AA- 9,076
 AA 3,082
 AA- 5,358
 AA-
Total structured finance 37,128
 AA- 50,247
 AA- 25,139
 AA- 37,128
 AA-
Total net par outstanding $358,571
 A $403,729
 A $296,318
 A $358,571
 A


101


The following tables set forth the Company’s net financial guaranty portfolio by internal rating.
 
Financial Guaranty Portfolio by Internal Rating (1)
As of December 31, 2016

  Public Finance
U.S.
 
Public Finance
Non-U.S.
 
Structured Finance
U.S
 
Structured Finance
Non-U.S
 Total
Rating
Category
 Net Par
Outstanding
 % 
Net Par
Outstanding
 % 
Net Par
Outstanding
 % 
Net Par
Outstanding
 % 
Net Par
Outstanding
 %
  (dollars in millions)
AAA $2,066
 0.8% $2,221
 8.4% $9,757
 44.2% $1,447
 47.0% $15,491
 5.2%
AA 46,420
 19.0
 170
 0.6
 5,773
 26.2
 127
 4.1
 52,490
 17.7
A 133,829
 54.7
 6,270
 23.8
 1,589
 7.2
 456
 14.8
 142,144
 48.0
BBB 55,103
 22.5
 16,378
 62.1
 879
 4.0
 759
 24.6
 73,119
 24.7
BIG 7,380
 3.0
 1,342
 5.1
 4,059
 18.4
 293
 9.5
 13,074
 4.4
Total net par outstanding $244,798
 100.0% $26,381
 100.0% $22,057
 100.0% $3,082
 100.0% $296,318
 100.0%
_____________________
(1)The December 31, 2016 amounts include $2.9 billion of net par from the CIFG Acquisition.


Financial Guaranty Portfolio by Internal Rating (1)
As of December 31, 2015 

 Public Finance
U.S.
 
Public Finance
Non-U.S.
 
Structured Finance
U.S
 
Structured Finance
Non-U.S
 Total 
Public Finance
U.S.
 
Public Finance
Non-U.S.
 
Structured Finance
U.S
 
Structured Finance
Non-U.S
 Total
Rating
Category
 Net Par
Outstanding
 % 
Net Par
Outstanding
 % 
Net Par
Outstanding
 % 
Net Par
Outstanding
 % 
Net Par
Outstanding
 % 
Net Par
Outstanding
 % 
Net Par
Outstanding
 % 
Net Par
Outstanding
 % 
Net Par
Outstanding
 % 
Net Par
Outstanding
 %
 (dollars in millions) (dollars in millions)
AAA $3,053
 1.1% $709
 2.4% $14,366
 45.2% $2,709
 50.6% $20,837
 5.8% $3,053
 1.1% $709
 2.4% $14,366
 45.2% $2,709
 50.6% $20,837
 5.8%
AA 69,274
 23.7
 2,017
 6.8
 7,934
 25.0
 177
 3.3
 79,402
 22.1
 69,274
 23.7
 2,017
 6.8
 7,934
 25.0
 177
 3.3
 79,402
 22.1
A 157,440
 53.9
 6,765
 22.9
 2,486
 7.8
 555
 10.3
 167,246
 46.7
 157,440
 53.9
 6,765
 22.9
 2,486
 7.8
 555
 10.3
 167,246
 46.7
BBB 54,315
 18.6
 18,708
 63.2
 1,515
 4.8
 1,365
 25.5
 75,903
 21.2
 54,315
 18.6
 18,708
 63.2
 1,515
 4.8
 1,365
 25.5
 75,903
 21.2
BIG 7,784
 2.7
 1,378
 4.7
 5,469
 17.2
 552
 10.3
 15,183
 4.2
 7,784
 2.7
 1,378
 4.7
 5,469
 17.2
 552
 10.3
 15,183
 4.2
Total net par outstanding (2) $291,866
 100.0% $29,577
 100.0% $31,770
 100.0% $5,358
 100.0% $358,571
 100.0% $291,866
 100.0% $29,577
 100.0% $31,770
 100.0% $5,358
 100.0% $358,571
 100.0%
_____________________
(1)Excludes $1.5 billion of loss mitigation securities insured and held by the Company as of December 31, 2015, which are primarily BIG.

(2)The December 31, 2015 amounts include $10.9 billion of net par acquired from the Radian Asset.Asset Acquisition.


Financial Guaranty Portfolio by Internal Rating
As of December 31, 2014 


Public Finance
U.S.
 
Public Finance
Non-U.S.
 
Structured Finance
U.S
 
Structured Finance
Non-U.S
 Total
Rating
Category
 
Net Par
Outstanding
 % 
Net Par
Outstanding
 % 
Net Par
Outstanding
 % 
Net Par
Outstanding
 % 
Net Par
Outstanding
 %
  (dollars in millions)
AAA $4,082
 1.3% $615
 2.0% $20,037
 48.7% $5,409
 59.6% $30,143
 7.5%
AA 90,464
 28.1
 2,785
 8.9
 8,213
 19.9
 503
 5.5
 101,965
 25.3
A 176,298
 54.7
 7,192
 22.9
 2,940
 7.1
 445
 4.9
 186,875
 46.3
BBB 43,429
 13.5
 19,363
 61.7
 1,795
 4.4
 1,912
 21.1
 66,499
 16.4
BIG 7,850
 2.4
 1,404
 4.5
 8,186
 19.9
 807
 8.9
 18,247
 4.5
Total net par outstanding (1) $322,123
 100.0% $31,359
 100.0% $41,171
 100.0% $9,076
 100.0% $403,729
 100.0%
_____________________
(1)Excludes $1.3 billion of loss mitigation securities insured and held by the Company as of December 31, 2014, which are primarily BIG.

102

Table of Contents

The tables below show the Company's ten largest U.S. public finance, U.S. structured finance and non-U.S. exposures by revenue source, excluding related authorities and public corporations, as of December 31, 2015:2016:

Ten Largest U.S. Public Finance Exposures
by Revenue Source
As of December 31, 20152016

Net Par Outstanding Percent of Total U.S. Public Finance Net Par Outstanding RatingNet Par Outstanding Percent of Total U.S. Public Finance Net Par Outstanding Rating
(dollars in millions)(dollars in millions)
New Jersey (State of)$4,692
 1.6% BBB+$4,468
 1.8% BBB+
Illinois (State of)2,269
 0.9
 BBB+
California (State of)2,400
 0.8
 A1,849
 0.8
 A
Illinois (State of)2,136
 0.7
 BBB+
New York (City of) New York2,082
 0.7
 AA-1,804
 0.7
 A+
Pennsylvania (Commonwealth of)1,771
 0.7
 A-
Chicago (City of) Illinois1,960
 0.7
 BBB+1,699
 0.7
 BBB+
New York (State of)1,916
 0.7
 A+1,670
 0.7
 A+
Skyway Concession Company LLC (1)1,842
 0.6
 BBB-
Puerto Rico General Obligation, Appropriations and Guarantees of the Commonwealth1,821
 0.6
 CCC
Puerto Rico, General Obligation, Appropriations and Guarantees of the Commonwealth1,663
 0.7
 CCC-
Massachusetts (Commonwealth of)1,780
 0.6
 AA1,627
 0.7
 AA
Los Angeles, California Unified School District1,615
 0.6
 AA-
Port Authority of New York & New Jersey1,337
 0.5
 BBB+
Total of top ten U.S. public finance exposures$22,244
 7.6% $20,157
 8.2% 
_____________________
(1)On February 25, 2016, in connection with the sale of the membership interests in SCC, the various SCC obligations insured by the Company were retired. See Note 5, Expected Loss to be Paid for additional information.


Ten Largest U.S. Structured Finance Exposures
As of December 31, 20152016

Net Par Outstanding Percent of Total U.S. Structured Finance Net Par Outstanding RatingNet Par Outstanding Percent of Total U.S. Structured Finance Net Par Outstanding Rating
(dollars in millions)(dollars in millions)
Stone Tower Credit Funding$835
 2.6% AAA
Private US Insurance Securitization800
 2.5
 AA$800
 3.6% AA
Synthetic Investment Grade Pooled Corporate CDO767
 2.4
 AAA766
 3.5
 AAA
Synthetic Investment Grade Pooled Corporate CDO744
 2.3
 AAA744
 3.4
 AAA
Fortress Credit Opportunities I, LP.715
 2.3
 AA
Synthetic Investment Grade Pooled Corporate CDO655
 2.1
 AAA655
 3.0
 AAA
Wachovia Super Senior CDO 2007-1563
 1.8
 AAA
Synthetic Investment Grade Pooled Corporate CDO563
 2.6
 AAA
Synthetic Investment Grade Pooled Corporate CDO516
 1.6
 AAA516
 2.3
 AAA
Private US Insurance Securitization500
 1.6
 AA500
 2.3
 AA
Shenandoah Trust Capital I Term Securities484
 1.5
 A+
Synthetic Investment Grade Pooled Corporate CDO450
 2.0
 AAA
SLM Private Credit Student Trust 2007-A450
 2.0
 A-
Synthetic Investment Grade Pooled Corporate CDO440
 2.0
 AAA
Total of top ten U.S. structured finance exposures$6,579
 20.7% $5,884
 26.7% 


103


Ten Largest Non-U.S. Exposures
As of December 31, 20152016

 Country Net Par Outstanding Percent of Total Non-U.S. Net Par Outstanding Rating
   (dollars in millions)
Quebec ProvinceCanada $2,089
 6.0% A+
Thames Water Utility Finance PLCUnited Kingdom 1,167
 3.3
 A-
Societe des Autoroutes du Nord et de l'Est de France S.A.France 960
 2.7
 BBB+
Channel Link Enterprises Finance PLC (Eurotunnel)France, United Kingdom 907
 2.6
 BBB
Capital Hospitals (Issuer) PLCUnited Kingdom 803
 2.3
 BBB-
Southern Water Services LimitedUnited Kingdom 729
 2.1
 A-
International Infrastructure PoolUnited Kingdom 671
 1.9
 AA
Southern Gas Networks PLCUnited Kingdom 661
 1.9
 BBB
Verbund - Lease and Sublease of Hydro-Electric equipmentAustria 644
 1.8
 AAA
South Lanarkshire SchoolsScotland 631
 1.8
 BBB-
Total of top ten non-U.S. exposures  $9,262
 26.4%  
 Country Net Par Outstanding Percent of Total Non-U.S. Net Par Outstanding Rating
   (dollars in millions)
Hydro-Quebec, Province of QuebecCanada $1,985
 6.7% A+
Thames Water Utility Finance PLCUnited Kingdom 1,146
 3.9
 A-
Societe des Autoroutes du Nord et de l'Est de France S.A.France 926
 3.1
 BBB+
Channel Link Enterprises Finance PLCFrance, United Kingdom 768
 2.6
 BBB
Verbund - Lease and Sublease of Hydro-Electric EquipmentAustria 677
 2.3
 AAA
Capital Hospitals (Barts)United Kingdom 671
 2.3
 BBB-
Sydney Airport Finance CompanyAustralia 631
 2.1
 BBB
Southern Water Services LimitedUnited Kingdom 615
 2.1
 A-
InspirED Education (South Lanarkshire) PLCUnited Kingdom 608
 2.1
 BBB-
Southern Gas Networks PLCUnited Kingdom 556
 1.9
 BBB
Total of top ten non-U.S. exposures  $8,583
 29.1%  


104


Financial Guaranty Portfolio by Geographic Area

The following table sets forth the geographic distribution of the Company's financial guaranty portfolio.

Geographic Distribution
of Financial Guaranty Portfolio
As of December 31, 20152016

Number of Risks Net Par Outstanding Percent of Total Net Par OutstandingNumber of Risks Net Par Outstanding Percent of Total Net Par Outstanding
  (dollars in millions)(dollars in millions)
U.S.:          
U.S. Public Finance:     
California1,514
 $47,731
 13.3%1,459
 $42,404
 14.3%
Texas1,307
 23,891
 6.7
1,271
 20,599
 7.0
Pennsylvania944
 23,655
 6.6
852
 20,232
 6.8
New York961
 22,513
 6.3
935
 19,637
 6.6
Illinois816
 22,220
 6.2
776
 17,967
 6.1
Florida369
 16,595
 4.6
324
 12,643
 4.3
New Jersey553
 13,605
 3.8
495
 12,560
 4.2
Michigan577
 10,898
 3.0
506
 7,985
 2.7
Georgia183
 6,991
 1.9
172
 6,372
 2.2
Ohio464
 6,753
 1.9
409
 5,554
 1.9
Other states and U.S. territories3,927
 97,014
 27.0
3,475
 78,845
 26.6
Total U.S. public finance11,615
 291,866
 81.3
10,674
 244,798
 82.7
U.S. Structured finance (multiple states)723
 31,770
 8.9
610
 22,057
 7.4
Total U.S.12,338
 323,636
 90.2
11,284
 266,855
 90.1
Non-U.S.:          
United Kingdom101
 17,565
 4.9
112
 15,940
 5.4
Australia22
 3,349
 0.9
18
 3,036
 1.0
Canada10
 3,099
 0.9
9
 2,730
 0.9
France16
 2,609
 0.7
14
 1,809
 0.6
Italy8
 1,296
 0.4
9
 1,311
 0.4
Other72
 7,017
 2.0
53
 4,637
 1.6
Total non-U.S.229
 34,935
 9.8
215
 29,463
 9.9
Total12,567
 $358,571
 100.0%11,499
 $296,318
 100.0%


Financial Guaranty Portfolio by Issue Size

The Company seeks broad coverage of the market by insuring and reinsuring small and large issues alike. The following table sets forth the distribution of the Company's portfolio by original size of the Company's exposure.

Public Finance Portfolio by Issue Size
As of December 31, 2016

Original Par Amount Per Issue 
Number of
Issues
 
Net Par
Outstanding
 
% of Public
Finance
Net Par
Outstanding
 (dollars in millions)
Less than $10 million15,018 $40,484
 14.9%
$10 through $50 million5,198 86,376
 31.9
$50 through $100 million937 48,058
 17.7
$100 million to $200 million430 42,938
 15.8
$200 million or greater238 53,323
 19.7
Total21,821 $271,179
 100.0%


Structured Finance Portfolio by Issue Size
As of December 31, 2016

Original Par Amount Per Issue 
Number of
Issues
 
Net Par
Outstanding
 
% of Structured
Finance
Net Par
Outstanding
 (dollars in millions)
Less than $10 million186 $94
 0.4%
$10 through $50 million241 1,765
 7.0
$50 through $100 million85 2,469
 9.8
$100 million to $200 million127 4,805
 19.1
$200 million or greater139 16,006
 63.7
Total778 $25,139
 100.0%

Exposures by Reinsurer
Ceded par outstanding represents the portion of insured risk ceded to external reinsurers. Under these relationships, the Company cedes a portion of its insured risk in exchange for a premium paid to the reinsurer. The Company remains primarily liable for all risks it directly underwrites and is required to pay all gross claims. It then seeks reimbursement from the reinsurer for its proportionate share of claims. The Company may be exposed to risk for this exposure if it were required to pay the gross claims and not be able to collect ceded claims from an assuming company experiencing financial distress. A number of the financial guaranty insurers to which the Company has ceded par have experienced financial distress and as a result have been downgraded by the rating agencies. In addition, state insurance regulators have intervened with respect to some of these insurers.

In accordance with U.S. statutory accounting requirements and U.S. insurance laws and regulations, in order for the Company to receive credit for liabilities ceded to reinsurers domiciled outside of the U.S., such reinsurers must secure their liabilities to the Company. All of the unauthorized reinsurers in the table below are required to post collateral for the benefit of the Company in an amount at least equal to the sum of their ceded unearned premium reserve, loss reserves and contingency reserves, all calculated on a statutory basis of accounting. In addition, certain authorized reinsurers in the table below post collateral on terms negotiated with the Company. Collateral may be in the form of letters of credit or trust accounts. The total collateral posted by all non-affiliated reinsurers as of December 31, 2016 was approximately $387 million.

 Assumed par outstanding represents the amount of par assumed by the Company from third party insurers and reinsurers, including other monoline financial guaranty companies. Under these relationships, the Company assumes a portion

of the ceding company’s insured risk in exchange for a premium. The Company may be exposed to risk in this portfolio in that the Company may be required to pay losses without a corresponding premium in circumstances where the ceding company is experiencing financial distress and is unable to pay premiums.
In addition to assumed and ceded reinsurance arrangements, the Company may also have exposure to financial guaranty insurers in "second-to-pay" transactions, where the Company provides insurance on an obligation that is already insured by another financial guarantor. In that case, if the underlying obligor and the financial guarantor both fail to pay an amount scheduled to be paid, the Company would be obligated to pay. The Company underwrites these transactions based on the underlying obligation, without regard to the financial guarantor. See Part II, Item 8, Financial Statements and Supplementary Data, Note 13, Reinsurance and Other Monoline Exposures.
Monoline and Reinsurer Exposure
by Company

  Par Outstanding
  As of December 31, 2016
Reinsurer Ceded Par
Outstanding (1)
 Second-to-
Pay Insured
Par
Outstanding (2)
 Assumed Par
Outstanding
  (in millions)
Reinsurers rated investment grade:      
Tokio Marine & Nichido Fire Insurance Co., Ltd. (3) (4) $3,436
 $
 $
Mitsui Sumitomo Insurance Co. Ltd. (3) (4) 1,273
 
 
National 
 4,420
 4,364
Subtotal 4,709
 4,420
 4,364
Reinsurers rated BIG, with rating withdrawn or not rated:      
American Overseas Reinsurance Company Limited (3) 3,573
 
 30
Syncora Guarantee Inc. (3) 2,062
 1,098
 655
ACA Financial Guaranty Corp. 637
 20
 
Ambac Assurance Corporation 115
 2,862
 6,695
MBIA 
 1,024
 165
MBIA UK (5) 
 319
 211
FGIC (6) 
 1,194
 410
Ambac Assurance Corp. Segregated Account 
 73
 614
Other (3) 60
 529
 120
Subtotal 6,447
 7,119
 8,900
Total $11,156
 $11,539
 $13,264
____________________
(1)Of the total ceded par to reinsurers rated BIG, had rating withdrawn or not rated, $384 million is rated BIG.

(2)The par on second-to-pay exposure where the primary insurer and underlying transaction rating are both BIG is $788 million.
(3)The total collateral posted by all non-affiliated reinsurers required or had agreed to post collateral as of December 31, 2016 was approximately $387 million.

(4)    The Company benefits from trust arrangements that satisfy the triple-A credit requirement of S&P and/or Moody’s.

(5)See Part II, Item 8, Financial Statements and Supplementary Data, Note 2, Acquisitions, for more information on MBIA UK.

(6)FGIC includes subsidiaries Financial Guaranty Insurance Company and FGIC UK Limited.

Exposure to Puerto Rico
         
The Company has insured exposure to general obligation bonds of the Commonwealth of Puerto Rico (Puerto Rico or the Commonwealth) and various obligations of its related authorities and public corporations aggregating $5.1$4.8 billion net par as of December 31, 2015,2016, all of which are rated BIG. In 2015, the Company's Puerto Rico exposures increased due to (1) net par acquired in the Radian Asset Acquisition, $385 million of which was outstanding as of December 31, 2015, and (2) a commutation of previously ceded Puerto Rico exposures.

Puerto Rico has experienced significant general fund budget deficits in recent years. These deficits, until recently, were covered primarily with the net proceeds of bond issuances, interim financings provided by GDByears and in some cases, one-time revenue measures or expense adjustment measures. In addition to high debt levels, Puerto Rico faces a challenging economic environment.


105


In June 2014, the Puerto Rico legislature passed the Recovery Act in order to provide Beginning on January 1, 2016, a legislative framework for certain public corporations experiencing severe financial stress to restructure their debt, including Puerto Rico Highway and Transportation Authority ("PRHTA") and PREPA. Subsequently, the Commonwealth stated PREPA might need to seek relief under the Recovery Act due to liquidity constraints. Investors in bonds issued by PREPA filed suit in the United States District Court for the Districtnumber of Puerto Rico challengingcredits have defaulted on bond payments, and the Recovery Act. On February 6, 2015,Company has now paid claims on several Puerto Rico credits as shown in the U.S. District Courttable "Puerto Rico Net Par Outstanding" below. Additional information about recent developments in Puerto Rico and the individual credits insured by the Company may be found in Part II, Item 8, Financial Statements and Supplementary Data, Note 4, Outstanding Exposure.

The Company groups its Puerto Rico exposure into three categories:

Constitutionally Guaranteed. The Company includes in this category public debt benefiting from Article VI of the Constitution of the Commonwealth, which expressly provides that interest and principal payments on the public debt are to be paid before other disbursements are made.

Public Corporations – Certain Revenues Potentially Subject to Clawback. The Company includes in this category the debt of public corporations for which applicable law permits the Commonwealth to claw back, subject to certain conditions and for the Districtpayment of Puerto Rico ruled the Recovery Act is preempted by the U.S. Bankruptcy Code and is therefore void. On July 6, 2015, the U.S. Court of Appeals for the First Circuit upheld that ruling, and on December 4, 2015, the U.S. Supreme Court granted petitions for writs of certiorari relating to that ruling. Oral arguments have been scheduled for March 22, 2016. Typical Supreme Court practice suggests a decision could be announced in June 2016, but there is no assurance that an opinion will be announced at such time, especially in light of the recent Supreme Court vacancy.

On June 28, 2015, Governor García Padilla of Puerto Rico (the "Governor") publicly stated that the Commonwealth’s public debt, considering the current level of economic activity, is unpayable and that a comprehensive debt restructuring may be necessary, and he has made similar statements since then. On June 29, 2015 a report commissioned by the Commonwealth and authored by former World Bank Chief Economist and former Deputy Director of the International Monetary Fund Dr. Anne Krueger and economists Dr. Ranjit Teja and Dr. Andrew Wolfe and calling for debt restructuring of all Puerto Rico bonds was released ("Krueger Report").

Puerto Rico Public Finance Corporation (“PFC”), a subsidiary of the GDB, failed to make most of an approximately $58 million Debt Service payment on August 3, 2015 and to make subsequent Debt Service payments because the Commonwealth’s legislature did not appropriate funds for payment.  The Company does not insure any obligations of the PFC. On January 1, 2016, PRIFA defaulted on payment ofat least a portion of the interest due on its bonds on that date. For those PRIFArevenues supporting the bonds the Company had insured,insures. As a Constitutional condition to clawback, available Commonwealth revenues for any fiscal year must be insufficient to pay Commonwealth debt service before the payment of any appropriations for that year.  The Company paid approximately $451 thousand of claims for the interest payments on which PRIFA had defaulted.

On September 9, 2015, the Working Group for the Fiscalbelieves that this condition has not been satisfied to date, and Economic Recovery of Puerto Rico (“Working Group”) established by the Governor published its “Puerto Rico Fiscal and Economic Growth Plan” (the “FEGP”). The FEGP projectedaccordingly that the Commonwealth would face a cumulative financing gap of $27.8 billion from fiscal year 2016has not to fiscal year 2020 without corrective action. Various stakeholders and analysts have publicly questioned the accuracy of the $27.8 billion gap projecteddate been entitled to clawback revenues supporting debt insured by the Working Group. The FEGP recommended economic development, structural, fiscalCompany. As described in Part II, Item 8, Financial Statements and institutional reform measures that it projects would reduce that gap to $14.0 billion. The Working Group asserts that the Commonwealth’s debt, including debt with a constitutional priority, is not sustainable. The FEGP included a recommendation that the Commonwealth’s advisors begin to work on a voluntary exchange offer to its creditors as part of the FEGP. The FEGP does not have the force of law and implementation of its recommendations would require actions by the governments of the Commonwealth and of the United States as well as the cooperation and agreement of various creditors.
On November 30, 2015 and December 8, 2015, the Governor issued executive orders (“Clawback Orders”) directing the Puerto Rico Department of Treasury and the Puerto Rico Tourism Company to retain or transfer certain taxes and revenues pledged to secure the payment of bonds issued by PRHTA, PRIFA and PRCCDA. On January 7, 2016,Supplementary Data, Note 4, Outstanding Exposure, the Company sued various Puerto Rico governmental officials in the United States District Court, District of Puerto Rico asserting that thisPuerto Rico's recent attempt to “claw back”claw back pledged taxes and revenues is unconstitutional, and demanding declaratory and injunctive relief. The Puerto Rico credits insured by the Company impacted by the Clawback Orders are shown in the table “Puerto Rico Net Par Outstanding” below.

On January 18, 2016,
Other Public Corporations. The Company includes in this category the Working Group published an updated FEGP that projected the cumulative financing gap beyond 2020 would continue to increase to $63.4 billion without corrective action. The Working Group followed that up with the publication on February 1, 2016,debt of a proposal for a voluntary exchange of $49.2 billion of tax supported debt into $26.5 billion of new mandatorily payable base bonds and $22.7 billion of growth bonds.
There have been a number of other proposals, plans and legislative initiatives offered in Puerto Rico and in the United States aimed at addressing Puerto Rico’s fiscal issues. Among the responses proposed is a federal financial control board and access to bankruptcy courts or another restructuring mechanism. U.S. House of Representatives Speaker Paul Ryan has asked that a legislative response be presented to the House of Representatives by the end of March 2016. The final shape and timing of responses to Puerto Rico’s distress eventually enacted or implemented by Puerto Rico or the United States, if any, and the impact of any such actions on obligations insured by the Company, is uncertain and may differ substantially from the recommendations of the Working Group or any other proposals or plans described in the press or offered to date or in the future.


106


S&P, Moody’s and Fitch Ratings have lowered the credit rating of the Commonwealth’s bonds and on its public corporations several times over the past approximately two years, and the Commonwealth has disclosed its liquidity has been adversely affected by rating agency downgrades and by the limited market access for its debt, and also noted it has relied on short-term financings and interim loans from the GDB and other private lenders, which reliance has constrained its liquidity and increased its near-term refinancing risk.
PREPA

As of December 31, 2015, the Company had $744 million insured net par outstanding of PREPA obligations. In August 2014, PREPA entered into forbearance agreements with the GDB, its bank lenders, and bondholders and financial guaranty insurers (including AGM and AGC) that hold or guarantee more than 60% of PREPA's outstanding bonds, in order to address its near-term liquidity issues. Creditors, including AGM and AGC, agreed not to exercise available rights and remedies until March 31, 2015, and the bank lenders agreed to extend the maturity of two revolving lines of credit to the same date. PREPA agreed it would continue to make principal and interest payments on its outstanding bonds, and interest payments on its lines of credit. It also agreed it would develop a five year business plan and a recovery program in respect of its operations. Subsequently, most of the parties extended these forbearance agreements several times.
On July 1, 2015, PREPA made full payment of the $416 million of principal and interest due on its bonds, including bonds insured by AGM and AGC. However, that payment was conditioned on and facilitated by AGM and AGC agreeing, also on July 1, to purchase a portion of $131 million of interest-bearing bonds to help replenish certain of the operating funds PREPA used to make the $416 million of principal and interest payments. On July 31, 2015, AGM and AGC purchased $74 million aggregate principal amount of those bonds; the bonds were repaid in full in 2016.

On December 24, 2015, AGM and AGC entered into a RSA with PREPA, an ad hoc group of uninsured bondholders and a group of fuel-line lenders that would, subject to certain conditions, result in, among other things, modernization of the utility and a restructuring of current debt. Upon finalization of the contemplated restructuring transaction, insured PREPA revenue bonds (with no reduction to par or stated interest rate or extension of maturity) will beare supported by securitization bonds issued by a special purpose corporation and secured by a transition charge assessed on ratepayers. To facilitate the securitization transaction, which enables PREPA to achieve debt relief and more efficient capital markets financing, Assured Guaranty will issue surety insurance policies in an aggregate amountrevenues it does not expected to exceed $113 million in exchange for a market premium and to support a portion of the reserve fund for the securitization bonds. Certain of the creditors also agreed, subject to certain conditions, to participate in a bridge financing. The Company’s share of the bridge financing is approximately $15 million. Legislation purportedly meeting the requirements of the RSA was enacted on February 16, 2016.  The closing of the restructuring transaction, the issuance of the surety bonds and the closing of the bridge financingbelieve are subject to certain conditions, including confirmation that the enacted legislation meets all requirements of the RSA and execution of acceptable documentation and legal opinions.clawback.
There can be no assurance that the conditions in the RSA will be met or that, if the conditions are met, the RSA’s other provisions, including those related to the restructuring of the insured PREPA revenue bonds, will be implemented. PREPA, during the pendency of the agreements, has suspended deposits into its debt service fund.

PRHTA

As of December 31, 2015, the Company had $909 million insured net par outstanding of PRHTA (Transportation revenue) bonds and $370 million net par of PRHTA (Highway revenue) bonds. In March 2015, legislation was passed in the Commonwealth that would have supported proposals involving the GDB and PRIFA and would have, among other things, strengthened PRHTA. The proposals involved the issuance of up to $2.95 billion of bonds by PRIFA, but the Company believes the Commonwealth is no longer pursuing those proposals. In addition, PRHTA is one of the public corporations affected by the Clawback Orders.

Municipal Finance Agency
As of December 31, 2015, the Company had $387 million net par outstanding of bonds issued by the Puerto Rico Municipal Finance Agency (“MFA”) secured by a pledge of local property tax revenues. On October 13, 2015, the Company filed a motion to intervene in litigation between Centro de Recaudación de Ingresos Municipales (“CRIM”) and the GDB in which CRIM was seeking to ensure that the pledged tax revenues are, and will continue to be, available to support the MFA bonds. While the Company’s motion to intervene was denied, the GDB and CRIM have reported that they executed a new deed of trust that requires the GDB, as fiduciary, to keep the pledged tax revenues separate from any other GDB monies or accounts and that governs the manner in which the pledged revenues may be invested and dispersed.

107


Net Exposure to Puerto RicoPublic Finance Portfolio by Issue Size
As of December 31, 20152016

  Net Par Outstanding    
  AGM Consolidated AGC Consolidated AG Re (1) Consolidated Eliminations (2) Total Net Par Outstanding (4) Gross Par Outstanding Internal Rating
  (in millions)  
Exposures Previously Subject to the Voided Recovery Act(3):              
PRHTA (Transportation revenue) (5) $289
 $475
 $225
 $(80) $909
 $936
 CCC-
PREPA 431
 74
 239
 
 744
 902
 CC
Puerto Rico Aqueduct and Sewer Authority 
 296
 92
 
 388
 388
 CCC
PRHTA (Highway revenue) (5) 219
 101
 50
 
 370
 575
 CCC
Puerto Rico Convention Center District Authority ("PRCCDA") (5) 
 82
 82
 
 164
 164
 CCC-
Total 939
 1,028
 688
 (80) 2,575
 2,965
  
               
Exposures Not Previously Subject to the Voided Recovery Act:              
Commonwealth of Puerto Rico - General Obligation Bonds 720
 415
 480
 
 1,615
 1,737
 CCC
MFA 206
 65
 116
 
 387
 571
 CCC-
Puerto Rico Sales Tax Financing Corporation 261
 
 8
 
 269
 269
 CCC+
Puerto Rico Public Buildings Authority 14
 137
 37
 
 188
 194
 CCC
PRIFA (5) (6) 
 10
 8
 
 18
 18
 CCC-
University of Puerto Rico 
 1
 
 
 1
 1
 CCC-
Total 1,201
 628
 649
 
 2,478
 2,790
  
Total net exposure to Puerto Rico $2,140
 $1,656
 $1,337
 $(80) $5,053
 $5,755
  
Original Par Amount Per Issue 
Number of
Issues
 
Net Par
Outstanding
 
% of Public
Finance
Net Par
Outstanding
 (dollars in millions)
Less than $10 million15,018 $40,484
 14.9%
$10 through $50 million5,198 86,376
 31.9
$50 through $100 million937 48,058
 17.7
$100 million to $200 million430 42,938
 15.8
$200 million or greater238 53,323
 19.7
Total21,821 $271,179
 100.0%


Structured Finance Portfolio by Issue Size
As of December 31, 2016

108

Original Par Amount Per Issue 
Number of
Issues
 
Net Par
Outstanding
 
% of Structured
Finance
Net Par
Outstanding
 (dollars in millions)
Less than $10 million186 $94
 0.4%
$10 through $50 million241 1,765
 7.0
$50 through $100 million85 2,469
 9.8
$100 million to $200 million127 4,805
 19.1
$200 million or greater139 16,006
 63.7
Total778 $25,139
 100.0%

Exposures by Reinsurer
Ceded par outstanding represents the portion of insured risk ceded to external reinsurers. Under these relationships, the Company cedes a portion of its insured risk in exchange for a premium paid to the reinsurer. The Company remains primarily liable for all risks it directly underwrites and is required to pay all gross claims. It then seeks reimbursement from the reinsurer for its proportionate share of claims. The Company may be exposed to risk for this exposure if it were required to pay the gross claims and not be able to collect ceded claims from an assuming company experiencing financial distress. A number of the financial guaranty insurers to which the Company has ceded par have experienced financial distress and as a result have been downgraded by the rating agencies. In addition, state insurance regulators have intervened with respect to some of these insurers.

In accordance with U.S. statutory accounting requirements and U.S. insurance laws and regulations, in order for the Company to receive credit for liabilities ceded to reinsurers domiciled outside of the U.S., such reinsurers must secure their liabilities to the Company. All of the unauthorized reinsurers in the table below are required to post collateral for the benefit of the Company in an amount at least equal to the sum of their ceded unearned premium reserve, loss reserves and contingency reserves, all calculated on a statutory basis of accounting. In addition, certain authorized reinsurers in the table below post collateral on terms negotiated with the Company. Collateral may be in the form of letters of credit or trust accounts. The total collateral posted by all non-affiliated reinsurers as of December 31, 2016 was approximately $387 million.

 Assumed par outstanding represents the amount of par assumed by the Company from third party insurers and reinsurers, including other monoline financial guaranty companies. Under these relationships, the Company assumes a portion

of the ceding company’s insured risk in exchange for a premium. The Company may be exposed to risk in this portfolio in that the Company may be required to pay losses without a corresponding premium in circumstances where the ceding company is experiencing financial distress and is unable to pay premiums.
In addition to assumed and ceded reinsurance arrangements, the Company may also have exposure to financial guaranty insurers in "second-to-pay" transactions, where the Company provides insurance on an obligation that is already insured by another financial guarantor. In that case, if the underlying obligor and the financial guarantor both fail to pay an amount scheduled to be paid, the Company would be obligated to pay. The Company underwrites these transactions based on the underlying obligation, without regard to the financial guarantor. See Part II, Item 8, Financial Statements and Supplementary Data, Note 13, Reinsurance and Other Monoline Exposures.
Monoline and Reinsurer Exposure
by Company


 ___________________
  Par Outstanding
  As of December 31, 2016
Reinsurer Ceded Par
Outstanding (1)
 Second-to-
Pay Insured
Par
Outstanding (2)
 Assumed Par
Outstanding
  (in millions)
Reinsurers rated investment grade:      
Tokio Marine & Nichido Fire Insurance Co., Ltd. (3) (4) $3,436
 $
 $
Mitsui Sumitomo Insurance Co. Ltd. (3) (4) 1,273
 
 
National 
 4,420
 4,364
Subtotal 4,709
 4,420
 4,364
Reinsurers rated BIG, with rating withdrawn or not rated:      
American Overseas Reinsurance Company Limited (3) 3,573
 
 30
Syncora Guarantee Inc. (3) 2,062
 1,098
 655
ACA Financial Guaranty Corp. 637
 20
 
Ambac Assurance Corporation 115
 2,862
 6,695
MBIA 
 1,024
 165
MBIA UK (5) 
 319
 211
FGIC (6) 
 1,194
 410
Ambac Assurance Corp. Segregated Account 
 73
 614
Other (3) 60
 529
 120
Subtotal 6,447
 7,119
 8,900
Total $11,156
 $11,539
 $13,264
____________________
(1)"AG Re" means Assured Guaranty Re Ltd.Of the total ceded par to reinsurers rated BIG, had rating withdrawn or not rated, $384 million is rated BIG.

(2)NetThe par outstanding eliminations relate toon second-to-pay policies under which an Assured Guaranty insurance subsidiary guarantees an obligation already insured by another Assured Guaranty insurance subsidiary.exposure where the primary insurer and underlying transaction rating are both BIG is $788 million.
(3)On February 6, 2015, the U.S. District Court for the DistrictThe total collateral posted by all non-affiliated reinsurers required or had agreed to post collateral as of Puerto Rico ruled that the Recovery Act is preempted by the U.S. Bankruptcy Code and is therefore void. On July 6, 2015, the U.S. Court of Appeals for the First Circuit upheld that ruling, and on December 4, 2015, the U.S. Supreme Court granted petitions for writs of certiorari relating to that ruling.31, 2016 was approximately $387 million.
(4)Includes exposure to capital appreciation bonds with a current aggregate net par outstanding of $32 million and a fully accreted net par at maturity of $66 million. Of these amounts, current net par of $17 million and fully accreted net par at maturity of $50 million relate to the Puerto Rico Sales Tax Financing Corporation, current net par of $10 million and fully accreted net par at maturity of $11 million relate to the PRHTA, and current net par of $4 million and fully accreted net par at maturity of $5 million relate to the Commonwealth General Obligation Bonds.

(4)    The Company benefits from trust arrangements that satisfy the triple-A credit requirement of S&P and/or Moody’s.

(5)The Governor issued executive ordersSee Part II, Item 8, Financial Statements and Supplementary Data, Note 2, Acquisitions, for more information on November 30, 2015 and December 8, 2015, directing the Puerto Rico Department of Treasury and the Puerto Rico Tourism Company to retain or transfer certain taxes and revenues pledged to secure the payment of bonds issued by PRHTA, PRIFA and PRCCDA. On January 7, 2016, the Company sued various Puerto Rico governmental officials in the United States District Court, District of Puerto Rico asserting that this attempt to “claw back” pledged taxes and revenues is unconstitutional, and demanding declaratory and injunctive relief.  MBIA UK.

(6)On January 1, 2016 PRIFA defaulted on full payment of a portion of the interest due on its bonds on that date. For those PRIFA bonds theFGIC includes subsidiaries Financial Guaranty Insurance Company had insured, the Company paid approximately $451 thousand of claims for the interest payments on which PRIFA had defaulted.and FGIC UK Limited.


Exposure to Puerto Rico


109


The following table shows the scheduled amortization of theCompany has insured exposure to general obligation bonds of the Commonwealth of Puerto Rico (Puerto Rico or the Commonwealth) and various obligations of its related authorities and public corporations aggregating $4.8 billion net par as of December 31, 2016, all of which are rated BIG. Puerto Rico has experienced significant general fund budget deficits in recent years and a challenging economic environment. Beginning on January 1, 2016, a number of Puerto Rico credits have defaulted on bond payments, and the Company has now paid claims on several Puerto Rico credits as shown in the table "Puerto Rico Net Par Outstanding" below. Additional information about recent developments in Puerto Rico and the individual credits insured by the Company may be found in Part II, Item 8, Financial Statements and Supplementary Data, Note 4, Outstanding Exposure.

The Company groups its Puerto Rico exposure into three categories:

Constitutionally Guaranteed. The Company includes in this category public debt benefiting from Article VI of the Constitution of the Commonwealth, which expressly provides that interest and principal payments on the public debt are to be paid before other disbursements are made.

Public Corporations – Certain Revenues Potentially Subject to Clawback. The Company includes in this category the debt of public corporations for which applicable law permits the Commonwealth to claw back, subject to certain conditions and for the payment of public debt, at least a portion of the revenues supporting the bonds the Company insures. As a Constitutional condition to clawback, available Commonwealth revenues for any fiscal year must be insufficient to pay Commonwealth debt service before the payment of any appropriations for that year.  The Company believes that this condition has not been satisfied to date, and accordingly that the Commonwealth has not to date been entitled to clawback revenues supporting debt insured by the Company. The Company guarantees payments of interestAs described in Part II, Item 8, Financial Statements and principal when those amounts are scheduled to be paid and cannot be required to pay on an accelerated basis. In the event that obligors default on their obligations,Supplementary Data, Note 4, Outstanding Exposure, the Company would only paysued various Puerto Rico governmental officials in the shortfall between the principal and interest due in any given period and the amount paid by the obligors.
Amortization Schedule
of Net Par OutstandingUnited States District Court, District of Puerto Rico asserting that Puerto Rico's recent attempt to claw back pledged taxes is unconstitutional, and demanding declaratory and injunctive relief.
As of December 31, 2015

Other Public Corporations. The Company includes in this category the debt of public corporations that are supported by revenues it does not believe are subject to clawback.
 Scheduled Net Par Amortization
 20162017201820192020202120222023202420252026 -20302031 -20352036 -20402041 -20452046 -2047Total
 (in millions)
Exposures Previously Subject to the Voided Recovery Act:                
PRHTA (Transportation revenue)$32
$36
$42
$28
$23
$18
$19
$21
$1
$26
$151
$227
$240
$45
$
$909
PREPA20
5
4
25
42
22
22
81
78
52
309
84
0


744
Puerto Rico Aqueduct and Sewer Authority15


2
25
84

2
92
168
388
PRHTA (Highway revenue)20
10
10
21
22
26
6
8
8
8
27
167
37


370
PRCCDA11


19
105
29


164
Total98
51
56
74
87
66
47
110
89
111
590
583
308
137
168
2,575
                 
Exposures Not Previously Subject to the Voided Recovery Act:                
Commonwealth of Puerto Rico - General Obligation Bonds142
95
75
82
137
16
37
15
73
68
254
475
146


1,615
MFA55
47
47
44
37
33
33
16
12
11
52


387
Puerto Rico Sales Tax Financing Corporation(1)(1)(1)(1)(1)(2)(2)1
0
(2)(6)32
98
155

269
Puerto Rico Public Buildings Authority8
30

5
10
12
0
7
0
8
52
40
16


188
PRIFA

2


2


3
11

18
University of Puerto Rico0
0
0
0
0
0
0
0
0
0
0
1


1
Total204
171
123
130
183
59
68
41
85
85
352
548
263
166

2,478
Total net par for Puerto Rico$302
$222
$179
$204
$270
$125
$115
$151
$174
$196
$942
$1,131
$571
$303
$168
$5,053


110


Amortization Schedule
of Net Debt Service Outstanding of Puerto Rico
As of December 31, 2015

 Scheduled Net Debt Service Amortization
 20162017201820192020202120222023202420252026 -20302031 -20352036 -20402041 -20452046 -2047Total
 (in millions)
Exposures Previously Subject to the Voided Recovery Act:                
PRHTA (Transportation revenue)$80
$82
$86
$69
$63
$57
$57
$58
$37
$61
$309
$348
$288
$47
$
$1,642
PREPA55
38
37
58
74
52
50
109
102
72
366
92
0


1,105
Puerto Rico Aqueduct and Sewer Authority35
19
19
19
19
19
19
19
21
45
160
68
70
160
181
873
PRHTA (Highway revenue)40
29
29
39
39
42
20
21
21
21
87
203
39


630
PRCCDA19
7
7
7
7
7
7
7
7
7
51
127
30


290
Total229
175
178
192
202
177
153
214
188
206
973
838
427
207
181
4,540
                 
Exposures Not Previously Subject to the Voided Recovery Act:                
Commonwealth of Puerto Rico - General Obligation Bonds226
172
146
150
201
72
93
69
127
116
458
606
161


2,597
MFA74
64
62
56
47
40
39
21
16
15
57


491
Puerto Rico Sales Tax Financing Corporation12
13
13
13
13
13
13
16
15
12
68
103
164
170

638
Puerto Rico Public Buildings Authority18
39
8
12
18
20
6
14
6
14
72
49
17


293
PRIFA0
1
3
1
1
1
1
3
0
0
4
4
6
12

37
University of Puerto Rico0
0
0
0
0
0
0
0
0
0
0
1


1
Total330
289
232
232
280
146
152
123
164
157
659
763
348
182

4,057
Total net debt service for Puerto Rico$559
$464
$410
$424
$482
$323
$305
$337
$352
$363
$1,632
$1,601
$775
$389
$181
$8,597


111


Financial Guaranty Portfolio by Issue Size

The Company seeks broad coverage of the market by insuring and reinsuring small and large issues alike. The following table sets forth the distribution of the Company's portfolio by original size of the Company's exposure.

Public Finance Portfolio by Issue Size
As of December 31, 20152016

Original Par Amount Per Issue 
Number of
Issues
 
Net Par
Outstanding
 
% of Public
Finance
Net Par
Outstanding
 
Number of
Issues
 
Net Par
Outstanding
 
% of Public
Finance
Net Par
Outstanding
(dollars in millions) (dollars in millions)
Less than $10 millionLess than $10 million16,116 $44,672
 13.9%Less than $10 million15,018 $40,484
 14.9%
$10 through $50 million$10 through $50 million5,746 97,227
 30.2
$10 through $50 million5,198 86,376
 31.9
$50 through $100 million$50 through $100 million1,097 56,787
 17.7
$50 through $100 million937 48,058
 17.7
$100 million to $200 million$100 million to $200 million477 50,028
 15.6
$100 million to $200 million430 42,938
 15.8
$200 million or greater$200 million or greater283 72,729
 22.6
$200 million or greater238 53,323
 19.7
TotalTotal23,719 $321,443
 100.0%Total21,821 $271,179
 100.0%


Structured Finance Portfolio by Issue Size
As of December 31, 20152016

Original Par Amount Per Issue 
Number of
Issues
 
Net Par
Outstanding
 
% of Structured
Finance
Net Par
Outstanding
 (dollars in millions)
Less than $10 million217 $115
 0.3%
$10 through $50 million291 2,907
 7.8
$50 through $100 million105 3,313
 8.9
$100 million to $200 million157 8,069
 21.8
$200 million or greater169 22,724
 61.2
Total939 $37,128
 100.0%

Exposure to Residential Mortgage-Backed Securities
The tables below provide information on the risk ratings and certain other risk characteristics of the Company’s financial guaranty insurance and credit derivative RMBS exposures as of December 31, 2015. U.S. RMBS exposures represent 2% of the total net par outstanding, and BIG U.S. RMBS represent 26% of total BIG net par outstanding. See Note 5, Expected Loss to be Paid, of the Financial Statements and Supplementary Data, for a discussion of expected losses to be paid on U.S. RMBS exposures.

Distribution of U.S. RMBS by Rating and Type of Exposure as of December 31, 2015
Ratings: 
Prime
First Lien
 
Alt-A
First Lien
 
Option
ARMs
 
Subprime
First Lien
 
Second
Lien
 Total Net Par Outstanding
  (dollars in millions)
AAA $9
 $220
 $16
 $1,536
 $0
 $1,781
AA 95
 325
 91
 482
 108
 1,102
A 1
 
 4
 41
 1
 47
BBB 56
 15
 
 94
 0
 165
BIG 284
 793
 141
 1,304
 1,452
 3,973
Total exposures $445
 $1,353
 $252
 $3,457
 $1,560
 $7,067


112


Distribution of U.S. RMBS by Year Insured and Type of Exposure as of December 31, 2015
Year
insured:
 
Prime
First Lien
 
Alt-A
First Lien
 
Option
ARMs
 
Subprime
First Lien
 
Second
Lien
 Total Net Par Outstanding
  (in millions)
2004 and prior $55
 $56
 $18
 $1,069
 $108
 $1,305
2005 127
 450
 36
 182
 345
 1,140
2006 85
 196
 35
 724
 438
 1,478
2007 177
 651
 163
 1,414
 669
 3,075
2008 
 
 
 68
 
 68
Total exposures $445
 $1,353
 $252
 $3,457
 $1,560
 $7,067
Original Par Amount Per Issue 
Number of
Issues
 
Net Par
Outstanding
 
% of Structured
Finance
Net Par
Outstanding
 (dollars in millions)
Less than $10 million186 $94
 0.4%
$10 through $50 million241 1,765
 7.0
$50 through $100 million85 2,469
 9.8
$100 million to $200 million127 4,805
 19.1
$200 million or greater139 16,006
 63.7
Total778 $25,139
 100.0%

Exposures by Reinsurer
 
Ceded par outstanding represents the portion of insured risk ceded to otherexternal reinsurers. Under these relationships, the Company cedes a portion of its insured risk in exchange for a premium paid to the reinsurer. The Company remains primarily liable for all risks it directly underwrites and is required to pay all gross claims. It then seeks reimbursement from the reinsurer for its proportionate share of claims. The Company may be exposed to risk for this exposure if it were required to pay the gross claims and not be able to collect ceded claims from an assuming company experiencing financial distress. A number of the financial guaranty insurers to which the Company has ceded par have experienced financial distress and as a result have been downgraded by the rating agencies. In addition, state insurance regulators have intervened with respect to some of these insurers.

In accordance with U.S. statutory accounting requirements and U.S. insurance laws and regulations, in order for the Company to receive credit for liabilities ceded to reinsurers domiciled outside of the U.S., such reinsurers must secure their liabilities to the Company. All of the unauthorized reinsurers in the table below are required to post collateral for the benefit of the Company in an amount at least equal to the sum of their ceded unearned premium reserve, loss reserves and contingency reserves, all calculated on a statutory basis of accounting. In addition, certain authorized reinsurers in the table below post collateral on terms negotiated with the Company. Collateral may be in the form of letters of credit or trust accounts. The total collateral posted by all non-affiliated reinsurers as of December 31, 20152016 was approximately $470$387 million.

 Assumed par outstanding represents the amount of par assumed by the Company from third party insurers and reinsurers, including other monolines.monoline financial guaranty companies. Under these relationships, the Company assumes a portion

of the ceding company’s insured risk in exchange for a premium. The Company may be exposed to risk in this portfolio in that the Company may be required to pay losses without a corresponding premium in circumstances where the ceding company is experiencing financial distress and is unable to pay premiums.
 
In addition to assumed and ceded reinsurance arrangements, the Company may also have exposure to financial guaranty insurers in "second-to-pay" transactions, where the Company provides insurance on an obligation that is already insured by another financial guarantor. In that case, if the underlying obligor and the financial guarantor both fail to pay an amount scheduled to be paid, the Company would be obligated to pay. The Company underwrites these transactions based on the underlying obligation, without regard to the financial obligor.guarantor. See Part II, Item 8, Financial Statements and Supplementary Data, Note 13, Reinsurance and Other Monoline Exposures, of the Financial Statements and Supplementary Data.Exposures.
 

Monoline and Reinsurer Exposure
113


Exposure by ReinsurerCompany

  Ratings at Par Outstanding (1)
  February 24, 2016 As of December 31, 2015
Reinsurer Moody’s
Reinsurer
Rating
 S&P
Reinsurer
Rating
 Ceded Par
Outstanding
 Second-to-
Pay Insured
Par
Outstanding
 Assumed Par
Outstanding
  (dollars in millions)
American Overseas Reinsurance Company Limited (f/k/a Ram Re) (2) WR (3) WR $5,227
 $
 $30
Tokio Marine & Nichido Fire Insurance Co., Ltd. (2) Aa3 (4) A+ (4) 4,216
 
 
Syncora Guarantee Inc. (2) WR WR 2,451
 1,244
 727
Mitsui Sumitomo Insurance Co. Ltd. (2) A1 A+ (4) 1,818
 
 
ACA Financial Guaranty Corp. NR (5) WR 714
 20
 
Ambac Assurance Corporation WR WR 117
 3,889
 10,388
National (6) A3 AA- 
 5,299
 5,100
MBIA (7) (7) 
 1,802
 440
FGIC (8) (8) 
 1,424
 652
Ambac Assurance Corp. Segregated Account NR NR 
 91
 873
CIFG Assurance North America Inc. WR WR 
 43
 2,996
Other (2) Various Various 78
 796
 133
Total     $14,621
 $14,608
 $21,339
  Par Outstanding
  As of December 31, 2016
Reinsurer Ceded Par
Outstanding (1)
 Second-to-
Pay Insured
Par
Outstanding (2)
 Assumed Par
Outstanding
  (in millions)
Reinsurers rated investment grade:      
Tokio Marine & Nichido Fire Insurance Co., Ltd. (3) (4) $3,436
 $
 $
Mitsui Sumitomo Insurance Co. Ltd. (3) (4) 1,273
 
 
National 
 4,420
 4,364
Subtotal 4,709
 4,420
 4,364
Reinsurers rated BIG, with rating withdrawn or not rated:      
American Overseas Reinsurance Company Limited (3) 3,573
 
 30
Syncora Guarantee Inc. (3) 2,062
 1,098
 655
ACA Financial Guaranty Corp. 637
 20
 
Ambac Assurance Corporation 115
 2,862
 6,695
MBIA 
 1,024
 165
MBIA UK (5) 
 319
 211
FGIC (6) 
 1,194
 410
Ambac Assurance Corp. Segregated Account 
 73
 614
Other (3) 60
 529
 120
Subtotal 6,447
 7,119
 8,900
Total $11,156
 $11,539
 $13,264
____________________
(1)IncludesOf the total ceded par related to insured credit derivatives.reinsurers rated BIG, had rating withdrawn or not rated, $384 million is rated BIG.

(2)
The par on second-to-pay exposure where the primary insurer and underlying transaction rating are both BIG is $788 million.
(3)The total collateral posted by all non-affiliated reinsurers required or agreeinghad agreed to post collateral as of December 31, 20152016 was approximately $470 million.$387 million.
(3)    Represents “Withdrawn Rating.”

(4)    The Company benefits from trust arrangements that satisfy the triple-A credit requirement of S&P and/or Moody’s.

(5)    Represents “Not Rated.”

(6)(5)National is rated AA+ by KBRA.See Part II, Item 8, Financial Statements and Supplementary Data, Note 2, Acquisitions, for more information on MBIA UK.

(7)MBIA includes subsidiaries MBIA Insurance Corp. rated B by S&P and B3 by Moody's and MBIA U.K. Insurance Ltd. rated BB by S&P and Ba2 by Moody’s.

(8)(6)FGIC includes subsidiaries Financial Guaranty Insurance Company and FGIC UK Limited both of which had their ratings withdrawn by rating agencies.Limited.

Selected European Exposure

to Puerto Rico
         Several European countries have experienced significant economic, fiscal and/or political strains such that the likelihood of default on obligations with a nexus to those countries may be higher than the Company anticipated when such factors did not exist.
The Company has identifiedinsured exposure to general obligation bonds of the Commonwealth of Puerto Rico (Puerto Rico or the Commonwealth) and various obligations of its related authorities and public corporations aggregating $4.8 billion net par as of December 31, 2016, all of which are rated BIG. Puerto Rico has experienced significant general fund budget deficits in recent years and a challenging economic environment. Beginning on January 1, 2016, a number of Puerto Rico credits have defaulted on bond payments, and the Company has now paid claims on several Puerto Rico credits as shown in the table "Puerto Rico Net Par Outstanding" below. Additional information about recent developments in Puerto Rico and the individual credits insured by the Company may be found in Part II, Item 8, Financial Statements and Supplementary Data, Note 4, Outstanding Exposure.

The Company groups its Puerto Rico exposure into three categories:

Constitutionally Guaranteed. The Company includes in this category public debt benefiting from Article VI of the Constitution of the Commonwealth, which expressly provides that interest and principal payments on the public debt are to be paid before other disbursements are made.

Public Corporations – Certain Revenues Potentially Subject to Clawback. The Company includes in this category the debt of public corporations for which applicable law permits the Commonwealth to claw back, subject to certain conditions and for the payment of public debt, at least a portion of the revenues supporting the bonds the Company insures. As a Constitutional condition to clawback, available Commonwealth revenues for any fiscal year must be insufficient to pay Commonwealth debt service before the payment of any appropriations for that year.  The Company believes that this condition has not been satisfied to date, and accordingly that the Commonwealth has not to date been entitled to clawback revenues supporting debt insured by the Company. As described in Part II, Item 8, Financial Statements and Supplementary Data, Note 4, Outstanding Exposure, the Company sued various Puerto Rico governmental officials in the United States District Court, District of Puerto Rico asserting that Puerto Rico's recent attempt to claw back pledged taxes is unconstitutional, and demanding declaratory and injunctive relief.

Other Public Corporations. The Company includes in this category the debt of public corporations that are supported by revenues it does not believe are subject to clawback.


Net Exposure to Puerto Rico
As of December 31, 2016

  Net Par Outstanding  
  AGM AGC AG Re Eliminations (1) Total Net Par Outstanding (2) Gross Par Outstanding
  (in millions)
Commonwealth Constitutionally Guaranteed            
Commonwealth of Puerto Rico - General Obligation Bonds (3) $680
 $378
 $421
 $(3) $1,476
 $1,577
Puerto Rico Public Buildings Authority (PBA) (3) 11
 169
 0
 (11) 169
 174
Public Corporations - Certain Revenues Potentially Subject to Clawback         

  
Puerto Rico Highways and Transportation Authority (PRHTA) (Transportation revenue) (3) (4) 273
 519
 209
 (83) 918
 949
PRHTA (Highway revenue) 213
 93
 44
 
 350
 556
Puerto Rico Convention Center District Authority (PRCCDA) 
 152
 
 
 152
 152
Puerto Rico Infrastructure Financing Authority (PRIFA) (3) 
 17
 1
 
 18
 18
Other Public Corporations         

  
PREPA 417
 73
 234
 
 724
 876
Puerto Rico Aqueduct and Sewer Authority (PRASA) 
 285
 88
 
 373
 373
Municipal Finance Agency (MFA) 175
 61
 98
 
 334
 488
Puerto Rico Sales Tax Financing Corporation (COFINA) 262
 
 9
 
 271
 271
University of Puerto Rico (U of PR) 
 1
 
 
 1
 1
Total net exposure to Puerto Rico $2,031
 $1,748
 $1,104
 $(97) $4,786
 $5,435
____________________
(1)Net par outstanding eliminations relate to second-to-pay policies under which an Assured Guaranty insurance subsidiary guarantees an obligation already insured by another Assured Guaranty insurance subsidiary.

(2)Includes exposure to capital appreciation bonds with a current aggregate net par outstanding of $31 million and a fully accreted net par at maturity of $63 million. Of these amounts, current net par of $19 million and fully accreted net par at maturity of $50 million relate to the COFINA, current net par of $7 million and fully accreted net par at maturity of $7 million relate to the PRHTA, and current net par of $5 million and fully accreted net par at maturity of $5 million relate to the Commonwealth General Obligation Bonds.

(3)As of the date of this filing, the Company has paid claims on these credits.

(4)The December 31, 2016 amount includes $46 million of net par from CIFG Acquisition.


The following table shows the scheduled amortization of the general obligation bonds of Puerto Rico and various obligations of its related authorities and public corporations insured by the Company. The Company guarantees payments of interest and principal when those amounts are scheduled to be paid and cannot be required to pay on an accelerated basis. In the event that obligors default on their obligations, the Company would only pay the shortfall between the principal and interest due in any given period and the amount paid by the obligors.
Amortization Schedule
of Net Par Outstanding of Puerto Rico
As of December 31, 2016

 Scheduled Net Par Amortization
 2017 (1Q)2017 (2Q)2017 (3Q)2017 (4Q)20182019202020212022 -20262027 -20312032 -20362037 -20412042 -2047Total
 (in millions)
Commonwealth Constitutionally Guaranteed              
Commonwealth of Puerto Rico - General Obligation Bonds$0
$0
$93
$0
$75
$82
$136
$16
$226
$254
$489
$105
$
$1,476
PBA

28


3
5
13
24
42
54


169
Public Corporations - Certain Revenues Potentially Subject to Clawback              
PRHTA (Transportation revenue)0
0
36
0
38
32
25
18
119
156
295
194
5
918
PRHTA (Highway revenue)

10

10
21
22
26
30
62
169


350
PRCCDA


19
133


152
PRIFA


2


2


14

18
Other Public Corporations              
PREPA0
0
5

4
25
42
21
322
279
26
0

724
PRASA


53
57

2
261
373
MFA

48

47
44
37
33
98
27


334
COFINA0
0
0
0
(1)(1)(1)(2)(5)(7)34
102
152
271
U of PR

0

0
0
0
0
0
0
1


1
Total net par for Puerto Rico$0
$0
$220
$0
$175
$206
$266
$125
$869
$889
$1,201
$417
$418
$4,786


Amortization Schedule
of Net Debt Service Outstanding of Puerto Rico
As of December 31, 2016

 Scheduled Net Debt Service Amortization
 2017 (1Q)2017 (2Q)2017 (3Q)2017 (4Q)20182019202020212022 -20262027 -20312032 -20362037 -20412042 -2047Total
 (in millions)
Commonwealth Constitutionally Guaranteed              
Commonwealth of Puerto Rico - General Obligation Bonds$38
$0
$131
$0
$146
$150
$200
$73
$488
$445
$595
$112
$
$2,378
PBA4

32

7
10
13
20
54
58
62


260
Public Corporations - Certain Revenues Potentially Subject to Clawback              
PRHTA (Transportation revenue)24
0
60
0
84
76
67
59
305
308
404
229
5
1,621
PRHTA (Highway revenue)10

19

29
39
39
42
96
120
196


590
PRCCDA3

4

7
7
7
7
35
50
151


271
PRIFA0

0

3
1
1
1
7
4
3
15

35
Other Public Corporations              
PREPA15
2
20
2
37
58
74
52
440
322
29
0

1,051
PRASA10

10

20
19
19
19
147
129
68
70
327
838
MFA8

57

62
56
47
40
118
30


418
COFINA6
0
6
0
13
13
13
13
69
68
103
162
160
626
U of PR0

0

0
0
0
0
0
0
1


1
Total net par for Puerto Rico$118
$2
$339
$2
$408
$429
$480
$326
$1,759
$1,534
$1,612
$588
$492
$8,089


Exposure to U.S. Residential Mortgage-Backed Securities
The tables below provide information on the risk ratings and certain other risk characteristics of the Company’s financial guaranty insurance, FG VIE and credit derivative U.S. RMBS exposures. As of December 31, 2016, U.S. RMBS exposures represent 2% of the total net par outstanding, and BIG U.S. RMBS represent 24% of total BIG net par outstanding. See Part II, Item 8, Financial Statements and Supplementary Data, Note 5, Expected Loss to be Paid, for a discussion of expected losses to be paid on U.S. RMBS exposures.

Distribution of U.S. RMBS by Rating and Type of Exposure as of December 31, 2016
Ratings: 
Prime
First Lien
 
Alt-A
First Lien
 
Option
ARMs
 
Subprime
First Lien
 
Second
Lien
 Total Net Par Outstanding
  (dollars in millions)
AAA $2
 $174
 $28
 $1,471
 $0
 $1,675
AA 24
 240
 52
 276
 0
 592
A 14
 11
 0
 85
 0
 111
BBB 24
 5
 
 80
 0
 108
BIG 141
 570
 81
 1,134
 1,225
 3,151
Total exposures $205
 $1,000
 $161
 $3,045
 $1,225
 $5,637


Distribution of U.S. RMBS by Year Insured and Type of Exposure as of December 31, 2016
Year
insured:
 
Prime
First Lien
 
Alt-A
First Lien
 
Option
ARMs
 
Subprime
First Lien
 
Second
Lien
 Total Net Par Outstanding
  (in millions)
2004 and prior 31
 43
 15
 959
 74
 1,122
2005 102
 376
 30
 164
 264
 936
2006 72
 76
 28
 682
 352
 1,210
2007 
 504
 89
 1,176
 536
 2,305
2008 
 
 
 65
 
 65
Total exposures 205
 1,000
 161
 3,045
 1,225
 5,637

Exposure to Selected European Countries

The European countries where itthe Company has exposure and where it believes heightened uncertainties exist to be:are: Hungary, Italy, Portugal, Spain and Spain (the “SelectedTurkey (collectively, the Selected European Countries”)Countries). The Company selected theseadded Turkey to its list of Selected European countries based on its view that their credit fundamentals have weakenedCountries in 2016, as a result of the global financial crisis, as well as on published reports identifying countries that may be experiencing reduced demand for their sovereign debtrecent political turmoil in the current environment. The Company has in the past included Greece on the list, but the Company no longer has any meaningful exposure to Greece.


114


Direct Economic Exposure to the Selected European Countries
country. The Company’s direct economic exposure to the Selected European Countries (based on par for financial guaranty contracts and notional amount for financial guaranty contracts accounted for as derivatives) is shown in the following tables, both gross and net of ceded reinsurance:reinsurance.

Gross Direct Economic Exposure
to Selected European Countries(1)
As of December 31, 20152016
 
 Hungary Italy Portugal Spain Total
 (in millions)
Sub-sovereign exposure: 


Non-infrastructure public finance (2)$
 $1,023
 $91
 $331
 $1,445
Infrastructure finance274
 10
 
 120
 404
Total sub-sovereign exposure274
 1,033
 91
 451
 1,849
Non-sovereign exposure: 


Regulated utilities
 226
 
 
 226
RMBS and other structured finance176
 278
 
 13
 467
Total non-sovereign exposure176
 504
 
 13
 693
Total$450
 $1,537
 $91
 $464
 $2,542
Total BIG$380
 $
 $91
 $464
 $935
 Hungary Italy Portugal Spain Turkey Total
 (in millions)
Sub-sovereign exposure(2)$239
 $1,107
 $78
 $430
 $
 $1,854
Non-sovereign exposure(3)117
 443
 
 
 202
 762
Total$356
 $1,550
 $78
 $430
 $202
 $2,616
Total BIG$287
 $
 $78
 $430
 $
 $795

 
Net Direct Economic Exposure
to Selected European Countries(1)
As of December 31, 20152016
 Hungary Italy Portugal Spain Total
 (in millions)
Sub-sovereign exposure: 


Non-infrastructure public finance(2)$
 $780
 $85
 $240
 $1,105
Infrastructure finance271
 10
 
 120
 401
Total sub-sovereign exposure271
 790
 85
 360
 1,506
Non-sovereign exposure: 


Regulated utilities
 212
 
 
 212
RMBS and other structured finance170
 244
 
 13
 427
Total non-sovereign exposure170
 456
 
 13
 639
Total$441
 $1,246
 $85
 $373
 $2,145
Total BIG$374
 $
 $85
 $373
 $832
 Hungary Italy Portugal Spain Turkey Total
 (in millions)
Sub-sovereign exposure(2)$236
 $880
 $76
 $342
 $
 $1,534
Non-sovereign exposure(3)114
 399
 
 
 202
 715
Total$350
 $1,279
 $76
 $342
 $202
 $2,249
Total BIG$283
 $
 $76
 $342
 $
 $701
____________________
(1)
While the Company’s exposures are shown in U.S. dollars, the obligations the Company insures are in various currencies, primarily Euros. Oneeuros.
(2)
Sub-sovereign exposure in Selected European Countries includes transactions backed by receivables from, or supported by, sub-sovereigns, which are governmental or government-backed entities other than the ultimate governing body of the residential mortgage-backed securities included in the table above includes residential mortgages in both Italy and Germany, and only the portion of the transaction equal to the portion of the original mortgage pool in Italian mortgages is shown in the tables.country.

(2)(3)The
Non-sovereign exposure shown in the "Non-infrastructure public finance" category is from transactions backed by receivable payments from sub-sovereigns in Italy, SpainSelected European Countries includes debt of regulated utilities, RMBS and Portugal.diversified payment rights (DPR) securitizations.


The tables above include the par amount of financial guaranty contracts accounted for as derivatives of $110$108 million with a fair value of $3$2 million, net of reinsurance. The Company’s credit derivative transactions are governed by ISDA documentation, and the Company is required to make a loss payment on them only upon the occurrence of one or more defined credit events with respect to the referenced securities or loans.


115


The Company rates $374$283 million of its direct net par exposure to the Republic of Hungary BIG. The sub-sovereign transaction it rates BIG is an infrastructure financing dependent on payments by government agencies, while the non-sovereign transactions it rates BIG are covered mortgage bonds issued by Hungarian banks.  The Company rates one insured Hungarian covered bond transaction investment grade.

The Company does not rate any of its direct exposure to the Republic of Italy BIG.  The Company’s sub-sovereign exposure to Italy depends on payments by Italian governmental entities, in connection with infrastructure financings or for services already rendered, while its non-sovereign Italian exposure is comprised primarily of securities backed by Italian residential mortgages or in one case a government-sponsored water utility.

The Company rates all of its direct exposure to the Kingdom of Spain and the Republic of Portugal BIG.  The Company’s direct sub-sovereign exposure to Spain and Portugal includes infrastructure financings dependent on payments by sub-sovereigns and government agencies and financings dependent on lease and other payments by sub-sovereigns and government agencies.

The $202 million net insured par exposure in Turkey is to DPR securitizations sponsored by a major Turkish bank. These DPR securitizations were established outside of Turkey and involve payment orders in U.S. dollars, pounds sterling and Euros from persons outside of Turkey to beneficiaries in Turkey who are customers of the sponsoring bank. The sponsoring bank's correspondent banks have agreed to remit all such payments to a trustee-controlled account outside Turkey, where debt service payments for the DPR securitization are given priority over payments to the sponsoring bank.

 Indirect Exposure to Selected European Countries
 
The Company considers economic exposure to a Selected European Country to be indirect when that exposure relates to only a small portion of an insured transaction that otherwise is not related to that Selected European Country, and the Company has excluded its indirect exposure to the Selected European Countries from the exposure tables above. The Company has such indirect exposure to Selected European Countries through insurance it provides on pooled corporate and commercial receivables transactions.
 
The Company’s pooled corporate obligations with indirect exposure to Selected European Countries are highly diversified in terms of obligors and, except in the case of TruPS CDOs or transactions backed by perpetual preferred securities, highly diversified in terms of industry. Most pooled corporate obligations are structured to limit exposure to any given obligor and any given non-U.S. country or region and generally benefit from embedded credit enhancement which allows a transaction a certain level of losses in the underlying collateral without causing the Company to pay a claim. The Company’s commercial receivable transactions with indirect exposure to Selected European Countries are rail car lease transactions and aircraft lease transactions where some of the lessees have a nexus with the Selected European Countries. Like the pooled corporate transactions, the commercial receivable transactions generally benefit from embedded credit enhancement which allows a transaction a certain level of losses in the underlying collateral without causing the Company to pay a claim.

The Company has excluded from the exposure tables above its indirect economic exposure to the Selected European Countries through policies it provides on pooled corporate and commercial receivables transactions. The Company calculates indirect exposure to a country by multiplying the par amount of a transaction insured by the Company times the percent of the relevant collateral pool reported as having a nexus to the country. On that basis, the Company has calculated exposure of $223$115 million to Selected European Countries (plus Greece) in transactions with $4.2$2.8 billion of net par outstanding. The indirect exposure to credits with a nexus to Greece is $6$3 million across several highly rated pooled corporate obligations with net par outstanding of $244$129 million.
    
Identifying Exposure to Selected European Countries
 
When the Company directly insures an obligation, it assigns the obligation to a geographic location or locations based on its view of the geographic location of the risk. For most exposures this can be a relatively straight-forward determination as, for example, a debt issue supported by availability payments for a toll road in a particular country. The Company may also assign portions of a risk to more than one geographic location as it has, for example, in a residential mortgage backed security backed by residential mortgage loans in both Germany and Italy. The Company may also have exposures to the Selected

European Countries in business assumed from other monoline insurance companies.third party insurers and reinsurers. In the case of assumed business, the Company depends upon geographic information provided by the primary insurer.


116


Liquidity and Capital Resources
 
Liquidity Requirements and Sources

AGL and its Holding Company Subsidiaries
 
The liquidity of AGL, AGUS and AGMH is largely dependent on dividends from their operating subsidiaries and their access to external financing. The liquidity requirements of these entities include the payment of operating expenses, interest on debt issued by AGUS and AGMH, and dividends on AGL's common shares. AGL and its holding company subsidiaries may also require liquidity to make periodic capital investments in their operating subsidiaries or, in the case of AGL, to repurchase its common shares pursuant to its share repurchase authorization. In the ordinary course of business, the Company evaluates its liquidity needs and capital resources in light of holding company expenses and dividend policy, as well as rating agency considerations. The Company also subjects its cash flow projections and its assets to a stress test, maintaining a liquid asset balance of one time its stressed operating company net cash flows. Management believes that AGL will have sufficient liquidity to satisfy its needs over the next twelve months. See “Insurance Company Regulatory Restrictions” below for a discussion of the dividend restrictions of its insurance company subsidiaries.
 

AGL and Holding Company Subsidiaries
Significant Cash Flow Items

Year Ended December 31,Year Ended December 31,
2015 2014 20132016 2015 2014
(in millions)(in millions)
Intercompany sources (uses):     
Dividends paid by AGC to AGUS$90
 $69
 $67
$79
 $90
 $69
Dividends paid by AGM to AGMH215
 160
 163
247
 215
 160
Dividends paid by AG Re to AGL150
 82
 144
100
 150
 82
Dividends paid by other subsidiaries of AGMH
 10


 10
Repayment of surplus note by AGM to AGMH25
 50
 50

 25
 50
Proceeds to AGMH from repurchase of common shares by AGM300
 
 
Repayment of loan by AGUS to AGRO(20) 
 
Issuance of note by AGUS to AGC(1)
 (200) 
Repayment of note by AGC to AGUS(1)
 200
 
External sources (uses):     
Dividends paid to AGL shareholders(72) (76) (75)(69) (72) (76)
Repurchases of common shares by AGL(1)(555) (590) (264)
Repurchases of common shares by AGL(2)(306) (555) (590)
Interest paid by AGMH and AGUS(95) (83) (70)(95) (95) (83)
Proceeds from issuance of long-term debt
 495


 495
Payment of long-term debt by AGUS
 
 (7)
Issuance of note by AGUS to AGC(2)(200) 
 
Repayment of note by AGC to AGUS(2)200
 
 
____________________
(1)On May 6, 2015, in continuation of the Company's capital management strategy of repurchasing its common shares, the Company's Board of Directors approved the repurchase of an incremental $400 million of common shares. On a settlement date basis, the remaining authorization for share repurchases was $55 million on December 31, 2015. After the repurchase of additional shares in 2016, the Company exhausted the share repurchase authorization on February 9, 2016. On February 24, 2016, the Board of Directors approved a $250 million share repurchase authorization.

(2)On March 31, 2015, AGUS, as lender, provided $200 million to AGC, as borrower, from available funds to help fund the purchase of Radian Asset. AGC repaid that loan in full on April 14, 2015.

(2)See Part II, Item 8, Financial Statements and Supplementary Data, Note 18, Shareholders' Equity, for additional information about share repurchases and authorizations.

Dividends From Subsidiaries

The Company anticipates that for the next twelve months, amounts paid by AGL’s direct and indirect insurance company subsidiaries as dividends or other distributions will be a major source of its liquidity. The insurance company subsidiaries’ ability to pay dividends depends upon their financial condition, results of operations, cash requirements, and compliance with rating agency requirements, and is also subject to restrictions contained in the insurance laws and related regulations of their states of domicile. Dividend restrictions applicable to AGC, and AGM, MAC and to AG Re, are described underin Part II, Item 8, Financial Statements and Supplementary Data, Note 11, Insurance Company Regulatory Requirements of the Financial Statements and Supplementary Data.Requirements.

Under New YorkDividend restrictions by insurance law, AGM may only pay dividends out of "earned surplus," which is the portion of the company's surplus that represents the net earnings, gains or profits (after deduction of all losses) that have not

117

Table of Contents

been distributed to shareholderscompany subsidiary are as dividends or transferred to stated capital or capital surplus, or applied to other purposes permitted by law, but does not include unrealized appreciation of assets. AGM may pay dividends without the prior approval of the New York Superintendent that, together with all dividends declared or distributed by it during the preceding 12 months, does not exceed the lesser of 10% of its policyholders' surplus (as of its last annual or quarterly statement filed with the New York Superintendent) or 100% of its adjusted net investment income during that period. follows:

The maximum amount available during 20162017 for AGM to distribute as dividends without regulatory approval is estimated to be approximately $244$232 million, of which approximately $95$81 million is estimated to be available for distribution in the first quarter of 2016.2017.

Under Maryland's insurance law, AGC may, with prior notice to the Maryland Insurance Commissioner, pay an ordinary dividend that, together with all dividends paid in the prior 12 months, does not exceed the lesser of 10% of its policyholders' surplus (as of the prior December 31) or 100% of its adjusted net investment income during that period. The maximum amount available during 20162017 for AGC to distribute as ordinary dividends will beis approximately $79$107 million, of which approximately $9$29 million is available for distribution in the first quarter of 2016.2017.

The maximum amount available during 2017 for MAC to distribute as dividends without regulatory approval is a New York domiciled insurance company subjectestimated to be approximately $49 million.  MAC currently intends to allocate the same dividend limitations described above for AGM. The Company does not currently anticipate that MAC will distribute any dividends.distribution of such amount quarterly in 2017. 

For AG Re, any distribution (including repurchase of shares) of any share capital, contributed surplus or other statutory capital that would reduce its total statutory capital by 15% or more of its total statutory capital as set out in its previous year's financial statements requires the prior approval of the Bermuda Monetary Authority ("Authority"). Separately, dividends are paid out of an insurer's statutory surplus and cannot exceed that surplus. Further, annual dividends cannot exceed 25% of total statutory capital and surplus surplus as set out in its previous year's financial statements, which is $254 million, without AG Re certifying to the Authority that it will continue to meet required margins. Based on the foregoing limitations,applicable law and regulations, in 20162017 AG Re has the capacity to (i) make capital distributions in an aggregate amount up to $127$128 million without the prior approval of the Authority and (ii) declare and pay dividends in an aggregate amount up to the limit of its outstanding statutory surplus, which is $174$314 million. Such dividend capacity is further limited by the actual amount of AG Re’s unencumbered assets, which amount changes

from time to time due in part to collateral posting requirements. As of December 31, 2015,2016, AG Re had unencumbered assets of approximately $640$596 million.

Generally, dividends paid by a U.S. company to a Bermuda holding company are subject to a 30% withholding tax. After AGL became tax resident in the U.K., it became subject to the tax rules applicable to companies resident in the U.K., including the benefits afforded by the U.K.’s tax treaties. The income tax treaty between the U.K. and the U.S. reduces or eliminates the U.S. withholding tax on certain U.S. sourced investment income (to 5% or 0%), including dividends from U.S. subsidiaries to U.K. resident persons entitled to the benefits of the treaty.

External Financing

From time to time, AGL and its subsidiaries have sought external debt or equity financing in order to meet their obligations. External sources of financing may or may not be available to the Company, and if available, the cost of such financing may not be acceptable to the Company.

On June 20, 2014, AGUS issued $500 million of 5.0%5% Senior Notes due 2014. The notes are guaranteed by AGL. The net proceeds of the notes were used for general corporate purposes, including the purchase of AGL common shares.

Intercompany Loans and Guarantees

On March 30, 2015, AGUS loaned $200 million to AGC to facilitate the acquisition of Radian Asset on April 1, 2015. AGC repaid the loan in full on April 14, 2015.


118

Table of Contents

From time to time, AGL and its subsidiaries have entered into intercompany loan facilities. For example, on October 25, 2013, AGL, as borrower, and AGUS, as lender, entered into a revolving credit facility pursuant to which AGL may, from time to time, borrow for general corporate purposes. Under the credit facility, AGUS committed to lend a principal amount not exceeding $225 million in the aggregate. Such commitment terminates on October 25, 2018 (the “loanloan termination date”)date). The unpaid principal amount of each loan will bear interest at a fixed rate equal to 100% of the then applicable Federal short-term or mid-term interest rate, as the case may be, as determined under Internal Revenue Code Sec. 1274(d), and interest on all loans will be computed for the actual number of days elapsed on the basis of a year consisting of 360 days. Accrued interest on all loans will be paid on the last day of each June and December, beginning on December 31, 2013, and at maturity. AGL must repay the then unpaid principal amounts of the loans by the third anniversary of the loan termination date. No amounts are currently outstanding under the credit facility.

In addition, in connection with2012 AGUS borrowed $90 million from its affiliate AGRO to fund the acquisition of MAC,MAC. During 2016, AGUS entered into a loan agreement with its affiliate Assured Guaranty Re Overseas Ltd. in 2012 to borrow $90repaid $20 million in orderoutstanding principal as well as accrued any unpaid interest, and the parties agreed to fundextend the purchase price. Thatmaturity date of the loan remained outstanding asfrom May 2017 to November 2019. As of December 31, 2015. Furthermore, AGUS obtained the following funds from its subsidiaries in 2012 to complete the remarketing of the $172.52016, $70 million principal amount of 8.50% Senior Notes due 2012 that it had issued in 2009 in connection with the acquisition of AGHM: (1) $82.5 million loaned from an affiliate, (2) $50 million in dividends from AGMH, and (3) $40 million in dividends from AGC. The $82.5 million loan was repaid in full in July 2013 with a combination of the outstanding common stock of MAC and cash.remained outstanding.

Furthermore, AGL fully and unconditionally guarantees the payment of the principal of, and interest on, the $1,130 million aggregate principal amount of senior notes issued by AGUS and AGMH, and the $450 million aggregate principal amount of junior subordinated debentures issued by AGUS and AGMH, in each case, as described under "Commitments and Contingencies -- Long-Term Debt Obligations "Obligations" below.

Cash and Investments

As of December 31, 2015,2016, AGL had $9.7$36 million in cash and short-term investments. AGUS and AGMH had a total of $114$259 million in cash and short-term investments .investments. In addition, the Company's U.S. holding companies have $59$147 million in fixed-maturity securities with weighted average duration of 0.50.2 years.


Insurance Company Subsidiaries
 
Liquidity of the insurance company subsidiaries is primarily used to pay for:

operating expenses,
claims on the insured portfolio,
posting of collateral in connection with credit derivatives and reinsurance transactions,
reinsurance premiums,
dividends to AGL, AGUS and/or AGMH, as applicable,
principal of and, where applicable, interest on surplus notes, and
capital investments in their own subsidiaries, where appropriate.

On June 30, 2016, MAC obtained approval from the NYDFS to repay its $300 million surplus note to Municipal Assurance Holdings Inc. (MAC Holdings) and its $100 million surplus note (plus accrued interest) to AGM. Accordingly, on June 30, 2016, MAC transferred cash and/or marketable securities to (i) MAC Holdings in an aggregate amount equal to $300 million, and (ii)  AGM in an aggregate amount of $102.5 million. MAC Holdings, upon receipt of such $300 million from MAC, distributed cash and/or marketable securities in an aggregate amount of $300 million to its shareholders, AGM and AGC, in proportion to their respective 61% and 39% ownership interests such that AGM received $182 million and AGC received $118 million.

On November 25, 2016, the New York Superintendent approved AGM's request to repurchase 125 of its shares of common stock from its direct parent, AGMH, for approximately $300 million. AGM implemented the stock redemption plan in December 2016. Each share repurchased by AGM was retired and ceased to be an authorized share. Pursuant to AGM's Amended and Restated Charter, the par value of AGM's remaining shares of common stock issued and outstanding increased automatically in order to maintain AGM's total paid-in capital at $15 million and its authorized capital at $20 million.

Management believes that its subsidiaries’ liquidity needs for the next twelve months can be met from current cash, short-term investments and operating cash flow, including premium collections and coupon payments as well as scheduled maturities and paydowns from their respective investment portfolios. The Company targets a balance of its most liquid assets including cash and short-term securities, Treasuries, agency RMBS and pre-refunded municipal bonds equal to 1.5 times its projected operating company cash flow needs over the next four quarters. The Company intends to hold and has the ability to hold temporarily impaired debt securities until the date of anticipated recovery.
 
Beyond the next twelve months, the ability of the operating subsidiaries to declare and pay dividends may be influenced by a variety of factors, including market conditions, insurance regulations and rating agency capital requirements and general economic conditions.
 
Insurance policies issued provide, in general, that payments of principal, interest and other amounts insured may not be accelerated by the holder of the obligation. Amounts paid by the Company therefore are typically in accordance with the obligation’s original payment schedule, unless the Company accelerates such payment schedule, at its sole option.
 

119


 Payments made in settlement of the Company’s obligations arising from its insured portfolio may, and often do, vary significantly from year-to-year, depending primarily on the frequency and severity of payment defaults and whether the Company chooses to accelerate its payment obligations in order to mitigate future losses.
 
Claims (Paid) Recovered

Year Ended December 31,Year Ended December 31,
2015 2014 20132016 2015 2014
(in millions)(in millions)
Public finance$(29) $(144) $6
$(216) $(29) $(144)
Structured finance:          
U.S. RMBS before benefit for recoveries for breaches of R&W(270) (304) (587)(179) (270) (304)
Net benefit for recoveries for breaches of R&W173
 663
 954
89
 173
 663
U.S. RMBS after benefit for recoveries for breaches of R&W(97) 359
 367
(90) (97) 359
Other structured finance(161) 2
 (124)(48) (161) 2
Structured finance(258) 361
 243
(138) (258) 361
Claims (paid) recovered, net of reinsurance(1)$(287) $217
 $249
$(354) $(287) $217
____________________
(1)Includes $11 million, $21 million and $20 million paid in 2016, 2015 and 2014, and $189 million recovered in 2013, respectively, for consolidated FG VIEs. Claims recovered in 2013 include invested assets received as part of a restructuring.
 
As of December 31, 2015,2016, the Company had exposure of approximately $2.9 billion$528 million to infrastructure transactions with refinancing risk. The Company may be required to make claim payments on such exposure, the aggregate amount of the claim payments may be substantial and, although the Company may not experience ultimate loss on a particular transaction, reimbursement may not occur for an extended time. These transactions generally involve long-term infrastructure projectsproject that werewas financed by bonds that mature prior to the expiration of the project concession. The Company expects the cash flows from these projectsthe project to be sufficient to repay all of the debt over the life of the project concession, butand also expects the debt to be refinanced in the market at or prior to its maturity. If the issuer is unable to refinance the debt due to market conditions, the Company may have to pay a claimclaims when the debt matures from 2018 to 2022, and then recover from cash flows produced by the project in the future. The Company generally projects that in most scenarios it will be fully reimbursed for such claim payments. However, the recovery of such amounts is uncertain and may take from 10 to 35 years, depending on the transaction and the performance of the underlying collateral. As of December 31, 2015, the Company estimated total claims for the two largest transactions with significant refinancing risk, assuming no refinancing, and based on certain performance assumptions, could be $1.9 billion on a gross basis; such claims would occur from 2017 through 2022. Of such $1.9 billion in estimated gross claims, an estimated $1.3 billion related to obligations of SCC, which owned the concession for the Chicago Skyway toll road. In November 2015, a consortium of three Canadian pension plans announced that they had reached agreement, subject to regulatory approvals and customary closing conditions, to purchase SCC for $2.8 billion. The sale was completed on February 25, 2016 and the various SCC obligations insured by the Company were retired without a claim on the Company.

In addition, the Company has net par exposure of $5.1 billion to Commonwealththe general obligation bonds of Puerto Rico transactions,and various obligations of its related authorities and public corporations aggregating $4.8 billion , all of which are BIG. Puerto Rico has experienced significant general fund budget deficits in recent years. These deficits have been covered primarily withBeginning in 2016, the net proceeds of bond issuances, with interim financings provided by GDB and, in some cases, with one-time revenue measures or expense adjustment measures.Commonwealth has defaulted on obligations to make payments on its debt. In addition to high debt levels, Puerto Rico faces a challenging economic environment. Information regarding the Company's exposure to the Commonwealth of Puerto Rico and its related authorities and public corporations is set forth in "Insured Portfolio-Exposure to Puerto Rico" above.Part II, Item 8, Financial Statements and Supplementary Data, Note 4, Outstanding Exposure.

The terms of the Company’s CDS contracts generally are modified from standard CDS contract forms approved by ISDA in order to provide for payments on a scheduled "pay-as-you-go" basis and to replicate the terms of a traditional financial guaranty insurance policy. Some contracts the Company entered into as the credit protection seller, however, utilize standard ISDA settlement mechanics of cash settlement (i.e., a process to value the loss of market value of a reference obligation) or physical settlement (i.e., delivery of the reference obligation against payment of principal by the protection seller) in the event of a “credit event,” as defined in the relevant contract. Cash settlement or physical settlement generally requires the payment of a larger amount, prior to the maturity of the reference obligation, than would settlement on a “pay-as-you-go” basis, under which the Company would be required to pay scheduled interest shortfalls during the term of the reference obligation and scheduled principal shortfall only at the final maturity of the reference obligation.basis. As of December 31, 2015,2016, the Company was posting approximately $305$116 million to secure its obligations under CDS. Of that amount, approximately $282$100 million related to $3.6

120

Table of Contents

billion$516 million in CDS gross par insured where the amount of required collateral is capped and the remaining $23$16 million related to $221$174 million in CDS gross par insured where the amount of required collateral is based on movements in the mark-to-market valuation of the underlying exposure. In February 2017, the Company terminated its remaining CDS contracts with one of its counterparties as to which it has a cap on its posting requirement and relating to approximately $183 million gross par and $73 million of collateral posted, as December 31, 2016, and the collateral is being returned to the Company.

Consolidated Cash Flows
 
Consolidated Cash Flow Summary
 
 Year Ended December 31,
 2015 2014 2013
 (in millions)
Net cash flows provided by (used in) operating activities before effects of trading securities and FG VIEs consolidation$(103) $431
 $396
(Purchases) sales of trading securities, net8
 78
 (16)
Effect of FG VIEs consolidation43
 68
 (136)
Net cash flows provided by (used in) operating activities - reported(52) 577
 244
Net cash flows provided by (used in) investing activities before effects of FG VIEs consolidation823
 (423) 37
Effect of FG VIEs consolidation171
 327
 644
Net cash flows provided by (used in) investing activities - reported994
 (96) 681
Net cash flows provided by (used in) financing activities before effects of FG VIEs consolidation(633) (189) (367)
Effect of FG VIEs consolidation(214) (396) (511)
Net cash flows provided by (used in) financing activities - reported (1)(847) (585) (878)
Effect of exchange rate changes(4) (5) (1)
Cash at beginning of period75
 184
 138
Total cash at the end of the period$166
 $75
 $184
 Year Ended December 31,
 2016 2015 2014
 (in millions)
Net cash flows provided by (used in) operating activities before effects of FG VIE consolidation$(165) $(95) $509
Effect of FG VIE consolidation24
 43
 68
Net cash flows provided by (used in) operating activities - reported(141) (52) 577
Net cash flows provided by (used in) investing activities before effects of FG VIE consolidation489
 823
 (423)
Effect of FG VIE consolidation587
 171
 327
Net cash flows provided by (used in) investing activities - reported1,076
 994
 (96)
Net cash flows provided by (used in) financing activities before effects of FG VIE consolidation(367) (633) (189)
Effect of FG VIE consolidation(611) (214) (396)
Net cash flows provided by (used in) financing activities - reported (1)(978) (847) (585)
Effect of exchange rate changes(5) (4) (5)
Cash at beginning of period166
 75
 184
Total cash at the end of the period$118
 $166
 $75
____________________
(1)Claims paid on consolidated FG VIEs are presented in the consolidated cash flow statements as a component of paydowns on FG VIE liabilities in financing activities as opposed to operating activities.

Excluding net cash flows from purchasesFG VIE consolidation, cash outflows from operating activities increased in 2016 compared with 2015 due primarily to claim payments on Puerto Rico bonds, higher accelerated claim payments as a means of mitigating future losses and sales of the trading portfolio and the effect of consolidatinglower cash received from commutations.

Excluding net cash flows from FG VIEs,VIE consolidation, cash inflows from operating activities decreased in 2015 compared with 2014 due primarily to lower R&W cash recoveries in 2015 than the comparable prior year period.

Excluding net cash flows from purchases and sales of the trading portfolio and the effect of consolidating FG VIEs, cash inflows from operating activities increased in 2014 compared with 2013 due primarily to lower claims paid on losses (net of R&W recoveries) and cash received on commutation agreements, offset in part by (1) lower premiums and realized gains (losses) and other settlements on credit derivatives, net of commissions, (2) higher taxes and (3) interest payments.

Investing activities were primarily net sales (purchases) of fixed-maturity and short-term investment securities. Investing cash flows in 2016, 2015 2014 and 20132014 include inflows of $629 million, $400 million and $408 million and $663 million forfrom paydowns on FG VIE assets, respectively. The increase in inflows from FG VIEs respectively.in 2016 was due to the proceeds from a paydown of a large transaction. In 2016, the first quarterCompany paid $435 million, net of cash acquired, to acquire CIFGH. In 2015, the Company sold securities to fund the acquisition of Radian Asset by AGC. In the second quarter of 2015 the CompanyAGC and paid $800 million, net of cash acquired, to acquire Radian Asset. The 2013 amounts included proceeds from sales of third party surplus notes and other invested assets.
 
Financing activities consisted primarily of paydowns of FG VIE liabilities and share repurchases. Financing cash flows in 2016, 2015 2014 and 20132014 include outflows of $611 million, $214 million and $396 million and $511 million for FG VIEs, respectively. The increase in outflows from FG VIEs in 2016 was due to the paydown of a large transaction. In 2016, the Company paid $306 million to repurchase 10.7 million common shares; in 2015, the Company paid $555 million to repurchase 21.0 million common shares; and in 2014, the Company paid $590 million to repurchase 24.4 million common shares; and in 2013, the Company paid $264 million to repurchase 12.5 million common shares.

From January 1, 2016 through2017 through February 9, 2016,23, 2017, the Company repurchased an additional 2.33.6 million shares for $55 million and exhausted its previouscommon shares. As of February 23, 2017, the Company had remaining authorization to repurchasepurchase common shares. On February 24, 2016, the Board shares of Directors approved$407 million on a $250 million share repurchase authorization.settlement basis. For more information about the Company's share repurchase

121


authorizationrepurchases and the amounts it repurchased in 2015,authorizations, see Note 18, Shareholders' Equity, of thePart II, Item 8, Financial Statements and Supplementary Data.Data, Note 18, Shareholders' Equity.
 
Commitments and Contingencies
 
Leases
 
AGL and its subsidiaries are party to various lease agreements.office space and certain other items.

The principal executive offices of AGL and AG Re consist of approximately 8,250 square feet of office space located in Hamilton, Bermuda; the lease for this space expires in April 2021. AGM entered into an operating lease as of September 30, 2015 for new office space originally comprising one full floor and one partial floor at 1633 Broadway in New York City.  The Company plans to movemoved the principal place of business of AGM, AGC, MAC and the Company's other U.S. based subsidiaries from 31 West 52nd Street in New York City to this new location duringin the summerthird quarter of 2016. The new lease is for approximately 88,000 square feet and runs until 2032, with an option, subject to certain conditions, to renew for five years at a fair market rent. The fixed annual rent, which commences after an initial rent holiday, begins at $6.2 million, rising in two steps to $7.3 million for the last five years of the initial term.  In connection with the move and in return for rent abatement and certain other concessions, AGM agreed to terminate, eight months after its new space is delivered,terminated its lease on its existing office space at 31 West 52nd Street, which had been scheduled to run until 2026. On September 23, 2016, AGM entered into an amendment to its new lease to include the remaining portion of the partial floor for the remainder of the lease term. The fixed annual rent for the remaining portion of the partial floor, which commences after an initial rent holiday, begins at $1.1 million per annum, rising in two steps to $1.3 million for the last five years of the initial term. In addition, the Company leases office space in London and San Francisco, California. See “–Contractual Obligations” for lease payments due by period. Rent expense was $10.5$13.4 million in 2016, $10.5 million in 2015 and $10.1 million in 2014 and $9.9 million in 2013.2014.


122

Table of Contents

Long-Term Debt Obligations
 
The outstanding principal and interest paid on long-term debt were as follows:

Principal Outstanding
and Interest Paid on Long-Term Debt
 
Principal Amount Interest PaidPrincipal Amount Interest Paid
As of December 31, Year Ended December 31,As of December 31, Year Ended December 31,
2015 2014 2015 2014 20132016 2015 2016 2015 2014
(in millions)(in millions)
AGUS: 


7.0% Senior Notes(1)$200
 $200
 $14
 $14
 $14
5.0% Senior Notes(1)500
 500
 25
 13
 
7% Senior Notes(1)$200
 $200
 $14
 $14
 $14
5% Senior Notes(1)500
 500
 25
 25
 13
Series A Enhanced Junior Subordinated Debentures(2)150
 150
 10
 10
 10
150
 150
 10
 10
 10
Total AGUS850
 850
 49
 37
 24
850
 850
 49
 49
 37
AGMH(4): 


AGMH(3): 


67/8% QUIBS(1)
100
 100
 7
 7
 7
100
 100
 7
 7
 7
6.25% Notes(1)230
 230
 14
 14
 14
230
 230
 14
 14
 14
5.60% Notes(1)100
 100
 6
 6
 6
5.6% Notes(1)100
 100
 6
 6
 6
Junior Subordinated Debentures(2)300
 300
 19
 19
 19
300
 300
 19
 19
 19
Total AGMH730
 730
 46
 46
 46
730
 730
 46
 46
 46
AGM(3): 


AGM Notes Payable12
 16
 0
 3
 6
9
 12
 0
 0
 3
Total AGM12
 16
 0
 3
 6
9
 12
 0
 0
 3
Total$1,592
 $1,596
 $95
 $86
 $76
$1,589
 $1,592
 $95
 $95
 $86
 ____________________
(1)AGL fully and unconditionally guarantees these obligations

(2)Guaranteed by AGL on a junior subordinated basis.

(3)                                 Principal amounts vary from carrying amounts due primarily to acquisition method fair value adjustments at the AGMH acquisition date, which are accreted or amortized into interest expense over the remaining terms of these obligations.

7.0%7% Senior Notes issued by AGUS.  On May 18, 2004, AGUS issued $200 million of 7.0% senior notes7% Senior Notes due 2034 for net proceeds of $197 million. Although the coupon on the Senior Notes is 7.0%7%, the effective rate is approximately 6.4%, taking into account the effect of a cash flow hedge.
 

5.0%5% Senior Notes issued by AGUS. On June 20, 2014, AGUS issued $500 million of 5.0%5% Senior Notes due 2024 for net proceeds of $495 million. The notes are guaranteed by AGL. The net proceeds from the sale of the notes were used for general corporate purposes, including the purchase of common shares of AGL.

Series A Enhanced Junior Subordinated Debentures issued by AGUS.  On December 20, 2006, AGUS issued $150 million of Debentures due 2066. The Debentures pay a fixed 6.40%6.4% rate of interest until December 15, 2016, and thereafter pay a floating rate of interest, reset quarterly, at a rate equal to three month London Interbank Offered Rate ("LIBOR")(LIBOR) plus a margin equal to 2.38%. AGUS may select at one or more times to defer payment of interest for one or more consecutive periods for up to ten years. Any unpaid interest bears interest at the then applicable rate. AGUS may not defer interest past the maturity date.
 
6 7/8% QUIBS issued by AGMH.  On December 19, 2001, AGMH issued $100 million face amount of 6 7/8% QUIBS due December 15, 2101, which are callable without premium or penalty.
 
6.25% Notes issued by AGMH.  On November 26, 2002, AGMH issued $230 million face amount of 6.25% Notes due November 1, 2102, which are callable without premium or penalty in whole or in part.

123

Table of Contents

 
5.60%5.6% Notes issued by AGMH.  On July 31, 2003, AGMH issued $100 million face amount of 5.60%5.6% Notes due July 15, 2103, which are callable without premium or penalty in whole or in part.
 
Junior Subordinated Debentures issued by AGMH.  On November 22, 2006, AGMH issued $300 million face amount of Junior Subordinated Debentures with a scheduled maturity date of December 15, 2036 and a final repayment date of December 15, 2066. The final repayment date of December 15, 2066 may be automatically extended up to four times in five-year increments provided certain conditions are met. The debentures are redeemable, in whole or in part, at any time prior to December 15, 2036 at their principal amount plus accrued and unpaid interest to the date of redemption or, if greater, the make-whole redemption price. Interest on the debentures will accrue from November 22, 2006 to December 15, 2036 at the annual rate of 6.40%6.4%. If any amount of the debentures remains outstanding after December 15, 2036, then the principal amount of the outstanding debentures will bear interest at a floating interest rate equal to one-month LIBOR plus 2.215% until repaid. AGMH may elect at one or more times to defer payment of interest on the debentures for one or more consecutive interest periods that do not exceed ten years. In connection with the completion of this offering, AGMH entered into a replacement capital covenant for the benefit of persons that buy, hold or sell a specified series of AGMH long-term indebtedness ranking senior to the debentures. Under the covenant, the debentures will not be repaid, redeemed, repurchased or defeased by AGMH or any of its subsidiaries on or before the date that is twenty years prior to the final repayment date, except to the extent that AGMH has received proceeds from the sale of replacement capital securities. The proceeds from this offering were used to pay a dividend to the shareholders of AGMH.

Recourse Credit Facility
 
In connection with the acquisition of AGMH, AGM agreed to retain the risks relating to the debt and strip policy portions of the leveraged lease business. The liquidity risk to AGM related to the strip policy portion of the leveraged lease business iswas previously mitigated by the strip coverage facility described below.
 
In a leveraged lease transaction, a tax-exempt entity (such as a transit agency) transfers tax benefits to a tax-paying entity by transferring ownership of a depreciable asset, such as subway cars. The tax-exempt entity then leases the asset back from its new owner.
 
If the lease is terminated early, the tax-exempt entity must make an early termination payment to the lessor. A portion of this early termination payment is funded from monies that were pre-funded and invested at the closing of the leveraged lease transaction (along with earnings on those invested funds). The tax-exempt entity is obligated to pay the remaining, unfunded portion of this early termination payment (known as the “strip coverage”)strip coverage) from its own sources. AGM issued financial guaranty insurance policies (known as “strip policies”)strip policies) that guaranteed the payment of these unfunded strip coverage amounts to the lessor, in the event that a tax-exempt entity defaulted on its obligation to pay this portion of its early termination payment. Following such events, AGM can then seek reimbursement of its strip policy payments from the tax-exempt entity, and can also sell the transferred depreciable asset and reimburse itself from the sale proceeds.

Currently, all the leveraged lease transactions in which AGM acts as strip coverage provider are breaching a rating trigger related to AGM and are subject to early termination. However, early termination of a lease does not result in a draw on the AGM policy if the tax-exempt entity makes the required termination payment.Ifpayment. If all the leases were to terminate early and the tax-exempt entities do not make the required early termination payments, then AGM would be exposed to possible liquidity claims on gross exposure of approximately $1.1 billion$953 million as of December 31, 2015.2016. To date, none of the leveraged lease

transactions that involve AGM has experienced an early termination due to a lease default and a claim on the AGM policy. It is difficult to determine the probability that AGM will have to pay strip provider claims or the likely aggregate amount of such claims. At December 31, 2015,2016, approximately $1.4$1.5 billion of cumulative strip par exposure had been terminated since 2008 on a consensual basis. The consensual terminations have resulted in no claims on AGM.
 
On July 1, 2009, AGM and Dexia Crédit Local S.A., acting through its New York Branch (“Dexia(Dexia Crédit Local (NY)), entered into a credit facility (the “StripStrip Coverage Facility”)Facility). Under the Strip Coverage Facility, Dexia Crédit Local (NY) agreed to make loans to AGM to finance all draws made by lessors on AGM strip policies that were outstanding as of November 13, 2008, up to the commitment amount. The commitmentThere have never been any borrowings under the Strip Coverage Facility, the amount of the leveraged leases covered by the Strip Coverage Facility has declined since July 1, 2009 and, to date, none of the leveraged lease transactions in which AGM acts as the strip coverage provider has experienced an early termination due to a lease default. Consequently, and in view of the credit quality of the relevant tax-exempt entities and the cost of the Strip Coverage Facility, was $1 billion at closing of the Company's acquisition of AGMH. AGM has reduced the maximum commitment amount from time to time, after taking into account its experience with its exposure to leveraged lease transactions. Most recently, as of June 30, 2014, AGM reduced the maximum commitment amount to $495 million and agreed with Dexia Crédit Local (NY)Company determined that the commitment amount would no longer amortize on a scheduled monthly basis.

124

Table of Contents

Fundings under this facility are subject to certain conditions precedent, and their repayment is collateralized by a security interest that AGM granted to Dexia Crédit Local (NY) in amounts that AGM recovers – from the tax-
exempt entity, or from asset sale proceeds – following its payment of strip policy claims. On June 30, 2014, AGM and Dexia Crédit Local (NY) agreed to shorten the duration of the facility. Accordingly,maintaining the Strip Coverage Facility will terminate uponwas no longer warranted. On July 29, 2016, the earliest to occur of an AGM change of control,parties terminated the reduction of the commitment amount to $0 in accordance with the terms of the facility, and June 30, 2024 (rather than the original maturity date of January 31, 2042).
The Strip Coverage Facility’s financial covenants require that AGM and its subsidiaries maintain:Facility.

a maximum debt-to-capital ratio of 30%; and

a minimum net worth of 75% of consolidated net worth as of July 1, 2009, plus, beginning June 30, 2015 and on each anniversary of such date, an amount equal to the product of (i) 25% of the aggregate consolidated net income (or loss) for the period beginning July 2, 2009 and ending on June 30, 2014 and (ii) a fraction, the numerator of which is the commitment amount as of the relevant calculation date and the denominator of which is $1 billion.

The Company was in compliance with all financial covenants as of December 31, 2015.
The Strip Coverage Facility contains restrictions on AGM, including, among other things, in respect of its ability to incur debt, permit liens, pay dividends or make distributions, dissolve or become party to a merger or consolidation. Most of these restrictions are subject to exceptions. The Strip Coverage Facility has customary events of default, including (subject to certain materiality thresholds and grace periods) payment default, bankruptcy or insolvency proceedings and cross-default to other debt agreements.
As of December 31, 2015, no amounts were outstanding under this facility, nor have there been any borrowings during the life of this facility.
Committed Capital Securities
 
Each of AGC and AGM have issued $200 million of CCS pursuant to transactions in which AGC CCS or AGM’s Committed Preferred Trust Securities (the “AGM CPS”)AGM CPS), as applicable, were issued by custodial trusts created for the primary purpose of issuing such securities, investing the proceeds in high-quality assets and providing put options to AGC or AGM, as applicable. The put options allow AGC and AGM to issue non-cumulative redeemable perpetual preferred securities to the trusts in exchange for cash. For both AGC and AGM, four initial trusts were created, each with an initial aggregate face amount of $50 million. The Company does not consider itself to be the primary beneficiary of the trusts for either the AGC or AGM committed capital securitiesCCS and the trusts are not consolidated in Assured Guaranty's financial statements.

The trusts provide AGC and AGM access to new capital at their respective sole discretion through the exercise of the put options. Upon AGC's or AGM's exercise of its put option, the relevant trust will liquidate its portfolio of eligible assets and use the proceeds to purchase the AGC or AGM preferred stock, as applicable. AGC or AGM may use the proceeds from such sale of its preferred stock to the trusts for any purpose, including the payment of claims. The put agreements have no scheduled termination date or maturity. However, each put agreement will terminate if (subject to certain grace periods) specified events occur.

     AGC Committed Capital Securities. AGC entered into separate put agreements with four custodial trusts with respect to its committed capital securitiesCCS in April 2005. The AGC put options have not been exercised through the date of this filing. Initially, all of AGC committed capital securitiesCCS were issued to a special purpose pass-through trust (the “Pass-Through Trust”)Pass-Through Trust). The Pass-Through Trust was dissolved in April 2008 and the AGC committed capital securitiesCCS were distributed to the holders of the Pass-Through Trust's securities. Neither the Pass-Through Trust nor the custodial trusts are consolidated in the Company's financial statements.  Income distributions on the Pass-Through Trust securities and committed capital securitiesCCS were equal to an annualized rate of one-month LIBOR plus 110 basis points for all periods ending on or prior to April 8, 2008. Following dissolution of the Pass-Through Trust, distributions on the AGC committed capital securitiesCCS are determined pursuant to an auction process. On April 7, 2008 this auction process failed, thereby increasing the annualized rate on the AGC committed capital securitiesCCS to one-month LIBOR plus 250 basis points. Distributions on the AGC preferred stock will be determined pursuant to the same process. AGC continues to have the ability to exercise its put option and cause the related trusts to purchase AGC Preferred Stock.
 

125

Table of Contents

AGM Committed Capital Securities. AGM entered into separate put agreements with four custodial trusts with respect to its committed capital securitiesCCS in June 2003. The AGM put options have not been exercised through the date of this filing. AGM pays a floating put premium to the trusts, which represents the difference between the commercial paper yield and the winning auction rate (plus all fees and expenses of the trust). If an auction does not attract sufficient clearing bids, however, the auction rate is subject to a maximum rate of one-month LIBOR plus 200 basis points for the next succeeding distribution period. Beginning in August 2007, the AGM committed capital securitiesCCS required the maximum rate for each of the relevant trusts. AGM continues to have the ability to exercise its put option and cause the related trusts to purchase AGM Preferred Stock.


Contractual Obligations

The following table summarizes the Company's obligations under its contracts, including debt and lease obligations, and also includes estimated claim payments, based on its loss estimation process, under financial guaranty policies it has issued.

As of December 31, 2015As of December 31, 2016
Less Than
1 Year
 
1-3
Years
 
3-5
Years
 
After
5 Years
 Total
Less Than
1 Year
 
1-3
Years
 
3-5
Years
 
More Than
5 Years
 Total
(in millions)(in millions)
Long-term debt:        
7.0% Senior Notes$14
 $28
 $28
 $387
 $457
5.0% Senior Notes25
 50
 50
 588
 713
Long-term debt(1):        
7% Senior Notes$14
 $28
 $28
 $373
 $443
5% Senior Notes25
 50
 50
 563
 688
Series A Enhanced Junior Subordinated Debentures10
 19
 19
 591
 639
5
 11
 12
 443
 471
67/8% QUIBS
7
 14
 14
 657
 692
7
 14
 14
 650
 685
6.25% Notes14
 29
 29
 1,407
 1,479
14
 29
 29
 1,393
 1,465
5.60% Notes6
 11
 11
 563
 591
5.6 Notes6
 11
 11
 557
 585
Junior Subordinated Debentures19
 38
 38
 1,183
 1,278
19
 38
 38
 1,164
 1,259
Notes Payable4
 6
 1
 2
 13
4
 3
 1
 1
 9
Operating lease obligations(1)(2)4
 13
 16
 84
 117
6
 17
 17
 88
 128
Other compensation plans(3)17


 17
15


 15
Estimated financial guaranty claim payments(2)242
 348
 143
 2,165
 2,898
Estimated claim payments(4)231
 298
 65
 1,969
 2,563
Other15


 15
Total$362
 $556
 $349
 $7,627
 $8,894
$361
 $499
 $265
 $7,201
 $8,326
 ____________________
(1)Includes interest and principal payments. See Note 16, Long-Term Debt and Credit Facilities, in Part II, Item 8, Financial Statements and Supplementary Data for expected maturities of debt.

(2)Operating lease obligations exclude escalations in building operating costs and real estate taxes.

(2)(3)Financial guaranty claimAmount excludes approximately $56 million of liabilities under various supplemental retirement plans, which are fair valued and payable at the time of termination of employment by either employer or employee. Amount also excludes approximately $19 million of liabilities under Performance Retention Plan, which are payable at the time of vesting or termination of employment by either employer or employee. Given the nature of these awards, we are unable to determine the year in which they will be paid.

(4)Claim payments represent estimated undiscounted expected cash outflows under direct and assumed financial guaranty contracts, whether accounted for as insurance or credit derivatives, including claim payments under contracts in consolidated FG VIEs. The amounts presented are not reduced for cessions under reinsurance contracts. Amounts include any benefit anticipated from excess spread or other recoveries within the contracts but do not reflect any benefit for recoveries under breaches of R&W.

(3)Amount excludes approximately $55 million of liabilities under various supplemental retirement plans, which are fair valued and payable at the time of termination of employment by either employer or employee. Amount also excludes approximately $70 million of liabilities under AGL 2004 long term incentive plan, which are fair valued and payable at the time of vesting or termination of employment by either employer or employee. Given the nature of these awards, we are unable to determine the year in which they will be paid.

Investment Portfolio
 
The Company’s principal objectives in managing its investment portfolio are to support the highest possible ratings for each operating company; to manage investment risk within the context of the underlying portfolio of insurance risk; to maintain sufficient liquidity to cover unexpected stress in the insurance portfolio; and to maximize after-tax net investment income.


126


The Company’s fixed-maturity securities and short-term investments had a duration of 5.3 years as of December 31, 2016 and 5.4 years as of December 31, 2015 and 5.0 years as of December 31, 2014. Generally, the Company’s fixed-maturity securities are designated as available-for-sale. For more information about the Investment Portfolio and a detailed description of the Company’s valuation of investments see Part II, Item 8, Financial Statements and of the Company's assessment of other-than temporary impairments, seeSupplementary Data, Note 7, Fair Value Measurement and Note 10, Investments and Cash, of the Financial Statements and Supplementary Data.Cash.

Fixed-Maturity Securities and Short-Term Investments
by Security Type 

As of December 31, 2015 As of December 31, 2014As of December 31, 2016 As of December 31, 2015
Amortized
Cost
 
Estimated
Fair Value
 
Amortized
Cost
 
Estimated
Fair Value
Amortized
Cost
 
Estimated
Fair Value
 
Amortized
Cost
 
Estimated
Fair Value
(in millions)(in millions)
Fixed-maturity securities: 


Obligations of state and political subdivisions$5,528
 $5,841
 $5,416
 $5,795
$5,269
 $5,432
 $5,528
 $5,841
U.S. government and agencies377
 400
 635
 665
424
 440
 377
 400
Corporate securities1,505
 1,520
 1,320
 1,368
1,612
 1,613
 1,505
 1,520
Mortgage-backed securities(1):       
       
RMBS1,238
 1,245
 1,255
 1,285
998
 987
 1,238
 1,245
CMBS506
 513
 639
 659
575
 583
 506
 513
Asset-backed securities831
 825
 411
 417
835
 945
 831
 825
Foreign government securities290
 283
 296
 302
261
 233
 290
 283
Total fixed-maturity securities10,275
 10,627
 9,972
 10,491
9,974
 10,233
 10,275
 10,627
Short-term investments396
 396
 767
 767
590
 590
 396
 396
Total fixed-maturity and short-term investments$10,671
 $11,023
 $10,739
 $11,258
$10,564
 $10,823
 $10,671
 $11,023
 ____________________
(1)
Government-agency obligations were approximately 54%42% of mortgage backed securities as of December 31, 20152016 and 44%54% as of December 31, 20142015, based on fair value.
 

127


The following tables summarize, for all fixed-maturity securities in an unrealized loss position as of December 31, 20152016 and December 31, 20142015, the aggregate fair value and gross unrealized loss by length of time the amounts have continuously been in an unrealized loss position.

Fixed-Maturity Securities
Gross Unrealized Loss by Length of Time 
As of December 31, 20152016

Less than 12 months 12 months or more TotalLess than 12 months 12 months or more Total
Fair
Value
 
Unrealized
Loss
 
Fair
Value
 
Unrealized
Loss
 
Fair
Value
 
Unrealized
Loss
Fair
Value
 
Unrealized
Loss
 
Fair
Value
 
Unrealized
Loss
 
Fair
Value
 
Unrealized
Loss
(dollars in millions)(dollars in millions)
Obligations of state and political subdivisions$316
 $(10) $7
 $0
 $323
 $(10)$1,110
 $(38) $6
 $(1) $1,116
 $(39)
U.S. government and agencies77
 0
 
 
 77
 0
87
 (1) 
 
 87
 (1)
Corporate securities381
 (8) 95
 (15) 476
 (23)492
 (11) 118
 (20) 610
 (31)
Mortgage-backed securities:       
           
    
RMBS438
 (8) 90
 (14) 528
 (22)391
 (23) 94
 (15) 485
 (38)
CMBS140
 (2) 2
 0
 142
 (2)165
 (5) 
 
 165
 (5)
Asset-backed securities517
 (10) 
 
 517
 (10)36
 0
 0
 0
 36
 0
Foreign government securities97
 (4) 82
 (7) 179
 (11)44
 (5) 114
 (27) 158
 (32)
Total$1,966
 $(42) $276
 $(36) $2,242
 $(78)$2,325
 $(83) $332
 $(63) $2,657
 $(146)
Number of securities(1) 
 335
  
 71
  
 396
 
 622
  
 60
  
 676
Number of securities with other-than-temporary impairment 
 9
  
 4
  
 13
 
 8
  
 9
  
 17


Fixed-Maturity Securities
Gross Unrealized Loss by Length of Time 
As of December 31, 20142015

Less than 12 months 12 months or more TotalLess than 12 months 12 months or more Total
Fair
Value
 
Unrealized
Loss
 
Fair
Value
 
Unrealized
Loss
 
Fair
Value
 
Unrealized
Loss
Fair
Value
 
Unrealized
Loss
 
Fair
Value
 
Unrealized
Loss
 
Fair
Value
 
Unrealized
Loss
(dollars in millions)(dollars in millions)
Obligations of state and political subdivisions$64
 $0
 $25
 $(1) $89
 $(1)$316
 $(10) $7
 $0
 $323
 $(10)
U.S. government and agencies139
 0
 68
 (1) 207
 (1)77
 0
 
 
 77
 0
Corporate securities189
 (3) 104
 (2) 293
 (5)381
 (8) 95
 (15) 476
 (23)
Mortgage-backed securities: 


RMBS205
 (3) 159
 (18) 364
 (21)438
 (8) 90
 (14) 528
 (22)
CMBS36
 0
 19
 0
 55
 0
140
 (2) 2
 0
 142
 (2)
Asset-backed securities56
 (2) 18
 (1) 74
 (3)517
 (10) 
 
 517
 (10)
Foreign government securities108
 (2) 0
 0
 108
 (2)97
 (4) 82
 (7) 179
 (11)
Total$797
 $(10) $393
 $(23) $1,190
 $(33)$1,966
 $(42) $276
 $(36) $2,242
 $(78)
Number of securities(1) 
 125
  
 82
  
 198
 
 335
  
 71
  
 396
Number of securities with other-than-temporary impairment 
 3
  
 7
  
 10
 
 9
  
 4
  
 13
___________________
(1)The number of securities does not add across because lots consisting of the same securities have been purchased at different times and appear in both categories above (i.e., Lessless than 12 months and 12 months or more). If a security appears in both categories, it is counted only once in the Totaltotal column.


128

Table of Contents

Of the securities in an unrealized loss position for 12 months or more as of December 31, 2015, nine2016, 41 securities had an unrealized losslosses greater than 10% of book value. The total unrealized loss for these securities as of December 31, 2016 was $59 million. As of December 31, 2015, wasof the securities in an unrealized loss position for 12 months or more, nine securities had unrealized losses greater than 10% of book value with an unrealized loss of $26 million. The Company has determined that the unrealized losses recorded as of December 31, 2016 and December 31, 2015 arewere yield related and not the result of other-than-temporary impairment.other-than-temporary-impairment.

 
Changes in interest rates affect the value of the Company’s fixed-maturity portfolio. As interest rates fall, the fair value of fixed-maturity securities generally increases and as interest rates rise, the fair value of fixed-maturity securities generally decreases. The Company’s portfolio of fixed-maturity securities consists primarily of high-quality, liquid instruments.
 

The amortized cost and estimated fair value of the Company’s available-for-sale fixed-maturity securities, by contractual maturity, are shown below. Expected maturities will differ from contractual maturities because borrowers may have the right to call or prepay obligations with or without call or prepayment penalties.

Distribution of Fixed-Maturity Securities
by Contractual Maturity
As of December 31, 20152016  

Amortized
Cost
 
Estimated
Fair Value
Amortized
Cost
 
Estimated
Fair Value
(in millions)(in millions)
Due within one year$234
 $233
$482
 $550
Due after one year through five years1,911
 1,965
1,725
 1,727
Due after five years through 10 years2,169
 2,257
2,112
 2,155
Due after 10 years4,217
 4,414
4,082
 4,231
Mortgage-backed securities: 


RMBS1,238
 1,245
998
 987
CMBS506
 513
575
 583
Total$10,275
 $10,627
$9,974
 $10,233
 

The following table summarizes the ratings distributions of the Company’s investment portfolio as of December 31, 20152016 and December 31, 20142015. Ratings reflect the lower of the Moody’s and S&P classifications, except for bonds purchased for loss mitigation or other risk management strategies, which use Assured Guaranty’s internal ratings classifications.
 
Distribution of
Fixed-Maturity Securities by Rating
 
Rating As of
December 31, 2015
 As of
December 31, 2014
 As of
December 31, 2016
 As of
December 31, 2015
AAA 10.8% 14.0% 11.6% 10.8%
AA 59.0
 60.3
 54.8
 59.0
A 17.6
 17.9
 17.9
 17.6
BBB 0.9
 0.5
 1.9
 0.9
BIG(1) 11.4
 7.3
 13.5
 11.4
Not rated 0.3
 
 0.3
 0.3
Total 100.0% 100.0% 100.0% 100.0%
____________________
(1)Comprised primarily of loss mitigation and other risk management assets. See Part II, Item 8, Financial Statements and Supplementary Data, Note 10, Investments and Cash, of the Financial Statements and Supplementary Data.Cash.
 
The investment portfolio contains securities and cash that are either held in trust for the benefit of third party reinsurers in accordance with statutory requirements, invested in a guaranteed investment contract for future claims payments, placed on deposit to fulfill state licensing requirements, or otherwise restricted in the amount of $285 million and $283 million, and $236 millionbased on fair value, as of December 31, 20152016 and December 31, 2014, respectively, based on fair value.2015, respectively. The investment portfolio also contains securities that are held in trust by certain AGL subsidiaries for the benefit of other AGL subsidiaries in accordance with

129


statutory and regulatory requirements in the amount of $1,420 million and $1,411 million, and $1,395 millionbased on fair value, as of December 31, 20152016 and December 31, 2014, respectively, based on fair value.2015, respectively.

The fair value of the Company’s pledged securities to secure its obligations under its CDS exposure totaled $305$116 million and $376$305 million as of December 31, 20152016 and December 31, 2014,2015, respectively. In February 2017, the Company terminated substantially all of its remaining CDS contracts with one of its counterparties and all of the collateral that the Company had been posting to that counterparty is being returned to the Company. See Part II, Item 8, Financial Statements and Supplementary Data, Note 8, Contracts Accounted for as Credit Derivatives.

 
Liquidity Arrangements with respect to AGMH’s former Financial Products Business
 
AGMH’s former financial products segment had been in the business of borrowing funds through the issuance of GICs and medium term notes and reinvesting the proceeds in investments that met AGMH’s investment criteria. The financial products business also included the equity payment undertaking agreement portion of the leveraged lease business, as described further below in “—Leveraged Lease Business.”
 
The GIC Business
 
Until November 2008, AGMH, through its financial products business, offered GICs to municipalities and other market participants. The GICs were issued through certain non-insurance subsidiaries of AGMH. In return for an initial payment, each GIC entitles its holder to receive the return of the holder’s invested principal plus interest at a specified rate, and to withdraw principal from the GIC as permitted by its terms. AGM insures the payment obligations on all these GICs.
The proceeds of GICs were loaned to AGMH’s former subsidiary FSA Asset Management LLC ("FSAM")(FSAM). FSAM in turn invested these funds in fixed-income obligations (the “FSAM assets”)FSAM assets).
As of December 31, 2016, approximately 25% of the FSAM assets (measured by aggregate principal balance) were in cash or were obligations backed by the full faith and credit of the U.S. AGM’s insurance policies on the GICs remain in place, and must remain in place until each GIC is terminated, even though AGMH no longer holds any ownership interest in FSAM or the GIC issuers.
 
In June 2009, in connection with the Company's acquisition of AGMH from Dexia Holdings Inc., Dexia SA, the ultimate parent of Dexia Holdings Inc., and certain of its affiliates, entered into a number of agreements intended to mitigate the credit, interest rate and liquidity risks associated with the GIC business and the related AGM insurance policies. Some of those agreements have since terminated or expired, or been modified. In addition to the surviving agreements described below, AGM benefits from a guaranty jointly and severally issued by Dexia SA and Dexia Crédit Local S.A. to AGM that guarantees the payment obligations of AGM under its insurance policies related to the GIC business, and an indemnification agreement between AGM, Dexia SA and Dexia Crédit Local S.A. that protects AGM from other losses arising out of or as a result of the GIC business.
 
To support the primary payment obligations under the GICs, each of Dexia SA and Dexia Crédit Local S.A. are party to a put contract. Pursuant to the put contract, FSAM may put an amount of its FSAM assets to Dexia SA and Dexia Crédit Local S.A. in exchange for funds that FSAM would in turn make available to meet demands for payment under the GICs. The amount that could be put varies depending on the type of trigger event in question. To secure their obligations under this put contract, Dexia SA and Dexia Crédit Local S.A. are required to post eligible highly liquid collateral having an aggregate value (subject to agreed reductions and advance rates) equal to at least the excess of (i) the aggregate principal amount of all outstanding GICs over (ii) the aggregate mark-to-market value of FSAM’s assets.

As of December 31, 2015, approximately 27.6% of the FSAM assets (measured by aggregate principal balance) were in cash or were obligations backed by the full faith and credit of the United States.

As of December 31, 2015,2016, the aggregate accreted GIC balance was approximately $1.8$1.5 billion, compared with approximately $10.2 billion as of December 31, 2009. As of December 31, 2015, the aggregate accreted principal amount of FSAM assets was approximately $2.8 billion, the aggregate fair market value was approximately $2.6 billion and the aggregate market value after agreed upon reductions was approximately $1.8 billion. Cash and positive derivative value exceeded the negative derivative values and other projected costs by approximately $41 million. Accordingly, as of December 31, 20152016, the aggregate fair market value of the assets supporting the GIC business (disregarding the agreed upon reductions) plus cash and positive derivative value exceeded by nearly $0.9$0.8 billion the aggregate principal amount of all outstanding GICs and certain other business and hedging costs of the GIC business. Even after applying the agreed upon reductions to the fair market value of the assets, the aggregate value of the assets supporting the GIC business plus cash and positive derivative value exceeded the aggregate principal amount of all outstanding GICs and certain other business and hedging costs of the GIC business. Accordingly, no posting of collateral was required under the primary put contract.


130

Table of Contents

To provide additional support, Dexia Crédit Local S.A. provides a liquidity commitment to FSAM to lend against FSAM assets under a revolving credit agreement. As of December 31, 2015,2016, the commitment totaled $1.5$1.4 billion, of which approximately $1.0$0.8 billion was drawn. The agreement requires the commitment remain in place, generally until the GICs have been paid in full.

Despite the put contract and revolving credit agreement, and the significant portion of FSAM assets comprised of highly liquid securities backed by the full faith and credit of the United States, AGM remains subject to the risk that Dexia SA and its affiliates may not make payments or securities available (i) on a timely basis, which is referred to as “liquidity risk,” or (ii) at all, which is referred to as “credit risk,” because of the risk of default. Even if the Dexia entities have sufficient assets to pay all amounts when due (either under the GICs, or under the guarantee, the put contract and the revolving credit agreement), one or more rating agencies may view negatively the ability or willingness of Dexia SA and its affiliates to perform under their various agreements, which could negatively affect AGM’s ratings.
If Dexia SA or its affiliates do not fulfill their contractual obligations,obligations. In that case, the GIC issuers may not have the financial ability to pay upon the withdrawal of GIC funds or post collateral or make other payments in respect of the GICs, thereby resulting in claims upon the AGM financial guaranty insurance policies. If AGM is required to pay a claim due to a failure of the GIC issuers to pay amounts in respect of the GICs, AGM is subject to the risk that the GICs will not be paid from funds received from Dexia SA and its affiliates before it is required to make payment under its financial guaranty policies or that it will not receive the guaranty payment at all.
 
A downgrade of the financial strength rating of AGM could trigger a payment obligation of AGM in respect to AGMH's former GIC business. Most of the GICs insured by AGM allow for the withdrawal of GIC funds in the event of a downgrade of AGM, unless the relevant GIC issuer posts collateral or otherwise enhances its credit. Most GICs insured by AGM allow for the termination of the GIC contract and a withdrawal of GIC funds at the option of the GIC holder in the event of a downgrade of AGM below a specified threshold, generally below A- by S&P or A3 by Moody's, with no right of the GIC issuer to avoid such withdrawal by posting collateral or otherwise enhancing its credit. Each GIC contract stipulates the thresholds below which the GIC issuer must post eligible collateral, along with the types of securities eligible for posting and the collateralization percentage applicable to each security type. These collateralization percentages range from 100% of the GIC balance for cash posted as collateral to, typically, 108% for asset-backed securities. There areMoody's. FSAM is expected to behave sufficient eligible and liquid assets within the FSAM to satisfy any expected withdrawal and collateral posting obligations resulting from future rating actions affecting AGM.
 

The Medium Term Notes Business
 
In connection with the acquisition of AGMH, Dexia Crédit Local S.A. agreed to fund, on behalf of AGM, 100% of all policy claims made under financial guaranty insurance policies issued by AGM in relation to the medium term notes issuance program of FSA Global Funding Limited. Such agreement is set out in a Separation Agreement, dated as of July 1, 2009, between Dexia Crédit Local S.A., AGM, FSA Global Funding and Premier International Funding Co., and in a funding guaranty and a reimbursement guaranty that Dexia Crédit Local S.A. issued for the benefit of AGM. Under the funding guaranty, Dexia Crédit Local S.A. guarantees to pay to or on behalf of AGM amounts equal to the payments required to be made under policies issued by AGM relating to the medium term notes business. Under the reimbursement guaranty, Dexia Crédit Local S.A. guarantees to pay reimbursement amounts to AGM for payments it makes following a claim for payment under an obligation insured by a policy it has issued. Notwithstanding Dexia Crédit Local S.A.’s obligation to fund 100% of all policy claims under those policies, AGM has a separate obligation to remit to Dexia Crédit Local S.A. a certain percentage (ranging from 0% to 25%) of those policy claims. AGM, the Company and related parties are also protected against losses arising out of or as a result of the medium term note business through an indemnification agreement with Dexia Crédit Local S.A. As of December 31, 2015,2016, FSA Global Funding Limited had approximately $679$560 million of medium term notes outstanding.
 
Leveraged Lease Business
 
Under the Strip Coverage Facility entered into in connection with the acquisition of AGMH, Dexia Credit Local (NY) agreed to make loans to AGM to finance all draws made by lessors on certain AGM strip policies issued in connection with the leveraged lease business. AGM may request advances under the Strip Coverage Facility without any explicit limit on the number of loan requests, provided that the aggregate principal amount of loans outstanding as of the date of the request may not exceed the commitment amount. The leveraged lease business, the AGM strip policies and the Strip Coverage Facility (including the commitment amount) are described further under “Commitments"Commitments and Contingencies-Recourse Credit Facility" above. There have never been any borrowings under the Strip Coverage Facility, the amount of the leveraged leases covered by the Strip Coverage Facility has declined since July 1, 2009 and, to date, none of the leveraged lease transactions in which AGM acts as the strip coverage provider has experienced an early termination due to a lease default. Consequently, and in view of the credit quality of the relevant tax-exempt entities and the cost of the Strip Coverage Facility, the Company determined that maintaining the Strip Coverage Facility was no longer warranted. On July 29, 2016, the parties terminated the Strip Coverage Facility.


131

Table of Contents

ITEM 7A.QUANTITATIVE AND QUALITATIVE DISCLOSURES ABOUT MARKET RISK

Market risk is the risk of loss due to adverse changes in earnings, cash flow or fair value as a result of changes in the value of financial instruments.value. The Company's primary market risk exposures in respect of market risk sensitive instruments include interest rate risk, foreign currency exchange rate risk and credit spread risk. The Company's primary exposure to market risk is summarized below:

The fair value of credit derivatives within the financial guaranty portfolio of insured obligations which fluctuate based on changes in credit spreads of the underlying obligations and the Company's own credit spreads.

The Investment Portfolio's fair value of the investment portfolio is primarily driven by changes in interest rates and also affected by changes in credit spreads.

The Investment Portfolio alsofair value of the investment portfolio contains foreign denominated securities whose value fluctuates based on changes in foreign exchange rates.

PremiumsThe carrying value of premiums receivable include foreign denominated receivables whose carrying value fluctuates based on changes in foreign exchange rates.

The fair value of the assets and liabilities of consolidated FG VIE's may fluctuate based on changes in prepayment spreads, default rates, interest rates, and house price depreciation/appreciation. The fair value of the FG VIE liabilities would also fluctuate based on changes in the Company's credit spread.

Sensitivity of Credit Derivatives to Credit Risk

Unrealized gains and losses on credit derivatives are a function of changes in the estimated fair value of the Company's credit derivative contracts. If credit spreads of the underlying obligations change, the fair value of the related credit derivative changes. Market liquidity could also impact valuations of the underlying obligations. The Company considers the impact of its own credit risk, together with credit spreads on the risk that it insured through CDS contracts, in determining their fair value. The Company determines its own credit risk based on quoted CDS prices traded on the Company at each balance sheet date. The quoted price of five-year CDS contracts traded on AGC at December 31, 20152016 and December 31, 20142015 was 376158 bps and 323376 bps, respectively. The quoted price of five-year CDS contracts traded on AGM at December 31, 20152016 and December 31, 20142015 was 366158 bps and 325366 bps, respectively. Historically, the price of CDS traded on AGC and AGM moves directionally the same as general market spreads, although this may not always be the case. An overall narrowing of spreads generally results in an unrealized gain on credit derivatives for the Company, and an overall widening of spreads generally results in an unrealized loss for the Company. In certain circumstances, due to the fact that spread movements are not perfectly correlated, the narrowing or widening of the price of CDS traded on AGC and AGM can have a more significant financial statement impact than the changes in underlying collateral prices.

The impact of changes in credit spreads will vary based upon the volume, tenor, interest rates, and other market conditions at the time these fair values are determined. In addition, since each transaction has unique collateral and structural

terms, the underlying change in fair value of each transaction may vary considerably. The fair value of credit derivative contracts also reflects the change in the Company's own credit cost, based on the price to purchase credit protection on AGC and AGM.

The Company generally holds these credit derivative contracts to maturity. The unrealized gains and losses on derivative financial instruments will reduce to zero as the exposure approaches its maturity date, unless there is a payment default on the exposure or early termination. Given these facts, the Company does not actively hedge these exposures.

132


The following table summarizes the estimated change in fair values on the net balance of the Company’s credit derivative positions assuming immediate parallel shifts in credit spreads on AGC and AGM and on the risks that they both assume.

Effect of Changes in Credit Spread

 As of December 31, 2015 As of December 31, 2014 As of December 31, 2016 As of December 31, 2015
Credit Spreads(1) 
Estimated Net
Fair Value
(Pre-Tax)
 
Estimated Change
in Gain/(Loss)
(Pre-Tax)
 Estimated Net
Fair Value
(Pre-Tax)
 Estimated Change
in Gain/(Loss)
(Pre-Tax)
 
Estimated Net
Fair Value
(Pre-Tax)
 
Estimated Change
in Gain/(Loss)
(Pre-Tax)
 Estimated Net
Fair Value
(Pre-Tax)
 Estimated Change
in Gain/(Loss)
(Pre-Tax)
(in millions) (in millions)
100% widening in spreads100% widening in spreads$(742) $(377) $(1,821) $(926)100% widening in spreads$(791) $(402) $(742) $(377)
50% widening in spreads50% widening in spreads(554) (189) (1,358) (463)50% widening in spreads(590) (201) (554) (189)
25% widening in spreads25% widening in spreads(460) (95) (1,128) (233)25% widening in spreads(490) (101) (460) (95)
10% widening in spreads10% widening in spreads(403) (38) (989) (94)10% widening in spreads(430) (41) (403) (38)
Base ScenarioBase Scenario(365) 
 (895) 
Base Scenario(389) 
 (365) 
10% narrowing in spreads10% narrowing in spreads(330) 35
 (809) 86
10% narrowing in spreads(351) 38
 (330) 35
25% narrowing in spreads25% narrowing in spreads(277) 88
 (679) 216
25% narrowing in spreads(295) 94
 (277) 88
50% narrowing in spreads50% narrowing in spreads(190) 175
 (466) 429
50% narrowing in spreads(203) 186
 (190) 175
____________________
(1)Includes the effects of spreads on both the underlying asset classes and the Company's own credit spread.

Sensitivity of Investment Portfolio to Interest Rate Risk

Interest rate risk is the risk that financial instruments' values will change due to changes in the level of interest rates, in the spread between two rates, in the shape of the yield curve or in any other interest rate relationship. The Company is exposed to interest rate risk primarily in its investment portfolio. As interest rates rise for an available-for-sale investment portfolio, the fair value of fixed‑income securities generally decreases.decreases; as interests rates fall for an available-for-sale portfolio, the fair value of fixed-income securities generally increases. The Company's policy is generally to hold assets in the investment portfolio to maturity. Therefore, barring credit deterioration, interest rate movements do not result in realized gains or losses unless assets are sold prior to maturity. The Company does not hedge interest rate risk, however, interest rate fluctuation risk is managed through the investment guidelines which limit duration and prevent investment in high volatility sectors.

Interest rate sensitivity in the investment portfolio can be estimated by projecting a hypothetical instantaneous increase or decrease in interest rates. The following table presents the estimated pre-tax change in fair value of the Company's fixed-maturity securities and short-term investments from instantaneous parallel shifts in interest rates.

Sensitivity to Change in Interest Rates on the Investment Portfolio

Increase (Decrease) in Fair Value from Changes in Interest RatesIncrease (Decrease) in Fair Value from Changes in Interest Rates
300 Basis
Point
Decrease
 
200 Basis
Point
Decrease
 
100 Basis
Point
Decrease
 
100 Basis
Point
Increase
 
200 Basis
Point
Increase
 
300 Basis
Point
Increase
300 Basis
Point
Decrease
 
200 Basis
Point
Decrease
 
100 Basis
Point
Decrease
 
100 Basis
Point
Increase
 
200 Basis
Point
Increase
 
300 Basis
Point
Increase
(in millions)(in millions)
December 31, 2016$1,215
 $957
 $537
 $(528) $(1,063) $(1,578)
December 31, 2015$1,561
 $1,107
 $568
 $(557) $(1,094) $(1,607)1,561
 1,107
 568
 (557) (1,094) (1,607)
December 31, 20141,294
 942
 496
 (509) (1,016) (1,514)


Sensitivity of Other Areas to Interest Rate Risk

Insurance

Fluctuation in interest rates also affects the demand for the Company's product. When interest rates are lower or when the market is otherwise relatively less risk averse, the spread between insured and uninsured obligations typically narrows and, as a result, financial guaranty insurance typically provides lower cost savings to issuers than it would during periods of relatively wider spreads. These lower cost savings generally lead to a corresponding decrease in demand and premiums obtainable for financial guaranty insurance. Changes in interest rates also impact the amount of our losses and could impact the amount of infrastructure exposures that can be refinanced in the future. In addition, increases in prevailing interest rate levels can lead to a decreased volume of capital markets activity and, correspondingly, a decreased volume of insured transactions.


133

Table of Contents

In addition, fluctuations in interest rates also impact the performance of insured transactions where there are differences between the interest rates on the underlying collateral and the interest rates on the insured securities. For example, a rise in interest rates could increase the amount of losses the Company projects for certain RMBS, Triple-X life insurance securitizations, student loan transactions and TruPS CDOs. The impact of fluctuations in interest rates on such transactions varies, depending on, among other things, the interest rates on the underlying collateral and insured securities, the relative amounts of underlying collateral and liabilities, the structure of the transaction, and the sensitivity to interest rates of the behavior of the underlying borrowers and the value of the underlying assets.

In the case of RMBS, fluctuations in interest rates impact the amount of periodic excess spread, which is created when a trust’s assets produce interest that exceeds the amount required to pay interest on the trust’s liabilities.  There are several RMBS transactions in our insured portfolio which benefit from excess spread either by covering losses in a particular period, or reimbursing past claims under our policies. As of December 31, 2015,2016, the Company projects approximately $230$225 million of excess spread for all of its RMBS transactions over their remaining lives.

Since RMBS excess spread is determined by the relationship between interest rates on the underlying collateral and the trust’s certificates, it can be affected by unmatched moves in either of these interest rates.  Additionally, faster than expected prepayments can decrease the dollar amount of excess spread and therefore reduce the cash flow available to cover losses or reimburse past claims.  Further, modifications to underlying mortgage rates (e.g. rate reductions for troubled borrowers) can reduce excess spread since there would be no equivalent decrease in the certificate interest rates of the trust's certificates. Similarly, an upswing in short-term rates that increases the trust’s certificate interest rate that is not met with equal increases to the interest rates on the underlying mortgages can decrease excess spread.  These potential reductions in excess spread are mitigated by an interest rate cap, which goes into effect once the collateral rate falls below the stated certificate rate. Most of the RMBS securities we insure are capped at the collateral rate. The Company is not obligated to pay additional claims because the collateral interest rate drops below the trust's certificate stated interest rate, rather this just causes the Company to lose the benefit of potential positive excess spread.   

Interest Expense

Beginning in the fourth quarter of 2016, fluctuation in interest rates also impacts the Company’s interest expense. On December 15, 2016, the series A enhanced junior subordinated debentures issued by AGUS began to accrue interest at a floating rate, reset quarterly, equal to three month London Interbank Offered Rate (3-month LIBOR) plus a margin equal to 2.38% (prior to December 15, 2016, the debentures paid a fixed 6.4% rate of interest). The 3-month LIBOR rate used for the December 15, 2016 interest rate reset is 0.96%. Increases to 3-month LIBOR will cause the Company’s interest expense to rise while decreases to 3-month LIBOR will lower the Company’s interest expense. If 3-month LIBOR increases by 70%, the Company’s interest expense will increase by approximately $1 million. Conversely, if 3-month LIBOR decreases by 70%, the Company’s interest expense will decrease by approximately $1 million.

Sensitivity of Investment Portfolio to Foreign Exchange Rate Risk

Foreign exchange risk is the risk that a financial instrument's value will change due to a change in the foreign currency exchange rates. The Company has foreign denominated securities in its investment portfolio. Securities denominated in currencies other than U.S. Dollar were 4.9%4.7% and 4.0%4.9% of the fixed-maturity securities and short-term investments as of December 31, 20152016 and 2014,2015, respectively. The Company's material exposure is to changes in the dollar/pound sterling exchange rate. Changes in fair value of available-for-sale investments attributable to changes in foreign exchange rates are recorded in other comprehensive income.OCI.


Sensitivity to Change in Foreign Exchange Rates on the Investment Portfolio

Increase (Decrease) in Fair Value from Changes in Foreign Exchange RatesIncrease (Decrease) in Fair Value from Changes in Foreign Exchange Rates
30%
Decrease
 
20%
Decrease
 
10%
Decrease
 
10%
Increase
 
20%
Increase
 
30%
Increase
30%
Decrease
 
20%
Decrease
 
10%
Decrease
 
10%
Increase
 
20%
Increase
 
30%
Increase
(in millions)(in millions)
December 31, 2016$(153) $(102) $(51) $51
 $102
 $153
December 31, 2015$(163) $(108) $(54) $54
 $108
 $163
(163) (108) (54) 54
 108
 163
December 31, 2014(135) (90) (45) 45
 90
 135


Sensitivity of Premiums Receivable to Foreign Exchange Rate Risk

The Company has foreign denominated premium receivables. The Company's material exposure is to changes in dollar/Pound Sterlingpound sterling and dollar/Euroeuro exchange rates.


134

Table of Contents

Sensitivity to Change in Foreign Exchange Rates
on Premium Receivable, Net of Reinsurance

Increase (Decrease) in Premium Receivable from Changes in Foreign Exchange RatesIncrease (Decrease) in Premium Receivable from Changes in Foreign Exchange Rates
30%
Decrease
 
20%
Decrease
 
10%
Decrease
 
10%
Increase
 
20%
Increase
 
30%
Increase
30%
Decrease
 
20%
Decrease
 
10%
Decrease
 
10%
Increase
 
20%
Increase
 
30%
Increase
(in millions)(in millions)
December 31, 2016$(77) $(52) $(26) $26
 $52
 $77
December 31, 2015$(96) $(64) $(32) $32
 $64
 $96
(96) (64) (32) 32
 64
 96
December 31, 2014(95) (63) (32) 32
 63
 95


Sensitivity of FG VIE Assets and Liabilities to Market Risk

The fair value of the Company’s FG VIE assets is generally sensitive to changes related to estimated prepayment speeds; estimated default rates (determined on the basis of an analysis of collateral attributes such as: historical collateral performance, borrower profiles and other features relevant to the evaluation of collateral credit quality); discount rates implied by market prices for similar securities; and house price depreciation/appreciation rates based on macroeconomic forecasts. Significant changes to some of these inputs could materially change the market value of the FG VIE’s assets and the implied collateral losses within the transaction. In general, the fair value of the FG VIE asset is most sensitive to changes in the projected collateral losses, where an increase in collateral losses typically leads to a decrease in the fair value of FG VIE assets, while a decrease in collateral losses typically leads to an increase in the fair value of FG VIE assets. These factors also directly impact the fair value of the Company’s FG VIE liabilities.
 
The fair value of the Company’s FG VIE liabilities is generally sensitive to the various model inputs described above. In addition, the Company’s FG VIE liabilities with recourse are also sensitive to changes in the Company’s implied credit worthiness. Significant changes to any of these inputs could materially change the timing of expected losses within the insured transaction which is a significant factor in determining the implied benefit from the Company’s insurance policy guaranteeing the timely payment of principal and interest for the tranches of debt issued by the FG VIE that is insured by the Company. In general, extending the timing of expected loss payments by the Company into the future typically leads to a decrease in the value of the Company’s insurance and a decrease in the fair value of the Company’s FG VIE liabilities with recourse, while a shortening of the timing of expected loss payments by the Company typically leads to an increase in the value of the Company’s insurance and an increase in the fair value of the Company’s FG VIE liabilities with recourse.


135

Table of Contents

Item 8.    FINANCIAL STATEMENTS AND SUPPLEMENTARY DATA


136


Report of Independent Registered Public Accounting Firm

To the Board of Directors and Shareholders of Assured Guaranty Ltd.:

In our opinion, the accompanying consolidated balance sheets and the related consolidated statements of operations, of comprehensive income, of shareholders’ equity and of cash flows present fairly, in all material respects, the financial position of Assured Guaranty Ltd. and its subsidiaries at December 31, 20152016 and December 31, 2014,2015, and the results of their operations and their cash flows for each of the three years in the period ended December 31, 20152016 in conformity with accounting principles generally accepted in the United States of America. In addition, in our opinion, the Company maintained, in all material respects, effective internal control over financial reporting as of December 31, 2015,2016, based on criteria established in the 2013 Internal Control - Integrated Framework issued by the Committee of Sponsoring Organizations of the Treadway Commission (COSO). The Company's management is responsible for these financial statements, for maintaining effective internal control over financial reporting and for its assessment of the effectiveness of internal control over financial reporting, included in the accompanying Management's Report on Internal Control over Financial Reporting. Our responsibility is to express opinions on these financial statements and on the Company's internal control over financial reporting based on our integrated audits. We conducted our audits in accordance with the standards of the Public Company Accounting Oversight Board (United States). Those standards require that we plan and perform the audits to obtain reasonable assurance about whether the financial statements are free of material misstatement and whether effective internal control over financial reporting was maintained in all material respects. Our audits of the financial statements included examining, on a test basis, evidence supporting the amounts and disclosures in the financial statements, assessing the accounting principles used and significant estimates made by management, and evaluating the overall financial statement presentation. Our audit of internal control over financial reporting included obtaining an understanding of internal control over financial reporting, assessing the risk that a material weakness exists, and testing and evaluating the design and operating effectiveness of internal control based on the assessed risk. Our audits also included performing such other procedures as we considered necessary in the circumstances. We believe that our audits provide a reasonable basis for our opinions.

A company’s internal control over financial reporting is a process designed to provide reasonable assurance regarding the reliability of financial reporting and the preparation of financial statements for external purposes in accordance with generally accepted accounting principles. A company’s internal control over financial reporting includes those policies and procedures that (i) pertain to the maintenance of records that, in reasonable detail, accurately and fairly reflect the transactions and dispositions of the assets of the company; (ii) provide reasonable assurance that transactions are recorded as necessary to permit preparation of financial statements in accordance with generally accepted accounting principles, and that receipts and expenditures of the company are being made only in accordance with authorizations of management and directors of the company; and (iii) provide reasonable assurance regarding prevention or timely detection of unauthorized acquisition, use, or disposition of the company’s assets that could have a material effect on the financial statements.

Because of its inherent limitations, internal control over financial reporting may not prevent or detect misstatements. Also, projections of any evaluation of effectiveness to future periods are subject to the risk that controls may become inadequate because of changes in conditions, or that the degree of compliance with the policies or procedures may deteriorate.


/s/ PricewaterhouseCoopers LLP

New York, New York
February 26, 201624, 2017


137


Assured Guaranty Ltd.

Consolidated Balance Sheets
 
(dollars in millions except per share and share amounts)
 
As of
December 31, 2015
 As of
December 31, 2014
As of
December 31, 2016
 As of
December 31, 2015
Assets 


Investment portfolio: 


Fixed-maturity securities, available-for-sale, at fair value (amortized cost of $10,275 and $9,972)$10,627
 $10,491
Fixed-maturity securities, available-for-sale, at fair value (amortized cost of $9,974 and $10,275)$10,233
 $10,627
Short-term investments, at fair value396
 767
590
 396
Other invested assets169
 126
162
 169
Total investment portfolio11,192
 11,384
10,985
 11,192
Cash166
 75
118
 166
Premiums receivable, net of commissions payable693
 729
576
 693
Ceded unearned premium reserve232
 381
206
 232
Deferred acquisition costs114
 121
106
 114
Reinsurance recoverable on unpaid losses69
 78
80
 69
Salvage and subrogation recoverable126
 151
365
 126
Credit derivative assets81
 68
13
 81
Deferred tax asset, net276
 260
497
 276
Current income tax receivable40
 
12
 40
Financial guaranty variable interest entities’ assets, at fair value1,261
 1,402
876
 1,261
Other assets294
 270
317
 294
Total assets$14,544
 $14,919
$14,151
 $14,544
Liabilities and shareholders’ equity 


Unearned premium reserve$3,996
 $4,261
$3,511
 $3,996
Loss and loss adjustment expense reserve1,067
 799
1,127
 1,067
Reinsurance balances payable, net51
 107
64
 51
Long-term debt1,300
 1,297
1,306
 1,300
Credit derivative liabilities446
 963
402
 446
Current income tax payable
 5
Financial guaranty variable interest entities’ liabilities with recourse, at fair value1,225
 1,277
807
 1,225
Financial guaranty variable interest entities’ liabilities without recourse, at fair value124
 142
151
 124
Other liabilities272
 310
279
 272
Total liabilities8,481
 9,161
7,647
 8,481
Commitments and contingencies (See Note 15)


Common stock ($0.01 par value, 500,000,000 shares authorized; 137,928,552 and 158,306,661 shares issued and outstanding)1
 2
Common stock ($0.01 par value, 500,000,000 shares authorized; 127,988,230 and 137,928,552 shares issued and outstanding)1
 1
Additional paid-in capital1,342
 1,887
1,060
 1,342
Retained earnings4,478
 3,494
5,289
 4,478
Accumulated other comprehensive income, net of tax of $104 and $159237
 370
Accumulated other comprehensive income, net of tax of $70 and $104149
 237
Deferred equity compensation (320,193 and 320,193 shares)5
 5
5
 5
Total shareholders’ equity6,063
 5,758
6,504
 6,063
Total liabilities and shareholders’ equity$14,544
 $14,919
$14,151
 $14,544
 
The accompanying notes are an integral part of these consolidated financial statements.


138


Assured Guaranty Ltd.

Consolidated Statements of Operations
 
(dollars in millions except per share amounts)
 
Year Ended December 31,Year Ended December 31,
2015
2014
20132016
2015
2014
Revenues          
Net earned premiums$766
 $570
 $752
$864
 $766
 $570
Net investment income423
 403
 393
408
 423
 403
Net realized investment gains (losses): 


Other-than-temporary impairment losses(47) (76) (32)(47) (47) (76)
Less: portion of other-than-temporary impairment loss recognized in other comprehensive income0
 (1) 10
4
 0
 (1)
Net impairment loss(47) (75) (42)(51) (47) (75)
Other net realized investment gains (losses)21
 15
 94
22
 21
 15
Net realized investment gains (losses)(26) (60) 52
(29) (26) (60)
Net change in fair value of credit derivatives:          
Realized gains (losses) and other settlements(18) 23
 (42)29
 (18) 23
Net unrealized gains (losses)746
 800
 107
69
 746
 800
Net change in fair value of credit derivatives728
 823
 65
98
 728
 823
Fair value gains (losses) on committed capital securities27
 (11) 10
0
 27
 (11)
Fair value gains (losses) on financial guaranty variable interest entities38
 255
 346
38
 38
 255
Bargain purchase gain and settlement of pre-existing relationships214


259

214
 
Other income (loss)37
 14
 (10)39
 37
 14
Total revenues2,207
 1,994
 1,608
1,677
 2,207
 1,994
Expenses


Loss and loss adjustment expenses424
 126
 154
295
 424
 126
Amortization of deferred acquisition costs20
 25
 12
18
 20
 25
Interest expense101
 92
 82
102
 101
 92
Other operating expenses231
 220
 218
245
 231
 220
Total expenses776
 463
 466
660
 776
 463
Income (loss) before income taxes1,431
 1,531
 1,142
1,017
 1,431
 1,531
Provision (benefit) for income taxes 


Current75
 96
 157
117
 75
 96
Deferred300
 347
 177
19
 300
 347
Total provision (benefit) for income taxes375
 443
 334
136
 375
 443
Net income (loss)$1,056
 $1,088
 $808
$881
 $1,056
 $1,088
          
Earnings per share:          
Basic$7.12
 $6.30
 $4.32
$6.61
 $7.12
 $6.30
Diluted$7.08
 $6.26
 $4.30
$6.56
 $7.08
 $6.26
Dividends per share$0.48
 $0.44
 $0.40
$0.52
 $0.48
 $0.44
 
The accompanying notes are an integral part of these consolidated financial statements.
 

139


Assured Guaranty Ltd.

Consolidated Statements of Comprehensive Income
 
(in millions)
 
Year Ended December 31,Year Ended December 31,
2015 2014 20132016 2015 2014
Net income (loss)$1,056
 $1,088
 $808
$881
 $1,056
 $1,088
Unrealized holding gains (losses) arising during the period on: 


Investments with no other-than-temporary impairment, net of tax provision (benefit) of $(36), $80 and $(106)(93) 196
 (309)
Investments with other-than-temporary impairment, net of tax provision (benefit) of $(23), $(9) and $(17)(43) (20) (35)
Investments with no other-than-temporary impairment, net of tax provision (benefit) of $(34), $(36) and $80(71) (93) 196
Investments with other-than-temporary impairment, net of tax provision (benefit) of $(5), $(23) and $(9)(9) (43) (20)
Unrealized holding gains (losses) arising during the period, net of tax(136) 176
 (344)(80) (136) 176
Less: reclassification adjustment for gains (losses) included in net income (loss), net of tax provision (benefit) of $(7), $(21) and $5(10) (41) 14
Change in net unrealized gains on investments(126) 217
 (358)
Less: reclassification adjustment for gains (losses) included in net income (loss), net of tax provision (benefit) of $(10), $(7) and $(21)(16) (10) (41)
Change in net unrealized gains (losses) on investments(64) (126) 217
Other, net of tax provision(7) (7) 3
(24) (7) (7)
Other comprehensive income (loss)$(133) $210
 $(355)(88) (133) 210
Comprehensive income (loss)$923
 $1,298
 $453
$793
 $923
 $1,298
 
The accompanying notes are an integral part of these consolidated financial statements.
 

140


Assured Guaranty Ltd.

Consolidated Statements of Shareholders’ Equity
 
Years Ended December 31, 2015,2016, 20142015 and 20132014
 
(dollars in millions, except share data)
 
Common Shares Outstanding  Common Stock Par Value Additional
Paid-in
Capital
 Retained Earnings Accumulated
Other
Comprehensive Income
 Deferred
Equity Compensation
 Total
Shareholders’ Equity
Common Shares Outstanding  Common Stock Par Value Additional
Paid-in
Capital
 Retained Earnings Accumulated
Other
Comprehensive Income
 Deferred
Equity Compensation
 Total
Shareholders’ Equity
Balance at December 31, 2012194,003,297
  $2
 $2,724
 $1,749
 $515
 $4
 $4,994
Net income
  
 
 808
 
 
 808
Dividends ($0.40 per share)
  
 
 (75) 
 
 (75)
Common stock repurchases(12,512,759)  0
 (264) 
 
 
 (264)
Share-based compensation and other687,328
  0
 6
 
 
 1
 7
Other comprehensive income


 (355) 
 (355)
Balance at December 31, 2013182,177,866
  2
 2,466
 2,482
 160
 5
 5,115
182,177,866
  $2
 $2,466
 $2,482
 $160
 $5
 $5,115
Net income
  
 
 1,088
 
 
 1,088


 1,088
 
 
 1,088
Dividends ($0.44 per share)
  
 
 (76) 
 
 (76)
  
 
 (76) 
 
 (76)
Common stock repurchases(24,413,781)  0
 (590) 
 
 
 (590)(24,413,781)  0
 (590) 
 
 
 (590)
Share-based compensation and other542,576
  0
 11


 11
542,576
  0
 11


 11
Other comprehensive loss


 210
 
 210
Other comprehensive income


 210
 
 210
Balance at December 31, 2014158,306,661
  $2
 $1,887
 $3,494
 $370
 $5
 $5,758
158,306,661
  2
 1,887
 3,494
 370
 5
 5,758
Net income
  
 
 1,056
 
 
 1,056


 1,056
 
 
 1,056
Dividends ($0.48 per share)
  
 
 (72) 
 
 (72)
  
 
 (72) 
 
 (72)
Common stock repurchases(20,995,419)  (1) (554) 
 
 
 (555)(20,995,419)  (1) (554) 
 
 
 (555)
Share-based compensation and other617,310
  0
 9


 9
617,310
  0
 9


 9
Other comprehensive loss


 (133) 
 (133)


 (133) 
 (133)
Balance at December 31, 2015137,928,552
  $1
 $1,342
 $4,478
 $237
 $5
 $6,063
137,928,552
  $1
 $1,342
 $4,478
 $237
 $5
 $6,063
Net income
  
 
 881
 
 
 881
Dividends ($0.52 per share)
  
 
 (70) 
 
 (70)
Common stock repurchases(10,721,248)  0
 (306) 
 
 
 (306)
Share-based compensation and other780,926
  0
 24


 24
Other comprehensive loss


 (88) 
 (88)
Balance at December 31, 2016127,988,230
  $1
 $1,060
 $5,289
 $149
 $5
 $6,504

The accompanying notes are an integral part of these consolidated financial statements.


141


Assured Guaranty Ltd.
Consolidated Statements of Cash Flows
 (in millions)
 
Year Ended December 31,Year Ended December 31,
2015 2014 20132016 2015 2014
Operating Activities:          
Net Income$1,056
 $1,088
 $808
$881
 $1,056
 $1,088
Adjustments to reconcile net income to net cash flows provided by operating activities:          
Non-cash interest and operating expenses27
 23
 19
39
 27
 23
Net amortization of premium (discount) on investments(25) (16) (8)(34) (25) (16)
Provision (benefit) for deferred income taxes300
 347
 177
19
 300
 347
Net realized investment losses (gains)17
 60
 (52)29
 17
 60
Net unrealized losses (gains) on credit derivatives(746) (800) (107)(69) (746) (800)
Fair value losses (gains) on committed capital securities(27) 11
 (10)0
 (27) 11
Bargain purchase gain and settlement of pre-existing relationships(214) 
 
(259) (214) 
Change in deferred acquisition costs9
 3
 (8)9
 9
 3
Change in premiums receivable, net of premiums and commissions payable(8) 108
 86
128
 (8) 108
Change in ceded unearned premium reserve79
 69
 109
22
 79
 69
Change in unearned premium reserve(744) (332) (612)(777) (744) (332)
Change in loss and loss adjustment expense reserve, net244
 182
 136
(105) 244
 182
Change in current income tax(45) (45) 30
27
 (45) (45)
Change in financial guaranty variable interest entities' assets and liabilities, net(6) (170) (295)(24) (6) (170)
(Purchases) sales of trading securities, net8
 78
 (16)
 8
 78
Other23
 (29) (13)(27) 23
 (29)
Net cash flows provided by (used in) operating activities(52) 577
 244
(141) (52) 577
Investing activities 


Fixed-maturity securities: 


Purchases(2,577) (2,801) (1,886)(1,646) (2,577) (2,801)
Sales2,107
 1,251
 1,029
1,365
 2,107
 1,251
Maturities898
 877
 883
1,155
 898
 877
Net sales (purchases) of short-term investments897
 158
 (87)17
 897
 158
Net proceeds from paydowns on financial guaranty variable interest entities’ assets400
 408
 663
629
 400
 408
Acquisition of CIFG, net of cash acquired(435) 
 
Acquisition of Radian Asset, net of cash acquired(800) 
 

 (800) 
Other69
 11
 79
(9) 69
 11
Net cash flows provided by (used in) investing activities994
 (96) 681
1,076
 994
 (96)
Financing activities 


Dividends paid(72) (76) (75)(69) (72) (76)
Repurchases of common stock(555) (590) (264)(306) (555) (590)
Share activity under option and incentive plans(2) 1
 (1)10
 (2) 1
Net paydowns of financial guaranty variable interest entities’ liabilities(214) (396) (511)(611) (214) (396)
Net proceeds from issuance of long-term debt
 495


 495
Repayment of long-term debt(4) (19) (27)(2) (4) (19)
Net cash flows provided by (used in) financing activities(847) (585) (878)(978) (847) (585)
Effect of foreign exchange rate changes(4) (5) (1)(5) (4) (5)
Increase (decrease) in cash91
 (109) 46
(48) 91
 (109)
Cash at beginning of period75
 184
 138
166
 75
 184
Cash at end of period$166
 $75
 $184
$118
 $166
 $75
Supplemental cash flow information 


Cash paid (received) during the period for: 


Income taxes$103
 $122
 $110
$74
 $103
 $122
Interest$95
 $86
 $76
$95
 $95
 $86
The accompanying notes are an integral part of these consolidated financial statements.

142


Assured Guaranty Ltd.

Notes to Consolidated Financial Statements
 
December 31, 20152016, 20142015 and 20132014 

1.Business and Basis of Presentation
 
Business
 
Assured Guaranty Ltd. (“AGL”(AGL and, together with its subsidiaries, “Assured Guaranty”Assured Guaranty or the “Company”)Company) is a Bermuda-based holding company that provides, through its operating subsidiaries, credit protection products to the United States (“U.S.”(U.S.) and international public finance (including infrastructure) and structured finance markets. The Company applies its credit underwriting judgment, risk management skills and capital markets experience primarily to offer financial guaranty insurance that protects holders of debt instruments and other monetary obligations from defaults in scheduled payments. If an obligor defaults on a scheduled payment due on an obligation, including a scheduled principal or interest payment (“Debt Service”)(debt service), the Company is required under its unconditional and irrevocable financial guaranty to pay the amount of the shortfall to the holder of the obligation. The Company markets its financial guaranty insurance directly to issuers and underwriters of public finance and structured finance securities as well as to investors in such obligations. The Company guarantees obligations issued principally in the U.S. and the United Kingdom ("U.K."(U.K.), and also guarantees obligations issued in other countries and regions, including Australia and Western Europe. The Company also provides other forms of insurance that are in line with its risk profile and benefit from its underwriting experience.

In the past, the Company sold credit protection by issuing policies that guaranteed payment obligations under credit derivatives, primarily credit default swaps ("CDS")(CDS). Financial guaranty contractsContracts accounted for as credit derivatives are generally structured such that the circumstances giving rise to the Company’s obligation to make loss payments are similar to those for financial guaranty insurance contracts. The Company’s credit derivative transactions are governed by International Swaps and Derivative Association, Inc. (“ISDA”)(ISDA) documentation. The Company has not entered into any new CDS in order to sell credit protection in the U.S. since the beginning of 2009, when regulatory guidelines were issued that limited the terms under which such protection could be sold. The capital and margin requirements applicable under the Dodd-Frank Wall Street Reform and Consumer Protection Act also contributed to the Company not entering into such new CDS in the U.S. since 2009. The Company actively pursues opportunities to terminate existing CDS, which have the effect of reducing future fair value volatility in income and/or reducing rating agency capital charges.

Basis of Presentation
 
The consolidated financial statements have been prepared in conformity with accounting principles generally accepted in the United States of America (“GAAP”)(GAAP) and, in the opinion of management, reflect all adjustments that are of a normal recurring nature, necessary for a fair statement of the financial condition, results of operations and cash flows of the Company and its consolidated variable interest entities (“VIEs”)(VIEs) for the periods presented. The preparation of financial statements in conformity with GAAP requires management to make estimates and assumptions that affect the reported amounts of assets and liabilities and disclosure of contingent assets and liabilities as of the date of the financial statements and the reported amounts of revenues and expenses during the reporting period. Actual results could differ from those estimates.

The consolidated financial statements include the accounts of AGL, its direct and indirect subsidiaries, (collectively, the “Subsidiaries”)Subsidiaries), and its consolidated financial guaranty ("FG") VIEs. Intercompany accounts and transactions between and among all consolidated entities have been eliminated. Certain prior yearprior-year balances have been reclassified to conform to the current year's presentation.

The Company's principal insurance company subsidiaries are:

Assured Guaranty Municipal Corp. ("AGM")(AGM), domiciled in New York;
Municipal Assurance Corp. ("MAC")(MAC), domiciled in New York;
Assured Guaranty Corp. ("AGC")(AGC), domiciled in Maryland;
Assured Guaranty (Europe) Ltd. ("AGE")(AGE), organized in the United Kingdom;U.K.; and
Assured Guaranty Re Ltd. (“AG Re”)(AG Re) and Assured Guaranty Re Overseas Ltd (AGRO), domiciled in Bermuda.

The Company’s organizational structure includes various holding companies, two of which—Assured Guaranty USU.S. Holdings Inc. (“AGUS”)(AGUS) and Assured Guaranty Municipal Holdings Inc. (“AGMH”)(AGMH) – have public debt outstanding. See Note 16, Long-Term Debt and Credit Facilities.Facilities and Note 21, Subsidiary Information.

143


Significant Accounting Policies

The Company revalues assets, liabilities, revenue and expenses denominated in non-U.S. currencies into U.S. dollars using applicable exchange rates. Gains and losses relating to translating foreign functional currency financial statements for U.S. GAAP reporting are recorded in other comprehensive income (loss) ("OCI")(OCI). Gains and losses relating to transactions in foreign denominations in subsidiaries where the functional currency is the U.S. dollar, are reported in the consolidated statement of operations.

The chief operating decision maker manages the operations of the Company at a consolidated level. Therefore, all results of operations are reported as one segment.

Other significant accounting policies are included in the following notes.

Significant Accounting Policies

Acquisition of Radian Asset Assurance Inc.AcquisitionsNote 2
Expected loss to be paid (insurance, credit derivatives and FG VIE contracts)Note 5
Financial guarantyContracts accounted for as insurance (premium revenue recognition, loss and loss adjustment expense and policy acquisition cost)Note 6
Fair value measurementNote 7
Credit derivatives (at fair value)Note 8
Variable interest entities (at fair value)Note 9
Investments and cashNote 10
Income taxesNote 12
Earnings per shareNote 17
Stock based compensationNote 19


Future Application of Accounting Standards

Income Taxes

In October 2016, the Financial Accounting Standards Board (FASB) issued Accounting Standards Update (ASU) 2016-16, Income Taxes (Topic 740) - Intra-Entity Transfers of Assets Other Than Inventory, which removes the current prohibition against immediate recognition of the current and deferred income tax effects of intra-entity transfers of assets other than inventory.  Under the ASU, the selling (transferring) entity is required to recognize a current income tax expense or benefit upon transfer of the asset.  Similarly, the purchasing (receiving) entity is required to recognize a deferred tax asset or deferred tax liability, as well as the related deferred tax benefit or expense, upon receipt of the asset.  The ASU is effective for annual periods beginning after December 15, 2017, including interim periods within those annual periods, and early adoption is permitted.  The ASU’s amendments are to be applied on a modified retrospective basis recognizing the effects in retained earnings as of the beginning of the year of adoption.  The Company is currently evaluating the effect on its Consolidated Financial Statements of adopting this ASU.

Statement of Cash Flows

In November 2016, the FASB issued ASU 2016-18, Statement of Cash Flows (Topic 230): Restricted Cash (a consensus of the Emerging Issues Task Force), which addresses the presentation of changes in restricted cash and restricted cash equivalents in the statement of cash flows with the objective of reducing the existing diversity in practice. Under the ASU, entities are required to show the changes in the total of cash, cash equivalents, restricted cash and restricted cash equivalents in the statement of cash flows.  As a result, entities will no longer present transfers between cash and cash equivalents and restricted cash and restricted cash equivalents in the statement of cash flows.  When cash, cash equivalents, restricted cash and restricted cash equivalents are presented in more than one line item on the balance sheet, the ASU requires a reconciliation be presented either on the face of the statement of cash flows or in the notes to the financial statements showing the totals in the statement of cash flows to the related captions in the balance sheet. The ASU is effective for public business entities for fiscal years beginning after December 15, 2017, and interim periods within those fiscal years. Early adoption is permitted, including

adoption in an interim period. If the ASU is adopted in an interim period, any adjustments should be reflected as of the beginning of the fiscal year that includes that interim period. This ASU will not have a material impact on the Company’s Consolidated Statements of Cash Flows.

In August 2016, the FASB issued ASU 2016-15, Statement of Cash Flows (Topic 230): Classification of Certain Cash Receipts and Cash Payments (a consensus of the Emerging Issues Task Force), which addresses eight specific cash flow issues with the objective of reducing the existing diversity in practice. The issues addressed in the new guidance include debt prepayment or debt extinguishment costs, settlement of zero-coupon debt instruments, contingent consideration payments made after a business combination, proceeds from the settlement of insurance claims, proceeds from the settlement of corporate-owned life insurance policies, including bank-owned life insurance policies, distributions received from equity method investments, beneficial interests in securitization transactions and separately identifiable cash flows and application of the predominance principle. The amendments in this ASU are effective for public business entities for fiscal years beginning after December 15, 2017, and interim periods within those fiscal years. Early adoption is permitted, including adoption in an interim period. If an entity early adopts the amendments in an interim period, any adjustments should be reflected as of the beginning of the fiscal year that includes that interim period. An entity that elects early adoption must adopt all of the amendments in the same period. This ASU will not have a material impact on the Company’s Consolidated Statements of Cash Flows.

Credit Losses on Financial Instruments

In June 2016, the FASB issued ASU 2016-13, Financial Instruments - Credit Losses (Topic 326): Measurement of Credit Losses on Financial Instruments.  The amendments in this ASU are intended to improve financial reporting by requiring timelier recording of credit losses on loans and other financial instruments held by financial institutions and other organizations. The ASU requires the measurement of all expected credit losses for financial assets held at the reporting date based on historical experience, current conditions, and reasonable and supportable forecasts. Financial institutions will use forward-looking information to better inform their credit loss estimates as a result of the ASU. While many of the loss estimation techniques applied today will still be permitted, the inputs to those techniques will change to reflect the full amount of expected credit losses. The ASU requires enhanced disclosures to help investors and other financial statement users to better understand significant estimates and judgments used in estimating credit losses, as well as credit quality and underwriting standards of an organization’s portfolio. 

In addition, the ASU amends the accounting for credit losses on available-for-sale securities and purchased financial assets with credit deterioration. The ASU also eliminates the concept of “other than temporary” from the impairment model for certain available-for-sale securities. Accordingly, the ASU states that an entity must use an allowance approach, must limit the allowance to an amount at which the security’s fair value is less than its amortized cost basis, may not consider the length of time fair value has been less than amortized cost, and may not consider recoveries in fair value after the balance sheet date when assessing whether a credit loss exists. For purchased financial assets with credit deterioration, the ASU requires an entity’s method for measuring credit losses to be consistent with its method for measuring expected losses for originated and purchased non-credit-deteriorated assets.

The ASU is effective for fiscal years beginning after December 15, 2019, including interim periods within those fiscal years. For most debt instruments, entities will be required to record a cumulative-effect adjustment to the statement of financial position as of the beginning of the first reporting period in which the guidance is adopted.  The changes to the impairment model for available-for-sale securities and changes to purchased financial assets with credit deterioration are to be applied prospectively.  For the Company, this would be as of January 1, 2020.  Early adoption is permitted for fiscal years, and interim periods with those fiscal years, beginning after December 15, 2018.  The Company is currently evaluating the effect on its Consolidated Financial Statements of adopting this ASU.

Share-Based Payments

In March 2016, the FASB issued ASU 2016-09, Compensation - Stock Compensation (Topic 718) - Improvements to Employee Share-Based Payment, which simplifies several aspects of the accounting for employee share-based payment transactions, including the accounting for income taxes, forfeitures, and statutory tax withholding requirements, as well as classification in the statement of cash flows.  The new guidance will require all income tax effects of awards to be recognized in the income statement when the awards vest or are settled. It also will allow an employer to repurchase more of an employee’s shares than it can today for tax withholding purposes without triggering liability accounting and to make a policy election to account for forfeitures as they occur.  The ASU is effective for fiscal years beginning after December 15, 2016, including interim periods within those fiscal years, and early adoption is permitted.  The Company does not expect that the ASU will have a material effect on its Consolidated Financial Statements.


Leases

In February 2016, the FASB issued ASU 2016-02, Leases (Topic 842). This ASU requires lessees to present right-of-use assets and lease liabilities on the balance sheet. ASU 2016-02 is to be applied using a modified retrospective approach at the beginning of the earliest comparative period in the financial statements. The ASU is effective for fiscal years beginning after December 15, 2018, including interim periods within those fiscal years. Early adoption is permitted. The Company is evaluating the impact that this ASU will have on its Consolidated Financial Statements.

Financial Instruments

In January 2016, the Financial Accounting Standards Board ("FASB")FASB issued Accounting Standards Update ("ASU")ASU  2016-01, Financial Instruments - Overall (Subtopic 825-10) - Recognition and Measurement of Financial Assets and Financial Liabilities.  The amendments in this ASU are intended to make targeted improvements to GAAP by addressing certain aspects of recognition, measurement, presentation, and disclosure of financial instruments. One ofUnder the amendmentsASU, certain equity securities will need to be accounted for at fair value with changes in fair value recognized through net income.  Currently, the Company recognizes unrealized gains and losses for these securities in OCI. Another amendment pertains to liabilities that an entity has elected to measure at fair value in accordance with the fair value option for financial instruments. For these liabilities, the portion of fair value change related to credit risk will be separately presented in other comprehensive income.OCI.  Currently, the entire change in the fair value of these liabilities is reflected in the income statement. The Company elected the fair value option to account for its consolidated FG VIEs. FG VIE financial liabilities with recourse are sensitive to changes in the Company’s implied credit worthiness and will be impacted by the ASU. 

            The ASU is effective for fiscal years beginning after December 15, 2017, including interim periods within those fiscal years. Entities will be required to record a cumulative-effect adjustment to the statement of financial position as of the beginning of the fiscal year in which the guidance is adopted.  For the Company, this would be as of January 1, 2018.  Early adoption is permitted only for the amendment related to the change in presentation of financial liabilities that are fair valued using the fair value option. The Company is currently evaluating the effect of adopting this ASU on its Consolidated Financial Statements.

144


Short Duration Insurance Contracts

In May 2015, the FASB issued ASU 2015-09, Financial Services - Insurance (Topic 944) - Disclosures about Short-Duration Contracts. The primary objective of this ASU is to improve disclosures for insurance entities which issue short-duration contracts. The ASU 2015-09 will have no impact on the Company's financial statement disclosures. The ASU is effective for annual periods beginning after December 15, 2015, and interim periods within annual periods beginning after December 15, 2016.

Consolidation

In February 2015, the FASB issued ASU No. 2015-02, Consolidation (Topic 810): Amendments to the Consolidation Analysis, which is intended to improve certain areas of consolidation guidance for legal entities such as limited partnerships, limited liability companies, and securitization structures. The ASU will be effective on January 1, 2016. Early adoption is permitted, including adoption in an interim period. The Company does not expect that ASU 2015-02the amendment related to certain equity securities will have ana material effect on its Consolidated Financial Statements. Upon the adoption date, the Company will present the total change in credit risk for FG VIEs’ financial liabilities with recourse separately in OCI. 

2.Acquisitions

Consistent with one of its key business strategies of supplementing its book of business through acquisitions, the Company has acquired three financial guaranty companies since January 1, 2015, as described below.

CIFG Holding Inc.
On July 1, 2016, AGC acquired all of the issued and outstanding capital stock of CIFG Holding Inc. (together with its subsidiaries CIFGH), the parent of financial guaranty insurer CIFG Assurance North America, Inc. (CIFGNA), (the CIFG Acquisition), for $450.6 million in cash. AGUS previously owned 1.6% of the outstanding shares of CIFGH, for which it received $7.1 million in consideration from AGC, resulting in a net consolidated purchase price of $443 million. AGC merged CIFGNA with and into AGC, with AGC as the surviving company, on July 5, 2016. The CIFG Acquisition added $4.2 billion of net par insured on July 1, 2016.

At the time of the CIFG Acquisition, CIFGNA had a subsidiary financial guaranty company domiciled in France, CIFG Europe S.A. (CIFGE), which had been put into run-off and surrendered its licenses. CIFGNA had reinsured all of CIFGE’s outstanding financial guaranty business and also had issued a “second-to-pay policy” pursuant to which CIFGNA guaranteed the full and complete payment of any shortfall in amounts due from CIFGE on its insured portfolio; AGC assumed these obligations as part of the CIFGNA merger with and into AGC. CIFGE remains a separate subsidiary in runoff, now owned by AGC. As of December 31, 2016, CIFGE had investment assets of $41 million and gross par exposure of $694 million, and is not currently expected to pay dividends.

The CIFG Acquisition was accounted for under the acquisition method of accounting which requires that the assets and liabilities acquired be recorded at fair value. The Company exercised significant judgment to determine the fair value of the assets it acquired and liabilities it assumed in the CIFG Acquisition. The most significant of these determinations related to the valuation of CIFGH's financial guaranty insurance and credit derivative contracts. On an aggregate basis, CIFGH's contractual premiums for financial guaranty contracts were less than the premiums a market participant of similar credit quality would demand to acquire those contracts at the date of the CIFG Acquisition (the CIFG Acquisition Date), particularly for below-investment-grade transactions, resulting in a significant amount of the purchase price being allocated to these contracts. For information on the methodology the Company used to measure the fair value of assets it acquired and liabilities it assumed in

the CIFG Acquisition, including financial guaranty insurance and credit derivative contracts, please refer to Note 7, Fair Value Measurement.

The fair value of the Company's stand-ready obligation on the CIFG Acquisition Date is recorded in unearned premium reserve. After the CIFG Acquisition Date, loss reserves and loss and loss adjustment expenses (LAE) will be recorded when the expected losses for each contract exceeds the remaining unearned premium reserve, in accordance with the Company's accounting policy described in Note 6, Contracts Accounted for as Insurance. The expected losses acquired by the Company as part of the CIFG Acquisition are included in the description of expected losses to be paid under Note 5, Expected Losses to be Paid.

The excess of the fair value of net assets acquired over the consideration transferred was recorded as a bargain purchase gain in "bargain purchase gain and settlement of pre-existing relationships" in net income. In addition, the Company and CIFGH had pre-existing reinsurance relationships, which were also effectively settled at fair value on the CIFG Acquisition Date. The loss on settlement of these pre-existing reinsurance relationships represents the net difference between the historical assumed balances that were recorded by AGC and the fair value of ceded balances acquired from CIFGH. The Company believes the bargain purchase gain resulted from the nature of the financial guaranty business and the desire of investors in CIFGH to monetize their investments in CIFGH. The bargain purchase gain reflects the fair value of CIFGH’s assets and liabilities, as well as tax attributes that were recorded in deferred taxes comprising net operating losses (after Internal Revenue Code change in control provisions) and other temporary book-to-tax differences for which CIFGH had recorded a full valuation allowance.


The following table shows the net effect of the CIFG Acquisition, including the effects of the settlement of pre-existing relationships.

 Fair Value of Net Assets Acquired, before Settlement of Pre-existing Relationships Net effect of Settlement of Pre-existing Relationships Net Effect of CIFG Acquisition
 (in millions)
Cash Purchase Price (1)$443
 $
 $443
      
Identifiable assets acquired:     
Investments770
 
 770
Cash8
 
 8
Premiums receivable, net of commissions payable18
 
 18
Ceded unearned premium reserve173
 (173) 
Deferred acquisition costs1
 (1) 
Salvage and subrogation recoverable23
 
 23
Credit derivative assets1
 
 1
Deferred tax asset, net194
 34
 228
Other assets4
 
 4
Total assets1,192
 (140) 1,052
  
    
Liabilities assumed:     
Unearned premium reserves306
 (10) 296
Loss and loss adjustment expense reserve1
 (66) (65)
Credit derivative liabilities68
 0
 68
Other liabilities17
 
 17
Total liabilities392
 (76) 316
Net asset effect of CIFG Acquisition800
 (64) 736
Bargain purchase gain and settlement of pre-existing relationships resulting from CIFG Acquisition, after-tax357
 (64) 293
Deferred tax
 (34) (34)
Bargain purchase gain and settlement of pre-existing relationships resulting from CIFG Acquisition, pre-tax$357
 $(98) $259
_____________________
(1)The cash purchase price of Radian Asset Assurance Inc.$443 million represents the cash transferred for the acquisition which was allocated as follows: (1) $270 million for the purchase of net assets of $627 million, and (2) the settlement of pre-existing relationships between CIFGH and Assured Guaranty at a fair value of $173 million.

Revenue and net income related to CIFGH from the CIFG Acquisition Date through December 31, 2016 included in the consolidated statement of operations were approximately $307 million and $323 million, respectively. For 2016, the Company recognized transaction expenses related to the CIFG Acquisition. These expenses were primarily driven by the fees paid to the Company's legal and financial advisors and to the Company's independent auditor.

CIFG Acquisition-Related Expenses

 Year Ended December 31, 2016
 (in millions)
Professional services$2
Financial advisory fees4
Total$6


The Company has determined that the presentation of pro-forma information is impractical for the CIFG Acquisition as historical financial records are not available on a U.S. GAAP basis.

Radian Asset Assurance Inc.

On April 1, 2015 (“(Radian Acquisition Date”)Date), AGC completed the acquisition (“Radian(Radian Asset Acquisition”)Acquisition) of all of the issued and outstanding capital stock of financial guaranty insurer Radian Asset Assurance Inc. (“Radian Asset”)(Radian Asset) for $804.5 million; the cash consideration was paid from AGC's available funds and from the proceeds of a $200 million loan from AGC’s direct parent, AGUS. AGC repaid the loan in full to AGUS on April 14, 2015. Radian Asset was merged with and into AGC, with AGC as the surviving company of the merger. The Radian Asset Acquisition added $13.6 billion to the Company's net par outstanding on April 1, 2015, and is consistent with one of the Company's key business strategies of supplementing its book of business through acquisitions.2015.

The Radian Asset Acquisition was accounted for under the acquisition method of accounting which required that the assets and liabilities acquired be recorded at fair value. The Company was required to exercise significant judgment to determine the fair value of the assets it acquired and liabilities it assumed in the Radian Asset Acquisition. The most significant of these determinations related to the valuation of Radian Asset's financial guaranty insurance and credit derivative contracts. On an aggregate basis, Radian Asset’s contractual premiums for financial guaranty contracts were less than the premiums a market participant of similar credit quality would demand to acquire those contracts at the Radian Acquisition Date, particularly for below-investment-grade ("BIG")(BIG) transactions, resulting in a significant amount of the purchase price being allocated to these contracts. For information on the methodology the Company used to measure the fair value of assets it acquired and liabilities it assumed in the Radian Asset Acquisition, including financial guaranty insurance and credit derivative contracts, please refer to Note 7, Fair Value Measurement.

The fair value of the Company's stand-ready obligation for financial guaranty insurance contracts on the Radian Acquisition Date is recorded in unearned premium reserve (please refer to Note 6, Financial GuarantyContracts Accounted for as Insurance for additional information on stand-ready obligation). At the Radian Acquisition Date, the fair value of each financial guaranty insurance contract acquired was in excess of the expected losses for each contract and therefore no explicit loss reserves were recorded on the Radian Acquisition Date. Loss reserves and loss and loss adjustment expenses ("LAE")LAE are recorded when the expected losses for each contract exceeds the remaining unearned premium reserve, in accordance with the Company's accounting policy described in Note 6, Financial GuarantyContracts Accounted for as Insurance. The expected losses assumed by the Company as part of the Radian Asset Acquisition are included in the description of expected losses to be paid under Note 5, Expected Loss to be Paid.

The excess of the fair value of net assets acquired over the consideration transferred was recorded as a bargain purchase gain in "bargain purchase gain and settlement of pre-existing relationships" in net income. In addition, the Company and Radian Asset had pre-existing reinsurance relationships, which were effectively settled at fair value on the Radian Acquisition Date. The gain on settlement of these pre-existing reinsurance relationships primarily represents the net difference between the historical ceded balances that were recorded by AGM and the fair value of assumed balances acquired from Radian Asset. The Company believes the bargain purchase resulted from the announced desire of Radian Guaranty Inc. to focus its business strategy on the mortgage and real estate markets and to monetize its investment in Radian Asset and thereby accelerate its ability to comply with the financial requirements of the final Private Mortgage Insurer Eligibility Requirements.


145


The following table shows the net effect of the Radian Asset Acquisition at the Radian Acquisition Date, including the effects of the settlement of pre-existing relationships.

 Fair Value of Net Assets Acquired, before Settlement of Pre-existing Relationships Net effect of Settlement of Pre-existing Relationships Net Effect of Radian Asset Acquisition
 (in millions)
Cash purchase price(1)$804
 $
 $804
Identifiable assets acquired:     
Investments1,473
 
 1,473
Cash4
 
 4
Ceded unearned premium reserve(3) (65) (68)
Credit derivative assets30
 
 30
Deferred tax asset, net263
 (56) 207
Financial guaranty variable interest entities’ assets122
 
 122
Other assets86
 (67) 19
Total assets1,975
 (188) 1,787
  
    
Liabilities assumed:     
Unearned premium reserves697
 (216) 481
Credit derivative liabilities271
 (26) 245
Financial guaranty variable interest entities’ liabilities118
 
 118
Other liabilities30
 (49) (19)
Total liabilities1,116
 (291) 825
Net asset effect of Radian Asset Acquisition859
 103
 962
Bargain purchase gain and settlement of pre-existing relationships resulting from Radian Asset Acquisition, after-tax55
 103
 158
Deferred tax
 56
 56
Bargain purchase gain and settlement of pre-existing relationships resulting from Radian Asset Acquisition, pre-tax$55
 $159
 $214
_____________________
(1)The cash purchase price of $804 million was the cash transferred for the acquisition which was allocated as follows: (1) $987 million for the purchase of net assets of $1,042 million, and (2) the settlement of pre-existing relationships between Radian Asset and Assured Guaranty at a fair value of $(183) million.
       
Revenue and net income related to Radian Asset from the Radian Acquisition Date through December 31, 2015 included in the consolidated statement of operations were approximately $560 million and $366 million, respectively. In 2015, the Company recorded transaction expenses related to the Radian Asset Acquisition in net income as part of other operating expenses. These expenses were primarily driven by the fees paid to the Company's legal and financial advisors and to the Company's independent auditor.

Radian Asset Acquisition-Related Expenses

 Year Ended December 31, 2015
 (in millions)
Professional services$2
Financial advisory fees10
Total$12


146


Unaudited Pro Forma Results of Operations

The following unaudited pro forma information presents the combined results of operations of Assured Guaranty and Radian Asset as if the acquisition had been completed on January 1, 2014, as required under GAAP. The pro forma accounts include the estimated historical results of the Company and Radian Asset and pro forma adjustments primarily comprising the earning of the unearned premium reserve and the expected losses that would be recognized in net income for each prior period presented, as well as the accounting for bargain purchase gain, settlement of pre-existing relationships and Radian Asset acquisition related expenses, all net of tax at the applicable statutory rate.

The unaudited pro forma combined financial information is presented for illustrative purposes only and does not indicate the financial results of the combined company had the companies actually been combined as of January 1, 2014, nor is it indicative of the results of operations in future periods.

Unaudited Pro Forma Results of Operations

Year Ended December 31, 2015 Year Ended December 31, 2014Year Ended December 31, 2015 Year Ended December 31, 2014
(in millions, except per share amounts)(in millions, except per share amounts)
Pro forma revenues$2,030
 $2,501
$2,030
 $2,501
Pro forma net income922
 1,531
922
 1,531
Pro forma earnings per share ("EPS"):   
Pro forma earnings per share (EPS):   
Basic6.22
 8.86
6.22
 8.86
Diluted6.18
 8.81
6.18
 8.81

MBIA UK Insurance Limited

On January 10, 2017, AGL announced that its subsidiary AGC completed its acquisition of MBIA UK Insurance Limited (MBIA UK), the European operating subsidiary of MBIA Insurance Corporation (MBIA), in accordance with the agreement announced on September 29, 2016. As consideration for the outstanding shares of MBIA UK plus $23 million in cash, AGC exchanged all its holdings of notes issued in the Zohar II 2005-1 transaction. AGC’s Zohar II 2005-1 notes had a total outstanding principal of approximately $347 million and fair value of $334 million as of the date of acquisition. MBIA insured all of the notes issued in the Zohar II 2005-1 transaction. As of December 31, 2016, MBIA UK had an insured portfolio of approximately $12 billion of net par.

MBIA UK has been renamed Assured Guaranty (London) Ltd. (AGLN). Assured Guaranty currently maintains AGLN as a stand-alone entity. Assured Guaranty is actively working to combine AGLN with its other affiliated European insurance companies. Any such combination will be subject to regulatory and court approvals; as a result, Assured Guaranty cannot predict when, or if, such a combination will be completed.

The Company is in the process of allocating the purchase price to the assets acquired and liabilities assumed and conforming accounting policies but has not yet completed the acquisition date balance sheet. The Company intends to include this information in its first quarter 2017 Form 10-Q.

3.Rating Actions

When a rating agency assigns a public rating to a financial obligation guaranteed by one of AGL’s insurance company subsidiaries, it generally awards that obligation the same rating it has assigned to the financial strength of the AGL subsidiary that provides the guaranty. Investors in products insured by AGL’s insurance company subsidiaries frequently rely on ratings published by the rating agencies because such ratings influence the trading value of securities and form the basis for many institutions’ investment guidelines as well as individuals’ bond purchase decisions. Therefore, the Company manages its business with the goal of achieving strong financial strength ratings. However, the methodologies and models used by rating agencies differ, presenting conflicting goals that may make it inefficient or impractical to reach the highest rating level. The methodologies and models are not fully transparent, contain subjective elements and data (such as assumptions about future market demand for the Company’s products) and change frequently.may change. Ratings are subject to continuous review and revision or withdrawal at any time. If the financial strength ratings of one (or more) of the Company’s insurance subsidiaries were reduced below current levels, the Company expects it could have adverse effects on the impacted subsidiary's future business opportunities as well as the premiums the impacted subsidiary could charge for its insurance policies.     

    
The Company periodically assesses the value of each rating assigned to each of its companies, and may as a result of such assessment may request that a rating agency add or drop a rating from certain of its companies. For example, the Kroll Bond Rating Agency ("KBRA")(KBRA) ratings were first assigned to MAC in 2013, and to AGM in 2014, and to AGC in 2016, while the A.M. Best Company, Inc. ("Best")(Best) rating was first assigned to Assured Guaranty Re Overseas Ltd. ("AGRO")(AGRO) in 2015, whileand a Moody's Investors Service, Inc. ("Moody's")(Moody's) rating was never requested for MAC and was dropped from AG Re and AGRO in 2015. On January 13, 2017, AGC announced that it had requested that Moody's withdraw its financial strength rating of AGC.

In the last several years, S&P Global Ratings, a division of Standard & Poor's RatingsFinancial Services ("S&P")LLC (S&P) and Moody's have changed, multiple times, their financial strength ratings of AGL's insurance subsidiaries, or changed the outlook on such ratings. More recently, KBRA and Best have assigned financial strength ratings to some of AGL's insurance subsidiaries. The rating agencies' most recent actions related to AGL's insurance subsidiaries are:

On March 18, 2014, S&P upgradedSeptember 20, 2016, KBRA assigned a financial strength rating of AA (stable outlook) to AGC. On December 14, 2016 and July 8, 2016, KBRA affirmed the AA+ (stable outlook) financial strength ratings of all of AGL's insurance subsidiaries to AA (stable outlook) from AA- (stable outlook); it most recently affirmed such ratings in a credit analysis issued on June 29, 2015.AGM and MAC, respectively.

On July 2, 2014,August 8, 2016, Moody's affirmed the ratings of AGL’s insurance subsidiaries, but changed to negative the outlook of the insurance financial strength ratings of AGC and its subsidiary Assured Guaranty (UK) Ltd. ("AGUK"). Moody's

147


adopted changes to its credit methodology for financial guaranty insurance companies on January 20, 2015 and, on February 18, 2015, Moody's published a credit opinion maintaining its existing ratings of AGL and its subsidiaries under that new methodology. On December 8, 2015 Moody's published credit opinions maintaining its existing insurance financial strength ratings of A2 (stable outlook) on AGM and AGE and A3 (negative outlook)insurance financial strength rating on AGC.AGC and AGC's subsidiary Assured Guaranty (U.K.) Ltd. (AGUK) raising the outlook to stable from negative, although AGC has requested that Moody's withdraw its financial strength rating of AGC and AGUK. Effective April 8, 2015, at the Company's request, Moody’s withdrew the financial strength ratings it had assigned to AG Re and AGRO.

On June 22, 2013, KBRA assigned aJuly 27, 2016, S&P affirmed the AA (stable) financial strength ratingratings of AA+ (stable outlook) to MAC, and affirmed that rating on August 3, 2015. On November 13, 2014, KBRA assigned a financial strength rating of AA+ (stable outlook) to AGM, and affirmed that rating on December 10, 2015.AGL's insurance subsidiaries.

On May 5, 2015,27, 2016, Best assigned to AGRO aaffirmed the A+ (stable) financial strength rating, of A+ (Stable), which is their second highest rating.rating, of AGRO.

There can be no assurance that any of the rating agencies will not take negative action on their financial strength ratings of AGL's insurance subsidiaries in the future.

For a discussion of the effects of rating actions on the Company, see the following:

Note 6, Financial GuarantyContracts Accounted for as Insurance
Note 8, Financial Guaranty Contracts Accounted for as Credit Derivatives
Note 13, Reinsurance and Other Monoline Exposures
Note 16, Long-Term Debt and Credit Facilities
4.Outstanding Exposure
 
The Company’s financial guaranty contracts are written in either insurance or credit derivative form, but collectively are considered financial guaranty contracts. The Company seeks to limit its exposure to losses by underwriting obligations that it views as investment grade at inception, although, as part of its loss mitigation strategy for existing troubled credits, it may underwrite new issuances that it views as BIG. The Company diversifies its insured portfolio across asset classes and, in the structured finance portfolio, requires rigorous subordination or collateralization requirements. Reinsurance may be used in order to reduce net exposure to certain insured transactions.

     Public finance obligations insured by the Company consist primarily of general obligation bonds supported by the taxing powers of U.S. state or municipal governmental authorities, as well as tax-supported bonds, revenue bonds and other obligations supported by covenants from state or municipal governmental authorities or other municipal obligors to impose and collect fees and charges for public services or specific infrastructure projects. The Company also includes within public finance obligations those obligations backed by the cash flow from leases or other revenues from projects serving substantial public purposes, including utilities, toll roads, health care facilities and government office buildings. The Company also includes within public finance similar obligations issued by territorial and non-U.S. sovereign and sub-sovereign issuers and governmental authorities.

Structured finance obligations insured by the Company are generally issued by special purpose entities, including VIEs, and backed by pools of assets having an ascertainable cash flow or market value or other specialized financial obligations. Some of these VIEs are consolidated as described in Note 9, Consolidated Variable Interest Entities. Unless

otherwise specified, the outstanding par and Debt Servicedebt service amounts presented in this note include outstanding exposures on VIEs whether or not they are consolidated.

Significant Risk Management Activities

The Portfolio Risk Management Committee, which includes members of senior management and senior credit and surveillance officers, sets specific risk policies and limits and is responsible for enterprise risk management, establishing the Company's risk appetite, credit underwriting of new business, surveillance and work-out.
    
As part of the surveillance process, the Company monitors trends and changes in transaction credit quality, detects any deterioration in credit quality, and recommends such remedial actions as may be necessary or appropriate. All transactions in the insured portfolio are assigned internal credit ratings, which are updated based on changes in transaction credit quality. The Company also develops strategies to enforce its contractual rights and remedies and to mitigate its losses, engage in negotiation discussions with transaction participants and, when necessary, manage the Company's litigation proceedings.

148


Surveillance Categories
 
The Company segregates its insured portfolio into investment grade and BIG surveillance categories to facilitate the appropriate allocation of resources to monitoring and loss mitigation efforts and to aid in establishing the appropriate cycle for periodic review for each exposure. BIG exposures include all exposures with internal credit ratings below BBB-. The Company’s internal credit ratings are based on internal assessments of the likelihood of default and loss severity in the event of default. Internal credit ratings are expressed on a ratings scale similar to that used by the rating agencies and are generally reflective of an approach similar to that employed by the rating agencies, except that the Company's internal credit ratings focus on future performance rather than lifetime performance.
 
The Company monitors its investment grade credits to determine whether any need to be internally downgraded to BIG and refreshes its internal credit ratings on individual credits in quarterly, semi-annual or annual cycles based on the Company’s view of the credit’s quality, loss potential, volatility and sector. Ratings on credits in sectors identified as under the most stress or with the most potential volatility are reviewed every quarter. The Company’s credit ratings on assumed credits are based on the Company’s reviews of low-rated credits or credits in volatile sectors, unless such information is not available, in which case, the ceding company’s credit ratingratings of the transactions are used.
 
Credits identified as BIG are subjected to further review to determine the probability of a loss. See Note 5, Expected Loss to be Paid, for additional information. Surveillance personnel then assign each BIG transaction to the appropriate BIG surveillance category based upon whether a future loss is expected and whether a claim has been paid. For surveillance purposes, the Company calculates present value using a constant discount rate of 4% or 5% depending on the insurance subsidiary. (Risk-free rates are used for calculating the expected loss for financial statement measurement purposes.)
 
More extensive monitoring and intervention is employed for all BIG surveillance categories, with internal credit ratings reviewed quarterly. The Company expects “future losses” on a transaction when the Company believes there is at least a 50% chance that, on a present value basis, it will pay more claims in the future of that transaction than it will have reimbursed. The three BIG categories are:
 
BIG Category 1: Below-investment-grade transactions showing sufficient deterioration to make future losses possible, but for which none are currently expected.
 
BIG Category 2: Below-investment-grade transactions for which future losses are expected but for which no claims (other than liquidity claims, which is a claimare claims that the Company expects to be reimbursed within one year) have yet been paid.
 
BIG Category 3: Below-investment-grade transactions for which future losses are expected and on which claims (other than liquidity claims) have been paid.


Components of Outstanding Exposure

Unless otherwise noted, ratings disclosed herein on the Company's insured portfolio reflect its internal ratings. The Company classifies those portions of risks benefiting from reimbursement obligations collateralized by eligible assets held in trust in acceptable reimbursement structures as the higher of 'AA' or their current internal rating.

The Company purchases securities that it has insured, and for which it has expected losses to be paid, in order to mitigate the economic effect of insured losses ("loss(loss mitigation securities")securities). The Company excludes amounts attributable to loss mitigation securities (unless otherwise indicated) from par and Debt Servicedebt service outstanding, because it manages such securities as investments and not insurance exposure. As of December 31, 2016 and December 31, 2015, the Company excluded $2.1 billion and $1.5 billion, respectively, of net par as a result of loss mitigation strategies, including loss mitigation securities held in the investment portfolio, which are primarily BIG. The following table presents the gross and net debt service for all financial guaranty contracts.


149


Financial Guaranty
Debt Service Outstanding

Gross Debt Service
Outstanding
 
Net Debt Service
Outstanding
Gross Debt Service
Outstanding
 
Net Debt Service
Outstanding
December 31,
2015
 December 31,
2014
 December 31,
2015
 December 31,
2014
December 31,
2016
 December 31,
2015
 December 31,
2016
 December 31,
2015
(in millions)(in millions)
Public finance$515,494
 $587,245
 $494,426
 $553,612
$425,849
 $515,494
 $409,447
 $494,426
Structured finance43,976
 59,477
 41,915
 56,010
29,151
 43,976
 28,088
 41,915
Total financial guaranty$559,470
 $646,722
 $536,341
 $609,622
$455,000
 $559,470
 $437,535
 $536,341

In addition to the amountsfinancial guaranty debt service shown in the table above, the Company’s netCompany provided structured capital relief Triple-X excess of loss life reinsurance on approximately $390 million of exposure as of December 31, 2016, which is expected to increase to approximately $1 billion prior to September 30, 2036. There was no exposure to structured capital relief Triple-X excess of loss life reinsurance as of December 31, 2015. The Company also has mortgage guaranty insurancereinsurance related to loans originated in Ireland on debt service wasof approximately $36 million as of December 31, 2016 and $102 million as of December 31, 2015 and $127 million as of December 31, 2014 related to loans originated in Ireland. As of December 31, 2015, the Company also had exposure to €12 million of reinsurance contracts relating to Spanish housing cooperatives risk, but the Company commuted back to the ceding company the exposure in January 2016.2015. These transactions are all rated investment grade internally.


Financial Guaranty Portfolio by Internal RatingRating(1)
As of December 31, 2016

  Public Finance
U.S.
 
Public Finance
Non-U.S.
 
Structured Finance
U.S
 
Structured Finance
Non-U.S
 Total
Rating
Category
 Net Par
Outstanding
 % 
Net Par
Outstanding
 % 
Net Par
Outstanding
 % 
Net Par
Outstanding
 % 
Net Par
Outstanding
 %
  (dollars in millions)
AAA $2,066
 0.8% $2,221
 8.4% $9,757
 44.2% $1,447
 47.0% $15,491
 5.2%
AA 46,420
 19.0
 170
 0.6
 5,773
 26.2
 127
 4.1
 52,490
 17.7
A 133,829
 54.7
 6,270
 23.8
 1,589
 7.2
 456
 14.8
 142,144
 48.0
BBB 55,103
 22.5
 16,378
 62.1
 879
 4.0
 759
 24.6
 73,119
 24.7
BIG 7,380
 3.0
 1,342
 5.1
 4,059
 18.4
 293
 9.5
 13,074
 4.4
Total net par outstanding $244,798
 100.0% $26,381
 100.0% $22,057
 100.0% $3,082
 100.0% $296,318
 100.0%
_____________________
(1)The December 31, 2016 amounts include $2.9 billion of net par from the CIFG Acquisition.


Financial Guaranty Portfolio by Internal Rating(1)
As of December 31, 2015 

 Public Finance
U.S.
 
Public Finance
Non-U.S.
 
Structured Finance
U.S
 
Structured Finance
Non-U.S
 Total 
Public Finance
U.S.
 
Public Finance
Non-U.S.
 
Structured Finance
U.S
 
Structured Finance
Non-U.S
 Total
Rating
Category
 Net Par
Outstanding
 % 
Net Par
Outstanding
 % 
Net Par
Outstanding
 % 
Net Par
Outstanding
 % 
Net Par
Outstanding
 % 
Net Par
Outstanding
 % 
Net Par
Outstanding
 % 
Net Par
Outstanding
 % 
Net Par
Outstanding
 % 
Net Par
Outstanding
 %
 (dollars in millions) (dollars in millions)
AAA $3,053
 1.1% $709
 2.4% $14,366
 45.2% $2,709
 50.6% $20,837
 5.8% $3,053
 1.1% $709
 2.4% $14,366
 45.2% $2,709
 50.6% $20,837
 5.8%
AA 69,274
 23.7
 2,017
 6.8
 7,934
 25.0
 177
 3.3
 79,402
 22.1
 69,274
 23.7
 2,017
 6.8
 7,934
 25.0
 177
 3.3
 79,402
 22.1
A 157,440
 53.9
 6,765
 22.9
 2,486
 7.8
 555
 10.3
 167,246
 46.7
 157,440
 53.9
 6,765
 22.9
 2,486
 7.8
 555
 10.3
 167,246
 46.7
BBB 54,315
 18.6
 18,708
 63.2
 1,515
 4.8
 1,365
 25.5
 75,903
 21.2
 54,315
 18.6
 18,708
 63.2
 1,515
 4.8
 1,365
 25.5
 75,903
 21.2
BIG 7,784
 2.7
 1,378
 4.7
 5,469
 17.2
 552
 10.3
 15,183
 4.2
 7,784
 2.7
 1,378
 4.7
 5,469
 17.2
 552
 10.3
 15,183
 4.2
Total net par outstanding (2) $291,866
 100.0% $29,577
 100.0% $31,770
 100.0% $5,358
 100.0% $358,571
 100.0% $291,866
 100.0% $29,577
 100.0% $31,770
 100.0% $5,358
 100.0% $358,571
 100.0%
_____________________
(1)Excludes $1.5 billion of loss mitigation securities insured and held by the Company as of December 31, 2015, which are primarily BIG.

(2)The December 31, 2015 amounts include $10.9 billion of net par acquired from the Radian Asset.Asset Acquisition.

Financial Guaranty Portfolio by Internal Rating
As of December 31, 2014

  
Public Finance
U.S.
 
Public Finance
Non-U.S.
 
Structured Finance
U.S
 
Structured Finance
Non-U.S
 Total
Rating
Category
 
Net Par
Outstanding
 % 
Net Par
Outstanding
 % 
Net Par
Outstanding
 % 
Net Par
Outstanding
 % 
Net Par
Outstanding
 %
  (dollars in millions)
AAA $4,082
 1.3% $615
 2.0% $20,037
 48.7% $5,409
 59.6% $30,143
 7.5%
AA 90,464
 28.1
 2,785
 8.9
 8,213
 19.9
 503
 5.5
 101,965
 25.3
A 176,298
 54.7
 7,192
 22.9
 2,940
 7.1
 445
 4.9
 186,875
 46.3
BBB 43,429
 13.5
 19,363
 61.7
 1,795
 4.4
 1,912
 21.1
 66,499
 16.4
BIG 7,850
 2.4
 1,404
 4.5
 8,186
 19.9
 807
 8.9
 18,247
 4.5
Total net par outstanding (1) $322,123
 100.0% $31,359
 100.0% $41,171
 100.0% $9,076
 100.0% $403,729
 100.0%
_____________________
(1)Excludes $1.3 billion of loss mitigation securities insured and held by the Company as of December 31, 2014, which are primarily BIG.


150


Financial Guaranty Portfolio
by Sector

Gross Par Outstanding Ceded Par Outstanding Net Par OutstandingGross Par Outstanding Ceded Par Outstanding Net Par Outstanding
SectorAs of December 31, 2015 As of December 31, 2014 As of December 31, 2015 As of December 31, 2014 As of December 31, 2015 As of December 31, 2014As of December 31, 2016 As of December 31, 2015 As of December 31, 2016 As of December 31, 2015 As of December 31, 2016 As of December 31, 2015
(in millions)(in millions)
Public finance:         


U.S.:         


General obligation$129,386
 $144,714
 $3,131
 $4,438
 $126,255
 $140,276
$110,167
 $129,386
 $2,450
 $3,131
 $107,717
 $126,255
Tax backed59,649
 65,600
 1,587
 3,075
 58,062
 62,525
51,325
 59,649
 1,394
 1,587
 49,931
 58,062
Municipal utilities46,951
 53,471
 1,015
 1,381
 45,936
 52,090
38,442
 46,951
 839
 1,015
 37,603
 45,936
Transportation24,351
 28,914
 897
 1,091
 23,454
 27,823
19,915
 24,351
 512
 897
 19,403
 23,454
Healthcare15,967
 16,225
 961
 1,377
 15,006
 14,848
11,940
 15,967
 702
 961
 11,238
 15,006
Higher education11,984
 13,485
 48
 386
 11,936
 13,099
10,114
 11,984
 29
 48
 10,085
 11,936
Infrastructure finance5,241
 5,098
 248
 917
 4,993
 4,181
3,902
 5,241
 133
 248
 3,769
 4,993
Housing2,075
 2,880
 38
 101
 2,037
 2,779
1,593
 2,075
 34
 38
 1,559
 2,037
Investor-owned utilities916
 944
 0
 0
 916
 944
697
 916
 0
 0
 697
 916
Other public finance3,288
 3,575
 17
 17
 3,271
 3,558
2,810
 3,288
 14
 17
 2,796
 3,271
Total public finance—U.S.299,808
 334,906
 7,942
 12,783
 291,866
 322,123
250,905
 299,808
 6,107
 7,942
 244,798
 291,866
Non-U.S.:         


Infrastructure finance14,040
 15,091
 1,312
 2,283
 12,728
 12,808
11,818
 14,040
 1,087
 1,312
 10,731
 12,728
Regulated utilities12,616
 14,582
 2,568
 3,668
 10,048
 10,914
11,395
 12,616
 2,132
 2,568
 9,263
 10,048
Pooled infrastructure2,013
 2,565
 134
 145
 1,879
 2,420
1,621
 2,013
 108
 134
 1,513
 1,879
Other public finance5,714
 6,216
 792
 999
 4,922
 5,217
5,653
 5,714
 779
 792
 4,874
 4,922
Total public finance—non-U.S.34,383
 38,454
 4,806
 7,095
 29,577
 31,359
30,487
 34,383
 4,106
 4,806
 26,381
 29,577
Total public finance334,191
 373,360
 12,748
 19,878
 321,443
 353,482
281,392
 334,191
 10,213
 12,748
 271,179
 321,443
Structured finance:         


U.S.:         


Pooled corporate obligations16,757
 21,791
 749
 1,145
 16,008
 20,646
10,273
 16,757
 223
 749
 10,050
 16,008
Residential Mortgage-Backed Securities ("RMBS")7,441
 10,109
 374
 692
 7,067
 9,417
Residential Mortgage-Backed Securities (RMBS)5,933
 7,441
 296
 374
 5,637
 7,067
Insurance securitizations3,047
 3,480
 47
 47
 3,000
 3,433
2,355
 3,047
 47
 47
 2,308
 3,000
Consumer receivables2,153
 2,157
 54
 58
 2,099
 2,099
1,707
 2,153
 55
 54
 1,652
 2,099
Financial products1,906
 2,276
 
 
 1,906
 2,276
1,540
 1,906
 
 
 1,540
 1,906
Commercial mortgage-backed securities ("CMBS") and other commercial real estate related exposures549
 1,979
 16
 22
 533
 1,957
Commercial receivables432
 567
 5
 7
 427
 560
234
 432
 4
 5
 230
 427
Commercial mortgage-backed securities (CMBS) and other commercial real estate related exposures43
 549
 
 16
 43
 533
Other structured finance823
 929
 93
 146
 730
 783
646
 823
 49
 93
 597
 730
Total structured finance—U.S.33,108
 43,288
 1,338
 2,117
 31,770
 41,171
22,731
 33,108
 674
 1,338
 22,057
 31,770
Non-U.S.:         


Pooled corporate obligations4,087
 7,439
 442
 835
 3,645
 6,604
1,716
 4,087
 181
 442
 1,535
 3,645
RMBS661
 552
 57
 60
 604
 492
Commercial receivables619
 965
 19
 21
 600
 944
373
 619
 17
 19
 356
 600
RMBS552
 893
 60
 99
 492
 794
Other structured finance635
 759
 14
 25
 621
 734
601
 635
 14
 14
 587
 621
Total structured finance—non-U.S.5,893
 10,056
 535
 980
 5,358
 9,076
3,351
 5,893
 269
 535
 3,082
 5,358
Total structured finance39,001
 53,344
 1,873
 3,097
 37,128
 50,247
26,082
 39,001
 943
 1,873
 25,139
 37,128
Total net par outstanding$373,192
 $426,704
 $14,621
 $22,975
 $358,571
 $403,729
$307,474
 $373,192
 $11,156
 $14,621
 $296,318
 $358,571


151


In addition to amounts shown in the tables above, the Company had outstanding commitments to provide guaranties of $595$123 million for structured finance and $394 million for public finance obligations atas of December 31, 2015.2016. The expiration dates for the public finance commitments range between January 15, 20161, 2017 and February 25,March 12, 2017, with $471$380 million expiring prior to the date of this filing and an additional $60 million expiring prior to December 31, 2016.filing. The commitments are contingent on the satisfaction of all conditions set forth in them and may expire unused or be canceled at the counterparty’s request. Therefore, the total commitment amount does not necessarily reflect actual future guaranteed amounts.

Actual maturities of insured obligations could differ from contractual maturities because borrowers have the right to call or prepay certain obligations with or without call or prepayment penalties. The expected maturities of structured finance obligations are, in general, considerably shorter than the contractual maturities for such obligations.

Expected Amortization of
Net Par Outstanding
As of December 31, 20152016

Public Finance Structured Finance TotalPublic Finance Structured Finance Total
(in millions)(in millions)
0 to 5 years$97,518
 $24,430
 $121,948
$90,563
 $16,394
 $106,957
5 to 10 years68,144
 4,786
 72,930
56,351
 3,692
 60,043
10 to 15 years58,348
 2,768
 61,116
45,712
 2,548
 48,260
15 to 20 years45,623
 2,765
 48,388
37,057
 1,859
 38,916
20 years and above51,810
 2,379
 54,189
41,496
 646
 42,142
Total net par outstanding$321,443
 $37,128
 $358,571
$271,179
 $25,139
 $296,318


Components of BIG Portfolio

Components of BIG Net Par Outstanding
(Insurance and Credit Derivative Form)
As of December 31, 20152016

 BIG Net Par Outstanding Net Par
 BIG 1 BIG 2 BIG 3 Total BIG Outstanding
     (in millions)    
U.S. public finance$4,765
 $2,883
 $136
 $7,784
 $291,866
Non-U.S. public finance875
 503
 
 1,378
 29,577
Structured finance         
First lien U.S. RMBS: 


Prime first lien225
 34
 25
 284
 445
Alt-A first lien119
 73
 601
 793
 1,353
Option ARM39
 12
 90
 141
 252
Subprime146
 228
 930
 1,304
 3,457
Second lien U.S. RMBS491
 50
 910
 1,451
 1,560
Total U.S. RMBS1,020
 397
 2,556
 3,973
 7,067
Triple-X life insurance transactions
 
 216
 216
 2,750
Trust preferred securities (“TruPS”)679
 127
 
 806
 4,379
Student loans12
 68
 83
 163
 1,818
Other structured finance672
 151
 40
 863
 21,114
Total$8,023
 $4,129
 $3,031
 $15,183
 $358,571
 BIG Net Par Outstanding Net Par
 BIG 1 BIG 2 BIG 3 Total BIG Outstanding
     (in millions)    
Public finance:         
U.S. public finance$2,402
 $3,123
 $1,855
 $7,380
 $244,798
Non-U.S. public finance1,288
 54
 
 1,342
 26,381
Public finance3,690
 3,177
 1,855
 8,722
 271,179
Structured finance:         
U.S. RMBS197
 493
 2,461
 3,151
 5,637
Triple-X life insurance transactions
 
 126
 126
 2,057
Trust preferred securities (TruPS)304
 126
 
 430
 1,892
Other structured finance304
 263
 78
 645
 15,553
Structured finance805
 882
 2,665
 4,352
 25,139
Total$4,495
 $4,059
 $4,520
 $13,074
 $296,318


152

Table of Contents

Components of BIG Net Par Outstanding
(Insurance and Credit Derivative Form)
As of December 31, 20142015

 BIG Net Par Outstanding Net Par
 BIG 1 BIG 2 BIG 3 Total BIG Outstanding
     (in millions)    
U.S. public finance$6,577
 $1,156
 $117
 $7,850
 $322,123
Non-U.S. public finance1,402
 2
 
 1,404
 31,359
Structured finance         
First lien U.S. RMBS: 


Prime first lien68
 33
 252
 353
 471
Alt-A first lien585
 531
 725
 1,841
 2,532
Option ARM47
 18
 118
 183
 407
Subprime156
 654
 765
 1,575
 4,051
Second lien U.S. RMBS1,012
 55
 624
 1,691
 1,956
Total U.S. RMBS1,868
 1,291
 2,484
 5,643
 9,417
Triple-X life insurance transactions
 
 598
 598
 3,133
TruPS997
 
 336
 1,333
 4,326
Student loans14
 68
 113
 195
 1,857
Other structured finance1,007
 172
 45
 1,224
 31,514
Total$11,865
 $2,689
 $3,693
 $18,247
 $403,729
 BIG Net Par Outstanding Net Par
 BIG 1 BIG 2 BIG 3 Total BIG Outstanding
     (in millions)    
Public finance:         
U.S. public finance$4,765
 $2,883
 $136
 $7,784
 $291,866
Non-U.S. public finance875
 503
 
 1,378
 29,577
Public finance5,640
 3,386
 136
 9,162
 321,443
Structured finance:         
U.S. RMBS1,020
 397
 2,556
 3,973
 7,067
Triple-X life insurance transactions
 
 216
 216
 2,750
TruPS679
 127
 
 806
 4,379
Other structured finance684
 219
 123
 1,026
 22,932
Structured finance2,383
 743
 2,895
 6,021
 37,128
Total$8,023
 $4,129
 $3,031
 $15,183
 $358,571


BIG Net Par Outstanding
and Number of Risks
As of December 31, 2016

  Net Par Outstanding Number of Risks(2)
Description 
Financial
Guaranty
Insurance(1)
 
Credit
Derivative
 Total 
Financial
Guaranty
Insurance(1)
 
Credit
Derivative
 Total
  (dollars in millions)
BIG:  


Category 1 $3,861
 $634
 $4,495
 165
 10
 175
Category 2 3,857
 202
 4,059
 79
 6
 85
Category 3 4,383
 137
 4,520
 148
 9
 157
Total BIG $12,101
 $973
 $13,074
 392
 25
 417


BIG Net Par Outstanding
and Number of Risks
As of December 31, 2015

  Net Par Outstanding Number of Risks(2)
Description 
Financial
Guaranty
Insurance(1)
 
Credit
Derivative
 Total 
Financial
Guaranty
Insurance(1)
 
Credit
Derivative
 Total
  (dollars in millions)
BIG:  


Category 1 $7,019
 $1,004
 $8,023
 202
 12
 214
Category 2 3,655
 474
 4,129
 85
 8
 93
Category 3 2,900
 131
 3,031
 132
 12
 144
Total BIG $13,574
 $1,609
 $15,183
 419
 32
 451


153

Table of Contents

BIG Net Par Outstanding
and Number of Risks
As of December 31, 2014_____________________

  Net Par Outstanding Number of Risks(2)
Description 
Financial
Guaranty
Insurance(1)
 
Credit
Derivative
 Total 
Financial
Guaranty
Insurance(1)
 
Credit
Derivative
 Total
  (dollars in millions)
BIG:  


Category 1 $10,195
 $1,670
 $11,865
 164
 18
 182
Category 2 2,135
 554
 2,689
 75
 14
 89
Category 3 2,892
 801
 3,693
 119
 24
 143
Total BIG $15,222
 $3,025
 $18,247
 358
 56
 414
_____________________
(1)    Includes net par outstanding for VIEs.

(2)A risk represents the aggregate of the financial guaranty policies that share the same revenue source for purposes of making Debt Servicedebt service payments.
 

154


Geographic Distribution of Net Par Outstanding

The Company seeks to maintain a diversified portfolio of insured obligations designed to spread its risk across a number of geographic areas.

Geographic Distribution of
Net Par Outstanding
As of December 31, 20152016

Number of Risks Net Par Outstanding Percent of Total Net Par OutstandingNumber of Risks Net Par Outstanding Percent of Total Net Par Outstanding
(dollars in millions)(dollars in millions)
U.S.:          
U.S. Public finance:          
California1,514
 $47,731
 13.3%1,459
 $42,404
 14.3%
Texas1,307
 23,891
 6.7
1,271
 20,599
 7.0
Pennsylvania944
 23,655
 6.6
852
 20,232
 6.8
New York961
 22,513
 6.3
935
 19,637
 6.6
Illinois816
 22,220
 6.2
776
 17,967
 6.1
Florida369
 16,595
 4.6
324
 12,643
 4.3
New Jersey553
 13,605
 3.8
495
 12,560
 4.2
Michigan577
 10,898
 3.0
506
 7,985
 2.7
Georgia183
 6,991
 1.9
172
 6,372
 2.2
Ohio464
 6,753
 1.9
409
 5,554
 1.9
Other states and U.S. territories3,927
 97,014
 27.0
3,475
 78,845
 26.6
Total U.S. public finance11,615
 291,866
 81.3
10,674
 244,798
 82.7
U.S. Structured finance (multiple states)723
 31,770
 8.9
610
 22,057
 7.4
Total U.S.12,338
 323,636
 90.2
11,284
 266,855
 90.1
Non-U.S.:          
United Kingdom101
 17,565
 4.9
112
 15,940
 5.4
Australia22
 3,349
 0.9
18
 3,036
 1.0
Canada10
 3,099
 0.9
9
 2,730
 0.9
France16
 2,609
 0.7
14
 1,809
 0.6
Italy8
 1,296
 0.4
9
 1,311
 0.4
Other72
 7,017
 2.0
53
 4,637
 1.6
Total non-U.S.229
 34,935
 9.8
215
 29,463
 9.9
Total12,567
 $358,571
 100.0%11,499
 $296,318
 100.0%


155

Table of Contents

Exposure to Puerto Rico
    
The Company has insured exposure to general obligation bonds of the Commonwealth of Puerto Rico (Puerto Rico or the Commonwealth) and various obligations of its related authorities and public corporations aggregating $5.1$4.8 billion net par as of December 31, 2015,2016, all of which are rated BIG. In 2015, the Company's Puerto Rico exposures increased due to (1) net par acquired in the Radian Asset Acquisition, which equals $385 million as of December 31, 2015, and (2) a commutation of previously ceded Puerto Rico exposures.

Puerto Rico has experienced significant general fund budget deficits in recent years. These deficits, until recently, were covered primarily with the net proceeds of bond issuances, interim financings provided by Government Development Bank for Puerto Rico (“GDB”)years and in some cases, one-time revenue measures or expense adjustment measures. In addition to high debt levels, Puerto Rico faces a challenging economic environment.

In June 2014, the Puerto Rico legislature passed the Puerto Rico Public Corporation Debt Enforcement and Recovery Act (the "Recovery Act") in order to provide Beginning on January 1, 2016, a legislative framework for certain public corporations experiencing severe financial stress to restructure their debt, including Puerto Rico Highway and Transportation Authority ("PRHTA") and Puerto Rico Electric Power Authority ("PREPA"). Subsequently, the Commonwealth stated PREPA might need to seek relief under the Recovery Act due to liquidity constraints. Investors in bonds issued by PREPA filed suit in the United States District Court for the Districtnumber of Puerto Rico challengingcredits have defaulted on bond payments, and the Recovery Act. On February 6, 2015, the U.S. District Court for the District ofCompany has now paid claims on several Puerto Rico ruledcredits as shown in the Recovery Act is preempted by the U.S. Bankruptcy Code and is therefore void. On July 6, 2015, the U.S. Court of Appeals for the First Circuit upheld that ruling, and on December 4, 2015, the U.S. Supreme Court granted petitions for writs of certiorari relating to that ruling. Oral arguments have been scheduled for March 22, 2016. Typical Supreme Court practice suggests a decision could be announced in June 2016, but there is no assurance that an opinion will be announced at such time, especially in light of the recent Supreme Court vacancy.table "Puerto Rico Net Par Outstanding" below.

On June 28,November 30, 2015 and December 8, 2015, Governor García Padilla of Puerto Rico (the "Governor") publicly stated that the Commonwealth’s public debt, considering the current level of economic activity, is unpayable and that a comprehensive debt restructuring may be necessary, and he has made similar statements since then. On June 29, 2015 a report commissioned by the Commonwealth and authored by former World Bank Chief Economist and former Deputy Director of the International Monetary Fund Dr. Anne Krueger and economists Dr. Ranjit Teja and Dr. Andrew Wolfe and calling for debt restructuring of all Puerto Rico bonds was released ("Krueger Report").

Puerto Rico Public Finance Corporation (“PFC”), a subsidiary of the GDB, failed to make most of an approximately $58 million Debt Service payment on August 3, 2015 and to make subsequent Debt Service payments because the Commonwealth’s legislature did not appropriate funds for payment.  The Company does not insure any obligations of the PFC. On January 1, 2016 Puerto Rico Infrastructure Finance Authority ("PRIFA") defaulted on payment of a portion of the interest due on its bonds on that date. For those PRIFA bonds the Company had insured, the Company paid approximately $451 thousand of claims for the interest payments on which PRIFA had defaulted.

On September 9, 2015, the Working Group for the Fiscal and Economic Recovery of Puerto Rico (“Working Group”) established by the Governor published its “Puerto Rico Fiscal and Economic Growth Plan” (the “FEGP”). The FEGP projected that the Commonwealth would face a cumulative financing gap of $27.8 billion from fiscal year 2016 to fiscal year 2020 without corrective action. Various stakeholders and analysts have publicly questioned the accuracy of the $27.8 billion gap projected by the Working Group. The FEGP recommended economic development, structural, fiscal and institutional reform measures that it projects would reduce that gap to $14.0 billion. The Working Group asserts that the Commonwealth’s debt, including debt with a constitutional priority, is not sustainable. The FEGP included a recommendation that the Commonwealth’s advisors begin to work on a voluntary exchange offer to its creditors as part of the FEGP. The FEGP does not have the force of law and implementation of its recommendations would require actions by the governments of the Commonwealth and of the United States as well as the cooperation and agreement of various creditors.
On November 30, 2015, and December 8, 2015, the GovernorFormer Governor) issued executive orders (“Clawback Orders”)(Clawback Orders) directing the Puerto Rico Department of Treasury and the Puerto Rico Tourism Company to retain or transfer certain taxes and revenues pledged to secure the payment of bonds issued by PRHTA, PRIFAthe Puerto Rico Highways and PRCCDA.Transportation Authority (PRHTA), Puerto Rico Infrastructure Financing Authority (PRIFA), and Puerto Rico Convention

Center District Authority (PRCCDA). On January 7, 2016, the Company sued various Puerto Rico governmental officials in the United States District Court, District of Puerto Rico, asserting that this attempt to “claw back” pledged taxes and revenues is unconstitutional, and demanding declaratory and injunctive relief. The Puerto Rico credits insured by the Company impacted bysubject to the Clawback Orders are shown in the table “Puerto Rico Net Par Outstanding” below.


156

Table of Contents

On January 18,April 6, 2016, the Working Group published an updated FEGP that projectedFormer Governor signed into law the cumulative financing gap beyond 2020 would continuePuerto Rico Emergency Moratorium & Financial Rehabilitation Act (the Moratorium Act). The Moratorium Act purportedly empowers the governor to increasedeclare, entity by entity, states of emergencies and moratoriums on debt service payments on obligations of the Commonwealth and its related authorities and public corporations, as well as instituting a stay against related litigation, among other things. The Former Governor used the authority of the Moratorium Act to $63.4 billion without corrective action. The Working Group followed that up with the publication on February 1, 2016, of a proposal for a voluntary exchange of $49.2 billion of tax supported debt into $26.5 billion of new mandatorily payable base bonds and $22.7 billion of growth bonds.
There have beentake a number of other proposals, plansactions related to issuers of obligations the Company insures. National Public Finance Guarantee Corporation (National) (another financial guarantor), holders of the Commonwealth general obligation bonds and legislative initiatives offered incertain Puerto Rico residents (the National Plaintiffs) have filed suits to invalidate the Moratorium Act, and after the passage of the Puerto Rico Oversight, Management, and Economic Stability Act (PROMESA), the National Plaintiffs sought a relief from the stay of litigation imposed by PROMESA to pursue the action. On July 21, 2016, the Company filed a motion and form of complaint in the U.S. District Court for the District of Puerto Rico seeking relief from the stay of litigation imposed by PROMESA to seek a declaration that the Moratorium Act is preempted by Federal bankruptcy law. In November 2016 that court denied both the Company's and the National Plaintiffs' motions for relief from stay in the respective actions. The PROMESA stay expires on May 1, 2017.

On June 30, 2016, PROMESA was signed into law by the President of the United States. PROMESA establishes a seven-member federal financial oversight board (Oversight Board) with authority to require that balanced budgets and fiscal plans be adopted and implemented by Puerto Rico. PROMESA provides a legal framework under which the debt of the Commonwealth and its related authorities and public corporations may be voluntarily restructured, and grants the Oversight Board the sole authority to file restructuring petitions in a federal court to restructure the debt of the Commonwealth and its related authorities and public corporations if voluntary negotiations fail, provided that any such restructuring must be in accordance with an Oversight Board approved fiscal plan that respects the liens and priorities provided under Puerto Rico law. PROMESA also appears to preempt at least portions of the Moratorium Act and to stay debt-related litigation, including the Company’s litigation regarding the Clawback Orders. On August 31, 2016, the President of the United States aimed at addressingappointed the seven members of the Oversight Board.

The Oversight Board has begun meeting and has hired Ramón Ruiz-Comas as interim executive director. On January 2, 2017, Ricardo Antonio Rosselló Nevares (the Governor) took office, replacing the Former Governor. On January 29, 2017, the Governor signed the Puerto Rico’s fiscal issues. AmongRico Emergency and Fiscal Responsibility Act (Emergency Act) that, among other things, repeals portions of the responses proposed is a federal financial control boardMoratorium Act, defines an emergency period until May 1, 2017, continues diversion of collateral away from bonds the Company insures, and access to bankruptcy courts or another restructuring mechanism. U.S. Housedefines the powers and duties of Representatives Speaker Paul Ryan has asked that a legislative response be presented to the House of Representatives by the end of March 2016.Fiscal Agency and Financial Advisory Authority (FAFAA). The final shape, timing and timingvalidity of responses to Puerto Rico’s distress eventually enacted or implemented by Puerto Ricounder the auspices of PROMESA and the Oversight Board or the United States, if any,otherwise, and the impact of any such actionsresponses on obligations insured by the Company, is uncertain and may differ substantiallyuncertain.

The Company groups its Puerto Rico exposure into three categories:

Constitutionally Guaranteed. The Company includes in this category public debt benefiting from the recommendationsArticle VI of the Working Group orConstitution of the Commonwealth, which expressly provides that interest and principal payments on the public debt are to be paid before other disbursements are made.

Public Corporations – Certain Revenues Potentially Subject to Clawback. The Company includes in this category the debt of public corporations for which applicable law permits the Commonwealth to claw back, subject to certain conditions and for the payment of public debt, at least a portion of the revenues supporting the bonds the Company insures. As a Constitutional condition to clawback, available Commonwealth revenues for any other proposals or plans described infiscal year must be insufficient to pay Commonwealth debt service before the press or offeredpayment of any appropriations for that year.  The Company believes that this condition has not been satisfied to date, or in the future.

S&P, Moody’s and Fitch Ratings have lowered the credit rating of the Commonwealth’s bonds and on its public corporations several times over the past approximately two years, andaccordingly that the Commonwealth has disclosed its liquidity hasnot to date been adversely affected by rating agency downgrades andentitled to clawback revenues supporting debt insured by the limited market access for its debt,Company. As noted above, the Company sued various Puerto Rico governmental officials in the United States District Court, District of Puerto Rico asserting that Puerto Rico's recent attempt to claw back pledged taxes is unconstitutional, and also noted it has relied on short-term financingsdemanding declaratory and interim loans from the GDB and other private lenders, which reliance has constrained its liquidity and increased its near-term refinancing risk.injunctive relief.
PREPA

Other Public Corporations. The Company includes in this category the debt of public corporations that are supported by revenues it does not believe are subject to clawback.


Constitutionally Guaranteed

General Obligation. As of December 31, 2015,2016, the Company had $744$1,476 million insured net par outstanding of the general obligations of Puerto Rico, which are supported by the good faith, credit and taxing power of the Commonwealth. On July 1, 2016, despite the requirements of Article VI of its Constitution but pursuant to an executive order issued by the Former Governor under the Moratorium Act, the Commonwealth defaulted on most of the debt service payment due that day, and the Company made its first claim payments on these bonds, and has continued to make claim payments on these bonds.

Puerto Rico Public Buildings Authority (PBA). As of December 31, 2016, the Company had $169 million insured net par outstanding of PBA bonds, which are supported by a pledge of the rents due under leases of government facilities to departments, agencies, instrumentalities and municipalities of the Commonwealth, and that benefit from a Commonwealth guaranty supported by a pledge of the Commonwealth’s good faith, credit and taxing power. On July 1, 2016, despite the requirements of Article VI of its Constitution but pursuant to an executive order issued by the Former Governor under the Moratorium Act, the PBA defaulted on most of the debt service payment due that day, and the Company made its first claim payments on these bonds, and has continued to make claim payments on these bonds.

Public Corporations - Certain Revenues Potentially Subject to Clawback

PRHTA. As of December 31, 2016, the Company had $918 million insured net par outstanding of PRHTA (Transportation revenue) bonds and $350 million insured net par of PRHTA (Highways revenue) bonds. The transportation revenue bonds are secured by a subordinate gross pledge of gasoline and gas oil and diesel oil taxes, motor vehicle license fees and certain tolls, plus a first lien on up to $120 million annually of taxes on crude oil, unfinished oil and derivative products. The highways revenue bonds are secured by a gross pledge of gasoline and gas oil and diesel oil taxes, motor vehicle license fees and certain tolls. The Clawback Orders cover Commonwealth-derived taxes that are allocated to PRHTA. The Company believes that such sources represented a substantial majority of PRHTA’s revenues in 2015. The PRHTA bonds are subject to executive orders issued pursuant to the Moratorium Act. As noted above, the Company filed a motion and form of complaint in the U.S. District Court for the District of Puerto Rico seeking relief from the PROMESA stay to seek a declaration that the Moratorium Act is preempted by Federal bankruptcy law and that certain gubernatorial executive orders diverting PRHTA pledged toll revenues (which are not subject to the Clawback Orders) are preempted by PROMESA and violate the U.S. Constitution, and also seeking damages and injunctive relief. That motion was denied on November 2, 2016, on procedural grounds. The PROMESA stay expires on May 1, 2017. There were sufficient funds in the PRHTA bond accounts to make the July 1, 2016 and January 1, 2017 PRHTA debt service payments guaranteed by the Company on a primary basis, and those payments were made in full.

PRCCDA. As of December 31, 2016, the Company had $152 million insured net par outstanding of PRCCDA bonds, which are secured by certain hotel tax revenues. These revenues are sensitive to the level of economic activity in the area and are subject to the Clawback Orders, and the bonds are subject to an executive order issued pursuant to the Moratorium Act. There were sufficient funds in the PRCCDA bond accounts to make the July 1, 2016 and January 1, 2017 PRCCDA bond payments guaranteed by the Company, and those payments were made in full.

PRIFA. As of December 31, 2016, the Company had $18 million insured net par outstanding of PRIFA bonds, which are secured primarily by the return to Puerto Rico of federal excise taxes paid on rum. These revenues are subject to the Clawback Orders and the bonds are subject to an executive order issued pursuant to the Moratorium Act. The Company made its first claim payment on PRIFA bonds in January 2016, and has continued to make claim payments on PRIFA bonds.

Other Public Corporations

Puerto Rico Electric Power Authority (PREPA). As of December 31, 2016, the Company had $724 million insured net par outstanding of PREPA obligations. In August 2014, PREPA entered into forbearance agreements with the GDB, its bank lenders, and bondholders and financial guaranty insurers (including AGM and AGC) that hold or guarantee more than 60%obligations, which are payable from a pledge of PREPA's outstanding bonds, in order to address its near-term liquidity issues. Creditors, including AGM and AGC, agreed not to exercise available rights and remedies until March 31, 2015, and the bank lenders agreed to extend the maturity of two revolving lines of credit to the same date. PREPA agreed it would continue to make principal and interest payments on its outstanding bonds, and interest payments on its lines of credit. It also agreed it would develop a five year business plan and a recovery program in respect of its operations. Subsequently, mostnet revenues of the parties extended these forbearance agreements several times.
On July 1, 2015, PREPA made full payment of the $416 million of principal and interest due on its bonds, including bonds insured by AGM and AGC. However, that payment was conditioned on and facilitated by AGM and AGC agreeing, also on July 1, to purchase a portion of $131 million of interest-bearing bonds to help replenish certain of the operating funds PREPA used to make the $416 million of principal and interest payments. On July 31, 2015, AGM and AGC purchased $74 million aggregate principal amount of those bonds; the bonds were repaid in full in 2016.electric system.

On December 24, 2015, AGM and AGC entered into a Restructuring Support Agreement (“RSA”)(RSA) with PREPA, an ad hoc group of uninsured bondholders and a group of fuel-line lenders that would, subject to certain conditions, result in, among other things, modernization of the utility and a restructuring of current debt. Upon finalization of the contemplated restructuring transaction, insured PREPA revenue bonds (with no reduction to par or stated interest rate or extension of maturity) will be supported by securitization bonds issued by a special purpose corporation and secured by a transition charge assessed on ratepayers. To facilitate the securitization transaction which enables PREPA to achieve debt relief and more efficient capital markets financing,in exchange for a market premium, Assured Guaranty will issue surety insurance policies in an aggregate amount not expected to exceed $113 million in exchange($14 million for a market premiumAGC and $99 million for AGM) to support a portion of the reserve fund for the securitization bonds. Certain of the creditors also agreed, subject to certain conditions, to participate in a bridge financing. The Company’sfinancing, which was closed in two tranches on May 19, 2016 and June 22, 2016.

AGM's and AGC's share of the bridge financing iswas approximately $15 million.million ($2 million for AGC and $13 million for AGM). Legislation purportedly meeting the requirements of the RSA was enacted on February 16, 2016, and a transition charge to be paid by PREPA rate payers for debt service on the securitization bonds as contemplated by the RSA was approved by the Puerto Rico Energy Commission on June 20, 2016. The closing of the restructuring transaction and the issuance of the surety bonds and the closing of the bridge financing are subject to certain conditions, including confirmation that the enacted legislation meets all requirements of the RSA and execution of acceptable documentation and legal opinions. The RSA has been extended to March 31, 2017.

On July 1, 2016, PREPA made full payment of the $41 million of principal and interest due on PREPA revenue bonds insured by AGM and AGC. That payment was funded in part by AGM’s purchase of $26 million of PREPA bonds maturing in 2020. Upon finalization of the transactions contemplated by the RSA, these new PREPA revenue bonds will be supported by securitization bonds contemplated by the RSA. On January 1, 2017, PREPA made full payment of the $18 million of interest due on PREPA revenue bonds insured by AGM and AGC.

There can be no assurance that the conditions in the RSA will be met or that, if the conditions are met, the RSA’sRSA's other provisions, including those related to the restructuring of the insured PREPA revenue bonds, will be implemented.implemented as currently agreed. In addition, the impact of PROMESA , the Moratorium Act and Emergency Act or any attempt to exercise the power purportedly granted by the Moratorium Act or the Emergency Act on the implementation of the RSA is uncertain. PREPA, during the pendency of the agreements, has suspended deposits into its debt service fund.


157


PRHTA

Puerto Rico Aqueduct and Sewer Authority (PRASA). As of December 31, 2015,2016, the Company had $909$373 million of insured net par outstanding to PRASA bonds, which are secured by the gross revenues of PRHTA (Transportation revenue)the water and sewer system. On September 15, 2015, PRASA entered into a settlement with the U.S.Department of Justice and the U.S. Environmental Protection Agency that requires it to spend $1.6 billion to upgrade and improve its sewer system island-wide. According to a material event notice PRASA filed on March 4, 2016, PRASA owed its contractors $140 million. The PRASA Revitalization Act, which establishes a securitization mechanism that could facilitate debt issuance, was signed into law on July 13, 2016. While certain bonds and $370 million net par of PRHTA (Highway revenue) bonds. In March 2015, legislation was passedbenefiting from a guarantee by the Commonwealth are subject to an executive order issued under the Moratorium Act, bonds insured by the Company are not subject to that order. There were sufficient funds in the Commonwealth that would have supported proposals involvingPRASA bond accounts to make the GDBJuly 1, 2016 and PRIFA and would have, among other things, strengthened PRHTA. The proposals involved the issuance of up to $2.95 billion of bondsJanuary 1, 2017 PRASA bond payments guaranteed by PRIFA, but the Company, believes the Commonwealth is no longer pursuingand those proposals. In addition, PRHTA is one of the public corporations affected by the Clawback Orders.payments were made in full.

Municipal Finance Agency
(MFA). As of December 31, 2015,2016, the Company had $387$334 million net par outstanding of bonds issued by the Puerto Rico Municipal Finance Agency (“MFA”)MFA secured by a pledge of local property tax revenues. On October 13, 2015,There were sufficient funds in the MFA bond accounts to make the July 1, 2016 and January 1, 2017 MFA bond payments guaranteed by the Company, filedand those payments were made in full.

Puerto Rico Sales Tax Financing Corporation (COFINA). As of December 31, 2016, the Company had $271 million insured net par outstanding of junior COFINA bonds, which are secured primarily by a motionsecond lien on certain sales and use taxes. There were no debt service payments due on July 1, 2016, or January 1, 2017, on Company-insured COFINA bonds, and, as of the date of this filing, all payments on Company-insured COFINA bonds had been made.

University of Puerto Rico (U of PR). As of December 31, 2016, the Company had $1 million insured net par outstanding of U of PR bonds, which are general obligations of the university and are secured by a subordinate lien on the proceeds, profits and other income of the University, subject to intervene in litigation between Centro de Recaudación de Ingresos Municipales (“CRIM”)a senior pledge and lien for the GDB in which CRIM was seekingbenefit of outstanding university system revenue bonds. The U of PR bonds are subject to ensure thatan executive order issued under the pledged tax revenuesMoratorium Act. There were no debt service payments due on July 1, 2016, or January 1, 2017 on Company-insured U of PR bonds, and, as of the date of this filing, all payments on Company-insured U of PR bonds had been made.


All Puerto Rico exposures are and will continue to be, available to support the MFA bonds. While the Company’s motion to intervene was denied, the GDB and CRIM have reported that they executed a new deed of trust that requires the GDB, as fiduciary, to keep the pledged tax revenues separate from any other GDB monies or accounts and that governs the manner in which the pledged revenues may be invested and dispersed.
internally rated BIG. The following tables show the Company’s insured exposure to general obligation bonds of Puerto Rico and various obligations of its related authorities and public corporations.

Puerto Rico
Gross Par and Gross Debt Service Outstanding

 Gross Par Outstanding Gross Debt Service Outstanding
 December 31,
2015
 December 31,
2014
 December 31,
2015
 December 31,
2014
 (in millions)
Previously Subject to the Voided Recovery Act (1)$2,965
 $3,058
 $5,162
 $5,326
Not Previously Subject to the Voided Recovery Act2,790
 2,977
 4,470
 4,748
   Total$5,755
 $6,035
 $9,632
 $10,074
 Gross Par Outstanding Gross Debt Service Outstanding
 December 31,
2016
 December 31,
2015
 December 31,
2016
 December 31,
2015
 (in millions)
Exposure to Puerto Rico$5,435
 $5,755
 $9,038
 $9,632
 ____________________
(1)On February 6, 2015, the U.S. District Court for the District of Puerto Rico ruled that the Recovery Act is preempted by the U.S. Bankruptcy Code and is therefore void. On July 6, 2015, the U.S. Court of Appeals for the First Circuit upheld that ruling, and on December 4, 2015, the U.S. Supreme Court granted petitions for writs of certiorari relating to that ruling.

158


Puerto Rico
Net Par Outstanding

 As of
December 31, 2016
 As of
December 31, 2015
 (in millions)
Commonwealth Constitutionally Guaranteed   
Commonwealth of Puerto Rico - General Obligation Bonds (1)$1,476
 $1,615
Puerto Rico Public Buildings Authority (1)169
 188
Public Corporations - Certain Revenues Potentially Subject to Clawback   
PRHTA (Transportation revenue) (1) (2)918
 909
PRHTA (Highways revenue)350
 370
PRCCDA152
 164
PRIFA (1)18
 18
Other Public Corporations   
PREPA724
 744
PRASA373
 388
MFA334
 387
COFINA271
 269
U of PR1
 1
Total net exposure to Puerto Rico$4,786
 $5,053
____________________
  As of
December 31, 2015
 As of
December 31, 2014
  Total(1) Internal Rating Total Internal Rating
  (in millions)
Exposures Previously Subject to the Voided Recovery Act:        
PRHTA (Transportation revenue) (2) $909
 CCC- $844
 BB-
PREPA 744
 CC 772
 B-
Puerto Rico Aqueduct and Sewer Authority 388
 CCC 384
 BB-
PRHTA (Highway revenue) (2) 370
 CCC 273
 BB
Puerto Rico Convention Center District Authority ("PRCCDA")(2) 164
 CCC- 174
 BB-
Total 2,575
   2,447
  
         
Exposures Not Previously Subject to the Voided Recovery Act:        
Commonwealth of Puerto Rico - General Obligation Bonds 1,615
 CCC 1,672
 BB
MFA 387
 CCC- 399
 BB-
Puerto Rico Sales Tax Financing Corporation 269
 CCC+ 269
 BBB
Puerto Rico Public Buildings Authority 188
 CCC 100
 BB
GDB 
  33
 BB
PRIFA (2) (3) 18
 CCC- 18
 BB-
University of Puerto Rico 1
 CCC- 1
 BB-
Total 2,478
   2,492
  
Total net exposure to Puerto Rico $5,053
   $4,939
  
(1)    As of the date of this filing, the Company has paid claims on these credits.
____________________
(1)As of December 31, 2015, the Company's Puerto Rico net exposures increased due to (1) net par of $385 million acquired in the Radian Asset Acquisition, of which $21 million was of PREPA and $166 million of PRHTA, and (2) a commutation of previously ceded Puerto Rico exposures.
(2)The Governor issued executive orders on November 30, 2015, and December 8, 2015, directing the Puerto Rico Department of Treasury and the Puerto Rico Tourism Company to retain or transfer certain taxes and revenues pledged to secure the payment of bonds issued by PRHTA, PRIFA and PRCCDA. On January 7, 2016 the Company sued various Puerto Rico governmental officials in the United States District Court, District of Puerto Rico asserting that this attempt to “claw back” pledged taxes and revenues is unconstitutional, and demanding declaratory and injunctive relief.  

(3)On January 1, 2016 PRIFA defaulted on full payment of a portion of the interest due on its bonds on that date. For those PRIFA bonds the Company had insured, the Company paid approximately $451 thousand of claims for the interest payments on which PRIFA had defaulted.
(2)    The December 31, 2016 amount includes $46 million of net par from the CIFG Acquisition.


159


The following table shows the scheduled amortization of the insured general obligation bonds of Puerto Rico and various obligations of its related authorities and public corporations. The Company guarantees payments of interest and principal when those amounts are scheduled to be paid and cannot be required to pay on an accelerated basis. In the event that obligors default on their obligations, the Company would only be required to pay the shortfall between the principal and interest due in any given period and the amount paid by the obligors.

Amortization Schedule of Puerto Rico Net Par Outstanding
and Net Debt Service Outstanding
As of December 31, 20152016

 Scheduled Net Par Amortization Scheduled Net Debt Service Amortization 
 Previously Subject to the Voided Recovery Act Not Previously Subject to the Voided Recovery Act Total Previously Subject to the Voided Recovery Act Not Previously Subject to the Voided Recovery Act Total 
 (in millions) 
2016$98
 $204
 $302
 $229
 $330
 $559
 
201751
 171
 222
 175
 289
 464
 
201856
 123
 179
 178
 232
 410
 
201974
 130
 204
 192
 232
 424
 
202087
 183
 270
 202
 280
 482
 
202166
 59
 125
 177
 146
 323
 
202247
 68
 115
 153
 152
 305
 
2023110
 41
 151
 214
 123
 337
 
202489
 85
 174
 188
 164
 352
 
2025111
 85
 196
 206
 157
 363
 
2026 - 2030590
 352
 942
 973
 659
 1,632
 
2031 - 2035583
 548
 1,131
 838
 763
 1,601
 
2036 - 2040308
 263
 571
 427
 348
 775
 
2041 - 2045137
 166
 303
 207
 182
 389
 
2046 - 2047168
 
 168
 181
 
 181
 
Total$2,575
 $2,478
 $5,053
 $4,540
 $4,057
 $8,597
 
 Scheduled Net Par Amortization Scheduled Net Debt Service Amortization
 (in millions)
2017 (January 1 - March 31)$0
 $118
2017 (April 1 - June 30)0
 2
2017 (July 1 - September 30)220
 339
2017 (October 1 - December 31)0
 2
Subtotal 2017220
 461
2018175
 408
2019206
 429
2020266
 480
2021125
 326
2022-2026869
 1,759
2027-2031889
 1,534
2032-20361,201
 1,612
2037-2041417
 588
2042-2047418
 492
Total$4,786
 $8,089


Exposure to the Selected European Countries

Several European countries continue to experience significant economic, fiscal and/or political strains such that the likelihood of default on obligations with a nexus to those countries may be higher than the Company anticipated when such factors did not exist. The European countries where the Company has exposure and believes heightened uncertainties exist are: Hungary, Italy, Portugal, Spain and SpainTurkey (collectively, the “SelectedSelected European Countries”)Countries). The Company is closely monitoringadded Turkey to its exposures in thelist of Selected European Countries where it believes heightened uncertainties exist.in 2016, as a result of the recent political turmoil in the country. The Company’s direct economic exposure to the Selected European Countries (based on par for financial guaranty contracts and notional amount for financial guaranty contracts accounted for as derivatives) is shown in the following table, net of ceded reinsurance.


160


Net Direct Economic Exposure to Selected European Countries(1)
As of December 31, 20152016

 Hungary Italy Portugal Spain Total
 (in millions)
Sub-sovereign exposure: 


Non-infrastructure public finance(2)$
 $780
 $85
 $240
 $1,105
Infrastructure finance271
 10
 
 120
 401
Total sub-sovereign exposure271
 790
 85
 360
 1,506
Non-sovereign exposure: 


Regulated utilities
 212
 
 
 212
RMBS and other structured finance170
 244
 
 13
 427
Total non-sovereign exposure170
 456
 
 13
 639
Total$441
 $1,246
 $85
 $373
 $2,145
Total BIG (See Note 5)$374
 $
 $85
 $373
 $832
 Hungary Italy Portugal Spain Turkey Total
 (in millions)
Sub-sovereign exposure(2)$236
 $880
 $76
 $342
 $
 $1,534
Non-sovereign exposure(3)114
 399
 
 
 202
 715
Total$350
 $1,279
 $76
 $342
 $202
 $2,249
Total BIG (See Note 5)$283
 $
 $76
 $342
 $
 $701
____________________
(1)
While the Company’s exposures are shown in U.S. dollars, the obligations the Company insures are in various currencies, primarily Euros. Oneeuros.
(2)
Sub-sovereign exposure in Selected European Countries includes transactions backed by receivables from, or supported by, sub-sovereigns, which are governmental or government-backed entities other than the ultimate governing body of the RMBS included in the table above includes residential mortgages in both Italy and Germany, and only the portion of the transaction equal to the portion of the original mortgage pool in Italian mortgages is shown in the table.country.

(2)(3)The
Non-sovereign exposure shown in the “Non-infrastructure public finance” category is from transactions backed by receivable payments from sub-sovereigns in Italy, Spain and Portugal. Sub-sovereign debt is debt issued by a governmental entity or government backed entity, or supported by such an entity, that is other than direct sovereignSelected European Countries includes debt of the ultimate governing body of the country.regulated utilities, RMBS and diversified payment rights (DPR) securitizations.

When the Company directly insures an obligation, it assigns the obligation to a geographic location or locations based on its view of the geographic location of the risk. The Company may also have direct exposures to the Selected European Countries in business assumed from unaffiliated monoline insurance companies, in which case the Company depends upon geographic information provided by the primary insurer.

The Company's $202 million net insured par exposure in Turkey is to DPR securitizations sponsored by a major Turkish bank. These DPR securitizations were established outside of Turkey and involve payment orders in U.S. dollars, pounds sterling and Euros from persons outside of Turkey to beneficiaries in Turkey who are customers of the sponsoring bank. The sponsoring bank's correspondent banks have agreed to remit all such payments to a trustee-controlled account outside Turkey, where debt service payments for the DPR securitization are given priority over payments to the sponsoring bank.

The Company has excluded from the exposure tables above its indirect economic exposure to the Selected European Countries through policies it provides on pooled corporate and commercial receivables transactions. The Company calculates indirect exposure to a country by multiplying the par amount of a transaction insured by the Company times the percent of the relevant collateral pool reported as having a nexus to the country. On that basis, the Company has calculated exposure of $223$115 million to Selected European Countries (plus Greece) in transactions with $4.2$2.8 billion of net par outstanding. The indirect exposure to credits with a nexus to Greece is $6$3 million across several highly rated pooled corporate obligations with net par outstanding of $244$129 million.


161


5.Expected Loss to be Paid
 
The insured portfolio includes policies accounted for under three separate accounting models depending on the characteristics of the contract and the Company's control rights. The Company has paid and expects to pay future losses on policies which fall under each of the three accounting models. The following provides a summarized description of the three accounting models prescribed by GAAP with a reference to the notes that describe the accounting policies and required disclosures throughout this report. The three models are: (1) insurance, (2) derivative and (3) VIE consolidation.

In order to effectively evaluate and manage the economics and liquidity of the entire insured portfolio, management compiles and analyzes loss information for all policies on a consistent basis. The Company monitors and assigns ratings and calculates expected losses in the same manner for all its exposures regardless of form or differing accounting models.

This note provides information regarding expected claim payments to be made under all contracts in the insured portfolio.portfolio, regardless of the accounting model. Net expected loss to be paid in the tables below consists of the present value of future: expected claim and LAE payments, expected recoveries in the transaction structures, cessions to reinsurers, and expected recoveries for breaches of representations and warranties ("R&W")(R&W) and other loss mitigation strategies. Expected loss to be paid is important from a liquidity perspective in that it represents the present value of amounts that the Company expects to

pay or recover in future periods, regardless of the accounting model. Expected loss to be paid is an important measure used by management to analyze the net economic loss on all contacts.contracts.

Accounting Policy

Insurance Accounting

For contracts accounted for as financial guaranty insurance, loss and LAE reserve is recorded only to the extent and for the amount that expected losses to be paid, exceed unearned premium reserve. As a result, the Company has expected loss to be paid that have not yet been expensed. Such amounts will be recognized in future periods as deferred premium revenue amortizes into income. Expected loss to be expensed is important because it presentsrepresents the Company's projection of incurred losses that will be recognized in future periods (excluding accretion of discount). See "Financial Guaranty Insurance Losses" in Note 6, Financial GuarantyContracts Accounted for as Insurance.

Derivative Accounting, at Fair Value

For contracts that do not meet the financial guaranty scope exception in the derivative accounting guidance (primarily due to the fact that the insured is not required to be exposed to the insured risk throughout the life of the contract), the Company records such credit derivative contracts at fair value on the consolidated balance sheet with changes in fair value recorded in the consolidated statement of operations. The fair value recorded on the balance sheet represents an exit price in a hypothetical market because the Company does not trade its credit derivative contracts. The fair value is determined using significant Level 3 inputs in an internally developed model while the expected loss to be paid (which represents the net present value of expected cash outflows) uses methodologies and assumptions consistent with financial guaranty insurance expected losses to be paid. See Note 7, Fair Value Measurement and Note 8, Financial Guaranty Contracts Accounted for as Credit Derivatives.

VIE Consolidation, at Fair Value

For financial guaranty (FG) insurance contracts issued on the debt of variable interest entities over which the Company is deemed to be the primary beneficiary due to its control rights, as defined in GAAP, the Company consolidates the FG VIE. The Company carries the assets and liabilities of the FG VIEs at fair value under the fair value option election.option. Management assesses the expected losses on the insured debt of the consolidated FG VIEs in the same manner as other financial guaranty insurance and credit derivative contracts. See Note 9, Consolidated Variable Interest Entities.
     
Expected Loss to be Paid

The expected loss to be paid is equal to the present value of expected future cash outflows for claim and LAE payments, net of inflows for expected salvage and subrogation (e.g., excess spread on the underlying collateral, and expected and contractual recoveries for breaches of R&W or other expected recoveries), using current risk-free rates. When the Company becomes entitled to the cash flow from the underlying collateral of an insured credit under salvage and subrogation rights as a result of a claim payment or estimated future claim payment, it reduces the expected loss to be paid on the contract. Net expected loss to be paid is defined as expected loss to be paid, net of amounts ceded to reinsurers.


162


The current risk-free rate is based on the remaining period of the contract used in the premium revenue recognition calculation (i.e., the contractual or expected period, as applicable). The Company updates the discount rate each quarter and recordsreflects the effect of such changes in economic loss development. Expected cash outflows and inflows are probability weighted cash flows that reflect the likelihood of all possible expected outcomes. The Company estimates the expected cash outflows and inflows using management's assumptions about the likelihood of all possible outcomes based on all information available to it. Those assumptions consider the relevant facts and circumstances and are consistent with the information tracked and monitored through the Company's risk-management activities.

Economic Loss Development

Economic loss development represents the change in net expected loss to be paid attributable to the effects of changes in assumptions based on observed market trends, changes in discount rates, accretion of discount and the economic effects of loss mitigation efforts.

Expected loss to be paid and economic loss development include the effects of loss mitigation strategies such as negotiated and estimated recoveries for breaches of R&W, and purchases of insured debt obligations. Additionally, in certain cases, issuers of insured obligations elected, or the Company and an issuer mutually agreed as part of a negotiation, to deliver the underlying collateral or insured obligation to the Company.

In circumstances where the Company has purchased its own insured obligations that have expected losses, expected loss to be paid is reduced by the proportionate share of the insured obligation that is held in the investment portfolio. The difference between the purchase price of the obligation and the fair value excluding the value of the Company's insurance is treated as a paid loss. Assets that are purchased by the Company are recorded in the investment portfolio, at fair value, excluding the value of the Company's insurance. See Note 10, Investments and Cash and Note 7, Fair Value Measurement.

Loss Estimation Process
 
The Company’s loss reserve committees estimate expected loss to be paid for all contracts by reviewing analyses that consider various scenarios with corresponding probabilities assigned to them. Depending upon the nature of the risk, the Company’s view of the potential size of any loss and the information available to the Company, that analysis may be based upon individually developed cash flow models, internal credit rating assessments and sector-driven loss severity assumptions or judgmental assessments. In the case of its assumed business, the Company may conduct its own analysis as just described or, depending on the Company’s view of the potential size of any loss and the information available to the Company, the Company may use loss estimates provided by ceding insurers. The Company monitors the performance of its transactions with expected losses and each quarter the Company’s loss reserve committees review and refresh their loss projection assumptions and scenarios and the probabilities they assign to those scenarios based on actual developments during the quarter and their view of future performance.

The financial guaranties issued by the Company insure the credit performance of the guaranteed obligations over an extended period of time, in some cases over 30 years, and in most circumstances the Company has no right to cancel such financial guaranties. As a result, the Company's estimate of ultimate losses on a policy is subject to significant uncertainty over the life of the insured transaction. Credit performance can be adversely affected by economic, fiscal and financial market variability over the long durationlife of most contracts.

The determination of expected loss to be paid is an inherently subjective process involving numerous estimates, assumptions and judgments by management, using both internal and external data sources with regard to frequency, severity of loss, economic projections, governmental actions, negotiations and other factors that affect credit performance. These estimates, assumptions and judgments, and the factors on which they are based, may change materially over a quarter,reporting period, and as a result the Company’s loss estimates may change materially over that same period.

Changes over a quarter in the Company’s loss estimates for structured finance transactions generally will be influenced by factors impacting the performance of the assets supporting those transactions. For example, changes over a quarterreporting period in the Company’s loss estimates for its RMBS transactions may be influenced by such factors as the level and timing of loan defaults experienced; changes in housing prices; results from the Company's loss mitigation activities; and other variables.

Similarly, changes over a quarterreporting period in the Company’s loss estimates for municipal obligations supported by specified revenue streams, such as revenue bonds issued by toll road authorities, municipal utilities or airport authorities, generally will be influenced by factors impacting their revenue levels, such as changes in demand; changing demographics; and other economic factors, especially if the obligations do not benefit from financial support from other tax revenues or governmental authorities.    On the other hand, changesChanges over a quarterreporting period in the Company’s loss estimates for its tax-supported public finance transactions generally will be influenced by factors impacting the public issuer’s ability and willingness to pay, such as changes in the economy and population of the relevant area; changes in the issuer’s

163


ability or willingness to raise taxes, decrease spending or receive federal assistance; new legislation; rating agency downgrades that reduce the issuer’s ability to refinance maturing obligations or issue new debt at a reasonable cost; changes in the priority or amount of pensions and other obligations owed to workers; developments in restructuring or settlement negotiations; and other political and economic factors.

The Company does not use traditional actuarial approaches to determine its estimates of expected losses. Actual losses will ultimately depend on future events or transaction performance and may be influenced by many interrelated factors that are difficult to predict. As a result, the Company's current projections of probable and estimable losses may be subject to considerable volatility and may not reflect the Company's ultimate claims paid.

In some instances, the terms of the Company's policy gives it the option to pay principal losses that have been recognized in the transaction but which it is not yet required to pay, thereby reducing the amount of guaranteed interest due in the future. The Company has sometimes exercised this option, which uses cash but reduces projected future losses.


The following tables present a roll forward of the present value of net expected loss to be paid for all contracts, whether accounted for as insurance, credit derivatives or FG VIEs, by sector, after the benefit for expected recoveries for breaches of R&W orand other expected recoveries. The Company used weighted average risk-free rates for U.S. dollar denominated obligations, that ranged from 0.0% to 3.25%3.23% with a weighted average of 2.73% as of December 31, 20152016 and 0.0% to 2.95%3.25% with a weighted average of 2.36% as of December 31, 2014.2015.

Net Expected Loss to be Paid
After Net Expected Recoveries for Breaches of R&W
Roll Forward

Year Ended December 31,
Year Ended December 31, 20152016 2015
(in millions)(in millions)
Net expected loss to be paid, beginning of period$1,169
$1,391
 $1,169
Net expected loss to be paid on the CIFGH portfolio as of July 1, 201622
 
Net expected loss to be paid on Radian Asset portfolio as of April 1, 2015190

 190
Economic loss development due to:    
Accretion of discount32
26
 32
Changes in discount rates(23)(15) (23)
Changes in timing and assumptions310
128
 310
Total economic loss development319
139
 319
Paid losses(287)(354) (287)
Net expected loss to be paid, end of period$1,391
$1,198
 $1,391


164


Net Expected Loss to be Paid
After Roll Forward by Sector
Year Ended December 31, 2016

 
Net Expected
Loss to be
Paid (Recovered) as of
December 31, 2015(2)
 Net Expected
Loss to be
Paid 
(Recovered)
on CIFG as of
July 1, 2016
 
Economic Loss
Development
 
(Paid)
Recovered
Losses (1)
 Net Expected
Loss to be
Paid (Recovered) as of
December 31, 2016 (2)
 (in millions)
Public finance:         
U.S. public finance$771
 $40
 $276
 $(216) $871
Non-U.S. public finance38
 2
 (7) 
 33
Public finance809
 42
 269
 (216) 904
Structured finance:         
U.S. RMBS409
 (22) (91) (90) 206
Triple-X life insurance transactions99
 
 (22) (23) 54
Other structured finance74
 2
 (17) (25) 34
Structured finance582
 (20) (130) (138) 294
Total$1,391
 $22
 $139
 $(354) $1,198


Net Expected Recoveries for Breaches of R&WLoss to be Paid
Roll Forward by Sector
Year Ended December 31, 2015

 
Net Expected
Loss to be
Paid (Recovered) as of
December 31, 2014(2)
 Net Expected
Loss to be
Paid 
(Recovered)
on Radian Asset portfolio as of
April 1, 2015
 
Economic Loss
Development
 
(Paid)
Recovered
Losses(1)
 Net Expected
Loss to be
Paid (Recovered) as of
December 31, 2015 (2)
 (in millions)
Public Finance:         
U.S. public finance$303
 $81
 $416
 $(29) $771
Non-U.S. public finance45
 4
 (11) 
 38
Public Finance348
 85
 405
 (29) 809
Structured Finance:         
U.S. RMBS: 


First lien: 


Prime first lien4
 
 (1) (5) (2)
Alt-A first lien304
 7
 (126) (58) 127
Option ARM(16) 0
 (16) 4
 (28)
Subprime303
 (4) 19
 (67) 251
Total first lien595
 3
 (124) (126) 348
Second lien(11) 1
 42
 29
 61
Total U.S. RMBS584
 4
 (82) (97) 409
Triple-X life insurance transactions161
 
 11
 (73) 99
TruPS23
 
 (18) 
 5
Student loans68
 
 (9) (5) 54
Other structured finance(15) 101
 12
 (83) 15
Structured Finance821
 105
 (86) (258) 582
Total$1,169
 $190
 $319
 $(287) $1,391


165


Net Expected Loss to be Paid
After Net Expected Recoveries for Breaches of R&W
Roll Forward by Sector
Year Ended December 31, 2014

 
Net Expected
Loss to be
Paid (Recovered) as of
December 31, 2013
 
Economic Loss
Development
 
(Paid)
Recovered
Losses(1)
 Net Expected
Loss to be
Paid (Recovered) as of
December 31, 2014 (2)
 (in millions)
Public Finance:       
U.S. public finance$264
 $183
 $(144) $303
Non-U.S. public finance57
 (12) 
 45
Public Finance321
 171
 (144) 348
Structured Finance:       
U.S. RMBS: 


First lien: 


Prime first lien21
 (16) (1) 4
Alt-A first lien304
 (144) 144
 304
Option ARM(9) (59) 52
 (16)
Subprime304
 (7) 6
 303
Total first lien620
 (226) 201
 595
Second lien(127) (42) 158
 (11)
Total U.S. RMBS493
 (268) 359
 584
Triple-X life insurance transactions75
 92
 (6) 161
TruPS51
 (28) 
 23
Student loans52
 16
 0
 68
Other structured finance(10) (13) 8
 (15)
Structured Finance661
 (201) 361
 821
Total$982
 $(30) $217
 $1,169
 
Net Expected
Loss to be
Paid (Recovered) as of
December 31, 2014
 Net Expected
Loss to be
Paid 
(Recovered)
on Radian Asset portfolio as of
April 1, 2015
 
Economic Loss
Development
 
(Paid)
Recovered
Losses (1)
 Net Expected
Loss to be
Paid (Recovered) as of
December 31, 2015 (2)
 (in millions)
Public finance:         
U.S. public finance$303
 $81
 $416
 $(29) $771
Non-U.S. public finance45
 4
 (11) 
 38
Public finance348
 85
 405
 (29) 809
Structured finance:         
U.S. RMBS584
 4
 (82) (97) 409
Triple-X life insurance transactions161
 
 11
 (73) 99
Other structured finance76
 101
 (15) (88) 74
Structured finance821
 105
 (86) (258) 582
Total$1,169
 $190
 $319
 $(287) $1,391
____________________
(1)
Net of ceded paid losses, whether or not such amounts have been settled with reinsurers. Ceded paid losses are typically settled 45 days after the end of the reporting period. Such amounts are recorded in reinsurance recoverable on paid losses included in other assets. The Company paid $25$16 million and $37$25 million in LAE for the years ended December 31, 20152016 and 2014,2015, respectively.

(2)Includes expected LAE to be paid of $12 million as of December 31, 20152016 and $16$12 million as of December 31, 2014.2015.


166


Future Net R&W Benefit
As of December 31, 2015, 2014 and 2013Recoverable (Payable)(1)
 
Future Net
R&W Benefit as of
December 31, 2015 (1)
 Future Net
R&W Benefit as of
December 31, 2014
 Future Net
R&W Benefit as of
December 31, 2013
Future Net
R&W Benefit as of
December 31, 2016
 Future Net
R&W Benefit as of
December 31, 2015
 Future Net
R&W Benefit as of
December 31, 2014
(in millions)(in millions)
U.S. RMBS:          
First lien$0
 $232
 $569
$(53) $0
 $232
Second lien79
 85
 143
47
 79
 85
Total$79
 $317
 $712
$(6) $79
 $317
____________________
(1)
The Company’s agreements with R&W providers generally provide that, as the Company makes claim payments, the R&W providers reimburse it for those claims; if the Company later receives reimbursement through the transaction (for example, from excess spread), the Company repays the R&W providers. See the section "Breaches“Breaches of Representations and Warranties" belowWarranties” for eligible assets heldinformation about the R&W agreements. When the Company projects receiving more reimbursements in trust.the future than it projects paying in claims on transactions covered by R&W settlement agreements, the Company will have a net R&W payable.


The following tables presenttable presents the present value of net expected loss to be paid for all contracts by accounting model, by sector and after the benefit for estimated and contractualexpected recoveries for breaches of R&W.  

Net Expected Loss to be Paid (Recovered)
By Accounting Model
As of December 31, 2015
 
Financial
Guaranty
Insurance
 FG VIEs(1) and Other Credit
Derivatives(2)
 Total
 (in millions)
Public Finance:       
U.S. public finance$771
 $
 $0
 $771
Non-U.S. public finance38
 
 
 38
Public Finance809
 
 
 809
Structured Finance:       
U.S. RMBS: 


First lien: 


Prime first lien2
 
 (4) (2)
Alt-A first lien110
 17
 0
 127
Option ARM(27) 
 (1) (28)
Subprime153
 59
 39
 251
Total first lien238
 76
 34
 348
Second lien13
 44
 4
 61
Total U.S. RMBS251
 120
 38
 409
Triple-X life insurance transactions88
 
 11
 99
TruPS0
 
 5
 5
Student loans54
 
 
 54
Other structured finance37
 16
 (38) 15
Structured Finance430
 136
 16
 582
Total$1,239
 $136
 $16
 $1,391


167

Table of Contents

Net Expected Loss to be Paid (Recovered)
By Accounting Model
As of December 31, 2014

 
Financial
Guaranty
Insurance
 FG VIEs(1) and Other Credit
Derivatives(2)
 Total
 (in millions)
Public Finance:       
U.S. public finance$303
 $
 $
 $303
Non-U.S. public finance45
 
 
 45
Public Finance348
 
 
 348
Structured Finance:       
U.S. RMBS: 
    
  
First lien: 
    
  
Prime first lien2
 
 2
 4
Alt-A first lien288
 17
 (1) 304
Option ARM(15) 
 (1) (16)
Subprime163
 71
 69
 303
Total first lien438
 88
 69
 595
Second lien(53) 38
 4
 (11)
Total U.S. RMBS385
 126
 73
 584
Triple-X life insurance transactions153
 
 8
 161
TruPS1
 
 22
 23
Student loans68
 
 
 68
Other structured finance34
 (4) (45) (15)
Structured Finance641
 122
 58
 821
Total$989
 $122
 $58
 $1,169
 As of December 31, 2016 As of December 31, 2015
 Public Finance Structured Finance Total Public Finance Structured Finance Total
 (in millions)
Financial guaranty insurance$904
 $179
 $1,083
 $809
 $430
 $1,239
FG VIEs (1) and other
 105
 105
 
 136
 136
Credit derivatives (2)0
 10
 10
 
 16
 16
Total$904
 $294
 $1,198
 $809
 $582
 $1,391
________________________
(1)    Refer to Note 9, Consolidated Variable Interest Entities.

(2)    Refer to Note 8, Financial Guaranty Contracts Accounted for as Credit Derivatives.


168

Table of Contents

The following tables presenttable presents the net economic loss development for all contracts by accounting model, by sector and after the benefit for estimated and contractualexpected recoveries for breaches of R&W.

Net Economic Loss Development (Benefit)
By Accounting Model
Year Ended December 31, 2015
 
Financial
Guaranty
Insurance
 FG VIEs(1) and Other 
Credit
Derivatives(2)
 Total
 (in millions)
Public Finance:       
U.S. public finance$421
 $
 $(5) $416
Non-U.S. public finance(11) 
 
 (11)
Public Finance410
 
 (5) 405
Structured Finance:       
U.S. RMBS: 


First lien: 


Prime first lien0
 
 (1) (1)
Alt-A first lien(49) 0
 (77) (126)
Option ARM(17) 
 1
 (16)
Subprime9
 11
 (1) 19
Total first lien(57) 11
 (78) (124)
Second lien35
 7
 
 42
Total U.S. RMBS(22) 18
 (78) (82)
Triple-X life insurance transactions6
 
 5
 11
TruPS(1) 
 (17) (18)
Student loans(9) 
 
 (9)
Other structured finance1
 (2) 13
 12
Structured Finance(25) 16
 (77) (86)
Total$385
 $16
 $(82) $319


169

Table of Contents

Net Economic Loss Development (Benefit)
By Accounting Model
Year Ended December 31, 2014

 
Financial
Guaranty
Insurance
 FG VIEs(1) and Other 
Credit
Derivatives(2)
 Total
 (in millions)
Public Finance:       
U.S. public finance$183
 $
 $
 $183
Non-U.S. public finance(10) 
 (2) (12)
Public Finance173
 
 (2) 171
Structured Finance:       
U.S. RMBS: 
    
  
First lien: 
    
  
Prime first lien
 
 (16) (16)
Alt-A first lien(87) (13) (44) (144)
Option ARM(48) 1
 (12) (59)
Subprime(15) 6
 2
 (7)
Total first lien(150) (6) (70) (226)
Second lien(130) 91
 (3) (42)
Total U.S. RMBS(280) 85
 (73) (268)
Triple-X life insurance transactions86
 
 6
 92
TruPS(2) 
 (26) (28)
Student loans16
 
 
 16
Other structured finance(5) (1) (7) (13)
Structured Finance(185) 84
 (100) (201)
Total$(12) $84
 $(102) $(30)
 Year Ended December 31, 2016 Year Ended December 31, 2015
 Public Finance Structured Finance Total Public Finance Structured Finance Total
 (in millions)
Financial guaranty insurance$269
 $(105) $164
 $410
 $(25) $385
FG VIEs (1) and other
 (8) (8) 
 16
 16
Credit derivatives (2)
 (17) (17) (5) (77) (82)
Total$269
 $(130) $139
 $405
 $(86) $319
______________________
(1)    Refer to Note 9, Consolidated Variable Interest Entities.

(2)    Refer to Note 8, Financial Guaranty Contracts Accounted for as Credit Derivatives.


Selected U.S. Public Finance Transactions
    
The Company insures general obligation bonds of the Commonwealth of Puerto Rico and various obligations of its related authorities and public corporations aggregating $5.1$4.8 billion net par as of December 31, 2015,2016, all of which are BIG. For additional information regarding the Company's exposure to general obligations of Commonwealth of Puerto Rico and various obligations of its related authorities and public corporations, please refer to "Exposure to Puerto Rico" in Note 4, Outstanding Exposure.

On February 25, 2015, a plan of adjustment resolving the bankruptcy filing of the City of Stockton, California under chapter 9 of the U.S. Bankruptcy Code became effective. As of December 31, 2015,2016, the Company’s net exposurepar subject to the plan consists of $115$113 million of pension obligation bonds. As part of the plan settlement, the City will repay the pension obligation bonds from certain fixed payments and certain variable payments contingent on the City's revenue growth. The Company agreed as part of the plan to cancel its $40 million of the City’s lease revenue bonds in exchange for the irrevocable option to take title to the office building that served as collateral for the lease revenue bonds. The Company also receives net rental payments from the office building. The Company no longer reflects the canceled lease revenue bonds as outstanding insured net par, but instead the financial statements reflect an investment in the office building and related lease revenue and expenses. As of December 31, 2015, the office building is carried at approximately $29 million and is reported as part of Other Assets.


170

Table of Contents

As a result of the Radian Asset Acquisition, the Company has approximately $21 million of net par exposure as of December 31, 2015 to bonds issued by Parkway East Public Improvement District, which is located in Madison County, Mississippi. The bonds, which are rated BIG, are payable from special assessments on properties within the District, as well as amounts paid under a contribution agreement with the County in which the County covenants that it will provide funds in the event special assessments are not sufficient to make a debt service payment. The special assessments have not been sufficient to pay debt service in full. In earlier years, the County provided funding to cover the balance of the debt service requirement, but the County now claims that the District’s failure to reimburse it within the two years stipulated in the contribution agreement means that the County is not required to provide funding until it is reimbursed. A declaratory judgment action is pending against the District and the County to establish the Company's rights under the contribution agreement. See "Recovery Litigation" below.

The Company also has $15.0 billion of net par exposure to healthcare transactions. The BIG net par outstanding in this sector is $351 million, $242 million of which was acquired as part of the Radian Asset Acquisition.

The Company projects that its total net expected loss across its troubled U.S. public finance credits as of December 31, 2015,2016, including those mentioned above, which incorporated the likelihood of the various outcomes, will be $771$871 million,

compared with a net expected loss of $303$771 million as of December 31, 2014.2015. On AprilJuly 1, 2015,2016, the Radian AssetCIFG Acquisition added $81$40 million in net expectedeconomic losses to be paid for U.S. public finance credits. Economic loss development in 20152016 was $416$276 million, which was primarily attributable to Puerto Rico exposures.

Certain Selected European Country Sub-Sovereign Transactions

The Company insures and reinsures credits with sub-sovereign exposure to various Spanish and Portuguese issuers where a Spanish and Portuguese sovereign default may cause the sub-sovereigns also to default. The Company's gross exposure net of reinsurance to these Spanish and Portuguese credits is $452$342 million and $91 million, respectively, and exposure net of reinsurance for Spanish and Portuguese credits is $360 million and $85$76 million, respectively. The Company rates most of these issuers in the BB categoryBIG due to the financial condition of Spain and Portugal and their dependence on the sovereign. The Company's Hungary exposure is to infrastructure bonds dependent on payments from Hungarian governmental entities. The Company's gross exposure net of reinsurance to these Hungarian credits is $274 million and its exposure net of reinsurance is $271$236 million, all of which is rated BIG. The Company estimated net expected losses of $35$29 million related to these Spanish, Portuguese and Hungarian credits. The economic benefit of approximately $11$7 million during 20152016 was primarily related to changes in the exchange rate between the Euroeuro and US Dollar and certain assumption updates.U.S. Dollar.
 
Infrastructure Finance

As of December 31, 2015, the Company had exposure of approximately $2.9 billion to infrastructure transactions with refinancing risk. The Company may be required to make claim payments on such exposure, the aggregate amount of the claim payments may be substantial and, although the Company may not experience ultimate loss on a particular transaction, reimbursement may not occur for an extended time. These transactions generally involve long-term infrastructure projects that were financed by bonds that mature prior to the expiration of the project concession. The Company expects the cash flows from these projects to be sufficient to repay all of the debt over the life of the project concession, but also expects the debt to be refinanced in the market at or prior to its maturity. If the issuer is unable to refinance the debt due to market conditions, the Company may have to pay a claim when the debt matures, and then recover from cash flows produced by the project in the future. The Company generally projects that in most scenarios it will be fully reimbursed for such claim payments. However, the recovery of such amounts is uncertain and may take from 10 to 35 years, depending on the transaction and the performance of the underlying collateral. As of December 31, 2015, the Company estimated total claims for the two largest transactions with significant refinancing risk, assuming no refinancing, and based on certain performance assumptions, could be $1.9 billion on a gross basis; such claims would occur from 2017 through 2022. Of such $1.9 billion in estimated gross claims, an estimated $1.3 billion related to obligations of Skyway Concession Company LLC (“SCC”), which owned the concession for the Chicago Skyway toll road. In November 2015, a consortium of three Canadian pension plans announced that they had reached agreement, subject to regulatory approvals and customary closing conditions, to purchase SCC for $2.8 billion. The sale was completed on February 25, 2016 and the various SCC obligations insured by the Company were retired without a claim on the Company.


171

Table of Contents

Approach to Projecting Losses in U.S. RMBS

The Company projects losses on its insured U.S. RMBS on a transaction-by-transaction basis by projecting the performance of the underlying pool of mortgages over time and then applying the structural features (i.e., payment priorities and tranching) of the RMBS and any R&W agreements to the projected performance of the collateral over time. The resulting projected claim payments or reimbursements are then discounted using risk-free rates.
 
The further behind a mortgage borrower falls in making payments, the more likely it is that he or she will default. The rate at which borrowers from a particular delinquency category (number of monthly payments behind) eventually default is referred to as the “liquidation rate.” The Company derives its liquidation rate assumptions from observed roll rates, which are the rates at which loans progress from one delinquency category to the next and eventually to default and liquidation. The Company applies liquidation rates to the mortgage loan collateral in each delinquency category and makes certain timing assumptions to project near-term mortgage collateral defaults from loans that are currently delinquent.
 
Mortgage borrowers that are not more than one payment behind (generally considered performing borrowers) have demonstrated an ability and willingness to pay throughout the recession and mortgage crisis, and as a result are viewed as less likely to default than delinquent borrowers. Performing borrowers that eventually default will also need to progress through delinquency categories before any defaults occur. The Company projects how many of the currently performing loans will default and when they will default, by first converting the projected near term defaults of delinquent borrowers derived from liquidation rates into a vector of conditional default rates ("CDR")(CDR), then projecting how the CDR will develop over time. Loans that are defaulted pursuant to the conditional default rateCDR after the near-term liquidation of currently delinquent loans represent defaults of currently performing loans and projected re-performing loans. A conditional default rateCDR is the outstanding principal amount of defaulted loans liquidated in the current month divided by the remaining outstanding amount of the whole pool of loans (or “collateral pool balance”). The collateral pool balance decreases over time as a result of scheduled principal payments, partial and whole principal prepayments, and defaults.
 
In order to derive collateral pool losses from the collateral pool defaults it has projected, the Company applies a loss severity. The loss severity is the amount of loss the transaction experiences on a defaulted loan after the application of net proceeds from the disposal of the underlying property. The Company projects loss severities by sector based on its experience to date. The Company continues to update its evaluation of these loss severities as new information becomes available.
 
The Company has been enforcing claims for breaches of R&W regarding the characteristics of the loans included in the collateral pools, and by reaching agreements with certain R&W providers in early October 2015, has completed its active pursuit of significant R&W claims.pools. The Company calculates a credit for R&W recoveries to include in its cash flow projections based onprojections. Where the Company has an agreement with an R&W provider (such as its agreements it has with R&W providers,Bank of America and UBS, which are described in more detail under "Breaches of Representations and Warranties" below.below), that credit is based on the agreement. Where the Company does not have an agreement with the R&W provider but the Company believes the R&W provider to be economically viable, the Company estimates what portion of its past and projected future claims it believes will be reimbursed by that provider.

The Company projects the overall future cash flow from a collateral pool by adjusting the payment stream from the principal and interest contractually due on the underlying mortgages for the collateral losses it projects as described above; assumed voluntary prepayments; and servicer advances. The Company then applies an individual model of the structure of the transaction to the projected future cash flow from that transaction’s collateral pool to project the Company’s future claims and

claim reimbursements for that individual transaction. Finally, the projected claims and reimbursements are discounted using risk-free rates. The Company runs several sets of assumptions regarding mortgage collateral performance, or scenarios, and probability weights them.

The Company's RMBS loss projection methodology assumes that the housing and mortgage markets will continue improving. Each period the Company makes a judgment as to whether to change the assumptions it uses to make RMBS loss projections based on its observation during the period of the performance of its insured transactions (including early stage delinquencies, late stage delinquencies and loss severity) as well as the residential property market and economy in general, and, to the extent it observes changes, it makes a judgment as whether those changes are normal fluctuations or part of a trend.
 

Year-End 2016 Compared to Year-End 2015 U.S. RMBS Loss Projections
172

TableBased on its observation during the period of Contentsthe performance of its insured transactions (including early stage delinquencies, late stage delinquencies and loss severity) as well as the residential property market and economy in general, the Company chose to use the same general assumptions to project RMBS losses as of December 31, 2016 as it used as of December 31, 2015, except it (1) increased severities for specific vintages of Alt-A first lien, Option ARM and subprime transactions, (2) decreased liquidation rates for specific non-performing categories of subprime transactions and Option ARM and (3) increased liquidation rates for specific non-performing categories of second lien transactions. In 2016 the economic benefit was $68 million for first lien U.S. RMBS and $23 million for second lien U.S. RMBS.


Year-End 2015 Compared to Year-End 2014 U.S. RMBS Loss Projections

Based on its observation during the period of the performance of its insured transactions (including early stage delinquencies, late stage delinquencies and loss severity) as well as the residential property market and economy in general, the Company chose to use the same general assumptions to project RMBS losses as of December 31, 2015 as it used as of December 31, 2014, except that, for its first lien RMBS loss projections for 2015, it shortened by twelve months the period it is projecting it will take in the base case to reach the final CDR as compared with December 31, 2014. The methodology and revised assumptions the Company used to project first lien RMBS losses and the scenarios it employed are described in more detail below under " - U.S. First Lien RMBS Loss Projections: Alt A First Lien, Option ARM, Subprime and Prime", and the methodology and assumptions the Company uses to project second lien RMBS losses and the scenarios it employs are described in more detail below under " - U.S. Second Lien RMBS Loss Projections." In 2015 the economic benefit was $124 million for first lien U.S. RMBS and loss development was $42 million for second lien U.S. RMBS.
 

Year-End 2014 Compared to Year-End 2013 U.S. RMBS Loss Projections

Based on its observations of the performance of its insured transactions (including early stage delinquencies, late stage delinquencies and loss severity) as well as the residential property market and economy in general, the Company chose to use the same general methodology to project first lien RMBS losses as of December 31, 2014 as it used as of December 31, 2013, but it made a number of refinements to reflect its observations, notably:
updated the liquidation rates it uses on delinquent loans based on observations and on an assumption that loan modifications (which improve liquidation rates) would over the next year be less frequent than they were over the most recent year

updated the liquidation rate it uses for loans reported as current but that had been reported as modified over the previous twelve months, based on observed data

established a liquidation rate assumption for loans reported as current and not modified in the past twelve months but that had been reported as delinquent in the previous twelve months

established loss severity assumptions by vintage category as well as product type, rather than just product type as done previously

beginning with the third quarter 2014, each quarter shortened by three months the period it is projecting it will take in the base case to reach the final CDR

The Company estimated the impact of all of the refinements to its first lien RMBS assumptions described above to be a decrease of expected losses of approximately $42 million (before adjustments for settlements or loss mitigation purchases) in 2014.
Based on its observations of the performance of its insured transactions (including early stage delinquencies, late stage delinquencies and loss severity) as well as the residential property market and economy in general, the Company chose to use the same general methodology to project second lien RMBS losses as of December 31, 2014 as it used as of December 31, 2013, but it made a number of refinements to reflect its observations, notably with respect to most home equity lines of credit ("HELOC") projections to:
reflect increased recoveries on newly defaulted loans as well as previously defaulted loans

project incremental defaults associated with increased monthly payments that occur when interest-only periods end

increase the assumed final conditional prepayment rate ("CPR") from 10% to 15%

The net impact of the refinements in the first two bullet points, which were implemented in the third quarter 2014, was an increase of $36 million in expected losses in the Company's base case as of September 30, 2014. The net impact of the refinements in the third bullet point was an increase in $13 million in expected losses in the Company's base case as of December 31, 2014.

173


U.S. First Lien RMBS Loss Projections: Alt-A First Lien, Option ARM, Subprime and Prime
The majority of projected losses in first lien RMBS transactions are expected to come from non-performing mortgage loans (those that are or in the past twelve months have been two or more payments behind, have been modified, are in foreclosure, or have been foreclosed upon). Changes in the amount of non-performing loans from the amount projected in the previous period are one of the primary drivers of loss development in this portfolio. In order to determine the number of defaults resulting from these delinquent and foreclosed loans, the Company applies a liquidation rate assumption to loans in each of various non-performing categories. The Company arrived at its liquidation rates based on data purchased from a third party provider and assumptions about how delays in the foreclosure process and loan modifications may ultimately affect the rate at which loans are liquidated. Each quarter the Company reviews the most recent twelve months of this data and (if necessary) adjusts its liquidation rates based on its observations. The following table shows liquidation assumptions for various non-performing categories. 

First Lien Liquidation Rates

December 31, 2015 December 31, 2014 December 31, 2013December 31, 2016 December 31, 2015 December 31, 2014
Current Loans Modified in the Previous 12 Months  
Alt A and Prime25% 25% 35%
Alt-A and Prime25% 25% 25%
Option ARM25 25 3525 25 25
Subprime25 25 3525 25 25
Current Loans Delinquent in the Previous 12 Months  
Alt A and Prime25 25 N/A
Alt-A and Prime25 25 25
Option ARM25 25 N/A25 25 25
Subprime25 25 N/A25 25 25
30 – 59 Days Delinquent    
Alt A and Prime35 35 50
Alt-A and Prime35 35 35
Option ARM40 40 5035 40 40
Subprime45 35 4540 45 35
60 – 89 Days Delinquent  
Alt A and Prime45 50 60
Alt-A and Prime45 45 50
Option ARM50 55 6550 50 55
Subprime55 40 5050 55 40
90+ Days Delinquent  
Alt A and Prime55 60 75
Alt-A and Prime55 55 60
Option ARM60 65 7055 60 65
Subprime60 55 6055 60 55
Bankruptcy  
Alt A and Prime45 45 60
Alt-A and Prime45 45 45
Option ARM50 50 6050 50 50
Subprime40 40 5540 40 40
Foreclosure  
Alt A and Prime65 75 85
Alt-A and Prime65 65 75
Option ARM70 80 8065 70 80
Subprime70 70 7065 70 70
Real Estate Owned  
All100 100 100100 100 100
 

174

Table of Contents

While the Company uses liquidation rates as described above to project defaults of non-performing loans (including current loans modified or delinquent within the last 12 months), it projects defaults on presently current loans by applying a CDR trend. The start of that CDR trend is based on the defaults the Company projects will emerge from currently nonperforming, recently nonperforming and modified loans. The total amount of expected defaults from the non-performing loans is translated into a constant CDR (i.e., the CDR plateau), which, if applied for each of the next 36 months, would be sufficient to produce approximately the amount of defaults that were calculated to emerge from the various delinquency categories. The CDR thus calculated individually on the delinquent collateral pool for each RMBS is then used as the starting point for the CDR curve used to project defaults of the presently performing loans.
 
In the base case, after the initial 36-month CDR plateau period, each transaction’s CDR is projected to improve over 12 months to an intermediate CDR (calculated as 20% of its CDR plateau); that intermediate CDR is held constant for 36 months and then trails off in steps to a final CDR of 5% of the CDR plateau. In the base case, the Company assumes the final CDR will be reached 7.56.5 years after the initial 36-month CDR plateau period, which is twelve months shorter than assumed at December 31, 2014.period. Under the Company’s methodology, defaults projected to occur in the first 36 months represent defaults that can be attributed to loans that were modified or delinquent in the last 12 months or that are currently delinquent or in foreclosure, while the defaults projected to occur using the projected CDR trend after the first 36 month period represent defaults attributable to borrowers that are currently performing or are projected to reperform.
     

Another important driver of loss projections is loss severity, which is the amount of loss the transaction incurs on a loan after the application of net proceeds from the disposal of the underlying property. Loss severities experienced in first lien transactions have reached historically high levels, and the Company is assuming in the base case that these high levels generally will continue for another 18 months. The Company determines its initial loss severity based on actual recent experience. As a result, the Company updated severities for specific asset classes and vintages based on observed data, as shown in the tables below. The Company then assumes that loss severities begin returning to levels consistent with underwriting assumptions beginning after the initial 18 month period, declining to 40% in the base case over 2.5 years. Beginning for December 31, 2014, the Company differentiated the loss severity assumptions depending on the vintage of the transaction, as shown in the table below.
 
The following table shows the range as well as the average, weighted by outstanding net insured par, for key assumptions used in the calculation of expected loss to be paid for individual transactions for direct vintage 2004 - 2008 first lien U.S. RMBS.

175


Key Assumptions in Base Case Expected Loss Estimates
First Lien RMBS(1)

As of
December 31, 2015
 As of
December 31, 2014
 As of
December 31, 2013
As of
December 31, 2016
 As of
December 31, 2015
 As of
December 31, 2014
Range Weighted Average Range Weighted Average Range Weighted AverageRange Weighted Average Range Weighted Average Range Weighted Average
Alt-A First Lien              
Plateau CDR1.7%26.4% 6.4% 2.0%13.4% 7.3% 2.8%18.4% 9.7%1.0%13.5% 5.7% 1.7%26.4% 6.4% 2.0%13.4% 7.3%
Intermediate CDR0.3%5.3% 1.3% 0.4%2.7% 1.5% 0.6%3.7% 1.9%
Period until intermediate CDR48 months 48 months 48 months 
Final CDR0.1%1.3% 0.3% 0.1%0.7% 0.3% 0.1%0.9% 0.5%0.0%0.7% 0.3% 0.1%1.3% 0.3% 0.1%0.7% 0.3%
Initial loss severity:            
2005 and prior60.0% 60.0% 65.0% 60.0% 60.0% 60.0% 
200670.0% 70.0% 65.0% 80.0% 70.0% 70.0% 
200765.0% 65.0% 65.0% 70.0% 65.0% 65.0% 
Initial CPR2.7%32.5% 11.5% 1.7%21.0% 7.7% 0.0%34.2% 9.7%
Final CPR(2)15% 15% 15% 
Option ARM              
Plateau CDR3.5%10.3% 7.8% 4.3%14.2% 10.6% 4.9%16.8% 11.9%3.2%7.0% 5.6% 3.5%10.3% 7.8% 4.3%14.2% 10.6%
Intermediate CDR0.7%2.1% 1.6% 0.9%2.8% 2.1% 1.0%3.4% 2.4%
Period until intermediate CDR48 months 48 months 48 months 
Final CDR0.2%0.5% 0.4% 0.2%0.7% 0.5% 0.2%0.8% 0.5%0.2%0.3% 0.3% 0.2%0.5% 0.4% 0.2%0.7% 0.5%
Initial loss severity:            
2005 and prior60.0% 60.0% 65.0% 60.0% 60.0% 60.0% 
200670.0% 70.0% 65.0% 70.0% 70.0% 70.0% 
200765.0% 65.0% 65.0% 75.0% 65.0% 65.0% 
Initial CPR1.5%10.9% 5.1% 1.1%11.8% 4.9% 0.4%13.1% 4.7%
Final CPR(2)15% 15% 15% 
Subprime              
Plateau CDR4.7%13.2% 9.5% 4.9%15% 10.6% 5.6%16.2% 11.8%2.8%14.1% 8.1% 4.7%13.2% 9.5% 4.9%15.0% 10.6%
Intermediate CDR0.9%2.6% 1.9% 1.0%3.0% 2.1% 1.1%3.2% 2.4%
Period until intermediate CDR48 months 48 months 48 months 
Final CDR0.2%0.7% 0.4% 0.2%0.7% 0.4% 0.3%0.8% 0.4%0.1%0.7% 0.4% 0.2%0.7% 0.4% 0.2%0.7% 0.4%
Initial loss severity:            
2005 and prior75.0% 75.0% 90.0% 80.0% 75.0% 75.0% 
200690.0% 90.0% 90.0% 90.0% 90.0% 90.0% 
200790.0% 90.0% 90.0% 90.0% 90.0% 90.0% 
Initial CPR0.0%10.1% 3.6% 0.0%10.5% 6.1% 0.0%15.7% 4.1%
Final CPR(2)15% 15% 15% 
____________________
(1)                                Represents variables for most heavily weighted scenario (the “base case”).

(2) For transactions where the initial CPR is higher than the final CPR, the initial CPR is held constant and the final CPR is not used.


176

Table of Contents

    
The rate at which the principal amount of loans is voluntarily prepaid may impact both the amount of losses projected (since that amount is a function of the conditional default rate,CDR, the loss severity and the loan balance over time) as well as the amount of excess spread (the amount by which the interest paid by the borrowers on the underlying loan exceeds the amount of interest owed on the insured obligations). The assumption for the voluntary CPRconditional prepayment rate (CPR) follows a similar pattern to that of the conditional default rate.CDR. The current level of voluntary prepayments is assumed to continue for the plateau period before gradually increasing over 12 months to the final CPR, which is assumed to be 15% in the base case. For transactions where the initial CPR is higher than the final CPR, the initial CPR is held constant and the final CPR is not used. These CPR assumptions are the same as those the Company used for December 31, 2014.2015.
 
 In estimating expected losses, the Company modeled and probability weighted sensitivities for first lien transactions by varying its assumptions of how fast a recovery is expected to occur. One of the variables used to model sensitivities was how

quickly the conditional default rateCDR returned to its modeled equilibrium, which was defined as 5% of the initial conditional default rate.CDR. The Company also stressed CPR and the speed of recovery of loss severity rates. The Company probability weighted a total of five scenarios as of December 31, 2015.2016. The Company used a similar approach to establish its pessimistic and optimistic scenarios as of December 31, 20152016 as it used as of December 31, 2014,2015, increasing and decreasing the periods of stress from those used in the base case.

In a somewhat more stressful environment than that of the base case, where the conditional default rate plateau was extended six months (to be 42 months long) before the same more gradual conditional default rate recovery and loss severities were assumed to recover over 4.5 rather than 2.5 years (and subprime loss severities were assumed to recover only to 60% and Option ARM and Alt A loss severities to only 45%), expected loss to be paid would increase from current projections by approximately $12 million for Alt-A first liens, $5 million for Option ARM, $46 million for subprime and $0.2 million for prime transactions.

In an even moreCompany's most stressful scenario where loss severities were assumed to rise and then recover over nine years and the initial ramp-down of the conditional default rateCDR was assumed to occur over 15 months and other assumptions were the same as the other stress scenario, expected loss to be paid would increase from current projections by approximately $31$27 million for Alt-A first liens, $9$8 million for Option ARM, $64$46 million for subprime and $1 million for prime transactions.

In a scenario with a somewhat less stressful environment than the base case, where conditional default rate recovery was somewhat less gradual, expected loss to be paid would decrease from current projections by approximately $1 million for Alt-A first liens, $15 million for Option ARM, $8 million for subprime and $14 thousand for prime transactions.

In an even lessCompany's least stressful scenario where the conditional default rateCDR plateau was six months shorter (30 months, effectively assuming that liquidation rates would improve) and the conditional default rateCDR recovery was more pronounced, (including an initial ramp-down of the conditional default rateCDR over nine months), expected loss to be paid would decrease from current projections by approximately $12$13 million for Alt-A first liens, $25$22 million for Option ARM, $34$25 million for subprime and $0.2$0.1 million for prime transactions.
 
 U.S. Second Lien RMBS Loss Projections
 
Second lien RMBS transactions include both HELOChome equity lines of credit (HELOC) and closed end second lien. The Company believes the primary variable affecting its expected losses in second lien RMBS transactions is the amount and timing of future losses in the collateral pool supporting the transactions. Expected losses are also a function of the structure of the transaction; the voluntary prepayment rate (typically also referred to as CPR of the collateral); the interest rate environment; and assumptions about the draw rate and loss severity.
 
In second lien transactions the projection of near-term defaults from currently delinquent loans is relatively straightforward because loans in second lien transactions are generally “charged off” (treated as defaulted) by the securitization’s servicer once the loan is 180 days past due. Most second lien transactions report the amount of loans in five monthly delinquency categories (i.e., 30-59 days past due, 60-89 days past due, 90-119 days past due, 120-149 days past due and 150-179 days past due). The Company estimates the amount of loans that will default over the next fivesix months by calculating current representative liquidation rates. A liquidation rate is the percent of loans in a given cohort (in this instance, delinquency category) that ultimately default. Similar to first liens, the Company then calculates a CDR for six months, which is the period over which the currently delinquent collateral is expected to be liquidated. That CDR is then used as the basis for the plateau CDR period that follows the embedded five months of losses. Liquidation rates assumed as of December 31, 2015, were from 10% to 100%.


177

Table of Contents

For the base case scenario, the CDR (the “plateau CDR”)plateau CDR) was held constant for six months. Once the plateau period has ended, the CDR is assumed to gradually trend down in uniform increments to its final long-term steady state CDR. (The long-term steady state CDR is calculated as the constant CDR that would have yielded the amount of losses originally expected at underwriting.) In the base case scenario, the time over which the CDR trends down to its final CDR is 28 months. Therefore, the total stress period for second lien transactions is 34 months, comprising fivesix months of delinquent data a one month plateau period and 28 months of decrease to the steady state CDR, the same as of December 31, 2014.2015.

HELOC loans generally permit the borrower to pay only interest for an initial period (often ten years) and, after that period, require the borrower to make both the monthly interest payment and a monthly principal payment, and so increase the borrower's aggregate monthly payment. Some of the HELOC loans underlying the Company's insured HELOC transactions have reached their principal amortization period. The Company has observed that the increase in monthly payments occurring when a loan reaches its principal amortization period, even if mitigated by borrower relief offered by the servicer, is associated with increased borrower defaults. Thus, most of the Company's HELOC projections incorporate an assumption that a percentage of loans reaching their amortization periods will default around the time of the payment increase. These projected defaults are in addition to those generated using the CDR curve as described above. This assumption is similar to the one used atas of December 31, 2014. For December 31, 2015 the Company used the approach it had refined in the third quarter of 2015 to calculate the number of additional delinquencies as a function of the number of modified loans in the transaction and the final steady state CDR but increased those additional resulting defaults. Under this refined approach, transactions that have worse than average expected experience will have higher defaults and transactions where borrowers are receiving modifications so that they will not default when their interest only period ends will have higher losses.2015.

When a second lien loan defaults, there is generally a very low recovery. The Company had assumed as of December 31, 20152016 that it will generally recover only 2% of the collateral defaulting in the future and declining additional amounts of post-default receipts on previously defaulted collateral. Based on experience,This is the Company changed thissame assumption from the assumption it had used as atof December 31, 2014, when it assumed it would generally recover 10% or less of the collateral defaulting in the future and declining additional amounts of post-default receipts on previously defaulted collateral.2015.

The rate at which the principal amount of loans is prepaid may impact both the amount of losses projected as well as the amount of excess spread. In the base case, an average CPR (based on experience of the most recent three quarters)past year) is assumed to continue until the end of the plateau before gradually increasing to the final CPR over the same period the CDR decreases. The final CPR is assumed to be 15% for second lien transactions, which is lower than the historical average but reflects the Company’s continued uncertainty about the projected performance of the borrowers in these transactions. For transactions where the initial CPR is higher than the final CPR, the initial CPR is held constant and the final CPR is not used. This pattern is generally

consistent with how the Company modeled the CPR atas of December 31, 2014.2015. To the extent that prepayments differ from projected levels it could materially change the Company’s projected excess spread and losses.
 
The Company uses a number of other variables in its second lien loss projections, including the spread between relevant interest rate indices. These variables have been relatively stable and in the relevant ranges have less impact on the projection results than the variables discussed above. However, in a number of HELOC transactions the servicers have been modifying poorly performing loans from floating to fixed rates, and, as a result, rising interest rates would negatively impact the excess spread available from these modified loans to support the transactions.  The Company incorporated these modifications in its assumptions.

In estimating expected losses, the Company modeled and probability weighted five possible CDR curves applicable to the period preceding the return to the long-term steady state CDR. The Company used five scenarios at December 31, 20152016 and three scenarios at December 31, 2014.2015. The Company believes that the level of the elevated CDR and the length of time it will persist, the ultimate prepayment rate, and the amount of additional defaults because of the expiry of the interest only period, are the primary drivers behind the likely amount of losses the collateral will suffer. The Company continues to evaluate the assumptions affecting its modeling results.

MostThe Company believes the most important driver of the Company'sits projected second lien RMBS losses are fromis the performance of its HELOC transactions. The following table shows the range as well as the average, weighted by outstanding net insured par, for key assumptions for the calculation of expected loss to be paid for individual transactions for direct vintage 2004 - 2008 HELOCs.


178

Table of Contents

Key Assumptions in Base Case Expected Loss Estimates
HELOCs(1)
 
As of
December 31, 2015
 As of
December 31, 2014
 As of
December 31, 2013
As of
December 31, 2016
 As of
December 31, 2015
 As of
December 31, 2014
Range Weighted Average Range Weighted Average Range Weighted AverageRange Weighted Average Range Weighted Average Range Weighted Average
Plateau CDR4.9%23.5% 10.3% 2.8%6.8% 4.1% 2.3%7.7% 4.9%3.5%24.8% 13.6% 4.9%23.5% 10.3% 2.8%6.8% 4.1%
Final CDR trended down to0.5%3.2% 1.2% 0.5%3.2% 1.2% 0.4%3.2% 1.1%0.5%3.2% 1.3% 0.5%3.2% 1.2% 0.5%3.2% 1.2%
Period until final CDR34 months 34 months 34 months 
Initial CPR10.9% 6.9%21.8% 11.0% 2.7%21.5% 9.9%
Final CPR(2)10.0%15.0% 13.3% 15.0%21.8% 15.5% 10% 
Liquidation rates:      
Current Loans Modified in the Previous 12 Months25% 25% 25% 
Current Loans Delinquent in the Previous 12 Months25 25 25 
30 – 59 Days Delinquent50 50 55 
60 – 89 Days Delinquent65 65 70 
90+ Days Delinquent80 75 80 
Bankruptcy55 55 55 
Foreclosure75 75 75 
Real Estate Owned100 100 100 
Loss severity98.0% 90.0%98.0% 90.4% 98% 98% 98% 90%98% 90.4%
____________________
(1)Represents variables for most heavily weighted scenario (the “base case”)base case).

(2) For transactions where the initial CPR is higher than the final CPR, the initial CPR is held constant and the final CPR is not used.
 

The Company’s base case assumed a six month CDR plateau and a 28 month ramp-down (for a total stress period of 34 months). The Company also modeled a scenario with a longer period of elevated defaults and another with a shorter period of elevated defaults. Increasing the CDR plateau to eight months and increasing the ramp-down by three months to 31 months (for a total stress period of 39 months), and doubling the defaults relating to the end of the interest only period would increase the expected loss by approximately $52$39 million for HELOC transactions. On the other hand, reducing the CDR plateau to four months and decreasing the length of the CDR ramp-down to 25 months (for a total stress period of 29 months), and lowering the ultimate prepayment rate to 10% would decrease the expected loss by approximately $28$23 million for HELOC transactions.


Breaches of Representations and Warranties
 
Generally, when mortgage loans were transferred into a securitization, the loan originator(s) and/or sponsor(s) provided R&W that the loans meet certain characteristics, and a breach of such R&W often requires that the loan be repurchased from the securitization. The Company has pursued such breaches of R&W on a loan-by-loan basis or in cases where a provider of R&W refused to honor its repurchase obligations, the Company sometimes chose to initiate litigation. The Company's success in pursuing these strategies permitted the Company to enterentered into agreements with R&W providers under which those providers made payments to the Company, agreed to make payments to the Company in the future, and / or repurchased loans from the transactions, all in return for releases of related liability by the Company. In some instances, the entity providing the R&W (or an affiliate of that entity) also benefited from credit protection sold by the Company through a CDS, and the Company entered into an agreement terminating the CDS protection it provided (and so avoiding future losses on that transaction), again in return for releases of related liability by the Company and in certain instances other consideration.

Through December 31, 2015 the Company has caused entities providing R&Ws to pay, or agree to pay, or to terminate or agree to terminate insurance protection on future projected losses of, approximately $4.2 billion (gross of reinsurance) in respect of their R&W liabilities for transactions in which the Company has provided insurance.

The Company has included in its net expected loss estimates asAs of December 31, 2015 an estimated net benefit of $79 million (net of reinsurance), all of which is projected to be received pursuant to existing agreements with R&W providers or is otherwise collateralized. The Company is no longer actively pursuing R&W providers where it does not have such an agreement. Most of the amount projected to be received pursuant to existing agreements with R&W providers benefits from eligible assets placed in trusts to collateralize the R&W provider’s future reimbursement obligation, with the amount of such collateral subject to increase or decrease from time to time as determined by rating agency requirements. Currently2016, the Company hashad two such agreements with three counterparties where a future reimbursement obligation is collateralized by eligible assets held in trust:

Bank of America.remaining. Under the Company's agreement with Bank of America Corporation and certain of its subsidiaries (“Bank(Bank of America”)America), Bank of America agreed to reimburse the Company for 80% of claims on the first lien transactions covered by the agreement that the Company pays in the future, until the aggregate lifetime collateral losses (not insurance losses or claims) on those transactions reach $6.6 billion. As of December 31, 2015 aggregate

179

Table of Contents

lifetime collateral losses on those transactions was $4.4 billion, andsubject to a cap the Company was projecting in its base case that such collateral losses would eventually reach $5.2 billion. Bank of America's reimbursement obligation is secured by $543 million of collateral held in trust for the Company's benefit.

Deutsche Bank.currently projects it will not reach. Under the Company's May 2012 agreement with Deutsche Bank AG and certain of its affiliates (collectively, “Deutsche Bank”), Deutsche Bank agreed to reimburse the Company for certain claims it pays in the future on eight first and second lien transactions, including 80% of claims it pays on those transactions until the aggregate lifetime claims (before reimbursement) reach $319 million. As of December 31, 2015, the Company was projecting in its base case that such aggregate lifetime claims would remain below $319 million. In the event aggregate lifetime claims paid exceed $389 million, Deutsche Bank must reimburse the Company for 85% of such claims paid (in excess of $389 million) until such claims paid reach $600 million. Deutsche Bank’s reimbursement obligation is secured by $71 million of collateral held in trust for the Company’s benefit.

UBS. On May 6, 2013, the Company entered into an agreement with UBS Real Estate Securities Inc. and affiliates ("UBS") and a third party resolving the Company’s claims and liabilities related to specified RMBS transactions that were issued, underwritten or sponsored by UBS and insured by AGM or AGC under financial guaranty insurance policies. Under the agreement,(UBS), UBS agreed to reimburse the Company for 85% of future losses on three first lien RMBS transactions,transactions. Bank of America and suchUBS have posted collateral to secure their obligations under these agreements. The Company also had an R&W reimbursement obligation is secured by $54 millionagreement with Deutsche Bank AG and certain of collateral heldits affiliates (collectively, Deutsche Bank), but Deutsche Bank's reimbursement obligations under that agreement were terminated in trustMay 2016 in return for a cash payment to the Company's benefit.

Company. The Company uses the same RMBS projection scenarios and weightings to project its future R&W benefit or payable as it uses to project RMBS losses on its portfolio. To the extent

As of December 31, 2016, the Company increases its loss projections,had a net R&W payable of $6 million to R&W counterparties, compared to an R&W recoverable of $79 million as of December 31, 2015. The decrease represents improvements in underlying collateral performance and the termination of the Deutsche Bank agreement described above, partially offset by the addition of R&W benefitrecoverable related to a RMBS insured by CIFGNA and still being pursued by the Company. The Company’s agreements with providers of R&W generally will also increase, subjectprovide for reimbursement to the agreement limitsCompany as claim payments are made and, thresholds described above. Similarly, to the extent the Company decreases its loss projections,later receives reimbursements of such claims from excess spread or other sources, for the Company to provide reimbursement to the R&W benefit generallyproviders. When the Company projects receiving more reimbursements in the future than it projects to pay in claims on transactions covered by R&W settlement agreements, the Company will also decrease, subject to the agreement limits and thresholds described above.have a net R&W payable.

Triple-X Life Insurance Transactions
 
The Company had $2.8$2.1 billion of net par exposure to financial guaranty Triple-X life insurance transactions as of December 31, 2015.2016. Two of these transactions, with $216$126 million of net par outstanding, are rated BIG. The Triple-X life insurance transactions are based on discrete blocks of individual life insurance business. In older vintage Triple-X life insurance securitization transactions, which include the two BIG-rated transactions, the amounts raised by the sale of the notes insured by the Company were used to capitalize a special purpose vehicle that provides reinsurance to a life insurer or reinsurer. The moniesamounts are invested at inception in accounts managed by third-party investment managers. In the case of the two BIG-rated transactions, material amounts of their assets were invested in U.S. RMBS. Based on its analysis of the information currently available, including estimates of future investment performance, and projected credit impairments on the invested assets and performance of the blocks of life insurance business at December 31, 2015,2016, the Company’s projected net expected loss to be paid is $99$54 million. The economic loss developmentbenefit during 20152016 was approximately $11$22 million, which was due primarily to changes in the risk free rates used to discount the losses and life insurance mortality projections earlier in the year as well as assumption updates related to future transaction cashflows.
In the case of one of the BIG-rated transactions, AGM had guaranteed a CDS that referenced the entire issued and outstanding amount of its Series A-1 Notes, which AGUK guarantees. On July 9, 2015, in considerationbenefit resulting from a purchase of a cash payment by AGM, the swap counterparty deliveredportion of an insured obligation to AGM all of the Series A-1 Notes, and the parties terminated the CDS. AGUK continues to guarantee the Series A-1 Notes. However, consistent with the Company's practice of excluding from its par and Debt Service outstanding amounts attributable to loss mitigation securities it has purchased because it manages such securities as investments and not insurance exposure, the Company excluded from its consolidated net par outstanding as of December 31, 2015 the $382.5 million net par of such notes.mitigate loss.

Student Loan Transactions
 
The Company has insured or reinsured $1.8$1.4 billion net par of student loan securitizations issued by private issuers and that it classifies as structured finance. Of this amount, $163$109 million is rated BIG. The Company is projecting approximately $54$32 million of net expected loss to be paid on these transactions. In general, the losses are due to: (i) the poor credit performance of private student loan collateral and high loss severities, or (ii) high interest rates on auction rate securities with respect to which the auctions have failed. The economic benefit during 20152016 was approximately $9$14 million, which was driven primarily by a partialthe commutation byof certain assumed student loan exposures earlier in the underlying insurer during the first quarter of 2015.year.


180

Table of Contents

Other structured finance

The Company's other structured finance exposures include $0.9 billionsector has BIG net par rated BIG, includingof $966 million, comprising primarily transactions backed by TruPS, perpetual preferred securities, commercial receivables and manufactured housing loans and quota share surety reinsurance contracts on Spanish housing cooperatives. As of April 1, 2015, the Radian Asset Acquisition added $101 million in net economic losses for other structured finance credits. The Company has expected loss to be paid of $15 million as of December 31, 2015.loans. The economic loss developmentbenefit during 20152016 was $12$3 million, which was attributable primarily to the purchaseimproved performance of notes issued by a distressed collateralized loan obligation (“CLO”) and termination of the related credit derivative in December 2015. In January 2016 the Company agreed with the ceding company to commute the Spanish housing cooperative surety reinsurance.various credits.
    

Recovery Litigation
 
Public Finance Transactions

On January 7, 2016, AGM, AGC and Ambac InsuranceAssurance Corporation (“Ambac”)(Ambac) commenced an action for declaratory judgment and injunctive relief in the U.S. District Court for the District of Puerto Rico to invalidate the executive orders issued by the Governor on November 30, 2015 and December 8, 2015 directing that the Secretary of the Treasury of the Commonwealth of Puerto Rico and the Puerto Rico Tourism Company retain or transfer (in other words, claw back) certain taxes and revenues pledged to secure the payment of bonds issued by the PRHTA, the PRCCDA and the PRIFA. The Commonwealth defendants filed a motion to dismiss the action for lack of subject matter jurisdiction, which the Court denied on October 4, 2016. On October 14, 2016, the Commonwealth defendants filed a notice of PROMESA automatic stay.

On July 21, 2016, AGC and AGM filed a motion and form of complaint in the U.S. District Court for the District of Puerto Rico Highwaysseeking relief from the stay provided by PROMESA. Upon a grant of relief from the PROMESA stay, the lawsuit further seeks a declaration that the Moratorium Act is preempted by Federal bankruptcy law and Transportation Authority,that certain gubernatorial executive orders diverting PRHTA pledged toll revenues (which are not subject to the Clawback) are preempted by PROMESA and violate the U.S. Constitution. Additionally, it seeks damages for the value of the PRHTA toll revenues diverted and injunctive relief prohibiting the defendants from taking any further action under these executive orders. On October 28, 2016, the Oversight Board filed a motion seeking leave to intervene in the action, which motion was denied on November 1, 2016, without prejudice, on procedural grounds. On November 2, 2016, the Court denied AGC’s and AGM’s motion for relief from the PROMESA stay on procedural grounds. The PROMESA stay expires on May 1, 2017.
For a discussion of the Company's exposure to Puerto Rico Convention Center District Authority andrelated to the Puerto Rico Infrastructure Financing Authority.  The action is still in its early stages.litigation described above, please see Note 4, Outstanding Exposure.

On November 1, 2013, Radian Asset commenced a declaratory judgment action in the U.S. District Court for the Southern District of Mississippi against Madison County, Mississippi and the Parkway East Public Improvement District to establish its rights under a contribution agreement from the County supporting certain special assessment bonds issued by the District and insured by Radian Asset (now AGC). As of December 31, 2015, $212016, $20 million of such bonds were outstanding. The County maintainsmaintained that its payment obligation is limited to two years of annual debt service, while AGC contends no such limitation applies.contended the County’s obligations under the contribution agreement continue so long as the bonds remain outstanding. On April 20, 2015,27, 2016, the Court issued an order addressinggranted AGC's and the County's cross-motions for partial summary judgment, and denied the County's motion for summary judgment, that its payment obligation lasts only two years.agreeing with AGC's interpretation of the County's obligations. On May 1, 2015, AGC paid its first claim on11, 2016, the insured bonds. Discovery is ongoing.County filed a notice of appeal of that ruling to the United States Court of Appeals for the Fifth Circuit.

Triple-X Life Insurance Transactions
 
In December 2008 AGUK filed an action in the Supreme Court of the State of New York against J.P. Morgan Investment Management Inc. (“JPMIM”)(JPMIM), the investment manager for a triple-X life insurance transaction, Orkney Re II plc ("Orkney")(Orkney), involving securities guaranteed by AGUK. As of December 31, 2016, the Company insures $423 million net par of Orkney securities. The action alleges that JPMIM engaged in breaches of fiduciary duty, gross negligence and breaches of contract based upon its handling of the Orkney investments. After AGUK’s claims were dismissed with prejudice in January 2010, AGUK was successful in its subsequent motions and appeals and, as of December 2011, all of AGUK’s claims for breaches of fiduciary duty, gross negligence and contract were reinstated in full. On January 22, 2016, AGUK filed a motion for partial summary judgment with respect to one of its claims for breach of contract relating to a failure to invest in compliance with the Delaware Insurance Code. On February 21, 2017, the court issued a decision on the motion. While the court denied the motion on the ground that the gross negligence of JPMIM in breaching the contract was a fact issue to be decided at trial, the court did find as a matter of law that JPMIM breached the contract relating to a failure to invest in compliance with the Delaware Insurance Code. A trial date has been set for mid-March 2017.

RMBS Transactions

On February 5, 2009, U.S. Bank National Association, as indenture trustee (U.S. Bank), CIFGNA, as insurer of the Class Ac Notes, and Syncora Guarantee Inc. (Syncora), as insurer of the Class Ax Notes, filed a complaint in the Supreme Court of the State of New York against GreenPoint Mortgage Funding, Inc. (GreenPoint) alleging GreenPoint breached its R&W with respect to the underlying mortgage loans in the GreenPoint Mortgage Funding Trust 2006-HE1 transaction. On March 3, 2010, the court dismissed CIFGNA's and Syncora’s causes of action on standing grounds. On December 16, 2013, GreenPoint moved to dismiss the remaining claims of U.S. Bank on the grounds that it too lacked standing. U.S. Bank cross-moved for partial summary judgment striking GreenPoint’s defense that U.S. Bank lacked standing to directly pursue claims against GreenPoint. On January 28, 2016, the court denied GreenPoint’s motion for summary judgment and granted U.S.

Bank’s cross-motion for partial summary judgment, finding that as a matter of law U.S. Bank has standing to directly assert claims against GreenPoint.  On November 28, 2016, GreenPoint filed an appeal. CIFGNA originally had $500 million insured net par exposure to this transaction; $23 million insured net par remains outstanding at December 31, 2016.

On November 26, 2012, CIFGNA filed a complaint in the Supreme Court of the State of New York against JP Morgan Securities LLC (JP Morgan) for material misrepresentation in the inducement of insurance and common law fraud, alleging that JP Morgan fraudulently induced CIFGNA to insure $400 million of securities issued by ACA ABS CDO 2006-2 Ltd. and $325 million of securities issued by Libertas Preferred Funding II, Ltd. On June 26, 2015, the Court dismissed with prejudice CIFGNA’s material misrepresentation in the inducement of insurance claim and dismissed without prejudice CIFGNA’s common law fraud claim. On September 24, 2015, the Court denied CIFGNA’s motion to amend but allowed CIFGNA to re-plead a cause of action for common law fraud. On November 20, 2015, CIFGNA filed a motion for leave to amend its complaint to re-plead common law fraud. On April 29, 2016, CIFGNA filed an appeal to reverse the Court’s decision dismissing CIFGNA’s material misrepresentation in the inducement of insurance claim. On November 29, 2016, the Appellate Division of the Supreme Court of the State of New York ruled that the Court’s decision dismissing with prejudice CIFGNA’s material misrepresentation in the inducement of insurance claim should be modified to grant CIFGNA leave to replead such claim.

On January 15, 2013, CIFGNA filed a complaint in the Supreme Court of the State of New York against Goldman, Sachs & Co. (Goldman) for material misrepresentation in the inducement of insurance and common law fraud, alleging that Goldman fraudulently induced CIFGNA to insure $325 million of Class A-1 Notes (the Class A-1 Notes) and to purchase $10 million of Class A-2 Notes (the Class A-2 Notes) issued by Fortius II Funding, Ltd. CDO. CIFGNA and Goldman agreed to separately arbitrate the issue of liability with respect to CIFG’s purchase of the Class A-2 Notes, and on February 4, 2015, an arbitration panel awarded CIFGNA $2.5 million in damages. On September 11, 2015, CIFGNA filed an amended complaint to allege that the arbitration award collaterally estopped Goldman from disputing its liability for fraudulent inducement in respect of the Class A-1 Notes. On October 20, 2016, AGC (as successor to CIFGNA) and Goldman reached a settlement of the action.

6.Financial GuarantyContracts Accounted for as Insurance

Financial Guaranty Insurance Premiums

The portfolio of outstanding exposures discussed in Note 4, Outstanding Exposure, includes financial guaranty contracts that meet the definition of insurance contracts as well as those that meet the definition of a derivative under GAAP.GAAP, as well as those that are accounted for as consolidated FG VIEs. Amounts presented in this note relate to financial guaranty insurance contracts, unless otherwise noted. See Note 8, Financial Guaranty Contracts Accounted for as Credit Derivatives for amounts that relate to CDS and Note 9, Consolidated Variable Interest Entities for amounts that relate to FG VIEs.

Accounting Policies

Accounting for financial guaranty contracts that meet the scope exception under derivative accounting guidance are subject to industry specific guidance for financial guaranty insurance. The accounting for contracts that fall under the financial guaranty insurance definition are consistent whether the contract was written on a direct basis, assumed from another financial guarantor under a reinsurance treaty, ceded to another insurer under a reinsurance treaty, or acquired in a business combination.

Premium receivablesPremiums receivable comprise the present value of contractual or expected future premium collections discounted using the risk-free rate. Unearned premium reserve represents deferred premium revenue, less claim payments made and recoveries received that have not yet been recognized in the statement of operations (“contra-paid”)(contra-paid). The following discussion relates to

181

Table of Contents

the deferred premium revenue component of the unearned premium reserve, while the contra-paid is discussed below under "Financial Guaranty Insurance Losses."

The amount of deferred premium revenue at contract inception is determined as follows:

For premiums received upfront on financial guaranty insurance contracts that were originally underwritten by the Company, deferred premium revenue is equal to the amount of cash received. Upfront premiums typically relate to public finance transactions.

For premiums received in installments on financial guaranty insurance contracts that were originally underwritten by the Company, deferred premium revenue is the present value of either (1) contractual premiums due or (2) in cases where the underlying collateral is comprised of homogeneous pools of assets, the expected premiums to be

collected over the life of the contract. To be considered a homogeneous pool of assets, prepayments must be contractually prepayable, the amount of prepayments must be probable, and the timing and amount of prepayments must be reasonably estimable. When the Company adjusts prepayment assumptions or expected premium collections, an adjustment is recorded to the deferred premium revenue, with a corresponding adjustment to the premium receivable, and prospective changes are recognized in premium revenues. Premiums receivable are discounted at the risk-free rate at inception and such discount rate is updated only when changes to prepayment assumptions are made that change the expected date of final maturity. Installment premiums typically relate to structured finance transactions, where the insurance premium rate is determined at the inception of the contract but the insured par is subject to prepayment throughout the life of the transaction.

For financial guaranty insurance contracts acquired in a business combination, deferred premium revenue is equal to the fair value of the Company's stand-ready obligation portion of the insurance contract at the date of acquisition based on what a hypothetical similarly rated financial guaranty insurer would have charged for the contract at that date and not the actual cash flows under the insurance contract. The amount of deferred premium revenue may differ significantly from cash collections due primarily to fair value adjustments recorded in connection with a business combination.

The Company recognizes deferred premium revenue as earned premium over the contractual period or expected period of the contract in proportion to the amount of insurance protection provided. As premium revenue is recognized, a corresponding decrease to the deferred premium revenue is recorded. The amount of insurance protection provided is a function of the insured principal amount outstanding. Accordingly, the proportionate share of premium revenue recognized in a given reporting period is a constant rate calculated based on the relationship between the insured principal amounts outstanding in the reporting period compared with the sum of each of the insured principal amounts outstanding for all periods. When an insured financial obligation is retired before its maturity, the financial guaranty insurance contract is extinguished. Any nonrefundable deferred premium revenue related to that contract is accelerated and recognized as premium revenue. When a premium receivable balance is deemed uncollectible, it is written off to bad debt expense.

For reinsurance assumed contracts, earned premiums reported in the Company's consolidated statements of operations are calculated based upon data received from ceding companies, however, some ceding companies report premium data between 30 and 90 days after the end of the reporting period. The Company estimates earned premiums for the lag period.  Differences between such estimates and actual amounts are recorded in the period in which the actual amounts are determined. When installment premiums are related to reinsurance assumed contracts, the Company assesses the credit quality and liquidity of the ceding companies and the impact of any potential regulatory constraints to determine the collectability of such amounts.


182


Deferred premium revenue ceded to reinsurers (ceded unearned premium reserve) is recorded as an asset. Direct, assumed and ceded earned premium revenue are presented together as net earned premiums in the statement of operations. Net earned premiums comprise the following:

Net Earned Premiums
 
Year Ended December 31,Year Ended December 31,
2015 2014 20132016 2015 2014
(in millions)(in millions)
Scheduled net earned premiums$416
 $415
 $470
$381
 $416
 $415
Acceleration of net earned premiums (1)331
 136
 263
Accelerations     
Refundings390
 294
 133
Terminations79
 37
 3
Total Accelerations469
 331
 136
Accretion of discount on net premiums receivable17
 16
 17
14
 17
 16
Financial guaranty insurance net earned premiums764
 567
 750
864
 764
 567
Other2
 3
 2
0
 2
 3
Net earned premiums (2)$766
 $570
 $752
Net earned premiums (1)$864
 $766
 $570
 ___________________
(1)Reflects the unscheduled refunding or termination of the insurance on an insured obligation as well as changes in scheduled earnings due to changes in the expected lives of the insured obligations. 
(2)Excludes $16 million, $21 million $32 million and $60$32 million for the year ended December 31, 2016, 2015 2014 and 2013,2014, respectively, related to consolidated FG VIEs.


Components of
Unearned Premium Reserve
 
As of December 31, 2015 As of December 31, 2014As of December 31, 2016 As of December 31, 2015
Gross Ceded Net(1) Gross Ceded Net(1)Gross Ceded Net(1) Gross Ceded Net(1)
(in millions)(in millions)
Deferred premium revenue$4,008
 $238
 $3,770
 $4,167
 $387
 $3,780
$3,548
 $206
 $3,342
 $4,008
 $238
 $3,770
Contra-paid(2)(12) (6) (6) 94
 (6) 100
(37) 0
 (37) (12) (6) (6)
Unearned premium reserve$3,996
 $232
 $3,764
 $4,261
 $381
 $3,880
$3,511
 $206
 $3,305
 $3,996
 $232
 $3,764
 ____________________
(1)Excludes $110$90 million and $125$110 million of deferred premium revenue and $30$25 million and $42$30 million of contra-paid related to FG VIEs as of December 31, 20152016 and December 31, 2014,2015, respectively.

(2)See "Financial Guaranty Insurance Losses – Insurance Contracts' Loss Information" below for an explanation of "contra-paid".
 

183

Table of Contents

Gross Premium Receivable,
Net of Commissions on Assumed Business
Roll Forward

Year Ended December 31,Year Ended December 31,
2015 2014 20132016 2015 2014
(in millions)(in millions)
Beginning of period, December 31$729
 $876
 $1,005
$693
 $729
 $876
Premiums receivable acquired in Radian Asset Acquisition on April 1, 20152
 
 
Gross premium written, net of commissions on assumed business198
 171
 145
Premiums receivable from acquisitions (see Note 2)18
 2
 
Gross written premiums on new business, net of commissions on assumed business193
 198
 171
Gross premiums received, net of commissions on assumed business(206) (230) (259)(258) (206) (230)
Adjustments:          
Changes in the expected term(19) (66) (28)(38) (19) (66)
Accretion of discount, net of commissions on assumed business18
 10
 20
9
 18
 10
Foreign exchange translation(25) (31) (1)(41) (25) (31)
Consolidation/deconsolidation of FG VIEs(4) (1) 
0
 (4) (1)
Other adjustments0
 
 (6)
End of period, December 31 (1)$693
 $729
 $876
$576
 $693
 $729
____________________
(1)Excludes $11 million, $17 million $19 million and $21$19 million as of December 31, 2016 , 2015 ,and 2014, and 2013, respectively, related to consolidated FG VIEs.
 
Foreign exchange translation relates to installment premium receivablespremiums receivable denominated in currencies other than the U.S. dollar. Approximately 52%50% and 51%52% of installment premiums at December 31, 20152016 and 2014,2015, respectively, are denominated in currencies other than the U.S. dollar, primarily the Euroeuro and British Pound Sterling.pound sterling.
 
The timing and cumulative amount of actual collections may differ from expected collections in the tables below due to factors such as foreign exchange rate fluctuations, counterparty collectability issues, accelerations, commutations and changes in expected lives.

Expected Collections of
Financial Guaranty Insurance Gross Premiums Receivable,
Net of Commissions on Assumed Business
(Undiscounted)

 As of December 31, 2015
 (in millions)
2016 (January 1 – March 31)$34
2016 (April 1 – June 30)23
2016 (July 1 – September 30)18
2016 (October 1 – December 31)17
201767
201861
201957
202056
2021-2025226
2026-2030147
2031-2035103
After 203584
Total(1)$893
 As of December 31, 2016
 (in millions)
2017 (January 1 – March 31)$27
2017 (April 1 – June 30)21
2017 (July 1 – September 30)14
2017 (October 1 – December 31)16
201858
201952
202050
202149
2022-2026179
2027-2031120
2032-203680
After 203665
Total(1)$731
____________________
(1)Excludes expected cash collections on FG VIEs of $22$13 million.

184


Scheduled Financial Guaranty Insurance Net Earned Premiums
 
 As of December 31, 2015
 (in millions)
2016 (January 1 – March 31)$100
2016 (April 1 – June 30)97
2016 (July 1 – September 30)93
2016 (October 1 – December 31)91
Subtotal 2016381
2017332
2018298
2019272
2020250
2021-2025977
2026-2030616
2031-2035363
After 2035281
Net deferred premium revenue(1)3,770
Future accretion186
Total future net earned premiums$3,956
 As of December 31, 2016
 (in millions)
2017 (January 1 – March 31)$89
2017 (April 1 – June 30)87
2017 (July 1 – September 30)82
2017 (October 1 – December 31)80
Subtotal 2017338
2018304
2019268
2020243
2021223
2022-2026856
2027-2031545
2032-2036315
After 2036250
Net deferred premium revenue(1)3,342
Future accretion145
Total future net earned premiums$3,487
 ____________________
(1)Excludes scheduled net earned premiums on consolidated FG VIEs of $110$90 million.


Selected Information for Financial Guaranty Insurance
Policies Paid in Installments

As of
December 31, 2015
 As of
December 31, 2014
As of
December 31, 2016
 As of
December 31, 2015
(dollars in millions)(dollars in millions)
Premiums receivable, net of commission payable$693
 $729
$576
 $693
Gross deferred premium revenue1,240
 1,370
1,041
 1,240
Weighted-average risk-free rate used to discount premiums3.1% 3.5%3.0% 3.1%
Weighted-average period of premiums receivable (in years)9.4
 9.4
9.1
 9.4


Financial Guaranty Insurance Acquisition Costs

Accounting Policy

Policy acquisition costs that are directly related and essential to successful insurance contract acquisition and ceding commission income on ceded reinsurance contracts are deferred for contracts accounted for as insurance, and reported net. Amortization of deferred policy acquisition costs includes the accretion of discount on ceding commission income and expense.

Capitalized policy acquisition costs costs include expenses such as ceding commissions expense on assumed reinsurance contracts and the cost of underwriting personnel attributable to successful underwriting efforts. Ceding commission expense on assumed reinsurance contracts and ceding commission income on ceded reinsurance contracts that are associated with premiums received in installments are calculated at their contractually defined commission rates, discounted consistent with premiums receivable for all future periods, and included in deferred acquisition costs ("DAC")(DAC), with a corresponding offset to net premiums receivable or reinsurance balances payable. Management uses its judgment in determining the type and amount of costs to be deferred. The Company conducts an annual study to determine which operating costs qualify for deferral. Costs

incurred for soliciting potential customers, market research, training, administration, unsuccessful acquisition efforts, and product development as well as all overhead type costs are charged to expense as incurred. DAC is amortized in proportion to

185

Table of Contents

net earned premiums. When an insured obligation is retired early, the remaining related DAC, net of ceding commission income is recognized at that time.
 
Expected losses which includeand LAE, investment income, and the remaining costs of servicing the insured or reinsured business, are considered in determining the recoverability of DAC.
  
Rollforward of
Deferred Acquisition Costs

Year Ended December 31,Year Ended December 31,
2015 2014 20132016 2015 2014
(in millions)(in millions)
Beginning of period$121
 $124
 $116
$114
 $121
 $124
DAC adjustments related to Radian Asset Acquisition on April 1, 20151
 
 
DAC adjustments from acquisitions (see Note 2)0
 1
 
Costs deferred during the period:          
Commissions on assumed and ceded business(1) 7
 9
(2) (1) 7
Premium taxes2
 3
 4
4
 2
 3
Compensation and other acquisition costs11
 10
 8
9
 11
 10
Total12
 20
 21
11
 12
 20
Costs amortized during the period(20) (23) (13)(19) (20) (23)
End of period$114
 $121
 $124
$106
 $114
 $121


Financial Guaranty Insurance Losses

Accounting Policies

Loss and LAE Reserve

Loss and LAE reserve reported on the balance sheet relates only to direct and assumed reinsurance contracts that are accounted for as insurance, substantially all of which are financial guaranty insurance contracts. The corresponding reserve ceded to reinsurers is reported as reinsurance recoverable on unpaid losses. As discussed in Note 7, Fair Value Measurement, contracts that meet the definition of a derivative, as well as consolidated FG VIE assets and liabilities, are recorded separately at fair value. Any expected losses related to consolidated FG VIEs are eliminated upon consolidation. Any expected losses on credit derivatives are not recorded as loss and LAE reserve on the consolidated balance sheet, rather, credit derivatives are recorded at fair value on the balance sheet.
    
Under financial guaranty insurance accounting, the sum of unearned premium reserve and loss and LAE reserve represents the Company's stand‑ready obligation. Unearned premium reserve is deferred premium revenue, less claim payments and recoveries received that have not yet been recognized in the statement of operations ("contra-paid")(contra-paid). At contract inception, the entire stand-ready obligation is represented by unearned premium reserve. A loss and LAE reserve for an insurance contract is recorded only to the extent, and for the amount, that expected loss to be paid net of contra-paid (“total losses”) exceed the deferred premium revenue, on a contract by contract basis. As a result, the Company has expected loss to be paid that has not yet been expensed. Such amounts will be recognized in future periods as deferred premium revenue amortizes into income.
When a claim or LAE payment is made on a contract, it first reduces any recorded loss and LAE reserve. To the extent there is no loss and LAE reserve on a contract, then such claim payment is recorded as “contra-paid,” which reduces the unearned premium reserve. The contra-paid is recognized in the line item “loss and LAE” in the consolidated statement of operations when and for the amount that total losses exceed the remaining deferred premium revenue on the insurance contract. Loss and LAE in the consolidated statement of operations is presented net of cessions to reinsurers.


186


Salvage and Subrogation Recoverable

When the Company becomes entitled to the cash flow from the underlying collateral of an insured credit under salvage and subrogation rights as a result of a claim payment or estimated future claim payment, it reduces the expected loss to be paid on the contract. Such reduction in expected loss to be paid can result in one of the following:

a reduction in the corresponding loss and LAE reserve with a benefit to the income statement,

no entry recorded, if “total loss” is not in excess of deferred premium revenue, or

the recording of a salvage asset with a benefit to the income statement if the transaction is in a net recovery position at the reporting date.

The Company recognizes the expected recovery of claim payments (including recoveries from settlement with R&W providers) made by an acquired subsidiary prior to the date of acquisition, consistent with its policy for recognizing recoveries on all financial guaranty insurance contracts. To the extent that the estimated amount of recoveries increases or decreases due to changes in facts and circumstances the Company would recognize a benefit or expense consistent with how changes in the expected recovery of all other claim payments are recorded. The ceded component of salvage and subrogation recoverable is recorded in the line item reinsurance balances payable.

Expected Loss to be Expensed

Expected loss to be expensed represents past or expected future net claim payments that have not yet been expensed. Such amounts will be expensed in future periods as deferred premium revenue amortizes into income on financial guaranty insurance policies. Expected loss to be expensed is the Company's projection of incurred losses that will be recognized in future periods, excluding accretion of discount.


187


Insurance Contracts' Loss Information

The following table provides information on loss and LAE reserves and salvage and subrogation recoverable, net of reinsurance. The Company used weighted average risk-free rates for U.S. dollar denominated financial guaranty insurance obligations that ranged from 0.0% to 3.25%3.23% with a weighted average of 2.74% as of December 31, 20152016 and 0.0% to 2.95%3.25% with a weighted average of 2.37% as of December 31, 2014. Financial guaranty insurance expected LAE reserve was $10 million as of December 31, 2015 and $12 million as of December 31, 2014.2015.

Loss and LAE Reserve and Salvage and Subrogation Recoverable
Net of Reinsurance
Insurance Contracts
 
 As of December 31, 2015 As of December 31, 2014
 
Loss and
LAE
Reserve, net
 
Salvage and
Subrogation
Recoverable, net 
 Net Reserve (Recoverable) 
Loss and
LAE
Reserve, net
 
Salvage and
Subrogation
Recoverable, net 
 Net Reserve (Recoverable)
 (in millions)
Public Finance:           
U.S. public finance$604
 $7
 $597
 $243
 $8
 $235
Non-U.S. public finance25
 
 25
 30
 
 30
Public Finance629
 7
 622
 273
 8
 265
Structured Finance:           
U.S. RMBS: 


First lien: 


Prime first lien2
 
 2
 2
 
 2
Alt-A first lien46
 
 46
 87
 
 87
Option ARM13
 42
 (29) 28
 40
 (12)
Subprime169
 21
 148
 166
 8
 158
First lien230
 63
 167
 283
 48
 235
Second lien32
 53
 (21) 7
 78
 (71)
Total U.S. RMBS262
 116
 146
 290
 126
 164
Triple-X life insurance transactions82
 
 82
 140
 
 140
TruPS
 
 
 0
 
 0
Student loans51
 
 51
 64
 
 64
Other structured finance48
 
 48
 34
 8
 26
Structured Finance443
 116
 327
 528
 134
 394
Subtotal1,072
 123
 949
 801
 142
 659
Other recoverables
 3
 (3) 
 13
 (13)
Subtotal1,072
 126
 946
 801
 155
 646
Effect of consolidating FG VIEs(74) 0
 (74) (80) (1) (79)
Total (1)$998
 $126
 $872
 $721
 $154
 $567
 As of December 31, 2016 As of December 31, 2015
 
Loss and
LAE
Reserve, net
 
Salvage and
Subrogation
Recoverable, net 
 Net Reserve (Recoverable) 
Loss and
LAE
Reserve, net
 
Salvage and
Subrogation
Recoverable, net 
 Net Reserve (Recoverable)
 (in millions)
Public finance:           
U.S. public finance$711
 $86
 $625
 $604
 $7
 $597
Non-U.S. public finance21
 
 21
 25
 
 25
Public finance732
 86
 646
 629
 7
 622
Structured finance:           
U.S. RMBS283
 262
 21
 262
 116
 146
Triple-X life insurance transactions36
 
 36
 82
 
 82
Other structured finance60
 
 60
 99
 
 99
Structured finance379
 262
 117
 443
 116
 327
Subtotal1,111
 348
 763
 1,072
 123
 949
Other recoverable (payable)
 (1) 1
 
 3
 (3)
Subtotal1,111
 347
 764
 1,072
 126
 946
Elimination of losses attributable to FG VIEs(64) 
 (64) (74) 0
 (74)
Total (1)$1,047
 $347
 $700
 $998
 $126
 $872
______________
(1)                                 See “Components of Net Reserves (Salvage)” table for loss and LAE reserve and salvage and subrogation recoverable components.
 

188


Components of Net Reserves (Salvage)

 As of
December 31, 2016
 As of
December 31, 2015
 (in millions)
Loss and LAE reserve$1,127
 $1,067
Reinsurance recoverable on unpaid losses(80) (69)
Loss and LAE reserve, net1,047
 998
Salvage and subrogation recoverable(365) (126)
Salvage and subrogation payable(1)17
 3
Other payable (recoverable)1
 (3)
Salvage and subrogation recoverable, net, and other recoverable(347) (126)
Net reserves (salvage)$700
 $872
 As of
December 31, 2015
 As of
December 31, 2014
 (in millions)
Loss and LAE reserve$1,067
 $799
Reinsurance recoverable on unpaid losses(69) (78)
Loss and LAE reserve, net998
 721
Salvage and subrogation recoverable(126) (151)
Salvage and subrogation payable(1)3
 10
Other recoverables(3) (13)
Salvage and subrogation recoverable, net, and other recoverable(126) (154)
Net reserves (salvage)$872
 $567
____________________
(1)          Recorded as a component of reinsurance balances payable.


 The table below provides a reconciliation of net expected loss to be paid to net expected loss to be expensed. Expected loss to be paid differs from expected loss to be expensed due to: (1)(i) the contra-paid which represent the claim payments made and recoveries received that have not yet been recognized in the statement of operations, (2)(ii) salvage and subrogation recoverable for transactions that are in a net recovery position where the Company has not yet received recoveries on claims previously paid (having the effect of reducing net expected loss to be paid by the amount of the previously paid claim and the expected recovery), but will have no future income effect (because the previously paid claims and the corresponding recovery of those claims will offset in income in future periods), and (3)(iii) loss reserves that have already been established (and therefore expensed but not yet paid).
 
Reconciliation of Net Expected Loss to be Paid and
Net Expected Loss to be Expensed
Financial Guaranty Insurance Contracts
 
 As of December 31, 2015
 (in millions)
Net expected loss to be paid$1,375
Less: net expected loss to be paid for FG VIEs and other136
Total1,239
Contra-paid, net5
Salvage and subrogation recoverable, net of reinsurance123
Loss and LAE reserve, net of reinsurance(982)
Other recoveries2
Net expected loss to be expensed (present value)(1)$387
 As of December 31, 2016
 (in millions)
Net expected loss to be paid - financial guaranty insurance (1)$1,083
Contra-paid, net37
Salvage and subrogation recoverable, net of reinsurance348
Loss and LAE reserve - financial guaranty insurance contracts, net of reinsurance(1,046)
Other recoverable (payable)(1)
Net expected loss to be expensed (present value) (2)$421
____________________
(1)See "Net Expected Loss to be Paid (Recovered) by Accounting Model" table in Note 5, Expected Loss to be Paid.

(2)Excludes $77$64 million as of December 31, 20152016 related to consolidated FG VIEs.


189


The following table provides a schedule of the expected timing of net expected losses to be expensed. The amount and timing of actual loss and LAE may differ from the estimates shown below due to factors such as accelerations, commutations, changes in expected lives and updates to loss estimates. This table excludes amounts related to FG VIEs, which are eliminated in consolidation.
 
Net Expected Loss to be Expensed
Financial Guaranty Insurance Contracts
 
 As of December 31, 2015
 (in millions)
2016 (January 1 – March 31)$12
2016 (April 1 – June 30)10
2016 (July 1 – September 30)8
2016 (October 1 – December 31)8
Subtotal 201638
201731
201830
201929
202027
2021-2025102
2026-203070
2031-203541
After 203519
Net expected loss to be expensed387
Discount286
Total expected future loss and LAE$673
 As of December 31, 2016
 (in millions)
2017 (January 1 – March 31)$8
2017 (April 1 – June 30)10
2017 (July 1 – September 30)8
2017 (October 1 – December 31)9
Subtotal 201735
201834
201932
202032
202128
2022-2026117
2027-203182
2032-203644
After 203617
Net expected loss to be expensed421
Future accretion373
Total expected future loss and LAE$794


190


The following table presents the loss and LAE recorded in the consolidated statements of operations by sector for insurance contracts. Amounts presented are net of reinsurance.

Loss and LAE
Reported on the
Consolidated Statements of Operations
 
 Year Ended December 31,
 2015 2014 2013
 (in millions)
Public Finance:     
U.S. public finance$392
 $192
 $198
Non-U.S. public finance1
 (1) 16
Public finance393
 191
 214
Structured Finance:     
U.S. RMBS:     
First lien:     
Prime first lien(1) (1) 1
Alt-A first lien(23) (66) (2)
Option ARM(15) (37) (48)
Subprime33
 8
 80
First lien(6) (96) 31
Second lien60
 (33) (35)
Total U.S. RMBS54
 (129) (4)
Triple-X life insurance transactions16
 85
 (44)
TruPS(1) (1) (1)
Student loans(9) 17
 10
Other structured finance(1) (7) 0
Structured finance59
 (35) (39)
Loss and LAE on insurance contracts before FG VIE consolidation452
 156
 175
Effect of consolidating FG VIEs(28) (30) (21)
Loss and LAE$424
 $126
 $154
 Year Ended December 31,
 2016 2015 2014
 (in millions)
Public finance:     
U.S. public finance$307
 $392
 $192
Non-U.S. public finance(3) 1
 (1)
Public finance304
 393
 191
Structured finance:     
U.S. RMBS37
 54
 (129)
Triple-X life insurance transactions(22) 16
 85
Other structured finance(17) (11) 9
Structured finance(2) 59
 (35)
Loss and LAE on insurance contracts before FG VIE consolidation302
 452
 156
Gain (loss) related to FG VIE consolidation(7) (28) (30)
Loss and LAE$295
 $424
 $126


191


The following table provides information on financial guaranty insurance contracts categorized as BIG.

Financial Guaranty Insurance
BIG Transaction Loss Summary
As of December 31, 20152016
 
BIG CategoriesBIG Categories
BIG 1 BIG 2 BIG 3 
Total
BIG, Net
 
Effect of
Consolidating
FG VIEs
 TotalBIG 1 BIG 2 BIG 3 
Total
BIG, Net
 
Effect of
Consolidating
FG VIEs
 Total
Gross Ceded Gross Ceded Gross Ceded Gross Ceded Gross Ceded Gross Ceded 
(dollars in millions)(dollars in millions)
Number of risks(1)202
 (46) 85
 (13) 132
 (44) 419
 
 419
165
 (35) 79
 (11) 148
 (49) 392
 
 392
Remaining weighted-average contract period (in years)10.0
 8.7
 13.8
 9.5
 7.7
 5.9
 10.7
 
 10.7
8.6
 7.0
 13.2
 10.5
 8.1
 6.0
 10.1
 
 10.1
Outstanding exposure: 


Principal$7,751
 $(732) $3,895
 $(240) $3,087
 $(187) $13,574
 $
 $13,574
$4,187
 $(326) $4,273
 $(416) $4,703
 $(320) $12,101
 $
 $12,101
Interest4,109
 (354) 2,805
 (110) 1,011
 (42) 7,419
 
 7,419
1,932
 (140) 2,926
 (219) 1,867
 (87) 6,279
 
 6,279
Total(2)$11,860
 $(1,086) $6,700
 $(350) $4,098
 $(229) $20,993
 $
 $20,993
$6,119
 $(466) $7,199
 $(635) $6,570
 $(407) $18,380
 $
 $18,380
Expected cash outflows (inflows)$386
 $(42) $1,158
 $(60) $1,464
 $(53) $2,853
 $(343) $2,510
$172
 $(19) $1,404
 $(86) $1,435
 $(65) $2,841
 $(326) $2,515
Potential recoveries                                  
Undiscounted R&W69
 (2) (49) 1
 (85) 5
 (61) 7
 (54)120
 (3) (2) 
 (62) 1
 54
 
 54
Other(3)(441) 14
 (118) 7
 (587) 19
 (1,106) 175
 (931)(560) 26
 (144) 4
 (681) 44
 (1,311) 198
 (1,113)
Total potential recoveries(372) 12
 (167) 8
 (672) 24
 (1,167) 182
 (985)(440) 23
 (146) 4
 (743) 45
 (1,257) 198
 (1,059)
Subtotal14
 (30) 991
 (52) 792
 (29) 1,686
 (161) 1,525
(268) 4
 1,258
 (82) 692
 (20) 1,584
 (128) 1,456
Discount91
 3
 (286) 12
 (58) (89) (327) 41
 (286)61
 (4) (355) 19
 (114) (4) (397) 24
 (373)
Present value of expected cash flows$105
 $(27) $705
 $(40) $734
 $(118) $1,359
 $(120) $1,239
$(207) $0
 $903
 $(63) $578
 $(24) $1,187
 $(104) $1,083
Deferred premium revenue$371
 $(37) $150
 $(4) $386
 $(32) $834
 $(100) $734
$131
 $(5) $246
 $(6) $476
 $(30) $812
 $(86) $726
Reserves (salvage)$2
 $(19) $591
 $(38) $404
 $(9) $931
 $(74) $857
$(255) $5
 $738
 $(58) $343
 $(10) $763
 $(64) $699
 

192


Financial Guaranty Insurance
BIG Transaction Loss Summary
As of December 31, 20142015
 
BIG CategoriesBIG Categories
BIG 1 BIG 2 BIG 3 
Total
BIG, Net
 
Effect of
Consolidating
FG VIEs
 TotalBIG 1 BIG 2 BIG 3 
Total
BIG, Net
 
Effect of
Consolidating
FG VIEs
 Total
Gross Ceded Gross Ceded Gross Ceded Gross Ceded Gross Ceded Gross Ceded 
(dollars in millions)(dollars in millions)
Number of risks(1)164
 (59) 75
 (15) 119
 (38) 358
 
 358
202
 (46) 85
 (13) 132
 (44) 419
 
 419
Remaining weighted-average contract period (in years)9.9
 7.4
 10.1
 8.9
 9.6
 6.9
 10.3
 
 10.3
10.0
 8.7
 13.8
 9.5
 7.7
 5.9
 10.7
 
 10.7
Outstanding exposure: 


Principal$12,358
 $(2,163) $2,421
 $(286) $3,067
 $(175) $15,222
 $
 $15,222
$7,751
 $(732) $3,895
 $(240) $3,087
 $(187) $13,574
 $
 $13,574
Interest6,350
 (838) 1,274
 (121) 1,034
 (48) 7,651
 
 7,651
4,109
 (354) 2,805
 (110) 1,011
 (42) 7,419
 
 7,419
Total(2)$18,708
 $(3,001) $3,695
 $(407) $4,101
 $(223) $22,873
 $
 $22,873
$11,860
 $(1,086) $6,700
 $(350) $4,098
 $(229) $20,993
 $
 $20,993
Expected cash outflows (inflows)$1,762
 $(626) $763
 $(77) $1,716
 $(75) $3,463
 $(345) $3,118
386
 (42) 1,158
 (60) 1,464
 (53) 2,853
 (343) 2,510
Potential recoveries                                  
Undiscounted R&W(39) 0
 (48) 2
 (171) 9
 (247) 8
 (239)69
 (2) (49) 1
 (85) 5
 (61) 7
 (54)
Other(3)(1,687) 608
 (206) 5
 (404) 30
 (1,654) 177
 (1,477)(372) 12
 (167) 8
 (672) 24
 (1,167) 182
 (985)
Total potential recoveries(1,726) 608
 (254) 7
 (575) 39
 (1,901) 185
 (1,716)(303) 10
 (216) 9
 (757) 29
 (1,228) 189
 (1,039)
Subtotal36
 (18) 509
 (70) 1,141
 (36) 1,562
 (160) 1,402
83
 (32) 942
 (51) 707
 (24) 1,625
 (154) 1,471
Discount3
 0
 (117) 11
 (353) 9
 (447) 34
 (413)22
 5
 (237) 11
 27
 (94) (266) 34
 (232)
Present value of expected cash flows$39
 $(18) $392
 $(59) $788
 $(27) $1,115
 $(126) $989
$105
 $(27) $705
 $(40) $734
 $(118) $1,359
 $(120) $1,239
Deferred premium revenue$378
 $(70) $119
 $(6) $312
 $(33) $700
 $(116) $584
$371
 $(37) $150
 $(4) $386
 $(32) $834
 $(100) $734
Reserves (salvage)$(42) $(5) $278
 $(53) $482
 $(10) $650
 $(79) $571
$2
 $(19) $591
 $(38) $404
 $(9) $931
 $(74) $857
____________________
(1)A risk represents the aggregate of the financial guaranty policies that share the same revenue source for purposes of making Debt Servicedebt service payments. The ceded number of risks represents the number of risks for which the Company ceded a portion of its exposure.

(2)Includes BIG amounts related to FG VIEs.

(3)Includes excess spread and draws on HELOCs.spread.
 

Ratings Impact on Financial Guaranty Business
 
A downgrade of one of AGL’s insurance subsidiaries may result in increased claims under financial guaranties issued by the Company, if the insured obligors were unable to pay.
 
For example, AGM has issued financial guaranty insurance policies in respect of the obligations of municipal obligors under interest rate swaps. AGM insures periodic payments owed by the municipal obligors to the bank counterparties. In certain cases, AGM also insures termination payments that may be owed by the municipal obligors to the bank counterparties. If (i) AGM has been downgraded below the rating trigger set forth in a swap under which it has insured the termination payment, which rating trigger varies on a transaction by transaction basis; (ii) the municipal obligor has the right to cure by, but has failed in, posting collateral, replacing AGM or otherwise curing the downgrade of AGM; (iii) the transaction documents include as a condition that an event of default or termination event with respect to the municipal obligor has occurred, such as the rating of the municipal obligor being downgraded past a specified level, and such condition has been met; (iv) the bank counterparty has elected to terminate the swap; (v) a termination payment is payable by the municipal obligor; and (vi) the municipal obligor has failed to make the termination payment payable by it, then AGM would be required to pay the termination payment due by the municipal obligor, in an amount not to exceed the policy limit set forth in the financial guaranty insurance policy. At AGM's current financial strength ratings, if the conditions giving rise to the obligation of AGM to make a termination payment under the swap termination policies were all satisfied, then AGM could pay claims in an amount

193


not exceeding approximately $150$125 million in respect of such termination payments. Taking into consideration whether the rating of the municipal obligor is below any applicable specified trigger, if the financial strength ratings of AGM were further downgraded below "A" by S&P or below "A2" by Moody's, and the conditions giving rise to the obligation of AGM to make a payment under the swap policies were all satisfied, then AGM could pay claims in an additional amount not exceeding approximately $377$291 million in respect of such termination payments.
     
As another example, with respect to variable rate demand obligations ("VRDOs")(VRDOs) for which a bank has agreed to provide a liquidity facility, a downgrade of AGM or AGC may provide the bank with the right to give notice to bondholders that the bank will terminate the liquidity facility, causing the bondholders to tender their bonds to the bank. Bonds held by the bank accrue interest at a “bank bond rate” that is higher than the rate otherwise borne by the bond (typically the prime rate plus 2.00% — 3.00%, and capped at the lesser of 25% and the maximum legal limit). In the event the bank holds such bonds for longer than a specified period of time, usually 90-180 days, the bank has the right to demand accelerated repayment of bond principal, usually through payment of equal installments over a period of not less than five years. In the event that a municipal obligor is unable to pay interest accruing at the bank bond rate or to pay principal during the shortened amortization period, a claim could be submitted to AGM or AGC under its financial guaranty policy. As of December 31, 20152016, AGM and AGC had insured approximately $5.7$4.9 billion net par of VRDOs, of which approximately $0.3 billion of net par constituted VRDOs issued by municipal obligors rated BBB- or lower pursuant to the Company’s internal rating. The specific terms relating to the rating levels that trigger the bank’s termination right, and whether it is triggered by a downgrade by one rating agency or a downgrade by all rating agencies then rating the insurer, vary depending on the transaction.

In addition, AGM may be required to pay claims in respect of AGMH’s former financial products business if Dexia SA and its affiliates, from which the Company had purchased AGMH and its subsidiaries, do not comply with their obligations following a downgrade of the financial strength rating of AGM. MostA downgrade of the guaranteed investment contracts ("GICs")financial strength rating of AGM could trigger a payment obligation of AGM in respect to AGMH's former GIC business. Most GICs insured by AGM allow for the termination of the GIC contract and a withdrawal of GIC funds at the option of the GIC holder to terminate the GIC and withdraw the funds in the event of a downgrade of AGM below a specified threshold, generally below A- by S&P or A3 or A-, with no right of the GIC issuerby Moody's. FSAM is expected to avoid suchhave sufficient eligible and liquid assets to satisfy any expected withdrawal byand collateral posting collateral or otherwise enhancing its credit. Each GIC contract stipulates the thresholds below which the GIC issuer must post eligible collateral, along with the types of securities eligible for posting and the collateralization percentage applicable to each security type. These collateralization percentages rangeobligations resulting from 100% of the GIC balance for cash posted as collateral to, typically, 108% for asset-backed securities. If the entire aggregate accreted GIC balance of approximately $1.8 billion as of December 31, 2015 were terminated, the assets of the GIC issuers (which had an aggregate market value which exceed the liabilities by $0.8 billion) would be sufficient to fund the withdrawal of the GIC funds.future rating actions affecting AGM.

7.Fair Value Measurement
 
The Company carries a significant portion of its assets and liabilities at fair value. Fair value is defined as the price that would be received to sell an asset or paid to transfer a liability in an orderly transaction between market participants at the measurement date (i.e., exit price). The price represents the price available in the principal market for the asset or liability. If there is no principal market, then the price is based on a hypothetical market that maximizes the value received for an asset or minimizes the amount paid for a liability (i.e., the most advantageous market).
 
Fair value is based on quoted market prices, where available. If listed prices or quotes are not available, fair value is based on either internally developed models that primarily use, as inputs, market-based or independently sourced market parameters, including but not limited to yield curves, interest rates and debt prices or with the assistance of an independent third-party using a discounted cash flow approach and the third party’s proprietary pricing models. In addition to market information, models also incorporate transaction details, such as maturity of the instrument and contractual features designed to reduce the Company’s credit exposure, such as collateral rights as applicable.
 
Valuation adjustments may be made to ensure that financial instruments are recorded at fair value. These adjustments include amounts to reflect counterparty credit quality, the Company’s creditworthiness and constraints on liquidity. As markets and products develop and the pricing for certain products becomes more or less transparent, the Company may refine its methodologies and assumptions. During 2015,2016, no changes were made to the Company’s valuation models that had or are expected to have, a material impact on the Company’s consolidated balance sheets or statements of operations and comprehensive income.
 
The Company’s methods for calculating fair value produce a fair value that may not be indicative of net realizable value or reflective of future fair values. The use of different methodologies or assumptions to determine fair value of certain financial instruments could result in a different estimate of fair value at the reporting date.
 

194


The categorization within the fair value hierarchy is determined based on whether the inputs to valuation techniques used to measure fair value are observable or unobservable. Observable inputs reflect market data obtained from independent sources, while unobservable inputs reflect Company estimates of market assumptions. The fair value hierarchy prioritizes

model inputs into three broad levels as follows, with Level 1 being the highest and Level 3 the lowest. An asset or liability’s categorization within the fair value hierarchy is based on the lowest level of significant input to its valuation.

Level 1—Quoted prices for identical instruments in active markets. The Company generally defines an active market as a market in which trading occurs at significant volumes. Active markets generally are more liquid and have a lower bid-ask spread than an inactive market.
 
Level 2—Quoted prices for similar instruments in active markets; quoted prices for identical or similar instruments in markets that are not active; and observable inputs other than quoted prices, such as interest rates or yield curves and other inputs derived from or corroborated by observable market inputs.
 
Level 3—Model derived valuations in which one or more significant inputs or significant value drivers are unobservable. Financial instruments are considered Level 3 when their values are determined using pricing models, discounted cash flow methodologies or similar techniques and at least one significant model assumption or input is unobservable. Level 3 financial instruments also include those for which the determination of fair value requires significant management judgment or estimation.

In May 2015, the FASB issued ASU No. 2015-07, Fair Value Measurement (Topic 820): Disclosures for Investments in Certain Entities That Calculate Net Asset Value per Share, which removes the requirement to make certain disclosures and categorize within the fair value hierarchy, certain investments for which fair value is measured using the net asset value ("NAV") per share as a practical expedient. Effective December 31, 2015, the Company retrospectively adopted this accounting guidance that no longer requires investments measured at fair value using NAV per share practical expedient to be categorized within the fair value hierarchy. Therefore, the Company no longer includes its investments in partially-owned investment companies, investment funds, and limited partnerships within the fair value hierarchy and the Level 3 rollforward tables disclosed below. Prior period amounts within the fair value hierarchy disclosures contained in this section have been revised to conform to the current period presentation. This guidance requires a change in disclosure only and adoption of this guidance did not have an impact on our financial condition or results of operations.

Transfers between Levels 1, 2 and 3 are recognized at the end of the period when the transfer occurs. The Company reviews the classification between Levels 1, 2 and 3 quarterly to determine whether a transfer is necessary. During the periods
presented, there were no transfers between Level 1 and Level 2. There were transfers of fixed-maturity securities from Level 2 into Level 3 during 2016 because of a lack of observability relating to the valuation inputs and 3.collateral pricing. There were no transfers into or out of Level 3 during 2015.
 
Measured and Carried at Fair Value
 
Fixed-Maturity Securities and Short-Term Investments
 
The fair value of bonds in the investment portfolio is generally based on prices received from third party pricing services or alternative pricing sources with reasonable levels of price transparency. The pricing services prepare estimates of fair value measurements using their pricing models, which include available relevant market information, benchmark curves, benchmarking of like securities, and sector groupings. Additional valuation factors that can be taken into account are nominal spreads and liquidity adjustments. The pricing services evaluate each asset class based on relevant market and credit information, perceived market movements, and sector news. The market inputs used in the pricing evaluation include: benchmark yields, reported trades, broker/dealer quotes, issuer spreads, two-sided markets, benchmark securities, bids, offers, reference data and industry and economic events. Benchmark yields have in many cases taken priority over reported trades for securities that trade less frequently or those that are distressed trades, and therefore may not be indicative of the market. The extent of the use of each input is dependent on the asset class and the market conditions. Given the asset class, the priority of the use of inputs may change or some market inputs may not be relevant. Additionally, the valuation of fixed-maturity investments is more subjective when markets are less liquid due to the lack of market based inputs, which may increase the potential that the estimated fair value of an investment is not reflective of the price at which an actual transaction would occur.
 
Short-term investments, that are traded in active markets, are classified within Level 1 in the fair value hierarchy and aretheir value is based on quoted market prices. Securities such as discount notes are classified within Level 2 because these securities are typically not actively traded due to their approaching maturity and, as such, their cost approximates fair value. Short term securities that were obtained as part of loss mitigation efforts and whose prices were determined based on models, where at least one significant model assumption or input is unobservable, are considered to be Level 3 in the fair value hierarchy.
 

195


Annually, the Company reviews each pricing service’s procedures, controls and models used in the valuations of the Company’s investment portfolio, as well as the competency of the pricing service’s key personnel. In addition, on a quarterly basis, the Company holds a meeting of the internal valuation committee (comprised of individuals within the Company with market, valuation, accounting, and/or finance experience) that reviews and approves prices and assumptions used by the pricing services.

For Level 1 and 2 securities, the Company, on a quarterly basis, reviews internally developed analytic packages that highlight, at a CUSIP level, price changes from the previous quarter to the current quarter. Where unexpected price movements are noted for a specific CUSIP, the Company formally challenges the price provided, and reviews all key inputs utilized in the third party’s pricing model, and compares such information to management’s own market information.


For Level 3 securities, the Company, on a quarterly basis:

reviews methodologies, any model updates and inputs and compares such information to management’s own market information and, where applicable, the internal models,

reviews internally developed analytic packages that highlight, at a CUSIP level, price changes from the previous quarter to the current quarter, and evaluates, documents, and resolves any significant pricing differences with the assistance of the third party pricing source, and

compares prices received from different third party pricing sources, and evaluates, documents the rationale for, and resolves any significant pricing differences.
 
As of December 31, 2015,2016, the Company used models to price 3880 fixed-maturity securities and short-term investments (which(primarily securities that were purchased or obtained for loss mitigation or other risk management purposes), which was 10.4%were 11.7% or $1,144$1,269 million of the Company’s fixed-maturity securities and short-term investments at fair value. Most Level 3 securities were priced with the assistance of an independent third-party. The pricing is based on a discounted cash flow approach using the third-party’s proprietary pricing models. The models use inputs such as projected prepayment speeds;  severity assumptions; recovery lag assumptions; estimated default rates (determined on the basis of an analysis of collateral attributes, historical collateral performance, borrower profiles and other features relevant to the evaluation of collateral credit quality); home price depreciation/appreciationappreciation/depreciation rates based on macroeconomic forecasts and recent trading activity. The yield used to discount the projected cash flows is determined by reviewing various attributes of the bond including collateral type, weighted average life, sensitivity to losses, vintage, and convexity, in conjunction with market data on comparable securities. Significant changes to any of these inputs could materially change the expected timing of cash flows within these securities which is a significant factor in determining the fair value of the securities.
 
Other Invested Assets
 
As of December 31, 20152016 and December 31, 2014,2015, other invested assets include investments carried and measured at fair value on a recurring basis of $53$52 million and $95$53 million, respectively, and include primarily an investment in the global property catastrophe risk market and an investment in a fund that invests primarily in senior loans and bonds. Fair values for the majority of these investments are based on their respective NAVnet asset value (NAV) per share or equivalent, as a practical expedient, and are excluded from the fair value hierarchy table below. Other invested assets also include fixed-maturity securities classified as trading carried as Level 2.equivalent.
 
Other Assets
 
Committed Capital Securities
 
The fair value of committed capital securities ("CCS")(CCS), which is recorded in “other assets” on the consolidated balance sheets, represents the difference between the present value of remaining expected put option premium payments under AGC’s CCS (the “AGC CCS”)AGC CCS) and AGM’s Committed Preferred Trust Securities (the “AGM CPS”)AGM CPS) agreements, and the estimated present value that the Company would hypothetically have to pay currently for a comparable security (see Note 16, Long Term Debt and Credit Facilities). The AGC CCS and AGM CPS are carried at fair value with changes in fair value recorded in the consolidated statement of operations. The estimated current cost of the Company’s CCS is based on several factors, including broker-dealer quotes for the outstanding securities, AGM and AGC CDS spreads, the U.S. dollar forward swap curve, London Interbank Offered Rate ("LIBOR")(LIBOR) curve projections, the Company's publicly traded debt and the term the securities are estimated to remain outstanding.
 

196


 Supplemental Executive Retirement Plans

The Company classifies the fair value measurement of the assets of the Company's various supplemental executive retirement plans as either Level 1 or Level 2. The fair value of these assets is valued based on the observable published daily values of the underlying mutual fund included in the aforementioned plans (Level 1) or based upon the net asset valueNAV of the funds if a published daily value is not available (Level 2). The net asset valuesNAV are based on observable information.
 
Financial Guaranty Contracts Accounted for as Credit Derivatives
 
The Company’s credit derivatives consist primarily of insured CDS contracts, and also include interest rate swaps and as of December 31, 2016, hedges on other financial guarantors that fall under derivative accounting standards requiring fair value accounting through the statement of operations. The following is a description of the fair value methodology applied to the Company's insured CDS that are accounted for as credit derivatives, which constitute the vast majority of the net credit derivative liability in the consolidated balance sheets. The Company doesdid not enter into CDS with the intent to trade these

contracts and the Company may not unilaterally terminate a CDS contract absent an event of default or termination event that entitles the Company to terminate such contracts; however, the Company has mutually agreed with various counterparties to terminate certain CDS transactions. Such terminations generally are not completed at fair value but insteaddone for an amount that approximates the present value of future premiums or for a negotiated amount.amount; not at fair value.
 
The terms of the Company’s CDS contracts differ from more standardized credit derivative contracts sold by companies outside the financial guaranty industry. The non-standard terms generally include the absence of collateral support agreements or immediate settlement provisions. In addition, the Company employs relatively high attachment points and does not exit derivatives it sells or purchases for credit protection purposes, except under specific circumstances such as mutual agreements with counterparties. Management considers the non-standard terms of its credit derivative contracts in determining the fair value of these contracts.
 
Due to the lack of quoted prices and other observable inputs for its instruments or for similar instruments, the Company determines the fair value of its credit derivative contracts primarily through internally developed, proprietary models that use both observable and unobservable market data inputs to derive an estimate of the fair value of the Company's contracts in its principal markets (see "Assumptions and Inputs"). There is no established market where financial guaranty insured credit derivatives are actively traded;traded, therefore, management has determined that the exit market for the Company’s credit derivatives is a hypothetical one based on its entry market. Management has tracked the historical pricing of the Company’s deals to establish historical price points in the hypothetical market that are used in the fair value calculation. These contracts are classified as Level 3 in the fair value hierarchy since there is reliance on at least one unobservable input deemed significant to the valuation model, most importantly the Company’s estimate of the value of the non-standard terms and conditions of its credit derivative contracts and of the Company’s current credit standing.

The Company’s models and the related assumptions are continuously reevaluated by management and enhanced, as appropriate, based upon improvements in modeling techniques and availability of more timely and relevant market information.
 
The fair value of the Company’s credit derivative contracts represents the difference between the present value of remaining premiums the Company expects to receive or pay and the estimated present value of premiums that a financial guarantor of comparable credit-worthiness would hypothetically charge or pay at the reporting date for the same protection. The fair value of the Company’s credit derivatives depends on a number of factors, including notional amount of the contract, expected term, credit spreads, changes in interest rates, the credit ratings of referenced entities, the Company’s own credit risk and remaining contractual cash flows. The expected remaining contractual premium cash flows are the most readily observable inputs since they are based on the CDS contractual terms. Credit spreads capture the effect of recovery rates and performance of underlying assets of these contracts, among other factors. Consistent with previous years, market conditions at December 31, 20152016 were such that market prices of the Company’s CDS contracts were not available.
 
Management considers factors such as current prices charged for similar agreements, when available, performance of underlying assets, life of the instrument, and the nature and extent of activity in the financial guaranty credit derivative marketplace. The assumptions that management uses to determine the fair value may change in the future due to market conditions. Due to the inherent uncertainties of the assumptions used in the valuation models, actual experience may differ from the estimates reflected in the Company’s consolidated financial statements and the differences may be material.


197


Assumptions and Inputs
 
The various inputs and assumptions that are key to the establishment of the Company’s fair value for CDS contracts are as follows:
 
Gross spread.

The allocation of gross spread among:
 
the profit the originator, usually an investment bank, realizes for putting the deal together and funding the transaction (“bank profit”)(bank profit);

 premiums paid to the Company for the Company’s credit protection provided (“net spread”); and

the cost of CDS protection purchased by the originator to hedge their counterparty credit risk exposure to the Company (“hedge cost”)(hedge cost).
 

The weighted average life which is based on Debt Servicedebt service schedules.

The rates used to discount future expected premium cash flows ranged from 1.00% to 2.55% at December 31, 2016 and 0.44% to 2.51% at December 31, 2015 and 0.26% to 2.70% at December 31, 2014.2015.
 
The Company obtains gross spreads on its outstanding contracts from market data sources published by third parties (e.g., dealer spread tables for the collateral similar to assets within the Company’s transactions), as well as collateral-specific spreads provided by trustees or obtained from market sources. If observable market credit spreads are not available or reliable for the underlying reference obligations, then market indices are used that most closely resemble the underlying reference obligations, considering asset class, credit quality rating and maturity of the underlying reference obligations. These indices are adjusted to reflect the non-standard terms of the Company’s CDS contracts. Market sources determine credit spreads by reviewing new issuance pricing for specific asset classes and receiving price quotes from their trading desks for the specific asset in question. Management validates these quotes by cross-referencing quotes received from one market source against quotes received from another market source to ensure reasonableness. In addition, the Company compares the relative change in price quotes received from one quarter to another, with the relative change experienced by published market indices for a specific asset class. Collateral specific spreads obtained from third-party, independent market sources are un-published spread quotes from market participants or market traders who are not trustees. Management obtains this information as the result of direct communication with these sources as part of the valuation process.

With respect to CDS transactions for which there is an expected claim payment within the next twelve months, the allocation of gross spread reflects a higher allocation to the cost of credit rather than the bank profit component. In the current market, it is assumed that a bank would be willing to accept a lower profit on distressed transactions in order to remove these transactions from its financial statements.
 
The following spread hierarchy is utilized in determining which source of gross spread to use, with the rule being to use CDS spreads where available. If not available, CDS spreads are either interpolated or extrapolated based on similar transactions or market indices.
 
Actual collateral specific credit spreads (if up-to-date and reliable market-based spreads are available).

Deals priced or closed during a specific quarter within a specific asset class and specific rating. No transactions closed during the periods presented.

Credit spreads interpolated based upon market indices.

Credit spreads provided by the counterparty of the CDS.

Credit spreads extrapolated based upon transactions of similar asset classes, similar ratings, and similar time to maturity.
 

198


Information by Credit Spread Type (1)
 
As of
December 31, 2015
 As of
December 31, 2014
As of
December 31, 2016
 As of
December 31, 2015
Based on actual collateral specific spreads13% 9%7% 13%
Based on market indices73% 82%77% 73%
Provided by the CDS counterparty14% 9%16% 14%
Total100% 100%100% 100%
 ____________________
(1)    Based on par.
 
Over time the data inputs can change as new sources become available or existing sources are discontinued or are no longer considered to be the most appropriate. It is the Company’s objective to move to higher levels on the hierarchy whenever possible, but it is sometimes necessary to move to lower priority inputs because of discontinued data sources or management’s assessment that the higher priority inputs are no longer considered to be representative of market spreads for a given type of collateral. This can happen, for example, if transaction volume changes such that a previously used spread index is no longer viewed as being reflective of current market levels.

The Company interpolates a curve based on the historical relationship between the premium the Company receives when a credit derivative is closed to the daily closing price of the market index related to the specific asset class and rating of the deal. This curve indicates expected credit spreads at each indicative level on the related market index. For transactions with unique terms or characteristics where no price quotes are available, management extrapolates credit spreads based on a similar transaction for which the Company has received a spread quote from one of the first three sources within the Company’s spread hierarchy. This alternative transaction will be within the same asset class, have similar underlying assets, similar credit ratings, and similar time to maturity. The Company then calculates the percentage of relative spread change quarter over quarter for the alternative transaction. This percentage change is then applied to the historical credit spread of the transaction for which no price quote was received in order to calculate the transactions’ current spread. Counterparties determine credit spreads by reviewing new issuance pricing for specific asset classes and receiving price quotes from their trading desks for the specific asset in question. These quotes are validated by cross-referencing quotes received from one market source with those quotes received from another market source to ensure reasonableness.
 
The premium the Company receives is referred to as the “net spread.” The Company’s pricing model takes into account not only how credit spreads on risks that it assumes affect pricing, but also how the Company’s own credit spread affects the pricing of its deals. The Company’s own credit risk is factored into the determination of net spread based on the impact of changes in the quoted market price for credit protection bought on the Company, as reflected by quoted market prices on CDS referencing AGC or AGM. For credit spreads on the Company’s name the Company obtains the quoted price of CDS contracts traded on AGC and AGM from market data sources published by third parties. The cost to acquire CDS protection referencing AGC or AGM affects the amount of spread on CDS deals that the Company retains and, hence, their fair value. As the cost to acquire CDS protection referencing AGC or AGM increases, the amount of premium the Company retains on a deal generally decreases. As the cost to acquire CDS protection referencing AGC or AGM decreases, the amount of premium the Company retains on a deal generally increases. In the Company’s valuation model, the premium the Company captures is not permitted to go below the minimum rate that the Company would currently charge to assume similar risks. This assumption can have the effect of mitigating the amount of unrealized gains that are recognized on certain CDS contracts. Given the current market conditions and the Company’s own credit spreads, approximately 20%26% and 21%20% , based on number of deals, of the Company's CDS contracts are fair valued using this minimum premium as of December 31, 20152016 and December 31, 2014,2015, respectively. The percentage of deals that price using the minimum premiums fluctuates due to changes in AGM's and AGC's credit spreads. In general when AGM's and AGC's credit spreads narrow, the cost to hedge AGM's and AGC's name declines and more transactions price above previously established floor levels. Meanwhile, when AGM's and AGC's credit spreads widen, the cost to hedge AGM's and AGC's name increases causing more transactions to price at previously established floor levels. The Company corroborates the assumptions in its fair value model, including the portion of exposure to AGC and AGM hedged by its counterparties, with independent third parties each reporting period. The current level of AGC’s and AGM’s own credit spread has resulted in the bank or deal originator hedging a significant portion of its exposure to AGC and AGM. This reduces the amount of contractual cash flows AGC and AGM can capture as premium for selling its protection.

The amount of premium a financial guaranty insurance market participant can demand is inversely related to the cost of credit protection on the insurance company as measured by market credit spreads assuming all other assumptions remain constant. This is because the buyers of credit protection typically hedge a portion of their risk to the financial guarantor, due to

199


the fact that the contractual terms of the Company's contracts typically do not require the posting of collateral by the guarantor. The extent of the hedge depends on the types of instruments insured and the current market conditions.
 
A fair value resulting in a credit derivative asset on protection sold is the result of contractual cash inflows on in-force deals in excess of what a hypothetical financial guarantor could receive if it sold protection on the same risk as of the reporting date. If the Company were able to freely exchange these contracts (i.e., assuming its contracts did not contain proscriptions on transfer and there was a viable exchange market), it would be able to realize a gain representing the difference between the higher contractual premiums to which it is entitled and the current market premiums for a similar contract. The Company determines the fair value of its CDS contracts by applying the difference between the current net spread and the contractual net spread for the remaining duration of each contract to the notional value of its CDS contracts and taking the present value of such amounts discounted at the corresponding LIBOR over the weighted average remaining life of the contract.
 

Example
 
The following is an example of how changes in gross spreads, the Company’s own credit spread and the cost to buy protection on the Company affect the amount of premium the Company can demand for its credit protection. The assumptions used in these examples are hypothetical amounts. Scenario 1 represents the market conditions in effect on the transaction date and Scenario 2 represents market conditions at a subsequent reporting date.
 
 Scenario 1 Scenario 2
 bps % of Total bps % of Total
Original gross spread/cash bond price (in bps)185
  
 500
  
Bank profit (in bps)115
 62% 50
 10%
Hedge cost (in bps)30
 16% 440
 88%
The premium the Company receives per annum (in bps)40
 22% 10
 2%
 
In Scenario 1, the gross spread is 185 basis points. The bank or deal originator captures 115 basis points of the original gross spread and hedges 10% of its exposure to AGC, when the CDS spread on AGC was 300 basis points (300 basis points × 10% = 30 basis points). Under this scenario the Company receives premium of 40 basis points, or 22% of the gross spread.
 
In Scenario 2, the gross spread is 500 basis points. The bank or deal originator captures 50 basis points of the original gross spread and hedges 25% of its exposure to AGC, when the CDS spread on AGC was 1,760 basis points (1,760 basis points × 25% = 440 basis points). Under this scenario the Company would receive premium of 10 basis points, or 2% of the gross spread. Due to the increased cost to hedge AGC’s name, the amount of profit the bank would expect to receive, and the premium the Company would expect to receive decline significantly.
 
In this example, the contractual cash flows (the Company premium received per annum above) exceed the amount a market participant would require the Company to pay in today’s market to accept its obligations under the CDS contract, thus resulting in an asset.

Strengths and Weaknesses of Model
 
The Company’s credit derivative valuation model, like any financial model, has certain strengths and weaknesses.
 
The primary strengths of the Company’s CDS modeling techniques are:
 
The model takes into account the transaction structure and the key drivers of market value. The transaction structure includes par insured, weighted average life, level of subordination and composition of collateral.

The model maximizes the use of market-driven inputs whenever they are available. The key inputs to the model are market-based spreads for the collateral, and the credit rating of referenced entities. These are viewed by the Company to be the key parameters that affect fair value of the transaction.

The model is a consistent approach to valuing positions. The Company has developed a hierarchy for market-based spread inputs that helps mitigate the degree of subjectivity during periods of high illiquidity.
 

200


The primary weaknesses of the Company’s CDS modeling techniques are:
 
There is no exit market or actual exit transactions. Therefore the Company’s exit market is a hypothetical one based on the Company’s entry market.

There is a very limited market in which to validate the reasonableness of the fair values developed by the Company’s model.

At December 31, 2015 and 2014, theThe markets for the inputs to the model were highly illiquid, which impacts their reliability.
 
Due to the non-standard terms under which the Company enters into derivative contracts, the fair value of its credit derivatives may not reflect the same prices observed in an actively traded market of credit derivatives that do not contain terms and conditions similar to those observed in the financial guaranty market.

These contracts were classified as Level 3 in the fair value hierarchy because there is a reliance on at least one unobservable input deemed significant to the valuation model, most significantly the Company's estimate of the value of non-standard terms and conditions of its credit derivative contracts and amount of protection purchased on AGC or AGM's name.

Fair Value Option on FG VIEs’ Assets and Liabilities
 
The Company elected the fair value option for all the FG VIEs’ assets and liabilities. See Note 9, Consolidated Variable Interest Entities.
 
The FG VIEs issued securities collateralized by first lien and second lien RMBS as well as loans and receivables. The lowest level input that is significant to the fair value measurement of these assets and liabilities was a Level 3 input (i.e., unobservable), therefore management classified them as Level 3 in the fair value hierarchy. Prices are generally determined with the assistance of an independent third-party, based on a discounted cash flow approach. The models to price the FG VIEs’ liabilities used, where appropriate, inputs such as estimated prepayment speeds; market values of the assets that collateralize the securities; estimated default rates (determined on the basis of an analysis of collateral attributes, historical collateral performance, borrower profiles and other features relevant to the evaluation of collateral credit quality); yields implied by market prices for similar securities; house price depreciation/appreciation rates based on macroeconomic forecasts and, for those liabilities insured by the Company, the benefit from the Company’s insurance policy guaranteeing the timely payment of principal and interest, taking into account the timing of the potential default and the Company’s own credit rating. The third-party also utilizes an internal model to determine an appropriate yield at which to discount the cash flows of the security, by factoring in collateral types, weighted-average lives, and other structural attributes specific to the security being priced. The expected yield is further calibrated by utilizing algorithms designed to aggregate market color, received by the third-party, on comparable bonds.
 
The fair value of the Company’s FG VIE assets is generally sensitive to changes related to estimated prepayment speeds; estimated default rates (determined on the basis of an analysis of collateral attributes such as: historical collateral performance, borrower profiles and other features relevant to the evaluation of collateral credit quality); discount ratesyields implied by market prices for similar securities; and house price depreciation/appreciation rates based on macroeconomic forecasts. Significant changes to some of these inputs could materially change the market value of the FG VIE’s assets and the implied collateral losses within the transaction. In general, the fair value of the FG VIE asset is most sensitive to changes in the projected collateral losses, where an increase in collateral losses typically leads to a decrease in the fair value of FG VIE assets, while a decrease in collateral losses typically leads to an increase in the fair value of FG VIE assets. These factors also directly impact the fair value of the Company’s FG VIE liabilities.
 
The fair value of the Company’s FG VIE liabilities is generally sensitive to the various model inputs described above. In addition, the Company’s FG VIE liabilities with recourse are also sensitive to changes in the Company’s implied credit worthiness. Significant changes to any of these inputs could materially change the timing of expected losses within the insured transaction which is a significant factor in determining the implied benefit from the Company’s insurance policy guaranteeing the timely payment of principal and interest for the tranches of debt issued by the FG VIE that is insured by the Company. In general, extending the timing of expected loss payments by the Company into the future typically leads to a decrease in the value of the Company’s insurance and a decrease in the fair value of the Company’s FG VIE liabilities with recourse, while a shortening of the timing of expected loss payments by the Company typically leads to an increase in the value of the Company’s insurance and an increase in the fair value of the Company’s FG VIE liabilities with recourse.
 

201


Not Carried at Fair Value
 
Financial Guaranty Insurance Contracts

For financial guaranty insurance contracts that are acquired in a business combination, the Company measures each contract at fair value on the date of acquisition, and then follows insurance accounting guidance on a recurring basis thereafter.  On a quarterly basis, the Company also discloses the fair value of its outstanding financial guaranty insurance contracts.  In both cases, fair value is based on management’s estimate of what a similarly rated financial guaranty insurance company would demand to acquire the Company’s in-force book of financial guaranty insurance business. It is based on a variety of factors that may include pricing assumptions management has observed for portfolio transfers, commutations, and acquisitions that have occurred in the financial guaranty market, as well as prices observed in the credit derivative market with an adjustment for illiquidity so that the terms would be similar to a financial guaranty insurance contract, and includes adjustments to the carrying value of unearned premium reserve for stressed losses, ceding commissions and return on capital. The significant inputs were not readily observable. The Company accordingly classified this fair value measurement as Level 3.

 
Long-Term Debt
 
The Company’s long-term debt, excluding notes payable, is valued by broker-dealers using third party independent pricing sources and standard market conventions. The market conventions utilize market quotations, market transactions for the Company’s comparable instruments, and to a lesser extent, similar instruments in the broader insurance industry. The fair value measurement was classified as Level 2 in the fair value hierarchy.
 
The fair value of the notes payable was determined by calculating the present value of the expected cash flows. The Company determines discounted future cash flows using market driven discount rates and a variety of assumptions, including a projection of the LIBOR rate, prepayment and default assumptions, and AGM CDS spreads. The fair value measurement was classified as Level 3 in the fair value hierarchy because there is a reliance on significant unobservable inputs to the valuation model, including the discount rates, prepayment and default assumptions, loss severity and recovery on delinquent loans.hierarchy.
 
Other Invested Assets
 
The other invested assets not carried at fair value consist primarily of investments in a guaranteed investment contract for future claims payments.contract. The fair value of the investments in athe guaranteed investment contract approximated their carrying value due to their short term nature. The fair value measurement of the guaranteed investment contract was classified as Level 2 in the fair value hierarchy.
 
Other Assets and Other Liabilities
 
The Company’s other assets and other liabilities consist predominantly of accrued interest, receivables for securities sold and payables for securities purchased, the carrying values of which approximate fair value.


202


Financial Instruments Carried at Fair Value
 
Amounts recorded at fair value in the Company’s financial statements are presented in the tables below.
 
Fair Value Hierarchy of Financial Instruments Carried at Fair Value
As of December 31, 20152016
 
  Fair Value Hierarchy  Fair Value Hierarchy
Fair Value Level 1 Level 2 Level 3Fair Value Level 1 Level 2 Level 3
(in millions)(in millions)
Assets: 


Investment portfolio, available-for-sale: 


Fixed-maturity securities 


Obligations of state and political subdivisions$5,841
 $
 $5,833
 $8
$5,432
 $
 $5,393
 $39
U.S. government and agencies400
 
 400
 
440
 
 440
 
Corporate securities1,520
 
 1,449
 71
1,613
 
 1,553
 60
Mortgage-backed securities: 
       
      
RMBS1,245
 
 897
 348
987
 
 622
 365
CMBS513
 
 513
 
583
 
 583
 
Asset-backed securities825
 
 168
 657
945
 
 140
 805
Foreign government securities283
 
 283
 
233
 
 233
 
Total fixed-maturity securities10,627


 9,543
 1,084
10,233


 8,964
 1,269
Short-term investments396
 305
 31
 60
590
 319
 271
 
Other invested assets (1)12
 
 5
 7
8
 
 0
 8
Credit derivative assets81
 
 
 81
13
 
 
 13
FG VIEs’ assets, at fair value1,261
 
 
 1,261
876
 
 
 876
Other assets106
 23
 21
 62
114
 24
 28
 62
Total assets carried at fair value$12,483
 $328
 $9,600
 $2,555
$11,834
 $343
 $9,263
 $2,228
Liabilities: 


Credit derivative liabilities$446
 $
 $
 $446
$402
 $
 $
 $402
FG VIEs’ liabilities with recourse, at fair value1,225
 
 
 1,225
807
 
 
 807
FG VIEs’ liabilities without recourse, at fair value124
 
 
 124
151
 
 
 151
Total liabilities carried at fair value$1,795
 $
 $
 $1,795
$1,360
 $
 $
 $1,360
 

203


Fair Value Hierarchy of Financial Instruments Carried at Fair Value
As of December 31, 20142015
 
  Fair Value Hierarchy  Fair Value Hierarchy
Fair Value Level 1 Level 2 Level 3Fair Value Level 1 Level 2 Level 3
(in millions)(in millions)
Assets: 


Investment portfolio, available-for-sale: 


Fixed-maturity securities 


Obligations of state and political subdivisions$5,795
 $
 $5,757
 $38
$5,841
 $
 $5,833
 $8
U.S. government and agencies665
 
 665
 
400
 
 400
 
Corporate securities1,368
 
 1,289
 79
1,520
 
 1,449
 71
Mortgage-backed securities: 


RMBS1,285
 
 860
 425
1,245
 
 897
 348
CMBS659
 
 659
 
513
 
 513
 
Asset-backed securities417
 
 189
 228
825
 
 168
 657
Foreign government securities302
 
 302
 
283
 
 283
 
Total fixed-maturity securities10,491
 
 9,721
 770
10,627
 
 9,543
 1,084
Short-term investments767
 359
 408
 
396
 305
 31
 60
Other invested assets(1)24
 
 17
 7
12
 
 5
 7
Credit derivative assets68
 
 
 68
81
 
 
 81
FG VIEs’ assets, at fair value(2)1,398
 
 
 1,398
1,261
 
 
 1,261
Other assets78
 26
 17
 35
106
 23
 21
 62
Total assets carried at fair value$12,826
 $385
 $10,163
 $2,278
$12,483
 $328
 $9,600
 $2,555
Liabilities: 


Credit derivative liabilities$963
 $
 $
 $963
$446
 $
 $
 $446
FG VIEs’ liabilities with recourse, at fair value1,277
 
 
 1,277
1,225
 
 
 1,225
FG VIEs’ liabilities without recourse, at fair value142
 
 
 142
124
 
 
 124
Total liabilities carried at fair value$2,382
 $
 $
 $2,382
$1,795
 $
 $
 $1,795
 ____________________
(1)Excluded from the table above are investments funds of $45$48 million and $76$45 million as of December 31, 20152016 and December 31, 2014,2015, respectively, measured using NAV per share practical expedient.share. Includes Level 3 mortgage loans that are recorded at fair value on a non-recurring basis.

(2)Excludes restricted cash.


204


Changes in Level 3 Fair Value Measurements
 
The table below presents a roll forward of the Company’s Level 3 financial instruments carried at fair value on a recurring basis during the years ended December 31, 20152016 and 2014.2015.

Fair Value Level 3 Rollforward
Recurring Basis
Year Ended December 31, 20152016
 
Fixed-Maturity Securities             Fixed-Maturity Securities             
Obligations
of State and
Political
Subdivisions
 Corporate Securities RMBS Asset-
Backed
Securities
 Short-Term Investments FG VIEs’
Assets at
Fair
Value
 Other
Assets (8)
 Credit
Derivative
Asset
(Liability),
net (5)
 FG VIEs' Liabilities with Recourse,
at Fair
Value
 FG VIEs' Liabilities without Recourse,
at Fair
Value
 Obligations
of State and
Political
Subdivisions
 Corporate Securities RMBS Asset-
Backed
Securities
 Short-Term Investments FG VIEs’
Assets at
Fair
Value
 Other
Assets (8)
 Credit
Derivative
Asset
(Liability),
net (5)
 FG VIEs' Liabilities with Recourse,
at Fair
Value
 FG VIEs' Liabilities without Recourse,
at Fair
Value
 
(in millions)(in millions)
Fair value as of December 31, 2014$38
 $79
 $425
 $228
 
$
 $1,398
 
$37
 
$(895) $(1,277) $(142) 
Radian Asset Acquisition
 
 4
 
 
 122
 2
 (215) (114) (4) 
Fair value as of December 31, 2015$8
 $71
 $348
 $657
 
$60
 $1,261
 
$65
 
$(365) $(1,225) $(124) 
CIFG Acquisition1
 
 20
 36
 0
 
 
 (67) 
 
 
Total pretax realized and unrealized gains/(losses) recorded in: (1)        


Net income (loss)3
(2)3
(2)18
(2)1
(2)24
(2)59
(3)26
(4)728
(6)111
(3)(28)(3)2
(2)(16)(2)10
(2)51
(2)0
(2)167
(3)0
(4)74
(6)(125)(3)(18)(3)
Other comprehensive income (loss)(2) (11) (12) (9) 
0
 
 
0


 (4) 5
 (13) 116
 
0
 
 
0


Purchases
 
 48
 471
 
52
(7)


 33
 
 70
 76


Settlements(31)(7)
 (134) (34) (16) (400) 
 
17
 
186
 
28
 (1) 
 (70) (139) (60) (629) 
 
(31) 
597
 
14
 
FG VIE consolidations
 
 (1) 
 

 104


(131) 


 97


(54) (43) 
FG VIE deconsolidations


 (22) 
 
 
 22
 
 
 0
 
 
 (20) 
 
 
 20
 
Fair value as of December 31, 2015$8
 $71
 $348
 $657
 
$60
 $1,261
 
$65
 
$(365) $(1,225) $(124) 
Change in unrealized gains/(losses) related to financial instruments held as of December 31, 2015$0
 $(11) $(9) $(9) $0
 $110
 $26
 $281
 $4
 $(22) 
Transfers into Level 3
 
 
 8


Fair value as of December 31, 2016$39
 $60
 $365
 $805
 
$
 $876
 
$65
 
$(389) $(807) $(151) 
Change in unrealized gains/(losses) related to financial instruments held as of December 31, 2016$(4) $5
 $(15) $116
 $
 $93
 $0
 $(33) $(12) $(17) 


205


Fair Value Level 3 Rollforward
Recurring Basis
Year Ended December 31, 20142015

Fixed-Maturity Securities           Fixed-Maturity Securities             
Obligations
of State and
Political
Subdivisions
 Corporate Securities RMBS Asset-
Backed
Securities
 FG VIEs’
Assets at
Fair
Value
 Other
Assets (8)
 Credit
Derivative
Asset
(Liability),
net (5)
 FG VIEs' Liabilities with Recourse,
at Fair
Value
 FG VIEs' Liabilities without Recourse,
at Fair
Value
 Obligations
of State and
Political
Subdivisions
 Corporate Securities RMBS Asset-
Backed
Securities
 Short-Term Investments FG VIEs’
Assets at
Fair
Value
 Other
Assets (8)
 Credit
Derivative
Asset
(Liability),
net (5)
 FG VIEs' Liabilities with Recourse,
at Fair
Value
 FG VIEs' Liabilities without Recourse,
at Fair
Value
 
(in millions) (in millions) 
Fair value as of December 31, 2013$36
 $136
 $290
 $268
 $2,565
 
$48
 $(1,693) 
$(1,790) $(1,081) 
Total pretax realized and unrealized gains/(losses) recorded in:(1)          


Fair value as of December 31, 2014$38
 $79
 $425
 $228
 $
 $1,398
 
$37
 $(895) 
$(1,277) $(142) 
Radian Asset Acquisition
 
 4
 
 
 122
 2
 (215) (114) (4) 
Total pretax realized and unrealized gains/(losses) recorded in: (1)            


Net income (loss)4
(2)(46)(2)21
(2)17
(2)164
(3)(11)(4)823
(6)94
(3)(43)(3)3
(2)3
(2)18
(2)1
(2)24
(2)59
(3)26
(4)728
(6)111
(3)(28)(3)
Other comprehensive income (loss)(1) (6) 24
 5


 (2) (11) (12) (9) 0
 
 
0


Purchases
 
 263


 48
 471
 52
(7)


Settlements(1) (5) (59) (62) (408) 
 (25) 
374
 
22
 (31)(7)
 (134) (34) (16) (400) 
 17
 
186
 
28
 
FG VIE consolidations
 
 (127) 
 206


(189) (42) 
 
 (1) 
 
 104


(131) 
 
FG VIE deconsolidations
 
 13
 
 (1,129) 
 
 234
 1,002


 (22) 
 
 
 22
 
Fair value as of December 31, 2014$38
 $79
 $425
 $228
 $1,398
 
$37
 $(895) 
$(1,277) $(142) 
Change in unrealized gains/(losses) related to financial instruments held as of December 31, 2014$(1) $(6) $21
 $4
 $141
 $(11) $254
 $(22) $3
 
Fair value as of December 31, 2015$8
 $71
 $348
 $657
 $60
 $1,261
 
$65
 $(365) 
$(1,225) $(124) 
Change in unrealized gains/(losses) related to financial instruments held as of December 31, 2015$0
 $(11) $(9) $(9) $0
 $110
 $26
 $281
 $4
 $(22) 
 ____________________
(1)Realized and unrealized gains (losses) from changes in values of Level 3 financial instruments represent gains (losses) from changes in values of those financial instruments only for the periods in which the instruments were classified as Level 3.

(2)Included in net realized investment gains (losses) and net investment income.

(3)Included in fair value gains (losses) on FG VIEs.

(4)Recorded in fair value gains (losses) on CCS, net realized investment gains (losses), net investment income and net investmentother income.

(5)Represents net position of credit derivatives. The consolidated balance sheet presents gross assets and liabilities based on net counterparty exposure.

(6)Reported in net change in fair value of credit derivatives.derivatives and other income.

(7)Primarily non-cash transaction.

(8)Includes CCS and other invested assets.


206


Level 3 Fair Value Disclosures
 
Quantitative Information About Level 3 Fair Value Inputs
At December 31, 20152016

Financial Instrument Description(1) Fair Value at December 31, 2016(in millions) Significant Unobservable Inputs Range Weighted Average as a Percentage of Current Par Outstanding
Assets (2):  
        
Fixed-maturity securities:  
        
Obligations of state and political subdivisions $39
 Yield 4.3%-22.8% 11.1%
           
Corporate securities 60
 Yield 20.1%  
           
RMBS 365
 CPR 1.6%-17.0% 4.6%
  CDR 1.5%-10.1% 6.7%
  Loss severity 30.0%-100.0% 77.8%
  Yield 3.3%-9.7% 6.0%
Asset-backed securities:          
Triple-X life insurance transactions 425
 Yield 5.7%-6.0% 5.8%
           
Collateralized debt obligations (CDO) 332
 Yield 10.0%  
           
CLO/TruPS 19
 Yield 1.5%-4.8% 3.1%
           
Others 29
 Yield 7.2%  
           
FG VIEs’ assets, at fair value 876
 CPR 3.5%-12.0% 7.8%
  CDR 2.5%-21.6% 5.7%
  Loss severity 35.0%-100.0% 78.6%
  Yield 2.9%-20.0% 6.5%
           
Other assets 62
 Implied Yield 4.5%-5.1% 4.8%
  Term (years) 10 years  
Liabilities:  
        
Credit derivative liabilities, net (389) Year 1 loss estimates 0.0%-38.0% 1.3%
  Hedge cost (in bps) 7.2
-118.1 24.5
  Bank profit (in bps) 3.8
-825.0 61.8
  Internal floor (in bps) 7.0
-100.0 13.9
  Internal credit rating AAA
-CCC AA+
           
FG VIEs’ liabilities, at fair value (958) CPR 3.5%-12.0% 7.8%
  CDR 2.5%-21.6% 5.7%
  Loss severity 35.0%-100.0% 78.6%
  Yield 2.4%-20.0% 5.0%
____________________
(1)Discounted cash flow is used as valuation technique for all financial instruments.
Financial Instrument Description(1) Fair Value at December 31, 2015(in millions) Significant Unobservable Inputs Range Weighted Average as a Percentage of Current Par Outstanding
Assets (2):  
        
Fixed-maturity securities (3):  
        
Corporate securities $71
 Yield 21.8%  
         
           
RMBS 348
 CPR 0.3%-9.0% 2.6%
  CDR 2.7%-9.3% 7.0%
  Loss severity 60.0%-100.0% 74.0%
  Yield 4.7%-8.2% 6.0%
Asset-backed securities:          
Investor owned utility 69
 Cash flow receipts 100.0%  
  Collateral recovery period 2.9 years  
  Discount factor 7.0%  
           
Triple-X life insurance transactions 329
 Yield 3.5%-7.5% 5.0%
       
           
Collateralized debt obligations ("CDO") 259
 Yield 20.0%  
           
Short-term investments 60
 Yield 17.0%  
           
FG VIEs’ assets, at fair value 1,261
 CPR 0.3%-9.2% 3.9%
  CDR 1.2%-16.0% 4.7%
  Loss severity 40.0%-100.0% 85.9%
  Yield 1.9%-20.0% 6.4%
           
Other assets 62
 Quotes from third party pricing $44-$46 $45
  Term (years) 5 years  

(2)Excludes several investments recorded in other invested assets with fair value of $8 million.


 Quantitative Information About Level 3 Fair Value Inputs
At December 31, 2015

207


Financial Instrument Description(1) Fair Value at
December 31, 2015
(in millions)
 Significant Unobservable Inputs Range Weighted Average as a Percentage of Current Par Outstanding Fair Value at December 31, 2015(in millions) Significant Unobservable Inputs Range Weighted Average as a Percentage of Current Par Outstanding
Assets (2):  
        
Fixed-maturity securities (3):  
     
Corporate securities $71
 Yield 21.8% 
   
     
RMBS 348
 CPR 0.3%-9.0% 2.6%
 CDR 2.7%-9.3% 7.0%
 Loss severity 60.0%-100.0% 74.0%
 Yield 4.7%-8.2% 6.0%
Asset-backed securities:     
Investor owned utility 69
 Cash flow receipts 100.0% 
 Collateral recovery period 2.9 years 
 Discount factor 7.0% 
     
Triple-X life insurance transactions 329
 Yield 3.5%-7.5% 5.0%
     
CDO 259
 Yield 20.0% 
     
Short-term investments 60
 Yield 17.0% 
     
FG VIEs’ assets, at fair value 1,261
 CPR 0.3%-9.2% 3.9%
 CDR 1.2%-16.0% 4.7%
 Loss severity 40.0%-100.0% 85.9%
 Yield 1.9%-20.0% 6.4%
     
Other assets 62
 Implied Yield 5.5%-6.4% 5.9%
  Term (years) 5 years 
Liabilities:  
       
     
Credit derivative liabilities, net (365) Year 1 loss estimates 0.0%-41.0% 0.6% (365) Year 1 loss estimates 0.0%-41.0% 0.6%
 Hedge cost (in bps) 32.8
-282.0 66.3  Hedge cost (in bps) 32.8
-282.0 66.3
 Bank profit (in bps) 3.8
-1,017.5 110.8  Bank profit (in bps) 3.8
-1,017.5 110.8
 Internal floor (in bps) 7.0
-100.0 16.8  Internal floor (in bps) 7.0
-100.0 16.8
 Internal credit rating AAA
-CCC AA+  Internal credit rating AAA
-CCC AA+
          
FG VIEs’ liabilities, at fair value (1,349) CPR 0.3%-9.2% 3.9% (1,349) CPR 0.3%-9.2% 3.9%
 CDR 1.2%-16.0% 4.7%  CDR 1.2%-16.0% 4.7%
 Loss severity 40.0%-100.0% 85.9%  Loss severity 40.0%-100.0% 85.9%
 Yield 1.9%-20.0% 5.6%  Yield 1.9%-20.0% 5.6%
____________________
(1)Discounted cash flow is used as valuation technique for all financial instruments.

(2)Excludes several investments recorded in other invested assets with fair value of $7 million.

(3)Excludes obligations of state and political subdivisions investments with fair value of $8 million.


208


Quantitative Information About Level 3 Fair Value Inputs
At December 31, 2014

Financial Instrument Description(1) Fair Value at December 31, 2014(in millions) Significant Unobservable Inputs Range Weighted Average as a Percentage of Current Par Outstanding
Assets:  
        
Fixed-maturity securities:  
        
Obligations of state and political subdivisions $38
 Rate of inflation 1.0%-3.0% 2.0%
  Cash flow receipts0.5%-74.3% 63.0%
  Discount rates4.6%-8.0% 7.3%
  Collateral recovery period1 month
-34 years 28 years
           
Corporate securities 79
 Yield 17.8%  
         
           
RMBS 425
 CPR 0.3%-8.1% 3.3%
  CDR 2.7%-10.6% 5.3%
  Loss severity 52.6%-100.0% 75.2%
  Yield 4.7%-11.7% 6.4%
Asset-backed securities:          
Investor owned utility 95
 Cash flow receipts 100.0%  
  Collateral recovery period 4 years  
  Discount factor 7.0%  
           
Triple-X life insurance transactions 133
 Yield 7.3%  
       
           
Other invested assets 7
 Discount for lack of liquidity 20.0%  
  Recovery on delinquent loans 40.0%  
  Default rates 0.0%-7.0% 5.8%
  Loss severity 40.0%-75.0% 68.3%
  Prepayment speeds 5.0%-15.0% 12.3%
           
FG VIEs’ assets, at fair value 1,398
 CPR 0.3%-11.0% 3.3%
  CDR 1.6%-11.8% 5.1%
  Loss severity 40.0%-100.0% 82.2%
  Yield 2.7%-17.7% 7.9%
           
Other assets 35
 Quotes from third party pricing $52-$61 $57
   Term (years) 5 years  


209


Financial Instrument Description(1) Fair Value at
December 31, 2014
(in millions)
 Significant Unobservable Inputs Range Weighted Average as a Percentage of Current Par Outstanding
Liabilities:  
        
Credit derivative liabilities, net (895) Year 1 loss estimates 0.0%-93.0% 2.1%
  Hedge cost (in bps) 20.0
-243.8 61.5
  Bank profit (in bps) 1.0
-994.4 127.0
  Internal floor (in bps) 7.0
-100.0 15.9
  Internal credit rating AAA
-CCC AA+
           
FG VIEs’ liabilities, at fair value (1,419) CPR 0.3%-11.0% 3.3%
  CDR 1.6%-11.8% 5.1%
  Loss severity 40.0%-100.0% 82.2%
  Yield 2.7%-17.7% 5.8%
____________________
(1)Discounted cash flow is used as valuation technique for all financial instruments.


The carrying amount and estimated fair value of the Company’s financial instruments are presented in the following table.
 
Fair Value of Financial Instruments
 
As of
December 31, 2015
 As of
December 31, 2014
As of
December 31, 2016
 As of
December 31, 2015
Carrying
Amount
 
Estimated
Fair Value
 
Carrying
Amount
 
Estimated
Fair Value
Carrying
Amount
 
Estimated
Fair Value
 
Carrying
Amount
 
Estimated
Fair Value
(in millions)(in millions)
Assets: 


Fixed-maturity securities$10,627
 $10,627
 $10,491
 $10,491
$10,233
 $10,233
 $10,627
 $10,627
Short-term investments396
 396
 767
 767
590
 590
 396
 396
Other invested assets(1)150
 152
 108
 110
146
 147
 150
 152
Credit derivative assets81
 81
 68
 68
13
 13
 81
 81
FG VIEs’ assets, at fair value1,261
 1,261
 1,398
 1,398
876
 876
 1,261
 1,261
Other assets206
 206
 184
 184
205
 205
 206
 206
Liabilities: 


Financial guaranty insurance contracts(2)3,998
 8,712
 3,823
 6,205
3,483
 8,738
 3,998
 8,712
Long-term debt1,300
 1,512
 1,297
 1,603
1,306
 1,546
 1,300
 1,512
Credit derivative liabilities446
 446
 963
 963
402
 402
 446
 446
FG VIEs’ liabilities with recourse, at fair value1,225
 1,225
 1,277
 1,277
807
 807
 1,225
 1,225
FG VIEs’ liabilities without recourse, at fair value124
 124
 142
 142
151
 151
 124
 124
Other liabilities9
 9
 27
 27
12
 12
 9
 9
____________________
(1)Includes investments not carried at fair value with a carrying value of $93 million.million and $93 million as of December 31, 2016 and December 31, 2015, respectively. Excludes investments carried under the equity method.

(2)Carrying amount includes the assets and liabilities related to financial guaranty insurance contract premiums, losses, and salvage and subrogation and other recoverables net of reinsurance.
 

210


8.Financial Guaranty Contracts Accounted for as Credit Derivatives
 
The Company has a portfolio of financial guaranty contracts that meet the definition of a derivative in accordance with GAAP (primarily CDS). The credit derivatives portfolio also includes interest rate swaps and hedges on other financial guarantors.

Accounting Policy

Credit derivatives are recorded at fair value. Changes in fair value are recorded in “net change in fair value of credit derivatives” on the consolidated statement of operations. Realized gains (losses) and other settlements on credit derivatives include credit derivative premiums received and receivable for credit protection the Company has sold under its insured CDS contracts, premiums paid and payable for credit protection the Company has purchased, claims paid and payable and received and receivable related to insured credit events under these contracts, ceding commission expense or income and realized gains or losses related to their early termination. Fair value of credit derivatives is reflected as either net assets or net liabilities determined on a contract by contract basis in the Company's consolidated balance sheets. See Note 7, Fair Value Measurement, for a discussion on the fair value methodology for credit derivatives.

Credit Derivative Net Par Outstanding by Sector
 
Credit derivative transactions are governed by ISDA documentation and have different characteristics from financial guaranty insurance contracts. For example, the Company’s control rights with respect to a reference obligation under a credit derivative may be more limited than when the Company issues a financial guaranty insurance contract. In addition, there are more circumstances under which the Company may be obligated to make payments. Similar to a financial guaranty insurance contract, the Company would be obligated to pay if the obligor failed to make a scheduled payment of principal or interest in

full. However, the Company may also be required to pay if the obligor becomes bankrupt or if the reference obligation were restructured if, after negotiation, those credit events are specified in the documentation for the credit derivative transactions. Furthermore, the Company may be required to make a payment due to an event that is unrelated to the performance of the obligation referenced in the credit derivative. If events of default or termination events specified in the credit derivative documentation were to occur, the non-defaulting or the non-affected party, which may be either the Company or the counterparty, depending upon the circumstances, may decide to terminate a credit derivative prior to maturity. In that case, the Company may be required to make a termination payment to its swap counterparty upon such termination. TheAbsent such an event of default or termination event, the Company may not unilaterally terminate a CDS contract; however, the Company on occasion has mutually agreed with various counterparties to terminate certain CDS transactions.
 

211


     The estimated remaining weighted average life of credit derivatives was 5.3 years at December 31, 2016 and 5.4 years at December 31, 2015 and 4.7 years at December 31, 2014.2015. The components of the Company’s credit derivative net par outstanding are presented below.
 
Credit Derivatives
Subordination and Ratings
 
 As of December 31, 2015 As of December 31, 2014 As of December 31, 2016 As of December 31, 2015
Asset Type 
Net Par
Outstanding
 
Original
Subordination(1)
 
Current
Subordination(1)
 
Weighted
Average
Credit
Rating
 
Net Par
Outstanding
 
Original
Subordination(1)
 
Current
Subordination(1)
 
Weighted
Average
Credit
Rating
 
Net Par
Outstanding
 
Weighted Average
Credit Rating
 
Net Par
Outstanding
 
Weighted Average
Credit Rating
 (dollars in millions) (dollars in millions)
Pooled corporate obligations:  


Collateralized loan obligations/collateralized bond obligations $5,873
 30.9% 42.3%  AAA $11,688
 32.0% 36.9% AAA
Collateralized loan obligations (CLO) /collateralized bond obligations $2,022
 AAA $5,873
  AAA
Synthetic investment grade pooled corporate 7,108
 21.7
 19.4
  AAA 7,640
 22.6
 20.6
 AAA 7,224
 AAA 7,108
  AAA
TruPS CDOs 3,429
 45.8
 42.6
  A- 3,119
 45.3
 35.8
 BBB- 1,179
 BBB+ 3,429
  A-
Market value CDOs of corporate obligations 1,113
 17.0
 30.1
  AAA 1,174
 19.1
 20.7
 AAA 
 -- 1,113
  AAA
Total pooled corporate obligations 17,523
 29.2
 32.3
 AAA 23,621
 30.1
 30.7
 AAA 10,425
 AAA 17,523
 AAA
U.S. RMBS:  


Option ARM and Alt-A first lien 351
 10.5
 12.7
  AA- 1,378
 16.3
 10.7
 BB+
Subprime first lien 981
 27.7
 45.2
  AA 1,366
 31.1
 50.5
 A
Prime first lien 177
 10.9
 0.0
  BB 223
 10.9
 0.0
 B
Closed-end second lien 17
 
 
  CCC 19
 
 
 CCC
Total U.S. RMBS 1,526
 24.1
 37.4
 A+ 2,986
 24.8
 33.9
 BBB
U.S. RMBS 1,142
 AA- 1,526
 A+
CMBS 530
 44.8
 52.6
  AAA 1,952
 35.3
 43.6
 AAA 
 -- 530
  AAA
Other 6,015
 
 
 A 6,437
 
 
 A 5,430
 A+ 6,015
 A
Total(2) $25,594
  
  
 AA+ $34,996
  
  
 AA+
Total(1) $16,997
 AA+ $25,594
 AA+
____________________
(1)Represents the sum of subordinate tranches and over-collateralization and does not include any benefit from excess interest collections that may be used to absorb losses.

(2)The December 31, 20152016 total amount includes $3.5$1.7 billion net par outstanding of credit derivatives acquired from Radian Asset.CIFG Acquisition.


Except for TruPS CDOs, the Company’s exposure to pooled corporate obligations is highly diversified in terms of obligors and industries. Most pooled corporate transactions are structured to limit exposure to any given obligor and industry. The majority of the Company’s pooled corporate exposure consists of CLO or synthetic pooled corporate obligations. Most of these CLOs have an average obligor size of less than 1% of the total transaction and typically restrict the maximum exposure to any one industry to approximately 10%. The Company’s exposure also benefits from embedded credit enhancement in the transactions which allows a transaction to sustain a certain level of losses in the underlying collateral, further insulating the Company from industry specific concentrations of credit risk on these deals.
 
The Company’s TruPS CDO asset pools are generally less diversified by obligors and industries than the typical CLO asset pool. Also, the underlying collateral in TruPS CDOs consists primarily of subordinated debt instruments such as TruPS issued by bank holding companies and similar instruments issued by insurance companies, real estate investment trusts and other real estate related issuers while CLOs typically contain primarily senior secured obligations. However, to mitigate these risks TruPS CDOs were typically structured with higher levels of embedded credit enhancement than typical CLOs.
 

212


The Company’s exposure to “Other” CDS contracts is also highly diversified. It includes $1.9$1.5 billion of exposure to one pooled infrastructure transaction comprising diversified pools of international infrastructure project transactions and loans to regulated utilities. These pools were all structured with underlying credit enhancement sufficient for the Company to attach at AAA levels at origination. The remaining $4.1$3.9 billion of exposure in “Other” CDS contracts comprises numerous deals across various asset classes, such as commercial receivables, international RMBS, infrastructure, regulated utilities and consumer receivables.

Distribution of Credit Derivative Net Par Outstanding by Internal Rating
 
 As of December 31, 2015 As of December 31, 2014 As of December 31, 2016 As of December 31, 2015
Ratings 
Net Par
Outstanding
 % of Total 
Net Par
Outstanding
 % of Total 
Net Par
Outstanding
 % of Total 
Net Par
Outstanding
 % of Total
 (dollars in millions) (dollars in millions)
AAA $14,808
 57.9% $21,817
 62.3% $10,967
 64.6% $14,808
 57.9%
AA 4,821
 18.8
 5,398
 15.4
 2,167
 12.7
 4,821
 18.8
A 2,144
 8.4
 1,982
 5.7
 1,499
 8.8
 2,144
 8.4
BBB 2,212
 8.6
 2,774
 8.0
 1,391
 8.2
 2,212
 8.6
BIG(1) 1,609
 6.3
 3,025
 8.6
 973
 5.7
 1,609
 6.3
Credit derivative net par outstanding $25,594
 100.0% $34,996
 100.0% $16,997
 100.0% $25,594
 100.0%
____________________
(1)The December 31, 2015 BIG amount includes $125 million net par outstanding of credit derivatives acquired from Radian Asset.
 
Fair Value of Credit Derivatives
 
Net Change in Fair Value of Credit Derivatives Gain (Loss)
 
Year Ended December 31,Year Ended December 31,
2015 2014 20132016 2015 2014
(in millions)(in millions)
Realized gains on credit derivatives$63
 $73
 $121
$56
 $63
 $73
Net credit derivative losses (paid and payable) recovered and recoverable and other settlements(81) (50) (163)(27) (81) (50)
Realized gains (losses) and other settlements on credit derivatives(18) 23
 (42)
Net change in unrealized gains (losses) on credit derivatives:     
Realized gains (losses) and other settlements29
 (18) 23
Net unrealized gains (losses):     
Pooled corporate obligations147
 (18) (32)(16) 147
 (18)
U.S. RMBS396
 814
 (69)22
 396
 814
CMBS42
 2
 
0
 42
 2
Other161
 2
 208
63
 161
 2
Net change in unrealized gains (losses) on credit derivatives746
 800
 107
Net unrealized gains (losses)69
 746
 800
Net change in fair value of credit derivatives$728
 $823
 $65
$98
 $728
 $823

Net Par
Terminations and Realized Gain and LossesSettlements
from Terminations of Direct Credit Derivative Contracts

Year Ended December 31,Year Ended December 31,
2015 2014 20132016 2015 2014
(in millions)(in millions)
Net par of terminated credit derivative contracts$2,777
 $3,591
 $4,054
$3,811
 $2,777
 $3,591
Realized gains on credit derivatives13
 1
 21
20
 13
 1
Net credit derivative losses (paid and payable) recovered and recoverable and other settlements116
 26
 

 (116) (26)
Net unrealized gains (losses) on credit derivatives103
 465
 546


213

TableDuring 2016, unrealized fair value gains were generated primarily as a result of ContentsCDS terminations in the U.S. RMBS and other sectors, run-off of CDS par and price improvements on the underlying collateral of the Company’s CDS. The majority of the CDS transactions were terminated as a result of settlement agreements with several CDS counterparties. The unrealized fair value gains were partially offset by unrealized losses resulting from wider implied net spreads across all sectors. The wider implied net spreads were primarily a result of the decreased cost to buy protection in AGC’s and AGM’s name, as the market cost of AGC’s and AGM’s credit protection decreased significantly during the period. These transactions were pricing at or above their floor levels (or the minimum rate at which the Company would consider assuming these risks based on historical experience); therefore when the cost of purchasing CDS protection on AGC and AGM, which management refers to as the CDS spread on AGC and AGM, decreased the implied spreads that the Company would expect to receive on these transactions increased.


During 2015, unrealized fair value gains were generated primarily as a result of CDS terminations. The Company reached a settlement agreement with one CDS counterparty to terminate five Alt-A first lien CDS transactions resulting in unrealized fair value gains of $213 million and was the primary driver of the unrealized fair value gains in the U.S. RMBS sector. The Company also terminated a CMBS transaction, a Triple-X life insurance securitization transaction, and a distressed middle market CLO securitization during the period and recognized unrealized fair value gains of $41 million, $99 million and $99 million, respectively. These were the primary drivers of the unrealized fair value gains in the CMBS, Other, and pooled corporate CLO sectors, respectively, during the period. The remainder of the fair value gains for the period were a result of tighter implied net spreads across all sectors. The tighter implied net spreads were primarily a result of the increased cost to buy protection in AGC’s and AGM’s name, particularly for the one year CDS spread. These transactions were pricing at or above their floor levels, therefore when the cost of purchasing CDS protection on AGC and AGM increased, the implied spreads that the Company would expect to receive on these transactions decreased. Finally, during 2015, there was a refinement in methodology to address an instance in a U.S. RMBS transaction where the Company now expects recoveries. This refinement resulted in approximately $49 million in fair value gains in 2015.

During 2014, unrealized fair value gains were generated primarily in the U.S. RMBS prime first lien, Option ARM and subprime sectors. This is primarily due to a significant unrealized fair value gain in the Option ARM and Alt-A first lien sector of approximately $543 million, as a result of the terminations of three large Alt-A first lien resecuritization transactions and one Option ARM first lien transaction during the period. In addition, there was an unrealized gain of approximately $346 million related to the change in index used to determine fair value during the fourth quarter of 2014. In the fourth quarter of 2014, new market indices were published on Option ARM and Alt-A first lien securitizations. As part of the Company’s normal review process the Company reviewed these indices and based upon the collateral make-up, collateral vintage, and collateral loss experience, determined it to be a better market indication for the Company’s Option ARM and Alt-A first lien securitizations. The unrealized fair value gains were partially offset by unrealized fair value losses generated by wider implied net spreads. The wider implied net spreads were primarily a result of the decreased cost to buy protection in AGC’s and AGM’s name, as the market cost of AGC's and AGM’s credit protection decreased during the period. These transactions were pricing at or above their floor levels (or the minimum rate at which the Company would consider assuming these risks based on historical experience); therefore when the cost of purchasing CDS protection on AGC and AGM decreased, the implied spreads that the Company would expect to receive on these transactions increased.

During 2013, unrealized fair value gains were generated in the “other” sector primarily as a result of the termination of a film securitization transaction and a U.K. infrastructure transaction, as well as price improvement on a Triple-X life insurance transaction. These unrealized gains were partially offset by unrealized fair value losses in the prime first lien, Alt-A, Option ARM and subprime RMBS sectors due to wider implied net spreads. The wider implied net spreads were primarily a result of the decreased cost to buy protection in AGC’s name as the market cost of AGC’s credit protection decreased. These transactions were pricing above their floor levels; therefore when the cost of purchasing CDS protection on AGC decreased, the implied spreads that the Company would expect to receive on these transactions increased. The cost of AGM’s credit protection also decreased slightly during 2013, but did not lead to significant fair value losses, as the majority of AGM policies continue to price at floor levels. The company terminated a film securitization CDS for a payment of $120 million which was recorded in realized gains (losses) and other settlements on credit derivatives, with a corresponding release of the unrealized loss recorded in unrealized gains (losses) on credit derivatives of $127 million for a net change in fair value of credit derivatives of $7 million.
The impact of changes in credit spreads will vary based upon the volume, tenor, interest rates, and other market conditions at the time these fair values are determined. In addition, since each transaction has unique collateral and structural terms, the underlying change in fair value of each transaction may vary considerably. The fair value of credit derivative contracts also reflects the change in the Company’s own credit cost based on the price to purchase credit protection on AGC and AGM. The Company determines its own credit risk based on quoted CDS prices traded on the Company at each balance sheet date.
 

214


CDS Spread on AGC and AGM
Quoted price of CDS contract (in basis points)
 
As of
December 31, 2015
 As of
December 31, 2014
 As of
December 31, 2013
As of
December 31, 2016
 As of
December 31, 2015
 As of
December 31, 2014
Five-year CDS spread:          
AGC376
 323
 460
158
 376
 323
AGM366
 325
 525
158
 366
 325
          
One-year CDS spread     
One-year CDS spread:     
AGC139
 80
 185
35
 139
 80
AGM131
 85
 220
29
 131
 85
 

Fair Value of Credit Derivatives Assets (Liabilities)
and Effect of AGC and AGM
Credit Spreads
 
As of
December 31, 2015
 As of
December 31, 2014
As of
December 31, 2016
 As of
December 31, 2015
(in millions)(in millions)
Fair value of credit derivatives before effect of AGC and AGM credit spreads$(1,448) $(2,029)$(811) $(1,448)
Plus: Effect of AGC and AGM credit spreads1,083
 1,134
422
 1,083
Net fair value of credit derivatives (1)$(365) $(895)$(389) $(365)
____________________
(1)December 31, 2015 amount includes $44 million of net fair value loss of credit derivatives acquired from Radian Asset.

The fair value of CDS contracts at December 31, 2015,2016, before considering the implications of AGC’s and AGM’s credit spreads, is a direct result of continued wide credit spreads in the fixed income security markets and ratings downgrades. The asset classes that remain most affected are 2005-2007 vintages of prime first lien, Alt-A, Option ARM, subprime RMBS deals as well as TruPS and pooled corporate securities. Comparing securities as well as 2005-2007 vintages of Alt-A, Option ARM and subprime RMBS deals. The mark to market benefit between December 31, 2016, and December 31, 2015, with December 31, 2014, there was resulted primarily from several CDS terminations and a narrowing of credit spreads primarily related to the Company's pooled corporate obligations as well as several large CDS terminations which resulted in a mark to market benefit. This benefit was partially offset by the Company's acquisition of Radian Asset's CDS portfolio which increased the Company's mark to market liability. This narrowing of spreads combined with the acquisition of Radian Asset,TruPS and the CDS terminations resulted in a gain of approximately $581 million, before taking into account AGC’s or AGM’s credit spreads.U.S. RMBS obligations.

Management believes that the trading level of AGC’s and AGM’s credit spreads over the past several years has been due to the correlation between AGC’s and AGM’s risk profile and the current risk profile of the broader financial markets, and to increased demand for credit protection against AGC and AGM as the result of its financial guaranty volume, as well as the overall lack of liquidity in the CDS market. Offsetting the benefit attributable to AGC’s and AGM’s credit spread were higher credit spreads in the fixed income security markets. The higher credit spreads in the fixed income security market are due to the lack of liquidity in the high yield CDO, TruPS CDO, and CLO markets as well as continuing market concerns over the 2005-2007 vintages of RMBS.
 

215

Table of Contents

The following table presents the fair value and the present value of expected claim payments or recoveries (i.e., net expected loss to be paid as described in Note 5) for contracts accounted for as derivatives.
 
Net Fair Value and Expected Losses
of Credit Derivatives by Sector

  
Fair Value of Credit Derivative
Asset (Liability), net
 
Expected Loss to be (Paid)
Recovered (1)
Asset Type As of
December 31, 2015
 As of
December 31, 2014
 As of
December 31, 2015
 As of
December 31, 2014
  (in millions)
Pooled corporate obligations $(82) $(49) $(5) $(23)
U.S. RMBS (98) (494) (38) (73)
CMBS 0
 0
 
 
Other (185) (352) 27
 38
Total $(365) $(895) $(16) $(58)
 As of
December 31, 2016
 As of
December 31, 2015
 (in millions)
Fair value of credit derivative asset (liability), net$(389) $(365)
Expected loss to be (paid) recovered(10) (16)
 ____________________
(1)
Includes R&W benefit of $0.4 million as of December 31, 2015 and $86 million as of December 31, 2014.


Ratings Sensitivities of Credit Derivative Contracts
 
Within the Company’s insured CDS portfolio, the transaction documentation for approximately $3.8$0.7 billion in CDS gross par insured as of December 31, 20152016 requires AGC to post eligible collateral to secure its obligations to make payments under such contracts. This constitutes a reduction of approximately $3.1 billion from the $3.8 billion subject to such a requirement as of December 31, 2015, primarily due to an agreement reached in May 2016 with a CDS counterparty reducing the collateral posting requirement with respect to that counterparty to zero. Eligible collateral is generally cash or U.S. government or agency securities; eligible collateral other than cash is valued at a discount to the face amount.

For approximately $3.6 billion$516 million gross par of such contracts, AGC has negotiated caps such that the posting requirement cannot exceed a certain fixed amount, regardless of the mark-to-market valuation of the exposure or the financial strength ratings of AGC. For such contracts, AGC need not post on a cash basis an aggregate of more than $575$500 million, although the value of the collateral posted may exceed such fixed amount depending on the advance rate agreed with the counterparty for the particular type of collateral posted.

For the remaining approximately $221$174 million gross par of such contracts, AGC could be required from time to time to post additional collateral without such cap based on movements in the mark-to-market valuation of the underlying exposure. 

As of December 31, 2016, the Company was posting approximately $116 million to secure its obligations under CDS, of which approximately $16 million related to the $174 million of gross par described above, as to which the obligation to collateralize is not capped. As of December 31, 2015, the Company was posting approximately $305 million to secure its obligations under CDS, of which approximately $23 million related to the $221 million of notional described above, as to which the obligation to collateralize is not capped. In contrast, as of December 31, 2014, the Company was posting approximately $376 million to secure its obligations under CDS, of which approximately $25 million related to $242 million of notionalgross par as to which the obligation to collateralize was not capped. The obligationIn February 2017, the Company terminated all of its remaining CDS contracts with one of its counterparties as to postwhich it had a posting requirement (subject to a cap); the CDS contracts related to approximately $183 million gross par and $73 million of collateral could impairposted, as December 31, 2016; and all the Company's liquidity and results of operations.collateral is being returned to the Company.


216

Table of Contents

Sensitivity to Changes in Credit Spread
 
The following table summarizes the estimated change in fair values on the net balance of the Company’s credit derivative positions assuming immediate parallel shifts in credit spreads on AGC and AGM and on the risks that they both assume.
 
Effect of Changes in Credit Spread
As of December 31, 20152016

Credit Spreads(1) 
Estimated Net
Fair Value
(Pre-Tax)
 
Estimated Change
in Gain/(Loss)
(Pre-Tax)
 
Estimated Net
Fair Value
(Pre-Tax)
 
Estimated Change
in Gain/(Loss)
(Pre-Tax)
 (in millions) (in millions)
100% widening in spreads $(742) $(377) $(791) $(402)
50% widening in spreads (554) (189) (590) (201)
25% widening in spreads (460) (95) (490) (101)
10% widening in spreads (403) (38) (430) (41)
Base Scenario (365) 
 (389) 
10% narrowing in spreads (330) 35
 (351) 38
25% narrowing in spreads (277) 88
 (295) 94
50% narrowing in spreads (190) 175
 (203) 186
 ____________________
(1)Includes the effects of spreads on both the underlying asset classes and the Company’s own credit spread.


9.Consolidated Variable Interest Entities
 
Background    

The Company provides financial guaranties with respect to debt obligations of special purpose entities, including VIEs. Assured Guaranty does not act as the servicer or collateral manager for any VIE obligations insured by its companies. The transaction structure generally provides certain financial protections to the Company. This financial protection can take several forms, the most common of which are overcollateralization, first loss protection (or subordination) and excess spread. In the case of overcollateralization (i.e., the principal amount of the securitized assets exceeds the principal amount of the structured finance obligations guaranteed by the Company), the structure allows defaults of the securitized assets before a default is experienced on the structured finance obligation guaranteed by the Company. In the case of first loss, the financial guaranty insurance policy only covers a senior layer of losses experienced by multiple obligations issued by special purpose entities, including VIEs. The first loss exposure with respect to the assets is either retained by the seller or sold off in the form of equity or mezzanine debt to other investors. In the case of excess spread, the financial assets contributed to special purpose entities, including VIEs, generate interest income that are in excess of the interest payments on the debt issued by the special purpose entity. Such excess spread is typically distributed through the transaction’s cash flow waterfall and may be used to create additional credit enhancement, applied to redeem debt issued by the special purpose entities, including VIEs (thereby, creating additional overcollateralization), or distributed to equity or other investors in the transaction.

Assured Guaranty is not primarily liable for the debt obligations issued by the VIEs it insures and would only be required to make payments on those insured debt obligations in the event that the issuer of such debt obligations defaults on any principal or interest due and only for the amount of the shortfall. AGL’s and its Subsidiaries’ creditors do not have any rights with regard to the collateral supporting the debt issued by the FG VIEs. Proceeds from sales, maturities, prepayments and interest from such underlying collateral may only be used to pay Debt Servicedebt service on VIE liabilities. Net fair value gains and losses on FG VIEs are expected to reverse to zero at maturity of the VIE debt, except for net premiums received and net claims paid by Assured Guaranty under the financial guaranty insurance contract. The Company’s estimate of expected loss to be paid for FG VIEs is included in Note 5, Expected Loss to be Paid.
 
Accounting Policy

The Company evaluates whether it is the primary beneficiary of its VIEs. If the Company concludes that it is the primary beneficiary, it is required to consolidate the entire VIE in the Company's financial statements and eliminate the effects of the financial guaranty insurance contracts issued by AGM and AGC on the consolidated FG VIEs debt obligations.

217

Table of Contents


The primary beneficiary of a VIE is the enterprise that has both 1) the power to direct the activities of a VIE that most significantly impact the entity's economic performance; and 2) the obligation to absorb losses of the entity that could potentially be significant to the VIE or the right to receive benefits from the entity that could potentially be significant to the VIE.

As part of the terms of its financial guaranty contracts, the Company obtains certain protective rights with respect to the VIE that are triggered by the occurrence of certain events, such as failure to be in compliance with a covenant due to poor deal performance or a deterioration in a servicer or collateral manager's financial condition. At deal inception, the Company typically is not deemed to control a VIE; however, once a trigger event occurs, the Company's control of the VIE typically increases. The Company continuously evaluates its power to direct the activities that most significantly impact the economic performance of VIEs that have debt obligations insured by the Company and, accordingly, where the Company is obligated to absorb VIE losses or receive benefits that could potentially be significant to the VIE. The Company obtains protective rights under its insurance contracts that give the Company additional controls over a VIE if there is either deterioration of deal performance or in the financial health of the deal servicer. The Company is deemed to be the control party for certain VIEs under GAAP, typically when its protective rights give it the power to both terminate and replace the deal servicer, which are characteristics specific to the Company's financial guaranty contracts. If the protective rights that could make the Company the control party have not been triggered, then the VIE is not consolidated. If the Company is deemed no longer to have those protective rights, the transaction is deconsolidated.

The FG VIEs' liabilities that are insured by the Company are considered to be with recourse, because the Company guarantees the payment of principal and interest regardless of the performance of the related FG VIEs' assets. FG VIEs' liabilities that are not insured by the Company are considered to be without recourse, because the payment of principal and interest of these liabilities is wholly dependent on the performance of the FG VIEs' assets.


The Company has limited contractual rights to obtain the financial records of its consolidated FG VIEs. The FG VIEs do not prepare separate GAAP financial statements; therefore, the Company compiles GAAP financial information for them based on trustee reports prepared by and received from third parties. Such trustee reports are not available to the Company until approximately 30 days after the end of any given period. The time required to perform adequate reconciliations and analyses of the information in these trustee reports results in a one quarter lag in reporting the FG VIEs' activities. The Company records the fair value of FG VIE assets and liabilities based on modeled prices. The Company updates the model assumptions each reporting period for the most recent available information, which incorporates the impact of material events that may have occurred since the quarter lag date. The net change in the fair value of consolidated FG VIE assets and liabilities is recorded in "fair value gains (losses) on FG VIEs" in the consolidated statements of operations. Interest income and interest expense are derived from the trustee reports and also included in “fair value gains (losses) on FG VIEs.” The Company has elected the fair value option for assets and liabilities classified as FG VIEs' assets and liabilities because the carrying amount transition method was not practical.

The cash flows generated by the FG VIE assets, including R&W recoveries, are classified as cash flows from investing activities. Paydowns of FG liabilities are supported by the cash flows generated by FG VIE assets, and for liabilities with recourse, possibly claim payments made by AGM or AGC under its financial guaranty insurance contracts. Paydowns of FG liabilities both with and without recourse are classified as cash flows used in financing activities by the Company. Interest income, interest expense and other expenses of the FG VIE assets and liabilities are classified as operating cash flows. Claim payments made by AGC and AGM under the financial guaranty contracts issued to the FG VIEs are eliminated upon consolidation and therefore such claim payments are treated as paydowns of FG VIE liabilities as a financing activity as opposed to an operating activity of AGM and AGC.


218

Table of Contents

Consolidated FG VIEs 

Number of FG VIEs Consolidated

Year Ended December 31,Year Ended December 31,
2015 2014 20132016 2015 2014
  
Beginning of the period, December 3132
 40
 33
34
 32
 40
Radian Asset Acquisition4


 4
 
Consolidated(1)1
 2
 11
1
 1
 2
Deconsolidated(1)(1) (8) (3)(2) (1) (8)
Matured(2) (2) (1)(1) (2) (2)
End of the period, December 3134
 32
 40
32
 34
 32
____________________
(1)
Net loss on consolidation and deconsolidation was de minimis in 2016. Net loss on consolidation was $26 million in 2015. Net gain on deconsolidation was $120 million and net loss on consolidation was $26 million in 2014. Net loss on consolidation and deconsolidation was $726 million in 2013.2014.
    
The total unpaid principal balance for the FG VIEs’ assets that were over 90 days or more past due was approximately $137 million at December 31, 2016 and $154 million at December 31, 2015 and $1832015. The aggregate unpaid principal of the FG VIEs’ assets was approximately $432 million greater than the aggregate fair value at December 31, 2014.2016. The aggregate unpaid principal of the FG VIEs’ assets was approximately $804 million greater than the aggregate fair value at December 31, 2015, excluding the effect of R&W settlements. The aggregate unpaid principalchange in the instrument-specific credit risk of the FG VIEs’ assets was approximately $941 million greater than the aggregate fair value atheld as of December 31, 2014, excluding2016 that was recorded in the effectconsolidated statements of R&W settlements and restricted cash.operations for 2016 were gains of $55 million. The change in the instrument-specific credit risk of the FG VIEs’ assets held as of December 31, 2015 that was recorded in the consolidated statements of operations for 2015 were gains of $90 million. The change in the instrument-specific credit risk of the FG VIEs’ assets held as of December 31, 2014 that was recorded in the consolidated statements of operations for 2014 were gains of $116 million. The change in the instrument-specific credit risk of the FG VIEs’ assets for 2013 were gains of $340 million. To calculate the instrument specific credit risk, the changes in the fair value of the FG VIE assets are allocated between those changes that are due to the instrument specific credit risk and those arechanges due to other factors, including interest rates. The instrument specific credit risk amount is determined by using expected contractual cash flows versus current expected cash flows discounted at original contractual rate. The net present value is calculated by discounting the expected cash flows of the underlying security, excluding the Company’s financial guaranty insurance, at the relevant effective interest rate.
 
The unpaid principal for FG VIE liabilities with recourse, which represent obligations insured by AGC or AGM, was $1,436$871 million and $1,912$1,436 million as of December 31, 20152016 and December 31, 2014,2015, respectively. FG VIE liabilities with recourse will mature at various dates ranging from 2025 to 2046.2038. The aggregate unpaid principal balance of the FG VIE

liabilities with and without recourse was approximately $109 million greater than the aggregate fair value of the FG VIEs’ liabilities as of December 31, 2016. The aggregate unpaid principal balance was approximately $423 million greater than the aggregate fair value of the FG VIEs’ liabilities as of December 31, 2015. The aggregate unpaid principal balance was approximately $916 million greater than the aggregate fair value of the FG VIEs’ liabilities as of December 31, 2014.
 

219

Table of Contents

The table below shows the carrying value of the consolidated FG VIEs’ assets and liabilities in the consolidated financial statements, segregated by the types of assets that collateralize their respective debt obligations for FG VIE liabilities with recourse.

Consolidated FG VIEs
By Type of Collateral 

As of December 31, 2015 (1) As of December 31, 2014As of December 31, 2016 As of December 31, 2015
Assets Liabilities Assets LiabilitiesAssets Liabilities Assets Liabilities
(in millions)(in millions)
With recourse: 


U.S. RMBS first lien$506
 $521
 $632
 $581
$473
 $509
 $506
 $521
U.S. RMBS second lien194
 273
 238
 327
178
 223
 194
 273
Other431
 431
 369
 369
Life insurance
 
 347
 347
Manufactured housing74
 75
 84
 84
Total with recourse1,131
 1,225
 1,239
 1,277
725
 807
 1,131
 1,225
Without recourse130
 124
 163
 142
151
 151
 130
 124
Total$1,261
 $1,349
 $1,402
 $1,419
$876
 $958
 $1,261
 $1,349
____________________
(1)The December 31, 2015 amounts include $111 million of FG VIE assets and $107 million of FG VIE liabilities acquired from Radian Asset.
     
The consolidation of FG VIEs has a significant effect onaffects net income and shareholders' equity due to (1)(i) changes in fair value gains (losses) on FG VIE assets and liabilities, (2)(ii) the elimination of premiums and losses related to the AGC and AGM FG VIE liabilities with recourse and (3)(iii) the elimination of investment balances related to the Company’s purchase of AGC and AGM insured FG VIE debt. Upon consolidation of a FG VIE, the related insurance and, if applicable, the related investment balances, are considered intercompany transactions and therefore eliminated. Such eliminations are included in the table below to present the full effect of consolidating FG VIEs.


Effect of Consolidating FG VIEs on Net Income,
Cash Flows From Operating Activities and Shareholders’ Equity
 
Year Ended December 31,Year Ended December 31,
2015 2014 20132016 2015 2014
(in millions)(in millions)
Net earned premiums$(21) $(32) $(60)$(16) $(21) $(32)
Net investment income(32) (11) (13)(10) (32) (11)
Net realized investment gains (losses)10
 (5) 2
1
 10
 (5)
Fair value gains (losses) on FG VIEs38
 255
 346
38
 38
 255
Bargain purchase gain
 2
 
Loss and LAE28
 30
 21
7
 28
 30
Bargain purchase gain2


Other income (loss)0
 (2) 
0
 0
 (2)
Effect on net income before tax25
 235
 296
Effect on income before tax20
 25
 235
Less: tax provision (benefit)8
 82
 103
7
 8
 82
Effect on net income (loss)$17
 $153
 $193
$13
 $17
 $153
          
Effect on cash flows from operating activities$43
 $68
 $(136)$24
 $43
 $68
 
 As of
December 31, 2015
 As of
December 31, 2014
 (in millions)
Effect on shareholders’ equity (decrease) increase$(23) $(44)
 As of
December 31, 2016
 As of
December 31, 2015
 (in millions)
Effect on shareholders’ equity (decrease) increase$(9) $(23)


220

TableFair value gains (losses) on FG VIEs represent the net change in fair value on the consolidated FG VIEs’ assets and liabilities. In 2016, the Company recorded a pre-tax net fair value gain on consolidated FG VIEs of Contents$38 million. The primary driver of the 2016 gain in fair value of FG VIE assets and liabilities was net mark-to-market gains due to price appreciation resulting from improvements in the underlying collateral of HELOC RMBS assets of the FG VIEs.


In 2015, the Company recorded a pre-tax net fair value gain on consolidated FG VIEs of $38 million which was primarily driven by price appreciation on the Company's FG VIE assets during the year that resulted from improvements in the underlying collateral, as well as large principal paydowns made on the Company's FG VIEs.

In 2014, the Company recorded a pre-tax net fair value gain on consolidated FG VIEs of $255 million. The primary driver of this gain, $120 million, was a result of the deconsolidation of seven VIEs. There was an additional gain of $37 million resulting from the Company exercising its option to accelerate two second lien RMBS VIEs. These two VIEs were treated as maturities during the period. The remainder of the gain for the period was driven by the price appreciation on the Company's FG VIE assets during the year resulting from improvements in the underlying collateral, as well as large principal paydowns made on the Company's FG VIEs.

In 2013, the Company recorded a pre-tax net fair value gain of consolidated FG VIEs of $346 million. The gain was primarily driven by R&W benefits received on several VIE assets as a result of settlements with various counterparties throughout the year. These R&W settlements resulted in a gain of approximately $265 million. The remainder of the gain was driven by price appreciation on the Company's FG VIE assets during the year resulting from improvements in the underlying collateral, as well as large principal paydowns made on the Company's FG VIEs.

Other Consolidated VIEs

In certain instances where the Company consolidates a VIE that was established as part of a loss mitigation negotiationnegotiated settlement agreement that results in the termination of the original insured financial guaranty insurance or credit derivative contract the Company classifies the assets and liabilities of those VIEs in the line items that most accurately reflect the nature of the items, as opposed to within the FG VIE assets and FG VIE liabilities.

Non-Consolidated VIEs
 
As of December 31, 20152016 and December 31, 2014,2015, the Company had financial guaranty contracts outstanding for approximately 750600 and 930750 VIEs, respectively, that it did not consolidate. To date, the Company’s analyses have indicated that it does not have a controlling financial interest inindicated that it is not the primary beneficiary of any other VIEs and, as a result, they are not consolidated in the consolidated financial statements.consolidated. The Company’s exposure provided through its financial guaranties with respect to debt obligations of special purpose entities is included within net par outstanding in Note 4, Outstanding Exposure.
 

10.Investments and Cash
 
Accounting Policy

The vast majority of the Company's investment portfolio is composed of fixed-maturity and short-term investments, classified as available-for-sale at the time of purchase (approximately 98.5% based on fair value as of December 31, 20152016), and therefore carried at fair value. Changes in fair value for other-than-temporarily-impaired ("OTTI")(OTTI) securities are bifurcated between credit losses and non-credit changes in fair value. The credit loss on OTTI securities is recorded in the statement of operations and the non-credit component of the change in fair value of securities, whether OTTI or not, is recorded in OCI. For securities in an unrealized loss position where the Company has the intent to sell or it is more-likely-than-not that it will be required to sell the security before recovery, declines inthe entire impairment loss (i.e., the difference between the security's fair value areand its amortized cost) is recorded in the consolidated statements of operations.

Credit losses reduce the amortized cost of impaired securities. The amortized cost basis is adjusted for accretion and amortization (using the effective interest method) with a corresponding entry recorded in net investment income.

Realized gains and losses on sales of investments are determined using the specific identification method. Realized loss includes amounts recorded for other-than-temporary impairments on debt securities and the declines in fair value of securities for which the Company has the intent to sell the security or inability to hold until recovery of amortized cost.

For mortgage‑backed securities, and any other holdings for which there is prepayment risk, prepayment assumptions are evaluated and revised as necessary. Any necessary adjustments due to changes in effective yields and maturities are recognized in net investment income.income using the retrospective method.

Loss mitigation securities are generally purchased at a discount and are accounted for based on their underlying investment type, and excludeexcluding the effects of the Company’s insurance. Interest income on loss mitigation securities is recognized on a level yield basis over the remaining life of the securitysecurity.


221


Short-term investments, which are those investments with a maturity of less than one year at time of purchase, are carried at fair value and include amounts deposited in money market funds.

Other invested assets primarily include:

include guaranteed investment contracts, which are carried at amortized cost plus accrued interest

and preferred stocks, which are carried at fair value with changes in unrealized gains and losses recorded in OCI,

a 50% equity investment acquired in a restructuring of an insured CDS carried at its proportionate share of the underlying entity's U.S. GAAP equity value.
OCI.

Cash consists of cash on hand and demand deposits. As a result of the lag in reporting FG VIEs, cash and short-term investments do not reflect cash outflow to the holders of the debt issued by the FG VIEs for claim payments made by the Company's insurance subsidiaries to the consolidated FG VIEs until the subsequent reporting period.

Assessment for Other-Than Temporary Impairments

The amount of other-than-temporary-impairment recognized in earnings depends on whether (1) an entity intends to sell the security or (2) it is more-likely-than-not that the entity will be required to sell the security before recovery of its amortized cost basis.

If an entity does not intend to sell the security and it is not more-likely-than-not that the Company will be required to sell the security before recovery of its amortized cost basis, the other-than-temporary-impairment is separated into (1) the amount representing the credit loss and (2) the amount related to all other factors.

The Company has a formal review process to determine other-than-temporary-impairment for securities in its investment portfolio where there is no intent to sell and it is not more-likely-than-not that it will be required to sell the security before recovery. Factors considered when assessing impairment include:

a decline in the market value of a security by 20% or more below amortized cost for a continuous period of at least six months;

a decline in the market value of a security for a continuous period of 12 months;

recent credit downgrades of the applicable security or the issuer by rating agencies;

the financial condition of the applicable issuer;

whether loss of investment principal is anticipated;

the impact of foreign exchange rates; and

whether scheduled interest payments are past due.

The Company assesses the ability to recover the amortized cost by comparing the net present value of projected future cash flows with the amortized cost of the security. If the security is in an unrealized loss position and its net present value is less than the amortized cost of the investment, an other-than-temporary impairment is recorded. . The net present value is calculated by discounting the Company's estimate of projected future cash flows at the effective interest rate implicit in the debt security at the time of purchase. The Company's estimates of projected future cash flows are driven by assumptions regarding probability of default and estimates regarding timing and amount of recoveries associated with a default. The Company develops these estimates using information based on historical experience, credit analysis and market observable data, such as industry analyst reports and forecasts, sector credit ratings and other relevant data. For mortgage‑backed and asset backed securities, cash flow estimates also include prepayment and other assumptions regarding the underlying collateral including default rates, recoveries and changes in value. The assumptions used in these projections requires the use of significant management judgment.


222


The Company's assessment of a decline in value included management's current assessment of the factors noted above. The Company also seeks advice from its outside investment managers. If that assessment changes in the future, the Company may ultimately record a loss after having originally concluded that the decline in value was temporary.

Net Investment Income and Realized Gains (Losses)

Net investment income is a function of the yield that the Company earns on invested assets and the size of the portfolio. The investment yield is a function of market interest rates at the time of investment as well as the type, credit quality and maturity of the invested assets. Accrued investment income, which is recorded in Other Assets, was $99$91 million and $9899 million as of December 31, 20152016 and December 31, 20142015, respectively.
 
Net Investment Income

Year Ended December 31,Year Ended December 31,
2015 2014 20132016 2015 2014
(in millions)(in millions)
Income from fixed-maturity securities managed by third parties$335

$324

$322
$306

$335

$324
Income from internally managed securities:          
Fixed maturities61

74

74
103

61

74
Other37
 14
 5
7
 37
 14
Other1
 0
 0
Gross investment income433

412

401
417

433

412
Investment expenses(10)
(9)
(8)(9)
(10)
(9)
Net investment income$423
 $403
 $393
$408
 $423
 $403


Net Realized Investment Gains (Losses)
 
Year Ended December 31,Year Ended December 31,
2015 2014 20132016 2015 2014
(in millions)(in millions)
Gross realized gains on available-for-sale securities$44
 $14
 $73
$28
 $44
 $14
Gross realized gains on other assets in investment portfolio2
 8
 40
Gross realized losses on available-for-sale securities(15) (5) (12)(8) (15) (5)
Gross realized losses on other assets in investment portfolio(10) (2) (7)
Net realized gains (losses) on other invested assets2
 (8) 6
Other-than-temporary impairment(47) (75) (42)(51) (47) (75)
Net realized investment gains (losses)$(26) $(60) $52
$(29) $(26) $(60)
 

223


The following table presents the roll-forward of the credit losses of fixed-maturity securities for which the Company has recognized an other-than-temporary-impairment and where the portion of the fair value adjustment related to other factors was recognized in OCI.
 
Roll Forward of Credit Losses
in the Investment Portfolio

Year Ended December 31,Year Ended December 31,
2015 2014 20132016 2015 2014
(in millions)(in millions)
Balance, beginning of period$124
 $80
 $64
$108
 $124
 $80
Additions for credit losses on securities for which an other-than-temporary-impairment was not previously recognized3
 64
 18
3
 3
 64
Eliminations of securities issued by FG VIEs
 (15) 

 
 (15)
Reductions for securities sold and other settlement during the period(28) (12) (21)(4) (28) (12)
Additions for credit losses on securities for which an other-than-temporary-impairment was previously recognized9
 7
 19
27
 9
 7
Balance, end of period$108
 $124
 $80
$134
 $108
 $124
 
Investment Portfolio

Fixed-Maturity Securities and Short-Term Investments
by Security Type
As of December 31, 2016

Investment Category 
Percent
of
Total(1)
 
Amortized
Cost
 
Gross
Unrealized
Gains
 
Gross
Unrealized
Losses
 
Estimated
Fair
Value
 
AOCI(2)
Gain
(Loss) on
Securities
with
Other-Than-Temporary Impairment
 
Weighted
Average
Credit
Rating
 (3)
  (dollars in millions)
Fixed-maturity securities:  


Obligations of state and political subdivisions 50% $5,269
 $202
 $(39) $5,432
 $13
 AA
U.S. government and agencies 4
 424
 17
 (1) 440
 
 AA+
Corporate securities 15
 1,612
 32
 (31) 1,613
 (8) A-
Mortgage-backed securities(4): 


RMBS 9
 998
 27
 (38) 987
 (21) A-
CMBS 5
 575
 13
 (5) 583
 
 AAA
Asset-backed securities 8
 835
 110
 0
 945
 33
 B
Foreign government securities 3
 261
 4
 (32) 233
 
 AA
Total fixed-maturity securities 94
 9,974
 405
 (146) 10,233
 17
 A+
Short-term investments 6
 590
 0
 0
 590
 
 AAA
Total investment portfolio 100% $10,564
 $405
 $(146) $10,823
 17
 A+


Fixed-Maturity Securities and Short-Term Investments
by Security Type 
As of December 31, 2015

Investment Category 
Percent
of
Total(1)
 
Amortized
Cost
 
Gross
Unrealized
Gains
 
Gross
Unrealized
Losses
 
Estimated
Fair
Value
 
AOCI(2)
Gain
(Loss) on
Securities
with
Other-Than-Temporary Impairment
 
Weighted
Average
Credit
Rating
 (3)
  (dollars in millions)
Fixed-maturity securities:  


Obligations of state and political subdivisions 52% $5,528
 $323
 $(10) $5,841
 $5
 AA
U.S. government and agencies 3
 377
 23
 0
 400
 
 AA+
Corporate securities 14
 1,505
 38
 (23) 1,520
 (13) A-
Mortgage-backed securities(4): 


RMBS 11
 1,238
 29
 (22) 1,245
 (7) A
CMBS 5
 506
 9
 (2) 513
 
 AAA
Asset-backed securities 8
 831
 4
 (10) 825
 (6) B+
Foreign government securities 3
 290
 4
 (11) 283
 
 AA+
Total fixed-maturity securities 96
 10,275
 430
 (78) 10,627
 (21) A+
Short-term investments 4
 396
 0
 0
 396
 
 AA-
Total investment portfolio 100% $10,671
 $430
 $(78) $11,023
 $(21) A+


224

Table of Contents

Fixed-Maturity Securities and Short-Term Investments
by Security Type
As of December 31, 2014

Investment Category 
Percent
of
Total(1)
 
Amortized
Cost
 
Gross
Unrealized
Gains
 
Gross
Unrealized
Losses
 
Estimated
Fair
Value
 
AOCI
Gain
(Loss) on
Securities
with
Other-Than-Temporary Impairment
 
Weighted
Average
Credit
Rating
 (3)
 
Percent
of
Total(1)
 
Amortized
Cost
 
Gross
Unrealized
Gains
 
Gross
Unrealized
Losses
 
Estimated
Fair
Value
 
AOCI
Gain
(Loss) on
Securities
with
Other-Than-Temporary Impairment
 
Weighted
Average
Credit
Rating
 (3)
 (dollars in millions) (dollars in millions)
Fixed-maturity securities:  


Obligations of state and political subdivisions 50% $5,416
 $380
 $(1) $5,795
 $7
 AA 52% $5,528
 $323
 $(10) $5,841
 $5
 AA
U.S. government and agencies 6
 635
 31
 (1) 665
 
 AA+ 3
 377
 23
 0
 400
 
 AA+
Corporate securities 12
 1,320
 53
 (5) 1,368
 (2) A 14
 1,505
 38
 (23) 1,520
 (13) A-
Mortgage-backed securities(4):  


RMBS 12
 1,255
 51
 (21) 1,285
 0
 A- 11
 1,238
 29
 (22) 1,245
 (7) A
CMBS 6
 639
 20
 0
 659
 
 AAA 5
 506
 9
 (2) 513
 
 AAA
Asset-backed securities 4
 411
 9
 (3) 417
 3
 BBB- 8
 831
 4
 (10) 825
 (6) B+
Foreign government securities 3
 296
 8
 (2) 302
 
 AA+ 3
 290
 4
 (11) 283
 
 AA+
Total fixed-maturity securities 93
 9,972
 552
 (33) 10,491
 8
 AA- 96
 10,275
 430
 (78) 10,627
 (21) A+
Short-term investments 7
 767
 0
 0
 767
 0
 AA+ 4
 396
 0
 0
 396
 
 AA-
Total investment portfolio 100% $10,739
 $552
 $(33) $11,258
 $8
 AA- 100% $10,671
 $430
 $(78) $11,023
 $(21) A+
____________________
(1)Based on amortized cost.
 
(2)Accumulated OCI. See also Note 20, Other Comprehensive Income.
 
(3)Ratings in the tables above represent the lower of the Moody’s and S&P classifications except for bonds purchased for loss mitigation or risk management strategies, which use internal ratings classifications. The Company’s portfolio consists primarily of high-quality, liquid instruments.
 
(4)
Government-agency obligations were approximately 54%42% of mortgage backed securities as of December 31, 20152016 and 44%54% as of December 31, 20142015 based on fair value.

The Company’s investment portfolio in tax-exempt and taxable municipal securities includes issuances by a wide number of municipal authorities across the U.S. and its territories. Under the Company's investment guidelines, securities rated lower than A-/A3 by S&P or Moody’s are typically not purchased for the Company’s portfolio unless acquired for loss mitigation or risk management strategies.


225

Table of Contents

The following tables present the fair value of the Company’s available-for-sale portfolio of obligations of state and political subdivisions as of December 31, 20152016 and December 31, 20142015 by state.
 
Fair Value of Available-for-Sale Portfolio of
Obligations of State and Political Subdivisions
As of December 31, 20152016 (1)
 
State 
State
General
Obligation
 
Local
General
Obligation
 Revenue Bonds 
Fair
Value
 
Amortized
Cost
 
Average
Credit
Rating
 
State
General
Obligation
 
Local
General
Obligation
 Revenue Bonds 
Fair
Value
 
Amortized
Cost
 
Average
Credit
Rating
 (in millions) (in millions)
Fixed-maturity securities:                      
New York $13
 $59
 $571
 $643
 $610
 AA $13
 $38
 $570
 $621
 $604
 AA
California 73
 62
 391
 526
 497
 A+
Texas 28
 224
 325
 577
 542
 AA 16
 186
 316
 518
 503
 AA
California 78
 66
 411
 555
 521
 A+
Washington 59
 79
 200
 338
 323
 AA 81
 68
 201
 350
 348
 AA
Florida 17
 
 268
 285
 266
 AA- 16
 11
 247
 274
 266
 AA-
Massachusetts 74
 
 149
 223
 215
 AA
Illinois 47
 69
 128
 244
 234
 A 18
 65
 127
 210
 205
 A+
Massachusetts 75
 
 148
 223
 207
 AA
Arizona 
 10
 181
 191
 181
 AA 
 3
 122
 125
 122
 AA
Georgia 
 9
 104
 113
 109
 A+
Pennsylvania 48
 26
 47
 121
 115
 A 38
 17
 58
 113
 111
 A+
Ohio 17
 14
 83
 114
 106
 AA
All others 156
 168
 1,148
 1,472
 1,396
 AA- 153
 155
 1,085
 1,393
 1,364
 AA-
Subtotal 538
 715
 3,510
 4,763
 4,501
 AA-
Short-term investments (2) 
 
 60
 60
 60
 CC
Total $538
 $715
 $3,570
 $4,823
 $4,561
 AA- $482
 $614
 $3,370
 $4,466
 $4,344
 AA-

Fair Value of Available-for-Sale Portfolio of
Obligations of State and Political Subdivisions
As of December 31, 20142015 (1)

State 
State
General
Obligation
 
Local
General
Obligation
 Revenue Bonds 
Fair
Value
 
Amortized
Cost
 
Average
Credit
Rating
 
State
General
Obligation
 
Local
General
Obligation
 Revenue Bonds 
Fair
Value
 
Amortized
Cost
 
Average
Credit
Rating
 (in millions) (in millions)
Fixed-maturity securities:                      
New York $13
 $59
 $571
 $643
 $610
 AA
Texas $60
 $293
 $305
 $658
 $613
  AA 28
 224
 325
 577
 542
 AA
New York 13
 41
 551
 605
 571
  AA
California 45
 70
 377
 492
 449
  A+ 78
 66
 411
 555
 521
 A+
Washington 59
 79
 200
 338
 323
 AA
Florida 47
 34
 256
 337
 311
  AA- 17
 
 268
 285
 266
 AA-
Illinois 20
 99
 177
 296
 275
  A+ 47
 69
 128
 244
 234
 A
Washington 67
 48
 163
 278
 262
 AA
Massachusetts 46
 8
 169
 223
 204
 AA 75
 
 148
 223
 207
 AA
Arizona 
 7
 170
 177
 165
  AA 
 10
 181
 191
 181
 AA
Michigan 
 
 132
 132
 122
  AA-
Pennsylvania 48
 26
 47
 121
 115
 A
Ohio 6
 40
 82
 128
 119
  AA 17
 14
 83
 114
 106
 AA
All others 276
 251
 1,096
 1,623
 1,528
  AA- 156
 168
 1,148
 1,472
 1,396
 AA-
Subtotal 538
 715
 3,510
 4,763
 4,501
 AA-
Short-term investments (2) 
 
 60
 60
 60
 CC
Total $580
 $891
 $3,478
 $4,949
 $4,619
 AA- $538
 $715
 $3,570
 $4,823
 $4,561
 AA-
____________________
(1)Excludes $1,078$966 million and $846$1,078 million as of December 31, 20152016 and 2014,2015, respectively, of pre-refunded bonds, at fair value. The credit ratings are based on the underlying ratings and do not include any benefit from bond insurance.

(2)    Matured in the first quarter of 2016.


226


The revenue bond portfolio is comprised primarily of essential service revenue bonds issued by transportation authorities and other utilities, water and sewer authorities, universities and healthcare providers.
 
Revenue Bonds
Sources of Funds
 
 As of December 31, 2015 As of December 31, 2014 As of December 31, 2016 As of December 31, 2015
Type 
Fair
Value
 
Amortized
Cost
 
Fair
Value
 
Amortized
Cost
 
Fair
Value
 
Amortized
Cost
 
Fair
Value
 
Amortized
Cost
 (in millions) (in millions)
Fixed-maturity securities:                
Transportation $867
 $815
 $796
 $733
 $860
 $824
 $867
 $815
Tax backed 617
 601
 610
 576
Water and sewer 612
 576
 563
 527
 545
 531
 612
 576
Tax backed 610
 576
 551
 514
Higher education 518
 487
 527
 492
 513
 499
 518
 487
Municipal utilities 414
 393
 512
 479
 365
 360
 414
 393
Healthcare 344
 321
 346
 317
 310
 298
 344
 321
All others 145
 141
 183
 173
 160
 158
 145
 141
Subtotal 3,510
 3,309
 3,478
 3,235
 3,370
 3,271
 3,510
 3,309
Short-term investments (1) 60
 60


 60
 60
Total $3,570
 $3,369
 $3,478
 $3,235
 $3,370
 $3,271
 $3,570
 $3,369
____________________
(1)    Matured in the first quarter of 2016.
 
The majority of the investment portfolio is managed by four outside managers. The Company has established detailed guidelines regarding credit quality, exposure to a particular sector and exposure to a particular obligor within a sector.

The following tables summarize, for all fixed-maturity securities in an unrealized loss position, the aggregate fair value and gross unrealized loss by length of time the amounts have continuously been in an unrealized loss position.
 
Fixed-Maturity Securities
Gross Unrealized Loss by Length of Time
As of December 31, 20152016
 
Less than 12 months 12 months or more TotalLess than 12 months 12 months or more Total
Fair
Value
 
Unrealized
Loss
 
Fair
Value
 
Unrealized
Loss
 
Fair
Value
 
Unrealized
Loss
Fair
Value
 
Unrealized
Loss
 
Fair
Value
 
Unrealized
Loss
 
Fair
Value
 
Unrealized
Loss
(dollars in millions)(dollars in millions)
Obligations of state and political subdivisions$316
 $(10) $7
 $0
 $323
 $(10)$1,110
 $(38) $6
 $(1) $1,116
 $(39)
U.S. government and agencies77
 0
 
 
 77
 0
87
 (1) 
 
 87
 (1)
Corporate securities381
 (8) 95
 (15) 476
 (23)492
 (11) 118
 (20) 610
 (31)
Mortgage-backed securities:       


RMBS438
 (8) 90
 (14) 528
 (22)391
 (23) 94
 (15) 485
 (38)
CMBS140
 (2) 2
 0
 142
 (2)165
 (5) 
 
 165
 (5)
Asset-backed securities517
 (10) 
 
 517
 (10)36
 0
 0
 0
 36
 0
Foreign government securities97
 (4) 82
 (7) 179
 (11)44
 (5) 114
 (27) 158
 (32)
Total$1,966
 $(42) $276
 $(36) $2,242
 $(78)$2,325
 $(83) $332
 $(63) $2,657
 $(146)
Number of securities(1) 
 335
  
 71
  
 396
 
 622
  
 60
  
 676
Number of securities with other-than-temporary impairment 
 9
  
 4
  
 13
 
 8
  
 9
  
 17
 

227


Fixed-Maturity Securities
Gross Unrealized Loss by Length of Time
As of December 31, 20142015

Less than 12 months 12 months or more TotalLess than 12 months 12 months or more Total
Fair
Value
 
Unrealized
Loss
 
Fair
Value
 
Unrealized
Loss
 
Fair
Value
 
Unrealized
Loss
Fair
Value
 
Unrealized
Loss
 
Fair
Value
 
Unrealized
Loss
 
Fair
Value
 
Unrealized
Loss
(dollars in millions)(dollars in millions)
Obligations of state and political subdivisions$64
 $0
 $25
 $(1) $89
 $(1)$316
 $(10) $7
 $0
 $323
 $(10)
U.S. government and agencies139
 0
 68
 (1) 207
 (1)77
 0
 
 
 77
 0
Corporate securities189
 (3) 104
 (2) 293
 (5)381
 (8) 95
 (15) 476
 (23)
Mortgage-backed securities: 


RMBS205
 (3) 159
 (18) 364
 (21)438
 (8) 90
 (14) 528
 (22)
CMBS36
 0
 19
 0
 55
 0
140
 (2) 2
 0
 142
 (2)
Asset-backed securities56
 (2) 18
 (1) 74
 (3)517
 (10) 
 
 517
 (10)
Foreign government securities108
 (2) 0
 0
 108
 (2)97
 (4) 82
 (7) 179
 (11)
Total$797
 $(10) $393
 $(23) $1,190
 $(33)$1,966
 $(42) $276
 $(36) $2,242
 $(78)
Number of securities(1) 
 125
  
 82
  
 198
 
 335
  
 71
  
 396
Number of securities with other-than-temporary impairment 
 3
  
 7
  
 10
 
 9
  
 4
  
 13
___________________
(1)
The number of securities does not add across because lots consisting of the same securities have been purchased at different times and appear in both categories above (i.e., Lessless than 12 months and 12 months or more). If a security appears in both categories, it is counted only once in the total column.
 
Of the securities in an unrealized loss position for 12 months or more as of December 31, 2015, nine2016, 41 securities had unrealized losses greater than 10% of book value. The total unrealized loss for these securities as of December 31, 2016 was $59 million. As of December 31, 2015, wasof the securities in an unrealized loss position for 12 months or more, nine securities had unrealized losses greater than 10% of book value with an unrealized loss of $26 million. The Company has determined that the unrealized losses recorded as of December 31, 2016 and December 31, 2015 arewere yield related and not the result of other-than-temporary-impairment.
 
The amortized cost and estimated fair value of available-for-sale fixed-maturity securities by contractual maturity as of December 31, 20152016 are shown below. Expected maturities will differ from contractual maturities because borrowers may have the right to call or prepay obligations with or without call or prepayment penalties.
 
Distribution of Fixed-Maturity Securities
by Contractual Maturity
As of December 31, 20152016
 
Amortized
Cost
 
Estimated
Fair Value
Amortized
Cost
 
Estimated
Fair Value
(in millions)(in millions)
Due within one year$234
 $233
$482
 $550
Due after one year through five years1,911
 1,965
1,725
 1,727
Due after five years through 10 years2,169
 2,257
2,112
 2,155
Due after 10 years4,217
 4,414
4,082
 4,231
Mortgage-backed securities: 


RMBS1,238
 1,245
998
 987
CMBS506
 513
575
 583
Total$10,275
 $10,627
$9,974
 $10,233
 

228

Table of Contents

The investment portfolio contains securities and cash that are either held in trust for the benefit of third party reinsurers in accordance with statutory requirements, invested in a guaranteed investment contract for future claims payments, placed on deposit to fulfill state licensing requirements, or otherwise restricted in the amount of $285 million and $283 million, and $236 millionbased on fair value, as of December 31, 20152016 and December 31, 2014, respectively, based on fair value.2015, respectively. The investment portfolio also contains securities that are held in trust by certain AGL subsidiaries for the benefit of other AGL subsidiaries in accordance with statutory and regulatory requirements in the amount of $1,420 million and $1,411 million, and $1,395 millionbased on fair value as of December 31, 20152016 and December 31, 2014, respectively, based on fair value.2015, respectively.

The fair value of the Company’s pledged securities to secure its obligations under its CDS exposure totaled $305$116 million and $376$305 million as of December 31, 20152016 and December 31, 20142015, respectively.
 
No material investments of the Company were non-income producing for years ended December 31, 20152016 and 2014,2015, respectively.
 
Externally Managed Portfolio

The majority of the investment portfolio is managed by four outside managers. The Company has established detailed guidelines regarding credit quality, exposure to a particular sector and exposure to a particular obligor within a sector. The Company's investment guidelines generally do not permit its outside managers to purchase securities rated lower than A- by S&P or A3 by Moody’s, excluding a 2.5% allocation to corporate securities not rated lower than BBB by S&P or Baa2 by Moody’s.

Internally Managed Portfolio

The investment portfolio tables shown above include both assets managed externally and internally. In the table below, more detailed information is provided for the component of the total investment portfolio that is internally managed (excluding short-term investments). The internally managed portfolio, as defined below, represents approximately 13%15% and 8%13% of the investment portfolio, on a fair value basis as of December 31, 2016 and December 31, 2015, and December 31, 2014, respectively. The internally managed portfolio consists primarily of the Company's investments in securities for (i) loss mitigation purposes, (ii) other risk management purposes and (iii) where the Company believes a particular security presents an attractive investment opportunity.
    
One of the Company's strategies for mitigating losses has been to purchase securities it has insured that have expected losses, at discounted prices (assets purchased for loss(loss mitigation purposes)securities). In addition, the Company holds other invested assets that were obtained or purchased as part of negotiated settlements with insured counterparties or under the terms of our financial guaranties (other risk management assets). During 2016, the Company established an alternative investments group to focus on deploying a portion of the Company's excess capital to pursue acquisitions and develop new business opportunities that complement the Company's financial guaranty business, are in line with its risk profile and benefit from its core competencies. The alternative investments group has been investigating a number of such opportunities, including, among others, both controlling and non-controlling investments in investment managers.

Internally Managed Portfolio
Carrying Value

As of December 31,As of December 31,
2015 20142016 2015
(in millions)(in millions)
Assets purchased for loss mitigation and other risk management purposes:      
Fixed-maturity securities, at fair value$1,266
 $835
$1,492
 $1,266
Other invested assets114
 46
107
 114
Other55
 79
55
 55
Total$1,435
 $960
$1,654
 $1,435


11.Insurance Company Regulatory Requirements
 
Each of the Company's insurance companies' ability to pay dividends depends, among other things, upon their financial condition, results of operations, cash requirements, compliance with rating agency requirements, and is also subject to restrictions contained in the insurance laws and related regulations of their state of domicile and other states. Financial statements prepared in accordance with accounting practices prescribed or permitted by local insurance regulatory authorities differ in certain respects from GAAP.

The Company's U.S. domiciled insurance companies prepare statutory financial statements in accordance with accounting practices prescribed or permitted by the National Association of Insurance Commissioners (“NAIC”)(NAIC) and their respective insurance departments. Prescribed statutory accounting practices are set forth in the NAIC Accounting Practices and Procedures Manual. The Company has no permitted accounting practices on a statutory basis.basis, except for those related to CIFGNA which was merged into AGC and therefore subject to statutory merger accounting requiring the restatement of prior year balances of AGC to include CIFGNA. On the CIFG Acquisition Date, accounting policies were conformed with AGC's accounting policies which do not include any permitted practices.


229

Table of Contents

GAAP differs in certain significant respects from U.S. insurance companies' statutory accounting practices prescribed or permitted by insurance regulatory authorities. The principal differences result from the following statutory accounting practices:

upfront premiums are earned when related principal and interest have expired rather than earned over the expected period of coverage;

acquisition costs are charged to expense as incurred rather than over the period that related premiums are earned;

a contingency reserve is computed based on statutory requirements, whereas no such reserve is required under GAAP;

certain assets designated as “non-admitted assets” are charged directly to statutory surplus, rather than reflected as assets under GAAP;

investments in subsidiaries are carried on the balance sheet on the equity basis, to the extent admissible, rather than consolidated with the parent;

the amount of deferred tax assets that may be admitted is subject to an adjusted surplus threshold and is generally limited to the lesser of those assets the Company expects to realize within three years of the balance sheet date or fifteen percent of the Company's adjusted surplus. This realization period and surplus percentage is subject to change based on the amount of adjusted surplus. Under GAAP there is no non-admitted asset determination, rather a valuation allowance is recorded to reduce the deferred tax asset to an amount that is more likely than not to be realized;

insured credit derivatives are accounted for as insurance contracts rather than as derivative contracts measured at fair value;

bonds are generally carried at amortized cost rather than fair value;

insured obligations of VIEs and refinancing vehicles debt, where the Company is deemed the primary beneficiary, are accounted for as insurance contracts. Under GAAP, such VIEs and refinancing vehicles are not consolidated;consolidated and any transactions with the Company are eliminated;

surplus notes are recognized as surplus and each payment of principal and interest is recorded only upon approval of the insurance regulator rather than liabilities with periodic accrual of interest;

push-down acquisition accounting is not applicable under statutory accounting practices, as it is under GAAP;

expected losses are discounted at a rate of 4.0% or 5.0%, recorded when the loss is deemed probable and without consideration of the deferred premium revenue rather thanrevenue. Under GAAP, expected losses are discounted at the risk free rate at the end of each reporting period and are recorded only to the extent they exceed deferred premium revenue;


the present value of installment premiums and commissions are not recorded on the balance sheet as they are under GAAP; and

mergers of acquired companies are treated as statutory mergers at historical balances and financial statements are retroactively revised assuming the merger occurred at the beginning of the prior year, rather than prospectively beginning with the date of acquisition at fair value under GAAP.

AG Re, a Bermuda regulated Class 3B insurer, prepares its statutory financial statements in conformity with the accounting principles set forth in the Insurance Act 1978, amendments thereto and related regulations. GAAP differsAs of December 31, 2016, the Bermuda Monetary Authority (Authority) now requires insurers to prepare statutory financial statements in accordance with the particular accounting principles adopted by the insurer (which, in the case of AG Re, are U.S. GAAP), subject to certain significant respects from statutory accounting practices prescribed or permitted by Bermuda insurance regulatory authorities.adjustments. The principal differences result from the following statutory accounting practices:

acquisition costs on upfront premiums are chargeddifference relates to operations as incurred, rather than over the period that related premiums are earned;

certain assets designated as “non-admitted assets” which are charged directly to statutory surplus rather than reflected as assets as they are under GAAP;U.S. GAAP.


230

Table of Contents

insured credit derivatives are accounted for as insurance contracts (except that loss reserves on insured credit derivatives are not net of unearned premium reserve), rather than as derivative contracts measured at fair value;

Loss reserves on non derivative contracts are net of unearned premium, which is offset by deferred acquisition costs, rather than only unearned premium. Loss reserves include a statutory reserve which includes a discount safety margin and statutory catastrophe reserve.


Insurance Regulatory Amounts Reported

Policyholders' Surplus Net Income (Loss)Policyholders' Surplus Net Income (Loss)
As of December 31, Year Ended December 31,As of December 31, Year Ended December 31,
2015 2014 2015 2014 20132016 2015 2016 2015 2014
(in millions)(in millions)
U.S. statutory companies:                  
AGM(1)$2,441
 $2,267
 $217
 $304
 $340
$2,321
 $2,441
 $191
 $217
 $304
AGC(1)(2)1,896
 1,365
 108
 (92) 116
MAC730
 612
 102
 75
 26
487
 730
 142
 102
 75
AGC(1)(2)1,365
 1,086
 (92) 116
 211
Bermuda statutory company:                  
AG Re1,018
 1,114
 85
 28
 103
1,255
 984
 139
 51
 28
____________________
(1)Policyholders' surplus of AGM and AGC include their indirect share of MAC. AGM and AGC own approximately 61% and 39%, respectively, of the outstanding stock of Municipal Assurance Holdings Inc. ("MAC Holdings")(MAC Holdings), which owns 100% of the outstanding common stock of MAC.

(2)As indicated in Note 2, Acquisition of Radian Asset Assurance Inc.,Acquisitions, AGC completed the acquisition of CIFGH (the parent company of CIFGNA) on July 1, 2016 and Radian Asset on April 1, 2015. Both CIFGNA and Radian Asset was merged with and into AGC, with AGC as the surviving company of the merger. The impact to AGC's policyholders' surplus was approximately $287 million from the CIFGH acquisition, on a statutory basis, as of July 1, 2016 and $333 million from the Radian Asset acquisition, on a statutory basis, as of April 1, 2015.

On July 16, 2013, the Company completed a series of transactions that increased the capitalization of MAC to $800 million on a statutory basis. The Company does not currently anticipate that MAC will distribute any dividends.

AGM and its subsidiaries Assured Guaranty Municipal Insurance Company ("AGMIC") and Assured Guaranty (Bermuda) Ltd. ("AGBM") terminated the reinsurance pooling agreement pursuant to which AGMIC and AGBM had assumed a quota share percentage of the financial guaranty insurance policies issued by AGM, and AGM reassumed such ceded business. Subsequently, AGMIC was merged into AGM, with AGM as the surviving company.
AGBM, which had made a loan of $82.5 million to AGUS, an indirect parent holding company of AGM, received all of the outstanding shares of MAC held by AGUS and cash, in full satisfaction of the principal of and interest on such loan. After AGBM distributed substantially all of its assets, including the MAC shares, to AGM as a dividend, AGM sold AGBM to its affiliate AG Re. Subsequently, AGBM and AG Re merged, with AG Re as the surviving company. The sale of AGBM to, and subsequent merger with, AG Re were each effective as of July 17, 2013.
MAC Holdings was formed to own 100% of the outstanding stock of MAC. AGM and its affiliate AGC subscribed for approximately 61% and 39% of the outstanding MAC Holdings common stock, respectively, for which AGM paid $425 million and AGC paid $275 million, as consideration. The consideration consisted of all of MAC's outstanding common stock (in the case of AGM), cash and marketable securities. 
MAC Holdings then contributed cash and marketable securities having a fair market value sufficient to increase MAC's policyholders' surplus to approximately $400 million, and purchased a surplus note issued by MAC in the principal amount of $300 million. In addition, AGM purchased a surplus note issued by MAC in the principal amount of $100 million.
Following the increase in MAC's capitalization, AGM ceded par exposure of approximately $87 billion and unearned premiums of approximately $468 million to MAC, and AGC ceded par exposure of approximately $24 billion and unearned premiums of approximately $249 million to MAC.

231

Table of Contents

Contingency Reserves

On July 15, 2013, AGM and its wholly-owned subsidiary AGE (together, the "AGM Group")AGM Group) and AGC, were notified that the New York State Department of Financial Services ("NYDFS")(NYDFS) and the Maryland Insurance Administration (“MIA”) do(MIA) did not object to the AGM Group and AGC, respectively, reassuming all of the outstanding contingency reserves that the AGM Group and AGC had ceded to AG Re and electing to cease ceding future contingency reserves to AG Re. The insurance regulators permitted the AGM Group and AGC to reassume the contingency reserves in increments over three years. In the third quarter of 2015, the AGM Group and AGC each reassumed their respective final installments and as of December 31, 2015, the AGM Group and AGC had collectively reassumed an aggregate of approximately $522 million.

From time to time, AGM and AGC have obtained the approval of their regulators to release contingency reserves based on losses or because the accumulated reserve is deemed excessive in relation to the insurer's outstanding insured obligations.  In 2015,2016, on the latter basis, AGM obtained the NYDFS's approval for a contingency reserve release of approximately $253$175 million and AGC obtained the MIA's approval for a contingency reserve release of approximately $134$152 million. In addition, MAC also released approximately $56$53 million of contingency reserves, which consisted of the assumed contingency reserves maintained by MAC, as reinsurer of AGM, in respect of the same obligations that were the subject of AGM's $253$175 million release.


With respect to the regular, quarterly contributions to contingency reserves required by the applicable Maryland and New York laws and regulations, such laws and regulations permit the discontinuation of such quarterly contributions to a company’s contingency reserves when such company’s aggregate contingency reserves for a particular line of business (i.e., municipal or non-municipal) exceed the sum of the company’s outstanding principal for each specified category of obligations within the particular line of business multiplied by the specified contingency reserve factor for each such category.  In accordance with such laws and regulations, and with the approval of the MIA and the NYDFS, respectively, AGC ceased making quarterly contributions to its contingency reserves for both municipal and non-municipal business and AGM ceased making quarterly contributions to its contingency reserves for non-municipal business, in each case beginning in the fourth quarter of 2014. Such cessations are expected to continue for as long as AGC and AGM satisfy the foregoing condition for their applicable lines of business.

Dividend Restrictions and Capital Requirements
      
Under New York insurance law, AGM and MAC may only pay dividends out of "earned surplus," which is the portion of the company's surplus that represents the net earnings, gains or profits (after deduction of all losses) that have not been distributed to shareholders as dividends, or transferred to stated capital or capital surplus, or applied to other purposes permitted by law, but does not include unrealized appreciation of assets. AGM and MAC may each pay dividends without the prior approval of the New York Superintendent of Financial Services ("New(New York Superintendent")Superintendent) that, together with all dividends declared or distributed by it during the preceding 12 months, doesdo not exceed the lesser of 10% of its policyholders' surplus (as of its last annual or quarterly statement filed with the New York Superintendent) or 100% of its adjusted net investment income during that period. The maximum amount available during 20162017 for AGM to distribute as dividends without regulatory approval is estimated to be approximately $244$232 million, of which approximately $95$81 million is estimated to be available for distribution in the first quarter of 2016.2017. The maximum amount available during 2017 for MAC to distribute as dividends without regulatory approval is estimated to be approximately $49 million.  Since its capitalization in 2013, MAC has not distributed any dividends. MAC currently intends to allocate the distribution of such amount quarterly in 2017.
 
Under Maryland's insurance law, AGC may, with prior notice to the Maryland Insurance Commissioner, pay an ordinary dividend that, together with all dividends paid in the prior 12 months, does not exceed the lesser of 10% of its policyholders' surplus (as of the prior December 31) or 100% of its adjusted net investment income during that period. The maximum amount available during 20162017 for AGC to distribute as ordinary dividends is approximately $79$107 million, of which approximately $9$29 million is available for distribution in the first quarter of 2016.2017.

On June 30, 2016, MAC is a New York domiciled insurance company subjectobtained approval from the NYDFS to the same dividend limitations described above forrepay its $300 million surplus note to MAC Holdings and its $100 million surplus note (plus accrued interest) to AGM. The Company does not currently anticipateAccordingly, on June 30, 2016, MAC transferred cash and/or marketable securities to (i) MAC Holdings in an aggregate amount equal to $300 million, and (ii)  AGM in an aggregate amount of $102.5 million. MAC Holdings, upon receipt of such $300 million from MAC, distributed cash and/or marketable securities in an aggregate amount of $300 million to its shareholders, AGM and AGC, in proportion to their respective 61% and 39% ownership interests such that MAC will distribute any dividends.AGM received $182 million and AGC received $118 million.

For AG Re, any distribution (including repurchase of shares) of any share capital, contributed surplus or other statutory capital that would reduce its total statutory capital by 15% or more of its total statutory capital as set out in its previous year's financial statements requires the prior approval of the Bermuda Monetary Authority ("Authority")(Authority). Separately, dividends are paid out of an insurer's statutory surplus and cannot exceed that surplus. Further, annual dividends cannot exceed 25% of total statutory capital and surplus as set out in its previous year's financial statements, which is $254$314 million, without AG Re certifying to the Authority that it will continue to meet required margins.As of December 31, 2016, the Authority now requires insurers to prepare statutory financial statements in accordance with the particular accounting principles adopted by the insurer (which, in the case of AG Re, are U.S. GAAP), subject to certain adjustments. As a result of this new requirement, certain assets previously non-admitted by AG Re are now admitted, resulting in an increase to AG Re’s statutory capital and surplus limitation. Based on the foregoing limitations, in 20162017 AG Re has the capacity to (i) make capital distributions in an aggregate amount up to $127$128 million without the prior approval of the Authority and (ii) declare and pay dividends in an aggregate amount up to the limit of its outstanding statutory surplus, which is $174 million.was approximately $314 million as of December 31, 2016. Such dividend capacity is further limited by the actual amount of AG Re’s unencumbered assets, which

232


amount changes from time to time due in part to collateral posting requirements. As of December 31, 2015,2016, AG Re had unencumbered assets of approximately $640$596 million.


U.K. company law prohibits each of AGE and AGUK from declaring a dividend to its shareholders unless it has “profits available for distribution.” The determination of whether a company has profits available for distribution is based on its accumulated realized profits less its accumulated realized losses. While the U.K. insurance regulatory laws impose no statutory restrictions on a general insurer's ability to declare a dividend, the Prudential Regulation Authority's capital requirements may in practice act as a restriction on dividends. The Company does not expect AGE or AGUK to distribute any dividends at this time

Dividends and Surplus Notes
By Insurance Company Subsidiaries

Year Ended December 31,Year Ended December 31,
2015 2014 20132016 2015 2014
(in millions)(in millions)
Dividends paid by AGC to AGUS$90
 $69
 $67
$79
 $90
 $69
Dividends paid by AGM to AGMH215
 160
 163
247
 215
 160
Dividends paid by AG Re to AGL150
 82
 144
100
 150
 82
Repayment of surplus note by AGM to AGMH25
 50
 50

 25
 50
Issuance of surplus notes by MAC to MAC Holdings
 
 (300)
Issuance of surplus notes by MAC to AGM
 
 (100)
Repayment of surplus note by MAC to AGM100
 
 
Repayment of surplus note by MAC to MAC Holdings (1)300
 
 
____________________
(1)MAC Holdings returned $300 million to AGM and AGC, in proportion to their ownership percentages, in the second quarter of 2016.

Stock Redemption Plan

On November 25, 2016, the New York Superintendent approved AGM's request to repurchase 125 of its shares of common stock from its direct parent, AGMH, for approximately $300 million. AGM implemented the stock redemption plan in December 2016. Each share repurchased by AGM was retired and ceased to be an authorized share. Pursuant to AGM's Amended and Restated Charter, the par value of AGM's remaining shares of common stock issued and outstanding increased automatically in order to maintain AGM's total paid-in capital at $15 million and its authorized capital at $20 million.

12.Income Taxes

Accounting Policy

The provision for income taxes consists of an amount for taxes currently payable and an amount for deferred taxes. Deferred income taxes are provided for temporary differences between the financial statement carrying amounts and tax bases of assets and liabilities, using enacted rates in effect for the year in which the differences are expected to reverse. A valuation allowance is recorded to reduce the deferred tax asset to an amount that is more likely than not to be realized.

Non-interest‑bearingNon-interest-bearing tax and loss bonds are purchased in the amount of the tax benefit that results from deducting contingency reserves as provided under Internal Revenue Code Section 832(e). The Company records the purchase of tax and loss bonds in deferred taxes.

The Company recognizes tax benefits only if a tax position is “more likely than not” to prevail.

Overview
 
AGL, and its "Bermuda Subsidiaries," which consist of AG Re, AGRO, and Cedar Personnel Ltd., are not subject to any income, withholding or capital gains taxes under current Bermuda law. The Company has received an assurance from the Minister of Finance in Bermuda that, in the event of any taxes being imposed, AGL and its Bermuda Subsidiaries will be exempt from taxation in Bermuda until March 31, 2035. AGL's U.S. and U.K. subsidiaries are subject to income taxes imposed by U.S. and U.K. authorities, respectively, and file applicable tax returns. In addition, AGRO, a Bermuda domiciled company and AGE, a U.K. domiciled company, have elected under Section 953(d) of the U.S. Internal Revenue Code to be taxed as a U.S. domestic corporation.
 

In November 2013, AGL became tax resident in the U.K. although it will remain a Bermuda-based company and its administrative and head office functions will continue to be carried on in Bermuda. As a U.K. tax resident company, AGL is required to file a corporation tax return with Her Majesty’s Revenue & Customs (“HMRC”)(HMRC).  AGL is subject to U.K. corporation tax in respect of its worldwide profits (both income and capital gains), subject to any applicable exemptions. The main rate of corporation tax is remains at 20% as of April 1, 2015. for 2016. AGL has also registered in the U.K. to report its Value Added Tax (“VAT”)(VAT) liability.  The current rate of VAT is 20%. Assured Guaranty expects that the dividends AGL receives from its direct subsidiaries will be exempt from U.K. corporation tax due to the exemption in section 931D of the U.K. Corporation Tax Act

233

Table of Contents

2009. In addition, any dividends paid by AGL to its shareholders should not be subject to any withholding tax in the U.K. The U.K. government implemented a new tax regime for “controlled foreign companies” (“CFC regime”) effective January 1, 2013.  Assured Guaranty does not expect any profits of non-U.K. resident members of the group to be taxed under the CFCU.K. "controlled foreign companies" regime and has obtained a clearance from HMRC confirming this on the basis of current facts.

AGUS files a consolidated federal income tax return with AGC, AG Financial Products Inc. ("AGFP")(AGFP), AG Analytics Inc., AGMH beginning May 12, 2012 MAC and MAC Holdings, and beginningsubsidiaries. On April 1, 2015 AGC purchased Radian Asset and Van American. Subsequent to the purchase, Radian Asset merged into AGC and dissolved. Van American (“joined AGUS consolidated tax group”).group. On July 1, 2016 AGC purchased CIFGNA, which subsequently merged into AGC and dissolved. Assured Guaranty Overseas USU.S. Holdings Inc. and its subsidiaries AGRO and AG Intermediary Inc., file their own consolidated federal income tax return.

Provision for Income Taxes

The effective tax rates reflect the proportion of income recognized by each of the Company’s operating subsidiaries, with U.S. subsidiaries taxed at the U.S. marginal corporate income tax rate of 35%, U.K. subsidiaries taxed at the U.K. blended marginal corporate tax rate of 20.25%20% unless subject to U.S. tax by election or as a U.S. controlled foreign corporation, and no taxes for the Company’s Bermuda subsidiaries unless subject to U.S. tax by election or as a U.S. controlled foreign corporation. For periods subsequent to April 1, 2015, the U.K. corporation tax rate has been reduced to 20%, for the and is expected to remain unchanged until April 1, 2017. For period April 1, 2014 to April 1, 2015 the U.K. corporation tax rate was 21% resulting in a blended tax rate of 20.25% in 2015, and prior to April 1, 2014, the U.K. corporation tax rate was 23% resulting in a blended tax rate of 21.5% in 2014.2015. The Company’s overall effective tax rate fluctuates based on the distribution of income across jurisdictions.
 
A reconciliation of the difference between the provision for income taxes and the expected tax provision at statutory rates in taxable jurisdictions is presented below.

Effective Tax Rate Reconciliation
 
Year Ended December 31,Year Ended December 31,
2015 2014 20132016 2015 2014
(in millions)(in millions)
Expected tax provision (benefit) at statutory rates in taxable jurisdictions$443
 $490
 $390
$316
 $443
 $490
Tax-exempt interest(54) (53) (57)(49) (54) (53)
Gain on bargain purchase(19) 
 
(125) (19) 
Change in liability for uncertain tax positions12
 9
 (2)11
 12
 9
Effect of provision to tax return filing adjustments(15) (11) (6)
Other(7) (3) 3
(2) 4
 3
Total provision (benefit) for income taxes$375
 $443
 $334
$136
 $375
 $443
Effective tax rate26.2% 28.9% 29.2%13.4% 26.2% 28.9%


The expected tax provision at statutory rates in taxable jurisdictions is calculated as the sum of pretax income in each jurisdiction multiplied by the statutory tax rate of the jurisdiction by which it will be taxed. Pretax income of the Company’s subsidiaries which are not U.S. or U.K. domiciled but are subject to U.S. or U.K. tax by election, establishment of tax residency or as controlled foreign corporations, are included at the U.S. or U.K. statutory tax rate. Where there is a pretax loss in one jurisdiction and pretax income in another, the total combined expected tax rate may be higher or lower than any of the individual statutory rates.
 

234


The following table presents pretax income and revenue by jurisdiction.
 
Pretax Income (Loss) by Tax Jurisdiction

Year Ended December 31,Year Ended December 31,
2015 2014 20132016 2015 2014
(in millions)(in millions)
United States$1,284
 $1,420
 $1,118
$921
 $1,284
 $1,420
Bermuda177
 142
 27
126
 177
 142
U.K.(30) (31) (3)(30) (30) (31)
Total$1,431
 $1,531
 $1,142
$1,017
 $1,431
 $1,531

 
Revenue by Tax Jurisdiction

Year Ended December 31,Year Ended December 31,
2015 2014 20132016 2015 2014
(in millions)(in millions)
United States$1,853
 $1,633
 $1,389
$1,442
 $1,853
 $1,633
Bermuda361
 365
 219
239
 361
 365
U.K.(7) (4) 0
(4) (7) (4)
Total$2,207
 $1,994
 $1,608
$1,677
 $2,207
 $1,994
 

Pretax income by jurisdiction may be disproportionate to revenue by jurisdiction to the extent that insurance losses incurred are disproportionate.
 

235


Components of Net Deferred Tax Assets

As of December 31,As of December 31,
2015 20142016 2015
(in millions)(in millions)
Deferred tax assets:      
Unrealized losses on credit derivative financial instruments, net$33
 $224
$66
 $33
Unearned premium reserves, net254
 55
229
 254
Loss and LAE reserve64
 66
216
 64
Tax and loss bonds39
 39
50
 39
Alternative minimum tax credit55
 57
17
 55
Foreign tax credit11
 
20
 11
FG VIEs
 13
DAC27
 35
29
 27
Investment basis difference86
 104
76
 86
Deferred compensation41
 38
40
 41
Net operating loss64
 
Other17
 19
43
 17
Total deferred income tax assets627
 650
850
 627
Deferred tax liabilities:      
Contingency reserves64
 64
82
 64
Public debt94
 96
91
 94
Unrealized appreciation on investments108
 159
84
 108
Unrealized gains on CCS22
 22
22
 22
Market discount21
 28
22
 21
FG VIEs13
 
Other18
 21
33
 31
Total deferred income tax liabilities340
 390
334
 340
Less: Valuation allowance11
 
19
 11
Net deferred income tax asset$276
 $260
$497
 $276


As of December 31, 2015,2016, the Company had alternative minimum tax credits of $55$17 million which do not expire. During 2016 the Company generated $1 million of foreign tax credit which will expire in 2026. Management believes sufficient future taxable income exists to realize the full benefit of these tax credits.

As part of the CIFG Acquisition, the Company acquired $189 million of net operating losses (NOL) which will begin to expire in 2033. The NOL has been limited under Internal Revenue Code Section 382 due to a change in control as a result of the acquisition. As of December 31, 2016, the Company had $184 million of NOL’s available to offset its future U.S. taxable income.

Valuation Allowance
 
As part of the Radian Asset Acquisition, the Company acquired $11$19 million of foreign tax credits (“FTC”)(FTC) which will expire between 2018 andin 2020. Of that balance, $11 million was guaranteed at the time of the purchase with an additional $8 million allocated after filing 2015 tax return. After reviewing positive and negative evidence, the Company came to the conclusion that it is more likely than not that the FTC will not be utilized, and therefore recorded a valuation allowance with respect to this tax attribute.

The Company came to the conclusion that it is more likely than not that the remaining net deferred tax asset will be fully realized after weighing all positive and negative evidence available as required under GAAP. The positive evidence that was considered included the cumulative income the Company has earned over the last three years, and the significant unearned premium income to be included in taxable income. The positive evidence outweighs any negative evidence that exists. As such, the Company believes that no valuation allowance is necessary in connection with this deferred tax asset. The Company will continue to analyze the need for a valuation allowance on a quarterly basis.


Audits

AGUS has open tax years with the U.S. Internal Revenue Service (“IRS”)(IRS) for 2009 forward and is currently under audit for the 2009-2012 tax years. On February 20, 2013In December of 2016 the IRS notified AGUSissued a Revenue Agent Report (RAR) which did not identify any material adjustments that were not already accounted for in the prior periods. It is expected that the Joint Committeeaudit will close in 2017 and, depending on Taxation completed its review of the 2006 through 2008final outcome, reserves for uncertain tax years and has accepted the results of the IRS examination without exception.positions may be released. Assured Guaranty Oversees USU.S. Holdings Inc. has open tax years of 20122013 forward. The Company's U.K. subsidiaries are not currently under examination and have open tax years of 2014 forward. CIFGNA, which was acquired by AGC during 2016, is not currently under examination and has open tax years of 2013 forward.

236

Table of Contents


Uncertain Tax Positions

The following table provides a reconciliation of the beginning and ending balances of the total liability for unrecognized tax benefits. The Company does not believe it is reasonably possible that this amount will change significantly in the next twelve months.positions.

 2015 2014 2013
 (in millions)
Balance as of January 1,$28
 $20
 $22
True-up from tax return filings10
 6
 4
Increase in unrecognized tax benefits as a result of position taken during the current period2
 2
 3
Decrease due to closing of IRS audit
 
 (9)
Balance as of December 31,$40
 $28
 $20
 2016 2015 2014
 (in millions)
Balance as of January 1,$40
 $28
 $20
Effect of provision to tax return filing adjustments6
 10
 6
Increase in unrecognized tax positions as a result of position taken during the current period4
 2
 2
Balance as of December 31,$50
 $40
 $28

The Company's policy is to recognize interest and penalties related to uncertain tax positions in income tax expense and has accrued $2 million for 2016 and $1 million per year from 2013 to 2015.for the year ended 2015 and 2014 respectively. As of December 31, 20152016 and December 31, 2014,2015, the Company has accrued $5.4$7 million and $4.5$5 million of interest, respectively.

The total amount of unrecognized tax benefitspositions as of December 31, 20152016 would affect the effective tax rate, if recognized.

Tax Treatment of CDS

The Company treats the guaranty it provides on CDS as an insurance contract for tax purposes and as such a taxable loss does not occur until the Company expects to make a loss payment to the buyer of credit protection based upon the occurrence of one or more specified credit events with respect to the contractually referenced obligation or entity. The Company holds its CDS to maturity, at which time any unrealized fair value loss in excess of credit-related losses would revert to zero. The tax treatment of CDS is an unsettled area of the law. The uncertainty relates to the IRS determination of the income or potential loss associated with CDS as either subject to capital gain (loss) or ordinary income (loss) treatment. In treating CDS as insurance contracts the Company treats both the receipt of premium and payment of losses as ordinary income and believes it is more likely than not that any CDS credit related losses will be treated as ordinary by the IRS. To the extent the IRS takes the view that the losses are capital losses in the future and the Company incurred actual losses associated with the CDS, the Company would need sufficient taxable income of the same character within the carryback and carryforward period available under the tax law.

13.Reinsurance and Other Monoline Exposures
 
The Company assumes exposure on insured obligations (“Assumed Business”)(Assumed Business) and may cede portions of its exposure on obligations it has insured (“Ceded Business”)(Ceded Business) in exchange for premiums, net of ceding commissions. The Company historically entered into ceded reinsurance contracts in order to obtain greater business diversification and reduce the net potential loss from large risks.
 
Accounting Policy

For business assumed and ceded, the accounting model of the underlying direct financial guaranty contract dictates the accounting model used for the reinsurance contract (except for those eliminated as FG VIEs). For any assumed or ceded financial guaranty insurance premiums and financial guaranty insurance losses, the accounting models described in Note 6 are followed. For any assumed or ceded credit derivative contracts, the accounting model in Note 8 is followed.


237


Assumed and Ceded Business
 
The Company assumes business from third party insurers and reinsurers, including other monoline financial guaranty companies. Under these relationships, the Company assumes a portion of the ceding company’s insured risk in exchange for a premium. The Company may be exposed to risk in this portfolio in that the Company may be required to pay losses without a corresponding premium in circumstances whereportion of the ceding company is experiencing financial distress and is unable to pay premiums.Company's premium for the insured risk (typically, net of a ceding commission). The Company’s facultative and treaty agreements are generally subject to termination at the option of the ceding company:
 
if the Company fails to meet certain financial and regulatory criteria and to maintain a specified minimum financial strength rating, or

upon certain changes of control of the Company.
 
Upon termination under these conditions, the Company may be required (under some of its reinsurance agreements) to return to the ceding company unearned premiums (net of ceding commissions) and loss reserves calculated on a statutory basis of accounting, attributable to reinsurance assumed pursuant to such agreements after which the Company would be released from liability with respect to the Assumed Business.

Upon the occurrence of the conditions set forth in the first bullet above, whether or not an agreement is terminated, the Company may be required to obtain a letter of credit or alternative form of security to collateralize its obligation to perform under such agreement or it may be obligated to increase the level of ceding commission paid.
 
The downgrade of the financial strength ratings of AG Re or of AGC gives certain ceding companies the right to recapture business they had ceded to AG Re and AGC, which would lead to a reduction in the Company's unearned premium reserve and related earnings on such reserve. With respect to a significant portion of the Company's in-force financial guaranty assumed business, based on AG Re's and AGC's current ratings and subject to the terms of each reinsurance agreement, the third party ceding company may have the right to recapture business it had ceded to AG Re and/or AGC, and in connection therewith, to receive payment from AG Re or AGC of an amount equal to the statutory unearned premium (net of ceding commissions) and statutory loss reserves (if any) associated with that business, plus, in certain cases, an additional ceding commission.required payment. As of December 31, 2015,2016, if each third party insurer ceding business to AG Re and/or AGC had a right to recapture such business, and chose to exercise such right, the aggregate amounts that AG Re and AGC could be required to pay to all such companies would be approximately $55$45 million and $34$18 million, respectively.

The Company has Ceded Business to non-affiliated companies to limit its exposure to risk. Under these relationships, the Company cedesceded a portion of its insured risk to the reinsurer in exchange for the reinsurer receiving a premium paid toshare of the reinsurer.Company's premiums for the insured risk (typically, net of a ceding commission). The Company remains primarily liable for all risks it directly underwrites and is required to pay all gross claims. It then seeks reimbursement from the reinsurer for its proportionate share of claims. The Company may be exposed to risk for this exposure if it were required to pay the gross claims and not be able to collect ceded claims from an assuming company experiencing financial distress. A number of the financial guaranty insurers to which the Company has ceded par have experienced financial distress and been downgraded by the rating agencies as a result. In addition, state insurance regulators have intervened with respect to some of these insurers. The Company’s ceded contracts generally allow the Company to recapture Ceded Business after certain triggering events, such as reinsurer downgrades.
 
Over the past several years, the Company has entered into several commutations in order to reassume previously ceded books of business from its reinsurers. The Company has also canceled assumed reinsurance contracts.
 
Net Effect of Commutations of Ceded and
Cancellations of Assumed Reinsurance Contracts 

Year Ended December 31,Year Ended December 31,
2015 2014 20132016 2015 2014
(in millions)(in millions)
Increase (decrease) in net unearned premium reserve$23
 $20
 $11
$
 $23
 $20
Increase (decrease) in net par outstanding855
 1,167
 151
28
 855
 1,167
Commutation gains recorded in other income28
 23
 2
Commutation gains (losses)8
 28
 23


238


The following table presents the components of premiums and losses reported in the consolidated statement of operations and the contribution of the Company's Assumed and Ceded Businesses.

Effect of Reinsurance on Statement of Operations

Year Ended December 31,Year Ended December 31,
2015 2014 20132016 2015 2014
(in millions)(in millions)
Premiums Written:          
Direct$164
 $116
 106
$165
 $164
 $116
Assumed(1)17
 (12) 17
(11) 17
 (12)
Ceded(2)10
 15
 2
(17) 10
 15
Net$191
 $119
 125
$137
 $191
 $119
Premiums Earned:          
Direct$792
 $581
 819
$887
 $792
 $581
Assumed40
 47
 40
27
 40
 47
Ceded(66) (58) (107)(50) (66) (58)
Net$766
 $570
 752
$864
 $766
 $570
Loss and LAE:          
Direct$399
 $132
 110
$327
 $399
 $132
Assumed45
 37
 73
0
 45
 37
Ceded(20) (43) (29)(32) (20) (43)
Net$424
 $126
 154
$295
 $424
 $126
____________________
(1)Negative assumed premiums written were due to changes in expected Debt Servicedebt service schedules.

(2)Positive ceded premiums written were due to commutations and changes in expected Debt Servicedebt service schedules.

In addition to the items presented in the table above, the Company records in net change in fair value of credit derivatives on the consolidated statements of operations, the effect of assumed and ceded credit derivative exposures. These amounts were losses of $27 million in 2016 and $3 million in 2015 and gains of $2 million in 2014.

Other Monoline Exposures
 
In addition to assumed and ceded reinsurance arrangements, the Company may also have exposure to some financial guaranty reinsurers (i.e., monolines) in other areas. Second-to-pay insured par outstanding represents transactions the Company has insured that were previously insured by other monolines.third party insurers and reinsurers. The Company underwrites such transactions based on the underlying insured obligation without regard to the primary insurer. Another area of exposure is in the investment portfolio where the Company holds fixed-maturity securities that are wrapped by monolines and whose value may change based on the rating of the monoline. As of December 31, 20152016, based on fair value, the Company had fixed-maturity securities in its investment portfolio consisting of $194$110 million insured by National, Public Finance Guarantee Corporation ("National"), $154$83 million insured by Ambac and $8 million insured by other guarantors.

In addition, the Company acquired bonds for loss mitigation or other risk management purposes in the amountpurposes. As of $123December 31, 2016 these bonds had a fair value of $332 million insured by MBIA and $126 million insured by FGIC UK Limited and $259 millionLimited. On January 10, 2017, the Company delivered the bonds insured by MBIA Insurance Corp.in connection with its acquisition of AGLN. See Note 2, Acquisitions, for more information on the acquisition of AGLN.

In accordance with U.S. statutory accounting requirements and U.S. insurance laws and regulations, in order for the Company to receive credit for liabilities ceded to reinsurers domiciled outside of the U.S., such reinsurers must secure their liabilities to the Company. All of the unauthorized reinsurers in the tables below are required to post collateral for the benefit of the Company in an amount at least equal to the sum of their ceded unearned premium reserve, loss reserves and contingency reserves all calculated on a statutory basis of accounting. In addition, certain authorized reinsurers in the tables below post collateral on terms negotiated with the Company.


239

Table of Contents

Monoline and Reinsurer Exposure by ReinsurerCompany

  Ratings at Par Outstanding (1)
  February 24, 2016 As of December 31, 2015
Reinsurer 
Moody’s
Reinsurer
Rating
 
S&P
Reinsurer
Rating
 
Ceded Par
Outstanding
 
Second-to-
Pay Insured
Par
Outstanding
 
Assumed Par
Outstanding
  (dollars in millions)
American Overseas Reinsurance Company Limited (f/k/a Ram Re) (2) WR (3) WR $5,227
 $
 $30
Tokio Marine & Nichido Fire Insurance Co., Ltd. (“Tokio”) (2) Aa3 (4) A+ (4) 4,216
 
 
Syncora Guarantee Inc. (2) WR WR 2,451
 1,244
 727
Mitsui Sumitomo Insurance Co. Ltd. (2) A1 A+ (4) 1,818
 
 
ACA Financial Guaranty Corp. NR (5) WR 714
 20
 
Ambac WR WR 117
 3,889
 10,388
National (6) A3 AA- 
 5,299
 5,100
MBIA (7) (7) 
 1,802
 440
FGIC (8) (8) 
 1,424
 652
Ambac Assurance Corp. Segregated Account NR NR 
 91
 873
CIFG Assurance North America Inc. ("CIFG") WR WR 
 43
 2,996
Other (2) Various Various 78
 796
 133
Total     $14,621
 $14,608
 $21,339
  Par Outstanding
  As of December 31, 2016
Reinsurer Ceded Par
Outstanding (1)
 Second-to-
Pay Insured
Par
Outstanding (2)
 Assumed Par
Outstanding
  (in millions)
Reinsurers rated investment grade:      
Tokio Marine & Nichido Fire Insurance Co., Ltd. (3) (4) $3,436
 $
 $
Mitsui Sumitomo Insurance Co. Ltd. (3) (4) 1,273
 
 
National 
 4,420
 4,364
Subtotal 4,709
 4,420
 4,364
Reinsurers rated BIG, had rating withdrawn or not rated:      
American Overseas Reinsurance Company Limited (3) 3,573
 
 30
Syncora (3) 2,062
 1,098
 655
ACA Financial Guaranty Corp. 637
 20
 
Ambac 115
 2,862
 6,695
MBIA 

1,024

165
MBIA UK (5) 

319

211
FGIC (6) 
 1,194
 410
Ambac Assurance Corp. Segregated Account 
 73
 614
Other (3) 60
 529
 120
Subtotal 6,447
 7,119
 8,900
Total $11,156
 $11,539
 $13,264
____________________
(1)IncludesOf the total ceded par related to insured credit derivatives.reinsurers rated BIG, had rating withdrawn or not rated, $384 million is rated BIG.

(2)The par on second-to-pay exposure where the primary insurer and underlying transaction rating are both BIG is $788 million.
  
(2)(3)
The total collateral posted by all non-affiliated reinsurers required or agreeinghad agreed to post collateral as of December 31, 2015, is2016 was approximately $470$387 million.

(3)    Represents “Withdrawn Rating.”
(4)    The Company benefits from trust arrangements that satisfy the triple-A credit requirement of S&P and/or Moody’s.

(5)    Represents “Not Rated.”

(6)(5)National is rated AA+ by KBRA.See Note 2, Acquisitions, for more information on MBIA UK.

(7)MBIA includes subsidiaries MBIA Insurance Corp. rated B by S&P and B3 by Moody's and MBIA U.K. Insurance Ltd. rated BB by S&P and Ba2 by Moody’s.

(8)(6)FGIC includes subsidiaries Financial Guaranty Insurance Company and FGIC UK Limited both of which had their ratings withdrawn by rating agencies.Limited.


240

Table of Contents

Ceded Par Outstanding by Reinsurer and Credit Rating
As of December 31, 2015

  Internal Credit Rating
Reinsurer  AAA AA A BBB BIG Total
  (in millions)
American Overseas Reinsurance Company Limited (f/k/a Ram Re) $403
 $1,809
 $1,607
 $1,087
 $321
 $5,227
Tokio 564
 529
 1,131
 1,365
 627
 4,216
Syncora Guarantee Inc. 
 132
 430
 1,766
 123
 2,451
Mitsui Sumitomo Insurance Co. Ltd. 131
 552
 590
 372
 173
 1,818
ACA Financial Guaranty Corp 
 449
 246
 19
 
 714
Ambac 
 
 117
 
 
 117
Other 49
 0
 1
 28
 
 78
Total $1,147
 $3,471
 $4,122
 $4,637
 $1,244
 $14,621


Second-to-Pay
Insured Par Outstanding by Internal Rating
As of December 31, 2015(1)
 Public Finance Structured Finance
 AAA AA A BBB BIG AAA AA A BBB BIG Total
 (in millions)
Syncora Guarantee Inc.$
 $71
 $176
 $624
 $329
 $
 $
 $
 $
 $44
 $1,244
ACA Financial Guaranty Corp.
 
 
 1
 19


 20
Ambac10
 1,024
 1,517
 1,085
 49
 1
 
 58
 137
 8
 3,889
National71
 1,649
 3,555


 24
 
 
 5,299
MBIA
 65
 254
 240
 
 
 886
 16
 234
 107
 1,802
FGIC
 31
 749
 251
 201
 149
 
 8
 
 35
 1,424
Ambac Assurance Corp. Segregated Account


 24
 
 
 67
 91
CIFG
 
 
 22
 21


 43
Other
 796


 796
Total$81
 $3,636
 $6,251
 $2,223
 $619
 $150
 $910
 $106
 $371
 $261
 $14,608
____________________
(1)Assured Guaranty’s internal rating.


241

Table of Contents

Amounts Due (To) From Reinsurers
As of December 31, 20152016
 
Assumed
Premium, net
of Commissions
 
Ceded
Premium, net
of Commissions
 Assumed
Expected
Loss to be Paid
 Ceded
Expected
Loss to be Paid
Assumed
Premium, net
of Commissions
 
Ceded
Premium, net
of Commissions
 Assumed
Expected
Loss to be Paid
 Ceded
Expected
Loss to be Paid
(in millions)(in millions)
American Overseas Reinsurance Company Limited (f/k/a Ram Re)$
 $(7) $
 $24
Tokio
 (12) 
 43
Syncora Guarantee Inc.15
 (22) 
 5
Mitsui Sumitomo Insurance Co. Ltd.
 (3) 
 17
Reinsurers rated investment grade$5
 $(11) $(1) $62
Reinsurers rated BIG, had rating withdrawn or not rated:       
Ambac41
 
 (5) 
33
 
 (1) 
National6
 
 (4) 
Syncora13
 (18) 
 (3)
Ambac Assurance Corp. Segregated Account6
 
 (47) 
FGIC4
 
 (13) 
MBIA5
 
 (11) 
0
 
 (8) 
FGIC4
 
 (14) 
Ambac Assurance Corp. Segregated Account11
 
 (67) 
CIFG0
 
 (62) 
MBIA UK4
 
 0
 
American Overseas Reinsurance Company Limited
 (5) 
 28
Other
 (3) 
 

 (12) 
 
Subtotal60
 (35) (69) 25
Total$82
 $(47) $(163) $89
$65
 $(46) $(70) $87
 

Excess of Loss Reinsurance Facility
 
AGC, AGM and MAC entered into a $360 million aggregate excess of loss reinsurance facility with a number of reinsurers, effective as of January 1, 2016. This facility replaces a similar $450 million aggregate excess of loss reinsurance facility that AGC, AGM and MAC had entered into effective January 1, 2014 and which terminated on December 31, 2015. The new facility covers losses occurring either from January 1, 2016 through December 31, 2023, or January 1, 2017 through December 31, 2024, at the option of AGC, AGM and MAC. It terminates on January 1, 2018, unless AGC, AGM and MAC choose to extend it. The new facility covers certain U.S. public finance credits insured or reinsured by AGC, AGM and MAC as of September 30, 2015, excluding credits that were rated non-investment grade as of December 31, 2015 by Moody’s or S&P or internally by AGC, AGM or MAC and is subject to certain per credit limits. Among the credits excluded are those associated with the Commonwealth of Puerto Rico and its related authorities and public corporations. The new facility attaches when AGC’s, AGM’s and MAC’s net losses (net of AGC’s and AGM's reinsurance (including from affiliates) and net of recoveries) exceed $1.25 billion in the aggregate. The new facility covers a portion of the next $400 million of losses, with the reinsurers assuming pro rata in the aggregate $360 million of the $400 million of losses and AGC, AGM and MAC jointly retaining the remaining $40 million. The reinsurers are required to be rated at least AA- or to post collateral sufficient to provide AGM, AGC and MAC with the same reinsurance credit as reinsurers rated AA-. AGM, AGC and MAC are obligated to pay the reinsurers their share of recoveries relating to losses during the coverage period in the covered portfolio. AGC, AGM and MAC paid approximately $9 million of premiums in 2016 for the term January 1, 2016 through December 31, 2016 and depositedhad approximately $9 million of securities intocash in trust accounts for the benefit of the reinsurers to be used to pay the premium for January 1, 2017 through December 31, 2017. The main differences between the new facility and the prior facility that terminated on December 31, 2015 are the reinsurance attachment point ($1.25 billion versus $1.5 billion), the total reinsurance coverage ($360 million part of $400 million versus $450 million part of $500 million) and the annual premium ($9 million versus $19 million). 
 

242


14.Related Party Transactions

The Company was party to transactions with entities that are affiliated with Wilbur L. Ross, Jr., who had been a director of the Company until November 21, 2014. Mr. Ross and the funds under his control owned approximately 8.2% of the AGL common shares as of December 31, 2013. However, in 2014, Mr. Ross and the funds sold all of the AGL shares they owned and Mr. Ross resigned from the AGL board. At the time of his resignation, WL Ross and Co. LLC issued a press release announcing that Mr. Ross had been elected Vice Chairman of Bank of Cyprus and, due to rules limiting directorships of bank officers, would be resigning from the boards of directors of several companies, including that of Assured Guaranty.

In addition, the Company retains Wellington Management Company, LLP ("Wellington")(Wellington) and BlackRock Financial Management, Inc. (BlackRock), aseach own more than 5% of the Company's common shares, and each are investment managermanagers for a portion of the Company's investment portfolio. The net expenses from transactions with Wellington ownedand BlackRock were approximately 9.0% of the common shares of AGL as of December 31, 2015, 9.3% as of December 31, 2014 and 6.6% as of December 31, 2013.

$4.2 million in 2016. The net expenses from transactions with Wellington were approximately $1.9 million in 2015 and $1.9 million in 2014. The net expenses from transactions with Wellington and WL Ross were $2.5 million in 2013, with no individual related party expense item exceeding $1.9 million. As of December 31, 20152016 and 20142015 there were no other significant amounts payable to or amounts receivable from related parties. In addition, please refer to Note 18, Shareholders' Equity, for a descriptionparties, other than compensation in the ordinary course of business.

On January 6, 2017, as part of the transaction under whichCompany's share repurchase program, the Company purchasedrepurchased 297,131 common shares from funds associatedits Chief Executive Officer and 23,062 common shares from its General Counsel. The Company repurchased the shares at the closing price of an AGL common share on the New York Stock Exchange on January 6, 2017. Separately, on that same date, these officers received 297,131 and 23,062 other common shares, respectively, in settlement of share units held by them in the employer stock fund of the Assured Guaranty Ltd. Supplemental Employee Retirement Plan (the AGL SERP). The units needed to be settled in January 2017 pursuant to the terms of an amendment adopted in 2011 to the AGL SERP, which amendment was adopted to comply with WL Ross & Co. LLCrequirements of Section 409A of the Internal Revenue Code (the Code) and its affiliates and from Mr. Ross.Section 457A of the Code.

15.Commitments and Contingencies
 
Leases

AGL and its subsidiaries are party to various lease agreements accounted for as operating leases. The Company leases and occupies space in New York City through 2032. In addition, AGL and its subsidiaries lease additional office space in various locations under non-cancelable operating leases which expire at various dates through 2029. Rent expense was $13.4 million in 2016, $10.5 million in 2015 and $10.1 million in 2014 and $9.9 million in 2013.2014.

AGM entered into an operating lease effective January 1, 2016, for new office space comprising one full floor and one partial floor at 1633 Broadway in New York City.  The Company plans to movemoved the principal place of business of AGM, AGC, MAC and the Company's other U.S. based subsidiaries from 31 West 52nd Street in New York City to this new location during the summer of 2016.  The new lease is for approximately 88,000 square feet and runs until 2032, with an option, subject to certain conditions, to renew for five years at a fair market rent.  The fixed annual rent, which commences after an initial rent holiday, begins at $6.2 million, rising in two steps to $7.3 million for the last five years of the initial term.  In connection with the move and in return for rent abatement and certain other concessions, AGM agreed to terminate, eight months after its new space is delivered,terminated its lease on its existing office space at 31 West 52nd Street, which had been scheduled to run until 2026.  On September 23, 2016, AGM entered into an amendment to that lease to include the remaining portion of the partial floor for the remainder of the lease term. The fixed annual rent, which commences after an initial rent holiday, begins at $1.1 million per annum, rising in two steps to $1.3 million for the last five years of the initial term.

Future Minimum Rental Payments

Year (in millions) (in millions)
2016$4
201720176
2017$6
201820187
20188
201920198
20199
202020208
20209
202120218
ThereafterThereafter84
Thereafter88
TotalTotal$117
Total$128


243


Legal Proceedings

Lawsuits arise in the ordinary course of the Company’s business. It is the opinion of the Company’s management, based upon the information available, that the expected outcome of litigation against the Company, individually or in the aggregate, will not have a material adverse effect on the Company’s financial position or liquidity, although an adverse resolution of litigation against the Company in a fiscal quarter or year could have a material adverse effect on the Company’s results of operations in a particular quarter or year.

In addition, in the ordinary course of their respective businesses, certain of the Company's subsidiaries assert claims in legal proceedings against third parties to recover losses paid in prior periods or prevent losses in the future. For example, asfuture, including those described in the "Recovery Litigation"Litigation," section of Note 5, Expected Loss to be Paid,Paid. For example, as described there, in January 2016 the Company commenced an action for declaratory judgment and injunctive relief in the U.S. District Court for the District of Puerto Rico to invalidate executive orders issued by the Governor of Puerto Rico directing the retention or transfer of certain taxes and revenues pledged to secure the payment of certain bonds insured by the Company. Also,Company, and in July 2016, the Company filed a motion and form of complaint in the U.S. District Court for the District of Puerto Rico seeking relief from the PROMESA stay in order to file a complaint to protect its interest in certain pledged PRHTA toll revenues. As another example, in December 2008, the Company filed a claim in the Supreme Court of the State of New York against an investment manager in a transaction it insured alleging breach of fiduciary duty, gross negligence and breach of contract. The amounts, if any, the Company will recover in these and other proceedings to recover losses are uncertain, and recoveries, or failure to obtain recoveries, in any one or more of these proceedings during any quarter or year could be material to the Company’sCompany's results of operations in that particular quarter or year.

Accounting Policy
    
The Company establishes accruals for litigation and regulatory matters to the extent it is probable that a loss has been incurred and the amount of that loss can be reasonably estimated. For litigation and regulatory matters where a loss may be reasonably possible, but not probable, or is probable but not reasonably estimable, no accrual is established, but if the matter is material, it is disclosed, including matters discussed below. The Company reviews relevant information with respect to its litigation and regulatory matters on a quarterly, and annual basis and updates its accruals, disclosures and estimates of reasonably possible loss based on such reviews.

Litigation

Proceedings Relating to the Company’s Financial Guaranty Business
 
The Company receives subpoenas duces tecum and interrogatories from regulators from time to time.
 
On November 28, 2011, Lehman Brothers International (Europe) (in administration) (“LBIE”)(LBIE) sued AGFP, an affiliate of AGC which in the past had provided credit protection to counterparties under credit default swaps.CDS. AGC acts as the credit support provider of AGFP under these credit default swaps.CDS. LBIE’s complaint, which was filed in the Supreme Court of the State of New York, alleged that AGFP improperly terminated nine credit derivative transactions between LBIE and AGFP and improperly calculated the termination payment in connection with the termination of 28 other credit derivative transactions between LBIE and AGFP. Following defaults by LBIE, AGFP properly terminated the transactions in question in compliance with the agreement between AGFP and LBIE, and calculated the termination payment properly. AGFP calculated that LBIE owes AGFP approximately $$29 million in connection with the termination of the credit derivative transactions, whereas LBIE asserted in the complaint that AGFP owes LBIE a termination payment of approximately $$1.4 billion. On February 3, 2012, AGFP filed a motion to dismiss certain of the counts in the complaint, and on March 15, 2013, the court granted AGFP's motion to dismiss the count relating to improper termination of the nine credit derivative transactions and denied AGFP's motion to dismiss the counts relating to the remaining transactions. On February 22, 2016, AGFP filed a motion for summary judgment on the remaining causes of action asserted by LBIE and on AGFP's counterclaims. Oral argument on AGFP's motion took place on July 21, 2016. LBIE's administrators disclosed in an April 10, 2015 report to LBIE’s unsecured creditors that LBIE's valuation expert has calculated LBIE's claim for damages in aggregate for the 28 transactions to range between a minimum of approximately $200 million and a maximum of approximately $500 million, depending on what adjustment, if any, is made for AGFP's credit risk and excluding any applicable interest. Notwithstanding the range calculated by LBIE's valuation expert, the Company cannot reasonably estimate the possible loss, if any, that may arise from this lawsuit.

On September 25, 2013, Wells Fargo Bank, N.A., as trust administrator of the MASTR Adjustable Rate Mortgages Trust 2007-3 (Wells Fargo), filed an interpleader complaint in the U.S. District Court for the Southern District of New York againstseeking adjudication of a dispute between Wales LLC (Wales) and AGM among others, relatingas to the right ofwhether AGM is entitled to be reimbursedreimbursement from

certain cashflows for principal claims paid in respect of insured certificates. On September 30, 2016, the court issued an opinion denying a motion for judgment on the pleadings filed by Wales. On January 3, 2017, the Court approved a Stipulation and Order of Dismissal of Wales from the action due to Wales having sold its interests in the MASTR Adjustable Rate Mortgages Trust 2007-3 certificates. On February 9, 2017, the remaining parties submitted a Stipulation and (Proposed) Order of Voluntary Dismissal, which the Court has not yet so-ordered. The Company estimates that an adverse outcome to the interpleader proceeding could increase losses on the transaction by approximately $10$10 - $20 million, net of expected settlement payments and reinsurance in force.
 

244

TableOn December 22, 2014, Deutsche Bank National Trust Company, as indenture trustee for the AAA Trust 2007-2 Re-REMIC (the Trustee), filed a “trust instructional proceeding” petition in the State of ContentsCalifornia Superior Court (Probate Division, Orange County), seeking the court’s instruction as to how it should allocate the losses resulting from its December 2014 sale of four RMBS owned by the AAA Trust 2007-2 Re-REMIC. This sale of approximately $70 million principal balance of RMBS was made pursuant to AGC’s liquidation direction in November 2014, and resulted in approximately $27 million of gross proceeds to the Re-REMIC. On December 22, 2014, AGC directed the indenture trustee to allocate to the uninsured Class A-3 Notes the losses realized from the sale. On May 4, 2015, the Superior Court rejected AGC’s allocation direction, and ordered the Trustee to allocate to the Class A-3 noteholders a pro rata share of the $27 million of gross proceeds. AGC is appealing the Superior Court’s decision to the California Court of Appeal.


On May 28, 2014, Houston Casualty Company Europe, Seguros y Reseguros, S.A. (“HCCE”)(HCCE) notified Radian Asset that it was demanding arbitration against Radian Asset in connection with housing cooperative losses presented to Radian Asset by HCCE under several years of quota-share surety reinsurance contracts. Through November 30, 2015, HCCE had presented AGC, as successor to Radian Asset, with approximately €15 million in claims.  In January 2016, Assured Guaranty and HCCE settled all the claims related to the Spanish housing cooperative losses.

Proceedings Related to AGMH’s Former Financial Products Business
     The following is a description of legal proceedings involving AGMH’s former Financial Products Business. Although the Company did not acquire AGMH’s former Financial Products Business, which included AGMH’s former GIC business, medium term notes business and portions of the leveraged lease businesses, certain legal proceedings relating to those businesses arewere against entities that the Company did acquire. While Dexia SA and Dexia Crédit Local S.A., jointly (together, Dexia) have paid all expenses and severally, have agreedsettlement amounts due to indemnify the Company against liability arising outdate as a result of the proceedings described below, such indemnification might not be sufficient to fully hold the Company harmless against any injunctive relief or civil or criminal sanction that is imposed against AGMH or its subsidiaries.subsidiaries as a result of any potential newly asserted claims related to these matters.
 
Governmental Investigations into Former Financial Products Business
 
AGMH and/or AGM have received subpoenas duces tecum and interrogatories or civil investigative demands from the Attorneys General of the States of Connecticut, Florida, Illinois, Massachusetts, Missouri, New York, Texas and West Virginia relating to their investigations of alleged bid rigging of municipal GICs. AGMH has been responding to such requests. AGMH may receive additional inquiries from these or other regulators and expects to provide additional information to such regulators regarding their inquiries in the future. In addition, AGMH received a subpoena from the Antitrust Division of the Department of Justice in November 2006 issued in connection with an ongoing criminal investigation of bid rigging of awards of municipal GICs and other municipal derivatives. PursuantAGMH responded to such requests when they were received several years ago. While it is possible AGMH may receive additional inquiries from these or other regulators, the Company is not currently aware that subpoena, AGMH has furnished toany governmental authority, including such Attorneys General or the Department of Justice, records and other informationare actively pursuing or contemplating legal proceedings with respect to AGMH’s municipal GIC business. The ultimate loss that may arise from these investigations remains uncertain.AGMH's former Financial Products Business.

Lawsuits Relating to Former Financial Products Business

DuringFrom 2008 nine putativethrough 2010, complaints were brought on behalf of a purported class action lawsuits were filed in federal courtof state, local and municipal government entities alleging federal antitrust violations in the municipal derivatives industry, seeking damages and alleging, among other things, a conspiracy to fix the pricing of, and manipulate bids for, municipal derivatives, including GICs. These cases have been coordinated andactions were consolidated for pretrial proceedingsbefore one judge in the U.S. District Court for the Southern District of New York as MDL 1950, In re Municipal Derivatives Antitrust Litigation Case No. 1:08-cv-2516 (“MDL 1950”) (MDL 1950). Five of these cases named both AGMH and AGM: (a) Hinds County, Mississippi v. Wachovia Bank, N.A.; (b) Fairfax County, Virginia v. Wachovia Bank, N.A.; (c) Central Bucks School District, Pennsylvania v. Wachovia Bank, N.A.; (d) Mayor and City Council of Baltimore, Maryland v. Wachovia Bank, N.A.; and (e) Washington County, Tennessee v. Wachovia Bank, N.A. In April 2009, the MDL 1950 court granted the defendants’ motion to dismiss on the federal claims for these five cases, but granted leave for the plaintiffs to file an amended complaint. The Corrected Third Consolidated Amended Class Action Complaint, filed on October 9, 2013, lists neither AGM nor AGMH as a named defendant or a co-conspirator. The complaint generally seeks unspecified monetary damages, interest, attorneys’ fees and other costs. The other four cases named AGMH (but not AGM) and also alleged that the defendants violated California state antitrust law and common law by engaging in illegal bid-rigging and market allocation, thereby depriving the cities or municipalities of competition in the awarding of GICs and ultimately resulting in the cities paying higher fees for these products: (f) City of Oakland, California v. AIG Financial Products Corp.; (g) County of Alameda, California v. AIG Financial Products Corp.; (h) City of Fresno, California v. AIG Financial Products Corp.; and (i) Fresno County Financing Authority v. AIG Financial Products Corp. When the four plaintiffs filed a consolidated complaint in September 2009, the plaintiffs did not name AGMH as a defendant. However, the complaint does describe some of AGMH’s and AGM’s activities. The consolidated complaint generally seeks unspecified monetary damages, interest, attorneys’ fees and other costs. In April 2010, the MDL 1950 court granted in part and denied in part the named defendants’Following motions to dismiss, this consolidated complaint. On September 22, 2015, the remaining parties to theamended class action complaints were filed on behalf of a putative class of plaintiffs. The most recently amended, operative class action reported tocomplaint does not list AGMH or its affiliates as defendants or co-conspirators. On July 8, 2016, the MDL 1950 Court that settlements in principle had been reached, and a motion for preliminary approvalentered an order approving settlement of those putativethe remaining class claims, was filed on February 24, 2016. The parties have reported that final settlement with those remaining defendants would resolveresolving the putative class case. The Company cannot reasonably estimate

In addition, the possible loss, if any,Attorney General of the State of West Virginia filed a lawsuit that, as amended, named AGM and Assured Guaranty U.S. Holdings as defendants and alleged a conspiracy to decrease the returns that West Virginia public entities earned on municipal derivative instruments. Also, approximately 19 California and New York government entities

brought individual lawsuits that were not a part of the class action and that did not dismiss AGMH or range of loss that may arise fromits affiliates. All these lawsuits.
In 2008, AGMH and AGM alsocases were named in five non-class action lawsuits originally filed in the California Superior Courts alleging violations of California law related to the municipal derivatives industry: (a) City of Los Angeles, California v. Bank of America, N.A.; (b) City of Stockton, California v. Bank of America, N.A.; (c) County of San Diego, California v. Bank of America, N.A.; (d) County of San Mateo, California v. Bank of America, N.A.; and (e) County of Contra Costa, California v.

245


Bank of America, N.A. Amended complaints in these actions were filed in September 2009, adding a federal antitrust claim and naming AGM (but not AGMH) and AGUS, among other defendants. These cases have been transferred to the Southern District of New York and consolidated with MDL 1950 for pretrial proceedings.purposes. In late 2009, AGMJune and AGUS, among other defendants, were named in six additional non-classJuly 2016, Dexia executed settlement agreements covering the action cases filed in federal court, which also have been coordinated and consolidated for pretrial proceedings with MDL 1950; one was voluntarily dismissed with prejudice in October 2010, leaving five that are currently pending: (f) City of Riverside, California v. Bank of America, N.A.; (g) Los Angeles World Airports v. Bank of America, N.A.; (h) Redevelopment Agency of the City of Stockton v. Bank of America, N.A.; (i) Sacramento Suburban Water District v. Bank of America, N.A.; and (j) County of Tulare, California v. Bank of America, N.A. The MDL 1950 court denied AGM and AGUS’s motions to dismiss the eleven complaints that were pending as of April 2010. Amended complaints were filed in May 2010. The complaints in these lawsuits generally seek or sought unspecified monetary damages, interest, attorneys’ fees, costs and other expenses. The Company cannot reasonably estimate the possible loss, if any, or range of loss that may arise from the remaining lawsuits.
In May 2010, AGM and AGUS, among other defendants, were named in five additional non-class action cases filed in federal court in California: (a) City of Richmond, California v. Bank of America, N.A. (filed on May 18, 2010, N.D. California); (b) City of Redwood City, California v. Bank of America, N.A. (filed on May 18, 2010, N.D. California); (c) Redevelopment Agency of the City and County of San Francisco, California v. Bank of America, N.A. (filed on May 21, 2010, N.D. California); (d) East Bay Municipal Utility District, California v. Bank of America, N.A. (filed on May 18, 2010, N.D. California); and (e) City of San Jose and the San Jose Redevelopment Agency, California v. Bank of America, N.A (filed on May 18, 2010, N.D. California). These cases have also been transferred to the Southern District of New York and consolidated with MDL 1950 for pretrial proceedings. In September 2010, AGM and AGUS, among other defendants, were named in a sixth additional non-class action filed in federal court in New York, but which alleges violation of New York’s Donnelly Act in addition to federal antitrust law: Active Retirement Community, Inc. d/b/a Jefferson’s Ferry v. Bank of America, N.A. (filed on September 21, 2010, E.D. New York), which has also been transferred to the Southern District of New York and consolidated with MDL 1950 for pretrial proceedings. In December 2010, AGM and AGUS, among other defendants, were named in a seventh additional non-class action filed in federal court in the Central District of California, Los Angeles Unified School District v. Bank of America, N.A., and in an eighth additional non-class action filed in federal court in the Southern District of New York, Kendal on Hudson, Inc. v. Bank of America, N.A. These cases also have been consolidated with MDL 1950 for pretrial proceedings. The complaints in these lawsuits generally seek unspecified monetary damages, interest, attorneys’ fees, costs and other expenses. The Company cannot reasonably estimate the possible loss, if any, or range of loss that may arise from these lawsuits.
In January 2011, AGM and AGUS, among other defendants, were named in an additional non-class action case filed in federal court in New York, which alleges violation of New York’s Donnelly Act in addition to federal antitrust law: Peconic Landing at Southold, Inc. v. Bank of America, N.A. This case has been consolidated with MDL 1950 for pretrial proceedings. The complaint in this lawsuit generally seeks unspecified monetary damages, interest, attorneys’ fees, costs and other expenses. The Company cannot reasonably estimate the possible loss, if any, or range of loss that may arise from this lawsuit.
In September 2009,brought by the Attorney General of the State of West Virginia filed a lawsuit (Circuit Ct. Mason County, W. Va.)and the actions brought by the individual California and New York plaintiffs, and on July 1, 2016 and July 27, 2016, respectively, the MDL 1950 court dismissed with prejudice the claims against Bank of America, N.A. alleging West Virginia state antitrust violationsAssured Guaranty U.S. Holdings and AGM in the municipal derivatives industry, seeking damagesall such actions. Those settlements release all claims as to Assured Guaranty U.S. Holdings, AGMH and alleging, among other things, a conspiracy to fix the pricing of, and manipulate bids for, municipal derivatives, including GICs. An amended complaint in this action was filed in June 2010, adding a federal antitrust claim and naming AGM, (but not AGMH) and AGUS, among other defendants. This case has been removed to federal court as well as transferred to the S.D.N.Y.their parents, subsidiaries and consolidated with MDL 1950 for pretrial proceedings. AGM and AGUS answered West Virginia's Second Amended Complaint on November 11, 2013. The complaint in this lawsuit generally seeks civil penalties, unspecified monetary damages, interest, attorneys’ fees, costs and other expenses. The Company cannot reasonably estimate the possible loss, if any, or range of loss that may arise from this lawsuit.affiliates.
 
16.Long-Term Debt and Credit Facilities
      
Accounting Policy

Long-term debt is recorded at principal amounts net of any unamortized original issue discount or premium and unamortized fair value adjustment for AGMH debt (as of the date of the AGMH acquisition). Discounts and acquisition date fair value adjustments are accreted into interest expense over the life of the applicable debt.

In April 2015, the FASB issued ASU No. 2015-03, Interest - Imputation of Interest(Topic 835-30): Simplifying the Presentation of Debt Issuance Costs, which requires that debt issuance costs related to a recognized debt liability be presented in the balance sheet as a direct deduction from the carrying amount of that debt liability, consistent with debt discounts. Effective December 31, 2015, the Company retrospectively adopted this accounting guidance. Therefore, the Company no

246


longer includes debt issuance costs in assets. The Company early-adopted this guidance effective December 31, 2015 and has retrospectively revised the prior year consolidated balance sheet and long-term debt disclosures. The adoption resulted in the reduction of other assets and long-term debt of $5 million and $6 million as of December 31, 2015 and 2014, respectively.

Long Term Debt

The Company has outstanding long-term debt comprising primarily debt issued by AGUS and AGMH. AGUS has issued 7.0%7% Senior Notes, 5.0%5% Senior Notes and Series A, Enhanced Junior Subordinated Debentures. AGMH has issued 6 7/8% Quarterly Income Bonds Securities (“QUIBS”)(QUIBS), 6.25% Notes and 5.60%5.6% Notes, as well as $300 million Junior Subordinated Debentures. All of such debt is fully and unconditionally guaranteed by AGL; AGL's guarantee of the junior subordinated debentures is on a junior subordinated basis.

Debt Issued by AGUS
 
7.07% Senior Notes.  On May 18, 2004, AGUS issued $$200 million of 7.0% senior notes due 2034 (“7.07% Senior Notes”)Notes due 2034 (7% Senior Notes) for net proceeds of $$197 million. Although the coupon on the Senior Notes is 7.0%7%, the effective rate is approximately 6.4%, taking into account the effect of a cash flow hedge executed by the Company in March 2004.
 
5.0%5% Senior Notes. On June 20, 2014, AGUS issued $500 million of 5.0%5% Senior Notes due 2024 ("5.0%(5% Senior Notes")Notes) for net proceeds of $495 million. The notes are guaranteed by AGL. The net proceeds from the sale of the notes were used for general corporate purposes, including the purchase of AGL common shares.

Series A Enhanced Junior Subordinated Debentures.  On December 20, 2006, AGUS issued $150$150 million of the Debentures due 2066. The Debentures pay a fixed 6.40%6.4% rate of interest until December 15, 2016, and thereafter pay a floating rate of interest, reset quarterly, at a rate equal to three month LIBOR plus a margin equal to 2.38%. AGUS may select at one or more times to defer payment of interest for one or more consecutive periods for up to ten years. Any unpaid interest bears interest at the then applicable rate. AGUS may not defer interest past the maturity date.
 
Debt Issued by AGMH
 
6 7/8% QUIBS.  On December 19, 2001, AGMH issued $$100 million face amount of 6 7/8%8% QUIBS due December 15, 2101, which are callable without premium or penalty.
 
6.25% Notes.  On November 26, 2002, AGMH issued $$230 million face amount of 6.25%6.25% Notes due November 1, 2102, which are callable without premium or penalty in whole or in part.
 
5.605.6% Notes.  On July 31, 2003, AGMH issued $$100 million face amount of 5.60%5.6% Notes due July 15, 2103, which are callable without premium or penalty in whole or in part.
 
Junior Subordinated Debentures.  On November 22, 2006, AGMH issued $$300 million face amount of Junior Subordinated Debentures with a scheduled maturity date of December 15, 2036 and a final repayment date of December 15, 2066. The final repayment date of December 15, 2066 may be automatically extended up to four times in five-year increments provided certain conditions are met. The debentures are redeemable, in whole or in part, at any time prior to December 15, 2036 at their principal amount plus accrued and unpaid interest to the date of redemption or, if greater, the make-whole redemption price. Interest on the debentures will accrue from November 22, 2006 to December 15, 2036 at the annual rate of 6.40%6.4%. If any amount of the debentures remains outstanding after December 15, 2036, then the principal amount of the outstanding debentures will bear interest at a floating interest rate equal to one-month LIBOR plus 2.215% until repaid. AGMH

may elect at one or more times to defer payment of interest on the debentures for one or more consecutive interest periods that do not exceed ten years. In connection with the completion of this offering, AGMH entered into a replacement capital covenant for the benefit of persons that buy, hold or sell a specified series of AGMH long-term indebtedness ranking senior to the debentures. Under the covenant, the debentures will not be repaid, redeemed, repurchased or defeased by AGMH or any of its subsidiaries on or before the date that is 20 years prior to the final repayment date, except to the extent that AGMH has received proceeds from the sale of replacement capital securities. The proceeds from this offering were used to pay a dividend to the shareholders of AGMH.


247


The principal and carrying values of the Company’s long-term debt are presented in the table below.
 
Principal and Carrying Amounts of Debt 

As of December 31, 2015 As of December 31, 2014As of December 31, 2016 As of December 31, 2015
Principal
Carrying
Value

Principal
Carrying
Value
Principal
Carrying
Value

Principal
Carrying
Value
(in millions)(in millions)
AGUS: 


7.0% Senior Notes$200
 $197

$200
 $196
5.0% Senior Notes500
 495
 500
 495
7% Senior Notes$200
 $197

$200
 $197
5% Senior Notes500
 496
 500
 495
Series A Enhanced Junior Subordinated Debentures150
 150

150
 150
150
 150

150
 150
Total AGUS850
 842

850
 841
850
 843

850
 842
AGMH: 


67/8% QUIBS
100
 69

100
 68
100
 69

100
 69
6.25% Notes230
 140

230
 139
230
 141

230
 140
5.60% Notes100
 56

100
 55
5.6% Notes100
 56

100
 56
Junior Subordinated Debentures300
 180

300
 175
300
 187

300
 180
Total AGMH730
 445

730
 437
730
 453

730
 445
AGM: 


Notes Payable12
 13

16
 19
9
 10

12
 13
Total AGM12
 13

16
 19
9
 10

12
 13
Total$1,592
 $1,300

$1,596
 $1,297
$1,589
 $1,306

$1,592
 $1,300


Principal payments due under the long-term debt are as follows:

Expected Maturity Schedule of Debt

Expected Withdrawal Date AGUS AGMH AGM Total AGUS AGMH AGM Total
 (in millions) (in millions)
2016 $
 $
 $4
 $4
2017 
 
 4
 4
 $
 $
 $4
 $4
2018 
 
 2
 2
 
 
 2
 2
2019 
 
 1
 1
 
 
 1
 1
2020 
 
 0
 0
 
 
 1
 1
2021-2040 700
 
 1
 701
2041-2060 


2061-2080 150
 300
 
 450
2021 
 
 0
 0
2022-2041 700
 
 1
 701
2042-2061 


2062-2081 150
 300
 
 450
Thereafter 
 430
 
 430
 
 430
 
 430
Total $850
 $730
 $12
 $1,592
 $850
 $730
 $9
 $1,589


248


Interest Expense

Year Ended December 31,Year Ended December 31,
2015 2014 20132016 2015 2014
(in millions)(in millions)
AGUS: 


7.0% Senior Notes$13
 $13
 $13
5.0% Senior Notes26
 13
 
7% Senior Notes$13
 $13
 $13
5% Senior Notes26
 26
 13
Series A Enhanced Junior Subordinated Debentures10
 10
 10
9
 10
 10
Total AGUS49
 36
 23
48
 49
 36
AGMH: 


67/8% QUIBS
7
 7
 7
7
 7
 7
6.25% Notes16
 16
 16
16
 16
 16
5.60% Notes6
 6
 6
5.6% Notes6
 6
 6
Junior Subordinated Debentures25
 25
 25
25
 25
 25
Total AGMH54
 54
 54
54
 54
 54
AGM: 


Notes Payable(2) 2
 5
0
 (2) 2
Total AGM(2) 2
 5
0
 (2) 2
Total$101
 $92
 $82
$102
 $101
 $92

Recourse Credit Facilities
 
2009 Strip Coverage Facility
 
In connection with the Company's acquisition of AGMH and its subsidiaries from Dexia Holdings Inc., AGM agreed to retain the risks relating to the debt and strip policy portions of the leveraged lease business. The liquidity risk to AGM related to the strip policy portion of the leveraged lease business is mitigated by the strip coverage facility described below.
 
In a leveraged lease transaction, a tax-exempt entity (such as a transit agency) transfers tax benefits to a tax-paying entity by transferring ownership of a depreciable asset, such as subway cars. The tax-exempt entity then leases the asset back from its new owner.
 
If the lease is terminated early, the tax-exempt entity must make an early termination payment to the lessor. A portion of this early termination payment is funded from monies that were pre-funded and invested at the closing of the leveraged lease transaction (along with earnings on those invested funds). The tax-exempt entity is obligated to pay the remaining, unfunded portion of this early termination payment (known as “strip coverage”)the strip coverage) from its own sources. AGM issued financial guaranty insurance policies (known as “strip policies”)strip policies) that guaranteed the payment of these unfunded strip coverage amounts to the lessor, in the event that a tax-exempt entity defaulted on its obligation to pay this portion of its early termination payment. Following such events, AGM can then seek reimbursement of its strip policy payments from the tax-exempt entity, and can also sell the transferred depreciable asset and reimburse itself from the sale proceeds.
 
Currently, all the leveraged lease transactions in which AGM acts as strip coverage provider are breaching a rating trigger related to AGM and are subject to early termination. However, early termination of a lease does not result in a draw on the AGM policy if the tax-exempt entity makes the required termination payment. If all the leases were to terminate early and the tax-exempt entities do not make the required early termination payments, then AGM would be exposed to possible liquidity claims on gross exposure of approximately $1.1 billion$953 million as of December 31, 2015.2016. To date, none of the leveraged lease transactions that involve AGM has experienced an early termination due to a lease default and a claim on the AGM policy. It is difficult to determine the probability that AGM will have to pay strip provider claims or the likely aggregate amount of such claims. At December 31, 2015,2016, approximately $1.4$1.5 billion of cumulative strip par exposure had been terminated since 2008 on a consensual basis. The consensual terminations have resulted in no claims on AGM.
 
On July 1, 2009, AGM and Dexia Crédit Local S.A., acting through its New York Branch (“Dexia(Dexia Crédit Local (NY)), entered into a credit facility (the “StripStrip Coverage Facility”)Facility). Under the Strip Coverage Facility, Dexia Crédit Local

249


(NY) agreed to make loans to AGM to finance all draws made by lessors on AGM strip policies that were outstanding as of November 13, 2008, up to the commitment amount. The commitmentThere have never been any borrowings under the Strip Coverage Facility, the amount of the leveraged leases covered by the Strip Coverage Facility has declined since July 1, 2009 and, to date, none of the leveraged

lease transactions in which AGM acts as the strip coverage provider has experienced an early termination due to a lease default. Consequently, and in view of the credit quality of the relevant tax-exempt entities and the cost of the Strip Coverage Facility, was $1 billion at closing of the Company's acquisition of AGMH. AGM has reduced the maximum commitment amount from time to time, after taking into account its experience with its exposure to leveraged lease transactions. Most recently, as of June 30, 2014, AGM reduced the maximum commitment amount to $495 million and agreed with Dexia Crédit Local (NY)Company determined that the commitment amount would no longer amortize on a scheduled monthly basis.
Fundings under this facility are subject to certain conditions precedent, and their repayment is collateralized by a security interest that AGM granted to Dexia Crédit Local (NY) in amounts that AGM recovers—from the tax-exempt entity, or from asset sale proceeds—following its payment of strip policy claims. On June 30, 2014, AGM and Dexia Crédit Local (NY) agreed to shorten the duration of the facility. Accordingly,maintaining the Strip Coverage Facility will terminate uponwas no longer warranted. On July 29, 2016, the earliest to occur of an AGM change of control,parties terminated the reduction of the commitment amount to $0 in accordance with the terms of the facility, and June 30, 2024 (rather than the original maturity date of January 31, 2042).Strip Coverage Facility.
 
The Strip Coverage Facility’s financial covenants require that AGM and its subsidiaries maintain:
a maximum debt-to-capital ratio of 30%; and

a minimum net worth of 75% of consolidated net worth as of July 1, 2009, plus, beginning June 30, 2015 and on each anniversary of such date, an amount equal to the product of (i) 25% of the aggregate consolidated net income (or loss) for the period beginning July 2, 2009 and ending on June 30, 2014 and (ii) a fraction, the numerator of which is the commitment amount as of the relevant calculation date and the denominator of which is $1 billion.

The Company was in compliance with all financial covenants as of December 31, 2015.

The Strip Coverage Facility contains restrictions on AGM, including, among other things, in respect of its ability to incur debt, permit liens, pay dividends or make distributions, dissolve or become party to a merger or consolidation. Most of these restrictions are subject to exceptions. The Strip Coverage Facility has customary events of default, including (subject to certain materiality thresholds and grace periods) payment default, bankruptcy or insolvency proceedings and cross-default to other debt agreements.

As of December 31, 2015, no amounts were outstanding under this facility, nor have there been any borrowings during the life of this facility.
Intercompany Credit Facility and Intercompany Debt

On October 25, 2013, AGL, as borrower, and AGUS, as lender, entered into a revolving credit facility pursuant to which AGL may, from time to time, borrow for general corporate purposes. Under the credit facility, AGUS committed to lend a principal amount not exceeding $225 million in the aggregate. Such commitment terminates on October 25, 2018 (the “loan termination date”). The unpaid principal amount of each loan will bear interest at a fixed rate equal to 100% of the then applicable Federal short-term or mid-term interest rate, as the case may be, as determined under Internal Revenue Code Sec. 1274(d), and interest on all loans will be computed for the actual number of days elapsed on the basis of a year consisting of 360 days. Accrued interest on all loans will be paid on the last day of each June and December, beginning on December 31, 2013, and at maturity.  AGL must repay the then unpaid principal amounts of the loans by the third anniversary of the loan termination date. No amounts are currently outstanding under the credit facility.

On March 30, 2015, AGUS loaned $200 million to AGC to facilitate the acquisition of Radian Asset on April 1, 2015. AGC repaid the loan in full on April 14, 2015.

In addition, in 2012 AGUS borrowed $90 million from its affiliate AGRO to fund the acquisition of MAC. ThatDuring 2016, AGUS repaid $20 million in outstanding principal as well as accrued and unpaid interest, and the parties agreed to extend the maturity date of the loan remained outstanding asfrom May 2017 to November 2019. As of December 31, 2015.2016, $70 million remained outstanding.


250


Committed Capital Securities

On April 8, 2005, AGC entered into separate agreements (the “Put Agreements”)Put Agreements) with four custodial trusts (each, a “Custodial Trust”)Custodial Trust) pursuant to which AGC may, at its option, cause each of the Custodial Trusts to purchase up to $$50 million of perpetual preferred stock of AGC (the “AGCAGC Preferred Stock”)Stock). The custodial trusts were created as a vehicle for providing capital support to AGC by allowing AGC to obtain immediate access to new capital at its sole discretion at any time through the exercise of the put option. If the put options were exercised, AGC would receive $$200 million in return for the issuance of its own perpetual preferred stock, the proceeds of which may be used for any purpose, including the payment of claims. The put options have not been exercised through the date of this filing.
 
Distributions on the AGC CCS are determined pursuant to an auction process. Beginning on April 7, 2008 this auction process failed, thereby increasing the annualized rate on the AGC CCS to one-month LIBOR plus 250 basis points.
 
In June 2003, $200 million of “AGM CPS”, money market preferred trust securities, were issued by trusts created for the primary purpose of issuing the AGM CPS, investing the proceeds in high-quality commercial paper and selling put options to AGM, allowing AGM to issue the trusts non-cumulative redeemable perpetual preferred stock (the “AGMAGM Preferred Stock”)Stock) of AGM in exchange for cash. There are four trusts, each with an initial aggregate face amount of $50 million. These trusts hold auctions every 28 days, at which time investors submit bid orders to purchase AGM CPS. If AGM were to exercise a put option, the applicable trust would transfer the portion of the proceeds attributable to principal received upon maturity of its assets, net of expenses, to AGM in exchange for AGM Preferred Stock. AGM pays a floating put premium to the trusts, which represents the difference between the commercial paper yield and the winning auction rate (plus all fees and expenses of the trust). If an auction does not attract sufficient clearing bids, however, the auction rate is subject to a maximum rate of one-month LIBOR plus 200 basis points for the next succeeding distribution period. Beginning in August 2007, the AGM CPS required the maximum rate for each of the relevant trusts. AGM continues to have the ability to exercise its put option and cause the related trusts to purchase AGM Preferred Stock. The trusts provide AGM access to new capital at its sole discretion through the exercise of the put options. As of December 31, 20152016 the put option had not been exercised. The Company does not consider itself to be the primary beneficiary of the trusts.

See Note 7, Fair Value Measurement, –Other Assets–Committed Capital Securities, for a fair value measurement discussion.
 

17.Earnings Per Share
 
Accounting Policy

The Company computes EPS using a two-class method by including participating securities which entitle their holders to receive nonforfeitable dividends or dividend equivalents before vesting. Restricted stock awards and share units under the AGC supplemental executive retirement plan ("AGC SERP")(AGC SERP) are considered participating securities as they received non-forfeitable rights to dividends at the same rate as common stock.

The two-class method of computing EPS is an earnings allocation formula that determines EPS for each class of common stock and participating security according to dividends declared (or accumulated) and participation rights in undistributed earnings. Basic EPS is then calculated by dividing net (loss) income available to common shareholders of Assured Guaranty by the weighted‑average number of common shares outstanding during the period. Diluted EPS adjusts basic EPS for the effects of restricted stock, restricted stock units, stock options and other potentially dilutive financial instruments (“dilutive securities”), only in the periods in which such effect is dilutive. The effect of the dilutive securities is reflected in diluted EPS by application of the more dilutive of (1) the treasury stock method or (2) the two-class method assuming nonvested shares are not converted into common shares. The Company has a single class of common stock.


251


Computation of Earnings Per Share 

Year Ended December 31,Year Ended December 31,
2015 2014 20132016 2015 2014
(in millions, except per share amounts)(in millions, except per share amounts)
Basic EPS:          
Net income (loss) attributable to AGL$1,056
 $1,088
 808
$881
 $1,056
 1,088
Less: Distributed and undistributed income (loss) available to nonvested shareholders1
 0
 1
1
 1
 0
Distributed and undistributed income (loss) available to common shareholders of AGL and subsidiaries, basic$1,055
 $1,088
 807
$880
 $1,055
 1,088
Basic shares148.1
 172.6
 186.6
133.0
 148.1
 172.6
Basic EPS$7.12
 $6.30
 $4.32
$6.61
 $7.12
 $6.30
          
Diluted EPS:          
Distributed and undistributed income (loss) available to common shareholders of AGL and subsidiaries, basic$1,055
 $1,088
 $807
$880
 $1,055
 $1,088
Plus: Re-allocation of undistributed income (loss) available to nonvested shareholders of AGL and subsidiaries0
 0
 0
0
 0
 0
Distributed and undistributed income (loss) available to common shareholders of AGL and subsidiaries, diluted$1,055
 $1,088
 $807
$880
 $1,055
 $1,088
          
Basic shares148.1
 172.6
 186.6
133.0
 148.1
 172.6
Dilutive securities0.9
 1.0
 1.0
1.1
 0.9
 1.0
Diluted shares149.0
 173.6
 187.6
134.1
 149.0
 173.6
Diluted EPS$7.08
 $6.26
 $4.30
$6.56
 $7.08
 $6.26
Potentially dilutive securities excluded from computation of EPS because of antidilutive effect0.5
 1.6
 2.7
0.3
 0.5
 1.6


18.Shareholders' Equity
    
Share Issuances

AGL has authorized share capital of $5 million divided into 500,000,000 shares, par value $0.01 per share. Except as described below, AGL's common shares have no preemptive rights or other rights to subscribe for additional common shares, no rights of redemption, conversion or exchange and no sinking fund rights. In the event of liquidation, dissolution or winding-up, the holders of AGL's common shares are entitled to share equally, in proportion to the number of common shares held by such holder, in AGL's assets, if any remain after the payment of all its liabilities and the liquidation preference of any outstanding preferred shares. Under certain circumstances, AGL has the right to purchase all or a portion of the shares held by a shareholder at fair market value. All of the common shares are fully paid and non assessable. Holders of AGL's common shares are entitled to receive dividends as lawfully may be declared from time to time by AGL's Board of Directors.Directors (the Board).

In general, and except as provided below, shareholders have one vote for each common share held by them and are entitled to vote with respect to their fully paid shares at all meetings of shareholders. However, if, and so long as, the common shares (and other of AGL's shares) of a shareholder are treated as "controlled shares" (as determined pursuant to section 958 of the Code) of any U.S. Person and such controlled shares constitute 9.5% or more of the votes conferred by AGL's issued and outstanding shares, the voting rights with respect to the controlled shares owned by such U.S. Person shall be limited, in the aggregate, to a voting power of less than 9.5% of the voting power of all issued and outstanding shares, under a formula specified in AGL's Bye-laws. The formula is applied repeatedly until there is no U.S. Person whose controlled shares constitute 9.5% or more of the voting power of all issued and outstanding shares and who generally would be required to recognize income with respect to AGL under the Code if AGL were a controlled foreign corporation as defined in the Code and if the ownership threshold under the Code were 9.5% (as defined in AGL's Bye-Laws as a "9.5%9.5% U.S. Shareholder")Shareholder).

Subject to AGL's Bye-Laws and Bermuda law, AGL's Board of Directors has the power to issue any of AGL's unissued shares as it determines, including the issuance of any shares or class of shares with preferred, deferred or other special rights.

252

Table of Contents


Under AGL's Bye-Laws and subject to Bermuda law, if AGL's Board of Directors determines that any ownership of AGL's shares may result in adverse tax, legal or regulatory consequences to the Company, any of the Company's subsidiaries or any of its shareholders or indirect holders of shares or its Affiliates (other than such as AGL's Board of Directors considers de minimis), the Company has the option, but not the obligation, to require such shareholder to sell to AGL or to a third party to whom AGL assigns the repurchase right the minimum number of common shares necessary to avoid or cure any such adverse consequences at a price determined in the discretion of the Board of Directors to represent the shares' fair market value (as defined in AGL's Bye-Laws). In addition, AGL's Board of Directors may determine that shares held carry different voting rights when it deems it appropriate to do so to (i) avoid the existence of any 9.5% U.S. Shareholder; and (ii) avoid adverse tax, legal or regulatory consequences to AGL or any of its subsidiaries or any direct or indirect holder of shares or its affiliates. "Controlled shares" includes, among other things, all shares of AGL that such U.S. Person is deemed to own directly, indirectly or constructively (within the meaning of section 958 of the Code). Further, these provisions do not apply in the event one shareholder owns greater than 75% of the voting power of all issued and outstanding shares.

Under these provisions, certain shareholders may have their voting rights limited to less than one vote per share, while other shareholders may have voting rights in excess of one vote per share. Moreover, these provisions could have the effect of reducing the votes of certain shareholders who would not otherwise be subject to the 9.5% limitation by virtue of their direct share ownership. AGL's Bye-laws provide that it will use its best efforts to notify shareholders of their voting interests prior to any vote to be taken by them.

Share Repurchases

AsOn February 22, 2017, the Board authorized an additional $300 million of December 31, 2015,share repurchases, bringing the Company's share repurchase authorization was $55 million. After additional repurchases in 2016, the Company exhausted its previoustotal remaining authorization to repurchase common shares on$407 million as of February 9, 2016. On February 24, 2016, the Board of Directors approved a $250 million share repurchase authorization.23, 2017. The Company expects to repurchase shares from time to time in the open market or in privately negotiated transactions. The timing, form and amount of the share repurchases under the program are at the discretion of management and will depend on a variety of factors, including free funds available at the parent company, market conditions, the Company's capital position, legal requirements and other factors. The repurchase program may be modified, extended or terminated by the Board of Directors at any time. It does not have an expiration date.


Share Repurchases

Year Number of Shares Repurchased 
Total Payments
(in millions)
 Average Price Paid Per Share Number of Shares Repurchased 
Total Payments
(in millions)
 Average Price Paid Per Share
2013 12,512,759
 $264
 $21.12
2014 24,413,781
 $590
 $24.17
 24,413,781
 $590
 $24.17
2015 20,995,419
 $555
 $26.43
 20,995,419
 $555
 $26.43
2016 (through February 9, 2016 on a settlement date basis) 2,258,602
 $55
 $24.37
Cumulative repurchases since the beginning of 2013 60,180,561
 $1,464
 $24.33
2016 10,721,248
 $306
 $28.53
2017 (through February 23, 2017 on a settlement date basis) 3,591,369
 $142
 $39.65
    
The 2013 share repurchases included 5.0 million common shares purchased on June 5, 2013 from funds associated with WL Ross & Co. LLC and its affiliates (collectively, the “WLR Funds”) and Wilbur L. Ross, Jr., a former director of the Company, for $109.7 million.


253

Table of Contents

Deferred Compensation

Each of the Chief Executive Officer and the General Counsel of the Company has elected to invest a portion of his AGL supplemental employee retirement plan ("AGL SERP")SERP account in the employer stock fund within the AGL SERP. Each unit in the employer stock fund represents the right to receive one AGL common share upon a distribution from the AGL SERP. Each unit equals the number of AGL common shares which could have been purchased with the value of the account deemed invested in the employer stock fund as of the date of such election. The election to invest in the employer stock fund is irrevocable (i.e., any portion of a AGL SERP account allocated to the employer stock fund and invested in units shall remain allocated to the employer stock fund until the participant receives a distribution from AGL SERP). At the same time such investment elections were made, the Company purchased AGL common shares and placed such shares in trust to be distributed to the Chief Executive Officer and the General Counsel upon a distribution from the AGL SERP in settlement of their units invested in the employer stock fund. As of December 31, 20152016 and 2014,2015, the Company had 320,193 and 320,193 shares, respectively, in the trust. The Company recorded the purchase of such shares in “deferred equity compensation” in the consolidated balance sheet. As indicated in Note 14, Related Party Transactions, on January 6, 2017, the 320,193 shares were distributed in settlement of the AGL SERP units and therefore, there are no shares remaining in trust.

Certain executives of the Company elected to invest a portion of their AGC SERP accounts in the employer stock fund in the AGC SERP. Each unit in the employer stock fund represents the right to receive one AGL common share upon a distribution from the AGC SERP. Each unit equals the number of AGL common shares which could have been purchased with the value of the account deemed invested in the employer stock fund as of the date of such election. As of December 31, 20152016 and 2014,2015, there were 74,309 and 74,309 units, respectively, in the AGC SERP. See Note 19, Employee Benefit Plans.

Dividends

Any determination to pay cash dividends is at the discretion of the Company's Board, of Directors, and depends upon the Company's results of operations, andcash flows from operating cash flows,activities, its financial position, and capital requirements, general business conditions, legal, tax, regulatory, rating agency and contractual restrictions on the payment of dividends, and any other factors the Company's Board of Directors deems relevant. For more information concerning regulatory constraints that affect the Company's ability to pay dividends, see Note 11, Insurance Company Regulatory Requirements.

On February 24, 2016,22, 2017, the Company declared a quarterly dividend of $0.1425 per common share, an increase of nearly 10% from a quarterly dividend of $0.13 per common share an increase of 8% from a quarterly dividend of $0.12 per common share paid in 2015.2016.

19.Employee Benefit Plans

Accounting Policy

Share-based compensation expense is based on the grant date fair value using the grant date closing price, the lattice, Monte Carlo or Black-Scholes-Merton (“Black-Scholes”)(Black-Scholes) pricing models. The Company amortizes the fair value of share-based awards on a straight-line basis over the requisite service periods of the awards, which are generally the vesting periods, with the exception of retirement‑eligible employees. For retirement-eligible employees, certain awards contain retirement provisions and therefore are amortized over the period through the date the employee first becomes eligible to retire and is no longer required to provide service to earn part or all of the award.

The fair value of each award under the Assured Guaranty Ltd. Employee Stock Purchase Plan is estimated at the beginning of each offering period using the Black-Scholes option valuation model.

The expense for Performance Retention Plan awards is recognized straight-line over the requisite service period, with the exception of retirement eligible employees. For retirement eligible employees, the expense is recognized immediately.

Assured Guaranty Ltd. 2004 Long-Term Incentive Plan

Under the Assured Guaranty Ltd. 2004 Long-Term Incentive Plan, as amended (the “Incentive Plan”)Incentive Plan), the number of AGL common shares that may be delivered under the Incentive Plan may not exceed 18,670,000. In the event of certain transactions affecting AGL's common shares, the number or type of shares subject to the Incentive Plan, the number and type of shares subject to outstanding awards under the Incentive Plan, and the exercise price of awards under the Incentive Plan, may be adjusted.


254

Table of Contents

The Incentive Plan authorizes the grant of incentive stock options, non-qualified stock options, stock appreciation rights, and full value awards that are based on AGL's common shares. The grant of full value awards may be in return for a participant's previously performed services, or in return for the participant surrendering other compensation that may be due, or may be contingent on the achievement of performance or other objectives during a specified period, or may be subject to a risk of forfeiture or other restrictions that will lapse upon the achievement of one or more goals relating to completion of service by the participant, or achievement of performance or other objectives. Awards under the Incentive Plan may accelerate and become vested upon a change in control of AGL.

The Incentive Plan is administered by the Compensation Committee of the Board, of Directors, except as otherwise determined by the Board. The Board may amend or terminate the Incentive Plan. As of December 31, 2015, 10,367,1632016, 10,232,649 common shares were available for grant under the Incentive Plan.

Time Vested Stock Options

Stock options are generally granted once a year with exercise prices equal to the closing price on the date of grant. To date, the Company has only issued non-qualified stock options. All stock options, except for performance stock options, granted to employees vest in equal annual installments over a three-year period and expire seven years or ten years from the date of grant. Stock options granted to directors vest over one year and expire in seven years or ten years from grant date. None of the Company's options, except for performance stock options, have a performance or market condition.

Time Vested Stock Options

Options for
Common Shares
 
Weighted
Average
Exercise Price
 
Number of
Exercisable
Options
 
Options for
Common Shares
 
Weighted
Average
Exercise Price
 
Number of
Exercisable
Options
Balance as of December 31, 20142,802,853
 $21.45
 2,631,653
 
Balance as of December 31, 20152,360,340
 $21.73
 2,275,096
Options granted


Options exercised(432,974) 20.12
 
 (768,212) 24.64
  
Options forfeited/expired(9,539) 20.76
 
 (421,535) 25.50
  
Balance as of December 31, 20152,360,340
 $21.73
 2,275,096
 
Balance as of December 31, 20161,170,593
 $18.43
 1,145,356

As of December 31, 2015,2016, the aggregate intrinsic value and weighted average remaining contractual term of stock options outstanding were $11$23 million and 2.22.3 years, respectively. As of December 31, 2015,2016, the aggregate intrinsic value and weighted average remaining contractual term of exercisable stock options were $11$22 million and 2.12.3 years, respectively.

As of December 31, 20152016 the total unrecognized compensation expense related to outstanding nonvested stock options was $342$27 thousand, which will be adjusted in the future for the difference between estimated and actual forfeitures. The Company expects to recognize that expense over the weighted average remaining service period of 0.90.1 years.


255


Lattice Option Pricing
Weighted Average Assumptions (1)

2014 2013 2014
Dividend yield2.03% 2.07% 2.03%
Expected volatility53.24% 53.41% 53.24%
Risk free interest rate2.21% 1.35% 2.21%
Expected life6.6 years
 6.6 years
 6.6 years
Forfeiture rate3.5% 4.5% 3.5%
Weighted average grant date fair value$10.35
 $8.94
 $10.35
____________________
(1)No options were granted in 2016 and 2015.


The Company uses a lattice model to value its employee and director stock options, rather than a simple Black-Scholes formula. The Black-Scholes approach is designed for options exercisable only at maturity (European style), but can still be used to value options exercisable at any time after they vest (“American style”)(American style) as long as no dividend payments are being made on the stock.  A lattice model can be used for both European and American style options and regardless of whether or not the stock is paying regular dividends. Because the options the Company has granted to its employees and directors are American style and because the Company pays regular dividends on its stock, the Company has selected a lattice model as the appropriate method to value these options.

The expected dividend yield is based on the current expected annual dividend and share price on the grant date. The expected volatility is estimated at the date of grant based on an average of the 7-year historical share price volatility and implied volatilities of certain at-the-money actively traded call options in the Company. The risk-free interest rate is the implied 7-year yield currently available on U.S. Treasury zero-coupon issues at the date of grant. The forfeiture rate is based on the historical employee termination information.

The total intrinsic value of stock options exercised during the years ended December 31, 2016, 2015 and 2014 and 2013 was $2.8$4.6 million, $3.0$2.8 million and $7.5$3.0 million, respectively. During the years ended December 31, 2016, 2015 and 2014, and 2013,$12.0 million, $4.9 million $4.3 million and $2.6$4.3 million, respectively, was received from the exercise of stock options. In order to satisfy stock option exercises, the Company issues new shares.

Performance Stock Options

The Company grants performance stock options under the Incentive Plan. These awards are non-qualified stock options with exercise prices equal to the closing price of an AGL common share on the applicable date of grant. These awards vest 35%, 50% or 100%, if the price of AGL's common shares using the highest 40-day average share price during the relevant three-year performance period reaches certain hurdles. If the share price is between the specified levels, the vesting level will be interpolated accordingly. These awards expire seven years from the date of grant.

Performance Stock Options

Options for
Common Shares
 
Weighted
Average
Exercise Price
 
Number of
Exercisable
Options
 
Options for
Common Shares
 
Weighted
Average
Exercise Price
 
Number of
Exercisable
Options
Balance as of December 31, 2014246,879
 $17.97
 0
 
Balance as of December 31, 2015239,537
 $17.92
 166,897
Options granted


Options exercised(7,342) 17.44
 
 (5,533) 19.08
  
Options forfeited/expired
 
 
 (12,595) 19.24
  
Balance as of December 31, 2015239,537
 $17.92
 166,897
 
Balance as of December 31, 2016221,409
 $17.89
 221,409


256

Table of Contents

As of December 31, 2015,2016, the aggregate intrinsic value and weighted average remaining contractual term of performance stock options outstanding were $1.9$4.4 million and 3.42.4 years, respectively. As of December 31, 2015,2016, the aggregate intrinsic value and weighted average remaining contractual term of exercisable performance stock options were $1.5$4.4 million and 3.12.4 years, respectively.

As of December 31, 2015 the total unrecognized compensation expense related to2016, there was no unexpensed outstanding nonvested performance stock options was $17 thousand, which will be adjusted in the future for the difference between estimated and actual forfeitures. The Company expects to recognize that expense over the weighted average remaining service period of 0.1 years.options.

Monte CarloNo options were granted in 2016, 2015 and Lattice Option Pricing2014.
Weighted Average Assumptions (1)

 2013
Dividend yield2.07%
Expected volatility53.5%
Risk free interest rate1.36%
Expected life6.3 years
Forfeiture rate4.5%
Weighted average grant date fair value$8.17
____________________
(1)No options were granted in neither 2015 nor 2014.

The expected dividend yield is based on the current expected annual dividend and share price on the grant date. The expected volatility is estimated at the date of grant based on an average of the 7-year historical share price volatility and implied volatilities of certain at-the-money actively traded call options in the Company. The risk-free interest rate is the implied 7-year yield currently available on U.S. Treasury zero-coupon issues at the date of grant. The forfeiture rate is based on the historical employee termination information.

The total intrinsic value of performance stock options exercised during the yearyears ended December 31, 2016 and 2015 was $41 thousand and $75 thousand.thousand, respectively. During the yearyears ended December 31, 2016 and 2015, $106 thousand and $98 thousand, respectively, was received from the exercise of performance stock options. In order to satisfy stock option exercises, the Company issues new shares.

Restricted Stock Awards

Restricted stock awards to employees generally vest in equal annual installments over a four-year period and restricted stock awards to outside directors vest in full in one year. Restricted stock awards to employees are amortized on a straight-line basis over the requisite service periods of the awards, and restricted stock awards to outside directors are amortized over one year, which are generally the vesting periods, with the exception of retirement‑eligible employees, discussed above.

Restricted Stock Award Activity

Nonvested Shares 
Number of
Shares
 
Weighted
Average Grant
Date Fair Value
Per Share
 
Number of
Shares
 
Weighted
Average Grant
Date Fair Value
Per Share
Nonvested at December 31, 201443,577
 $23.98
Nonvested at December 31, 2015Nonvested at December 31, 201562,145
 $25.67
GrantedGranted62,145
 25.67
Granted58,858
 25.57
VestedVested(43,577) 23.98
Vested(62,145) 25.67
ForfeitedForfeited
 
Forfeited
 
Nonvested at December 31, 201562,145
 $25.67
Nonvested at December 31, 2016Nonvested at December 31, 201658,858
 $25.57

As of December 31, 20152016 the total unrecognized compensation cost related to outstanding nonvested restricted stock awards was $0.7$0.6 million, which the Company expects to recognize over the weighted‑average remaining service period of 0.50.4 years. The total fair value of shares vested during the years ended December 31, 2016, 2015 and 2014 and 2013 was $1$1.6 million, $1 million and $1 million, respectively.


257

Table of Contents

Restricted Stock Units

Restricted stock units are valued based on the closing price of the underlying shares at the date of grant. Restricted stock units awarded to employees have vesting terms similar to those of the restricted stock awards and are delivered on the vesting date. The Company has granted restricted stock units to directors of the Company. Restricted stock units awarded to directors vestvested over a one-year period and arewere delivered after directors terminate from the board of directors.in January 2017.


Restricted Stock Unit Activity
(Excluding Dividend Equivalents)

Nonvested Stock Units 
Number of
Stock Units
 
Weighted
Average Grant
Date Fair Value
Per Share
 
Number of
Stock Units
 
Weighted
Average Grant
Date Fair Value
Per Share
Nonvested at December 31, 2014691,303
 $19.23
Nonvested at December 31, 2015Nonvested at December 31, 2015689,281
 $23.23
GrantedGranted320,983
 25.23
Granted377,661
 24.51
Delivered(321,210) 16.96
VestedVested(114,701) 20.88
ForfeitedForfeited(1,795) 21.73
Forfeited(6,732) 24.38
Nonvested at December 31, 2015689,281
 $23.23
Nonvested at December 31, 2016Nonvested at December 31, 2016945,509
 $24.01

As of December 31, 2015,2016, the total unrecognized compensation cost related to outstanding nonvested restricted stock units was $8.4$10.8 million, which the Company expects to recognize over the weighted‑average remaining service period of 1.8 years. The total fair value of restricted stock units delivered during the years ended December 31, 2016, 2015 and 2014 and 2013 was $6$2 million, $56 million and $5 million, respectively.

Performance Restricted Stock Units

The Company has granted performance restricted stock units under the Incentive Plan. These awards vest 35%, 50%, 100%, or 200%, if the price of AGL's common shares using the highest 40-day average share price during the relevant three-year performance period reaches certain hurdles. If the share price is between the specified levels, the vesting level will be interpolated accordingly.

Performance Restricted Stock Unit Activity

Performance Restricted Stock Units 
Number of
Performance Share Units
 
Weighted
Average Grant
Date Fair Value
Per Share
 
Number of
Performance Share Units
 
Weighted
Average Grant
Date Fair Value
Per Share
Nonvested at December 31, 2014423,302
 $26.72
Nonvested at December 31, 2015Nonvested at December 31, 2015408,260
 $27.32
GrantedGranted200,353
 28.31
Granted270,612
 25.62
DeliveredDelivered(215,395) 27.39
Delivered(69,437) 29.43
ForfeitedForfeited
 
Forfeited
 
Nonvested at December 31, 2015408,260
 $27.32
Nonvested at December 31, 2016 (1)Nonvested at December 31, 2016 (1)609,435
 $26.22
____________________
(1)Excludes 355,353 performance restricted stock units that have met performance hurdles and will be eligible for vesting after December 31, 2016.


As of December 31, 2015,2016, the total unrecognized compensation cost related to outstanding nonvested performance share units was $5.7$6.8 million, which the Company expects to recognize over the weighted‑average remaining service period of 1.8 years. The total fair value of performance restricted stock units delivered during the yearyears ended December 31, 2016 and 2015 was $2.1 million and $6 million.million, respectively.

Employee Stock Purchase Plan

The Company established the AGL Employee Stock Purchase Plan ("Stock(Stock Purchase Plan")Plan) in accordance with Internal Revenue Code Section 423, and participation is available to all eligible employees. Maximum annual purchases by participants are limited to the number of whole shares that can be purchased by an amount equal to 10% of the participant's compensation or, if less, shares having a value of $$25,000. Participants may purchase shares at a purchase price equal to 85% of the lesser of the fair market value of the stock on the first day or the last day of the subscription period. The Company has reserved for issuance and purchases under the Stock Purchase Plan 600,000 Assured Guaranty Ltd. common shares.


258

Table of Contents

The fair value of each award under the Stock Purchase Plan is estimated at the beginning of each offering period using the Black‑Scholes option‑pricing model and the following assumptions: a) the expected dividend yield is based on the current expected annual dividend and share price on the grant date; b) the expected volatility is estimated at the date of grant based on

the historical share price volatility, calculated on a daily basis; c) the risk-free rate for periods within the contractual life of the option is based on the U.S. Treasury yield curve in effect at the time of grant; and d) the expected life is based on the term of the offering period.

Stock Purchase Plan

Year Ended December 31,Year Ended December 31,
2015 2014 20132016 2015 2014
(dollars in millions)(dollars in millions)
Proceeds from purchase of shares by employees$0.8
 $0.9
 $0.9
$0.9
 $0.8
 $0.9
Number of shares issued by the Company38,565
 43,273
 57,980
39,055
 38,565
 43,273
Recorded in share-based compensation, net of deferral$0.2
 $0.2
 $0.3
$0.2
 $0.2
 $0.2

Share‑Based Compensation Expense

The following table presents stock based compensation costs and the effect of deferring such costs as policy acquisition costs, pre-tax. Amortization of previously deferred stock compensation costs is not shown in the table below.

Share‑Based Compensation Expense Summary

Year Ended December 31,Year Ended December 31,
2015 2014 20132016 2015 2014
(in millions)(in millions)
Share‑based compensation expense$10
 $10
 $8
$13
 $10
 $10
Share‑based compensation capitalized as DAC0.5
 0.3
 0.2
0.4
 0.5
 0.3
Income tax benefit2
 2
 2
3
 2
 2

Defined Contribution Plan

The Company maintains a savings incentive plan, which is qualified under Section 401(a) of the Internal Revenue Code for U.S. employees. The savings incentive plan is available to eligible full-time employees upon hire. Eligible participants could contribute a percentage of their salary subject to a maximum of $18,000 for 2015.2016. Contributions are matched by the Company at a rate of 100% up to 6% of participant's compensation, subject to IRS limitations. Any amounts over the IRS limits are contributed to and matched by the Company into a nonqualified supplemental executive retirement plan for employees eligible to participate in such nonqualified plan. The Company also makes a core contribution of 6% of the participant's compensation to the qualified plan, subject to IRS limitations, and the nonqualified supplemental executive retirement plan for eligible employees, regardless of whether the employee contributes to the plan(s). Employees become fully vested in Company contributions after one year of service, as defined in the plan. Plan eligibility is immediate upon hire. The Company also maintains similar non-qualified plans for non-U.S. employees.

The Company recognized defined contribution expenses of $10$11 million, $11$10 million and $10$11 million for the years ended December 31, 2016, 2015 2014 and 2013,2014, respectively.

Cash-Based Compensation Plans

The Company maintains a Performance Retention Plan (“PRP”)(PRP) that permits the grant of deferred cash based awards to selected employees. Generally, each PRP award is divided into three installments that vest over four years. The cash payment depends on growth in adjusted bookcertain measures of intrinsic value per share and on operatingfinancial return on equity, which are defined in each PRP award agreement. The Company recognized performance retention plan expenses of $12 million, $11 million and $15 million and $17 million for the years ended December 31, 2016, 2015 2014 and 2013,2014, respectively.


259

Table of Contents

The Company’s executive officers are eligible to receive compensation under a non-equity incentive plan. The amount of compensation payable is subject to a performance goal being met. The Compensation Committee then uses discretion to determine the actual amount of cash incentive compensation payable to each executive officer for such performance year based on factors and criteria as determined by the Compensation Committee, provided that such discretion cannot be used to increase

the amount that was determined to be payable to each executive officer. For an applicable performance year, the Compensation Committee establishes target financial performance measures for the Company and individual non-financial objectives for the executive officers. Most employees other than executive officers are eligible to receive discretionary bonuses.

20.Other Comprehensive Income
 
The following tables present the changes in each component of AOCI and the effect of significant reclassifications out of AOCI on the respective line items in net income.
 
Changes in Accumulated Other Comprehensive Income by Component
Year Ended December 31, 2016

 
Net Unrealized
Gains (Losses) on
Investments with no Other-Than-Temporary Impairment
 
Net Unrealized
Gains (Losses) on
Investments with Other-Than-Temporary Impairment
 
Cumulative
Translation
Adjustment
 Cash Flow Hedge 
Total Accumulated
Other
Comprehensive
Income
 (in millions)
Balance, December 31, 2015$260
 $(15) $(16) $8
 $237
Other comprehensive income (loss) before reclassifications(71) (9) (23) 
 (103)
Amounts reclassified from AOCI to:         
Net realized investment gains (losses)(23) 52
 
 
 29
Net investment income(3) 
 
 
 (3)
Interest expense
 
 
 (1) (1)
Total before tax(26) 52
 
 (1) 25
Tax (provision) benefit8
 (18) 
 0
 (10)
Total amount reclassified from AOCI, net of tax(18) 34
 
 (1) 15
Net current period other comprehensive income (loss)(89) 25
 (23) (1) (88)
Balance, December 31, 2016$171
 $10
 $(39) $7
 $149


Changes in Accumulated Other Comprehensive Income by Component
Year Ended December 31, 2015

 
Net Unrealized
Gains (Losses) on
Investments with no Other-Than-Temporary Impairment
 
Net Unrealized
Gains (Losses) on
Investments with Other-Than-Temporary Impairment
 
Cumulative
Translation
Adjustment
 Cash Flow Hedge 
Total Accumulated
Other
Comprehensive
Income
 (in millions)
Balance, December 31, 2014$367
 $4
 $(10) $9
 $370
Other comprehensive income (loss) before reclassifications(93) (43) (6) 
 (142)
Amounts reclassified from AOCI to:         
Net realized investment gains (losses)(11) 37
 
 
 26
Net investment income(9) 
 
 
 (9)
Interest expense
 
 
 (1) (1)
Total before tax(20) 37
 
 (1) 16
Tax (provision) benefit6
 (13) 
 0
 (7)
Total amount reclassified from AOCI, net of tax(14) 24
 
 (1) 9
Net current period other comprehensive income (loss)(107) (19) (6) (1) (133)
Balance, December 31, 2015$260
 $(15) $(16) $8
 $237


260

Table of Contents

Changes in Accumulated Other Comprehensive Income by Component
Year Ended December 31, 2014

 
Net Unrealized
Gains (Losses) on
Investments with no Other-Than-Temporary Impairment
 
Net Unrealized
Gains (Losses) on
Investments with Other-Than-Temporary Impairment
 
Cumulative
Translation
Adjustment
 Cash Flow Hedge 
Total Accumulated
Other
Comprehensive
Income
 (in millions)
Balance, December 31, 2013$178
 $(24) $(3) $9
 $160
Other comprehensive income (loss) before reclassifications196
 (20) (7) 
 169
Amounts reclassified from AOCI to:         
Net realized investment gains (losses)(12) 74
 
 
 62
Interest expense
 
 
 0
 0
Total before tax(12) 74
 
 0
 62
Tax (provision) benefit5
 (26) 
 0
 (21)
Total amount reclassified from AOCI, net of tax(7) 48
 
 0
 41
Net current period other comprehensive income (loss)189
 28
 (7) 0
 210
Balance, December 31, 2014$367
 $4
 $(10) $9
 $370


Changes in Accumulated Other Comprehensive Income by Component
Year Ended December 31, 2013

 
Net Unrealized
Gains (Losses) on
Investments with no Other-Than-Temporary Impairment
 
Net Unrealized
Gains (Losses) on
Investments with Other-Than-Temporary Impairment
 
Cumulative
Translation
Adjustment
 Cash Flow Hedge 
Total Accumulated
Other
Comprehensive
Income
 (in millions)
Balance, December 31, 2012$517
 $(5) $(6) $9
 $515
Other comprehensive income (loss) before reclassifications(309) (35) 3
 
 (341)
Amounts reclassified from AOCI to:         
Net realized investment gains (losses)(43) 24
 
 
 (19)
Interest expense
 
 
 (1) (1)
Total before tax(43) 24
 
 (1) (20)
Tax (provision) benefit13
 (8) 
 1
 6
Total amount reclassified from AOCI, net of tax(30) 16
 
 0
 (14)
Net current period other comprehensive income (loss)(339) (19) 3
 0
 (355)
Balance, December 31, 2013$178
 $(24) $(3) $9
 $160


261

Table of Contents

21.Subsidiary Information
 
The following tables present the condensed consolidating financial information for AGUS and AGMH, 100%-owned subsidiaries of AGL, which have issued publicly traded debt securities (see Note 16, Long Term Debt and Credit Facilities). The information for AGL, AGUS and AGMH presents its subsidiaries on the equity method of accounting.

CONDENSED CONSOLIDATING BALANCE SHEET
AS OF DECEMBER 31, 2016
(in millions)

262

 
Assured
Guaranty Ltd.
(Parent)
 
AGUS
(Issuer)
 
AGMH
(Issuer)
 
Other
Entities
 
Consolidating
Adjustments
 
Assured
Guaranty Ltd.
(Consolidated)
ASSETS 


Total investment portfolio and cash$36
 $384
 $22
 $11,029
 $(368) $11,103
Investment in subsidiaries6,164
 5,696
 3,734
 296
 (15,890) 
Premiums receivable, net of commissions payable
 
 
 699
 (123) 576
Ceded unearned premium reserve
 
 
 1,099
 (893) 206
Deferred acquisition costs
 
 
 156
 (50) 106
Reinsurance recoverable on unpaid losses
 
 
 484
 (404) 80
Credit derivative assets
 
 
 69
 (56) 13
Deferred tax asset, net
 16
 
 597
 (116) 497
Intercompany receivable
 
 
 70
 (70) 
Financial guaranty variable interest entities’ assets, at fair value
 
 
 876
 
 876
Dividend receivable from affiliate300


 (300) 
Other11
 78
 26
 801
 (222) 694
TOTAL ASSETS$6,511
 $6,174
 $3,782
 $16,176
 $(18,492) $14,151
LIABILITIES AND SHAREHOLDERS’ EQUITY 


Unearned premium reserves
 
 
 4,488
 (977) 3,511
Loss and LAE reserve
 
 
 1,596
 (469) 1,127
Long-term debt
 843
 453
 10
 
 1,306
Intercompany payable
 70
 
 300
 (370) 
Credit derivative liabilities
 
 
 458
 (56) 402
Deferred tax liabilities, net
 
 88
 
 (88) 
Financial guaranty variable interest entities’ liabilities, at fair value
 
 
 958
 
 958
Dividend payable to affiliate
 300
 
 
 (300) 
Other7
 3
 14
 665
 (346) 343
TOTAL LIABILITIES7
 1,216
 555
 8,475
 (2,606) 7,647
TOTAL SHAREHOLDERS’ EQUITY ATTRIBUTABLE TO ASSURED GUARANTY LTD.6,504
 4,958
 3,227
 7,405
 (15,590) 6,504
Noncontrolling interest
 
 
 296
 (296) 
TOTAL SHAREHOLDERS’ EQUITY6,504
 4,958
 3,227
 7,701
 (15,886) 6,504
TOTAL LIABILITIES AND SHAREHOLDERS’ EQUITY$6,511
 $6,174
 $3,782
 $16,176
 $(18,492) $14,151
Table of Contents


CONDENSED CONSOLIDATING BALANCE SHEET
AS OF DECEMBER 31, 2015
(in millions)

 
Assured
Guaranty Ltd.
(Parent)
 
AGUS
(Issuer)
 
AGMH
(Issuer)
 
Other
Entities
 
Consolidating
Adjustments
 
Assured
Guaranty Ltd.
(Consolidated)
ASSETS 


Total investment portfolio and cash$10
 $156
 $22
 $11,530
 $(360) $11,358
Investment in subsidiaries5,961
 5,569
 4,081
 377
 (15,988) 
Premiums receivable, net of commissions payable
 
 
 833
 (140) 693
Ceded unearned premium reserve
 
 
 1,266
 (1,034) 232
Deferred acquisition costs
 
 
 176
 (62) 114
Reinsurance recoverable on unpaid losses
 
 
 467
 (398) 69
Credit derivative assets
 
 
 207
 (126) 81
Deferred tax asset, net
 52
 
 357
 (133) 276
Intercompany receivable
 
 
 90
 (90) 
Financial guaranty variable interest entities’ assets, at fair value
 
 
 1,261
 
 1,261
Other98
 29
 26
 571
 (264) 460
TOTAL ASSETS$6,069
 $5,806
 $4,129
 $17,135
 $(18,595) $14,544
LIABILITIES AND SHAREHOLDERS’ EQUITY 


Unearned premium reserves$
 $
 $
 $5,143
 $(1,147) $3,996
Loss and LAE reserve
 
 
 1,537
 (470) 1,067
Long-term debt
 842
 445
 13
 
 1,300
Intercompany payable
 90
 
 300
 (390) 
Credit derivative liabilities
 
 
 572
 (126) 446
Deferred tax liabilities, net
 
 91
 
 (91) 
Financial guaranty variable interest entities’ liabilities, at fair value
 
 
 1,349
 
 1,349
Other6
 82
 15
 622
 (402) 323
TOTAL LIABILITIES6
 1,014
 551
 9,536
 (2,626) 8,481
TOTAL SHAREHOLDERS’ EQUITY ATTRIBUTABLE TO ASSURED GUARANTY LTD.6,063
 4,792
 3,578
 7,222
 (15,592) 6,063
Noncontrolling interest
 
 
 377
 (377) 
TOTAL SHAREHOLDERS’ EQUITY6,063
 4,792
 3,578
 7,599
 (15,969) 6,063
TOTAL LIABILITIES AND SHAREHOLDERS’ EQUITY$6,069
 $5,806
 $4,129
 $17,135
 $(18,595) $14,544

263

Table of Contents

CONDENSED CONSOLIDATING BALANCE SHEET
AS OF DECEMBER 31, 2014
(in millions)
Assured
Guaranty Ltd.
(Parent)
 
AGUS
(Issuer)
 
AGMH
(Issuer)
 
Other
Entities
 
Consolidating
Adjustments
 
Assured
Guaranty Ltd.
(Consolidated)
Assured
Guaranty Ltd.
(Parent)
 
AGUS
(Issuer)
 
AGMH
(Issuer)
 
Other
Entities
 
Consolidating
Adjustments
 
Assured
Guaranty Ltd.
(Consolidated)
ASSETS 


Total investment portfolio and cash$126
 $204
 $47
 $11,382
 $(300) $11,459
$10
 $156
 $22
 $11,530
 $(360) $11,358
Investment in subsidiaries5,612
 5,072
 3,965
 339
 (14,988) 
5,961
 5,569
 4,081
 377
 (15,988) 
Premiums receivable, net of commissions payable
 
 
 864
 (135) 729


 833
 (140) 693
Ceded unearned premium reserve
 
 
 1,469
 (1,088) 381


 1,266
 (1,034) 232
Deferred acquisition costs
 
 
 186
 (65) 121


 176
 (62) 114
Reinsurance recoverable on unpaid losses
 
 
 338
 (260) 78


 467
 (398) 69
Credit derivative assets
 
 
 277
 (209) 68


 207
 (126) 81
Deferred tax asset, net
 54
 
 295
 (89) 260

 52
 
 357
 (133) 276
Intercompany receivable
 
 
 90
 (90) 


 90
 (90) 
Financial guaranty variable interest entities’ assets, at fair value
 
 
 1,402
 
 1,402


 1,261
 
 1,261
Dividend receivable from affiliate69


 69
Other27
 71
 27
 538
 (242) 421
29
 29
 26
 571
 (264) 391
TOTAL ASSETS$5,765
 $5,401
 $4,039
 $17,180
 $(17,466) $14,919
$6,069
 $5,806
 $4,129
 $17,135
 $(18,595) $14,544
LIABILITIES AND SHAREHOLDERS’ EQUITY 


Unearned premium reserves$
 $
 $
 $5,328
 $(1,067) $4,261


 5,143
 (1,147) 3,996
Loss and LAE reserve
 
 
 1,066
 (267) 799


 1,537
 (470) 1,067
Long-term debt
 841
 437
 19
 
 1,297

 842
 445
 13
 
 1,300
Intercompany payable
 90
 
 300
 (390) 

 90
 
 300
 (390) 
Credit derivative liabilities
 
 
 1,172
 (209) 963


 572
 (126) 446
Deferred tax liabilities, net
 
 94
 
 (94) 

 
 91
 
 (91) 
Financial guaranty variable interest entities’ liabilities, at fair value
 
 
 1,419
 
 1,419


 1,349
 
 1,349
Dividend payable to affiliate
 69


 69
Other7
 9
 16
 764
 (374) 422
6
 13
 15
 622
 (402) 254
TOTAL LIABILITIES7
 940
 547
 10,068
 (2,401) 9,161
6
 1,014
 551
 9,536
 (2,626) 8,481
TOTAL SHAREHOLDERS’ EQUITY ATTRIBUTABLE TO ASSURED GUARANTY LTD.5,758
 4,461
 3,492
 6,773
 (14,726) 5,758
6,063
 4,792
 3,578
 7,222
 (15,592) 6,063
Noncontrolling interest
 
 
 339
 (339) 


 377
 (377) 
TOTAL SHAREHOLDERS’ EQUITY5,758
 4,461
 3,492
 7,112
 (15,065) 5,758
6,063
 4,792
 3,578
 7,599
 (15,969) 6,063
TOTAL LIABILITIES AND SHAREHOLDERS’ EQUITY$5,765
 $5,401
 $4,039
 $17,180
 $(17,466) $14,919
$6,069
 $5,806
 $4,129
 $17,135
 $(18,595) $14,544


264


CONDENSED CONSOLIDATING STATEMENT OF OPERATIONS
AND COMPREHENSIVE INCOME
FOR THE YEAR ENDED DECEMBER 31, 2016
(in millions)

 
Assured
Guaranty Ltd.
(Parent)
 
AGUS
(Issuer)
 
AGMH
(Issuer)
 
Other
Entities
 
Consolidating
Adjustments
 
Assured
Guaranty Ltd.
(Consolidated)
REVENUES 


Net earned premiums$
 $
 $
 $892
 $(28) $864
Net investment income0
 0
 0
 412
 (4) 408
Net realized investment gains (losses)0
 2
 0
 (28) (3) (29)
Net change in fair value of credit derivatives: 


Realized gains (losses) and other settlements
 
 
 29
 0
 29
Net unrealized gains (losses)
 
 
 69
 
 69
Net change in fair value of credit derivatives
 
 
 98
 
 98
Bargain purchase gain and settlement of pre-existing relationships
 
 
 257
 2
 259
Other0
 
 
 78
 (1) 77
TOTAL REVENUES0
 2
 0
 1,709
 (34) 1,677
EXPENSES 


Loss and LAE
 
 
 296
 (1) 295
Amortization of deferred acquisition costs
 
 
 30
 (12) 18
Interest expense
 52
 54
 10
 (14) 102
Other operating expenses29
 2
 2
 217
 (5) 245
TOTAL EXPENSES29
 54
 56
 553
 (32) 660
INCOME (LOSS) BEFORE INCOME TAXES AND EQUITY IN NET EARNINGS OF SUBSIDIARIES(29) (52) (56) 1,156
 (2) 1,017
Total (provision) benefit for income taxes
 18
 20
 (175) 1
 (136)
Equity in net earnings of subsidiaries910
 794
 274
 44
 (2,022) 
NET INCOME (LOSS)881
 760
 238
 1,025
 (2,023) 881
Less: noncontrolling interest
 
 
 44
 (44) 
NET INCOME (LOSS) ATTRIBUTABLE TO ASSURED GUARANTY LTD.$881
 $760
 $238
 $981
 $(1,979) $881
            
COMPREHENSIVE INCOME (LOSS)$793
 $685
 $163
 $953
 $(1,801) $793


CONDENSED CONSOLIDATING STATEMENT OF OPERATIONS
AND COMPREHENSIVE INCOME
FOR THE YEAR ENDED DECEMBER 31, 2015
(in millions)

Assured
Guaranty Ltd.
(Parent)
 
AGUS
(Issuer)
 
AGMH
(Issuer)
 
Other
Entities
 
Consolidating
Adjustments
 
Assured
Guaranty Ltd.
(Consolidated)
Assured
Guaranty Ltd.
(Parent)
 
AGUS
(Issuer)
 
AGMH
(Issuer)
 
Other
Entities
 
Consolidating
Adjustments
 
Assured
Guaranty Ltd.
(Consolidated)
REVENUES 


Net earned premiums$
 $
 $
 $783
 $(17) $766
$
 $
 $
 $783
 $(17) $766
Net investment income0
 1
 0
 432
 (10) 423
0
 1
 0
 432
 (10) 423
Net realized investment gains (losses)0
 0
 1
 (19) (8) (26)0
 0
 1
 (19) (8) (26)
Net change in fair value of credit derivatives: 


Realized gains (losses) and other settlements
 
 
 (18) 0
 (18)
 
 
 (18) 0
 (18)
Net unrealized gains (losses)
 
 
 773
 (27) 746


 773
 (27) 746
Net change in fair value of credit derivatives
 
 
 755
 (27) 728


 755
 (27) 728
Bargain purchase gain and settlement of pre-existing relationships
 
 
 54
 160
 214


 54
 160
 214
Other0
 0
 
 102
 0
 102

 0
 
 102
 0
 102
TOTAL REVENUES0
 1
 1
 2,107
 98
 2,207
0
 1
 1
 2,107
 98
 2,207
EXPENSES 


Loss and LAE
 
 
 434
 (10) 424


 434
 (10) 424
Amortization of deferred acquisition costs
 
 
 29
 (9) 20


 29
 (9) 20
Interest expense
 52
 54
 14
 (19) 101

 52
 54
 14
 (19) 101
Other operating expenses30
 1
 1
 202
 (3) 231
30
 1
 1
 202
 (3) 231
TOTAL EXPENSES30
 53
 55
 679
 (41) 776
30
 53
 55
 679
 (41) 776
INCOME (LOSS) BEFORE INCOME TAXES AND EQUITY IN NET EARNINGS OF SUBSIDIARIES(30) (52) (54) 1,428
 139
 1,431
(30) (52) (54) 1,428
 139
 1,431
Total (provision) benefit for income taxes
 18
 19
 (365) (47) (375)
 18
 19
 (365) (47) (375)
Equity in net earnings of subsidiaries1,086
 923
 468
 39
 (2,516) 
1,086
 923
 468
 39
 (2,516) 
NET INCOME (LOSS)1,056
 889
 433
 1,102
 (2,424) 1,056
1,056
 889
 433
 1,102
 (2,424) 1,056
Less: noncontrolling interest
 
 
 39
 (39) 


 39
 (39) 
NET INCOME (LOSS) ATTRIBUTABLE TO ASSURED GUARANTY LTD.$1,056
 $889
 $433
 $1,063
 $(2,385) $1,056
$1,056
 $889
 $433
 $1,063
 $(2,385) $1,056
                      
COMPREHENSIVE INCOME (LOSS)$923
 $787
 $359
 $967
 $(2,113) $923
$923
 $787
 $359
 $967
 $(2,113) $923


265

Table of Contents

CONDENSED CONSOLIDATING STATEMENT OF OPERATIONS
AND COMPREHENSIVE INCOME
FOR THE YEAR ENDED DECEMBER 31, 2014
(in millions)

 
Assured
Guaranty Ltd.
(Parent)
 
AGUS
(Issuer)
 
AGMH
(Issuer)
 
Other
Entities
 
Consolidating
Adjustments
 
Assured
Guaranty Ltd.
(Consolidated)
REVENUES 


Net earned premiums$
 $
 $
 $566
 $4
 $570
Net investment income0
 0
 1
 412
 (10) 403
Net realized investment gains (losses)0
 0
 0
 (58) (2) (60)
Net change in fair value of credit derivatives: 


Realized gains (losses) and other settlements
 
 
 23
 
 23
Net unrealized gains (losses)
 
 
 800
 
 800
Net change in fair value of credit derivatives
 
 
 823
 
 823
Other
 
 
 259
 (1) 258
TOTAL REVENUES0
 0
 1
 2,002
 (9) 1,994
EXPENSES 


Loss and LAE
 
 
 122
 4
 126
Amortization of deferred acquisition costs
 
 
 33
 (8) 25
Interest expense
 40
 54
 16
 (18) 92
Other operating expenses31
 1
 1
 195
 (8) 220
TOTAL EXPENSES31
 41
 55
 366
 (30) 463
INCOME (LOSS) BEFORE INCOME TAXES AND EQUITY IN NET EARNINGS OF SUBSIDIARIES(31) (41) (54) 1,636
 21
 1,531
Total (provision) benefit for income taxes
 14
 19
 (469) (7) (443)
Equity in net earnings of subsidiaries1,119
 983
 513
 32
 (2,647) 
NET INCOME (LOSS)1,088
 956
 478
 1,199
 (2,633) 1,088
Less: noncontrolling interest
 
 
 32
 (32) 
NET INCOME (LOSS) ATTRIBUTABLE TO ASSURED GUARANTY LTD.$1,088
 $956
 $478
 $1,167
 $(2,601) $1,088
            
COMPREHENSIVE INCOME (LOSS)$1,298
 $1,114
 $577
 $1,570
 $(3,261) $1,298


266

Table of Contents

CONDENSED CONSOLIDATING STATEMENT OF OPERATIONS
AND COMPREHENSIVE INCOME
FOR THE YEAR ENDED DECEMBER 31, 2013
(in millions)

 
Assured
Guaranty Ltd.
(Parent)
 
AGUS
(Issuer)
 
AGMH
(Issuer)
 
Other
Entities
 
Consolidating
Adjustments
 
Assured
Guaranty Ltd.
(Consolidated)
REVENUES 


Net earned premiums$
 $
 $
 $740
 $12
 $752
Net investment income0
 0
 1
 408
 (16) 393
Net realized investment gains (losses)0
 0
 0
 87
 (35) 52
Net change in fair value of credit derivatives: 


Realized gains (losses) and other settlements
 
 
 (42) 
 (42)
Net unrealized gains (losses)
 
 
 107
 
 107
Net change in fair value of credit derivatives
 
 
 65
 
 65
Other
 
 
 348
 (2) 346
TOTAL REVENUES0
 0
 1
 1,648
 (41) 1,608
EXPENSES 


Loss and LAE
 
 
 144
 10
 154
Amortization of deferred acquisition costs
 
 
 12
 0
 12
Interest expense
 28
 54
 20
 (20) 82
Other operating expenses22
 1
 1
 199
 (5) 218
TOTAL EXPENSES22
 29
 55
 375
 (15) 466
INCOME (LOSS) BEFORE INCOME TAXES AND EQUITY IN NET EARNINGS OF SUBSIDIARIES(22) (29) (54) 1,273
 (26) 1,142
Total (provision) benefit for income taxes
 9
 17
 (387) 27
 (334)
Equity in net earnings of subsidiaries830
 768
 701
 19
 (2,318) 
NET INCOME (LOSS)808
 748
 664
 905
 (2,317) 808
Less: noncontrolling interest
 
 
 19
 (19) 
NET INCOME (LOSS) ATTRIBUTABLE TO ASSURED GUARANTY LTD.$808
 $748
 $664
 $886
 $(2,298) $808
            
COMPREHENSIVE INCOME (LOSS)$453
 $522
 $515
 $309
 $(1,346) $453


267

Table of Contents

CONDENSED CONSOLIDATING STATEMENT OF CASH FLOWS
FOR THE YEAR ENDED DECEMBER 31, 2016
(in millions)
 
Assured
Guaranty Ltd.
(Parent)
 
AGUS
(Issuer)
 
AGMH
(Issuer)
 
Other
Entities
 
Consolidating
Adjustments
 
Assured
Guaranty Ltd.
(Consolidated)
Net cash flows provided by (used in) operating activities$390
 $533
 $213
 $64
 $(1,341) $(141)
Cash flows from investing activities 


Fixed-maturity securities: 


Purchases(4) (143) (10) (1,489) 
 (1,646)
Sales4
 24
 12
 1,325
 
 1,365
Maturities
 30
 
 1,125
 
 1,155
Sales (purchases) of short-term investments, net(26) (237) (10) 290
 
 17
Net proceeds from financial guaranty variable entities’ assets
 
 
 629
 
 629
Intercompany debt
 
 
 20
 (20) 
Proceeds from stock redemption and return of capital from subsidiaries
 
 300
 4
 (304) 
Acquisition of CIFG, net of cash acquired
 
 
 (442) 7
 (435)
Other
 7
 
 (9) (7) (9)
Net cash flows provided by (used in) investing activities(26) (319) 292
 1,453
 (324) 1,076
Cash flows from financing activities 


Return of capital
 
 
 (4) 4
 
Dividends paid(69) (288) (513) (540) 1,341
 (69)
Repurchases of common stock(306) 
 
 (300) 300
 (306)
Share activity under option and incentive plans11
 
 
 (1) 
 10
Net paydowns of financial guaranty variable entities’ liabilities
 
 
 (611) 
 (611)
Payment of long-term debt
 
 
 (2) 
 (2)
Intercompany debt
 (20) 
 
 20
 
Net cash flows provided by (used in) financing activities(364) (308) (513) (1,458) 1,665
 (978)
Effect of exchange rate changes
 
 
 (5) 
 (5)
Increase (decrease) in cash
 (94) (8) 54
 
 (48)
Cash at beginning of period0
 95
 8
 63
 
 166
Cash at end of period$0
 $1
 $0
 $117
 $
 $118

CONDENSED CONSOLIDATING STATEMENT OF CASH FLOWS
FOR THE YEAR ENDED DECEMBER 31, 2015
(in millions)
 
Assured
Guaranty Ltd.
(Parent)
 
AGUS
(Issuer)
 
AGMH
(Issuer)
 
Other
Entities
 
Consolidating
Adjustments
 
Assured
Guaranty Ltd.
(Consolidated)
Assured
Guaranty Ltd.
(Parent)
 
AGUS
(Issuer)
 
AGMH
(Issuer)
 
Other
Entities
 
Consolidating
Adjustments
 
Assured
Guaranty Ltd.
(Consolidated)
Net cash flows provided by (used in) operating activities$513
 $408
 $185
 $52
 $(1,210) $(52)$513
 $408
 $185
 $52
 $(1,210) $(52)
Cash flows from investing activities 


Fixed-maturity securities: 


Purchases
 (72) (21) (2,550) 66
 (2,577)
 (72) (21) (2,550) 66
 (2,577)
Sales
 177
 30
 1,900
 
 2,107

 177
 30
 1,900
 
 2,107
Maturities
 9
 
 889
 
 898

 9
 
 889
 
 898
Sales (purchases) of short-term investments, net116
 33
 19
 729
 
 897
116
 33
 19
 729
 
 897
Net proceeds from financial guaranty variable entities’ assets
 
 
 400
 
 400


 400
 
 400
Intercompany debt


Investment in subsidiary
 
 25
 
 (25) 
Proceeds from repayment of surplus notes
 
 25
 
 (25) 
Acquisition of Radian Asset, net of cash acquired
 
 
 (800) 
 (800)
 
 
 (800) 
 (800)
Other
 (5) 
 74
 
 69

 (5) 
 74
 
 69
Net cash flows provided by (used in) investing activities116
 142
 53
 642
 41
 994
116
 142
 53
 642
 41
 994
Cash flows from financing activities 


Return of capital
 
 
 (25) 25


 (25) 25
 
Capital contribution from parent


Dividends paid(72) (455) (234) (455) 1,144
 (72)(72) (455) (234) (455) 1,144
 (72)
Repurchases of common stock(555) 


 (555)(555) 


 (555)
Share activity under option and incentive plans(2) 


 (2)(2) 


 (2)
Net paydowns of financial guaranty variable entities’ liabilities
 
 
 (214) 
 (214)
 
 
 (214) 
 (214)
Net proceeds from issuance of long-term debt


Payment of long-term debt
 
 
 (4) 
 (4)
 
 
 (4) 
 (4)
Intercompany debt


Net cash flows provided by (used in) financing activities(629) (455) (234) (698) 1,169
 (847)(629) (455) (234) (698) 1,169
 (847)
Effect of exchange rate changes
 
 
 (4) 
 (4)
 
 
 (4) 
 (4)
Increase (decrease) in cash
 95
 4
 (8) 
 91

 95
 4
 (8) 
 91
Cash at beginning of period0
 0
 4
 71
 
 75
0
 0
 4
 71
 
 75
Cash at end of period$0
 $95
 $8
 $63
 $
 $166
$0
 $95
 $8
 $63
 $
 $166


268


CONDENSED CONSOLIDATING STATEMENT OF CASH FLOWS
FOR THE YEAR ENDED DECEMBER 31, 2014
(in millions)
 
 
Assured
Guaranty Ltd.
(Parent)
 
AGUS
(Issuer)
 
AGMH
(Issuer)
 
Other
Entities
 
Consolidating
Adjustments
 
Assured
Guaranty Ltd.
(Consolidated)
Net cash flows provided by (used in) operating activities$758
 $223
 $144
 $663
 $(1,211) $577
Cash flows from investing activities 


Fixed-maturity securities: 


Purchases
 (540) (8) (2,253) 
 (2,801)
Sales
 464
 10
 777
 
 1,251
Maturities
 6
 1
 870
 
 877
Sales (purchases) of short-term investments, net(93) (15) (3) 269
 
 158
Net proceeds from financial guaranty variable entities’ assets
 
 
 408
 
 408
Intercompany debt


Investment in subsidiary
 
 50
 
 (50) 
Other
 
 
 11
 
 11
Net cash flows provided by (used in) investing activities(93) (85) 50
 82
 (50) (96)
Cash flows from financing activities 


Return of capital
 
 
 (50) 50
 
Capital contribution from parent


Dividends paid(76) (700) (190) (321)��1,211
 (76)
Repurchases of common stock(590) 


 (590)
Share activity under option and incentive plans1


 1
Net paydowns of financial guaranty variable entities’ liabilities
 
 
 (396) 
 (396)
Net proceeds from issuance of long-term debt
 495


 495
Payment of long-term debt
 
 
 (19) 
 (19)
Intercompany debt


Net cash flows provided by (used in) financing activities(665) (205) (190) (786) 1,261
 (585)
Effect of exchange rate changes
 
 
 (5) 
 (5)
Increase (decrease) in cash
 (67) 4
 (46) 
 (109)
Cash at beginning of period0
 67
 0
 117
 
 184
Cash at end of period$0
 $0
 $4
 $71
 $
 $75


269


CONDENSED CONSOLIDATING STATEMENT OF CASH FLOWS
FOR THE YEAR ENDED DECEMBER 31, 2013
(in millions)
Assured
Guaranty Ltd.
(Parent)
 
AGUS
(Issuer)
 
AGMH
(Issuer)
 
Other
Entities
 
Consolidating
Adjustments
 
Assured
Guaranty Ltd.
(Consolidated)
Assured
Guaranty Ltd.
(Parent)
 
AGUS
(Issuer)
 
AGMH
(Issuer)
 
Other
Entities
 
Consolidating
Adjustments
 
Assured
Guaranty Ltd.
(Consolidated)
Net cash flows provided by (used in) operating activities$128
 $178
 $133
 $347
 $(542) $244
$758
 $223
 $144
 $663
 $(1,211) $577
Cash flows from investing activities 


Fixed-maturity securities: 


Purchases
 (93) (26) (1,832) 65
 (1,886)
 (540) (8) (2,253) 
 (2,801)
Sales176
 1
 25
 892
 (65) 1,029

 464
 10
 777
 
 1,251
Maturities29
 3
 2
 849
 
 883

 6
 1
 870
 
 877
Sales (purchases) of short-term investments, net7
 (28) (15) (51) 
 (87)(93) (15) (3) 269
 
 158
Net proceeds from financial guaranty variable entities’ assets
 
 
 663
 
 663


 408
 
 408
Intercompany debt
 
 
 7
 (7) 
Investment in subsidiary
 0
 49
 
 (49) 
Proceeds from repayment of surplus notes
 
 50
 
 (50) 
Other
 
 
 79
 
 79


 11
 
 11
Net cash flows provided by (used in) investing activities212
 (117) 35
 607
 (56) 681
(93) (85) 50
 82
 (50) (96)
Cash flows from financing activities 


Return of capital
 
 
 (50) 50


 (50) 50
 
Capital contribution from parent
 
 
 1
 (1) 
Dividends paid(75) 
 (168) (374) 542
 (75)(76) (700) (190) (321) 1,211
 (76)
Repurchases of common stock(264) 


 (264)(590) 


 (590)
Share activity under option and incentive plans(1) 


 (1)1


 1
Net paydowns of financial guaranty variable entities’ liabilities
 
 
 (511) 
 (511)
 
 
 (396) 
 (396)
Net proceeds from issuance of long-term debt
 495


 495
Payment of long-term debt
 
 
 (27) 
 (27)
 
 
 (19) 
 (19)
Intercompany debt
 (7) 
 
 7
 
Net cash flows provided by (used in) financing activities(340) (7) (168) (961) 598
 (878)(665) (205) (190) (786) 1,261
 (585)
Effect of exchange rate changes
 
 
 (1) 
 (1)
 
 
 (5) 
 (5)
Increase (decrease) in cash0
 54
 
 (8) 
 46

 (67) 4
 (46) 
 (109)
Cash at beginning of period
 13
 0
 125
 
 138
0
 67
 0
 117
 
 184
Cash at end of period$0
 $67
 $0
 $117
 $
 $184
$0
 $0
 $4
 $71
 $
 $75


270


22.Quarterly Financial Information (Unaudited)

A summary of selected quarterly information follows:

2015 
First
Quarter
 
Second
Quarter
 
Third
Quarter
 
Fourth
Quarter
 
Full
Year
2016 
First
Quarter
 
Second
Quarter
 
Third
Quarter
 
Fourth
Quarter
 
Full
Year
(dollars in millions, except per share data) (dollars in millions, except per share data)
RevenuesRevenues         Revenues         
Net earned premiums Net earned premiums$142
 $219
 $213
 $192
 $766
Net earned premiums$183
 $214
 $231
 $236
 $864
Net investment income Net investment income101
 98
 112
 112
 423
Net investment income99
 98
 94
 117
 408
Net realized investment gains (losses) Net realized investment gains (losses)16
 (9) (27) (6) (26) Net realized investment gains (losses)(13) 10
 (2) (24) (29)
Net change in fair value of credit derivatives Net change in fair value of credit derivatives124
 90
 86
 428
 728
Net change in fair value of credit derivatives(60) 63
 21
 74
 98
Fair value gains (losses) on CCS Fair value gains (losses) on CCS2
 23
 (15) 17
 27
Fair value gains (losses) on CCS(16) (11) (23) 50
 0
Fair value gains (losses) on FG VIEs Fair value gains (losses) on FG VIEs(7) 5
 2
 38
 38
Fair value gains (losses) on FG VIEs18
 4
 (11) 27
 38
Bargain purchase gain and settlement of pre-existing relationshipsBargain purchase gain and settlement of pre-existing relationships
 214
 
 
 214
Bargain purchase gain and settlement of pre-existing relationships
 
 259
 
 259
Other income (loss) Other income (loss)(9) 55
 (3) (6) 37
Other income (loss)34
 18
 (3) (10) 39
ExpensesExpenses         Expenses         
Loss and LAE Loss and LAE18
 188
 112
 106
 424
Loss and LAE90
 102
 (9) 112
 295
Amortization of DAC Amortization of DAC4
 6
 5
 5
 20
Amortization of DAC4
 5
 4
 5
 18
Interest expense Interest expense25
 26
 25
 25
 101
Interest expense26
 25
 26
 25
 102
Other operating expenses Other operating expenses56
 66
 54
 55
 231
Other operating expenses60
 63
 65
 57
 245
Income (loss) before provision for income taxesIncome (loss) before provision for income taxes266
 409
 172
 584
 1,431
Income (loss) before provision for income taxes65
 201
 480
 271
 1,017
Provision (benefit) for income taxesProvision (benefit) for income taxes65
 112
 43
 155
 375
Provision (benefit) for income taxes6
 55
 1
 74
 136
Net income (loss)Net income (loss)201
 297
 129
 429
 1,056
Net income (loss)59
 146
 479
 197
 881
Earnings (loss) per share(1):Earnings (loss) per share(1):         Earnings (loss) per share(1):         
Basic Basic$1.29
 $1.97
 $0.88
 $3.05
 $7.12
Basic$0.43
 $1.09
 $3.63
 $1.51
 $6.61
Diluted Diluted$1.28
 $1.96
 $0.88
 $3.03
 $7.08
Diluted$0.43
 $1.09
 $3.60
 $1.49
 $6.56
Dividends per shareDividends per share$0.12
 $0.12
 $0.12
 $0.12
 $0.48
Dividends per share$0.13
 $0.13
 $0.13
 $0.13
 $0.52


271


2014 
First
Quarter
 
Second
Quarter
 
Third
Quarter
 
Fourth
Quarter
 
Full
Year
2015 
First
Quarter
 
Second
Quarter
 
Third
Quarter
 
Fourth
Quarter
 
Full
Year
(dollars in millions, except per share data) (dollars in millions, except per share data)
RevenuesRevenues         Revenues         
Net earned premiums Net earned premiums$132
 $136
 $144
 $158
 $570
Net earned premiums$142
 $219
 $213
 $192
 $766
Net investment income Net investment income103
 96
 102
 102
 403
Net investment income101
 98
 112
 112
 423
Net realized investment gains (losses) Net realized investment gains (losses)2
 (8) (19) (35) (60) Net realized investment gains (losses)16
 (9) (27) (6) (26)
Net change in fair value of credit derivatives Net change in fair value of credit derivatives(211) 103
 255
 676
 823
Net change in fair value of credit derivatives124
 90
 86
 428
 728
Fair value gains (losses) on CCS Fair value gains (losses) on CCS(9) (6) 4
 
 (11) Fair value gains (losses) on CCS2
 23
 (15) 17
 27
Fair value gains (losses) on FG VIEs Fair value gains (losses) on FG VIEs157
 25
 50
 23
 255
Fair value gains (losses) on FG VIEs(7) 5
 2
 38
 38
Bargain purchase gain and settlement of pre-existing relationshipsBargain purchase gain and settlement of pre-existing relationships


Bargain purchase gain and settlement of pre-existing relationships
 214
 
 
 214
Other income (loss) Other income (loss)21
 7
 (11) (3) 14
Other income (loss)(9) 55
 (3) (6) 37
ExpensesExpenses         Expenses         
Loss and LAE Loss and LAE41
 57
 (44) 72
 126
Loss and LAE18
 188
 112
 106
 424
Amortization of DAC Amortization of DAC5
 3
 4
 13
 25
Amortization of DAC4
 6
 5
 5
 20
Interest expense Interest expense20
 20
 27
 25
 92
Interest expense25
 26
 25
 25
 101
Other operating expenses Other operating expenses60
 55
 50
 55
 220
Other operating expenses56
 66
 54
 55
 231
Income (loss) before provision for income taxesIncome (loss) before provision for income taxes69
 218
 488
 756
 1,531
Income (loss) before provision for income taxes266
 409
 172
 584
 1,431
Provision (benefit) for income taxesProvision (benefit) for income taxes27
 59
 133
 224
 443
Provision (benefit) for income taxes65
 112
 43
 155
 375
Net income (loss)Net income (loss)42
 159
 355
 532
 1,088
Net income (loss)201
 297
 129
 429
 1,056
Earnings (loss) per share(1):Earnings (loss) per share(1):         Earnings (loss) per share(1):         
Basic Basic$0.23
 $0.89
 $2.10
 $3.30
 $6.30
Basic$1.29
 $1.97
 $0.88
 $3.05
 $7.12
Diluted Diluted$0.23
 $0.89
 $2.09
 $3.28
 $6.26
Diluted$1.28
 $1.96
 $0.88
 $3.03
 $7.08
Dividends per shareDividends per share$0.11
 $0.11
 $0.11
 $0.11
 $0.44
Dividends per share$0.12
 $0.12
 $0.12
 $0.12
 $0.48
____________________
(1)Per share amounts for the quarters and the full years have each been calculated separately. Accordingly, quarterly amounts may not sum up to the annual amounts because of differences in the average common shares outstanding during each period and, with regard to diluted per share amounts only, because of the inclusion of the effect of potentially dilutive securities only in the periods in which such effect would have been dilutive.


ITEM 9.CHANGES IN AND DISAGREEMENTS WITH ACCOUNTANTS ON ACCOUNTING AND FINANCIAL DISCLOSURE

None.

ITEM 9A.CONTROLS AND PROCEDURES

Disclosure Controls and Procedures

Assured Guaranty's management, with the participation of Assured Guaranty Ltd.'s President and Chief Executive Officer and Chief Financial Officer, has evaluated the effectiveness of Assured Guaranty Ltd.'s disclosure controls and procedures (as such term is defined in Rules 13a 15(e) and 15d 15(e) under the Securities Exchange Act of 1934, as amended (the “Exchange Act”)Exchange Act)) as of the end of the period covered by this report. Based on this evaluation, Assured Guaranty Ltd.'s President and Chief Executive Officer and Chief Financial Officer have concluded that, as of the end of such period, Assured Guaranty Ltd.'s disclosure controls and procedures are effective in recording, processing, summarizing and reporting, on a timely basis, information required to be disclosed by Assured Guaranty Ltd. (including its consolidated subsidiaries) in the reports that it files or submits under the Exchange Act.

There has been no change in the Company's internal controls over financial reporting during the Company's quarter ended December 31, 2015,2016, that has materially affected, or is reasonably likely to materially affect, the Company's internal controls over financial reporting.

272

Table of Contents

Management's Report on Internal Control over Financial Reporting

The management of Assured Guaranty Ltd. is responsible for establishing and maintaining adequate internal control over financial reporting, as such term is defined in Exchange Act Rule 13a-15(f). Internal control over financial reporting is a process designed by, or under the supervision of the Company's President and Chief Executive Officer and Chief Financial Officer to provide reasonable assurance regarding the reliability of financial reporting and the preparation of the Company's consolidated financial statements for external purposes in accordance with accounting principles generally accepted in the United States of America.

Because of inherent limitations, internal control over financial reporting may not prevent or detect misstatements. Projections of any evaluation of effectiveness to future periods are subject to the risks that controls may become inadequate because of changes in conditions, or that the degree of compliance with the policies or procedures may deteriorate.
On AprilJuly 1, 20152016, the Company acquired Radian Asset.CIFG Holding Inc. and its subsidiaries. See Note 2, Acquisition of Radian Asset Assurance Inc., of thePart II, Item 8, Financial Statements and Supplementary Data, Note 2, Acquisitions, for additional information.Theinformation. The Company has extended its Section 404 compliance program under the Sarbanes-Oxley Act of 2002 and the applicable rules and regulations under such Act to include Radian Asset. The Company integrated Radian Asset’sthe integration of CIFG Holding Inc. and its subsidiaries' financial data into the Company’s existing systems, processes and related controls, and introducedas well as the new processes and controls to accommodate the business combination accounting and financial consolidation of Radian Asset.CIFG Holding Inc. and its subsidiaries.
Management of the Company has assessed the effectiveness of the Company's internal control over financial reporting as of December 31, 20152016 using the criteria set forth by the Committee of Sponsoring Organizations of the Treadway Commission (COSO) in the 2013 Internal Control-Integrated Framework. Based on this evaluation, management concluded that the Company's internal control over financial reporting was effective as of December 31, 20152016 based on criteria in the 2013 Internal Control- Integrated Framework issued by the COSO.

The effectiveness of the Company's internal control over financial reporting as of December 31, 20152016 has been audited by PricewaterhouseCoopers LLP, an independent registered public accounting firm, as stated in their "Report of Independent Registered Public Accounting Firm" included in Part II, Item 8.8, Financial Statements and Supplementary Data.

ITEM 9B.OTHER INFORMATION

None.

273

Table of Contents


PART III

ITEM 10.DIRECTORS, EXECUTIVE OFFICERS AND CORPORATE GOVERNANCE
 
Information pertaining to this item is incorporated by reference to the sections entitled “Proposal No. 1: Election of Directors”, “Corporate Governance—Did Our Insiders Comply with Section 16(a) Beneficial Ownership Reporting in 2015?2016?”, “Corporate Governance—How Are Directors nominated?” and “Corporate Governance—The Committees of the Board—The Audit Committee” of the definitive proxy statement for the Annual General Meeting of Shareholders, which involves the election of directors and will be filed with the SEC not later than 120 days after the close of the fiscal year pursuant to regulation 14A.

Information about the executive officers of AGL is set forth at the end of Part I of this Form 10-K and is hereby incorporated by reference.

Code of Conduct

The Company has adopted a Code of Conduct, which sets forth standards by which all employees, officers and directors of the Company must abide as they work for the Company. The Code of Conduct is available at www.assuredguaranty.com/governance. The Company intends to disclose on its internet site any amendments to, or waivers from, its Code of Conduct that are required to be publicly disclosed pursuant to the rules of the SEC or the New York Stock Exchange.

ITEM 11.EXECUTIVE COMPENSATION

This item is incorporated by reference to the sections entitled “Executive Compensation”, “Corporate Governance—Compensation Committee interlocking and insider participation” and “Corporate Governance—How are the directors compensated?” of the definitive proxy statement for the Annual General Meeting of Shareholders, which will be filed with the SEC not later than 120 days after the close of the fiscal year pursuant to regulation 14A.

ITEM 12.SECURITY OWNERSHIP OF CERTAIN BENEFICIAL OWNERS AND MANAGEMENT AND RELATED STOCKHOLDER MATTERS

This item is incorporated by reference to the sections entitled "Information about our Common Share Ownership" and "Equity Compensation Plans Information" of the definitive proxy statement for the Annual General Meeting of Shareholders, which will be filed with the SEC not later than 120 days after the close of the fiscal year pursuant to regulation 14A.

ITEM 13.CERTAIN RELATIONSHIPS AND RELATED TRANSACTIONS, AND DIRECTOR INDEPENDENCE

This item is incorporated by reference to the sections entitled “Corporate Governance—What is our related person transactions approval policy and what procedures do we use to implement it?”, “Corporate Governance—What related person transactions do we have?” and “Corporate Governance—Director independence” of the definitive proxy statement for the Annual General Meeting of Shareholders, which will be filed with the SEC not later than 120 days after the close of the fiscal year pursuant to regulation 14A.


ITEM 14.PRINCIPAL ACCOUNTING FEES AND SERVICES

This item is incorporated by reference to the section entitled “Proposal No. 3:4: Appointment of Independent Auditors—Independent Auditor Fee Information” and “Proposal No. 3:4: Appointment of Independent Auditors—Pre-Approval Policy of Audit and Non-Audit Services” of the definitive proxy statement for the Annual General Meeting of Shareholders, which will be filed with the SEC not later than 120 days after the close of the fiscal year pursuant to regulation 14A.

274

Table of Contents

PART IV


ITEM 15.EXHIBITS, FINANCIAL STATEMENT SCHEDULES

(a)Financial Statements, Financial Statement Schedules and Exhibits

1.Financial Statements

The following financial statements of Assured Guaranty Ltd. have been included in Part II, Item 8, Financial Statements and Supplementary Data, hereof:


2.    Financial Statement Schedules

The financial statement schedules are omitted because they are not applicable or the required information is shown in the consolidated financial statements or notes thereto.

3.    Exhibits*


Exhibit
Number
Description of Document
3.1Certificate of Incorporation and Memorandum of Association of the Registrant, as amended by Certificate of Incorporation on Change of Name dated March 30, 2004 and Certificate of Deposit of Memorandum of Increase of Capital dated April 21, 2004 (Incorporated by reference to Exhibit 3.1 to Form 10-K for the year ended December 31, 2009)
3.2First Amended and Restated Bye-laws of the Registrant, as amended (Incorporated by reference to Exhibit 3.1 to Form 8-K filed on May 10, 2011)
4.1Specimen Common Share Certificate (Incorporated by reference to Exhibit 4.1 to Form S-1 (#333-111491))
4.2Certificate of Incorporation and Memorandum of Association of the Registrant, as amended by Certificate of Incorporation on Change of Name dated March 30, 2004 and Certificate of Deposit of Memorandum of Increase of Capital dated April 21, 2004 (See Exhibit 3.1)
4.3Bye-laws of the Registrant (See Exhibit 3.2)
4.4Indenture, dated as of May 1, 2004, among the Company, Assured Guaranty U.S. Holdings Inc. and The Bank of New York, as trustee (Incorporated by reference to Exhibit 4.1 to Form 10-Q for the quarter ended March 31, 2004)
4.5Indenture, dated as of December 1, 2006, entered into among Assured Guaranty Ltd., Assured Guaranty U.S. Holdings Inc. and The Bank of New York, as trustee (Incorporated by reference to Exhibit 4.1 to Form 8-K filed on December 20, 2006)
4.6First Supplemental Subordinated Indenture, dated as of December 20, 2006, entered into among Assured Guaranty Ltd., Assured Guaranty U.S. Holdings Inc. and The Bank of New York, as trustee (Incorporated by reference to Exhibit 4.2 to Form 8-K filed on December 20, 2006)
4.7Replacement Capital Covenant, dated as of December 20, 2006, between Assured Guaranty U.S. Holdings Inc. and Assured Guaranty Ltd., in favor of and for the benefit of each Covered Debtholder (as defined therein) (Incorporated by reference to Exhibit 4.1 to Form 8-K filed on December 20, 2006)
4.8Amended and Restated Trust Indenture dated as of February 24, 1999 between Financial Security Assurance Holdings Ltd. and the Senior Debt Trustee (Incorporated by reference to Exhibit 4.1 to Financial Security Assurance Holdings Ltd.'s Registration Statement to Form S-3 (#333-74165))

275


Exhibit
Number
Description of Document
4.9
Form of Assured Guaranty Municipal Holdings Inc., formerly known as Financial Security Assurance Holdings Ltd. 67/8% Quarterly Interest Bond Securities due 2101 (Incorporated by reference to Exhibit 4.1 to Form 10-Q for the quarter ended March 31, 2010)
4.10Form of Assured Guaranty Municipal Holdings Inc., formerly known as Financial Security Assurance Holdings Ltd. 6.25% Notes due November 1, 2102 (Incorporated by reference to Exhibit 4.2 to Form 10-Q for the quarter ended March 31, 2010)
4.11Form of Assured Guaranty Municipal Holdings Inc., formerly known as Financial Security Assurance Holdings Ltd. 5.60% Notes due July 15, 2103 (Incorporated by reference to Exhibit 4.3 to Form 10-Q for the quarter ended March 31, 2010)
4.12Supplemental indenture, dated as of August 26, 2009, between Assured Guaranty Ltd., Financial Security Assurance Holdings Ltd. and U.S. Bank National Association, as trustee (Incorporated by reference to Exhibit 99.1 to Form 8-K filed on September 1, 2009)
4.13Indenture, dated as of November 22, 2006, between Financial Security Assurance Holdings Ltd. and The Bank of New York, as Trustee (Incorporated by reference to Exhibit 4.1 to Financial Security Assurance Holdings Ltd.'s Form 8-K filed on November 28, 2006)
4.14Form of Financial Security Assurance Holdings Ltd. Junior Subordinated Debenture, Series 2006-1 (Incorporated by reference to Exhibit 10.3 to Financial Security Assurance Holdings Ltd.'s Form 8-K filed on November 25, 2002)
4.15Supplemental indenture, dated as of August 26, 2009, between Assured Guaranty Ltd., Financial Security Assurance Holdings Ltd. and The Bank of New York Mellon, as trustee (Incorporated by reference to Exhibit 99.2 to Form 8-K filed on September 1, 2009)
4.16First Supplemental Indenture, to be dated as of June 24, 2009, between Assured Guaranty USU.S. Holdings Inc., Assured Guaranty Ltd. and The Bank of New York Mellon, as trustee (including the form of 8.50% Senior Note due 2014 of Assured Guaranty USU.S. Holdings Inc.) (Incorporated by reference to Exhibit 4.1 to Form 8-K filed on June 23, 2009)
4.17Officers’ Certificate, dated June 20, 2014, related to 5.000% Senior Notes due 2024, containing form of 5.000% Senior Notes due 2024 as Exhibit A thereto (Incorporated by reference to Exhibit 4.1 to Form 8-K filed on June 20, 2014)
10.1Guaranty by Assured Guaranty Re Ltd. in favor of Assured Guaranty Re Overseas Ltd., amended and restated as of May 1, 2014 (Incorporated by reference to Exhibit 10.1 to Form 10-Q for the quarter ended June 30, 2014)
10.2Put Agreement between Assured Guaranty Corp. and Woodbourne Capital Trust [I][II][III][IV] (Incorporated by reference to Exhibit 10.6 to Form 10-Q for the quarter ended March 31, 2005)
10.3Custodial Trust Expense Reimbursement Agreement (Incorporated by reference to Exhibit 10.7 to Form 10-Q for the quarter ended March 31, 2005)
10.4Assured Guaranty Corp. Articles Supplementary Classifying and Designating Series of Preferred Stock as Series A Perpetual Preferred Stock, Series B Perpetual Preferred Stock, Series C Perpetual Preferred Stock, Series D Perpetual Preferred Stock (Incorporated by reference to Exhibit 10.8 to Form 10-Q for the quarter ended March 31, 2005)
10.5Purchase Agreement among Dexia Holdings Inc., Dexia Crédit Local S.A. and the Company dated as of November 14, 2008 (Incorporated by reference to Exhibit 99.1 to Form 8-K filed on November 17, 2008)
10.6Amended and Restated Revolving Credit Agreement dated as of June 30, 2009 among FSA Asset Management LLC, Dexia Crédit Local S.A. and Dexia Bank Belgium S.A. (Incorporated by reference to Exhibit 10.1 to Form 8-K filed on July 8, 2009)
 10.7First Amendment to Amended and Restated Revolving Credit Agreement dated as of September 20, 2010 among FSA Asset Management LLC, Dexia Crédit Local S.A. and Dexia Bank Belgium S.A. (Incorporated by reference to Exhibit 10.11 to Form 10-K for the year ended December 31, 2013)
10.8Second Amendment to Amended and Restated Revolving Credit Agreement dated as of May 16, 2012 among FSA Asset Management LLC, Dexia Crédit Local S.A. and Dexia Bank Belgium S.A. (Incorporated by reference to Exhibit 10.12 to Form 10-K for the year ended December 31, 2013)
10.9Assignment Pursuant to the Amended and Restated Revolving Credit Agreement, as amended, dated as of December 12, 2013 between Belfius Bank SA/NV and Dexia Crédit Local S.A. (Incorporated by reference to Exhibit 10.13 to Form 10-K for the year ended December 31, 2013)
10.10Master Repurchase Agreement (September 1996 Version) dated as of June 30, 2009 between Dexia Crédit Local S.A. and FSA Asset Management LLC (Incorporated by reference to Exhibit 10.2.1 to Form 8-K filed on July 8, 2009)

276


Exhibit
Number
Description of Document
10.11Annex I-Committed Term Repurchase Agreement Annex dated as of June 30, 2009 between Dexia Crédit Local S.A. and FSA Asset Management LLC (Incorporated by reference to Exhibit 10.2.2 to Form 8-K filed on July 8, 2009)
10.12ISDA Master Agreement (Multicurrency-Cross Border) dated as of June 30, 2009 among Dexia SA, Dexia Crédit Local S.A. and FSA Asset Management LLC (Incorporated by reference to Exhibit 10.3.1 to Form 8-K filed on July 8, 2009)

10.13

Exhibit
Number
Description of Document
10.11Schedule to the 1992 Master Agreement, Guaranteed Put Contract, dated as of June 30, 2009 among Dexia Crédit Local S.A., Dexia SA and FSA Asset Management LLC (Incorporated by reference to Exhibit 10.3.2 to Form 8-K filed on July 8, 2009)
10.1410.12Put Option Confirmation, Guaranteed Put Contract, dated June 30, 2009 to FSA Asset Management LLC from Dexia SA and Dexia Crédit Local S.A. (Incorporated by reference to Exhibit 10.3.3 to Form 8-K filed on July 8, 2009)
10.1510.13ISDA Credit Support Annex (New York Law) to the Schedule to the ISDA Master Agreement, Guaranteed Put Contract, dated as of June 30, 2009 between Dexia Crédit Local S.A. and Dexia SA and FSA Asset Management LLC (Incorporated by reference to Exhibit 10.3.4 to Form 8-K filed on July 8, 2009)
10.1610.14ISDA Master Agreement (Multicurrency-Cross Border) dated as of June 30, 2009 among Dexia SA, Dexia Crédit Local S.A. and FSA Asset Management LLC (Incorporated by reference to Exhibit 10.4.1 to Form 8-K filed on July 8, 2009)
10.1710.15Schedule to the 1992 Master Agreement, Non-Guaranteed Put Contract, dated as of June 30, 2009 among Dexia Crédit Local S.A., Dexia SA and FSA Asset Management LLC (Incorporated by reference to Exhibit 10.4.2 to Form 8-K filed on July 8, 2009)
10.1810.16Put Option Confirmation, Non-Guaranteed Put Contract, dated June 30, 2009 to FSA Asset Management LLC from Dexia SA and Dexia Crédit Local S.A. (Incorporated by reference to Exhibit 10.4.3 to Form 8-K filed on July 8, 2009)
10.1910.17ISDA Credit Support Annex (New York Law) to the Schedule to the ISDA Master Agreement, Non-Guaranteed Put Contract, dated as of June 30, 2009 between Dexia Crédit Local S.A. and Dexia SA and FSA Asset Management LLC (Incorporated by reference to Exhibit 10.4.4 to Form 8-K filed on July 8, 2009)
10.2010.18First Demand Guarantee Relating to the “Financial Products” Portfolio of FSA Asset Management LLC issued by the Belgian State and the French State and executed as of June 30, 2009 (Incorporated by reference to Exhibit 10.5 to Form 8-K filed on July 8, 2009)
10.2110.19Guaranty, dated as of June 30, 2009, made jointly and severally by Dexia SA and Dexia Crédit Local S.A., in favor of Financial Security Assurance Inc. (Incorporated by reference to Exhibit 10.6 to Form 8-K filed on July 8, 2009)
10.2210.20Indemnification Agreement (GIC Business) dated as of June 30, 2009 by and among Financial Security Assurance Inc., Dexia Crédit Local S.A. and Dexia SA (Incorporated by reference to Exhibit 10.7 to Form 8-K filed on July 8, 2009)
10.2310.21Pledge and Administration Agreement, dated as of June 30, 2009, among Dexia SA, Dexia Crédit Local S.A., Dexia Bank Belgium SA, Dexia FP Holdings Inc., Financial Security Assurance Inc., FSA Asset Management LLC, FSA Portfolio Asset Limited, FSA Capital Markets Services LLC, FSA Capital Markets Services (Caymans) Ltd., FSA Capital Management Services LLC and The Bank of New York Mellon Trust Company, National Association (Incorporated by reference to Exhibit 10.8 to Form 8-K filed on July 8, 2009)
10.2410.22Separation Agreement, dated as of July 1, 2009, among Dexia Crédit Local S.A., Financial Security Assurance Inc., Financial Security Assurance International, Ltd., FSA Global Funding Limited and Premier International Funding Co. (Incorporated by reference to Exhibit 10.9 to Form 8-K filed on July 8, 2009)
10.2510.23Funding Guaranty, dated as of July 1, 2009, made by Dexia Crédit Local S.A. in favor of Financial Security Assurance Inc. and Financial Security Assurance International, Ltd. (Incorporated by reference to Exhibit 10.10 to Form 8-K filed on July 8, 2009)
10.2610.24Reimbursement Guaranty, dated as of July 1, 2009, made by Dexia Crédit Local S.A. in favor of Financial Security Assurance Inc. and Financial Security Assurance International, Ltd. (Incorporated by reference to Exhibit 10.11 to Form 8-K filed on July 8, 2009)
10.27Amended and Restated Strip Coverage Liquidity and Security Agreement, dated as of July 1, 2009, between Assured Guaranty Municipal Corp. and Dexia Crédit Local S.A. (Incorporated by reference to Exhibit 10.31 to Form 10-K for the year ended December 31, 2013)
10.28First Amendment to Amended and Restated Strip Coverage Liquidity and Security Agreement, dated as of June 30, 2014, between Assured Guaranty Municipal Corp. and Dexia Crédit Local S.A. (Incorporated by reference to Exhibit 10.6 to Form 10-Q for the quarter ended June 30, 2014)

277


Exhibit
Number
Description of Document
10.2910.25Indemnification Agreement (FSA Global Business), dated as of July 1, 2009, by and between Financial Security Assurance Inc., Assured Guaranty Ltd. and Dexia Crédit Local S.A. (Incorporated by reference to Exhibit 10.13 to Form 8-K filed on July 8, 2009)
10.3010.26Pledge and Administration Annex Amendment Agreement dated as of July 1, 2009 among Dexia SA, Dexia Crédit Local S.A., Dexia Bank Belgium SA, Dexia FP Holdings Inc., Financial Security Assurance Inc., FSA Asset Management LLC, FSA Portfolio Asset Limited, FSA Capital Markets Services LLC, FSA Capital Markets Services (Caymans) Ltd., FSA Capital Management Services LLC and The Bank of New York Mellon Trust Company, National Association (Incorporated by reference to Exhibit 10.14 to Form 8-K filed on July 8, 2009)
10.3110.27Put Confirmation Annex Amendment Agreement dated as of July 1, 2009 among Dexia SA and Dexia Crédit Local S.A. and FSA Asset Management LLC and Financial Security Assurance Inc. (Incorporated by reference to Exhibit 10.15 to Form 8-K filed on July 8, 2009)

10.32

Exhibit
Number
Description of Document
10.28Master Repurchase Agreement between FSA Capital Management Services LLC and FSA Capital Markets Services LLC (Incorporated by reference to Exhibit 10.20 to Form 10-Q for the quarter ended June 30, 2009)
10.3310.29Confirmation to Master Repurchase Agreement (Incorporated by reference to Exhibit 10.21 to Form 10-Q for the quarter ended June 30, 2009)
10.3410.30Master Repurchase Agreement Annex I (Incorporated by reference to Exhibit 10.22 to Form 10-Q for the quarter ended June 30, 2009)
10.3510.31Pledge and Intercreditor Agreement, among Dexia Crédit Local, Dexia Bank Belgium S.A., Financial Security Assurance Inc. and FSA Asset Management LLC, dated November 13, 2008 (Incorporated by reference to Exhibit 10.3 to Financial Security Assurance Holdings Ltd.'s Form 10-Q for the quarter ended September 30, 2008)
10.3610.32Amended and Restated Pledge and Intercreditor Agreement, dated as of February 20, 2009, between Dexia Crédit Local, Dexia Bank Belgium S.A., Financial Security Assurance Inc., FSA Asset Management LLC, FSA Capital Markets Services LLC and FSA Capital Management Services LLC (Incorporated by reference to Exhibit 10.19 to Financial Security Assurance Holdings Ltd.'s Form 10-K for the year ended December 31, 2008)
10.3710.33Put Option Agreement, dated as of June 23, 2003 by and between FSA and Sutton Capital Trust I (Incorporated by reference to Exhibit 99.5 to Financial Security Assurance Holdings Ltd.'s Form 10-Q for the quarter ended June 30, 2003)
10.3810.34Put Option Agreement, dated as of June 23, 2003 by and between FSA and Sutton Capital Trust II (Incorporated by reference to Exhibit 99.6 to Financial Security Assurance Holdings Ltd.'s Form 10-Q for the quarter ended June 30, 2003)
10.3910.35Put Option Agreement, dated as of June 23, 2003 by and between FSA and Sutton Capital Trust III (Incorporated by reference to Exhibit 99.7 to Financial Security Assurance Holdings Ltd.'s Form 10-Q for the quarter ended June 30, 2003)
10.4010.36Put Option Agreement, dated as of June 23, 2003 by and between FSA and Sutton Capital Trust IV (Incorporated by reference to Exhibit 99.8 to Financial Security Assurance Holdings Ltd.'s Form 10-Q for the quarter ended June 30, 2003)
10.4110.37Contribution Agreement, dated as of November 22, 2006, between Dexia S.A. and Financial Security Assurance Holdings Ltd. (Incorporated by reference to Exhibit 10.4 to Financial Security Assurance Holdings Ltd.'s Form 8-K filed on November 28, 2006)
10.4210.38Replacement Capital Covenant, dated as of November 22, 2006, by Financial Security Assurance Holdings Ltd. (Incorporated by reference to Exhibit 10.5 to Financial Security Assurance Holdings Ltd.'s Form 8-K filed on November 28, 2006)
10.4310.39Agreement and Amendment between Dexia Holdings Inc., Dexia Credit Local S.A. and the Company dated as of June 9, 2009 (Incorporated by reference to Exhibit 10.1 to Form 8-K filed on June 12, 2009)
10.4410.40Stock Purchase Agreement, dated as of December 22, 2014, between Assured Guaranty Corp. and Radian Guaranty Inc. (Incorporated by reference to Exhibit 10.44 to Form 10-K for the year ended December 31, 2014)
10.4510.41Summary of Annual Compensation*
10.4610.42Director Compensation Summary (Incorporated by reference to Exhibit 10.1 to Form 10-Q for the quarter ended March 31, 2015)2016)*

278


Exhibit
Number
Description of Document
10.4710.43Assured Guaranty Ltd. 2004 Long-Term Incentive Plan, as amended and restated as of May 7, 2009 and as amended through the Third Amendment (Incorporated by reference to Exhibit 10.2 to Form 10-Q for the quarter ended March 31, 2014)*Fourth Amendment*
10.4810.44Non-Qualified Stock Option Agreement under Assured Guaranty Ltd. 2004 Long-Term Incentive Plan to be used with employment agreement (Incorporated by reference to Exhibit 10.34 to Form 10-K for the year ended December 31, 2005)*
10.4910.45Non-Qualified Stock Option Agreement under Assured Guaranty Ltd. 2004 Long-Term Incentive Plan (Incorporated by reference to Exhibit 10.35 to Form 10-K for the year ended December 31, 2005)*
10.5010.46Non-Qualified Stock Option Agreement under Assured Guaranty Ltd. 2004 Long-Term Incentive Plan to be used with employment agreement (Incorporated by reference to Exhibit 10.66 to Form 10-K for the year ended December 31, 2007)*
10.5110.47Non-Qualified Stock Option Agreement under Assured Guaranty Ltd. 2004 Long-Term Incentive Plan (Incorporated by reference to Exhibit 10.67 to Form 10-K for the year ended December 31, 2007)*

10.52

Exhibit
Number
Description of Document
10.48Non-Qualified Stock Option Agreement under Assured Guaranty Ltd. 2004 Long-Term Incentive Plan to be used with employment agreement (Incorporated by reference to Exhibit 10.71 to Form 10-K for the year ended December 31, 2008)*
10.5310.49Non-Qualified Stock Option Agreement for Outside Directors under Assured Guaranty Ltd. 2004 Long-Term Incentive Plan (Incorporated by reference to Exhibit 10.19 to Form 10-Q for the quarter ended June 30, 2009)*
10.5410.502010 Form of Non-Qualified Stock Option Agreement under Assured Guaranty Ltd. 2004 Long-Term Incentive Plan to be used with employment agreement (Incorporated by reference to Exhibit 10.3 to Form 10-Q for the quarter ended March 31, 2010)*
10.5510.512010 Form of Non-Qualified Stock Option Agreement under Assured Guaranty Ltd. 2004 Long-Term Incentive Plan for use without employment agreement (Incorporated by reference to Exhibit 10.4 to Form 10-Q for the quarter ended March 31, 2010)*
10.5610.522012 Form of Executive Non-Qualified Stock Option Agreement under Assured Guaranty Ltd. 2004 Long-Term Incentive Plan (Incorporated by reference to Exhibit 10.7 to Form 10-Q for the quarter ended March 31, 2012)*
10.5710.532013 Form of Executive Non-Qualified Stock Option Agreement under Assured Guaranty Ltd. 2004 Long-Term Incentive Plan (Incorporated by reference to Exhibit 10.1 to Form 10-Q for the quarter ended March 31, 2013)*
10.5810.54Restricted Stock Unit Agreement for Outside Directors under Assured Guaranty Ltd. 2004 Long Term Incentive Plan (Incorporated by reference to Exhibit 10.37 to Form 10-K for the year ended December 31, 2005)*
10.5910.55Restricted Stock Unit Agreement for Outside Directors under Assured Guaranty Ltd. 2004 Long-Term Incentive Plan (Incorporated by reference to Exhibit 10.1 to Form 10-Q for the quarter ended June 30, 2007)*
10.6010.56Restricted Stock Unit Agreement for Outside Directors under Assured Guaranty Ltd. 2004 Long-Term Incentive Plan (Incorporated by reference to Exhibit 10.1 to Form 10-Q for the quarter ended June 30, 2008)*
10.6110.57Form of amendment to Restricted Stock Unit Awards for Outside Directors (Incorporated by reference to Exhibit 10.3 to Form 10-Q for the quarter ended June 30, 2008)*
10.6210.58Restricted Stock Agreement for Outside Directors under Assured Guaranty Ltd. 2004 Long-Term Incentive Plan (Incorporated by reference to Exhibit 10.2 to Form 10-Q for the quarter ended June 30, 2008)*
10.6310.592014 Restricted Stock Agreement for Outside Directors under Assured Guaranty Ltd. 2004 Long-Term Incentive Plan (Incorporated by reference to Exhibit 10.5 to Form 10-Q for the quarter ended June 30, 2014)*
10.6410.60Form of Restricted Stock Agreement for Outside Directors under Assured Guaranty Ltd. 2004 Long-Term Incentive Plan, as in effect for awards commencing in 2015 (Incorporated by reference to Exhibit 10.4 to Form 10-Q for the quarter ended March 31, 2015)*
10.6510.612013 Form of Executive Restricted Stock Unit Agreement under Assured Guaranty Ltd. 2004 Long-Term Incentive Plan (Incorporated by reference to Exhibit 10.2 to Form 10-Q for the quarter ended March 31, 2013)*
10.6610.622014 Form of Executive Restricted Stock Unit Agreement under Assured Guaranty Ltd. 2004 Long-Term Incentive Plan (Incorporated by reference to Exhibit 10.2 to Form 10-Q for the quarter ended June 30, 2014)*
10.6710.63Form of Executive Restricted Stock Unit Agreement under Assured Guaranty Ltd. 2004 Long-Term Incentive Plan, as in effect for awards commencing in 2015 (Incorporated by reference to Exhibit 10.3 to Form 10-Q for the quarter ended March 31, 2015)*
10.6810.642013 Form of Executive Performance-Based Restricted Stock Unit Agreement under Assured Guaranty Ltd. 2004 Long-Term Incentive Plan (Incorporated by reference to Exhibit 10.3 to Form 10-Q for the quarter ended March 31, 2013)*

279


Exhibit
Number
Description of Document
10.6910.652014 Form of Executive Performance-Based Restricted Stock Unit Agreement under Assured Guaranty Ltd. 2004 Long-Term Incentive Plan (Incorporated by reference to Exhibit 10.3 to Form 10-Q for the quarter ended June 30, 2014)*
10.7010.662015 Form of Executive Performance-Based Restricted Stock Unit Agreement under Assured Guaranty Ltd. 2004 Long-Term Incentive Plan (Incorporated by reference to Exhibit 10.2 to Form 10-Q for the quarter ended March 31, 2015)*
10.7110.67First Amendment to the Restricted Stock Unit Agreement for Outside Directors (Incorporated by reference to Exhibit 10.106 to Form 10-K for the year ended December 31, 2012)*
10.7210.68Assured Guaranty Ltd. Employee Stock Purchase Plan, as amended through the second amendment (Incorporated by reference to Exhibit 10.5 to Form 10-Q for the quarter ended March 31, 2013)*
10.7310.69Assured Guaranty Ltd. Performance Retention Plan (As Amended and Restated as of February 14, 2008 for Awards Granted during 2007) (Incorporated by reference to Exhibit 10.50 to Form 10-K for the year ended December 31, 2007)*

10.74

Exhibit
Number
Description of Document
10.70Assured Guaranty Ltd. Performance Retention Plan (As Amended and Restated as of February 14, 2008) (Incorporated by reference to Exhibit 10.58 to Form 10-K for the year ended December 31, 2007)*
10.7510.71Terms of Performance Retention Award Four Year Installment Vesting Granted on February 9, 2012 for participants Subject to $1 million Limit (Incorporated by reference to Exhibit 10.10 to Form 10-Q for the quarter ended March 31, 2012)*
10.7610.72Terms of Performance Retention Award Four Year Installment Vesting Granted on February 7, 2013 for Participants Subject to $1 million Limit (Incorporated by reference to Exhibit 10.4 to Form 10-Q for the quarter ended March 31, 2013)*
10.7710.73Terms of Performance Retention Award Four Year Installment Vesting Granted on February 5, 2014 for Participants Subject to $1 million Limit (Incorporated by reference to Exhibit 10.4 to Form 10-Q for the quarter ended June 30, 2014)*
10.7810.74Assured Guaranty Ltd. Executive Severance Plan (Incorporated by reference to Exhibit 10.5 to Form 10-Q for the quarter ended March 31, 2012)*
10.7910.75Form of Acknowledgement Letter for Participants in Assured Guaranty Ltd. Executive Severance Plan (Incorporated by reference to Exhibit 10.11 to Form 10-Q for the quarter ended March 31, 2012)*
10.8010.76Assured Guaranty Ltd. Perquisite Policy (Incorporated by reference to Exhibit 10.6 to Form 10-Q for the quarter ended March 31, 2012)*
10.8110.77Form of Indemnification Agreement between the Company and its executive officers and directors (Incorporated by reference to Exhibit 10.42 to Form 10-K for the year ended December 31, 2005)*
10.8210.78Assured Guaranty Ltd. Executive Officer Recoupment Policy (Incorporated by reference to Exhibit 10.69 to Form 10-K for the year ended December 31, 2008)*
10.8310.79Form of Acknowledgement of Assured Guaranty Ltd. Executive Officer Recoupment Policy (Incorporated by reference to Exhibit 10.70 to Form 10-K for the year ended December 31, 2008)*
10.8410.80Amended and Restated Assured Guaranty Ltd. Executive Officer Recoupment Policy (amended and restated effective November 3, 2015) (Incorporated by reference to Exhibit 10.84 to Form 10-K for the year ended December 31, 2015)*
10.8510.81Form of Acknowledgement of Amended and Restated Assured Guaranty Ltd. Executive Officer Recoupment Policy*Policy (Incorporated by reference to Exhibit 10.85 to Form 10-K for the year ended December 31, 2015)*
10.8610.82Assured Guaranty Ltd. Supplemental Employee Retirement Plan, as amended and restated effective January 1, 2009 and as amended by the First, Second, Third, Fourth and Fifth Amendments (Incorporated by reference to Exhibit 10.1 to Form 10-Q for the quarter ended September 30, 2012)*
10.8710.83Assured Guaranty Corp. Supplemental Executive Retirement Plan as amended through the Third Amendment thereto (Incorporated by reference to Exhibit 4.5 to Form S-8 (#333-178625))*
10.8810.84Financial Security Assurance Holdings Ltd. 1989 Supplemental Executive Retirement Plan (amended and restated as of December 17, 2004) (Incorporated by reference to Exhibit 10.4 to Financial Security Assurance Holdings Ltd.'s Form 8-K filed on December 17, 2004)*
10.8910.85Amendment to the Financial Security Assurance Holdings Ltd. 1989 Supplemental Employee Retirement Plan (Incorporated by reference to Exhibit 10.29 to Form 10-Q for the quarter ended June 30, 2009)*
10.9010.86Financial Security Assurance Holdings Ltd. 2004 Supplemental Executive Retirement Plan, as amended on February 14, 2008 (Incorporated by reference to Exhibit 10.3 to Financial Security Assurance Holdings Ltd.'s Form 8-K filed on February 15, 2008)*

280


Exhibit
Number
Description of Document
10.9110.87Separation Agreement, dated February 4, 2015, between Robert B. Mills and the Registrant (Incorporated by reference to Exhibit 10.91 to Form 10-K for the year ended December 31, 2014)*
10.88Agreement and Plan of Merger, dated as of April 12, 2016, among Assured Guaranty Corp., Cultivate Merger Sub, Inc. and CIFG Holding Inc. (Incorporated by reference to Exhibit 10.2 to Form 10-Q for the quarter ended March 31, 2016)
10.89Share Purchase Agreement relating to the sale and purchase of MBIA UK Insurance Limited, dated September 29, 2016, between MBIA UK (Holdings) Limited and Assured Guaranty Corp. (Incorporated by reference to Exhibit 10.1 to Form 10-Q for the quarter ended September 30, 2016)
10.90Share Repurchase Agreement dated as of January 3, 2017 between the Company and the Chief Executive Officer*
10.91Share Repurchase Agreement dated as of January 5, 2017 between the Company and the General Counsel*
10.922016 Form of Executive Restricted Stock Unit Agreement under Assured Guaranty Ltd. 2004 Long-Term Incentive Plan*


Exhibit
Number
Description of Document
10.932016 Form of Performance-Based Restricted Stock Unit Agreement under Assured Guaranty Ltd. 2004 Long-Term Incentive Plan*
12.1Computation of Ratio of Earnings to Fixed Charges
21.1Subsidiaries of the Registrant
23.1Accountants Consent
31.1Certification of CEO Pursuant to Exchange Act Rules 13A-14 and 15D-14, as Adopted Pursuant to Section 302 of the Sarbanes‑Oxley Act of 2002
31.2Certification of CFO Pursuant to Exchange Act Rules 13A-14 and 15D-14, as Adopted Pursuant to Section 302 of the Sarbanes‑Oxley Act of 2002
32.1Certification of CEO Pursuant to 18 U.S.C. Section 1350, as Adopted Pursuant to Section 906 of the Sarbanes‑ Oxley Act of 2002
32.2Certification of CFO Pursuant to 18 U.S.C. Section 1350, as Adopted Pursuant to Section 906 of the Sarbanes‑ Oxley Act of 2002
101.1The following financial information from Registrant's Annual Report on Form 10-K for the year ended December 31, 20152016 formatted in XBRL (eXtensible Business Reporting Language) interactive data files pursuant to Rule 405 of Regulation S-T: (i) Consolidated Balance Sheets at December 31, 20152016 and 2014;2015; (ii) Consolidated Statements of Operations for the years ended December 31, 2016, 2015 2014 and 2013;2014; (iii) Consolidated Statements of Comprehensive Income for the years ended December 31, 2016, 2015 2014 and 2013;2014; (iv) Consolidated Statements of Shareholders' Equity for the years ended December 31, 2016, 2015 2014 and 2013;2014; (v) Consolidated Statements of Cash Flows for the years ended December 31, 2016, 2015 2014 and 2013;2014; and (vi) Notes to Consolidated Financial Statements.

*Management contract or compensatory plan


281


SIGNATURES

Pursuant to the requirements of Section 13 or 15(d) of the Securities Exchange Act of 1934, the Registrant has caused this report to be signed on its behalf by the undersigned, thereunto duly authorized.

 Assured Guaranty Ltd.
  
  
 By:
/s/ Dominic J. Frederico
Name: Dominic J. Frederico
Title:  President and Chief Executive Officer

Date: February 26, 201624, 2017

Pursuant to the requirements of the Securities Exchange Act of 1934, this report has been signed below by the following persons on behalf of the Registrant and in the capacities and on the dates indicated.

  Name    Position    Date  
   
/s/ Francisco L. Borges
Francisco L. Borges
Chairman of the Board; DirectorFebruary 26, 201624, 2017
   
/s/ Dominic J. Frederico
Dominic J. Frederico
President and Chief Executive Officer; DirectorFebruary 26, 201624, 2017
   
/s/ Robert A. Bailenson
Robert A. Bailenson
Chief Financial Officer (Principal Financial and Accounting Officer and Duly Authorized Officer)February 26, 201624, 2017
   
/s/ G. Lawrence Buhl
G. Lawrence Buhl
DirectorFebruary 26, 2016
/s/ Stephen A. Cozen
Stephen A. Cozen
DirectorFebruary 26, 201624, 2017
   
/s/ Bonnie L. Howard
Bonnie L. Howard
DirectorFebruary 26, 201624, 2017
   
/s/ Thomas W. Jones
Thomas W. Jones
DirectorFebruary 26, 201624, 2017
   
/s/ Patrick W. Kenny
Patrick W. Kenny
DirectorFebruary 26, 201624, 2017
   
/s/ Alan J. Kreczko
Alan J. Kreczko
DirectorFebruary 26, 201624, 2017
   
/s/ Simon W. Leathes
Simon W. Leathes
DirectorFebruary 26, 201624, 2017
   
/s/ Michael T. O'Kane
Michael T. O'Kane
DirectorFebruary 26, 201624, 2017
   
/s/ Yukiko Omura
Yukiko Omura
DirectorFebruary 26, 201624, 2017


282269