0001273813 srt:MaximumMember us-gaap:VariableRateDemandObligationMember 2019-01-01 2019-12-31
UNITED STATES
SECURITIES AND EXCHANGE COMMISSION
Washington, D.C. 20549
FORM 10-K
|
| | |
ý☒ | | ANNUAL REPORT UNDER SECTION 13 OR 15(d) OF THE SECURITIES EXCHANGE ACT OF 1934 |
For the fiscal year ended December 31, 20162019
Or
|
| | |
o☐ | | TRANSITION REPORT PURSUANT TO SECTION 13 OR 15(d) OF THE SECURITIES EXCHANGE ACT OF 1934 |
For the transition period from to
Commission File Number 001-32141
ASSURED GUARANTY LTD.
(Exact name of Registrant as specified in its charter)
|
| | |
Bermuda | | 98-0429991 |
(State or other jurisdiction ofincorporation or organization)
| | 98-0429991
(I.R.S. Employer Identification No.employer |
| of incorporation) | | identification no.) |
30 Woodbourne Avenue,
Hamilton HM 08 Bermuda
(441) 279-5700
(Address, including zip code, and telephone number,
including area code, of Registrant's principal executive office)
None
(Former name, former address and former fiscal year, if changed since last report)
Securities registered pursuant to Section 12(b) of the Act:
|
| | | |
Title of each class class: | Trading Symbol(s) | Name of each exchange on which registered |
Common Shares $0.01 | $0.01 per share | AGO | New York Stock Exchange Inc. |
Securities registered pursuant to Section 12(g) of the Act:None
Indicate by check mark if the registrant is a well-known seasoned issuer, as defined in Rule 405 of the Securities Act. Yesý No o
Indicate by check mark if the registrant is not required to file reports pursuant to Section 13 or Section 15(d) of the Act. Yes oNoý
Indicate by check mark whether the registrant: (1) has filed all reports required to be filed by Section 13 or 15(d) of the Securities Exchange Act of 1934 during the preceding 12 months (or for such shorter period that the Registrant was required to file such reports), and (2) has been subject to such filing requirements for the past 90 days. Yesý No o
Indicate by check mark whether the registrant has submitted electronically and posted on its corporate Web site, if any, every Interactive Data File required to be submitted and posted pursuant to Rule 405 of Regulation S-T during the preceding 12 months (or for such shorter period that the registrant was required to submit and post such files). Yesý No o
Indicate by check mark if disclosure of delinquent filers pursuant to Item 405 of Regulation S-K is not contained herein, and will not be contained, to the best of registrant's knowledge, in definitive proxy or information statements incorporated by reference in Part III of this Form 10-K or any amendment to this Form 10-K. o
Indicate by check mark whether the registrant is a large accelerated filer, an accelerated filer, a non-accelerated filer, or a smaller reporting company, or an emerging growth company. See the definitions of "large accelerated filer," "accelerated filer," and "smaller reporting company," and "emerging growth company" in Rule 12b-2 of the Exchange Act.
|
| | | | |
| Large accelerated filer | x | | Accelerated filer | o |
| Non-accelerated filer | o | | Smaller reporting company | ☐ |
| | | Emerging growth company | ☐ |
Large accelerated filer ýIf an emerging growth company, indicate by check mark if the registrant has elected not to use the extended transition period for complying with any new or revised financial accounting standards provided pursuant to Section 13(a) of the Exchange Act. o
| | Accelerated filer o
| | Non-accelerated filer o
(Do not check if a
smaller reporting company)
| | Smaller reporting company o
|
Indicate by check mark whether the registrant is a shell company (as defined in Rule 12b-2 of the Exchange Act). Yes o☐ No ý
The aggregate market value of Common Shares held by non-affiliates of the Registrant as of the close of business on June 30, 201628, 2019 was $3,310,230,030$4,084,346,347 (based upon the closing price of the Registrant's shares on the New York Stock Exchange on that date, which was $25.37)$42.08). For purposes of this information, the outstanding Common Shares which were owned by all directors and executive officers of the Registrant were deemed to be the only shares of Common Stock held by affiliates.
As of February 21, 2017, 125,017,61425, 2020, 92,581,878 Common Shares, par value $0.01 per share, were outstanding (including 58,85856,028 unvested restricted shares).
DOCUMENTS INCORPORATED BY REFERENCE
Certain portions of Registrant's definitive proxy statement relating to its 20162020 Annual General Meeting of Shareholders are incorporated by reference to Part III of this report.
Forward Looking Statements
This Form 10-K contains information that includes or is based upon forward looking statements within the meaning of the Private Securities Litigation Reform Act of 1995. Forward looking statements give the expectations or forecasts of future events of Assured Guaranty Ltd. (AGL) and its subsidiaries (collectively with AGL, Assured Guaranty or the Company). These statements can be identified by the fact that they do not relate strictly to historical or current facts and relate to future operating or financial performance.
Any or all of Assured Guaranty’s forward looking statements herein are based on current expectations and the current economic environment and may turn out to be incorrect. Assured Guaranty’s actual results may vary materially. Among factors that could cause actual results to differ adversely are:
changes in the world’s credit markets, segments thereof, interest rates, credit spreads or general economic conditions;
developments in the world’s financial and capital markets that adversely affect insured obligors’ repayment rates, Assured Guaranty’s insurance loss or recovery experience, investments of Assured Guaranty or assets it manages;
reduction in the amount of available insurance opportunities and/or in the demand for Assured Guaranty's insurance;
rating agency action, including a ratings downgrade, a changethe loss of investors in outlook,Assured Guaranty's asset management strategies or the placement of ratings on watch for downgrade, or a change in rating criteria, at any time, of AGL or any of its subsidiaries, and/or of any securities AGL or any of its subsidiaries have issued, and/or of transactions that AGL’s subsidiaries have insured;
developments in the world’s financial and capital markets that adversely affect obligors’ payment rates,failure to attract new investors to Assured Guaranty’s loss experience, or its exposure to refinancing risk in transactions (which could result in substantial liquidity claims on its guarantees);Guaranty's asset management business;
the possibility that budget or pension shortfalls or other factors will result in credit losses or impairments on obligations of state, territorial and local governments and their related authorities and public corporations that Assured Guaranty insures or reinsures;
insured losses in excess of those expected by Assured Guaranty or the failure of Assured Guaranty to realize loss recoveries that are assumed in its expected loss estimates;estimates for insurance exposures;
increased competition, including from new entrants into the financial guaranty industry;
poor performance of Assured Guaranty's asset management strategies compared to the performance of the asset management strategies of Assured Guaranty's competitors;
the possibility that investments made by Assured Guaranty for its investment portfolio, including alternative investments and investments it manages, do not result in the benefits anticipated or subject Assured Guaranty to reduced liquidity at a time it requires liquidity or to unanticipated consequences;
the impact of market volatility on the mark-to-market of Assured Guaranty’s assets and liabilities subject to mark-to-market, including certain of its investments, most of its contracts written in credit default swap (CDS) form, and variable interest entities (VIEs) as well as on the mark-to-market of assets Assured Guaranty manages;
rating agency action, including a ratings downgrade, a change in outlook, the placement of ratings on obligors, including sovereign debtors, resultingwatch for downgrade, or a change in a reduction in the valuerating criteria, at any time, of AGL or any of its insurance subsidiaries, and/or of any securities in Assured Guaranty's investment portfolio and in collateral posted by and to Assured Guaranty;AGL or any of its subsidiaries have issued, and/or of transactions that AGL’s insurance subsidiaries have insured;
the inability of Assured Guaranty to access external sources of capital on acceptable terms;
changes in the world’s credit markets, segments thereof, interest rates or general economic conditions;
the impact of market volatility on the mark-to-market of Assured Guaranty’s contracts written in credit default swap form;
changes in applicable accounting policies or practices;
changes in applicable laws or regulations, including insurance, bankruptcy and tax laws, or other governmental actions;
the impactfailure of changes inAssured Guaranty to successfully integrate the world’s economybusiness of BlueMountain Capital Management, LLC (BlueMountain) and credit and currency markets and in applicable laws or regulations relating to the decision of the United Kingdom to exit the European Union;its associated entities;
the possibility that acquisitions or alternative investments made by Assured Guaranty, including its acquisition of BlueMountain (BlueMountain Acquisition), do not result in the benefits anticipated or subject Assured Guaranty to unanticipated consequences;
deterioration in the financial condition of Assured Guaranty’s reinsurers, the amount and timing of reinsurance recoverables actually received and the risk that reinsurers may dispute amounts owed to Assured Guaranty under its reinsurance agreements;
difficulties with the execution of Assured Guaranty’s business strategy;
loss of key personnel;
the effects of mergers, acquisitions and divestitures;
natural or man-made catastrophes;catastrophes or pandemics;
other risk factors identified in AGL’s filings with the U.S.United States (U.S.) Securities and Exchange Commission (the SEC);
other risks and uncertainties that have not been identified at this time; and
management’s response to these factors.
The foregoing review of important factors should not be construed as exhaustive, and should be read in conjunction with the other cautionary statements that are included in this Form 10-K. The Company undertakes no obligation to update publicly or review any forward looking statement, whether as a result of new information, future developments or otherwise, except as required by law. Investors are advised, however, to consult any further disclosures the Company makes on related subjects in the Company’s reports filed with the SEC.
If one or more of these or other risks or uncertainties materialize, or if the Company’s underlying assumptions prove to be incorrect, actual results may vary materially from what the Company projected. Any forward looking statements in this Form 10-K reflect the Company’s current views with respect to future events and are subject to these and other risks, uncertainties and assumptions relating to its operations, results of operations, growth strategy and liquidity.
For these statements, the Company claims the protection of the safe harbor for forward looking statements contained in Section 27A of the Securities Act of 1933, as amended (the Securities Act), and Section 21E of the Securities Exchange Act of 1934, as amended (the Exchange Act).
Convention
Unless otherwise noted, ratings on Assured Guaranty's insured portfolio and on bonds or notes purchased pursuant to loss mitigation strategies or other risk management strategies (loss mitigation securities) are Assured Guaranty’s internal ratings. Internal credit ratings are expressed on a rating scale similar to that used by the rating agencies and generally reflect an approach similar to that employed by the rating agencies, except that Assured Guaranty's internal credit ratings focus on future performance, rather than lifetime performance.
In addition, unless otherwise noted, the Company excludes amounts from its outstanding insured par and debt service outstandingrelating to securities or assets owned by the Company as a result of loss mitigation strategies, including loss mitigation securities held in the investment portfolio. The Company manages the loss mitigation securities as investments and not insurance exposure.
ASSURED GUARANTY LTD.
FORM 10-K
TABLE OF CONTENTS
PART I
Overview
Assured Guaranty Ltd. (AGL and, together with its subsidiaries, Assured Guaranty or the Company) is a Bermuda-based holding company incorporated in 2003 that provides, through its operating subsidiaries, credit protection products and asset management services. The Company provides credit protection products to the United States (U.S.)U.S. and international public finance (including infrastructure) and structured finance markets. Themarkets, and manages assets across collateralized loan obligations (CLOs) and long-duration opportunity funds that build on its corporate credit, asset-backed finance and healthcare structured capital experience.
In the Insurance segment, the Company applies its credit underwriting judgment, risk management skills and capital markets experience primarily to offer financial guaranty insurance that protects holders of debt instruments and other monetary obligations from defaults in scheduled payments. If an obligor defaults on a scheduled payment due on an obligation, including a scheduled principal or interest payment (Debt Service)(debt service), the Company is required under its unconditional and irrevocable financial guaranty to pay the amount of the shortfall to the holder of the obligation. The Company markets its financial guaranty insurance directly to issuers and underwriters of public finance and structured finance securities as well as to investors in such obligations. The Company guarantees obligations issued principally in the U.S. and the United Kingdom (U.K.), and also guarantees obligations issued in other countries and regions, including AustraliaWestern Europe, Canada and Western Europe.Australia.
In the Asset Management segment, the Company completed on October 1, 2019 its acquisition (the BlueMountain Acquisition) of all of the outstanding equity interests in BlueMountain Capital Management, LLC (BlueMountain) and its associated entities. As of that date, BlueMountain managed or serviced $18.3 billion in assets across CLOs and opportunity funds that build on its corporate credit, asset-backed finance and healthcare structured capital experience, as well as certain legacy hedge and opportunity funds now subject to an orderly wind-down. The Company also provides other forms of insurance that are in line with itsBlueMountain Acquisition diversifies the risk profile and benefit fromrevenue opportunities of the Company into the asset management industry, with the goal of further developing a fee-based platform, which will be operating within the Assured Investment Management platform. Additionally, the Company believes that the establishment of Assured Investment Management provides the Company an opportunity to deploy excess capital at attractive returns, improving the risk-adjusted return on a portion of its underwriting experience.
investment portfolio. The Company intends to leverage the Assured Investment Management infrastructure and platform to grow its Asset Management segment both organically and inorganically through strategic combinations.
Since the acquisition of BlueMountain and establishment of Assured Investment Management, the Company now operates in two distinct operating segments, Insurance and Asset Management, and also has a Corporate division. See Part II, Item 7, Management's Discussion and Analysis of Financial Condition and Results of Operations and Item 8, Financial Statements and Supplementary Data, Note 4, Segment Information for financial results of the Company's segments.
Insurance
The Company's largest line of business is Insurance. The Company primarily conducts its financial guaranty business on a direct basis from the following companies: Assured Guaranty Municipal Corp. (AGM), Municipal Assurance Corp. (MAC), Assured Guaranty Corp. (AGC), and Assured Guaranty (Europe) Ltd. (AGE)plc (AGE UK) and, most recently, Assured Guaranty (Europe) SA (AGE SA). It also conducts insurance business through its Bermuda-based reinsurers Assured Guaranty Re Ltd. (AG Re) and Assured Guaranty Re Overseas Ltd. (AGRO), Bermuda-based reinsurers.. The following is a description of AGL's principal insurance operating subsidiaries:
| |
| • | Assured Guaranty Municipal Corp. and Municipal Assurance Corp.Since mid-2008, AGM has provided financial guaranty insurance and reinsurance only on debt obligations issued in the U.S. public finance and global infrastructure markets, including bonds issued by U.S. state or governmental authorities or notes issued to finance infrastructure projects. MAC offers insurance and reinsurance on bonds issued by U.S. state or municipal governmental authorities, focusing on investment grade obligations in select sectors of the municipal market. AGM is located and domiciled in New York. AGM was organized in 1984 as "Financial Security Assurance Inc." and until 2008 also offered insurance and reinsurance in the global structured finance market. (AGM's subsidiaries AGE UK and AGE SA still offer insurance and reinsurance in the global structured finance markets.) MAC is located and domiciled in New York and was organized in 2008. Assured Guaranty acquired MAC on May 31, 2012. |
| |
| • | Assured Guaranty Corp.AGC is located in New York and domiciled in Maryland, was organized in 1985 and commenced operations in 1988. It provides insurance and reinsurance on debt obligations in the global structured finance market and also offers guarantees on obligations in the U.S. public finance and international infrastructure markets. AGC acquired CIFG Assurance North America, Inc. (CIFGNA) in 2016 and Radian Asset Assurance Inc. (Radian Asset) in 2015, and merged them each with and into AGC, with AGC being the surviving entity. |
| |
| • | Assured Guaranty (Europe) plcand Assured Guaranty (Europe) SA. AGE UK and AGE SA offer financial guarantees in both the international public finance and structured finance markets. AGE UK is a U.K. incorporated company licensed as a U.K. insurance company and located in England. Through 2019, AGE UK wrote business in the U.K. and various countries throughout the European Union (EU) as well as certain other non-EU countries. AGE UK was organized in 1990 and issued its first financial guarantee in 1994. As discussed further under “-- Regulation -- United Kingdom, Position of U.K. Regulated Entities within the AGL Group” below, AGE UK has agreed with its regulator that new business it writes would be guaranteed using a co-insurance structure pursuant to which AGE UK would co-insure municipal and infrastructure transactions with AGM, and structured finance transactions with AGC. AGE SA is a French incorporated company and has been authorized by the French insurance and banking supervisory authority, the Autorité de Contrôle Prudentiel et de Résolution, to conduct financial guarantee business, and is located in France. AGE SA was established in mid-2019 to address the impact of the withdrawal of the U.K. from the EU. AGE UK intends to transfer certain existing financial guarantees in its portfolio to AGE SA. Upon such transfer, these will become the financial guarantees of AGE SA. Through AGE SA, Assured Guaranty intends to continue to write new business in the EU. AGE UK will remain the Assured Guaranty platform that writes new business in the U.K. and certain other non-EU countries. |
The Company combined the operations of its then European subsidiaries, AGE UK, Assured Guaranty Municipal Corp.AGM is located and domiciled in New York, was organized in 1984 and commenced operations in 1985. Since mid-2008, AGM has provided financial guaranty insurance only on debt obligations issued in the U.S. public finance and global infrastructure markets, including bonds issued by U.S. state or governmental authorities or notes issued to finance infrastructure projects. Previously, AGM also offered insurance and reinsurance in the global structured finance market, including asset-backed securities issued by special purpose entities. AGM formerly was named Financial Security Assurance Inc.(UK) plc (AGUK), Assured Guaranty acquired AGM, together with its holding company Financial Security Assurance Holdings Ltd. (renamed Assured Guaranty Municipal Holdings Inc.(London) plc (AGLN) and CIFG Europe S.A. (CIFGE), AGMH)in a transaction that was completed on November 7, 2018. Under the combination, AGUK, AGLN and the subsidiaries owned by that holding company, on July 1, 2009.
Municipal Assurance Corp.MAC is locatedCIFGE transferred their insurance portfolios to and domiciled in New York and was organized in 2008. Assured Guaranty acquired MAC on May 31, 2012. On July 16, 2013, Assured Guaranty completed a series of transactions that increased the capitalization of MAC and resulted in MAC assuming a portfolio of geographically diversified U.S. public finance exposure from AGM and AGC. MAC offers insurance and reinsurance on bonds issued by U.S. state or municipal governmental authorities, focusing on investment grade obligations in select sectors of the municipal market.
Assured Guaranty Corp.AGC is located in New York and domiciled in Maryland, was organized in 1985 and commenced operations in 1988. It provides insurance and reinsurance on debt obligations in the global structured finance market and also offers guarantees on obligations in the U.S. public finance and international infrastructure markets.
On July 1, 2016, AGC acquired all of the issued and outstanding capital stock of CIFG Holding Inc. (together with its subsidiaries, CIFGH) (the CIFG Acquisition). AGC merged CIFG Assurance North America, Inc. (CIFGNA), a financial guaranty insurer subsidiary of CIFGH, with and into AGC, with AGC as the surviving company, on July 5, 2016. The CIFG Acquisition added $4.2 billion of net par insured on July 1, 2016.
On April 1, 2015 (Radian Acquisition Date), AGC completed the acquisition of all of the issued and outstanding capital stock of financial guaranty insurer Radian Asset Assurance Inc. (Radian Asset) (Radian Asset Acquisition). Radian Asset was merged with and into AGC, with AGC as the surviving company of the merger. The Radian Asset Acquisition added $13.6 billion to the Company's net par outstanding on April 1, 2015.AGE UK (the Combination).
| |
| • | Assured Guaranty Re Ltd. and Assured Guaranty Re Overseas Ltd.AG Re and AGRO underwrite financial guaranty reinsurance, and AGRO also underwrites other specialty insurance and reinsurance that is in line with the Company's risk profile and benefits from its underwriting experience. AG Re and AGRO write business as reinsurers of third-party primary insurers and of certain affiliated companies. AG Re is incorporated under the laws of Bermuda and is licensed as a Class 3B insurer under the Insurance Act 1978 and related regulations of Bermuda. AG Re indirectly owns AGRO, which is a Bermuda Class 3A and Class C insurer. |
On January 10, 2017, AGC completed its acquisition of MBIA UK Insurance Limited (MBIA UK) (MBIA UK Acquisition), the European operating subsidiary of MBIA Insurance Corporation (MBIA). As of December 31, 2016, MBIA UK had an insured portfolio of approximately $12 billion of net par. MBIA UK has changed its name to Assured Guaranty (London) Ltd. (AGLN). Assured Guaranty currently maintains AGLN as a stand-alone
entity. Assured Guaranty is actively working to combine AGLN with its other affiliated European insurance companies. Any such combination will be subject to regulatory and court approvals; as a result, Assured Guaranty cannot predict when, or if, such a combination will be completed.
Assured Guaranty (Europe) Ltd.AGE is a U.K. incorporated company licensed as a U.K. insurance company and authorized to operate in various countries throughout the European Economic Area (EEA). It was organized in 1990 and issued its first financial guarantee in 1994. AGE offers financial guarantees in both the international public finance and structured finance markets and is the primary entity from which the Company writes business in the EEA. As discussed further under "Business" below, AGE has agreed with its regulator that new business it writes would be guaranteed using a co-insurance structure pursuant to which AGE would co-insure municipal and infrastructure transactions with AGM, and structured finance transactions with AGC. AGE must obtain the approval of the Prudential Regulation Authority (PRA) before it can guarantee any new structured finance transaction.
Assured Guaranty Re Ltd. and Assured Guaranty Re Overseas Ltd.AG Re is incorporated under the laws of Bermuda and is licensed as a Class 3B insurer under the Insurance Act 1978 and related regulations of Bermuda. AG Re owns, indirectly, AGRO, which is a Bermuda Class 3A and Class C insurer. AG Re and AGRO underwrite financial guaranty reinsurance, and AGRO also underwrites other reinsurance that is in line with the Company's risk profile and benefits from its underwriting experience. AG Re and AGRO write business as reinsurers of third-party primary insurers and of certain affiliated companies.
Assured Guaranty is the market leader in the financial guaranty industry. The Company's position in the market has benefited from its acquisition of AGMH in 2009 as well as subsequent acquisitions of financial guarantors, its ability to maintain strong financial strength ratings, its strong claims-paying resources, its proven willingness to make claim payments to policyholders after obligors have defaulted, and its ability to achieve recoveries in respect of the claims that it has paid on insured residential mortgage-backed and other securities and to resolve troubled municipal credits to which it had exposure.
The Company faces competition in the U.S. public finance financial guaranty market. The Company estimates, based on third party industry compilations, that of the insured U.S. public finance bonds issued in the primary market in 2016, the Company insured approximately 56% of the par, while Build America Mutual Assurance Company (BAM), insured 40% of the par. National Public Finance Guarantee Corporation (National), an affiliate of MBIA, insured the remaining 4% of the balance. The continued presence in the market of BAM affects the Company's insured volume as well as the amount of premium the Company is able to charge.
The sustained low interest rate environment in the U.S. also presents the Company with challenges. Over the last several years, interest rates generally have been lower than historical norms. Average municipal interest rates were extremely low during 2016, with the benchmark AAA 30-year Municipal Market Data index published by Thomson Reuters (MMD Index), at times below 2%, a threshold not previously crossed in the modern era. As a result, the difference in yield (or the credit spread) between a bond insured by Assured Guaranty and an uninsured bond has provided comparatively little room for issuer savings and insurance premium, and Assured Guaranty has seen a lower demand for its financial guaranty insurance from issuers over the past several years than it saw historically.
In addition, the Company's business continues to be affected by negative perceptions of the value of the financial guaranty insurance sold by other companies that had been active in the industry. The losses suffered by such other insurers resulted in those companies being downgraded to below-investment-grade (BIG) levels by the rating agencies and/or subject to intervention by their state insurance regulators. In a number of cases, the state insurance regulators prevented the distressed financial guaranty insurers from paying claims or paying such claims in full; also, such financial guaranty insurers were perceived by market participants not to be actively conducting surveillance on transactions or fully exercising rights and remedies to mitigate losses.
The Company believes that issuers and investors in securities will continue to purchase financial guaranty insurance, especially if interest rates rise and credit spreads widen. U.S. municipalities have budgetary requirements that are best met through financings in the fixed income capital markets. In particular, smaller municipal issuers frequently use financial guaranties in order to access the capital markets with new debt offerings at a lower all-in interest rate than on an unguaranteed basis. In addition, the Company expects long-term debt financings for infrastructure projects will grow throughout the world, as will the financing needs associated with privatization initiatives or refinancing of infrastructure projects in developed countries.
During 2016, the Company established an alternative investments group to focus on deploying a portion of the Company's excess capital to pursue acquisitions and develop new business opportunities that complement the Company's financial guaranty business, are in line with its risk profile and benefit from its core competencies. The alternative investments group has been investigating a number of such opportunities, including, among others, both controlling and non-controlling investments in investment managers. In February 2017, the Company agreed to purchase up to $100 million of limited partnership interests in a fund that invests in the equity of private equity managers. The Company also considers opportunities to acquire financial guaranty portfolios, whether by acquiring financial guarantors who are no longer actively writing new business or their insured portfolios (including through reinsurance), or by commuting business that it had previously ceded. In the last several years, the Company has reassumed a number of previously ceded portfolios and has completed the acquisition of Radian Asset, CIFG Holding Inc. (CIFGH, and together with its subsidiaries, CIFG) (the CIFG Acquisition) and MBIA UK Insurance Limited (MBIA UK), the U.K. operating subsidiary of MBIA Insurance Corporation (MBIA) (MBIA UK Acquisition). On June 1, 2018, the Company closed a transaction with Syncora Guarantee Inc. (SGI) (SGI Transaction) under which AGC assumed, generally on a 100% quota share basis, substantially all of SGI’s insured portfolio and AGM reassumed a book of business previously ceded to SGI by AGM. The Company continues to investigate additional opportunities.opportunities related to remaining legacy financial guaranty portfolios, but the number and size of the opportunities have decreased and there can be no assurance of whether or when the Company will find suitable opportunities on appropriate terms.
Insurance Portfolio - Financial Guaranty Portfolio
Financial guaranty insurance generally provides an unconditional and irrevocable guaranty that protects the holder of a debt instrument or other monetary obligation against non-payment of scheduled principal and interest payments when due. Upon an obligor's default on scheduled principal or interestdebt service payments due on the debt obligation, whether due to its insolvency or otherwise, the Company is generally required under the financial guaranty contract to pay the investor the principal orand interest shortfallshortfalls then due.
Financial guaranty insurance may be issued to all of the investors of the guaranteed series or tranche of a municipal bond or structured finance security at the time of issuance of those obligations or it may be issued in the secondary market to only specific individual holders of such obligations who purchase the Company's credit protection.
Both issuers of and investors in financial instruments may benefit from financial guaranty insurance. Issuers benefit when they purchase financial guaranty insurance for their new issue debt transaction because the insurance may have the effect of lowering an issuer's interest cost over the life of the debt transaction to the extent that the insurance premium charged by the Company is less than the net present value of the difference between the yield on the obligation insured by Assured Guaranty (which carries the credit rating of the specific subsidiary that guarantees the debt obligation) and the yield on the debt obligation if sold on the basis of its uninsured credit rating. The principal benefit to investors is that the Company's guaranty provides increased certainty that scheduled payments will be received when due. The guaranty may also improve the marketability and liquidity of obligations issued by infrequent or unknown issuers, as well as obligations with complex structures or backed by asset classes new to the market. This benefit to market liquidity, which we call a liquidity benefit, results from the increase in secondary market trading values for Assured Guaranty-insured obligations as compared with uninsured obligations by the same issuer. In general the liquidity benefit of financial guaranties is thatand especially in such instances, investors aremay be able to sell bonds insured bondsby highly rated financial guarantors more quickly than uninsured debt obligations and, depending on the difference between the financial strength rating of the insurer and the rating of the issuer, at a higher secondary market price than for uninsured debt obligations.
As an alternative to traditional financial guaranty insurance, in the past the Company also provided credit protection relating to a particular security or obligor through a credit derivative contract, such as a credit default swap (CDS). Under the terms of a CDS, the seller of credit protection agreedagrees to make a specified payment to the buyer of credit protection if one or more specified credit events occurs with respect to a reference obligation or entity. In general, the Company, as the seller of credit protection, specified as credit events specified in the Company'sits CDS are forfailure to pay interest and principal defaults on the reference obligation. One difference between CDS and traditional primary financial guaranty insurance is that credit default protection was typically provided to a particular buyer of credit protection, who is not always required to own the reference obligation, rather than to all investors in the reference obligation. As a result,but the Company's rights and remedies under a CDS may be different and more limited than onunder a financial guaranty of an entire issuance. Credit derivatives were preferred by some investors, however, because they generally offered the investor ease of execution and standardized terms as well as more favorable accounting or capital treatment. Due to changes in the regulatory environment, the Company has not provided credit protection in the U.S. through a CDS since March 2009, other than in connection with loss mitigation and other remediation efforts relating to its existing book of business. See the Risk Factor captioned "ChangesThe Company, however, has acquired or reinsured portfolios both before and after 2009 that include financial guaranty contracts in or inability to comply with applicable law could adversely affect the Company's ability to do business" under Risks Related to GAAP and Applicable Law in "Item 1A. Risk Factors" for additional detail about the regulatory environment.credit derivative form.
The Company also offers credit protection through reinsurance, and in the past has provided reinsurance to other financial guaranty insurers with respect to their guaranty of public finance, infrastructure and structured finance obligations. The Company believes that the opportunities currently available to it in the reinsurance market primarily consist primarily of potentially assuming portfolios of transactions from inactive primary insurers, such as the SGI Transaction, and recapturing portfolios that it has previously ceded to third party reinsurers.reinsurers, but such opportunities are expected to be limited given the small number of unaffiliated reinsurers currently reinsuring the Company.
The Company's financial guaranty direct and assumed businesses provide credit protection on public finance infrastructure(including infrastructure) and structured finance obligations. When the Company directly insures an obligation, it assigns the obligation to a geographic location or locations based on its view of the geographic location of the risk. For information on the geographic breakdown of the Company's financial guaranty portfolio and on its income and revenue by jurisdiction,country of domicile, see Part II, Item 8, Financial Statements and Supplementary
Data, Note 4,5, Outstanding Insurance Exposure Geographic Distribution of Net Par Outstanding and Note 12, Income Taxes, Provision for Income Taxes.4, Segment Information.
U.S. Public Finance Obligations The Company insures and reinsures a number of different types of U.S. public finance obligations, including the following:
General Obligation Bonds are full faith and credit bonds that are issued by states, their political subdivisions and other municipal issuers, and are supported by the general obligation of the issuer to pay from available funds and by a pledge of the issuer to levy ad valorem taxes in an amount sufficient to provide for the full payment of the bonds.
Tax-Backed Bonds are obligations that are supported by the issuer from specific and discrete sources of taxation. They include tax-backed revenue bonds, general fund obligations and lease revenue bonds. Tax-backed obligations may be secured by a lien on specific pledged tax revenues, such as a gasoline or excise tax, or incrementally from growth in property tax revenue associated with growth in property values. These obligations also include obligations secured by special assessments levied against property owners and often benefit from issuer covenants to enforce collections of such assessments and to foreclose on delinquent properties. Lease revenue bonds typically are general fund obligations of a municipality or other governmental authority that are subject to annual appropriation or abatement; projects financed and subject to such lease payments ordinarily include real estate or equipment serving an essential public purpose. Bonds in this category also include moral obligations of municipalities or governmental authorities.
Municipal Utility Bonds are obligations of all forms of municipal utilities, including electric, water and sewer utilities and resource recovery revenue bonds. These utilities may be organized in various forms, including municipal enterprise systems, authorities or joint action agencies.
Transportation Bonds include a wide variety of revenue-supported bonds, such as bonds for airports, ports, tunnels, municipal parking facilities, toll roads and toll bridges.
Healthcare Bonds are obligations of healthcare facilities, including community based hospitals and systems, as well as of health maintenance organizations and long-term care facilities.
Higher Education Bonds are obligations secured by revenue collected by either public or private secondary schools, colleges and universities. Such revenue can encompass all of an institution's revenue, including tuition and fees, or in other cases, can be specifically restricted to certain auxiliary sources of revenue.
Infrastructure Bonds include obligations issued by a variety of entities engaged in the financing of infrastructure projects, such as roads, airports, ports, social infrastructure and other physical assets delivering essential services supported by long-term concession arrangements with a public sector entity.
Housing Revenue Bonds are obligations relating to both single and multi-family housing, issued by states and localities, supported by cash flow and, in some cases, insurance from entities such as the Federal Housing Administration.
Investor-Owned Utility Bonds are obligations primarily backed by investor-owned utilities, first mortgage bond obligations of for-profit electric or water utilities providing retail, industrial and commercial service, and also include sale-leaseback obligation bonds supported by such entities.
Renewable Energy Bonds are obligations backed by renewable energy sources, such as solar, wind farm, hydroelectric, geothermal and fuel cell.
Other Public Finance Bonds include other debt issued, guaranteed or otherwise supported by U.S. national or local governmental authorities, as well as student loans, revenue bonds, and obligations of some not-for-profit organizations.
A portion of the Company's exposure to tax-backed bonds, municipal utility bonds and transportation bonds constitutes "special revenue" bonds under the U.S. Bankruptcy Code. Even if an obligor under a special revenue bond were to seek protection from creditors under Chapter 9 of the U.S.United States Bankruptcy Code holders of the special(Bankruptcy Code). Special revenue bond should continue to receive timely payments of principal and interest during the bankruptcy proceeding, subject to the special revenues being sufficient to pay debt service and thebonds benefit from a lien on the special revenues, being subordinate to theafter deducting necessary operating expenses, of the project or system from which the revenues are derived. While "special revenues" acquired by the obligor after bankruptcy remain subject to the pre-petition pledge, special revenue bonds may be adjusted if their claim is determined to be "undersecured."
Non-U.S. Public Finance Obligations The Company insures and reinsures a number of different types of non-U.S. public finance obligations, which consist of both infrastructure projects and other projects essential for municipal function such as regulated utilities. Credit support for the exposures written by the Company may come from a variety of sources, including some combination of subordinated tranches, over-collateralization or cash reserves. Additional support also may be provided by transaction provisions intended to benefit noteholders or credit enhancers. The types of non-U.S. public finance securities the Company insures and reinsures include the following:
Regulated Utility Obligations are issued by government-regulated providers of essential services and commodities, including electric, water and gas utilities. The majority of the Company's international regulated utility business is conducted in the U.K.
Infrastructure Finance Obligations are obligations issued by a variety of entities engaged in the financing of international infrastructure projects, such as roads, airports, ports, social infrastructure, and other physical assets delivering essential services supported either by long-term concession arrangements with a public sector entity or a regulatory regime. The majority of the Company's international infrastructure business is conducted in the U.K.
Regulated Utilities Obligations are issued by government-regulated providersSovereign and Sub-Sovereign primarily includes obligations of essential services and commodities, including electric, water and gas utilities. The majoritylocal, municipal, regional or national governmental authorities or agencies outside of the Company's international regulated utility business is conducted in the U.K.United States.
Renewable Energy Bonds are obligations backed by renewable energy sources, such as solar, wind farm, hydroelectric, geothermal and fuel cell.
Pooled Infrastructure Obligations are synthetic asset-backed obligations that take the form of CDS obligations or credit-linked notes that reference either infrastructure finance obligations or a pool of such obligations, with a defined deductible to cover credit risks associated with the referenced obligations.
Other Public Finance Obligations include obligations of local, municipal, regional or national governmental authorities or agencies.agencies not generally described in any of the other categories above.
U.S. and Non-U.S. Structured Finance Obligations The Company insures and reinsures a number of different types of U.S. and non-U.S. structured finance obligations. Credit support for the exposures written by the Company may come from a variety of sources, including some combination of subordinated tranches, excess spread, over-collateralization or cash reserves. Additional support also may be provided by transaction provisions intended to benefit noteholders or credit enhancers. The types of U.S. and Non-U.S. Structured Financenon-U.S. structured finance obligations the Company insures and reinsures include the following:
Pooled Corporate Obligations are securities primarily backed by various types of corporate debt obligations, such as secured or unsecured bonds, bank loans or loan participations and trust preferred securities (TruPS). These securities are often issued in "tranches," with subordinated tranches providing credit support to the more senior tranches. The Company's financial guaranty exposures generally are to the more senior tranches of these issues.
Residential Mortgage-Backed Securities (RMBS) are obligations backed by closed-end and open-end first and second lien mortgage loans on one-to-four family residential properties, including condominiums and cooperative apartments. The Company has not insured a RMBS transaction since January 2008, although it has acquired RMBS insurance exposures since that time in connection with its acquisition or reinsurance of legacy financial guaranty portfolios. First lien mortgage loan products in these transactions include fixed rate, adjustable rate and option adjustable-rate mortgages. The credit quality of borrowers covers a broad range, including "prime","prime," "subprime" and "Alt-A"."Alt-A." A prime borrower is generally defined as one with strong risk characteristics as measured by factors such as payment history, credit score, and debt-to-income ratio. A subprime borrower is a borrower with higher risk characteristics, usually as determined by credit score and/or credit history. An Alt-A borrower is generally defined as a prime quality borrower that lacks certain ancillary characteristics, such as fully documented income. The Company has not insured a RMBS transaction since January 2008.
Insurance Securitization Obligations are obligations secured by the future earnings from pools of various types of insurance/insurance and reinsurance policies and income produced by invested assets.
Consumer Receivables Securities are obligations backed by non-mortgage consumer receivables, such as student loans, automobile loans and leases, manufactured home loans and other consumer receivables.
Pooled Corporate Obligations are securities primarily backed by various types of corporate debt obligations, such as secured or unsecured bonds, bank loans or loan participations and trust preferred securities. These securities are often issued in "tranches," with subordinated tranches providing credit support to the more senior tranches. The Company's financial guaranty exposures generally are to the more senior tranches of these issues.
Financial Products Business"Business is how the Company refers to the guaranteed investment contracts (GICs) portion of a line of business previously conducted by AGMHAssured Guaranty Municipal Holdings Inc. (AGMH) that the Company did not acquire when it purchased AGMH in 2009 from Dexia SA and that is being run off. That line of business was comprisedconsisted of AGMH's guaranteed investment contracts business, its medium term notes business and the equity payment agreements associated with AGMH's leveraged lease business. Assured Guaranty is indemnified byAlthough Dexia SA and certain of its affiliates (Dexia) assumed the liabilities related to such businesses when the Company purchased AGMH, AGM policies related to such businesses remained outstanding. Assured Guaranty is indemnified by Dexia against loss from the former Financial Products Business.
Until November 2008, AGMH’s former financial products segment had been in the business of borrowing funds through the issuance of GICs insured by AGM and reinvesting the proceeds in investments that met AGMH’s investment criteria. In June 2009, in connection with the Company's acquisition of AGMH from Dexia Holdings Inc., Dexia SA, the ultimate parent of Dexia Holdings Inc., and certain of its affiliates, entered into a number of agreements intended to mitigate the credit, interest rate and liquidity risks associated with the GIC business and the related AGM insurance policies. Some of those agreements have since terminated or expired, or been modified. As of December 31, 2019, the aggregate accreted GIC balance was approximately $1.0 billion, compared with approximately $10.2 billion as of December 31, 2009. As of December 31, 2019, the aggregate fair market value of the assets supporting the GIC business plus cash and positive derivative value exceeded by nearly $0.9 billion the aggregate principal amount of all outstanding GICs and certain other business and hedging costs of the GIC business.
AGMH's financial products business had also issued medium term notes insured by AGM, reinvesting the proceeds in investments that met AGMH's investment criteria. As of December 31, 2019, only $199 million of insured medium term notes remain outstanding.
The financial products business also included the equity payment undertaking agreement portion of the leveraged lease business, described in Liquidity and Capital Resources, Liquidity Requirements and Sources, Insurance Subsidiaries.
Commercial Receivables Securities are obligations backed by equipment loans or leases, aircraft and aircraft engine financings, business loans and trade receivables. Credit support is derived from the cash flows generated by the underlying obligations, as well as property or equipment values as applicable.
Commercial Mortgage-Backed Securities (CMBS) are obligations backed by pools of commercial mortgages on office, multi-family, retail, hotel, industrial and other specialized or mixed-use properties.
Other Structured Finance Obligations are obligations backed by assets not generally described in any of the other described categories. One
Insurance Portfolio - Specialty Insurance and Reinsurance
The Company also provides specialty insurance and reinsurance in transactions with similar risk profiles to its structured finance exposures written in financial guaranty form. The Company provides such type of asset is a tax benefit to be realized by an investor in one of the Federal or state programs that permit such investor to receive a credit against taxes (such as Federal corporate income tax or statespecialty insurance premium tax)and reinsurance, for making qualified investments in specified enterprises, typically located in designated low-income areas.example, for life insurance transactions and aircraft residual value insurance (RVI) transactions.
Credit PolicyExposure Limits, Underwriting Procedures, and Underwriting Procedure
Credit Policy
Exposure Limits
The Company establishes exposure limits and underwriting criteria for obligors, sectors and countries, and in the case of structured finance and infrastructure exposures, for individual insurance transactions. Risk exposure limits for single obligors are based on the Company's assessment of potential frequency and severity of loss as well as other factors, such as historical and stressed collateral performance. Sector limits are based on the Company’s view of stress losses for the sector and on its assessment of intra-sector correlation. Country limits are based on the size and stability of the relevant economy, and the Company’s view of the political environment and legal system. All of the foregoing limits are established in relation to the Company's capital base.
Underwriting Procedures
Each insurance transaction underwritten by the Company involves persons with different skills and backgrounds across various departments within the Company. The Company's insurance transaction underwriting teams include both underwriters and lawyers, who analyze the structure of a potential transaction and the credit and legal issues pertinent to the particular line of business or asset class, and accounting and finance personnel, who review the more complex transactions to determine the appropriate accounting treatment.
Upon completion of the underwriting analysis, the underwriter prepares a formal credit report that is submitted to a credit committee for review. An oral presentation is usually made to the committee, followed by questions from committee members and discussion among the committee members and the underwriters. In some cases, additional information may be presented at the meeting or required to be submitted prior to approval. Each credit committee decision is documented and any further requirements, such as specific terms or evidence of due diligence, are noted. The Company's credit committees assess each insurance transaction underwritten by the Company and are composed of senior officers of the Company generally excluding those senior officers responsible for business origination. The committees are organized by asset class, such as for public finance or structured finance, and along regulatory lines. For certain small transactions, the credit decision may be delegated by the credit committee to a sub-committee composed of members of the credit committee.
Upon approval by the credit committee, the underwriter, working with the responsible attorney, is responsible for closing the transaction and issuing the policy. At policy issuance, the underwriter and the responsible attorney certify that the transaction closed meets the terms and conditions agreed to by the credit committee.
Credit Policy
U.S. Public Finance
For U.S. public finance transactions, the Company's underwriters generally analyze the issuer's historical financial statements and, where warranted, develop stress case projections to test the issuer's ability to make timely debt service payments under stressful economic conditions.
The Company focuses principally on the credit quality of the obligor based on population size and trends, wealth factors, and strength of the economy. The Company evaluates the obligor’s liquidity position; its fiscal management policies and track record; its ability to raise revenues and control expenses; and its exposure to derivative contracts and to debt subject to acceleration. The Company assesses the obligor’s pension and other post-employment benefits obligations and funding policies and evaluates the obligor’s ability to adequately fund such obligations in the future. The Company analyzes other critical risk factors including the type of issue; the repayment source; pledged security, if any; the presence of restrictive covenants and the tenor of the risk. The Company also considers the ability of obligors to file for bankruptcy or receivership under applicable statutes (and on related statutes that provide for state oversight or fiscal control over financially troubled obligors). In addition,The Company also considers the environmental impact and risks associated with the transaction. The Company weighs the risk of a rating agency downgrade of an obligation's underlying uninsured rating.
For certain transactions, underwriting considerations may also include: the importance of the proposed project to the community; the financial management of a specific project; the potential refinancing risk; and legal or administrative risks.
In cases of not-for-profit institutions, such as healthcare issuers and private higher education issuers, the Company emphasizesfocuses on the financial stability of the institution, its competitive position and its management experience.
ForThe Company’s credit policy for U.S. infrastructure transactions the Company's due diligence is generally the same as it is for internationalsubstantially similar to that of non-U.S. infrastructure transactions as described below.
U.S. structured finance obligations generally present three distinct forms of risk: asset risk, pertaining to the amount and quality of assets underlying an issue; structural risk, pertaining to the extent to which an issue's legal structure provides protection from loss; and execution risk, which is the risk that poor performance by a servicer or collateral manager contributes to a decline in the cash flow available to the transaction. Each of these risks is addressed through the Company's underwriting process.
Generally, the amount and quality of asset coverage required with respect to a structured finance exposure is dependent upon both the historic performance of the asset class, as well as the Company’s view of the future performance of the subject assets. Future performance expectations are developed from historical loss experience, taking into account economic, social and political factors affecting that asset class as well as, to the extent feasible, the subject assets themselves. Conclusions are then drawn about the amount of over-collateralization or other credit enhancement necessary in a particular transaction in order to protect investors (and therefore the insurer or reinsurer) against poor asset performance. In addition, structured securities usually are designed to protect investors (and therefore the insurer or reinsurer) from the bankruptcy or
insolvency of the entity that originated the underlying assets, as well as the bankruptcy or insolvency of the servicer or manager of those assets.
The Company conducts extensive due diligence on the collateral that supports its insured transactions. The principal focus of the due diligence is to confirm the underlying collateral was originated in accordance with the stated underwriting criteria of the asset originator. To this end, such collateral is reviewed, either internally by the Company or by outside consultants that the Company engages. The Company also conducts audits of servicing or other management procedures, reviewing critical aspects of these procedures such as cash management and collections. The Company may, for certain transactions, obtain background checks on key managers of the originator, servicer or manager of the obligations underlying that transaction.Non-U.S. Transactions
In general,For non-U.S. transactions are comprised of structured finance transactions, transactions with regulated utilities, or infrastructure transactions. For these transactions, the Company undertakes an analysis of the country or countries in which the risk resides, which includes political risk as well as economic and demographic characteristics. For each transaction, the Company also performs an assessment of the legal framework governing the transaction and the laws affecting the underlying assets supporting the obligations to be insured.
In general, non-U.S. transactions consist of transactions with regulated utilities or infrastructure transactions. The underwriting of structured finance and regulated utilities is generally the same as for U.S. transactions, but for considerations relatedwith additional consideration given to factors specific to the specific country as described in the previous paragraph. relevant jurisdiction.
For non-U.S. infrastructure transactions, the Company reviews the type of project (e.g., utility, hospital, road, social housing, transportation or student accommodation) and the source of repayment of the debt. For certain transactions, debt service and operational expenses are covered by availability payments made by either a governmental entity or a not-for-profit entity. The availability payments are due if the project is available for use, regardless of whether the project actually is in use. The principal risks for such transactions are construction risk and operational risk. The project must be completed on time and must be available for use during the life of the concession. For other transactions, notably transactions secured by toll-roads and student accommodation, revenues derived from the project must be sufficient to make debt service payments as well as cover operating expenses during the concession period.
For infrastructure transactions, underwriters generally use financial models in order to evaluate the ability of the transaction to generate adequate cash flow to service the debt under a variety of scenarios. The models include economically stressed scenarios that the underwriters use for their assessment of the potential credit risk inherent in a particular transaction. Stress models developed internally by the Company's underwriters reflect both empirical research and information gathered from third parties, such as rating agencies or investment banks. The Company undertakes due diligencemay also engage advisors such as consultants and external counsel to assess demand risksassist in such projects and often uses consultants to help assess future demand and revenue and expense projections.analyzing a transaction's financial or legal risks.
The Company’s due diligence for infrastructure projects also includes: a financial review of the entity seeking the development of the project (usually a governmental entity or university); a financial and operational review of the developer, the construction companies, and the project operator; and a financial review of the various providers of operational financial protection for the bondholders (and therefore the insurer), including construction surety providers, letter-of-credit providers, liquidity banks or account banks. The Company uses outside consultants to review the construction program and to assess whether the project can be completed on time and on budget. The Company projects the cost of replacing the construction company, including delays in construction, in the event that a construction company is unable to complete the construction for any reason. Construction security packages are sized appropriately to cover these risks and the Company requires such coverage from credit-worthy institutions.
Underwriting Procedure
Each transaction underwritten byPrior to the global financial crisis of 2008, the Company involves personsinsured non-U.S. structured finance transactions, and continues to seek opportunities to insure such transactions. If it does, it expects its underwriting process generally to be the same as for U.S. structured finance transactions described below, but with different expertise across various departments within the Company. The Company's transaction underwriting teams include both underwriting and legal personnel, who analyze the structure of a potential transaction and the credit and legal issues pertinentadditional consideration given to factors specific to the particular linerelevant jurisdiction.
U.S. Structured Finance
Structured finance obligations generally present three distinct forms of businessrisk: asset risk, pertaining to the amount and quality of assets underlying an issue; structural risk, pertaining to the extent to which an issuer's legal structure provides protection from loss; and execution risk, which is the risk that poor performance by a servicer or asset class, and accounting and finance personnel, who reviewcollateral manager contributes to a decline in the more complex transactions for compliance with applicable accounting standards and investment guidelines.
Incash flow available to the public finance portiontransaction. Each of these risks is addressed through the Company's financial guaranty direct business, underwriters generally analyze the issuer's historical financial statements and, where warranted, develop stress case projections to test the issuers' ability to make timely debt service payments under stressful economic conditions. In theunderwriting process.
For structured and infrastructure finance portions of the Company's financial guaranty direct business,transactions, underwriters generally use computer-based financial models in order to evaluate the ability of the transaction to generate adequate cash flow to service the debt under a variety of hypothetical scenarios. The models include economically stressed scenarios that the underwriters use for their assessment of the potential credit risk inherent in a particular transaction. Stress models developed internally by the Company's underwriters reflect both empirical research and information gathered from third parties, such as rating agencies or investment banks. Generally, the amount and quality of asset coverage
required with respect to a structured finance exposure is dependent upon both the historic performance of the asset class, as well as the Company’s view of the future performance of the subject assets.
The Company may also engage advisors such as consultants and external counsel to assist in analyzing a transaction's financial or legal risks. The Company may also conduct a due diligence review that includes, among other things, a site visit to the project or facility, meetings with issuer management, review of underwriting and operational procedures, file reviews, and review of financial procedures and computer systems.
In addition, structured securities usually are designed to protect investors (and therefore the insurer or reinsurer) from the bankruptcy or insolvency of the entity that originated the underlying assets, as well as the bankruptcy or insolvency of the servicer or manager of those assets.
The Company conducts due diligence on the collateral that supports its insured transactions. The principal focus of the due diligence is to confirm the underlying collateral was originated in accordance with the stated underwriting criteria of the asset originator. The Company also conducts audits of servicing or other management procedures, reviewing critical aspects of these procedures such as cash management and collections. The Company may, for certain transactions, obtain background checks on key managers of the originator, servicer or manager of the obligations underlying that transaction.
Importance of Financial Strength Ratings
Low financial strength ratings or uncertainty over the Company's ability to maintain its financial strength ratings for its insurance operating companies would have a negative impact on issuers' and investors' perceptions of the value of the Company's insurance product. Therefore, the Company manages its business with the goal of achieving high financial strength ratings, preferably the highest that an agency will assign to a financial guarantor. However, the models used by rating agencies differ, presenting conflicting goals that may make it inefficient or impractical to reach the highest rating level. In addition, the models are not fully transparent, contain subjective factors and may change.
Insurance financial strength ratings reflect a rating agency's opinion of an insurer's ability to pay under its insurance policies and contracts in accordance with their terms. The rating is not specific to any particular policy or contract. It does not refer to an insurer's ability to meet non-insurance obligations and is not a recommendation to purchase any policy or contract issued by an insurer or to buy, hold, or sell any security insured by an insurer. The insurance financial strength ratings assigned by the rating agencies are based upon factors that the rating agencies believe are relevant to policyholders and are not directed toward the protection of investors in AGL's common shares. Ratings reflect only the views of the respective rating agencies assigning them and are subject to continuous review and revision or withdrawal at any time.
Following the financial crisis, the rating process has been challenging for the Company due to a number of factors, including:
| |
| • | Instability of Rating Criteria and Methodologies. Rating agencies purport to issue ratings pursuant to published rating criteria and methodologies. Beginning during the financial crisis, the rating agencies made material changes to their rating criteria and methodologies applicable to financial guaranty insurers, sometimes through formal changes and other times through ad hoc adjustments to the conclusions reached by existing criteria. Furthermore, these criteria and methodology changes were typically implemented without any transition period, making it difficult for an insurer to comply with new standards. |
| |
| • | Instability of Severe Stress Case Loss Assumptions. A major component in arriving at a financial guaranty insurer's rating has been the rating agency’s assessment of the insurer’s capital adequacy, with each rating agency employing its own proprietary model. These capital adequacy approaches include “stress case” loss assumptions for various risks or risk categories. Since the financial crisis, the rating agencies have at various times materially increased stress case loss assumptions for various risks or risk categories, in some cases later reducing such stress case losses. This approach has made predicting the amount of capital required to maintain or attain a certain rating more difficult. |
| |
| • | More Reliance on Qualitative Rating Criteria. In prior years, the financial strength ratings of the Company’s insurance subsidiaries were largely consistent with the rating agency’s assessment of the insurers’ capital adequacy, such that a rating downgrade could generally be avoided by raising additional capital or otherwise improving capital adequacy under the rating agency’s model. In recent years, however, both S&P Global Ratings, a division of Standard & Poor's Financial Services LLC (S&P) and Moody’s Investors Service, Inc. (Moody’s) have applied other factors, some of which are subjective, such as the insurer's business strategy and franchise value or the anticipated future demand for its product, to justify ratings for the Company’s insurance subsidiaries significantly below the ratings implied by their own capital adequacy models. Currently, for example, S&P has concluded that Assured Guaranty has |
“AAA” capital adequacy under the S&P model (but subject to a downward adjustment due to a “largest obligor test”) and Moody’s has concluded that AGM has “Aa” capital adequacy under the Moody’s model (offset by other factors including the rating agency’s assessment of competitive profile, future profitability and market share).
Despite the difficult rating agency process following the financial crisis, the Company has been able to maintain strong financial strength ratings. However, if a substantial downgrade of the financial strength ratings of the Company's insurance subsidiaries were to occur in the future, such downgrade would adversely affect its business and prospects and, consequently, its results of operations and financial condition. The Company believes that if the financial strength ratings of any of its insurance subsidiaries were downgraded from their current levels, such downgrade could result in downward pressure on the premium that such insurance subsidiary would be able to charge for its insurance. The Company periodically assesses the value of each rating assigned to each of its companies, and may as a result of such assessment request that a rating agency add or drop a rating from certain of its companies. For example, Kroll Bond Rating Agency (KBRA) ratings were first assigned to MAC in 2013, to AGM in 2014, to AGC in 2016 and to AGE UK in 2018; an A.M. Best Company, Inc. (Best) rating was first assigned to AGRO in 2015; while a Moody's rating was never requested for MAC, was dropped from AG Re and AGRO in 2015, and was the subject of a rating withdrawal request in the case of AGC (such request was declined).
The Company believes that so long as AGM, AGC and/or MAC continue to have financial strength ratings in the double-A category from at least one of the legacy rating agencies (S&P or Moody’s), they are likely to be able to continue writing financial guaranty business with a credit quality similar to that historically written. However, if neither legacy rating agency maintained financial strength ratings of AGM, AGC and/or MAC in the double-A category, or if either legacy rating agency were to downgrade AGM, AGC and/or MAC below the single-A level, it could be difficult for the Company to originate the current volume of new financial guaranty business with comparable credit characteristics.
See Item 1A. Risk Factors, Strategic Risks captioned “A downgrade of the financial strength or financial enhancement ratings of any of the Company's insurance and reinsurance subsidiaries would adversely affect its business and prospects and, consequently, its results of operations and financial condition” and Part II, Item 8, Financial Statements and Supplementary Data, Note 3, Ratings, for more information about the Company's ratings.
Competition
Assured Guaranty is the market leader in the financial guaranty industry. The Company's position in the market benefits from its ability to maintain strong financial strength ratings, its strong claims-paying resources, its proven willingness and ability to make claim payments to policyholders after obligors have defaulted, and its ability to achieve recoveries in respect of the claims that it has paid on insured residential mortgage-backed and other securities and to resolve its troubled municipal exposures.
Assured Guaranty's principal competition is in the form of obligations that issuers decide to issue on an uninsured basis. In the U.S. public finance market, when interest rates are low, investors may prefer greater yield over insurance protection, and issuers may find the cost savings from insurance less compelling. Over the last several years, interest rates generally have been lower than historical norms. In 2019, municipal interest rates reached new lows and credit spreads tightened further. The 30-year AAA Municipal Market Data (MMD) rate started the year off at 3.02% and ended the year at 2.09%. As a result, the difference in yield (or the credit spread) between a bond insured by Assured Guaranty and an uninsured bond has provided comparatively little room for issuer savings and insurance premium. In the U.S. public finance market, market penetration of municipal bond insurance remained approximately 5.9% of the par amount of new issues sold for both 2019 and 2018. The Company believes the relatively low market penetration rates in 2019 and 2018 were in part due to the extremely low interest rates prevailing during most of that period.
In the U.S. public finance market, Assured Guaranty is the only financial guaranty company active before the global financial crisis of 2008 that has maintained sufficient financial strength to write new business continuously since the crisis began. Assured Guaranty has only one direct competitor for financial guaranty, Build America Mutual Assurance Company (BAM), a mutual insurance company that commenced business in 2012 and is active only in the public finance market.
The Company estimates that, of the new U.S. public finance bonds sold with insurance in 2019, the Company insured approximately 60% of the par, while BAM insured approximately 40%. BAM is effective in competing with the Company for small to medium sized U.S. public finance transactions in certain sectors. BAM sometimes prices its guarantees for such transactions at levels the Company does not believe produces an adequate rate of return and so does not match, but BAM's pricing and underwriting strategies may have a negative impact on the amount of premium the Company is able to charge for its insurance for such transactions. However, the Company believes it has competitive advantages over BAM due to: AGM's and MAC's larger capital base; AGM's ability to insure larger transactions and issuances in more diverse U.S. bond sectors;
Upon completionBAM's inability to date to generate profits and to increase its statutory capital meaningfully, its higher leverage ratios than those of AGM and MAC, and its unpaid debt obligations; and AGM's and MAC's strong financial strength ratings from multiple rating agencies (in the case of AGM, AA+ from KBRA, AA from S&P and A2 from Moody's, and in the case of MAC, AA+ from KBRA and AA from S&P, compared with BAM's AA solely from S&P). Additionally, as a public company with access to both the equity and debt capital markets, Assured Guaranty may have greater flexibility to raise capital, if needed.
In the global structured finance and infrastructure markets, Assured Guaranty is the only financial guaranty insurance company currently writing new guarantees. Management considers the Company’s greater diversification to be a competitive advantage in the long run because it means the Company is not wholly dependent on conditions in any one market. In the international infrastructure finance market, the uninsured execution serving as the Company’s principal competition occurs primarily in privately funded transactions where no bonds are sold in the public markets. In the structured finance market, the uninsured execution occurs in both public and primary transactions primarily where bonds are sold with sufficient credit or structural enhancement embedded in transactions, such as through overcollateralization, first loss insurance, excess spread or other terms, to make the bonds attractive to investors without bond insurance.
In the future, additional new entrants into the financial guaranty industry could reduce the Company's new business prospects, including by furthering price competition or offering financial guaranty insurance on transactions with structural and security features that are more favorable to the issuers than those required by Assured Guaranty. However, the Company believes that the presence of multiple guarantors might also increase the overall visibility and acceptance of the underwriting analysis,product by a broadening group of investors, and the underwriter prepares a formal credit reportfact that is submittedinvestors are willing to a credit committee for review. An oral presentation is usually madecommit fresh capital to the committee, followed by questions from committee members and discussion amongindustry may promote market confidence in the committee members and the underwriters. product.
In some cases, additional information may be presented at the meeting or requiredaddition to be submitted prior to approval. Eachmonoline insurance companies, Assured Guaranty competes with other forms of credit committee decision is documented and any further requirements,enhancement, such as specific termsletters of credit or evidencecredit derivatives provided by banks and other financial institutions, some of due diligence,which are noted. The Company's credit committees are composedgovernmental enterprises, or direct guaranties of senior officers of the Company. The committees are organized by asset class, such as for public finance ormunicipal, structured finance or along regulatory lines,other debt by federal or state governments or government sponsored or affiliated agencies. Alternative credit enhancement structures, and in particular federal government credit enhancement or other programs, can interfere with the Company's new business prospects, particularly if they provide direct governmental-level guaranties, restrict the use of third-party financial guaranties or reduce the amount of transactions that might qualify for financial guaranties.
The Company believes that issuers and investors in securities will continue to assesspurchase financial guaranty insurance, especially if interest rates rise and credit spreads widen. U.S. municipalities have budgetary requirements that are best met through financings in the various potential exposures.fixed income capital markets. Historically, smaller municipal issuers have frequently used financial guaranties in order to access the capital markets with new debt offerings at a lower all-in interest rate than on an unguaranteed basis. In addition, the Company expects long-term debt financings for infrastructure projects will grow throughout the world, as will the financing needs associated with privatization initiatives or refinancing of infrastructure projects in developed countries.
The Company evaluates the amount of capital it requires based on an internal capital model as well as rating agency models and insurance regulations. The Company believes it has excess capital based on these measures, and has been returning some of its excess capital to shareholders by repurchasing its common shares and paying dividends, and has been deploying some of its excess capital to acquire financial guaranty portfolios, asset management companies and alternative investments.
Asset Management
The Company completed the BlueMountain Acquisition on October 1, 2019, for a purchase price of $157 million. The Company contributed $60 million of cash to BlueMountain at closing, and contributed an additional $30 million in cash in February 2020, for certain restructuring costs and future strategic investments. As of the date of acquisition, BlueMountain managed or serviced $18.3 billion in assets across CLOs and opportunity funds that build on its corporate credit, asset-backed finance and healthcare structured capital experience, as well as certain legacy hedge and opportunity funds now subject to an orderly wind-down. BlueMountain has managed structured finance, credit and special situation investments, with a track record dating back to 2003. As of December 31, 2019, BlueMountain, which now operates under the name “Assured Investment Management”, was a top-twenty CLO manager by assets under management (as reported by CreditFlux) and is led by an experienced CLO and loan research team, with a broad distribution channel. Assured Investment Management underwrites assets and structures investments while leveraging a technology-enabled risk platform.
The BlueMountain Acquisition and establishment of Assured Investment Management diversifies the Company into the asset management industry, with the goal of utilizing Assured Guaranty's core competency in credit while diversifying its revenues and expanding its marketing reach through a fee-based platform. Additionally, the Company believes that Assured Investment Management provides the Company an opportunity to deploy excess capital at attractive returns, improving the
risk-adjusted return on a portion of the investment portfolio and potentially increasing the amount of dividends certain of its insurance subsidiaries are permitted to pay under applicable regulations. The Company intends to initially invest $500 million of capital in funds managed by Assured Investment Management (Assured Investment Management funds) plus additional amounts in other accounts managed by Assured Investment Management. The Company intends to use these capital investments to (a) launch new products (CLOs and/or opportunity funds) on the Assured Investment Management platform and (b) enhance the returns of its own investment portfolio. As of December 31, 2019, the Company had invested approximately $79 million of the $500 million it intends to initially invest in Assured Investment Management funds.
The Company conducts its Asset Management business principally through BlueMountain Capital Management, LLC, a Delaware limited liability company located in New York. BlueMountain was organized in 2003.
Asset Management Products
CLOs are typically issued on a quarterly basis when market conditions permit and generally have a stated maturity of 12-13 years with a potential reinvestment period. Once the reinvestment period expires, the CLO’s noteholders will receive distributions through the maturity of the CLO (unless Assured Investment Management and the noteholders agree to reset the period of the CLOs for an extended reinvestment period).
Opportunity funds invest in a mix of strategies that may have higher concentrations in illiquid strategies. Typically, opportunity funds have limited redemption rights and instead offer contractual cashflow distributions based on the legal agreement of each respective opportunity fund.
In addition to CLOs and opportunity funds, the Company also manages legacy hedge and opportunity funds now subject to an orderly wind-down.
Asset Management Revenues
Fees in respect of investment advisory services are the largest components of revenues for the Asset Management segment. The Company is compensated for its investment advisory services generally through management fees charged to its advisory clients (Management Fees). The Company typically receives monthly Management Fees of 1/12 of a per annum fee of typically 1%-2% of the net assets of the hedge and opportunity funds. With respect to the CLOs, the Company typically receives a Management Fee made up of two components (i.e., a “Senior Investment Management Fee” of 0.15%-0.20%, as well as a “Subordinated Investment Management Fee” of 0.20%-0.35%, in each case, of the net assets of the CLO per annum).
In addition, with respect to CLOs and certain hedge and opportunity funds, the Company receives performance-based compensation (Performance Allocations/Fees) with respect to each calendar year or performance period, typically 10%-30% of net profits allocated to each investor in such vehicle on an annual basis, payable at the end of each year or performance period, as the case may be. With respect to CLOs and certain opportunity funds, the Company receives performance-based compensation on an internal rate of return calculation, if and to the extent a certain minimum rate of return (a “hurdle”) is exceeded. For certain hedge and opportunity funds, performance based-compensation is reduced by the amount of management fees paid over a specified period and/or subject to a “high-water mark” or loss carryforward provision. (A "high-water mark" provision typically requires that, once a performance fee is paid based on net asset value or other measure during a period, any subsequent performance fee be measured from that value, or high-water mark.)
Depending on the characteristics of the CLOs, hedge and/or opportunity funds, fees may be higher or lower. The Company reserves the right to waive some or all fees for certain investors, including investors affiliated with the Company. Further, to the extent that the Company’s hedge and/or opportunity funds are invested in the Company's managed/serviced CLOs, the Company may rebate any Management Fees and/or Performance Allocations/Fees earned from the CLOs to the extent that such fees are attributable to the hedge and opportunity funds’ holdings of CLOs also managed or serviced by the Company.
Consistent with its investment capabilities, the Company intends to continue to grow the Assured Investment Management platform's structured finance investment strategies. Since the establishment of the Assured Investment Management platform, the Company launched two opportunity funds, one focused on asset-backed finance and one focused on healthcare structured capital, with capital from the Company's Insurance segment. Also since the establishment of the Assured Investment Management platform, the Company launched two new CLOs and a CLO fund with capital from the Company's insurance segment and capital already managed in the Assured Investment Management platform.
Competition
The asset management industry is a highly competitive market. Assured Investment Management competes with many other firms in every aspect of the asset management industry, including raising funds, seeking investments, and hiring and retaining professionals. Some of Assured Investment Management’s asset management competitors are substantially larger and have considerably greater financial, technical and marketing resources. Certain of these competitors periodically raise significant amounts of capital in investment strategies that are also pursued by Assured Investment Management. Some of these competitors also may have a lower cost of capital and access to funding sources that are not available to Assured Investment Management and/or the Company, which may create further competitive disadvantages with respect to investment opportunities. In addition, some of these competitors may have higher risk tolerances or make different risk assessments, allowing them to consider a wider variety of investments and establish broader networks of business relationships.
Investment Portfolio
The Company's investment portfolio primarily consists of fixed maturity securities supporting its Insurance segment. The Asset Management segment and Corporate division primarily include short-term investments used to support business operations and corporate initiatives.
Investment income from the Company's investment portfolio is one of the primary sources of cash flow supporting its insurance operations and claim payments. The Company's total investment portfolio generated net investment income of $378 million, $395 million and $417 million in 2019, 2018 and 2017, respectively and equity in net earnings of investees of $4 million and $1 million in 2019 and 2018, respectively.
The Company's principal objectives in managing its investment portfolio are to maintain sufficient liquidity to cover unexpected stress in the insurance portfolio; to maximize after tax book income; to manage investment risk within the context of the underlying portfolio of insurance risk; and to preserve the highest possible ratings for each Assured Guaranty insurance operating company. If the Company's calculations with respect to its policy liabilities are incorrect or other unanticipated payment obligations arise, or if the Company improperly structures its investments to meet these liabilities, it could have unexpected losses, including losses resulting from forced liquidation of investments before their maturity. The investment policies of the Company's insurance subsidiaries are subject to insurance law requirements, and may change depending upon regulatory, economic and market conditions and the existing or anticipated financial condition and operating requirements, including the tax position, of the businesses. The performance of invested assets is subject to the ability of the Company and its external investment managers to select and manage appropriate investments.
Approximately 82% of the investment portfolio is externally managed by six investment managers: BlackRock Financial Management, Inc., Goldman Sachs Asset Management, L.P., New England Asset Management, Inc., Wellington Management Company, LLP, MacKay Shields LLC and Wasmer, Schroeder & Company, LLC. The Company's external investment managers have discretionary authority over the portion of the investment portfolio they manage within the limits of the investment guidelines approved by the Company's Board of Directors. Each manager is compensated based upon a fixed percentage of the market value of the portion of the portfolio being managed by such manager. BlackRock Financial Management, Inc. and Wellington Management Company LLP both own more than 5% of the Company's common shares, and the Company has a minority interest in Wasmer, Schroeder & Company, LLC. The Charles Schwab Corporation announced on February 24, 2020 that it had entered into an agreement to acquire Wasmer, Schroeder & Company, LLC, and that, subject to customary closing conditions, it expects to close the transaction in mid-2020. During the years ended December 31, 2019, 2018 and 2017, the Company recorded investment management fees and related expenses to external managers of $9 million, $9 million, and $9 million, respectively.
The Company internally manages a portion of its investment portfolio, primarily consisting of obligations that the Company purchases in connection with its loss mitigation or risk management strategy for its insured exposure (loss mitigation securities) or obtains as part of negotiated settlements with insured counterparties or under the terms of the financial guaranties. The Company held approximately $868 million and $1,190 million of securities, based on their fair value excluding the benefit of any insurance provided by the Company, as of December 31, 2019 and December 31, 2018, respectively. The Company has made minority investments in investment managers as part of its strategy of participating in that market and also makes other unrelated investments that it believes present attractive investment opportunities.
The Company intends to use the investment knowledge and experience in Assured Investment Management to expand the categories and types of investments included in its investment portfolio by both (a) initially investing $500 million of Insurance segment assets in Assured Investment Management funds plus additional amounts in other accounts managed by
Assured Investment Management and (b) expanding the categories and types of its alternative investments not managed by Assured Investment Management.
The portion of the Insurance segment’s portfolio that is invested in Assured Investment Management funds may be excluded from the amounts reported in the investment portfolio and instead reported in assets of consolidated investment vehicles in the Company’s consolidated statement of financial position if, under accounting principles generally accepted in the U.S. (GAAP), the Company is deemed to be the primary beneficiary. See Part II, Item 8, Financial Statements and Supplementary Data, Note 14, Variable Interest Entities for information on when and how such funds and CLOs require consolidation.
In instances where consolidation is required, the assets and liabilities of consolidated Assured Investment Management funds and CLOs are reported in the line items captioned “assets of consolidated investment vehicles” and “liabilities of consolidated investment vehicles,” resulting in a gross-up of the Company’s consolidated assets and liabilities. Redeemable and nonredeemable noncontrolling interests are also recorded for the portion of such consolidated funds’ capital attributable to affiliated or third party investors. Changes in fair value are recorded in other income.
The fair value of the Insurance segment’s investments in Assured Investment Management funds as of December 31, 2019 was $77 million. As of December 31, 2019, all funds and the underlying CLO in which one of the consolidated funds invests, were consolidated. Such investment is not included in the amounts reported in the investment portfolio, but instead, is presented as follows on the consolidated balance sheet: assets of consolidated investment vehicles of $572 million, liabilities of consolidated investment vehicles of $482 million, and redeemable and nonredeemable noncontrolling interests of $13 million.
Risk Management ProceduresImportance of Financial Strength Ratings
Organizational Structure
The Company's policies and procedures relating to risk assessment and risk management are overseen by its Board of Directors (the Board). The Board takes an enterprise-wide approach to risk management that is designed to supportLow financial strength ratings or uncertainty over the Company's business plans atability to maintain its financial strength ratings for its insurance operating companies would have a reasonable levelnegative impact on issuers' and investors' perceptions of risk. A fundamental partthe value of risk assessment and risk management is not only understanding the risks a company faces and what steps management is taking to manage those risks, but also understanding what level of risk is appropriate for the Company. The Board annually approves the Company's business plan, factoring risk management into account. It also approves the Company's risk appetite statement, which articulates the Company's tolerance for risk and describes the general types of risk thatinsurance product. Therefore, the Company acceptsmanages its business with the goal of achieving high financial strength ratings, preferably the highest that an agency will assign to a financial guarantor. However, the models used by rating agencies differ, presenting conflicting goals that may make it inefficient or attemptsimpractical to avoid. The involvement ofreach the Board in setting the Company's business strategy is a key part of its assessment of management's risk tolerance and also a determination of what constitutes an appropriate level of risk for the Company.
While the Board has the ultimate oversight responsibility for the risk management process, various committees of the Board also have responsibility for risk assessment and risk management. The Risk Oversight Committee of the Board oversees the standards, controls, limits, underwriting guidelines and policies that the Company establishes and implements in respect of credit underwriting and risk management. It focuses on management's assessment and management of both (i) credit risks and (ii) other risks, including, but not limited to, financial, legal and operational risks, and risks relating to the Company's reputation and ethical standards.highest rating level. In addition, the Audit Committeemodels are not fully transparent, contain subjective factors and may change.
Insurance financial strength ratings reflect a rating agency's opinion of an insurer's ability to pay under its insurance policies and contracts in accordance with their terms. The rating is not specific to any particular policy or contract. It does not refer to an insurer's ability to meet non-insurance obligations and is not a recommendation to purchase any policy or contract issued by an insurer or to buy, hold, or sell any security insured by an insurer. The insurance financial strength ratings assigned by the rating agencies are based upon factors that the rating agencies believe are relevant to policyholders and are not directed toward the protection of investors in AGL's common shares. Ratings reflect only the views of the Board is responsiblerespective rating agencies assigning them and are subject to continuous review and revision or withdrawal at any time.
Following the financial crisis, the rating process has been challenging for amongthe Company due to a number of factors, including:
| |
| • | Instability of Rating Criteria and Methodologies. Rating agencies purport to issue ratings pursuant to published rating criteria and methodologies. Beginning during the financial crisis, the rating agencies made material changes to their rating criteria and methodologies applicable to financial guaranty insurers, sometimes through formal changes and other times through ad hoc adjustments to the conclusions reached by existing criteria. Furthermore, these criteria and methodology changes were typically implemented without any transition period, making it difficult for an insurer to comply with new standards. |
| |
| • | Instability of Severe Stress Case Loss Assumptions. A major component in arriving at a financial guaranty insurer's rating has been the rating agency’s assessment of the insurer’s capital adequacy, with each rating agency employing its own proprietary model. These capital adequacy approaches include “stress case” loss assumptions for various risks or risk categories. Since the financial crisis, the rating agencies have at various times materially increased stress case loss assumptions for various risks or risk categories, in some cases later reducing such stress case losses. This approach has made predicting the amount of capital required to maintain or attain a certain rating more difficult. |
| |
| • | More Reliance on Qualitative Rating Criteria. In prior years, the financial strength ratings of the Company’s insurance subsidiaries were largely consistent with the rating agency’s assessment of the insurers’ capital adequacy, such that a rating downgrade could generally be avoided by raising additional capital or otherwise improving capital adequacy under the rating agency’s model. In recent years, however, both S&P Global Ratings, a division of Standard & Poor's Financial Services LLC (S&P) and Moody’s Investors Service, Inc. (Moody’s) have applied other factors, some of which are subjective, such as the insurer's business strategy and franchise value or the anticipated future demand for its product, to justify ratings for the Company’s insurance subsidiaries significantly below the ratings implied by their own capital adequacy models. Currently, for example, S&P has concluded that Assured Guaranty has |
“AAA” capital adequacy under the S&P model (but subject to a downward adjustment due to a “largest obligor test”) and Moody’s has concluded that AGM has “Aa” capital adequacy under the Moody’s model (offset by other matters, reviewing policies and processes related to the evaluation of risk assessment and risk management,factors including the Company's majorrating agency’s assessment of competitive profile, future profitability and market share).
Despite the difficult rating agency process following the financial risk exposures andcrisis, the steps managementCompany has takenbeen able to monitor and control such exposures. It also reviews compliance with legal and regulatory requirements. The Compensation Committeemaintain strong financial strength ratings. However, if a substantial downgrade of the Board reviews compensation-related risks to the Company. The Finance Committee of the Board oversees the investmentfinancial strength ratings of the Company's investment portfolioinsurance subsidiaries were to occur in the future, such downgrade would adversely affect its business and prospects and, consequently, its results of operations and financial condition. The Company believes that if the Company's capital structure, liquidity, financing arrangements,financial strength ratings of any of its insurance subsidiaries were downgraded from their current levels, such downgrade could result in downward pressure on the premium that such insurance subsidiary would be able to charge for its insurance. The Company periodically assesses the value of each rating assigned to each of its companies, and may as a result of such assessment request that a rating agency matters,add or drop a rating from certain of its companies. For example, Kroll Bond Rating Agency (KBRA) ratings were first assigned to MAC in 2013, to AGM in 2014, to AGC in 2016 and any corporate development activitiesto AGE UK in support2018; an A.M. Best Company, Inc. (Best) rating was first assigned to AGRO in 2015; while a Moody's rating was never requested for MAC, was dropped from AG Re and AGRO in 2015, and was the subject of a rating withdrawal request in the Company's financial plan. The Nominating and Governance Committeecase of the Board oversees risk at the Company by developing appropriate corporate governance guidelines and identifying qualified individuals to become board members.AGC (such request was declined).
The Company has establishedbelieves that so long as AGM, AGC and/or MAC continue to have financial strength ratings in the double-A category from at least one of the legacy rating agencies (S&P or Moody’s), they are likely to be able to continue writing financial guaranty business with a numbercredit quality similar to that historically written. However, if neither legacy rating agency maintained financial strength ratings of management committeesAGM, AGC and/or MAC in the double-A category, or if either legacy rating agency were to develop underwriting and risk management guidelines, policies and proceduresdowngrade AGM, AGC and/or MAC below the single-A level, it could be difficult for the Company to originate the current volume of new financial guaranty business with comparable credit characteristics.
See Item 1A. Risk Factors, Strategic Risks captioned “A downgrade of the financial strength or financial enhancement ratings of any of the Company's insurance and reinsurance subsidiaries would adversely affect its business and prospects and, consequently, its results of operations and financial condition” and Part II, Item 8, Financial Statements and Supplementary Data, Note 3, Ratings, for more information about the Company's ratings.
Competition
Assured Guaranty is the market leader in the financial guaranty industry. The Company's position in the market benefits from its ability to maintain strong financial strength ratings, its strong claims-paying resources, its proven willingness and ability to make claim payments to policyholders after obligors have defaulted, and its ability to achieve recoveries in respect of the claims that it has paid on insured residential mortgage-backed and other securities and to resolve its troubled municipal exposures.
Assured Guaranty's principal competition is in the form of obligations that issuers decide to issue on an uninsured basis. In the U.S. public finance market, when interest rates are tailoredlow, investors may prefer greater yield over insurance protection, and issuers may find the cost savings from insurance less compelling. Over the last several years, interest rates generally have been lower than historical norms. In 2019, municipal interest rates reached new lows and credit spreads tightened further. The 30-year AAA Municipal Market Data (MMD) rate started the year off at 3.02% and ended the year at 2.09%. As a result, the difference in yield (or the credit spread) between a bond insured by Assured Guaranty and an uninsured bond has provided comparatively little room for issuer savings and insurance premium. In the U.S. public finance market, market penetration of municipal bond insurance remained approximately 5.9% of the par amount of new issues sold for both 2019 and 2018. The Company believes the relatively low market penetration rates in 2019 and 2018 were in part due to their respective businesses, providing multiplethe extremely low interest rates prevailing during most of that period.
In the U.S. public finance market, Assured Guaranty is the only financial guaranty company active before the global financial crisis of 2008 that has maintained sufficient financial strength to write new business continuously since the crisis began. Assured Guaranty has only one direct competitor for financial guaranty, Build America Mutual Assurance Company (BAM), a mutual insurance company that commenced business in 2012 and is active only in the public finance market.
The Company estimates that, of the new U.S. public finance bonds sold with insurance in 2019, the Company insured approximately 60% of the par, while BAM insured approximately 40%. BAM is effective in competing with the Company for small to medium sized U.S. public finance transactions in certain sectors. BAM sometimes prices its guarantees for such transactions at levels the Company does not believe produces an adequate rate of credit reviewreturn and analysis.so does not match, but BAM's pricing and underwriting strategies may have a negative impact on the amount of premium the Company is able to charge for its insurance for such transactions. However, the Company believes it has competitive advantages over BAM due to: AGM's and MAC's larger capital base; AGM's ability to insure larger transactions and issuances in more diverse U.S. bond sectors;
BAM's inability to date to generate profits and to increase its statutory capital meaningfully, its higher leverage ratios than those of AGM and MAC, and its unpaid debt obligations; and AGM's and MAC's strong financial strength ratings from multiple rating agencies (in the case of AGM, AA+ from KBRA, AA from S&P and A2 from Moody's, and in the case of MAC, AA+ from KBRA and AA from S&P, compared with BAM's AA solely from S&P). Additionally, as a public company with access to both the equity and debt capital markets, Assured Guaranty may have greater flexibility to raise capital, if needed.
Portfolio Risk
In the global structured finance and infrastructure markets, Assured Guaranty is the only financial guaranty insurance company currently writing new guarantees. Management Committee—This committee establishes company-wideconsiders the Company’s greater diversification to be a competitive advantage in the long run because it means the Company is not wholly dependent on conditions in any one market. In the international infrastructure finance market, the uninsured execution serving as the Company’s principal competition occurs primarily in privately funded transactions where no bonds are sold in the public markets. In the structured finance market, the uninsured execution occurs in both public and primary transactions primarily where bonds are sold with sufficient credit policy foror structural enhancement embedded in transactions, such as through overcollateralization, first loss insurance, excess spread or other terms, to make the bonds attractive to investors without bond insurance.
In the future, additional new entrants into the financial guaranty industry could reduce the Company's directnew business prospects, including by furthering price competition or offering financial guaranty insurance on transactions with structural and assumed business. It implements specific underwriting procedures and limits forsecurity features that are more favorable to the issuers than those required by Assured Guaranty. However, the Company believes that the presence of multiple guarantors might also increase the overall visibility and allocates underwriting capacity amongacceptance of the product by a broadening group of investors, and the fact that investors are willing to commit fresh capital to the industry may promote market confidence in the product.
In addition to monoline insurance companies, Assured Guaranty competes with other forms of credit enhancement, such as letters of credit or credit derivatives provided by banks and other financial institutions, some of which are governmental enterprises, or direct guaranties of municipal, structured finance or other debt by federal or state governments or government sponsored or affiliated agencies. Alternative credit enhancement structures, and in particular federal government credit enhancement or other programs, can interfere with the Company's subsidiaries. The Portfolio Risk Management Committee focuses on measuring and managing credit, market and liquidity risk fornew business prospects, particularly if they provide direct governmental-level guaranties, restrict the overall company. All transactions in new asset classesuse of third-party financial guaranties or new jurisdictions must be approved by this committee.
U.S. Management Committee—This committee establishes strategic policy and reviewsreduce the implementationamount of strategic initiatives and general business progress in the U.S. The U.S. Management Committee approves risk policy at the U.S. operating company level.
Risk Management Committees—The U.S., U.K. and AG Re risk management committees conduct an in-depth review of the insured portfolios of the relevant subsidiaries, focusing on varying portions of the portfolio at each meeting. They assign internal ratings of the insured transactions and review sector reports, monthly product line surveillance reports and compliance reports.
Workout Committee—This committee receives reports from surveillance and workout personnel on transactions that might benefit from active loss mitigation or risk reduction,qualify for financial guaranties.
The Company believes that issuers and approves loss mitigation or risk reduction strategies for such transactions.
Reserve Committees—Oversight of reserving risk is vestedinvestors in securities will continue to purchase financial guaranty insurance, especially if interest rates rise and credit spreads widen. U.S. municipalities have budgetary requirements that are best met through financings in the U.S. Reserve Committee,fixed income capital markets. Historically, smaller municipal issuers have frequently used financial guaranties in order to access the AG Re Reserve Committee andcapital markets with new debt offerings at a lower all-in interest rate than on an unguaranteed basis. In addition, the U.K. Reserve Committee. Company expects long-term debt financings for infrastructure projects will grow throughout the world, as will the financing needs associated with privatization initiatives or refinancing of infrastructure projects in developed countries.
The committees reviewCompany evaluates the reserve methodology and assumptions for each major asset class or significant BIG transaction,amount of capital it requires based on an internal capital model as well as rating agency models and insurance regulations. The Company believes it has excess capital based on these measures, and has been returning some of its excess capital to shareholders by repurchasing its common shares and paying dividends, and has been deploying some of its excess capital to acquire financial guaranty portfolios, asset management companies and alternative investments.
Asset Management
The Company completed the loss projection scenarios usedBlueMountain Acquisition on October 1, 2019, for a purchase price of $157 million. The Company contributed $60 million of cash to BlueMountain at closing, and contributed an additional $30 million in cash in February 2020, for certain restructuring costs and future strategic investments. As of the date of acquisition, BlueMountain managed or serviced $18.3 billion in assets across CLOs and opportunity funds that build on its corporate credit, asset-backed finance and healthcare structured capital experience, as well as certain legacy hedge and opportunity funds now subject to an orderly wind-down. BlueMountain has managed structured finance, credit and special situation investments, with a track record dating back to 2003. As of December 31, 2019, BlueMountain, which now operates under the name “Assured Investment Management”, was a top-twenty CLO manager by assets under management (as reported by CreditFlux) and is led by an experienced CLO and loan research team, with a broad distribution channel. Assured Investment Management underwrites assets and structures investments while leveraging a technology-enabled risk platform.
The BlueMountain Acquisition and establishment of Assured Investment Management diversifies the Company into the asset management industry, with the goal of utilizing Assured Guaranty's core competency in credit while diversifying its revenues and expanding its marketing reach through a fee-based platform. Additionally, the Company believes that Assured Investment Management provides the Company an opportunity to deploy excess capital at attractive returns, improving the
risk-adjusted return on a portion of the investment portfolio and potentially increasing the amount of dividends certain of its insurance subsidiaries are permitted to pay under applicable regulations. The Company intends to initially invest $500 million of capital in funds managed by Assured Investment Management (Assured Investment Management funds) plus additional amounts in other accounts managed by Assured Investment Management. The Company intends to use these capital investments to (a) launch new products (CLOs and/or opportunity funds) on the Assured Investment Management platform and (b) enhance the returns of its own investment portfolio. As of December 31, 2019, the Company had invested approximately $79 million of the $500 million it intends to initially invest in Assured Investment Management funds.
The Company conducts its Asset Management business principally through BlueMountain Capital Management, LLC, a Delaware limited liability company located in New York. BlueMountain was organized in 2003.
Asset Management Products
CLOs are typically issued on a quarterly basis when market conditions permit and generally have a stated maturity of 12-13 years with a potential reinvestment period. Once the reinvestment period expires, the CLO’s noteholders will receive distributions through the maturity of the CLO (unless Assured Investment Management and the probability weights assignednoteholders agree to those scenarios. The reserve committees establish reservesreset the period of the CLOs for an extended reinvestment period).
Opportunity funds invest in a mix of strategies that may have higher concentrations in illiquid strategies. Typically, opportunity funds have limited redemption rights and instead offer contractual cashflow distributions based on the legal agreement of each respective opportunity fund.
In addition to CLOs and opportunity funds, the Company also manages legacy hedge and opportunity funds now subject to an orderly wind-down.
Asset Management Revenues
Fees in respect of investment advisory services are the largest components of revenues for the relevant subsidiaries, taking into considerationAsset Management segment. The Company is compensated for its investment advisory services generally through management fees charged to its advisory clients (Management Fees). The Company typically receives monthly Management Fees of 1/12 of a per annum fee of typically 1%-2% of the net assets of the hedge and opportunity funds. With respect to the CLOs, the Company typically receives a Management Fee made up of two components (i.e., a “Senior Investment Management Fee” of 0.15%-0.20%, as well as a “Subordinated Investment Management Fee” of 0.20%-0.35%, in each case, of the net assets of the CLO per annum).
In addition, with respect to CLOs and certain hedge and opportunity funds, the Company receives performance-based compensation (Performance Allocations/Fees) with respect to each calendar year or performance period, typically 10%-30% of net profits allocated to each investor in such vehicle on an annual basis, payable at the end of each year or performance period, as the case may be. With respect to CLOs and certain opportunity funds, the Company receives performance-based compensation on an internal rate of return calculation, if and to the extent a certain minimum rate of return (a “hurdle”) is exceeded. For certain hedge and opportunity funds, performance based-compensation is reduced by the amount of management fees paid over a specified period and/or subject to a “high-water mark” or loss carryforward provision. (A "high-water mark" provision typically requires that, once a performance fee is paid based on net asset value or other measure during a period, any subsequent performance fee be measured from that value, or high-water mark.)
Depending on the characteristics of the CLOs, hedge and/or opportunity funds, fees may be higher or lower. The Company reserves the right to waive some or all fees for certain investors, including investors affiliated with the Company. Further, to the extent that the Company’s hedge and/or opportunity funds are invested in the Company's managed/serviced CLOs, the Company may rebate any Management Fees and/or Performance Allocations/Fees earned from the CLOs to the extent that such fees are attributable to the hedge and opportunity funds’ holdings of CLOs also managed or serviced by the Company.
Consistent with its investment capabilities, the Company intends to continue to grow the Assured Investment Management platform's structured finance investment strategies. Since the establishment of the Assured Investment Management platform, the Company launched two opportunity funds, one focused on asset-backed finance and one focused on healthcare structured capital, with capital from the Company's Insurance segment. Also since the establishment of the Assured Investment Management platform, the Company launched two new CLOs and a CLO fund with capital from the Company's insurance segment and capital already managed in the Assured Investment Management platform.
Competition
The asset management industry is a highly competitive market. Assured Investment Management competes with many other firms in every aspect of the asset management industry, including raising funds, seeking investments, and hiring and retaining professionals. Some of Assured Investment Management’s asset management competitors are substantially larger and have considerably greater financial, technical and marketing resources. Certain of these competitors periodically raise significant amounts of capital in investment strategies that are also pursued by Assured Investment Management. Some of these competitors also may have a lower cost of capital and access to funding sources that are not available to Assured Investment Management and/or the Company, which may create further competitive disadvantages with respect to investment opportunities. In addition, some of these competitors may have higher risk tolerances or make different risk assessments, allowing them to consider a wider variety of investments and establish broader networks of business relationships.
Investment Portfolio
The Company's investment portfolio primarily consists of fixed maturity securities supporting information provided by surveillance personnel.
its Insurance segment. The Asset Management segment and Corporate division primarily include short-term investments used to support business operations and corporate initiatives.
Investment income from the Company's investment portfolio is one of the primary sources of cash flow supporting its insurance operations and claim payments. The Company's total investment portfolio generated net investment income of $378 million, $395 million and $417 million in 2019, 2018 and 2017, respectively and equity in net earnings of investees of $4 million and $1 million in 2019 and 2018, respectively.
The Company's surveillance personnelprincipal objectives in managing its investment portfolio are responsible for monitoring and reporting on all transactionsto maintain sufficient liquidity to cover unexpected stress in the insuredinsurance portfolio; to maximize after tax book income; to manage investment risk within the context of the underlying portfolio of insurance risk; and to preserve the highest possible ratings for each Assured Guaranty insurance operating company. If the Company's calculations with respect to its policy liabilities are incorrect or other unanticipated payment obligations arise, or if the Company improperly structures its investments to meet these liabilities, it could have unexpected losses, including exposures in bothlosses resulting from forced liquidation of investments before their maturity. The investment policies of the Company's insurance subsidiaries are subject to insurance law requirements, and may change depending upon regulatory, economic and market conditions and the existing or anticipated financial guaranty directcondition and assumedoperating requirements, including the tax position, of the businesses. The primary objectiveperformance of the surveillance processinvested assets is subject to monitor trends and changes in transaction credit quality, detect any deterioration in credit quality, and recommend remedial actions to management. All transactions in the insured portfolio are assigned internal credit ratings, and surveillance personnel recommend adjustments to those ratings to reflect changes in transaction credit quality.
The Company's workout personnel are responsible for managing workout, loss mitigation and risk reduction situations. They work together with the Company's surveillance personnel to develop and implement strategies on transactions that are experiencing loss or could possibly experience loss. They develop strategies designed to enhance the ability of the Company and its external investment managers to enforce its contractual rightsselect and remediesmanage appropriate investments.
Approximately 82% of the investment portfolio is externally managed by six investment managers: BlackRock Financial Management, Inc., Goldman Sachs Asset Management, L.P., New England Asset Management, Inc., Wellington Management Company, LLP, MacKay Shields LLC and mitigate potential losses.Wasmer, Schroeder & Company, LLC. The Company's workout personnel also engage in negotiation discussions with transaction participants and, when necessary,external investment managers have discretionary authority over the portion of the investment portfolio they manage (along with legal personnel)within the limits of the investment guidelines approved by the Company's litigation proceedings. They may also make openBoard of Directors. Each manager is compensated based upon a fixed percentage of the market or negotiated purchasesvalue of securitiesthe portion of the portfolio being managed by such manager. BlackRock Financial Management, Inc. and Wellington Management Company LLP both own more than 5% of the Company's common shares, and the Company has a minority interest in Wasmer, Schroeder & Company, LLC. The Charles Schwab Corporation announced on February 24, 2020 that it had entered into an agreement to acquire Wasmer, Schroeder & Company, LLC, and that, subject to customary closing conditions, it expects to close the transaction in mid-2020. During the years ended December 31, 2019, 2018 and 2017, the Company recorded investment management fees and related expenses to external managers of $9 million, $9 million, and $9 million, respectively.
The Company internally manages a portion of its investment portfolio, primarily consisting of obligations that the Company haspurchases in connection with its loss mitigation or risk management strategy for its insured exposure (loss mitigation securities) or negotiateobtains as part of negotiated settlements with insured counterparties or otherwise implement consensual terminations of insurance coverage prior to contractual maturity. The Company's workout personnel work with servicers of RMBS transactions to enhance their performance.
Direct Business
The Company monitors the performance of each risk in its portfolio and tracks aggregation of risk. The review cycle and scope vary based upon transaction type and credit quality. In general, the review process includes the collection and analysis of information from various sources, including trustee and servicer reports, financial statements, general industry or sector news and analyses, and rating agency reports. For public finance risks, the surveillance process includes monitoring general economic trends, developments with respect to state and municipal finances, and the financial situation of the issuers. For structured finance transactions, the surveillance process can include monitoring transaction performance data and cash flows, compliance with transaction terms and conditions, and evaluation of servicer or collateral manager performance and financial condition. Additionally, the Company uses various quantitative tools and models to assess transaction performance and identify situations where there may have been a change in credit quality. For all transactions, surveillance activities may include discussions with or site visits to issuers, servicers or other parties to a transaction.
Assumed Business
For transactions that the Company has assumed, the ceding insurers are responsible for conducting ongoing surveillance of the exposures that have been ceded to the Company. The Company's surveillance personnel monitor the ceding insurer's surveillance activities on exposures ceded to the Company through a variety of means, including reviews of surveillance reports provided by the ceding insurers, and meetings and discussions with their analysts. The Company's surveillance personnel also monitor general news and information, industry trends and rating agency reports to help focus surveillance activities on sectors or credits of particular concern. For certain exposures, the Company also will undertake an independent analysis and remodeling of the exposure. In the event of credit deterioration of a particular exposure, more frequent reviews of the ceding company's risk mitigation activities are conducted. The Company's surveillance personnel also take steps to ensure that the ceding insurer is managing the risk pursuant tounder the terms of the applicable reinsurance agreement. To this end, the Company conducts periodic reviews of ceding companies' surveillance activities and capabilities. That process may include the review of the insurer's underwriting, surveillance and claim files for certain transactions.
Ceded Business
As part of its risk management strategy prior to the financial crisis, the Company obtained third party reinsurance or retrocessions to reduce its exposure to risk concentrations, such as for single risk limits, portfolio credit rating or exposure limits, geographic limits or other factors, to increase its underwriting capacity, both on an aggregate-risk and a single-risk basis, to meet internal, rating agency and regulatory risk limits, diversify risks, reduce the need for additional capital, and strengthen financial ratios.guaranties. The Company receives capital credit for ceded reinsurance inheld approximately $868 million and $1,190 million of securities, based on their fair value excluding the capital models usedbenefit of any insurance provided by the rating agencies to evaluate the Company's capital position for its financial strength ratings and in its own internal capital models. The amount of the credit depends on the reinsurer's rating and any collateral it may post. During and after the financial crisis, most of the Company's reinsurers were downgraded by one or more rating agencies, and the effect of such downgrades, in general, was to
decrease the financial benefits of using reinsurance. Over the past several years the Company, has entered into commutation agreements reassuming portions of the previously ceded business from certain reinsurers; as of December 31, 2016, approximately 4%, or $11.2 billion,2019 and December 31, 2018, respectively. The Company has made minority investments in investment managers as part of its principal amount outstanding was still cededstrategy of participating in that market and also makes other unrelated investments that it believes present attractive investment opportunities.
The Company intends to third party reinsurers, down from 12%, or $86.5 billion, asuse the investment knowledge and experience in Assured Investment Management to expand the categories and types of December 31, 2009.investments included in its investment portfolio by both (a) initially investing $500 million of Insurance segment assets in Assured Investment Management funds plus additional amounts in other accounts managed by
More recentlyAssured Investment Management and (b) expanding the categories and types of its alternative investments not managed by Assured Investment Management.
The portion of the Insurance segment’s portfolio that is invested in Assured Investment Management funds may be excluded from the amounts reported in the investment portfolio and instead reported in assets of consolidated investment vehicles in the Company’s consolidated statement of financial position if, under accounting principles generally accepted in the U.S. (GAAP), the Company has obtained excess-of-loss reinsurance in partis deemed to augment its capital inbe the capital model used by S&P Global Ratings, a division of Standard & Poor's Financial Services LLC (S&P) to evaluate its financial strength ratings. Specifically, AGC, AGM and MAC entered into a $360 million aggregate excess of loss reinsurance facility with a number of reinsurers, effective as of January 1, 2016. At its inception effective as of January 1, 2016, the facility covered losses occurring from January 1, 2016 through December 31, 2022, or from January 1, 2017 through December 31, 2023, at the option of AGC, AGM and MAC. AGC, AGM and MAC did not elect coverage under the new facility for the seven year period commencing January 1, 2016, but they retain an option, which must be exercised prior to January 1, 2018, and which requires the payment of additional premium, to elect coverage for the seven year period commencing January 1, 2017.primary beneficiary. See Part II, Item 8, Financial Statements and Supplementary Data, Note 13, Reinsurance14, Variable Interest Entities for information on when and Other Monoline Exposures,how such funds and CLOs require consolidation.
In instances where consolidation is required, the assets and liabilities of consolidated Assured Investment Management funds and CLOs are reported in the line items captioned “assets of consolidated investment vehicles” and “liabilities of consolidated investment vehicles,” resulting in a gross-up of the Company’s consolidated assets and liabilities. Redeemable and nonredeemable noncontrolling interests are also recorded for more information.the portion of such consolidated funds’ capital attributable to affiliated or third party investors. Changes in fair value are recorded in other income.
The Company mayfair value of the Insurance segment’s investments in Assured Investment Management funds as of December 31, 2019 was $77 million. As of December 31, 2019, all funds and the underlying CLO in which one of the consolidated funds invests, were consolidated. Such investment is not included in the future enter into new third party reinsurance or retrocessions or other arrangements to reduce its exposure to risk concentrations, such as for single risk limits, portfolio credit rating or exposure limits, geographic limits or other factors, to increase its underwriting capacity, both on an aggregate-risk and a single-risk basis, to meet internal, rating agency and regulatory risk limits, diversify risks, reduce the need for additional capital, or strengthen financial ratios. The Company may alsoamounts reported in the future enter into new commutation agreements reassuming portionsinvestment portfolio, but instead, is presented as follows on the consolidated balance sheet: assets of its remaining previously ceded business.consolidated investment vehicles of $572 million, liabilities of consolidated investment vehicles of $482 million, and redeemable and nonredeemable noncontrolling interests of $13 million.
Importance of Financial Strength Ratings
Low financial strength ratings or uncertainty over the Company's ability to maintain its financial strength ratings for its insurance operating companies would have a negative impact on issuers' and investors' perceptions of the value of the Company's insurance product. Therefore, the Company manages its business with the goal of achieving high financial strength ratings, preferably the highest that an agency will assign to a financial guarantor. However, the models used by rating agencies differ, presenting conflicting goals that may make it inefficient or impractical to reach the highest rating level. In addition, the models are not fully transparent, contain subjective factors and may change.
Historically, insuranceInsurance financial strength ratings reflect a rating agency's opinion of an insurer's ability to pay under its insurance policies and contracts in accordance with their terms. The rating is not specific to any particular policy or contract. It does not refer to an insurer's ability to meet non-insurance obligations and is not a recommendation to purchase any policy or contract issued by an insurer or to buy, hold, or sell any security insured by an insurer. The insurance financial strength ratings assigned by the rating agencies are based upon factors that the rating agencies believe are relevant to policyholders and are not directed toward the protection of investors in AGL's common shares. Ratings reflect only the views of the respective rating agencies assigning them and are subject to continuous review and revision or withdrawal at any time.
Following the financial crisis, the rating process has been challenging for the Company due to a number of factors, including:
| |
| • | Instability of Rating Criteria and Methodologies. Rating agencies purport to issue ratings pursuant to published rating criteria and methodologies. Beginning during the financial crisis, the rating agencies made material changes to their rating criteria and methodologies applicable to financial guaranty insurers, sometimes through formal changes and other times through ad hoc adjustments to the conclusions reached by existing criteria. Furthermore, these criteria and methodology changes were typically implemented without any transition period, making it difficult for an insurer to comply with new standards. |
| |
| • | Instability of Severe Stress Case Loss Assumptions. A major component in arriving at a financial guaranty insurer's rating has been the rating agency’s assessment of the insurer’s capital adequacy, with each rating agency employing its own proprietary model. These capital adequacy approaches include “stress case” loss assumptions for various risks or risk categories. Since the financial crisis, the rating agencies have at various times materially increased stress case loss assumptions for various risks or risk categories, in some cases later reducing such stress case losses. This approach has made predicting the amount of capital required to maintain or attain a certain rating more difficult. |
Instability of Rating Criteria and Methodologies. Rating agencies purport to issue ratings pursuant to published rating criteria and methodologies. In recent years, the rating agencies have made material changes to their rating criteria and methodologies applicable to financial guaranty insurers, sometimes through formal changes and other times through ad hoc adjustments to the conclusions reached by existing criteria. Furthermore, these criteria and methodology changes were typically implemented without any transition period, making it difficult for an insurer to comply quickly with new standards.
| |
| • | More Reliance on Qualitative Rating Criteria. In prior years, the financial strength ratings of the Company’s insurance subsidiaries were largely consistent with the rating agency’s assessment of the insurers’ capital adequacy, such that a rating downgrade could generally be avoided by raising additional capital or otherwise improving capital adequacy under the rating agency’s model. In recent years, however, both S&P Global Ratings, a division of Standard & Poor's Financial Services LLC (S&P) and Moody’s Investors Service, Inc. (Moody’s) have applied other factors, some of which are subjective, such as the insurer's business strategy and franchise value or the anticipated future demand for its product, to justify ratings for the Company’s insurance subsidiaries significantly below the ratings implied by their own capital adequacy models. Currently, for example, S&P has concluded that Assured Guaranty has |
Instability of Severe Stress Case Loss Assumptions. A major component in arriving at a financial guaranty insurer's rating has been the rating agency’s assessment of the insurer’s capital adequacy, with each rating agency employing its own proprietary model. These capital adequacy approaches include “stress case” loss assumptions for various risks or risk categories. Since the financial crisis, the rating agencies have at various times materially increased stress case loss assumptions for various risks or risk categories, in some cases later reducing such stress case losses. This approach has made predicting the amount of capital required to maintain or attain a certain rating more difficult.
More Reliance on Qualitative Rating Criteria. In prior years, the financial strength ratings of the Company’s insurance company subsidiaries were largely consistent with the rating agency’s assessment of the insurers’ capital adequacy, such that a rating downgrade could generally be avoided by raising additional capital or otherwise
improving capital adequacy under the rating agency’s model. In recent years, however, both S&P and Moody’s have applied other factors, some of which are subjective, such as the insurer's business strategy and franchise value or the anticipated future demand for its product, to justify ratings for the Company’s insurance company subsidiaries significantly below the ratings implied by their own capital adequacy models. Currently, for example, S&P has concluded that AGM has “AAA”“AAA” capital adequacy under the S&P model (but subject to a downward adjustment due to a “large“largest obligor test”) and Moody’s has concluded that AGM has “Aa” capital adequacy under the Moody’s model (offset by other factors including the rating agency’s assessment of competitive profile, future profitability and market share).
Despite the difficult rating agency process following the financial crisis, the Company has been able to maintain strong financial strength ratings. However, if a substantial downgrade of the financial strength ratings of the Company's insurance subsidiaries were to occur in the future, such downgrade would adversely affect its business and prospects and, consequently, its results of operations and financial condition. The Company believes that if the financial strength ratings of AGM, AGC and/or MACany of its insurance subsidiaries were downgraded from their current levels, such downgrade could result in downward pressure on the premium that such insurance subsidiary would be able to charge for its insurance. Currently, AGM, AGC and MAC all have AA (Stable Outlook) financial strength ratings from S&P. Each of AGM and MAC also has a AA+ (Stable Outlook) financial strength rating from Kroll Bond Rating Agency (KBRA), while AGC has a AA (Stable Outlook) financial strength rating from KBRA. AGM and AGC have financial strength ratings in the single-A category from Moody's (A2 (Stable Outlook) and A3 (Stable Outlook), respectively), although AGC announced on January 13, 2017 that it had requested that Moody's withdraw its financial strength rating of AGC. In addition, AGRO has been assigned a rating of A+ (Stable) from A.M. Best Company, Inc. (Best), which is Best's second highest rating. The Company periodically assesses the value of each rating assigned to each of its companies, and may as a result of such assessment request that a rating agency add or drop a rating from certain of its companies. For example, the KBRAKroll Bond Rating Agency (KBRA) ratings were first assigned to MAC in 2013, and to AGM in 2014, to AGC in 2016 and theto AGE UK in 2018; an A.M. Best Company, Inc. (Best) rating was first assigned to AGRO in 2015,2015; while a Moody's rating was never requested for MAC, was dropped from AG Re and AGRO in 2015, and as noted above, iswas the subject of a rating withdrawal request in the case of AGC.AGC (such request was declined).
The Company believes that so long as AGM, AGC and/or MAC continue to have financial strength ratings in the double-A category from at least one of the legacy rating agencies (S&P or Moody’s), they are likely to be able to continue writing financial guaranty business with a credit quality similar to that historically written. However, if neither legacy rating agency maintained financial strength ratings of AGM, AGC and/or MAC in the double-A category, or if either legacy rating agency were to downgrade AGM, AGC and/or MAC below the single-A level, it could be difficult for the Company to originate the current volume of new financial guaranty business with comparable credit characteristics.
See "ItemItem 1A. Risk Factors", Risk FactorFactors, Strategic Risks captioned "Risks Related to“A downgrade of the financial strength or financial enhancement ratings of any of the Company's Financial Strengthinsurance and Financial Enhancement Ratings"reinsurance subsidiaries would adversely affect its business and prospects and, consequently, its results of operations and financial condition” and Part II, Item 7, Management's Discussion8, Financial Statements and Analysis of Financial Condition, Results of Operations,Supplementary Data, Note 3, Ratings, for more information about the Company's ratings.
Investments
Investment income from the Company's investment portfolio is one of the primary sources of cash flow supporting its operations and claim payments. The Company's total investment portfolio was $11.0 billion and $11.2 billion as of December 31, 2016 and 2015, respectively, and generated net investment income of $408 million, $423 million and $403 million in 2016, 2015 and 2014, respectively.
The Company's principal objectives in managing its investment portfolio are to support the highest possible ratings for each operating company; maintain sufficient liquidity to cover unexpected stress in the insurance portfolio; and maximize total after-tax net investment income. If the Company's calculations with respect to its policy liabilities are incorrect or other unanticipated payment obligations arise, or if the Company improperly structures its investments to meet these liabilities, it could have unexpected losses, including losses resulting from forced liquidation of investments before their maturity. The investment policies of the Company's insurance subsidiaries are subject to insurance law requirements, and may change depending upon regulatory, economic and market conditions and the existing or anticipated financial condition and operating requirements, including the tax position, of the businesses.
Approximately 83% of the Company's investment portfolio is externally managed by its investment managers: BlackRock Financial Management, Inc., Goldman Sachs Asset Management, L.P., General Re-New England Asset Management, Inc. and Wellington Management Company, LLP. The performance of the Company's invested assets is subject to the ability of the investment managers to select and manage appropriate investments. The Company's investment managers have discretionary authority over the Company's investment portfolio within the limits of the Company's investment guidelines approved by the Company's Board. The Company's portfolio is allocated approximately equally among the four investment managers and each manager is compensated based upon a fixed percentage of the market value of the portion of the portfolio
being managed by such manager. During the years ended December 31, 2016, 2015 and 2014, the Company recorded investment management fee expenses of $9 million, $10 million, and $9 million, respectively.
As of December 31, 2016, the Company internally managed 17% of the investment portfolio, either in connection with its loss mitigation or risk management strategy, or because the Company believes a particular security or asset presents an attractive investment opportunity. During 2016, the Company established an alternative investments group to focus on deploying a portion of the Company's excess capital to pursue acquisitions and develop new business opportunities that complement the Company's financial guaranty business, are in line with its risk profile and benefit from its core competencies. The alternative investments group has been investigating a number of such opportunities, including both controlling and non-controlling investments in investment managers.
The largest component of the Company’s internally managed portfolio consists of obligations that the Company purchases in connection with its loss mitigation or risk management strategy for its insured exposure. Purchasing such obligations enables the Company to exercise rights available to holders of the obligations. The Company also holds other invested assets that were obtained or purchased as part of negotiated settlements with insured counterparties or under the terms of its financial guaranties. The Company held approximately $1,600 million and $1,440 million of securities based on their fair value, after elimination of the benefit of any insurance provided by the Company, that were obtained for loss mitigation or risk management purposes in its internally managed investment accounts as of December 31, 2016 and December 31, 2015, respectively.
Competition
Assured Guaranty is the market leader in the financial guaranty industry. Assured Guaranty believesThe Company's position in the market benefits from its ability to maintain strong financial strength protection against defaults, credit selection policies, underwriting standards, history of makingratings, its strong claims-paying resources, its proven willingness and ability to make claim payments to policyholders after obligors have defaulted, and surveillance procedures makeits ability to achieve recoveries in respect of the claims that it an attractive provider of financial guaranties.has paid on insured residential mortgage-backed and other securities and to resolve its troubled municipal exposures.
Assured Guaranty's principal competition is in the form of obligations that issuers decide to issue on an uninsured basis. In the U.S. public finance market, when interest rates are low, investors may prefer greater yield over insurance protection, and issuers may find the cost savings from insurance less compelling. Over the last several years, interest rates generally have been lower than historical norms. AverageIn 2019, municipal interest rates were extremely low during 2016, with the benchmarkreached new lows and credit spreads tightened further. The 30-year AAA 30-year Municipal Market Data index published by Thomson Reuters (MMD Index),(MMD) rate started the year off at times below 2%, a threshold not previously crossed in3.02% and ended the modern era.year at 2.09%. As a result, the difference in yield (or the credit spread) between a bond insured by Assured Guaranty and an uninsured bond has provided comparatively little room for issuer savings and insurance premium. In the U.S. public finance market, in 2016, market penetration of municipal bond insurance decreased toremained approximately 6.0%5.9% of the par amount of new issues sold compared with approximately 6.7% in 2015.for both 2019 and 2018. The Company believes this decrease wasthe relatively low market penetration rates in 2019 and 2018 were in part due in large part to the extremely low interest rates prevailing during most of 2016.that period.
In the international infrastructureU.S. public finance market, the uninsured execution serving as the Company’s principal competition occurs primarily in privately funded transactions where no bonds are sold in the public markets. In the structured finance market, the uninsured execution occurs in both public and primary transactions primarily where bonds are sold with sufficient credit or structural enhancement embedded in transactions, such as through overcollateralization, first loss insurance, excess spread or other terms, to make the bonds attractive to investors without bond insurance.
Assured Guaranty is the only financial guaranty company active before the global financial crisis of 2008 that has maintained sufficient financial strength to write new business continuously since the crisis began. As a result of rating agency downgrades of the financial strength ratings of financial guaranty competitors active before the crisis, Assured Guaranty has only twoone direct competitorscompetitor for financial guaranty, the most significant of which was BAM,Build America Mutual Assurance Company (BAM), a mutual insurance company that commenced business in 2012.2012 and is active only in the public finance market.
Based on industry statistics, theThe Company estimates that, of the new U.S. public finance bonds sold with insurance in 2016,2019, the Company insured approximately 56%60% of the par, while BAM insured approximately 40%. BAM is effective in competing with the Company for small to medium sized U.S. public finance transactions in certain sectors. BAM sometimes prices its guarantees for such transactions at levels the Company does not believe produces an adequate rate of return and so does not match, but BAM's pricing and underwriting strategies may have a negative impact on the amount of premium the Company is able to charge for its insurance for such transactions. However, the Company believes it has competitive advantages over BAM due to: AGM's and MAC's larger capital base; AGM's ability to insure larger transactions and issuances in more diverse U.S. bond sectors;
BAM's inability to date to generate profits and to increase its statutory capital meaningfully, its higher leverage ratios than those of AGM and MAC, and its increasing unpaid debt obligations; and AGM's and MAC's strong financial strength ratings from multiple rating agencies (in the case of AGM, AA+ from KBRA, AA from S&P and A2
from Moody's, and in the case of MAC, AA+ from KBRA and AA from S&P, compared with BAM's AA solely from S&P). Additionally, as a public company with access to both the equity and debt capital markets, Assured Guaranty may have greater flexibility to raise capital, if needed.
Another competitor to the Company on U.S. public finance transactions is National, which the Company estimates insured approximately 4% of the par of public finance bonds sold with insurance in 2016. In 2009, MBIA, one of the legacy insurers that is not writing new business, transferred its U.S. public finance exposures to its affiliate National. The transfer was challenged in litigation that was not settled until May 2013. Subsequently, S&P has raised National’s financial strength rating from BBB to AA-, noting that S&P no longer viewed MBIA’s rating as a limitation on National’s rating, and Moody’s has upgraded National's financial strength rating from Baa2 to A3.
In the global structured finance and infrastructure markets, Assured Guaranty is the only financial guaranty insurance company currently writing new guarantees. Management considers the Company’s greater diversification to be a competitive advantage in the long run because it means the Company is not wholly dependent on conditions in any one market. In the international infrastructure finance market, the uninsured execution serving as the Company’s principal competition occurs primarily in privately funded transactions where no bonds are sold in the public markets. In the structured finance market, the uninsured execution occurs in both public and primary transactions primarily where bonds are sold with sufficient credit or structural enhancement embedded in transactions, such as through overcollateralization, first loss insurance, excess spread or other terms, to make the bonds attractive to investors without bond insurance.
In the future, additional new entrants into the financial guaranty industry could reduce the Company's new business prospects, including by furthering price competition or offering financial guaranty insurance on transactions with structural and security features that are more favorable to the issuers than those required by Assured Guaranty. However, the Company believes that the presence of multiple guarantors might also increase the overall visibility and acceptance of the product by a broadening group of investors, and the fact that investors are willing to commit fresh capital to the industry may promote market confidence in the product.
In addition to monoline insurance companies, Assured Guaranty competes with other forms of credit enhancement, such as letters of credit or credit derivatives provided by banks and other financial institutions, some of which are governmental enterprises, or direct guaranties of municipal, structured finance or other debt by federal or state governments or government sponsored or affiliated agencies. Alternative credit enhancement structures, and in particular federal government credit enhancement or other programs, can interfere with the Company's new business prospects, particularly if they provide direct governmental-level guaranties, restrict the use of third-party financial guaranties or reduce the amount of transactions that might qualify for financial guaranties.
The Company believes that issuers and investors in securities will continue to purchase financial guaranty insurance, especially if interest rates rise and credit spreads widen. U.S. municipalities have budgetary requirements that are best met through financings in the fixed income capital markets. Historically, smaller municipal issuers have frequently used financial guaranties in order to access the capital markets with new debt offerings at a lower all-in interest rate than on an unguaranteed basis. In addition, the Company expects long-term debt financings for infrastructure projects will grow throughout the world, as will the financing needs associated with privatization initiatives or refinancing of infrastructure projects in developed countries.
The Company evaluates the amount of capital it requires based on an internal capital model as well as rating agency models and insurance regulations. The Company believes it has excess capital based on these measures, and has been returning some of its excess capital to shareholders by repurchasing its common shares and paying dividends, and has been deploying some of its excess capital to acquire financial guaranty portfolios, asset management companies and alternative investments.
Asset Management
The Company completed the BlueMountain Acquisition on October 1, 2019, for a purchase price of $157 million. The Company contributed $60 million of cash to BlueMountain at closing, and contributed an additional $30 million in cash in February 2020, for certain restructuring costs and future strategic investments. As of the date of acquisition, BlueMountain managed or serviced $18.3 billion in assets across CLOs and opportunity funds that build on its corporate credit, asset-backed finance and healthcare structured capital experience, as well as certain legacy hedge and opportunity funds now subject to an orderly wind-down. BlueMountain has managed structured finance, credit and special situation investments, with a track record dating back to 2003. As of December 31, 2019, BlueMountain, which now operates under the name “Assured Investment Management”, was a top-twenty CLO manager by assets under management (as reported by CreditFlux) and is led by an experienced CLO and loan research team, with a broad distribution channel. Assured Investment Management underwrites assets and structures investments while leveraging a technology-enabled risk platform.
The BlueMountain Acquisition and establishment of Assured Investment Management diversifies the Company into the asset management industry, with the goal of utilizing Assured Guaranty's core competency in credit while diversifying its revenues and expanding its marketing reach through a fee-based platform. Additionally, the Company believes that Assured Investment Management provides the Company an opportunity to deploy excess capital at attractive returns, improving the
risk-adjusted return on a portion of the investment portfolio and potentially increasing the amount of dividends certain of its insurance subsidiaries are permitted to pay under applicable regulations. The Company intends to initially invest $500 million of capital in funds managed by Assured Investment Management (Assured Investment Management funds) plus additional amounts in other accounts managed by Assured Investment Management. The Company intends to use these capital investments to (a) launch new products (CLOs and/or opportunity funds) on the Assured Investment Management platform and (b) enhance the returns of its own investment portfolio. As of December 31, 2019, the Company had invested approximately $79 million of the $500 million it intends to initially invest in Assured Investment Management funds.
The Company conducts its Asset Management business principally through BlueMountain Capital Management, LLC, a Delaware limited liability company located in New York. BlueMountain was organized in 2003.
Asset Management Products
CLOs are typically issued on a quarterly basis when market conditions permit and generally have a stated maturity of 12-13 years with a potential reinvestment period. Once the reinvestment period expires, the CLO’s noteholders will receive distributions through the maturity of the CLO (unless Assured Investment Management and the noteholders agree to reset the period of the CLOs for an extended reinvestment period).
Opportunity funds invest in a mix of strategies that may have higher concentrations in illiquid strategies. Typically, opportunity funds have limited redemption rights and instead offer contractual cashflow distributions based on the legal agreement of each respective opportunity fund.
In addition to CLOs and opportunity funds, the Company also manages legacy hedge and opportunity funds now subject to an orderly wind-down.
Asset Management Revenues
Fees in respect of investment advisory services are the largest components of revenues for the Asset Management segment. The Company is compensated for its investment advisory services generally through management fees charged to its advisory clients (Management Fees). The Company typically receives monthly Management Fees of 1/12 of a per annum fee of typically 1%-2% of the net assets of the hedge and opportunity funds. With respect to the CLOs, the Company typically receives a Management Fee made up of two components (i.e., a “Senior Investment Management Fee” of 0.15%-0.20%, as well as a “Subordinated Investment Management Fee” of 0.20%-0.35%, in each case, of the net assets of the CLO per annum).
In addition, with respect to CLOs and certain hedge and opportunity funds, the Company receives performance-based compensation (Performance Allocations/Fees) with respect to each calendar year or performance period, typically 10%-30% of net profits allocated to each investor in such vehicle on an annual basis, payable at the end of each year or performance period, as the case may be. With respect to CLOs and certain opportunity funds, the Company receives performance-based compensation on an internal rate of return calculation, if and to the extent a certain minimum rate of return (a “hurdle”) is exceeded. For certain hedge and opportunity funds, performance based-compensation is reduced by the amount of management fees paid over a specified period and/or subject to a “high-water mark” or loss carryforward provision. (A "high-water mark" provision typically requires that, once a performance fee is paid based on net asset value or other measure during a period, any subsequent performance fee be measured from that value, or high-water mark.)
Depending on the characteristics of the CLOs, hedge and/or opportunity funds, fees may be higher or lower. The Company reserves the right to waive some or all fees for certain investors, including investors affiliated with the Company. Further, to the extent that the Company’s hedge and/or opportunity funds are invested in the Company's managed/serviced CLOs, the Company may rebate any Management Fees and/or Performance Allocations/Fees earned from the CLOs to the extent that such fees are attributable to the hedge and opportunity funds’ holdings of CLOs also managed or serviced by the Company.
Consistent with its investment capabilities, the Company intends to continue to grow the Assured Investment Management platform's structured finance investment strategies. Since the establishment of the Assured Investment Management platform, the Company launched two opportunity funds, one focused on asset-backed finance and one focused on healthcare structured capital, with capital from the Company's Insurance segment. Also since the establishment of the Assured Investment Management platform, the Company launched two new CLOs and a CLO fund with capital from the Company's insurance segment and capital already managed in the Assured Investment Management platform.
Competition
The asset management industry is a highly competitive market. Assured Investment Management competes with many other firms in every aspect of the asset management industry, including raising funds, seeking investments, and hiring and retaining professionals. Some of Assured Investment Management’s asset management competitors are substantially larger and have considerably greater financial, technical and marketing resources. Certain of these competitors periodically raise significant amounts of capital in investment strategies that are also pursued by Assured Investment Management. Some of these competitors also may have a lower cost of capital and access to funding sources that are not available to Assured Investment Management and/or the Company, which may create further competitive disadvantages with respect to investment opportunities. In addition, some of these competitors may have higher risk tolerances or make different risk assessments, allowing them to consider a wider variety of investments and establish broader networks of business relationships.
Investment Portfolio
The Company's investment portfolio primarily consists of fixed maturity securities supporting its Insurance segment. The Asset Management segment and Corporate division primarily include short-term investments used to support business operations and corporate initiatives.
Investment income from the Company's investment portfolio is one of the primary sources of cash flow supporting its insurance operations and claim payments. The Company's total investment portfolio generated net investment income of $378 million, $395 million and $417 million in 2019, 2018 and 2017, respectively and equity in net earnings of investees of $4 million and $1 million in 2019 and 2018, respectively.
The Company's principal objectives in managing its investment portfolio are to maintain sufficient liquidity to cover unexpected stress in the insurance portfolio; to maximize after tax book income; to manage investment risk within the context of the underlying portfolio of insurance risk; and to preserve the highest possible ratings for each Assured Guaranty insurance operating company. If the Company's calculations with respect to its policy liabilities are incorrect or other unanticipated payment obligations arise, or if the Company improperly structures its investments to meet these liabilities, it could have unexpected losses, including losses resulting from forced liquidation of investments before their maturity. The investment policies of the Company's insurance subsidiaries are subject to insurance law requirements, and may change depending upon regulatory, economic and market conditions and the existing or anticipated financial condition and operating requirements, including the tax position, of the businesses. The performance of invested assets is subject to the ability of the Company and its external investment managers to select and manage appropriate investments.
Approximately 82% of the investment portfolio is externally managed by six investment managers: BlackRock Financial Management, Inc., Goldman Sachs Asset Management, L.P., New England Asset Management, Inc., Wellington Management Company, LLP, MacKay Shields LLC and Wasmer, Schroeder & Company, LLC. The Company's external investment managers have discretionary authority over the portion of the investment portfolio they manage within the limits of the investment guidelines approved by the Company's Board of Directors. Each manager is compensated based upon a fixed percentage of the market value of the portion of the portfolio being managed by such manager. BlackRock Financial Management, Inc. and Wellington Management Company LLP both own more than 5% of the Company's common shares, and the Company has a minority interest in Wasmer, Schroeder & Company, LLC. The Charles Schwab Corporation announced on February 24, 2020 that it had entered into an agreement to acquire Wasmer, Schroeder & Company, LLC, and that, subject to customary closing conditions, it expects to close the transaction in mid-2020. During the years ended December 31, 2019, 2018 and 2017, the Company recorded investment management fees and related expenses to external managers of $9 million, $9 million, and $9 million, respectively.
The Company internally manages a portion of its investment portfolio, primarily consisting of obligations that the Company purchases in connection with its loss mitigation or risk management strategy for its insured exposure (loss mitigation securities) or obtains as part of negotiated settlements with insured counterparties or under the terms of the financial guaranties. The Company held approximately $868 million and $1,190 million of securities, based on their fair value excluding the benefit of any insurance provided by the Company, as of December 31, 2019 and December 31, 2018, respectively. The Company has made minority investments in investment managers as part of its strategy of participating in that market and also makes other unrelated investments that it believes present attractive investment opportunities.
The Company intends to use the investment knowledge and experience in Assured Investment Management to expand the categories and types of investments included in its investment portfolio by both (a) initially investing $500 million of Insurance segment assets in Assured Investment Management funds plus additional amounts in other accounts managed by
Assured Investment Management and (b) expanding the categories and types of its alternative investments not managed by Assured Investment Management.
The portion of the Insurance segment’s portfolio that is invested in Assured Investment Management funds may be excluded from the amounts reported in the investment portfolio and instead reported in assets of consolidated investment vehicles in the Company’s consolidated statement of financial position if, under accounting principles generally accepted in the U.S. (GAAP), the Company is deemed to be the primary beneficiary. See Part II, Item 8, Financial Statements and Supplementary Data, Note 14, Variable Interest Entities for information on when and how such funds and CLOs require consolidation.
In instances where consolidation is required, the assets and liabilities of consolidated Assured Investment Management funds and CLOs are reported in the line items captioned “assets of consolidated investment vehicles” and “liabilities of consolidated investment vehicles,” resulting in a gross-up of the Company’s consolidated assets and liabilities. Redeemable and nonredeemable noncontrolling interests are also recorded for the portion of such consolidated funds’ capital attributable to affiliated or third party investors. Changes in fair value are recorded in other income.
The fair value of the Insurance segment’s investments in Assured Investment Management funds as of December 31, 2019 was $77 million. As of December 31, 2019, all funds and the underlying CLO in which one of the consolidated funds invests, were consolidated. Such investment is not included in the amounts reported in the investment portfolio, but instead, is presented as follows on the consolidated balance sheet: assets of consolidated investment vehicles of $572 million, liabilities of consolidated investment vehicles of $482 million, and redeemable and nonredeemable noncontrolling interests of $13 million.
Risk Management Procedures
Organizational Structure
The Company's policies and procedures relating to risk assessment and risk management are overseen by its Board of Directors (the Board or AGL's Board). The Board takes an enterprise-wide approach to risk management that is designed to support the Company's business plans at a reasonable level of risk. A fundamental part of risk assessment and risk management is not only understanding the risks a company faces and what steps management is taking to manage those risks, but also understanding what level of risk is appropriate for the Company. The Board annually approves the Company's business plan, factoring risk management into account. It also approves the Company's risk appetite statement, which articulates the Company's tolerance for risk and describes the general types of risk that the Company accepts or attempts to avoid. The involvement of the Board in setting the Company's business strategy is a key part of its assessment of management's risk tolerance and also a determination of what constitutes an appropriate level of risk for the Company.
While the Board has the ultimate oversight responsibility for the risk management process, various committees of the Board also have responsibility for risk assessment and risk management. The Risk Oversight Committee of the Board oversees the standards, controls, limits, underwriting guidelines and policies that the Company establishes and implements in respect of credit underwriting and risk management. It focuses on management's assessment and management of both (i) credit risks and (ii) other risks, including, but not limited to, market, financial, legal and operational risks (including cybersecurity risks), and risks relating to the Company's reputation and ethical standards. In addition, the Audit Committee of the Board is responsible for, among other matters, reviewing policies and processes related to risk assessment and risk management, including the Company's major financial risk exposures and the steps management has taken to monitor and control such exposures. It also reviews compliance with legal and regulatory requirements (including cybersecurity requirements). The Compensation Committee of the Board reviews compensation-related risks to the Company. The Finance Committee of the Board oversees the investment of the Company's investment portfolio and the Company's capital structure, liquidity, financing arrangements, rating agency matters, and any corporate development activities in support of the Company's financial plan. The Nominating and Governance Committee of the Board oversees risk at the Company by developing appropriate corporate governance guidelines and identifying qualified individuals to become board members.
The Company has established a number of management committees to develop enterprise level risk management guidelines, policies and procedures for the Company's insurance, reinsurance and asset management subsidiaries that are tailored to their respective businesses, providing multiple levels of review, analysis and control.
The Company's management committees responsible for enterprise risk management include:
| |
| • | Portfolio Risk Management Committee—The Portfolio Risk Management Committee is responsible for enterprise risk management for the Company on a consolidated basis and focuses on measuring and managing credit, market and liquidity risk for the Company. This committee establishes company-wide credit policy for the Company's direct and assumed insured business. It implements specific underwriting procedures and limits for the Company and allocates underwriting capacity among the Company's subsidiaries. All transactions in new asset classes or new jurisdictions, or otherwise outside the Company's Board-approved risk appetite statement, must be approved by this committee. |
| |
| • | U.S. Management Committee—This committee establishes strategic policy and reviews the implementation of strategic initiatives and general business progress in the U.S. The U.S. Management Committee approves risk policy at the U.S. operating company level. |
The Company's management committees responsible for risk management in its Insurance segment include:
| |
| • | Risk Management Committees—The U.S., AG Re and AGRO risk management committees and the AGE UK Surveillance Committee conduct an in-depth review of the insured portfolios of the relevant subsidiaries, focusing on varying portions of the portfolio at each meeting. They review and may revise internal ratings assigned to the insured transactions and review sector reports, monthly product line surveillance reports and compliance reports. |
| |
| • | Workout Committee—This committee receives reports from surveillance and workout personnel on insurance transactions that might benefit from active loss mitigation or risk reduction, and approves loss mitigation or risk reduction strategies for such transactions. |
| |
| • | Reserve Committees—Oversight of reserving risk is vested in the U.S. Reserve Committee, the U.K. Executive Risk Committee, the AG Re Reserve Committee and the AGRO Reserve Committee. The committees review the reserve methodology and assumptions for each major asset class or significant below-investment-grade (BIG) transaction, as well as the loss projection scenarios used and the probability weights assigned to those scenarios. The reserve committees establish reserves for the relevant subsidiaries, taking into consideration supporting information provided by surveillance personnel. |
The Company's committees responsible for risk management in its Asset Management segment include:
| |
| • | Asset Management Investment Committees—These committees focus on consistent application of rigorous investment evaluation criteria for the Asset Management segment's investing activity. Each Asset Management segment investment committee consists of the Chief Investment Officer and two or more senior investment professionals with deep expertise in the markets relevant to each investment. |
| |
| • | Asset Management Risk Committee—This focuses on preventing the Asset Management segment investment or business process from posing inappropriate risk of loss, legal or reputational damage to investors. The committee is responsible for approving Asset Management segment investment risk policy and managing the products consistently with all fiduciary objectives and constraints, including those of its affiliates. Compliance and other operational sub-committees report regularly to this committee on the full range of compliance and other operational risk matters applicable to the Asset Management segment including policies, risks and controls, audits, personal trading activity, compliance testing results, operational diligence and regulatory filings. |
| |
| • | Valuation Committee—This committee focuses on consistent and objective oversight of the Asset Management segment's valuation policies and procedures. It meets monthly to review the month-end valuations prior to the release of net asset valuations (NAV) to fund investors. The month-end package includes details of estimated versus final NAV differences, securitized products price verification, valuation model reviews, price back testing, derivative valuation verification, administrator valuation reconciliation and latent price analysis. In addition, this committee convenes to review and decide on material changes to fund valuation methodology, material valuation changes on an Accounting Standards Codification (ASC) 820 Level 3 asset, pricing or valuation exceptions, valuation approach to new products, new model approval, guidelines and policies for classification of assets and changes to policies and procedures. |
Enterprise Risk Management
The business units and functional areas are responsible for identifying, assessing, monitoring, reporting and managing their own risks. The Chief Risk Officer and other risk management personnel are separate from the business units and are responsible for developing the risk management framework, ensuring applicable risk management policies and procedures are followed consistently across business units, and for providing objective oversight and aggregated risk analysis. Internal Audit provides independent assurance around effective risk management design and control execution.
A risk appetite statement and risk limits have been established from an enterprise-wide and business unit perspective for specific risk categories, where appropriate. Risk management personnel monitor a variety of key risk indicators on an ongoing basis and work with the business units to take the appropriate steps to manage the Company's established risk appetites and tolerances. Risk management also uses an internally developed capital model to project potential credit losses in the insured portfolio and analyze the related capital implications for the Company, and performs stress and scenario testing to both validate model results and assess the potential financial impact of emerging risks.
Quarterly risk reporting keeps management and the Board and its Risk Oversight Committee, senior management, the business units and functional areas informed about material risk-related developments. At least once each year, risk management personnel prepare an Own Risk and Solvency Assessment for the Group and each of the operating companies (Commercial Insurer Solvency Self-Assessment for AG Re) which reports the results of capital modeling, the status of key risk indicators and any emerging risks. In addition, the Company performs in-depth reviews annually of risk topics of interest to management and the Board. To the extent potentially significant business activities or operational initiatives are considered, the Chief Risk Officer analyzes the possible impact on the Company’s risk profile and capital adequacy.
Surveillance of Insured Transactions
The Company's surveillance personnel are responsible for monitoring and reporting on the performance of each risk in its insured portfolio, including exposures in both the financial guaranty direct and assumed businesses, and tracks aggregation of risk. The primary objective of the surveillance process is to monitor trends and changes in transaction credit quality, detect any deterioration in credit quality, and recommend remedial actions to management. All transactions in the insured portfolio are assigned internal credit ratings, and surveillance personnel recommend adjustments to those ratings to reflect changes in transaction credit quality. The Company monitors its insured portfolio and refreshes its internal credit ratings on individual exposures in quarterly, semi-annual or annual cycles based on the Company’s view of the exposure’s quality, loss potential, volatility and sector. Ratings on exposures in sectors identified as under the most stress or with the most potential volatility are reviewed every quarter, although the Company may also review a rating in response to developments impacting the credit when a ratings review is not scheduled.
The review cycle and scope vary based upon transaction type and credit quality. In general, the review process includes the collection and analysis of information from various sources, including trustee and servicer reports, financial statements, general industry or sector news and analyses, and rating agency reports. For public finance risks, the surveillance process includes monitoring general economic trends, developments with respect to state and municipal finances, and the financial situation of the issuers. For structured finance transactions, the surveillance process can include monitoring transaction performance data and cash flows, compliance with transaction terms and conditions, and evaluation of servicer or collateral manager performance and financial condition. Additionally, the Company uses various quantitative tools and models to assess transaction performance and identify situations where there may have been a change in credit quality. Surveillance activities may include discussions with or site visits to issuers, servicers or other parties to a transaction.
For transactions that the Company has assumed, the ceding insurers are responsible for conducting ongoing surveillance of the exposures that have been ceded to the Company, except that the Company provides surveillance for exposures assumed from SGI. The Company's surveillance personnel monitor the ceding insurer's surveillance activities on exposures ceded to the Company through a variety of means, including reviews of surveillance reports provided by the ceding insurers, and meetings and discussions with their analysts. The Company's surveillance personnel also monitor general news and information, industry trends and rating agency reports to help focus surveillance activities on sectors or exposures of particular concern. For certain exposures, the Company also will undertake an independent analysis and remodeling of the exposure. The Company's surveillance personnel also take steps to ensure that the ceding insurer is managing the risk pursuant to the terms of the applicable reinsurance agreement.
Workouts
The Company's workout personnel are responsible for managing workout, loss mitigation and risk reduction situations. They work together with the Company's surveillance personnel to develop and implement strategies on transactions that are experiencing loss or could possibly experience loss. They develop strategies designed to enhance the ability of the Company to enforce its contractual rights and remedies and mitigate potential losses. The Company's workout personnel also engage in negotiation discussions with transaction participants and, when necessary, manage (along with legal personnel) the Company's litigation proceedings. They may also make open market or negotiated purchases of securities that the Company has insured, or negotiate or otherwise implement consensual terminations of insurance coverage prior to contractual maturity. The Company's surveillance personnel work with servicers of RMBS transactions to enhance their performance.
Ceded Business
As part of its risk management strategy prior to the global financial crisis of 2008, the Company obtained third party reinsurance or retrocessions for various risk management purposes, and may do so again in the future. Over the past several years the Company has entered into commutation agreements reassuming portions of the previously ceded business from certain reinsurers; as of December 31, 2019, approximately 0.6%, or $1.3 billion, of its principal amount outstanding was still ceded to third party reinsurers, down from 12%, or $86.5 billion, as of December 31, 2009. In the future, the Company may enter into new commutation agreements to reassume portions of its insured business ceded to other reinsurers, but such opportunities are expected to be limited given the small number of unaffiliated reinsurers currently reinsuring the Company.
Asset Management
The Company’s Asset Management segment risk personnel are responsible for quantifying, analyzing and reporting the risks of each asset management fund and ensuring adherence to agreed investor mandates, independent from Asset Management segment investment personnel. The Asset Management segment applies investment and risk management processes across all managed funds and investments. Investment professionals are responsible for sourcing, evaluating, structuring, executing, managing, and exiting existing investments. After the evaluation and diligence processes, and as appropriate thereafter, investment team members submit recommended actions to the relevant Asset Management segment investment committee in accordance with each strategy’s required investment procedures. The relevant Asset Management segment investment committee carefully considers the alignment of each investment with the unique objectives and constraints of the vehicle(s) to which it is allocated. Asset Management segment risk professionals further independently monitor and ensure alignment of risk taking with the objectives and constraints of each investment mandate at inception and thereafter, using both proprietary and third-party quantitative data, analytic tools, and reports.
Cybersecurity
The Company relies on digital technology to conduct its businesses and interact with market participants and vendors. With this reliance on technology comes the associated security risks from using today’s communication technology and networks.
To defend the Company's computer systems from cyberattacks, the Company uses tools such as firewalls, anti-malware software, multifactor authentication, e-mail security services, virtual private networks, third-party security experts, and timely applied software patches, among others. The Company has also engaged third-party consultants to conduct penetration tests to identify any potential security vulnerabilities. Although the Company believes its defenses against cyber intrusions are sufficient, it continually monitors its computer networks for new types of threats.
Climate Change Risk
As a financial guarantor of municipal and structured finance transactions, the Company does not take direct exposure to climate change, but does face the risk that its obligors’ ability to pay debt service will be impaired by the impact of climate related events. Beginning February 1, 2019, the Company formalized its consideration of environmental risks in its financial guaranty business by requiring that underwriting submissions include a consideration of environmental factors as part of the analysis.
The Company is also exposed indirectly to climate change trends and events that might impair the performance of securities in its investment portfolio. The portfolio consists predominantly of fixed-income assets. Nevertheless, environmental issues, including regulatory changes, changes in supply or demand characteristics of fuels, and extreme weather events, may
impact the value of certain securities. The Company determined in 2016 not to make any new investments in thermal coal enterprises. In fourth quarter of 2019, the Company revised its investment guidelines to reflect its commitment to incorporating material environmental factors into its investment analysis to enhance the quality of investment decisions.
The Company has established a management environmental and social responsibility task force that is responsible for coordinating its response to climate change risk (among other matters). In May 2019 the Board established an Environmental and Social Responsibility Committee to oversee the Company's response to climate change risk, and that committee began meeting in August.
Regulation
General
The business of insurance and reinsurance is regulated in most countries, although the degree and type of regulation varies significantly from one jurisdiction to another. Reinsurers are generally subject to less direct regulation than primary insurers. The business of asset management, and the financial services industry generally, is subject to extensive regulation as well.
The Company is subject to regulation under applicable insurance-related and asset management-related statutes in the U.S., the U.K., Bermuda and Bermuda, as well as applicable statutes in Australia.elsewhere.
Regulation of Insurance Business
United States
AGL has three operating insurance subsidiaries domiciled in the U.S., which the Company refers to collectively as the Assured Guaranty U.S. Insurance Subsidiaries.
AGM is a New York domiciled insurance company licensed to write financial guaranty insurance and reinsurance in 50 U.S. states, the District of Columbia, Guam, Puerto Rico and the U.S. Virgin Islands.
| |
| • | MAC is a New York domiciled insurance company licensed to write financial guaranty insurance and reinsurance in 50 U.S. states and the District of Columbia. MAC only insures U.S. public finance debt obligations, focusing on investment grade bonds in select sectors of that market. |
MAC is a New York domiciled insurance company licensed to write financial guaranty insurance and reinsurance in 50 U.S. states and the District of Columbia. MAC will only insure U.S. public finance debt obligations, focusing on investment grade bonds in select sectors of that market.
AGC is a Maryland domiciled insurance company licensed to write financial guaranty insurance and reinsurance in 50 U.S. states, the District of Columbia and Puerto Rico.
Insurance Holding Company Regulation
AGL and the Assured Guaranty U.S. Insurance Subsidiaries are subject to the insurance holding company laws of their jurisdictionrespective jurisdictions of domicile, as well as other jurisdictions where these insurers are licensed to do insurance business. These laws
generally require each of the Assured Guaranty U.S. Insurance Subsidiaries to register with its respective domestic state insurance department and annually to furnish financial and other information about the operations of companies within theirits holding company system. Generally, all transactions among companies in the holding company system to which any of the Assured Guaranty U.S. Insurance Subsidiaries is a party (including sales, loans, reinsurance agreements and service agreements) must be fair and, if material or of a specified category, such as reinsurance or service agreements, require prior notice and approval or non-disapproval by the insurance department where the applicable subsidiary is domiciled.
Change of Control
Before a person can acquire control of a U.S. domestic insurance company, prior written approval must be obtained from the insurance commissioner of the state where the domestic insurer is domiciled. Generally, state statutes provide that control over a domestic insurer is presumed to exist if any person, directly or indirectly, owns, controls, holds with the power to vote, or holds proxies representing, 10% or more of the voting securities of the domestic insurer. Prior to granting approval of an application to acquire control of a domestic insurer, the state insurance commissioner will consider factors such factors as the financial strength of the applicant, the integrity and management of the applicant's board of directors and executive officers, the acquirer's plans for the management of the applicant's board of directors and executive officers, the acquirer's plans for the future operations of the domestic insurer and any anti-competitive results that may arise from the consummation of the acquisition of control. These laws may discourage potential acquisition proposals and may delay, deter or prevent a change of control involving AGL that some or all of AGL's stockholders might consider to be desirable, including in particular unsolicited transactions.
State Insurance Regulation
State insurance authorities have broad regulatory powers with respect to various aspects of the business of U.S. insurance companies, including licensing these companies to transact business, accreditation of reinsurers, admittance ofdetermining whether assets toare "admitted" and counted in statutory surplus, regulatingprohibiting unfair trade and claims practices, establishing reserve requirements and solvency standards, regulating investments and dividends and, in certain instances, approving policy forms and related materials and approving premium rates. State insurance laws and regulations require the Assured Guaranty U.S. Insurance Subsidiaries to file financial statements with insurance departments everywhere they are licensed, authorized or accredited to conduct insurance business, and their operations are subject to examination by those departments at any time. The Assured Guaranty U.S. Insurance Subsidiaries prepare statutory financial statements in accordance with Statutory Accounting Practices,Principles, or SAP, and procedures prescribed or permitted by these departments. State insurance departments also conduct periodic examinations of the books and records, financial reporting, policy filings and market conduct of insurance companies domiciled in their states, generally once every three to five years. Market conduct examinations by regulators other than the domestic regulator are generally carried out in cooperation with the insurance departments of other states under guidelines promulgated by the National Association of Insurance Commissioners.
The New York State Department of Financial Services (the NYDFS), the regulatory authority of the domiciliary jurisdiction of AGM and MAC, and the Maryland Insurance Administration (the MIA), the regulatory authority of the domiciliary jurisdiction of AGC, each conducts a periodic examination of insurance companies domiciled in New York and Maryland, respectively, usually at five-year intervals. In 2012, the NYDFS commenced examinations of AGM and MAC in order for its examinations of these companies to coincide with the Maryland Insurance Administration (the MIA's) examination of AGC. In 2013, the NYDFS completed its examinations and issued Reports on Examination of AGM for the four-year period ending December 31, 2011 and MAC for the period September 26, 2008 through June 30, 2012. The reports did not note any significant regulatory issues concerning those companies.
The MIA, the regulatory authority of the domiciliary jurisdiction of AGC, conducts a periodic examination of insurance companies domiciled in Maryland every five years. In 2013, the MIA issued an Examination Report with respect to AGC for the five year period ending December 31, 2011; no significant regulatory issues were noted in such report.
Assured Guaranty has been notified that2017, the NYDFS and MIA will formally commence an examination,in coordination commenced examinations, respectively, of AGM and MAC, and AGC, in 2017 for the period covering the end of the last applicable examination period for each company through December 31, 2016. In 2018, the NYDFS and MIA completed their examinations. The NYDFS issued Reports on Examination of AGM for the five-year period ending December 31, 2016 and MAC for the period July 1, 2012 through December 31, 2016. The reports did not note any significant regulatory issues concerning those companies. The MIA issued an Examination Report with respect to AGC for the five year period ending December 31, 2016; no significant regulatory issues were noted in that report.
State Dividend Limitations
New York. One of the primary sources of cash for repurchases of shares and the payment of debt service and dividends by the Company is the receipt of dividends from AGM. Under the New York Insurance Law, AGM and MAC may only pay dividends out of "earned surplus," which is the portion of the company's surplus that represents the net earnings, gains or profits (after deduction of all losses) that have not been distributed to shareholders as dividends, transferred to stated capital
or capital surplus, or applied to other purposes permitted by law, but does not include unrealized appreciation of assets. AGM and MAC may each pay dividends without the prior approval of the New York Superintendent of Financial Services (New York Superintendent) that, together with all dividends declared or distributed by it during the preceding 12 months, do not exceed the lesser of 10% of its policyholders' surplus (as of its last annual or quarterly statement filed with the New York Superintendent) or 100% of its adjusted net investment income during that period. TheSee Part II, Item 7, Management's Discussion and Analysis of Financial Condition and Results of Operations, Liquidity and Capital Resources, for the maximum amount available during 2017 for AGM to payof dividends to its parent AGMHthat can be paid without regulatory approval, is estimated to be approximately $232 million, of which approximately $81 million is available for distribution in the first quarter of 2017. AGM paid dividends of $247 million, $215 millionrecent dividend history and $160 million during 2016, 2015 and 2014, respectively, to AGMH. The maximum amount available during 2017 for MAC to distribute as dividends to its shareholders (AGM and AGC) without regulatory approval is estimated to be approximately $49 million; MAC currently intends to allocate the distribution of such amount quarterly in 2017. other recent capital movements.
Maryland. Another primary source of cash for the repurchases of shares and payment of debt service and dividends by the Company is the receipt of dividends from AGC. Under Maryland's insurance law, AGC may, with prior notice to the MIA, pay an ordinary dividend that, together with all dividends paid in the prior 12 months, does not exceed the lesser of 10% of its policyholders' surplus (as of the prior December 31) or 100% of its adjusted net investment income during that period. The maximum amount available during 2017 for AGC to pay ordinary dividends to its parent Assured Guaranty U.S. Holdings Inc. (AGUS) will be approximately $107 million, of which approximately $29 million is available for distribution in the first quarter of 2017. A dividend or distribution to a stockholder in excess of this limitation would constitute an "extraordinary dividend," which must
be paid out of "earned surplus" and reported to, and approved by, the MIA prior to payment. "Earned surplus" is that portion of the company's surplus that represents the net earnings, gains or profits (after deduction of all losses) that have not been distributed to shareholders as dividends or transferred to stated capital or capital surplus, or applied to other purposes permitted by law, but does not include unrealized capital gains and appreciation of assets. AGC may not pay any dividend or make any distribution, including ordinary dividends, unless it notifies the MIAMaryland Insurance Commissioner (the Maryland Commissioner) of the proposed payment within five business days following declaration and at least ten days before payment. The MIAMaryland Commissioner may declare that such dividend not be paid if it finds that AGC's policyholders' surplus would be inadequate after payment of the dividend or the dividend could lead AGC to a hazardous financial condition. AGCSee Part II, Item 7, Management's Discussion and Analysis of Financial Condition and Results of Operations, Liquidity and Capital Resources, for the maximum amount of dividends that can be paid dividends of $79 million, $90 millionwithout regulatory approval, recent dividend history and $69 million during 2016, 2015 and 2014, respectively, to AGUS.other recent capital movements.
Contingency Reserves
Under the New York Insurance Law, each of AGM and MAC must establish a contingency reserve to protect policyholders. New York Insurance Law determines the calculation of the contingency reserve and the period of time over which it must be established and, subsequently, can be taken down.released.
Likewise, in accordance with Maryland insurance law and regulations, AGC also maintains a statutory contingency reserve for the protection of policyholders. Maryland insurance law determines the calculation of the contingency reserve and the period of time over which it must be established, and subsequently, can be taken down.released.
In both New York and Maryland, when considering the principal amount guaranteed, the insurer is permitted to take into account amounts that it has ceded to reinsurers. In addition, releases from the insurer's contingency reserve may be permitted under specified circumstances in the event that actual loss experience exceeds certain thresholds or if the reserve accumulated is deemed excessive in relation to the insurer's outstanding insured obligations.
From time to time, AGM and AGC have obtained the approval of their regulators to release contingency reserves based on losses or because the accumulated reserve is deemed excessive in relation to the insurer's outstanding insured obligations. In 2016,2019, on the latter basis, AGM and MAC obtained the NYDFS's approval for a contingency reserve releasereleases of approximately $175$124 million and $25 million, respectively, and AGC obtained the MIA's approval for a contingency reserve release of approximately $152$4 million. In addition,The MAC also released approximately $53 millionand AGC releases consisted entirely of the assumed contingency reserves whichmaintained by those companies, as reinsurers of AGM, in connection with the same insured obligations that were the subject of AGM's $124 million release. Similarly, in 2018, on the same basis, AGM and MAC obtained the NYDFS's approval for contingency reserve releases of approximately $142 million and $45 million, respectively, and AGC obtained the MIA's approval for a contingency reserve release of approximately $11 million. As in 2019, the MAC and AGC releases in 2018 consisted of the assumed contingency reserves maintained by MAC,those companies, as reinsurerreinsurers of AGM, in respect ofconnection with the same insured obligations that were the subject of AGM's $175$142 million release.release, except for a portion of AGC's $11 million release relating to the exposures AGC assumed in June 2018 from SGI.
Applicable MarylandNew York and New YorkMaryland laws and regulations require regular, quarterly contributions to contingency reserves, while they are being established, but such laws and regulations permit the discontinuation of such quarterly contributions to an insurer's contingency reserves when such insurer's aggregate contingency reserves for a particular line of business (i.e., municipal or non-municipal) exceed the sum of the insurer's outstanding principal for each specified category of obligations within the particular line of business multiplied by the specified contingency reserve factor for each such category. In accordance with such laws and regulations, and with the approval of the MIANYDFS and the NYDFS,MIA, respectively, AGM ceased making quarterly contributions to its contingency reserves for non-municipal business and AGC ceased making quarterly contributions to its contingency reserves for both municipal and non-municipal business, and AGM ceased making quarterly contributions to its contingency reserves for non-municipal business, in each case beginning in the fourth
quarter of 2014. Such cessations are expected to continue for as long as AGCAGM and AGMAGC satisfy the foregoing condition for their applicable line(s) of business.
In July 2013, AGM and AGC were notified that the NYDFS and MIA did not object to AGM, AGE and AGC reassuming all of the outstanding contingency reserves that they had ceded to AG Re and electing to cease ceding future contingency reserves to AG Re. The insurance regulators permitted AGM, AGE and AGC to reassume the contingency reserves in increments over three years. As of December 31, 2015, AGM, AGE and AGC had collectively reassumed an aggregate of approximately $522 million.
Financial guaranty insurers are also required to maintain a loss and loss adjustment expense (LAE) reserve (on a case-by-case basis) and unearned premium reserve.
Single and Aggregate Risk Limits
The New York Insurance Law and the Code of Maryland Regulations establish single risk limits for financial guaranty insurers applicable to all obligations issued by a single entity and backed by a single revenue source. For example, under the limit applicable to qualifying asset-backed securities, the lesser of:
the insured average annual debt service for a single risk, net of qualifying reinsurance and collateral, or
the insured unpaid principal (reduced by the extent to which the unpaid principal of the supporting assets exceeds the insured unpaid principal) divided by nine, net of qualifying reinsurance and collateral,
may not exceed 10% of the sum of the insurer's policyholders' surplus and contingency reserves, subject to certain conditions.
Under the limit applicable to municipal obligations, the insured average annual debt service for a single risk, net of qualifying reinsurance and collateral, may not exceed 10% of the sum of the insurer's policyholders' surplus and contingency reserves. In addition, insured principal of municipal obligations attributable to any single risk, net of qualifying reinsurance and collateral, is limited to 75% of the insurer's policyholders' surplus and contingency reserves.
Under the limit applicable to qualifying asset-backed securities, the lesser of:
the insured average annual debt service for a single risk, net of qualifying reinsurance and collateral, or
the insured unpaid principal (reduced by the extent to which the unpaid principal of the supporting assets exceeds the insured unpaid principal) divided by nine, net of qualifying reinsurance and collateral,
may not exceed 10% of the sum of the insurer's policyholders' surplus and contingency reserves, subject to certain conditions.
Single-risk limits are also specified for other categories of insured obligations, and generally are more restrictive than those listed for asset-backed or municipal obligations. Obligations not qualifying for an enhanced single-risk limit are generally subject to the "corporate" unpaid principal limit (applicable to insurance of unsecured corporate obligations) equal to 10% of the sum of the insurer's policyholders' surplus and contingency reserves. For example, "triple-X" and "future flow" securitizations, as well as unsecured investor-owned utility obligations, are generally subject to these "corporate" single-risk limits.
The New York Insurance Law and the Code of Maryland Regulations also establish aggregate risk limits on the basis of aggregate net liability insured as compared with statutory capital. "Aggregate net liability" is defined as outstanding principal and interest of guaranteed obligations insured, net of qualifying reinsurance and collateral. Under these limits, policyholders' surplus and contingency reserves must not be less than the sum of various percentages of aggregate net liability for various categories of specified obligations. The percentage varies from 0.33% for certain municipal obligations to 4% for certain non-investment-grade obligations. As of December 31, 2016,2019, the aggregate net liability of each of AGM, MAC and AGC utilized approximately 23.7%23%, 27.6%19% and 10.7%9% of their respective policyholders' surplus and contingency reserves.
The New York Superintendent hasand the Maryland Commissioner each have broad discretion to order a financial guaranty insurer to cease new business originations if the insurer fails to comply with single or aggregate risk limits. In practice,the Company's experience in New York, the New York Superintendent has shown a willingness to work with insurers to address these concerns.
Group Regulation
In connection with AGL’s establishment of tax residence in the U.K., as discussed in greater detail under "Tax Matters" below, the NYDFS has assumed responsibilitybeen designated as group-wide supervisor for regulation of the Assured Guaranty group. GroupGroup-wide supervision by the NYDFS results in additional regulatory oversight over Assured Guaranty, particularly with respect to group-wide enterprise risk, and may subject Assured Guaranty to new regulatory requirements and constraints.
Investments
The Assured Guaranty U.S. Insurance Subsidiaries are subject to laws and regulations that require diversification of their investment portfolio and limit the amount of investments in certain asset categories, such as BIG fixed-maturity securities, equity real estate, other equity investments, and derivatives. Failure to comply with these laws and regulations would cause investments exceeding regulatory limitations to be treated as non-admitted assets for purposes of measuring surplus, and, in some instances, would require divestiture of such non-qualifying investments. The Company believes that the investments made by the Assured Guaranty U.S. Insurance Subsidiaries complied with such regulations as of December 31, 2016.2019. In addition, any investment must be approved by the insurance company's board of directors or a committee thereof that is responsible for supervising or making such investment.
Operations of the Company's Non-U.S. Insurance Subsidiaries
In addition to the regulatory requirements imposed by the jurisdictions in which they are licensed, the business operations of the Company's reinsurance subsidiaries are affected by regulatory requirements in various U.S. states ofgoverning the United States governing "credit for reinsurance", which are imposed onability of the ceding companies of the reinsurers.reinsurers to receive credit for the reinsurance on their financial statements. The Nonadmitted and Reinsurance Reform Act (NRRA) ofwithin the Dodd-Frank Wall Street Reform and Consumer Protection Act (the Dodd-Frank Act) streamlined the regulation of reinsurance by applying single state regulation for credit for reinsurance. Under the NRRA,Nonadmitted and Reinsurance Reform Act, credit for reinsurance determinations are controlled by the ceding company’s state of domicile and non-domiciliary states are prohibited from applying their credit for reinsurance laws extraterritorially. In general, a ceding company which obtains reinsurance from a reinsurer that is licensed, accredited or approved by the ceding company's state of domicile is permitted to reflect in its statutory financial statements a credit in an aggregate amount equal to the ceding company's liability for unearned premiums (which are that portion of premiums written which applies to the unexpired portion of the policy period), and loss and loss expenseLAE reserves ceded to the reinsurer. The great majority of states, however, also permit a credit on the statutory financial statements of a ceding insurer for reinsurance obtained from a non-licensed or non-accredited reinsurer to the extent that the reinsurer secures its reinsurance obligations to the ceding insurer by providing collateral in the form of a letter of credit, trust fund or other acceptable security arrangement. Certain of those states permit such non-licensed/non-accredited reinsurers that meet certain specified requirements to apply for certified reinsurer status. If granted, such status allows the certified reinsurer to post less than 100% collateral (the exact percentage depends on the certifying state's view of the reinsurer's financial strength) and the applicable ceding company will still qualify, on the basis of such reduced collateral, for full credit for reinsurance on its statutory financial statements with respect to reinsurance contracts renewed or entered into with the certified reinsurer on or after the date the reinsurer becomes certified. A few states do not allow credit for reinsurance ceded to non-licensed reinsurers except in certain limited circumstances and others impose additional requirements that make it difficult to become accredited. The Company's reinsurance subsidiaries AG Re and AGRO are not licensed, accredited or approved in any state and accordingly have established trusts to secure their reinsurance obligations. In 2017, AGRO obtained certified reinsurer status in Missouri, which allows AGRO to post 10% collateral in respect of any reinsurance assumed from Missouri-domiciled ceding companies on or after the date of AGRO’s certification.
U.S. Federal Regulation
The Company’s businesses are subject to direct and indirect regulation under U.S. federal law. In particular, the Company’s derivatives activities are directly and indirectly subject to a variety of regulatory requirements under the Dodd-Frank Act. Based on the size of its subsidiaries' remaining legacy derivatives portfolios, AGL does not believe any of its subsidiaries isare required to register with the Commodity Futures Trading Commission (CFTC) as a “major swap participant” or with the SEC as a "major securities-based swap participant".participant." Certain of the Company's subsidiaries may be subject to Dodd-Frank Act requirements to post margin or to clear on a regulated execution facility future swap transactions or with respect to certain amendments to legacy swap transactions, if they enter into such transactions.
Bermuda
AG Re and AGRO are each an insurance company currently registered and licensed under the Insurance Act 1978 of Bermuda, amendments thereto and related regulations (collectively, the Insurance Act). AG Re is registered and licensed as a Class 3B insurer and AGRO is registered and licensed as a Class 3A insurer and a Class C long-term insurer.
Bermuda Insurance Regulation
The Insurance Act imposes on insurance companies solvency and liquidity standards; restrictions on the declaration and payment of dividends and distributions; restrictions on the reduction of statutory capital; restrictions on the winding up of long-term insurers; and auditing and reporting requirements; and the need to have a principal representative and a principal office (as understood under the Insurance Act) in Bermuda. The Insurance Act grants to the Bermuda Monetary Authority (the Authority) the power to cancel insurance licenses, supervise, investigate and intervene in the affairs of insurance companies and in certain circumstances share information with foreign regulators. Class 3A and Class 3B insurers are authorized to carry on general insurance business (as understood under the Insurance Act), subject to conditions attached to the license and to compliance with minimum capital and surplus requirements, solvency margin, liquidity ratio and other requirements imposed by the Insurance Act. Class C long-term insurers are permitted to carry on long-term business (as understood under the
Insurance Act) subject to conditions attached to the license and to similar compliance requirements and the requirement to maintain its long-term business fund (a segregated fund).
Each of AG Re and AGRO is required annually to file statutorily mandated financial statements and returns, audited by an auditor approved by the Authority (no approved auditor of an insurer may have an interest in that insurer, other than as an
insured, and no officer, servant or agent of an insurer shall be eligible for appointment as an insurer's approved auditor), together with an annual loss reserve opinion of the loss reserve specialist, who is approved by the Authority, and in respect of AGRO, the required actuary's certificate with respect to the long-term business. When each of AG Re and AGRO files its statutory financial statements, it is also required to deliver to the Authority a declaration of compliance, declaring whether or not the insurer has, with respect to the preceding financial year, complied with all requirements of the minimum criteria applicable to it; complied with the minimum margin of solvency as at its financial year end; complied with the applicable enhanced capital requirements as at its financial year end; complied with the minimum liquidity ratio for general business as at its financial year end; and complied with applicable conditions, directions and restrictions imposed on, or approvals granted to the insurer. AG Re and AGRO are also required to file annual financial statements prepared in conformity with accounting principles generally accepted in the United States of America (GAAP),GAAP, which must be available to the public.
In addition, AG Re and AGRO are each required to file a capital and solvency return that includes its Bermuda Solvency Capital Requirement (BSCR) model (or an approved internal capital model in lieu thereof), a schedule of fixed income investments together with schedules prescribed by BSCR rating, a schedule of funds held by ceding reinsurers in segregated accounts/trusts by BSCR rating, a schedule of net reserves for losses and loss expense provisions by line of business, a schedule of premiums written by line of business, a schedule of geographic diversification of net premiums written by line of business, a schedule of risk management, a schedule of fixed income securities, a schedule of commercial insurer's solvency self-assessment (CISSA), a schedule of catastrophe risk return, a schedule of loss triangles or reconciliation of net loss reserves, a schedule of eligible capital, a statutory economic balance sheet, the loss reserve specialist's opinion, a schedule of regulated non-insurance financial operating entities and a schedule of solvency.Insurance Act from time to time. AGRO’s capital and solvency return must also include, among other details, a schedule of long-term premiums written by line of business, a schedule of long-term business data, a schedule of long-term variable annuity guarantees data and reconciliation, a schedule of long-term variable annuity guarantees - internal capital model and the approved actuary’s opinion.
Each of AG Re and AGRO are also required to prepare and file with the Authority, and publish on its website, a financial condition report. The Authority has discretion to approve modifications and exemptions to the public disclosure rules, on application by the insurer if, among other things, the Authority is satisfied that the disclosure of certain information will result in a competitive disadvantage or compromise confidentiality obligations of the insurer.
Finally, in lieu of the standard legal and regulatory requirements, AG Re is required to filemake a modified filing with the Authority, on a quarterly basis, financial returns consisting of (i)its board of directors quarterly meeting package (which includes AG Re’s unaudited quarterly financial statements for each financial quarter (which must minimally include a balance sheet and income statement and must also be recent and not reflect a financial position that exceeds two months)statements), and (ii) a list and detailsno later than 30 days after the date of material intra‑group transactions and risk concentrations that have materialized since the most recentits quarterly or annual financial returns, which would also include, among other things, details surrounding all intra group reinsurance and retrocession arrangements and other intra group risk transfer insurance business arrangements that have materialized since the most recent quarterly or annual financial returns and (iii) details of the ten largest exposures to unaffiliated counterparties and any other counterparty exposures exceeding 10% of the insurer’s statutory capital and surplus.board meetings.
Shareholder Controllers
Pursuant to provisions in the Insurance Act, any person who becomes a holder of 10% or more, 20% or more, 33% or more or 50% or more of the Company's common shares must notify the Authority in writing within 45 days of becoming such a holder. The Authority has the power to object to such a person if it appears to the Authority that the person is not fit and proper to be such a holder. In such a case, the Authority may require the holder to reduce their shareholding in the Company and may direct, among other things, that the voting rights attached to their common shares are not exercisable. A person that does not comply with such a notice or direction from the Authority will be guilty of an offense.
Notification of Material Changes
All registered insurers are required to give notice to the Authority of their intention to effect a material change within the meaning of the Insurance Act. For the purposes of the Insurance Act, the following changes are material: (i) the transfer or acquisition of insurance business being part of a scheme falling within, or any transaction relating to a scheme of arrangement under section 25 of the Insurance Act or section 99 of the Companies Act 1981 of Bermuda (the Companies Act), (ii) the
amalgamation or merger with or acquisition of another firm, (iii) engaging in unrelated business that is retail business, (iv) the acquisition of a controlling interest in an undertaking that is engaged in non-insurance business which offers services or products to non-affiliated persons, (v) outsourcing all or substantially all of the functions of actuarial, risk management, compliance and internal audit functions, (vi) outsourcing all or a material part of an insurer's underwriting activity, (vii) transferring other than by way of reinsurance all or substantially all of a line of business, (viii) expanding into a material new line of business, (ix) the sale of an insurer, and (x) outsourcing an officer role (in this context meaning a chief executive or senior executive performing the roles of underwriting, actuarial, risk management, compliance, internal audit, finance or investment matters).
Registered insurers are not permitted to take any steps to give effect to a material change listed above unless it has first served notice on the Authority that it intends to effect such material change and, before the end of 30 days, either the Authority has notified such company in writing that it has no objection to such change or that period has lapsed without the Authority having issued a notice of objection. A person who fails to give the required notice or who effects a material change, or allows such material change to be effected, before the prescribed period has elapsed or after having received a notice of objection is guilty of an offence.offense.
Minimum Solvency Margin and Enhanced Capital Requirements
Under the Insurance Act, AG Re and AGRO must each ensure that the value of its general business statutory assets exceeds the amount of its general business statutory liabilities by an amount greater than the prescribed minimum solvency margin and each company's applicable enhanced capital requirement.
The minimum solvency margin for Class 3A and Class 3B insurers is the greater of (i) $1 million, or (ii) 20% of the first $6 million of net premiums written; if in excess of $6 million, the figure is $1.2 million plus 15% of net premiums written in excess of $6 million, or (iii) 15% of net discounted aggregate loss and loss expense provisions and other insurance reserves, or (iv) 25% of that insurer's applicable enhanced capital requirement reported at the end of its relevant year.
In addition, as a Class C long-term insurer, AGRO is required, with respect to its long-term business, to maintain a minimum solvency margin equal to the greater of (i) $500,000, (ii) 1.5% of its assets or (iii) 25% its enhanced captialcapital requirement reported at the end of the relevant year. For the purpose of this calculation, assets are defined as the total assets pertaining to its long-term business reported on the balance sheet in the relevant year less the amounts held in a segregated account. AGRO is also required to keep its accounts in respect of its long-term business separate from any accounts kept in respect of any other business and all receipts of its long-term business form part of its long-term business fund.
Each of AG Re and AGRO is required to maintain available statutory capital and surplus at a level equal to or in excess of its applicable enhanced capital requirement, which is established by reference to either its BSCR model or an approved internal capital model. The BSCR model is a risk-based capital model which provides a method for determining an insurer's capital requirements (statutory economic capital and surplus) by taking into account the risk characteristics of different aspects of the insurer's business. The BSCR formula establishes capital requirements for ten categories of risk: fixed income investment risk, equity investment risk, interest rate/liquidity risk, currency risk, concentration risk, premium risk, reserve risk, credit risk, catastrophe risk and operational risk. For each category, the capital requirement is determined by applying factors to asset, premium, reserve, creditor, probable maximum loss and operation items, with higher factors applied to items with greater underlying risk and lower factors for less risky items.
While not specifically referred to in the Insurance Act, the Authority has also established a target capital level (TCL) for each insurer subject to an enhanced capital requirement equal to 120% of its enhanced capital requirement. While such an insurer is not currently required to maintain its statutory capital and surplus at this level, the TCL serves as an early warning tool for the Authority and failure to maintain statutory capital at least equal to the TCL will likely result in increased regulatory oversight.
For each insurer subject to an enhanced capital requirement, there is a three-tiered capital system designed to assess the quality of capital resources that a company has available to meet its capital requirements. Under this system, all of an insurer's capital instruments will be classified as either basic or ancillary capital which in turn will be classified into one of three tiers based on their “loss absorbency” characteristics. Highest quality capital is classified as Tier 1 Capital; lesser quality capital is classified as either Tier 2 Capital or Tier 3 Capital. Under this regime, up to certain specified percentages of Tier 1, Tier 2 and Tier 3 Capital (determined by registration classification) may be used to support the company's minimum solvency margin, enhanced capital requirement and TCL.
Restrictions on Dividends and Distributions
The Insurance Act limits the declaration and payment of dividends and other distributions by AG Re and AGRO.
Under the Insurance Act:
The minimum share capital must be always issued and outstanding and cannot be reduced. For AG Re, which is registered as a Class 3B insurer, the minimum share capital is $120,000. For AGRO, which is registered both as a Class 3A and a Class C long-term insurer, the minimum share capital is $370,000.
With respect to the distribution (including repurchase of shares) of any share capital, contributed surplus or other statutory capital:
| |
| (a) | any such distribution that would reduce AG Re's or AGRO's total statutory capital by 15% or more of their respective total statutory capital as set out in their previous year's financial statements requires the prior approval of the Authority. Any application for such approval must include an affidavit stating that the company will continue to meet the required margins and such other information as the Authority may require; and |
| |
| (b) | as a Class C long-term insurer, AGRO may not use the funds allocated to its long-term business fund, directly or indirectly, for any purpose other than a purpose of its long-term business except in so far as such payment can be made out of any surplus certified by AGRO's approved actuary to be available for distribution otherwise than to policyholders;policyholders. |
With respect to the declaration and payment of dividends:
| |
| (a) | each of AG Re and AGRO is prohibited from declaring or paying any dividends during any financial year if it is in breach of its solvency margin, minimum liquidity ratio or enhanced capital requirement, or if the declaration or payment of such dividends would cause such a breach (if it has failed to meet its minimum solvency margin or minimum liquidity ratio on the last day of any financial year, the insurer will be prohibited, without the approval of the Authority, from declaring or paying any dividends during the next financial year). Dividends are paid out of each insurer's statutory surplus and, therefore, dividends cannot exceed such surplus. See "—Minimum"Minimum Solvency Margin and Enhanced Capital Requirements" above and "—Minimum"Minimum Liquidity Ratio" below; |
| |
| (b) | an insurer which at any time fails to meet its minimum solvency margin or comply with the enhanced capital requirement may not declare or pay any dividend until the failure is rectified, and also in such circumstances the insurer must report, within 14 days after becoming aware of its failure or having reason to believe that such failure has occurred, to the Authority in writing giving particulars of the circumstances leading to the failure and giving a plan detailing the manner, specific actions to be taken and time frame in which the insurer intends to rectify the failure. A failure to comply with the enhanced capital requirement will also result in the insurer furnishing certain other information to the Authority within 45 days after becoming aware of its failure or having reason to believe that such failure has occurred; |
| |
| (c) | each of AG Re and AGRO is prohibited from declaring or paying in any financial year dividends of more than 25% of its total statutory capital and surplus (as shown on its previous financial year's statutory balance sheet) unless it files (at least seven days before payments of such dividends) with the Authority an affidavit signed by at least two directors (one of whom must be a Bermuda resident director if any of the insurer's directors are resident in Bermuda) and the principal representative stating that it will continue to meet its solvency margin and minimum liquidity ratio. Where such an affidavit is filed, it shall be available for public inspection at the offices of the Authority; and |
| |
| (d) | as a Class C long-term insurer, AGRO may not declare or pay a dividend to any person other than a policyholder unless the value of the assets of its long-term business fund, as certified by AGRO's approved actuary, exceeds the extent (as so certified) of the liabilities of AGRO's long-term business, and the amount of any such dividend shall not exceed the aggregate of (1) that excess; and (2) any other funds properly available for the payment of dividends being funds arising out of AGRO's business other than its long-term business. |
The Companies Act also limits the declaration and payment of dividends and other distributions by Bermuda companies such as AGL and its Bermuda subsidiaries, (includingwhich consist of AG Re, AGRO and AGRO)Cedar Personnel Ltd. (Bermuda Subsidiaries). Such companies may only declare and pay a dividend or make a distribution out of contributed surplus (as understood under the Companies Act) if there are reasonable grounds for believing that the company is and after the payment will be able to meet and pay its liabilities as they become due and the realizable value of the company's assets will not be less than its liabilities. The Companies Act also regulates and restricts the reduction and return of capital and paid in share premium, including the repurchase of shares.
Based on See Part II, Item 8, Financial Statements and Supplementary Data, Note 18, Insurance Company Regulatory Requirements, for more information, for the limitations above, in 2017 AG Re has the capacity to (i) make capital distributions in an aggregate amount up to $128 million without the prior approval of the Authority and (ii) declare and pay dividends in an aggregate amount up to the limit of its outstanding statutory surplus, which is $314 million. Such dividend capacity may be further limited by the actualmaximum amount of AG Re’s unencumbered assets, which amount changes from time to time due in part to collateral posting requirements. As of December 31, 2016, AG Re had unencumbered assets of approximately $596 million. AG Re declareddividends that can be paid without regulatory approval, recent dividend history and paid dividends of $100 million, $150 million and $82 million during 2016, 2015 and 2014, respectively, to AGL. The Company does not expect AGRO to declare or pay any dividends or other distributions at this time.recent capital movements.
Minimum Liquidity Ratio
The Insurance Act provides a minimum liquidity ratio for general business. An insurer engaged in general business is required to maintain the value of its relevant assets at not less than 75% of the amount of its relevant liabilities. Relevant assets include cash and time deposits, quoted investments, unquoted bonds and debentures, first liens on real estate, investment income due and accrued, accounts and premiums receivable, reinsurance balances receivable, funds held by ceding reinsurers and any other assets which the Authority on application in any particular case made to it with reasons, accepts in that case. There are certain categories of assets which, unless specifically permitted by the Authority, do not automatically qualify as relevant assets, such as unquoted equity securities, investments in and advances to affiliates and real estate and collateral loans.
The relevant liabilities are total general business insurance reserves and total other liabilities less deferred income tax and sundry liabilities (by interpretation, those not specifically defined) and letters of credit, corporate guarantees and other instruments.
Insurance Code of Conduct
Each of AG Re and AGRO is subject to the Insurance Code of Conduct, which establishes duties, standards, procedures and sound business principles which must be complied with to ensure sound corporate governance, risk management and internal controls are implemented by all insurers registered under the Insurance Act. The Authority will assess an insurer's compliance with the Code of Conduct in a proportionate manner relative to the nature, scale and complexity of its business. Failure to comply with the requirements under the Insurance Code of Conduct will be a factor taken into account by the Authority in determining whether an insurer is conducting its business in a sound and prudent manner as prescribed by the Insurance Act. Such failure to comply with the requirements of the Insurance Code of Conduct could result in the Authority exercising its powers of intervention and investigation and will be a factor in calculating the operational risk charge applicable in accordance with the insurer's BSCR model or approved internal model.
Certain Other Bermuda Law Considerations
Although AGL is incorporated in Bermuda, it is classified as a non-resident of Bermuda for exchange control purposes by the Authority. Pursuant to its non-resident status, AGL may engage in transactions in currencies other than Bermuda dollars and there are no restrictions on its ability to transfer funds (other than funds denominated in Bermuda dollars) in and out of Bermuda or to pay dividends to U.S. residents who are holders of its common shares.
Under Bermuda law, "exempted" companies are companies formed for the purpose of conducting business outside Bermuda from a principal place of business in Bermuda. As an "exempted" company, AGL (as well as each of AG Re and AGRO) may not, without the express authorization of the Bermuda legislature or under a license or consent granted by the Minister of Finance (the Minister), participate in certain business and other transactions, including: (1) the acquisition or holding of land in Bermuda (except that held by way of lease or tenancy agreement which is required for its business and held for a term not exceeding 50 years, or which is used to provide accommodation or recreational facilities for its officers and employees and held with the consent of the Minister, for a term not exceeding 21 years), (2) the taking of mortgages on land in Bermuda to secure a principal amount in excess of $50,000 unless the Minister consents to a higher amount, and (3) the carrying on of business of any kind or type for which it is not duly licensed in Bermuda, except in certain limited circumstances, such as doing business with another exempted undertaking in furtherance of AGL's business carried on outside Bermuda.
The Bermuda government actively encourages foreign investment in "exempted" entities like AGL that are based in Bermuda, but which do not operate in competition with local businesses. AGL is not currently subject to taxes computed on profits or income or computed on any capital asset, gain or appreciation. Bermuda companies pay, as applicable, annual government fees, business fees, payroll tax and other taxes and duties. See "—Tax Matters—Taxation of AGL and Subsidiaries—Bermuda."
Special considerations apply to the Company's Bermuda operations. Under Bermuda law, non-Bermudians, other than spouses of Bermudians and individuals holding permanent resident certificates or working resident certificates, are not permitted to engage in any gainful occupation in Bermuda without a work permit issued by the Bermuda government. A work permit is only granted or extended if the employer can show that, after a proper public advertisement, no Bermudian, spouse of a Bermudian or individual holding a permanent resident certificate or working resident certificate is available who meets the minimum standards for the position. A waiver from advertising is automatically granted in respect of any chief executive officer position and other chief officer positions. The employer can also make a request for a waiver from the requirement to advertise in certain other cases, as expressed in the Bermuda government's work permit policies. Currently, all of the Company's Bermuda based professional employees who require work permits have been granted work permits by the Bermuda government.
United Kingdom
The Company combined the operations of its European insurance subsidiaries, AGE UK, AGUK, AGLN and CIFGE, in a transaction that was completed on November 7, 2018. Under the Combination, AGUK, AGLN and CIFGE transferred their insurance portfolios to and merged with and into AGE UK.
This section concernsGeneral
Each of AGE and its affiliates Assured Guaranty (U.K.) Ltd. (AGUK), Assured Guaranty (London) Ltd. (AGLN)UK and Assured Guaranty Finance Overseas LtdLtd. (AGFOL), each of which is regulated in the U.K., as well as Assured Guaranty Credit Protection Ltd. (AGCPL), which is an authorized representative of AGE. AGE, AGUK and AGLN are regulated by the PRA as insurers. AGUK has been placed into runoff.AGLN (formerly MBIA UK Insurance Limited and renamed on January 13, 2017) was acquired as an authorized insurer in run-off by AGC on January 10, 2017. The Company is actively working to combine AGE, AGUK, AGLN and its affiliate CIFG Europe S.A. (CIFGE). Any such combination will be subject to regulatory and court approvals. As a result, the Company cannot predict when, or if, such combination will be completed.
General
Each of AGE, AGUK, AGLN and AGFOL are subject to the U.K.'s Financial Services and Markets Act 2000 (FSMA), which covers financial services relating to deposits, insurance, investments and certain other financial products.
Under FSMA, effecting or carrying out contracts of insurance by way of business in the U.K. each constitutes a “regulated activity” requiring authorization by the appropriate regulator. An authorized insurance company must have permission for each class of insurance business it intends to write.
Insurance companies in the U.K. are authorized by the Prudential Regulation Authority (PRA) and regulated by the PRA and the Financial Conduct Authority (FCA). The PRA and the FCA were established on April 1, 2013 and are the main regulatory authorities responsible for financial regulation in the U.K. These two regulatory bodies cover the following areas:
the PRA, a part of the Bank of England, is responsible for prudential regulation of key systemically importantcertain classes of financial services firms (which includes insurance companies, among others), and
the FCA is responsible for the conduct of business regulation of all firms and the regulation of market conduct and the prudential regulation of all non-PRA firms.
While the two regulators coordinate and cooperate in some areas, they have separate and independent mandates and separate rule-making and enforcement powers. AGE AGUK and AGLN areUK is regulated by both the PRA and the FCA. AGFOL is regulated by the FCA.
The PRA carries out the prudential supervision of insurance companies through a variety of methods, including the collection of information from statistical returns, the review of accountants' reports and insurers' annual reports and disclosures, visits to insurance companies and regular formal interviews. The PRA takes a risk-based approach to the supervision of insurance companies.
The primary source of rules relating to the prudential supervision of AGE AGUK and AGLNUK is the Solvency II Directive (Directive 2009/138/EC) as amended (including by the Omnibus II Directive (Directive 2014/51/EU)) (together, Solvency II),
which came into force and effect on January 1, 2016. The Solvency II rules continue to apply to AGE UK during the transition period to December 31, 2020 following the U.K.'s exit from the EU on January 31, 2020 (see also “U.K. referendum vote to leave the European Union” below). The PRA remains the prudential regulator for U.K. insurers such as AGE AGUK and AGLNUK, under Solvency II. Solvency II provides rules on capital adequacy, governance and risk management and regulatory reporting and public disclosure. It is intended to align capital requirements with the risk profile of each EEAEuropean Economic Area (EEA) insurance company and to ensure adequate diversification of an insurer's or reinsurer's exposures to any credit risks of its reinsurers. Each of AGE AGUK and AGLNUK has calculated its minimum required capital according to the Solvency II criteria and is in compliance.
The PRA applies threshold conditions, which insurers must meet, and against which the PRA assesses them on a continuous basis. At a high level, these conditions are that:
an insurer'sinsurer must be a body corporate (other than a limited liability partnership), a registered friendly society or a member of The Society of Lloyd's;
if an insurer is a body corporate incorporated in the U.K., its head office, and in particular its mind and management, must be in the U.K. if it is incorporated in the U.K.;U.K;
an insurer's business must be conducted in a prudent manner — in particular, the insurer must maintain appropriate financial and non-financial resources;
the insurer must be fit and proper, and be appropriately staffed; and
the insurer and its group must be capable of being effectively supervised.
The PRA assesses, on an ongoing basis, whether insurers are acting in a manner consistent with safety and soundness and appropriate policyholder protection, and so whether they meet, and are likely to continue to meet, the threshold conditions. It weights its supervision towards those issues and those insurers that, in its judgment, pose the greatest risk to its objectives. It is forward-looking, assessing its objectives not just against current risks, but also against those that could plausibly arise further
ahead and will rely significantly on judgments based on evidence and analysis. Its risk assessment framework looks at the potential impact of failure of the insurer, its risk context and mitigating factors.
AGFOL’sThe key EU legislation that is relevant to AGFOL is the Markets in Financial Instruments Directive (MiFID)(Directive 2014/65/EU)(MiFID II), which harmonizes the regulatory regime for investment services and activities across the EEA and the Insurance Distribution Directive (Directive EU/2016/97) (IDD) (which came into force on October 1, 2018). This EU legislation continues to apply to AGFOL during the transition period to December 31, 2020 following the U.K's exit from the EU on January 31, 2020. AGFOL’s MiFID II activities are limited to receiving and transmitting orders and giving investment advice and it cannot hold client money. Accordingly, although it is subject to MiFID II, AGFOL is exempt from the Capital Requirements Directive and Capital Requirements Regulations, (CRD III and CRD IV), which are the EU regulations on capital for certain MiFID firms. AGFOL has therefore calculated its minimum required capital according to the FCA’s rules for non-CRDnon-Capital Requirements Directive firms, and is in compliance.
TheDuring the transition period following the U.K.'s exit from the EU on January 31, 2020, the regulatory regime in the U.K. mustwill be consistent with relevant European Union (EU)EU legislation, which is either directly applicable in, or must be implemented into national law by, all of the remaining EU member states. The key EU legislation that is relevant to AGE AGUK and AGLNUK is Solvency II, which provides the framework for a newthe solvency and supervisory regime for insurers in the U.K. and in the EEA. The key EU legislation that is relevant to AGFOL is MiFID which harmonizes the regulatory regime for investment services and activities across the EEAII and the Insurance Mediation Directive.IDD(see also “U.K. referendum vote to leave the European Union” below.)
Position of U.K. Regulated Entities within the AGL Group
AGE UK is authorized by the PRA to effect and carry out certain classes of general insurance, specifically: classes 14 (credit), 15 (suretyship) and 16 (miscellaneous financial loss) for eligible counterparties and professional clients only (i.e., not retail clients). This scope of permission is sufficient to enable AGE UK to effect and carry out financial guaranty insurance and reinsurance. The insurance and reinsurance businesses of AGE UK are subject to close supervision by the PRA. AGE UK also has permission to arrange and advise on transactions it guarantees, and to take deposits in the context of its insurance business.
Following the Company's decision inIn 2010 to place AGUK into run-off, the Company has been utilizing AGE as the entity from which to write business in the EEA. Itit was agreed between management and AGE'sAGE UK's then regulator, the Financial Services Authority (now the PRA), that any new business written by AGE UK would be guaranteed using a co-insurance structure pursuant to which AGE UK would co-insure municipal and infrastructure transactions with AGM, and structured finance transactions with AGC. AGE must obtain the approval of the PRA before it can guarantee any new structured finance transaction. AGE'sUK's financial guaranty for each transaction covers a proportionate share (expected to be approximately 3 to 10%(currently fixed from 2019 at 15%) of the total exposure, and AGM or AGC, as the case may be, guarantees the remaining exposure under the transaction (subject to compliance with EEA licensing requirements). AGM or AGC, as the case may be, will also provide a second-to-pay guaranty to cover AGE'sAGE UK's financial guaranty.
AGE UK also is the principal of AGCPL.Assured Guaranty Credit Protection Ltd. (AGCPL). AGCPL is not PRA or FCA authorized, but is an appointed representative of AGE.AGE UK. This means AGCPL can carry on insurance mediationdistribution activities without a license, because AGE UK has regulatory responsibility for it.
AGCPL is subject to the requirements of Regulation (EU) No 648/2012 of the European Parliament and of the Council of July 4, 2012 on OTCover the counter (OTC) derivatives, central counterparties and trade repositories (EMIR), as amended by Regulation (EU) 2019/834 of the European Parliament and of the Council of May 20, 2019, which, as a Europeanan EU regulation, is directly applicable in all the member states of the EU.EU and in the U.K. AGCPL is the only European entity within the AGL group which has entered into derivative contracts and as such it is the only entity in the group which is directly subject to EMIR. AGCPL has notified the European Securities and Markets Authority (ESMA) and the FCA of its status under EMIR as a non-financial counterparty which has exceeded thea clearing threshold (an NFC+) as described in Article 10 of EMIR.. AGCPL is subject to certain requirements under EMIR with respect to its portfolio of derivative contracts including: (i) the requirement to centrally clear certain classes of standardized OTC derivatives (although AGCPL does not currently enter into such classes of derivatives, and so this requirement is not currently relevant); (ii) an obligation to employ certain risk mitigation techniques relating to derivatives that cannot be centrally cleared; and (iii) a requirement to report derivative transactions to a trade depository.repository, whether directly or through a delegated reporting arrangement. The Company is aware that circumstances exist in which EMIR may apply directly to non-European entities when transacting derivatives, but has determined that these circumstances do not apply to the non-European entities in AGL’s group.derivatives.
AGFOL, a subsidiary of AGL, is authorized by the FCA to carry out designatedcertain investment business activities (including(and insurance mediation) in that itdistribution) activities. It may “advise on investments (except on pension transfers and pension opt outs)” relating to most investment instruments.instruments (but not including insurance contracts). In addition, it may arrange or bring about transactions in investments and make “arrangements with a view to transactions in investments.”investments," in each case in relation to investments and insurance contracts (but only “non-investment insurance contracts”). In all cases, it may deal only with clients who are eligible
counterparties or professional customers (i.e., not retail clients), or, when arranging in relation to non-investment insurance contracts, commercial customers. AGFOL is not authorized as an insurer and does not itself take risk in the transactions it arranges or places, and may not hold funds on behalf of its customers. AGFOL's permissions also allow it to introduce business to AGC and AGM, so that AGFOL can arrange financial guaranties underwritten by AGC and AGM.
Solvency II and Solvency Requirements
In the U.K., Solvency II has been transposed into national law through changes to existing provisions in the FCA and the PRA’s respective handbooks and rulebook and through amendments to primary legislation. The Solvency II “Delegated Acts”,Acts,” which set out more detailed rules underlying Solvency II have direct effect in all EEA member states, includingand in the U.K. during the transition period to December 31, 2020 (see also “U.K. referendum vote to leave the European Union” below).
Among other things, Solvency II introducesintroduced a revised risk-based prudential regime which includes the following "Pillar 1" regulatory capital rules:
assets and liabilities are generally to be valued at their market value;
the amount of required economic capital is intended to ensure, with a probability of 99.5%, that regulated firms are able to meet their obligations to policyholders and beneficiaries over the following 12 months; and
reinsurance recoveries will be treated as a separate asset (rather than being netted against the underlying insurance liabilities).
In many instances, Solvency II is expected to require insurers to maintain a somewhat increased amount of capital to satisfy the new solvency capital requirements. AGE and AGUK haveUK has agreed with the PRA that theyit will use the "Standard Formula" prescribed by Solvency II for calculation of theirits capital requirements. AGLN is still using a bespoke internal model for calculation of its capital requirements, which was approved by the PRA prior to the acquisition of AGLN (then MBIA UK Insurance Limited) by AGC.
In addition to new regulatory capital rules, Solvency II also contains a number of “Pillar 2” qualitative requirements, obliging firms to develop and embed systems to identify, measure and proactively manage the risks they are, or may be, exposed to. Among other things, firms must:
have in place an effective system of governance that provides for the sound and prudent management of its business;
establish effective risk-management systems; and
take a comprehensive approach to considering their risks through an Own Risk and Solvency Assessment (ORSA) as proportionate to the nature, scale and complexity of the risks inherent in their business.
“Pillar 3” reporting and disclosure requirements also exist, including a requirement to publishprepare a public Solvency and Financial Condition Report (SFCR) and a private Regular Supervisory Report (RSR).Report. For more information on reporting requirements and the ORSA, see “Reporting Requirements” below.
Solvency II contains a new regime for the supervision of groups, including groups in which the parent undertaking has its head office in a country that is outside the EEA. The treatment of such groups in part depends on whether the jurisdiction in which the non-EEA parent has its head office is determined to have a supervisory regime which is equivalent to the Solvency II regime. In the absence of such a determination, the Solvency II rules on supervision apply to the group on a worldwide basis, unless the PRA elects to apply “other methods” which ensure appropriate supervision. Both AGE and AGUK are subsidiariesUK is a direct subsidiary of a U.S. parent companies.company.
The PRA has issued a Direction to AGE and AGUKUK which confirms the “other methods” that the PRA will apply to ensure appropriate supervision. These include, among other things, requirements for AGE and AGUKUK to notify the PRA in advance of any material changes in their intra-group arrangements and any payments of dividends or capital extractions to a group undertaking outside the EEA. AGE and AGUK must also provide the PRA with certain other information, such as internalin relation to the group's risk management, risk exposures and external solvency capital adequacy and risk assessment reports.assessment. The Direction applies from JanuaryNovember 12, 2018 until October 1, 2016 until January 1, 2019,2020, unless it is revoked earlier or no longer applicable.
Restrictions on Dividend Payments
U.K. company law prohibits each of AGE AGUK, AGLNUK and AGFOL from declaring a dividend to its shareholders unless it has “profits available for distribution.” The determination of whether a company has profits available for distribution is based on its accumulated realized profits less its accumulated realized losses. While the U.K. insurance regulatory laws impose no statutory restrictions on a general insurer's ability to declare a dividend, the PRA's capital requirements may in practice act as a restriction on dividends for AGE AGUK and AGLN.UK.
Reporting Requirements
U.K. insurance companies must prepare their financial statements under the Companies Act 2006, which requires the filing with Companies House of audited financial statements and related reports. In addition, as fromstarting January 1, 2016, the reporting requirements for U.K. insurance companies were modified by Solvency II. AGE AGUK and AGLN areUK is required to produce certain key reports including an annual SFCR, RSRSolvency and Financial Condition Report, Regular Supervisory Report and an ORSA, the latter as part of the so-called “Pillar 2” individual capital assessment requirements. Although the SFCR will take the place of a number of existing regulatory returns, Solvency II is likely to result in an overall increase in the quantity and quality of disclosures that firms make.
The PRA will review each firm’s ORSA and then consider whether in its view the firm needs to hold capital in excess of its Pillar 1 capital (see “Solvency II and Solvency Requirements” above) and, if so, willmay impose a “capital add-on”.add-on.” The prescribed information to be contained in the ORSA, as well as the frequency with which the assessment must be carried out, is subject to guidance issued by the European Insurance and Occupational Pensions Authority (EIOPA) in September 2015 and a supervisory statementstatements issued by the PRA in October 2015.PRA. The PRA has advised AGE AGUK and AGLNUK that it is not imposing a capital add-on for those companies at this time. The PRA may determine to impose a capital add-on in relation to AGE AGUK and AGLNUK in the future.
Supervision of Management
AGE AGUKUK and AGLNAGFOL are subject to the rules contained in the Senior Insurance Managers Regime (SIMR).and Certification Regime. This requires that individuals undertaking particular roles need to be registered with the PRArelevant UK regulator as undertaking a “Senior Insurance ManagerManagement Function”. This broadly includes individuals undertaking the executive functions and the oversight functions of each entity. Directors of those entities not serving inFor firms that are regulated by both the PRA and FCA, such as AGE UK, certain roles specified inare supervised by the SIMR will be required to become “approved persons” withPRA and certain roles are supervised by the FCA. For firms that are regulated by the FCA (as detailed further in respect of AGFOL below).
In respect of AGFOL, individuals who perform one or more “controlled functions”only, such as significant influence functions (which includesAGFOL, all board members and other senior managers) or the customer function within authorized firms must be approved the FCA to carry out that function. Individuals performing these functionsrelevant roles are “Approved Persons” for the purpose of Part V of FSMA and staff performing these specified “controlled functions” within an authorized firm must be approvedsupervised by the FCA.
Change of Control
Under FSMA, when a person decides to acquire or increase “control” of a U.K. authorized firm (including an insurance company) they must give the PRA (if regulated by the PRA and FCA) or the FCA (if regulated solely by the FCA) notice in writing before making the acquisition. The PRA hasand the FCA have up to 60 working days (without including any period of interruption) in which to assess a change of control case. Any person (a company or individual) that directly or indirectly acquires 10% or 20% (depending on the type of firm, the “Control Percentage Threshold”) or more of the shares, or is entitled to exercise or control the exercise of the Control Percentage Threshold or more of the voting power, in a U.K. authorized firm or its parent undertaking is considered to “acquire control” of the authorized firm. Broadly speaking, the 10% threshold applies to banks, insurers and reinsurers (but not brokers) and MiFID investment firms, and the 20% threshold to insurance brokers and certain other firms that are non-directive firms.
Intervention and Enforcement
The PRA has extensive powers to intervene in the affairs of an authorized firm, culminating in the sanction of the suspension of authorization to carry on a regulated activity. The PRA can also vary or cancel a firm's permissions under its own initiative if it considers that the firm is failing, or is likely to fail, to satisfy the Threshold Conditions. FSMA gives the PRA significant investigation and enforcement powers. It also gives the PRA a rule-making power, under which it makes the various rules that constitute its Handbook of Rules.Rulebook.
The PRA also has the power to prosecute criminal offenses arising under FSMA. The FCA has the power to prosecute offenses under FSMA and to prosecute insider dealing under Part V of the Criminal Justice Act of 1993, and breaches by authorized firms of money laundering and terrorist financing regulations.
“Passporting”
During the transition period to December 31, 2020 under the withdrawal agreement, EU directives allow AGE AGUK, AGLNUK and AGFOL to conduct business in the other remaining EU states other than the U.K. where they are authorized by the PRA or FCA under a single market directive. This right extends to the EEA. A firm taking advantage of a right under a single market directive to conduct business in anotheran EEA state can rely on its "home state" authorization. This ability to operate in other jurisdictions of the EEA on the basis of home state authorization and supervision is sometimes referred to as “passporting.” Each of AGE AGUK, AGLNUK and AGFOL is passported to conduct business in certain remaining EEA states other than the U.K.states. Passporting is not applicable to firms not authorized in the EEA or the U.K., such as AGM and AGC. Accordingly, the co-insurance model described above cannot be “passported” throughout the EEA. Instead, it is a question of local law in each remaining EEA member state as to whether AGM's or AGC’s participation in a co-insurance structure, protecting insureds or risks located in that jurisdiction, would amount to the conduct of insurance business in that jurisdiction. (See also “U.K. referendum vote to leave the EU”European Union” below.)
Fees and Levies
Each of AGE AGUK, AGLNUK and AGFOL is subject to regulatory fees and levies based on, in respect of AGE UK its gross premium income and gross technical liabilities.liabilities and, in respect of AGFOL, its annual income. These fees are collected by the FCA (though they relate to regulation by both the PRA and the FCA). The PRA and the FCA also requiresrequire authorized firms, including authorized insurers, to participate in an investors' protection fund, known as the Financial Services Compensation Scheme. The Financial Services Compensation Scheme was established to compensate consumers of financial services firms, including the buyers of insurance, against failures in the financial services industry. Eligible claimants (identified in the Compensation SourcebookPolicyholder Protection section of the PRA Rulebook and the Compensation section of the FCA Handbook) may be compensated by the Financial Services Compensation Scheme when an authorized firm (including an insurer or insurance distributor) is unable, or likely to be unable, to satisfy policyholder claims. General insurance in class 14 (credit) is not protected by the Financial Services Compensation Scheme, nor is reinsurance in any class; however, other direct insurance classes written by AGUK and AGE UK are covered (namely, classes 15 (suretyship) and 16 (miscellaneous financial loss)).
Material Contracts
AGE’s New York affiliate, AGM currently provides support to AGE UK through a quota share and excess of loss reinsurance agreement (the AGM Reinsurance Agreement) and a net worth maintenance agreement (the AGE UK Net Worth Agreement). For transactions closed prior to 2011, AGE typically guaranteed all
The versions of such agreements currently in force became effective on November 7, 2018 upon completion of the guaranteed obligations directly andCombination. These new agreements clarified the application of the prior agreements to AGE UK upon the Combination. They also incorporated changes to certain terms of the prior agreements requested by the PRA during its review of the Combination, including a change to the amount of collateral that AGM reinsured underis obligated to post to secure its reinsurance of AGE UK. Except for such changes, the new agreements do not materially alter the terms or coverage of the prior agreements.
The AGM Reinsurance Agreement - Quota Share Reinsurance: Under the quota share cover of the prior AGM Reinsurance Agreement AGM reinsured between approximately 92%95% - 99% of AGE'sAGE UK's retention of each AGE UK financial guaranty insurance policy after cessions to other reinsurers. InSuch range of proportionate reinsurance by AGM was the result of a formula in the prior AGM Reinsurance Agreement that fixed AGM’s reinsurance of AGE UK policies issued during a particular calendar year based upon the respective prior year-end capitalization of AGE UK and AGM.
The AGE UK policies reinsured pursuant to the prior AGM Reinsurance Agreement were limited to ones issued in 2011 and prior years because:
(a) AGE UK and AGM in 2011 implemented a co-guarantee structure pursuant to which (i) AGE UK, rather than guaranteeing directly all of the obligations issued in a particular transaction, directly guarantees, ainstead, only the portion of the guaranteed obligations in an amount equal to what would have been AGE'sAGE UK's pro rata retention percentage under the quota share cover of the prior AGM Reinsurance Agreement, (ii) AGM directly guarantees the balance of the guaranteed obligations, and (iii) AGM also provides a
second-to-pay guarantee for AGE'sAGE UK's portion of the guaranteed obligations. AGM's ability to provide such direct guaranties outsideobligations; and
(b) the prior AGM Reinsurance Agreement excluded AGE UK’s insured portion of the U.K. is uncertain. See "Passporting" above.co-guaranteed obligations from reinsurance by AGM, and all AGE UK business since 2011 has consisted of transactions insured pursuant to such co-guarantee structure.
The new AGM Reinsurance Agreement maintains in place AGM’s proportionate reinsurance of all AGE UK policies covered under the prior AGM Reinsurance Agreement. The new agreement provides, however, that to the extent AGE UK issues a future qualifying policy without utilizing the co-guarantee structure described above, AGM will reinsure a fixed 85% share of AGE UK’s gross liabilities under such policy, rather than a percentage share based on AGE UK’s and AGM’s respective prior year-end capitalization. Similarly, the percentages of a future transaction’s obligations that AGE UK and AGM co-guarantee will be split 15% by AGE UK and 85% by AGM, so that AGM’s co-guaranteed portion continues to mirror the percentage of quota share reinsurance AGM otherwise would provide for the transaction under the new AGM Reinsurance Agreement.
The AGM Reinsurance Agreement - Excess of Loss Reinsurance: Under the excess of loss cover of the prior AGM Reinsurance Agreement, AGM payswas obligated to pay AGE UK quarterly the amount, if any, by which (i) the sum of (a) AGE’sAGE UK’s incurred losses calculated in accordance with U.K. GAAP as reported by AGE UK in its financial returns filed with the PRA and (b) AGE’sAGE UK’s paid losses and loss adjustment expenses (LAE),LAE, in both cases net of all other performing reinsurance, including the reinsurance provided by the Company under the quota share cover of the AGM Reinsurance Agreement, exceedsexceeded (ii) an amount equal to (a) AGE’sAGE UK’s capital resources under U.K. law minus (b) 110% of the greatest of the amounts as maymight be required by the PRA as a condition for AGE UK to maintain its authorization to carry on a financial guarantee business in the U.K. The new AGM Reinsurance Agreement permitsprovides this same form of excess of loss reinsurance; it simply clarifies that such reinsurance covers the legacy portfolios transferred to AGE UK by AGUK, AGLN and CIFGE in addition to the legacy AGE UK policies reinsured under the prior AGM Reinsurance Agreement.
Other Provisions of the AGM Reinsurance Agreement: Under the new AGM Reinsurance Agreement, AGM’s required collateral is 102% of the sum of AGM’s assumed share of the following for all AGE UK policies for which AGM provides proportionate reinsurance: (a) AGE UK’s unearned premium reserve (net of AGE UK’s reinsurance premium payable to AGM); (b) AGE UK’s provisions for unpaid losses and allocated loss adjustment expenses (net of any salvage recoverable), and (c) any unexpired risk provisions of AGE UK, in each case (a) - (c) as calculated by AGE UK in accordance with U.K. GAAP. This new, post-Combination collateral measure is in contrast to (i) AGM’s collateral measure prevailing from December 2014 through 2015, which was based, in part, upon the losses expected to be borne by AGM (and two other affiliated reinsurers of AGE UK, AG Re and AGRO) at the 99.5% confidence interval under the PRA’s FG Benchmark Model; and (ii) AGM’s collateral measure prevailing from 2016 up to the time of the Combination, which was based on the same losses calculated under AGE UK’s internal capital requirement model instead of the FG Benchmark Model. As a result of this new collateral measure, AGM’s total collateral required for AGE UK increased by approximately $52 million upon the Combination. AGM funded such increase promptly following the Combination.
The quota share and excess of loss covers under the prior AGM Reinsurance Agreement excluded transactions guaranteed by AGE UK on or after July 1, 2009 that were not municipal, utility, project finance or infrastructure risks or similar types of risks. The new AGM Reinsurance Agreement retains the same exclusion. The old AGM Reinsurance Agreement also permitted AGE UK to terminate the Reinsurance Agreementagreement upon the following events: a downgrade of AGM’s ratings by Moody’s below Aa3 or by S&P below AA- if AGM fails to restore its rating(s) to the required level within a prescribed period of time; AGM's insolvency; failure by AGM to maintain the minimum capital required by its domiciliary jurisdiction; or AGM filing a petition in bankruptcy, going into liquidation or rehabilitation or having a receiver appointed.
The quota share and excess loss covers each exclude transactions guaranteednew AGM Reinsurance Agreement preserves these same termination rights by AGE on or after July 1, 2009 that are not municipal, utility, project finance or infrastructure risks or similar types of risks.
The Reinsurance AgreementUK, and also contemplatesadds an additional termination right enabling AGE UK to terminate the establishment of collateral byagreement should AGM to support AGM’s reinsurance obligations to AGE. In December 2014, to satisfy the PRA’s collateral requirements, AGM and AGE entered into a trust agreement pursuant to which AGM established and deposited assets into a reinsurance trust account for the benefit of AGE. AGM’s collateral requirement was measured during 2015, as of the end of each calendar quarter, by (i) using the PRA’s FG Benchmark Model to calculate at the 99.5% confidence interval the losses expected to be borne collectively by AGE’s three affiliated reinsurers, AGM, AG Re and AGRO; (ii) deducting from such calculation AGE’s capital resources under such model; and (iii) requiring AGM, AG Re and AGRO collectivelyfail to maintain collateral equal to fifty percent (50%) of such difference, i.e., the excess of AGM’s, AG Re’s and AGRO’s assumed modeled losses over AGE’s capital resources. As of January 1, 2016, the PRA agreed to allow AGM’s collateral requirement to be determined using AGE’s internal capital requirement model instead of the FG Benchmark Model under the same formula described above. This change in the calculation of AGM'sits required collateral was reflected in an amendment to the Reinsurance Agreement approved by the NYDFS and made effective in April 2016.collateral.
The AGE UK Net Worth Agreement: Pursuant to the prior AGE UK Net Worth Agreement, AGM iswas obligated to cause AGE UK to maintain capital resources equal to 110% of the greatest of the amounts as may be required by the PRA as a condition for AGE UK to maintain its authorization to carry on a financial guarantee business in the U.K., provided that AGM's contributions (a) dodid not exceed 35% of AGM's policyholders' surplus on an accumulated basis as determined by the laws of the State of New York, and (b) arewere in compliance with Section 1505 of the New York Insurance Law. AGM’s obligation remains the same under the new AGE UK Net Worth Agreement, which simply clarifies that it applies to AGE UK’s expanded insurance and investment portfolios resulting from the Combination. AGM has never been required to make any contributionsa contribution to AGE'sAGE UK's capital under any version of the AGE UK Net Worth Agreement - either the current agreement or theany prior net worth maintenance agreement. With the approval of the NYDFS,agreements. The new AGE and AGM amended the AGEUK Net Worth Agreement effective in April 2016also permits AGE UK to provide for useterminate such agreement without also triggering an automatic termination of the internal capital requirement model.AGM Reinsurance Agreement (as would have occurred under the prior AGE UK Net Worth Agreement).
The NYDFS approved each of the changes described above to the AGM Reinsurance Agreement and AGE UK Net Worth Maintenance Agreement.
AGUK’s parent company,AGC’s Support Agreements in Respect of AGUK: Prior to the Combination, the Company's affiliate, AGC, currently providesprovided support to AGUK through a further amendedFurther Amended and restatedRestated quota share reinsurance agreement (the AGC Quota Share Agreement), a further amendedFurther Amended and restatedRestated excess of loss reinsurance agreement (the AGC XOL Agreement), and a further amendedFurther Amended and restatedRestated net worth maintenance agreement (the "AGUKAGUK Net Worth Agreement")Agreement). Pursuant toThe latter two agreements were terminated effective upon the Combination because AGUK’s legacy policies became part of AGE UK’s portfolio upon the Combination and, therefore, are now covered by the excess of loss portion of the new AGM Reinsurance Agreement and the new AGE UK Net Worth Maintenance Agreement, as described above. The AGC Quota Share Agreement, AGUK cedespursuant to which AGC provided 90% quota share reinsurance of its financial guaranty insurance and reinsurance exposure to AGC. Pursuant toAGUK’s legacy policies, was also terminated upon the XOL Agreement, AGC indemnifies AGUK for 100% of losses (net of theCombination, but it was replaced with a new quota share reinsurance agreement discussed above) incurred by AGUK in excess of an amount equal to (a) AGUK’s capital resources minus (b) 110%between AGE UK and AGC (the New AGC Reinsurance Agreement). This new agreement preserves AGC’s 90% quota share reinsurance of the greatestlegacy AGUK policies that are now part of AGE UK’s portfolio, but it has no application to new business written by AGE UK following the amountsCombination. The new AGC Reinsurance Agreement also imposes a new collateral requirement on AGC that is the same as may be required by the PRA as a condition for AGUK maintaining its authorization to carry on a financial guarantee business in the U.K. Pursuant to the AGUK Net Worth Agreement, if AGUK's net worth falls below 110% of the minimum level of capital required by the PRA, AGC must invest additional funds in order to bring the capital of AGUK back into compliance with the required amount.
In 2016, AGC and AGUK reached an agreement with the PRA that, in order for AGC to secure its outstanding reinsurance of AGUKAGM’s collateral requirement under the Quota Sharenew AGM Reinsurance Agreement, and XOL Agreement,as described above, except that AGC shallcontinues also to post as collateral its share of AGUK-guaranteedan AGE UK-guaranteed (formerly, pre-Combination, AGUK-guaranteed) triple-X insurance bondsbond that havehad been purchased by AGC for loss mitigation and an additional amount to be determined by (i) using AGUK’s internal capital requirement model to calculate at(as AGC had similarly done under the 99.5% confidence intervalprior AGC Quota Share Agreement).
The MIA approved the losses expected to be borne by AGC for the exposures it has assumed from AGUK that do not have loss reserves (non-reserve exposures); (ii) adding the amount of loss reserves ceded by AGUK to AGC under U.K. GAAP; (iii) subtracting from such sum AGUK’s capital resources under its internal capital requirement model (the result of clauses (i) through (iii) being referred to as the resulting amount); and then (iv) reducing the resulting amount by 50%termination of the portion ofprior AGC XOL Agreement, AGUK Net Worth Agreement and the resulting amount that was contributed by the non-reserve exposures. Accordingly, AGC and AGUK entered into a trust agreement pursuant to which AGC established a reinsurance trust account for the benefit of AGUK and deposits therein sufficient assets to satisfy the above-
described collateral requirement agreed with the PRA. This new collateral requirement is reflected in the Quota Share Agreement and XOL Agreement, which were approved by the MIA and made effective in July 2016.replacement of the latter with the New AGC Reinsurance Agreement.
U.K. referendum vote to leave the European Union
On June 23, 2016, the U.K. voted in a national referendum to withdraw from the EU. The result of the referendum doesdid not legally oblige the U.K. to exit the European UnionEU (a so-called Brexit). However, on March 29, 2017 the U.K. government has indicated that it intends to formally serveserved notice to the European Council of its desire to withdraw in accordance with Article 50 of the Treaty on European Union (Article 50) by the end of March 2017..
Article 50 envisages a negotiation period leading to an exit on a mutually agreed date. However,As part of the negotiations, the U.K. sought a transition period during which it would cease to be a member state of the EU, but would continue to have rights and obligations under EU law, other than the right to participate formally in the absenceEU decision making process, and EU legislation would remain in force. A withdrawal agreement was agreed by the U.K. Government and EU and the U.K. Parliament approved the withdrawal agreement so that the UK left the EU on January 31, 2020. Under the terms of such mutualthe withdrawal agreement the default datetransition period will end on December 31, 2020 and the U.K. Government is stating that this will not be extended, although the terms of the withdrawal agreement do allow for exit is two years after the member state serves the Article 50 notice. EU treaties will therefore cease to applyan extension to the U.K. ontransition period.
As a result of the earlierapproval of (i) the entry into force of any withdrawal agreement, or (ii) two years after the giving of notice (unlesscurrent law relating to the Company's operations in the EU remains the same during the transition period. Negotiations will be ongoing during the transition period between the U.K. and EU to determine the wider terms of the U.K.’s future relationship with the EU, including the terms of trade between the U.K. and the EU. Given the lack of clarity on the ultimate post-Brexit relationship between the U.K. and the EU, the Company cannot fully determine what, if any, impact Brexit may have on its operations, both inside and outside the U.K. If the U.K. and EU fail to agree the U.K.'s future relationship with the EU during the transition period then the U.K. will leave the EU on December 31, 2020 without a trade deal in place. This would create considerable uncertainty as to the ongoing relationship between the U.K. and the EU and a likely negative impact on all remaining Member States unanimously agreeparties.
A further question arising from Brexit is whether U.K. authorized financial services firms such as AGE UK will continue to extendenjoy passporting rights to the negotiation period), currently contemplatedother 27 EEA states after Brexit. As a consequence, Assured Guaranty has established a new subsidiary in Paris, France, in order to be March 2019.continue with the ability to write new business, and to service existing business, in those other EEA states.
Until the U.K. formally withdraws fromend of the EU,transition period under the withdrawal agreement, EU legislation will remain in force and the role of EU institutions will be unchanged. On withdrawalAt the end of the U.K. from the EU,transition period, in the absence of any agreement to the contrary, all treaty obligations would lapse, directives, directly effective decisions and regulations (as well as rulings of the Court of Justice of the EU) would cease to apply and the competencies of EU institutions would fall away.
The U.K. Government has announced its intentionpassed legislation under which most EU regulation, EU decision or EU tertiary legislation would, to bring all aspectsthe extent possible, form part of European law into U.K. law prior toon and after the date the U.K. exitingexits the EU. It seems most likely, given the relatively short timescales available, that initiallyUnder this legislation Solvency II will beis brought into U.K. law in its current form.substantially the same form as it has on the day the U.K. exits the EU. Retaining Solvency II in substantially its current form would alsoshould make it easier for the U.K. to obtain a ruling of “equivalence” from the European Commission under Solvency II, which would accord insurers certain advantages when it comes to the Solvency II rules on reinsurance, the calculation of group capital and group supervision.
The U.K. Government could take time to review whether there might be any changes which are desired on a national level. The Treasury Select Committee of the House of Commons is currently reviewinghas conducted a review of Solvency II and has indicated that it will do so against the backdrop of Brexit, taking into account certain features which are regarded as unsuitable by the U.K. industry. The results of the Treasury Select Committee’s work have been responded to by the PRA and may feed in to future discussions about potential changes to the Solvency II regime.U.K. insurance regulation.
Any changes to Solvency IIU.K. insurance regulation following Brexit could reduce the chances of the U.K. obtaining (or subsequently preserving) a ruling of equivalence.
A further question arisingSee the Risk Factor captioned “Changes in applicable laws and regulations resulting from Brexitthe withdrawal of the U.K. from the EU may adversely affect the Company” under Risks Related to GAAP, Applicable Law and Litigation, in Item 1A, Risk Factors.
France
As an insurance company licensed in France, AGE SA is whether U.K. authorised financial services firmsregulated by the Autorité de Contrôle Prudentiel et de Résolution (ACPR) and is subject to the provisions of Solvency II as well as related EU delegated regulations as implemented in France, and by the French Insurance Code and the Monetary and Financial Code, both of which set out the primary rules governing the insurance industry in France. Additional laws and regulations laid down in the Civil Code and other codes as well as the "soft law" issued by the ACPR (codes of conduct, guidelines, communications and binding recommendations) may apply to French insurance companies such as AGE SA.
Regulation of Asset Management Business
United States
AGL has three operating asset management subsidiaries: BlueMountain and AGUK will continue to enjoy passporting rightsBlueMountain CLO Management, LLC (BlueMountain CLO Management), each of which is domiciled in the United States and is registered as an investment adviser with the SEC, and Blue Mountain Capital Partners (London) LLP (BlueMountain London), a U.K. domiciled “relying adviser” which is not independently registered with the SEC. Registered investment advisers are subject to the requirements and regulations of the U.S. Investment Advisers Act of 1940, as amended (the Advisers Act). As registered investment advisers, BlueMountain and BlueMountain CLO Management require periodic reports on Forms ADV, which are publicly available. The Advisers Act imposes requirements on registered advisers, including the maintenance of a Code of Ethics addressing potential conflicts of interest, an effective compliance program, recordkeeping and reporting, disclosure, limitations on agency cross and principal transactions between an adviser and its advisory clients and general anti-fraud prohibitions. BlueMountain is also registered with the CFTC as a commodity pool operator and is a member of the National Futures Association (NFA). BlueMountain London is registered as a commodity trading advisor with the CFTC and is a member of the NFA. Registered commodity pool operators and commodity trading advisers are each subject to the requirements and regulations of the U.S. Commodity Exchange Act, as amended (the Commodity Exchange Act). The requirements of the Commodity Exchange Act relate to, among other 27 EEA states after Brexit. things, maintaining an effective compliance program, recordkeeping and reporting, disclosure, business conduct and general anti-fraud prohibitions.
In addition, private funds advised by BlueMountain, BlueMountain CLO Management and BlueMountain London rely on exemptions from various requirements of the event that passporting rightsSecurities Act, the Exchange Act, the U.S. Investment Company Act of 1940, as amended, the Commodity Exchange Act and the U.S. Employee Retirement Income Security Act of 1974, as amended. These exemptions are highly complex and may in certain circumstances depend on compliance by third parties which are not retained, Assured Guarantycontrolled by the Company.
United Kingdom
BlueMountain London is assessing a numberauthorized by the FCA as an investment manager in the United Kingdom. The FSMA and rules promulgated thereunder, together with certain additional legislation (derived from both EU and U.K. sources), govern all aspects of options in order to continue with the ability to write newU.K. investment business, including sales, research and to run off existing business, in those EEA states.trading practices, the provision of investment advice, and discretionary management services, the use and safekeeping of client funds and securities, regulatory capital, organizational arrangements, recordkeeping, margin practices and procedures, the approval standards for individuals, anti-money laundering, periodic reporting, and settlement procedures.
France
In connection with the CIFG Acquisition in July 2016, the Company acquired a French insurer called CIFG Europe S.A. which is now in run off. CIFGNA had reinsured all of CIFGE’s outstanding financial guaranty business and also had issued a “second-to-pay policy” pursuant to which CIFGNA guaranteed the full and complete payment of any shortfall in amounts due from CIFGE on its insured portfolio. AGC assumed these obligations as part of the CIFGNA merger with and into AGC. CIFGE remains a separate subsidiary in run off, now owned by AGC. Prior to the CIFG Acquisition, CIFGE had prepared a run off plan which was approved by its French regulator, theAutorité de contrôle prudentiel et de résolution (ACPR). CIFGE has been in run off for more than two years, and therefore has surrendered its licence under French law to write new insurance business. The withdrawal of the licence has no practical impact on the level of supervision exercised by the ACPR over CIFGE as an insurer.
Tax Matters
United States Tax Reform
Tax reform commonly referred to as the 2017 Tax Cuts and Jobs Act (Tax Act) was passed by the U.S. Congress and was signed into law on December 22, 2017. The Tax Act lowered the corporate U.S. tax rate to 21%, eliminated the alternative minimum tax, limited the deductibility of interest expense and required a one-time tax on a deemed repatriation of untaxed earnings of non-U.S. subsidiaries. In the context of the taxation of U.S. property/casualty insurance companies such as the Company, the Tax Act also modifies the loss reserve discounting rules and the proration rules that apply to reduce reserve deductions to reflect the lower corporate income tax rate. In addition, the Tax Act included certain provisions intended to eliminate certain perceived tax advantages of companies (including insurance companies) that have legal domiciles outside the United States but have certain U.S. connections and United States persons investing in such companies. For example, the Tax Act includes a base erosion and anti-abuse tax (BEAT) that could make affiliate reinsurance between United States and non-U.S. members of the Company's group economically unfeasible. In addition, the Tax Act introduced a current tax on global intangible low taxed income that may result in an increase in U.S. corporate income tax imposed on the Company's U.S. group members with respect to earnings of their non-U.S. subsidiaries. As discussed in more detail below, the Tax Act also revised the rules applicable to passive foreign investment companies (PFICs) and controlled foreign corporations (CFCs). Although the Company is currently unable to predict the ultimate impact of the Tax Act on its business, shareholders and results of operations, it is possible that the Tax Act may increase the U.S. federal income tax liability of U.S. members of the group that cede risk to non-U.S. group members and may affect the timing and amount of U.S. federal income taxes imposed on certain U.S. shareholders. Further, it is possible that other legislation could be introduced and enacted by the current Congress or future Congresses that could have an adverse impact on the Company. Additionally, tax laws and interpretations regarding whether a company is engaged in a U.S. trade or business or whether a company is a CFC or a PFIC or has related person insurance income (RPII) are subject to change, possibly on a retroactive basis. Currently there are only proposed regulations regarding the application of the PFIC rules to an insurance company. Additionally, the regulations regarding RPII have been in proposed form since 1991. New regulations or pronouncements interpreting or clarifying such rules may be forthcoming. The Company cannot be certain if, when or in what form such regulations or pronouncements may be provided and whether such guidance will have a retroactive effect. See Part II, Item 8, Financial Statements and Supplementary Data, Note 1, Business and Basis of Presentation and Note 17, Income Taxes.
Taxation of AGL and Subsidiaries
Bermuda
Under current Bermuda law, there is no Bermuda income, corporate or profits tax or withholding tax, capital gains tax or capital transfer tax payable by AGL or its Bermuda subsidiaries.Subsidiaries. AGL, AG Re and AGRO have each obtained from the Minister of Finance under the Exempted Undertakings Tax Protection Act 1966, as amended, an assurance that, in the event that Bermuda enacts legislation imposing tax computed on profits, income, any capital asset, gain or appreciation, or any tax in the nature of estate duty or inheritance, then the imposition of any such tax shall not be applicable to AGL, AG Re or AGRO or to any of their operations or their shares, debentures or other obligations, until March 31, 2035. This assurance is subject to the provisoprovision that it is not to be construed so as to prevent the application of any tax or duty to such persons as are ordinarily resident in Bermuda, or to prevent the application of any tax payable in accordance with the provisions of the Land Tax Act 1967 or otherwise payable in relation to any land leased to AGL, AG Re or AGRO. AGL, AG Re and AGRO each pays annual Bermuda government fees, and AG Re and AGRO pay annual insurance license fees. In addition, all entities employing individuals in Bermuda are required to pay a payroll tax and there are other sundry taxes payable, directly or indirectly, to the Bermuda government.
United States
AGL has conducted and intends to continue to conduct substantially all of its operations outside the U.S. and to limit the U.S. contacts of AGL and its foreignnon-U.S. subsidiaries (except AGRO, and AGE, which have elected to be taxed as a U.S. corporations)corporation) so that they should not be engaged in a trade or business in the U.S. A foreignnon-U.S. corporation, such as AG Re, that is deemed to be engaged in a trade or business in the United States would be subject to U.S. income tax at regular corporate rates, as well as the branch profits tax, on its income which is treated as effectively connected with the conduct of that trade or business, unless the corporation is entitled to relief under the permanent establishment provision of an applicable tax treaty, as discussed below. Such income tax, if imposed, would be based on effectively connected income computed in a manner generally analogous to that applied to the income of a U.S. corporation, except that a foreignnon-U.S. corporation would generally be entitled to deductions and credits only if it timely files a U.S. federal income tax return. AGL, AG Re and certain of the other foreignnon-U.S. subsidiaries have and will continue to file protective U.S. federal income tax returns on a timely basis in order to preserve the right to claim
income tax deductions and credits if it is ever determined that they are subject to U.S. federal income tax. The highest marginal federal income tax rates currently are 35%21% for a corporation's effectively connected income and 30% for the "branch profits" tax.
Under the income tax treaty between Bermuda and the U.S. (the Bermuda Treaty), a Bermuda insurance company would not be subject to U.S. income tax on income found to be effectively connected with a U.S. trade or business unless that trade or business is conducted through a permanent establishment in the U.S. AG Re currently intends to conduct its activities so that it does not have a permanent establishment in the U.S.
An insurance enterprise resident in Bermuda generally will be entitled to the benefits of the Bermuda Treaty if (i) more than 50% of its shares are owned beneficially, directly or indirectly, by individual residents of the U.S. or Bermuda or U.S. citizens and (ii) its income is not used in substantial part, directly or indirectly, to make disproportionate distributions to, or to meet certain liabilities of, persons who are neither residents of either the U.S. or Bermuda nor U.S. citizens.
ForeignNon-U.S. insurance companies carrying on an insurance business within the U.S. have a certain minimum amount of effectively connected net investment income determined in accordance with a formula that depends, in part, on the amount of U.S. risk insured or reinsured by such companies. If AG Re or another of the Company's Bermuda subsidiaries is considered to be engaged in the conduct of an insurance business in the U.S. and is not entitled to the benefits of the Bermuda Treaty in general (because it fails to satisfy one of the limitations on treaty benefits discussed above), the Internal Revenue Code of 1986, as amended (the Code), could subject a significant portion of AG Re's or another of the Company's Bermuda subsidiary's investment income to U.S. income tax.
AGL, as a U.K. tax resident, would not be subject to U.S. income tax on any income found to be effectively connected with a U.S. trade or business under the income tax treaty between the U.S. and the U.K. (the U.K. Treaty), unless that trade or business is conducted through a permanent establishment in the United States. AGL intends to conduct its activities so that it does not have a permanent establishment in the United States.
ForeignNon-U.S. corporations not engaged in a trade or business in the U.S., and those that are engaged in a U.S. trade or business with respect to their non-effectively connected income are nonetheless subject to U.S. withholding tax on certain "fixed or determinable annual or periodic gains, profits and income" derived from sources within the U.S. (such as dividends and certain interest on investments), subject to exemption under the Code or reduction by applicable treaties. The standard non-treaty rate of U.S. withholding tax is currently 30%. The Bermuda Treaty does not reduce the U.S. withholding rate on U.S.-sourced investment income. The U.K. Treaty reduces or eliminates U.S. withholding tax on certain U.S. sourced investment income, including dividends from U.S. companies to U.K. resident persons entitled to the benefit of the U.K. Treaty.
The U.S. also imposes an excise tax on insurance and reinsurance premiums paid to foreignnon-U.S. insurers with respect to risk of a U.S. person located wholly or partly within the U.S. or risks of a foreign person engaged in a trade or business in the U.S. which are located within the U.S. The rates of tax applicable to premiums paid are 4% for direct casualty insurance premiums and 1% for reinsurance premiums.
AGRO and AGE havehas elected to be treated as a U.S. corporationscorporation for all U.S. federal tax purposes and, as such, each of AGRO, and AGE, together with AGL's U.S. subsidiaries, is subject to taxation in the U.S. at regular corporate rates.
If AGRO were to pay dividends to its U.S. holding company parent and that U.S. holding company were to pay dividends to its Bermudian parent AG Re, such dividends would be subject to U.S. withholding tax at a rate of 30%.
United Kingdom
In November 2013, AGL became tax resident in the U.K. AGL remains a Bermuda-based company and its administrative and head office functions continue to be carried on in Bermuda. The AGL common shares have not changed and continue to be listed on the New York Stock Exchange (NYSE).
As a company that is not incorporated in the U.K., AGL will be considered tax resident in the U.K. only if it is “centrally managed and controlled” in the U.K. Central management and control constitutes the highest level of control of a company’s affairs. Effective November 6, 2013, the AGL Board intends to manage the affairs of AGL in such a way as to maintain its status as a company that is tax resident in the U.K.
As a U.K. tax resident company, AGL is subject to the tax rules applicable to companies resident in the U.K., including the benefits afforded by the U.K.’s tax treaties.
As a U.K. tax resident, AGL is required to file a corporation tax return with Her Majesty’s Revenue & Customs (HMRC). AGL will be subject to U.K. corporation tax in respect of its worldwide profits (both income and capital gains), subject to any applicable exemptions. The main rate of corporation tax is currently 20%19%. It will be further reduced to 19% with effect from April 1, 2017 and 17% with effect from April 1, 2020. AGL has also registered in the U.K. to report its value added tax (VAT) liability. The current rate of VAT is 20%.
The dividends AGL receives from its direct subsidiaries should be exempt from U.K. corporation tax due to the exemption in section 931D of the U.K. Corporation Tax Act 2009. In addition, any dividends paid by AGL to its shareholders should not be subject to any withholding tax in the U.K. The non-U.K. resident subsidiaries intend to operate in such a manner that their profits are outside the scope of the charge under the "controlled foreign companies" (CFC) regime. Accordingly, Assured Guaranty does not expect any profits of non-U.K. resident members of the group to be attributed to AGL and taxed in the U.K. under the CFC regime and has obtained clearance from HMRC confirming this on the basis of current facts and intentions.
Taxation of Shareholders
Bermuda Taxation
Currently, there is no Bermuda capital gains tax, or withholding or other tax payable on principal, interest or dividends paid to the holders of the AGL common shares.
United States Taxation
This discussion is based upon the Code, the regulations promulgated thereunder and any relevant administrative rulings or pronouncements or judicial decisions, all as in effect on the date hereofof filing and as currently interpreted, and does not
take into account possible changes in such tax laws or interpretations thereof, which may apply retroactively. This discussion does not include any description of the tax laws of any state or local governments within the U.S. or any foreign government.
The following summary sets forth the material U.S. federal income tax considerations related to the purchase, ownership and disposition of AGL's shares. Unless otherwise stated, this summary deals only with holders that are U.S. Persons (as defined below) who purchase and hold their shares and who hold their shares as capital assets within the meaning of section 1221 of the Code. The following discussion is only a discussion of the material U.S. federal income tax matters as described herein and does not purport to address all of the U.S. federal income tax consequences that may be relevant to a particular shareholder in light of such shareholder's specific circumstances. For example, special rules apply to certain shareholders, such as partnerships, insurance companies, regulated investment companies, real estate investment trusts, dealers or traders in securities, tax exempt organizations, expatriates, persons that do not hold their securities in the U.S. dollar, persons who are considered with respect to AGL or any of its foreignnon-U.S. subsidiaries as "United States shareholders" for purposes of the controlled foreign corporation (CFC)CFC rules of the Code (generally, a U.S. Person, as defined below, who owns or is deemed to own 10% or more of the total combined voting power or value of all classes of AGL or the stock of any of AGL's foreignnon-U.S. subsidiaries entitled to vote (i.e., 10% U.S. Shareholders)), or persons who hold the common shares as part of a hedging or conversion transaction or as part of a short-sale or straddle. Any such shareholder should consult their tax advisor.
If a partnership holds AGL's shares, the tax treatment of the partners will generally depend on the status of the partner and the activities of the partnership. Partners of a partnership owning AGL's shares should consult their tax advisers.
For purposes of this discussion, the term "U.S. Person" means: (i) a citizen or resident of the U.S., (ii) a partnership or corporation, created or organized in or under the laws of the U.S., or organized under any political subdivision thereof, (iii) an estate the income of which is subject to U.S. federal income taxation regardless of its source, (iv) a trust if either (x) a court within the U.S. is able to exercise primary supervision over the administration of such trust and one or more U.S. Persons have the authority to control all substantial decisions of such trust or (y) the trust has a valid election in effect to be treated as a U.S. Person for U.S. federal income tax purposes or (v) any other person or entity that is treated for U.S. federal income tax purposes as if it were one of the foregoing.
Taxation of Distributions. Subject to the discussions below relating to the potential application of the CFC, related person insurance income (RPII)RPII and passive foreign investment company (PFIC)PFIC rules, cash distributions, if any, made with respect to AGL's shares will constitute dividends for U.S. federal income tax purposes to the extent paid out of current or accumulated earnings and profits of AGL (as computed using U.S. tax principles). Dividends paid by AGL to corporate shareholders will not be eligible for the dividends received deduction. To the extent such distributions exceed AGL's earnings and profits, they will be treated first as a return of the shareholder's basis in the common shares to the extent thereof, and then as gain from the sale of a capital asset.
AGL believes dividends paid by AGL on its common shares to non-corporate holders will be eligible for reduced rates of tax at the rates applicable to long-term capital gains as "qualified dividend income," provided that AGL is not a PFIC and certain other requirements, including stock holding period requirements, are satisfied.
Classification of AGL or its ForeignNon-U.S. Subsidiaries as a Controlled Foreign Corporation.CFC. Each 10% U.S. Shareholder (as defined below) of a foreignnon-U.S. corporation that is a CFC for an uninterrupted period of 30 days or moreat any time during a taxable year and whothat owns, shares in the foreign corporation, directly or indirectly through foreignnon-U.S. entities, shares in the non-U.S. corporation on the last day of the foreignnon-U.S. corporation's taxable year inon which it is a CFC, must include in its gross income, for U.S. federal income tax purposes, its pro rata share of the CFC's "subpart F income," even if the subpart F income is not distributed. "Subpart F income" of a foreignnon-U.S. insurance corporation typically includes foreignnon-U.S. personal holding company income (such as interest, dividends and other types of passive income), as well as insurance and reinsurance income (including underwriting and investment income). A foreignnon-U.S. corporation is considered a CFC if 10% U.S. Shareholders own (directly, indirectly through foreignnon-U.S. entities or by attribution by application of the constructive ownership rules of section 958(b) of the Code (i.e., constructively)) more than 50% of the total combined voting power of all classes of voting stock of such foreignnon-U.S. corporation, or more than 50% of the total value of all stock of such corporation on any day during the taxable year of such corporation. For purposes of taking into account insurance income, a CFC also includes a foreignnon-U.S. insurance company in which more than 25% of the total combined voting power of all classes of stock (oror more than 25% of the total value of the stock)stock is owned by 10% U.S. Shareholders, on any day during the taxable year of such corporation. A "10% U.S. Shareholder" is a U.S. Person who owns (directly, indirectly through foreignnon-U.S. entities or constructively) at least 10% of the total combined voting power or value of all classes of stock entitled to vote of the foreignnon-U.S. corporation. The Tax Act expanded the definition of 10% U.S. Shareholder to include ownership by value (rather than just vote), so provisions in the Company's organizational documents that cut back voting power to potentially avoid 10% U.S. Shareholder status will no longer mitigate the risk of 10% U.S. Shareholder status. AGL believes that because of the dispersion of AGL's share ownership, provisions in AGL's organizational documents that limit voting power (these provisions are described in "Description of Share Capital") and other factors, no U.S. Person who owns shares of AGL directly or indirectly through one or more foreignnon-U.S. entities should be treated as owning (directly, indirectly through foreignnon-U.S. entities, or constructively), 10% or more of the total voting power or value of all classes of shares of
AGL or any of its foreignnon-U.S. subsidiaries. It is possible, however, thatHowever, AGL’s shares may not be as widely dispersed as the Internal Revenue Service (IRS) could challengeCompany believes due to, for example, the effectivenessapplication of these provisionscertain ownership attribution rules, and no assurance may be given that a court could sustain suchU.S. Person who owns the Company's shares will not be characterized as a challenge.10% U.S. Shareholder. In addition, the direct and indirect subsidiaries of AGUSAssured Guaranty US Holdings Inc. (AGUS) are characterized as CFCs and any subpart F income generated will be included in the gross income of the applicable domestic subsidiaries in the AGL group.
The RPII CFC Provisions. The following discussion generally is applicable only if the gross RPII of AG Re or any other foreignnon-U.S. insurance subsidiary that either (i) has not made an election under section 953(d) of the Code to be treated as a U.S. corporation for all U.S. federal tax purposes or are CFCs(ii) is not a CFC owned directly or indirectly by AGUS (each a "Foreign Insurance Subsidiary" or collectively, with AG Re, the "Foreign Insurance Subsidiaries") determined on a gross basis, is 20% or more of the Foreign Insurance Subsidiary's gross insurance income for the taxable year and the 20% Ownership Exception (as defined below) is not met. The following discussion generally would not apply for any taxable year in which the Foreign Insurance Subsidiary's gross RPII falls below the 20% threshold or the 20% Ownership Exception is met. Although the Company cannot be certain, it believes that each Foreign Insurance Subsidiary has been, in prior years of operations, and will be, for the foreseeable future, either below the 20% threshold or in compliance with the requirements of 20% Ownership Exception for each tax year.
RPII is any "insurance income" (as defined below) attributable to policies of insurance or reinsurance with respect to which the person (directly or indirectly) insured is a "RPII shareholder" (as defined below) or a "related person" (as defined below) to such RPII shareholder. In general, and subject to certain limitations, "insurance income" is income (including premium and investment income) attributable to the issuing of any insurance or reinsurance contract which would be taxed under the portions of the Code relating to insurance companies if the income were the income of a domestic insurance company. For purposes of inclusion of the RPII of a Foreign Insurance Subsidiary in the income of RPII shareholders, unless an exception applies, the term "RPII shareholder" means any U.S. Person who owns (directly or indirectly through foreignnon-U.S. entities) any amount of AGL's common shares. Generally, the term "related person" for this purpose means someone who controls or is controlled by the RPII shareholder or someone who is controlled by the same person or persons which control the RPII shareholder. Control is measured by either more than 50% in value or more than 50% in voting power of stock applying certain constructive ownership principles. A Foreign Insurance Subsidiary will be treated as a CFC under the RPII provisions if RPII shareholders are treated as owning (directly, indirectly through foreignnon-U.S. entities or constructively) 25% or more of the shares of AGL by vote or value.
RPII Exceptions. The special RPII rules do not apply if (i) at all times during the taxable year less than 20% of the voting power and less than 20% of the value of the stock of AGL (the 20% Ownership Exception) is owned (directly or indirectly through entities) by persons who are (directly or indirectly) insured under any policy of insurance or reinsurance issued by a Foreign Insurance Subsidiary or related persons to any such person, (ii) RPII, determined on a gross basis, is less than 20% of a Foreign Insurance Subsidiary's gross insurance income for the taxable year (the 20% Gross Income Exception),
(iii) a Foreign Insurance Subsidiary elects to be taxed on its RPII as if the RPII were effectively connected with the conduct of a U.S. trade or business, and to waive all treaty benefits with respect to RPII and meet certain other requirements or (iv) a Foreign Insurance Subsidiary elects to be treated as a U.S. corporation and waive all treaty benefits and meet certain other requirements. The Foreign Insurance Subsidiaries do not intend to make either of these elections. Where none of these exceptions applies, each U.S. Person owning or treated as owning any shares in AGL (and therefore, indirectly, in a Foreign Insurance Subsidiary) on the last day of AGL's taxable year will be required to include in its gross income for U.S. federal income tax purposes its share of the RPII for the portion of the taxable year during which a Foreign Insurance Subsidiary was a CFC under the RPII provisions, determined as if all such RPII were distributed proportionately only to such U.S. Persons at that date, but limited by each such U.S. Person's share of a Foreign Insurance Subsidiary's current-year earnings and profits as reduced by the U.S. Person's share, if any, of certain prior-year deficits in earnings and profits. The Foreign Insurance Subsidiaries intend to operate in a manner that is intended to ensure that each qualifies for either the 20% Gross Income Exception or 20% Ownership Exception.
Computation of RPII. For any year in which a Foreign Insurance Subsidiary does not meet the 20% Ownership Exception or the 20% Gross Income Exception, AGL may also seek information from its shareholders as to whether beneficial owners of shares at the end of the year are U.S. Persons so that the RPII may be determined and apportioned among such persons; to the extent AGL is unable to determine whether a beneficial owner of shares is a U.S. Person, AGL may assume that such owner is not a U.S. Person, thereby increasing the per share RPII amount for all known RPII shareholders. The amount of RPII includable in the income of a RPII shareholder is based upon the net RPII income for the year after deducting related expenses such as losses, loss reserves and operating expenses. If a Foreign Insurance Subsidiary meets the 20% Ownership Exception or the 20% Gross Income Exception, RPII shareholders will not be required to include RPII in their taxable income.
Apportionment of RPII to U.S. Holders. Every RPII shareholder who owns shares on the last day of any taxable year of AGL in which a Foreign Insurance Subsidiary does not meet the 20% Ownership Exception or the 20% Gross Income Exception should expect that for such year it will be required to include in gross income its share of a Foreign Insurance
Subsidiary's RPII for the portion of the taxable year during which the Foreign Insurance Subsidiary was a CFC under the RPII provisions, whether or not distributed, even though it may not have owned the shares throughout such period. A RPII shareholder who owns shares during such taxable year but not on the last day of the taxable year is not required to include in gross income any part of the Foreign Insurance Subsidiary's RPII.
Basis Adjustments. An A RPII shareholder's tax basis in its common shares will be increased by the amount of any RPII the shareholder includes in income. The RPII shareholder may exclude from income the amount of any distributions by AGL out of previously taxed RPII income. The RPII shareholder's tax basis in its common shares will be reduced by the amount of such distributions that are excluded from income.
Uncertainty as to Application of RPII. The RPII provisions are complex and have never been interpreted by the courts or the Treasury Department in final regulations; regulations interpreting the RPII provisions of the Code exist only in proposed form. It is not certain whether these regulations will be adopted in their proposed form or what changes or clarifications might ultimately be made thereto or whether any such changes, as well as any interpretation or application of RPII by the IRS,Internal Revenue Service (IRS), the courts or otherwise, might have retroactive effect. These provisions include the grant of authority to the Treasury Department to prescribe "such regulations as may be necessary to carry out the purpose of this subsection including regulations preventing the avoidance of this subsection through cross insurance arrangements or otherwise." Accordingly, the meaning of the RPII provisions and the application thereof to the Foreign Insurance Subsidiaries is uncertain. In addition, the Company cannot be certain that the amount of RPII or the amounts of the RPII inclusions for any particular RPII shareholder, if any, will not be subject to adjustment based upon subsequent IRS examination. Any prospective investor which does business with a Foreign Insurance Subsidiary and is considering an investment in common shares should consult his tax advisor as to the effects of these uncertainties.
Information Reporting. Under certain circumstances, U.S. Persons owning shares (directly, indirectly or constructively) in a foreignnon-U.S. corporation are required to file IRS Form 5471 with their U.S. federal income tax returns. Generally, information reporting on IRS Form 5471 is required by (i) a person who is treated as a RPII shareholder, (ii) a 10% U.S. Shareholder of a foreignnon-U.S. corporation that is a CFC for an uninterrupted period of 30 days or moreat any time during any tax year of the foreignnon-U.S. corporation and who owned the stock on the last day of that year; and (iii) under certain circumstances, a U.S. Person who acquires stock in a foreignnon-U.S. corporation and as a result thereof owns 10% or more of the voting power or value of such foreignnon-U.S. corporation, whether or not such foreignnon-U.S. corporation is a CFC. For any taxable year in which AGL determines that the 20% Gross Income Exception and the 20% Ownership Exception does not apply, AGL will provide to all U.S. Persons registered as shareholders of its shares a completed IRS Form 5471 or the relevant information necessary to complete the form. Failure to file IRS Form 5471 may result in penalties. In addition, U.S. shareholders should consult their tax advisors with respect to other information reporting requirements that may be applicable to them.
U.S. Persons holding ourthe Company's shares should consider their possible obligation to file FINCENFinCEN Form 114, Foreign Bank and Financial Accounts Report, with respect to their shares. Additionally, such U.S. and non-U.S. persons should consider their possible obligations to annually report certain information with respect to usthe non-U.S. accounts with their U.S. federal income tax returns. Shareholders should consult their tax advisors with respect to these or any other reporting requirement which may apply with respect to their ownership of ourthe Company's shares.
Tax-Exempt Shareholders. Tax-exempt entities will be required to treat certain subpart F insurance income, including RPII, that is includable in income by the tax-exempt entity as unrelated business taxable income. Prospective investors that are tax exempt entities are urged to consult their tax advisors as to the potential impact of the unrelated business taxable income provisions of the Code. A tax-exempt organization that is treated as a 10% U.S. Shareholder or a RPII Shareholder also must file IRS Form 5471 in certain circumstances.
Dispositions of AGL's Shares. Subject to the discussions below relating to the potential application of the Code section 1248 and PFIC rules, holders of shares generally should recognize capital gain or loss for U.S. federal income tax purposes on the sale, exchange or other disposition of shares in the same manner as on the sale, exchange or other disposition of any other shares held as capital assets. If the holding period for these shares exceeds one year, any gain will be subject to tax at a current maximumthe marginal tax rate of 20% for individuals and 35% for corporations. Moreover, gain, if any, generally will be a U.S. source gain and generally will constitute "passive income" for foreign tax credit limitation purposes.applicable to long term capital gains.
Code section 1248 provides that if a U.S. Person sells or exchanges stock in a foreignnon-U.S. corporation and such person owned, directly, indirectly through foreignnon-U.S. entities or constructively, 10% or more of the voting power of the corporation at any time during the five-year period ending on the date of disposition when the corporation was a CFC, any gain from the sale or exchange of the shares will be treated as a dividend to the extent of the CFC's earnings and profits (determined under U.S. federal income tax principles) during the period that the shareholder held the shares and while the corporation was a CFC (with
certain adjustments). The Company believes that because of the dispersion of AGL's share ownership, provisions in AGL's organizational documents that limit voting power and other factors that no U.S. shareholder of AGL should be treated as owning (directly, indirectly through foreignnon-U.S. entities or constructively) 10% ofor more of the total voting power or value of AGL; to the extent this is the case this application of Code Section 1248 under the regular CFC rules should not apply to dispositions of AGL's shares. It is possible, however, that the IRS could challenge the effectiveness of these provisions and that a court could sustain such a challenge. A 10% U.S. Shareholder may in certain circumstances be required to report a disposition of shares of a CFC by attaching IRS Form 5471 to the U.S. federal income tax or information return that it would normally file for the taxable year in which the disposition occurs. In the event this is determined necessary, AGL will provide a completed IRS Form 5471 or the relevant information necessary to complete the Form. Code section 1248 in conjunction with the RPII rules also applies to the sale or exchange of shares in a foreignnon-U.S. corporation if the foreignnon-U.S. corporation would be treated as a CFC for RPII purposes regardless of whether the shareholder is a 10% U.S. Shareholder or whether the 20% Ownership Exception or 20% Gross Income Exception applies. Existing proposed regulations do not address whether Code section 1248 would apply if a foreignnon-U.S. corporation is not a CFC but the foreignnon-U.S. corporation has a subsidiary that is a CFC and that would be taxed as an insurance company if it were a domestic corporation. The Company believes, however, that this application of Code section 1248 under the RPII rules should not apply to dispositions of AGL's shares because AGL will not be directly engaged in the insurance business. The Company cannot be certain, however, that the IRS will not interpret the proposed regulations in a contrary manner or that the Treasury Department will not amend the proposed regulations to provide that these rules will apply to dispositions of common shares. Prospective investors should consult their tax advisors regarding the effects of these rules on a disposition of common shares.
Passive Foreign Investment Companies. In general, a foreignnon-U.S. corporation will be a PFIC during a given year if (i) 75% or more of its gross income constitutes "passive income" (the 75% test) or (ii) 50% or more of its assets produce passive income (the 50% test). and once characterized as a PFIC will generally retain PFIC status for future taxable years with respect to its U.S. shareholders in the taxable year of the initial PFIC characterization.
If AGL were characterized as a PFIC during a given year, each U.S. Person holding AGL's shares would be subject to a penalty tax at the time of the sale at a gain of, or receipt of an "excess distribution" with respect to, their shares, unless such person (i) is a 10% U.S. Shareholder and AGL is a CFC or (ii) made a "qualified electing fund election" or "mark-to-market" election. It is uncertain that AGL would be able to provide its shareholders with the information necessary for a U.S. Person to make a qualified electing fund election. In addition, if AGL were considered a PFIC, upon the death of any U.S. individual owning common shares, such individual's heirs or estate would not be entitled to a "step-up" in the basis of the common shares that might otherwise be available under U.S. federal income tax laws. In general, a shareholder receives an "excess distribution" if the amount of the distribution is more than 125% of the average distribution with respect to the common shares during the three preceding taxable years (or shorter period during which the taxpayer held common shares). In general, the penalty tax is equivalent to an interest charge on taxes that are deemed due during the period the shareholder owned the common shares, computed by assuming that the excess distribution or gain (in the case of a sale) with respect to the common shares was taken in equal portion at the highest applicable tax rate on ordinary income throughout the shareholder's period of ownership. The interest charge is equal to the applicable rate imposed on underpayments of U.S. federal income tax for such
period. In addition, a distribution paid by AGL to U.S. shareholders that is characterized as a dividend and is not characterized as an excess distribution would not be eligible for reduced rates of tax as qualified dividend income. A U.S. Person that is a shareholder in a PFIC may also be subject to additional information reporting requirements, including the annual filing of IRS Form 8621.
For the above purposes, passive income generally includes interest, dividends, annuities and other investment income. The PFIC rules, as amended by the Tax Act, provide that income "derivedderived in the active conduct of an insurance business by a corporation which is predominantly engaged in anqualifying insurance business...corporation is not treated as passive income." The PFIC provisions also contain a look-through rule under which a foreignnon-U.S. corporation shall be treated as if it "received directly its proportionate share of the income..." and as if it "held its proportionate share of the assets..." of any other corporation in which it owns at least 25% of the value of the stock. A second PFIC look-through rule would treat stock of a U.S. corporation owned by another U.S. corporation which is at least 25% owned (by value) by a non-U.S. corporation as a non-passive asset that generates non-passive income for purposes of determining whether the non-U.S. corporation is a PFIC.
The insurance income exception isoriginally was intended to ensure that income derived by a bona fide insurance company is not treated as passive income, except to the extent such income is attributable to financial reserves in excess of the reasonable needs of the insurance business. The Company expects, for purposes of the PFIC rules, that each of AGL's insurance subsidiaries will be predominantly engaged in an insurance business and is unlikely to have financial reserves in excess of the reasonable needs of its insurance business in each year of operations. Accordingly, noneHowever, the Tax Act limits the insurance income exception to a non-U.S. insurance company that is a qualifying insurance corporation that would be taxable as an insurance company if it were a U.S. corporation and maintains insurance liabilities of more than 25% of such company’s assets for a taxable year (or maintains insurance liabilities that at least equal or exceed 10% of its assets and it satisfies a facts and circumstances test that requires a showing that the income or assets of AGL's insurance subsidiaries should be treated as passive. Additionally, the Company expects that in each year of operations the passive income and assets of AGL's non-insurance subsidiaries will notfailure to exceed the 75% test25% threshold is due to runoff-related or 50% test amounts in each year of operations with respect torating-related circumstances) (the Reserve Test). Further, the overall incomeU.S. Treasury Department and assets of AGL and its subsidiaries. Under the look-through rule AGL should be deemed to own its proportionate share of the assets and to have received its proportionate share of the income of its direct and indirect subsidiaries for purposes of the 75% test and the 50% test. As a result, the Company believes that AGL was
not and should not be treated as a PFIC. The Company cannot be certain that the IRS will not successfully challenge this position, however, as there are currently no final or temporary regulations regarding the application of the PFIC provisions to an insurance company. The IRS recently issued proposed regulations (the 2019 Proposed Regulations) intended to clarify the application of the PFIC provisions to ana non-U.S. insurance company.company and provide guidance on a range of issues relating to PFICs including the application of the look-through rule, the treatment of income and assets of certain U.S. insurance subsidiaries for purposes of the look-through rule and the extension of the look-through rule to 25% or more owned partnerships. The 2019 Proposed Regulations define insurance liabilities for purposes of the Reserve Test, tighten the Reserve Test and the statutory cap on insurance liabilities, and provide guidance on the runoff-related and rating-related circumstances for purposes of the 10% test. These proposed regulations2019 Proposed Regulations also provide that a non-U.S. insurance company may only qualify for an exception to the PFIC rules if, among other things, the non-U.S. insurance company’s officers and employees perform its substantial managerial and operational activities. This proposed regulationactivities (taking into account activities of officers and employees of certain related entities in certain cases). The 2019 Proposed Regulations also provide that an active conduct percentage test must be satisfied for the insurance company exception to apply, which test compares the expenses for services of officers and employees of the non-U.S. insurer and certain related entities incurred for the production of premium and certain investment income to all such expenses regardless of the service provider. The 2019 Proposed Regulations also introduce attribution rules that, taken together with other provisions of the regulations, could result in a U.S. Person that directly owns any shares in a non-PFIC being treated as an indirect shareholder of a lower tier PFIC subject to the general PFIC rules described herein. The 2019 Proposed Regulations will not be effective until adopted in final form. BecauseThe Company believes that, based on the application of the legal uncertainties relating to how the proposed regulations will be interpretedPFIC look-through rules described above and the form in which such regulations mayCompany's plan of operations for the current and future years, AGL should not be finalized, or whether any legislation will be proposed to limit the insurance company exception,characterized as a PFIC. However, as the Company cannot predict whatthe likelihood of finalization of the 2019 Proposed Regulations or the scope, nature, or impact if any, such guidanceof the proposed regulations on us, should they be formally adopted or legislation would have on an investorenacted or whether the Company's non-U.S. insurance subsidiaries will be able to satisfy the Reserve Test in future years and the interaction of the PFIC look-through rules is not clear, no assurance may be given that is subject to U.S. federal income tax.the Company will not be characterized as a PFIC. Prospective investors should consult their tax advisor as to the effects of the PFIC rules.
Foreign tax credit. If U.S. Persons own a majority of AGL's common shares, only a portion of the current income inclusions, if any, under the CFC, RPII and PFIC rules and of dividends paid by AGL (including any gain from the sale of common shares that is treated as a dividend under section 1248 of the Code) will be treated as foreign source income for purposes of computing a shareholder's U.S. foreign tax credit limitations. The Company will consider providing shareholders with information regarding the portion of such amounts constituting foreign source income to the extent such information is reasonably available. It is also likely that substantially all of the "subpart F income," RPII and dividends that are foreign source income will constitute either "passive" or "general" income. Thus, it may not be possible for most shareholders to utilize excess foreign tax credits to reduce U.S. tax on such income.
Information Reporting and Backup Withholding on Distributions and Disposition Proceeds. Information returns may be filed with the IRS in connection with distributions on AGL's common shares and the proceeds from a sale or other disposition of AGL's common shares unless the holder of AGL's common shares establishes an exemption from the information reporting rules. A holder of common shares that does not establish such an exemption may be subject to U.S. backup
withholding tax on these payments if the holder is not a corporation or non-U.S. Person or fails to provide its taxpayer identification number or otherwise comply with the backup withholding rules. The amount of any backup withholding from a payment to a U.S. Person will be allowed as a credit against the U.S. Person's U.S. federal income tax liability and may entitle the U.S. Person to a refund, provided that the required information is furnished to the IRS.
Changes in U.S. Federal Income Tax Law Could Materially Adversely Affect AGL or AGL's Shareholders. Legislation has been introduced from time to time in the U.S. Congress intended to eliminate certain perceived tax advantages of companies (including insurance companies) that have legal domiciles outside the U.S. but have certain U.S. connections. It is possible that legislation could be introduced in and enacted by the current Congress or future Congress that could have an adverse impact on AGL or AGL's shareholders. For example, legislation has been introduced in Congress to limit the deductibility of reinsurance premiums paid by U.S. companies to foreign affiliates. Further, legislation based on the Tax Reform Task-Force Blueprint dated June 24, 2016, which recommends moving to a cash flow consumption-based tax system and provides for border adjustments taxing imports may be introduced and enacted and its impact on the insurance industry may adversely impact the results of our operations.
Additionally, tax laws and interpretations regarding whether a company is engaged in a U.S. trade or business or whether a company is a CFC or a PFIC or has RPII are subject to change, possibly on a retroactive basis. There are currently only recently proposed regulations regarding the application of the PFIC rules to an insurance company. Additionally, the regulations regarding RPII have been in proposed form since 1991. New regulations or pronouncements interpreting or clarifying such rules may be forthcoming. The Company cannot be certain if, when or in what form such regulations or pronouncements may be provided and whether such guidance will have a retroactive effect.
United Kingdom
The following discussion is intended to be only a general guide to certain U.K. tax consequences of holding AGL common shares, under current law and the current practice of HMRC, either of which is subject to change at any time, possibly with retrospective effect. Except where otherwise stated, this discussion applies only to shareholders who are not (and have not recently been) resident or (in the case of individuals) domiciled for tax purposes in the U.K., who hold their AGL common shares as an investment and who are the absolute beneficial owners of their common shares. This discussion may not apply to certain shareholders, such as dealers in securities, life insurance companies, collective investment schemes, shareholders who are exempt from tax and shareholders who have (or are deemed to have) acquired their shares by virtue of an office or employment. Such shareholders may be subject to special rules.
The following statements do not purport to be a comprehensive description of all the U.K. considerations that may be relevant to any particular shareholder. Any person who is in any doubt as to their tax position should consult an appropriate professional tax adviser.
AGL's Tax Residency. AGL is not incorporated in the U.K., but effective November 6, 2013, the AGL Board manages its affairs with the intent to maintain its status as a company that is tax resident in the U.K.
Dividends. Under current U.K. tax law, AGL is not required to withhold tax at source from dividends paid to the holders of the AGL common shares.
Capital gains. U.K. tax is not normally charged on any capital gains realized by non-U.K. shareholders in AGL unless, in the case of a corporate shareholder, at or before the time the gain accrues, the shareholding is used in or for the purposes of a trade carried on by the non-resident shareholder through a permanent establishment in the U.K. or for the purposes of that permanent establishment. Similarly, an individual shareholder who carries on a trade, profession or vocation in the U.K. through a branch or agency may be liable for U.K. tax on the gain if such shareholder disposes of shares that are, or have been, used, held or acquired for the purposes of such trade, profession or vocation or for the purposes of such branch or agency. This treatment applies regardless of the U.K. tax residence status of AGL.
Stamp Taxes. On the basis that AGL does not currently intend to maintain a share register in the U.K., there should be no U.K. stamp duty reserve tax on a purchase of common shares in AGL. A conveyance or transfer on sale of common shares in AGL will not be subject to U.K. stamp duty, provided that the instrument of transfer is not executed in the U.K. and does not relate to any property situated, or any matter or thing done, or to be done, in the U.K.
Description of Share Capital
The following summary of AGL's share capital is qualified in its entirety by the provisions of Bermuda law, AGL's memorandum of association and its Bye-Laws, copies of which are incorporated by reference as exhibits to this Annual Report on Form 10-K.
AGL's authorized share capital of $5,000,000 is divided into 500,000,000 shares, par value U.S. $0.01 per share, of which 124,958,75692,525,850 common shares were issued and outstanding as of February 21, 2017.25, 2020. Except as described below, AGL's common shares have no pre-emptive rights or other rights to subscribe for additional common shares, no rights of redemption, conversion or exchange and no sinking fund rights. In the event of liquidation, dissolution or winding-up, the holders of AGL's common shares are entitled to share equally, in proportion to the number of common shares held by such holder, in AGL's assets, if any remain after the payment of all AGL's debts and liabilities and the liquidation preference of any outstanding preferred shares. Under certain circumstances, AGL has the right to purchase all or a portion of the shares held by a shareholder. See "—Acquisition"Acquisition of Common Shares by AGL" below.
Voting Rights and Adjustments
In general, and except as provided below, shareholders have one vote for each common share held by them and are entitled to vote with respect to their fully paid shares at all meetings of shareholders. However, if, and so long as, the common shares (and other of AGL's shares) of a shareholder are treated as "controlled shares" (as determined pursuant to section 958 of
the Code) of any U.S. Person and such controlled shares constitute 9.5% or more of the votes conferred by AGL's issued and outstanding shares, the voting rights with respect to the controlled shares owned by such U.S. Person shall be limited, in the aggregate, to a voting power of less than 9.5% of the voting power of all issued and outstanding shares, under a formula specified in AGL's Bye-laws. The formula is applied repeatedly until there is no U.S. Person whose controlled shares constitute 9.5% or more of the voting power of all issued and outstanding shares and who generally would be required to recognize income with respect to AGL under the Code if AGL were a CFC as defined in the Code and if the ownership threshold under the Code were 9.5% (as defined in AGL's Bye-Laws as a 9.5% U.S. Shareholder). In addition, AGL's Board may determine that shares held carry different voting rights when it deems it appropriate to do so to (i) avoid the existence of any 9.5% U.S. Shareholder; and (ii) avoid adverse tax, legal or regulatory consequences to AGL or any of its subsidiaries or any direct or indirect holder of shares or its affiliates. "Controlled shares" includes, among other things, all shares of AGL that such U.S. Person is deemed to own directly, indirectly or constructively (within the meaning of section 958 of the Code). Further, these provisions do not apply in the event one shareholder owns greater than 75% of the voting power of all issued and outstanding shares.
Under these provisions, certain shareholders may have their voting rights limited to less than one vote per share, while other shareholders may have voting rights in excess of one vote per share. Moreover, these provisions could have the effect of
reducing the votes of certain shareholders who would not otherwise be subject to the 9.5% limitation by virtue of their direct share ownership. AGL's Bye-laws provide that it will use its best efforts to notify shareholders of their voting interests prior to any vote to be taken by them.
AGL's Board is authorized to require any shareholder to provide information for purposes of determining whether any holder's voting rights are to be adjusted, which may be information on beneficial share ownership, the names of persons having beneficial ownership of the shareholder's shares, relationships with other shareholders or any other facts AGL's Board may deem relevant. If any holder fails to respond to this request or submits incomplete or inaccurate information, AGL's Board may eliminate the shareholder's voting rights. All information provided by the shareholder will be treated by AGL as confidential information and shall be used by AGL solely for the purpose of establishing whether any 9.5% U.S. Shareholder exists and applying the adjustments to voting power (except as otherwise required by applicable law or regulation).
Restrictions on Transfer of Common Shares
AGL's Board may decline to register a transfer of any common shares under certain circumstances, including if they have reason to believe that any adverse tax, regulatory or legal consequences to the Company, any of its subsidiaries or any of its shareholders or indirect holders of shares or its Affiliates may occur as a result of such transfer (other than such as AGL's Board considers de minimis)minimis). Transfers must be by instrument unless otherwise permitted by the Companies Act.
The restrictions on transfer and voting restrictions described above may have the effect of delaying, deferring or preventing a change in control of Assured Guaranty.
Acquisition of Common Shares by AGL
Under AGL's Bye-Laws and subject to Bermuda law, if AGL's Board determines that any ownership of AGL's shares may result in adverse tax, legal or regulatory consequences to AGL, any of AGL's subsidiaries or any of AGL's shareholders or indirect holders of shares or its Affiliates (other than such as AGL's Board considers de minimis)minimis), AGL has the option, but not the obligation, to require such shareholder to sell to AGL or to a third party to whom AGL assigns the repurchase right the minimum number of common shares necessary to avoid or cure any such adverse consequences at a price determined in the discretion of the Board to represent the shares' fair market value (as defined in AGL's Bye-Laws).
Other Provisions of AGL's Bye-Laws
AGL's Board and Corporate Action
AGL's Bye-Laws provide that AGL's Board shall consist of not less than three and not more than 21 directors, the exact number as determined by the Board. AGL's Board consists of ten persons who are elected for annual terms.
Shareholders may only remove a director for cause (as defined in AGL's Bye-Laws) at a general meeting, provided that the notice of any such meeting convened for the purpose of removing a director shall contain a statement of the intention to do so and shall be provided to that director at least two weeks before the meeting. Vacancies on the Board can be filled by the Board if the vacancy occurs in those events set out in AGL's Bye-Laws as a result of death, disability, disqualification or resignation of a director, or from an increase in the size of the Board.
Generally under AGL's Bye-Laws, the affirmative votes of a majority of the votes cast at any meeting at which a quorum is present is required to authorize a resolution put to vote at a meeting of the Board, including one relating to a merger, acquisition or business combination. Corporate action may also be taken by a unanimous written resolution of the Board without a meeting. A quorum shall be at least one-half of directors then in office present in person or represented by a duly authorized representative, provided that at least two directors are present in person.
Shareholder Action
At the commencement of any general meeting, two or more persons present in person and representing, in person or by proxy, more than 50% of the issued and outstanding shares entitled to vote at the meeting shall constitute a quorum for the transaction of business. In general, any questions proposed for the consideration of the shareholders at any general meeting shall be decided by the affirmative votes of a majority of the votes cast in accordance with the Bye-Laws.
The Bye-Laws contain advance notice requirements for shareholder proposals and nominations for directors, including when proposals and nominations must be received and the information to be included.
Amendment
The Bye-Laws may be amended only by a resolution adopted by the Board and by resolution of the shareholders.
Voting of Non-U.S. Subsidiary Shares
IfWhen AGL is required or entitled to vote at a general meeting (for example, an annual meeting) of any of AG Re, AGFOL or any other of its directly held non-U.S. subsidiaries, AGL's Board shallis required to refer the subject matter of the vote to AGL's shareholders and seek direction from such shareholders as to how they should vote on the resolution proposed by the non-U.S. subsidiary. AGL's Board in its discretion shall require that substantially similar provisions are or will be contained in the bye-laws (or equivalent governing documents) of any direct or indirect non-U.S. subsidiaries other than U.K.AGRO and AGRO.subsidiaries incorporated in the U.K.
Employees
As of December 31, 2016,2019, the Company had approximately 300 employees.441 employees including 134 employees from BlueMountain. None of the Company's employees are subject to collective bargaining agreements. The Company believes that employee relations are satisfactory.
Available Information
The Company maintains an Internet web site at www.assuredguaranty.com. The Company makes available, free of charge, on its web site (under assuredguaranty.com/www.assuredguaranty.com/sec-filings) the Company's annual report on Form 10-K, quarterly reports on Form 10-Q, current reports on Form 8-K, and amendments to those reports filed or furnished pursuant to Section 13 (a) or 15 (d) of the Exchange Act as soon as reasonably practicable after the Company files such material with, or furnishes it to, the SEC. The Company also makes available, free of charge, through its web site (under assuredguaranty.com/www.assuredguaranty.com/governance) links to the Company's Corporate Governance Guidelines, its Code of Conduct, AGL's Bye-Laws and the charters for its Board committees. In addition, the SEC maintains an Internet site (at www.sec.gov) that contains reports, proxy and information statements, and other information regarding issuers that file electronically with the SEC.
The Company routinely posts important information for investors on its web site (under assuredguaranty.com/www.assuredguaranty.com/company-statements and, more generally, under the Investor Information tab at www.assuredguaranty.com/investor-informationand Businesses pages)tab at www.assuredguaranty.com/businesses). The Company uses this web site as a means of disclosing material information and for complying with its disclosure obligations under SEC Regulation FD (Fair Disclosure). Accordingly, investors should monitor the Company Statements, Investor Information and Businesses portions of the Company's web site, in addition to following the Company's press releases, SEC filings, public conference calls, presentations and webcasts.
The information contained on, or that may be accessed through, the Company's web site is not incorporated by reference into, and is not a part of, this report.
You should carefully consider the following information, together with the information contained in AGL's other filings with the SEC. The risks and uncertainties discussed below are not the only ones the Company faces. However, these are the risks that the Company's management believes are material. The Company may face additional risks or uncertainties that are not presently known to the Company or that management currently deems immaterial, and such risks or uncertainties also may impair its business or results of operations. The risks discussed below could result in a significant or material adverse effect on the Company's financial condition, results of operations, liquidity or business prospects.
Risks Related to the Company's Expected LossesEconomic, Market and Political Conditions and Natural Phenomena
Estimates of expected losses are subject to uncertainties and may not be adequate to cover potential paid claims.
The financial guaranties issued by the Company's insurance subsidiaries insure the credit performance of the guaranteed obligations over an extended period of time, in some cases over 30 years, and in most circumstances, the Company has no right to cancel such financial guaranties. As a result, the Company's estimate of ultimate losses on a policy is subject to significant uncertainty over the life of the insured transaction. Credit performance can be adversely affected by economic, fiscal and financial market variability over the long duration of most contracts. If the Company's actual losses exceed its current estimate, this may result in adverse effects on the Company's financial condition, results of operations, liquidity, business prospects, financial strength ratings and ability to raise additional capital.
The determination of expected loss is an inherently subjective process involving numerous estimates, assumptions and judgments by management, using both internal and external data sources with regard to frequency, severity of loss, economic projections, governmental actions, negotiations and other factors that affect credit performance. The Company does not use traditional actuarial approaches to determine its estimates of expected losses. Actual losses will ultimately depend on future events or transaction performance. As a result, the Company's current estimates of probable and estimable losses may not reflect the Company's future ultimate claims paid.
Certain sectors and large risks within the Company's insured portfolio have experienced credit deterioration in excess of the Company’s initial expectations, which has led or may lead to losses in excess of the Company’s initial expectations. The Company's expected loss models take into account current and expected future trends, which contemplate the impact of current and probable developments in the performance of the credit. These factors, which are integral elements of the Company's reserve estimation methodology, are updated on a quarterly basis based on current information. Because such information changes, sometimes materially, from quarter to quarter, the Company’s projection of losses may also change materially. Since the financial crisis, much of the development in the Company’s loss projections was with respect to insured U.S. RMBS securities. While the Company's net par outstanding of U.S. RMBS rated BIG under the Company's rating methodology as of December 31, 2016 and December 31, 2015 was still $3.2 billion and $4.0 billion, respectively, and may still be a source of loss development, the Company believes the performance of this portfolio has stabilized. More recently, there has been credit deterioration with respect to certain insured Puerto Rico credits. The Company had net par outstanding to general obligation bonds of the Commonwealth of Puerto Rico and various obligations of its related authorities and public corporations aggregating to $4.8 billion and $5.1 billion, respectively, as of December 31, 2016 and December 31, 2015, all of which was rated BIG under the Company’s rating methodology as of December 31, 2016. For a discussion of the Company's Puerto Rico risks and RMBS transactions, see Part II, Item 8, Financial Statements and Supplementary Data, Note 4, Outstanding Exposure.
Risks Related to the Company's Financial Strength and Financial Enhancement Ratings
A downgrade of the financial strength or financial enhancement ratings of any of the Company's insurance and reinsurance subsidiaries would adversely affect its business and prospects and, consequently, its results of operations and financial condition.
The financial strength and financial enhancement ratings assigned by S&P, Moody's, KBRA and Best to AGL's insurance and reinsurance subsidiaries represent the rating agencies' opinions of the insurer's financial strength and ability to meet ongoing obligations to policyholders and cedants in accordance with the terms of the financial guaranties it has issued or the reinsurance agreements it has executed. The ratings also reflect qualitative factors, such as the rating agencies' opinion of an insurer's business strategy and franchise value, the anticipated future demand for its product, the composition of its insured portfolio, and its capital adequacy, profitability and financial flexibility. Issuers, investors, underwriters, ceding companies and others consider the Company's financial strength or financial enhancement ratings an important factor when deciding whether or not to utilize a financial guaranty or purchase reinsurance from one of the insurance or reinsurance subsidiaries. A downgrade by a rating agency of the financial strength or financial enhancement ratings of one or more of AGL's subsidiaries
could impair the Company's financial condition, results of operation, liquidity, business prospects or other aspects of the Company's business.
The ratings assigned by the rating agencies that publish financial strength or financial enhancement ratings on AGL's insurance subsidiaries are subject to frequent review and may be lowered by a rating agency as a result of a number of factors, including, but not limited to, the rating agency's revised stress loss estimates for the Company's insurance portfolio, adverse developments in the Company's or the subsidiary's financial conditions or results of operations due to underwriting or investment losses or other factors, changes in the rating agency's outlook for the financial guaranty industry or in the markets in which the Company operates, or a revision in the rating agency's capital model or ratings methodology. Their reviews can occur at any time and without notice to the Company and could result in a decision to downgrade, revise or withdraw the financial strength or financial enhancement ratings of AGL's insurance and reinsurance subsidiaries. For example, while all of the rating agencies that rate AGL subsidiaries with exposure to Puerto Rico have indicated that their evaluations of such AGL subsidiaries already take into account stress scenarios related to developments in Puerto Rico, actual developments in Puerto Rico beyond what a rating agency considered could cause that rating agency to review its ratings of such AGL subsidiaries.
Since 2008, each of S&P and Moody's has reviewed and downgraded the financial strength ratings of AGL's insurance and reinsurance subsidiaries, including AGC, AGM and AG Re. In addition, S&P and Moody's have from time to time changed the ratings outlook for certain of the Company's subsidiaries to "negative" from "stable" or have placed such ratings on watch for possible downgrade. Currently, AGM, AGC, MAC and AG Re all have AA (Stable Outlook) financial strength ratings from S&P, with the most recent change by S&P being an upgrade of AGC, AGM and AG Re from AA- (Stable Outlook) in November 2011. Each of AGM and MAC also has a AA+ (Stable Outlook) and AGC also has a AA (Stable Outlook) financial strength rating from KBRA, while AGM and AGC have financial strength ratings in the single-A category from Moody's (A2 (Stable Outlook) and A3 (Stable Outlook), respectively), with the most recent ratings change by Moody's being a change in the outlook of AGC to Stable in August 2016. In addition, AGRO has been assigned a rating of A+ (Stable) from Best, which is Best's second highest rating. The Company periodically assesses the value of each rating assigned to each of its companies, and may as a result of such assessment request that a rating agency add or drop a rating from certain of its companies. For example, the KBRA ratings were first assigned to MAC in 2013 and to AGM in 2014 and the Best rating was first assigned to AGRO in 2015, while a Moody's rating was never requested for MAC and was dropped from AG Re and AGRO in 2015. On January 13, 2017, AGC announced that it had requested that Moody's withdraw its financial strength rating of AGC.
The Company believes that the uncertainty introduced by S&P and Moody's various actions and proposals have reduced the Company's new business opportunities and have also affected the value of the Company's product to issuers and investors. The insurance subsidiaries' financial strength ratings are an important competitive factor in the financial guaranty insurance and reinsurance markets. If the financial strength or financial enhancement ratings of one or more of the Company's insurance subsidiaries were reduced below current levels, the Company expects that would reduce the number of transactions that would benefit from the Company's insurance; consequently, a downgrade by rating agencies could harm the Company's new business production, results of operations and financial condition.
In addition, a downgrade may have a negative impact on the Company in respect of transactions that it has insured or reinsurance that it has assumed. For example, a downgrade of one of the Company's insurance subsidiaries may result in increased claims under financial guaranties such subsidiary has issued. Under variable rate demand obligations insured by AGM, further downgrades past rating levels specified in the transaction documents could result in the municipal obligor paying a higher rate of interest and in such obligations amortizing on a more accelerated basis than expected when the obligations originally were issued; if the municipal obligor is unable to make such interest or principal payments, AGM may receive a claim under its financial guaranty. Under interest rate swaps insured by AGM, further downgrades past specified rating levels could entitle the municipal obligor's swap counterparty to terminate the swap; if the municipal obligor owed a termination payment as a result and were unable to make such payment, AGM may receive a claim if its financial guaranty guaranteed such termination payment. For more information about increased claim payments the Company may potentially make, see Part II, Item 8, Financial Statements and Supplementary Data, Note 6, Contracts Accounted for as Insurance, Ratings Impact on Financial Guaranty Business. In certain other transactions, beneficiaries of financial guaranties issued by the Company's insurance subsidiaries may have the right to cancel the credit protection offered by the Company, which would result in the loss of future premium earnings and the reversal of any fair value gains recorded by the Company. In addition, a downgrade of AG Re or AGC could result in certain ceding companies recapturing business that they had ceded to these reinsurers. See "The downgrade of the financial strength ratings of AG Re or of AGC gives certain reinsurance counterparties the right to recapture ceded business, which would lead to a reduction in the Company's unearned premium reserve and related earnings on such reserve" below.
If AGM's financial strength or financial enhancement ratings were downgraded, AGM-insured GICs issued by the former AGMH subsidiaries that conducted AGMH's Financial Products Business (the Financial Products Companies) may
come due or may come due absent the posting of collateral by the GIC issuers. The Company relies on agreements pursuant to which Dexia has agreed to guarantee or lend certain amounts, or to post liquid collateral, in regards to AGMH's former financial products business. See "Risks Related to the Company's Business, Acquisitions may subject the Company to non-monetary consequences."
Furthermore, if the financial strength ratings of AGE or AGUK were downgraded, AGM or AGC may be required to contribute additional capital to their respective subsidiary pursuant to the terms of the support arrangements for such subsidiaries, including those described in "Item 1. Business, Regulation, United Kingdom, Material Contracts."
The downgrade of the financial strength ratings of AG Re or of AGC gives certain reinsurance counterparties the right to recapture ceded business, which would lead to a reduction in the Company's unearned premium reserve and related earnings on such reserve.
The downgrade of the financial strength ratings of AG Re or of AGC gives certain reinsurance counterparties the right to recapture ceded business, which would lead to a reduction in the Company's unearned premium reserve and related earnings on such reserve. With respect to a significant portion of the Company's in-force financial guaranty assumed business, based on AG Re's and AGC's current ratings and subject to the terms of each reinsurance agreement, the third party ceding company may have the right to recapture assumed business ceded to AG Re and/or AGC, and in connection therewith, to receive payment from the assuming reinsurer of an amount equal to the reinsurer’s statutory unearned premium (net of ceding commissions) and statutory loss reserves (if any) associated with that business, plus, in certain cases, an additional ceding commission. As of December 31, 2016, if each third party company ceding business to AG Re and/or AGC had a right to recapture such business, and chose to exercise such right, the aggregate amounts that AG Re and AGC could be required to pay to all such companies would be approximately $45 million and $18 million, respectively.
Actions taken by the rating agencies with respect to capital models and rating methodology of the Company's business or changes in capital charges or downgrades of transactions within its insured portfolio may adversely affect its ratings, business prospects, results of operations and financial condition.
The rating agencies from time to time have evaluated the Company's capital adequacy under a variety of scenarios and assumptions. The rating agencies do not always supply clear guidance on their approach to assessing the Company's capital adequacy and the Company may disagree with the rating agencies' approach and assumptions. For example, S&P assesses each individual credit (including potential new credits) insured by the Company based on a variety of factors, including the nature of the credit, the nature of the support or credit enhancement for the credit, its tenor, and its expected and actual performance. This assessment determines the amount of capital the Company is required to maintain against that credit to maintain its financial strength ratings under S&P's capital adequacy model. Sometimes the rating agencies consider the amount of additional capital that could be required for certain risks or sectors under certain stress scenarios based on their views of developments in the market, as each have done recently with respect to the Company's exposures to Puerto Rico. Factors influencing the rating agencies are beyond management's control and not always known to the Company. In the event of an actual or perceived deterioration in creditworthiness, or a change in a rating agency's capital model or rating methodology, that rating agency may require the Company to increase the amount of capital allocated to support the affected credits, regardless of whether losses actually occur, or against potential new business. Significant reductions in the rating agencies' assessments of credits in the Company's insured portfolio can produce significant increases in the amount of capital required for the Company to maintain its financial strength ratings under the rating agencies' capital adequacy models, which may require the Company to seek additional capital. The amount of such capital required may be substantial, and may not be available to the Company on favorable terms and conditions or at all. Accordingly, the Company cannot ensure that it will seek to, or be able to, raise additional capital. The failure to raise additional required capital could result in a downgrade of the Company's ratings and thus have an adverse impact on its business, results of operations and financial condition. See "Risks Related to the Company's Capital and Liquidity Requirements—The Company may require additional capital from time to time, including from soft capital and liquidity credit facilities, which may not be available or may be available only on unfavorable terms."
Risks Related to the Financial, Credit and Financial Guaranty Markets
The Company's business, liquidity, financial condition and stock price may be adversely affected by developments in the U.S. and world-wide financial markets.markets and economy generally.
The Company's loss reserves, profitability, financial position, insured portfolio, investment portfolio, assets under management (AUM), cash flow, statutory capital and stock price could be materially affected by the U.S. and global financial markets. Upheavals inmarkets and economy generally.
In recent years, the global financial markets affect economic activity and employmenteconomy generally have been impacted by political events such as trade confrontations between the U.S. and therefore can affecttraditional allies and between the Company's business.U.S. and China as well as the process of withdrawal of the U.K. from the EU (commonly known as ‘Brexit’). The global economic outlook remains uncertain,and political systems also have been impacted by events in the Middle East and Eastern Europe, as well as Africa and Southeast Asia, and could be impacted by other events in the future, including the overall growth rate of the U.S. economy, the fragile economic recovery innatural and man-made disasters and pandemics.
Europe and the impact of recent political trends on the global economic order. These and other risks could materially and negatively affect the Company’s ability to access the capital markets, the cost of the Company's debt, the demand for its credit enhancement and asset management products, the amount of losses incurred on transactions it guarantees, the value and performance of its investment portfolio (including its alternative investments), the value of its AUM and amount of its related asset management fees, the financial ratings of its insurance subsidiaries, and the price of its common shares.
Some of the state and local governments and entities that issue obligations the Company insures are experiencing significant budget deficits and pension funding and revenue shortfalls that could result in increased credit losses or impairments and capital charges on those obligations.
Some of the state and local governments that issue the obligations the Company insures have experienced significant budget deficits and pension funding and revenue collection shortfalls that required them to significantly raise taxes and/or cut spending in order to satisfy their obligations. While the U.S. government has provided some financial support and although overall state revenues have increased in recent years, significant budgetary pressures remain, especially at the local government level and in relation to retirement obligations. Certain local governments, including ones that have issued obligations insured by the Company, have sought protection from creditors under chapter 9 of the U.S. Bankruptcy Code as a means of restructuring their outstanding debt. In some recent instances where local governments were seeking to restructure their outstanding debt, and partially in response to concerns that materially reducing pension payments would lead to employee flight and, therefore, an inadequate level of local government services, pension and other obligations owed to workers were treated more favorably than senior bond debt owed to the capital markets. If the issuers of the obligations in the Company's public finance portfolio do not have sufficient funds to cover their expenses and are unable or unwilling to raise taxes, decrease spending or receive federal assistance, the Company may experience increased levels of losses or impairments on its public finance obligations, which could materially and adversely affect its business, financial condition and results of operations. If such issuers succeed in restructuring pension and other obligations owed to workers so that they are treated more favorably than obligations insured by the Company, such losses or impairments could be greater than the Company otherwise anticipated when the insurance was written.
In addition, obligations supported by specified revenue streams, such as revenue bonds issued by toll road authorities, municipal utilities or airport authorities, may be adversely affected by revenue declines resulting from reduced demand, changing demographics or other factors associated with an economy in which unemployment remains high, housing prices have not yet stabilized and growth is slow. These obligations, which may not necessarily benefit from financial support from other tax revenues or governmental authorities, may also experience increased losses if the revenue streams are insufficient to pay scheduled interest and principal payments.
Persistently low interest rate levels and credit spreads could adversely affect demand for financial guaranty insurance as well as the Company's financial condition.
Demand for financial guaranty insurance generally fluctuates with changes in market credit spreads. Credit spreads, which are based on the difference between interest rates on high-quality or "risk free" securities versus those on lower-rated or uninsured securities, fluctuate due to a number of factors and are sensitive to the absolute level of interest rates, current credit experience and investors' risk appetite. When interest rates are low, or when the market is relatively less risk averse, the credit spread between high-quality or insured obligations versus lower- rated or uninsured obligations typically narrows. As a result, financial guaranty insurance typically provides lower interest cost savings to issuers than it would during periods of relatively wider credit spreads. Issuers are less likely to use financial guaranties on their new issues when credit spreads are narrow, this results in decreased demand or premiums obtainable for financial guaranty insurance. The continued persistence of low interest rate levels and or low credit spreads by historical standards could continue to dampen demand for financial guaranty insurance.
Conversely, in a deteriorating credit environment, credit spreads increase and become "wide," which increases the interest cost savings that financial guaranty insurance may provide and can result in increased demand for financial guaranties by issuers. However, if the weakening credit environment is associated with economic deterioration, the Company's insured portfolio could generate claims and loss payments in excess of normal or historical expectations. In addition, increases in market interest rate levels could reduce new capital markets issuances and, correspondingly, cause a decreased volume of insured transactions.
The Company may be subjected to significant risks from individual or correlated exposures.
The Company is exposed to the risk that issuers of debt that it insures or other counterparties may default in their financial obligations, whether as a result of insolvency, lack of liquidity, operational failure or other reasons. Similarly, the Company could be exposed to corporate credit risk if a corporation or financial institution is the originator or servicer of loans, mortgages or other assets backing structured securities that the Company has insured.
In addition, because the Company insures or reinsures municipal bonds, it may have significant exposures to single municipal risks; see Part II, Item 7, Management's Discussion and Analysis of Financial Condition and Results of Operations, Insured Portfolio, for a list of the Company's ten largest municipal risks by revenue source. While the Company's risk of a complete loss, where it would have to pay the entire principal amount of an issue of bonds and interest thereon with no recovery, is generally lower for municipal bonds, most of which are backed by tax or other revenues, than for corporate bonds, there can be no assurance that a single default by a municipality would not have a material adverse effect on the Company's results of operations or financial condition.
The Company's ultimate exposure to a single risk may exceed its underwriting guidelines (caused by, for example, acquisitions, reassumptions, or amortization of loss onthe portfolio faster than the single risk), and capital charges for municipal creditsan event with respect to a single risk may cause a significant loss. The Company seeks to reduce this risk by managing exposure to large single risks, as well as concentrations of correlated risks, through tracking its aggregate exposure to single risks in its various lines of business and establishing underwriting criteria to manage risk aggregations. The Company may insure and has insured individual public finance and asset-backed risks well in excess of $1 billion. Should the Company's risk assessments prove inaccurate and should the applicable limits prove inadequate, the Company could also be exacerbatedexposed to larger than anticipated losses, and could be required by rating agency downgrades of municipal credit ratings. A downgraded municipal issuer may be unable to refinance maturing obligations or issue new debt, which could reduce the municipality's ability to service its debt. Downgrades could also affect the interest rate that the municipality must pay on its variable rate debt or for new debt issuance. Municipal credit downgrades, as with other downgrades, result in an increase in the capital charges the rating agencies assess when evaluatingto hold additional capital against insured exposures whether or not downgraded by the rating agencies.
The Company is exposed to correlation risk across the various assets the Company insures and in which it invests. During periods of strong macroeconomic performance, stress in an individual transaction generally occurs for idiosyncratic reasons or as a result of issues in a single asset class (so impacting only transactions in that sector). During a broad economic downturn, a wider range of the Company's insurance and investment portfolios could be exposed to stress at the same time. This stress may manifest itself in any or all of the following: ratings downgrades of insured risks, which may require more capital adequacy in their rating models. Significant municipal downgrades could resultthe Company’s insurance subsidiaries; a reduction in higher capital requirements forthe value of the Company’s investments and /or AUM; and actual defaults and losses in its insurance and / or investment portfolios. In addition, while the Company's insurance portfolio has experienced many catastrophic events in the past without material loss, unexpected catastrophic events may have a material adverse effect upon the Company's insured portfolio and/or its investment portfolios, especially where the obligor is already under financial stress. For example, Hurricane Maria negatively impacted the Company’s insurance exposure to Puerto Rico and its related authorities and public corporations.
Claim payments on obligations of the Commonwealth of Puerto Rico and its related authorities and public corporations insured by the Company in order to maintain its financial strength ratings.excess of those expected by the Company or recoveries below those expected by the Company could have a negative effect on the Company's liquidity and results of operations.
The Company has an aggregate $4.8$4.3 billion net par exposure as of December 31, 20162019 to the Commonwealth of Puerto Rico (Puerto Rico or the Commonwealth) and various obligations of its related authorities and public corporations, and claim payments on such insured exposures in excess of thatthose expected by the Company could have a negative effect on the Company's liquidity and results of operations. On January 1, 2016,Most of the Puerto Rico Infrastructure Finance Authority (PRIFA)Rican entities with obligations insured by the Company have defaulted on payment of a portion of the interest due on its bonds on that date. There have been additional payment defaults by Puerto Rico issuers since then,their debt service payments, and the Company has made claim payments with respect to several Puerto Rico credits. On April 6, 2016, Governor García Padilla of Puerto Rico (the Former Governor) signed into lawpaid claims on them. The total net expected loss the Puerto Rico Emergency Moratorium & Financial Rehabilitation Act (the Moratorium Act). The Moratorium Act purportedly empowers the governor to declare, entity by entity, states of emergencies and moratoriums on debt service payments on obligations of the Commonwealth and its related authorities and public corporations, as well as instituting a stay against related litigation, among other things. The Former Governor used the authority of the Moratorium Act to take a number of actionsCompany carries related to issuerssuch exposures is net of obligationsa significant credit for estimated recoveries on claims already paid, and recoveries below those expected by the Company insures. could also have a negative effect on the Company's liquidity and results of operations.
On June 30, 2016, the Puerto Rico Oversight, Management, and Economic Stability Act (PROMESA) was signed into law by the President of the United States. PROMESA establishesestablished a seven-member federal financial oversight board (Oversight Board) with authority to require that balanced budgets and fiscal plans be adopted and implemented by Puerto Rico. PROMESA provides a legal framework under which the debt of the Commonwealth and its related authorities and public corporations may be voluntarily restructured, and grants the Oversight Board the sole authority to file restructuring petitions in a federal court to restructure the debt of the Commonwealth and its related authorities and public corporations if voluntary negotiations fail, provided that any such restructuring must be in accordance with an Oversight Board approved fiscal plan that respects the liens and priorities provided under Puerto Rico law. The Oversight Board has begun meeting
On September 20, 2017, Hurricane Maria made landfall in Puerto Rico as a Category 4 hurricane on the Saffir-Simpson scale, causing loss of life and widespread devastation. Damage to the Commonwealth’s infrastructure, including the power grid, water system and transportation system, was extensive, and has hired Ramón Ruiz-Comas as interim executive director. On January 2, 2017, Ricardo Antonio Rosselló Nevares (the Governor) took office, replacingimpacted the Former Governor. On January 29, 2017,ability and willingness of Puerto Rican obligors to make timely and full debt service payments and participants’ efforts to resolve the Governor signed theCommonwealth’s financial issues under PROMESA. More recently, beginning on December 28, 2019, and progressing into early 2020, Puerto Rico Emergencyhas been struck by a swarm of earthquakes, including at least 11 that were of magnitude 5 or greater based on the the Richter magnitude scale. While not nearly as deadly or destructive as Hurricane Maria, the earthquakes have damaged buildings and Fiscal Responsibility Act (Emergency Act) that, among other things, repeals portions ofinfrastructure, including the Moratorium Act, defines an emergency period until May 1, 2017, continues diversion of collateral away from bonds the Company insures, and defines the powers and duties of the Fiscal Agency and Financial Advisory Authority (FAFAA). power grid.
The final shape, timing and validity of responses to Puerto Rico’s distress eventually enacted or implemented under the auspices of PROMESA and the Oversight Board or
otherwise, and the impact, after resolution of any legal challenges, of any such responses on obligations insured by the Company, is uncertain.are uncertain, but could be significant. Additional information about the Company's exposure to Puerto Rico and legal actions it has initiated may be found in Part II, Item 8, Financial Statements and Supplementary Data, Note 4,5, Outstanding Insurance Exposure, Exposure to Puerto Rico.
In addition, obligations supportedChanges in attitudes toward debt repayment could negatively impact the Company’s financial guaranty business.
The likelihood of debt repayment is impacted by specified revenue streams,both the ability and the willingness of the obligor to repay their debt. Debtors generally understand that debt repayment is not only a legal obligation but is also appropriate, and that a failure to repay their debt will impede their access to debt in the future. To the extent societal attitudes toward the repayment of debt by struggling obligors softens and such as revenue bonds issued by toll road authorities, municipal utilities or airport authorities,obligors believe there to be less of a penalty for nonpayment, some struggling debtors may be adversely affected by revenue declines resulting from reduced demand, changing demographicsmore likely to default and, if they default, less likely to agree to repayment plans they view as burdensome. If the issuers of the obligations in the Company's public finance portfolio become unwilling to raise taxes, decrease spending or other factors associated with an economyreceive federal assistance in which unemployment remains high, housing prices have not yet stabilized and growth is slow. Theseorder to repay their debt, the Company may experience increased levels of losses or impairments on its public finance obligations, which may not necessarily benefit from financial support from other tax revenues or governmental authorities, may also experience increased losses if the revenue streams are insufficient to pay scheduled interestcould materially and principal payments.
Persistently low interest rate levels and credit spreads could adversely affect demandits business, financial condition and results of operations.
Global climate change may impact the Company’s insurance and investment portfolios.
Atmospheric concentrations of carbon dioxide and other greenhouse gases have increased dramatically since the industrial revolution, and have been blamed for financial guaranty insurancea gradual increase in global average temperatures and an apparent increase in the frequency and severity of natural disasters. These trends, as well as climate change regulation, are expected to continue in the Company's financial condition.future and to impact nearly all sectors of the economy to varying degrees.
Demand for financial guaranty insurance generally fluctuates with changes in market credit spreads. Credit spreads, which are basedClimate change and climate change regulation may impact asset prices and general economic conditions and may disproportionately impact particular industries or locations. The Company cannot predict the long-term impacts on the difference between interest rates on high-qualityCompany from climate change or "risk free" securities versus those on lower-rated or uninsured securities, fluctuate due to a number of factors and are sensitive to the absolute level of interest rates, current credit experience and investors' risk appetite. Average municipal interest rates were extremely low during 2016, with the benchmark AAA 30-year Municipal Market Data index published by Thomson Reuters (MMD Index), at times below 2%, a threshold not previously crossed in the modern era. When interest rates are low, or when the market is relatively less risk averse, the credit spread between high-quality or insured obligations versus lower- rated or uninsured obligations typically narrows. As a result, financial guaranty insurance typically provides lower interest cost savings to issuers than it would during periods of relatively wider credit spreads. When issuers are less likely to use financial guaranties on their new issues when credit spreads are narrow, this results in decreased demand or premiums obtainable for financial guarantyclimate change regulation. The Company manages its insurance and a resulting reduction in the Company's results of operations. The continued persistence of low interest rate levelsinvestment risks by maintaining well-diversified insurance and credit spreads could continue to dampen demand for financial guaranty insurance.
Conversely, in a deteriorating credit environment, credit spreads increaseinvestment portfolios, both geographically and become "wide", which increases the interest cost savings that financial guaranty insurance may provideby sector, and can result in increased demand for financial guaranties by issuers. However, if the weakening credit environment is associated with economic deterioration, the Company's insured portfolio could generate claims and loss payments in excess of normal or historical expectations. In addition, increases in market interest rate levels could reduce new capital markets issuances and, correspondingly, a decreased volume of insured transactions.
Competition in the Company's industry may adversely affect its revenues.
As described in greater detail under "Competition" in "Item 1. Business,"monitors these portfolios on an ongoing basis. While the Company can adjust its investment exposure to sectors and/or geographical areas that
face competition, eithersevere risks due to climate change or climate change regulation, the Company has less flexibility in adjusting the formexposure in its insurance portfolio because some of current or new providers of credit enhancement or in terms of alternative structures, including uninsured offerings, or pricing competition. Increased competition could have an adverse effect onthe financial guaranties issued by the Company's insurance business.
The Company's financial position, resultssubsidiaries insure the credit performance of operationsthe guaranteed obligations over an extended period of time, in some cases over 30 years, and, cash flows may be adversely affected by fluctuations in foreign exchange rates.
The Company's reporting currency is the U.S. dollar. The functional currencies of AGL's primary insurance and reinsurance subsidiaries are the U.S. dollar and pound sterling. Exchange rate fluctuations may materially impact the Company's financial position, results of operations and cash flows. The Company's non-U.S. subsidiaries maintain both assets and liabilities in currencies different from their functional currency, which exposesmost circumstances, the Company has no right to changes in currency exchange rates. In addition, locally-required capital levels are invested in local currencies in order to satisfy regulatory requirements and to support local insurance operations regardless of currency fluctuations.cancel such financial guaranties.
The principal currencies creating foreign exchange risk are the British pound sterling and the European Union euro. The Company cannot accurately predict the nature or extent of future exchange rate variability between these currencies or relative to the U.S. dollar. Foreign exchange rates are sensitive to factors beyond the Company's control. The Company does not engage in active management, or hedging, of its foreign exchange rate risk. Therefore, fluctuation in exchange rates between these currencies and the U.S. dollar could adversely impact the Company's financial position, results of operations and cash flows.
The Company's international operations expose it to less predictable credit and legal risks.
The Company pursues new business opportunities in international markets. The underwriting of obligations of an issuer in a foreign country involves the same process as that for a domestic issuer, but additional risks must be addressed, such as the evaluation of foreign currency exchange rates, foreign business and legal issues, and the economic and political environment of the foreign country or countries in which an issuer does business. Changes in such factors could impede the Company's ability to insure, or increase the risk of loss from insuring, obligations in the countries in which it currently does business and limit its ability to pursue business opportunities in other countries.
The Company's investment portfolio and AUM may be adversely affected by credit, interest rate and other market changes.
The Company's operating results are affected, in part, by the performance of its investment portfolio which primarily consists primarily of fixed-income securities and short-term investments. As of December 31, 2016, the2019, fixed-maturity securities and short-term investments held by the Company had a fair value of approximately $10.8$10.1 billion. Credit losses and changes in interest rates could have an adverse effect on itsthe Company's shareholders' equity and net income. Credit losses result in realized losses on the Company's investment portfolio, which reduce net income and shareholders' equity. Changes in interest rates can affect both shareholders' equity and investment income. For example, if interest rates decline, funds reinvested will earn less than expected, reducing the Company's future investment income compared to the amount it would earn if interest rates had not declined. However, the value of the Company's fixed-rate investments would generally increase if interest rates decreased, resulting in an unrealized gain on investments included in shareholders' equity. Conversely, if interest rates increase, the value of the fixed-rate investment portfolio will be reduced, resulting in unrealized losses that the Company is required to include in shareholders' equity as a change in accumulated other comprehensive income.equity. Accordingly, interest rate increases could reduce the Company's shareholders' equity.
Credit losses and changes in interest rates could also have an adverse impact on the amount of the Company’s AUM, which could impact net income. For example, if interest rates increase or there are credit losses in the portfolios managed by Assured Investment Management, AUM will decrease, reducing the amount of management fees earned by the Company. Conversely, if interest rates decrease, AUM and management fees will increase.
Interest rates are highly sensitive to many factors, including monetary policies, domestic and international economic and political conditions and other factors beyond the Company's control. The Company does not engage in active management, or hedging, of interest rate risk in its investment portfolio, and may not be able to mitigate interest rate sensitivity effectively.
The market valueExpansion of the categories and types of investments in the Company’s investment portfolio alsomay expose it to increased credit, interest rate, liquidity and other risks.
The Company is using the investment knowledge and experience acquired in the BlueMountain Acquisition to expand the categories and types of investments included in its investment portfolio by both (a) initially investing $500 million of capital in Assured Investment Management funds plus additional amounts in other accounts managed by Assured Investment Management and (b) expanding the categories and types of its alternative investments not managed by Assured Investment Management. This expansion of categories and types of investments may increase the risk in the Company’s investment portfolio as described above under "The Company's investment portfolio may be adversely affected by general developments in the capital markets, including decreased market liquidity for investment assets, market perception of increased credit risk with respect to the types of securities held in the portfolio, downgrades of credit ratings of issuers of investment assets and/or foreign exchange movements impacting investment assets. In addition, the Company invests in securities insured by other financial guarantors, the market value of which may be affected by the rating instability of the relevant financial guarantor.
The Company also invests a portion of its excess capital in alternative investments, which also may be affected by credit, interest rate and other market changes as well as factors specific to those investments. See "Risks Related tochanges." For example, the Company's Business - Alternativefair value of alternative investments may notbe more volatile than other investments made by the Company. In addition, this expansion may result in the benefits anticipated."
‘Brexit’ may adversely impact credits insured byCompany investing a portion of its portfolio in alternative investments that are less liquid than some of its other investments. While the Company and may also adversely impact the Company through currency exchange rates.
On June 23, 2016, a referendum was heldmanages its investment portfolio with its liquidity requirements in the U.K. in which a majority voted to exit the EU, known as “Brexit”. The U.K. government has indicated that it intends to formally serve notice to the European Council by March 2017 of its desire to withdraw in accordance with Article 50 of the Treaty on European Union. Negotiations between the U.K. and the EU will determine the future terms of the U.K’s relationship with the EU, including the terms of trade between the U.K. and the EU. Any resulting political, social and economic uncertainty and changes arising from Brexit may have a negative impact on the economies of the U.K. as well as non-U.K. EU and EEA countries, whichmind, this expansion may increase the probabilityrisks described below under “-- Operational Risks -- The ability of losses on obligations insured byAGL and its subsidiaries to meet their liquidity needs may be limited”. Expanding the categories and types of investments in the Company’s investment portfolio may also expose the Company that are exposed to other types of risks, in the U.K. and non-U.K. EU and EEA countries.including reputational risks.
Brexit may also impact currency exchange rates. The Company reports its accounts in U.S. dollars, while some of its income, expenses and assets are denominated in other currencies, primarily the pound sterling and the euro. From December 31, 2015, to December 31, 2016, which period encompasses the Brexit vote, the value of pound sterling changed from £0.68 per dollar to £0.81 per dollar, while the euro changed from €0.83 per dollar to €0.95 per dollar. For the year ended 2016 the Company recognized losses of approximately $21 million in the consolidated statement of operations, net of tax, and approximately $32 million in OCI, net of tax, for foreign currency translation, that were primarily driven by the exchange rate fluctuations of the pound sterling. If the Company had owned AGLN during 2016, these impacts would have been greater.
Risks Related to Estimates, Assumptions and Valuations
Estimates of expected losses are subject to uncertainties and may not be adequate to cover potential paid claims.
The financial guaranties issued by the Company's Capitalinsurance subsidiaries insure the credit performance of the guaranteed obligations over an extended period of time, in some cases over 30 years, and, Liquidity Requirementsin most circumstances, the Company has no right to cancel such financial guaranties. As a result, the Company's estimate of ultimate losses on a policy is subject to significant uncertainty over the life of the insured transaction. Credit performance can be adversely affected by economic, fiscal and financial market variability as well as changes in law or industry practices (such as the potential discontinuance of the publication of the London Interbank Offered Rate (LIBOR) over the long duration of most contracts. If the Company's actual losses exceed its current estimate, this may result in adverse effects on the Company's financial condition, results of operations, liquidity, business prospects, financial strength ratings and ability to raise additional capital.
Significant claim payments may reduceThe determination of expected loss is an inherently subjective process involving numerous estimates, assumptions and judgments by management, using both internal and external data sources with regard to frequency, severity of loss, economic projections, the perceived strength of legal protections, governmental actions, negotiations and other factors that affect credit performance. The Company does not use traditional actuarial approaches to determine its estimates of expected losses. Actual losses will ultimately depend on future events or transaction performance. As a result, the Company's liquidity.
Claim payments reducecurrent estimates of losses may not reflect the Company's invested assetsfuture ultimate claims paid.
Certain sectors and resultlarge risks within the Company's insured portfolio have experienced credit deterioration in reduced liquidityexcess of the Company’s initial expectations, which has led or may lead to losses in excess of the Company’s initial expectations. The Company's expected loss models take into account current and net investment income, even ifexpected future trends, which contemplate the Company is reimbursedimpact of current and possible developments in fullthe performance of the exposure. These factors, which are integral elements of the Company's reserve estimation methodology, are updated on a quarterly basis based on current information. Because such information changes over time, and does not experience ultimate loss on a particular policy. Sincesometimes materially, the financial crisis, manyCompany’s projection of losses may also change materially. Much of the claims paid byrecent development in the Company were with respectCompany's loss projections relate to insured U.S. RMBS securities. More recently, there has been credit deterioration with respect to certainthe Company's insured Puerto Rico credits.exposures. The Company had net par outstanding to general obligation bonds of the Commonwealth of Puerto Rico and various obligations of its related authorities and public corporations aggregating of $4.8 billion and $5.1 billion, respectively, as of December 31, 20162019 and December 31, 2015,2018 aggregating to $4.3 billion and $4.8 billion, respectively, all of which was rated BIG under the Company’s rating methodology as of December 31, 2016.methodology. For a discussion of the Company's Puerto Rico risks, and RMBS transactions, see Part II, Item 8, Financial Statements and Supplementary Data, Note 4,5, Outstanding Insurance Exposure.
AsThe valuation of December 31, 2016, the Company had exposure of approximately $528 million to a long-term infrastructure project that was financed by bonds that mature prior to the expirationmany of the project concession. The Company expects the cash flows from the projectCompany’s assets and liabilities and AUM includes methodologies, estimates and assumptions that are subject to be sufficientdiffering interpretations and could result in changes to repay allvaluations of the debt overCompany’s assets and liabilities that may materially adversely affect the lifeCompany’s results of the project concession,operations and also expects the debt to be refinanced in the market at or prior to its maturity. If the issuer is unable to refinance the debt due to market conditions, the Company may have to pay claims when the debt matures from 2018 to 2022, and then recover from cash flows produced by the project in the future. The Company generally projects that in most scenarios it will be fully reimbursed for such claim payments. However, the recovery of such amounts is uncertain and may take from 10 to 35 years, depending on the performance of the underlying collateral. financial condition.
The Company plans for future claim payments. If the amountcarries a significant portion of future claim payments is significantly more than projectedits assets and liabilities and reports a significant portion of its AUM at fair value. The approaches used by the Company however,to calculate the Company's ability to make other claim paymentsfair value of those assets and its financial condition, financial strength ratings and business prospects could be adversely affected.
The Company may require additional capital from time to time, including from soft capital and liquidity credit facilities, which may not be available or may be available only on unfavorable terms.
The Company's capital requirements depend on many factors, primarily related to its in-force book of business and rating agency capital requirements. The Company needs liquid assets to make claim payments on its insured portfolio and to write new business. Failure to raise additional capital as needed may result in the Company being unable to write new business and may result in the ratings of the Company and its subsidiaries being downgraded by one or more ratings agency. The Company's access to external sources of financing, as well as the cost of such financing, is dependent on various factors, including the market supply of such financing, the Company's long-term debt ratings and insurance financial strength ratings and the perceptions of its financial strength and the financial strength of its insurance subsidiaries. The Company's debt ratingsliabilities it carries at fair value are in turn influenced by numerous factors, such as financial leverage, balance sheet strength, capital structure and earnings trends. If the Company's need for capital arises because of significant losses, the occurrence of these losses may make it more difficult for the Company to raise the necessary capital.
Future capital raises for equity or equity-linked securities could also result in dilution to the Company's shareholders. In addition, some securities that the Company could issue, such as preferred stock or securities issued by the Company's operating subsidiaries, may have rights, preferences and privileges that are senior to those of its common shares.
Financial guaranty insurers and reinsurers typically rely on providers of lines of credit, credit swap facilities and similar capital support mechanisms (often referred to as "soft capital") to supplement their existing capital base, or "hard capital." The ratings of soft capital providers directly affect the level of capital credit which the rating agencies give the Company when evaluating its financial strength. The Company currently maintains soft capital facilities with providers having ratings adequate to provide the Company's desired capital credit. For example, effective January 1, 2016, AGC, AGM and MAC entered into a $360 million aggregate excess of loss reinsurance facility with a number of reinsurers, that covers certain U.S. public finance credits insured or reinsured by those companies. (For additional information, seedescribed under Part II, Item 8, Financial Statements and Supplementary Data, Note 13, Reinsurance9, Fair Value Measurement. The determination of fair values is made at a specific point in time, based on available market information and Other Monoline Exposures). However, no assurance can be given thatjudgments about the Company will be able to renew any existing soft capital facilities or that one or moreassets and liabilities being valued, including estimates of timing and amounts of cash flows and the credit rating of the rating agencies will not downgradeissuer or withdraw the applicable ratingscounterparty. The use of such providers in the future. In addition, the Companydifferent methodologies and assumptions may not be able to replace a downgraded soft capital provider with an acceptable replacement provider for a variety of reasons, including if an acceptable replacement provider is unwilling to provide the Company with soft capital commitments or if no adequately-rated institutions are actively providing soft capital facilities. Furthermore, the rating agencies may in the future change their methodology and no longer give credit for soft capital, which may necessitate the Company having to raise additional capital in order to maintain its ratings.
An increase in AGL's subsidiaries' leverage ratio may prevent them from writing new insurance.
Insurance regulatory authorities impose capital requirements on AGL's insurance subsidiaries. These capital requirements, which include leverage ratios and surplus requirements, may limit the amount of insurance that the subsidiaries may write. The insurance subsidiaries have several alternatives available to control their leverage ratios, including obtaining capital contributions from the Company, purchasing reinsurance or entering into other loss mitigation agreements, or reducing the amount of new business written. However, a material reduction ineffect on estimated fair value amounts.
During periods of market disruption, including periods of rapidly changing credit spreads or illiquidity, it may be difficult to value certain of the statutory capitalCompany’s assets and surplus of a subsidiary, whether resulting from underwritingliabilities and AUM, particularly if trading becomes less frequent or investment losses, a change in regulatory capital requirements or otherwise, or a disproportionatemarket data becomes less observable. An increase in the amount of riskthe Company’s alternative investments may increase the amount of the Company’s assets subject to this risk. During such periods, more assets and liabilities may fall to the Level 3 valuation level, which describes model derived valuations in force, could increase a subsidiary's leverage ratio. Thiswhich one or more significant inputs or significant value drivers are unobservable, thereby resulting in turn could requirevalues that subsidiary to obtain reinsurance for existing business (which may not be available,indicative of net realizable value or reflective of future fair values. Rapidly changing credit and equity market conditions could materially impact the valuation of assets and liabilities as reported within the financial statements, and period-to-period changes in value could vary significantly.
Strategic Risks
Competition in the Company's industries may be available on terms thatadversely affect its revenues.
As described in greater detail under Item 1, Business, Insurance Segment "--Competition," the Company considers unfavorable), or add tocan face competition in its capital base to maintain its financial strength ratings. Failure to maintain regulatory capital levels could limit that subsidiary's ability to write new business.
The Company's holding companies' ability to meet its obligations may be constrained.
Each of AGL, AGUS and AGMH is a holding company and, as such, has no direct operations of its own. None of the holding companies expects to have any significant operations or assets other than its ownership of the shares of its subsidiaries.
The insurance company subsidiaries’ ability to pay dividends and make other payments depends, among other things, upon their financial condition, results of operations, cash requirements, and compliance with rating agency requirements, and is also subject to restrictions containedbusiness, either in the insurance laws and related regulationsform of their statescurrent or new providers of domicile. Restrictions applicable to AGM, AGC and MAC, and to AG Re and AGRO, are described under the "Regulation, United States, State Dividend Limitations" and "Regulation, Bermuda, Restrictions on Dividends and Distributions" sections of “Item 1. Business.” Such dividends and permitted payments are expected to be the primary source of funds for the holding companies to meet ongoing cash requirements, including operating expenses, any future debt service payments and other expenses, and to pay dividends to their respective shareholders. Accordingly, if the insurance subsidiaries cannot pay sufficient dividends or make other permitted payments at the timescredit enhancement or in the amounts that are required, that wouldterms of alternative structures, including uninsured offerings, or pricing competition. Increased competition could have an adverse effect on the abilityCompany's insurance business.
The Company’s Asset Management segment operates in highly competitive markets. The Company competes with many other firms in every aspect of AGL, AGUSthe asset management industry, including raising funds, seeking investments, and AGMH to satisfy their ongoing cash requirementshiring and on theirretaining professionals. The Company’s ability to pay dividendsincrease and retain AUM is directly related to shareholders.
If AGRO were to pay dividends to its U.S. holding company parent and that U.S. holding company were to pay dividends to its Bermudian parent AG Re, such dividends would be subject to U.S. withholding tax at a rate of 30%.
The ability of AGL and its subsidiaries to meet their liquidity needs may be limited.
Each of AGL, AGUS and AGMH requires liquidity, either in the form of cash or in the ability to easily sell investment assets for cash, in order to meet its payment obligations, including, without limitation, its operating expenses, interest on debt and dividends on common shares, and to make capital investments in operating subsidiaries. The Company's operating subsidiaries require substantial liquidity in order to meet their respective payment and/or collateral posting obligations, including under financial guaranty insurance policies, CDS contracts or reinsurance agreements. They also require liquidity to pay operating expenses, reinsurance premiums, dividends to AGUS or AGMH for debt service and dividends to the Company, as well as, where appropriate, to make capital investments in their own subsidiaries. The Company cannot give any assurance that the liquidity of AGL and its subsidiaries will not be adversely affected by adverse market conditions, changes in insurance regulatory law or changes in general economic conditions.
AGL anticipates that its liquidity needs will be met by the ability of its operating subsidiaries to pay dividends or to make other payments; external financings; investment income from its invested assets; and current cash and short-term investments. The Company expects that its subsidiaries' need for liquidity will be met by the operating cash flows of such subsidiaries; external financings; investment income from their invested assets; and proceeds derived from the sale of its investment portfolio, a significant portion of which is in the form of cash or short-term investments. All of these sources of liquidity are subject to market, regulatory or other factors that may impact the Company's liquidity position at any time. As discussed above, AGL's insurance subsidiaries are subject to regulatory and rating agency restrictions limiting their ability to declare and to pay dividends and make other payments to AGL. As further noted above, external financing may or may not be available to AGL or its subsidiaries in the future on satisfactory terms.
In addition, investment income at AGL and its subsidiaries may fluctuate based on interest rates, defaults by the issuers of the securities AGL or its subsidiaries hold in their respective investment portfolios, the performance of alternative investments, or other factors thatthe assets it manages as measured against market averages and the performance of the Company’s competitors. In addition, if the Company’s successful competitors charge lower fees for substantially similar products, the Company does not control. Also, the value of the Company's investments may be adversely affected by changes in interest rates, credit riskface pressure to lower fees to attract and capital market conditions and therefore may adversely affect theretain asset management clients.
Company's potential ability to sell investments quickly and the price which the Company might receive for those investments. Alternative investments may be particularly difficult to sell at adequate prices or at all.
Risks Related to the Company's Business
The Company's financial guaranty products may subject it to significant risks from individual or correlated credits.
The Company is exposed to the risk that issuers of debt that it insures or other counterparties may default in their financial obligations, whether as a result of insolvency, lack of liquidity, operational failure or other reasons. Similarly, the Company could be exposed to corporate credit risk if a corporation's securities are contained in a portfolio of collateralized debt obligations (CDOs) it insures, or if the corporation or financial institution is the originator or servicer of loans, mortgages or other assets backing structured securities that the Company has insured.
In addition, because the Company insures or reinsures municipal bonds, it can have significant exposures to single municipal risks; see Part II, Item 7, Management's Discussion and Analysis, Insured Portfolio, for a list of the Company's largest ten municipal risks by revenue source. While the Company's risk of a complete loss, where it would have to pay the entire principal amount of an issue of bonds and interest thereon with no recovery, is generally lower for municipal bonds than for corporate bonds as most municipal bonds are backed by tax or other revenues, there can be no assurance that a single default by a municipality would not have a material adverse effect on its results of operations or financial condition.
The Company's ultimate exposure to a single name may exceed its underwriting guidelines, and an event with respect to a single name may cause a significant loss. The Company seeks to reduce this risk by managing exposure to large single risks, as well as concentrations of correlated risks, through tracking its aggregate exposure to single names in its various lines of business and establishing underwriting criteria to manage risk aggregations. It has also in the past obtained third party reinsurance for such exposure. The Company may insure and has insured individual public finance and asset-backed risks well in excess of $1 billion. Should the Company's risk assessments prove inaccurate and should the applicable limits prove inadequate, the Company could be exposed to larger than anticipated losses, and could be required by the rating agencies to hold additional capital against insured exposures whether or not downgraded by the rating agencies.
The Company is exposed to correlation risk across the various assets the Company insures. During periods of strong macroeconomic performance, stress in an individual transaction generally occurs in a single asset class or for idiosyncratic reasons. During a broad economic downturn, a wider range of the Company's insured portfolio could be exposed to stress at the same time. This stress may manifest itself in ratings downgrades, which may require more capital, or in actual losses. In addition, while the Company has experienced catastrophic events in the past without material loss, unexpected catastrophic events may have a material adverse effect upon the Company's insured portfolio and/or its investment portfolios.
Some of the Company's directCompany’s asset management competitors are substantially larger and have considerably greater financial, guaranty products may be riskier than traditional financial guaranty insurance.
As of December 31, 2016technical and 2015, 6% and 7%, respectively, of the Company's financial guaranty direct exposures were executed as credit derivatives. Traditional financial guaranty insurance provides an unconditional and irrevocable guaranty that protects the holder of a municipal finance or structured finance obligation against non-payment of principal and interest, while credit derivatives provide protection from the occurrence of specified credit events, including non-payment of principal and interest. In general, the Company structures credit derivative transactions such that circumstances giving rise to its obligation to make payments are similar to that for financial guaranty policies and generally occur when issuers fail to make payments on the underlying reference obligations. The tenor of credit derivatives exposures, like exposure under financial guaranty insurance policies, is also generally for as long as the reference obligation remains outstanding.
Nonetheless, credit derivative transactions are governed by International Swaps and Derivatives Association, Inc. (ISDA) documentation and operate differently from financial guaranty insurance policies. For example, the Company's control rights with respect to a reference obligation under a credit derivative may be more limited than when it issues a financial guaranty insurance policy on a direct primary basis. In addition, a credit derivative may be terminated for a breach of the ISDA documentation or other specific events, unlike financial guaranty insurance policies. In addition, under a limited number of credit derivative contracts, the Company may be required to post eligible securities as collateral, generally cash or U.S. government or agency securities, under specified circumstances. The need to post collateral under manymarketing resources. Certain of these transactions is subject to capscompetitors periodically raise significant amounts of capital in investment strategies that the Company has negotiated with its counterparties, but there are some transactions as to which the Company could be required to post collateral without such a cap based on movements in the mark-to-market valuation of the underlying exposure in excess of contractual thresholds. See Part II, Item 8, Financial Statements and Supplementary Data, Note 8, Contracts Accounted for as Credit Derivatives, Rating Sensitivities of Credit Derivatives Contracts.
Further downgrades of one or more of the Company's reinsurers could reduce the Company's capital adequacy and return on equity. The impairment of other financial institutions also could adversely affect the Company.
At December 31, 2016, the Company had ceded approximately 4% of its principal amount of insurance outstanding to third party reinsurers. In evaluating the credits insuredpursued by the Company, securities rating agencies allowCompany. Some of these competitors also may have a lower cost of capital charge "credit" for reinsurance based on the reinsurers' ratings. In recent years, a number of the Company's reinsurers were downgraded by one or more rating agencies, resulting in decreases in the credit allowed for reinsurance and in the financial benefits of using reinsurance under existing rating agency capital adequacy models. Many of the Company's reinsurers have already been downgradedaccess to single-A or below by one or more rating agencies. The Company could be required to raise additional capital to replace the lost reinsurance credit in order to satisfy rating agency and regulatory capital adequacy and single risk requirements. The rating agencies' reduction in credit for reinsurance could also ultimately reduce the Company's return on equity to the extentfunding sources that ceding commissions paidare not available to the Company, by the reinsurers were not adequately increasedwhich may create further competitive disadvantages with
respect to compensate for the effect of any additional capital required.investment opportunities. In addition, downgraded reinsurers may default on amounts due to the Company and such reinsurer obligations may not be adequately collateralized, resulting in additional losses to the Company and a reduction in its shareholders' equity and net income.
The Company also has exposure to counterparties in various industries, including banks, hedge funds and other investment vehicles in its insured transactions. Manysome of these transactions expose the Companycompetitors may have higher risk tolerances or make different risk assessments, allowing them to credit risk in the event its counterparty fails to perform its obligations.consider a wider variety of investments and establish broader networks of business relationships.
Acquisitions may not result in the benefits anticipated and may subject the Company to non-monetary consequences.
From time to time the Company evaluates financial guaranty portfolio and company acquisition opportunities and conducts diligence activities with respect to transactions with other financial guarantors and financial services companies. For example, during 20152019 the Company acquired Radian Asset and in 2016BlueMountain Capital Management, LLC. Prior to that, the Company acquired CIFG,several legacy financial guaranty insurance companies and in each case merged it with and into AGC, with AGCfinancial guaranty portfolios. These acquisitions as the surviving companywell as any future acquisitions of the merger. In January 2017, the Company acquired MBIA UK. Acquiring other asset managers or asset management contracts or financial guaranty portfolios or companies or other financial services companies may involve some or all of the various risks commonly associated with acquisitions, including, among other things: (a) failure to adequately identify and value potential exposures and liabilities of the target portfolio or entity; (b) difficulty in estimating the value of the target portfolio or entity; (c) potential diversion of management’s time and attention; (d) exposure to asset quality issues of the target entity; and (e) difficulty and expense of integrating the operations, systems and personnel of the target entity.entity; and (f) concentration of exposures, including exposures which may exceed single risk limits, due to the addition of the target portfolio. Such acquisitions may also have unintended consequences on ratings assigned by the rating agencies to the Company or its insurance subsidiaries (see “- Risks Related to the Company’s Ratings”) or on the applicability of laws and regulations to the Company’s existing businesses. These or other factors may cause any past or future acquisitions of financial guaranty portfolios or companies or other financial services companies not to result in the benefits to the Company anticipated when the acquisition was agreed.
Past or future acquisitions may also subject the Company to non-monetary consequences that may or may not have been anticipated or fully mitigated at the time of the acquisition. For example,
The recent BlueMountain Acquisition may negatively impact the Company's relationships with its investors, regulators, rating agencies, employees or obligors it insures, or Assured Investment Management's business or its relationships with its clients and employees.
The BlueMountain Acquisition represents a significant step in November 2006, AGMH receivedthe Company's development of its asset management business and involves a subpoenasignificant investment by the Company. The Company discussed the BlueMountain Acquisition with its relevant regulators and with the rating agencies prior to closing and does not believe that the BlueMountain Acquisition has had a negative impact on its relationship with those regulators or the rating agencies. There can be no assurance, however, that the BlueMountain Acquisition will not in the future negatively impact the Company's relationships with its investors, regulators, rating agencies, employees or obligors it insures or its business or results of operations.
Assured Investment Management's ability to generate new business and to retain current clients is dependent on the performance of its clients' investments as well as its relationship with its clients. There can be no assurance that the BlueMountain Acquisition will not negatively impact Assured Investment Management's relationship with any investor or potential investor. Any such negative impact could prevent the Company from realizing the benefits it expects from the Antitrust DivisionBlueMountain Acquisition.
Assured Investment Management may present risks that could have a negative effect on the Company's business, results of operations or financial condition.
The expansion of the Department of Justice issued in connection with an ongoing criminal investigation of bid rigging of awards of municipal GICs and other municipal derivatives. AGMH responded to the subpoena and has had limited contact with the DOJ on the matter since late 2011. Although the subpoena related to AGMH's former Financial Products Business,Company’s asset management business line, which the Company did not acquire, it was issued to AGMH,believes is in line with its risk profile and benefits from its core competencies, may present new risks that could have a negative effect on the Company's business, results of operations or financial condition.
Now that the Company has established Assured Investment Management, the Company’s business, results of operations and financial condition may be impacted by some of the risks faced by asset managers. Asset management services are primarily a fee-based business, and the Company's asset management and performance fees are based on the amount of its AUM as well as the performance of those assets. Volatility or declines in the markets in which the Company did acquire.invests as an asset manager, or poor performance of its investments, may negatively affect its AUM and its asset management and performance fees and may deter future investment in the Company’s asset management products. The Company’s asset management business is also subject to legal, regulatory, compliance, accounting, valuation and political risks that differ from those involved in the Company’s business of providing credit protection products. In addition, the asset management business is an intensely competitive business, creating new competitive risks.
Alternative investments may not result in the benefits anticipated.
From time to time, and in order to deploy a portion of the Company's excess capital, the Company may invest in business opportunitiesalternative investments that complement the Company's financial guaranty business, are in line with its risk profile and benefit from its core competencies. The alternative investments group has been investigating a number of such opportunities, including, among others, both controllingcompetencies, and non-controlling investments in investment managers. For example, in February 2017 the Company agreedhas chosen to purchase upuse the knowledge base gained in the BlueMountain Acquisition to $100 millionincrease the amount of limited partnership interests in a fund thatthe excess capital it invests in the equity of private equity managers. The Company continues to investigate additional opportunities.alternative assets. Alternative investmentsassets may be riskier than many of the other investments the Company makes, and may not result in the benefits anticipated at the time of the investment. In addition, although the Company uses what it believes to be excess capital to make alternative investments, measures of required capital can fluctuate and such investments may not be given much, or any, value under the various rating agency, regulatory and internal capital models to which the Company is subject. Also, alternative investments may be less liquid than most of the Company's other investments and so may be difficult to convert to cash or investments that do receive credit under the capital models to which the Company is subject. See "Risks Related to the Company's Capital and Liquidity Requirements --“Operational Risks - The ability of AGL and its subsidiaries to meet their liquidity needs may be limited."”
A downgrade of the financial strength or financial enhancement ratings of any of the Company's insurance and reinsurance subsidiaries would adversely affect its business and prospects and, consequently, its results of operations and financial condition.
The financial strength and financial enhancement ratings assigned by S&P, Moody’s, KBRA and Best to each of the Company's insurance and reinsurance subsidiaries represent such rating agencies' opinions of the insurer's financial strength and ability to meet ongoing obligations to policyholders and cedants in accordance with the terms of the financial guaranties it has issued or the reinsurance agreements it has executed. Issuers, investors, underwriters, ceding companies and others consider the Company's financial strength or financial enhancement ratings an important factor when deciding whether or not to utilize a financial guaranty or purchase reinsurance from one of the Company's insurance or reinsurance subsidiaries. A downgrade by a rating agency of the financial strength or financial enhancement ratings of one or more of the Company's insurance subsidiaries could impair the Company's financial condition, results of operation, liquidity, business prospects or other aspects of the Company's business. The ratings assigned by the rating agencies to the Company's insurance subsidiaries are subject to review and may be lowered by a rating agency at any time and without notice to the Company.
The rating agencies have evaluated the Company’s insurance subsidiaries under a variety of scenarios and assumptions, and have changed their methodologies and criteria from time to time. Factors influencing the rating agencies are beyond management's control and not always known to the Company. In the event of an actual or perceived deterioration in creditworthiness of large risks in the Company’s insurance portfolio, or a change in a rating agency's capital model or rating methodology, a rating agency may require the Company to increase the amount of capital it holds to maintain its financial strength ratings under the rating agencies' capital adequacy models, which may require the Company to seek additional capital, or a rating agency may identify an issue that additional capital would not address. The amount of such capital required may be substantial, and may not be available to the Company on favorable terms and conditions or at all. The failure to raise additional required capital, or successfully address another issue or issues raised by a rating agency, could result in a downgrade of the ratings of the Company’s insurance subsidiaries and thus have an adverse impact on its business, results of operations and financial condition.
The Company periodically assesses the value of each rating assigned to each of its subsidiaries, and may as a result of such assessment request that a rating agency add or drop a rating from certain of its subsidiaries. Rating agencies may choose not to honor the Company’s request, and continue to rate a subsidiary after the Company’s request to drop the rating, as Moody’s did with respect to AGC.
The insurance subsidiaries' financial strength ratings are an important competitive factor in the financial guaranty insurance and reinsurance markets. If the financial strength or financial enhancement ratings of one or more of the Company's insurance subsidiaries were reduced below current levels, the Company expects that would reduce the number of transactions that would benefit from the Company's insurance; consequently, a downgrade by rating agencies could harm the Company's new business production, results of operations and financial condition.
In addition, a downgrade may have a negative impact on the Company’s insurance subsidiaries in respect of transactions that they have insured or reinsurance that they have assumed. For example, under interest rate swaps insured by AGM, downgrades past specified rating levels could entitle the municipal obligor's swap counterparty to terminate the swap; if the municipal obligor owed a termination payment as a result and were unable to make such payment, AGM may receive a claim if its financial guaranty guaranteed such termination payment. In certain other transactions, beneficiaries of financial guaranties issued by the Company's insurance subsidiaries may have the right to cancel the credit protection provided by them, which would result in the loss of future premium earnings and the reversal of any fair value gains recorded by the Company. In
addition, a downgrade of AG Re, AGC or AGRO could result in certain ceding companies recapturing business that they had ceded to these reinsurers.
Operational Risks
The Company's financial position, results of operations and cash flows may be adversely affected by fluctuations in foreign exchange rates.
The Company's reporting currency is the U.S. dollar. The functional currencies of the Company’s primary insurance and reinsurance subsidiaries are the U.S. dollar. The Company's non-U.S. subsidiaries maintain both assets and liabilities in currencies different from their functional currency, which exposes the Company to changes in currency exchange rates. In addition, assets of non-U.S. subsidiaries are primarily invested in local currencies in order to satisfy regulatory requirements and to support local insurance operations regardless of currency fluctuations.
The principal currencies creating foreign exchange risk are the pound sterling and the Euro. The Company cannot accurately predict the nature or extent of future exchange rate variability between these currencies or relative to the U.S. dollar. Foreign exchange rates are sensitive to factors beyond the Company's control.
The Company does not engage in active management, or hedging, of its foreign exchange rate risk. Therefore, fluctuation in exchange rates between the U.S. dollar and the British pound sterling or the EU euro could adversely impact the Company's financial position, results of operations and cash flows. See Part II, Item 7A, Quantitative and Qualitative Disclosures About Market Risk, Sensitivity to Foreign Exchange Risk.
The Company may be adversely impacted by the transition from LIBOR as a reference rate.
In 2017, the U.K.’s FCA announced that after 2021 it would no longer compel banks to submit the rates required to calculate LIBOR. This announcement indicates that the continuation of LIBOR on the current basis cannot and will not be guaranteed after 2021. Consequently, at this time, it is not possible to predict whether and to what extent banks will continue to provide submissions for the calculation of LIBOR. While regulators have suggested substitute rates, including the Secured Overnight Financing Rate, the impact of the discontinuance of LIBOR, if it occurs, will be contract-specific. The Company has exposure to LIBOR in three areas of its operations: (i) issuers of obligations the Company insures have obligations, assets and hedges that reference LIBOR, and some of the obligations the Company insures reference LIBOR, (ii) debt issued by the Company's wholly owned subsidiaries AGUS and AGMH currently pay, or will convert to, a floating interest rate tied to LIBOR, and (iii) committed capital securities (CCS) from which the Company benefits that also pay interest tied to LIBOR. See Part II, Item 8, Financial Statements and Supplementary Data, Note 15, Long-Term Debt and Credit Facilities.
The Company has reviewed its insured portfolio to identify insured transactions that it believes may be vulnerable to the transition from LIBOR, as well as relevant language in the documents relating to the debt issued by the Company and the CCS that benefit the Company. See Part II, Item 7, Management's Discussion and Analysis, Executive Summary “-- Other Events -- LIBOR Sunset”. Under their current documents, a significant portion of these securities are likely to become fixed rate in December 2021, the initial benefit or harm of the sunset of LIBOR depends on the level of interest rates at such time. Also, whatever interest rate is set by the party responsible for calculating the interest rate may be challenged in the court by other parties in interest. Given the lack of clarity on decisions that parties responsible for calculating interest rates will make and the reaction of impacted parties, as well as the unknown level of interest rates when the change occurs, the Company cannot at this time predict the impact of the transition from LIBOR, if it occurs, on every obligor and obligation the Company enhances or on its own debt issuances.
The Company's international operations expose it to less predictable political, credit and legal risks.
The Company pursues new business opportunities in international markets. The underwriting of obligations of an issuer in a foreign country involves the same process as that for a domestic issuer, but additional risks must be addressed, such as the evaluation of foreign currency exchange rates, foreign business and legal issues, and the economic and political environment of the foreign country or countries in which an issuer does business. Changes in such factors could impede the Company's ability to insure, or increase the risk of loss from insuring, obligations in the countries in which it currently does business and limit its ability to pursue business opportunities in other countries.
The Company is dependent on key executives and the loss of any of these executives, or its inability to retain other key personnel, could adversely affect its business.
The Company's success substantially depends upon its ability to attract and retain qualified employees and upon the ability of its senior management and other key employees to implement its business strategy. The Company believes there are only a limited number of available qualified executives in the insurance business lines in which the Company competes.competes, and that there is strong competition for qualified asset management executives. The Company relies substantially upon the services of Dominic J. Frederico, President and Chief Executive Officer, and other executives. Although the Company has designed its executive compensation with the goal of retaining and creating incentives for its executive officers, the Company may not be successful in retaining their services. The loss of the services of any of these individuals or other key members of the Company's management team could adversely affect the implementation of its business strategy.
The Company’s success in asset management will depend in part upon the ability of the Company to attract, motivate and retain key management personnel and other key employees, including key investment professionals. Uncertainties associated with the integration of BlueMountain may result in the departure of management personnel and other key employees, including key investment professionals, at the Company, and the Company may have difficulty attracting and motivating management personnel and other key employees, including key investment professionals, to the same extent it did prior to the BlueMountain Acquisition.
The Company is dependent on its information technology and that of certain third parties, and a cyber-attack,cyberattack, security breach or failure in such systems could adversely affect the Company’s business.
The Company relies upon information technology and systems, including technology and systems provided by or interfacing with those of third parties, to support a variety of its business processes and activities. In addition, the Company has collected and stored confidential information including personally identifiable information in connection with certain loss mitigation and due diligence activities related to its structured finance business, personally identifiable information.and asset management businesses, along with information regarding employees and directors and asset management clients, among others. Information technology security threats and events are reportedly increasing in frequency and sophistication. While the Company does not believe that the financial guaranty industry isinsurance or alternative asset management industries are as inherently prone to cyber-attackscyberattacks as industries relating to, for example, payment card processing, banking, retail investment advisors, critical infrastructure or defense contracting, the Company’s data systems and those of third parties on which it relies are still vulnerable to security breaches due to cyber-attacks,cyberattacks, viruses, malware, ransomware, hackers and other external hazards, as well as inadvertent errors, equipment and system failures, and employee misconduct. Problems in or security breaches of these systems could, for example, result in lost business, reputational harm, the disclosure or misuse of confidential or proprietary information, incorrect reporting, inaccurate loss projections, legal costs and regulatory penalties. penalties, including under the EU's General Data Protection Regulation, the California Consumer Privacy Act and similar laws and regulations.
The Company’s business operations rely on the continuous availability of its computer systems as well as those of certain third parties. In addition to disruptions caused by cyber-attackscyberattacks or other data breaches, such systems may be adversely affected by natural and man-made catastrophes. The Company’s failure to maintain business continuity in the wake of such events, particularly if there were an interruption for an extended period, could prevent the timely completion of critical processes across its operations, including, for example, claims processing, treasury and investment operations and payroll. These failures could result in additional costs, loss of business, fines and litigation.
The Company and its subsidiaries are subject to numerous laws and regulations of a number of jurisdictions regarding its information systems, particularly with regard to personally identifiable information. The Company's failure to comply with these requirements, even absent a security breach, could result in penalties, reputational harm or difficulty in obtaining desired consents from regulatory authorities.
Risks Related to GAAPThe Board oversees the risk management process, including cybersecurity risks, and Applicable Law
Changes in the fair valueengages with management on risk management issues, including cybersecurity issues. The Audit Committee of the Company's insured credit derivatives portfolioBoard of Directors has specific responsibility for overseeing information technology matters, including cybersecurity risk, and the Risk Oversight Committee of the Board of Directors addresses cybersecurity matters as part of its enterprise risk management responsibilities.
Errors in, overreliance on or misuse of models may subject net income to volatility.result in financial loss, reputational harm or adverse regulatory action.
The Company is requireduses models for numerous purposes in its business. For example, it uses models to mark-to-market certain derivatives that it insures, including CDS that are considered derivativesproject future cash flows associated with pricing models, calculating reserves, evaluating risks in its insurance and investment portfolios, valuing assets and projecting liquidity needs. It also uses models to determine and project capital requirements under GAAP. Although there is no cash flow effect from this "marking-to-market," net changes inits own risk model as
well as under regulatory and rating agency requirements. While the fair value ofCompany has a model validation function and has adopted procedures to protect its models, the derivative are reported in the Company's consolidated statements of operations and therefore affect its reported earnings. Asmodels may not operate properly (including as a result of such treatment,errors or damage) and givenmay rely on assumptions that are inherently uncertain and in hindsight are incorrect.
Significant claim payments may reduce the large principal balanceCompany's liquidity.
Claim payments reduce the Company's invested assets and result in reduced liquidity and net investment income, even if the Company is reimbursed in full over time and does not experience ultimate loss on a particular policy. In the years after the financial crisis in 2008, many of the Company's CDS portfolio, small changes in the market pricing for insurance of CDS will generally result inclaims paid by the Company recognizingwere with respect to insured U.S. RMBS securities. More recently, there has been credit deterioration with respect to certain insured Puerto Rico exposures, and the Company has been paying material gains or losses,claims with material market price increases generally resulting in large reported losses under GAAP. Accordingly,respect to a number of those exposures since 2016. The Company had net par outstanding to general obligation bonds of the Company's GAAP earnings will be more volatile than would be suggested by the actual performanceCommonwealth of Puerto Rico and various obligations of its business operationsrelated authorities and insured portfolio.
The fair valuepublic corporations aggregating $4.3 billion and $4.8 billion, respectively, as of a credit derivative will be affected by any event causing changes inDecember 31, 2019 and December 31, 2018, all of which was rated BIG under the credit spread (i.e., the difference in interest rates between comparable securities having different credit risk) on an underlying security referenced in the credit derivative. Common events that may cause credit spreads on an underlying municipal or corporate security referenced inCompany’s rating methodology. For a credit derivative to fluctuate include changes in the state of national or regional economic conditions, industry cyclicality, changes to a company's competitive position within an industry, management changes, changes in the ratings of the underlying security, movements in interest rates, default or failure to pay interest, or any other factor leading investors to revise expectations about the issuer's ability to pay principal and interest on its debt obligations. Similarly, common events that may cause credit spreads on an underlying structured security referenced in a credit derivative to fluctuate may include the occurrence and severity of collateral defaults, changes in demographic trends and their impact on the levels of credit
enhancement, rating changes, changes in interest rates or prepayment speeds, or any other factor leading investors to revise expectations about the risk of the collateral or the ability of the servicer to collect payments on the underlying assets sufficient to pay principal and interest. The fair value of credit derivative contracts also reflects the change in the Company's own credit cost, based on the price to purchase credit protection on AGC and AGM. For discussion of the Company's fair value methodology for credit derivatives,Puerto Rico risks, see Part II, Item 8, Financial Statements and Supplementary Data, Note 7, Fair Value Measurement.5, Outstanding Insurance Exposure.
The Company plans for future claim payments. If a credit derivativethe amount of future claim payments is held to maturity and no credit loss is incurred, any unrealized gains or losses previously reported would be offset as the transactions reach maturity. Due to the complexity of fair value accounting and the application of GAAP requirements, future amendments or interpretations of relevant accounting standards may causesignificantly more than that projected by the Company, to modify its accounting methodology in a manner which may have an adverse impact on its financial results.
Change in industry and other accounting practices could impair the Company's reported financial results and impede its ability to do business.
Changes in or the issuance of new accounting standards, as well as any changes in the interpretation of current accounting guidance, may have an adverse effect on the Company's reported financial results, including future revenues, and may influence the types and/or volume of business that management may choose to pursue.
Changes in or inability to comply with applicable law could adversely affect the Company's ability to do business.make other claim payments and its financial condition, financial strength ratings and business prospects could be adversely affected.
The Company’s businesses are subjectCompany may require additional capital from time to directtime, including from soft capital and indirect regulation under state insurance laws, federal securities, commoditiesliquidity credit facilities, which may not be available or may be available only on unfavorable terms.
The Company's capital requirements depend on many factors, primarily related to its in-force book of business and tax laws affecting public financerating agency capital requirements. Failure to raise additional capital if and asset backed obligations,as needed may result in the Company being unable to write new business and federal regulationmay result in the ratings of derivatives,the Company and its subsidiaries being downgraded by one or more rating agency. The Company's access to external sources of financing, as well as applicable lawsthe cost of such financing, is dependent on various factors, including the market supply of such financing, the Company's long-term debt ratings and insurance financial strength ratings and the perceptions of its financial strength and the financial strength of its insurance subsidiaries. The Company's debt ratings are in turn influenced by numerous factors, such as financial leverage, balance sheet strength, capital structure and earnings trends. If the other countries in whichCompany's need for capital arises because of significant losses, the occurrence of these losses may make it more difficult for the Company operates. to raise the necessary capital.
Future legislative, regulatory, judicialcapital raises for equity or other legal changesequity-linked securities could also result in dilution to the jurisdictions in whichCompany's shareholders. In addition, some securities that the Company does businesscould issue, such as preferred stock or securities issued by the Company's operating subsidiaries, may adverselyhave rights, preferences and privileges that are senior to those of its common shares.
Financial guaranty insurers and reinsurers typically rely on providers of lines of credit, excess of loss reinsurance facilities and similar capital support mechanisms (often referred to as "soft capital") to supplement their existing capital base, or "hard capital." The ratings of soft capital providers directly affect its ability to pursue its current mix of business, thereby materially impacting its financial results by, among other things, limiting the types of risks it may insure, lowering applicable single or aggregate risk limits, increasing required reserves or capital, increasing the level of supervision or regulation tocapital credit which the Company’s operationsrating agencies give the Company when evaluating its financial strength. The Company currently maintains soft capital facilities with providers having ratings adequate to provide the Company's desired capital credit. For example, the Company cedes modest amounts of insurance to certain third-party reinsurers. See Part II, Item 8, Financial Statements and Supplementary Data, Note 8, Reinsurance. In addition, the Company benefits from $400 million of CCS. See Part II, Item 8, Financial Statements and Supplementary Data, Note 15, Long-Term Debt and Credit Facilities. No assurance can be given that one or more of the rating agencies will not downgrade or withdraw the applicable ratings of the Company's reinsurers in the future. Furthermore, the rating agencies may be subject, imposing restrictions that makein the future change their methodology and no longer give credit for soft capital, which may necessitate the Company having to raise additional capital in order to maintain its ratings.
An increase in the Company’s products less attractive to potential buyers, lowering the profitability ofinsurance subsidiaries' leverage ratio may prevent them from writing new insurance.
Insurance regulatory authorities impose capital requirements on the Company’s business activities, requiringinsurance subsidiaries. These capital requirements, which include leverage ratios and surplus requirements, may limit the Company to change certain of its business practices and exposing it to additional costs (including increased compliance costs).
If the Company fails to comply with applicable insurance laws and regulations it could be exposed to fines, the lossamount of insurance licenses, limitations onthat the rightsubsidiaries may write. The insurance subsidiaries have several alternatives available to originate new business and restrictions on its ability to pay dividends, all of which could have an adverse impact on its business results and prospects. If an insurance company’s surplus declines below minimum required levels, the insurance regulator could impose additional restrictions on the insurer or initiate insolvency proceedings. AGM, AGC and MAC may increase surplus by various means,control their leverage ratios, including obtaining capital contributions from the Company,affiliates, purchasing reinsurance or entering into other loss mitigation arrangements,agreements, or reducing the amount of new business written or obtaining regulatory approval to release contingency reserves. From time to time, AGM, MAC and AGC have obtained approval from their regulators to release contingency reserves based on losses and,written. However, a material reduction in the casestatutory capital and surplus of AGM and MAC, also basedan insurance subsidiary, whether resulting from underwriting or investment losses, a change in regulatory capital requirements or another event, or a disproportionate increase in the amount of risk in force, could increase a subsidiary's leverage ratio. This in turn could require that subsidiary to obtain reinsurance for existing business (which may not be available, or may be available on terms that the expiration of their insured exposure.
AGL'sCompany considers unfavorable), or add to its capital base to maintain its financial strength ratings. Failure to maintain regulatory capital levels could limit that subsidiary's ability to write new business.
The Company's holding companies' ability to meet their obligations may be constrained.
Each of AGL, AGUS and AGMH is a holding company and, as such, has no direct operations of its own. None of the holding companies expects to have any significant operations or assets other than its ownership of the shares of its subsidiaries. The Company expects that dividends from the insurance companies will be the primary source of funds for AGL, AGUS and AGMH while it is building its asset management business.
The insurance subsidiaries’ ability to pay dividends may be constrained by certain insurance regulatoryand make other payments depends, among other things, upon their financial condition, results of operations, cash requirements, and restrictions.
AGLcompliance with rating agency requirements, and is also subject to Bermuda regulatory requirements that affect its ability to pay dividends on common shares and to make other payments. Under the Bermuda Companies Act 1981, as amended, AGL may declare or pay a dividend only if it has reasonable grounds for believing that it is, and after the payment would be, able to pay its liabilities as they become due, and if the realizable value of its assets would not be less than its liabilities. While AGL currently intends to pay dividends on its common shares, investors who require dividend income should carefully consider these risks before investingrestrictions contained in AGL. In addition, if, pursuant to the insurance laws and related regulations of their states of domicile. Restrictions applicable to AGM, AGC and MAC, and to AG Re and AGRO, are described under the sections of Item 1. Business "-- Regulation, United States, State Dividend Limitations" and "-- Regulation, Bermuda, MarylandRestrictions on Dividends and New York, AGL'sDistributions." Such dividends and permitted payments are currently expected to be the primary source of funds for the holding companies to meet ongoing cash requirements, including operating expenses, any future debt service payments and other expenses, and to pay dividends to their respective shareholders. Accordingly, if the insurance subsidiaries cannot pay sufficient dividends to AGLor make other permitted payments at the times or in the amounts that it requires, itare required, that would have an adverse effect on AGL'sthe ability of AGL, AGUS and AGMH to satisfy their ongoing cash requirements and on their ability to pay dividends to shareholders. See "Risks Related
If AGRO were to the Company's Capitalpay dividends to its U.S. holding company parent and Liquidity Requirements—that U.S. holding company were to pay dividends to its Bermudian parent AG Re, such dividends would be subject to U.S. withholding tax at a rate of 30%.
The ability of AGL and its subsidiaries to meet their liquidity needs may be limited."
Each of AGL, AGUS and AGMH requires liquidity, either in the form of cash or in the ability to easily sell investment assets for cash, in order to meet its payment obligations, including, without limitation, its operating expenses, interest on debt and dividends on common shares, and to make capital investments in operating subsidiaries. The Company's operating subsidiaries require substantial liquidity in order to meet their respective payment and/or collateral posting obligations, including under financial guaranty insurance policies or reinsurance agreements. They also require liquidity to pay operating expenses, reinsurance premiums, dividends to AGUS or AGMH for debt service and dividends to AGL, as well as, where appropriate, to make capital investments in their own subsidiaries. In addition, the Company may require substantial liquidity to fund any future acquisitions. The Company cannot give any assurance that the liquidity of AGL and its subsidiaries will not be adversely affected by adverse market conditions, changes in insurance regulatory law or changes in general economic conditions.
Applicable insurance laws may
AGL anticipates that its liquidity needs will be met by the ability of its operating subsidiaries to pay dividends or to make it difficult to effect a changeother payments; external financings; investment income from its invested assets; and current cash and short-term investments. The Company expects that its subsidiaries' need for liquidity will be met by the operating cash flows of control of AGL.
Before a person can acquire control of a U.S. or U.K. insurance company, prior written approval must be obtainedsuch subsidiaries; external financings; investment income from their invested assets; and proceeds derived from the sale of their investment portfolios, significant portions of which are in the form of cash or short-term investments. All of these sources of liquidity are subject to market, regulatory or other factors that may impact the Company's liquidity position at any time. As discussed above, AGL's insurance commissionersubsidiaries are subject to regulatory and rating agency restrictions limiting their ability to declare and to pay dividends and make other payments to AGL. As further noted above, external financing may or may not be available to AGL or its subsidiaries in the future on satisfactory terms.
In addition, investment income at AGL and its subsidiaries may fluctuate based on interest rates, defaults by the issuers of the statesecurities AGL or country whereits subsidiaries hold in their respective investment portfolios, the insurer is domiciled. Because a person acquiring 10%performance of alternative investments, or more of AGL's common shares would indirectly controlother factors that the same percentageCompany does not control. Also, the value of the stock of its U.S. insurance company subsidiaries, the insurance change of control laws of Maryland, New YorkCompany's investments may be adversely affected by changes in interest rates, credit risk and the U.K. would likely apply to such a transaction. These laws may discourage potential acquisition proposalscapital market conditions and may delay, deter or prevent a change of control of AGL, including through transactions, and in particular unsolicited transactions, that some or all of its shareholders might consider to be desirable. While AGL's Bye-Laws limit the voting power of any shareholder to less than 10%, we cannot assure you that the applicable regulatory body would agree that a shareholder who owned 10% or more of its common shares did not control the applicable insurance company subsidiary, notwithstanding the limitation on the voting power of such shares.
Changes in applicable laws and regulations resulting from Brexittherefore may adversely affect the Company.Company's potential ability to sell investments quickly and the price which the Company might receive for those investments. Part of the Company’s investment strategy is to invest more of its excess capital in alternative investments, which may be particularly difficult to sell at adequate prices or at all.
Brexit could lead to legal uncertainty and politically divergent national laws and regulations as the U.K. determines which EU laws to replace or replicate. Depending on the terms of Brexit, AGE may lose the ability to insure new transactions from London in non-U.K. EU and EEA countries without obtaining additional licenses, which may require a presence in another EU country. Brexit-related changes in laws and regulations may also adversely affect the Company’s surveillance and loss mitigation activities with respect to existing insured transactions in non-U.K. EU and EEA countries, especially to the extent Brexit inhibits the issuance of new guaranties in distressed situations. Brexit may also impact laws, rules and regulations applicable to U.K. entities with obligations insured by the Company and could adversely impact the ability of non-U.K. EU or EEA citizens to continue to be employed at AGE in London.
Risks Related to Taxation
Changes in U.S. tax laws could reduce the demand or profitability of financial guaranty insurance, or negatively impact the Company's investment portfolio.
Press reports indicateThe Tax Act included provisions that could result in a reduction of supply, such as the U.S. Congress is considering making major changes to the Internal Revenue Code in 2017.termination of advance refunding bonds. Any material change in the U.S. tax treatment of municipal securities, the imposition of a national sales tax or a flat tax in lieu of the current federal income tax structure in the U.S., or changes in the treatment of dividends, could adversely affect the market for municipal obligations and, consequently, reduce the demand for financial guaranty insurance and reinsurance of such obligations. Limiting or eliminating the Federal income tax exclusion for municipal bond interest would increase the cost of borrowing for state and local governments, and as a result, could cause a decrease in infrastructure spending by states and municipalities. Municipalities may issue a lower volume of bonds, and in particular may be less likely to refund existing debt, in which case,municipal obligations could impact the amount of bondssuch obligations that cancould benefit from insurance. The supply of municipal bonds in each of 2018 and 2019 was below that in 2017, possibly due at least in part to the impact of the Tax Act. In addition, the reduction of the U.S. corporate income tax rate to 21% could make municipal obligations less attractive to certain institutional investors such as banks and property and casualty insurance might also be reduced.companies, resulting in lower demand for municipal obligations.
ChangesFurther, future changes in U.S. federal, state or local laws that materially adversely affect the tax treatment of municipal securities or the market for those securities, or other changes negatively affecting the municipal securities market, may lower volume and demand for municipal obligations and also may adversely impact the Company's investment portfolio, a significant portion of which is invested in tax-exempt instruments. These adverse changes may adversely affect the value of the Company's tax-exempt portfolio, or its liquidity.
Certain of the Company's foreignnon-U.S. subsidiaries may be subject to U.S. tax.
The Company manages its business so that AGL and its foreignnon-U.S. subsidiaries (other than AGRO and AGE)AGRO) operate in such a manner that none of them should be subject to U.S. federal tax (other than U.S. excise tax on insurance and reinsurance premium income attributable to insuring or reinsuring U.S. risks, and U.S. withholding tax on certain U.S. source investment income). However, because there is considerable uncertainty as to the activities which constitute being engaged in a trade or business within the U.S., the Company cannot be certain that the IRS will not contend successfully that AGL or any of its foreignnon-U.S. subsidiaries (other than AGRO and AGE)AGRO) is/are engaged in a trade or business in the U.S. If AGL and its foreignnon-U.S. subsidiaries (other than AGRO and AGE)AGRO) were considered to be engaged in a trade or business in the U.S., each such company could be subject to U.S. corporate income and branch profits taxes on the portion of its earnings effectively connected to such U.S. business.
AGL, AG Re and AGRO may become subject to taxes in Bermuda after March 2035, which may have a material adverse effect on the Company's results of operations and on an investment in the Company.
The Bermuda Minister of Finance, under Bermuda's Exempted Undertakings Tax Protection Act 1966, as amended, has given AGL, AG Re and AGRO an assurance that if any legislation is enacted in Bermuda that would impose tax computed
on profits or income, or computed on any capital asset, gain or appreciation, or any tax in the nature of estate duty or inheritance tax, then subject to certain limitations the imposition of any such tax will not be applicable to AGL, AG Re or AGRO, or any of AGL's or its subsidiaries' operations, shares, debentures or other obligations until March 31, 2035. Given the limited duration of the Minister of Finance's assurance, the Company cannot be certain that it will not be subject to Bermuda tax after March 31, 2035.
U.S. Persons who hold 10% or more of AGL's shares directly or through foreignnon-U.S. entities may be subject to taxation under the U.S. controlled foreign corporation rules.CFC.
Each 10% U.S. shareholder of a foreignnon-U.S. corporation that is a CFC for an uninterrupted period of 30 days or moreat any time during a taxable year and whothat owns shares in the foreignnon-U.S. corporation directly or indirectly through foreignnon-U.S. entities on the last day of the foreignnon-U.S. corporation's taxable year on which it is a CFC must include in its gross income for U.S. federal income tax purposes its pro rata share of the CFC's "subpart F income," even if the subpart F income is not distributed. In addition, upon a sale of shares of a CFC, 10% U.S. shareholders may be subject to U.S. federal income tax on a portion of their gain at ordinary income rates.
The Company believes that because of the dispersion of the share ownership in AGL, provisions in AGL's Bye-Laws that limit voting power, contractual limits on voting power and other factors, no U.S. Person who owns AGL's shares directly or indirectly through foreignnon-U.S. entities should be treated as a 10% U.S. shareholder of AGL or of any of its foreignnon-U.S. subsidiaries. It is possible, however, thatHowever, AGL’s shares may not be as widely dispersed as the IRS could challengeCompany believes due to, for example, the effectivenessapplication of these provisionscertain ownership attribution rules, and no assurance may be given that a court could sustain suchU.S. Person who owns the Company's shares will not be characterized as a challenge,10% U.S. shareholder, in which case such U.S. Person may be subject to taxation under U.S. taxCFC rules.
U.S. Persons who hold shares may be subject to U.S. income taxation at ordinary income rates on their proportionate share of the Company's related person insurance income.
If the following conditions are true, then a U.S. Person who owns AGL's shares (directly or indirectly through foreignnon-U.S. entities) on the last day of the taxable year would be required to include in its income for U.S. federal income tax purposes such person's pro rata share of the RPII of such Foreign Insurance Subsidiary (as defined below)above) for the entire taxable year, determined as if such RPII were distributed proportionately only to U.S. Persons at that date, regardless of whether such income is distributed:
the Company is 25% or more owned directly, indirectly through foreignnon-U.S. entities or by attribution by U.S. Persons;
the gross RPII of AG Re or any other AGL foreignnon-U.S. subsidiary engaged in the insurance business that has not made an election under section 953(d) of the Code to be treated as a U.S. corporation for all U.S. tax purposes or are CFCs owned directly or indirectly by AGUS (each, with AG Re, a Foreign Insurance Subsidiary) were to equalequals or exceedexceeds 20% of such Foreign Insurance Subsidiary's gross insurance income in any taxable year; and
direct or indirect insureds (and persons related to such insureds) own (or are treated as owning directly or indirectly through entities) 20% or more of the voting power or value of the Company's shares.
In addition, any RPII that is includible in the income of a U.S. tax-exempt organization may be treated as unrelated business taxable income.
The amount of RPII earned by a Foreign Insurance Subsidiary (generally, premium and related investment income from the direct or indirect insurance or reinsurance of any direct or indirect U.S. holder of shares or any person related to such holder) will depend on a number of factors, including the geographic distribution of a Foreign Insurance Subsidiary's business and the identity of persons directly or indirectly insured or reinsured by a Foreign Insurance Subsidiary. The Company believes that each of its Foreign Insurance Subsidiaries either should not in the foreseeable future have RPII income which equals or exceeds 20% of its gross insurance income or have direct or indirect insureds, as provided for by RPII rules, that directly or indirectly own 20% or more of either the voting power or value of AGL's shares. However, the Company cannot be certain that this will be the case because some of the factors which determine the extent of RPII may be beyond its control.
U.S. Persons who dispose of AGL's shares may be subject to U.S. income taxation at dividend tax rates on a portion of their gain, if any.
The meaning of the RPII provisions and the application thereof to AGL and its Foreign Insurance Subsidiaries is uncertain. The RPII rules in conjunction with section 1248 of the Code provide that if a U.S. Person disposes of shares in a foreignnon-U.S. insurance corporation in which U.S. Persons own (directly, indirectly, through foreignnon-U.S. entities or by attribution) 25% or more of the shares (even if the amount of gross RPII is less than 20% of the corporation's gross insurance income and the ownership of its shares by direct or indirect insureds and related persons is less than the 20% threshold), any gain from the disposition will generally be treated as dividend income to the extent of the holder's share of the corporation's undistributed earnings and profits that were accumulated during the period that the holder owned the shares. This provision applies whether or not such earnings and profits are attributable to RPII. In addition, such a holder will be required to comply with certain reporting requirements, regardless of the amount of shares owned by the holder.
In the case of AGL's shares, these RPII rules should not apply to dispositions of shares because AGL is not itself directly engaged in the insurance business. However, the RPII provisions have never been interpreted by the courts or the U.S. Treasury Department in final regulations, and regulations interpreting the RPII provisions of the Code exist only in proposed form. It is not certain whether these regulations will be adopted in their proposed form, what changes or clarifications might ultimately be made thereto, or whether any such changes, as well as any interpretation or application of the RPII rules by the IRS, the courts, or otherwise, might have retroactive effect. The U.S. Treasury Department has authority to impose, among other things, additional reporting requirements with respect to RPII.
U.S. Persons who hold common shares will be subject to adverse tax consequences if AGL is considered to be a "passive foreign investment company" for U.S. federal income tax purposes.
If AGL is considered a PFIC for U.S. federal income tax purposes, a U.S. Person who owns any shares of AGL will be subject to adverse tax consequences that could materially adversely affect its investment, including subjecting the investor to both a greater tax liability than might otherwise apply and an interest charge. The Company believes that AGL iswas not and currently does not expect AGL to become, a PFIC
for U.S. federal income tax purposes; however, there can be no assurance that AGL will not be deemed a PFIC by the IRS.
There are currently no final or temporary regulations regardingpurposes for taxable years through 2019 and, based on the application of certain PFIC look-through rules and the Company's plan of operations for the current and future years, should not be a PFIC provisionsin the future. However, as discussed above, the Tax Act limits the insurance income exception to a non-U.S. insurance company that is a qualifying insurance corporation that would be taxable as an insurance company. Thecompany if it were a U.S. corporation and maintains insurance liabilities of more than 25% of such company’s assets for a taxable year (or maintains insurance liabilities that at least equal to 10% of its assets and it satisfies a facts and circumstances test that requires a showing that the failure to exceed the 25% threshold is due to runoff-related or rating-related circumstances) (the Reserve Test).
In addition, the IRS recently issued proposed regulationsthe 2019 Proposed Regulations intended to clarify the application of the PFIC provisions to an insurance company. These proposed regulationscompany and provide guidance on a range of issues relating to PFICs including the application of the look-through rule, the treatment of income and assets of certain U.S. insurance subsidiaries for purposes of the look-through rule and extension of the look-through rule to 25% or more owned partnerships. The 2019 Proposed Regulations define insurance liabilities for purposes of the Reserve Test, tighten the Reserve Test and the statutory cap on insurance liabilities, and provide guidance on the runoff-related and rating-related circumstances for purposes of the 10% test. The 2019 Proposed Regulations provide that a non-U.S. insurance company may only qualify for an exception to the PFIC rules if, among other things, the non-U.S. insurance company’s officers and employees perform its substantial managerial and operational activities.activities (taking into account activities of officers and employees of certain related entities in certain cases). The 2019 Proposed Regulations also provide that an active conduct percentage test must be satisfied for the insurance company exception to apply, which test compares the expenses for services of officers and employees of the non-U.S. insurer and certain related entities incurred for the production of premium and certain investment income to all such expenses regardless of the service provider. The 2019 Proposed Regulations also introduce attribution rules that, taken together with other provisions of the regulations, could result in a U.S. person that directly owns any shares in a non-PFIC being treated as an indirect shareholder of a lower tier PFIC subject to the general PFIC rules described herein. This proposed regulation will not be effective unless and until adopted in final form. BecauseThe Company cannot predict the likelihood of the legal uncertainties relating to howfinalization of the proposed regulations or the scope, nature, or impact of the proposed regulations on it, should they be formally adopted or enacted or whether its Foreign Insurance subsidiaries will be interpretedable to satisfy the Reserve Test in future years, and the form in which such regulations or any legislative proposalinteraction of the PFIC look-through rules is not clear, no assurance may be finalized,given that the Company cannot predict what impact, if any, such guidance or legislation would have on an investor that is subject to U.S. federal income tax.will not be characterized as a PFIC.
Changes in U.S. federal income tax law could materially adversely affect an investment in AGL's common shares.
Legislation has been introduced inThe Tax Act was passed by the U.S. Congress and was signed into law on December 22, 2017, with certain provisions intended to eliminate certain perceived tax advantages of companies (including insurance companies) that have legal domiciles outside the U.S.United States but have certain U.S. connections.connections and United States persons investing in such companies. For example, legislation has been introducedthe Tax Act includes a BEAT that could make affiliate reinsurance between United States and non-U.S. members of the group economically unfeasible and a current tax on global intangible income that may result in Congressan increase in U.S. corporate income tax imposed on U.S. group members with respect to limitcertain earnings at their non-U.S. subsidiaries, and revises the deductibilityrules applicable to PFICs and CFCs. Although the Company is currently unable to predict the ultimate impact of reinsurance premiums paid by U.S. insurance companies to foreign affiliatesthe Tax Act on its business, shareholders and impose additional limits on deductibilityresults of interest of foreign owned U.S. corporations. Another legislative proposal would treat a foreign corporationoperations, it is possible that is primarily managed and controlled inthe Tax Act may increase the U.S. as a U.S. corporation for U.S federal income tax purposes. Further, legislation based on the Tax Reform Task-Force Blueprint dated June 24, 2016, which recommends moving to a cash flow consumption-based tax system and provides for border adjustments taxing imports, may be introduced and enacted and its impact on the insurance industry may adversely impact the results of our operations. Also, legislation has previously been introduced to override the reduction or eliminationliability of the U.S. withholding taxmembers of its group that cede risk to non-U.S. group members and may affect the timing and amount of U.S. federal income taxes imposed on certain U.S. source investment income under a tax treaty in the case of a deductible related party payment made by a U.S. member of a foreign controlled group to a foreign member of the group organized in a tax treaty country to the extent that the ultimate foreign parent corporation would not enjoy the treaty benefits with respect to such payments. Itshareholders. Furthermore, it is possible that this or similarother legislation could be introduced in and enacted by the current Congress or future Congresses that could have an adverse impact on the Company or the Company's shareholders.Company.
U.S. federal income tax laws and interpretations regarding whether a company is engaged in a trade or business within the U.S. is a PFIC, or whether U.S. Persons would be required to include in their gross income the "subpart F income" of a CFC or RPII are subject to change, possibly on a retroactive basis. There currently are only recently proposed regulations
regarding the application of the PFIC rules to insurance companies, and the regulations regarding RPII have been in proposed form since 1991. New regulations or pronouncements interpreting or clarifying such rules may be forthcoming. The Company cannot be certain if, when, or in what form such regulations or pronouncements may be implemented or made, or whether such guidance will have a retroactive effect.
Recharacterization by the Internal Revenue Service of the Company's U.S. federal tax treatment of losses on the Company's CDS portfolio can adversely affect the Company's financial position.
As part of the Company's financial guaranty business, the Company has sold credit protection by insuring CDS entered into with various financial institutions. Assured Guaranty's CDS portfolio has experienced significant cumulative fair value losses which are only deductible for U.S. federal income tax purposes upon realization and, consequently, generate a significant deferred tax asset based on the Company's intended treatment of such losses as ordinary insurance losses upon realization. The U.S. federal income tax treatment of CDS is an unsettled area of the tax law. As such, it is possible that the IRS may decide that the losses generated by the Company's CDS business should be characterized as capital rather than ordinary insurance losses, which could materially adversely affect the Company's financial condition.
An ownership change under Section 382 of the Code could have adverse U.S. federal tax consequences.
If AGL were to issue equity securities in the future, including in connection with any strategic transaction, or if previously issued securities of AGL were to be sold by the current holders, AGL may experience an "ownership change" within the meaning of Section 382 of the Code. In general terms, an ownership change would result from transactions increasing the aggregate ownership of certain stockholders in AGL's stock by more than 50 percentage points over a testing period (generally three years). If an ownership change occurred, the Company's ability to use certain tax attributes, including certain built-in losses, credits, deductions or tax basis and/or the Company's ability to continue to reflect the associated tax benefits as assets on AGL's balance sheet, may be limited. The Company cannot give any assurance that AGL will not undergo an ownership change at a time when these limitations could materially adversely affect the Company's financial condition.
AGMH likely experienced an ownership change under Section 382 of the Code.
In connection with the acquisition of AGMH, AGMH likely experienced an "ownership change" within the meaning of Section 382 of the Code. The Company has concluded that the Section 382 limitations as discussed in "An ownership change under Section 382 of the Code could have adverse U.S. federal tax consequences" are unlikely to have any material tax or accounting consequences. However, this conclusion is based on a variety of assumptions, including the Company's estimates regarding the amount and timing of certain deductions and future earnings, any of which could be incorrect. Accordingly, there can be no assurance that these limitations would not have an adverse effect on the Company's financial condition or that such adverse effects would not be material.
A change in AGL’s U.K. tax residence or its ability to otherwise qualify for the benefits of income tax treaties to which the U.K. is a party could adversely affect an investment in AGL’s common shares.
AGL is not incorporated in the U.K. and, accordingly, is only resident in the U.K. for U.K. tax purposes if it is “centrally managed and controlled” in the U.K. Central management and control constitutes the highest level of control of a company’s affairs. AGL believes it is entitled to take advantage of the benefits of income tax treaties to which the U.K. is a party on the basis that it is has established central management and control in the U.K. AGL has obtained confirmation that there is a low risk of challenge to its residency status from HMRC under the facts as they stand today. The Board intends to manage the affairs of AGL in such a way as to maintain its status as a company that is tax-resident in the U.K. for U.K. tax purposes and to qualify for the benefits of income tax treaties to which the U.K. is a party. However, the concept of central management and control is a case-law concept that is not comprehensively defined in U.K. statute. In addition, it is a question of fact. Moreover, tax treaties may be revised in a way that causes AGL to fail to qualify for benefits thereunder. Accordingly, a change in relevant U.K. tax law or in tax treaties to which the U.K. is a party, or in AGL’s central management and control as a factual matter, or other events, could adversely affect the ability of Assured Guaranty to manage its capital in the efficient manner that it contemplated in establishing U.K. tax residence.
Changes in U.K. tax law or in AGL’s ability to satisfy all the conditions for exemption from U.K. taxation on dividend income or capital gains in respect of its direct subsidiaries could affect an investment in AGL’s common shares.
As a U.K. tax resident, AGL is subject to U.K. corporation tax in respect of its worldwide profits (both income and capital gains), subject to applicable exemptions. The main rate of corporation tax is currently 20%19%.
With respect to income, the dividends that AGL receives from its subsidiaries should be exempt from U.K. corporation tax under the exemption contained in section 931D of the Corporation Tax Act 2009.
With respect to capital gains, if AGL were to dispose of shares in its direct subsidiaries or if it were deemed to have done so, it may realize a chargeable gain for U.K. tax purposes. Any tax charge would be based on AGL’s original acquisition cost. It is anticipated that any such future gain should qualify for exemption under the substantial shareholding exemption in Schedule 7AC to the Taxation of Chargeable Gains Act 1992. However, the availability of such exemption would depend on facts at the time of disposal, in particular the “trading” nature of the relevant subsidiary (and, in respect of disposal before April 1, 2017 only, the Assured Guaranty group).subsidiary. There is no statutory definition of what constitutes “trading” activities for this purpose and in practice reliance is placed on the published guidance of HMRC.
A change in U.K. tax law or its interpretation by HMRC, or any failure to meet all the qualifying conditions for relevant exemptions from U.K. corporation tax, could affect Assured Guaranty’s financial results of operations or its ability to provide returns to shareholders.
An adverse adjustment under U.K. legislation governing the taxation of U.K. tax resident holding companies on the profits of their non-U.K. subsidiaries could adversely impact Assured Guaranty's tax liability.
Under the U.K. "controlled foreign company" regime, the income profits of non-U.K. resident companies may, in certain circumstances, be attributed to controlling U.K. resident shareholders for U.K. corporation tax purposes. The non-U.K. resident members of the Assured Guaranty group intend to operate and manage their levels of capital in such a manner that their profits would not be taxed on AGL under the U.K. CFC regime. Assured Guaranty has obtained clearance from HMRC that none of the profits of the non-U.K. resident members of the Assured Guaranty group should be subject to U.K. tax as a result of attribution under the CFC regime on the facts as they currently stand. However, a change in the way in which Assured Guaranty operates or any further change in the CFC regime, resulting in an attribution to AGL of any of the income profits of and of AGL's non-U.K. resident subsidiaries for U.K. corporation tax purposes, could adversely affect Assured Guaranty's financial results of operations.
An adverse adjustment under U.K. transfer pricing legislation could adversely impact Assured Guaranty's tax liability.
If any arrangements between U.K. resident companies in the Assured Guaranty group and other members of the Assured Guaranty group (whether resident in or outside the U.K.) are found not to be on arm's length terms and as a result a U.K. tax advantage is being obtained, an adjustment will be required to compute U.K. taxable profits as if such arrangement were on arm's length terms. Any transfer pricing adjustment could adversely affect Assured Guaranty's financial results of operations.
Since January 1, 2016, the U.K. has implemented a country by country reporting (CBCR) regime whereby large multi-national enterprises are required to report details of their operations and intra-group transactions in each jurisdiction. The U.K. CBCR legislation includes power to introduce regulations requiring public disclosure of U.K. CBCR reports, although this power has not yet been exercised. It is possible that Assured Guaranty's approach to transfer pricing may become subject to greater scrutiny from the tax authorities in the jurisdictions in which the group operates in consequence of the implementation of a CBCR regime in the U.K. (or other jurisdictions).
Assured Guaranty's financial results may be affected by measures taken in response to the OECD BEPS project.
The Organization for Economic Co-operation and Development (OECD) published its final reports on Base Erosion and Profit Shifting (the BEPS Reports) in October 2015. The recommended actions include measures to address the abuse of double tax treaties, and an examinationupdating of the definition of a “permanent establishment” and the rules for attributing profit to a permanent establishment. There are also recommended actions relating to the goal of ensuring that transfer pricing outcomes are in line with value creation, noting that the current rules may facilitate the transfer of risks or capital away from countries where the economic activity takes place. In response to this, the U.K. Government has already made or proposed draftintroduced legislation to implement changes to transfer pricing, hybrid financial instruments and the deductibility of interest.interest and to impose country-by-country reporting obligations. The U.K. Government has also ratified the multilateral instrument, which was developed as a result of the BEPS Report, with regard to changes to the U.K. double tax treaties. Any further changes in U.K. tax law or changes in U.S. tax law in response to the BEPS Reports could adversely affect Assured Guaranty’s tax liability.
A new U.K. tax, the diverted profits tax (DPT), which is levied at 25%, came into effect from April 1, 2015, and, in substance, effectively anticipated some of the recommendations emerging from the BEPS Reports. This is an anti-avoidance measure, aimed at protecting the U.K. tax base against the diversion of profits away from the U.K. tax charge. In particular, DPT may apply to profits generated by economic activities carried out in the U.K., that are not taxed in the U.K. by reason of arrangements between companies in the same multinational group and involving a low-tax jurisdiction, including co-insurance and reinsurance. It is currently unclear whether DPT would constitute a creditable tax for U.S. foreign tax credit purposes. If any member of the Assured Guaranty group is liable to DPT, this could adversely affect the Company's results of operations.
AnIn May 2019, the OECD published a “Programme of Work” designed to address the tax challenges created by an increasingly digitalized economy. The Programme is divided into two pillars. The first pillar focuses on the allocation of group profits between jurisdictions based on a new nexus rule that looks to the jurisdiction of the customer or user (the so-called “market jurisdiction”) as a supplement to the traditional “permanent establishment” concept. The outline proposals are broadly drafted and it is not possible to determine at this time whether they will, when implemented, apply to the financial guarantee sector and, if so, whether they would have any material adverse adjustment under U.K. legislation governingimpact on the Company's operations and results. The second pillar addresses the remaining BEPS risk of profit shifting to entities in low jurisdictions by introducing a global minimum tax rate. Possible measures to implement such rate include the imposition of source-based taxation (including withholding tax) on certain payments to low tax jurisdictions and an effective extension of U.K.a “controlled foreign company” regime whereby parent companies would be subject to a “top-up” tax resident holding companies on the profits of all their foreign subsidiaries could adversely impact Assured Guaranty’sin low tax liability.
Underjurisdictions. Again, to date, the U.K. “controlled foreign company” regime, the income profits of non-U.K. resident companies may, in certain circumstances, be attributedoutlined proposals are broadly described and it is not possible to controlling U.K. resident shareholders for U.K. corporation tax purposes. The non-U.K. resident members of the Assured Guaranty group intend to operate and managedetermine their levels of capital in such a manner that their profits would not be taxed on AGL under the U.K. CFC regime. Assured Guaranty has obtained clearance from HMRC that none of the profits of the non-U.K. resident members of the Assured Guaranty group should be subject to U.K. tax as a result of attribution under the CFC regime on the facts as they currently stand. However, a change in the way in which Assured Guaranty operates or any further change in the CFC regime, resulting in an attribution to AGL of any of the income profits of any of AGL’s non-U.K. resident subsidiaries for U.K. corporation tax purposes,impact. They could adversely affect Assured Guaranty’s tax liability.
Risks Related to GAAP, Applicable Law and Litigation
Changes in the fair value of the Company's insured credit derivatives portfolio may subject net income to volatility.
The Company is required to mark-to-market certain derivatives that it insures, including CDS that are considered derivatives under GAAP. Although there is no cash flow effect from this "marking-to-market," net changes in the fair value of the derivative are reported in the Company's consolidated statements of operations and therefore affect its reported earnings. As a result of such treatment, and given the principal balance of the Company's CDS portfolio, small changes in the market pricing for insurance of CDS will generally result in the Company recognizing gains or losses, with material market price increases generally resulting in material reported losses under GAAP. Accordingly, the Company's GAAP earnings will be more volatile than would be suggested by the actual performance of its business operations and insured portfolio.
The fair value of a credit derivative will be affected by any event causing changes in the credit spread (i.e., the difference in interest rates between comparable securities having different credit risk) on an underlying security referenced in the credit derivative. Common events that may cause credit spreads on an underlying public finance or structured finance security referenced in a credit derivative to fluctuate include changes in the state of national or regional economic conditions, industry cyclicality, changes to a company's competitive position within an industry, management changes, changes in the ratings of the underlying security, movements in interest rates, default or failure to pay interest, or any other factor leading investors to revise expectations about the underlying issuer's ability to pay principal and interest on its debt obligations. Similarly, common events that may cause credit spreads on an underlying structured security referenced in a credit derivative to fluctuate may include the occurrence and severity of collateral defaults, changes in demographic trends and their impact on the levels of credit enhancement, rating changes, changes in interest rates or prepayment speeds, or any other factor leading investors to revise expectations about the risk of the collateral or the ability of the servicer to collect payments on the underlying assets sufficient to pay principal and interest. The fair value of credit derivative contracts also reflects the change in the Company's own credit cost, based on the price to purchase credit protection on AGC. For discussion of the Company's fair value methodology for credit derivatives, see Part II, Item 8, Financial Statements and Supplementary Data, Note 9, Fair Value Measurement.
If a credit derivative is held to maturity and no credit loss is incurred, any unrealized gains or losses previously reported would be reversed as the transactions reach maturity. Due to the complexity of fair value accounting and the application of GAAP requirements, future amendments or interpretations of relevant accounting standards may cause the Company to modify its accounting methodology in a manner which may have an adverse impact on its financial results.
Changes in the fair value of financial guaranty variable interest entities or the funds it both manages and invests in and certain CLOs it manages, or the Company’s decision to consolidate or deconsolidate one or more entities during a financial reporting period, may subject the Company’s assets and liabilities to volatility.
The Company is required to consolidate VIEs with respect to which it has provided financial guaranties (FG VIE) if it concludes that it is the primary beneficiary of that FG VIE. The effects of consolidating FG VIEs includes (i) changes in fair value gains (losses) on FG VIEs’ assets and liabilities, (ii) the elimination of premiums and losses related to the AGC and AGM FG VIEs’ liabilities with recourse and (iii) the elimination of investment balances related to the Company’s purchase of AGC and AGM insured FG VIEs’ debt. Upon consolidation of a FG VIE, the related insurance and, if applicable, the related investment balances, are considered intercompany transactions and therefore eliminated. The Company continuously evaluates its power to direct the activities that most significantly impact the economic performance of FG VIEs and, accordingly, where the Company is obligated to absorb FG VIE losses or receive benefits that could potentially be significant to the FG VIE. The Company is deemed to be the control party for certain FG VIEs under GAAP, typically when its protective rights give it the power to both terminate and replace the deal servicer, which are characteristics specific to the Company's financial guaranty contracts. If the protective rights that could make the Company the control party have not been triggered, then the FG VIE is not consolidated. If the Company is deemed no longer to have those protective rights, the FG VIE is deconsolidated. See Part II, Item 8, Financial Statements and Supplementary Data, Note 14, Variable Interest Entities.
The Company is also required to consolidate VIEs with respect to funds which it both manages and invests in (AM VIE) and certain CLOs it manages (CLO VIE) if it concludes that it is the primary beneficiary of the VIE. The effects of consolidating AM VIEs and CLO VIEs includes (i) changes in fair value gains (losses) on consolidated investments’ assets and liabilities, (ii) the elimination of intercompany investments and debt between CLO VIEs and underlying CLOs, (iii) the elimination of investment balances related to the insurance subsidiaries’ purchase of AM VIEs, and (iv) the recording of noncontrolling interests representing the portion of such AM VIEs that are not owned by the Company’s insurance subsidiaries. The Company continuously evaluates its power to direct the activities that most significantly impact the economic performance of AM VIEs and CLO VIEs, which is typically the management of their assets. The Company is deemed to be the control party
for certain VIEs under GAAP, typically when it both manages the investment vehicle or fund, and has a significant investment in such vehicle or fund. See Part II, Item 8, Financial Statements and Supplementary Data, Note 14, Variable Interest Entities.
Change in industry and other accounting practices could impair the Company's reported financial results and impede its ability to do business.
Changes in or the issuance of new accounting standards, as well as any changes in the interpretation of current accounting guidance, may have an adverse effect on the Company's reported financial results, including future revenues, and may influence the types and/or volume of business that management may choose to pursue. See Part II, Item 8, Financial Statements and Supplementary Data, Note 1, Business and Basis of Presentation, for a discussion of the future application of accounting standards.
Changes in or inability to comply with applicable law and regulations could adversely affect the Company's ability to do business.
The Company’s businesses are subject to detailed insurance, asset management and other financial services laws and government regulation in all of the jurisdictions in which it operates across the globe. In addition to the insurance, asset management and other regulations and laws specific to the industries in which it operates, regulatory agencies in jurisdictions in which the Company operates across the globe have broad administrative power of many aspects of the Company’s business, which may include ethical issues, money laundering, privacy, recordkeeping and marketing and sales practices. Future legislative, regulatory, judicial or other legal changes in the jurisdictions in which the Company does business may adversely affect its ability to pursue its current mix of business, thereby materially impacting its financial results by, among other things, limiting the types of risks it may insure, lowering applicable single or aggregate risk limits related to its insurance business, increasing required reserves or capital for its insurance subsidiaries, increasing the level of supervision or regulation to which the Company’s operations may be subject, imposing restrictions that make the Company’s products less attractive to potential buyers and investors, lowering the profitability of the Company’s business activities, requiring the Company to change certain of its business practices and exposing it to additional costs (including increased compliance costs).
Compliance with applicable laws and regulations is time consuming and personnel-intensive. If the Company fails to comply with applicable insurance or investment advisory laws and regulations it could be exposed to fines, the loss of insurance or investment advisory licenses, limitations on the right to originate new business and restrictions on its ability to pay dividends, all of which could have an adverse impact on its business results and prospects. If an insurance subsidiary’s surplus declines below minimum required levels, the insurance regulator could impose additional restrictions on the insurance subsidiary or initiate insolvency proceedings. AGM, AGC and MAC may increase surplus by various means, including obtaining capital contributions from the Company, purchasing reinsurance or entering into other loss mitigation arrangements, reducing the amount of new business written or obtaining regulatory approval to release contingency reserves. From time to time, AGM, MAC and AGC have obtained approval from their regulators to release contingency reserves based on losses or because the accumulated contingency reserve is deemed excessive in relation to the insurer's outstanding insured obligations.
Legislation or litigation arising out of the struggles of distressed obligors may materially impact the Company’s legal rights as creditor both in the instance at hand and more generally.
Borrower distress or default, whether or not the relevant obligation is insured by one of the Company’s insurance subsidiaries, may result in legislation or litigation that may impact the Company’s legal rights as creditor. For example, the default by the Commonwealth of Puerto Rico on much of its debt and the strategy Puerto Rico has chosen to employ have resulted in both legislation and litigation that is continuing to impact the Company’s rights as creditor, most directly in Puerto Rico but also elsewhere in the U.S. municipal market. In addition to a number of laws and decrees in Puerto Rico, the U.S. government enacted PROMESA and established the Oversight Board which are directly impacting the Company’s ability enforce the contractual and constitutional rights it understood itself to have at the time it insured the obligations. In addition, there is a great deal of litigation (both involving the Company and not involving the Company) relating to Puerto Rico’s bond defaults that may impact the Company’s rights in Puerto Rico as well as creditor rights more generally. For example, the United States Court of Appeals for the First Circuit decided that the Bankruptcy Code permits, but does not require, continued payment of special revenues by a debtor during the pendency of a bankruptcy proceeding, while most professionals involved in the municipal market understood the continued payment of special revenues by a debtor during the pendency of a bankruptcy case is mandatory. The Company cannot predict how these or future legislative developments or litigation may impact the Company and its business.
The Company is, and may be in the future, involved in litigation, both as a defendant and as a plaintiff, in the ordinary course of its insurance and asset management business and other business operations. The outcome of such litigation could
materially impact the Company’s loss reserves and results of operations and cash flows. For a discussion of material litigation, see Part II, Item 8, Financial Statements and Supplementary Data, Note 5, Outstanding Insurance Exposure; Note 6, Expected Losses to be Paid; and Note 20, Commitments and Contingencies.
AGL's ability to pay dividends may be constrained by certain insurance regulatory requirements and restrictions.
AGL is subject to Bermuda regulatory requirements that affect its ability to pay dividends on common shares and to make other payments. Under the Bermuda Companies Act 1981, as amended, AGL may declare or pay a dividend only if it has reasonable grounds for believing that it is, and after the payment would be, able to pay its liabilities as they become due, and if the realizable value of its assets would not be less than its liabilities. While AGL currently intends to pay dividends on its common shares, investors who require dividend income should carefully consider these risks before investing in AGL. In addition, if, pursuant to the insurance laws and related regulations of Bermuda, Maryland and New York, AGL's insurance subsidiaries cannot pay sufficient dividends to AGL at the times or in the amounts that it requires and AGL’s other operating subsidiaries were unable to provide such funds, it would have an adverse effect on AGL's ability to pay dividends to shareholders. See “-- Operational Risks -- The ability of AGL and its subsidiaries to meet their liquidity needs may be limited.”
Applicable insurance laws may make it difficult to effect a change of control of AGL.
Before a person can acquire control of a U.S. or U.K. insurance company, prior written approval must be obtained from the insurance commissioner of the state or country where the insurer is domiciled. Because a person acquiring 10% or more of AGL's common shares would indirectly control the same percentage of the stock of its U.S. insurance subsidiaries, the insurance change of control laws of Maryland, New York and the U.K. would likely apply to such a transaction. These laws may discourage potential acquisition proposals and may delay, deter or prevent a change of control of AGL, including through transactions, and in particular unsolicited transactions, that some or all of its shareholders might consider to be desirable. While AGL's Bye-Laws limit the voting power of any shareholder to less than 10%, the Company cannot provide assurances that the applicable regulatory body would agree that a shareholder who owned 10% or more of its common shares did not control the applicable insurance subsidiary, notwithstanding the limitation on the voting power of such shares.
Changes in applicable laws and regulations resulting from the withdrawal of the U.K. from the EU may adversely affect the Company.
The U.K. is withdrawing from the EU in a process commonly known as Brexit. See Item 1, Business, Regulation above. Given the lack of clarity on the ultimate post-Brexit relationship between U.K. and the EU, the Company cannot fully determine what, if any, impact Brexit may have on its operations, both inside and outside the U.K., or what impact Brexit may have on the economies of the markets the Company serves. The Company has established and obtained authorization for a new subsidiary in France, AGE SA, to facilitate its operations. The current intention of AGE UK, the Company’s U.K. subsidiary, is to transfer those of its existing policies that are affected by Brexit to AGE SA, in order for the new subsidiary to administer them. AGE SA is also able to originate new guarantee business in the EU.
Risks Related to AGL's Common Shares
The market price of AGL's common shares may be volatile, which could cause the value of an investment in the Company to decline.
The market price of AGL's common shares has experienced, and may continue to experience, significant volatility. Numerous factors, including many over which the Company has no control, may have a significant impact on the market price of its common shares. These risks include those described or referred to in this "Risk Factors" section as well as, among other things:
investor perceptions of the Company, its prospects and that of the financial guaranty industryand asset management industries and the markets in which the Company operates;
the Company's operating and financial performance;
the Company's access to financial and capital markets to raise additional capital, refinance its debt or replace existing senior secured credit and receivables-backed facilities;
the Company's ability to repay debt;
the Company's dividend policy;
the amount of share repurchases authorized by the Company;
future sales of equity or equity-related securities;
changes in earnings estimates or buy/sell recommendations by analysts; and
general financial, economic and other market conditions.
In addition, the stock market in recent years has experienced extreme price and trading volume fluctuations that often have been unrelated or disproportionate to the operating performance of individual companies. These broad market fluctuations may adversely affect the price of AGL's common shares, regardless of its operating performance.
Furthermore, future sales or other issuances of AGL equity may adversely affect the market price of its common shares.
AGL's common shares are equity securities and are junior to existing and future indebtedness.
As equity interests, AGL's common shares rank junior to indebtedness and to other non-equity claims on AGL and its assets available to satisfy claims on AGL, including claims in a bankruptcy or similar proceeding. For example, upon liquidation, holders of AGL debt securities and shares of preferred stock and creditors would receive distributions of AGL's available assets prior to the holders of AGL common shares. Similarly, creditors, including holders of debt securities, of AGL's subsidiaries, have priority on the assets of those subsidiaries. Future indebtedness may restrict payment of dividends on the common shares.
Additionally, unlike indebtedness, where principal and interest customarily are payable on specified due dates, in the case of common shares, dividends are payable only when and if declared by AGL's Board or a duly authorized committee of the Board. Further, the common shares place no restrictions on its business or operations or on its ability to incur indebtedness or engage in any transactions, subject only to the voting rights available to stockholders generally.
Provisions in the Code and AGL's Bye-Laws may reduce or increase the voting rights of its common shares.
Under the Code, AGL's Bye-Laws and contractual arrangements, certain shareholders have their voting rights limited to less than one vote per share, resulting in other shareholders having voting rights in excess of one vote per share. Moreover, the relevant provisions of the Code and AGL's Bye-Laws may have the effect of reducing the votes of certain shareholders who would not otherwise be subject to the limitation by virtue of their direct share ownership.
More specifically, pursuant to the relevant provisions of the Code, if, and so long as, the common shares of a shareholder are treated as "controlled shares" (as determined under section 958 of the Code) of any U.S. Person (as defined below) and such
controlled shares constitute 9.5% or more of the votes conferred by AGL's issued shares, the voting rights with respect to the controlled shares of such U.S. Person (a 9.5% U.S. Shareholder) are limited, in the aggregate, to a voting power of less than 9.5%, under a formula specified in AGL's Bye-Laws. The formula is applied repeatedly until the voting power of all 9.5% U.S. Shareholders has been reduced to less than 9.5%. For these purposes, "controlled shares" include, among other things, all shares of AGL that such U.S. Person is deemed to own directly, indirectly or constructively (within the meaning of section 958 of the Code).
In addition, the Board may limit a shareholder's voting rights where it deems appropriate to do so to (1) avoid the existence of any 9.5% U.S. Shareholders, and (2) avoid certain material adverse tax, legal or regulatory consequences to the
Company or any of the Company's subsidiaries or any shareholder or its affiliates. AGL's Bye-Laws provide that shareholders will be notified of their voting interests prior to any vote taken by them.
As a result of any such reallocation of votes, the voting rights of a holder of AGL common shares might increase above 5% of the aggregate voting power of the outstanding common shares, thereby possibly resulting in such holder becoming a reporting person subject to Schedule 13D or 13G filing requirements under the Securities Exchange Act of 1934. In addition, the reallocation of votes could result in such holder becoming subject to the short swing profit recovery and filing requirements under Section 16 of the Exchange Act.
AGL also has the authority under its Bye-Laws to request information from any shareholder for the purpose of determining whether a shareholder's voting rights are to be reallocated under the Bye-Laws. If a shareholder fails to respond to a request for information or submits incomplete or inaccurate information in response to a request, the Company may, in its sole discretion, eliminate such shareholder's voting rights.
Provisions in AGL's Bye-Laws may restrict the ability to transfer common shares, and may require shareholders to sell their common shares.
AGL's Board may decline to approve or register a transfer of any common shares (1) if it appears to the Board, after taking into account the limitations on voting rights contained in AGL's Bye-Laws, that any adverse tax, regulatory or legal consequences to AGL, any of its subsidiaries or any of its shareholders may occur as a result of such transfer (other than such as the Board considers to be de minimis), or (2) subject to any applicable requirements of or commitments to the NYSE, if a written opinion from counsel supporting the legality of the transaction under U.S. securities laws has not been provided or if any required governmental approvals have not been obtained.
AGL's Bye-Laws also provide that if the Board determines that share ownership by a person may result in adverse tax, legal or regulatory consequences to the Company, any of the subsidiaries or any of the shareholders (other than such as the Board considers to be de minimis), then AGL has the option, but not the obligation, to require that shareholder to sell to AGL or to third parties to whom AGL assigns the repurchase right for fair market value the minimum number of common shares held by such person which is necessary to eliminate such adverse tax, legal or regulatory consequences.
| |
| ITEM 1B. | UNRESOLVED STAFF COMMENTS |
None.
The principal executive offices of AGL and AG Re consist of approximately 8,250 square feet of office space located in Hamilton, Bermuda; the lease for this space expires in April 2021 and is renewable at the option of the Company.
In addition, the Company had been occupying offices at 31 West 52nd Street in New York City. In September 2015,City, the Company entered into aU.S. insurance subsidiaries lease for 88,000office spaces consisting of 103,500 square feet of office space at 1633 Broadway in New York City, and later an additional 15,500 square feet forone location subject to a total of 103,500 square feet; the new lease expiresexpiring in February 2032, with an option, subject to certain conditions, to renew for five years at a fair market rent.rent, and the U.S. asset management subsidiaries lease office space consisting of 78,400 square feet of office space at another location subject to a lease expiring in March 2024. The Company agreed to terminate its existingU.S. insurance subsidiaries also lease in August 2016 and relocated its U.S. affiliates into the new office space in San Francisco. In addition, AGE UK and the summerEuropean operations of 2016.the Assured Investment Management platform lease separate office space in London.
Furthermore, the Company has offices in San Francisco and London. During 2016, the Company moved its London offices from 1 Finsbury Square to 6 Bevis Marks.
Management believes its office space is adequate for its current and anticipated needs.
Lawsuits arise in the ordinary course of the Company's business. It is the opinion of the Company's management, based upon the information available, that the expected outcome of litigation against the Company, individually or in the aggregate, will not have a material adverse effect on the Company's financial position or liquidity, although an adverse resolution of litigation against the Company in a fiscal quarter or year could have a material adverse effect on the Company's results of operations in a particular quarter or year.
In addition, in the ordinary course of their respective businesses, certain of the Company'sAGL's insurance subsidiaries assert claimsare in legal proceedings againstlitigation with third parties to recover losses paid in prior periods or prevent losses in the future, including those described in Part II, Item 8, Financial Statements and Supplementary Data, Note 5, Expected Loss to be Paid, Recovery Litigation.future. For example, as described there, in January 2016 the Company has commenced an action for declaratory judgment and injunctive reliefa number of legal actions in the U.S. District Court for the District of Puerto Rico to invalidate executive orders issued byenforce its rights with respect to the Governorobligations it insures of Puerto Rico directingand various of its related authorities and public corporations. See the retention or transfer"Exposure to Puerto Rico" section of certain taxesPart II, Item 8, Financial Statements and revenues pledgedSupplementary Data, Note 5, Outstanding Insurance Exposure, for a description of such actions. See also the "Recovery Litigation" section of Part II, Item 8, Financial Statements and Supplementary Data, Note 6, Expected Losses to secure the paymentbe Paid, for a description of certain bonds insured by the Company, and in July 2016, the Company filed a motion and form of complaintrecovery litigation unrelated to Puerto Rico. Also in the U.S. District Court forordinary course of their respective business, certain of AGL's investment management subsidiaries and the District of Puerto Rico seeking relief from the PROMESA stayfunds managed by them are involved in order to file a complaint to protect its interest in certain pledged PRHTA toll revenues. As another example, in December 2008, the Company filed a claim in the Supreme Court of the State of New York against an investment manager in a transaction it insured alleging breach of fiduciary duty, gross negligence and breach of contract.litigation with third parties regarding fees, appraisals, or portfolio company investments. The amounts, if any, the Company will recover in these and other proceedings to recover losses are uncertain, and recoveries, or failure to obtain recoveries, in any one or more of these proceedings during any quarter or year could be material to the Company's results of operations in that particular quarter or year.
The Company establishes accruals for litigation and regulatory matters to the extent it is probable that a loss has been incurred and the amount of that loss can be reasonably estimated. For litigation and regulatory matters where a loss may be reasonably possible, but not probable, or is probable but not reasonably estimable, no accrual is established, but if the matter is material, it is disclosed, including matters discussed below. The Company reviews relevant information with respect to its litigation and regulatory matters on a quarterly and annual basis and updates its accruals, disclosures and estimates of reasonably possible loss based on such reviews.
The Company receives subpoenas duces tecum and interrogatories from regulators from time to time.
On November 28, 2011, Lehman Brothers International (Europe) (in administration) (LBIE) sued AG Financial Products Inc. (AGFP), an affiliate of AGC which in the past had provided credit protection to counterparties under credit default swaps.CDS. AGC acts as the credit support provider of AGFP under these credit default swaps. LBIE'sCDS. LBIE’s complaint, which was filed in the Supreme Court of the State of New York, alleged that AGFP improperly terminatedasserted a claim for breach of the implied covenant of good faith and fair dealing based on AGFP's termination of nine credit derivative transactions between LBIE and AGFP and improperly calculatedasserted claims for breach of contract and breach of the termination payment in connection with theimplied covenant of good faith and fair dealing based on AGFP's termination of 28 other credit derivative transactions between LBIE and AGFP.AGFP and AGFP's calculation of the termination payment in connection with those 28 other credit derivative transactions. Following defaults by LBIE, AGFP properly terminated the transactions in question in compliance with the agreement between AGFP and LBIE, and calculated the termination payment properly. AGFP calculated that LBIE owes AGFP approximately $29$4 million for the claims which were dismissed and approximately $25 million in connection with the termination of the other credit derivative transactions, whereas LBIE asserted in the complaint that AGFP owes LBIE a termination payment of approximately $1.4 billion. On February 3, 2012, AGFP filed a motion to dismiss certainthe claims for breach of the countsimplied covenant of good faith in theLBIE's complaint, and on March 15, 2013, the court granted AGFP's motion to dismiss in respect of the count relating to improper termination of the nine credit derivative transactions and denied AGFP's motion to dismiss the counts relatingnarrowed LBIE's claim with respect to the remaining28 other credit derivative transactions. On February 22, 2016, AGFP filed a motion for summary judgment on the remaining causes of action asserted by LBIE and on AGFP's counterclaims. LBIE’sLBIE's administrators disclosed in an April 10, 2015 report to LBIE’s unsecured creditors that LBIE's valuation expert has calculated LBIE's claim for damages in aggregate for the 28 transactions to range between a minimum of approximately $200 million and a maximum of approximately $500 million, depending on what adjustment, if any, is made for AGFP's credit risk and excluding any applicable interest.
On September 25, 2013, Wells Fargo Bank, N.A., as trust administrator AGFP filed a motion for summary judgment on the remaining causes of action asserted by LBIE and on AGFP's counterclaims and on July 2, 2018, the court granted in part and denied in part AGFP’s motion. The court dismissed, in its entirety, LBIE’s remaining claim for breach of the MASTR Adjustable Rate Mortgages Trust 2007-3 (Wells Fargo),implied covenant of good faith and fair dealing and also dismissed LBIE’s claim for breach of contract solely to the extent that it is based upon AGFP’s conduct in connection with the auction. With respect to LBIE’s claim for breach of contract, the court held that there are triable issues of fact regarding whether AGFP calculated its loss reasonably and in good faith. On October 1, 2018, AGFP filed an interpleader complaint inappeal with the U.S. DistrictAppellate Division of the Supreme Court forof the Southern DistrictState of New York, First Judicial Department, seeking adjudicationreversal of a dispute between Wales LLC (Wales) and AGM as to whether AGM is entitled to reimbursement from certain cashflows for principal claims paid in respectthe portions of insured certificates. On September 30, 2016, the court issued an opinionlower court's ruling denying aAGFP’s motion for summary judgment on the pleadings filed by Wales.with respect to LBIE’s sole remaining claim for breach of contract. On January 3, 2017,17, 2019, the Court approved a StipulationAppellate Division affirmed the Supreme Court's decision, holding that the lower court correctly determined that there are triable issues of fact regarding whether AGFP calculated its loss reasonably and Order of Dismissal of Wales from the action due to Wales having sold its interests in the MASTR Adjustable Rate Mortgages Trust 2007-3 certificates. On February 9, 2017, the remaining parties submitted a Stipulation and (Proposed) Order of Voluntary Dismissal, which the Courtgood faith. A trial has not yet so-ordered. The Company estimates that an adverse outcome to the interpleader proceeding could increase losses on the transaction by approximately $10 - $20 million, net of expected settlement payments and reinsurance in force.been scheduled for March 2020.
On December 22, 2014, Deutsche Bank National Trust Company, as indenture trustee for the AAA Trust 2007-2 Re-REMIC (the Trustee), filed a “trust instructional proceeding” petition in the State of California Superior Court (Probate Division, Orange County), seeking the court’s instruction as to how it should allocate the losses resulting from its December 2014 sale of four RMBS owned by the AAA Trust 2007-2 Re-REMIC. This sale of approximately $70 million principal balance of RMBS was made pursuant to AGC’s liquidation direction in November 2014, and resulted in approximately $27 million of gross proceeds to the Re-REMIC. On December 22, 2014, AGC directed the indenture trustee to allocate to the uninsured Class A-3 Notes the losses realized from the sale. On May 4, 2015, the Superior Court rejected AGC’s allocation
direction, and ordered the Trustee to allocate to the Class A-3 noteholders a pro rata share of the $27 million of gross proceeds. AGC is appealing the Superior Court’s decision to the California Court of Appeal.
| |
| ITEM 4. | MINE SAFETY DISCLOSURES |
Not applicable.
Information About Our Executive Officers of the Company
The table below sets forth the names, ages, positions and business experience of the executive officers of Assured Guaranty Ltd.AGL.
|
| | | |
| Name | Age | | Position(s) |
| Dominic J. Frederico | 6467 | | President and Chief Executive Officer; Deputy Chairman |
James M. MichenerRobert A. Bailenson | 6453 | | Chief Financial Officer |
| Ling Chow | 49 | | General Counsel and Secretary |
| Howard W. Albert | 60 | | Chief Risk Officer |
| Laura Bieling | 53 | | Chief Accounting Officer and Controller |
| Russell B. Brewer II | 5962 | | Chief Surveillance Officer |
Robert A. Bailenson | 50 | | Chief Financial Officer |
Bruce E. Stern | 62 | | Executive Officer |
Howard W. AlbertStephen Donnarumma | 57 | | Chief RiskCredit Officer |
| Andrew Feldstein | 55 | | Chief Investment Officer and Head of Asset Management of Assured Guaranty |
Dominic J. Frederico has been a director of AGL since the Company's 2004 initial public offering and the President and Chief Executive Officer of AGL since December 2003. Mr. Frederico served as Vice Chairman of ACE Limited from 2003 until 2004 and served as President and Chief Operating Officer of ACE Limited and Chairman of ACE INA Holdings, Inc. from 1999 to 2003. Mr. Frederico was a director of ACE Limited from 2001 through May 2005. From 1995 to 1999 Mr. Frederico served in a number of executive positions with ACE Limited. Prior to joining ACE Limited, Mr. Frederico spent 13 years working for various subsidiaries of American International Group.
James M. MichenerRobert A. Bailenson has been Chief Financial Officer of AGL since June 2011. Mr. Bailenson has been with Assured Guaranty and its predecessor companies since 1990. Mr. Bailenson became Chief Accounting Officer of AGC in 2003, of AGL in May 2005, and of AGM in July 2009, and served in such capacities until 2019. He was Chief Financial Officer and Treasurer of AG Re from 1999 until 2003 and was previously the Assistant Controller of Capital Re Corp., the Company's predecessor.
Ling Chow has been General Counsel and Secretary of AGL since January 1, 2018. She is responsible for legal affairs and corporate governance at the Company, including its litigation and other legal strategies relating to distressed credits, and its corporate, compliance, regulatory and disclosure efforts. Ms. Chow previously served as Deputy General Counsel and Assistant Secretary of AGL from May 2015 and as Assured Guaranty's U.S. General Counsel from June 2016. Prior to that, Ms. Chow served as Deputy General Counsel of Assured Guaranty's U.S. subsidiaries in several capacities from 2004. Before joining Assured Guaranty in 2002, Ms. Chow was an associate at law firms in New York City, most recently Brobeck, Phleger & Harrison LLP, where she was a senior associate responsible for transactional work associated with public and private mergers and acquisitions, venture capital investments, and private and public securities offerings.
Howard W. Albert has been Chief Risk Officer of AGL since May 2011. Prior to that, he was Chief Credit Officer of AGL from 2004 to April 2011. Mr. Albert joined Assured Guaranty in September 1999 as Chief Underwriting Officer of Capital Re Company, the predecessor to AGC. Before joining Assured Guaranty, he was a Senior Vice President with Rothschild Inc. from February 2004.1997 to August 1999. Prior to that, he spent eight years at Financial Guaranty Insurance Company from May 1989 to February 1997, where he was responsible for underwriting guaranties of asset-backed securities and international infrastructure transactions. Prior to that, he was employed by Prudential Capital, an investment arm of The Prudential Insurance Company of America, from September 1984 to April 1989, where he underwrote investments in asset-backed securities, corporate loans and project financings.
Laura Bieling has been the Chief Accounting Officer and Controller of AGL since May 2019 and the Controller of AGM and AGC since 2011. Ms. Bieling has been with AGM since 2000, and was the Chief Accounting Officer and Controller of AGMH from 2004 until July of 2009. Prior to joining Assured Guaranty, Mr. MichenerAGM, Ms. Bieling was General Counsel and Secretary of Travelers Property Casualty Corp. from January 2002 to February 2004. From April 2001 to January 2002, Mr. Michener served as general counsel of Citigroup's Emerging Markets business. Prior to joining Citigroup's Emerging Markets business, Mr. Michener was General Counsel of Travelers Insurance from April 2000 to April 2001 and General Counsel of Travelers Property Casualty Corp. from May 1996 to April 2000.a Senior Manager at PricewaterhouseCoopers, LLP.
Russell B. Brewer II has been Chief Surveillance Officer of AGL since November 2009 and Chief Surveillance Officer of AGC and AGM since July 2009 and has also been responsible for information technology at Assured Guaranty since April 2015. Mr. Brewer has been with AGM since 1986. Mr. Brewer was Chief Risk Management Officer of AGM from September 2003 until July 2009 and Chief Underwriting Officer of AGM from September 1990 until September 2003. Mr. Brewer was also a member of the Executive Management Committee of AGM. He was a Managing Director of AGMH from May 1999 until July 2009. From March 1989 to August 1990, Mr. Brewer was Managing Director, Asset Finance Group, of AGM. Prior to joining AGM, Mr. Brewer was an Associate Director of Moody's Investors Service, Inc.
Robert A. BailensonStephen Donnarumma has been the Chief FinancialCredit Officer of AGLAGC since June 2011.2007, of AGM since its 2009 acquisition, and of MAC since its 2012 capitalization. Mr. BailensonDonnarumma has been with Assured Guaranty and its predecessor companies since 1990.1993. Over the past 25 years, Mr. Bailenson became Chief Accounting OfficerDonnarumma has held a number of AGM in July 2009 and has been Chief Accounting Officer of AGL since May 2005 and Chief Accounting Officer of AGC since 2003. He was Chief Financial Officer and Treasurer of AG Re from 1999 until 2003 and was previously the Assistant Controller of Capital Re Corp., the Company's predecessor.
Bruce E. Stern has been Executive Officer of AGC and AGM since July 2009. Mr. Stern was General Counsel, Managing Director, Secretary and Executive Management Committee member of AGM from 1987 until July 2009. Prior to joining AGM, Mr. Stern was an associatepositions at the New York office of Cravath, Swaine & Moore. Mr. Stern has served as Chairman of the Association of FinancialAssured Guaranty, Insurers since April 2010.
Howard W. Albert has been Chief Risk Officer of AGL since May 2011. Prior to that, he wasincluding Deputy Chief Credit Officer of AGL, from 2004 to April 2011. Mr. Albert joined Assured Guaranty in September 1999 asChief Operating Officer and Chief Underwriting Officer of CapitalAG Re, Company, the predecessorChief Risk Officer of AGC, and Senior Managing Director, Head of Mortgage and Asset-backed Securities of AGC. Prior to AGC. Before joining Assured Guaranty, heMr. Donnarumma was a Senior Vice President with Rothschild Inc. from February 1997 to August 1999. Prior to that, he spent eight years at Financial Guaranty Insurance Company from May 1989 to February 1997,until 1993, where he was responsible forhis responsibilities included underwriting guaranties of asset-backed securities
domestic and international infrastructurefinancial guaranty transactions. Prior to that, he served as a Director of Credit Risk Analysis at Fannie Mae from 1987 until 1989. Mr. Donnarumma was employed by Prudential Capital,also an investment armanalyst with Moody’s Investors Services from 1985 until 1987.
Andrew Feldstein has been the Chief Investment Officer and Head of The Prudential InsuranceAsset Management of Assured Guaranty since October 2019. Mr. Feldstein co-founded BlueMountain, which the Company of America, from September 1984acquired in 2019, and continues to April 1989,serve as its Chief Executive Officer and Chief Investment Officer. Prior to co-founding BlueMountain in 2003, Mr. Feldstein spent more than a decade at J.P. Morgan, where he underwrote investments in asset-backed securities, corporate loanswas a Managing Director and project financings.served as Head of Structured Credit; Head of High Yield Sales, Trading and Research; and Head of Global Credit Portfolio.
PART II
| |
| ITEM 5. | MARKET FOR REGISTRANT'S COMMON EQUITY, RELATED STOCKHOLDER MATTERS AND ISSUER PURCHASES OF EQUITY SECURITIES |
AGL's common shares are listed on the NYSE under the symbol "AGO." The table below sets forth, for the calendar quarters indicated, the reported high and low sales prices and amount of any cash dividends declared.
Common Stock Prices and Dividends
|
| | | | | | | | | | | | | | | | | | | | | | | |
| | 2016 | | 2015 |
| | Sales Price | | Cash | | Sales Price | | Cash |
| | High | | Low | | Dividends | | High | | Low | | Dividends |
| First Quarter | $ | 26.82 |
| | $ | 21.79 |
| | $ | 0.13 |
| | $ | 26.96 |
| | $ | 24.21 |
| | $ | 0.12 |
|
| Second Quarter | 27.45 |
| | 23.43 |
| | 0.13 |
| | 29.75 |
| | 22.55 |
| | 0.12 |
|
| Third Quarter | 28.07 |
| | 24.69 |
| | 0.13 |
| | 26.87 |
| | 22.86 |
| | 0.12 |
|
| Fourth Quarter | 39.03 |
| | 27.42 |
| | 0.13 |
| | 29.62 |
| | 24.39 |
| | 0.12 |
|
On February 21, 2017, the closing price for AGL's common shares on the NYSE was $41.36, and25, 2020, the approximate number of shareholders of record at the close of business on that date was 76.80.
AGL is a holding company whose principal source of income is dividends from its operating subsidiaries. The ability of the operating subsidiaries to pay dividends to AGL and AGL's ability to pay dividends to its shareholders are each subject to legal and regulatory restrictions. The declaration and payment of future dividends will be at the discretion of AGL's Board and will be dependent upon the Company's profits and financial requirements and other factors, including legal restrictions on the payment of dividends and such other factors as the Board deems relevant. AGL paid quarterly cash dividends in the amount of $0.18 and $0.16 per common share in 2019 and 2018, respectively. For more information concerning AGL's dividends, please refer to Part II,see Item 7.7, Management's Discussion and Analysis, of Financial Condition and Results of Operations, Liquidity and Capital Resources and Item 8, Financial Statements and Supplementary Data, Note 11, Insurance Company Regulatory Requirements.21, Shareholders' Equity.
2016 ShareIssuer’s Purchases of Equity Securities
In 2016,2019, the Company repurchased a total of 10.711.2 million common shares for approximately $306$500 million at an average price of $28.53$44.79 per share. From time to time, the Board authorizes the repurchase of common shares. Most recently, on February 22, 2017,26, 2020, the Board approved an incremental $300additional $250 million inof share repurchases, which bringsand the currentremaining authorization, as of February 23, 2017, to $40727, 2020, is $408 million. The Company expects future common share repurchases under the current authorization to be made from time to time in the open market or in privately negotiated transactions. The timing, form and amount of the share repurchases are at the discretion of management and will depend on a variety of factors, including availability of funds at the holding companies, other potential uses for such funds, market conditions, the Company's capital position, legal requirements and other factors. The repurchase authorization may be modified, extended or terminated by the Board at any time. It does not have an expiration date. See Part II, Item 8, Financial Statements and Supplementary Data, Note 18,21, Shareholders' Equity for additional information about share repurchases and authorizations.
Issuer’s Purchases of Equity Securities
The following table reflects purchases of AGL common shares made by the Company during Fourth Quarter 2016.the fourth quarter of 2019.
| | | Period | | Total Number of Shares Purchased | | Average Price Paid Per Share | | Total Number of Shares Purchased as Part of Publicly Announced Program (1) | | Maximum Number (or Approximate Dollar Value) of Shares that May Yet Be Purchased Under the Program(2) | | Total Number of Shares Purchased | | Average Price Paid Per Share | | Total Number of Shares Purchased as Part of Publicly Announced Program (1) | | Maximum Number (or Approximate Dollar Value) of Shares that May Yet Be Purchased Under the Program(2) |
| October 1 - October 31 | | 692,002 |
| | $ | 28.90 |
| | 692,002 |
| | $ | 95,000,101 |
| | 1,064,208 |
| | $ | 45.68 |
| | 1,062,300 |
| | 309,345,134 |
|
| November 1 - November 30 | | 703,510 |
| | $ | 33.21 |
| | 703,510 |
| | $ | 321,635,067 |
| | 1,078,733 |
| | $ | 48.34 |
| | 1,076,436 |
| | 257,307,202 |
|
| December 1 - December 31 | | 1,905,105 |
| | $ | 38.03 |
| | 1,905,105 |
| | $ | 249,175,822 |
| | 1,224,646 |
| | $ | 49.66 |
| | 1,196,781 |
| | 197,873,422 |
|
| Total | | 3,300,617 |
| | $ | 35.09 |
| | 3,300,617 |
| | |
| | 3,367,587 |
| | $ | 47.98 |
| | 3,335,517 |
| | |
|
____________________
| |
| (1) | After giving effect to repurchases since the beginning of 2013 through February 23, 2017,27, 2020 the Company has repurchased a total of 72.2106.6 million common shares for approximately $1,857$3,256 million, excluding commissions, at an average price of $25.71$30.56 per share. |
Performance Graph
Set forth below are a line graph and a table comparing the dollar change in the cumulative total shareholder return on AGL's common shares from December 31, 20112014 through December 31, 20162019 as compared to the cumulative total return of the Standard & Poor's 500 Stock Index, and the cumulative total return of the Standard & Poor's 500 Financials Sector GICS Level 1 Index and the cumulative total return of the Russell Midcap Financial Services Index. The Company added the Russell Midcap Financial Services Index in 2018 because it believes that this index, which includes the Company, provides a useful comparison to other companies in the financial services sector, and excludes companies that are included in the Standard & Poor's 500 Financials Sector GICS Level 1 Index but are many times larger than the Company. The chart and table depict the value on December 31 2011, December 31, 2012, December 31, 2013, December 31,of each year from 2014 December 31, 2015 and December 31, 2016through 2019 of a $100 investment made on December 31, 2011,2014, with all dividends reinvested:
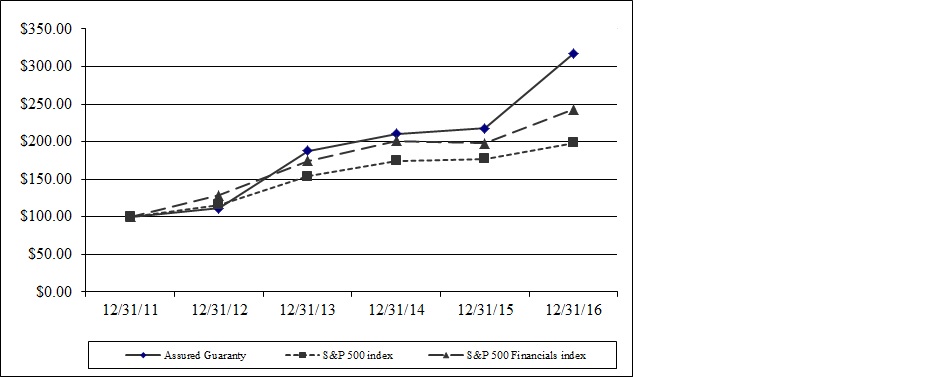
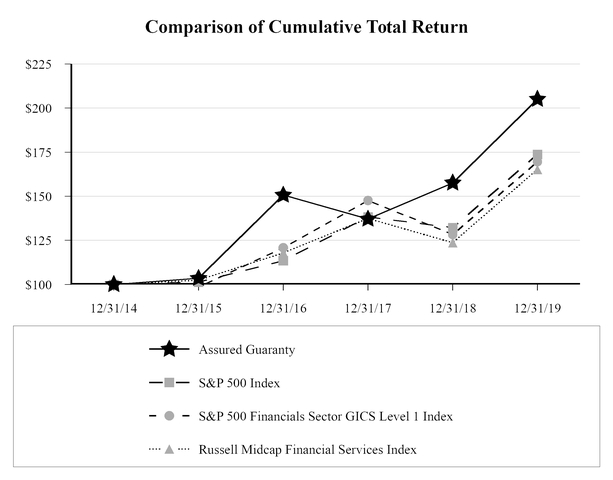
| | | | Assured Guaranty | | S&P 500 Index | | S&P 500 Financial Index | Assured Guaranty | | S&P 500 Index | | S&P 500 Financials Sector GICS Level 1 Index | | Russell Midcap Financial Services Index |
| 12/31/2011 | $ | 100.00 |
| | $ | 100.00 |
| | $ | 100.00 |
| |
| 12/31/2012 | 111.17 |
| | 115.99 |
| | 128.74 |
| |
| 12/31/2013 | 187.70 |
| | 153.54 |
| | 174.56 |
| |
| 12/31/2014 | 210.58 |
| | 174.54 |
| | 201.06 |
| $ | 100.00 |
| | $ | 100.00 |
| | $ | 100.00 |
| | $ | 100.00 |
|
| 12/31/2015 | 217.95 |
| | 176.93 |
| | 197.92 |
| 103.50 |
| | 101.37 |
| | 98.44 |
| | 102.35 |
|
| 12/31/2016 | 317.34 |
| | 198.07 |
| | 242.95 |
| 150.70 |
| | 113.49 |
| | 120.83 |
| | 117.86 |
|
| 12/31/2017 | | 137.08 |
| | 138.26 |
| | 147.58 |
| | 137.44 |
|
| 12/31/2018 | | 157.58 |
| | 132.19 |
| | 128.34 |
| | 123.64 |
|
| 12/31/2019 | | 205.06 |
| | 173.80 |
| | 169.52 |
| | 165.13 |
|
___________________
Source: BloombergCalculated from total returns published by Bloomberg.
| |
| ITEM 6. | SELECTED FINANCIAL DATA |
The following selected financial data should be read together with the other information contained in this Form 10-K, including "Management's Discussion and Analysis of Financial Condition and Results of Operations" and the consolidated financial statements and related notes included elsewhere in this Form 10-K. Certain prior year balances have been reclassified to conform to the current year's presentation.
|
| | | | | | | | | | | | | | | | | | | |
| | Year Ended December 31, |
| | 2019 | | 2018 | | 2017 | | 2016 | | 2015 |
| | (dollars in millions, except per share amounts) |
| Statement of operations data: | | | | | | | | | |
| Revenues: | | | | | | | | | |
| Net earned premiums | $ | 476 |
| | $ | 548 |
| | $ | 690 |
| | $ | 864 |
| | $ | 766 |
|
| Net investment income (1) | 378 |
| | 395 |
| | 417 |
| | 408 |
| | 423 |
|
| Asset management fees | 22 |
| | — |
| | — |
| | — |
| | — |
|
| Net realized investment gains (losses) | 22 |
| | (32 | ) | | 40 |
| | (29 | ) | | (26 | ) |
| Net change in fair value of credit derivatives | (6 | ) | | 112 |
| | 111 |
| | 98 |
| | 728 |
|
| Fair value gains (losses) on FG VIEs | 42 |
| | 14 |
| | 30 |
| | 38 |
| | 38 |
|
| Foreign exchange gains (losses) on remeasurement | 24 |
| | (37 | ) | | 60 |
| | (37 | ) | | (18 | ) |
| Bargain purchase gain and settlement of pre-existing relationships | — |
| | — |
| | 58 |
| | 259 |
| | 214 |
|
| Commutation gains (losses) | 1 |
| | (16 | ) | | 328 |
| | 8 |
| | 28 |
|
| Other income (loss) (1) | 4 |
| | 17 |
| | 5 |
| | 66 |
| | 51 |
|
| Total revenues | 963 |
| | 1,001 |
| | 1,739 |
| | 1,675 |
| | 2,204 |
|
| Expenses: | | | | | | | | | |
| Loss and loss adjustment expenses | 93 |
| | 64 |
| | 388 |
| | 295 |
| | 424 |
|
| Interest expense | 89 |
| | 94 |
| | 97 |
| | 102 |
| | 101 |
|
| Amortization of deferred acquisition costs (DAC) | 18 |
| | 16 |
| | 19 |
| | 18 |
| | 20 |
|
| Employee compensation and benefit expenses | 178 |
| | 152 |
| | 143 |
| | 133 |
| | 126 |
|
| Other operating expenses | 125 |
| | 96 |
| | 101 |
| | 112 |
| | 105 |
|
| Total expenses | 503 |
| | 422 |
| | 748 |
| | 660 |
| | 776 |
|
| Income (loss) before income taxes and equity in net earnings of investees | 460 |
|
| 579 |
|
| 991 |
|
| 1,015 |
|
| 1,428 |
|
| Equity in net earnings of investees (1) | 4 |
| | 1 |
| | — |
| | 2 |
| | 3 |
|
| Income (loss) before income taxes | 464 |
| | 580 |
| | 991 |
| | 1,017 |
| | 1,431 |
|
| Provision (benefit) for income taxes | 63 |
| | 59 |
| | 261 |
| | 136 |
| | 375 |
|
| Net income (loss) | 401 |
| | 521 |
| | 730 |
| | 881 |
| | 1,056 |
|
| Less: Redeemable noncontrolling interests | (1 | ) | | — |
| | — |
| | — |
| | — |
|
| Net income (loss) attributable to Assured Guaranty Ltd. | $ | 402 |
| | $ | 521 |
| | $ | 730 |
| | $ | 881 |
| | $ | 1,056 |
|
| Diluted earnings per share | $ | 4.00 |
| | $ | 4.68 |
| | $ | 5.96 |
| | $ | 6.56 |
| | $ | 7.08 |
|
| Cash dividends declared per share | $ | 0.72 |
| | $ | 0.64 |
| | $ | 0.57 |
| | $ | 0.52 |
| | $ | 0.48 |
|
|
| | | | | | | | | | | | | | | | | | | |
| | Year Ended December 31, |
| | 2016 | | 2015 | | 2014 | | 2013 | | 2012 |
| | (dollars in millions, except per share amounts) |
| Statement of operations data: | | | | | | | | | |
| Revenues: | | | | | | | | | |
| Net earned premiums | $ | 864 |
| | $ | 766 |
| | $ | 570 |
| | $ | 752 |
| | $ | 853 |
|
| Net investment income | 408 |
| | 423 |
| | 403 |
| | 393 |
| | 404 |
|
| Net realized investment gains (losses) | (29 | ) | | (26 | ) | | (60 | ) | | 52 |
| | 1 |
|
| Realized gains and other settlements on credit derivatives | 29 |
| | (18 | ) | | 23 |
| | (42 | ) | | (108 | ) |
| Net unrealized gains (losses) on credit derivatives | 69 |
| | 746 |
| | 800 |
| | 107 |
| | (477 | ) |
| Fair value gains (losses) on committed capital securities | 0 |
| | 27 |
| | (11 | ) | | 10 |
| | (18 | ) |
| Fair value gains (losses) on financial guaranty variable interest entities | 38 |
| | 38 |
| | 255 |
| | 346 |
| | 191 |
|
| Bargain purchase gain and settlement of pre-existing relationships | 259 |
| | 214 |
| | — |
| | — |
| | — |
|
| Other income (loss) | 39 |
| | 37 |
| | 14 |
| | (10 | ) | | 108 |
|
| Total revenues | 1,677 |
| | 2,207 |
| | 1,994 |
| | 1,608 |
| | 954 |
|
| Expenses: | | | | | | | | | |
| Loss and loss adjustment expenses | 295 |
| | 424 |
| | 126 |
| | 154 |
| | 504 |
|
| Amortization of deferred acquisition costs | 18 |
| | 20 |
| | 25 |
| | 12 |
| | 14 |
|
| Interest expense | 102 |
| | 101 |
| | 92 |
| | 82 |
| | 92 |
|
| Other operating expenses | 245 |
| | 231 |
| | 220 |
| | 218 |
| | 212 |
|
| Total expenses | 660 |
| | 776 |
| | 463 |
| | 466 |
| | 822 |
|
| Income (loss) before (benefit) provision for income taxes | 1,017 |
|
| 1,431 |
|
| 1,531 |
|
| 1,142 |
|
| 132 |
|
| Provision (benefit) for income taxes | 136 |
| | 375 |
| | 443 |
| | 334 |
| | 22 |
|
| Net income (loss) | 881 |
| | 1,056 |
| | 1,088 |
| | 808 |
| | 110 |
|
| Earnings (loss) per share: | | | | | | | | | |
| Basic | $ | 6.61 |
| | $ | 7.12 |
| | $ | 6.30 |
| | $ | 4.32 |
| | $ | 0.58 |
|
| Diluted | $ | 6.56 |
| | $ | 7.08 |
| | $ | 6.26 |
| | $ | 4.30 |
| | $ | 0.57 |
|
| Dividends per share | $ | 0.52 |
| | $ | 0.48 |
| | $ | 0.44 |
| | $ | 0.40 |
| | $ | 0.36 |
|
| | | | As of December 31, | As of December 31, |
| | 2016 | | 2015 | | 2014 | | 2013 | | 2012 | 2019 | | 2018 | | 2017 | | 2016 | | 2015 |
| | (dollars in millions, except per share amounts) | (dollars in millions, except per share amounts) |
| Balance sheet data (end of period): | | | | | | | | | | |
| Balance sheet data: | | | | | | | | | | |
| Assets: | | | | | | | | | | | | | | | | | | |
| Investments and cash | $ | 11,103 |
| | $ | 11,358 |
| | $ | 11,459 |
| | $ | 10,969 |
| | $ | 11,223 |
| $ | 10,409 |
| | $ | 10,977 |
| | $ | 11,539 |
| | $ | 11,103 |
| | $ | 11,358 |
|
| Premiums receivable, net of commissions payable | 576 |
| | 693 |
| | 729 |
| | 876 |
| | 1,005 |
| 1,286 |
| | 904 |
| | 915 |
| | 576 |
| | 693 |
|
| Ceded unearned premium reserve | 206 |
| | 232 |
| | 381 |
| | 452 |
| | 561 |
| 39 |
| | 59 |
| | 119 |
| | 206 |
| | 232 |
|
| Salvage and subrogation recoverable | 365 |
| | 126 |
| | 151 |
| | 174 |
| | 456 |
| 747 |
| | 490 |
| | 572 |
| | 365 |
| | 126 |
|
| Credit derivative assets | 13 |
| | 81 |
| | 68 |
| | 94 |
| | 141 |
| |
| Variable interest entities’ assets (3) | | 1,014 |
| | 569 |
| | 700 |
| | 876 |
| | 1,261 |
|
| Goodwill and other intangible assets | | 216 |
| | 24 |
| | 24 |
| | 25 |
| | 24 |
|
| Total assets | 14,151 |
| | 14,544 |
| | 14,919 |
| | 16,285 |
| | 17,240 |
| 14,326 |
| | 13,603 |
| | 14,433 |
| | 14,151 |
| | 14,544 |
|
| Liabilities and shareholders' equity: | | | | | | | | | | | | | | | | | | |
| Unearned premium reserve | 3,511 |
| | 3,996 |
| | 4,261 |
| | 4,595 |
| | 5,207 |
| 3,736 |
| | 3,512 |
| | 3,475 |
| | 3,511 |
| | 3,996 |
|
| Loss and loss adjustment expense reserve | 1,127 |
| | 1,067 |
| | 799 |
| | 592 |
| | 601 |
| 1,050 |
| | 1,177 |
| | 1,444 |
| | 1,127 |
| | 1,067 |
|
| Reinsurance balances payable, net | 64 |
| | 51 |
| | 107 |
| | 148 |
| | 219 |
| |
| Long-term debt | 1,306 |
| | 1,300 |
| | 1,297 |
| | 814 |
| | 834 |
| 1,235 |
| | 1,233 |
| | 1,292 |
| | 1,306 |
| | 1,300 |
|
| Credit derivative liabilities | 402 |
| | 446 |
| | 963 |
| | 1,787 |
| | 1,934 |
| 191 |
| | 209 |
| | 271 |
| | 402 |
| | 446 |
|
| Variable interest entities’ liabilities (3) | | 951 |
| | 619 |
| | 757 |
| | 958 |
| | 1,349 |
|
| Total liabilities | 7,647 |
| | 8,481 |
| | 9,161 |
| | 11,170 |
| | 12,246 |
| 7,674 |
| | 7,048 |
| | 7,594 |
| | 7,647 |
| | 8,481 |
|
| Accumulated other comprehensive income | 149 |
| | 237 |
| | 370 |
| | 160 |
| | 515 |
| |
| Shareholders' equity attributable to Assured Guaranty Ltd. | | 6,639 |
| | 6,555 |
| | 6,839 |
| | 6,504 |
| | 6,063 |
|
| Shareholders' equity | 6,504 |
| | 6,063 |
| | 5,758 |
| | 5,115 |
| | 4,994 |
| 6,645 |
| | 6,555 |
| | 6,839 |
| | 6,504 |
| | 6,063 |
|
| Book value per share | 50.82 |
| | 43.96 |
| | 36.37 |
| | 28.07 |
| | 25.74 |
| |
| Shareholders' equity attributable to Assured Guaranty Ltd. per share | | 71.18 |
| | 63.23 |
| | 58.95 |
| | 50.82 |
| | 43.96 |
|
| Consolidated statutory financial information: | | | | | | | | | | | | | | | | | | |
| Policyholders' surplus | | $ | 5,056 |
| | $ | 5,148 |
| | $ | 5,305 |
| | $ | 5,126 |
| | $ | 4,631 |
|
| Contingency reserve | $ | 2,008 |
| | $ | 2,263 |
| | $ | 2,330 |
| | $ | 2,934 |
| | $ | 2,364 |
| 1,607 |
| | 1,663 |
| | 1,750 |
| | 2,008 |
| | 2,263 |
|
| Policyholders' surplus | 5,036 |
| | 4,550 |
| | 4,142 |
| | 3,202 |
| | 3,579 |
| |
| Claims-paying resources(1) | 11,701 |
| | 12,306 |
| | 12,189 |
| | 12,147 |
| | 12,328 |
| |
| Outstanding Exposure: | | | | | | | | | | |
| Claims-paying resources (2) | | 11,162 |
| | 11,815 |
| | 12,021 |
| | 11,954 |
| | 12,567 |
|
| Financial Guaranty Exposure: | | | | | | | | | | |
| Net debt service outstanding | $ | 437,535 |
| | $ | 536,341 |
| | $ | 609,622 |
| | $ | 690,535 |
| | $ | 780,356 |
| $ | 374,130 |
| | $ | 371,586 |
| | $ | 401,118 |
| | $ | 437,535 |
| | $ | 536,341 |
|
| Net par outstanding | 296,318 |
| | 358,571 |
| | 403,729 |
| | 459,107 |
| | 518,772 |
| 236,807 |
| | 241,802 |
| | 264,952 |
| | 296,318 |
| | 358,571 |
|
| Asset Management Data: | | | | | | | | | | |
| Assets under management | | 17,827 |
| | — |
| | — |
| | — |
| | — |
|
___________________
| |
| (1) | The presentation of equity in net earnings of investees was changed in 2019 to reflect amounts previously reported in net investment income and other income to a separate line item on the consolidated statements of operations. |
| |
| (2) | Based on accounting practices prescribed or permitted by U.S. insurance regulatory authorities, for all insurance subsidiaries. Claims-paying resources is calculated as the sum of statutory policyholders' surplus, statutory contingency reserve, statutory unearned premium reserves and net deferred ceding commission income, statutory loss and LAE reserves, present value of installment premium on financial guaranty and credit derivatives,all insurance contracts regardless of form, discounted at 6%, and standby lines of credit/stop loss.loss and excess-of-loss reinsurance facility. Total claims-paying resources is used by the Company to evaluate the adequacy of capital resources. Includes an aggregate excess-of-loss reinsurance facility for $360 million for December 31, 2016 |
| |
| (3) | Beginning in 2019, variable interest entities’ assets and 2015, $450 million for December 31, 2014 and $435 million for December 31, 2013 and 2012. See Part II, Item 8, Financial Statements and Supplementary Data, Note 13, Reinsurance and Other Monoline Exposures.liabilities include consolidated investment vehicles. |
| |
| ITEM 7. | MANAGEMENT'S DISCUSSION AND ANALYSIS OF FINANCIAL CONDITION AND RESULTS OF OPERATIONS |
The following discussion and analysis of the Company’s financial condition and results of operations should be read in conjunction with the Company’s consolidated financial statements and accompanying notes which appear elsewhere in this Form 10-K. It contains forward looking statements that involve risks and uncertainties. Please see “Forward Looking Statements” for more information. The Company's actual results could differ materially from those anticipated in these forward looking statements as a result of various factors, including those discussed below and elsewhere in this Form 10-K, particularly under the headings “Risk Factors” and “Forward Looking Statements.”
Introduction
The Company provides credit protection products to the U.S. and international public finance (including infrastructure) and structured finance markets. The Company applies its credit underwriting judgment, risk management skills and capital markets experience primarily to offer financial guaranty insurance that protects holders of debt instruments and other monetary obligations from defaults in scheduled payments. If an obligor defaults on a scheduled payment due on an obligation, including a scheduled principal or interest payment, the Company is required under its unconditional and irrevocable financial guaranty to pay the amount of the shortfall to the holder of the obligation. The Company markets its financial guaranty insurance directly to issuers and underwriters of public finance and structured finance securities as well as to investors in such obligations. The Company guarantees obligations issued principally in the U.S. and the U.K., and also guarantees obligations issued in other countries and regions, including Australia and Western Europe. The Company also provides other forms of insurance that are in line with its risk profile and benefit from its underwriting experience.
Executive Summary
This executive summary of management’s discussion and analysis highlights selected information and may not contain all of the information that is important to readers of this Annual Report. For a more detailed description of events, trends and uncertainties, as well as the capital, liquidity, credit, operational and market risks and the critical accounting policies and estimates affecting the Company, this Annual Reportthe following discussion and analysis of the Company’s financial condition and results of operations should be read in its entirety.entirety with the Company’s consolidated financial statements and accompanying notes which appear elsewhere in this Form 10-K. The following discussion and analysis of the Company’s financial condition and results of operations contains forward looking statements that involve risks and uncertainties. See “Forward Looking Statements” for more information. The Company's actual results could differ materially from those anticipated in these forward looking statements as a result of various factors, including those discussed below and elsewhere in this Form 10-K, particularly under the headings “Risk Factors” and “Forward Looking Statements.”
Overview
Beginning in fourth quarter 2019, after the acquisition of BlueMountain, the Company realigned its reporting structure to be consistent with how management now views its different business lines. Management views its businesses in two distinct segments: Insurance and Asset Management. The Company's Corporate division activities are presented separately. The Insurance and Asset Management businesses are conducted through separate legal entities, which is the basis on which the results of operations are presented and reviewed by the chief operating decision maker (CODM) to assess performance and allocate resources.
In the Insurance segment, the Company provides credit protection products to the U.S. and international public finance (including infrastructure) and structured finance markets. The Company applies its credit underwriting judgment, risk management skills and capital markets experience primarily to offer credit protection products to holders of debt instruments and other monetary obligations that protect them from defaults in scheduled payments. If an obligor defaults on a scheduled payment due on an obligation, including a scheduled debt service payment, the Company is required under its unconditional and irrevocable financial guaranty to pay the amount of the shortfall to the holder of the obligation. The Company markets its credit protection products directly to issuers and underwriters of public finance and structured finance securities as well as to investors in such obligations. The Company guarantees obligations issued principally in the U.S. and the U.K., and also guarantees obligations issued in other countries and regions, including Western Europe, Canada and Australia. The Company also provides other forms of insurance that are consistent with its risk profile and benefit from its underwriting experience.
Premiums are earned over the contractual lives, or in the case of homogeneous pools of insured obligations, the remaining expected lives, of financial guaranty insurance contracts. The Company estimates remaining expected lives of its insured obligations and makes prospective adjustments for such changes in expected lives. Scheduled net earned premiums decrease each year unless replaced by a higher amount of new business, reassumptions of previously ceded business, or books of business acquired in a business combination.
In the Asset Management segment, Assured Investment Management provides investment advisory services, which include the management of CLOs and opportunity funds, as well as certain legacy hedge and opportunity funds now subject to an orderly wind-down. As of December 31, 2019, Assured Investment Management had $17.8 billion of AUM of which $12.8 billion is from CLOs, $1.0 billion is from opportunity funds and $4.0 billion is from wind-down funds. These amounts are inclusive of $191 million that Assured Investment Management manages on behalf of the Company's insurance subsidiaries. AUM may be impacted by a wide range of factors, including the condition of the global economy and financial markets, the relative attractiveness of Assured Investment Management’s investment strategies, and regulatory or other governmental policies or actions. For an explanation of how the Company defines and uses the AUM metric and why it provides useful information to investors, please see " -- Results of Operations by Segment -- Asset Management Segment."
Fees in respect of investment advisory services are the largest components of revenues for the Asset Management segment. Assured Investment Management is compensated for its investment advisory services generally through management fees which are based on AUM. In addition, with respect to CLOs and certain hedge and opportunity funds, Assured Investment Management may receive performance fees if certain thresholds are met.
The Corporate division consists primarily of interest expense on the debt of AGUS and AGMH, as well as other operating expenses attributed to holding company activities, including administrative services performed by operating subsidiaries for the holding companies.
The Company reviews its segment results before giving effect to the consolidation of VIEs. The effect of consolidating VIEs, as well as intersegment eliminations and certain reclassification are presented separately in the Company's reconciliations of segment results to GAAP and non-GAAP measures.
Economic Environment
The amountAs a financial guaranty insurer and pricing of new businessasset manager, the Company originates, as well asis affected by numerous factors, including the economy and the condition of financial healthmarkets. Interest rates, credit spreads, fluctuations in equity, credit and foreign exchange markets, which may be volatile, can significantly affect the ability of the issuers whose obligationsCompany to write new insurance business and attract third-party assets for its asset management business. Such factors can also affect the Company's expected losses in its Insurance segment, valuation of its investments and the investments of the funds it insures, depend in part on the economic environment in the markets it serves, including the level of interest rates and credit spreads in those markets.manages.
The overall U.S. experienced sustained positive economic environment continued improving during 2016. The U.S. Department of Commerce Bureau of Economic Analysis reported an advanced estimate that real gross domestic product increased 1.6% during 2016.momentum in 2019. According to the U.S. Bureau of Labor Statistics (BLS), the U.S. economy added an estimated 2.2unemployment rate began the year at 3.9% and ended the year at 3.5%. Payroll employment growth in 2019 totaled 2.1 million jobs, during 2016, andcompared with a gain of 2.3 million jobs in 2018. Gross domestic product increased 2.3% in 2019, compared with 2.9% in 2018 according to the estimated monthly unemployment rate did not exceed 5.0% in any monthBureau of the year, falling in the fourth quarter to levels not seen since 2007. Federal Reserve Board Chairman Janet Yellen stated in January 2017 that labor utilization was close to a normal level and other measures of labor utilization had improved appreciably.Economic Analysis initial estimate.
TheAs reported by U.S. stock market trended higher during 2016 in response to continuing signs of economic improvement, although investors experienced considerable volatility related to oil prices, global economic uncertainty, and political developments such as the British electorate's vote in favor of Britain exiting the European Union (Brexit)Census Bureau and the U.S. presidential election. Stock market indices rose to record levelsDepartment of Housing and Urban Development, new home sales were up 23% on a year-over-year basis. The median sale price of new homes sold in the fourth quarter.
U.S. homein December 2019 was $331,400, an improvement over 2018’s lower median sales prices, as measured by the S&P CoreLogic Case-Shiller U.S. National Home Price Index, continuedwhich hit a low of $302,400 in November 2018. See Item 8, Financial Statements and Supplementary Data, Note 6, Expected Loss to rise atbe Paid, for a 5.6% rate over the 12 months ended November 30, 2016.
From the beginningdiscussion of the assumptions used in determining expected losses for U.S. RMBS.
The federal funds rate ended 2019 with a target range of 1.5% and 1.75%, having started the year at 2.25% and 2.50%. At the January 28-29, 2020 Federal Open Market Committee (FOMC) supported further improvement in labor market conditions and a return to 2% inflation. Itmeeting, the FOMC maintained the target range for the federal funds rate at 1/4between 1.5% and 1.75%. After that meeting, the FOMC released the following statement in regards to 1/2 percent until mid-December, whenits decision to maintain the fed funds rate at its current level: “The Committee judges that the current stance of monetary policy is appropriate to support sustained expansion of economic activity, strong labor market conditions, and inflation returning to the Committee's symmetric 2% objective. The Committee will continue to monitor the implications of incoming information for the economic outlook, including global developments and muted inflation pressures, as it raised it a quarter point to 1/2 to 3/4 percent and projected three additional increases during 2017. Averageassesses the appropriate path of the target range for the federal funds rate.”
In 2019, municipal interest rates were extremely lowreached new lows and credit spreads tightened further. The 30-year AAA Municipal Market Data (MMD) rate started the year off at 3.02% and ended the year at 2.09%. Credit spreads tightened during the year withas the spread between "A" and "AAA" 30-year AAAgeneral obligation fell from 51 basis points (bps) to start the year to as low as 35 bps on July 24th. It remained near that relatively narrow level through the end of the year. This is compared to an average of 53 bps in 2018 and 2017. The “AAA” 30-year MMD Index falling at times below 2%,benchmark yields reached 1.83% on August 28th, the lowest yield since the benchmark was first published in June 1981. Following the reporting period, the benchmark yield hit a threshold not previously crossedsubsequent new low.
When interest rates are low, or when the market is relatively less risk averse, the credit spread between high-quality or insured obligations versus lower-rated or uninsured obligations typically narrows. As a result, financial guaranty insurance typically provides lower interest cost savings to issuers than it would during periods of relatively wider credit spreads. Issuers are less likely to use financial guaranties on their new issues when credit spreads are narrow, which results in decreased demand or premiums obtainable for financial guaranty insurance, and a resulting reduction in the modern era. The low rates helped produce record issuanceCompany's results of operations. See “Key Business Strategies” below for market volume and penetration.
US equity markets were largely negative for 2018 due to equities dropping sharply in the fourth quarter of 2018, but experienced a very strong 2019. The Dow Jones Industrial Average, Nasdaq Composite Index and the S&P 500 Index all finished markedly higher for the full year.
During 2019, the U.S. municipal bond market while constrainingdollar remained stable against other currencies on a trade-weighted basis according to data from the opportunitiesFederal Reserve Bank of St. Louis. The Company believes this was the result of the Federal Reserve shifting its monetary policy path to a more accommodating one, bringing it more in line with other key central banks (e.g., Bank of Japan, the Bank of England and the European Central Bank). See Item 8, Financial Statements and Supplementary Data, Note 7, Contracts Accounted for bond insurers to add financial value.as Insurance and Note 10, Investments and Cash, for gains/losses on foreign exchange rate changes on the consolidated statements of operations.
Financial Performance of Assured Guaranty
Financial Resultsresults include the results of BlueMountain after the date of acquisition on October 1, 2019.
Financial Results
|
| | | | | | | | | | | |
| | Year Ended December 31, |
| | 2016 | | 2015 | | 2014 |
| | (in millions, except per share amounts) |
| Net income (loss) | $ | 881 |
| | $ | 1,056 |
| | $ | 1,088 |
|
| Operating income (non-GAAP)(1) | 895 |
| | 710 |
| | 647 |
|
| Gain (loss) related to the effect of consolidating FG VIEs (FG VIE consolidation) included in operating income | 12 |
| | 11 |
| | 156 |
|
| | | | | | |
| Net income (loss) per diluted share | 6.56 |
| | 7.08 |
| | 6.26 |
|
| Operating income per share (non-GAAP)(1) | 6.68 |
| | 4.76 |
| | 3.73 |
|
| Gain (loss) related to FG VIE consolidation included in operating income per share | 0.10 |
| | 0.07 |
| | 0.90 |
|
| | | | | | |
| Diluted shares | 134.1 |
| | 149.0 |
| | 173.6 |
|
| | | | | | |
| Gross written premiums (GWP) | 154 |
| | 181 |
| | 104 |
|
| Present value of new business production (PVP)(1) | 214 |
| | 179 |
| | 168 |
|
| Gross par written | 17,854 |
| | 17,336 |
| | 13,171 |
|
|
| | | | | | | | | | | |
| | Year Ended December 31, |
| | 2019 | | 2018 | | 2017 |
| | (in millions, except per share amounts) |
| GAAP Highlights | | | | | |
| Net income (loss) attributable to AGL | $ | 402 |
| | $ | 521 |
| | $ | 730 |
|
| Net income (loss) attributable to AGL per diluted share | 4.00 |
| | 4.68 |
| | 5.96 |
|
| Weighted Average Diluted shares | 100.2 |
| | 111.3 |
| | 122.3 |
|
| | | | | | |
| Adjusted operating income (loss) (1) (2) | | | | | |
| Insurance | $ | 512 |
| | $ | 582 |
| | $ | 732 |
|
| Asset Management | (10 | ) | | — |
| | — |
|
| Corporate | (111 | ) | | (96 | ) | | (83 | ) |
| Other | — |
| | (4 | ) | | 12 |
|
| Adjusted operating income (loss) | 391 |
| | 482 |
| | 661 |
|
| Adjusted operating income per diluted share (2) | 3.91 |
| | 4.34 |
| | 5.41 |
|
| | | | | | |
| Insurance Segment | | | | | |
| Gross written premiums (GWP) | $ | 677 |
| | $ | 612 |
| | $ | 307 |
|
| Present value of new business production (PVP) (1) | 463 |
| | 663 |
| | 289 |
|
| Gross par written | 24,353 |
| | 24,624 |
| | 18,024 |
|
| Asset Management Segment | | | | | |
| CLO net inflows | $ | 885 |
| | $ | — |
| | $ | — |
|
| Wind-down funds net outflows | (1,297 | ) | | — |
| | — |
|
|
| | | | | | | | | | | | | | | | |
| | | As of December 31, 2016 | | As of December 31, 2015 |
| | | Amount | | Per Share | | Amount | | Per Share |
| | | (in millions, except per share amounts) |
| Shareholders' equity | | $ | 6,504 |
| | $ | 50.82 |
| | $ | 6,063 |
| | $ | 43.96 |
|
| Non-GAAP operating shareholders' equity(1) | | 6,386 |
| | 49.89 |
| | 5,925 |
| | 42.96 |
|
| Non-GAAP adjusted book value(1) | | 8,506 |
| | 66.46 |
| | 8,396 |
| | 60.87 |
|
| Gain (loss) related to FG VIE consolidation included in non-GAAP operating shareholders' equity | | (7 | ) | | (0.06 | ) | | (21 | ) | | (0.15 | ) |
| Gain (loss) related to FG VIE consolidation included in non-GAAP adjusted book value | | (24 | ) | | (0.18 | ) | | (43 | ) | | (0.31 | ) |
| Common shares outstanding (2) | | 128.0 |
| | | | 137.9 |
| | |
|
| | | | | | | | | | | | | | | | |
| | | As of December 31, 2019 | | As of December 31, 2018 |
| | | Amount | | Per Share | | Amount | | Per Share |
| | | (in millions, except per share amounts) |
| Shareholders' equity attributable to AGL | | $ | 6,639 |
| | $ | 71.18 |
| | $ | 6,555 |
| | $ | 63.23 |
|
| Adjusted operating shareholders' equity (1) (3) | | 6,246 |
| | 66.96 |
| | 6,342 |
| | 61.17 |
|
| Adjusted book value (1) (4) | | 9,035 |
| | 96.86 |
| | 8,922 |
| | 86.06 |
|
| Gain (loss) related to the effect of consolidating VIEs (VIE consolidation) included in adjusted operating shareholders' equity | | 7 |
| | 0.07 |
| | 3 |
| | 0.03 |
|
| Gain (loss) related to VIE consolidation included in adjusted book value | | (4 | ) | | (0.05 | ) | | (15 | ) | | (0.15 | ) |
| Common shares outstanding (5) | | 93.3 |
| | | | 103.7 |
| | |
____________________
| |
| (1) | Please refer to “—See “-- Non-GAAP Financial Measures” for a definition of the financial measures that were not determined in accordance with GAAPaccounting principles generally accepted in the United States of America (GAAP) and a reconciliation of the non-GAAP financial measure to the most directly comparable GAAP measure, if available. Please note that the Company changed its definition of Operating Income, Non-GAAP Operating Shareholders' Equity and Non-GAAP Adjusted Book Value starting in fourth quarter 2016 in response to new non-GAAP guidance issued by the SEC in 2016. Please refer to “—See “-- Non-GAAP Financial Measures” for additional details. |
| |
| (2) | Please refer to "Key"Adjusted operating income" was formerly known as "Non-GAAP operating income." |
| |
| (3) | "Adjusted operating shareholders' equity" was formerly known as "Non-GAAP operating shareholders' equity." |
| |
| (4) | "Adjusted book value" was formerly known as "Non-GAAP adjusted book value." |
| |
| (5) | See “Key Business Strategies –-- Capital Management"Management” below for information on common share repurchases. |
Year Ended December 31, 2016
Several primary drivers of volatility in net income or loss are not necessarily indicative of credit impairment or improvement, or ultimate economic gains or losses:losses such as: changes in credit spreads of insured credit derivative obligations;obligations, changes in fair value of assets and liabilities of financial guaranty variable interest entities (FG VIEs)VIEs and committed capital securities (CCS);CCS, changes in fair value of credit derivatives related to the Company's own credit spreads;spreads, and changes in risk-free rates used to discount expected losses. Changes
Other factors that drive volatility in credit spreads generally havenet income in the most significant effect on the fair value of credit derivatives and FG VIE assets and liabilities. In addition to non-economic factors, other factors such as:Insurance segment include: changes in expected losses,claims and recoveries, the amount and timing of the refunding transactions and terminations,and/or termination of insured obligations, realized gains and losses on the investment portfolio (including other-than-temporary impairments)impairments (OTTI)), changes in foreign exchange rates, the effects of large settlements, and transactions,commutations, acquisitions, and the effects of the Company's various loss mitigation strategies, and changes in the fair value of investments in Assured Investment Management funds. In the Asset Management segment, changes in the fair value of Assured Investment Management funds affect the amount of management and performance fees earned. Changes in laws and regulations, among others,other factors, may also have a significant effect on reported net income or loss in a given reporting period.
Consolidated Results of Operations
Consolidated Results of Operations
|
| | | | | | | | | | | |
| | Year Ended December 31, |
| | 2019 | | 2018 | | 2017 |
| | (in millions) |
| Revenues: | | | | | |
| Net earned premiums | $ | 476 |
| | $ | 548 |
| | $ | 690 |
|
| Net investment income | 378 |
| | 395 |
| | 417 |
|
| Asset management fees | 22 |
| | — |
| | — |
|
| Net realized investment gains (losses) | 22 |
| | (32 | ) | | 40 |
|
| Net change in fair value of credit derivatives | (6 | ) | | 112 |
| | 111 |
|
| Fair value gains (losses) on FG VIEs | 42 |
| | 14 |
| | 30 |
|
| Foreign exchange gains (losses) on remeasurement | 24 |
| | (37 | ) | | 60 |
|
| Bargain purchase gain and settlement of pre-existing relationships | — |
| | — |
| | 58 |
|
| Commutation gains (losses) | 1 |
| | (16 | ) | | 328 |
|
| Other income (loss) | 4 |
| | 17 |
| | 5 |
|
| Total revenues | 963 |
| | 1,001 |
| | 1,739 |
|
| Expenses: | | | | | |
| Loss and LAE | 93 |
| | 64 |
| | 388 |
|
| Interest expense | 89 |
| | 94 |
| | 97 |
|
| Amortization of DAC | 18 |
| | 16 |
| | 19 |
|
| Employee compensation and benefit expenses | 178 |
| | 152 |
| | 143 |
|
| Other operating expenses | 125 |
| | 96 |
| | 101 |
|
| Total expenses | 503 |
| | 422 |
| | 748 |
|
| Income (loss) before provision for income taxes and equity in net earnings of investees | 460 |
| | 579 |
| | 991 |
|
| Equity in net earnings of investees | 4 |
| | 1 |
| | — |
|
| Income (loss) before income taxes | 464 |
| | 580 |
| | 991 |
|
| Provision (benefit) for income taxes | 63 |
| | 59 |
| | 261 |
|
| Net income (loss) | 401 |
| | 521 |
| | 730 |
|
| Less: Redeemable noncontrolling interests | (1 | ) | | — |
| | — |
|
| Net income (loss) attributable to Assured Guaranty Ltd. | $ | 402 |
| | $ | 521 |
| | $ | 730 |
|
| Effective tax rate | 13.7 | % | | 10.2 | % | | 26.3 | % |
Year Ended December 31, 2019 Compared with Year Ended December 31, 2018
Net income attributable to AGL for 20162019 was $881 millionlower compared with $1,056 million in 2015. The decrease was2018 primarily due primarily to lower to:
fair value gainslosses on credit derivatives and CCS in 20162019 compared with 2015. This wasgains in 2018,
lower earned premiums consistent with the scheduled decline net par outstanding, as well as lower accelerations for refundings and terminations,
higher compensation and other operating expenses attributable to the BlueMountain Acquisition and its related fourth quarter 2019 expenses, and
higher loss and loss adjustment expenses in 2019.
These decreases were offset in part by lower loss and LAE and higher premium accelerations.
Under the revised calculation of non-GAAP measures explainedforeign exchange gains in "Non-GAAP Financial Measures" below, the Company reported operating income of $895 million in 2016,2019 compared with $710 millionlosses in 2015. 2018, realized gains on investment portfolio in 2019 compared with losses in 2018, higher gains on FG VIEs in 2019, and asset management fees from BlueMountain for fourth quarter 2019.
The increaseCompany’s effective tax rate reflects the proportion of income recognized by each of the Company’s operating subsidiaries, with U.S. subsidiaries generally taxed at the U.S. marginal corporate income tax rate of 21% in operating income2019 and 2018, U.K. subsidiaries taxed at the U.K. marginal corporate tax rate of 19%, and no taxes for the Company’s Bermuda Subsidiaries, unless subject to U.S. tax by election or as a U.S. controlled foreign corporation. The effective tax rate was primarilylower in 2019 due to lower operating loss and LAE and higher premium accelerations.the impact of final BEAT regulations issued in fourth quarter 2019 that allow alternative minimum tax credits to be used in the calculation.
Shareholders' equity attributable to AGL increased since December 31, 20152018 primarily due primarily to positive net income (including the effect of the CIFG Acquisition), which was partially offset by share repurchases, lower netand unrealized gains on available for sale investment securities, recorded in AOCI, and dividends. Non-GAAP operating shareholders' equity and non-GAAP adjusted book value also increased since December 31, 2015 due to positive operating income (including the effect of the CIFG Acquisition), offset in part by share repurchases and dividends. BookAdjusted operating shareholders' equity decreased in 2019primarily due to share repurchases and dividends, partially offset by positive adjusted operating income. Adjusted book value non-GAAPincreased slightly in 2019 primarily due to new business development, partially offset by share repurchases and dividends.
Shareholders' equity attributable to AGL per share, adjusted operating shareholders' equity per share and non-GAAP adjusted book value per share alsoall increased in 2019 to $71.18, $66.96 and $96.86, respectively, which benefited from the repurchase of 10.7an additional 11.2 million common shares in 2016.2019. See “Accretive Effect of Cumulative Repurchases” table below.
Year Ended December 31, 2018 Compared with Year Ended December 31, 2017
The Company's comparison of 2018 results to 2017 results is included in the Company's Annual Report on Form 10-K for the fiscal year ended December 31, 2018, under Part II, Item 7, Management's Discussion and Analysis of Financial Condition and Results of Operations, Executive Summary and Results of Operations.
Key Business Strategies
The Company continually evaluates its business strategies. For example, with the BlueMountain Acquisition the Company has increased its focus on asset management and alternative investments. Currently, the Company is pursuing the following key business strategies each described in more detail below:three areas:
New business productionInsurance
Capital management
Asset Management and Alternative strategies to create value, including through acquisitions, investments and commutationsInvestments
Loss mitigation
New Business Production
The Company believes high-profile defaults by municipal obligors, such as the Commonwealth of Puerto Rico, Detroit, Michigan and Stockton, California have led to increased awareness of the value of bond insurance and stimulated demand for the product. The Company believes there will be continued demand for its insurance in this market because, for those exposures that the Company guarantees, it undertakes the tasks of credit selection, analysis, negotiation of terms, surveillance and, if necessary, loss mitigation. The Company believes that its insurance:
encourages retail investors, who typically have fewer resources than the Company for analyzing municipal bonds, to purchase such bonds;
enables institutional investors to operate more efficiently; and
allows smaller, less well-known issuers to gain market access on a more cost-effective basis.
On the other hand, the persistently low interest rate environment has dampened demand for bond insurance and, after a number of years in which the Company was essentially the only financial guarantor, there are now two other financial guarantors active in one of its markets.
U.S. Municipal Market Data and Penetration Rates (1)
Based on Sale Date
|
| | | | | | | | | | | |
| | Year Ended December 31, |
| | 2016 | | 2015 | | 2014 |
| | (dollars in billions, except number of issues and percent) |
| Par: | | | | | |
| New municipal bonds issued | $ | 423.7 |
| | $ | 377.6 |
| | $ | 314.9 |
|
| Total insured | $ | 25.3 |
| | $ | 25.2 |
| | $ | 18.5 |
|
| Insured by Assured Guaranty | $ | 14.2 |
| | $ | 15.1 |
| | $ | 10.7 |
|
| Number of issues: | | | | | |
| New municipal bonds issued | 12,271 |
| | 12,076 |
| | 10,162 |
|
| Total insured | 1,889 |
| | 1,880 |
| | 1,403 |
|
| Insured by Assured Guaranty | 904 |
| | 1,009 |
| | 697 |
|
| Market penetration based on: | | | | | |
| Par | 6.0 | % | | 6.7 | % | | 5.9 | % |
| Number of issues | 15.4 | % | | 15.6 | % | | 13.8 | % |
| Single A par sold | 22.6 | % | | 22.1 | % | | 19.7 | % |
| Single A transactions sold | 55.8 | % | | 54.1 | % | | 49.3 | % |
| $25 million and under par sold | 17.8 | % | | 18.7 | % | | 16.5 | % |
| $25 million and under transactions sold | 17.5 | % | | 17.6 | % | | 15.4 | % |
____________________(1) Source: Thomson Reuters.
New Business Production
|
| | | | | | | | | | | |
| | Year Ended December 31, |
| | 2016 | | 2015 | | 2014 |
| | (in millions) |
| GWP | | | | | |
| Public Finance—U.S. | $ | 142 |
| | $ | 119 |
| | $ | 122 |
|
| Public Finance—non-U.S. | 15 |
| | 41 |
| | 6 |
|
| Structured Finance—U.S. | (1 | ) | | 23 |
| | (32 | ) |
| Structured Finance—non-U.S. | (2 | ) | | (2 | ) | | 8 |
|
| Total GWP | $ | 154 |
| | $ | 181 |
| | $ | 104 |
|
| PVP(1): | | | | | |
| Public Finance—U.S. | $ | 161 |
| | $ | 124 |
| | $ | 128 |
|
| Public Finance—non-U.S. | 25 |
| | 27 |
| | 7 |
|
| Structured Finance—U.S. (2) | 27 |
| | 22 |
| | 24 |
|
| Structured Finance—non-U.S. | 1 |
| | 6 |
| | 9 |
|
| Total PVP | $ | 214 |
| | $ | 179 |
| | $ | 168 |
|
| Gross Par Written: | | | | | |
| Public Finance—U.S. | $ | 16,039 |
| | $ | 16,377 |
| | $ | 12,275 |
|
| Public Finance—non-U.S. | 677 |
| | 567 |
| | 128 |
|
| Structured Finance—U.S. (2) | 1,114 |
| | 327 |
| | 418 |
|
| Structured Finance—non-U.S. | 24 |
| | 65 |
| | 350 |
|
| Total gross par written | $ | 17,854 |
| | $ | 17,336 |
| | $ | 13,171 |
|
____________________
| |
(1) | PVP and Gross Par Written in the table above are based on "close date," when the transaction settles. See “– Non-GAAP Financial Measures – PVP or Present Value of New Business Production.” |
| |
(2) | Includes a structured capital relief Triple-X excess of loss life reinsurance transaction written in 2016. |
GWP include amounts collected in the current year on upfront new business written, the present value of contractual or expected premiums on new business written (discounted at risk free rates), and the effects of changes in the estimated lives of transactions in the inforce book of business. The decrease in GWP to $154 million in 2016 from $181 million in 2015, was due primarily to changes in estimated lives.
For the year ended December 31, 2016 compared with the year ended December 31, 2015, PVP increased by approximately 20% to $214 million, primarily due to an increase in secondary market U.S. public finance new business.
Outside the U.S., the Company generated $26 million of PVP in 2016 compared with $33 million of PVP in 2015. Non-U.S. public finance business generally represents European infrastructure transactions. The Company believes the U.K. currently presents the most new business opportunities for financial guarantees of infrastructure financings, which have typically required such guarantees for capital market access. These transactions typically have long lead times. The Company believes it is the only company in the private sector offering such financial guarantees outside the United States.
Structured finance transactions tend to have long lead times and may vary from period to period In general, the Company expects that structured finance opportunities will increase in the future as the global economy recovers, interest rates rise, more issuers return to the capital markets for financings and institutional investors again utilize financial guaranties. The Company considers its involvement in both structured finance and international infrastructure transactions to be beneficial because such transactions diversify both the Company's business opportunities and its risk profile beyond public finance. This category also includes a structured capital relief Triple-X excess of loss life reinsurance transaction.
The difference between GWP and PVP relates primarily to the difference in discount rates used in the calculation of PVP compared with GWP and the inclusion in GWP of the effects of changes in lives of the existing insured portfolio.
Capital Management
In recent years, the Company has developed strategies to manage capital within the Assured Guaranty group more efficiently.Insurance
In 2016, AGM sought and received approval from the NYDFS to repurchase $300 million of its common stock from its parent, Assured Guaranty Municipal Holdings Inc. (AGMH). The repurchase was effectuated on December 19, 2016. Subsequently, AGMH distributed the proceeds as dividends to its immediate parent, AGUS, and in 2017, AGUS began using these proceeds to pay dividends to AGL. AGL intends to use these funds predominantly to repurchase its publicly traded common shares. AGM and AGC have also been paying dividends to their parents, and MAC may also pay dividends to its parents. See Part II, Item 8, Financial Statements and Supplementary Data, Note 11, Insurance Company Regulatory Requirements for additional information about dividends the Company's insurance companies may and have paid.
In 2014, AGUS issued 5.0% Senior Notes for net proceeds of $495 million. The net proceeds from the sale of the notes were used for general corporate purposes, including the repurchase of common shares of AGL.
From 2013 through February 23, 2017, the Company has repurchased a total of 72.2 million common shares for approximately $1,857 million, excluding commissions. On February 22, 2017 the Board of Directors authorized an additional $300 million in share repurchases. As of February 23, 2017, $407 million of authority remains under the Company's share repurchase authorizations. The Company expects the repurchases to be made from time to time in the open market or in privately negotiated transactions. The timing, form and amount of the share repurchases under the program are at the discretion of management and will depend on a variety of factors, including free funds available at the parent company, market conditions, the Company's capital position, legal requirements and other factors. The repurchase program may be modified, extended or terminated by the Board at any time. It does not have an expiration date. See Part II, Item 8, Financial Statements and Supplementary Data, Note 18, Shareholders' Equity, for additional information about the Company's repurchases of its common shares.
Summary of Share Repurchases
|
| | | | | | | | | | |
| | Amount | | Number of Shares | | Average price per share |
| | (in millions, except per share data) |
| 2013 | $ | 264 |
| | 12.5 |
| | $ | 21.12 |
|
| 2014 | 590 |
| | 24.4 |
| | 24.17 |
|
| 2015 | 555 |
| | 21.0 |
| | 26.43 |
|
| 2016 | 306 |
| | 10.7 |
| | 28.53 |
|
| 2017 (through February 23, 2017) | 142 |
| | 3.6 |
| | 39.65 |
|
| Cumulative repurchases since the beginning of 2013 | $ | 1,857 |
| | 72.2 |
| | $ | 25.71 |
|
Accretive Effect of Cumulative Repurchases(1)
|
| | | | | | | | | | | | | | | | |
| | | Year Ended December 31, | | | | |
| | | 2016 | | 2015 | | As of
December 31, 2016 | | As of
December 31, 2015 |
| | | (per share) |
| Net income | | $ | 1.90 |
| | $ | 1.56 |
| | | | |
| Operating income | | 1.94 |
| | 1.00 |
| | | | |
| Shareholders' equity | | | | | | $ | 8.92 |
| | $ | 5.75 |
|
| Non-GAAP operating shareholders' equity | | | | | | 8.59 |
| | 5.45 |
|
| Non-GAAP adjusted book value | | | | | | 14.38 |
| | 10.74 |
|
_________________
| |
(1) | Cumulative repurchases since the beginning of 2013. |
In order to reduce leverage, and possibly rating agency capital charges, the Company has mutually agreed with beneficiaries to terminate selected financial guaranty insurance and credit derivative contracts. In particular, the Company has targeted investment grade securities for which claims are not expected but which carry a disproportionately large rating agency capital charge. The Company terminated investment grade financial guaranty and CDS contracts with net par of $6.6 billion in 2016, $2.8 billion in 2015 and $3.1 billion in 2014.
Alternative Strategies
The Company considers alternative strategiesseeks to grow the insurance business through new business production, acquisitions of legacy monolines and reinsurance transactions, and to continue to mitigate losses in orderits current insured portfolio.
Growth of the Insured Portfolio
The Company seeks to create long-term shareholder value.grow its insurance portfolio through new business production in each of its three markets: U.S. public finance, international infrastructure and global structured finance. The Company believes high-profile defaults by municipal obligors, such as Puerto Rico, Detroit, Michigan and Stockton, California have led to increased awareness of the value of bond insurance and stimulated demand for the product. The Company believes there will be continued demand for its insurance in this market because, for those exposures that the Company guarantees, it undertakes the tasks of credit selection, analysis, negotiation of terms, surveillance and, if necessary, loss mitigation. The Company believes that its insurance:
encourages retail investors, who typically have fewer resources than the Company for analyzing municipal bonds, to purchase such bonds;
enables institutional investors to operate more efficiently; and
allows smaller, less well-known issuers to gain market access on a more cost-effective basis.
On the other hand, the persistently low interest rate environment and relatively tight U.S. municipal credit spreads have dampened demand for bond insurance, and provisions in legislation known as the Tax Act, such as the termination of the tax-exempt status of advance refunding bonds and the reduction in corporate tax rates, have resulted in a reduction of supply and made municipal obligations less attractive to certain institutional investors.
In certain segments of the global infrastructure and structured finance markets the Company believes its financial guaranty product is competitive with other financing options. For example, certain investors may receive advantageous capital requirement treatment with the addition of the Company’s guaranty. The Company considers its involvement in both international infrastructure and structured finance transactions to be beneficial because such transactions diversify both the Company's business opportunities and its risk profile beyond U.S. public finance. Quarterly business activity in the international infrastructure and structured finance sectors is influenced by typically long lead times and therefore may vary from quarter to quarter.
The Company also considers opportunities to acquire financial guaranty portfolios, whether by acquiring financial guarantors who are no longer actively writing new business or their insured portfolios, or by commuting business that it had previously ceded.portfolios. These transactions enable the Company to improve its future earnings and deploy someexcess capital.
Assumption of its excess capital. During 2016,Insured Portfolio. On June 1, 2018, the Company established an alternative investments group to focusclosed a transaction with Syncora Guarantee Inc. (SGI) (SGI Transaction) under which AGC assumed, generally on deploying a portion of the Company's excess capital to pursue acquisitions and develop new business opportunities that complement the Company's financial guaranty business, are in line with its risk profile and benefit from its core competencies.
CIFG Holding Inc. On July 1, 2016, AGC acquired100% quota share basis, substantially all of the issuedSGI’s insured portfolio and outstanding capital stockAGM reassumed a book of CIFGH, for $450.6 million in cash. AGUSbusiness previously owned 1.6% of the outstanding shares of CIFGH, for which it received $7.1 million in consideration from AGC, resulting in a net consolidated purchase price of $443 million. AGC merged CIFGNA with and into AGC, with AGC as the surviving company, on July 5, 2016.ceded to SGI by AGM. The CIFG Acquisition added $4.2 billion of net par insured on Julyvalue of exposures reinsured and commuted as of June 1, 2016. In 2016, the acquisition contributed net income and operating income of2018 totaled approximately $2.41$12 billion. The SGI Transaction reduced shareholders' equity by $0.16 per share, and $2.38 per share, respectively, including the bargain purchase gain,due to a commutation loss on settlementthe reassumed book of pre-existing relationshipsbusiness, and activity since the the date of the CIFG Acquisition (CIFG Acquisition Date). Shareholders' equity benefited by $2.23 per share, non-GAAP operating shareholders' equity benefited by $2.23 per share and non-GAAPincreased adjusted book value benefited by $3.85$2.25 per share asshare. Additionally, beginning on June 1, 2018, on behalf of SGI, AGC began providing certain administrative services on the CIFG Acquisition Date.assumed portfolio, including surveillance, risk management, and claims processing.
Radian Asset Assurance Inc. On April 1, 2015 (the Radian Acquisition Date), AGC completed the acquisition of Radian Asset for a cash purchase price of $804.5 million. In connection with the acquisition, AGC acquired Radian Asset’s entire insured portfolio, which resulted in an increase in net par outstanding as of the Radian Acquisition Date of approximately $13.6 billion, consisting of $9.4 billion of public finance net par outstanding and $4.2 billion of structured finance net par outstanding. In 2015, the acquisition contributed net income of approximately $2.46 per share and operating income of approximately $2.13 per share, including the bargain purchase gain, settlement of pre-existing relationships and activity since the Radian Acquisition Date. Shareholders' equity benefited by $1.04 per share, non-GAAP operating shareholders' equity benefited by $1.26 per share and non-GAAP adjusted book value benefited by $3.73 per share as of the Radian Acquisition Date.
MBIA UK Insurance Limited.Acquisitions:On January 10, 2017, AGC completed its acquisition of MBIA UK, Insurance Limited (MBIA UK), the European operating subsidiarywhich added a total of MBIA. As consideration for the outstanding shares of$12 billion in net par. At acquisition, MBIA UK plus $23 million in cash, AGC exchanged all its holdingscontributed shareholders' equity of notes issued in the Zohar II 2005-1 transaction. AGC’s Zohar II 2005-1 notes had a total outstanding principal of approximately $347$84 million and fairadjusted book value of $334 million as of the date of acquisition. MBIA insured all of the notes issued in the Zohar II 2005-1 transaction. As of December 31, 2016, MBIA UK had an insured portfolio of approximately $12 billion of net par. MBIA UK has changed its name to Assured Guaranty (London) Ltd. (AGLN). Assured Guaranty currently maintains AGLN as a stand-alone entity. Assured Guaranty is actively working to combine AGLN with its other affiliated European insurance companies. Any such combination will be subject to regulatory and court approvals; as a result, Assured Guaranty cannot predict when, or if, such a combination will be completed.$322 million.
Alternative Investments. The alternative investments group has been investigating a number of new business opportunities that complement the Company's financial guaranty business, are in line with its risk profile and benefit from its core competencies, including, among others, both controlling and non-controlling investments in investment managers. In February 2017 the Company agreed to purchase up to $100 million of limited partnership interests in a fund that invests in the equity of private equity managers. The Company continues to investigate additional opportunities.
Commutations. The Company entered into various commutation agreements to reassume previously ceded business in 2016, 20152019, 2018 and 20142017 that resulted in gains of $8$1 million in 2016, $282019, losses of $16 million in 20152018 and $23gains of $328 million in 2014 and additional2017. The commutations added net unearned premium reserve of $0 in 2016, $23$15 million in 20152019 and $20$64 million in 2014. The commutation gains were recorded in other income. The2018. In the future, the Company may also in the future enter into new commutation agreements reassumingto reassume portions of its remaining previouslyinsured business ceded business.to other reinsurers, but such opportunities are expected to be limited given the small number of unaffiliated reinsurers currently reinsuring the Company.
U.S. Municipal Market Data and Bond Insurance Penetration Rates (1)
Based on Sale Date
|
| | | | | | | | | | | |
| | Year Ended December 31, |
| | 2019 | | 2018 | | 2017 |
| | (dollars in billions, except number of issues and percent) |
| Par: | | | | | |
| New municipal bonds issued | $ | 406.6 |
| | $ | 320.3 |
| | $ | 409.5 |
|
| Total insured | $ | 23.9 |
| | $ | 18.9 |
| | $ | 23.0 |
|
| Insured by Assured Guaranty | $ | 14.0 |
| | $ | 10.5 |
| | $ | 13.5 |
|
| Number of issues: | | | | | |
| New municipal bonds issued | 10,590 |
| | 8,555 |
| | 10,589 |
|
| Total insured | 1,724 |
| | 1,246 |
| | 1,637 |
|
| Insured by Assured Guaranty | 839 |
| | 596 |
| | 833 |
|
| Bond insurance market penetration based on: | | | | | |
| Par | 5.9 | % | | 5.9 | % | | 5.6 | % |
| Number of issues | 16.3 | % | | 14.6 | % | | 15.5 | % |
| Single A par sold | 21.4 | % | | 17.8 | % | | 23.3 | % |
| Single A transactions sold | 54.9 | % | | 52.8 | % | | 57.3 | % |
| $25 million and under par sold | 18.1 | % | | 17.2 | % | | 18.7 | % |
| $25 million and under transactions sold | 19.7 | % | | 17.1 | % | | 18.3 | % |
| |
| (1) | Source: The amounts in the table are those reported by Thomson Reuters. The table excludes Corporate-CUSIP healthcare and project finance transactions insured by Assured Guaranty, which the company also considers to be public finance business. |
Loss MitigationConsolidated Results of Operations
InConsolidated Results of Operations
|
| | | | | | | | | | | |
| | Year Ended December 31, |
| | 2019 | | 2018 | | 2017 |
| | (in millions) |
| Revenues: | | | | | |
| Net earned premiums | $ | 476 |
| | $ | 548 |
| | $ | 690 |
|
| Net investment income | 378 |
| | 395 |
| | 417 |
|
| Asset management fees | 22 |
| | — |
| | — |
|
| Net realized investment gains (losses) | 22 |
| | (32 | ) | | 40 |
|
| Net change in fair value of credit derivatives | (6 | ) | | 112 |
| | 111 |
|
| Fair value gains (losses) on FG VIEs | 42 |
| | 14 |
| | 30 |
|
| Foreign exchange gains (losses) on remeasurement | 24 |
| | (37 | ) | | 60 |
|
| Bargain purchase gain and settlement of pre-existing relationships | — |
| | — |
| | 58 |
|
| Commutation gains (losses) | 1 |
| | (16 | ) | | 328 |
|
| Other income (loss) | 4 |
| | 17 |
| | 5 |
|
| Total revenues | 963 |
| | 1,001 |
| | 1,739 |
|
| Expenses: | | | | | |
| Loss and LAE | 93 |
| | 64 |
| | 388 |
|
| Interest expense | 89 |
| | 94 |
| | 97 |
|
| Amortization of DAC | 18 |
| | 16 |
| | 19 |
|
| Employee compensation and benefit expenses | 178 |
| | 152 |
| | 143 |
|
| Other operating expenses | 125 |
| | 96 |
| | 101 |
|
| Total expenses | 503 |
| | 422 |
| | 748 |
|
| Income (loss) before provision for income taxes and equity in net earnings of investees | 460 |
| | 579 |
| | 991 |
|
| Equity in net earnings of investees | 4 |
| | 1 |
| | — |
|
| Income (loss) before income taxes | 464 |
| | 580 |
| | 991 |
|
| Provision (benefit) for income taxes | 63 |
| | 59 |
| | 261 |
|
| Net income (loss) | 401 |
| | 521 |
| | 730 |
|
| Less: Redeemable noncontrolling interests | (1 | ) | | — |
| | — |
|
| Net income (loss) attributable to Assured Guaranty Ltd. | $ | 402 |
| | $ | 521 |
| | $ | 730 |
|
| Effective tax rate | 13.7 | % | | 10.2 | % | | 26.3 | % |
Year Ended December 31, 2019 Compared with Year Ended December 31, 2018
Net income attributable to AGL for 2019 was lower compared 2018 primarily due to:
fair value losses on credit derivatives and CCS in 2019 compared with gains in 2018,
lower earned premiums consistent with the scheduled decline net par outstanding, as well as lower accelerations for refundings and terminations,
higher compensation and other operating expenses attributable to the BlueMountain Acquisition and its related fourth quarter 2019 expenses, and
higher loss and loss adjustment expenses in 2019.
These decreases were offset in part by foreign exchange gains in 2019 compared with losses in 2018, realized gains on investment portfolio in 2019 compared with losses in 2018, higher gains on FG VIEs in 2019, and asset management fees from BlueMountain for fourth quarter 2019.
The Company’s effective tax rate reflects the proportion of income recognized by each of the Company’s operating subsidiaries, with U.S. subsidiaries generally taxed at the U.S. marginal corporate income tax rate of 21% in 2019 and 2018, U.K. subsidiaries taxed at the U.K. marginal corporate tax rate of 19%, and no taxes for the Company’s Bermuda Subsidiaries, unless subject to U.S. tax by election or as a U.S. controlled foreign corporation. The effective tax rate was lower in 2019 due to the impact of final BEAT regulations issued in fourth quarter 2019 that allow alternative minimum tax credits to be used in the calculation.
Shareholders' equity attributable to AGL increased since December 31, 2018 primarily due to net income and unrealized gains on available for sale investment securities, offset in part by share repurchases and dividends. Adjusted operating shareholders' equity decreased in 2019primarily due to share repurchases and dividends, partially offset by positive adjusted operating income. Adjusted book value increased slightly in 2019 primarily due to new business development, partially offset by share repurchases and dividends.
Shareholders' equity attributable to AGL per share, adjusted operating shareholders' equity per share and adjusted book value per share all increased in 2019 to $71.18, $66.96 and $96.86, respectively, which benefited from the repurchase of an effortadditional 11.2 million shares in 2019. See “Accretive Effect of Cumulative Repurchases” table below.
Year Ended December 31, 2018 Compared with Year Ended December 31, 2017
The Company's comparison of 2018 results to avoid or reduce potential2017 results is included in the Company's Annual Report on Form 10-K for the fiscal year ended December 31, 2018, under Part II, Item 7, Management's Discussion and Analysis of Financial Condition and Results of Operations, Executive Summary and Results of Operations.
Key Business Strategies
The Company continually evaluates its business strategies. For example, with the BlueMountain Acquisition the Company has increased its focus on asset management and alternative investments. Currently, the Company is pursuing the following key business strategies in three areas:
Insurance
Asset Management and Alternative Investments
Capital Management
Insurance
The Company seeks to grow the insurance business through new business production, acquisitions of legacy monolines and reinsurance transactions, and to continue to mitigate losses in its current insured portfolio.
Growth of the Insured Portfolio
The Company seeks to grow its insurance portfolios,portfolio through new business production in each of its three markets: U.S. public finance, international infrastructure and global structured finance. The Company believes high-profile defaults by municipal obligors, such as Puerto Rico, Detroit, Michigan and Stockton, California have led to increased awareness of the value of bond insurance and stimulated demand for the product. The Company believes there will be continued demand for its insurance in this market because, for those exposures that the Company employs a numberguarantees, it undertakes the tasks of strategies.
In the public finance area, thecredit selection, analysis, negotiation of terms, surveillance and, if necessary, loss mitigation. The Company believes that its experienceinsurance:
encourages retail investors, who typically have fewer resources than the Company for analyzing municipal bonds, to purchase such bonds;
enables institutional investors to operate more efficiently; and
allows smaller, less well-known issuers to gain market access on a more cost-effective basis.
On the other hand, the persistently low interest rate environment and relatively tight U.S. municipal credit spreads have dampened demand for bond insurance, and provisions in legislation known as the Tax Act, such as the termination of the tax-exempt status of advance refunding bonds and the resources it is prepared to deploy, as well as its ability to provide bond insurance or other contributions as part of a solution, hasreduction in corporate tax rates, have resulted in more favorable outcomesa reduction of supply and made municipal obligations less attractive to certain institutional investors.
In certain segments of the global infrastructure and structured finance markets the Company believes its financial guaranty product is competitive with other financing options. For example, certain investors may receive advantageous capital requirement treatment with the addition of the Company’s guaranty. The Company considers its involvement in distressed publicboth international infrastructure and structured finance situations than would have been the case without its participation, as illustrated, for example, bytransactions to be beneficial because such transactions diversify both the Company's rolebusiness opportunities and its risk profile beyond U.S. public finance. Quarterly business activity in the Detroit, Michigan; Stockton, California;international infrastructure and Jefferson County, Alabama financial crises. Currently, the Companystructured finance sectors is an active participant in discussions with the Commonwealth of Puerto Ricoinfluenced by typically long lead times and its advisors with respecttherefore may vary from quarter to a number of Puerto Rico credits. For example, on December 24, 2015, AGC and AGM entered into a Restructuring Support Agreement (RSA) with Puerto Rico Electric Power Authority (PREPA), an ad hoc group of uninsured bondholders and a group of fuel-line lenders that would, subject to certain conditions, result in, among other things, modernization of the utility and a restructuring of current debt. Legislation meeting the requirements of the RSA was enacted on February 16, 2016, and a transition charge to be paid by PREPA rate payers for debt service on the securitization bonds as contemplated by the RSA was approved by the Puerto Rico Energy Commission on June 20, 2016. The closing of the restructuring transaction and the issuance of the surety bonds are subject to certain conditions, including execution of acceptable documentation and legal opinions. There can be no assurance that the conditions in the RSA will be met or that, if the conditions are met, the RSA's other provisions, including those related to the restructuring of the insured PREPA revenue bonds, will be implemented as currently agreed. In addition, there also can be no assurance that the negotiations with respect to other Puerto Rico credits will result in agreements on a consensual recovery plans.quarter.
The Company is currently working with the servicers of some of the RMBS it insures to encourage the servicers to provide alternatives to distressed borrowers that will encourage them to continue making payments on their loans and so improve the performance of the related RMBS. Many of the home equity lines of credit (HELOC) loans underlying the HELOC RMBS have entered or are entering their amortization periods, which results in material increases to the size of the monthly payments the borrowers are required to make.
The Company also continuesconsiders opportunities to purchase attractively priced obligations, including BIG obligations, that it hasacquire financial guaranty portfolios, whether by acquiring financial guarantors who are no longer actively writing new business or their insured portfolios. These transactions enable the Company to improve its future earnings and fordeploy excess capital.
Assumption of Insured Portfolio. On June 1, 2018, the Company closed a transaction with Syncora Guarantee Inc. (SGI) (SGI Transaction) under which it has expected lossesAGC assumed, generally on a 100% quota share basis, substantially all of SGI’s insured portfolio and AGM reassumed a book of business previously ceded to be paid, in order to mitigate the economic effect of insured losses (loss mitigation securities).SGI by AGM. The fairnet par value of assets purchased for loss mitigation purposesexposures reinsured and commuted as of December 31, 2016 (excludingJune 1, 2018 totaled approximately $12 billion. The SGI Transaction reduced shareholders' equity by $0.16 per share, due to a commutation loss on the reassumed book of business, and increased adjusted book value by $2.25 per share. Additionally, beginning on June 1, 2018, on behalf of SGI, AGC began providing certain administrative services on the assumed portfolio, including surveillance, risk management, and claims processing.
Acquisitions: On January 10, 2017, AGC completed its acquisition of MBIA UK, which added a total of $12 billion in net par. At acquisition, MBIA UK contributed shareholders' equity of $84 million and adjusted book value of the Company's insurance) was $1,299 million, with a par$322 million.
Commutations. The Company entered into various commutation agreements to reassume previously ceded business in 2019, 2018 and 2017 that resulted in gains of $2,243 million (including bonds related to FG VIEs of $49$1 million in fair value and $2362019, losses of $16 million in par).
2018 and gains of $328 million in 2017. The commutations added net unearned premium reserve of $15 million in 2019 and $64 million in 2018. In some instances, the terms of the Company's policy gives it the option to pay principal on an accelerated basis on an obligation on which it has paid a claim, thereby reducing the amount of guaranteed interest due in the future. The Company has at times exercised this option, which uses cash but reduces projected future, losses.
In an effort to recover losses the Company experienced inmay enter into new commutation agreements to reassume portions of its insured U.S. RMBS portfolio, the Company also continuesbusiness ceded to pursue providers of representations and warranties (R&W) by enforcing R&W provisions in contracts, negotiating agreements with R&W providers relating to those provisions and, where appropriate, pursuing litigation against R&W providers. See Part II, Item 8, Financial Statements and Supplementary Data, Note 5, Expected Loss to be Paid.
Other Events
Brexit
The Company is evaluating the impact on its business of the referendum held in the U.K on June 23, 2016, in which a majority voted to exit the EU, known as “Brexit”. Negotiationsother reinsurers, but such opportunities are expected to commence soon to determinebe limited given the future termssmall number of unaffiliated reinsurers currently reinsuring the U.K’s relationship with the EU, including the terms of trade between the U.K. and the EU. The negotiations, once commenced, are likely to last for two years, or possibly more. Brexit may impact laws, rules and regulations applicable to the Company’s U.K. subsidiaries and U.K. operations.Company.
The Company cannot predict the direction Brexit-related developments will take nor the impact of those developmentsU.S. Municipal Market Data and Bond Insurance Penetration Rates (1)
Based on the economies of the markets the Company serves, which may materially adversely affect the Company’s business, results of operations and financial condition, but the Company has identified certain areas where Brexit may impact its business:Sale Date
Currency Impact.The Company reports its accounts in U.S. dollars, while some of its income, expenses, assets and liabilities are denominated in other currencies, primarily the pound sterling and the euro. From December 31, |
| | | | | | | | | | | |
| | Year Ended December 31, |
| | 2019 | | 2018 | | 2017 |
| | (dollars in billions, except number of issues and percent) |
| Par: | | | | | |
| New municipal bonds issued | $ | 406.6 |
| | $ | 320.3 |
| | $ | 409.5 |
|
| Total insured | $ | 23.9 |
| | $ | 18.9 |
| | $ | 23.0 |
|
| Insured by Assured Guaranty | $ | 14.0 |
| | $ | 10.5 |
| | $ | 13.5 |
|
| Number of issues: | | | | | |
| New municipal bonds issued | 10,590 |
| | 8,555 |
| | 10,589 |
|
| Total insured | 1,724 |
| | 1,246 |
| | 1,637 |
|
| Insured by Assured Guaranty | 839 |
| | 596 |
| | 833 |
|
| Bond insurance market penetration based on: | | | | | |
| Par | 5.9 | % | | 5.9 | % | | 5.6 | % |
| Number of issues | 16.3 | % | | 14.6 | % | | 15.5 | % |
| Single A par sold | 21.4 | % | | 17.8 | % | | 23.3 | % |
| Single A transactions sold | 54.9 | % | | 52.8 | % | | 57.3 | % |
| $25 million and under par sold | 18.1 | % | | 17.2 | % | | 18.7 | % |
| $25 million and under transactions sold | 19.7 | % | | 17.1 | % | | 18.3 | % |
| |
| (1) | Source: The amounts in the table are those reported by Thomson Reuters. The table excludes Corporate-CUSIP healthcare and project finance transactions insured by Assured Guaranty, which the company also considers to be public finance business. |
2015 to December 31, 2016, the value of pound sterling dropped from £0.68 per dollar to £0.81 per dollar, while the euro dropped from €0.83 per dollar to €0.95 per dollar. For the year ended 2016 the Company recognized losses of approximately $21 million in the consolidated statement of operations, net of tax, and approximately $32 million in OCI, net of tax, for foreign currency translation, that were primarily driven by the exchange rate fluctuations of the pound sterling. If the Company had owned AGLN during 2016, these impacts would have been greater.
U.K. Business. As of December 31, 2016, approximately $15.9 billion of the Company’s insured net par is to risks located in the U.K., and most of that exposure is to utilities, with much of the rest to hospital facilities, toll roads, government accommodation, housing associations, universities and other public purpose enterprises that the Company believes are not overly vulnerable to Brexit pressures. AGE is currently authorized by the PRA of the Bank of England with permissions sufficient to enable AGE to effect and carry out financial guaranty insurance and reinsurance in the U.K. Most of the new transactions insured by AGE since 2008 have been in the U.K. As of December 31, 2016, approximately $10.0 billion of insured net par of AGLN, which the Company acquired in January 2017, is to risks located in the U.K.
Business Elsewhere in the EU. As of December 31, 2016, approximately $5.5 billion of the Company’s insured net par is to risks located in EU and EEA countries other than the U.K. As of December 31, 2016, approximately $1.5 billion of insured net par of AGLN, which the Company acquired in January 2017, is to risks located in EU and EEA countries other than the U.K. Currently, EU directives allow AGE to conduct business in other EU or EEA states based on its PRA permissions. This is sometimes called “passporting”. Depending on the terms of Brexit, AGE may, once Brexit is implemented, lose the ability to insure new transactions from London in non-U.K. EU and EEA countries without obtaining additional licenses, which may require a presence in another EU country. While pertinent laws and regulations have yet to be adopted or passed, the Company does not believe Brexit will adversely affect its surveillance and loss mitigation activities with respect to existing insured transactions in non-U.K. EU and EEA countries, except to the extent Brexit inhibits the issuance of new guaranties in distressed situations in non-U.K. EU or EEA countries. As noted above, most of the new transactions insured by AGE since 2008 have been in the U.K.
Employees.While nearly one-third of the employees working in AGE’s London office are non-U.K. EU or EEA citizens, most of those employees currently qualify, and the Company expects the rest to qualify within the next two years, to become permanent residents under current U.K. law.
Results of Operations
Estimates and Assumptions
The Company’s consolidated financial statements include amounts that are determined using estimates and assumptions. The actual amounts realized could ultimately be materially different from the amounts currently provided for in the Company’s consolidated financial statements. Management believes the most significant items requiring inherently subjective and complex estimates are expected losses, fair value estimates, other-than-temporary impairment, deferred income taxes, and premium revenue recognition. The following discussion of the results of operations includes information regarding the estimates and assumptions used for these items and should be read in conjunction with the notes to the Company’s consolidated financial statements.
An understanding of the Company’s accounting policies is of critical importance to understanding its consolidated financial statements. See Part II, Item 8, Financial Statements and Supplementary Data, for a discussion of the significant accounting policies, the loss estimation process, and the fair value methodologies.
The Company carries a significant amount of its assets and a portion of its liabilities at fair value, the majority of which are measured at fair value on a recurring basis. Level 3 assets, consisting primarily of FG VIE’ assets, credit derivative assets and investments, represented approximately 19% and 20% of the total assets that are measured at fair value on a recurring basis as of December 31, 2016 and 2015, respectively. All of the Company's liabilities that are measured at fair value are Level 3. See Part II, Item 8, Financial Statements and Supplementary Data, Note 7, Fair Value Measurement, in for additional information about assets and liabilities classified as Level 3.
Consolidated Results of Operations
Consolidated Results of Operations
| | | | Year Ended December 31, | Year Ended December 31, |
| | 2016 | | 2015 | | 2014 | 2019 | | 2018 | | 2017 |
| | (in millions) | (in millions) |
| Revenues: | | | | | | | | | | |
| Net earned premiums | $ | 864 |
| | $ | 766 |
| | $ | 570 |
| $ | 476 |
| | $ | 548 |
| | $ | 690 |
|
| Net investment income | 408 |
| | 423 |
| | 403 |
| 378 |
| | 395 |
| | 417 |
|
| Asset management fees | | 22 |
| | — |
| | — |
|
| Net realized investment gains (losses) | (29 | ) | | (26 | ) | | (60 | ) | 22 |
| | (32 | ) | | 40 |
|
| Net change in fair value of credit derivatives: | | | | | | |
| Realized gains (losses) and other settlements | 29 |
| | (18 | ) | | 23 |
| |
| Net unrealized gains (losses) | 69 |
| | 746 |
| | 800 |
| |
| Net change in fair value of credit derivatives | 98 |
| | 728 |
| | 823 |
| (6 | ) | | 112 |
| | 111 |
|
| Fair value gains (losses) on CCS | 0 |
| | 27 |
| | (11 | ) | |
| Fair value gains (losses) on FG VIEs | 38 |
| | 38 |
| | 255 |
| 42 |
| | 14 |
| | 30 |
|
| Foreign exchange gains (losses) on remeasurement | | 24 |
| | (37 | ) | | 60 |
|
| Bargain purchase gain and settlement of pre-existing relationships | 259 |
| | 214 |
| | — |
| — |
| | — |
| | 58 |
|
| Commutation gains (losses) | | 1 |
| | (16 | ) | | 328 |
|
| Other income (loss) | 39 |
| | 37 |
| | 14 |
| 4 |
| | 17 |
| | 5 |
|
| Total revenues | 1,677 |
| | 2,207 |
| | 1,994 |
| 963 |
| | 1,001 |
| | 1,739 |
|
| Expenses: | | | | | | | | | | |
| Loss and LAE | 295 |
| | 424 |
| | 126 |
| 93 |
| | 64 |
| | 388 |
|
| Amortization of deferred acquisition costs | 18 |
| | 20 |
| | 25 |
| |
| Interest expense | 102 |
| | 101 |
| | 92 |
| 89 |
| | 94 |
| | 97 |
|
| Amortization of DAC | | 18 |
| | 16 |
| | 19 |
|
| Employee compensation and benefit expenses | | 178 |
| | 152 |
| | 143 |
|
| Other operating expenses | 245 |
| | 231 |
| | 220 |
| 125 |
| | 96 |
| | 101 |
|
| Total expenses | 660 |
| | 776 |
| | 463 |
| 503 |
| | 422 |
| | 748 |
|
| Income (loss) before provision for income taxes | 1,017 |
| | 1,431 |
| | 1,531 |
| |
| Income (loss) before provision for income taxes and equity in net earnings of investees | | 460 |
| | 579 |
| | 991 |
|
| Equity in net earnings of investees | | 4 |
| | 1 |
| | — |
|
| Income (loss) before income taxes | | 464 |
| | 580 |
| | 991 |
|
| Provision (benefit) for income taxes | 136 |
| | 375 |
| | 443 |
| 63 |
| | 59 |
| | 261 |
|
| Net income (loss) | $ | 881 |
| | $ | 1,056 |
| | $ | 1,088 |
| 401 |
| | 521 |
| | 730 |
|
| Less: Redeemable noncontrolling interests | | (1 | ) | | — |
| | — |
|
| Net income (loss) attributable to Assured Guaranty Ltd. | | $ | 402 |
| | $ | 521 |
| | $ | 730 |
|
| Effective tax rate | | 13.7 | % | | 10.2 | % | | 26.3 | % |
Year Ended December 31, 2019 Compared with Year Ended December 31, 2018
Net income attributable to AGL for 2019 was lower compared 2018 primarily due to:
fair value losses on credit derivatives and CCS in 2019 compared with gains in 2018,
lower earned premiums consistent with the scheduled decline net par outstanding, as well as lower accelerations for refundings and terminations,
higher compensation and other operating expenses attributable to the BlueMountain Acquisition and its related fourth quarter 2019 expenses, and
higher loss and loss adjustment expenses in 2019.
These decreases were offset in part by foreign exchange gains in 2019 compared with losses in 2018, realized gains on investment portfolio in 2019 compared with losses in 2018, higher gains on FG VIEs in 2019, and asset management fees from BlueMountain for fourth quarter 2019.
The Company’s effective tax rate reflects the proportion of income recognized by each of the Company’s operating subsidiaries, with U.S. subsidiaries generally taxed at the U.S. marginal corporate income tax rate of 21% in 2019 and 2018, U.K. subsidiaries taxed at the U.K. marginal corporate tax rate of 19%, and no taxes for the Company’s Bermuda Subsidiaries, unless subject to U.S. tax by election or as a U.S. controlled foreign corporation. The effective tax rate was lower in 2019 due to the impact of final BEAT regulations issued in fourth quarter 2019 that allow alternative minimum tax credits to be used in the calculation.
Shareholders' equity attributable to AGL increased since December 31, 2018 primarily due to net income and unrealized gains on available for sale investment securities, offset in part by share repurchases and dividends. Adjusted operating shareholders' equity decreased in 2019primarily due to share repurchases and dividends, partially offset by positive adjusted operating income. Adjusted book value increased slightly in 2019 primarily due to new business development, partially offset by share repurchases and dividends.
Shareholders' equity attributable to AGL per share, adjusted operating shareholders' equity per share and adjusted book value per share all increased in 2019 to $71.18, $66.96 and $96.86, respectively, which benefited from the repurchase of an additional 11.2 million shares in 2019. See “Accretive Effect of Cumulative Repurchases” table below.
Year Ended December 31, 2018 Compared with Year Ended December 31, 2017
The Company's comparison of 2018 results to 2017 results is included in the Company's Annual Report on Form 10-K for the fiscal year ended December 31, 2018, under Part II, Item 7, Management's Discussion and Analysis of Financial Condition and Results of Operations, Executive Summary and Results of Operations.
Key Business Strategies
The Company continually evaluates its business strategies. For example, with the BlueMountain Acquisition the Company has increased its focus on asset management and alternative investments. Currently, the Company is pursuing the following key business strategies in three areas:
Insurance
Asset Management and Alternative Investments
Capital Management
Insurance
The Company seeks to grow the insurance business through new business production, acquisitions of legacy monolines and reinsurance transactions, and to continue to mitigate losses in its current insured portfolio.
Growth of the Insured Portfolio
The Company seeks to grow its insurance portfolio through new business production in each of its three markets: U.S. public finance, international infrastructure and global structured finance. The Company believes high-profile defaults by municipal obligors, such as Puerto Rico, Detroit, Michigan and Stockton, California have led to increased awareness of the value of bond insurance and stimulated demand for the product. The Company believes there will be continued demand for its insurance in this market because, for those exposures that the Company guarantees, it undertakes the tasks of credit selection, analysis, negotiation of terms, surveillance and, if necessary, loss mitigation. The Company believes that its insurance:
encourages retail investors, who typically have fewer resources than the Company for analyzing municipal bonds, to purchase such bonds;
enables institutional investors to operate more efficiently; and
allows smaller, less well-known issuers to gain market access on a more cost-effective basis.
On the other hand, the persistently low interest rate environment and relatively tight U.S. municipal credit spreads have dampened demand for bond insurance, and provisions in legislation known as the Tax Act, such as the termination of the tax-exempt status of advance refunding bonds and the reduction in corporate tax rates, have resulted in a reduction of supply and made municipal obligations less attractive to certain institutional investors.
In certain segments of the global infrastructure and structured finance markets the Company believes its financial guaranty product is competitive with other financing options. For example, certain investors may receive advantageous capital requirement treatment with the addition of the Company’s guaranty. The Company considers its involvement in both international infrastructure and structured finance transactions to be beneficial because such transactions diversify both the Company's business opportunities and its risk profile beyond U.S. public finance. Quarterly business activity in the international infrastructure and structured finance sectors is influenced by typically long lead times and therefore may vary from quarter to quarter.
The Company also considers opportunities to acquire financial guaranty portfolios, whether by acquiring financial guarantors who are no longer actively writing new business or their insured portfolios. These transactions enable the Company to improve its future earnings and deploy excess capital.
Assumption of Insured Portfolio. On June 1, 2018, the Company closed a transaction with Syncora Guarantee Inc. (SGI) (SGI Transaction) under which AGC assumed, generally on a 100% quota share basis, substantially all of SGI’s insured portfolio and AGM reassumed a book of business previously ceded to SGI by AGM. The net par value of exposures reinsured and commuted as of June 1, 2018 totaled approximately $12 billion. The SGI Transaction reduced shareholders' equity by $0.16 per share, due to a commutation loss on the reassumed book of business, and increased adjusted book value by $2.25 per share. Additionally, beginning on June 1, 2018, on behalf of SGI, AGC began providing certain administrative services on the assumed portfolio, including surveillance, risk management, and claims processing.
Acquisitions: On January 10, 2017, AGC completed its acquisition of MBIA UK, which added a total of $12 billion in net par. At acquisition, MBIA UK contributed shareholders' equity of $84 million and adjusted book value of $322 million.
Commutations. The Company entered into various commutation agreements to reassume previously ceded business in 2019, 2018 and 2017 that resulted in gains of $1 million in 2019, losses of $16 million in 2018 and gains of $328 million in 2017. The commutations added net unearned premium reserve of $15 million in 2019 and $64 million in 2018. In the future, the Company may enter into new commutation agreements to reassume portions of its insured business ceded to other reinsurers, but such opportunities are expected to be limited given the small number of unaffiliated reinsurers currently reinsuring the Company.
U.S. Municipal Market Data and Bond Insurance Penetration Rates (1)
Based on Sale Date
|
| | | | | | | | | | | |
| | Year Ended December 31, |
| | 2019 | | 2018 | | 2017 |
| | (dollars in billions, except number of issues and percent) |
| Par: | | | | | |
| New municipal bonds issued | $ | 406.6 |
| | $ | 320.3 |
| | $ | 409.5 |
|
| Total insured | $ | 23.9 |
| | $ | 18.9 |
| | $ | 23.0 |
|
| Insured by Assured Guaranty | $ | 14.0 |
| | $ | 10.5 |
| | $ | 13.5 |
|
| Number of issues: | | | | | |
| New municipal bonds issued | 10,590 |
| | 8,555 |
| | 10,589 |
|
| Total insured | 1,724 |
| | 1,246 |
| | 1,637 |
|
| Insured by Assured Guaranty | 839 |
| | 596 |
| | 833 |
|
| Bond insurance market penetration based on: | | | | | |
| Par | 5.9 | % | | 5.9 | % | | 5.6 | % |
| Number of issues | 16.3 | % | | 14.6 | % | | 15.5 | % |
| Single A par sold | 21.4 | % | | 17.8 | % | | 23.3 | % |
| Single A transactions sold | 54.9 | % | | 52.8 | % | | 57.3 | % |
| $25 million and under par sold | 18.1 | % | | 17.2 | % | | 18.7 | % |
| $25 million and under transactions sold | 19.7 | % | | 17.1 | % | | 18.3 | % |
| |
| (1) | Source: The amounts in the table are those reported by Thomson Reuters. The table excludes Corporate-CUSIP healthcare and project finance transactions insured by Assured Guaranty, which the company also considers to be public finance business. |
Loss Mitigation
In an effort to avoid, reduce or recover losses and potential losses in its insurance portfolios, the Company employs a number of strategies.
In the public finance area, the Company believes its experience and the resources it is prepared to deploy, as well as its ability to provide bond insurance or other contributions as part of a solution, result in more favorable outcomes in distressed public finance situations than would be the case without its participation. This has been illustrated by the Company's role in the Detroit, Michigan; Stockton, California; and Jefferson County, Alabama financial crises. Currently, the Company is actively working to mitigate potential losses in connection with the obligations it insures of the Commonwealth of Puerto Rico and various obligations of its related authorities and public corporations and was an active participant in negotiating the Puerto Rico Electric Power Authority (PREPA) restructuring support agreement and the Puerto Rico Sales Tax Financing Corporation (COFINA)plan of adjustment. The Company will also, where appropriate, pursue litigation to enforce its rights, and it has initiated a number of legal actions to enforce its rights in Puerto Rico. For more information about developments in Puerto Rico and related recovery litigation being pursued by the Company, see Item 8, Financial Statements and Supplementary Data, Note 5, Outstanding Insurance Exposure.
The Company is currently working with the servicers of some of the RMBS it insures to encourage the servicers to provide alternatives to distressed borrowers that will encourage them to continue making payments on their loans to help improve the performance of the related RMBS.
In some instances, the terms of the Company's policy give it the option to pay principal on an accelerated basis on an obligation on which it has paid a claim, thereby reducing the amount of guaranteed interest due in the future. The Company has at times exercised this option, which uses cash but reduces projected future losses. The Company may also facilitate the issuance of refunding bonds, by either providing insurance on the refunding bonds or purchasing refunding bonds, or both. Refunding bonds may provide the issuer with payment relief.
Asset Management
The BlueMountain Acquisition represents a significant increase in the Company's participation in the asset management industry. Assured Investment Management is a diversified asset manager that serves as investment advisor to CLOs and opportunity funds as well as certain legacy hedge and opportunity funds now subject to an orderly wind-down. Assured Investment Management manages structured finance, credit and special situation investments, with a track record dating back to 2003. Assured Investment Management underwrites assets and structures investments while leveraging a technology-enabled risk platform, which aims to maximize returns for its clients.
As of December 31, 2019, Assured Investment Management is a top-twenty CLO manager by AUM, as published by CreditFlux, and is led by an experienced CLO and loan research team. Assured Investment Management and its affiliates have issued 37 CLOs since inception, in both the U.S. and European markets. The CLOs have broad investor distribution with access to a diversified set of global investors. The team has focused on building diversified portfolios with a focus on free cash flow generation and downside protection.
The Company monitors certain operating metrics that are common to the asset management industry. These operating metrics include, but are not limited to, funded assets under management and unfunded capital commitments (together, AUM) and investment advisory service revenues. The Company considers the categorization of its AUM by product type to be a useful lens in monitoring the Asset Management segment. AUM by product type assists in measuring the duration of AUM for which the Asset Management segment has the potential to earn Management Fees and Performance Allocations/Fees. For a discussion of the metric AUM, please see “-- Results of Operations by Segment -- Asset Management Segment.”
Assured Investment Management product types generally have the following contractual duration profile:
CLO products are typically issued on a quarterly basis when market conditions permit and generally have a stated maturity of 12-13 years with a potential reinvestment period. Once the reinvestment period expires, CLO noteholders will receive distributions through the maturity of the CLO, unless Assured Investment Management and the noteholders agree to reset the period of the CLOs for an extended reinvestment period.
Opportunity funds invest in a mix of strategies that may have higher concentrations in illiquid strategies. Typically, opportunity funds have limited withdrawal or redemption rights, and instead offer contractual cashflow distributions based on the legal agreement of each respective opportunity fund.
In addition to CLOs and opportunity funds, Assured Investment Management also manages legacy hedge and opportunity funds now subject to an orderly wind-down.
The Company intends to initially invest $500 million of capital in funds managed by Assured Investment Management plus additional amounts in other accounts managed by Assured Investment Management. The Company intends to use these capital investments to (a) launch new products (CLOs, and/or opportunity funds) on the Assured Investment Management platform and (b) enhance the returns of its own investment portfolio. As of December 31, 2019, the Company had invested approximately $79 million of the $500 million it intends to initially invest in Assured Investment Management funds. This capital was invested in three new investment vehicles, with each vehicle dedicated to a single strategy including CLOs, asset-backed finance and healthcare structured capital. These strategies are consistent with the investment strengths of Assured Investment Management and its plans to continue to grow its structured finance strategies.
Over time, the Company seeks to broaden and further diversify its Asset Management segment leading to increased assets under management and a fee-generating platform. The Company intends to leverage the Assured Investment Management infrastructure and platform to grow its Asset Management segment both organically and through strategic combinations.
Capital Management
In recent years, the Company has developed strategies to manage capital within the Assured Guaranty group more efficiently.
From 2013 through February 27, 2020, the Company has repurchased 106.6 million common shares for approximately $3,256 million, representing 55% of the total shares outstanding at the beginning of the repurchase program in 2013. On February 26, 2020, the Board authorized an additional $250 million of share repurchases. As of February 27, 2020, $408 million remained under the aggregate share repurchase authorization. Shares may be repurchased from time to time in the open market or in privately negotiated transactions. The timing, form and amount of the share repurchases under the program are at the discretion of management and will depend on a variety of factors, including free funds available at the parent company, other potential uses for such free funds, market conditions, the Company's capital position, legal requirements and other factors. The repurchase program may be modified, extended or terminated by the Board of Directors at any time and does not have an expiration date. See Item 8, Financial Statements and Supplementary Data, Note 21, Shareholders' Equity, for additional information about the Company's repurchases of its common shares.
Summary of Share Repurchases
|
| | | | | | | | | | |
| | Amount | | Number of Shares | | Average price per share |
| | (in millions, except per share data) |
| 2013-2018 | $ | 2,716 |
| | 94.556 |
| | $ | 28.73 |
|
| 2019 | 500 |
| | 11.164 |
| | 44.79 |
|
| 2020 (through February 27, 2020) | 40 |
| | 0.844 |
| | 47.41 |
|
| Cumulative repurchases since the beginning of 2013 | $ | 3,256 |
| | 106.564 |
| | $ | 30.56 |
|
Accretive Effect of Cumulative Repurchases (1)
|
| | | | | | | | | | | | | | | | |
| | | Year Ended December 31, | | | | |
| | | 2019 | | 2018 | | As of
December 31, 2019 | | As of
December 31, 2018 |
| | | (per share) |
| Net income attributable to AGL | | $ | 1.60 |
| | $ | 1.73 |
| | | | |
| Adjusted operating income | | 1.56 |
| | 1.58 |
| | | | |
| Shareholders' equity attributable to AGL | | | | | | $ | 21.44 |
| | $ | 16.26 |
|
| Adjusted operating shareholders' equity | | | | | | 19.24 |
| | 15.29 |
|
| Adjusted book value | | | | | | 35.06 |
| | 27.07 |
|
_________________
| |
| (1) | Represents the estimated accretive effect of cumulative repurchases since the beginning of 2013. |
In March 2019, MAC received approval from the NYDFS to dividend to Municipal Assurance Holdings Inc. (MAC Holdings) a $100 million in 2019, an amount that exceeds the amount available to dividend without such approval in 2019 under applicable law. MAC distributed $100 million dividend to MAC Holdings during the second quarter of 2019.
In 2019, the MIA approved and AGC implemented the repurchase of $100 million of its shares of common stock from AGUS.
The Company also considers the appropriate mix of debt and equity in its capital structure, and may repurchase some of its debt from time to time. For example, in 2019, 2018 and 2017, AGUS purchased $3 million, $100 million and $28 million of par, respectively, of AGMH's outstanding Junior Subordinated Debentures, which resulted in a loss on extinguishment of debt of $1 million in 2019, $34 million in 2018 and $9 million in 2017. The Company may choose to make additional purchases of this or other Company debt in the future.
Other Events
Brexit
On June 23, 2016, a referendum was held in the U.K. in which a majority voted to exit the EU, known as “Brexit”. The U.K. government served notice to the European Council on March 29, 2017 of its desire to withdraw in accordance with Article 50 of the Treaty on European Union. As described above in Part 1, Item 1, Business, Regulation, the U.K. parliament has approved a withdrawal agreement with the EU and the U.K. left the EU on January 31, 2020. There is a transition period under the terms of the withdrawal agreement which will end on December 31, 2020. Negotiations will be ongoing during the transition period between the U.K. and EU to determine the wider terms of the U.K.'s future relationship with the EU, including the terms of trade between the U.K. and the EU. If the U.K. and EU fail to agree the U.K.'s future relationship with the EU during the transition period ending on December 31, 2020, there will be considerable uncertainty as to the ongoing terms of the U.K’s relationship with the EU, including the terms of trade between the U.K. and the EU, and a likely negative impact on all parties. Given the lack of clarity on the ultimate post-Brexit relationship between the U.K. and the EU, the Company cannot fully determine what, if any, impact Brexit may have on its business or operations, both inside and outside the U.K., but it has identified the following issues:
•Currency Impact. The Company reports its accounts in U.S. dollars, while some of its income, expenses, assets and liabilities are denominated in other currencies, primarily the pound sterling and the euro. During 2016, the year in which a majority in the U.K. voted for Brexit, the value of pound sterling dropped from £0.68 per dollar to £0.81 per dollar, while the euro dropped from €0.83 per dollar to €0.95 per dollar. For the year ended 2016 the Company recognized losses of approximately $21 million in the consolidated statement of operations, net of tax, and approximately $32 million in other comprehensive income (OCI), net of tax, for foreign currency translation, that were primarily driven by the exchange rate fluctuations of the pound sterling. Currency exchange rates may also move materially as the terms of Brexit become known, especially in the event of the U.K. and EU failing to agree the U.K.'s future relationship with the EU by the end of the transition period.
•U.K. Business. As of December 31, 2019, approximately $38.5 billion of the Company’s insured net par is to risks located in the U.K., and most of that exposure is to utilities, with much of the rest to hospital facilities, government accommodation, universities, toll roads and housing associations that the Company believes are not overly vulnerable to Brexit pressures. AGE UK is currently authorized by the PRA of the Bank of England with permissions sufficient to enable AGE UK to effect and carry out financial guaranty insurance and reinsurance in the U.K. Most of the new transactions insured by AGE UK since 2008 have been in the U.K.
•Business Elsewhere in the EU. As of December 31, 2019, approximately $7.0 billion of the Company’s insured net par is to risks located in EU and EEA countries. During the transition period under the withdrawal agreement, EU directives allow AGE UK to conduct business in those other remaining EU or EEA states based on its PRA permissions. This is sometimes called “passporting." The Company cannot determine whether U.K. authorized financial services firms such as AGE UK will continue to enjoy passporting rights to those other remaining EEA states after Brexit. As a consequence, Assured Guaranty has established a new subsidiary in Paris, France, AGE SA, in order to continue with the ability to write new business, and to service existing business, in those other remaining EEA states. While the Company believes that, in the event that the U.K. and EU fail to agree on the U.K.'s future relationship with the EU during the transition period, those other EEA states outside the U.K. will permit the Company to continue to service existing business in their states, there can be no assurance that this will occur, nor can the Company fully determine the impact on its business and operations if it does not occur. As noted above, most of the new transactions insured by AGE UK since 2008 have been in the U.K.
•Employees. All of the employees working in AGE UK’s London office are either U.K. citizens or have U.K. resident status.
LIBOR Sunset
In 2017, the United Kingdom’s FCA announced that after 2021 it would no longer compel banks to submit the rates required to calculate LIBOR. This announcement indicates that the continuation of LIBOR on the current basis cannot and will not be guaranteed after 2021. Consequently, at this time, it is not possible to predict whether and to what extent banks will continue to provide submissions for the calculation of LIBOR. While regulators have suggested substitute rates, including the Secured Overnight Financing Rate, the impact of the discontinuance of LIBOR, if it occurs, will be contract-specific. The Company has exposure to LIBOR in three areas of its operations: (i) issuers of obligations the Company insures have obligations, assets and hedges that reference LIBOR, and some of the obligations the Company insures reference LIBOR, (ii)
debt issued by the Company's wholly owned subsidiaries AGUS and AGMH currently pay, or will convert to, a floating interest rate tied to LIBOR, and (iii) CCS from which the Company benefits also pay interest tied to LIBOR. See Item 8, Financial Statements and Supplementary Data, Note 15, Long-Term Debt and Credit Facilities.
The Company has reviewed its insured portfolio to identify insured transactions that it believes may be vulnerable to the transition from LIBOR. The review focused on insured issues that are scheduled or projected to have an outstanding principal balance as of December 31, 2021, the date of LIBOR’s scheduled sunset, and excluded, due to their immateriality, insured issues projected to have an outstanding principal balance of less than $1 million at December 31, 2021. The Company reviewed the language governing the setting of interest rates in the event of unavailability of LIBOR in the governing documents of all BIG insured transactions (except those issues projected to have an outstanding principal balance of less than $1 million at December 31, 2021), which the Company believes are most likely to be vulnerable to issues relating to the setting of interest rates after the sunset of LIBOR. The Company has also reviewed relevant language in the documents relating to the debt issued by the Company and the CCS that benefit the Company. As a significant portion of these securities are likely to become fixed rate in December 2021, the initial benefit or harm of the sunset of LIBOR depends on the level of interest rates at such time. Also, whatever interest rate is set by the party responsible for calculating the interest rate may be challenged in the court by other parties in interest. The Company has initiated a dialogue with relevant trustees, calculation agents, auction agents, servicers and other parties responsible for implementing the rate change in these transactions. Most have not yet committed to a course of action.
Given the lack of clarity on decisions that parties responsible for calculating interest rates will make and the reaction of impacted parties as well as the unknown level of interest rates when the change occurs, the Company cannot at this time predict the impact of the discontinuance of LIBOR, if it occurs, on every obligor and obligation the Company enhances or on its own debt issuances. See the Risk Factor captioned “The Company may be adversely impacted by the transition from LIBOR as a reference rate” under Operational Risks in Part 1, Item 1A, Risk Factors.
Income Taxes
The U.S. Internal Revenue Service and Department of the Treasury issued proposed regulations on July 10, 2019
relating to the tax treatment of PFICs. The proposed regulations provide guidance on various passive foreign investment company rules, including changes resulting from the Tax Act. Management is currently in the process of evaluating the impact to its shareholders and business operations.
Results of Operations
Business Segments
The Company reports its results of operations consistent with the manner in which the Company's CODM reviews the business to assess performance and allocate resources. Prior to the BlueMountain Acquisition on October 1, 2019, the Company's operating subsidiaries were all insurance companies, and results of operations were viewed by the CODM as one segment. Beginning in fourth quarter 2019, with the BlueMountain Acquisition and expansion into the asset management business, the Company now operates in two distinct segments, Insurance and Asset Management. The Asset Management segment operates under the name "Assured Investment Management." The following describes the components of each segment, along with the Corporate division and Other categories. The Insurance and Asset Management segments are presented without giving effect to the consolidation of the FG VIEs and investment vehicles that are not subsidiaries of Assured Guaranty. See Item 8. Financial Statement and Supplementary Data, Note 14, Variable Interest Entities.
The Insurance segment primarily consists of the Company's domestic and foreign insurance subsidiaries and their wholly-owned subsidiaries that provide credit protection products to the U.S. and international public finance (including infrastructure) and structured finance markets. The Insurance segment also includes the income (loss) from its proportionate equity interest in Assured Investment Management funds.
The Asset Management segment consists of the Company's Assured Investment Management subsidiaries, which provide asset management services to outside investors as well as to the Company's Insurance segment.
The Corporate division consists primarily of interest expense on the debt of AGUS and AGMH, as well as other operating expenses attributed to holding company activities, including administrative services performed by operating subsidiaries for the holding companies.
Other items consist of intersegment eliminations, reclassifications, and consolidation adjustments, including the effect of consolidating FG VIEs and certain Assured Investment Management investment vehicles in which Insurance segment invests.
The Company does not report assets by reportable segment as the CODM does not use assets to assess performance and allocate resources and only reviews assets at a consolidated level.
The Company analyzes the operating performance of each segment using "adjusted operating income." See “-- Non-GAAP Financial Measures -- Adjusted Operating Income” below for definition of "adjusted operating income" (formerly known as non-GAAP operating income) and Item 8, Financial Statements and Supplementary Data, Note 4, Segment Information. Results for each segment include specifically identifiable expenses as well as allocations of expenses among legal entities based on time studies and other cost allocation methodologies based on headcount or other metrics. Total adjusted operating income includes the effect of consolidating both FG VIEs and investment vehicles; however the effect of consolidating such entities, including the related eliminations, is included in the "other" column in the tables below, which represents the CODM's view, consistent with the management approach guidance for presentation of segment metrics.
The following table summarizes adjusted operating income from the Company's business segment operations. See also Item 8, Financial Statements and Supplementary Data, Note 4, Segment Information.
|
| | | | | | | | | | | |
| | Year Ended December 31, |
| | 2019 | �� | 2018 | | 2017 |
| | (in millions) |
| Adjusted operating income (loss) by segment: | | | | | |
| Insurance | $ | 512 |
| | $ | 582 |
| | $ | 732 |
|
| Asset management | (10 | ) | | — |
| | — |
|
| Corporate | (111 | ) | | (96 | ) | | (83 | ) |
| Other | — |
| | (4 | ) | | 12 |
|
| Adjusted operating income (loss) | 391 |
| | 482 |
| | 661 |
|
| Reconciling items from adjusted operating income to net income (loss) attributable to AGL: | | | | | |
| Plus pre-tax adjustments: | | | | | |
| Realized gains (losses) on investments | 22 |
| | (32 | ) | | 40 |
|
| Non-credit impairment unrealized fair value gains (losses) on credit derivatives | (10 | ) | | 101 |
| | 43 |
|
| Fair value gains (losses) on CCS | (22 | ) | | 14 |
| | (2 | ) |
| Foreign exchange gains (losses) on remeasurement of premiums receivable and loss and LAE reserves | 22 |
| | (32 | ) | | 57 |
|
| Total pre-tax adjustments | 12 |
| | 51 |
| | 138 |
|
| Plus tax effect on pre-tax adjustments | (1 | ) | | (12 | ) | | (69 | ) |
| Net income (loss) attributable to AGL | $ | 402 |
| | $ | 521 |
| | $ | 730 |
|
Results of Operations by Segment
Insurance Segment Results
Insurance Results
|
| | | | | | | | | | | |
| | Year Ended December 31, |
| | 2019 | | 2018 | | 2017 |
| | (in millions) |
| Revenues | | | | | |
| Net earned premiums and credit derivative revenues | $ | 511 |
| | $ | 580 |
| | $ | 734 |
|
| Net investment income | 383 |
| | 396 |
| | 423 |
|
| Bargain purchase gain and settlement of pre-existing relationships | — |
| | — |
| | 58 |
|
| Commutation gains (losses) | 1 |
| | (16 | ) | | 328 |
|
| Other income (loss) | 22 |
| | 32 |
| | 16 |
|
| Total revenues | 917 |
| | 992 |
| | 1,559 |
|
| Expenses | | | | | |
| Loss expense | 86 |
| | 70 |
| | 352 |
|
| Amortization of deferred acquisition cost (DAC) | 18 |
| | 16 |
| | 19 |
|
| Employee compensation and benefit expenses | 137 |
| | 134 |
| | 127 |
|
| Other operating expenses | 83 |
| | 82 |
| | 88 |
|
| Total expenses | 324 |
| | 302 |
| | 586 |
|
| Equity in net earnings of investees | 2 |
| | 1 |
| | — |
|
| Adjusted operating income (loss) before income taxes | 595 |
| | 691 |
| | 973 |
|
| Provision (benefit) for income taxes | 83 |
| | 109 |
| | 241 |
|
| Adjusted operating income (loss) | $ | 512 |
| | $ | 582 |
| | $ | 732 |
|
Insurance New Business Production
Insurance
Gross Written Premiums and
New Business Production
|
| | | | | | | | | | | |
| | Year Ended December 31, |
| | 2019 | | 2018 | | 2017 |
| | (in millions) |
| GWP | | | | | |
| Public Finance—U.S. | $ | 198 |
| | $ | 320 |
| | $ | 190 |
|
| Public Finance—non-U.S. | 417 |
| | 115 |
| | 105 |
|
| Structured Finance—U.S. | 57 |
| | 167 |
| | (1 | ) |
| Structured Finance—non-U.S. | 5 |
| | 10 |
| | 13 |
|
| Total GWP | $ | 677 |
| | $ | 612 |
| | $ | 307 |
|
| PVP (1): | | | | | |
| Public Finance—U.S. | $ | 201 |
| | $ | 391 |
| | $ | 196 |
|
| Public Finance—non-U.S. | 211 |
| | 94 |
| | 66 |
|
| Structured Finance—U.S. | 45 |
| | 166 |
| | 12 |
|
| Structured Finance—non-U.S. | 6 |
| | 12 |
| | 15 |
|
| Total PVP | $ | 463 |
| | $ | 663 |
| | $ | 289 |
|
| Gross Par Written (1): | | | | | |
| Public Finance—U.S. | $ | 16,337 |
| | $ | 19,572 |
| | $ | 15,957 |
|
| Public Finance—non-U.S. | 6,347 |
| | 3,817 |
| | 1,376 |
|
| Structured Finance—U.S. | 1,581 |
| | 902 |
| | 489 |
|
| Structured Finance—non-U.S. | 88 |
| | 333 |
| | 202 |
|
| Total gross par written | $ | 24,353 |
| | $ | 24,624 |
| | $ | 18,024 |
|
| | | | | | |
| Average rating on new business written | A | | A- | | A- |
____________________
| |
| (1) | PVP and Gross Par Written in the table above are based on "close date," when the transaction settles. See “-- Non-GAAP Financial Measures -- PVP or Present Value of New Business Production.” |
GWP relates to both financial guaranty insurance and specialty insurance and reinsurance contracts. Financial guaranty GWP includes amounts collected upfront on new business written, the present value of future premiums on new business written (discounted at risk free rates), as well as the effects of changes in the estimated lives of transactions in the inforce book of business. Specialty insurance and reinsurance GWP is recorded as premiums are due. Credit derivatives are accounted for at fair value and therefore not included in GWP. The non-GAAP measure, PVP, on the other hand, includes upfront premiums and estimated future installments on new business at the time of issuance, discounted at 6% for all contracts whether in insurance or credit derivative form.
Excluding amounts assumed in the SGI Transaction in 2018, GWP and PVP increased in 2019 compared with 2018. GWP was $677 million in 2019, compared with $282 million in 2018 (excluding the SGI Transaction), and PVP was $463 million in 2019 compared with $272 million in 2018 (excluding the SGI Transaction). 2019 GWP and PVP were the highest reported direct new business production since 2009.
In 2019, the Company generated non-U.S.public finance GWP of $417 million, representing PVP of $211 million, on $6.3 billion of investment-grade par with an average rating of A+. Excluding the SGI Transaction in 2018, GWP and PVP for non-U.S. public finance transactions was $65 million and $44 million, respectively. GWP and PVP in 2019 were driven primarily by:
privately executed, bilateral guarantees on a large number of European sub-sovereign credits,
additional premiums upon the conversion of several existing transactions from credit default swaps to financial guaranty insurance contracts,
several U.K financings for the construction of new student accommodations, and
debt refinancings, including a Spanish solar plant transaction, which was the first insured issuance in Spain since the 2008 financial crisis, and a previously insured regulated utility transaction.
Global structured finance GWP and PVP was also higher in 2019 compared with 2018 (excluding the SGI Transaction), as the Company wrote insurance on more transactions and par in the collateralized loan obligation, life insurance reserve, and residual value reinsurance asset classes.
In 2019, Assured Guaranty once again guaranteed the majority of U.S. public finance insured par issued. 2019 U.S. public finance GWP of $198 million was consistent with 2018 GWP of $197 million, excluding the SGI Transaction. Similarly, PVP of $201 million in FY 2019 was consistent with PVP of $206 million in FY 2018, excluding the SGI Transaction.
Infrastructure and structured finance transactions tend to have long lead times, causing production levels to vary significantly from period to period.
2018Assumed SGI Insured Portfolio
GWP and PVP for 2018 included the assumption of substantially all of the insured portfolio of SGI. On a GAAP basis, the SGI Transaction generated GWP of $330 million, plus $86 million in undiscounted expected future credit derivative revenue, including transactions with $131 million in expected losses (discounted at a risk-free rate on a GAAP basis). On a non-GAAP basis, PVP was $391 million, including transactions with expected losses of $83 million (discounted at 6% consistent with the PVP discount rate). See also Item 8, Financial Statements and Supplementary Data, Note 2, Business Combinations and Assumption of Insured Portfolio, for additional information. The components of new business production generated by the SGI Transaction are presented below.
Assumed SGI Insured Portfolio
As of June 1, 2018
|
| | | | | | | | | | | | | | | | | | | |
| | GWP | | PVP (1) | | |
| | Financial Guaranty | | Financial Guaranty | | Credit Derivatives | | Total | | Gross Par Written (1) |
| | (in millions) |
| Public Finance—U.S. | $ | 123 |
| | $ | 118 |
| | $ | 67 |
| | $ | 185 |
| | $ | 7,559 |
|
| Public Finance—non-U.S. | 50 |
| | 38 |
| | 12 |
| | 50 |
| | 3,345 |
|
| Structured Finance—U.S. | 157 |
| | 156 |
| | — |
| | 156 |
| | 349 |
|
| Structured Finance—non-U.S. | — |
| | — |
| | — |
| | — |
| | 19 |
|
| Total | $ | 330 |
| | $ | 312 |
| | $ | 79 |
| | $ | 391 |
| | $ | 11,272 |
|
____________________
| |
| (1) | See “-- Non-GAAP Financial Measures -- PVP or Present Value of New Business Production.” |
Net Earned Premiums and Credit Derivative Revenues
NetPremiums are earned premiums are recognized over the contractual lives, or in the case of homogeneous pools of insured obligations, the remaining expected lives, of financial guaranty insurance contracts. The Company estimates remaining expected lives of its insured obligations and makes prospective adjustments for such changes in expected lives. Scheduled net earned premiums are expected to decrease each year unless replaced by a higher amount of new business, reassumptions of previously ceded business, or books of business acquired in a business combination. See Part II, Item 8, Financial Statements and Supplementary Data, Note 6,7, Contracts Accounted for as Insurance, Financial Guaranty Insurance Premiums, for additional informationinformation. Credit derivative revenue represents realized gains on credit derivatives representing premiums received and the expected timing of future premium earnings.receivable.
Net Earned Premiums
|
| | | | | | | | | | | |
| | Year Ended December 31, |
| | 2016 | | 2015 | | 2014 |
| | (in millions) |
| Financial guaranty insurance: | | | | | |
| Public finance | | | | | |
| Scheduled net earned premiums and accretion | $ | 299 |
| | $ | 308 |
| | $ | 279 |
|
| Accelerations: | | | | | |
| Refundings | 390 |
| | 294 |
| | 133 |
|
| Terminations | 34 |
| | 23 |
| | 2 |
|
| Total accelerations | 424 |
| | 317 |
| | 135 |
|
| Total public finance | 723 |
| | 625 |
| | 414 |
|
| Structured finance(1) | | | | | |
| Scheduled net earned premiums and accretion | 96 |
| | 125 |
| | 152 |
|
| Terminations | 45 |
| | 14 |
| | 1 |
|
| Total structured finance | 141 |
| | 139 |
| | 153 |
|
| Other | 0 |
| | 2 |
| | 3 |
|
| Total net earned premiums | $ | 864 |
| | $ | 766 |
| | $ | 570 |
|
____________________
| |
(1) | Excludes $16 million, $21 million and $32 million for 2016, 2015 and 2014, respectively, on consolidated FG VIEs.
|
2016 compared with 2015: Net earned premiums increased in 2016 compared with 2015 due primarily to higher accelerations, partially offset by the lower earned premiums resulting from the scheduled decline in par outstanding. At December 31, 2016, $3.3 billion of net deferred premium revenue remained to be earned over the life of the insurance contracts. The CIFG Acquisition increased deferred premium revenue by $296 million at the date of the acquisition.
2015 compared with 2014: Net earned premiums increased in 2015 compared with 2014 due primarily to higher accelerations and the addition of the Radian Asset book of business, offset in part by lower earned premiums resulting from the scheduled decline in par outstanding. The Radian Asset Acquisition on April 1, 2015 increased deferred premium revenue by $549 million at the date of acquisition.
The increase in net earned premiums due to accelerations is attributable to changes in the expected lives of insured obligations driven by (a) refundings of insured obligations or (b) terminations of insured obligations either through negotiated agreements or the exercise of ourthe Company's contractual rights to make claim payments on an accelerated basis.
Refundings occur in the public finance market and havehad been at historically high levels in recent years primarily due primarily to the low interest rate environment, which has allowed many municipalities and other public finance issuers to refinance their debt obligations at lower rates. The premiums associated with the insured obligations of municipalities and other public finance
issuers are generally received upfront when the obligations are issued and insured. When such issuers pay down insured obligations prior to their originally scheduled maturities, the Company is no longer on risk for payment defaults, and therefore accelerates the recognition of the nonrefundable unearned premiums remaining fromdeferred premium revenue remaining. Provisions in the original upfront payment.2017 Tax Act regarding the termination of the tax-exempt status of advance refunding bonds have resulted in fewer refundings.
Terminations are generally negotiated agreements with issuersbeneficiaries resulting in the extinguishment of the Company’s insurance obligation with respect to the insured obligations.obligation. Terminations are more common in the structured finance asset class, but may also occur in the public finance asset class. While each termination may have different terms, they all result in the expiration of the Company’s insurance risk, such that the Company acceleratesacceleration of the recognition of the associated deferred premium revenue and the reduction of any remaining premiums receivable.
Net Earned Premiums and Credit Derivative Revenues
|
| | | | | | | | | | | |
| | Year Ended December 31, |
| | 2019 | | 2018 | | 2017 |
| | (in millions) |
| Financial guaranty insurance: | | | | | |
| Public finance | | | | | |
| Scheduled net earned premiums | $ | 278 |
| | $ | 300 |
| | $ | 315 |
|
| Accelerations: | | | | | |
| Refundings | 115 |
| | 139 |
| | 269 |
|
| Terminations | 10 |
| | 14 |
| | 2 |
|
| Total accelerations | 125 |
| | 153 |
| | 271 |
|
| Total public finance | 403 |
| | 453 |
| | 586 |
|
| Structured finance | | | | | |
| Scheduled net earned premiums | 78 |
| | 97 |
| | 102 |
|
| Accelerations | 7 |
| | 6 |
| | 15 |
|
| Total structured finance | 85 |
| | 103 |
| | 117 |
|
| Specialty insurance and reinsurance | 6 |
| | 4 |
| | 2 |
|
| Total net earned premiums | 494 |
| | 560 |
| | 705 |
|
| Credit derivative revenues | 17 |
| | 20 |
| | 29 |
|
| Total net earned premiums and credit derivative revenues | $ | 511 |
| | $ | 580 |
| | $ | 734 |
|
2019 compared with 2018: Net earned premiums decreased in 2019 compared with 2018 primarily due to a reduction in accelerations due to refundings and terminations and the scheduled decline in par outstanding. At December 31, 2019, $3.8 billion of net deferred premium revenue remained to be earned over the life of the insurance contracts.
2018 compared with 2017: Net earned premiums decreased in 2018 compared with 2017 primarily due to reduced refunding activity due to a reduction in the insured portfolio as well as fewer advanced refunding bonds, caused by changes in tax law enacted in 2017. At December 31, 2018, $3.6 billion of net deferred premium revenue remained to be earned over the life of the insurance contracts. The SGI Transaction contributed $375 million of net unearned premiums.premium reserve on June 1, 2018.
Credit derivative revenues have declined in 2019, 2018 and 2017 primarily due to the decline in the net par outstanding. The Company has not written new credit derivatives since 2009. Other than credit derivatives acquired in business combinations and reinsurance agreements, or as part of loss mitigation strategies, credit derivative exposure is expected to decline.
Net Investment Income
Net investment income is a function of the yield that the Company earns on invested assetsearned and the size of the investment portfolio. The investment yield is a function of market interest rates at the time of investment as well as the type, credit quality and maturity of the invested assets. Net investment income in the Insurance segment represents income earned on the available for sale portfolio, short term investments and other invested assets, other than equity method investments. Equity method investments in the Insurance segment include the insurance companies' investments in Assured Investment Management funds, as well as other direct investments. The income (loss) on such investments is presented as a separate line item, "equity in earnings of investees." The
Company currently intends to invest up to $500 million in Assured Investment Management funds, and as of December 31, 2019 had invested $79 million.
Net Investment Income (1)
| | | | Year Ended December 31, | Year Ended December 31, |
| | 2016 | | 2015 | | 2014 | 2019 | | 2018 | | 2017 |
| | (in millions) | (in millions) |
| Income from fixed-maturity securities managed by third parties | $ | 306 |
| | $ | 335 |
| | $ | 324 |
| $ | 272 |
| | $ | 293 |
| | $ | 296 |
|
| Income from internally managed securities: | | | | | | |
| Fixed maturities | 103 |
| | 61 |
| | 74 |
| |
| Other | 7 |
| | 37 |
| | 14 |
| |
| Other | 1 |
| | 0 |
| | 0 |
| |
| Income from internally managed securities | | 120 |
| | 112 |
| | 136 |
|
| Gross investment income | 417 |
| | 433 |
| | 412 |
| 392 |
| | 405 |
| | 432 |
|
| Investment expenses | (9 | ) | | (10 | ) | | (9 | ) | (9 | ) | | (9 | ) | | (9 | ) |
| Net investment income | $ | 408 |
| | $ | 423 |
| | $ | 403 |
| $ | 383 |
| | $ | 396 |
| | $ | 423 |
|
____________________
| |
(1) | Net investment income excludes $10 million for 2016 and $32 million for 2015 and $11 million in 2014, related to securities in the investment portfolio owned by AGC and AGM that were issued by consolidated FG VIEs. |
20162019 compared with 2015:2018: Net investment income decreased compared with 2018 primarily due primarily to lowera decrease in the average asset balances in the investment balance and lower average investment yield.portfolio, which was partially offset by the acceleration of income related to the settlement of an insured obligation in June 2019 that was held in the loss mitigation portfolio. The overall pre-tax book yield was 3.80%3.51% as of December 31, 20162019 and 4.56%3.86% as of December 31, 2015,2018, respectively. Excluding the internally managed portfolio, pre-tax book yield was 3.30%3.21% as of December 31, 20162019 compared with 3.58%3.24% as of December 31, 2015.2018.
20152018 compared with 2014:2017: Net investment income increaseddecreased compared with 2017 primarily due primarily to additional incomethe accretion on the Radian Asset investment portfolio and loss mitigation strategies resultingZohar II 2005-1 notes prior to the MBIA UK Acquisition date in additional income on securities within the internally managed portfolio.January 2017. The overall pre-tax book yield was 4.56%3.86% as of December 31, 20152018 and 3.65%3.78% as of December 31, 2014,2017, respectively. Excluding the internally managed portfolio, pre-tax book yield was 3.58%3.24% as of December 31, 20152018 compared with 3.36%3.20% as of December 31, 2014.2017.
Net Realized Investment Gains (Losses)
The table below presents the components of net realized investment gains (losses). See Part II, Item 8, Financial Statements and Supplementary Data, Note 10, Investments and Cash.
Net Realized Investment Gains (Losses)
|
| | | | | | | | | | | |
| | Year Ended December 31, |
| | 2016 | | 2015 | | 2014 |
| | (in millions) |
| Gross realized gains on available-for-sale securities | $ | 28 |
| | $ | 44 |
| | $ | 14 |
|
| Gross realized losses on available-for-sale securities | (8 | ) | | (15 | ) | | (5 | ) |
| Net realized gains (losses) on other invested assets | 2 |
| | (8 | ) | | 6 |
|
| Other-than-temporary impairment | (51 | ) | | (47 | ) | | (75 | ) |
| Net realized investment gains (losses) | $ | (29 | ) | | $ | (26 | ) | | $ | (60 | ) |
Other-than-temporary-impairments in 2016 were primarily attributable to securities purchased for loss mitigation purposes and changes in foreign exchange rates. Realized gains in 2016 were due primarily to sales of securities in order to fund the purchase of CIFGH by AGC.
Net realized investment losses for 2015 include a loss on a forward contract. Other-than-temporary-impairments in 2015 were primarily attributable to securities purchased for loss mitigation purposes. The realized gains in 2015 were due primarily to sales of securities in order to fund the purchase of Radian Asset by AGC.
Net realized investment losses for 2014 included an other-than-temporary impairment that was primarily attributable to securities in the internally managed portfolio received as part of a restructuring of an insured transaction.
Bargain Purchase Gain and Settlement of Pre-existing Relationships
On July 1, 2016, AGC acquired all of the issued and outstanding capital stock of CIFGH, the parent of financial guaranty insurer CIFGNA, and merged CIFGNA with and into AGC, with AGC as the surviving company, on July 5, 2016. In connection with the acquisition,MBIA UK Acquisition in 2016,2017, the Company recognized a $357 million bargain purchase gain of $56 million and a $98 million lossgain on settlementsettlements of pre-existing relationships.
On April 1, 2015, AGC completed the acquisitionrelationships of Radian Asset and merged Radian Asset with and into AGC, with AGC as the surviving company of the merger. In connection with the acquisition, in 2015, the Company recognized a $55 million bargain purchase gain and a $159 million gain on settlement of pre-existing relationships.
$2 million. See Part II, Item 8, Financial Statements and Supplementary Data, Note 2, Acquisitions,Business Combinations and Assumption of Insured Portfolio, for additional information.
Commutation Gains (Losses)
In connection with the reassumption of previously ceded books of business, the Company recognized commutation gains of $1 million in 2019 and $328 million in 2017, respectively, and commutation losses of $16 million in 2018. The losses in 2018 related to the commutation component of the SGI Transaction.
Other Income (Loss)
Other income (loss) comprisesconsists of recurring items such as foreign exchange remeasurement gains and losses,those listed in the table below as well as ancillary fees on financial guaranty policies such as commitmentfor commitments and consent,consents, and if applicable, other revenue items on financial guaranty insurance and reinsurance contracts such as commutation gains on re-assumptions of previously ceded business, loss mitigation recoveries and certainother non-recurring items. In 2016, other income primarily comprised a benefit due to loss mitigation recoveries, offset in part by a loss on foreign exchange mainly due to the decline in the exchange rate of the pound sterling. In 2015 and 2014, other income primarily comprised a commutation gain on the reassumption of ceded books of business from certain reinsurers and benefits due to loss mitigation recoveries.
Other Income (Loss)
| | | | Year Ended December 31, | Year Ended December 31, |
| | 2016 | | 2015 | | 2014 | 2019 | | 2018 | | 2017 |
| | (in millions) | (in millions) |
| Foreign exchange gain (loss) on remeasurement of premium receivable and loss reserves | $ | (33 | ) | | $ | (15 | ) | | $ | (21 | ) | |
| Commutation gains | 8 |
| | 28 |
| | 23 |
| |
| Foreign exchange gain (loss) on remeasurement (1) | | $ | 3 |
| | $ | (5 | ) | | $ | 5 |
|
| Fair value gains (losses) on equity investments (2) | | — |
| | 27 |
| | — |
|
| Other | 64 |
| | 24 |
| | 12 |
| 19 |
| | 10 |
| | 11 |
|
| Total other income (loss) | $ | 39 |
| | $ | 37 |
| | $ | 14 |
| $ | 22 |
| | $ | 32 |
| | $ | 16 |
|
____________________
| |
| (1) | Primarily relate to cash. |
| |
| (2) | The Company recorded a gain on change in fair value of equity securities in 2018 related to the Company's minority interest in the parent company of TMC Bonds LLC, which it sold in third quarter of 2018. |
Economic Loss Development
The insured portfolio includes policies accounted for under three separate accounting models depending on the characteristics of the contract and the Company’s control rights. Please refer to Part II, Item 8, Financial Statements and Supplementary Data, Note 5, Expected Loss to be Paid, forFor a discussion of the assumptions and methodologies used in calculating the expected loss to be paid for all contracts. For a discussion ofcontracts, the loss estimation process approach to projecting losses and the accounting policies for measurement and recognition accounting policies under GAAP for each type of contract, see the followingNotes listed below in Part II, Item 8, Financial Statements and Supplementary Data:Data.
•Note 56 for expected loss to be paid
��Note 6 for financial guaranty insurance,
•Note 7 for contracts accounted for as insurance
•Note 9 for fair value methodologies for credit derivatives and FG VIEVIEs’ assets and liabilities
•Note 811 for contracts accounted for as credit derivatives and
•Note 914 for consolidated FG VIEs.VIEs
The discussion of losses that follows encompasses losses on all contracts in the insured portfolio regardless of accounting model, unless otherwise specified. In order to effectivelyefficiently evaluate and manage the economics of the entire insured portfolio, management compiles and analyzes expected loss information for all policies on a consistent basis. That is, management monitors and assigns ratings and calculates expectedThe discussion of losses that follows encompasses losses on all contracts in the same manner for all its exposures. Management also considers contract specific characteristics that affect the estimatesinsured portfolio regardless of expected loss.
The surveillance process for identifying transactions with expected losses is described in Part II, Item 8, Financial Statements and Supplementary Data, Note 5, Expected Losses to be Paid. More extensive monitoring and intervention is employed for all BIG surveillance categories, with internal credit ratings reviewed quarterly.
accounting model, unless otherwise specified. Net expected loss to be paid primarily consists primarily of the present value of future: expected claim and LAE payments, expected recoveries from issuers or excess spread, and other collateral in the transaction structures, cessions to reinsurers, and expected recoveriesrecoveries/payables for breaches of R&Wrepresentation & warranties (R&W) and the effects of other loss mitigation strategies. Current risk free rates are used to discount expected losses at the end of each reporting period and therefore changes in such rates from period to period affect the expected loss estimates reported. Assumptions used in the determination of the net expected loss to be paid such as delinquency, severity, and discount rates and expected time frames to recovery in the mortgage market were consistent by sector regardless of the accounting model used. The primary drivers of economic loss development are discussed below. Changes in risk freerisk-free rates used to discount losses affect economic loss development, loss and LAE, and operating loss and LAE; however, the effect of changes in discount rates are not indicative of actual credit impairment or improvement in the period.
Net Expected Loss to be Paid (Recovered) and
Net Economic Loss Development (Benefit)
By Accounting Model
|
| | | | | | | | | | | | | | | | | | | |
| | Net Expected Loss to be Paid (Recovered) | | Net Economic Loss Development (Benefit) |
| | As of December 31, | | Year Ended December 31, |
| | 2019 | | 2018 | | 2019 | | 2018 | | 2017 |
| | (in millions) |
| Insurance | $ | 683 |
| | $ | 1,110 |
| | $ | 14 |
| | $ | (9 | ) | | $ | 353 |
|
| FG VIEs | 58 |
| | 75 |
| | (29 | ) | | (13 | ) | | (6 | ) |
| Credit derivatives | (4 | ) | | (2 | ) | | 14 |
| | 17 |
| | (34 | ) |
| Total | $ | 737 |
| | $ | 1,183 |
| | $ | (1 | ) | | $ | (5 | ) | | $ | 313 |
|
Net Expected Loss to be Paid (Recovered) and
Net Economic Loss Development (Benefit)
By Sector
|
| | | | | | | | | | | | | | | | | | | |
| | Net Expected Loss to be Paid (Recovered) | | Net Economic Loss Development (Benefit) |
| | As of December 31, | | Year Ended December 31, |
| | 2019 | | 2018 | | 2019 | | 2018 | | 2017 |
| | (in millions) |
| U.S. public finance | $ | 531 |
| | $ | 832 |
| | $ | 224 |
| | $ | 70 |
| | $ | 554 |
|
| Non-U.S. public finance | 23 |
| | 32 |
| | (9 | ) | | $ | (14 | ) | | $ | (5 | ) |
| Structured finance | | | | | | | | | |
| U.S. RMBS | 146 |
| | 293 |
| | (234 | ) | | (69 | ) | | (181 | ) |
| Other structured finance | 37 |
| | 26 |
| | 18 |
| | 8 |
| | (55 | ) |
| Structured finance | 183 |
| | 319 |
| | (216 | ) | | (61 | ) | | (236 | ) |
| Total | $ | 737 |
| | $ | 1,183 |
| | $ | (1 | ) | | $ | (5 | ) | | $ | 313 |
|
Risk-Free Rates
|
| | | | | | | | | | | |
| | Risk-Free Rates used in Expected Loss for U.S. Dollar Denominated Obligations | | Economic Loss Development (Benefit) Attributable to Changes in Risk Free Rates |
| | As of December 31, | | Year Ended December 31, |
| | Range | | Weighted Average | | (in millions) |
| 2019 | 0.0 | % | - | 2.45% | | 1.94 | % | | $ | (11 | ) |
| 2018 | 0.0 | % | - | 3.06% | | 2.74 | % | | (17 | ) |
| 2017 | 0.0 | % | - | 2.78% | | 2.38 | % | | 25 |
|
2019 Net Economic Loss Development
Public Finance: Public finance expected loss to be paid primarily related to U.S. exposures, which had BIG net par outstanding of $5.8 billion as of December 31, 2019 compared with $6.4 billion as of December 31, 2018. The Company projects that its total net expected loss across its troubled U.S. public finance exposures as of December 31, 2019 will be $531 million, compared with $832 million as of December 31, 2018. The total net expected loss for troubled U.S. public finance exposures is net of a credit for estimated future recoveries of claims already paid. At December 31, 2019 that credit was $819 million compared with $586 million at December 31, 2018. Economic loss development on U.S. exposures in 2019 was $224 million, which was primarily attributable to Puerto Rico exposures. See Item 8, Financial Statements and Supplementary Data, Note 5, Outstanding Insurance Exposure, for details about significant developments that have taken place in Puerto Rico.
The economic benefit of approximately $9 million on non-U.S. exposures during 2019 was mainly attributable to the improved internal outlook of certain Spanish sovereigns and sub-sovereigns.
U.S. RMBS: The net benefit attributable to U.S. RMBS of $234 million was mainly related to improvement in the performance of second lien U.S. RMBS transactions.
Other Structured Finance: The economic loss development attributable to structured finance, excluding U.S. RMBS, was $18 million, mainly related to LAE.
2018 Net Economic Loss Development
Public Finance: Public finance expected loss to be paid primarily related to U.S. exposure, which had BIG net par outstanding of $6.4 billion as of December 31, 2018 compared with $7.1 billion as of December 31, 2017. The Company projects that its total net expected loss across its troubled U.S. public finance exposures as of December 31, 2018 will be $832 million, compared with $1,157 million as of December 31, 2017. The total net expected loss for troubled U.S. public finance exposures is net of a credit for estimated future recoveries of claims already paid. At December 31, 2018, that credit was $586 million compared with $385 million at December 31, 2017. Economic loss development on U.S. exposures in 2018 was $70 million, which was primarily attributable to Puerto Rico exposures, partially offset by the release of reserves on the Company's exposure to the City of Hartford following the State of Connecticut's (CT) agreement to pay the debt service costs of certain bonds of the City of Hartford, including those insured by the Company.
The economic benefit of approximately $14 million on non-U.S. exposures during 2018 was mainly attributable to a U.K. arterial road and changes in certain probability of default assumptions.
U.S. RMBS: The net benefit attributable to U.S. RMBS of $69 million was mainly related to improvement in the performance of second lien U.S. RMBS transactions. The net expected loss to be paid for U.S RMBS increased from 2017 to 2018 mainly due losses assumed in the SGI Transaction and the collection of a large R&W settlement in 2018.
Other Structured Finance: The economic loss development attributable to structured finance, excluding U.S. RMBS, was $8 million, related to progress on efforts to workout life insurance transactions and LAE.
2017 Net Economic Loss Development
Public Finance: Public finance expected loss to be paid primarily related to U.S. exposures which had BIG net par outstanding of $7.1 billion as of December 31, 2017 compared with $7.4 billion as of December 31, 2016. The Company projected that its total net expected loss across its troubled U.S. public finance exposures as of December 31, 2017 would be $1,157 million, compared with $871 million as of December 31, 2016. Economic loss development on U.S. exposures in 2017 was $554 million, which was primarily attributable to Puerto Rico exposures.
U.S. RMBS: The net benefit attributable to U.S. RMBS was $181 million and was mainly related to an R&W litigation settlement, and improved second lien U.S. RMBS recoveries.
Other Structured Finance: The net benefit attributable to structured finance (excluding U.S. RMBS) was $55 million, primarily due to a benefit from a litigation settlement related to two life insurance transactions.
Insurance Segment Loss and LAE
The primary differences between net economic loss development and the amount reported as loss and LAE in the consolidated statements of operations are that the amount reported in the Consolidated Statements of Operations:
loss and LAE: (1) considers deferred premium revenue in the calculation of loss reserves and loss and LAE for financial guaranty insurance contracts,
(2) eliminates loss and LAE related to consolidated FG VIEs and
(3) does not include estimated losses on credit derivatives.
Loss and LAE reported in Insurance segment adjusted operating income (i.e. operating, adjusted loss and LAE) includes lossesloss and LAE on financial guaranty insurance contracts other than those eliminated due(without giving effect to eliminations related to consolidation of FG VIEs, andVIEs), plus credit derivatives.derivative losses.
For financial guaranty insurance contracts, theeach transaction's expected loss and LAE reported into be expensed is compared with the Consolidated Statements of Operations is generally recorded only when expected losses exceed deferred premium revenue.revenue of that transaction. When the expected loss to be expensed exceeds the deferred premium revenue, a loss is recognized in income for the amount of such excess. Therefore, the timing of loss recognition in income does not necessarily coincide with the timing of the actual credit impairment or improvement reported in net economic loss development. Transactions (particularly BIG transactions) acquired in a business combination or seasoned portfolios assumed from legacy financial guaranty insurers generally have the largest deferred premium revenue balances because of the purchase accounting adjustments made at acquisition.balances. Therefore the largest differences between net economic loss development and loss and LAE on financial guaranty insurance contracts generally relate to thesethose policies. See "Loss and LAE (Financial Guaranty Insurance Contracts)" below.
Net Expected Loss to be Paid
|
| | | | | | | |
| | As of
December 31, 2016 | | As of
December 31, 2015 |
| | (in millions) |
| Public finance | $ | 904 |
| | $ | 809 |
|
| Structured finance | | | |
| U.S. RMBS before R&W payable (recoverable) | 200 |
| | 488 |
|
| R&W payable (recoverable) (1) | 6 |
| | (79 | ) |
| U.S. RMBS after R&W | 206 |
| | 409 |
|
| Other structured finance | 88 |
| | 173 |
|
| Structured finance | 294 |
| | 582 |
|
| Total | $ | 1,198 |
| | $ | 1,391 |
|
____________________
| |
(1) | The Company’s agreements with R&W providers generally provide that, as the Company makes claim payments, the R&W providers reimburse it for those claims; if the Company later receives reimbursement through the transaction (for example, from excess spread), the Company repays the R&W providers. When the Company projects receiving more reimbursements in the future than it projects paying in claims on transactions covered by R&W settlement agreements, the Company will have a net R&W payable.
|
Economic Loss Development (Benefit) (1)
|
| | | | | | | | | | | |
| | Year Ended December 31, |
| | 2016 | | 2015 | | 2014 |
| | (in millions) |
| Public finance | $ | 269 |
| | $ | 405 |
| | $ | 171 |
|
| Structured finance | | | | | |
| U.S. RMBS before R&W payable (recoverable) | (108 | ) | | (149 | ) | | 0 |
|
| R&W payable (recoverable) | 17 |
| | 67 |
| | (268 | ) |
| U.S. RMBS after R&W | (91 | ) | | (82 | ) | | (268 | ) |
| Other structured finance | (39 | ) | | (4 | ) | | 67 |
|
| Structured finance | (130 | ) | | (86 | ) | | (201 | ) |
| Total | $ | 139 |
| | $ | 319 |
| | $ | (30 | ) |
____________________
| |
(1) | Economic loss development includes the effects of changes in assumptions based on observed market trends, changes in discount rates, accretion of discount and the economic effects of loss mitigation efforts. |
2016 Net Economic Loss Development
The total economic loss development of $139 million in 2016 was primarily related to the public finance sector, offset in part by improvements in the structured finance sector. The risk-free rates used to discount expected losses ranged from 0.0% to 3.23% as of December 31, 2016 and 0.0% to 3.25% as of December 31, 2015. The effect of changes in the risk-free rates used to discount expected losses was a benefit of $15 million in 2016.
U.S. Public Finance Economic Loss Development: The net par outstanding for U.S. public finance obligations rated BIG by the Company was $7.4 billion as of December 31, 2016 compared with $7.8 billion as of December 31, 2015. The Company projects that its total net expected loss across its troubled U.S. public finance credits as of December 31, 2016 will be $871 million, compared with $771 million as of December 31, 2015. Economic loss development in 2016 was $276 million, which was primarily attributable to Puerto Rico exposures. See "Insured Portfolio-Exposure to Puerto Rico" below for details about significant developments that have taken place in Puerto Rico.
U.S. RMBS Economic Loss Development: The net benefit attributable to U.S. RMBS was $91 million and was due mainly to the acceleration of claim payments as a means of mitigating future losses on certain Alt-A transactions.
Other Structured Finance Economic Loss Development: The net benefit attributable to structured finance (excluding U.S. RMBS) was $39 million, due primarily to a benefit from the purchase of a portion of an insured obligation as part of a loss mitigation strategy and and the commutation of certain assumed student loan exposures.
2015 Net Economic Loss Development
Total economic loss development was $319 million in 2015, due primarily to higher U.S. public finance losses on Puerto Rico exposures, partially offset by a net benefit in the U.S. RMBS sector. The risk-free rates used to discount expected losses ranged from 0.0% to 3.25% as of December 31, 2015 compared with 0.0% to 2.95% as of December 31, 2014. The change in the risk-free rates used to discount expected losses was a benefit of $23 million in 2015.
U.S. Public Finance Economic Loss Development: The net par outstanding for U.S. public finance obligations rated BIG by the Company was $7.8 billion as of December 31, 2015 compared with $7.9 billion as of December 31, 2014. The Company projected that its total net expected loss across its troubled U.S. public finance credits as of December 31, 2015 would be $771 million, compared with $303 million as of December 31, 2014. Economic loss development in 2015 was approximately $416 million, which was primarily attributable to certain Puerto Rico exposures.
U.S. RMBS Economic Loss Development: The net benefit attributable to U.S. RMBS of $82 million was primarily due to the R&W settlements during the year and a benefit due to the acceleration of claim payments as a means of mitigating future losses on certain Alt-A transactions, which was partially offset by losses in certain second lien U.S. RMBS transactions due to rising delinquencies and collateral deterioration associated with the increase in monthly payments when their loans reach their principal amortization period.
2014 Net Economic Loss Development
Total economic loss development was a favorable $30 million in 2014, due primarily to the various U.S. RMBS R&W settlements during the year and improvements in some of the Company's insured TruPS transactions. This was partially offset by U.S. public finance losses related to Puerto Rico and Detroit and structured finance losses that resulted primarily from changes in underlying assumptions on life insurance securitization transactions and the decrease in discount rates used. The risk-free rates used to discount expected losses ranged from 0.0% to 2.95% as of December 31, 2014 compared with 0.0% to 4.44% as of December 31, 2013.
U.S. Public Finance Economic Loss Development: The net par outstanding for U.S. public finance obligations rated BIG by the Company was $7.9 billion as of December 31, 2014 compared with $9.1 billion as of December 31, 2013. The Company projected that its total net expected loss across its troubled U.S. public finance credits as of December 31, 2014 would be $303 million, compared with $264 million as of December 31, 2013. Economic loss development in 2014 was approximately $183 million, which was primarily attributable to Puerto Rico and Detroit exposures.
U.S. RMBS Economic Loss Development: The net benefit attributable to U.S. RMBS of $268 million was primarily due to the R&W settlements during the year.
Loss and LAE (Financial Guaranty Insurance Contracts)
The amount of loss and LAE recognized in the consolidated statementsInsurance segment income, which includes all policies regardless of operations for financial guaranty contracts accounted for as insurance,form, is dependent ona function of the amount of economic loss development discussed above and the deferred premium revenue amortization in a given period, on a contract-by-contract basis. For these transactions, each transaction’s expected loss to be expensed, net of estimated recoveries, is compared with the deferred premium revenue of that transaction. Generally, when the expected loss to be expensed exceeds the deferred premium revenue, a loss is recognized in the consolidated statements of operations for the amount of such excess.
While expected loss to be paid is an important liquidity measure that provides the present value of amounts that the Company expects to pay or recover in future periods on all contracts, expected loss to be expensed is important because it presents the Company’s projection of loss and LAEnet expected losses that will be recognized in future periods as deferred premium revenue amortizes into income in the Consolidated Statements of Operations for financial guaranty insurance policies. Expected loss to be paid for FG VIEs pursuant to AGC’s and AGM’s financial guaranty policies is calculated in a manner consistent with financial guaranty insurance contracts, but eliminated in consolidation under GAAP.
The following table presents the Insurance segment loss and LAE, recorded in the consolidated statements of operations. Amounts presented are net of reinsurance.
Insurance Segment
Loss and LAE Reported(Benefit)
on the Consolidated Statements of Operations
| | | | Year Ended December 31, | Year Ended December 31, |
| | 2016 | | 2015 | | 2014 | 2019 | | 2018 | | 2017 |
| | (in millions) | (in millions) |
| Public finance | $ | 304 |
| | $ | 393 |
| | $ | 191 |
| |
| U.S. public finance | | $ | 247 |
| | $ | 90 |
| | $ | 553 |
|
| Non-U.S. public finance | | (7 | ) | | (7 | ) | | (4 | ) |
| Structured finance | | | | | | | | | | |
| U.S. RMBS | 37 |
| | 54 |
| | (129 | ) | (176 | ) | | (19 | ) | | (142 | ) |
| Other structured finance | (39 | ) | | 5 |
| | 94 |
| 22 |
| | 6 |
| | (55 | ) |
| Structured finance | (2 | ) | | 59 |
| | (35 | ) | (154 | ) | | (13 | ) | | (197 | ) |
| Total insurance contracts before FG VIE consolidation | 302 |
| | 452 |
| | 156 |
| |
| Elimination of losses attributable to FG VIEs | (7 | ) | | (28 | ) | | (30 | ) | |
| Total loss and LAE (1) | $ | 295 |
| | $ | 424 |
| | $ | 126 |
| |
| Total loss and LAE (benefit) | | $ | 86 |
| | $ | 70 |
| | $ | 352 |
|
____________________
| |
(1) | Excludes credit derivative benefit of $20 million for 2016, credit derivative loss expense of $22 million for 2015 and credit derivative benefit of $77 million for 2014. |
LossThe primary components of the Insurance segment loss and LAE expense were as follows:
2019 was mainly driven by higher losses on certain Puerto Rico exposures, partially offset by improved recoveries in 2016U.S. RMBS,
2018 was mainly driven by higher loss reserves on certain Puerto Rico exposures.exposures, partially offset by the reduction of loss reserves on the City of Hartford, CT, exposure and a benefit on structured finance exposures, and
Loss and LAE in 2015 comprised2017 was mainly changes indriven by higher loss estimatesreserves on certain Puerto Rico exposures, second lien U.S. RMBS transactions and Triple-X life insurance transactions. Some of the increases were partially offset by improvements in first lien U.S. RMBSa benefit from R&W settlements of $105 million, and student loan transactions.
In 2014, losses and LAE primarily included higher U.S. public finance loss estimates on Puerto Rico and Detroit, and higher structured finance losses attributable to Triple-Xa life insurance transactions. In 2014, loss and LAE also included benefits in the U.S. RMBS portfolio due primarily to the settlement of several R&W claims. Changes in risk-free rates used to discount losses also adversely affected loss expense for long-dated transactions, however this component of loss expense does not reflect actual credit impairment or improvement in the period.litigation settlement.
For financial guaranty contracts accounted for as insurance, the amounts reported in the GAAP financial statements may only reflect a portion of the current period’s economic loss development and may also include a portion of prior-period economic loss development. The difference between economic loss developmentadditional information on financial guaranty insurance contracts and loss and LAE recognized in the Consolidated Statements of Operations relates to the effect of taking deferred premium revenue into account for loss and LAE, which is not considered in economic loss development.
The following table provides a schedule of the expected timing of net expected losses to be expensed.expensed see Item 8, Financial Statements and Supplementary Data, Note 7, Contracts Accounted for as Insurance, Financial Guaranty Insurance Losses.
Compensation, Benefits, Other Operating Expenses and Amortization of DAC
2019 compared with 2018: Employee compensation and benefit expenses increased in 2019 compared with 2018 primarily due to higher bonus and share-based compensation expenses, which were offset by higher deferred costs as a result of increased new business production. Other operating expenses and amortization of DAC increased in 2019 compared with 2018 primarily due to higher professional fees and amortization of DAC resulting from increased premium earned for specific underwriting years, which were partially offset by lower acquisition related expenses, which related to the SGI Transaction in 2018.
2018 compared with 2017: Employee compensation and benefit expenses increased in 2018 compared with 2017 primarily due to higher salary and bonus accruals and share-based compensation expenses, which were offset by higher deferred costs as a result of increased new business production. Other operating expenses and amortization of DAC decreased in 2018 compared with 2017 primarily due to lower acquisition related expenses (SGI Transaction in 2018 versus MBIA UK Acquisition in 2017) and amortization of DAC resulting from reduced premium earned for specific underwriting years.
Asset Management Segment Results
Asset Management Results
|
| | | |
| | Year Ended
December 31, 2019 |
| | (in millions) |
| Revenues | |
| Management fees: | |
| CLOs | $ | 3 |
|
| Opportunity funds | 2 |
|
| Wind-down funds | 13 |
|
| Total management fees | 18 |
|
| Performance fees | 4 |
|
| Total asset management fees | 22 |
|
| Total revenues | 22 |
|
| Expenses | |
| Restructuring expenses | 7 |
|
| Amortization of intangible assets | 3 |
|
| Employee compensation and benefit expenses | 17 |
|
| Other operating expenses | 7 |
|
| Total expenses | 34 |
|
| Adjusted operating income (loss) before income taxes | (12 | ) |
| Provision (benefit) for income taxes | (2 | ) |
| Adjusted operating income (loss) | $ | (10 | ) |
Asset Management Fees
Management fees from CLOs are the net management fees that Assured Investment Management retains after rebating the portion of these fees that pertains to the CLO equity that is held directly by Assured Investment Management funds. Gross management fees from CLOs, before rebates to Assured Investment Management funds, were $11 million for the fourth quarter of 2019.
Management fees from opportunity funds for the quarter are attributable to a previously established opportunity fund. During the fourth quarter of 2019, the Company launched two new opportunity funds with capital from the Company's insurance subsidiaries of $142 million, which are expected to earn management fees beginning in 2020.
Performance fees were primarily derived from the achievement of performance criteria of two funds currently in wind-down. Funds that do not hit high-water marks or return hurdles are not eligible to receive performance fees for the year. Distributions to investors in the wind-down funds are expected to continue, at least throughout 2020.
Performance fees are recorded when the contractual performance criteria have been met and when it is probable that a significant reversal of revenues will not occur in future reporting periods. For opportunity funds, these conditions are met typically close to the end of the fund’s life. The Company's current opportunity funds were not near the end of their harvest period during the quarter, when they would typically earn performance fee.
Expenses
Expenses primarily consist of employee compensation and benefits, which included $7 million in restructuring expenses as the Company repositioned Assured Investment Management and right-sized the asset management business. Remaining operating expenses primarily consist of depreciation and amortization related to the leases held by Assured Investment Management in New York and London. Amortization of finite-lived intangible assets, which mainly consist of Assured Investment Management's CLO and investment management contracts and its CLO distribution network, was $3 million during the fourth quarter of 2019.
Assets Under Management
The Company uses AUM as a metric to measure progress in its Asset Management segment. The Company uses measures of its AUM in its decision making process and intends to use a measure of change in AUM in its calculation of certain components of management compensation. Investors also use AUM to evaluate companies that participate in the asset management business. AUM refers to the assets managed, advised or serviced by the Asset Management segment and equals the sum of the following:
the net asset value of the opportunity and wind-down funds plus any unfunded commitments;
the amount of aggregate collateral balance and timingprincipal cash of actual lossAssured Investment Management's CLOs, including CLO equity that may be held by Assured Investment Management funds. This also includes CLO assets managed by BlueMountain Fuji Management, LLC (BM Fuji). BlueMountain is not the investment manager of BM Fuji CLOs, but rather has entered into a services agreement and LAEa secondment agreement with BM Fuji pursuant to which BlueMountain provides certain services associated with the management of BM Fuji-advised CLOs and acts in the capacity of service provider.
The Company's calculation of AUM may differ from the estimates shown belowcalculation employed by other investment managers and, as a result, this measure may not be directly comparable to similar measures presented by other investment managers. The calculation also differs from the manner in which Assured Investment Management affiliates registered with the SEC report “Regulatory Assets Under Management” on Form ADV and Form PF in various ways.
The Company also uses several other measurements of AUM to understand and measure its AUM in more detail and for various purposes, including its relative position in the market and its income and income potential:
“Third-party assets under management” or “3rd Party AUM” refers to the assets Assured Investment Management manages or advises on behalf of third-party investors. This includes current and former employee investments in Assured Investment Management's funds. For CLOs, this also includes CLO equity that may be held by Assured Investment Management's funds.
“Intercompany assets under management” or “Intercompany AUM” refers to the assets Assured Investment Management manages or advises on behalf of the Company. This includes investments from affiliates of Assured Guaranty along with general partners' investments of BlueMountain (or its affiliates) into the funds.
“Funded assets under management” or “Funded AUM” refers to assets that have been deployed or invested into the funds or CLOs.
“Unfunded assets under management” or “Unfunded AUM” refers to unfunded capital commitments from closed-end funds and CLO warehouse fund.
“Fee earning assets under management” or “Fee Earning AUM” refers to assets where Assured Investment Management collects fees and has elected not to waive or rebate fees to investors.
“Non-fee earning assets under management” or “Non-Fee Earning AUM” refers to assets where Assured Investment Management does not collect fees or has elected to waive or rebate fees to investors. Assured Investment Management reserves the right to waive some or all fees for certain investors, including investors affiliated with Assured Investment Management and/or the Company. Further, to the extent that the Company's wind-down and/or opportunity funds are invested in Assured Investment Management managed CLOs, Assured Investment Management may rebate any management fees and/or performance compensation earned from the CLOs to the extent such fees are attributable to the wind-down and opportunity funds’ holdings of CLOs also managed by Assured Investment Management.
Assets Under Management
|
| | | | | | | | | | | | | | | |
| | CLOs | | Opportunity Funds | | Wind-Down Funds | | Total |
| | (in millions) |
| Rollforward: | | | | | | | |
| AUM, October 1, 2019 | $ | 11,844 |
| | $ | 923 |
| | $ | 5,528 |
| | $ | 18,295 |
|
| | | | | | | | |
| Inflows | 977 |
| | 165 |
| | — |
| | 1,142 |
|
| Outflows: | | | | | | | |
| Redemptions | — |
| | — |
| | (171 | ) | | (171 | ) |
| Distributions | (92 | ) | | (43 | ) | | (1,126 | ) | | (1,261 | ) |
| Total outflows | (92 | ) | | (43 | ) | | (1,297 | ) | | (1,432 | ) |
| Net flows | 885 |
| | 122 |
| | (1,297 | ) | | (290 | ) |
| Change in fund value | 29 |
| | (22 | ) | | (185 | ) | | (178 | ) |
| AUM, end of period (1) | $ | 12,758 |
| | $ | 1,023 |
| | $ | 4,046 |
| | $ | 17,827 |
|
| | | | | | | | |
| Funded AUM | $ | 12,721 |
| | $ | 796 |
| | $ | 3,980 |
| | $ | 17,497 |
|
| Unfunded AUM | 37 |
| | 227 |
| | 66 |
| | 330 |
|
| | | | | | | | |
| Fee Earning AUM | $ | 3,438 |
| | $ | 695 |
| | $ | 3,838 |
| | $ | 7,971 |
|
| Non-Fee Earning AUM | 9,320 |
| | 328 |
| | 208 |
| | 9,856 |
|
_____________________
| |
| (1) | Includes $142 million and $49 million of AUM related to intercompany investments in Assured Investment Management opportunity fund and CLO fund, respectively. |
CLOs AUM includes $536 million of CLO equity that is held by various Assured Investment Management funds. This CLO equity corresponds to the majority of the non-fee earning CLO AUM, as Assured Investment Management typically rebates the CLO fees back to Assured Investment Management funds.
Net outflows were $290 million, primarily driven by the return of capital in wind-down funds, which includes funds that are now subject to orderly wind-down and certain funds in their harvest period, partially offset by the issuance of two new CLOs and a CLO fund, as well as the launch of opportunity funds focused on asset-backed finance and healthcare structured capital strategies. The new funds launched in the fourth quarter of 2019 were primarily funded with capital from the Insurance segment.
Corporate Division Results
Corporate Results
|
| | | | | | | | | | | |
| | Year Ended December 31, |
| | 2019 | | 2018 | | 2017 |
| | (in millions) |
| Revenues | | | | | |
| Net investment income | $ | 4 |
| | $ | 6 |
| | $ | 2 |
|
| Other income (loss) (1) | (1 | ) | | (34 | ) | | (10 | ) |
| Total revenues | 3 |
| | (28 | ) | | (8 | ) |
| Expenses | | | | | |
| Interest expense | 94 |
| | 97 |
| | 100 |
|
| Employee compensation and benefit expenses | 17 |
| | 18 |
| | 16 |
|
| Other operating expenses | 22 |
| | 14 |
| | 13 |
|
| Total expenses | 133 |
| | 129 |
| | 129 |
|
| Adjusted operating income (loss) before income taxes | (130 | ) | | (157 | ) | | (137 | ) |
| Provision (benefit) for income taxes | (19 | ) | | (61 | ) | | (54 | ) |
| Adjusted operating income (loss) | $ | (111 | ) | | $ | (96 | ) | | $ | (83 | ) |
_____________________
(1) Primarily loss on extinguishment of debt.
Adjusted operating loss for the Corporate division for all periods consisted primarily of interest expense and compensation expense, and also included losses on the extinguishment of debt recorded in other income.
Revenues
The loss on extinguishment of debt, recorded in other income, is related to AGUS' purchase of a portion of the principal amount of AGMH's outstanding Junior Subordinated Debentures. The loss represents the difference between the amount paid to purchase AGMH's debt and the carrying value of the debt, which includes the unamortized fair value adjustments that were recorded upon the acquisition of AGMH in 2009.
Interest Expense
Interest expense primarily relates to debt issued by AGUS and AGMH. Decrease in interest expense for all years relates to purchase of AGMH's debt by AGUS. See Item 8, Financial Statements and Supplementary Data, Note 15, Long-Term Debt and Credit Facilities, for additional information.
Compensation, Benefits and Other Operating Expenses
Compensation and benefits expenses allocated to the Corporate division are based on time studies and represent the costs incurred and time spent on holding company activities, capital management, corporate oversight and governance. Other operating expenses increased in 2019 compared with 2018 primarily due to factorshigher professional fees related to AGUS' acquisition of BlueMountain.
Other
Other items consist of intersegment eliminations, reclassifications, and consolidation adjustments, including the effect of consolidating FG VIEs and certain Assured Investment Management investment vehicles in which Insurance segment invests. The net effect on adjusted operating income (loss) of these adjustments was a loss of $4 million in 2018 and a gain of $12 million in 2017. The effect was de minimis in 2019. See Item 8, Financial Statements and Supplementary Data, Note 4, Segment Information.
VIE Consolidation Effect on
Net Income (Loss) Attributable to AGL
|
| | | | | | | | | | | |
| | Year Ended December 31, |
| | 2019 | | 2018 | | 2017 |
| | (in millions) |
| Effect of consolidating: | | | | | |
| FG VIEs | $ | — |
| | $ | (4 | ) | | $ | 11 |
|
| Investment vehicles | — |
| | — |
| | — |
|
| VIE consolidation effect | $ | — |
| | $ | (4 | ) | | $ | 11 |
|
The types of variable interest entities (VIEs) the Company consolidates when it is deemed to be the primary beneficiary include (1) entities whose debt obligations the insurance subsidiaries insure, and (2) investment vehicles such as accelerations, commutations, changescollateralized financing entities and investment funds managed by the Asset Management subsidiaries, in expected liveswhich the insurance company subsidiaries have a variable interest (consolidated investment vehicles). The Company eliminates the effects of intercompany transactions between consolidated VIEs and updates to loss estimates. This table excludes $64 million related toits insurance and asset management subsidiaries, as well as intercompany transactions between consolidated VIEs.
Generally, the consolidation of the Company's consolidated investment vehicles and FG VIEs has a significant gross-up effect on the Company's assets, liabilities and cash flows. The consolidated investment vehicles have no net effect on the net income attributable to the Company. The economic interest the Company holds in consolidated funds is presented in the Insurance segment. The ownership interests of the Company's consolidated funds, to which the Company has no economic rights, are eliminatedreflected as either redeemable or nonredeemable noncontrolling interests in consolidation.the consolidated funds in the Company's consolidated financial statements. See Item 8, Financial Statements and Supplementary Data, Note 14, Variable Interest Entities, for additional information.
Reconciliation to GAAP
Reconciliation of Net Expected LossIncome (Loss) Attributable to be ExpensedAGL
Financial Guaranty Insurance ContractsTo Adjusted Operating Income (Loss)
|
| | | |
| | As of December 31, 2016 |
| | (in millions) |
| 2017 (January 1 – March 31) | $ | 8 |
|
| 2017 (April 1 – June 30) | 10 |
|
| 2017 (July 1 – September 30) | 8 |
|
| 2017 (October 1 – December 31) | 9 |
|
| Subtotal 2017 | 35 |
|
| 2018 | 34 |
|
| 2019 | 32 |
|
| 2020 | 32 |
|
| 2021 | 28 |
|
| 2022-2026 | 117 |
|
| 2027-2031 | 82 |
|
| 2032-2036 | 44 |
|
| After 2036 | 17 |
|
| Net expected loss to be expensed | 421 |
|
| Future accretion | 373 |
|
| Total expected future loss and LAE | $ | 794 |
|
|
| | | | | | | | | | | |
| | Year Ended December 31, |
| | 2019 | | 2018 | | 2017 |
| | (in millions) |
| Net income (loss) attributable to AGL | $ | 402 |
| | $ | 521 |
| | $ | 730 |
|
| Less pre-tax adjustments: | | | | | |
| Realized gains (losses) on investments | 22 |
| | (32 | ) | | 40 |
|
| Non-credit impairment unrealized fair value gains (losses) on credit derivatives | (10 | ) | | 101 |
| | 43 |
|
| Fair value gains (losses) on CCS (1) | (22 | ) | | 14 |
| | (2 | ) |
| Foreign exchange gains (losses) on remeasurement of premiums receivable and loss and LAE reserves | 22 |
| | (32 | ) | | 57 |
|
| Total pre-tax adjustments | 12 |
| | 51 |
| | 138 |
|
| Less tax effect on pre-tax adjustments | (1 | ) | | (12 | ) | | (69 | ) |
| Adjusted operating income (loss) | $ | 391 |
| | $ | 482 |
| | $ | 661 |
|
___________________
| |
| (1) | Included in other income (loss) in the consolidated statements of operations. |
Net ChangeRealized Investment Gains (Losses)
The table below presents the components of net realized investment gains (losses).
Net Realized Investment Gains (Losses)
|
| | | | | | | | | | | |
| | Year Ended December 31, |
| | 2019 | | 2018 | | 2017 |
| | (in millions) |
| Gross realized gains on available-for-sale securities | $ | 63 |
| | $ | 20 |
| | $ | 95 |
|
| Gross realized losses on available-for-sale securities | (5 | ) | | (12 | ) | | (12 | ) |
| Net realized gains (losses) on other invested assets | (1 | ) | | (1 | ) | | — |
|
| OTTI | (35 | ) | | (39 | ) | | (43 | ) |
| Net realized investment gains (losses) | $ | 22 |
| | $ | (32 | ) | | $ | 40 |
|
Gross realized gains mainly consisted of the following in each year presented:
2019 mainly related to the sale of the COFINA Exchange Senior Bonds.
2018 mainly related to foreign exchange gains.
2017 mainly relate to sales of internally managed investments, including the gain on sale of the Zohar II 2005-1 notes exchanged in the MBIA UK Acquisition.
OTTI for 2019, 2018 and 2017 was primarily attributable to securities purchased for loss mitigation and other risk management purposes and changes in foreign exchange rates.
Non-Credit Impairment Unrealized Fair Value ofGains (Losses) on Credit Derivatives
Changes in the fair value of credit derivatives occur primarily because of changes in interest rates,the Company's own credit rating and credit spreads, collateral credit spreads, notional amounts, credit ratings of the referenced entities, expected terms, realized gains (losses) and other settlements, and the issuing company's own credit rating and credit spreads,interest rates, and other market factors. With considerable volatility continuingThe components of changes in the market, unrealized gains (losses) onfair value of credit derivatives may fluctuate significantlyrelated to credit derivative revenues and changes in future periods.
Except for net estimated credit impairments (i.e., net expected payments), thelosses are included in Insurance segment results. Non-economic changes in unrealized fair value gains and losses on credit derivatives are not included in the Insurance segment measure of adjusted operating income because it does not represent actual claims or expected losses and are expected to reduce reverse
to zero as the exposure approaches its maturity date. Changes in the fair value of the Company’s credit derivatives that do not reflect actual or expected claims or credit losses have no impact on the Company’s statutory claims-paying resources, rating agency capital or regulatory capital positions. Expected losses to be paid in respect of contracts accounted for asUnrealized gains (losses) on credit derivatives are includedmay fluctuate significantly in the discussion above “Economic Loss Development.”future periods.
The impact of changes in credit spreads will vary based upon the volume, tenor, interest rates, and other market conditions at the time these fair values are determined. In addition, since each transaction has unique collateral and structural terms, the underlying change in fair value of each transaction may vary considerably. The fair value of credit derivative contracts also reflects the change in the Company’s own credit cost based on the price to purchase credit protection on AGC and AGM.AGC. The Company determines its own credit risk based on quoted CDS prices traded on the CompanyAGC at each balance sheet date. Generally, a widening of credit spreads of the underlying obligations results in unrealized losses and the tightening of credit spreads of the underlying obligations results in unrealized gains. A widening of the CDS prices traded on AGC and AGM has an effect of offsetting unrealized losses that result from widening general market credit spreads, while a narrowing of the CDS prices traded on AGC and AGM has an effect of offsetting unrealized gains that result from narrowing general market credit spreads. Due to the relatively low volume and characteristics of CDS contracts remaining in AGM's portfolio, changes in AGM's credit spreads do not significantly affect the fair value of these CDS contracts.
The valuation of the Company’s credit derivative contracts requires the use of models that contain significant, unobservable inputs, and are classified as Level 3 in the fair value hierarchy. The models used to determine fair value are primarily developed internally based on market conventions for similar transactions that the Company observed in the past.
There has been very limited new issuance activity in this market over the past several years and as of December 31, 2016,2019, market prices for the Company’s credit derivative contracts were generally not available. Inputs to the estimate of fair value include various market indices, credit spreads, the Company’s own credit spread, and estimated contractual payments. See Part II, Item 8, Financial Statements and SupplementalSupplementary Data, Note 7,9, Fair Value Measurement, for additional information.
Net Change in Fair Value of Credit Derivatives
Gain (Loss)
|
| | | | | | | | | | | |
| | Year Ended December 31, |
| | 2016 | | 2015 | | 2014 |
| | (in millions) |
| Realized gains on credit derivatives | $ | 56 |
| | $ | 63 |
| | $ | 73 |
|
| Net credit derivative losses (paid and payable) recovered and recoverable and other settlements | (27 | ) | | (81 | ) | | (50 | ) |
| Realized gains (losses) and other settlements (1) | 29 |
| | (18 | ) | | 23 |
|
| Net unrealized gains (losses): | | | | | |
| Pooled corporate obligations | (16 | ) | | 147 |
| | (18 | ) |
| U.S. RMBS | 22 |
| | 396 |
| | 814 |
|
| Commercial mortgage-backed securities (CMBS) | 0 |
| | 42 |
| | 2 |
|
| Other | 63 |
| | 161 |
| | 2 |
|
| Net unrealized gains (losses) | 69 |
| | 746 |
| | 800 |
|
| Net change in fair value of credit derivatives | $ | 98 |
| | $ | 728 |
| | $ | 823 |
|
____________________
| |
(1) | Includes realized gains and losses due to terminations and settlements of CDS contracts. |
Net credit derivative premiums included in the realized gains on credit derivatives line in the table above, have declined in 2016, 2015 and 2014 due primarily to the decline in the net par outstanding to $17.0 billion at December 31, 2016 from $25.6 billion at December 31, 2015 and $35.0 billion at December 31, 2014. As part of its strategic initiative, the Company has been negotiating terminations of investment grade and BIG CDS contracts with its counterparties.The following table presents the effect of terminations on realized gains (losses) and other settlements on credit derivatives.
Terminations and Settlements
of Direct Credit Derivative Contracts
|
| | | | | | | | | | | |
| | Year Ended December 31, |
| | 2016 | | 2015 | | 2014 |
| | (in millions) |
| Net par of terminated credit derivative contracts | $ | 3,811 |
| | $ | 2,777 |
| | $ | 3,591 |
|
| Realized gains on credit derivatives | 20 |
| | 13 |
| | 1 |
|
| Net credit derivative losses (paid and payable) recovered and recoverable and other settlements | — |
| | (116 | ) | | (26 | ) |
| Net unrealized gains (losses) on credit derivatives | 103 |
| | 465 |
| | 546 |
|
During 2016, unrealized2019, non-credit impairment fair value gains were generated primarily as a result of price improvements on the underlying collateral of the Company's CDS. These unrealized fair value gains were partially offset by unrealized fair value losses resulting from wider implied net spreads driven by the decreased market cost to buy protection in AGC’s name during the period. For those CDS transactions that were pricing at or above their floor levels, when the cost of purchasing CDS protection on AGC, which management refers to as the CDS spread on AGC, decreased, the implied spreads that the Company would expect to receive on these transactions increased.
During 2018, non-credit impairment fair value gains were primarily generated by CDS terminations, in the U.S. RMBS and other sectors, run-off of CDS par and price improvements on the underlying collateral of the Company’s CDS. In addition, unrealized fair value gains were generated by the increase in credit given to the primary insurer on one of the Company's second-to-pay CDS policies during the period. The unrealized fair value gains were partially offset by unrealized fair value losses resulting from wider implied net spreads driven by the decreased cost to buy protection in AGC’s name, as the market cost of AGC’s credit protection decreased during the period.
During 2017, non-credit impairment fair value gains were primarily generated by CDS terminations, run-off of net par outstanding, and price improvements on the underlying collateral of the Company’s CDS. The majority of the CDS transactions that were terminated were as a result of settlement agreements with several CDS counterparties. The unrealized fair value gains were partially offset by unrealized losses resulting from wider implied net spreads across all sectors. The wider implied net spreads were primarily a result ofDuring 2017, the decreased cost to buy protection in AGC’s and AGM’s name, asspecifically the market cost of AGC’s and AGM’s credit protection decreased significantlyfive-year CDS spread, did not change materially during the period. These transactions were pricing at or above their floor levels (orperiod, and therefore did not have a material impact on the minimum rate at which the Company would consider assuming these risks based on historical experience); therefore when the cost of purchasing CDS protection on AGC and AGM, which management refers to as the CDS spread on AGC and AGM, decreased the implied spreads that the Company would expect to receive on these transactions increased.
During 2015,Company’s unrealized fair value gains were generated primarily as a result of CDS terminations. The Company reached a settlement agreement with one CDS counterparty to terminate five Alt-A first lien CDS transactions resultingand losses on CDS.
Fair Value Gains (Losses) on CCS
Fair value losses on CCS in unrealized fair value gains of $213 million2019 and was the primary driver of the unrealized fair value gains in the U.S. RMBS sector. The Company also terminated a CMBS transaction, a Triple-X life insurance securitization transaction, and a distressed middle market CLO securitization during the period and recognized unrealized fair value gains of $41 million, $99 million and $99 million, respectively. These2017 were the primary drivers of the unrealized fair value gains in the CMBS, Other, and pooled corporate collateralized loan obligation (CLO) sectors, respectively, during the period. The remainder of the fair value gains for the period were a result of tighter implied net spreads across all sectors. The tighter implied net spreads were primarily a result of the increased cost to buy protection in AGC’s and AGM’s name, particularly for the one year CDS spread. These transactions were pricing at or above their floor levels, therefore when the cost of purchasing CDS protection on AGC and AGM increased, the implied spreads that the Company would expect to receive on these transactions decreased. Finally, during 2015, there was a refinement in methodology to address an instance in a U.S. RMBS transaction where the Company now expects recoveries. This refinement resulted in approximately $49 million in fair value gains in 2015.
During 2014, unrealized fair value gains were generated primarily in the U.S. RMBS prime first lien, Option ARM and subprime sectors. This is primarily due to a significant unrealized fair value gaintightening in the Option ARM and Alt-A first lien sector of approximately $543 million, as a result of the terminations of three large Alt-A first lien resecuritization transactions and one Option ARM first lien transactionmarket spreads during the period. In addition, there was an unrealized gain of approximately $346 million related to the change in index used to determine fair value during the fourth quarter of 2014. In the fourth quarter of 2014, new market indices were published on Option ARM and Alt-A first lien securitizations. As part of the Company’s normal review process the Company reviewed these indices and based upon the collateral make-up, collateral vintage, and collateral loss experience, determined it to be a better market indication for the Company’s Option ARM and Alt-A first lien securitizations. The unrealized fair value gains were partially offset by unrealized fair value losses generated by wider implied net spreads. The wider implied net spreads were primarily a result of the decreased cost to buy protection in AGC’s and AGM’s name, as the market cost of AGC's and AGM’s credit protection decreased during the period. These transactions were pricing at or above their floor levels; therefore when the cost of purchasing CDS protection on AGC and AGM decreased, the implied spreads that the Company would expect to receive on these transactions increased.
CDS Spread on AGC and AGM
Quoted price of CDS contract (in basis points)
|
| | | | | | | | |
| | As of
December 31, 2016 | | As of
December 31, 2015 | | As of
December 31, 2014 |
| Five-year CDS spread: | | | | | |
| AGC | 158 |
| | 376 |
| | 323 |
|
| AGM | 158 |
| | 366 |
| | 325 |
|
| | | | | | |
| One-year CDS spread | | | | | |
| AGC | 35 |
| | 139 |
| | 80 |
|
| AGM | 29 |
| | 131 |
| | 85 |
|
Effect of Changes in the Company’s Credit Spread on
Net Unrealized Gains (Losses) on Credit Derivatives
|
| | | | | | | | | | | |
| | Year Ended December 31, |
| | 2016 | | 2015 | | 2014 |
| | (in millions) |
| Change in unrealized gains (losses) of credit derivatives: | | | | | |
| Before considering implication of the Company’s credit spreads | $ | 183 |
| | $ | 663 |
| | $ | 1,396 |
|
| Resulting from change in the Company’s credit spreads | (114 | ) | | 83 |
| | (596 | ) |
| After considering implication of the Company’s credit spreads | $ | 69 |
| | $ | 746 |
| | $ | 800 |
|
Management believes that the trading level of AGC’s and AGM’s credit spreads over the past several years has been due to the correlation between AGC’s and AGM’s risk profile and the current risk profile of the broader financial markets, as well as the overall lack of liquidity in the CDS market. Offsetting the benefit attributable to AGC’s and AGM’s credit spread were higher credit spreads in the fixed income security markets relative to pre-financial crisis levels. The higher credit spreads in the fixed income security market are due to the lack of liquidity in the high-yield CDO, TruPS CDOs, and CLO markets as well as continuing market concerns over the 2005-2007 vintages of RMBS.
Interest Expense
Changes in interest expense between 2015 and 2014 relate to the timing of debt issuance. In June 2014, the Company issued $500 million aggregate principal amount of 5% Senior Notes due 2024. All other long term debt of the U.S. holding companies was outstanding throughout all three years presented. See Part II, Item 8, Financial Statements and Supplementary Data, Note 16, Long-Term Debt and Credit Facilities. The following table presents the components of interest expense.
Interest Expense
|
| | | | | | | | | | | |
| | Year Ended December 31, |
| | 2016 | | 2015 | | 2014 |
| | (in millions) |
| Debt issued by AGUS | $ | 48 |
| | $ | 49 |
| | $ | 36 |
|
| Debt issued by AGMH | 54 |
| | 54 |
| | 54 |
|
| Notes payable by AGM | 0 |
| | (2 | ) | | 2 |
|
| Total | $ | 102 |
| | $ | 101 |
| | $ | 92 |
|
In December 2016, $150 million of debt became floating rate interest debt, that resets quarterly, at a rate equal to three month LIBOR plus a margin equal to 2.38%.
Other Operating Expenses and Amortization of Deferred Acquisition Costs
2016 compared with 2015: Other operating expenses increased in 2016 compared to 2015 due primarily to higher compensation expense and accelerated amortization of leasehold improvements as a result of the Company's move of its New York offices.
2015 compared with 2014: Other operating expenses increased in 2015 compared to 2014 due primarily to $12 million in expenses related to the Radian Asset Acquisition and expenses related to the relocation of the New York offices in the summer of 2016. The Radian Asset Acquisition expenses were comprised mainly of fees paid to financial and legal advisors and to the independent auditor. Relocation expenses include broker fees and accelerated depreciation of unamortized improvements in the current New York office.
Financial Guaranty Variable Interest Entities
As of December 31, 2016 and 2015, the Company consolidated 32 and 34 VIEs, respectively. The table below presents the effects on reported GAAP income resulting from consolidating these FG VIEs and eliminating their related insurance and investment amounts. The consolidation of FG VIEs has an effect on net income and shareholders' equity due to:
changes in fair value gains (losses) on FG VIE assets and liabilities,
the eliminations of premiums and losses related to the AGC and AGM FG VIE liabilities with recourse, and
the elimination of investment balances related to the Company’s purchase of AGC and AGM insured FG VIE debt.
Upon consolidation of a FG VIE, the related insurance and, if applicable, the related investment balances, are considered intercompany transactions and therefore eliminated. See Part II, Item 8, Financial Statements and Supplementary Data, Note 9, Consolidated Variable Interest Entities, for more details.
Effect of Consolidating FG VIEs on Net Income (Loss)
|
| | | | | | | | | | | |
| | Year Ended December 31, |
| | 2016 | | 2015 | | 2014 |
| | (in millions) |
| Net earned premiums | $ | (16 | ) | | $ | (21 | ) | | $ | (32 | ) |
| Net investment income | (10 | ) | | (32 | ) | | (11 | ) |
| Net realized investment gains (losses) | 1 |
| | 10 |
| | (5 | ) |
| Fair value gains (losses) on FG VIEs | 38 |
| | 38 |
| | 255 |
|
| Bargain purchase gain | — |
| | 2 |
| | — |
|
| Loss and LAE | 7 |
| | 28 |
| | 30 |
|
| Other income (loss) | 0 |
| | 0 |
| | (2 | ) |
| Effect on income before tax | 20 |
| | 25 |
| | 235 |
|
| Less: tax provision (benefit) | 7 |
| | 8 |
| | 82 |
|
| Effect on net income (loss) | $ | 13 |
| | $ | 17 |
| | $ | 153 |
|
year. Fair value gains (losses) on FG VIEs represent the net changeCCS in fair value on the consolidated FG VIEs’ assets and liabilities. In 2016, the Company recorded2018 were primarily due to a pre-tax net fair value gain on consolidated FG VIEs of $38 million. The primary driver of the 2016 gainwidening in fairmarket spreads during 2018. Fair value of FG VIE assetsCCS is heavily affected by, and liabilities was net mark-to-market gains due to price appreciation resulting from improvements in the underlying collateral of HELOC RMBS assets of the FG VIEs.
In 2015, the Company recorded a pre-tax net fair value gain on consolidated FG VIEs of $38 million which was primarily driven by price appreciation on the Company's FG VIE assets during the year that resulted from improvementspart fluctuates with, changes in the underlying collateral, as well as large principal paydowns made on the Company's FG VIEs.
In 2014, the Company recorded a pre-tax net fair value gain on consolidated FG VIEs of $255 million. The primary driver of this gain, $120 million, was a result of the deconsolidation of seven VIEs. There was an additional gain of $37 million resulting from the Company exercising its option to accelerate two second lien RMBS VIEs. These two VIEs were treated as maturities during the period. The remainder of the gain for the period was driven by the price appreciation on the Company's FG VIE assets during the year resulting from improvements in the underlying collateral, as well as large principal paydowns made on the Company's FG VIEs.
Provision for Income Tax
Deferred income tax assetsmarket interest rates, credit spreads and liabilitiesother market factors and are established for the temporary differences between the financial statement carrying amounts and tax bases of assets and liabilities using enacted rates in effect for the year in which the differences arenot expected to reverse. Such temporary differences relate principally to unrealizedresult in an economic gain or loss.
Foreign Exchange Gain (Loss) on Remeasurement
Foreign exchange gains and losses on investmentsin all years primarily relate to remeasurement of premiums receivable and credit derivatives, FG VIE fair value adjustments, loss and LAE reserve, unearned premium reserve and tax attributes for net operating losses, alternative minimum tax credits and foreign tax credits. Asare mainly due to changes in the exchange rate of December 31, 2016 and December 31, 2015, the Company had a net deferred income tax asset of $497 million and $276 million, respectively. The increase in 2016 from 2015 is mainly attributablepound sterling relative to CIFG Acquisition.the U.S. dollar.
Provision for Income Taxes and Effective Tax Rates
|
| | | | | | | | | | | |
| | Year Ended December 31, |
| | 2016 | | 2015 | | 2014 |
| | (in millions) |
| Total provision (benefit) for income taxes | $ | 136 |
| | $ | 375 |
| | $ | 443 |
|
| Effective tax rate | 13.4 | % | | 26.2 | % | | 28.9 | % |
The Company’s effective tax rates reflect the proportion of income recognized by each of the Company’s operating subsidiaries, with U.S. subsidiaries taxed at the U.S. marginal corporate income tax rate of 35%, U.K. subsidiaries taxed at the U.K. marginal corporate tax rate of 20% unless subject to U.S. tax by election or as a U.S. CFC, and no taxes for the Company’s Bermuda subsidiaries unless subject to U.S tax by election or as a U.S. CFC. The Company’s overall corporate effective tax rate fluctuates based on the distribution of taxable income across these jurisdictions. In each of the periods
presented, the portion of taxable income from each jurisdiction varied. The non-taxable book-to-tax differences were mostly consistent as compared to the prior period with the exception of the benefit on bargain purchase gain from the CIFG Acquisition and Radian Asset Acquisition. See Part II, Item 8, Financial Statements and Supplementary Data, Note 12, Income Taxes, for more details.
Non-GAAP Financial Measures
To reflect the key financial measures that management analyzes in evaluating the Company’s operations and progress towards long-term goals, the Company discloses both financial measures determined in accordance with GAAP and financial measures not determined in accordance with GAAP (non-GAAP financial measures).
Financial measures identified as non-GAAP should not be considered substitutes for GAAP financial measures. The primary limitation of non-GAAP financial measures is the potential lack of comparability to financial measures of other companies, whose definitions of non-GAAP financial measures may differ from those of Assured Guaranty. Beginning in fourth quarter 2016, the Company’s publicly disclosed non-GAAP financial measures are different from the financial measures used by management in its decision making process and in its calculation of certain components of management compensation (core financial measures). The Company had previously excluded the effect of consolidating FG VIEs (FG VIE consolidation) in its calculation of its non-GAAP financial measures of operating income, non-GAAP operating shareholders’ equity and non-GAAP adjusted book value. Starting in fourth quarter 2016, based on the SEC's May 17, 2016 release of updated Compliance and Disclosure Interpretations of the rules and regulations on the use of non-GAAP financial measures, the Company will no longer adjust for FG VIE consolidation. However, wherever possible, the Company has separately disclosed the effect of FG VIE consolidation that is included in its non-GAAP financial measures. The prior-year non-GAAP financial measures have been updated to reflect the revised calculation.Company.
Management and the Board use core financial measures, which are based on non-GAAP financial measures adjusted to remove FG VIE consolidation, as well as GAAP financial measures and other factors, to evaluate the Company’s results of operations, financial condition and progress towards long-term goals. The Company removes FG VIE consolidation in its core financial measures because, although GAAP requires the Company to consolidate certain VIEs that have issued debt obligations insured by the Company, the Company does not own such VIEs and its exposure is limited to its obligation under its financial guaranty insurance contract. By disclosing non-GAAP financial measures, along with FG VIE consolidation, the Company gives investors, analysts and financial news reporters access to information that management and the Board of Directors review internally. Assured GuarantyThe Company believes its presentation of non-GAAP financial measures, and FGalong with the effect of VIE consolidation, provides information that is necessary for analysts to calculate their estimates of Assured Guaranty’s financial results in their research reports on Assured Guaranty and for investors, analysts and the financial news media to evaluate Assured Guaranty’s financial results.
ManyGAAP requires the Company to consolidate certain FG VIEs and investment vehicles. The Company does not own such FG VIEs and its exposure is limited to its obligation under the financial guaranty insurance contract, which is captured in the Insurance segment results. The economic effect of its consolidated investment vehicles is also captured in its Insurance segment results through the insurance subsidiaries' economic interest in such vehicles. Management and the Board of Directors use non-GAAP financial measures further adjusted to remove VIE consolidation (which the Company refers to as its core financial measures), as well as GAAP financial measures and other factors, to evaluate the Company’s results of operations, financial condition and progress towards long-term goals. The Company uses these core financial measures in its decision making process and in its calculation of certain components of management compensation. Wherever possible, the Company has separately disclosed the effect of VIE consolidation.
Management believes that many investors, analysts and financial news reporters use non-GAAPadjusted operating shareholders’ equity, further adjusted for FGto remove the effect of VIE consolidation, as the principal financial measure for valuing AGL’s current share price or projected share price and also as the basis of their decision to recommend, buy or sell AGL’s common shares. ManyManagement also believes that many of the Company’s fixed income investors also use this measure to evaluate the Company’s capital adequacy.
ManyManagement believes that many investors, analysts and financial news reporters also use non-GAAP adjusted book value, further adjusted for FGto remove the effect of VIE consolidation, to evaluate AGL’s share price and as the basis of their decision to recommend, buy or sell the AGL common shares. OperatingAdjusted operating income further adjusted for the effect of FG VIE consolidation enables investors and analysts to evaluate the Company’s financial results as comparedin comparison with the consensus analyst estimates distributed publicly by financial databases.
The core financial measures that are usedthe Company uses to help determine compensation are: (1) adjusted operating income, further adjusted for FGto remove the effect of VIE consolidation, (2) non-GAAPadjusted operating shareholders' equity, further adjusted for FGto remove the effect of VIE consolidation, (3) growth in non-GAAP adjusted book value per share, further adjusted for FGto remove the effect of VIE consolidation, and (4) PVP.
The following paragraphs define each non-GAAP financial measure disclosed by the Company and describe why it is useful. ATo the extent there is a directly comparable GAAP financial measure, a reconciliation of the non-GAAP financial measure and the most directly comparable GAAP financial measure is presented below.
Adjusted Operating Income
Management believes that adjusted operating income is a useful measure because it clarifies the understanding of the underwriting results and financial conditionscondition of the Company and presents the results of operations of the Company excluding the fair value adjustments on credit derivatives and CCS that are not expected to result in economic gain or loss, as well as
other adjustments described below. Management further adjusts adjusted operating income further by removing FG VIE consolidation to arrive at its core operating income measure. OperatingAdjusted operating income is defined as net income (loss) attributable to AGL, as reported under GAAP, adjusted for the following:
| |
1) | Elimination of realized gains (losses) on the Company’s investments, except for gains and losses on securities classified as trading. The timing of realized gains and losses, which depends largely on market credit cycles, can vary considerably across periods. The timing of sales is largely subject to the Company’s discretion and influenced by market opportunities, as well as the Company’s tax and capital profile.
|
| |
2) | Elimination of non-credit-impairment unrealized fair value gains (losses) on credit derivatives, which is the amount of unrealized fair value gains (losses) in excess of the present value of the expected estimated economic credit losses, and non-economic payments. Such fair value adjustments are heavily affected by, and in part fluctuate with, changes in market interest rates, the Company's credit spreads, and other market factors and are not expected to result in an economic gain or loss.
|
| |
3) | Elimination of fair value gains (losses) on the Company’s CCS. Such amounts are affected by changes in market interest rates, the Company's credit spreads, price indications on the Company's publicly traded debt, and other market factors and are not expected to result in an economic gain or loss.
|
| |
4) | Elimination of foreign exchange gains (losses) on remeasurement of net premium receivables and loss and LAE reserves. Long-dated receivables and loss and LAE reserves represent the present value of future contractual or expected cash flows. Therefore, the current period’s foreign exchange remeasurement gains (losses) are not necessarily indicative of the total foreign exchange gains (losses) that the Company will ultimately recognize.
|
| |
5) | Elimination of the tax effects related to the above adjustments, which are determined by applying the statutory tax rate in each of the jurisdictions that generate these adjustments.
|
Reconciliation of Net Income (Loss)
to Operating Income
|
| | | | | | | | | | | |
| | Year Ended December 31, |
| | 2016 | | 2015 | | 2014 |
| | (in millions) |
| Net income (loss) | $ | 881 |
| | $ | 1,056 |
| | $ | 1,088 |
|
| Less pre-tax adjustments: | | | | | |
| Realized gains (losses) on investments | (30 | ) | | (27 | ) | | (56 | ) |
| Non-credit impairment unrealized fair value gains (losses) on credit derivatives | 36 |
| | 505 |
| | 687 |
|
| Fair value gains (losses) on CCS | 0 |
| | 27 |
| | (11 | ) |
| Foreign exchange gains (losses) on remeasurement of premiums receivable and loss and LAE reserves | (33 | ) | | (15 | ) | | (21 | ) |
| Total pre-tax adjustments | (27 | ) | | 490 |
| | 599 |
|
| Less tax effect on pre-tax adjustments | 13 |
| | (144 | ) | | (158 | ) |
| Operating income | $ | 895 |
| | $ | 710 |
| | $ | 647 |
|
| | | | | | |
| Gain (loss) related to FG VIE consolidation (net of tax provision of $7, $4 and $84) included in operating income | $ | 12 |
| | $ | 11 |
| | $ | 156 |
|
Non-GAAP1)Elimination of realized gains (losses) on the Company’s investments, except for gains and losses on securities classified as trading. The timing of realized gains and losses, which depends largely on market credit cycles, can vary considerably across periods. The timing of sales is largely subject to the Company’s discretion and influenced by market opportunities, as well as the Company’s tax and capital profile.
2)Elimination of non-credit-impairment unrealized fair value gains (losses) on credit derivatives that are recognized in net income, which is the amount of unrealized fair value gains (losses) in excess of the present value of the expected estimated economic credit losses, and non-economic payments. Such fair value adjustments are heavily affected by, and in part fluctuate with, changes in market interest rates, the Company's credit spreads, and other market factors and are not expected to result in an economic gain or loss.
3)Elimination of fair value gains (losses) on the Company’s CCS that are recognized in net income. Such amounts are affected by changes in market interest rates, the Company's credit spreads, price indications on the Company's publicly traded debt, and other market factors and are not expected to result in an economic gain or loss.
4)Elimination of foreign exchange gains (losses) on remeasurement of net premium receivables and loss and LAE reserves that are recognized in net income. Long-dated receivables and loss and LAE reserves represent the present value of future contractual or expected cash flows. Therefore, the current period’s foreign exchange remeasurement gains (losses) are not necessarily indicative of the total foreign exchange gains (losses) that the Company will ultimately recognize.
5)Elimination of the tax effects related to the above adjustments, which are determined by applying the statutory tax rate in each of the jurisdictions that generate these adjustments.
Adjusted Operating Shareholders’ Equity and Non-GAAP Adjusted Book Value
Management believes that non-GAAPadjusted operating shareholders’ equity is a useful measure because it presents the equity of the Company excluding the fair value adjustments on investments, credit derivatives and CCS that are not expected to result in economic gain or loss, along with other adjustments described below. Management further adjusts non-GAAPadjusted operating shareholders’ equity further by removing FG VIE consolidation to arrive at its core operating shareholders' equity and core adjusted book value.
Non-GAAPAdjusted operating shareholders’ equity is the basis of the calculation of non-GAAP adjusted book value (see below). Non-GAAPAdjusted operating shareholders’ equity is defined as shareholders’ equity attributable to AGL, as reported under GAAP, adjusted for the following:
| |
1) | Elimination of non-credit-impairment unrealized fair value gains (losses) on credit derivatives, which is the amount of unrealized fair value gains (losses) in excess of the present value of the expected estimated economic credit losses, and non-economic payments. Such fair value adjustments are heavily affected by, and in part fluctuate with, changes in market interest rates, credit spreads and other market factors and are not expected to result in an economic gain or loss.1)Elimination of non-credit-impairment unrealized fair value gains (losses) on credit derivatives, which is the amount of unrealized fair value gains (losses) in excess of the present value of the expected estimated economic credit losses, and non-economic payments. Such fair value adjustments are heavily affected by, and in part fluctuate with, changes in market interest rates, credit spreads and other market factors and are not expected to result in an economic gain or loss. |
| |
2) | Elimination of fair value gains (losses) on the Company’s CCS. Such amounts are affected by changes in market interest rates, the Company's credit spreads, price indications on the Company's publicly traded debt, and other market factors and are not expected to result in an economic gain or loss.2)Elimination of fair value gains (losses) on the Company’s CCS. Such amounts are affected by changes in market interest rates, the Company's credit spreads, price indications on the Company's publicly traded debt, and other market factors and are not expected to result in an economic gain or loss. |
| |
3) | Elimination of unrealized gains (losses) on the Company’s investments that are recorded as a component of accumulated other comprehensive income (AOCI) (excluding foreign exchange remeasurement). The AOCI component of the fair value adjustment on the investment portfolio is not deemed economic because the Company generally holds these investments to maturity and therefore should not recognize an economic gain or loss.
|
3)Elimination of unrealized gains (losses) on the Company’s investments that are recorded as a component of accumulated other comprehensive income (AOCI) (excluding foreign exchange remeasurement). The AOCI component of the fair value adjustment on the investment portfolio is not deemed economic because the Company generally holds these investments to maturity and therefore should not recognize an economic gain or loss.
4) Elimination of the tax asset or liabilityeffects related to the above adjustments, which are determined by applying the statutory tax rate in each of the jurisdictions that generate these adjustments.
Management uses non-GAAP adjusted book value, further adjusted for FG VIE consolidation, to measure the intrinsic value of the Company, excluding franchise value. Growth in non-GAAP adjusted book value per share, further adjusted for FG VIE consolidation (core adjusted book value), is one of the key financial measures used in determining the amount of certain long-term compensation
elements to management and employees and used by rating agencies and investors. Management believes that thisadjusted book value is a useful measure because it enables an evaluation of the net present value of the Company’s in-force premiums and revenues net of expected losses. Non-GAAP adjustedAdjusted book value is non-GAAPadjusted operating shareholders’ equity, as defined above, further adjusted for the following:
| |
1) | Elimination of deferred acquisition costs, net. These amounts represent net deferred expenses that have already been paid or accrued and will be expensed in future accounting periods.1)Elimination of deferred acquisition costs, net. These amounts represent net deferred expenses that have already been paid or accrued and will be expensed in future accounting periods. |
| |
2) | Addition of the net present value of estimated net future credit derivative revenue. See below.2)Addition of the net present value of estimated net future revenue. See below. |
| |
3) | Addition of the deferred premium revenue on financial guaranty contracts in excess of expected loss to be expensed, net of reinsurance. This amount represents the expected future net earned premiums, net of expected losses to be expensed, which are not reflected in GAAP equity.
|
3)Addition of the deferred premium revenue on financial guaranty contracts in excess of expected loss to be expensed, net of reinsurance. This amount represents the expected future net earned premiums, net of expected losses to be expensed, which are not reflected in GAAP equity.
4) Elimination of the tax asset or liabilityeffects related to the above adjustments, which are determined by applying the statutory tax rate in each of the jurisdictions that generate these adjustments.
The unearned premiums and revenues included in non-GAAP adjusted book value will be earned in future periods, but actual earnings may differ materially from the estimated amounts used in determining current non-GAAP adjusted book value due to changes in foreign exchange rates, prepayment speeds, terminations, credit defaults and other factors.
Reconciliation of Shareholders’ Equity Attributable to AGL
to Non-GAAPTo Adjusted Book Value
| | | | As of December 31, 2016 | | As of December 31, 2015 | As of December 31, 2019 | | As of December 31, 2018 |
| | Total | | Per Share | | Total | | Per Share | After-Tax | | Per Share | | After-Tax | | Per Share |
| | (dollars in millions, except per share amounts) | (dollars in millions, except per share amounts) |
| Shareholders’ equity | $ | 6,504 |
| | $ | 50.82 |
| | $ | 6,063 |
| | $ | 43.96 |
| |
| Shareholders’ equity Attributable to AGL | | $ | 6,639 |
| | $ | 71.18 |
| | $ | 6,555 |
| | $ | 63.23 |
|
| Less pre-tax adjustments: | | | | | | | | | | | | | | |
| Non-credit impairment unrealized fair value gains (losses) on credit derivatives | (189 | ) | | (1.48 | ) | | (241 | ) | | (1.75 | ) | (56 | ) | | (0.60 | ) | | (45 | ) | | (0.44 | ) |
| Fair value gains (losses) on CCS | 62 |
| | 0.48 |
| | 62 |
| | 0.45 |
| 52 |
| | 0.56 |
| | 74 |
| | 0.72 |
|
| Unrealized gain (loss) on investment portfolio excluding foreign exchange effect | 316 |
| | 2.47 |
| | 373 |
| | 2.71 |
| 486 |
| | 5.21 |
| | 247 |
| | 2.39 |
|
| Less taxes | (71 | ) | | (0.54 | ) | | (56 | ) | | (0.41 | ) | (89 | ) | | (0.95 | ) | | (63 | ) | | (0.61 | ) |
| Non-GAAP operating shareholders’ equity | 6,386 |
| | 49.89 |
| | 5,925 |
| | 42.96 |
| |
| Adjusted operating shareholders’ equity | | 6,246 |
| | 66.96 |
| | 6,342 |
| | 61.17 |
|
| Pre-tax adjustments: | | | | | | | | | | | | | | |
| Less: Deferred acquisition costs | 106 |
| | 0.83 |
| | 114 |
| | 0.83 |
| 111 |
| | 1.19 |
| | 105 |
| | 1.01 |
|
| Plus: Net present value of estimated net future credit derivative revenue | 136 |
| | 1.07 |
| | 169 |
| | 1.23 |
| |
| Plus: Net present value of estimated net future revenue | | 192 |
| | 2.05 |
| | 204 |
| | 1.96 |
|
| Plus: Net unearned premium reserve on financial guaranty contracts in excess of expected loss to be expensed | 2,922 |
| | 22.83 |
| | 3,384 |
| | 24.53 |
| 3,296 |
| | 35.34 |
| | 3,005 |
| | 28.98 |
|
| Plus taxes | (832 | ) | | (6.50 | ) | | (968 | ) | | (7.02 | ) | (588 | ) | | (6.30 | ) | | (524 | ) | | (5.04 | ) |
| Non-GAAP adjusted book value | $ | 8,506 |
| | $ | 66.46 |
| | $ | 8,396 |
| | $ | 60.87 |
| |
| Adjusted book value | | $ | 9,035 |
| | $ | 96.86 |
| | $ | 8,922 |
| | $ | 86.06 |
|
| | | | | | | | | | | | | | | |
| Gain (loss) related to FG VIE consolidation included in non-GAAP operating shareholders' equity (net of tax benefit of $(4) and $(11)) | $ | (7 | ) | | $ | (0.06 | ) | | $ | (21 | ) | | $ | (0.15 | ) | |
| Gain (loss) related to VIE consolidation included in adjusted operating shareholders' equity (net of tax provision of $2 and $1) | | $ | 7 |
| | $ | 0.07 |
| | $ | 3 |
| | $ | 0.03 |
|
| | | | | | | | | | | | | | | |
| Gain (loss) related to FG VIE consolidation included in non-GAAP adjusted book value (net of tax benefit of $(12) and $(22)) | $ | (24 | ) | | $ | (0.18 | ) | | $ | (43 | ) | | $ | (0.31 | ) | |
| Gain (loss) related to VIE consolidation included in adjusted book value (net of tax benefit of $1 and $4) | | $ | (4 | ) | | $ | (0.05 | ) | | $ | (15 | ) | | $ | (0.15 | ) |
Net Present Value of Estimated Net Future Credit Derivative Revenue
Management believes that this amount is a useful measure because it enables an evaluation of the value of future estimated revenue for contracts other than financial guaranty insurance contracts (such as specialty insurance and reinsurance contracts and credit derivative revenue.derivatives). There is no corresponding GAAP financial measure. This amount represents the present value of estimated future revenue from the Company’s credit derivative in-force book of business,these contracts, net of reinsurance, ceding commissions and premium taxes, for contracts without expected economic losses, and is discounted at 6%. Estimated net future credit derivative revenue may change from period to period due to changes in foreign exchange rates, prepayment speeds, terminations, credit defaults or other factors that affect par outstanding or the ultimate maturity of an obligation.
PVP or Present Value of New Business Production
Management believes that PVP is a useful measure because it enables the evaluation of the value of new business production for the Company by taking into account the value of estimated future installment premiums on all new contracts underwritten in a reporting period as well as premium supplements and additional installment premium on existing contracts as to which the issuer has the right to call the insured obligation but has not exercised such right, whether in insurance or credit derivative contract form, which management believes GAAP gross written premiums and the net credit derivative premiums received and receivable portion of net realized gains and other settlements on credit derivatives (Credit Derivative Realized Gains (Losses)) do not adequately measure. PVP in respect of financial guaranty contracts written in a specified period is defined as gross upfront and installment premiums received and the present value of gross estimated future installment premiums, discounted, in each case, at 6%. For purposes of the PVP calculation, management discounts estimated futureUnder GAAP, financial guaranty installment premiums on insurance contracts at 6%, while under GAAP, these amounts are discounted at a risk free rate. Additionally, under GAAP, management records future installment premiums on financial guaranty insurance contracts covering non-homogeneous pools of assets
based on the contractual term of the transaction, whereas for PVP purposes, management records an estimate of the future installment premiums the Company expects to receive, which may be based upon a shorter period of time than the contractual term of the transaction. Actual future net earned or written premiums and Credit Derivative Realized Gains (Losses) may differ from PVP due to factors including, but not limited to, changes in foreign exchange rates, prepayment speeds, terminations, credit defaults, or other factors that affect par outstanding or the ultimate maturity of an obligation.
Reconciliation of GWP to PVP
|
| | | | | | | | | | | | | | | | | | | |
| | Year Ended December 31, 2016 |
| | Public Finance | | Structured Finance | | |
| | U.S. | | Non - U.S. | | U.S. | | Non - U.S. | | Total |
| | (in millions) |
| GWP | $ | 142 |
| | $ | 15 |
| | $ | (1 | ) | | $ | (2 | ) | | $ | 154 |
|
| Less: Installment GWP and other GAAP adjustments(1) | (19 | ) | | 15 |
| | (4 | ) | | (2 | ) | | (10 | ) |
| Plus: Financial guaranty installment premium PVP | 0 |
| | 25 |
| | 1 |
| | 1 |
| | 27 |
|
| Plus: PVP of non-financial guaranty insurance | — |
| | — |
| | 23 |
| | — |
| | 23 |
|
| PVP | $ | 161 |
| | $ | 25 |
| | $ | 27 |
| | $ | 1 |
| | $ | 214 |
|
|
| | | | | | | | | | | | | | | | | | | |
| | Year Ended December 31, 2019 |
| | Public Finance | | Structured Finance | | |
| | U.S. | | Non - U.S. | | U.S. | | Non - U.S. | | Total |
| | (in millions) |
| GWP | $ | 198 |
| | $ | 417 |
| | $ | 57 |
| | $ | 5 |
| | $ | 677 |
|
| Less: Installment GWP and other GAAP adjustments (1) | (3 | ) | | 417 |
| | 55 |
| | — |
| | 469 |
|
| Upfront GWP | 201 |
| | — |
| | 2 |
| | 5 |
| | 208 |
|
| Plus: Installment premium PVP | — |
| | 211 |
| | 43 |
| | 1 |
| | 255 |
|
| PVP | $ | 201 |
| | $ | 211 |
| | $ | 45 |
| | $ | 6 |
| | $ | 463 |
|
|
| | | | | | | | | | | | | | | | | | | |
| | Year Ended December 31, 2015 |
| | Public Finance | | Structured Finance | | |
| | U.S. | | Non - U.S. | | U.S. | | Non - U.S. | | Total |
| | (in millions) |
| GWP | $ | 119 |
| | $ | 41 |
| | $ | 23 |
| | $ | (2 | ) | | $ | 181 |
|
| Less: Installment GWP and other GAAP adjustments(1) | (5 | ) | | 41 |
| | 21 |
| | (2 | ) | | 55 |
|
| Plus: Financial guaranty installment premium PVP | 0 |
| | 27 |
| | 18 |
| | 1 |
| | 46 |
|
| Plus: PVP of non-financial guaranty insurance | — |
| | — |
| | 2 |
| | 5 |
| | 7 |
|
| PVP | $ | 124 |
| | $ | 27 |
| | $ | 22 |
| | $ | 6 |
| | $ | 179 |
|
|
| | | | | | | | | | | | | | | | | | | |
| | Year Ended December 31, 2018 |
| | Public Finance | | Structured Finance | | |
| | U.S. | | Non - U.S. | | U.S. | | Non - U.S. | | Total |
| | (in millions) |
| GWP | $ | 320 |
| | $ | 115 |
| | $ | 167 |
| | $ | 10 |
| | $ | 612 |
|
| Less: Installment GWP and other GAAP adjustments (1) | 34 |
| | 75 |
| | 9 |
| | 1 |
| | 119 |
|
| Upfront GWP | 286 |
| | 40 |
| | 158 |
| | 9 |
| | 493 |
|
| Plus: Installment premium PVP (2) | 105 |
| | 54 |
| | 8 |
| | 3 |
| | 170 |
|
| PVP | $ | 391 |
| | $ | 94 |
| | $ | 166 |
| | $ | 12 |
| | $ | 663 |
|
|
| | | | | | | | | | | | | | | | | | | |
| | Year Ended December 31, 2014 |
| | Public Finance | | Structured Finance | | |
| | U.S. | | Non - U.S. | | U.S. | | Non - U.S. | | Total |
| | (in millions) |
| GWP | $ | 122 |
| | $ | 6 |
| | $ | (32 | ) | | $ | 8 |
| | $ | 104 |
|
| Less: Installment GWP and other GAAP adjustments(1) | (2 | ) | | 5 |
| | (33 | ) | | 8 |
| | (22 | ) |
| Plus: Financial guaranty installment premium PVP | 4 |
| | 6 |
| | 23 |
| | 9 |
| | 42 |
|
| Plus: PVP of non-financial guaranty insurance | — |
| | — |
| | 0 |
| | — |
| | 0 |
|
| PVP | $ | 128 |
| | $ | 7 |
| | $ | 24 |
| | $ | 9 |
| | $ | 168 |
|
|
| | | | | | | | | | | | | | | | | | | |
| | Year Ended December 31, 2017 |
| | Public Finance | | Structured Finance | | |
| | U.S. | | Non - U.S. | | U.S. | | Non - U.S. | | Total |
| | (in millions) |
| GWP | $ | 190 |
| | $ | 105 |
| | $ | (1 | ) | | $ | 13 |
| | $ | 307 |
|
| Less: Installment GWP and other GAAP adjustments (1) | (3 | ) | | 103 |
| | (1 | ) | | — |
| | 99 |
|
| Upfront GWP | 193 |
| | 2 |
| | — |
| | 13 |
| | 208 |
|
| Plus: Installment premium PVP | 3 |
| | 64 |
| | 12 |
| | 2 |
| | 81 |
|
| PVP | $ | 196 |
| | $ | 66 |
| | $ | 12 |
| | $ | 15 |
| | $ | 289 |
|
_____________
| |
| (1) | Includes present value of new business on installment policies discounted at the prescribed GAAP discount rates, GWP adjustments on existing installment policies due to changes in assumptions, any cancellations of assumed reinsurance contracts, and other GAAP adjustments. |
| |
| (2) | Includes PVP of credit derivatives assumed in the SGI Transaction. |
Insured Portfolio
Financial Guaranty Exposure
The Company measures its financial guaranty exposure in terms of (a) gross and net par outstanding and (b) gross and net debt service, which includes scheduled principal and interest. The Company uses gross and net par outstanding and gross and net debt service to measure and understand the financial guaranty risk it guarantees in its Insurance segment and to understand its relative position in the fixed income markets.
The Company typically guarantees the payment of principal and interest when due. Since most of these payments are due in the future, the Company generally uses gross and net par outstanding as a proxy for its financial guaranty exposure. Gross par outstanding generally represents the principal amount of the insured obligation at a point in time. Net par outstanding equals gross par outstanding net of any third-party reinsurance. The Company includes in its par outstanding calculation the impact of any consumer price index inflator to the reporting date as well as, in the case of accreting (zero-coupon) obligations, accretion to the reporting date.
The Company purchases securities that it has insured, and for which it has expected losses to be paid, in order to mitigate the economic effect of insured losses (loss mitigation securities). The Company excludes amounts attributable to loss mitigation securities from par and debt service outstanding, which amounts are included in the investment portfolio, because the Company manages such securities as investments and not insurance exposure. As of December 31, 2019 and December 31, 2018, the Company excluded $1.4 billion and $1.9 billion, respectively, of net par attributable to loss mitigation securities. See Item 8, Financial Statements and Supplementary Data, Note 5, Outstanding Insurance Exposure, for additional information.
Gross debt service outstanding represents the sum of all estimated future principal and interest payments on the obligations insured, on an undiscounted basis. Net debt service outstanding equals gross debt service outstanding net of any third-party reinsurance. Future debt service payments include the impact of any consumer price index inflator after the reporting date, as well as, in the case of accreting (zero-coupon) obligations, accretion after the reporting date.
The Company calculates its debt service outstanding as follows:
for insured obligations that are not supported by homogeneous pools of assets (which category includes most of the Company's public finance transactions), as the total estimated contractual future principal and interest due through maturity, regardless of whether the obligations may be called and regardless of whether, in the case of obligations where principal payments are due when an underlying asset makes a principal payment, the Company believes the obligations will be repaid prior to contractual maturity;
for insured obligations that are supported by homogeneous pools of assets that are contractually permitted to prepay principal (which category includes, for example, RMBS and CLOs), as total estimated expected future principal and interest due on insured obligations through their respective expected terms, which includes the Company's expectations as to whether the obligations may be called and, in the case of obligations where principal payments are due when an underlying asset makes a principal payment, when the Company expects principal payments to be made prior to contractual maturity.
The calculation of debt service requires the use of estimates, which the Company updates periodically, including estimates for the expected remaining term of insured obligations supported by homogeneous pools of assets, updated interest rates for floating and variable rate insured obligations, behavior of consumer price indices for obligations with consumer price index inflators, foreign exchange rates and other assumptions based on the characteristics of each insured obligation. The anticipated sunset of LIBOR at the end of 2021 has introduced another variable into the Company's calculation of future debt service. See the Risk Factor captioned “The Company may be adversely impacted by the transition from LIBOR as a reference rate” under Operational Risks in Part 1, Item 1A, Risk Factors. Debt service is a measure of the estimated maximum potential exposure to insured obligations before considering the Company’s various legal rights to the underlying collateral and other remedies available to it under its financial guaranty contract.
Actual debt service may differ from estimated debt service due to refundings, terminations, negotiated restructurings, prepayments, changes in interest rates on variable rate insured obligations, consumer price index behavior differing from that projected, changes in foreign exchange rates on non-U.S. denominated insured obligations and other factors.
The following tables presenttable presents the insured financial guaranty portfolio by asset classsector, net of cessions to reinsurers. It includes all financial guaranty contracts outstanding as of the dates presented, regardless of the form written (i.e., credit derivative form or traditional financial guaranty insurance form) or the applicable accounting model (i.e., insurance, derivative or VIE consolidation). The Company excludes amounts attributable to loss mitigation securities (unless otherwise indicated) from par and principal and interest (debt service) outstanding because it manages such securities as investments, not insurance exposures. As of December 31, 2016 and December 31, 2015, the Company excluded $2.1 billion and $1.5 billion, respectively, of net par as a result of loss mitigation strategies, including loss mitigation securities held in the investment portfolio, which are primarily BIG.
Financial Guaranty
Net Par Outstanding and Average Internal Rating by Sector
| | | | | As of December 31, 2016 | | As of December 31, 2015 | | As of December 31, 2019 | | As of December 31, 2018 |
| Sector | | Net Par Outstanding | | Avg. Rating | | Net Par Outstanding | | Avg. Rating | | Net Par Outstanding | | Avg. Rating | | Net Par Outstanding | | Avg. Rating |
| | | (dollars in millions) | | (dollars in millions) |
| Public finance: | | | | |
| | | | | | |
| | |
| U.S.: | | | | |
| | | | | | |
| | |
| General obligation | | $ | 107,717 |
| | A | | $ | 126,255 |
| | A | | $ | 73,467 |
| | A- | | $ | 78,800 |
| | A- |
| Tax backed | | 49,931 |
| | A- | | 58,062 |
| | A | | 37,047 |
| | A- | | 40,616 |
| | A- |
| Municipal utilities | | 37,603 |
| | A | | 45,936 |
| | A | | 26,195 |
| | A- | | 28,402 |
| | A- |
| Transportation | | 19,403 |
| | A- | | 23,454 |
| | A | | 16,209 |
| | BBB+ | | 15,197 |
| | A- |
| Healthcare | | 11,238 |
| | A | | 15,006 |
| | A | | 7,148 |
| | A- | | 6,750 |
| | A- |
| Higher education | | 10,085 |
| | A | | 11,936 |
| | A | | 5,916 |
| | A- | | 6,643 |
| | A- |
| Infrastructure finance | | 3,769 |
| | BBB+ | | 4,993 |
| | BBB | | 5,429 |
| | A- | | 5,489 |
| | A- |
| Housing | | 1,559 |
| | A- | | 2,037 |
| | A | |
| Housing revenue | | | 1,321 |
| | BBB+ | | 1,435 |
| | BBB+ |
| Investor-owned utilities | | 697 |
| | BBB+ | | 916 |
| | A- | | 655 |
| | A- | | 846 |
| | A- |
| Renewable energy | | | 210 |
| | A- | | 215 |
| | BBB+ |
| Other public finance—U.S. | | 2,796 |
| | A | | 3,271 |
| | A | | 1,890 |
| | A- | | 2,169 |
| | A- |
| Total public finance—U.S. | | 244,798 |
| | A | | 291,866 |
| | A | | 175,487 |
| | A- | | 186,562 |
| | A- |
| Non-U.S.: | | | | |
| | | | | | |
| | |
| Regulated utilities | | | 18,995 |
| | BBB+ | | 18,124 |
| | BBB+ |
| Infrastructure finance | | 10,731 |
| | BBB | | 12,728 |
| | BBB | | 17,952 |
| | BBB | | 17,166 |
| | BBB |
| Regulated utilities | | 9,263 |
| | BBB+ | | 10,048 |
| | BBB+ | |
| Sovereign and sub-sovereign | | | 11,341 |
| | A+ | | 6,094 |
| | A |
| Renewable energy | | | 1,555 |
| | A | | 1,346 |
| | A |
| Pooled infrastructure | | 1,513 |
| | AAA | | 1,879 |
| | AA | | 1,416 |
| | AAA | | 1,373 |
| | AAA |
| Other public finance | | 4,874 |
| | A | | 4,922 |
| | A | |
| Total public finance—non-U.S. | | 26,381 |
| | BBB+ | | 29,577 |
| | BBB+ | | 51,259 |
| | A- | | 44,103 |
| | BBB+ |
| Total public finance | | 271,179 |
| | A- | | 321,443 |
| | A | | 226,746 |
| | A- | | 230,665 |
| | A- |
| Structured finance: | | | | |
| | | | | | |
| | |
| U.S.: | | | | |
| | | | | | |
| | |
| RMBS | | | 3,546 |
| | BBB- | | 4,270 |
| | BBB- |
| Life insurance transactions | | | 1,776 |
| | AA- | | 1,435 |
| | A+ |
| Pooled corporate obligations | | 10,050 |
| | AAA | | 16,008 |
| | AAA | | 1,401 |
| | AA- | | 1,215 |
| | AA- |
| RMBS | | 5,637 |
| | BBB- | | 7,067 |
| | BBB- | |
| Insurance securitizations | | 2,308 |
| | A+ | | 3,000 |
| | A+ | |
| Financial products | | | 1,019 |
| | AA- | | 1,094 |
| | AA- |
| Consumer receivables | | 1,652 |
| | BBB+ | | 2,099 |
| | A- | | 962 |
| | A- | | 1,255 |
| | A- |
| Financial products | | 1,540 |
| | AA- | | 1,906 |
| | AA- | |
| Commercial receivables | | 230 |
| | BBB- | | 427 |
| | BBB+ | |
| CMBS and other commercial real estate related exposures | | 43 |
| | A | | 533 |
| | AAA | |
| Other structured finance—U.S. | | 597 |
| | AA- | | 730 |
| | AA- | | 596 |
| | BBB+ | | 675 |
| | A- |
| Total structured finance—U.S. | | 22,057 |
| | A+ | | 31,770 |
| | AA- | | 9,300 |
| | A- | | 9,944 |
| | A- |
| Non-U.S.: | | | | |
| | | | | | |
| | |
| RMBS | | | 427 |
| | A | | 576 |
| | A- |
| Pooled corporate obligations | | 1,535 |
| | AA | | 3,645 |
| | AA | | 55 |
| | BB+ | | 126 |
| | A |
| RMBS | | 604 |
| | A- | | 492 |
| | BBB | |
| Commercial receivables | | 356 |
| | BBB+ | | 600 |
| | BBB+ | |
| Other structured finance | | 587 |
| | AA | | 621 |
| | AA- | | 279 |
| | A+ | | 491 |
| | A |
| Total structured finance—non-U.S. | | 3,082 |
| | AA- | | 5,358 |
| | AA- | | 761 |
| | A | | 1,193 |
| | A |
| Total structured finance | | 25,139 |
| | AA- | | 37,128 |
| | AA- | | 10,061 |
| | A- | | 11,137 |
| | A- |
| Total net par outstanding | | $ | 296,318 |
| | A | | $ | 358,571 |
| | A | | $ | 236,807 |
| | A- | | $ | 241,802 |
| | A- |
The following tables settable sets forth the Company’s net financial guaranty portfolio by internal rating.
Financial Guaranty Portfolio by Internal Rating (1)
As of December 31, 2016
| | | | | Public Finance
U.S. | | Public Finance Non-U.S. | | Structured Finance U.S | | Structured Finance Non-U.S | | Total | | As of December 31, 2019 | | As of December 31, 2018 |
Rating
Category | | Net Par
Outstanding | | % | | Net Par Outstanding | | % | | Net Par Outstanding | | % | | Net Par Outstanding | | % | | Net Par Outstanding | | % | | Net Par Outstanding | | % | | Net Par Outstanding | | % |
| | | (dollars in millions) | | (dollars in millions) |
| AAA | | $ | 2,066 |
| | 0.8 | % | | $ | 2,221 |
| | 8.4 | % | | $ | 9,757 |
| | 44.2 | % | | $ | 1,447 |
| | 47.0 | % | | $ | 15,491 |
| | 5.2 | % | | $ | 4,361 |
| | 1.8 | % | | $ | 4,618 |
| | 1.9 | % |
| AA | | 46,420 |
| | 19.0 |
| | 170 |
| | 0.6 |
| | 5,773 |
| | 26.2 |
| | 127 |
| | 4.1 |
| | 52,490 |
| | 17.7 |
| | 29,037 |
| | 12.3 |
| | 27,021 |
| | 11.2 |
|
| A | | 133,829 |
| | 54.7 |
| | 6,270 |
| | 23.8 |
| | 1,589 |
| | 7.2 |
| | 456 |
| | 14.8 |
| | 142,144 |
| | 48.0 |
| | 111,329 |
| | 47.0 |
| | 119,415 |
| | 49.4 |
|
| BBB | | 55,103 |
| | 22.5 |
| | 16,378 |
| | 62.1 |
| | 879 |
| | 4.0 |
| | 759 |
| | 24.6 |
| | 73,119 |
| | 24.7 |
| | 83,574 |
| | 35.3 |
| | 80,588 |
| | 33.3 |
|
| BIG | | 7,380 |
| | 3.0 |
| | 1,342 |
| | 5.1 |
| | 4,059 |
| | 18.4 |
| | 293 |
| | 9.5 |
| | 13,074 |
| | 4.4 |
| | 8,506 |
| | 3.6 |
| | 10,160 |
| | 4.2 |
|
| Total net par outstanding | | $ | 244,798 |
| | 100.0 | % | | $ | 26,381 |
| | 100.0 | % | | $ | 22,057 |
| | 100.0 | % | | $ | 3,082 |
| | 100.0 | % | | $ | 296,318 |
| | 100.0 | % | | $ | 236,807 |
| | 100.0 | % | | $ | 241,802 |
| | 100.0 | % |
_____________________
| |
(1) | The December 31, 2016 amounts include $2.9 billion of net par from the CIFG Acquisition. |
Financial Guaranty Portfolio by Internal Rating (1)
As of December 31, 2015
|
| | | | | | | | | | | | | | | | | | | | | | | | | | | | | | | | | | | |
| | | Public Finance U.S. | | Public Finance Non-U.S. | | Structured Finance U.S | | Structured Finance Non-U.S | | Total |
Rating Category | | Net Par Outstanding | | % | | Net Par Outstanding | | % | | Net Par Outstanding | | % | | Net Par Outstanding | | % | | Net Par Outstanding | | % |
| | | (dollars in millions) |
| AAA | | $ | 3,053 |
| | 1.1 | % | | $ | 709 |
| | 2.4 | % | | $ | 14,366 |
| | 45.2 | % | | $ | 2,709 |
| | 50.6 | % | | $ | 20,837 |
| | 5.8 | % |
| AA | | 69,274 |
| | 23.7 |
| | 2,017 |
| | 6.8 |
| | 7,934 |
| | 25.0 |
| | 177 |
| | 3.3 |
| | 79,402 |
| | 22.1 |
|
| A | | 157,440 |
| | 53.9 |
| | 6,765 |
| | 22.9 |
| | 2,486 |
| | 7.8 |
| | 555 |
| | 10.3 |
| | 167,246 |
| | 46.7 |
|
| BBB | | 54,315 |
| | 18.6 |
| | 18,708 |
| | 63.2 |
| | 1,515 |
| | 4.8 |
| | 1,365 |
| | 25.5 |
| | 75,903 |
| | 21.2 |
|
| BIG | | 7,784 |
| | 2.7 |
| | 1,378 |
| | 4.7 |
| | 5,469 |
| | 17.2 |
| | 552 |
| | 10.3 |
| | 15,183 |
| | 4.2 |
|
| Total net par outstanding | | $ | 291,866 |
| | 100.0 | % | | $ | 29,577 |
| | 100.0 | % | | $ | 31,770 |
| | 100.0 | % | | $ | 5,358 |
| | 100.0 | % | | $ | 358,571 |
| | 100.0 | % |
_____________________
| |
(1) | The December 31, 2015 amounts include $10.9 billion of net par from the Radian Asset Acquisition. |
The tables below show the Company's ten largest U.S. public finance, U.S. structured finance and non-U.S. exposures by revenue source, excluding related authorities and public corporations, as of December 31, 2016:2019:
Ten Largest U.S. Public Finance Exposures
by Revenue Source
As of December 31, 20162019
| | | | Net Par Outstanding | | Percent of Total U.S. Public Finance Net Par Outstanding | | Rating | Net Par Outstanding | | Percent of Total U.S. Public Finance Net Par Outstanding | | Rating |
| | (dollars in millions) | (dollars in millions) |
| New Jersey (State of) | $ | 4,468 |
| | 1.8 | % | | BBB+ | $ | 4,224 |
| | 2.4 | % | | BBB |
| Pennsylvania (Commonwealth of) | | 1,978 |
| | 1.1 |
| | A- |
| Illinois (State of) | 2,269 |
| | 0.9 |
| | BBB+ | 1,803 |
| | 1.1 |
| | BBB |
| New York Metropolitan Transportation Authority | | 1,630 |
| | 0.9 |
| | A- |
| Puerto Rico, General Obligation, Appropriations and Guarantees of the Commonwealth | | 1,409 |
| | 0.8 |
| | CCC |
| Puerto Rico Highways & Transportation Authority | | 1,265 |
| | 0.7 |
| | CCC |
| Chicago (City of) Illinois | | 1,158 |
| | 0.7 |
| | BBB |
| North Texas Tollway Authority | | 1,120 |
| | 0.6 |
| | A |
| California (State of) | 1,849 |
| | 0.8 |
| | A | 1,082 |
| | 0.6 |
| | AA- |
| New York (City of) New York | 1,804 |
| | 0.7 |
| | A+ | |
| Pennsylvania (Commonwealth of) | 1,771 |
| | 0.7 |
| | A- | |
| Chicago (City of) Illinois | 1,699 |
| | 0.7 |
| | BBB+ | |
| New York (State of) | 1,670 |
| | 0.7 |
| | A+ | |
| Puerto Rico, General Obligation, Appropriations and Guarantees of the Commonwealth | 1,663 |
| | 0.7 |
| | CCC- | |
| Massachusetts (Commonwealth of) | 1,627 |
| | 0.7 |
| | AA | |
| Port Authority of New York & New Jersey | 1,337 |
| | 0.5 |
| | BBB+ | |
| Wisconsin (State of) | | 1,053 |
| | 0.6 |
| | A+ |
| Total of top ten U.S. public finance exposures | $ | 20,157 |
| | 8.2 | % | | $ | 16,722 |
| | 9.5 | % | |
Ten Largest U.S. Structured Finance Exposures
As of December 31, 20162019
|
| | | | | | | | |
| | Net Par Outstanding | | Percent of Total U.S. Structured Finance Net Par Outstanding | | Rating |
| | (dollars in millions) |
| Private US Insurance Securitization | $ | 800 |
| | 3.6 | % | | AA |
| Synthetic Investment Grade Pooled Corporate CDO | 766 |
| | 3.5 |
| | AAA |
| Synthetic Investment Grade Pooled Corporate CDO | 744 |
| | 3.4 |
| | AAA |
| Synthetic Investment Grade Pooled Corporate CDO | 655 |
| | 3.0 |
| | AAA |
| Synthetic Investment Grade Pooled Corporate CDO | 563 |
| | 2.6 |
| | AAA |
| Synthetic Investment Grade Pooled Corporate CDO | 516 |
| | 2.3 |
| | AAA |
| Private US Insurance Securitization | 500 |
| | 2.3 |
| | AA |
| Synthetic Investment Grade Pooled Corporate CDO | 450 |
| | 2.0 |
| | AAA |
| SLM Private Credit Student Trust 2007-A | 450 |
| | 2.0 |
| | A- |
| Synthetic Investment Grade Pooled Corporate CDO | 440 |
| | 2.0 |
| | AAA |
| Total of top ten U.S. structured finance exposures | $ | 5,884 |
| | 26.7 | % | | |
|
| | | | | | | | |
| | Net Par Outstanding | | Percent of Total U.S. Structured Finance Net Par Outstanding | | Rating |
| | (dollars in millions) |
| Private US Insurance Securitization | $ | 530 |
| | 5.7 | % | | AA |
| Private US Insurance Securitization | 500 |
| | 5.4 |
| | AA- |
| SLM Private Credit Student Trust 2007-A | 417 |
| | 4.4 |
| | A+ |
| Private US Insurance Securitization | 340 |
| | 3.7 |
| | AA- |
| Fortress Credit Opportunities VII CLO Limited | 257 |
| | 2.8 |
| | AA- |
| Private US Insurance Securitization | 213 |
| | 2.3 |
| | AA- |
| ABPCI Direct Lending Fund CLO I Ltd | 208 |
| | 2.2 |
| | A |
| SLM Private Credit Student Loan Trust 2006-C | 194 |
| | 2.1 |
| | AA- |
| Option One 2007-FXD2 | 177 |
| | 1.9 |
| | CCC |
| Brightwood Fund III Static 2018-1, LLC | 159 |
| | 1.7 |
| | AA |
| Total of top ten U.S. structured finance exposures | $ | 2,995 |
| | 32.2 | % | | |
Ten Largest Non-U.S. Exposures
As of December 31, 20162019
| | | | Country | | Net Par Outstanding | | Percent of Total Non-U.S. Net Par Outstanding | | Rating | Country | | Net Par Outstanding | | Percent of Total Non-U.S. Net Par Outstanding | | Rating |
| | | (dollars in millions) | | (dollars in millions) |
| Southern Water Services Limited | | United Kingdom | | $ | 2,760 |
| | 5.3 | % | | A- |
| Thames Water Utility Finance Plc | | United Kingdom | | 2,068 |
| | 4.0 |
| | A- |
| Hydro-Quebec, Province of Quebec | Canada | | $ | 1,985 |
| | 6.7 | % | | A+ | Canada | | 2,013 |
| | 3.9 |
| | A+ |
| Thames Water Utility Finance PLC | United Kingdom | | 1,146 |
| | 3.9 |
| | A- | |
| Southern Gas Networks PLC | | United Kingdom | | 1,739 |
| | 3.3 |
| | BBB |
| Societe des Autoroutes du Nord et de l'Est de France S.A. | France | | 926 |
| | 3.1 |
| | BBB+ | France | | 1,689 |
| | 3.2 |
| | BBB+ |
| Welsh Water PLC | | United Kingdom | | 1,652 |
| | 3.2 |
| | A- |
| Anglian Water Services Financing | | United Kingdom | | 1,502 |
| | 2.9 |
| | A- |
| National Grid Gas PLC | | United Kingdom | | 1,314 |
| | 2.5 |
| | BBB+ |
| British Broadcasting Corporation (BBC) | | United Kingdom | | 1,305 |
| | 2.5 |
| | A+ |
| Channel Link Enterprises Finance PLC | France, United Kingdom | | 768 |
| | 2.6 |
| | BBB | France, United Kingdom | | 1,234 |
| | 2.4 |
| | BBB |
| Verbund - Lease and Sublease of Hydro-Electric Equipment | Austria | | 677 |
| | 2.3 |
| | AAA | |
| Capital Hospitals (Barts) | United Kingdom | | 671 |
| | 2.3 |
| | BBB- | |
| Sydney Airport Finance Company | Australia | | 631 |
| | 2.1 |
| | BBB | |
| Southern Water Services Limited | United Kingdom | | 615 |
| | 2.1 |
| | A- | |
| InspirED Education (South Lanarkshire) PLC | United Kingdom | | 608 |
| | 2.1 |
| | BBB- | |
| Southern Gas Networks PLC | United Kingdom | | 556 |
| | 1.9 |
| | BBB | |
| Total of top ten non-U.S. exposures | | $ | 8,583 |
| | 29.1 | % | | | $ | 17,276 |
| | 33.2 | % | |
Financial Guaranty Portfolio by Geographic Area
The following table sets forth the geographic distribution of the Company's financial guaranty portfolio.
Geographic Distribution
of Financial Guaranty Portfolio
As of December 31, 20162019
| | | | Number of Risks | | Net Par Outstanding | | Percent of Total Net Par Outstanding | Number of Risks | | Net Par Outstanding | | Percent of Total Net Par Outstanding |
| | (dollars in millions) | (dollars in millions) |
| U.S.: | | | | | | | | | | |
| California | 1,459 |
| | $ | 42,404 |
| | 14.3 | % | 1,318 |
| | $ | 33,368 |
| | 14.1 | % |
| Pennsylvania | | 665 |
| | 15,895 |
| | 6.7 |
|
| Texas | 1,271 |
| | 20,599 |
| | 7.0 |
| 1,090 |
| | 14,860 |
| | 6.3 |
|
| Pennsylvania | 852 |
| | 20,232 |
| | 6.8 |
| |
| New York | 935 |
| | 19,637 |
| | 6.6 |
| 749 |
| | 14,682 |
| | 6.2 |
|
| Illinois | 776 |
| | 17,967 |
| | 6.1 |
| 602 |
| | 13,977 |
| | 5.9 |
|
| New Jersey | | 337 |
| | 10,504 |
| | 4.4 |
|
| Florida | 324 |
| | 12,643 |
| | 4.3 |
| 266 |
| | 7,107 |
| | 3.0 |
|
| New Jersey | 495 |
| | 12,560 |
| | 4.2 |
| |
| Michigan | 506 |
| | 7,985 |
| | 2.7 |
| 305 |
| | 5,345 |
| | 2.3 |
|
| Georgia | 172 |
| | 6,372 |
| | 2.2 |
| |
| Ohio | 409 |
| | 5,554 |
| | 1.9 |
| |
| Other states and U.S. territories | 3,475 |
| | 78,845 |
| | 26.6 |
| |
| Puerto Rico | | 17 |
| | 4,270 |
| | 1.8 |
|
| Louisiana | | 162 |
| | 4,167 |
| | 1.8 |
|
| Other | | 2,529 |
| | 51,312 |
| | 21.7 |
|
| Total U.S. public finance | 10,674 |
| | 244,798 |
| | 82.7 |
| 8,040 |
| | 175,487 |
| | 74.2 |
|
| U.S. Structured finance (multiple states) | 610 |
| | 22,057 |
| | 7.4 |
| 450 |
| | 9,300 |
| | 3.9 |
|
| Total U.S. | 11,284 |
| | 266,855 |
| | 90.1 |
| 8,490 |
| | 184,787 |
| | 78.1 |
|
| Non-U.S.: | | | | | | | | | | |
| United Kingdom | 112 |
| | 15,940 |
| | 5.4 |
| 288 |
| | 38,450 |
| | 16.2 |
|
| France | | 7 |
| | 3,130 |
| | 1.3 |
|
| Canada | | 8 |
| | 2,495 |
| | 1.1 |
|
| Australia | 18 |
| | 3,036 |
| | 1.0 |
| 11 |
| | 2,112 |
| | 0.9 |
|
| Canada | 9 |
| | 2,730 |
| | 0.9 |
| |
| France | 14 |
| | 1,809 |
| | 0.6 |
| |
| Italy | 9 |
| | 1,311 |
| | 0.4 |
| |
| Austria | | 3 |
| | 1,250 |
| | 0.5 |
|
| Other | 53 |
| | 4,637 |
| | 1.6 |
| 42 |
| | 4,583 |
| | 1.9 |
|
| Total non-U.S. | 215 |
| | 29,463 |
| | 9.9 |
| 359 |
| | 52,020 |
| | 21.9 |
|
| Total | 11,499 |
| | $ | 296,318 |
| | 100.0 | % | 8,849 |
| | $ | 236,807 |
| | 100.0 | % |
Financial Guaranty Portfolio by Issue Size
The Company seeks broad coverage of the market by insuring and reinsuring small and large issues alike. The following table setstables set forth the distribution of the Company's portfolio by original size of the Company's exposure.
Public Finance Portfolio by Issue Size
As of December 31, 20162019
| | | Original Par Amount Per Issue | | Number of Issues | | Net Par Outstanding | | % of Public Finance Net Par Outstanding | | Number of Issues | | Net Par Outstanding | | % of Public Finance Net Par Outstanding |
| | | (dollars in millions) | | (dollars in millions) |
| Less than $10 million | Less than $10 million | 15,018 | | $ | 40,484 |
| | 14.9 | % | Less than $10 million | 12,838 | | $ | 33,384 |
| | 14.7 | % |
| $10 through $50 million | $10 through $50 million | 5,198 | | 86,376 |
| | 31.9 |
| $10 through $50 million | 3,844 | | 62,416 |
| | 27.6 |
|
| $50 through $100 million | $50 through $100 million | 937 | | 48,058 |
| | 17.7 |
| $50 through $100 million | 640 | | 34,257 |
| | 15.1 |
|
| $100 million to $200 million | $100 million to $200 million | 430 | | 42,938 |
| | 15.8 |
| $100 million to $200 million | 342 | | 35,469 |
| | 15.6 |
|
| $200 million or greater | $200 million or greater | 238 | | 53,323 |
| | 19.7 |
| $200 million or greater | 227 | | 61,220 |
| | 27.0 |
|
| Total | Total | 21,821 | | $ | 271,179 |
| | 100.0 | % | Total | 17,891 | | $ | 226,746 |
| | 100.0 | % |
Structured Finance Portfolio by Issue Size
As of December 31, 20162019
| | | Original Par Amount Per Issue | | Number of Issues | | Net Par Outstanding | | % of Structured Finance Net Par Outstanding | | Number of Issues | | Net Par Outstanding | | % of Structured Finance Net Par Outstanding |
| | | (dollars in millions) | | (dollars in millions) |
| Less than $10 million | Less than $10 million | 186 | | $ | 94 |
| | 0.4 | % | Less than $10 million | 135 | | $ | 108 |
| | 1.1 | % |
| $10 through $50 million | $10 through $50 million | 241 | | 1,765 |
| | 7.0 |
| $10 through $50 million | 163 | | 1,057 |
| | 10.4 |
|
| $50 through $100 million | $50 through $100 million | 85 | | 2,469 |
| | 9.8 |
| $50 through $100 million | 57 | | 1,117 |
| | 11.1 |
|
| $100 million to $200 million | $100 million to $200 million | 127 | | 4,805 |
| | 19.1 |
| $100 million to $200 million | 76 | | 2,229 |
| | 22.2 |
|
| $200 million or greater | $200 million or greater | 139 | | 16,006 |
| | 63.7 |
| $200 million or greater | 95 | | 5,550 |
| | 55.2 |
|
| Total | Total | 778 | | $ | 25,139 |
| | 100.0 | % | Total | 526 | | $ | 10,061 |
| | 100.0 | % |
Exposures by Reinsurer
Ceded par outstanding represents the portion of insured risk ceded to external reinsurers. Under these relationships, the Company cedes a portion of its insured risk in exchange for a premium paid to the reinsurer. The Company remains primarily liable for all risks it directly underwrites and is required to pay all gross claims. It then seeks reimbursement from the reinsurer for its proportionate share of claims. The Company may be exposed to risk for this exposure if it were required to pay the gross claims and not be able to collect ceded claims from an assuming company experiencing financial distress. A number of the financial guaranty insurers to which the Company has ceded par have experienced financial distress and as a result have been downgraded by the rating agencies. In addition, state insurance regulators have intervened with respect to some of these insurers.
In accordance with U.S. statutory accounting requirements and U.S. insurance laws and regulations, in order for the Company to receive credit for liabilities ceded to reinsurers domiciled outside of the U.S., such reinsurers must secure their liabilities to the Company. All of the unauthorized reinsurers in the table below are required to post collateral for the benefit of the Company in an amount at least equal to the sum of their ceded unearned premium reserve, loss reserves and contingency reserves, all calculated on a statutory basis of accounting. In addition, certain authorized reinsurers in the table below post collateral on terms negotiated with the Company. Collateral may be in the form of letters of credit or trust accounts. The total collateral posted by all non-affiliated reinsurers as of December 31, 2016 was approximately $387 million.
Assumed par outstanding represents the amount of par assumed by the Company from third party insurers and reinsurers, including other monoline financial guaranty companies. Under these relationships, the Company assumes a portion
of the ceding company’s insured risk in exchange for a premium. The Company may be exposed to risk in this portfolio in that the Company may be required to pay losses without a corresponding premium in circumstances where the ceding company is experiencing financial distress and is unable to pay premiums.
In addition to assumed and ceded reinsurance arrangements, the Company may also have exposure to financial guaranty insurers in "second-to-pay" transactions, where the Company provides insurance on an obligation that is already insured by another financial guarantor. In that case, if the underlying obligor and the financial guarantor both fail to pay an amount scheduled to be paid, the Company would be obligated to pay. The Company underwrites these transactions based on the underlying obligation, without regard to the financial guarantor. See Part II, Item 8, Financial Statements and Supplementary Data, Note 13, Reinsurance and Other Monoline Exposures.
Monoline and Reinsurer Exposure
by Company
|
| | | | | | | | | | | | |
| | | Par Outstanding |
| | | As of December 31, 2016 |
| Reinsurer | | Ceded Par
Outstanding (1) | | Second-to-
Pay Insured
Par
Outstanding (2) | | Assumed Par
Outstanding |
| | | (in millions) |
| Reinsurers rated investment grade: | | | | | | |
| Tokio Marine & Nichido Fire Insurance Co., Ltd. (3) (4) | | $ | 3,436 |
| | $ | — |
| | $ | — |
|
| Mitsui Sumitomo Insurance Co. Ltd. (3) (4) | | 1,273 |
| | — |
| | — |
|
| National | | — |
| | 4,420 |
| | 4,364 |
|
| Subtotal | | 4,709 |
| | 4,420 |
| | 4,364 |
|
| Reinsurers rated BIG, with rating withdrawn or not rated: | | | | | | |
| American Overseas Reinsurance Company Limited (3) | | 3,573 |
| | — |
| | 30 |
|
| Syncora Guarantee Inc. (3) | | 2,062 |
| | 1,098 |
| | 655 |
|
| ACA Financial Guaranty Corp. | | 637 |
| | 20 |
| | — |
|
| Ambac Assurance Corporation | | 115 |
| | 2,862 |
| | 6,695 |
|
| MBIA | | — |
| | 1,024 |
| | 165 |
|
| MBIA UK (5) | | — |
| | 319 |
| | 211 |
|
| FGIC (6) | | — |
| | 1,194 |
| | 410 |
|
| Ambac Assurance Corp. Segregated Account | | — |
| | 73 |
| | 614 |
|
| Other (3) | | 60 |
| | 529 |
| | 120 |
|
| Subtotal | | 6,447 |
| | 7,119 |
| | 8,900 |
|
| Total | | $ | 11,156 |
| | $ | 11,539 |
| | $ | 13,264 |
|
____________________
| |
(1) | Of the total ceded par to reinsurers rated BIG, had rating withdrawn or not rated, $384 million is rated BIG. |
| |
(2) | The par on second-to-pay exposure where the primary insurer and underlying transaction rating are both BIG is $788 million. |
| |
(3) | The total collateral posted by all non-affiliated reinsurers required or had agreed to post collateral as of December 31, 2016 was approximately $387 million. |
(4) The Company benefits from trust arrangements that satisfy the triple-A credit requirement of S&P and/or Moody’s.
| |
(5) | See Part II, Item 8, Financial Statements and Supplementary Data, Note 2, Acquisitions, for more information on MBIA UK. |
| |
(6) | FGIC includes subsidiaries Financial Guaranty Insurance Company and FGIC UK Limited. |
Exposure to Puerto Rico
The Company hashad insured exposure to general obligation bonds of the Commonwealth of Puerto Rico (Puerto Rico or the Commonwealth) and various obligations of its related authorities and public corporations aggregating $4.8$4.3 billion net par as of December 31, 2016,2019, all of which arewas rated BIG. Puerto Rico has experienced significant general fund budget deficits in recent years and a challenging economic environment. Beginning on January 1, 2016, a number of Puerto Rico creditsexposures have defaulted on bond payments, and the Company has now paid claims on severalall of its Puerto Rico credits as shown in the table "Puertoexposures except for Puerto Rico Net Par Outstanding" below. Aqueduct and Sewer Authority (PRASA), Municipal Finance Agency (MFA) and University of Puerto Rico (U of PR).
The Company groups its Puerto Rico exposure into three categories:
Constitutionally Guaranteed.
Public Corporations – Certain Revenues Potentially Subject to Clawback.
Other Public Corporations.
Additional information about recent developments in Puerto Rico and the individual creditsexposures insured by the Company may be found in Part II, Item 8, Financial Statements and Supplementary Data, Note 4,5, Outstanding Insurance Exposure.
The Company groups its Puerto Rico exposure into three categories:
Constitutionally Guaranteed. The Company includes in this category public debt benefiting from Article VI of the Constitution of the Commonwealth, which expressly provides that interest and principal payments on the public debt are to be paid before other disbursements are made.
Public Corporations – Certain Revenues Potentially Subject to Clawback. The Company includes in this category the debt of public corporations for which applicable law permits the Commonwealth to claw back, subject to certain conditions and for the payment of public debt, at least a portion of the revenues supporting the bonds the Company insures. As a Constitutional condition to clawback, available Commonwealth revenues for any fiscal year must be insufficient to pay Commonwealth debt service before the payment of any appropriations for that year. The Company believes that this condition has not been satisfied to date, and accordingly that the Commonwealth has not to date been entitled to clawback revenues supporting debt insured by the Company. As described in Part II, Item 8, Financial Statements and Supplementary Data, Note 4, Outstanding Exposure, the Company sued various Puerto Rico governmental officials in the United States District Court, District of Puerto Rico asserting that Puerto Rico's recent attempt to claw back pledged taxes is unconstitutional, and demanding declaratory and injunctive relief.
Other Public Corporations. The Company includes in this category the debt of public corporations that are supported by revenues it does not believe are subject to clawback.
Net Exposure to Puerto Rico
As of December 31, 20162019
|
| | | | | | | | | | | | | | | | | | | | | | | | |
| | | Net Par Outstanding | | |
| | | AGM | | AGC | | AG Re | | Eliminations (1) | | Total Net Par Outstanding | | Gross Par Outstanding |
| | | (in millions) |
| Commonwealth Constitutionally Guaranteed | | | | | | | | | | | | |
| Commonwealth of Puerto Rico - General Obligation Bonds (2) | | $ | 611 |
| | $ | 268 |
| | $ | 375 |
| | $ | (1 | ) | | $ | 1,253 |
| | $ | 1,294 |
|
| Puerto Rico Public Buildings Authority (PBA) (2) | | 7 |
| | 139 |
| | 1 |
| | (7 | ) | | 140 |
| | 145 |
|
| Public Corporations - Certain Revenues Potentially Subject to Clawback | | | | | | | | | | | | |
| Puerto Rico Highways and Transportation Authority (PRHTA) (Transportation revenue) (2) | | 223 |
| | 481 |
| | 186 |
| | (79 | ) | | 811 |
| | 842 |
|
| PRHTA (Highway revenue) (2) | | 345 |
| | 74 |
| | 35 |
| | — |
| | 454 |
| | 515 |
|
| Puerto Rico Convention Center District Authority (PRCCDA) | | — |
| | 152 |
| | — |
| | — |
| | 152 |
| | 152 |
|
| Puerto Rico Infrastructure Financing Authority (PRIFA) | | — |
| | 15 |
| | 1 |
| | — |
| | 16 |
| | 16 |
|
| Other Public Corporations | | | | | | | | | | | | |
| PREPA (2) | | 525 |
| | 71 |
| | 226 |
| | — |
| | 822 |
| | 838 |
|
| PRASA | | — |
| | 284 |
| | 89 |
| | — |
| | 373 |
| | 373 |
|
| MFA | | 153 |
| | 33 |
| | 62 |
| | — |
| | 248 |
| | 282 |
|
| U of PR | | — |
| | 1 |
| | — |
| | — |
| | 1 |
| | 1 |
|
| Total exposure to Puerto Rico | | $ | 1,864 |
| | $ | 1,518 |
| | $ | 975 |
| | $ | (87 | ) | | $ | 4,270 |
| | $ | 4,458 |
|
|
| | | | | | | | | | | | | | | | | | | | | | | | |
| | | Net Par Outstanding | | |
| | | AGM | | AGC | | AG Re | | Eliminations (1) | | Total Net Par Outstanding (2) | | Gross Par Outstanding |
| | | (in millions) |
| Commonwealth Constitutionally Guaranteed | | | | | | | | | | | | |
| Commonwealth of Puerto Rico - General Obligation Bonds (3) | | $ | 680 |
| | $ | 378 |
| | $ | 421 |
| | $ | (3 | ) | | $ | 1,476 |
| | $ | 1,577 |
|
| Puerto Rico Public Buildings Authority (PBA) (3) | | 11 |
| | 169 |
| | 0 |
| | (11 | ) | | 169 |
| | 174 |
|
| Public Corporations - Certain Revenues Potentially Subject to Clawback | | | | | | | | | |
|
| | |
| Puerto Rico Highways and Transportation Authority (PRHTA) (Transportation revenue) (3) (4) | | 273 |
| | 519 |
| | 209 |
| | (83 | ) | | 918 |
| | 949 |
|
| PRHTA (Highway revenue) | | 213 |
| | 93 |
| | 44 |
| | — |
| | 350 |
| | 556 |
|
| Puerto Rico Convention Center District Authority (PRCCDA) | | — |
| | 152 |
| | — |
| | — |
| | 152 |
| | 152 |
|
| Puerto Rico Infrastructure Financing Authority (PRIFA) (3) | | — |
| | 17 |
| | 1 |
| | — |
| | 18 |
| | 18 |
|
| Other Public Corporations | | | | | | | | | |
|
| | |
| PREPA | | 417 |
| | 73 |
| | 234 |
| | — |
| | 724 |
| | 876 |
|
| Puerto Rico Aqueduct and Sewer Authority (PRASA) | | — |
| | 285 |
| | 88 |
| | — |
| | 373 |
| | 373 |
|
| Municipal Finance Agency (MFA) | | 175 |
| | 61 |
| | 98 |
| | — |
| | 334 |
| | 488 |
|
| Puerto Rico Sales Tax Financing Corporation (COFINA) | | 262 |
| | — |
| | 9 |
| | — |
| | 271 |
| | 271 |
|
| University of Puerto Rico (U of PR) | | — |
| | 1 |
| | — |
| | — |
| | 1 |
| | 1 |
|
| Total net exposure to Puerto Rico | | $ | 2,031 |
| | $ | 1,748 |
| | $ | 1,104 |
| | $ | (97 | ) | | $ | 4,786 |
| | $ | 5,435 |
|
____________________
| |
| (1) | Net par outstanding eliminations relate to second-to-pay policies under which an Assured Guaranty insurance subsidiary guarantees an obligation already insured by another Assured Guaranty insurance subsidiary. |
| |
| (2) | Includes exposure to capital appreciation bonds with a current aggregate net par outstanding of $31 million and a fully accreted net par at maturity of $63 million. Of these amounts, current net par of $19 million and fully accreted net par at maturity of $50 million relate to the COFINA, current net par of $7 million and fully accreted net par at maturity of $7 million relate to the PRHTA, and current net par of $5 million and fully accreted net par at maturity of $5 million relate to the Commonwealth General Obligation Bonds. |
| |
(3) | As of the date of this filing, the Companyseven-member financial oversight board established by PROMESA has paid claims oncertified a filing under Title III of PROMESA for these credits.exposures. |
| |
(4) | The December 31, 2016 amount includes $46 million of net par from CIFG Acquisition. |
The following table showstables show the scheduled amortization of the general obligation bonds of Puerto Rico and various obligations of its related authorities and public corporations insured by the Company. The Company guarantees payments of interest and principal when those amounts are scheduled to be paid and cannot be required to pay on an accelerated basis. In the event that obligors default on their obligations, the Company would only pay the shortfall between the principal and interest due in any given period and the amount paid by the obligors.
Amortization Schedule
of Net Par Outstanding of Puerto Rico
As of December 31, 20162019
| | | | Scheduled Net Par Amortization | Scheduled Net Par Amortization |
| | 2017 (1Q) | 2017 (2Q) | 2017 (3Q) | 2017 (4Q) | 2018 | 2019 | 2020 | 2021 | 2022 -2026 | 2027 -2031 | 2032 -2036 | 2037 -2041 | 2042 -2047 | Total | 2020 (1Q) | 2020 (2Q) | 2020 (3Q) | 2020 (4Q) | 2021 | 2022 | 2023 | 2024 | 2025 -2029 | 2030 -2034 | 2035 -2039 | 2040 -2044 | 2045 -2047 | Total |
| | (in millions) | (in millions) |
| Commonwealth Constitutionally Guaranteed | | |
| Commonwealth of Puerto Rico - General Obligation Bonds | $ | 0 |
| $ | 0 |
| $ | 93 |
| $ | 0 |
| $ | 75 |
| $ | 82 |
| $ | 136 |
| $ | 16 |
| $ | 226 |
| $ | 254 |
| $ | 489 |
| $ | 105 |
| $ | — |
| $ | 1,476 |
| $ | — |
| $ | — |
| $ | 141 |
| $ | — |
| $ | 15 |
| $ | 37 |
| $ | 14 |
| $ | 73 |
| $ | 289 |
| $ | 419 |
| $ | 265 |
| $ | — |
| $ | — |
| $ | 1,253 |
|
| PBA | — |
| — |
| 28 |
| — |
| — |
| 3 |
| 5 |
| 13 |
| 24 |
| 42 |
| 54 |
| — |
| — |
| 169 |
| — |
| — |
| 5 |
| — |
| 13 |
| — |
| 7 |
| — |
| 58 |
| 38 |
| 19 |
| — |
| — |
| 140 |
|
| Public Corporations - Certain Revenues Potentially Subject to Clawback | | |
| PRHTA (Transportation revenue) | 0 |
| 0 |
| 36 |
| 0 |
| 38 |
| 32 |
| 25 |
| 18 |
| 119 |
| 156 |
| 295 |
| 194 |
| 5 |
| 918 |
| — |
| — |
| 25 |
| — |
| 18 |
| 28 |
| 33 |
| 4 |
| 163 |
| 166 |
| 292 |
| 82 |
| — |
| 811 |
|
| PRHTA (Highway revenue) | — |
| — |
| 10 |
| — |
| 10 |
| 21 |
| 22 |
| 26 |
| 30 |
| 62 |
| 169 |
| — |
| — |
| 350 |
| — |
| — |
| 22 |
| — |
| 35 |
| 6 |
| 32 |
| 33 |
| 55 |
| 177 |
| 94 |
| — |
| — |
| 454 |
|
| PRCCDA | — |
| — |
| — |
| — |
| — |
| — |
| — |
| — |
| — |
| 19 |
| 133 |
| — |
| — |
| 152 |
| — |
| — |
| — |
| — |
| — |
| — |
| — |
| — |
| 19 |
| 76 |
| 57 |
| — |
| — |
| 152 |
|
| PRIFA | — |
| — |
| — |
| — |
| 2 |
| — |
| — |
| — |
| 2 |
| — |
| — |
| 14 |
| — |
| 18 |
| — |
| — |
| — |
| — |
| — |
| — |
| 2 |
| — |
| — |
| — |
| 7 |
| 7 |
| — |
| 16 |
|
| Other Public Corporations | | |
| PREPA | 0 |
| 0 |
| 5 |
| — |
| 4 |
| 25 |
| 42 |
| 21 |
| 322 |
| 279 |
| 26 |
| 0 |
| — |
| 724 |
| — |
| — |
| 48 |
| — |
| 28 |
| 28 |
| 95 |
| 93 |
| 386 |
| 140 |
| 4 |
| — |
| — |
| 822 |
|
| PRASA | — |
| — |
| — |
| — |
| — |
| — |
| — |
| — |
| 53 |
| 57 |
| — |
| 2 |
| 261 |
| 373 |
| — |
| — |
| — |
| — |
| — |
| — |
| — |
| 1 |
| 109 |
| — |
| 2 |
| 15 |
| 246 |
| 373 |
|
| MFA | — |
| — |
| 48 |
| — |
| 47 |
| 44 |
| 37 |
| 33 |
| 98 |
| 27 |
| — |
| — |
| — |
| 334 |
| — |
| — |
| 45 |
| — |
| 40 |
| 40 |
| 22 |
| 18 |
| 79 |
| 4 |
| — |
| — |
| — |
| 248 |
|
| COFINA | 0 |
| 0 |
| 0 |
| 0 |
| (1 | ) | (1 | ) | (1 | ) | (2 | ) | (5 | ) | (7 | ) | 34 |
| 102 |
| 152 |
| 271 |
| |
| U of PR | — |
| — |
| 0 |
| — |
| 0 |
| 0 |
| 0 |
| 0 |
| 0 |
| 0 |
| 1 |
| — |
| — |
| 1 |
| — |
| — |
| — |
| — |
| — |
| — |
| — |
| — |
| — |
| 1 |
| — |
| — |
| — |
| 1 |
|
| Total net par for Puerto Rico | $ | 0 |
| $ | 0 |
| $ | 220 |
| $ | 0 |
| $ | 175 |
| $ | 206 |
| $ | 266 |
| $ | 125 |
| $ | 869 |
| $ | 889 |
| $ | 1,201 |
| $ | 417 |
| $ | 418 |
| $ | 4,786 |
| |
| Total | | $ | — |
| $ | — |
| $ | 286 |
| $ | — |
| $ | 149 |
| $ | 139 |
| $ | 205 |
| $ | 222 |
| $ | 1,158 |
| $ | 1,021 |
| $ | 740 |
| $ | 104 |
| $ | 246 |
| $ | 4,270 |
|
Amortization Schedule
of Net Debt Service Outstanding of Puerto Rico
As of December 31, 20162019
| | | | Scheduled Net Debt Service Amortization | Scheduled Net Debt Service Amortization |
| | 2017 (1Q) | 2017 (2Q) | 2017 (3Q) | 2017 (4Q) | 2018 | 2019 | 2020 | 2021 | 2022 -2026 | 2027 -2031 | 2032 -2036 | 2037 -2041 | 2042 -2047 | Total | 2020 (1Q) | 2020 (2Q) | 2020 (3Q) | 2020 (4Q) | 2021 | 2022 | 2023 | 2024 | 2025 -2029 | 2030 -2034 | 2035 -2039 | 2040 -2044 | 2045 -2047 | Total |
| | (in millions) | (in millions) |
| Commonwealth Constitutionally Guaranteed | | |
| Commonwealth of Puerto Rico - General Obligation Bonds | $ | 38 |
| $ | 0 |
| $ | 131 |
| $ | 0 |
| $ | 146 |
| $ | 150 |
| $ | 200 |
| $ | 73 |
| $ | 488 |
| $ | 445 |
| $ | 595 |
| $ | 112 |
| $ | — |
| $ | 2,378 |
| $ | 33 |
| $ | — |
| $ | 173 |
| $ | — |
| $ | 74 |
| $ | 94 |
| $ | 70 |
| $ | 128 |
| $ | 514 |
| $ | 572 |
| $ | 294 |
| $ | — |
| $ | — |
| $ | 1,952 |
|
| PBA | 4 |
| — |
| 32 |
| — |
| 7 |
| 10 |
| 13 |
| 20 |
| 54 |
| 58 |
| 62 |
| — |
| — |
| 260 |
| 4 |
| — |
| 9 |
| — |
| 20 |
| 6 |
| 13 |
| 6 |
| 81 |
| 50 |
| 20 |
| — |
| — |
| 209 |
|
| Public Corporations - Certain Revenues Potentially Subject to Clawback | | |
| PRHTA (Transportation revenue) | 24 |
| 0 |
| 60 |
| 0 |
| 84 |
| 76 |
| 67 |
| 59 |
| 305 |
| 308 |
| 404 |
| 229 |
| 5 |
| 1,621 |
| 21 |
| — |
| 46 |
| — |
| 59 |
| 68 |
| 72 |
| 41 |
| 331 |
| 294 |
| 356 |
| 89 |
| — |
| 1,377 |
|
| PRHTA (Highway revenue) | 10 |
| — |
| 19 |
| — |
| 29 |
| 39 |
| 39 |
| 42 |
| 96 |
| 120 |
| 196 |
| — |
| — |
| 590 |
| 12 |
| — |
| 34 |
| — |
| 58 |
| 27 |
| 52 |
| 51 |
| 134 |
| 233 |
| 101 |
| — |
| — |
| 702 |
|
| PRCCDA | 3 |
| — |
| 4 |
| — |
| 7 |
| 7 |
| 7 |
| 7 |
| 35 |
| 50 |
| 151 |
| — |
| — |
| 271 |
| 3 |
| — |
| 3 |
| — |
| 7 |
| 7 |
| 7 |
| 7 |
| 52 |
| 103 |
| 61 |
| — |
| — |
| 250 |
|
| PRIFA | 0 |
| — |
| 0 |
| — |
| 3 |
| 1 |
| 1 |
| 1 |
| 7 |
| 4 |
| 3 |
| 15 |
| — |
| 35 |
| — |
| — |
| — |
| — |
| 1 |
| 1 |
| 3 |
| 1 |
| 4 |
| 3 |
| 10 |
| 8 |
| — |
| 31 |
|
| Other Public Corporations | | |
| PREPA | 15 |
| 2 |
| 20 |
| 2 |
| 37 |
| 58 |
| 74 |
| 52 |
| 440 |
| 322 |
| 29 |
| 0 |
| — |
| 1,051 |
| 17 |
| 3 |
| 65 |
| 3 |
| 63 |
| 62 |
| 128 |
| 121 |
| 467 |
| 155 |
| 5 |
| — |
| — |
| 1,089 |
|
| PRASA | 10 |
| — |
| 10 |
| — |
| 20 |
| 19 |
| 19 |
| 19 |
| 147 |
| 129 |
| 68 |
| 70 |
| 327 |
| 838 |
| 10 |
| — |
| 10 |
| — |
| 19 |
| 19 |
| 19 |
| 20 |
| 190 |
| 68 |
| 70 |
| 82 |
| 272 |
| 779 |
|
| MFA | 8 |
| — |
| 57 |
| — |
| 62 |
| 56 |
| 47 |
| 40 |
| 118 |
| 30 |
| — |
| — |
| — |
| 418 |
| 6 |
| — |
| 52 |
| — |
| 50 |
| 48 |
| 28 |
| 23 |
| 89 |
| 5 |
| — |
| — |
| — |
| 301 |
|
| COFINA | 6 |
| 0 |
| 6 |
| 0 |
| 13 |
| 13 |
| 13 |
| 13 |
| 69 |
| 68 |
| 103 |
| 162 |
| 160 |
| 626 |
| |
| U of PR | 0 |
| — |
| 0 |
| — |
| 0 |
| 0 |
| 0 |
| 0 |
| 0 |
| 0 |
| 1 |
| — |
| — |
| 1 |
| — |
| — |
| — |
| — |
| — |
| — |
| — |
| — |
| — |
| 1 |
| — |
| — |
| — |
| 1 |
|
| Total net par for Puerto Rico | $ | 118 |
| $ | 2 |
| $ | 339 |
| $ | 2 |
| $ | 408 |
| $ | 429 |
| $ | 480 |
| $ | 326 |
| $ | 1,759 |
| $ | 1,534 |
| $ | 1,612 |
| $ | 588 |
| $ | 492 |
| $ | 8,089 |
| |
| Total | | $ | 106 |
| $ | 3 |
| $ | 392 |
| $ | 3 |
| $ | 351 |
| $ | 332 |
| $ | 392 |
| $ | 398 |
| $ | 1,862 |
| $ | 1,484 |
| $ | 917 |
| $ | 179 |
| $ | 272 |
| $ | 6,691 |
|
Financial Guaranty Exposure to U.S. Residential Mortgage-Backed Securities
The tablestable below provideprovides information on the risk ratings and certain other risk characteristics of the Company’s financial guaranty insurance, FG VIE and credit derivative U.S. RMBS exposures. As of December 31, 2016,2019, U.S. RMBS net par outstanding was $3.5 billion, of which $1.6 billion was rated BIG. U.S. RMBS exposures represent 2% of the total net par outstanding, and BIG U.S. RMBS represent 24%19% of total BIG net par outstanding.outstanding as of December 31, 2019. See Part II, Item 8, Financial Statements and Supplementary Data, Note 5,6, Expected Loss to be Paid, for a discussion of expected losses to be paid on U.S. RMBS exposures.
Distribution of U.S. RMBS by Rating and Type of Exposure as of December 31, 2016
|
| | | | | | | | | | | | | | | | | | | | | | | | |
| Ratings: | | Prime First Lien | | Alt-A First Lien | | Option ARMs | | Subprime First Lien | | Second Lien | | Total Net Par Outstanding |
| | | (dollars in millions) |
| AAA | | $ | 2 |
| | $ | 174 |
| | $ | 28 |
| | $ | 1,471 |
| | $ | 0 |
| | $ | 1,675 |
|
| AA | | 24 |
| | 240 |
| | 52 |
| | 276 |
| | 0 |
| | 592 |
|
| A | | 14 |
| | 11 |
| | 0 |
| | 85 |
| | 0 |
| | 111 |
|
| BBB | | 24 |
| | 5 |
| | — |
| | 80 |
| | 0 |
| | 108 |
|
| BIG | | 141 |
| | 570 |
| | 81 |
| | 1,134 |
| | 1,225 |
| | 3,151 |
|
| Total exposures | | $ | 205 |
| | $ | 1,000 |
| | $ | 161 |
| | $ | 3,045 |
| | $ | 1,225 |
| | $ | 5,637 |
|
Distribution of U.S. RMBS by Year Insured and Type of Exposure as of December 31, 20162019
| | Year insured: | | Prime First Lien | | Alt-A First Lien | | Option ARMs | | Subprime First Lien | | Second Lien | | Total Net Par Outstanding | | Prime First Lien | | Alt-A First Lien | | Option ARMs | | Subprime First Lien | | Second Lien | | Total Net Par Outstanding |
| | | (in millions) | | (in millions) |
| 2004 and prior | | 31 |
| | 43 |
| | 15 |
| | 959 |
| | 74 |
| | 1,122 |
| | $ | 22 |
| | $ | 21 |
| | $ | 1 |
| | $ | 581 |
| | $ | 47 |
| | $ | 672 |
|
| 2005 | | 102 |
| | 376 |
| | 30 |
| | 164 |
| | 264 |
| | 936 |
| | 50 |
| | 217 |
| | 24 |
| | 222 |
| | 132 |
| | 645 |
|
| 2006 | | 72 |
| | 76 |
| | 28 |
| | 682 |
| | 352 |
| | 1,210 |
| | 38 |
| | 42 |
| | 11 |
| | 280 |
| | 217 |
| | 588 |
|
| 2007 | | — |
| | 504 |
| | 89 |
| | 1,176 |
| | 536 |
| | 2,305 |
| | — |
| | 332 |
| | 28 |
| | 957 |
| | 281 |
| | 1,598 |
|
| 2008 | | — |
| | — |
| | — |
| | 65 |
| | — |
| | 65 |
| | — |
| | — |
| | — |
| | 43 |
| | — |
| | 43 |
|
| Total exposures | | 205 |
| | 1,000 |
| | 161 |
| | 3,045 |
| | 1,225 |
| | 5,637 |
| | $ | 110 |
| | $ | 612 |
| | $ | 64 |
| | $ | 2,083 |
| | $ | 677 |
| | $ | 3,546 |
|
Exposure to Selected European Countries
Specialty Insurance and Reinsurance Exposure
The European countries where the Company has exposurealso provides specialty insurance and believes heightened uncertainties exist are: Hungary, Italy, Portugal, Spain and Turkey (collectively, the Selected European Countries). The Company added Turkeyreinsurance on transactions with risk profiles similar to those of its list of Selected European Countriesstructured finance exposures written in 2016, as a result of the recent political turmoil in the country. The Company’s direct economic exposure to the Selected European Countries (based on par for financial guaranty contractsform. All specialty insurance and notional amount for financial guaranty contracts accounted for as derivatives) isreinsurance exposures shown in the following tables, both grosstable below are rated investment grade internally.
Specialty Insurance and net of ceded reinsurance.Reinsurance
Gross Direct Economic Exposure
to Selected European Countries(1)
As of December 31, 2016
|
| | | | | | | | | | | | | | | | | | | | | | | |
| | Hungary | | Italy | | Portugal | | Spain | | Turkey | | Total |
| | (in millions) |
| Sub-sovereign exposure(2) | $ | 239 |
| | $ | 1,107 |
| | $ | 78 |
| | $ | 430 |
| | $ | — |
| | $ | 1,854 |
|
| Non-sovereign exposure(3) | 117 |
| | 443 |
| | — |
| | — |
| | 202 |
| | 762 |
|
| Total | $ | 356 |
| | $ | 1,550 |
| | $ | 78 |
| | $ | 430 |
| | $ | 202 |
| | $ | 2,616 |
|
| Total BIG | $ | 287 |
| | $ | — |
| | $ | 78 |
| | $ | 430 |
| | $ | — |
| | $ | 795 |
|
Net Direct Economic Exposure
to Selected European Countries(1)
As of December 31, 2016
|
| | | | | | | | | | | | | | | | | | | | | | | |
| | Hungary | | Italy | | Portugal | | Spain | | Turkey | | Total |
| | (in millions) |
| Sub-sovereign exposure(2) | $ | 236 |
| | $ | 880 |
| | $ | 76 |
| | $ | 342 |
| | $ | — |
| | $ | 1,534 |
|
| Non-sovereign exposure(3) | 114 |
| | 399 |
| | — |
| | — |
| | 202 |
| | 715 |
|
| Total | $ | 350 |
| | $ | 1,279 |
| | $ | 76 |
| | $ | 342 |
| | $ | 202 |
| | $ | 2,249 |
|
| Total BIG | $ | 283 |
| | $ | — |
| | $ | 76 |
| | $ | 342 |
| | $ | — |
| | $ | 701 |
|
|
| | | | | | | | | | | | | | | | |
| | | Gross Exposure | | Net Exposure |
| | | As of December 31, 2019 | | As of December 31, 2018 | | As of December 31, 2019 | | As of December 31, 2018 |
| | | (in millions) |
| Life insurance transactions (1) | | $ | 1,046 |
| | $ | 880 |
| | $ | 898 |
| | $ | 763 |
|
| Aircraft RVI policies | | 398 |
| | 340 |
| | 243 |
| | 218 |
|
____________________
| |
| (1) | While exposures are shown in U.S. dollars, the obligations are in various currencies, primarily euros.
The life insurance transactions net exposure is projected to increase to approximately $1.0 billion by December 31, 2023. |
| |
(2) | Sub-sovereign exposure in Selected European Countries includes transactions backed by receivables from, or supported by, sub-sovereigns, which are governmental or government-backed entities other than the ultimate governing body of the country.
|
| |
(3) | Non-sovereign exposure in Selected European Countries includes debt of regulated utilities, RMBS and diversified payment rights (DPR) securitizations.
|
The tables above include the par amount of financial guaranty contracts accounted for as derivatives of $108 million with a fair value of $2 million, net of reinsurance. The Company’s credit derivative transactions are governed by ISDA documentation, and the Company is required to make a loss payment on them only upon the occurrence of one or more defined credit events with respect to the referenced securities or loans.
The Company rates $283 million of its direct net par exposure to the Republic of Hungary BIG. The sub-sovereign transaction it rates BIG is an infrastructure financing dependent on payments by government agencies, while the non-sovereign transactions it rates BIG are covered mortgage bonds issued by Hungarian banks. The Company rates one insured Hungarian covered bond transaction investment grade.
The Company does not rate any of its direct exposure to the Republic of Italy BIG. The Company’s sub-sovereign exposure to Italy depends on payments by Italian governmental entities, while its non-sovereign Italian exposure is comprised primarily of securities backed by Italian residential mortgages or in one case a government-sponsored water utility.
The Company rates all of its direct exposure to the Kingdom of Spain and the Republic of Portugal BIG. The Company’s direct sub-sovereign exposure to Spain and Portugal includes infrastructure financings dependent on payments by sub-sovereigns and government agencies and financings dependent on lease and other payments by sub-sovereigns and government agencies.
The $202 million net insured par exposure in Turkey is to DPR securitizations sponsored by a major Turkish bank. These DPR securitizations were established outside of Turkey and involve payment orders in U.S. dollars, pounds sterling and Euros from persons outside of Turkey to beneficiaries in Turkey who are customers of the sponsoring bank. The sponsoring bank's correspondent banks have agreed to remit all such payments to a trustee-controlled account outside Turkey, where debt service payments for the DPR securitization are given priority over payments to the sponsoring bank.
Indirect Exposure to Selected European CountriesReinsurer Exposures
The Company considers economichas exposure to reinsurers through reinsurance arrangements (both as a Selected European Country to be indirect when thatceding company and as an assuming company). Most of the Company's exposure as a ceding company and as an assuming company relates to only a small portion of an insured transaction that otherwise is not related to that Selected European Country, andfinancial guaranty contracts written before 2009, although the Company has excluded its indirect exposure to the Selected European Countries from the exposure tables above.assumed or reassumed (from financial guarantors no longer writing new business) some of those exposures more recently. The Company has such indirect exposurecontinues to Selected European Countries through insurance it provides on pooled corporatecede portions of certain specialty exposures to reinsurers to mitigate its risk. See Item 8, Financial Statements and commercial receivables transactions.Supplementary Data, Note 8, Reinsurance.
The Company’s pooled corporate obligations with indirect exposure to Selected European Countries are highly diversified in terms of obligors and, except in the case of TruPS CDOs or transactions backed by perpetual preferred securities, highly diversified in terms of industry. Most pooled corporate obligations are structured to limit exposure to any given obligor and any given non-U.S. country or region and generally benefit from embedded credit enhancement which allows a transaction a certain level of losses in the underlying collateral without causing the Company to pay a claim. The Company’s commercial receivable transactions with indirect exposure to Selected European Countries are rail car lease transactions and aircraft lease transactions where some of the lessees have a nexus with the Selected European Countries. Like the pooled corporate transactions, the commercial receivable transactions generally benefit from embedded credit enhancement which allows a transaction a certain level of losses in the underlying collateral without causing the Company to pay a claim.
The Company has excluded from the exposure tables above its indirect economic exposure to the Selected European Countries through policies it provides on pooled corporate and commercial receivables transactions. The Company calculates indirect exposure to a country by multiplying the par amount of a transaction insured by the Company times the percent of the relevant collateral pool reported as having a nexus to the country. On that basis, the Company has calculated exposure of $115 million to Selected European Countries (plus Greece) in transactions with $2.8 billion of net par outstanding. The indirect exposure to credits with a nexus to Greece is $3 million across several highly rated pooled corporate obligations with net par outstanding of $129 million.
Identifying Exposure to Selected European Countries
When the Company directly insures an obligation, it assigns the obligation to a geographic location or locations based on its view of the geographic location of the risk. For most exposures this can be a relatively straight-forward determination as, for example, a debt issue supported by availability payments for a toll road in a particular country. The Company may also assign portions of a risk to more than one geographic location as it has, for example, in a residential mortgage backed security backed by residential mortgage loans in both Germany and Italy. The Company may also have exposures to the Selected
European Countries in business assumed from third party insurers and reinsurers. In the case of assumed business, the Company depends upon geographic information provided by the primary insurer.
Liquidity and Capital Resources
Liquidity Requirements and Sources
AGL and its Holding Company Subsidiaries
The liquidity of AGL, AGUS and AGMH is largely dependent on dividends from their operating subsidiaries and their access to external financing. The liquidity requirements of these entities include the payment of operating expenses, interest on debt issued by AGUS and AGMH, and dividends on AGL's common shares. AGL and its holding company subsidiaries may also require liquidity to fund acquisitions of new businesses, to make periodic capital investments in their operating subsidiaries, purchase the Company's outstanding debt, or in the case of AGL, to repurchase its common shares pursuant to its share repurchase authorization. In the ordinary course of business, the Company evaluates its liquidity needs and capital resources in light of holding company expenses and dividend policy, as well as rating agency considerations. The Company also subjects its cash flow projections and its assets to a stress test, maintaining a liquid asset balance of one time its stressed operating company net cash flows. Management believes that AGL will have sufficient liquidity to satisfy its needs over the next twelve months. See “Insurance Company Regulatory Restrictions”“Distributions From Subsidiaries” below for a discussion of the dividend restrictions of its insurance company subsidiaries.
The following table presents significant holding company cash flow activities (other than investment income, expenses and taxes) related to distributions from subsidiaries and outflows for debt service, dividends and other capital management activities.
AGL and U.S. Holding Company Subsidiaries
Significant Cash Flow Items
|
| | | | | | | | | | | |
| | Year Ended December 31, |
| | 2016 | | 2015 | | 2014 |
| | (in millions) |
| Intercompany sources (uses): | | | | | |
| Dividends paid by AGC to AGUS | $ | 79 |
| | $ | 90 |
| | $ | 69 |
|
| Dividends paid by AGM to AGMH | 247 |
| | 215 |
| | 160 |
|
| Dividends paid by AG Re to AGL | 100 |
| | 150 |
| | 82 |
|
| Dividends paid by other subsidiaries of AGMH | — |
| | — |
| | 10 |
|
| Repayment of surplus note by AGM to AGMH | — |
| | 25 |
| | 50 |
|
| Proceeds to AGMH from repurchase of common shares by AGM | 300 |
| | — |
| | — |
|
| Repayment of loan by AGUS to AGRO | (20 | ) | | — |
| | — |
|
| Issuance of note by AGUS to AGC(1) | — |
| | (200 | ) | | — |
|
| Repayment of note by AGC to AGUS(1) | — |
| | 200 |
| | — |
|
| External sources (uses): | | | | | |
| Dividends paid to AGL shareholders | (69 | ) | | (72 | ) | | (76 | ) |
| Repurchases of common shares by AGL(2) | (306 | ) | | (555 | ) | | (590 | ) |
| Interest paid by AGMH and AGUS | (95 | ) | | (95 | ) | | (83 | ) |
| Proceeds from issuance of long-term debt | — |
| | — |
| | 495 |
|
|
| | | | | | | | | | | |
| | AGL | | AGUS | | AGMH |
| | (in millions) |
| Year ended December 31, 2019 | | | | | |
| Intercompany sources | $ | 689 |
| | $ | 667 |
| | $ | 220 |
|
| Intercompany (uses) | — |
| | (492 | ) | | (199 | ) |
| External sources (uses): | | | | | |
| Dividends paid to AGL shareholders | (74 | ) | | — |
| | — |
|
| Repurchases of common shares (1) | (500 | ) | | — |
| | — |
|
| Interest paid (2) | — |
| | (46 | ) | | (38 | ) |
| Purchase of AGMH's debt by AGUS | — |
| | (3 | ) | | — |
|
| BlueMountain acquisition | — |
| | (157 | ) | | — |
|
| | | | | | |
| Year ended December 31, 2018 | | | | | |
| Intercompany sources | $ | 597 |
| | $ | 525 |
| | $ | 205 |
|
| Intercompany (uses) | — |
| | (485 | ) | | (192 | ) |
| External sources (uses): | | | | | |
| Dividends paid to AGL shareholders | (71 | ) | | — |
| | — |
|
| Repurchases of common shares (1) | (500 | ) | | — |
| | — |
|
| Interest paid (2) | — |
| | (58 | ) | | (41 | ) |
| Purchase of AGMH's debt by AGUS | — |
| | (100 | ) | | — |
|
| | | | | | |
| Year ended December 31, 2017 | | | | | |
| Intercompany sources | $ | 595 |
| | $ | 391 |
| | $ | 322 |
|
| Intercompany (uses) | — |
| | (511 | ) | | (279 | ) |
| External sources (uses): | | | | | |
| Dividends paid to AGL shareholders | (70 | ) | | — |
| | — |
|
| Repurchases of common shares (1) | (501 | ) | | — |
| | — |
|
| Interest paid (2) | — |
| | (32 | ) | | (45 | ) |
| Purchase of AGMH's debt by AGUS | — |
| | (28 | ) | | — |
|
____________________
| |
| (1) | On March 31, 2015, AGUS, as lender, provided $200 million to AGC, as borrower, from available funds to help fund the purchase of Radian Asset. AGC repaid that loan in full on April 14, 2015. |
| |
(2) | See Part II, Item 8, Financial Statements and Supplementary Data, Note 18,21, Shareholders' Equity, for additional information about share repurchases and authorizations. |
| |
| (2) | See “Long-Term Obligations” below for interest paid by subsidiary. |
Dividends
Distributions From Subsidiaries
The Company anticipates that, for the next twelve months, amounts paid by AGL’s direct and indirect insurance company subsidiaries as dividends or other distributions will be a major source of its liquidity. The insurance company subsidiaries’ ability to pay dividends depends upon their financial condition, results of operations, cash requirements, other potential uses for such funds, and compliance with rating agency requirements, and is also subject to restrictions contained in the insurance laws and related regulations of their states of domicile. Dividend restrictions applicable to AGC, AGM, MAC and to AG Re,the insurance subsidiaries are described in Part II, Item 8, Financial Statements and Supplementary Data, Note 11,18, Insurance Company Regulatory Requirements.
Dividend restrictions by insurance company subsidiary are as follows:
The maximum amount available during 20172020 for AGM to distribute as dividends without regulatory approval is estimated to be approximately $232$218 million, of which approximately $81$72 million is estimated to be available for distribution in the first quarter of 2017.2020.
The maximum amount available during 20172020 for AGC to distribute as ordinary dividends is approximately $107$166 million, of which approximately $29$85 million is available for distribution in the first quarter of 2017.2020.
The maximum amount available during 20172020 for MAC to distribute to MAC Holdings as dividends without regulatory approval is estimated to be approximately $49 million. MAC currently intends to allocate$21 million, none of which is available for distribution in the distributionfirst quarter of such amount quarterly in 2017. 2020.
Based on the applicable law and regulations, in 20172020 AG Re has the capacity to (i) make capital distributions in an aggregate amount up to $128 million without the prior approval of the Authority and (ii) declare and pay dividends in an aggregate amount up to the limitapproximately $274 million as of its outstanding statutory surplus, which is $314 million.December 31, 2019. Such dividend capacity is further limited by (i) the actual amount of AG Re’s unencumbered assets, which amount changes
from time to time due in part to collateral posting requirements. Asrequirements and which was approximately $264 million as of December 31, 2016, AG Re had2019, and (ii) the amount of statutory surplus, which as of December 31, 2019 was $240 million.
Based on the applicable law and regulations, in 2020 AGRO has the capacity to (i) make capital distributions in an aggregate amount up to $21 million without the prior approval of the Authority and (ii) declare and pay dividends in an aggregate amount up to approximately $103 million as of December 31, 2019. Such dividend capacity is further limited by (i) the actual amount of AGRO’s unencumbered assets, which amount changes from time to time due in part to collateral posting requirements and which was approximately $383 million as of approximately $596December 31, 2019, and (ii) the amount of Statutory surplus, which as of December 31, 2019 was $273 million.
Generally, dividends paid by a U.S. company to a Bermuda holding company are subject to a 30% withholding tax. After AGL became tax resident in the U.K., it became subject to the tax rules applicable to companies resident in the U.K., including the benefits afforded by the U.K.’s tax treaties. The income tax treaty between the U.K. and the U.S. reduces or eliminates the U.S. withholding tax on certain U.S. sourced investment income (to 5% or 0%), including dividends from U.S. subsidiaries to U.K. resident persons entitled to the benefits of the treaty.
Each of the Company's insurance subsidiaries may, with the approval of the relevant regulator, repurchase shares of its stock from its parent, so providing its parent with additional liquidity. AGC made such repurchases in 2019 and 2018, AGM and MAC made such repurchases in 2017. See Item 8, Financial Statements and Supplementary Data, Note 18, Insurance Company Regulatory Requirements, for more information.
External Financing
From time to time, AGL and its subsidiaries have sought external debt or equity financing in order to meet their obligations. External sources of financing may or may not be available to the Company, and if available, the cost of such financing may not be acceptable to the Company.
Cash and Investments
As of December 31, 2019, AGL had $135 million in cash and short-term investments, and AGUS and AGMH had a total of $223 million in cash and short-term investments. In addition, AGUS and AGMH have $7 million in fixed-maturity securities (excluding AGUS' investment in AGMH's debt) with weighted average duration of 4.4 years.
Commitments and Contingencies -Long-Term Debt Obligations
The Company has outstanding long-term debt issued primarily by AGUS and AGMH. All of AGUS' and AGMH's debt is fully and unconditionally guaranteed by AGL; AGL's guarantee of the junior subordinated debentures is on a junior subordinated basis. The outstanding principal, and interest paid, on long-term debt were as follows:
Principal Outstanding
and Interest Paid on Long-Term Debt and Intercompany Loans
|
| | | | | | | | | | | | | | | | | | | |
| | Principal Amount | | Interest Paid |
| | As of December 31, | | Year Ended December 31, |
| | 2019 | | 2018 | | 2019 | | 2018 | | 2017 |
| | (in millions) |
| AGUS | $ | 850 |
| | $ | 850 |
| | $ | 46 |
| | $ | 58 |
| | $ | 32 |
|
| Intercompany loans | 290 |
| | 50 |
| | 3 |
| | 3 |
| | 3 |
|
| Total AGUS | 1,140 |
| | 900 |
| | 49 |
| | 61 |
| | 35 |
|
| AGMH | 730 |
| | 730 |
| | 46 |
| | 46 |
| | 46 |
|
| AGM | 4 |
| | 5 |
| | — |
| | — |
| | — |
|
| AGMH's debt purchased by AGUS (1) | (131 | ) | | (128 | ) | | (8 | ) | | (5 | ) | | (1 | ) |
| Elimination of intercompany loans | (290 | ) | | (50 | ) | | (3 | ) | | (3 | ) | | (3 | ) |
| Total | $ | 1,453 |
| | $ | 1,457 |
| | $ | 84 |
| | $ | 99 |
| | $ | 77 |
|
____________________
| |
| (1) | Represents principal amount of Junior Subordinated Debentures issued by AGMH that has been purchased by AGUS. Loss on extinguishment of debt was $1 million in 2019, $34 million in 2018 and $9 million in 2017. |
Issued by AGUS:
7% Senior Notes. On May 18, 2004, AGUS issued $200 million of 7% Senior Notes due 2034 for net proceeds of $197 million. Although the coupon on the Senior Notes is 7%, the effective rate is approximately 6.4%, taking into account the effect of a cash flow hedge. The notes are redeemable, in whole or in part, at their principal amount plus accrued and unpaid interest at the date of redemption or, if greater, the make-whole redemption price.
5% Senior Notes.On June 20, 2014, AGUS issued $500$500 million of 5% Senior Notes due 2014. The notes are guaranteed by AGL.2024 for net proceeds of $495 million. The net proceeds from the sale of the notes were used for general corporate purposes, including the purchase of AGL common shares.shares of AGL. The notes are redeemable, in whole or in part, at their principal amount plus accrued and unpaid interest at the date of redemption or, if greater, the make-whole redemption price.
Series A Enhanced Junior Subordinated Debentures. On December 20, 2006, AGUS issued $150 million of Debentures due 2066. The Debentures paid a fixed 6.4% rate of interest until December 15, 2016, and thereafter pay a floating rate of interest, reset quarterly, at a rate equal to three month LIBOR plus a margin equal to 2.38%. LIBOR may be discontinued. See the Risk Factor captioned “The Company may be adversely impacted by the transition from LIBOR as a reference rate” under Operational Risks in Part I, Item 1A, Risk Factors. AGUS may select at one or more times to defer payment of interest for one or more consecutive periods for up to ten years. Any unpaid interest bears interest at the then applicable rate. AGUS may not defer interest past the maturity date. The debentures are redeemable, in whole or in part, at their principal amount plus accrued and unpaid interest to the date of redemption.
Issued by AGMH:
6 7/8% QUIBS. On December 19, 2001, AGMH issued $100 million face amount of 6 7/8% QUIBS due December 15, 2101, which are redeemable without premium or penalty in whole or in part at their principal amount plus accrued and unpaid interest up to but not including the date of redemption.
6.25% Notes. On November 26, 2002, AGMH issued $230 million face amount of 6.25% Notes due November 1, 2102, which are redeemable without premium or penalty in whole or in part at their principal amount plus accrued and unpaid interest up to but not including the date of redemption.
5.6% Notes. On July 31, 2003, AGMH issued $100 million face amount of 5.6% Notes due July 15, 2103, which are redeemable without premium or penalty in whole or in part at their principal amount plus accrued and unpaid interest up to but not including the date of redemption.
Junior Subordinated Debentures. On November 22, 2006, AGMH issued $300 million face amount of Junior Subordinated Debentures with a scheduled maturity date of December 15, 2036 and a final repayment date of December 15, 2066. The final repayment date of December 15, 2066 may be automatically extended up to four times in five-year increments provided certain conditions are met. The debentures are redeemable, in whole or in part, at any time prior to December 15, 2036 at their principal amount plus accrued and unpaid interest to the date of redemption or, if greater, the make-whole redemption price. Interest on the debentures will accrue from November 22, 2006 to December 15, 2036 at the annual rate of 6.4%. If any amount of the debentures remains outstanding after December 15, 2036, then the principal amount of the outstanding debentures will bear interest at a floating interest rate equal to one-month LIBOR plus 2.215% until repaid. LIBOR may be discontinued. See the Risk Factor captioned “The Company may be adversely impacted by the transition from LIBOR as a reference rate” under Operational Risks in Part I, Item 1A, Risk Factors. AGMH may elect at one or more times to defer payment of interest on the debentures for one or more consecutive interest periods that do not exceed ten years. In connection with the completion of this offering, AGMH entered into a replacement capital covenant for the benefit of persons that buy, hold or sell a specified series of AGMH long-term indebtedness ranking senior to the debentures. Under the covenant, the debentures will not be repaid, redeemed, repurchased or defeased by AGMH or any of its subsidiaries on or before the date that is twenty years prior to the final repayment date, except to the extent that AGMH has received proceeds from the sale of replacement capital securities. The proceeds from this offering were used to pay a dividend to the shareholders of AGMH. As of December 31, 2019, AGUS has purchased $131 million of these debentures, and may chose to make additional purchases of this or other Company debt in the future.
Intercompany Loans and Guarantees
On March 30, 2015,October 1, 2019 AGM, AGC and MAC made 10-year, 3.5% interest rate intercompany loans to AGUS loaned $200totaling $250 million to AGCfund the BlueMountain Acquisition and the related capital contributions. AGUS paid $157 million to facilitateacquire BlueMountain, contributed $60 million of cash to BlueMountain at closing and contributed an additional $30 million in cash in February 2020. See Item 8, Financial Statements and Supplementary Data, Note 15, Long-Term Debt and Credit Facilities, for additional information.
In addition, in 2012 AGUS borrowed $90 million from its affiliate AGRO to fund the acquisition of Radian Asset on April 1, 2015. AGCMAC. In 2018, the maturity date was extended to November 2023. During 2019, 2018 and 2017, AGUS repaid the loan$10 million, $10 million and $10 million, respectively, in full on April 14, 2015.outstanding principal as well as accrued and unpaid interest. As of December 31, 2019, $40 million remained outstanding.
From time to time, AGL and its subsidiaries have entered into intercompany loan facilities. For example, on October 25, 2013, AGL, as borrower, and AGUS, as lender, entered into a revolving credit facility pursuant to which AGL may, from time to time, borrow for general corporate purposes. Under the credit facility, AGUS committed to lend a principal amount not exceeding $225 million in the aggregate. SuchThe commitment under the revolving credit facility terminates on October 25, 20182023 (the loan commitment termination date). The unpaid principal amount of each loan will bear semi-annual interest at a fixed rate equal to 100% of the then applicable Federal short-term or mid-term interest rate as the case may be, as determined under Internal Revenue Code Sec.Section 1274(d), and interest on all loans will be computed for the actual number of days elapsed on the basis of a year consisting of 360 days.. Accrued interest on all loans will be paid on the last day of each June and December beginning on December 31, 2013, and at maturity. AGL must repay the then unpaid principal amounts of the loans, if any, by the third anniversary of the loan commitment termination date. No amounts are currently outstanding underAGL has not drawn upon the credit facility.
In addition, in 2012 AGUS borrowed $90 million from its affiliate AGRO to fund the acquisition of MAC. During 2016, AGUS repaid $20 million in outstanding principal as well as accrued any unpaid interest, and the parties agreed to extend the maturity date of the loan from May 2017 to November 2019. As of December 31, 2016, $70 million remained outstanding.
Furthermore, AGL fully and unconditionally guarantees the payment of the principal of, and interest on, the $1,130 million aggregate principal amount of senior notes issued by AGUS and AGMH, and the $450 million aggregate principal amount of junior subordinated debentures issued by AGUS and AGMH, in each case, as described under "Commitments and Contingencies -- Long-Term Debt Obligations" below.
Cash and Investments
As of December 31, 2016, AGL had $36 million in cash and short-term investments. AGUS and AGMH had a total of $259 million in cash and short-term investments. In addition, the Company's U.S. holding companies have $147 million in fixed-maturity securities with weighted average duration of 0.2 years.
above.
Insurance Company Subsidiaries
Liquidity of the insurance company subsidiaries is primarily used to pay for:
operating expenses,
claims on the insured portfolio,
posting of collateral in connection with credit derivatives and reinsurance transactions,
reinsurance premiums,
dividends or other distributions to AGL, AGUS and/or AGMH, as applicable,
posting of collateral in connection with reinsurance and credit derivative transactions, if necessary,
reinsurance premiums,
principal of and, where applicable, interest on surplus notes, and
capital investments in their own subsidiaries, where appropriate.
On June 30, 2016, MAC obtained approval from the NYDFS to repay its $300 million surplus note to Municipal Assurance Holdings Inc. (MAC Holdings) and its $100 million surplus note (plus accrued interest) to AGM. Accordingly, on June 30, 2016, MAC transferred cash and/or marketable securities to (i) MAC Holdings in an aggregate amount equal to $300 million, and (ii) AGM in an aggregate amount of $102.5 million. MAC Holdings, upon receipt of such $300 million from MAC, distributed cash and/or marketable securities in an aggregate amount of $300 million to its shareholders, AGM and AGC, in proportion to their respective 61% and 39% ownership interests such that AGM received $182 million and AGC received $118 million.
On November 25, 2016, the New York Superintendent approved AGM's request to repurchase 125 of its shares of common stock from its direct parent, AGMH, for approximately $300 million. AGM implemented the stock redemption plan in December 2016. Each share repurchased by AGM was retired and ceased to be an authorized share. Pursuant to AGM's Amended and Restated Charter, the par value of AGM's remaining shares of common stock issued and outstanding increased automatically in order to maintain AGM's total paid-in capital at $15 million and its authorized capital at $20 million.
Management believes that itsthe insurance subsidiaries’ liquidity needs for the next twelve months can be met from current cash, short-term investments and operating cash flow, including premium collections and coupon payments as well as scheduled maturities and paydowns from their respective investment portfolios. The Company targets a balance of its most liquid assets including cash and short-term securities, Treasuries, agency RMBS and pre-refunded municipal bonds equal to 1.5 times its projected operating company cash flow needs over the next four quarters. The Company intends to hold and has the ability to hold temporarily impaired debt securities until the date of anticipated recovery.recovery of amortized cost.
The insurance subsidiaries initially intend to invest $500 million in Assured Investment Management funds. As of December 31, 2019, the Insurance segment had invested $79 million in Assured Investment Management funds which are accounted for under the equity method, using NAV as a practical expedient. On a consolidated basis, these investments are eliminated and the underlying funds and CLOs are consolidated. The insurance subsidiaries have committed an additional $114 million to the three Assured Investment Management Funds that may be drawn in the future. See Item 8, Financial Statements and Supplementary Data, Note 14, Variable Interest Entities.
Beyond the next twelve months, the ability of the operating subsidiaries to declare and pay dividends may be influenced by a variety of factors, including market conditions, general economic conditions, and, in the case of the Company's insurance subsidiaries, insurance regulations and rating agency capital requirements and general economic conditions.requirements.
Insurance policies issued provide, in general, that payments of principal, interest and other amounts insured may not be accelerated by the holder of the obligation. Amounts paid by the Company therefore are typically in accordance with the obligation’s original payment schedule, unless the Company accelerates such payment schedule, at its sole option.
Payments made in settlement of the Company’s obligations arising from its insured portfolio may, and often do, vary significantly from year-to-year, depending primarily on the frequency and severity of payment defaults and whether the Company chooses to accelerate its payment obligations in order to mitigate future losses.
Claims (Paid) Recovered
|
| | | | | | | | | | | |
| | Year Ended December 31, |
| | 2016 | | 2015 | | 2014 |
| | (in millions) |
| Public finance | $ | (216 | ) | | $ | (29 | ) | | $ | (144 | ) |
| Structured finance: | | | | | |
| U.S. RMBS before benefit for recoveries for breaches of R&W | (179 | ) | | (270 | ) | | (304 | ) |
| Net benefit for recoveries for breaches of R&W | 89 |
| | 173 |
| | 663 |
|
| U.S. RMBS after benefit for recoveries for breaches of R&W | (90 | ) | | (97 | ) | | 359 |
|
| Other structured finance | (48 | ) | | (161 | ) | | 2 |
|
| Structured finance | (138 | ) | | (258 | ) | | 361 |
|
| Claims (paid) recovered, net of reinsurance(1) | $ | (354 | ) | | $ | (287 | ) | | $ | 217 |
|
____________________
| |
(1) | Includes $11 million, $21 million and $20 million paid in 2016, 2015 and 2014, respectively, for consolidated FG VIEs. |
As of December 31, 2016, the Company had exposure of approximately $528 million to a long-term infrastructure project that was financed by bonds that mature prior to the expiration of the project concession. The Company expects the cash flows from the project to be sufficient to repay all of the debt over the life of the project concession, and also expects the debt to be refinanced in the market at or prior to its maturity. If the issuer is unable to refinance the debt due to market conditions, the Company may have to pay claims when the debt matures from 2018 to 2022, and then recover from cash flows produced by the project in the future. The Company generally projects that in most scenarios it will be fully reimbursed for such claim payments. However, the recovery of such amounts is uncertain and may take from 10 to 35 years, depending on the performance of the underlying collateral.
In addition, the Company has net par exposure to the general obligation bonds of Puerto Rico and various obligations of its related authorities and public corporations aggregating $4.8$4.3 billion, , all of which areis rated BIG. Puerto Rico has experienced significant general fund budget deficits in recent years. Beginning in 2016, the Commonwealth hasand certain related authorities and public corporations have defaulted on obligations to make payments on its debt. In addition to high debt levels, Puerto Rico faces a challenging economic environment. Information regarding the Company's exposure to the Commonwealth of Puerto Rico and its related authorities and public corporations is set forth in Part II, Item 8, Financial Statements and Supplementary Data, Note 4,5, Outstanding Insurance Exposure.
Claims (Paid) Recovered
|
| | | | | | | | | | | |
| | Year Ended December 31, |
| | 2019 | | 2018 | | 2017 |
| | (in millions) |
| U.S. public finance | $ | (525 | ) | | $ | (395 | ) | | $ | (268 | ) |
| Non-U.S. public finance | — |
| | (1 | ) | | 5 |
|
| Structured finance: | | | | | |
| U.S. RMBS | 87 |
| | 159 |
| | 48 |
|
| Other structured finance | (7 | ) | | (9 | ) | | (14 | ) |
| Structured finance | 80 |
| | 150 |
| | 34 |
|
| Claims (paid) recovered, net of reinsurance (1) | $ | (445 | ) | | $ | (246 | ) | | $ | (229 | ) |
____________________
| |
| (1) | Includes $12 million recovered, $2 million paid, and $8 million paid in 2019, 2018 and 2017, respectively, for consolidated FG VIEs. |
In connection with the acquisition of AGMH, AGM agreed to retain the risks relating to the debt and strip policy portions of the leveraged lease business. In a leveraged lease transaction, a tax-exempt entity (such as a transit agency) transfers tax benefits to a tax-paying entity by transferring ownership of a depreciable asset, such as subway cars. The tax-exempt entity then leases the asset back from its new owner.
If the lease is terminated early, the tax-exempt entity must make an early termination payment to the lessor. A portion of this early termination payment is funded from monies that were pre-funded and invested at the closing of the leveraged lease transaction (along with earnings on those invested funds). The tax-exempt entity is obligated to pay the remaining, unfunded portion of this early termination payment (known as the strip coverage) from its own sources. AGM issued financial guaranty insurance policies (known as strip policies) that guaranteed the payment of these unfunded strip coverage amounts to the lessor, in the event that a tax-exempt entity defaulted on its obligation to pay this portion of its early termination payment. Following such events, AGM can then seek reimbursement of its strip policy payments from the tax-exempt entity, and can also sell the transferred depreciable asset and reimburse itself from the sale proceeds.
Currently, all the leveraged lease transactions in which AGM acts as strip coverage provider are breaching a rating trigger related to AGM and are subject to early termination. However, early termination of a lease does not result in a draw on the AGM policy if the tax-exempt entity makes the required termination payment. If all the leases were to terminate early and the tax-exempt entities did not make the required early termination payments, then AGM would be exposed to possible liquidity claims on gross exposure of approximately $676 million as of December 31, 2019. To date, none of the leveraged lease transactions that involve AGM has experienced an early termination due to a lease default and a claim on the AGM policy. At December 31, 2019, approximately $1.7 billion of cumulative strip par exposure had been terminated since 2008 on a consensual basis. The consensual terminations have resulted in no claims on AGM.
The terms of the Company’s CDS contracts generally are modified from standard CDS contract forms approved by ISDAInternational Swaps and Derivatives Association, Inc. in order to provide for payments on a scheduled "pay-as-you-go" basis and to replicate the terms of a traditional financial guaranty insurance policy. Some contractsHowever, the Company entered into asmay also be required to pay if the credit protection seller, however, utilize standard ISDA settlement mechanics of cash settlement (i.e., a process to value the loss of market value of a reference obligation)obligor becomes bankrupt or physical settlement (i.e., delivery ofif the reference obligation against payment of principal by the protection seller)were restructured if, after negotiation, those credit events are specified in the documentation for the credit derivative transactions. Furthermore, the Company may be required to make a payment due to an event that is unrelated to the performance of a “credit event,” as definedthe obligation referenced in the relevant contract. Cash settlementcredit derivative. If events of default or physical settlement generally requirestermination events specified in the credit derivative documentation were to occur, the Company may be required to make a cash termination payment of a larger amount,to its swap counterparty upon such termination. Any such payment would probably occur prior to the maturity of the reference obligation and be in an amount larger than would settlementthe amount due for that period on a “pay-as-you-go” basis.
The transaction documentation with one counterparty for $180 million of the CDS insured by the Company requires the Company to post collateral, subject to a cap, to secure its obligation to make payments under such contracts. As of December 31, 2016,2019, AGC did not have to post collateral to satisfy these requirements and the maximum posting requirement was $180 million.
Commitments and Contingencies -Committed Capital Securities
Each of AGC and AGM have entered into put agreements with four separate custodial trusts allowing each of AGC and AGM, respectively, to issue an aggregate of $200 million of non-cumulative redeemable perpetual preferred securities to the trusts in exchange for cash. Each custodial trust was created for the primary purpose of issuing $50 million face amount of CCS, investing the proceeds in high-quality assets and entering into put options with AGC or AGM, as applicable. The Company was posting approximately $116does not consider itself to be the primary beneficiary of the trusts and the trusts are not consolidated in Assured Guaranty's financial statements.
The trusts provide AGC and AGM access to new equity capital at their respective sole discretion through the exercise of the put options. Upon AGC's or AGM's exercise of its put option, the relevant trust will liquidate its portfolio of eligible assets and use the proceeds to purchase AGC or AGM preferred stock, as applicable. AGC or AGM may use the proceeds from its sale of preferred stock to the trusts for any purpose, including the payment of claims. The put agreements have no scheduled termination date or maturity. However, each put agreement will terminate if (subject to certain grace periods) specified events occur. Both AGC and AGM continue to have the ability to exercise their respective put options and cause the related trusts to purchase their preferred stock.
Prior to 2008 or 2007, the amounts paid on the CCS were established through an auction process. All of those auctions failed in 2008 or 2007, and the rates paid on the CCS increased to their respective maximums. The annualized rate on the AGC CCS is one-month LIBOR plus 250 bps, and the annualized rate on the AGM Committed Preferred Trust Securities (CPS) is one-month LIBOR plus 200 bps. LIBOR may be discontinued. See the Risk Factor captioned "The Company may be adversely impacted by the transition from LIBOR as a reference rate" under Operational Risks in Part I, Item 1A, Risk Factors.
Assured Investment Management Sources and Uses of Liquidity
The Asset Management segment's sources of liquidity are (1) net working capital, (2) cash from operations, including management and performance fees (which are unpredictable as to amount and timing), and (3) capital contributions from AGUS (through February 2020, $90 million had been contributed to secure its obligations under CDS. Of that amount, approximately $100 million related to $516supplement working capital). As of December 31, 2019, the Assured Investment Management subsidiaries had $11 million in CDS gross par insured where the amount of required collateral is capped and the remaining $16 million related to $174 million in CDS gross par insured where the amount of required collateral is based on movementscash.
Liquidity needs in the mark-to-market valuationAsset Management segment primarily include (1) paying operating expenses including compensation, (2) paying dividends to AGUS, and (3) capital to support growth and expansion of the underlying exposure. In February 2017, the Company terminated its remaining CDS contracts with one of its counterparties as to which it has a cap on its posting requirement and relating to approximately $183 million gross par and $73 million of collateral posted, as December 31, 2016, and the collateral is being returned to the Company.asset management business.
Consolidated Cash FlowsPrincipal Outstanding
Consolidated Cash Flow Summaryand Interest Paid on Long-Term Debt and Intercompany Loans
|
| | | | | | | | | | | |
| | Year Ended December 31, |
| | 2016 | | 2015 | | 2014 |
| | (in millions) |
| Net cash flows provided by (used in) operating activities before effects of FG VIE consolidation | $ | (165 | ) | | $ | (95 | ) | | $ | 509 |
|
| Effect of FG VIE consolidation | 24 |
| | 43 |
| | 68 |
|
| Net cash flows provided by (used in) operating activities - reported | (141 | ) | | (52 | ) | | 577 |
|
| Net cash flows provided by (used in) investing activities before effects of FG VIE consolidation | 489 |
| | 823 |
| | (423 | ) |
| Effect of FG VIE consolidation | 587 |
| | 171 |
| | 327 |
|
| Net cash flows provided by (used in) investing activities - reported | 1,076 |
| | 994 |
| | (96 | ) |
| Net cash flows provided by (used in) financing activities before effects of FG VIE consolidation | (367 | ) | | (633 | ) | | (189 | ) |
| Effect of FG VIE consolidation | (611 | ) | | (214 | ) | | (396 | ) |
| Net cash flows provided by (used in) financing activities - reported (1) | (978 | ) | | (847 | ) | | (585 | ) |
| Effect of exchange rate changes | (5 | ) | | (4 | ) | | (5 | ) |
| Cash at beginning of period | 166 |
| | 75 |
| | 184 |
|
| Total cash at the end of the period | $ | 118 |
| | $ | 166 |
| | $ | 75 |
|
|
| | | | | | | | | | | | | | | | | | | |
| | Principal Amount | | Interest Paid |
| | As of December 31, | | Year Ended December 31, |
| | 2019 | | 2018 | | 2019 | | 2018 | | 2017 |
| | (in millions) |
| AGUS | $ | 850 |
| | $ | 850 |
| | $ | 46 |
| | $ | 58 |
| | $ | 32 |
|
| Intercompany loans | 290 |
| | 50 |
| | 3 |
| | 3 |
| | 3 |
|
| Total AGUS | 1,140 |
| | 900 |
| | 49 |
| | 61 |
| | 35 |
|
| AGMH | 730 |
| | 730 |
| | 46 |
| | 46 |
| | 46 |
|
| AGM | 4 |
| | 5 |
| | — |
| | — |
| | — |
|
| AGMH's debt purchased by AGUS (1) | (131 | ) | | (128 | ) | | (8 | ) | | (5 | ) | | (1 | ) |
| Elimination of intercompany loans | (290 | ) | | (50 | ) | | (3 | ) | | (3 | ) | | (3 | ) |
| Total | $ | 1,453 |
| | $ | 1,457 |
| | $ | 84 |
| | $ | 99 |
| | $ | 77 |
|
____________________
| |
| (1) | Represents principal amount of Junior Subordinated Debentures issued by AGMH that has been purchased by AGUS. Loss on extinguishment of debt was $1 million in 2019, $34 million in 2018 and $9 million in 2017. |
Issued by AGUS:
7% Senior Notes. On May 18, 2004, AGUS issued $200 million of 7% Senior Notes due 2034 for net proceeds of $197 million. Although the coupon on the Senior Notes is 7%, the effective rate is approximately 6.4%, taking into account the effect of a cash flow hedge. The notes are redeemable, in whole or in part, at their principal amount plus accrued and unpaid interest at the date of redemption or, if greater, the make-whole redemption price.
5% Senior Notes. On June 20, 2014, AGUS issued $500 million of 5% Senior Notes due 2024 for net proceeds of $495 million. The net proceeds from the sale of the notes were used for general corporate purposes, including the purchase of common shares of AGL. The notes are redeemable, in whole or in part, at their principal amount plus accrued and unpaid interest at the date of redemption or, if greater, the make-whole redemption price.
Series A Enhanced Junior Subordinated Debentures. On December 20, 2006, AGUS issued $150 million of Debentures due 2066. The Debentures paid a fixed 6.4% rate of interest until December 15, 2016, and thereafter pay a floating rate of interest, reset quarterly, at a rate equal to three month LIBOR plus a margin equal to 2.38%. LIBOR may be discontinued. See the Risk Factor captioned “The Company may be adversely impacted by the transition from LIBOR as a reference rate” under Operational Risks in Part I, Item 1A, Risk Factors. AGUS may select at one or more times to defer payment of interest for one or more consecutive periods for up to ten years. Any unpaid interest bears interest at the then applicable rate. AGUS may not defer interest past the maturity date. The debentures are redeemable, in whole or in part, at their principal amount plus accrued and unpaid interest to the date of redemption.
Issued by AGMH:
6 7/8% QUIBS. On December 19, 2001, AGMH issued $100 million face amount of 6 7/8% QUIBS due December 15, 2101, which are redeemable without premium or penalty in whole or in part at their principal amount plus accrued and unpaid interest up to but not including the date of redemption.
6.25% Notes. On November 26, 2002, AGMH issued $230 million face amount of 6.25% Notes due November 1, 2102, which are redeemable without premium or penalty in whole or in part at their principal amount plus accrued and unpaid interest up to but not including the date of redemption.
5.6% Notes. On July 31, 2003, AGMH issued $100 million face amount of 5.6% Notes due July 15, 2103, which are redeemable without premium or penalty in whole or in part at their principal amount plus accrued and unpaid interest up to but not including the date of redemption.
Junior Subordinated Debentures. On November 22, 2006, AGMH issued $300 million face amount of Junior Subordinated Debentures with a scheduled maturity date of December 15, 2036 and a final repayment date of December 15, 2066. The final repayment date of December 15, 2066 may be automatically extended up to four times in five-year increments provided certain conditions are met. The debentures are redeemable, in whole or in part, at any time prior to December 15, 2036 at their principal amount plus accrued and unpaid interest to the date of redemption or, if greater, the make-whole redemption price. Interest on the debentures will accrue from November 22, 2006 to December 15, 2036 at the annual rate of 6.4%. If any amount of the debentures remains outstanding after December 15, 2036, then the principal amount of the outstanding debentures will bear interest at a floating interest rate equal to one-month LIBOR plus 2.215% until repaid. LIBOR may be discontinued. See the Risk Factor captioned “The Company may be adversely impacted by the transition from LIBOR as a reference rate” under Operational Risks in Part I, Item 1A, Risk Factors. AGMH may elect at one or more times to defer payment of interest on the debentures for one or more consecutive interest periods that do not exceed ten years. In connection with the completion of this offering, AGMH entered into a replacement capital covenant for the benefit of persons that buy, hold or sell a specified series of AGMH long-term indebtedness ranking senior to the debentures. Under the covenant, the debentures will not be repaid, redeemed, repurchased or defeased by AGMH or any of its subsidiaries on or before the date that is twenty years prior to the final repayment date, except to the extent that AGMH has received proceeds from the sale of replacement capital securities. The proceeds from this offering were used to pay a dividend to the shareholders of AGMH. As of December 31, 2019, AGUS has purchased $131 million of these debentures, and may chose to make additional purchases of this or other Company debt in the future.
Intercompany Loans and Guarantees
On October 1, 2019 AGM, AGC and MAC made 10-year, 3.5% interest rate intercompany loans to AGUS totaling $250 million to fund the BlueMountain Acquisition and the related capital contributions. AGUS paid $157 million to acquire BlueMountain, contributed $60 million of cash to BlueMountain at closing and contributed an additional $30 million in cash in February 2020. See Item 8, Financial Statements and Supplementary Data, Note 15, Long-Term Debt and Credit Facilities, for additional information.
In addition, in 2012 AGUS borrowed $90 million from its affiliate AGRO to fund the acquisition of MAC. In 2018, the maturity date was extended to November 2023. During 2019, 2018 and 2017, AGUS repaid $10 million, $10 million and $10 million, respectively, in outstanding principal as well as accrued and unpaid interest. As of December 31, 2019, $40 million remained outstanding.
From time to time, AGL and its subsidiaries have entered into intercompany loan facilities. For example, on October 25, 2013, AGL, as borrower, and AGUS, as lender, entered into a revolving credit facility pursuant to which AGL may, from time to time, borrow for general corporate purposes. Under the credit facility, AGUS committed to lend a principal amount not exceeding $225 million in the aggregate. The commitment under the revolving credit facility terminates on October 25, 2023 (the loan commitment termination date). The unpaid principal amount of each loan will bear semi-annual interest at a fixed rate equal to 100% of the then applicable interest rate as determined under Internal Revenue Code Section 1274(d). Accrued interest on all loans will be paid on the last day of each June and December and at maturity. AGL must repay the then unpaid principal amounts of the loans, if any, by the third anniversary of the loan commitment termination date. AGL has not drawn upon the credit facility.
Furthermore, AGL fully and unconditionally guarantees the payment of the principal of, and interest on, the $1,130 million aggregate principal amount of senior notes issued by AGUS and AGMH, and the $450 million aggregate principal amount of junior subordinated debentures issued by AGUS and AGMH, in each case, as described above.
Insurance Subsidiaries
Liquidity of the insurance subsidiaries is primarily used to pay for:
operating expenses,
claims on the insured portfolio,
dividends or other distributions to AGL, AGUS and/or AGMH, as applicable,
posting of collateral in connection with reinsurance and credit derivative transactions, if necessary,
reinsurance premiums,
principal of and, where applicable, interest on surplus notes, and
capital investments in their own subsidiaries, where appropriate.
Management believes that the insurance subsidiaries’ liquidity needs for the next twelve months can be met from current cash, short-term investments and operating cash flow, including premium collections and coupon payments as well as scheduled maturities and paydowns from their respective investment portfolios. The Company targets a balance of its most liquid assets including cash and short-term securities, Treasuries, agency RMBS and pre-refunded municipal bonds equal to 1.5 times its projected operating company cash flow needs over the next four quarters. The Company intends to hold and has the ability to hold temporarily impaired debt securities until the date of anticipated recovery of amortized cost.
The insurance subsidiaries initially intend to invest $500 million in Assured Investment Management funds. As of December 31, 2019, the Insurance segment had invested $79 million in Assured Investment Management funds which are accounted for under the equity method, using NAV as a practical expedient. On a consolidated basis, these investments are eliminated and the underlying funds and CLOs are consolidated. The insurance subsidiaries have committed an additional $114 million to the three Assured Investment Management Funds that may be drawn in the future. See Item 8, Financial Statements and Supplementary Data, Note 14, Variable Interest Entities.
Beyond the next twelve months, the ability of the operating subsidiaries to declare and pay dividends may be influenced by a variety of factors, including market conditions, general economic conditions, and, in the case of the Company's insurance subsidiaries, insurance regulations and rating agency capital requirements.
Insurance policies issued provide, in general, that payments of principal, interest and other amounts insured may not be accelerated by the holder of the obligation. Amounts paid by the Company therefore are typically in accordance with the obligation’s original payment schedule, unless the Company accelerates such payment schedule, at its sole option.
Payments made in settlement of the Company’s obligations arising from its insured portfolio may, and often do, vary significantly from year-to-year, depending primarily on the frequency and severity of payment defaults and whether the Company chooses to accelerate its payment obligations in order to mitigate future losses.
In addition, the Company has net par exposure to the general obligation bonds of Puerto Rico and various obligations of its related authorities and public corporations aggregating $4.3 billion, all of which is rated BIG. Beginning in 2016, the Commonwealth and certain related authorities and public corporations have defaulted on obligations to make payments on its debt. Information regarding the Company's exposure to the Commonwealth of Puerto Rico and its related authorities and public corporations is set forth in Item 8, Financial Statements and Supplementary Data, Note 5, Outstanding Insurance Exposure.
Claims (Paid) Recovered
|
| | | | | | | | | | | |
| | Year Ended December 31, |
| | 2019 | | 2018 | | 2017 |
| | (in millions) |
| U.S. public finance | $ | (525 | ) | | $ | (395 | ) | | $ | (268 | ) |
| Non-U.S. public finance | — |
| | (1 | ) | | 5 |
|
| Structured finance: | | | | | |
| U.S. RMBS | 87 |
| | 159 |
| | 48 |
|
| Other structured finance | (7 | ) | | (9 | ) | | (14 | ) |
| Structured finance | 80 |
| | 150 |
| | 34 |
|
| Claims (paid) recovered, net of reinsurance (1) | $ | (445 | ) | | $ | (246 | ) | | $ | (229 | ) |
____________________
| |
| (1) | ClaimsIncludes $12 million recovered, $2 million paid, onand $8 million paid in 2019, 2018 and 2017, respectively, for consolidated FG VIEs are presented in the consolidated cash flow statements as a component of paydowns on FG VIE liabilities in financing activities as opposed to operating activities.VIEs. |
Excluding net cash flows from FG VIE consolidation, cash outflows from operating activities increased in 2016 compared with 2015 due primarily to claim payments on Puerto Rico bonds, higher accelerated claim payments as a means of mitigating future losses and lower cash received from commutations.
Excluding net cash flows from FG VIE consolidation, cash inflows from operating activities decreased in 2015 compared with 2014 due primarily to lower R&W cash recoveries in 2015 than the comparable prior year period.
Investing activities were primarily net sales (purchases) of fixed-maturity and short-term investment securities. Investing cash flows in 2016, 2015 and 2014 include inflows of $629 million, $400 million and $408 million from paydowns on FG VIE assets, respectively. The increase in inflows from FG VIEs in 2016 was due to the proceeds from a paydown of a large transaction. In 2016, the Company paid $435 million, net of cash acquired, to acquire CIFGH. In 2015, the Company sold securities to fund the acquisition of Radian Asset by AGC and paid $800 million, net of cash acquired, to acquire Radian Asset.
Financing activities consisted primarily of paydowns of FG VIE liabilities and share repurchases. Financing cash flows in 2016, 2015 and 2014 include outflows of $611 million, $214 million and $396 million for FG VIEs, respectively. The increase in outflows from FG VIEs in 2016 was due to the paydown of a large transaction. In 2016, the Company paid $306 million to repurchase 10.7 million common shares; in 2015, the Company paid $555 million to repurchase 21.0 million common shares; and in 2014, the Company paid $590 million to repurchase 24.4 million common shares.
From January 1, 2017 through February 23, 2017, the Company repurchased an additional 3.6 million common shares. As of February 23, 2017, the Company had remaining authorization to purchase common shares of $407 million on a settlement basis. For more information about the Company's share repurchases and authorizations, see Part II, Item 8, Financial Statements and Supplementary Data, Note 18, Shareholders' Equity.
Commitments and Contingencies
Leases
AGL and its subsidiaries lease office space and certain other items.
The principal executive offices of AGL and AG Re consist of approximately 8,250 square feet of office space located in Hamilton, Bermuda; the lease for this space expires in April 2021. AGM entered into an operating lease as of September 30, 2015 for new office space originally comprising one full floor and one partial floor at 1633 Broadway in New York City. The Company moved the principal place of business of AGM, AGC, MAC and the Company's other U.S. based subsidiaries from 31 West 52nd Street in New York City to this new location in the third quarter of 2016. The new lease is for approximately 88,000 square feet and runs until 2032, with an option, subject to certain conditions, to renew for five years at a fair market rent. The fixed annual rent, which commences after an initial rent holiday, begins at $6.2 million, rising in two steps to $7.3 million for the last five years of the initial term. In connection with the moveacquisition of AGMH, AGM agreed to retain the risks relating to the debt and strip policy portions of the leveraged lease business. In a leveraged lease transaction, a tax-exempt entity (such as a transit agency) transfers tax benefits to a tax-paying entity by transferring ownership of a depreciable asset, such as subway cars. The tax-exempt entity then leases the asset back from its new owner.
If the lease is terminated early, the tax-exempt entity must make an early termination payment to the lessor. A portion of this early termination payment is funded from monies that were pre-funded and invested at the closing of the leveraged lease transaction (along with earnings on those invested funds). The tax-exempt entity is obligated to pay the remaining, unfunded portion of this early termination payment (known as the strip coverage) from its own sources. AGM issued financial guaranty insurance policies (known as strip policies) that guaranteed the payment of these unfunded strip coverage amounts to the lessor, in return for rent abatement and certain other concessions, AGM terminated its leasethe event that a tax-exempt entity defaulted on its office space atobligation to pay this portion of its early termination payment. Following such events, AGM can then seek reimbursement of its strip policy payments from the tax-exempt entity, and can also sell the transferred depreciable asset and reimburse itself from the sale proceeds.
Currently, all the leveraged lease transactions in which AGM acts as strip coverage provider are breaching a rating trigger related to AGM and are subject to early termination. However, early termination of a lease does not result in a draw on the AGM policy if the tax-exempt entity makes the required termination payment. If all the leases were to terminate early and the tax-exempt entities did not make the required early termination payments, then AGM would be exposed to possible liquidity claims on gross exposure of approximately $676 million as of December 31, West 52nd Street, which2019. To date, none of the leveraged lease transactions that involve AGM has experienced an early termination due to a lease default and a claim on the AGM policy. At December 31, 2019, approximately $1.7 billion of cumulative strip par exposure had been terminated since 2008 on a consensual basis. The consensual terminations have resulted in no claims on AGM.
The terms of the Company’s CDS contracts generally are modified from standard CDS contract forms approved by International Swaps and Derivatives Association, Inc. in order to provide for payments on a scheduled "pay-as-you-go" basis and to run until 2026. On September 23, 2016, AGM entered intoreplicate the terms of a traditional financial guaranty insurance policy. However, the Company may also be required to pay if the obligor becomes bankrupt or if the reference obligation were restructured if, after negotiation, those credit events are specified in the documentation for the credit derivative transactions. Furthermore, the Company may be required to make a payment due to an amendmentevent that is unrelated to the performance of the obligation referenced in the credit derivative. If events of default or termination events specified in the credit derivative documentation were to occur, the Company may be required to make a cash termination payment to its new leaseswap counterparty upon such termination. Any such payment would probably occur prior to include the remaining portionmaturity of the partial floorreference obligation and be in an amount larger than the amount due for the remainder of the lease term. The fixed annual rent for the remaining portion of the partial floor, which commences after an initial rent holiday, begins at $1.1 million per annum, rising in two steps to $1.3 million for the last five years of the initial term. In addition, the Company leases office space in London and San Francisco, California. See “–Contractual Obligations” for lease payments due by period. Rent expense was $13.4 million in 2016, $10.5 million in 2015 and $10.1 million in 2014.
Long-Term Debt Obligationsthat period on a “pay-as-you-go” basis.
The outstanding principaltransaction documentation with one counterparty for $180 million of the CDS insured by the Company requires the Company to post collateral, subject to a cap, to secure its obligation to make payments under such contracts. As of December 31, 2019, AGC did not have to post collateral to satisfy these requirements and interestthe maximum posting requirement was $180 million.
Commitments and Contingencies -Committed Capital Securities
Each of AGC and AGM have entered into put agreements with four separate custodial trusts allowing each of AGC and AGM, respectively, to issue an aggregate of $200 million of non-cumulative redeemable perpetual preferred securities to the trusts in exchange for cash. Each custodial trust was created for the primary purpose of issuing $50 million face amount of CCS, investing the proceeds in high-quality assets and entering into put options with AGC or AGM, as applicable. The Company does not consider itself to be the primary beneficiary of the trusts and the trusts are not consolidated in Assured Guaranty's financial statements.
The trusts provide AGC and AGM access to new equity capital at their respective sole discretion through the exercise of the put options. Upon AGC's or AGM's exercise of its put option, the relevant trust will liquidate its portfolio of eligible assets and use the proceeds to purchase AGC or AGM preferred stock, as applicable. AGC or AGM may use the proceeds from its sale of preferred stock to the trusts for any purpose, including the payment of claims. The put agreements have no scheduled termination date or maturity. However, each put agreement will terminate if (subject to certain grace periods) specified events occur. Both AGC and AGM continue to have the ability to exercise their respective put options and cause the related trusts to purchase their preferred stock.
Prior to 2008 or 2007, the amounts paid on long-term debtthe CCS were established through an auction process. All of those auctions failed in 2008 or 2007, and the rates paid on the CCS increased to their respective maximums. The annualized rate on the AGC CCS is one-month LIBOR plus 250 bps, and the annualized rate on the AGM Committed Preferred Trust Securities (CPS) is one-month LIBOR plus 200 bps. LIBOR may be discontinued. See the Risk Factor captioned "The Company may be adversely impacted by the transition from LIBOR as follows:a reference rate" under Operational Risks in Part I, Item 1A, Risk Factors.
Assured Investment Management Sources and Uses of Liquidity
The Asset Management segment's sources of liquidity are (1) net working capital, (2) cash from operations, including management and performance fees (which are unpredictable as to amount and timing), and (3) capital contributions from AGUS (through February 2020, $90 million had been contributed to supplement working capital). As of December 31, 2019, the Assured Investment Management subsidiaries had $11 million in cash.
Liquidity needs in the Asset Management segment primarily include (1) paying operating expenses including compensation, (2) paying dividends to AGUS, and (3) capital to support growth and expansion of the asset management business.
Principal Outstanding
and Interest Paid on Long-Term Debt and Intercompany Loans
|
| | | | | | | | | | | | | | | | | | | |
| | Principal Amount | | Interest Paid |
| | As of December 31, | | Year Ended December 31, |
| | 2016 | | 2015 | | 2016 | | 2015 | | 2014 |
| | (in millions) |
| AGUS: | |
| | |
| | | | |
| | |
| 7% Senior Notes(1) | $ | 200 |
| | $ | 200 |
| | $ | 14 |
| | $ | 14 |
| | $ | 14 |
|
| 5% Senior Notes(1) | 500 |
| | 500 |
| | 25 |
| | 25 |
| | 13 |
|
| Series A Enhanced Junior Subordinated Debentures(2) | 150 |
| | 150 |
| | 10 |
| | 10 |
| | 10 |
|
| Total AGUS | 850 |
| | 850 |
| | 49 |
| | 49 |
| | 37 |
|
| AGMH(3): | |
| | |
| | |
| | |
| | |
|
67/8% QUIBS(1) | 100 |
| | 100 |
| | 7 |
| | 7 |
| | 7 |
|
| 6.25% Notes(1) | 230 |
| | 230 |
| | 14 |
| | 14 |
| | 14 |
|
| 5.6% Notes(1) | 100 |
| | 100 |
| | 6 |
| | 6 |
| | 6 |
|
| Junior Subordinated Debentures(2) | 300 |
| | 300 |
| | 19 |
| | 19 |
| | 19 |
|
| Total AGMH | 730 |
| | 730 |
| | 46 |
| | 46 |
| | 46 |
|
| AGM(3): | |
| | |
| | |
| | |
| | |
|
| AGM Notes Payable | 9 |
| | 12 |
| | 0 |
| | 0 |
| | 3 |
|
| Total AGM | 9 |
| | 12 |
| | 0 |
| | 0 |
| | 3 |
|
| Total | $ | 1,589 |
| | $ | 1,592 |
| | $ | 95 |
| | $ | 95 |
| | $ | 86 |
|
|
| | | | | | | | | | | | | | | | | | | |
| | Principal Amount | | Interest Paid |
| | As of December 31, | | Year Ended December 31, |
| | 2019 | | 2018 | | 2019 | | 2018 | | 2017 |
| | (in millions) |
| AGUS | $ | 850 |
| | $ | 850 |
| | $ | 46 |
| | $ | 58 |
| | $ | 32 |
|
| Intercompany loans | 290 |
| | 50 |
| | 3 |
| | 3 |
| | 3 |
|
| Total AGUS | 1,140 |
| | 900 |
| | 49 |
| | 61 |
| | 35 |
|
| AGMH | 730 |
| | 730 |
| | 46 |
| | 46 |
| | 46 |
|
| AGM | 4 |
| | 5 |
| | — |
| | — |
| | — |
|
| AGMH's debt purchased by AGUS (1) | (131 | ) | | (128 | ) | | (8 | ) | | (5 | ) | | (1 | ) |
| Elimination of intercompany loans | (290 | ) | | (50 | ) | | (3 | ) | | (3 | ) | | (3 | ) |
| Total | $ | 1,453 |
| | $ | 1,457 |
| | $ | 84 |
| | $ | 99 |
| | $ | 77 |
|
____________________
| |
| (1) | AGL fullyRepresents principal amount of Junior Subordinated Debentures issued by AGMH that has been purchased by AGUS. Loss on extinguishment of debt was $1 million in 2019, $34 million in 2018 and unconditionally guarantees these obligations$9 million in 2017. |
| |
(2) | Guaranteed by AGL on a junior subordinated basis. |
(3)Principal amounts vary from carrying amounts due primarily to acquisition method fair value adjustments at the AGMH acquisition date, which are accreted or amortized into interest expense over the remaining terms of these obligations.Issued by AGUS:
7% Senior Notes issued by AGUS.Notes. On May 18, 2004, AGUS issued $200 million of 7% Senior Notes due 2034 for net proceeds of $197 million. Although the coupon on the Senior Notes is 7%, the effective rate is approximately 6.4%, taking into account the effect of a cash flow hedge. The notes are redeemable, in whole or in part, at their principal amount plus accrued and unpaid interest at the date of redemption or, if greater, the make-whole redemption price.
5% Senior Notes issued by AGUS.Notes. On June 20, 2014, AGUS issued $500 million of 5% Senior Notes due 2024 for net proceeds of $495 million. The notes are guaranteed by AGL. The net proceeds from the sale of the notes were used for general corporate purposes, including the purchase of common shares of AGL. The notes are redeemable, in whole or in part, at their principal amount plus accrued and unpaid interest at the date of redemption or, if greater, the make-whole redemption price.
Series A Enhanced Junior Subordinated Debentures issued by AGUS.Debentures. On December 20, 2006, AGUS issued $150 million of Debentures due 2066. The Debentures paypaid a fixed 6.4% rate of interest until December 15, 2016, and thereafter pay a floating rate of interest, reset quarterly, at a rate equal to three month London Interbank Offered Rate (LIBOR)LIBOR plus a margin equal to 2.38%. LIBOR may be discontinued. See the Risk Factor captioned “The Company may be adversely impacted by the transition from LIBOR as a reference rate” under Operational Risks in Part I, Item 1A, Risk Factors. AGUS may select at one or more times to defer payment of interest for one or more consecutive periods for up to ten years. Any unpaid interest bears interest at the then applicable rate. AGUS may not defer interest past the maturity date. The debentures are redeemable, in whole or in part, at their principal amount plus accrued and unpaid interest to the date of redemption.
Issued by AGMH:
6 7/8% QUIBS issued by AGMH.QUIBS. On December 19, 2001, AGMH issued $100 million face amount of 6 7/8% QUIBS due December 15, 2101, which are callableredeemable without premium or penalty.penalty in whole or in part at their principal amount plus accrued and unpaid interest up to but not including the date of redemption.
6.25% Notes issued by AGMH.Notes. On November 26, 2002, AGMH issued $230 million face amount of 6.25% Notes due November 1, 2102, which are callableredeemable without premium or penalty in whole or in part.part at their principal amount plus accrued and unpaid interest up to but not including the date of redemption.
5.6% Notes issued by AGMH.Notes. On July 31, 2003, AGMH issued $100 million face amount of 5.6% Notes due July 15, 2103, which are callableredeemable without premium or penalty in whole or in part.part at their principal amount plus accrued and unpaid interest up to but not including the date of redemption.
Junior Subordinated Debentures issued by AGMH.Debentures. On November 22, 2006, AGMH issued $300$300 million face amount of Junior Subordinated Debentures with a scheduled maturity date of December 15, 2036 and a final repayment date of December 15, 2066. The final repayment date of December 15, 2066 may be automatically extended up to four times in five-yearfive-year increments provided certain conditions are met. The debentures are redeemable, in whole or in part, at any time prior to December 15, 2036 at their principal amount plus accrued and unpaid interest to the date of redemption or, if greater, the make-whole redemption price. Interest on the debentures will accrue from November 22, 2006 to December 15, 2036 at the annual rate of 6.4%. If any amount of the debentures remains outstanding after December 15, 2036, then the principal amount of the outstanding debentures will bear interest at a floating interest rate equal to one-monthone-month LIBOR plus 2.215% until repaid. LIBOR may be discontinued. See the Risk Factor captioned “The Company may be adversely impacted by the transition from LIBOR as a reference rate” under Operational Risks in Part I, Item 1A, Risk Factors. AGMH may elect at one or more times to defer payment of interest on the debentures for one or more consecutive interest periods that do not exceed ten years. In connection with the completion of this offering, AGMH entered into a replacement capital covenant for the benefit of persons that buy, hold or sell a specified series of AGMH long-term indebtedness ranking senior to the debentures. Under the covenant, the debentures will not be repaid, redeemed, repurchased or defeased by AGMH or any of its subsidiaries on or before the date that is twenty years prior to the final repayment date, except to the extent that AGMH has received proceeds from the sale of replacement capital securities. The proceeds from this offering were used to pay a dividend to the shareholders of AGMH. As of December 31, 2019, AGUS has purchased $131 million of these debentures, and may chose to make additional purchases of this or other Company debt in the future.
Intercompany Loans and Guarantees
On October 1, 2019 AGM, AGC and MAC made 10-year, 3.5% interest rate intercompany loans to AGUS totaling $250 million to fund the BlueMountain Acquisition and the related capital contributions. AGUS paid $157 million to acquire BlueMountain, contributed $60 million of cash to BlueMountain at closing and contributed an additional $30 million in cash in February 2020. See Item 8, Financial Statements and Supplementary Data, Note 15, Long-Term Debt and Credit Facilities, for additional information.
In addition, in 2012 AGUS borrowed $90 million from its affiliate AGRO to fund the acquisition of MAC. In 2018, the maturity date was extended to November 2023. During 2019, 2018 and 2017, AGUS repaid $10 million, $10 million and $10 million, respectively, in outstanding principal as well as accrued and unpaid interest. As of December 31, 2019, $40 million remained outstanding.
From time to time, AGL and its subsidiaries have entered into intercompany loan facilities. For example, on October 25, 2013, AGL, as borrower, and AGUS, as lender, entered into a revolving credit facility pursuant to which AGL may, from time to time, borrow for general corporate purposes. Under the credit facility, AGUS committed to lend a principal amount not exceeding $225 million in the aggregate. The commitment under the revolving credit facility terminates on October 25, 2023 (the loan commitment termination date). The unpaid principal amount of each loan will bear semi-annual interest at a fixed rate equal to 100% of the then applicable interest rate as determined under Internal Revenue Code Section 1274(d). Accrued interest on all loans will be paid on the last day of each June and December and at maturity. AGL must repay the then unpaid principal amounts of the loans, if any, by the third anniversary of the loan commitment termination date. AGL has not drawn upon the credit facility.
Furthermore, AGL fully and unconditionally guarantees the payment of the principal of, and interest on, the $1,130 million aggregate principal amount of senior notes issued by AGUS and AGMH, and the $450 million aggregate principal amount of junior subordinated debentures issued by AGUS and AGMH, in each case, as described above.
Recourse Credit FacilityInsurance Subsidiaries
Liquidity of the insurance subsidiaries is primarily used to pay for:
operating expenses,
claims on the insured portfolio,
dividends or other distributions to AGL, AGUS and/or AGMH, as applicable,
posting of collateral in connection with reinsurance and credit derivative transactions, if necessary,
reinsurance premiums,
principal of and, where applicable, interest on surplus notes, and
capital investments in their own subsidiaries, where appropriate.
Management believes that the insurance subsidiaries’ liquidity needs for the next twelve months can be met from current cash, short-term investments and operating cash flow, including premium collections and coupon payments as well as scheduled maturities and paydowns from their respective investment portfolios. The Company targets a balance of its most liquid assets including cash and short-term securities, Treasuries, agency RMBS and pre-refunded municipal bonds equal to 1.5 times its projected operating company cash flow needs over the next four quarters. The Company intends to hold and has the ability to hold temporarily impaired debt securities until the date of anticipated recovery of amortized cost.
The insurance subsidiaries initially intend to invest $500 million in Assured Investment Management funds. As of December 31, 2019, the Insurance segment had invested $79 million in Assured Investment Management funds which are accounted for under the equity method, using NAV as a practical expedient. On a consolidated basis, these investments are eliminated and the underlying funds and CLOs are consolidated. The insurance subsidiaries have committed an additional $114 million to the three Assured Investment Management Funds that may be drawn in the future. See Item 8, Financial Statements and Supplementary Data, Note 14, Variable Interest Entities.
Beyond the next twelve months, the ability of the operating subsidiaries to declare and pay dividends may be influenced by a variety of factors, including market conditions, general economic conditions, and, in the case of the Company's insurance subsidiaries, insurance regulations and rating agency capital requirements.
Insurance policies issued provide, in general, that payments of principal, interest and other amounts insured may not be accelerated by the holder of the obligation. Amounts paid by the Company therefore are typically in accordance with the obligation’s original payment schedule, unless the Company accelerates such payment schedule, at its sole option.
Payments made in settlement of the Company’s obligations arising from its insured portfolio may, and often do, vary significantly from year-to-year, depending primarily on the frequency and severity of payment defaults and whether the Company chooses to accelerate its payment obligations in order to mitigate future losses.
In addition, the Company has net par exposure to the general obligation bonds of Puerto Rico and various obligations of its related authorities and public corporations aggregating $4.3 billion, all of which is rated BIG. Beginning in 2016, the Commonwealth and certain related authorities and public corporations have defaulted on obligations to make payments on its debt. Information regarding the Company's exposure to the Commonwealth of Puerto Rico and its related authorities and public corporations is set forth in Item 8, Financial Statements and Supplementary Data, Note 5, Outstanding Insurance Exposure.
Claims (Paid) Recovered
|
| | | | | | | | | | | |
| | Year Ended December 31, |
| | 2019 | | 2018 | | 2017 |
| | (in millions) |
| U.S. public finance | $ | (525 | ) | | $ | (395 | ) | | $ | (268 | ) |
| Non-U.S. public finance | — |
| | (1 | ) | | 5 |
|
| Structured finance: | | | | | |
| U.S. RMBS | 87 |
| | 159 |
| | 48 |
|
| Other structured finance | (7 | ) | | (9 | ) | | (14 | ) |
| Structured finance | 80 |
| | 150 |
| | 34 |
|
| Claims (paid) recovered, net of reinsurance (1) | $ | (445 | ) | | $ | (246 | ) | | $ | (229 | ) |
____________________
| |
| (1) | Includes $12 million recovered, $2 million paid, and $8 million paid in 2019, 2018 and 2017, respectively, for consolidated FG VIEs. |
In connection with the acquisition of AGMH, AGM agreed to retain the risks relating to the debt and strip policy portions of the leveraged lease business. The liquidity risk to AGM related to the strip policy portion of the leveraged lease business was previously mitigated by the strip coverage facility described below.
In a leveraged lease transaction, a tax-exempt entity (such as a transit agency) transfers tax benefits to a tax-paying entity by transferring ownership of a depreciable asset, such as subway cars. The tax-exempt entity then leases the asset back from its new owner.
If the lease is terminated early, the tax-exempt entity must make an early termination payment to the lessor. A portion of this early termination payment is funded from monies that were pre-funded and invested at the closing of the leveraged lease transaction (along with earnings on those invested funds). The tax-exempt entity is obligated to pay the remaining, unfunded portion of this early termination payment (known as the strip coverage) from its own sources. AGM issued financial guaranty insurance policies (known as strip policies) that guaranteed the payment of these unfunded strip coverage amounts to the lessor, in the event that a tax-exempt entity defaulted on its obligation to pay this portion of its early termination payment. Following such events, AGM can then seek reimbursement of its strip policy payments from the tax-exempt entity, and can also sell the transferred depreciable asset and reimburse itself from the sale proceeds.
Currently, all the leveraged lease transactions in which AGM acts as strip coverage provider are breaching a rating trigger related to AGM and are subject to early termination. However, early termination of a lease does not result in a draw on the AGM policy if the tax-exempt entity makes the required termination payment. If all the leases were to terminate early and the tax-exempt entities dodid not make the required early termination payments, then AGM would be exposed to possible liquidity claims on gross exposure of approximately $953$676 million as of December 31, 2016.2019. To date, none of the leveraged lease
transactions that involve AGM has experienced an early termination due to a lease default and a claim on the AGM policy. At December 31, 2016,2019, approximately $1.5$1.7 billion of cumulative strip par exposure had been terminated since 2008 on a consensual basis. The consensual terminations have resulted in no claims on AGM.
On July 1, 2009, AGMThe terms of the Company’s CDS contracts generally are modified from standard CDS contract forms approved by International Swaps and Dexia Crédit Local S.A., acting through its New York Branch (Dexia Crédit Local (NY)), entered intoDerivatives Association, Inc. in order to provide for payments on a scheduled "pay-as-you-go" basis and to replicate the terms of a traditional financial guaranty insurance policy. However, the Company may also be required to pay if the obligor becomes bankrupt or if the reference obligation were restructured if, after negotiation, those credit facility (the Strip Coverage Facility). Underevents are specified in the Strip Coverage Facility, Dexia Crédit Local (NY) agreeddocumentation for the credit derivative transactions. Furthermore, the Company may be required to make loansa payment due to AGM to finance all draws made by lessors on AGM strip policiesan event that were outstanding as of November 13, 2008, upis unrelated to the commitment amount. There have never been any borrowings underperformance of the Strip Coverage Facility,obligation referenced in the credit derivative. If events of default or termination events specified in the credit derivative documentation were to occur, the Company may be required to make a cash termination payment to its swap counterparty upon such termination. Any such payment would probably occur prior to the maturity of the reference obligation and be in an amount larger than the amount due for that period on a “pay-as-you-go” basis.
The transaction documentation with one counterparty for $180 million of the leveraged leases coveredCDS insured by the Strip Coverage Facility has declined since July 1, 2009 and,Company requires the Company to date, none of the leveraged lease transactions in which AGM acts as the strip coverage provider has experienced an early termination duepost collateral, subject to a lease default. Consequently, and in viewcap, to secure its obligation to make payments under such contracts. As of the credit quality of the relevant tax-exempt entitiesDecember 31, 2019, AGC did not have to post collateral to satisfy these requirements and the cost of the Strip Coverage Facility, the Company determined that maintaining the Strip Coverage Facilitymaximum posting requirement was no longer warranted. On July 29, 2016, the parties terminated the Strip Coverage Facility.$180 million.
CommittedCommitments and Contingencies -Committed Capital Securities
Each of AGC and AGM have issuedentered into put agreements with four separate custodial trusts allowing each of AGC and AGM, respectively, to issue an aggregate of $200 million of CCS pursuant to transactions in which AGC CCS or AGM’s Committed Preferred Trust Securities (the AGM CPS), as applicable, were issued by custodial trusts created for the primary purpose of issuing such securities, investing the proceeds in high-quality assets and providing put options to AGC or AGM, as applicable. The put options allow AGC and AGM to issue non-cumulative redeemable perpetual preferred securities to the trusts in exchange for cash. For both AGC and AGM, four initial trusts wereEach custodial trust was created each with an initial aggregatefor the primary purpose of issuing $50 million face amount of $50 million.CCS, investing the proceeds in high-quality assets and entering into put options with AGC or AGM, as applicable. The Company does not consider itself to be the primary beneficiary of the trusts for either the AGC or AGM CCS and the trusts are not consolidated in Assured Guaranty's financial statements.
The trusts provide AGC and AGM access to new equity capital at their respective sole discretion through the exercise of the put options. Upon AGC's or AGM's exercise of its put option, the relevant trust will liquidate its portfolio of eligible assets and use the proceeds to purchase the AGC or AGM preferred stock, as applicable. AGC or AGM may use the proceeds from suchits sale of its preferred stock to the trusts for any purpose, including the payment of claims. The put agreements have no scheduled termination date or maturity. However, each put agreement will terminate if (subject to certain grace periods) specified events occur.
Both AGC Committed Capital Securities.AGC entered into separate put agreements with four custodial trusts with respect to its CCS in April 2005. The AGC put options have not been exercised through the date of this filing. Initially, all of AGC CCS were issued to a special purpose pass-through trust (the Pass-Through Trust). The Pass-Through Trust was dissolved in April 2008 and the AGC CCS were distributed to the holders of the Pass-Through Trust's securities. Neither the Pass-Through Trust nor the custodial trusts are consolidated in the Company's financial statements. Income distributions on the Pass-Through Trust securities and CCS were equal to an annualized rate of one-month LIBOR plus 110 basis points for all periods ending on or prior to April 8, 2008. Following dissolution of the Pass-Through Trust, distributions on the AGC CCS are determined pursuant to an auction process. On April 7, 2008 this auction process failed, thereby increasing the annualized rate on the AGC CCS to one-month LIBOR plus 250 basis points. Distributions on the AGC preferred stock will be determined pursuant to the same process. AGC continuesAGM continue to have the ability to exercise itstheir respective put optionoptions and cause the related trusts to purchase their preferred stock.
Prior to 2008 or 2007, the amounts paid on the CCS were established through an auction process. All of those auctions failed in 2008 or 2007, and the rates paid on the CCS increased to their respective maximums. The annualized rate on the AGC Preferred Stock.
CCS is one-month LIBOR plus 250 bps, and the annualized rate on the AGM Committed Capital Securities.AGM entered into separate put agreements with four custodial trusts with respect to its CCS in June 2003. The AGM put options have not been exercised through the date of this filing. AGM pays a floating put premium to the trusts, which represents the difference between the commercial paper yield and the winning auction rate (plus all fees and expenses of the trust). If an auction does not attract sufficient clearing bids, however, the auction ratePreferred Trust Securities (CPS) is subject to a maximum rate of one-month LIBOR plus 200 basis pointsbps. LIBOR may be discontinued. See the Risk Factor captioned "The Company may be adversely impacted by the transition from LIBOR as a reference rate" under Operational Risks in Part I, Item 1A, Risk Factors.
Assured Investment Management Sources and Uses of Liquidity
The Asset Management segment's sources of liquidity are (1) net working capital, (2) cash from operations, including management and performance fees (which are unpredictable as to amount and timing), and (3) capital contributions from AGUS (through February 2020, $90 million had been contributed to supplement working capital). As of December 31, 2019, the Assured Investment Management subsidiaries had $11 million in cash.
Liquidity needs in the Asset Management segment primarily include (1) paying operating expenses including compensation, (2) paying dividends to AGUS, and (3) capital to support growth and expansion of the asset management business.
Consolidated Cash Flows
The consolidated statements of cash flow include the cash flows of the Insurance and Asset Management subsidiaries and holding companies as well as the cash flows of the consolidated FG VIEs and, beginning October 1, 2019, the consolidated investment vehicles.
Consolidated Cash Flow Summary
|
| | | | | | | | | | | |
| | Year Ended December 31, |
| | 2019 | | 2018 | | 2017 |
| | (in millions) |
| Net cash flows provided by (used in) operating activities before effect of VIE consolidation | $ | (255 | ) | | $ | 451 |
| | $ | 414 |
|
| Effect of VIE consolidation (1) | (254 | ) | | 11 |
| | 19 |
|
| Net cash flows provided by (used in) operating activities | (509 | ) | | 462 |
| | 433 |
|
| | | | | | |
| Net cash flows provided by (used in) investing activities before effect of VIE consolidation | 1,055 |
| | 192 |
| | 112 |
|
| Acquisitions, net of cash acquired | (145 | ) | | — |
| | 95 |
|
| Effect of VIE consolidation (1) | 259 |
| | 105 |
| | 138 |
|
| Net cash flows provided by (used in) investing activities | 1,169 |
| | 297 |
| | 345 |
|
| | | | | | |
| Dividends paid | (74 | ) | | (71 | ) | | (70 | ) |
| Repurchases of common stock | (500 | ) | | (500 | ) | | (501 | ) |
| Repurchase of debt | (3 | ) | | (100 | ) | | (28 | ) |
| Net cash flows provided by (used in) financing activities before effect of VIE consolidation | (16 | ) | | (8 | ) | | (10 | ) |
| Effect of VIE consolidation (1) | 9 |
| | (116 | ) | | (157 | ) |
| Net cash flows provided by (used in) financing activities (2) | (584 | ) | | (795 | ) | | (766 | ) |
| | | | | | |
| Effect of exchange rate changes | 3 |
| | (4 | ) | | 5 |
|
| Cash and restricted cash at beginning of period | 104 |
| | 144 |
| | 127 |
|
| Total cash and restricted cash at the end of the period | $ | 183 |
| | $ | 104 |
| | $ | 144 |
|
____________________
| |
| (1) | VIE consolidation includes the effects of FG VIEs and consolidated investment vehicles. |
| |
| (2) | Claims paid on consolidated FG VIEs are presented in the consolidated cash flow statements as a component of paydowns on FG VIEs’ liabilities in financing activities as opposed to operating activities. |
Cash flows from operations, excluding the effect of consolidating VIEs, was an outflow of $255 million in 2019, inflows of $451 million and $414 million in 2018 and 2017, respectively. Cash flows from operations in 2018 and 2017 included significant inflows from strategic initiatives. In 2018, the Company received $363 million as consideration for the next succeeding distribution period. BeginningSGI Transaction and in August 2007,2017 the AGM CCS requiredCompany received $426 million in commutation premiums upon the maximum ratere-assumption of a previously ceded book of business. In 2019, however, cash flows from operations included a significant claim payment for eachPuerto Rico COFINA exposures. Premium receipts have declined in 2018 and 2019. Cash flows from operations attributable to the effect of consolidated VIEs was negative in 2019 due to the relevant trusts. AGM continuesinclusion of investing activities of consolidated investment vehicles.
Investing activities primarily consisted of net sales (purchases) of fixed-maturity and short-term investments, paydowns on FG VIEs’ assets, outflows for the BlueMountain Acquisition in 2019 and inflows for the MBIA UK Acquisition in 2017. The higher investing inflows in 2019 primarily related to havesales of securities whose proceeds were used to fund the abilityBlueMountain Acquisition and claim payments.
Financing activities primarily consisted of share repurchases, dividends, paydowns of FG VIEs’ liabilities and debt extinguishment. It also included issuances of CLO's in consolidated investment vehicles. The inflows in 2019 compared to exercise its put optionthe outflows in 2018 and cause2017 attributable to consolidated VIEs was due to the related trustsconsolidation of Assured Investment Management CLO.
From January 1, 2020 through February 27, 2020, the Company repurchased an additional 0.8 million common shares. On February 26, 2020, the Board authorized share repurchases for an additional $250 million. As of February 27, 2020, after combining the remaining authorization and the new authorization, the Company was authorized to purchase AGM Preferred Stock.$408 million of its common shares. For more information about the Company's share repurchases and authorizations, see Item 8, Financial Statements and Supplementary Data, Note 21, Shareholders' Equity.
Commitments and Contingencies
Leases
The Company leases and occupies approximately 103,500 square feet in New York City through 2032. Subject to certain conditions, the Company has an option to renew the lease for five years at a fair market rent. The Company also leases 78,400 square feet of office space at another location in New York City, which expires in 2024. In addition, AGL and its subsidiaries lease additional office space in various locations under non-cancelable operating leases which expire at various dates through 2029. See “Contractual Obligations” below or Item 8, Financial Statements and Supplementary Data, Note 20, Commitments and Contingencies, for lease payments due by period. Rent expense was $12 million in 2019, $9 million in 2018 and $9 million in 2017.
Contractual Obligations
The following table summarizes the Company's obligations under its contracts, including debt and lease obligations, and also includes estimated claim payments, based on its loss estimation process, under financial guaranty policies it has issued.
| | | | As of December 31, 2016 | As of December 31, 2019 |
| | Less Than 1 Year | | 1-3 Years | | 3-5 Years | | More Than 5 Years | | Total | Less Than 1 Year | | 1-3 Years | | 3-5 Years | | More Than 5 Years | | Total |
| | (in millions) | (in millions) |
| Long-term debt(1): | | | | | | | | |
| | | | | | | | |
|
| AGUS: | | | | | | | | | | |
| 7% Senior Notes | $ | 14 |
| | $ | 28 |
| | $ | 28 |
| | $ | 373 |
| | $ | 443 |
| $ | 14 |
| | $ | 28 |
| | $ | 28 |
| | $ | 331 |
| | $ | 401 |
|
| 5% Senior Notes | 25 |
| | 50 |
| | 50 |
| | 563 |
| | 688 |
| 25 |
| | 50 |
| | 550 |
| | — |
| | 625 |
|
| Series A Enhanced Junior Subordinated Debentures | 5 |
| | 11 |
| | 12 |
| | 443 |
| | 471 |
| 6 |
| | 12 |
| | 12 |
| | 420 |
| | 450 |
|
| AGMH: | | | | | | | | | | |
67/8% QUIBS | 7 |
| | 14 |
| | 14 |
| | 650 |
| | 685 |
| 7 |
| | 14 |
| | 14 |
| | 629 |
| | 664 |
|
| 6.25% Notes | 14 |
| | 29 |
| | 29 |
| | 1,393 |
| | 1,465 |
| 14 |
| | 29 |
| | 29 |
| | 1,350 |
| | 1,422 |
|
| 5.6 Notes | 6 |
| | 11 |
| | 11 |
| | 557 |
| | 585 |
| |
| 5.6% Notes | | 6 |
| | 11 |
| | 11 |
| | 540 |
| | 568 |
|
| Junior Subordinated Debentures | 19 |
| | 38 |
| | 38 |
| | 1,164 |
| | 1,259 |
| 19 |
| | 38 |
| | 38 |
| | 1,107 |
| | 1,202 |
|
| Notes Payable | 4 |
| | 3 |
| | 1 |
| | 1 |
| | 9 |
| |
| Operating lease obligations(2) | 6 |
| | 17 |
| | 17 |
| | 88 |
| | 128 |
| |
| Other compensation plans(3) | 15 |
| | — |
| | — |
| | — |
| | 15 |
| |
| Estimated claim payments(4) | 231 |
| | 298 |
| | 65 |
| | 1,969 |
| | 2,563 |
| |
| AGM Notes Payable | | 2 |
| | — |
| | — |
| | 2 |
| | 4 |
|
| Operating and finance lease obligations (2) | | 20 |
| | 39 |
| | 30 |
| | 62 |
| | 151 |
|
| Other compensation plans (3) | | 19 |
| | 6 |
| | 4 |
| | — |
| | 29 |
|
| Estimated claim payments (4) | | 516 |
| | 661 |
| | 103 |
| | 1,265 |
| | 2,545 |
|
| Ceded premium payable, net of commission | | 4 |
| | 5 |
| | 4 |
| | 16 |
| | 29 |
|
| Other | 15 |
| | — |
| | — |
| | — |
| | 15 |
| 8 |
| | — |
| | — |
| | — |
| | 8 |
|
| Total | $ | 361 |
| | $ | 499 |
| | $ | 265 |
| | $ | 7,201 |
| | $ | 8,326 |
| |
| Total (5) | | $ | 660 |
| | $ | 893 |
| | $ | 823 |
| | $ | 5,722 |
| | $ | 8,098 |
|
____________________
| |
| (1) | Includes interest and principal payments. See Note 16, Long-Term Debt and Credit Facilities, in Part II, Item 8, Financial Statements and Supplementary Data, Note 15, Long-Term Debt and Credit Facilities, for expected maturities of debt. |
| |
| (2) | Operating lease obligations exclude escalations in building operating costs and real estate taxes. |
| |
| (3) | Amount excludes approximately $56$85 million of liabilities under various supplemental retirement plans, which are fair valued and payable at the time of termination of employment by either employer or employee. Amount also excludes approximately $19$33 million of liabilities under Performance Retention Plan,deferred compensation plans, which are payable at the time of vesting or termination of employment by either employer or employee. Given the nature of these awards, we arethe Company is unable to determine the year in which they will be paid. |
| |
| (4) | Claim payments represent estimated undiscounted expected cash outflows under direct and assumed financial guaranty contracts, whether accounted for as insurance or credit derivatives, including claim payments under contracts in consolidated FG VIEs. The amounts presented are not reduced for cessions under reinsurance contracts. Amounts include any benefit anticipated from excess spread or other recoveries within the contracts but do not reflect any benefit for recoveries under breaches of R&W. Amounts also exclude estimated recoveries related to past claims paid for policies in the public finance sector. |
| |
| (5) | See Item 8, Financial Statements and Supplementary Data, Note 14. Variable Interest Entities, for expected maturities of FG VIEs' liabilities and consolidated investment vehicles. |
Investment Portfolio
The Company’s principal objectives in managing its investment portfolio are to support the highest possible ratings for each operating company;company, to manage investment risk within the context of the underlying portfolio of insurance risk;risk, to maintain sufficient liquidity to cover unexpected stress in the insurance portfolio;portfolio, and to maximize after-tax net investment income.
The Company’s fixed-maturity securities and short-term investments had a duration of 5.34.1 years and 4.9 years as of December 31, 20162019 and 5.4 years as of December 31, 2015.2018, respectively. Generally, the Company’s fixed-maturity securities are designated as available-for-sale. For more information about the Investment Portfolio and a detailed description of the Company’s valuation of investments see Part II, Item 8, Financial Statements and Supplementary Data, Note 7,9, Fair Value Measurement and Note 10, Investments and Cash.
Fixed-Maturity Securities and Short-Term Investments
by Security Type
| | | | As of December 31, 2016 | | As of December 31, 2015 | As of December 31, 2019 | | As of December 31, 2018 |
| | Amortized Cost | | Estimated Fair Value | | Amortized Cost | | Estimated Fair Value | Amortized Cost | | Estimated Fair Value | | Amortized Cost | | Estimated Fair Value |
| | (in millions) | (in millions) |
| Fixed-maturity securities: | |
| | |
| | |
| | |
| |
| | |
| | |
| | |
|
| Obligations of state and political subdivisions | $ | 5,269 |
| | $ | 5,432 |
| | $ | 5,528 |
| | $ | 5,841 |
| $ | 4,036 |
| | $ | 4,340 |
| | $ | 4,761 |
| | $ | 4,911 |
|
| U.S. government and agencies | 424 |
| | 440 |
| | 377 |
| | 400 |
| 137 |
| | 147 |
| | 167 |
| | 175 |
|
| Corporate securities | 1,612 |
| | 1,613 |
| | 1,505 |
| | 1,520 |
| 2,137 |
| | 2,221 |
| | 2,175 |
| | 2,136 |
|
| Mortgage-backed securities(1): | | | | | | | |
| |
| Mortgage-backed securities (1): | | | | | | | | |
|
| RMBS | 998 |
| | 987 |
| | 1,238 |
| | 1,245 |
| 745 |
| | 775 |
| | 999 |
| | 982 |
|
| CMBS | 575 |
| | 583 |
| | 506 |
| | 513 |
| |
| Commercial mortgage-backed securities (CMBS) | | 402 |
| | 419 |
| | 542 |
| | 539 |
|
| Asset-backed securities | 835 |
| | 945 |
| | 831 |
| | 825 |
| 684 |
| | 720 |
| | 942 |
| | 1,068 |
|
| Foreign government securities | 261 |
| | 233 |
| | 290 |
| | 283 |
| |
| Non-U.S. government securities | | 230 |
| | 232 |
| | 298 |
| | 278 |
|
| Total fixed-maturity securities | 9,974 |
| | 10,233 |
| | 10,275 |
| | 10,627 |
| 8,371 |
| | 8,854 |
| | 9,884 |
| | 10,089 |
|
| Short-term investments | 590 |
| | 590 |
| | 396 |
| | 396 |
| 1,268 |
| | 1,268 |
| | 729 |
| | 729 |
|
| Total fixed-maturity and short-term investments | $ | 10,564 |
| | $ | 10,823 |
| | $ | 10,671 |
| | $ | 11,023 |
| $ | 9,639 |
| | $ | 10,122 |
| | $ | 10,613 |
| | $ | 10,818 |
|
____________________
| |
| (1) | Government-agencyU.S. government-agency obligations were approximately 42% of mortgage backed securities as of December 31, 20162019 and 54%48% as of December 31, 2015,2018, based on fair value.
|
The following tables summarize, for all fixed-maturity securities in an unrealized loss position as of December 31, 20162019 and December 31, 2015,2018, the aggregate fair value and gross unrealized loss by length of time the amounts have continuously been in an unrealized loss position.
Fixed-Maturity Securities
Gross Unrealized Loss by Length of Time
As of December 31, 20162019
| | | | Less than 12 months | | 12 months or more | | Total | Less than 12 months | | 12 months or more | | Total |
| | Fair Value | | Unrealized Loss | | Fair Value | | Unrealized Loss | | Fair Value | | Unrealized Loss | Fair Value | | Unrealized Loss | | Fair Value | | Unrealized Loss | | Fair Value | | Unrealized Loss |
| | (dollars in millions) | (dollars in millions) |
| Obligations of state and political subdivisions | $ | 1,110 |
| | $ | (38 | ) | | $ | 6 |
| | $ | (1 | ) | | $ | 1,116 |
| | $ | (39 | ) | $ | 45 |
| | $ | (1 | ) | | $ | — |
| | $ | — |
| | $ | 45 |
| | $ | (1 | ) |
| U.S. government and agencies | 87 |
| | (1 | ) | | — |
| | — |
| | 87 |
| | (1 | ) | 5 |
| | — |
| | 5 |
| | — |
| | 10 |
| | — |
|
| Corporate securities | 492 |
| | (11 | ) | | 118 |
| | (20 | ) | | 610 |
| | (31 | ) | 61 |
| | — |
| | 119 |
| | (19 | ) | | 180 |
| | (19 | ) |
| Mortgage-backed securities: | | | | | | | |
| | | | | | | | | | | |
| | | | |
| RMBS | 391 |
| | (23 | ) | | 94 |
| | (15 | ) | | 485 |
| | (38 | ) | 10 |
| | — |
| | 75 |
| | (7 | ) | | 85 |
| | (7 | ) |
| CMBS | 165 |
| | (5 | ) | | — |
| | — |
| | 165 |
| | (5 | ) | — |
| | — |
| | 4 |
| | — |
| | 4 |
| | — |
|
| Asset-backed securities | 36 |
| | 0 |
| | 0 |
| | 0 |
| | 36 |
| | 0 |
| 24 |
| | — |
| | 183 |
| | (2 | ) | | 207 |
| | (2 | ) |
| Foreign government securities | 44 |
| | (5 | ) | | 114 |
| | (27 | ) | | 158 |
| | (32 | ) | |
| Non-U.S. government securities | | — |
| | — |
| | 56 |
| | (5 | ) | | 56 |
| | (5 | ) |
| Total | $ | 2,325 |
| | $ | (83 | ) | | $ | 332 |
| | $ | (63 | ) | | $ | 2,657 |
| | $ | (146 | ) | $ | 145 |
| | $ | (1 | ) | | $ | 442 |
| | $ | (33 | ) | | $ | 587 |
| | $ | (34 | ) |
Number of securities(1) | |
| | 622 |
| | |
| | 60 |
| | |
| | 676 |
| |
| | 57 |
| | |
| | 119 |
| | |
| | 176 |
|
| Number of securities with other-than-temporary impairment | |
| | 8 |
| | |
| | 9 |
| | |
| | 17 |
| |
| Number of securities with OTTI | | |
| | 1 |
| | |
| | 7 |
| | |
| | 8 |
|
Fixed-Maturity Securities
Gross Unrealized Loss by Length of Time
As of December 31, 20152018
| | | | Less than 12 months | | 12 months or more | | Total | Less than 12 months | | 12 months or more | | Total |
| | Fair Value | | Unrealized Loss | | Fair Value | | Unrealized Loss | | Fair Value | | Unrealized Loss | Fair Value | | Unrealized Loss | | Fair Value | | Unrealized Loss | | Fair Value | | Unrealized Loss |
| | (dollars in millions) | (dollars in millions) |
| Obligations of state and political subdivisions | $ | 316 |
| | $ | (10 | ) | | $ | 7 |
| | $ | 0 |
| | $ | 323 |
| | $ | (10 | ) | $ | 195 |
| | $ | (4 | ) | | $ | 658 |
| | $ | (14 | ) | | $ | 853 |
| | $ | (18 | ) |
| U.S. government and agencies | 77 |
| | 0 |
| | — |
| | — |
| | 77 |
| | 0 |
| 11 |
| | — |
| | 24 |
| | (1 | ) | | 35 |
| | (1 | ) |
| Corporate securities | 381 |
| | (8 | ) | | 95 |
| | (15 | ) | | 476 |
| | (23 | ) | 836 |
| | (19 | ) | | 522 |
| | (33 | ) | | 1,358 |
| | (52 | ) |
| Mortgage-backed securities: | |
| | |
| | |
| | |
| | | | | |
| | |
| | |
| | |
| | | | |
| RMBS | 438 |
| | (8 | ) | | 90 |
| | (14 | ) | | 528 |
| | (22 | ) | 85 |
| | (2 | ) | | 447 |
| | (32 | ) | | 532 |
| | (34 | ) |
| CMBS | 140 |
| | (2 | ) | | 2 |
| | 0 |
| | 142 |
| | (2 | ) | 111 |
| | (1 | ) | | 164 |
| | (6 | ) | | 275 |
| | (7 | ) |
| Asset-backed securities | 517 |
| | (10 | ) | | — |
| | — |
| | 517 |
| | (10 | ) | 322 |
| | (4 | ) | | 38 |
| | (1 | ) | | 360 |
| | (5 | ) |
| Foreign government securities | 97 |
| | (4 | ) | | 82 |
| | (7 | ) | | 179 |
| | (11 | ) | |
| Non-U.S. government securities | | 83 |
| | (4 | ) | | 99 |
| | (18 | ) | | 182 |
| | (22 | ) |
| Total | $ | 1,966 |
| | $ | (42 | ) | | $ | 276 |
| | $ | (36 | ) | | $ | 2,242 |
| | $ | (78 | ) | $ | 1,643 |
| | $ | (34 | ) | | $ | 1,952 |
| | $ | (105 | ) | | $ | 3,595 |
| | $ | (139 | ) |
| Number of securities(1) | |
| | 335 |
| | |
| | 71 |
| | |
| | 396 |
| |
| Number of securities with other-than-temporary impairment | |
| | 9 |
| | |
| | 4 |
| | |
| | 13 |
| |
| Number of securities (1) | | |
| | 417 |
| | |
| | 608 |
| | |
| | 997 |
|
| Number of securities with OTTI (1) | | |
| | 22 |
| | |
| | 22 |
| | |
| | 42 |
|
___________________
| |
| (1) | The number of securities does not add across because lots consisting of the same securities have been purchased at different times and appear in both categories above (i.e., less than 12 months and 12 months or more). If a security appears in both categories, it is counted only once in the total column. |
Of the securities in an unrealized loss position for 12 months or more as of December 31, 2016, 412019 and December 31, 2018, 19 and 38 securities, respectively, had unrealized losses greater than 10% of book value. The total unrealized loss for these securities was $25 million as of December 31, 2016 was $59 million. As2019 and $43 million as of December 31, 2015, of2018. The Company considered the securitiescredit quality, cash flows, interest rate movements, ability to hold a security to recovery and intent to sell a security in an unrealized loss position for 12 months or more, nine securitiesdetermining whether a security had unrealized losses greater than 10% of book value with an unrealized loss of $26 million.a credit loss. The Company has determined that the unrealized losses recorded as of December 31, 20162019 and December 31, 20152018 were yieldnot related and not the result of other-than-temporary-impairment.to credit quality.
Changes in interest rates affect the value of the Company’s fixed-maturity portfolio. As interest rates fall, the fair value of fixed-maturity securities generally increases and as interest rates rise, the fair value of fixed-maturity securities generally decreases. The Company’s portfolio of fixed-maturity securities primarily consists primarily of high-quality, liquid instruments.
The amortized cost and estimated fair value of the Company’s available-for-sale fixed-maturity securities, by contractual maturity, are shown below. Expected maturities will differ from contractual maturities because borrowers may have the right to call or prepay obligations with or without call or prepayment penalties.
Distribution of Fixed-Maturity Securities
by Contractual Maturity
As of December 31, 2016 2019
| | | | Amortized Cost | | Estimated Fair Value | Amortized Cost | | Estimated Fair Value |
| | (in millions) | (in millions) |
| Due within one year | $ | 482 |
| | $ | 550 |
| $ | 326 |
| | $ | 334 |
|
| Due after one year through five years | 1,725 |
| | 1,727 |
| 1,538 |
| | 1,591 |
|
| Due after five years through 10 years | 2,112 |
| | 2,155 |
| 2,022 |
| | 2,128 |
|
| Due after 10 years | 4,082 |
| | 4,231 |
| 3,338 |
| | 3,607 |
|
| Mortgage-backed securities: | |
| | |
| |
| | |
|
| RMBS | 998 |
| | 987 |
| 745 |
| | 775 |
|
| CMBS | 575 |
| | 583 |
| 402 |
| | 419 |
|
| Total | $ | 9,974 |
| | $ | 10,233 |
| $ | 8,371 |
| | $ | 8,854 |
|
The following table summarizes the ratings distributions of the Company’s investment portfolio as of December 31, 20162019 and December 31, 20152018. Ratings reflect the lower of the Moody’s and S&P classifications, except for bonds purchased for loss mitigation or other risk management strategies, which use Assured Guaranty’s internal ratings classifications.
Distribution of
Fixed-Maturity Securities by Rating
| | | Rating | | As of
December 31, 2016 | | As of
December 31, 2015 | | As of
December 31, 2019 | | As of
December 31, 2018 |
| AAA | | 11.6 | % | | 10.8 | % | | 16.2 | % | | 15.7 | % |
| AA | | 54.8 |
| | 59.0 |
| | 45.1 |
| | 48.2 |
|
| A | | 17.9 |
| | 17.6 |
| | 21.2 |
| | 19.8 |
|
| BBB | | 1.9 |
| | 0.9 |
| | 8.2 |
| | 5.0 |
|
| BIG(1) | | 13.5 |
| | 11.4 |
| |
| BIG (1) | | | 8.6 |
| | 10.8 |
|
| Not rated | | 0.3 |
| | 0.3 |
| | 0.7 |
| | 0.5 |
|
| Total | | 100.0 | % | | 100.0 | % | | 100.0 | % | | 100.0 | % |
____________________
| |
| (1) | ComprisedIncludes primarily of loss mitigation and other risk management assets. See Part II, Item 8, Financial Statements and Supplementary Data, Note 10, Investments and Cash.Cash, for additional information. |
The investment portfolio contains securitiesBased on fair value, investments and cashrestricted assets that are either held in trust for the benefit of third party reinsurersceding insurers in accordance with statutory requirements, invested in a guaranteed investment contract for future claims payments, placed on deposit to fulfill state licensing requirements, or otherwise pledged or restricted in the amount of $285totaled $280 million and $283$266 million, based on fair value, as of December 31, 20162019 and December 31, 2015,2018, respectively. The investment portfolio also contains securities that are held in trust by certain AGL subsidiaries or otherwise restricted for the
benefit of other AGL subsidiaries in accordance with statutory and regulatory requirements in the amount of $1,420$1,502 million and $1,411$1,855 million, based on fair value, as of December 31, 20162019 and December 31, 2015,2018, respectively.
Consolidated VIEs
The fair valueCompany manages its liquidity needs by evaluating cash flows without the effect of consolidated VIEs, however, the Company’s pledged securities to secure its obligations under its CDS exposure totaled $116 millionCompany's consolidated financial statements reflect the financial position of Assured Guaranty as well as Assured Guaranty's consolidated VIEs. The primary sources and $305 millionuses of cash at Assured Guaranty's consolidated VIEs are as follows:
FG VIEs. The primary sources of December 31, 2016cash in FG VIEs are the collection of principal and December 31, 2015, respectively. In February 2017, the Company terminated substantially all of its remaining CDS contracts with one of its counterparties and all ofinterest on the collateral thatsupporting its insured debt obligations, and the Company had been posting to that counterparty is being returned toprimary uses of cash are the Company. See Part II, Item 8, Financial Statementspayment of principal and Supplementary Data, Note 8, Contracts Accounted for as Credit Derivatives.interest due on the insured obligations.
Liquidity Arrangements with respect to AGMH’s former Financial Products Business
AGMH’s former financial products segment had beenInvestment Vehicles. The primary sources and uses of cash in the business of borrowing funds through the issuance of GICs and medium term notes and reinvesting the proceeds in investments that met AGMH’sconsolidated investment criteria. The financial products business also included the equity payment undertaking agreement portion of the leveraged lease business, as described further below in “—Leveraged Lease Business.”
The GIC Business
Until November 2008, AGMH, through its financial products business, offered GICs to municipalities and other market participants. The GICs were issued through certain non-insurance subsidiaries of AGMH. In return for an initial payment, each GIC entitles its holder to receive the return of the holder’s invested principal plus interest at a specified rate, and to withdraw principalvehicles are raising capital from the GIC as permitted by its terms. AGM insures the payment obligations on all these GICs. The proceeds of GICs were loaned to AGMH’s former subsidiary FSA Asset Management LLC (FSAM). FSAM in turn invested these funds in fixed-income obligations (the FSAM assets). As of December 31, 2016, approximately 25% of the FSAM assets (measured by aggregate principal balance) were in cash or were obligations backed by the full faith and credit of the U.S. AGM’s insurance policies on the GICs remain in place, and must remain in place until each GIC is terminated, even though AGMH no longer holds any ownership interest in FSAM or the GIC issuers.
In June 2009, in connection with the Company's acquisition of AGMH from Dexia Holdings Inc., Dexia SA, the ultimate parent of Dexia Holdings Inc., and certain of its affiliates, entered into a number of agreements intended to mitigate the credit, interest rate and liquidity risks associated with the GIC business and the related AGM insurance policies. Some of those agreements have since terminated or expired, or been modified.
To support the primary payment obligations under the GICs, each of Dexia SA and Dexia Crédit Local S.A. are party to a put contract. Pursuant to the put contract, FSAM may put an amount of its FSAM assets to Dexia SA and Dexia Crédit Local S.A. in exchange for funds that FSAM would in turn make available to meet demands for payment under the GICs. To secure their obligations under this put contract, Dexia SA and Dexia Crédit Local S.A. are required to post eligible highly liquid collateral having an aggregate value (subject to agreed reductions and advance rates) equal to at least the excess of (i) the aggregate principal amount of all outstanding GICs over (ii) the aggregate mark-to-market value of FSAM’s assets.
As of December 31, 2016, the aggregate accreted GIC balance was approximately $1.5 billion, compared with approximately $10.2 billion as of December 31, 2009. As of December 31, 2016, the aggregate fair market value of the assets supporting the GIC business (disregarding the agreed upon reductions) plus cash and positive derivative value exceeded by nearly $0.8 billion the aggregate principal amount of all outstanding GICs and certain other business and hedging costs of the GIC business. Even after applying the agreed upon reductions to the fair market value of the assets, the aggregate value of the assets supporting the GIC business plus cash and positive derivative value exceeded the aggregate principal amount of all outstanding GICs and certain other business and hedging costs of the GIC business. Accordingly, no posting of collateral was required under the primary put contract.
To provide additional support, Dexia Crédit Local S.A. provides a liquidity commitment to FSAM to lend against FSAM assets under a revolving credit agreement. As of December 31, 2016, the commitment totaled $1.4 billion, of which approximately $0.8 billion was drawn. The agreement requires the commitment remain in place, generally until the GICs have been paid in full.
Despite the put contract and revolving credit agreement, and the significant portion of FSAM assets comprised of highly liquid securities backed by the full faith and credit of the United States, AGM remains subject to the risk that Dexia SA and its affiliates may not fulfill their contractual obligations. In that case, the GIC issuers may not have the financial ability to pay upon the withdrawal of GIC funds or post collateral or make other payments in respect of the GICs, thereby resulting in claims upon the AGM financial guaranty insurance policies.
A downgrade of the financial strength rating of AGM could trigger a payment obligation of AGM in respect to AGMH's former GIC business. Most GICs insured by AGM allow for the termination of the GIC contract and a withdrawal of GIC funds at the option of the GIC holder in the event of a downgrade of AGM below a specified threshold, generally below A- by S&P or A3 by Moody's. FSAM is expected to have sufficient eligible and liquid assets to satisfy any expected withdrawal and collateral posting obligations resulting from future rating actions affecting AGM.
The Medium Term Notes Business
In connection with the acquisition of AGMH, Dexia Crédit Local S.A. agreed to fund, on behalf of AGM, 100% of all policy claims made under financial guaranty insurance policies issued by AGM in relation to the medium term notes issuance program of FSA Global Funding Limited. As of December 31, 2016, FSA Global Funding Limited had approximately $560 million of medium term notes outstanding.
Leveraged Lease Business
Under the Strip Coverage Facility entered into in connection with the acquisition of AGMH, Dexia Credit Local (NY) agreedinvestors, using capital to make loansinvestments, generating cash flows from operations, distributing cash flow to AGMinvestors and issuing debt to finance all draws made by lessors on certain AGM strip policies issued in connection with the leveraged lease business. The leveraged lease business, the AGM strip policies and the Strip Coverage Facility are described further under "Commitments and Contingencies-Recourse Credit Facility" above. There have never been any borrowings under the Strip Coverage Facility, the amount of the leveraged leases covered by the Strip Coverage Facility has declined since July 1, 2009 and, to date, none of the leveraged lease transactions in which AGM acts as the strip coverage provider has experienced an early termination due to a lease default. Consequently, and in view of the credit quality of the relevant tax-exempt entities and the cost of the Strip Coverage Facility, the Company determined that maintaining the Strip Coverage Facility was no longer warranted. On July 29, 2016, the parties terminated the Strip Coverage Facility.investments (CLOs).
| |
| ITEM 7A. | QUANTITATIVE AND QUALITATIVE DISCLOSURES ABOUT MARKET RISK |
Market risk is the risk of loss due to adverse changesfactors that affect the overall performance of the financial markets or moves in earnings, cash flow or fair value.market prices. The Company's primary market risk exposures in respect of market risk sensitive instruments include interest rate risk, foreign currency exchange rate risk and credit spread risk. The Company's primary exposure to market risk, is summarized below:and primarily affect the following areas.
The fair value of credit derivatives within the financial guaranty portfolio of insured obligations which fluctuatefluctuates based on changes in credit spreads of the underlying obligations and the Company's own credit spreads.
The fair value of the investment portfolio is primarily driven by changes in interest rates and also affected by changes in credit spreads.
The fair value of the investment portfolio contains foreign denominated securities whose value fluctuates based on changes in foreign exchange rates.
The carrying value of premiums receivable include foreign denominated receivables whose value fluctuates based on changes in foreign exchange rates.
The fair value of the assets and liabilities of consolidated FG VIE'sVIEs may fluctuate based on changes in prepaymentprepayments, spreads, default rates, interest rates, and house price depreciation/appreciation. The fair value of the FG VIEVIEs’ liabilities would also fluctuate based on changes in the Company's credit spread.
Asset management revenues are sensitive to changes in the fair value of investments.
The fair value of consolidated investment vehicles are sensitive to changes in market risk.
Sensitivity of Credit Derivatives to Credit Risk
Unrealized gains and losses on credit derivatives are a function of changes in the estimated fair value of the Company's credit derivative contracts. If credit spreads of the underlying obligations change,and the fair value of the relatedCompany's own credit derivative changes.spread. Market liquidity could also impact valuations of the underlying obligations. The Company considers the impact of its own credit risk, together with credit spreads on the riskexposures that it insured through CDS contracts, in determining their fair value.
The Company determines its own credit risk based on quoted CDS prices traded on the CompanyAGC at each balance sheet date. The quoted price of five-year CDS contracts traded on AGC at December 31, 20162019 and December 31, 20152018 was 15841 bps and 376110 bps, respectively. The quoted priceMovements in AGM's CDS prices no longer have a significant impact on the estimated fair value of five-yearthe Company's credit derivative contracts due to the relatively low volume and characteristics of CDS contracts traded on AGM at December 31, 2016 and December 31, 2015 was 158 bps and 366 bps, respectively. remaining in AGM's portfolio.
Historically, the price of CDS traded on AGC and AGM movesmoved directionally the same as general market spreads, although this may not always be the case. An overall narrowing of spreads generally results in an unrealized gain on credit derivatives for the Company, and an overall widening of spreads generally results in an unrealized loss for the Company. In certain circumstances, due to the fact that spread movements are not perfectly correlated, the narrowing or widening of the price of CDS traded on AGC and AGM can have a more significant financial statement impact than the changes in underlying collateral prices.risks it assumes.
The impact of changes in credit spreads will vary based upon the volume, tenor, interest rates, and other market conditions at the time these fair values are determined. In addition, since each transaction has unique collateral and structural
terms, the underlying change in fair value of each transaction may vary considerably. The fair value of credit derivative contracts also reflects the change in the Company's own credit cost, based on the price to purchase credit protection on AGC and AGM.AGC.
TheIn the Company’s valuation model, the premium the Company generally holds these credit derivative contractscaptures is not permitted to maturity. Thego below the minimum rate that the Company would currently charge to assume similar risks. This assumption can have the effect of mitigating the amount of unrealized gains that are recognized on certain CDS contracts. Given market conditions and lossesthe Company’s own credit spreads, approximately 17% based on derivative financial instruments will reducefair value, of the Company's CDS contracts were fair valued using this minimum premium as of December 31, 2018. As of December 31, 2019, the corresponding number was de minimis. The percentage of transactions that price using the minimum premiums fluctuates due to zero aschanges in AGC's credit spreads. In general, when AGC's credit spreads narrow, the exposure approaches its maturity date, unless there is a payment default oncost to hedge AGC's name declines and more transactions price above previously established floor levels. Meanwhile, when AGC's credit spreads widen, the exposure or early termination. Given these facts, the Company does not activelycost to hedge these exposures.AGC's name increases causing more transactions to price at established floor levels.
The following table summarizes the estimated change in fair values on the net balance of the Company’s credit derivative positions assuming immediate parallel shifts in credit spreads on AGC and AGM and on the risks that they both assume.
Effect of Changes in Credit Spread
|
| | | | | | | | | | | | | | | | |
| | | As of December 31, 2016 | | As of December 31, 2015 |
| Credit Spreads(1) | | Estimated Net Fair Value (Pre-Tax) | | Estimated Change in Gain/(Loss) (Pre-Tax) | | Estimated Net
Fair Value
(Pre-Tax) | | Estimated Change
in Gain/(Loss)
(Pre-Tax) |
| | (in millions) |
| 100% widening in spreads | $ | (791 | ) | | $ | (402 | ) | | $ | (742 | ) | | $ | (377 | ) |
| 50% widening in spreads | (590 | ) | | (201 | ) | | (554 | ) | | (189 | ) |
| 25% widening in spreads | (490 | ) | | (101 | ) | | (460 | ) | | (95 | ) |
| 10% widening in spreads | (430 | ) | | (41 | ) | | (403 | ) | | (38 | ) |
| Base Scenario | (389 | ) | | — |
| | (365 | ) | | — |
|
| 10% narrowing in spreads | (351 | ) | | 38 |
| | (330 | ) | | 35 |
|
| 25% narrowing in spreads | (295 | ) | | 94 |
| | (277 | ) | | 88 |
|
| 50% narrowing in spreads | (203 | ) | | 186 |
| | (190 | ) | | 175 |
|
|
| | | | | | | | | | | | | | | | |
| | | As of December 31, 2019 | | As of December 31, 2018 |
| Credit Spreads (1) | | Estimated Net Fair Value (Pre-Tax) | | Estimated Change in Gain/(Loss) (Pre-Tax) | | Estimated Net
Fair Value
(Pre-Tax) | | Estimated Change
in Gain/(Loss)
(Pre-Tax) |
| | (in millions) |
| Increase of 25 bps | $ | (315 | ) | | $ | (130 | ) | | $ | (348 | ) | | $ | (141 | ) |
| Base Scenario | (185 | ) | | — |
| | (207 | ) | | — |
|
| Decrease of 25 bps | (97 | ) | | 88 |
| | (143 | ) | | 64 |
|
| All transactions priced at floor | (56 | ) | | 129 |
| | (101 | ) | | 106 |
|
____________________
| |
| (1) | Includes the effects of spreads on both the underlying asset classes and the Company's own credit spread. |
Sensitivity of Investment Portfolio to Interest Rate Risk
Interest rate risk is the risk that financial instruments' values will change due to changes in the level of interest rates, in the spread between two rates, in the shape of the yield curve or in any other interest rate relationship. The Company is exposed to interest rate risk primarily in its investment portfolio. As interest rates rise for an available-for-sale investment portfolio, the fair value of fixed‑income securities generally decreases; as interests rates fall for an available-for-sale portfolio, the fair value of fixed-income securities generally increases. The Company's policy is generally to hold assets in the investment portfolio to maturity. Therefore, barring credit deterioration, interest rate movements do not result in realized gains or losses unless assets are sold prior to maturity. The Company does not hedge interest rate risk, however,risk; instead, interest rate fluctuation risk is managed through the investment guidelines which limit duration and preventprohibit investment in historically high volatility sectors.
Interest rate sensitivity in the investment portfolio can be estimated by projecting a hypothetical instantaneous increase or decrease in interest rates. The following table presents the estimated pre-tax change in fair value of the Company's fixed-maturity securities and short-term investments from instantaneous parallel shifts in interest rates.
Sensitivity to Change in Interest Rates on the Investment Portfolio
|
| | | | | | | | | | | | | | | | | | | | | | | |
| | Increase (Decrease) in Fair Value from Changes in Interest Rates |
| | 300 Basis Point Decrease | | 200 Basis Point Decrease | | 100 Basis Point Decrease | | 100 Basis Point Increase | | 200 Basis Point Increase | | 300 Basis Point Increase |
| | (in millions) |
| December 31, 2016 | $ | 1,215 |
| | $ | 957 |
| | $ | 537 |
| | $ | (528 | ) | | $ | (1,063 | ) | | $ | (1,578 | ) |
| December 31, 2015 | 1,561 |
| | 1,107 |
| | 568 |
| | (557 | ) | | (1,094 | ) | | (1,607 | ) |
|
| | | | | | | | | | | | | | | | | | | | | | | |
| | Increase (Decrease) in Fair Value from Changes in Interest Rates |
| | 300 Basis Point Decrease | | 200 Basis Point Decrease | | 100 Basis Point Decrease | | 100 Basis Point Increase | | 200 Basis Point Increase | | 300 Basis Point Increase |
| | (in millions) |
| December 31, 2019 | $ | 641 |
| | $ | 624 |
| | $ | 404 |
| | $ | (420 | ) | | $ | (852 | ) | | $ | (1,295 | ) |
| December 31, 2018 | $ | 1,226 |
| | $ | 1,029 |
| | $ | 552 |
| | $ | (465 | ) | | $ | (996 | ) | | $ | (1,525 | ) |
Sensitivity of Other Areas to Interest Rate Risk
Insurance
Fluctuation in interest rates also affects the demand for the Company's product. When interest rates are lower or when the market is otherwise relatively less risk averse, the spread between insured and uninsured obligations typically narrows and, as a result, financial guaranty insurance typically provides lower cost savings to issuers than it would during periods of relatively wider spreads. These lower cost savings generally lead to a corresponding decrease in demand and premiums obtainable for financial guaranty insurance. Changes in interest rates also impact the amount of our losses and could impact the amount of infrastructure exposures that can be refinanced in the future. In addition, increases in prevailing interest rate levels can lead to a decreased volume of capital markets activity and, correspondingly, a decreased volume of insured transactions. Changes in interest rates also impact the amount of losses in the future.
In addition, fluctuations in interest rates also impact the performance of insured transactions where there are differences between the interest rates on the underlying collateral and the interest rates on the insured securities. For example, a rise in interest rates could increase the amount of losses the Company projects for certain RMBS Triple-X life insurance securitizations,and student loan transactions and TruPS CDOs.transactions. The impact of fluctuations in interest rates on such transactions varies, depending on, among other things, the interest rates on the underlying collateral and insured securities, the relative amounts of underlying collateral and liabilities, the structure of the transaction, and the sensitivity to interest rates of the behavior of the underlying borrowers and the value of the underlying assets.
In the case of RMBS, fluctuations in interest rates impact the amount of periodic excess spread, which is created when a trust’s assets produce interest that exceeds the amount required to pay interest on the trust’s liabilities. There are several RMBS transactions in ourthe Company's insured portfolio which benefit from excess spread either by covering losses in a particular period or reimbursing past claims under ourthe Company's policies. As of December 31, 2016,2019, the Company projects approximately $225$114 million of excess spread for all of its RMBS transactions over their remaining lives.
Since RMBS excess spread is determined by the relationship between interest rates on the underlying collateral and the trust’s certificates, it can be affected by unmatched moves in either of these interest rates. Additionally, faster than expected prepayments can decrease the dollar amount of excess spread and therefore reduce the cash flow available to cover losses or reimburse past claims. Further,For example, modifications to underlying mortgage rates (e.g. rate reductions for troubled borrowers) can reduce excess spread since there would be no equivalent decrease in the certificate interest rates of the trust's certificates. Similarly,because an upswing in short-term rates that increases the trust’s certificate interest rate that is not met with equal increases to the interest rates on the underlying mortgages can decrease excess spread. These potential reductions in excess spread are often mitigated by an interest rate cap, which goes into effect once the collateral rate falls below the stated certificate rate. MostInterest due on most of the RMBS securities we insurethe Company insures are capped at the collateral rate. The Company is not obligated to pay additional claims becausewhen the collateral interest rate drops below the trust's certificate stated interest rate, rather this just causes the Company to lose the benefit of potential positive excess spread. Additionally, faster than expected prepayments can decrease the dollar amount of excess spread and therefore reduce the cash flow available to cover losses or reimburse past claims.
Interest Expense
Beginning in the fourth quarter of 2016, fluctuationFluctuations in interest rates also impactsimpact the Company’s interest expense. On December 15, 2016, theThe series A enhanced junior subordinated debentures issued by AGUS began to accrueaccrues interest at a floating rate, reset quarterly, equal to three month London Interbank Offered Rate (3-month LIBOR)three-month LIBOR plus a margin equal to 2.38% (prior to December 15, 2016, the debentures paid a fixed 6.4% rate. Three-month LIBOR of interest). The 3-month LIBOR rate1.89% and 2.79% were used for the interest rate resets for December 15, 2016 interest rate reset is 0.96%.2019 and December 15, 2018, respectively. Increases to 3-monththree-month LIBOR will cause the Company’s interest expense to rise while decreases to 3-monththree month LIBOR will lower the Company’s interest expense. If 3-monthFor example, if three-month LIBOR increases by 70%,
100 bps, the Company’s annual interest expense will increase by approximately $1$1.5 million. Conversely, if 3-monththree-month LIBOR decreases by 70%,100 bps, the Company’s annual interest expense will decrease by approximately $1$1.5 million. LIBOR may be discontinued. See the Risk Factor captioned "The Company may be adversely impacted by the transition from LIBOR as a reference rate" under Operational Risks in Part I, Item 1A, Risk Factors.
Sensitivity of Investment Portfolio to Foreign Exchange Rate Risk
Foreign exchange risk is the risk that a financial instrument's value will change due to a change in the foreign currency exchange rates. The Company has foreign denominated securities in its investment portfolio.portfolio as well as foreign denominated premium receivables. The Company's material exposure is to changes in U.S. dollar/pound sterling and U.S. dollar/euro exchange rates. Securities denominated in currencies other than U.S. Dollardollar were 4.7%8.5% and 4.9%7.4% of the fixed-maturity securities and short-term investments as of December 31, 20162019 and 2015,2018, respectively. The Company's material exposure is to changes in the dollar/pound sterling exchange rate. Changes in fair value of available-for-sale investments attributable to changes in foreign exchange rates are recorded in OCI.
Sensitivity to Change Approximately 78% and 72% of installment premiums at December 31, 2019 and December 31, 2018, respectively, are denominated in Foreign Exchange Rates oncurrencies other than the Investment Portfolio
|
| | | | | | | | | | | | | | | | | | | | | | | |
| | Increase (Decrease) in Fair Value from Changes in Foreign Exchange Rates |
| | 30% Decrease | | 20% Decrease | | 10% Decrease | | 10% Increase | | 20% Increase | | 30% Increase |
| | (in millions) |
| December 31, 2016 | $ | (153 | ) | | $ | (102 | ) | | $ | (51 | ) | | $ | 51 |
| | $ | 102 |
| | $ | 153 |
|
| December 31, 2015 | (163 | ) | | (108 | ) | | (54 | ) | | 54 |
| | 108 |
| | 163 |
|
Sensitivity of Premiums Receivable to Foreign Exchange Rate Risk
The Company has foreign denominated premium receivables. The Company's material exposure is to changes in dollar/U.S. dollar, primarily the pound sterling and dollar/euro exchange rates.euro.
Sensitivity to Change in Foreign Exchange Rates
|
| | | | | | | | | | | | | | | | | | | | | | | |
| | Increase (Decrease) in Carrying Value from Changes in Foreign Exchange Rates |
| | 30% Decrease | | 20% Decrease | | 10% Decrease | | 10% Increase | | 20% Increase | | 30% Increase |
| | (in millions) |
| Investment Portfolio: | | | | | | | | | | | |
| December 31, 2019 | $ | (257 | ) | | $ | (171 | ) | | $ | (86 | ) | | $ | 86 |
| | $ | 171 |
| | $ | 257 |
|
| December 31, 2018 | (239 | ) | | (159 | ) | | (80 | ) | | 80 |
| | 159 |
| | 239 |
|
| | | | | | | | | | | | |
| Premium Receivables: | | | | | | | | | | | |
| December 31, 2019 | (301 | ) | | (201 | ) | | (100 | ) | | 100 |
| | 201 |
| | 301 |
|
| December 31, 2018 | (192 | ) | | (128 | ) | | (64 | ) | | 64 |
| | 128 |
| | 192 |
|
Sensitivity of Asset Management Fees to Changes in Fair Value of Assured Investment Management Managed Investments
In the ordinary course of business, Assured Investment Management may manage a variety of risks, including market risk, credit risk, liquidity risk, foreign exchange risk and interest rate risk. The Company identifies, measures and monitors risk through various control mechanisms, including, but not limited to, monitoring and diversifying exposures and activities across a variety of instruments, markets and counterparties.
At December 31, 2019, the majority of the Company’s investment advisory fees were management fees based on Premium Receivable, NetAUM of Reinsurancethe applicable funds the Company manages. Movements in credit markets, equity market prices, interest rates, foreign exchange rates, or all of these could cause the value of AUM to fluctuate, the returns realized on AUM to change, and clients to reallocate assets away from the Company, which could result in lower management fees.
In addition to management fees, the Company's asset management fees are also comprised of performance fees generally expressed as a percentage of the returns on AUM. Movements in credit markets, equity market prices, interest rates or foreign exchange rates could cause the value of AUM to fluctuate, the returns realized on AUM to change, and clients to reallocate assets away from the Company, which could result in lower performance fees.
Management believes that investment performance is one of the most important factors for the growth and retention of AUM. Poor investment performance relative to applicable portfolio benchmarks and to competitors could reduce revenues and growth because existing clients might withdraw funds in favor of better performing products, which could reduce the ability to attract funds; and could result in lower asset management revenues.
The following table presents the pre-tax decline in asset management fees from a 10% decline in fair value of Assured Investment Management managed investments.
|
| | | | | | | | | | | | | | | | | | | | | | | |
| | Increase (Decrease) in Premium Receivable from Changes in Foreign Exchange Rates |
| | 30% Decrease | | 20% Decrease | | 10% Decrease | | 10% Increase | | 20% Increase | | 30% Increase |
| | (in millions) |
| December 31, 2016 | $ | (77 | ) | | $ | (52 | ) | | $ | (26 | ) | | $ | 26 |
| | $ | 52 |
| | $ | 77 |
|
| December 31, 2015 | (96 | ) | | (64 | ) | | (32 | ) | | 32 |
| | 64 |
| | 96 |
|
|
| | | | | | | | | | | |
| | Sensitivity to Changes in Fair Value |
| | Year Ended December 31, 2019 |
| | Management Fees | | Performance Fees | | Total |
| | (in millions) |
| | | | | | |
| 10% Decline in fair value of Assured Investment Management manged investments gain (loss) | $ | (2 | ) | | $ | (4 | ) | | $ | (6 | ) |
Sensitivity of FG VIEVIEs’ Assets and Liabilities to Market Risk
The fair value of the Company’s FG VIEVIEs’ assets is generally sensitive to changes related to estimated prepayment speeds; estimated default rates (determined on the basis of an analysis of collateral attributes such as: historical collateral performance, borrower profiles and other features relevant to the evaluation of collateral credit quality); discount ratesyields implied by market prices for similar securities; and house price depreciation/appreciation rates based on macroeconomic forecasts. Significant changes to some of these inputs could materially change the market value of the FG VIE’sVIEs’ assets and the implied collateral losses within the transaction. In general, the fair value of the FG VIE assetVIEs’ assets is most sensitive to changes in the projected collateral losses, where an increase in collateral losses typically leads to a decrease in the fair value of FG VIEVIEs’ assets, while a decrease in collateral losses typically leads to an increase in the fair value of FG VIEVIEs’ assets. These factors also directly impactThe third-party pricing provider utilizes an internal model to determine an appropriate yield at which to discount the cash flows of the security, by factoring in collateral types, weighted-average lives, and other structural attributes specific to the security being priced. The expected yield is further calibrated by utilizing algorithms designed to aggregate market color, received by the independent third-party, on comparable bonds.
The models to price the FG VIEs’ liabilities used, where appropriate, the same inputs used in determining fair value of FG VIEs’ assets and, for those liabilities insured by the Company’s FG VIE liabilities.Company, the benefit from the Company's insurance policy guaranteeing the timely payment of principal and interest, taking into account the Company's own credit risk.
The fair value of the Company’s FG VIE liabilities is generally sensitive to the various model inputs described above. In addition, the Company’s FG VIE liabilities with recourse are also sensitive to changes in the Company’s implied credit worthiness. Significant changes to anycertain of thesethe inputs described above could materially change the timing of expected losses within the insured transaction which is a significant factor in determining the implied benefit from the Company’s insurance policy guaranteeing the timely payment of principal and interest for the tranches of debt issued by the FG VIEVIEs that is insured by the Company. In general, extending the timing of expected loss payments by the Company into the future typically leads to a decrease in the value of the Company’s insurance and a decrease in the fair value of the Company’s FG VIEVIEs’ liabilities with recourse, while a shortening of the timing of expected loss payments by the Company typically leads to an increase in the value of the Company’s insurance and an increase in the fair value of the Company’s FG VIEVIEs’ liabilities with recourse.
Sensitivity of Consolidated Investment Vehicles to Market Risk
The fair value of the Company’s consolidated CLOs is generally sensitive to changes related to estimated prepayment speeds; estimated default rates (determined on the basis of an analysis of collateral attributes such as: historical collateral performance, borrower profiles and other features relevant to the evaluation of collateral credit quality); reinvestment assumptions; yields implied by market prices for similar securities; changes to the market prices of similar loans held by the CLOs. Significant changes to some of these inputs could materially change the market value of the consolidated CLOs as these are all inputs used to project and discount future cashflows.
The fair value of the Company’s consolidated Assured Investment Management funds is generally sensitive to changes in prices of comparable or similar investments; changes in financial projections of subject companies; changes in company specific risk premium, changes in the risk free rate of return; changes in equity risk premium; and new information obtained from issuers. These inputs are used in applying the various valuation techniques and broadly refer to the current assumptions that market participants use to make valuation decisions, including assumptions about risk.
Item 8. FINANCIAL STATEMENTS AND SUPPLEMENTARY DATA
Report of Independent Registered Public Accounting Firm
TotheBoard of Directors and Shareholders of Assured Guaranty Ltd.:
In our opinion,Opinions on the Financial Statements and Internal Control over Financial Reporting
We have audited the accompanying consolidated balance sheets of Assured Guaranty Ltd. and its subsidiaries (the “Company”)as of December 31, 2019and2018,and the related consolidated statements of operations, of comprehensive income, of shareholders’ equity and of cash flowsfor each of the three years in the period ended December 31, 2019, including the related notes (collectively referred to as the “consolidated financial statements”).We also have audited the Company's internal control over financial reporting as of December 31, 2019, based on criteria established in Internal Control - Integrated Framework(2013)issued by the Committee of Sponsoring Organizations of the Treadway Commission (COSO).
In our opinion, the consolidatedfinancial statements referred to above present fairly, in all material respects, the financial position of Assured Guaranty Ltd. and its subsidiariesatthe Company as of December 31, 2016 2019and December 31, 2015, 2018, and the results of theiritsoperations and their itscash flows for each of the three years in the period endedDecember 31, 20162019in conformity with accounting principles generally accepted in the United States of America. In addition,Also in our opinion, the Company maintained, in all material respects, effective internal control over financial reporting as of December 31, 2016,2019, based on criteria established in the 2013 Internal Control - Integrated Framework(2013)issued by the Committee of Sponsoring Organizations of the Treadway Commission (COSO). COSO.
Basis for Opinions
The Company's management is responsible for these consolidated financial statements, for maintaining effective internal control over financial reporting, and for its assessment of the effectiveness of internal control over financial reporting, included in the accompanying Management'sManagement’s Report on Internal Control over Financial Reporting.Reporting appearing under Item 9A. Our responsibility is to express opinions on these the Company’s consolidatedfinancial statements and on the Company's internal control over financial reporting based on our integrated audits. We are a public accounting firm registered with the Public Company Accounting Oversight Board (United States) (PCAOB) and are required to be independent with respect to the Company in accordance with the U.S. federal securities laws and the applicable rules and regulations of the Securities and Exchange Commission and the PCAOB.
We conducted our audits in accordance with the standards of the Public Company Accounting Oversight Board (United States).PCAOB. Those standards require that we plan and perform the audits to obtain reasonable assurance about whether the consolidated financial statements are free of material misstatement, whether due to error or fraud, and whether effective internal control over financial reporting was maintained in all material respects.
Our audits of the consolidatedfinancial statements included performing procedures to assess the risks of material misstatement of the consolidatedfinancial statements, whether due to error or fraud, and performing procedures that respond to those risks. Such procedures included examining, on a test basis, evidence supportingregarding the amounts and disclosures in the consolidatedfinancial statements, assessingstatements. Our audits also included evaluating the accounting principles used and significant estimates made by management, andas well as evaluating the overall presentation of the consolidated financial statement presentation.statements. Our audit of internal control over financial reporting included obtaining an understanding of internal control over financial reporting, assessing the risk that a material weakness exists, and testing and evaluating the design and operating effectiveness of internal control based on the assessed risk. Our audits also included performing such other procedures as we considered necessary in the circumstances. We believe that our audits provide a reasonable basis for our opinions.
As described in Management’s Report on Internal Control over Financial Reporting, management has excluded BlueMountain Capital Management, LLC (“BlueMountain”) and its associated entities from its annual assessment of internal control over financial reporting as of December 31, 2019 because it was acquired by the Company in a purchase business combination during 2019. We have also excluded BlueMountain from our audit of internal control over financial reporting. BlueMountain is a wholly-owned subsidiary whose total assets and total revenues excluded from management’s assessment and our audit of internal control over financial reporting represent approximately 2% and 3%, respectively, of the related consolidated financial statement amounts as of and for the year ended December 31, 2019.
Definition and Limitations of Internal Control over Financial Reporting
A company’s internal control over financial reporting is a process designed to provide reasonable assurance regarding the reliability of financial reporting and the preparation of financial statements for external purposes in accordance with generally accepted accounting principles. A company’s internal control over financial reporting includes those policies and procedures that (i) pertain to the maintenance of records that, in reasonable detail, accurately and fairly reflect the transactions
and dispositions of the assets of the company; (ii) provide reasonable assurance that transactions are recorded as necessary to permit preparation of financial statements in accordance with generally accepted accounting principles, and that receipts and expenditures of the company are being made only in accordance with authorizations of management and directors of the company; and (iii) provide reasonable assurance regarding prevention or timely detection of unauthorized acquisition, use, or disposition of the company’s assets that could have a material effect on the financial statements.
Because of its inherent limitations, internal control over financial reporting may not prevent or detect misstatements. Also, projections of any evaluation of effectiveness to future periods are subject to the risk that controls may become inadequate because of changes in conditions, or that the degree of compliance with the policies or procedures may deteriorate.
Critical Audit Matters
The critical audit matters communicated beloware mattersarising from the current period audit of the consolidated financial statements that were communicated or required to be communicated to the audit committee and that (i) relate to accounts or disclosures that are material to theconsolidated financial statements and (ii) involved our especially challenging, subjective, or complex judgments. The communication of critical audit matters does not alter in any way our opinion on the consolidatedfinancial statements, taken as a whole, and we are not, by communicating the critical audit matters below, providing separate opinions on the critical audit matters or on the accounts or disclosures to which they relate.
Valuation of Loss and Loss Adjustment Expense (LAE) Reserve and Salvage and Subrogation Recoverable - Estimation of the Expected Loss to be Paid
As described in Notes 6 and 7 to the consolidated financial statements, the loss and LAE reserve and the salvage and subrogation recoverable reported on the consolidated balance sheet relate only to direct and assumed reinsurance contracts that are accounted for as insurance, substantially all of which are financial guaranty insurance contracts. As of December 31, 2019, loss and LAE reserve was $1.0 billion and salvage and subrogation recoverable was $747 million. A loss and LAE reserve for a financial guaranty insurance contract is recorded only to the extent, and for the amount, that expected loss to be paid plus contra-paid (“total losses”) exceed the deferred premium revenue, on a contract by contract basis. The expected loss to be paid is equal to the present value of expected future cash outflows for claim and LAE payments, net of inflows for expected salvage and subrogation, using current risk-free rates. If a transaction is in a net recovery position, this results in the recording of a salvage and subrogation recoverable. Expected cash outflows and inflows are probability weighted cash flows that reflect management's assumptions about the likelihood of all possible outcomes based on all information available to management. The determination of expected loss to be paid is a subjective process involving numerous significant assumptions and judgments, including severity of loss, economic projections, delinquencies, liquidation rates, prepayment rates, recovery rates, internal credit rating, and probability weightings, as used in the respective cash flow models used by management.
The principal considerations for our determination that performing procedures relating to the valuation of loss and LAE reserve and salvage and subrogation recoverable - estimation of the expected loss to be paid is a critical audit matter are (i) there was significant judgment by management in determining the assumptions used in the respective cash flow models in determining the estimate, which in turn led to a high degree of auditor judgment and subjectivity in performing procedures related to the valuation; (ii) there was significant auditor effort and judgment in evaluating audit evidence relating to the aforementioned assumptions and judgments used in the respective cash flow models; and (iii) the audit effort included the involvement of professionals with specialized skill and knowledge to assist in performing these procedures and evaluating the audit evidence obtained.
Addressing the matter involved performing procedures and evaluating audit evidence in connection with forming our overall opinion on the consolidated financial statements. These procedures included testing the effectiveness of controls relating to the Company’s valuation of loss and LAE reserve and salvage and subrogation recoverable - estimation of the expected loss to be paid, including controls over the cash flow models and the development of significant assumptions. These procedures also included, among others, the use of professionals with specialized skill and knowledge to assist in (i) independently estimating a range of expected loss to be paid and comparing the independent estimate to management’s estimate to evaluate the reasonableness of the estimate for certain transactions ; and (ii) evaluating the reasonableness of the aforementioned assumptions used as applicable in the respective cash flow models for certain transactions used in developing the estimate of the expected loss to be paid. Performing these procedures involved testing the completeness and accuracy of data provided by management.
Valuation of Credit Derivatives
As described in Notes 9 and 11 to the consolidated financial statements, the credit derivatives consist primarily of financial guaranty contracts that are accounted for as derivatives. As of December 31, 2019, credit derivative liabilities were $191 million, and credit derivative assets were included within other assets on the consolidated balance sheet. The fair value of credit derivatives is reflected as either net assets or net liabilities determined on a contract by contract basis in the consolidated balance sheets. The fair value of the credit derivative contracts represents the difference between the present value of remaining premiums that management expected to receive or pay and the estimated present value of premiums that a financial guarantor of comparable credit-worthiness would hypothetically charge or pay at the reporting date for the same protection. Management determines the fair value of its credit derivative contracts primarily through internally developed, proprietary models that use both observable and unobservable market data inputs. The significant unobservable inputs include hedge cost, bank profit, year one loss, internal credit rating and internal floor.
The principal considerations for our determination that performing procedures relating to the valuation of credit derivatives is a critical audit matter are (i) there was significant judgment by management in determining the significant unobservable inputs used in determining the estimate, which in turn led to a high degree of auditor judgment and subjectivity in performing procedures related to the valuation of credit derivatives; (ii) there was a high degree of auditor judgment in evaluating audit evidence relating to the significant unobservable inputs used in the internally developed, proprietary models; and (iii) the audit effort included the involvement of professionals with specialized skill and knowledge to assist in performing these procedures and evaluating the audit evidence obtained.
Addressing the matter involved performing procedures and evaluating audit evidence in connection with forming our overall opinion on the consolidated financial statements. These procedures included testing the effectiveness of controls relating to the Company’s valuation of credit derivatives, including controls over the internally developed, proprietary models and the development of the significant unobservable inputs. These procedures also included, among others, testing management’s process for determining the valuation of credit derivatives, including the use of professionals with specialized skill and knowledge to assist in (i) evaluating the appropriateness of the models and (ii) evaluating the reasonableness of the significant unobservable inputs used in the valuation, including hedge cost, bank profit, year one loss, internal credit rating and internal floor used in developing the estimate of the fair value of credit derivatives. Performing these procedures involved testing the completeness and accuracy of data provided by management.
/s/ PricewaterhouseCoopers LLP
New York, New York
February 24, 201728, 2020
We have served as the Company’s auditor since 2003.
Assured Guaranty Ltd.
Consolidated Balance Sheets
(dollars in millions except per share and share amounts)
| | | | As of
December 31, 2016 | | As of
December 31, 2015 | As of
December 31, 2019 | | As of
December 31, 2018 |
| Assets | |
| | |
| |
| | |
|
| Investment portfolio: | |
| | |
| |
| | |
|
| Fixed-maturity securities, available-for-sale, at fair value (amortized cost of $9,974 and $10,275) | $ | 10,233 |
| | $ | 10,627 |
| |
| Fixed-maturity securities, available-for-sale, at fair value (amortized cost of $8,371 and $9,884) | | $ | 8,854 |
| | $ | 10,089 |
|
| Short-term investments, at fair value | 590 |
| | 396 |
| 1,268 |
| | 729 |
|
| Other invested assets | 162 |
| | 169 |
| |
| Other invested assets (includes $6 and $7 measured at fair value) | | 118 |
| | 55 |
|
| Total investment portfolio | 10,985 |
| | 11,192 |
| 10,240 |
| | 10,873 |
|
| Cash | 118 |
| | 166 |
| 169 |
| | 104 |
|
| Premiums receivable, net of commissions payable | 576 |
| | 693 |
| 1,286 |
| | 904 |
|
| Ceded unearned premium reserve | 206 |
| | 232 |
| |
| Deferred acquisition costs | 106 |
| | 114 |
| 111 |
| | 105 |
|
| Reinsurance recoverable on unpaid losses | 80 |
| | 69 |
| |
| Salvage and subrogation recoverable | 365 |
| | 126 |
| 747 |
| | 490 |
|
| Credit derivative assets | 13 |
| | 81 |
| |
| Deferred tax asset, net | 497 |
| | 276 |
| |
| Current income tax receivable | 12 |
| | 40 |
| |
| Financial guaranty variable interest entities’ assets, at fair value | 876 |
| | 1,261 |
| 442 |
| | 569 |
|
| Other assets | 317 |
| | 294 |
| |
| Assets of consolidated investment vehicles (includes $558 measured at fair value) | | 572 |
| | — |
|
| Goodwill and other intangible assets | | 216 |
| | 24 |
|
| Other assets (includes $135 and $139 measured at fair value) | | 543 |
| | 534 |
|
| Total assets | $ | 14,151 |
| | $ | 14,544 |
| $ | 14,326 |
| | $ | 13,603 |
|
| Liabilities and shareholders’ equity | |
| | |
| |
| | |
|
| Unearned premium reserve | $ | 3,511 |
| | $ | 3,996 |
| $ | 3,736 |
| | $ | 3,512 |
|
| Loss and loss adjustment expense reserve | 1,127 |
| | 1,067 |
| 1,050 |
| | 1,177 |
|
| Reinsurance balances payable, net | 64 |
| | 51 |
| |
| Long-term debt | 1,306 |
| | 1,300 |
| 1,235 |
| | 1,233 |
|
| Credit derivative liabilities | 402 |
| | 446 |
| |
| Credit derivative liabilities, at fair value | | 191 |
| | 209 |
|
| Financial guaranty variable interest entities’ liabilities with recourse, at fair value | 807 |
| | 1,225 |
| 367 |
| | 517 |
|
| Financial guaranty variable interest entities’ liabilities without recourse, at fair value | 151 |
| | 124 |
| 102 |
| | 102 |
|
| Liabilities of consolidated investment vehicles (includes $481 measured at fair value) | | 482 |
| | — |
|
| Other liabilities | 279 |
| | 272 |
| 511 |
| | 298 |
|
| Total liabilities | 7,647 |
| | 8,481 |
| 7,674 |
| | 7,048 |
|
| Commitments and contingencies (See Note 15) |
| |
| |
| Common stock ($0.01 par value, 500,000,000 shares authorized; 127,988,230 and 137,928,552 shares issued and outstanding) | 1 |
| | 1 |
| |
| | | | | |
| Commitments and contingencies (see Note 20) | |
| |
|
| Redeemable noncontrolling interests in consolidated investment vehicles | | 7 |
| | — |
|
| | | | | |
| Common stock ($0.01 par value, 500,000,000 shares authorized; 93,274,987 and 103,672,592 shares issued and outstanding) | | 1 |
| | 1 |
|
| Additional paid-in capital | 1,060 |
| | 1,342 |
| — |
| | 86 |
|
| Retained earnings | 5,289 |
| | 4,478 |
| 6,295 |
| | 6,374 |
|
| Accumulated other comprehensive income, net of tax of $70 and $104 | 149 |
| | 237 |
| |
| Deferred equity compensation (320,193 and 320,193 shares) | 5 |
| | 5 |
| |
| Accumulated other comprehensive income, net of tax of $71 and $38 | | 342 |
| | 93 |
|
| Deferred equity compensation | | 1 |
| | 1 |
|
| Total shareholders’ equity attributable to Assured Guaranty Ltd. | | 6,639 |
| | 6,555 |
|
| Nonredeemable noncontrolling interests | | 6 |
| | — |
|
| Total shareholders’ equity | 6,504 |
| | 6,063 |
| 6,645 |
| | 6,555 |
|
| Total liabilities and shareholders’ equity | $ | 14,151 |
| | $ | 14,544 |
| |
| Total liabilities, redeemable noncontrolling interests and shareholders’ equity | | $ | 14,326 |
| | $ | 13,603 |
|
The accompanying notes are an integral part of these consolidated financial statements.
Assured Guaranty Ltd.
Consolidated Statements of Operations
(dollars in millions except per share amounts)
| | | | Year Ended December 31, | Year Ended December 31, |
| | 2016 |
| 2015 |
| 2014 | 2019 |
| 2018 |
| 2017 |
| Revenues | | | | | | | | | | |
| Net earned premiums | $ | 864 |
| | $ | 766 |
| | $ | 570 |
| $ | 476 |
| | $ | 548 |
| | $ | 690 |
|
| Net investment income | 408 |
| | 423 |
| | 403 |
| 378 |
| | 395 |
| | 417 |
|
| Net realized investment gains (losses): | |
| | |
| | | |
| Other-than-temporary impairment losses | (47 | ) | | (47 | ) | | (76 | ) | |
| Less: portion of other-than-temporary impairment loss recognized in other comprehensive income | 4 |
| | 0 |
| | (1 | ) | |
| Net impairment loss | (51 | ) | | (47 | ) | | (75 | ) | |
| Other net realized investment gains (losses) | 22 |
| | 21 |
| | 15 |
| |
| Asset management fees | | 22 |
| | — |
| | — |
|
| Net realized investment gains (losses) | (29 | ) | | (26 | ) | | (60 | ) | 22 |
| | (32 | ) | | 40 |
|
| Net change in fair value of credit derivatives: | | | | | | |
| Realized gains (losses) and other settlements | 29 |
| | (18 | ) | | 23 |
| |
| Net unrealized gains (losses) | 69 |
| | 746 |
| | 800 |
| |
| Net change in fair value of credit derivatives | 98 |
| | 728 |
| | 823 |
| (6 | ) | | 112 |
| | 111 |
|
| Fair value gains (losses) on committed capital securities | 0 |
| | 27 |
| | (11 | ) | |
| Fair value gains (losses) on financial guaranty variable interest entities | 38 |
| | 38 |
| | 255 |
| 42 |
| | 14 |
| | 30 |
|
| Foreign exchange gains (losses) on remeasurement | | 24 |
| | (37 | ) | | 60 |
|
| Bargain purchase gain and settlement of pre-existing relationships | 259 |
|
| 214 |
| | — |
| — |
|
| — |
| | 58 |
|
| Commutation gains (losses) | | 1 |
| | (16 | ) | | 328 |
|
| Other income (loss) | 39 |
| | 37 |
| | 14 |
| 4 |
| | 17 |
| | 5 |
|
| Total revenues | 1,677 |
| | 2,207 |
| | 1,994 |
| 963 |
| | 1,001 |
| | 1,739 |
|
| Expenses |
|
| |
|
| | |
|
| |
|
| | |
| Loss and loss adjustment expenses | 295 |
| | 424 |
| | 126 |
| 93 |
| | 64 |
| | 388 |
|
| Interest expense | | 89 |
| | 94 |
| | 97 |
|
| Amortization of deferred acquisition costs | 18 |
| | 20 |
| | 25 |
| 18 |
| | 16 |
| | 19 |
|
| Interest expense | 102 |
| | 101 |
| | 92 |
| |
| Employee compensation and benefit expenses | | 178 |
| | 152 |
| | 143 |
|
| Other operating expenses | 245 |
| | 231 |
| | 220 |
| 125 |
| | 96 |
| | 101 |
|
| Total expenses | 660 |
| | 776 |
| | 463 |
| 503 |
| | 422 |
| | 748 |
|
| Income (loss) before income taxes and equity in net earnings of investees | | 460 |
| | 579 |
| | 991 |
|
| Equity in net earnings of investees | | 4 |
| | 1 |
| | — |
|
| Income (loss) before income taxes | 1,017 |
| | 1,431 |
| | 1,531 |
| 464 |
| | 580 |
| | 991 |
|
| Provision (benefit) for income taxes | |
| | |
| | | |
| | |
| | |
| Current | 117 |
| | 75 |
| | 96 |
| (2 | ) | | (15 | ) | | 11 |
|
| Deferred | 19 |
| | 300 |
| | 347 |
| 65 |
| | 74 |
| | 250 |
|
| Total provision (benefit) for income taxes | 136 |
| | 375 |
| | 443 |
| 63 |
| | 59 |
| | 261 |
|
| Net income (loss) | $ | 881 |
| | $ | 1,056 |
| | $ | 1,088 |
| 401 |
| | 521 |
| | 730 |
|
| Less: Redeemable noncontrolling interests | | (1 | ) | | — |
| | — |
|
| Net income (loss) attributable to Assured Guaranty Ltd. | | $ | 402 |
| | $ | 521 |
| | $ | 730 |
|
| | | | | | | | | | | |
| Earnings per share: | | | | | | | | | | |
| Basic | $ | 6.61 |
| | $ | 7.12 |
| | $ | 6.30 |
| $ | 4.04 |
| | $ | 4.73 |
| | $ | 6.05 |
|
| Diluted | $ | 6.56 |
| | $ | 7.08 |
| | $ | 6.26 |
| $ | 4.00 |
| | $ | 4.68 |
| | $ | 5.96 |
|
| Dividends per share | $ | 0.52 |
| | $ | 0.48 |
| | $ | 0.44 |
| |
The accompanying notes are an integral part of these consolidated financial statements.
Assured Guaranty Ltd.
Consolidated Statements of Comprehensive Income
(in millions)
|
| | | | | | | | | | | |
| | Year Ended December 31, |
| | 2016 | | 2015 | | 2014 |
| Net income (loss) | $ | 881 |
| | $ | 1,056 |
| | $ | 1,088 |
|
| Unrealized holding gains (losses) arising during the period on: | |
| | |
| | |
| Investments with no other-than-temporary impairment, net of tax provision (benefit) of $(34), $(36) and $80 | (71 | ) | | (93 | ) | | 196 |
|
| Investments with other-than-temporary impairment, net of tax provision (benefit) of $(5), $(23) and $(9) | (9 | ) | | (43 | ) | | (20 | ) |
| Unrealized holding gains (losses) arising during the period, net of tax | (80 | ) | | (136 | ) | | 176 |
|
| Less: reclassification adjustment for gains (losses) included in net income (loss), net of tax provision (benefit) of $(10), $(7) and $(21) | (16 | ) | | (10 | ) | | (41 | ) |
| Change in net unrealized gains (losses) on investments | (64 | ) | | (126 | ) | | 217 |
|
| Other, net of tax provision | (24 | ) | | (7 | ) | | (7 | ) |
| Other comprehensive income (loss) | (88 | ) | | (133 | ) | | 210 |
|
| Comprehensive income (loss) | $ | 793 |
| | $ | 923 |
| | $ | 1,298 |
|
|
| | | | | | | | | | | |
| | Year Ended December 31, |
| | 2019 | | 2018 | | 2017 |
| Net income (loss) | $ | 401 |
| | $ | 521 |
| | $ | 730 |
|
| Change in net unrealized gains (losses) on: | |
| | |
| | |
| Investments with no other-than-temporary impairment, net of tax provision (benefit) of $46, $(32) and $27 | 293 |
| | (215 | ) | | 64 |
|
| Investments with other-than-temporary impairment, net of tax provision (benefit) of $(14), $(8) and $46 | (46 | ) | | (26 | ) | | 89 |
|
| Change in net unrealized gains (losses) on investments | 247 |
| | (241 | ) | | 153 |
|
| Change in net unrealized gains (losses) on financial guaranty variable interest entities' liabilities with recourse, net of tax | 4 |
| | 2 |
| | — |
|
| Other, net of tax provision (benefit) of $0, $(2) and $2 | (2 | ) | | (8 | ) | | 14 |
|
| Other comprehensive income (loss) | 249 |
| | (247 | ) | | 167 |
|
| Comprehensive income (loss) | 650 |
| | 274 |
| | 897 |
|
| Less: Comprehensive income (loss) attributable to noncontrolling interests | (1 | ) | | — |
| | — |
|
| Comprehensive income (loss) attributable to Assured Guaranty Ltd. | $ | 651 |
| | $ | 274 |
| | $ | 897 |
|
The accompanying notes are an integral part of these consolidated financial statements.
Assured Guaranty Ltd.
Consolidated Statements of Shareholders’ Equity
Years Ended December 31, 2016, 20152019, 2018 and 20142017
(dollars in millions, except share data)
| | | | Common Shares Outstanding | | | Common Stock Par Value | | Additional
Paid-in
Capital | | Retained Earnings | | Accumulated
Other
Comprehensive Income | | Deferred
Equity Compensation | | Total
Shareholders’ Equity | Common Shares Outstanding | | | Common Stock Par Value | | Additional
Paid-in
Capital | | Retained Earnings | | Accumulated
Other
Comprehensive Income | | Deferred
Equity Compensation | | Total Shareholders’ Equity Attributable to Assured Guaranty Ltd. | | Nonredeemable Noncontrolling Interests | | Total
Shareholders’ Equity |
| Balance at December 31, 2013 | 182,177,866 |
| | | $ | 2 |
| | $ | 2,466 |
| | $ | 2,482 |
| | $ | 160 |
| | $ | 5 |
| | $ | 5,115 |
| |
| Balance at December 31, 2016 | | 127,988,230 |
| | | $ | 1 |
| | $ | 1,060 |
| | $ | 5,289 |
| | $ | 149 |
| | $ | 5 |
| | $ | 6,504 |
| | $ | — |
| | $ | 6,504 |
|
| Net income | — |
| | | — |
| | — |
| | 1,088 |
| | — |
| | — |
| | 1,088 |
| — |
| | | — |
| | — |
| | 730 |
| | — |
| | — |
| | 730 |
| | — |
| | 730 |
|
| Dividends ($0.44 per share) | — |
| | | — |
| | — |
| | (76 | ) | | — |
| | — |
| | (76 | ) | |
| Dividends ($0.57 per share) | | — |
| | | — |
| | — |
| | (70 | ) | | — |
| | — |
| | (70 | ) | | — |
| | (70 | ) |
| Common stock repurchases | (24,413,781 | ) | | | 0 |
| | (590 | ) | | — |
| | — |
| | — |
| | (590 | ) | (12,669,643 | ) | | | — |
| | (501 | ) | | — |
| | — |
| | — |
| | (501 | ) | | — |
| | (501 | ) |
| Share-based compensation and other | 542,576 |
| | | 0 |
| | 11 |
| | — |
| | — |
| | — |
| | 11 |
| |
| Share-based compensation | | 702,265 |
| | | — |
| | 14 |
| | — |
| | — |
| | (4 | ) | | 10 |
| | — |
| | 10 |
|
| Other comprehensive income | — |
| | | — |
| | — |
| | — |
| | 210 |
| | — |
| | 210 |
| — |
| | | — |
| | — |
| | — |
| | 167 |
| | — |
| | 167 |
| | — |
| | 167 |
|
| Balance at December 31, 2014 | 158,306,661 |
| | | 2 |
| | 1,887 |
| | 3,494 |
| | 370 |
| | 5 |
| | 5,758 |
| |
| Effect of 2017 Tax Act | | — |
| | | — |
| | — |
| | (56 | ) | | 56 |
| | — |
| | — |
| | — |
| | — |
|
| Other | | — |
| | | — |
| | — |
| | (1 | ) | | — |
| | — |
| | (1 | ) | | — |
| | (1 | ) |
| Balance at December 31, 2017 | | 116,020,852 |
| | | 1 |
| | 573 |
| | 5,892 |
| | 372 |
| | 1 |
| | 6,839 |
| | — |
| | 6,839 |
|
| Net income | — |
| | | — |
| | — |
| | 1,056 |
| | — |
| | — |
| | 1,056 |
| — |
| | | — |
| | — |
| | 521 |
| | — |
| | — |
| | 521 |
| | — |
| | 521 |
|
| Dividends ($0.48 per share) | — |
| | | — |
| | — |
| | (72 | ) | | — |
| | — |
| | (72 | ) | |
| Dividends ($0.64 per share) | | — |
| | | — |
| | — |
| | (71 | ) | | — |
| | — |
| | (71 | ) | | — |
| | (71 | ) |
| Common stock repurchases | (20,995,419 | ) | | | (1 | ) | | (554 | ) | | — |
| | — |
| | — |
| | (555 | ) | (13,243,107 | ) | | | — |
| | (500 | ) | | — |
| | — |
| | — |
| | (500 | ) | | — |
| | (500 | ) |
| Share-based compensation and other | 617,310 |
| | | 0 |
| | 9 |
| | — |
| | — |
| | — |
| | 9 |
| |
| Share-based compensation | | 894,847 |
| | | — |
| | 13 |
| | — |
| | — |
| | — |
| | 13 |
| | — |
| | 13 |
|
| Other comprehensive loss | — |
| | | — |
| | — |
| | — |
| | (133 | ) | | — |
| | (133 | ) | — |
| | | — |
| | — |
| | — |
| | (247 | ) | | — |
| | (247 | ) | | — |
| | (247 | ) |
| Balance at December 31, 2015 | 137,928,552 |
| | | $ | 1 |
| | $ | 1,342 |
| | $ | 4,478 |
| | $ | 237 |
| | $ | 5 |
| | $ | 6,063 |
| |
| Effect of adoption of ASU 2016-01 (see Note 1) | | — |
| | | — |
| | — |
| | 32 |
| | (32 | ) | | — |
| | — |
| | — |
| | — |
|
| Balance at December 31, 2018 | | 103,672,592 |
| | | 1 |
| | 86 |
| | 6,374 |
| | 93 |
| | 1 |
| | 6,555 |
| | — |
| | 6,555 |
|
| Net income | — |
| | | — |
| | — |
| | 881 |
| | — |
| | — |
| | 881 |
| — |
| | | — |
| | — |
| | 402 |
| | — |
| | — |
| | 402 |
| | — |
| | 402 |
|
| Dividends ($0.52 per share) | — |
| | | — |
| | — |
| | (70 | ) | | — |
| | — |
| | (70 | ) | |
| Dividends ($0.72 per share) | | — |
| | | — |
| | — |
| | (74 | ) | | — |
| | — |
| | (74 | ) | | — |
| | (74 | ) |
| Common stock repurchases | (10,721,248 | ) | | | 0 |
| | (306 | ) | | — |
| | — |
| | — |
| | (306 | ) | (11,163,929 | ) | | | — |
| | (93 | ) | | (407 | ) | | — |
| | — |
| | (500 | ) | | — |
| | (500 | ) |
| Share-based compensation and other | 780,926 |
| | | 0 |
| | 24 |
| | — |
| | — |
| | — |
| | 24 |
| |
| Other comprehensive loss | — |
| | | — |
| | — |
| | — |
| | (88 | ) | | — |
| | (88 | ) | |
| Balance at December 31, 2016 | 127,988,230 |
| | | $ | 1 |
| | $ | 1,060 |
| | $ | 5,289 |
| | $ | 149 |
| | $ | 5 |
| | $ | 6,504 |
| |
| Share-based compensation | | 766,324 |
| | | — |
| | 7 |
| | — |
| | — |
| | — |
| | 7 |
| | — |
| | 7 |
|
| Contributions | | — |
| | | — |
| | — |
| | — |
| | — |
| | — |
| | — |
| | 6 |
| | 6 |
|
| Other comprehensive income | | — |
| | | — |
| | — |
| | — |
| | 249 |
| | — |
| | 249 |
| | — |
| | 249 |
|
| Balance at December 31, 2019 | | 93,274,987 |
| | | $ | 1 |
| | $ | — |
| | $ | 6,295 |
| | $ | 342 |
| | $ | 1 |
| | $ | 6,639 |
| | $ | 6 |
| | $ | 6,645 |
|
The accompanying notes are an integral part of these consolidated financial statements.
Assured Guaranty Ltd.
Consolidated Statements of Cash Flows
(in millions)
|
| | | | | | | | | | | |
| | Year Ended December 31, |
| | 2016 | | 2015 | | 2014 |
| Operating Activities: | | | | | |
| Net Income | $ | 881 |
| | $ | 1,056 |
| | $ | 1,088 |
|
| Adjustments to reconcile net income to net cash flows provided by operating activities: | | | | | |
| Non-cash interest and operating expenses | 39 |
| | 27 |
| | 23 |
|
| Net amortization of premium (discount) on investments | (34 | ) | | (25 | ) | | (16 | ) |
| Provision (benefit) for deferred income taxes | 19 |
| | 300 |
| | 347 |
|
| Net realized investment losses (gains) | 29 |
| | 17 |
| | 60 |
|
| Net unrealized losses (gains) on credit derivatives | (69 | ) | | (746 | ) | | (800 | ) |
| Fair value losses (gains) on committed capital securities | 0 |
| | (27 | ) | | 11 |
|
| Bargain purchase gain and settlement of pre-existing relationships | (259 | ) | | (214 | ) | | — |
|
| Change in deferred acquisition costs | 9 |
| | 9 |
| | 3 |
|
| Change in premiums receivable, net of premiums and commissions payable | 128 |
| | (8 | ) | | 108 |
|
| Change in ceded unearned premium reserve | 22 |
| | 79 |
| | 69 |
|
| Change in unearned premium reserve | (777 | ) | | (744 | ) | | (332 | ) |
| Change in loss and loss adjustment expense reserve, net | (105 | ) | | 244 |
| | 182 |
|
| Change in current income tax | 27 |
| | (45 | ) | | (45 | ) |
| Change in financial guaranty variable interest entities' assets and liabilities, net | (24 | ) | | (6 | ) | | (170 | ) |
| (Purchases) sales of trading securities, net | — |
| | 8 |
| | 78 |
|
| Other | (27 | ) | | 23 |
| | (29 | ) |
| Net cash flows provided by (used in) operating activities | (141 | ) | | (52 | ) | | 577 |
|
| Investing activities | |
| | |
| | |
| Fixed-maturity securities: | |
| | |
| | |
| Purchases | (1,646 | ) | | (2,577 | ) | | (2,801 | ) |
| Sales | 1,365 |
| | 2,107 |
| | 1,251 |
|
| Maturities | 1,155 |
| | 898 |
| | 877 |
|
| Net sales (purchases) of short-term investments | 17 |
| | 897 |
| | 158 |
|
| Net proceeds from paydowns on financial guaranty variable interest entities’ assets | 629 |
| | 400 |
| | 408 |
|
| Acquisition of CIFG, net of cash acquired | (435 | ) | | — |
| | — |
|
| Acquisition of Radian Asset, net of cash acquired | — |
| | (800 | ) | | — |
|
| Other | (9 | ) | | 69 |
| | 11 |
|
| Net cash flows provided by (used in) investing activities | 1,076 |
| | 994 |
| | (96 | ) |
| Financing activities | |
| | |
| | |
| Dividends paid | (69 | ) | | (72 | ) | | (76 | ) |
| Repurchases of common stock | (306 | ) | | (555 | ) | | (590 | ) |
| Share activity under option and incentive plans | 10 |
| | (2 | ) | | 1 |
|
| Net paydowns of financial guaranty variable interest entities’ liabilities | (611 | ) | | (214 | ) | | (396 | ) |
| Net proceeds from issuance of long-term debt | — |
| | — |
| | 495 |
|
| Repayment of long-term debt | (2 | ) | | (4 | ) | | (19 | ) |
| Net cash flows provided by (used in) financing activities | (978 | ) | | (847 | ) | | (585 | ) |
| Effect of foreign exchange rate changes | (5 | ) | | (4 | ) | | (5 | ) |
| Increase (decrease) in cash | (48 | ) | | 91 |
| | (109 | ) |
| Cash at beginning of period | 166 |
| | 75 |
| | 184 |
|
| Cash at end of period | $ | 118 |
| | $ | 166 |
| | $ | 75 |
|
| Supplemental cash flow information | |
| | |
| | |
| Cash paid (received) during the period for: | |
| | |
| | |
| Income taxes | $ | 74 |
| | $ | 103 |
| | $ | 122 |
|
| Interest | $ | 95 |
| | $ | 95 |
| | $ | 86 |
|
The accompanying notes are an integral part of these consolidated financial statements.
Assured Guaranty Ltd.
Consolidated Statements of Cash Flows
(in millions)
|
| | | | | | | | | | | |
| | Year Ended December 31, |
| | 2019 | | 2018 | | 2017 |
| Operating Activities: | | | | | |
| Net Income | $ | 401 |
| | $ | 521 |
| | $ | 730 |
|
| Adjustments to reconcile net income to net cash flows provided by operating activities: | | | | | |
| Non-cash interest and operating expenses | 34 |
| | 36 |
| | 26 |
|
| Net amortization of premium (discount) on investments | (35 | ) | | (31 | ) | | (46 | ) |
| Provision (benefit) for deferred income taxes | 65 |
| | 74 |
| | 250 |
|
| Net realized investment losses (gains) | (22 | ) | | 32 |
| | (40 | ) |
| Bargain purchase gain and settlement of pre-existing relationships | — |
| | — |
| | (58 | ) |
| Change in premiums receivable, net of premiums and commissions payable | (388 | ) | | (6 | ) | | (69 | ) |
| Change in ceded unearned premium reserve | 20 |
| | 58 |
| | 90 |
|
| Change in unearned premium reserve | 224 |
| | 39 |
| | (424 | ) |
| Change in loss and loss adjustment expense reserve, net | (528 | ) | | (173 | ) | | 142 |
|
| Change in financial guaranty variable interest entities' assets and liabilities, net | (27 | ) | | (5 | ) | | (15 | ) |
| Change in credit derivative assets and liabilities, net | (1 | ) | | (62 | ) | | (144 | ) |
| Other | — |
| | (21 | ) | | (9 | ) |
| Cash flows from consolidated investment vehicles: | | | | | |
| Purchases of securities | (267 | ) | | — |
| | — |
|
| Other changes in investment vehicles | 15 |
| | — |
| | — |
|
| Net cash flows provided by (used in) operating activities | (509 | ) | | 462 |
| | 433 |
|
| Investing activities | |
| | |
| | |
| Fixed-maturity securities: | |
| | |
| | |
| Purchases | (873 | ) | | (1,881 | ) | | (2,552 | ) |
| Sales | 1,805 |
| | 1,180 |
| | 1,701 |
|
| Maturities and paydowns | 781 |
| | 962 |
| | 821 |
|
| Short-term investments with maturities of over three months: | | | | | |
| Purchases | (229 | ) | | (243 | ) | | (255 | ) |
| Sales | 2 |
| | 23 |
| | 102 |
|
| Maturities and paydowns | 316 |
| | 207 |
| | 191 |
|
| Net sales (purchases) of short-term investments with original maturities of less than three months | (623 | ) | | (84 | ) | | 36 |
|
| Net proceeds from paydowns on financial guaranty variable interest entities’ assets | 139 |
| | 116 |
| | 147 |
|
| Net proceeds from sales of financial guaranty variable interest entities’ assets | 51 |
| | — |
| | — |
|
| Acquisitions, net of cash acquired (see Note 2) | (145 | ) | | — |
| | 95 |
|
| Proceeds from maturity of other invested asset | — |
| | — |
| | 85 |
|
| Proceeds from sales of other invested assets | 36 |
| | 38 |
| | 2 |
|
| Purchases of other invested assets | (88 | ) | | (20 | ) | | (23 | ) |
| Other | (3 | ) | | (1 | ) | | (5 | ) |
| Net cash flows provided by (used in) investing activities | $ | 1,169 |
| | $ | 297 |
| | $ | 345 |
|
(continued)
The accompanying notes are an integral part of these consolidated financial statements.
Assured Guaranty Ltd.
Consolidated Statements of Cash Flows - (Continued)
(in millions)
|
| | | | | | | | | | | |
| | Year Ended December 31, |
| | 2019 | | 2018 | | 2017 |
| Financing activities | | | | | |
| Dividends paid | $ | (74 | ) | | $ | (71 | ) | | $ | (70 | ) |
| Repurchases of common stock | (500 | ) | | (500 | ) | | (501 | ) |
| Net paydowns of financial guaranty variable interest entities’ liabilities | (181 | ) | | (116 | ) | | (157 | ) |
| Paydown of long-term debt | (4 | ) | | (101 | ) | | (30 | ) |
| Other | (15 | ) | | (7 | ) | | (8 | ) |
| Cash flows from consolidated investment vehicles: | | | | | |
| Proceeds from issuance of collateralized loan obligations | 482 |
| | — |
| | — |
|
| Repayment of warehouse loans and equity | (306 | ) | | — |
| | — |
|
| Contributions from noncontrolling interests to investment vehicles | 18 |
| | — |
| | — |
|
| Distributions to redeemable noncontrolling interests from investment vehicles | (4 | ) | | — |
| | — |
|
| Net cash flows provided by (used in) financing activities | (584 | ) | | (795 | ) | | (766 | ) |
| Effect of foreign exchange rate changes | 3 |
| | (4 | ) | | 5 |
|
| Increase (decrease) in cash and restricted cash | 79 |
| | (40 | ) | | 17 |
|
| Cash and restricted cash at beginning of period | 104 |
| | 144 |
| | 127 |
|
| Cash and restricted cash at end of period | $ | 183 |
| | $ | 104 |
| | $ | 144 |
|
| | | | | | |
| Supplemental cash flow information | |
| | |
| | |
| Cash paid (received) during the period for: | |
| | |
| | |
| Income taxes | $ | 4 |
| | $ | (4 | ) | | $ | 10 |
|
| Interest on long-term debt | 84 |
| | 99 |
| | 77 |
|
| | | | | | |
| Supplemental disclosure of non-cash investing and financing activities: | | | | | |
| Purchases of fixed-maturity investments | $ | (188 | ) | | $ | (4 | ) | | $ | (32 | ) |
| Sales of fixed-maturity investments | 44 |
| | — |
| | — |
|
| | | | | | |
| | As of December 31, |
| | 2019 | | 2018 | | 2017 |
| Reconciliation of cash and restricted cash to the consolidated balance sheets: | | | | | |
| Cash | $ | 169 |
| | $ | 104 |
| | $ | 144 |
|
| Restricted cash (included in other assets) | — |
| | — |
| | — |
|
| Cash of consolidated investment vehicles | 14 |
| | — |
| | — |
|
| Cash and restricted cash at the end of period | $ | 183 |
| | $ | 104 |
| | $ | 144 |
|
The accompanying notes are an integral part of these consolidated financial statements.
Assured Guaranty Ltd.
Notes to Consolidated Financial Statements
December 31, 2016, 20152019, 2018 and 2014 2017
| |
| 1. | Business and Basis of Presentation |
Business
Assured Guaranty Ltd. (AGL and, together with its subsidiaries, Assured Guaranty or the Company) is a Bermuda-based holding company that provides, through its operating subsidiaries, credit protection products to the United States (U.S.)U.S. and international public finance (including infrastructure) and structured finance markets. Themarkets, as well as asset management services.
Through its insurance subsidiaries, the Company applies its credit underwriting judgment, risk management skills and capital markets experience primarily to offer financial guaranty insurance that protects holders of debt instruments and other monetary obligations from defaults in scheduled payments. If an obligor defaults on a scheduled payment due on an obligation, including a scheduled principal or interest payment (debt service), the Company is required under its unconditional and irrevocable financial guaranty to pay the amount of the shortfall to the holder of the obligation. The Company markets its financial guaranty insurance directly to issuers and underwriters of public finance and structured finance securities as well as to investors in such obligations. The Company guarantees obligations issued principally in the U.S. and the United Kingdom (U.K.), and also guarantees obligations issued in other countries and regions, including AustraliaWestern Europe, Canada and Western Europe.Australia. The Company also provides other forms ofspecialty insurance that areand reinsurance on transactions with similar risk profiles to its structured finance exposures written in line withfinancial guaranty form.
Through its risk profile and benefit from its underwriting experience.
In the past,asset management subsidiaries, the Company soldprovides investment management services across various asset classes including collateralized loan obligations (CLOs) and long-duration opportunity funds that build on its corporate credit, protection by issuing policies that guaranteed payment obligations under credit derivatives, primarily credit default swaps (CDS). Contracts accounted forasset-backed finance and healthcare structured capital experience as credit derivatives are generally structured such that the circumstances giving risewell as certain funds now subject to the Company’s obligation to make loss payments are similar to those for financial guaranty insurance contracts. The Company’s credit derivative transactions are governed by International Swaps and Derivative Association, Inc. (ISDA) documentation. The Company has not entered into any new CDS in order to sell credit protection in the U.S. since the beginning of 2009, when regulatory guidelines were issued that limited the terms under which such protection could be sold. The capital and margin requirements applicable under the Dodd-Frank Wall Street Reform and Consumer Protection Act also contributed to the Company not entering into such new CDS in the U.S. since 2009. The Company actively pursues opportunities to terminate existing CDS, which have the effect of reducing future fair value volatility in income and/or reducing rating agency capital charges.orderly wind-down.
Basis of Presentation
The consolidated financial statements have been prepared in conformity with accounting principles generally accepted in the United States of America (GAAP) and, in the. In management's opinion, of management, reflect all material adjustments that are of a normal recurring nature, necessary for a fair statement of the financial condition, results of operations and cash flows of the Company and its consolidated variable interest entities (VIEs) forare reflected in the periods presented.presented and are of a normal, recurring nature. The preparation of financial statements in conformity with GAAP requires management to make estimates and assumptions that affect the reported amounts of assets and liabilities and disclosure of contingent assets and liabilities as of the date of the financial statements and the reported amounts of revenues and expenses during the reporting period. Actual results could differ from those estimates. The presentation of equity in net earnings of investees was changed in 2019 to reflect amounts previously reported in net investment income and other income to a separate line item on the consolidated statements of operations. Certain prior year balances have been reclassified to conform to the current year's presentation.
The consolidated financial statements include the accounts of AGL, its direct and indirect subsidiaries (collectively, the Subsidiaries), and its consolidated VIEs. Intercompany accounts and transactions between and among all consolidated entities have been eliminated. Certain prior-year balances have been reclassified to conform to the current year's presentation.
The Company's principal insurance company subsidiaries are:
Assured Guaranty Municipal Corp. (AGM), domiciled in New York;
Municipal Assurance Corp. (MAC), domiciled in New York;
Assured Guaranty Corp. (AGC), domiciled in Maryland;
Assured Guaranty (Europe) Ltd. (AGE)plc (AGE UK), organized in the U.K.; and
Assured Guaranty (Europe) SA (AGE SA), organized in France;
Assured Guaranty Re Ltd. (AG Re), domiciled in Bermuda; and
Assured Guaranty Re Overseas LtdLtd. (AGRO), domiciled in Bermuda.
The Company's principal asset management subsidiaries are BlueMountain Capital Management, LLC (BlueMountain), BlueMountain CLO Management, LLC, and BlueMountain GP Holdings, LLC.
The Company’s organizational structure includes various holding companies, two2 of which—which - Assured Guaranty U.S.US Holdings Inc. (AGUS) and Assured Guaranty Municipal Holdings Inc. (AGMH) –- have public debt outstanding. See Note 16,15, Long-Term Debt and Credit Facilities and Note 21,25, Subsidiary Information.
Significant Accounting Policies
The Company revalues assets, liabilities, revenue and expenses denominated in non-U.S. currencies into U.S. dollars using applicable exchange rates. Gains and losses relating to transactions in foreign denominations in those subsidiaries where the functional currency is the U.S. dollar are reported in the consolidated statement of operations. Gains and losses relating to translating foreign functional currency financial statements for U.S. GAAP reporting are recorded in other comprehensive income (loss) (OCI). Gains and losses relating to transactions in foreign denominations in subsidiaries where the functional currency is the U.S. dollar, are reported in the consolidated statement of operations.
The chief operating decision maker manages the operations of the Company at a consolidated level. Therefore, all results of operations are reported as one segment.
Other significant accounting policies are included in the following notes.
Significant Accounting Policies
|
| |
AcquisitionsBusiness Combinations | Note 2 |
| Segments | Note 4 |
Expected loss to be paid (insurance, credit derivatives and FG VIEfinancial guaranty (FG) VIEs contracts) | Note 56 |
| Contracts accounted for as insurance (premium revenue recognition, loss and loss adjustment expense and policy acquisition cost) | Note 67 and 8 |
| Fair value measurement | Note 7 |
Credit derivatives (at fair value) | Note 8 |
Variable interest entities (at fair value) | Note 9 |
| Investments and cash | Note 10 |
| Credit derivatives | Note 11 |
| Management fees | Note 12 |
| Goodwill and other intangible assets | Note 13 |
| Variable interest entities | Note 14 |
| Long term debt | Note 15 |
| Stock based compensation | Note 16 |
| Income taxes | Note 1217 |
| Leases | Note 20 |
| Share repurchases | Note 21 |
| Earnings per share | Note 17 |
Stock based compensation | Note 1923 |
Future Application ofAdopted Accounting Standards
Income TaxesLeases
In OctoberFebruary 2016, the Financial Accounting Standards Board (FASB) issued Accounting Standards Update (ASU) 2016-16, Income Taxes2016-02, Leases (Topic 740) - Intra-Entity Transfers of Assets Other Than Inventory, which removes the current prohibition against immediate recognition of the current and deferred income tax effects of intra-entity transfers of assets other than inventory. Under the ASU, the selling (transferring) entity is required to recognize a current income tax expense or benefit upon transfer of the asset. Similarly, the purchasing (receiving) entity is required to recognize a deferred tax asset or deferred tax liability, as well as the related deferred tax benefit or expense, upon receipt of the asset. The ASU is effective for annual periods beginning after December 15, 2017, including interim periods within those annual periods, and early adoption is permitted. The ASU’s amendments are to be applied on a modified retrospective basis recognizing the effects in retained earnings as of the beginning of the year of adoption.842). The Company is currently evaluatingadopted Topic 842 on January 1, 2019 using the effectoptional transition method that allows the Company to initially apply the new requirements at the effective date, with no revision to prior periods. See Note 20, Commitments and Contingencies, for additional information.
Premium Amortization on its Consolidated Financial Statements of adopting this ASU.Purchased Callable Debt Securities
Statement of Cash Flows
In November 2016,March 2017, the FASB issued ASU 2016-18, Statement of Cash Flows2017-08, Receivables-Nonrefundable Fees and Other Costs (Topic 230): Restricted Cash (a consensus of310-20) - Premium Amortization on Purchased Callable Debt Securities. This ASU shortened the Emerging Issues Task Force), which addressesamortization period for the presentation of changes in restricted cash and restricted cash equivalents inpremium on certain purchased callable debt securities to the statement of cash flowsearliest call date. This ASU was adopted on January 1, 2019, with the objective of reducing the existing diversity in practice. Under the ASU, entities are required to show the changes in the total of cash, cash equivalents, restricted cash and restricted cash equivalents in the statement of cash flows. As a result, entities will no longer present transfers between cash and cash equivalents and restricted cash and restricted cash equivalents in the statement of cash flows. When cash, cash equivalents, restricted cash and restricted cash equivalents are presented in more than one line itemeffect on the balance sheet, the ASU requires a reconciliation be presented either on the face of the statement of cash flows or in the notes to theCompany's consolidated financial statements showing the totals in the statement of cash flows to the related captions in the balance sheet. The ASU is effective for public business entities for fiscal years beginning after December 15, 2017, and interim periods within those fiscal years. Early adoption is permitted, includingstatements.
adoption in an interim period. If the ASU is adopted in an interim period, any adjustments should be reflected asFuture Application of the beginning of the fiscal year that includes that interim period. This ASU will not have a material impact on the Company’s Consolidated Statements of Cash Flows.Accounting Standards
In August 2016, the FASB issued ASU 2016-15, Statement of Cash Flows (Topic 230): Classification of Certain Cash Receipts and Cash Payments (a consensus of the Emerging Issues Task Force), which addresses eight specific cash flow issues with the objective of reducing the existing diversity in practice. The issues addressed in the new guidance include debt prepayment or debt extinguishment costs, settlement of zero-coupon debt instruments, contingent consideration payments made after a business combination, proceeds from the settlement of insurance claims, proceeds from the settlement of corporate-owned life insurance policies, including bank-owned life insurance policies, distributions received from equity method investments, beneficial interests in securitization transactions and separately identifiable cash flows and application of the predominance principle. The amendments in this ASU are effective for public business entities for fiscal years beginning after December 15, 2017, and interim periods within those fiscal years. Early adoption is permitted, including adoption in an interim period. If an entity early adopts the amendments in an interim period, any adjustments should be reflected as of the beginning of the fiscal year that includes that interim period. An entity that elects early adoption must adopt all of the amendments in the same period. This ASU will not have a material impact on the Company’s Consolidated Statements of Cash Flows.
Credit Losses on Financial Instruments
In June 2016, the FASB issued ASU 2016-13, Financial Instruments - Credit Losses (Topic 326): Measurement of Credit Losses on Financial Instruments. The amendments in this ASU are intendedprovides a new current expected credit loss model to improve financial reporting by requiring timelier recording ofaccount for credit losses on loanscertain financial assets (e.g., reinsurance recoverables, premium receivables, and other financial instruments held by financial institutionsheld-to-maturity debt securities) and other organizations. The ASUoff-balance sheet exposures (e.g., loan commitments). That model requires the measurement of all expectedan entity to estimate lifetime credit losses forrelated to certain financial assets, held at the reporting date based on relevant historical experience,information, adjusted for current conditions and reasonable and supportable forecasts. Financial institutions will use forward-looking information to better inform their credit loss estimates as a resultforecasts that could affect the collectability of the ASU. While manyreported amount. The ASU also makes targeted amendments to the current impairment model for available-for-sale debt securities, which includes requiring the recognition of an allowance rather than a direct write-down of the loss estimation techniques applied today will stillinvestment, which may be permitted,reversed in the inputs to those techniques will change to reflectevent that the full amount of expected credit losses. The ASU requires enhanced disclosures to help investors and other financial statement users to better understand significant estimates and judgments used in estimating credit losses, as well as credit quality and underwriting standards of an organization’s portfolio.
issuer improves. In addition, the ASU amends the accounting for credit losses on available-for-sale securities and purchased financial assets with credit deterioration. The ASU also eliminates the concept of “other than temporary” from the impairmentexisting guidance for purchased credit impaired assets and introduces a new model for certain available-for-sale securities. Accordingly, the ASU states that an entity must use an allowance approach, must limit the allowance to an amount at which the security’s fair value is less than its amortized cost basis, may not consider the length of time fair value has been less than amortized cost, and may not consider recoveries in fair value after the balance sheet date when assessing whether a credit loss exists. For purchased financial assets with credit deterioration, such as certain of the ASUCompany's loss mitigation securities, which requires the recognition of an entity’s methodinitial allowance for measuring credit losses tolosses. Under the new guidance, the amortized cost would be consistent with its method for measuring expected losses for originated and purchased non-credit-deteriorated assets.the purchase price plus the allowance at the acquisition date.
The ASU is effective for fiscal years, beginning after December 15, 2019, includingand interim periods within those fiscal years.years, beginning after December 15, 2019. For mostreinsurance recoverables, premiums receivable and debt instruments such as loans and held to maturity securities, entities will be required to record a cumulative-effect adjustment to the statement of financial position as of the beginning of the first reporting period in which the guidance is adopted. The changes to the impairment model for available-for-sale securities are to be applied using a modified retrospective approach, and changes to purchased financial assets with credit deterioration are to be applied prospectively. For theThe Company is adopting this would be as ofASU, including certain amendments, effective January 1, 2020. Early adoption is permitted for fiscal years, and interim periods with those fiscal years, beginning after December 15, 2018. The Company is currently evaluating theASU 2016-13 will not have a material effect on its Consolidated Financial Statementsshareholders' equity at the date of adopting this ASU.adoption.
Share-Based PaymentsTargeted Improvements to the Accounting for Long-Duration Contracts
In March 2016,August 2018, the FASB issued ASU 2016-09, Compensation2018-12, Financial Services - Stock CompensationInsurance (Topic 718) -944): Targeted Improvements to Employee Share-Based Payment, which simplifies several aspectsthe Accounting for Long-Duration Contracts. The amendments in this ASU:
improve the timeliness of recognizing changes in the liability for future policy benefits and modify the rate used to discount future cash flows,
simplify and improve the accounting for employee share-based payment transactions, includingcertain market-based options or guarantees associated with deposit (or account balance) contracts,
simplify the amortization of deferred acquisition costs (DAC), and
improve the effectiveness of the required disclosures.
This ASU does not affect the Company’s financial guaranty insurance contracts, but may affect its accounting for income taxes, forfeitures, and statutory tax withholding requirements, as well as classification incertain specialty (non-financial guaranty) contracts. In October 2019, the statementFASB affirmed its decision to defer the effective date of cash flows. The new guidance will require all income tax effects of awardsthe ASU to be recognized in the income statement when the awards vest or are settled. It also will allow an employer to repurchase more of an employee’s shares than it can today for tax withholding purposes without triggering liability accounting and to make a policy election to account for forfeitures as they occur. The ASU is effective for fiscal years beginning after December 15, 2016, including interim periods within those fiscal years, and early adoption is permitted.January 1, 2022. The Company does not plan to adopt this ASU until January 1, 2022, and does not expect that thethis ASU willto have a material effect on its Consolidated Financial Statements.consolidated financial statements.
Simplification of the Accounting for Income Taxes
Leases
In February 2016,December 2019, the FASB issued ASU 2016-02, Leases2019-12, Income Taxes (Topic 842). This740): Simplifying the Accounting for Income Taxes. The amendments in this ASU requires lessees to present right-of-use assetssimplify the accounting for income taxes by removing certain exceptions and lease liabilities on the balance sheet. ASU 2016-02 is to be applied using a modified retrospective approach at the beginning of the earliest comparative period in the financial statements.clarifying certain requirements regarding franchise taxes, goodwill, consolidated tax expenses and annual effective tax rate calculations. The ASU is effective for fiscal yearsinterim and annual periods beginning after December 15, 2018, including interim periods within those fiscal years. Early2020, with early adoption is permitted. The Company is evaluatingcurrently assessing the impact thatof this ASU will have on its Consolidated Financial Statements.
Financial Instruments
In January 2016, the FASB issued ASU 2016-01, Financial Instruments - Overall (Subtopic 825-10) - Recognition and Measurement of Financial Assets and Financial Liabilities. The amendments in this ASU are intended to make targeted improvements to GAAP by addressing certain aspects of recognition, measurement, presentation, and disclosure ofconsolidated financial instruments. Under the ASU, certain equity securities will need to be accounted for at fair value with changes in fair value recognized through net income. Currently, the Company recognizes unrealized gains and losses for these securities in OCI. Another amendment pertains to liabilities that an entity has elected to measure at fair value in accordance with the fair value option for financial instruments. For these liabilities, the portion of fair value change related to credit risk will be separately presented in OCI. Currently, the entire change in the fair value of these liabilities is reflected in the income statement. The Company elected the fair value option to account for its consolidated FG VIEs. FG VIE financial liabilities with recourse are sensitive to changes in the Company’s implied credit worthiness and will be impacted by the ASU.
statements.
The ASU is effective for fiscal years beginning after December 15, 2017, including interim periods within those fiscal years. Entities will be required to record a cumulative-effect adjustment to the statement of financial position as of the beginning of the fiscal year in which the guidance is adopted. For the Company, this would be as of January 1, 2018. Early adoption is permitted only for the amendment related to the change in presentation of financial liabilities that are fair valued using the fair value option. The Company does not expect that the amendment related to certain equity securities will have a material effect on its Consolidated Financial Statements. Upon the adoption date, the Company will present the total change in credit risk for FG VIEs’ financial liabilities with recourse separately in OCI.
| |
| 2. | AcquisitionsBusiness Combinations and Assumption of Insured Portfolio |
Consistent with one of its key business strategies, of supplementing its book of business through acquisitions, the Company has acquired three1 asset management company, 1 financial guaranty companies since Januarycompany and completed 1 2015,reinsurance transaction, during the three-year period covered by this report, as described below.
CIFG Holding Inc.
On July 1, 2016, AGC acquired all of the issued and outstanding capital stock of CIFG Holding Inc. (together with its subsidiaries CIFGH), the parent of financial guaranty insurer CIFG Assurance North America, Inc. (CIFGNA), (the CIFG Acquisition), for $450.6 million in cash. AGUS previously owned 1.6% of the outstanding shares of CIFGH, for which it received $7.1 million in consideration from AGC, resulting in a net consolidated purchase price of $443 million. AGC merged CIFGNA with and into AGC, with AGC as the surviving company, on July 5, 2016. The CIFG Acquisition added $4.2 billion of net par insured on July 1, 2016.
At the time of the CIFG Acquisition, CIFGNA had a subsidiary financial guaranty company domiciled in France, CIFG Europe S.A. (CIFGE), which had been put into run-off and surrendered its licenses. CIFGNA had reinsured all of CIFGE’s outstanding financial guaranty business and also had issued a “second-to-pay policy” pursuant to which CIFGNA guaranteed the full and complete payment of any shortfall in amounts due from CIFGE on its insured portfolio; AGC assumed these obligations as part of the CIFGNA merger with and into AGC. CIFGE remains a separate subsidiary in runoff, now owned by AGC. As of December 31, 2016, CIFGE had investment assets of $41 million and gross par exposure of $694 million, and is not currently expected to pay dividends.Business Combinations
Accounting Policies
The CIFG Acquisition wasCompany's business combinations are accounted for under the acquisition method of accounting which requires that the assets and liabilities of the acquired entities be recorded at fair value. The Company exercised significant judgment to determine the fair value of the assets it acquired and liabilities it assumed in each of the CIFG Acquisition.acquisitions. The most significant of these determinations related to the valuation of CIFGH'sthe acquired financial guaranty insurance contracts and credit derivativeinvestment management contracts. On an aggregate basis, CIFGH's contractual premiums
Contractual premium for financial guaranty insurance contracts charged by acquired legacy financial guarantors were generally less than their fair value, which is based on the premiumspremium a market participant of similar credit quality would demand to acquire those contracts at the date of the CIFG Acquisition (the CIFG Acquisition Date), particularly for below-investment-grade transactions, resulting inacquisition. Accordingly, a significant amount of the purchase price beingwas allocated to these contracts. For information on the methodology the Company used to measure the fair value of assets it acquired and liabilities it assumed in
the CIFG Acquisition, including financial guaranty insurance and credit derivative contracts, please refer to Note 7, Fair Value Measurement.
The fair value of the Company's stand-ready obligation on the CIFG Acquisition Date is recorded in unearned premium reserve. After the CIFG Acquisition Date, loss reserves and loss and loss adjustment expenses (LAE) will be recorded when the expected losses for each contract exceeds the remaining unearned premium reserve, in accordance with the Company's accounting policy described in Note 6, Contracts Accounted for as Insurance. The expected losses acquired by the Company as part of the CIFG Acquisition are included in the description of expected losses to be paid under Note 5, Expected Losses to be Paid.
below-investment grade (BIG) transactions. The excess of the fair value of net assets acquired over the consideration transferred was recorded as a bargain purchase gain in "bargain purchase gain and settlementthe statement of pre-existing relationships" in net income.operations. In addition, the Company and CIFGHthe acquired legacy financial guarantor had pre-existing reinsurance relationships, which were also effectively settled at fair value on the CIFG Acquisition Date.their respective acquisition dates. The gain or loss on settlement of these pre-existing reinsurance relationships represents the net difference between the historical assumed or ceded balances that were recorded by AGCthe Company and the fair value of ceded or assumed balances acquired from CIFGH. The Company believesand was also recorded in the bargain purchase gain resulted from the naturestatement of the financial guaranty business and the desire of investors in CIFGH to monetize their investments in CIFGH. The bargain purchase gain reflectsoperations. While the fair value of CIFGH’sthe Company's stand-ready obligation on the date of acquisition is recorded in unearned premium reserve, thereafter, loss reserves and loss and loss adjustment expenses (LAE) are recorded in accordance with the Company's accounting policy for insurance contracts.
BlueMountain's finite-lived intangible assets consist mainly of investment management and liabilities,CLO contracts and its CLO distribution network, which were recorded at fair value on the date of acquisition. The fair value of the contracts and CLO distribution network were determined using the multi-period excess earnings method and the replacement cost method, respectively. The excess of the purchase price over fair value of the net assets of the acquired BlueMountain subsidiaries was recorded as goodwill.
In assumed reinsurance agreements, the Company allocates premiums it receives to each financial guaranty or credit derivative contract on the effective date of the agreement. Thereafter, loss reserves and LAE are recorded in accordance with the Company's accounting policy for financial guaranty insurance contracts, and changes in fair value are recorded for credit derivatives.
BlueMountain
On October 1, 2019 (the BlueMountain Acquisition Date), AGUS completed the acquisition of all of the outstanding equity interests in BlueMountain and its associated entities, for a purchase price of $157 million (BlueMountain Acquisition). As of the date of acquisition, BlueMountain managed assets across CLOs and long-duration opportunity funds that build on its corporate credit, asset-backed finance and healthcare structured capital experience, as well as tax attributes that were recordedcertain funds now subject to orderly wind-down. In addition, AGUS contributed $60 million of cash to BlueMountain at closing and contributed an additional $30 million in deferred taxes comprising net operating losses (after Internal Revenue Code changecash in control provisions)February 2020. To fund the BlueMountain Acquisition and other temporary book-to-tax differences for which CIFGH had recordedthe related capital contributions, AGM, AGC and MAC made 10 year, 3.5% interest rate intercompany loans to AGUS totaling $250 million.
The BlueMountain Acquisition is expected to broaden and further diversify the Company's revenue sources with a full valuation allowance.fee-generating platform.
The following table shows the net effect of the CIFGBlueMountain Acquisition including the effects of the settlement of pre-existing relationships.on October 1, 2019.
|
| | | | | | | | | | | |
| | Fair Value of Net Assets Acquired, before Settlement of Pre-existing Relationships | | Net effect of Settlement of Pre-existing Relationships | | Net Effect of CIFG Acquisition |
| | (in millions) |
| Cash Purchase Price (1) | $ | 443 |
| | $ | — |
| | $ | 443 |
|
| | | | | | |
| Identifiable assets acquired: | | | | | |
| Investments | 770 |
| | — |
| | 770 |
|
| Cash | 8 |
| | — |
| | 8 |
|
| Premiums receivable, net of commissions payable | 18 |
| | — |
| | 18 |
|
| Ceded unearned premium reserve | 173 |
| | (173 | ) | | — |
|
| Deferred acquisition costs | 1 |
| | (1 | ) | | — |
|
| Salvage and subrogation recoverable | 23 |
| | — |
| | 23 |
|
| Credit derivative assets | 1 |
| | — |
| | 1 |
|
| Deferred tax asset, net | 194 |
| | 34 |
| | 228 |
|
| Other assets | 4 |
| | — |
| | 4 |
|
| Total assets | 1,192 |
| | (140 | ) | | 1,052 |
|
| | |
| | | | |
| Liabilities assumed: | | | | | |
| Unearned premium reserves | 306 |
| | (10 | ) | | 296 |
|
| Loss and loss adjustment expense reserve | 1 |
| | (66 | ) | | (65 | ) |
| Credit derivative liabilities | 68 |
| | 0 |
| | 68 |
|
| Other liabilities | 17 |
| | — |
| | 17 |
|
| Total liabilities | 392 |
| | (76 | ) | | 316 |
|
| Net asset effect of CIFG Acquisition | 800 |
| | (64 | ) | | 736 |
|
| Bargain purchase gain and settlement of pre-existing relationships resulting from CIFG Acquisition, after-tax | 357 |
| | (64 | ) | | 293 |
|
| Deferred tax | — |
| | (34 | ) | | (34 | ) |
| Bargain purchase gain and settlement of pre-existing relationships resulting from CIFG Acquisition, pre-tax | $ | 357 |
| | $ | (98 | ) | | $ | 259 |
|
|
| | | | |
| | | Net Effect of BlueMountain Acquisition |
| | | (in millions) |
| Cash purchase price | | $ | 157 |
|
| | | |
| Identifiable assets acquired: | | |
| Investment portfolio | | 3 |
|
| Cash | | 12 |
|
Intangible assets (1) | | 79 |
|
| Other assets (2) | | 59 |
|
| Total assets | | 153 |
|
| | | |
|
| Liabilities assumed: | | |
Compensation payable (3) | | 61 |
|
| Other liabilities | | 52 |
|
| Total liabilities | | 113 |
|
| Net assets of BlueMountain | | 40 |
|
Goodwill recognized from BlueMountain Acquisition (1) | | $ | 117 |
|
_____________________
(1) Presented in goodwill and other intangible assets on the consolidated balance sheets.
| |
(1)(2) | The cash purchase priceThis includes a $5 million reduction of $443 million represents the cash transferredright-of-use asset for the acquisition which was allocated as follows: (1) $270 millionunfavorable lease terms relative to market terms for the purchase of net assets of $627 million, and (2) the settlement of pre-existing relationships between CIFGH and Assured Guaranty at a fair value of $173 million.leases acquired from BlueMountain. |
Revenue and net income related to CIFGH from(3) Presented in other liabilities on the CIFGconsolidated balance sheets.
From the BlueMountain Acquisition Date through December 31, 20162019, there were revenues of $32 million and a net loss of $10 million related to BlueMountain included in the consolidated statement of operations were approximately $307 million and $323 million, respectively.operations. For 2016,2019, the Company recognized transaction expenses related to the CIFG Acquisition. These expenses wereBlueMountain Acquisition of $9 million, primarily driven by the fees paidrelated to the Company's legal and financial advisors and to the Company's independent auditor.advisor fees.
CIFG Acquisition-Related Expenses
|
| | | |
| | Year Ended December 31, 2016 |
| | (in millions) |
| Professional services | $ | 2 |
|
| Financial advisory fees | 4 |
|
| Total | $ | 6 |
|
The Company has determined that the presentation of pro-forma information is impractical for the CIFG Acquisition as historical financial records are not available on a U.S. GAAP basis.
Radian Asset Assurance Inc.
On April 1, 2015 (Radian Acquisition Date), AGC completed the acquisition (Radian Asset Acquisition) of all of the issued and outstanding capital stock of financial guaranty insurer Radian Asset Assurance Inc. (Radian Asset) for $804.5 million; the cash consideration was paid from AGC's available funds and from the proceeds of a $200 million loan from AGC’s direct parent, AGUS. AGC repaid the loan in full to AGUS on April 14, 2015. Radian Asset was merged with and into AGC, with AGC as the surviving company of the merger. The Radian Asset Acquisition added $13.6 billion to the Company's net par outstanding on April 1, 2015.
The Radian Asset Acquisition was accounted for under the acquisition method of accounting which required that the assets and liabilities acquired be recorded at fair value. The Company was required to exercise significant judgment to determine the fair value of the assets it acquired and liabilities it assumed in the Radian Asset Acquisition. The most significant of these determinations related to the valuation of Radian Asset's financial guaranty insurance and credit derivative contracts. On an aggregate basis, Radian Asset’s contractual premiums for financial guaranty contracts were less than the premiums a market participant of similar credit quality would demand to acquire those contracts at the Radian Acquisition Date, particularly for below-investment-grade (BIG) transactions, resulting in a significant amount of the purchase price being allocated to these contracts. For information on the methodology the Company used to measure the fair value of assets it acquired and liabilities it assumed in the Radian Asset Acquisition, including financial guaranty insurance and credit derivative contracts, please refer to Note 7, Fair Value Measurement.
The fair value of the Company's stand-ready obligation for financial guaranty insurance contracts on the Radian Acquisition Date is recorded in unearned premium reserve (please refer to Note 6, Contracts Accounted for as Insurance for additional information on stand-ready obligation). At the Radian Acquisition Date, the fair value of each financial guaranty insurance contract acquired was in excess of the expected losses for each contract and therefore no explicit loss reserves were recorded on the Radian Acquisition Date. Loss reserves and loss and LAE are recorded when the expected losses for each contract exceeds the remaining unearned premium reserve, in accordance with the Company's accounting policy described in Note 6, Contracts Accounted for as Insurance. The expected losses assumed by the Company as part of the Radian Asset Acquisition are included in the description of expected losses to be paid under Note 5, Expected Loss to be Paid.
The excess of the fair value of net assets acquired over the consideration transferred was recorded as a bargain purchase gain in "bargain purchase gain and settlement of pre-existing relationships" in net income. In addition, the Company and Radian Asset had pre-existing reinsurance relationships, which were effectively settled at fair value on the Radian Acquisition Date. The gain on settlement of these pre-existing reinsurance relationships primarily represents the net difference between the historical ceded balances that were recorded by AGM and the fair value of assumed balances acquired from Radian Asset. The Company believes the bargain purchase resulted from the announced desire of Radian Guaranty Inc. to focus its business strategy on the mortgage and real estate markets and to monetize its investment in Radian Asset and thereby accelerate its ability to comply with the financial requirements of the final Private Mortgage Insurer Eligibility Requirements.
The following table shows the net effectpresents details of the Radian Asset Acquisition at the Radian Acquisition Date, including the effects of the settlement of pre-existing relationships.identified intangible assets acquired:
Finite-Lived
Intangible Assets Acquired
|
| | | | | |
| | Fair Value | | Estimated Weighted Average Useful Life |
| | (in millions) | | |
| CLO contracts | $ | 42 |
| | 9.0 years |
| Investment management contracts | 24 |
| | 4.8 years |
| CLO distribution network | 9 |
| | 5.0 years |
| Trade name | 3 |
| | 10.0 years |
| Favorable sublease | 1 |
| | 4.4 years |
| Total finite-lived intangible assets, net | $ | 79 |
| |
|
|
| | | | | | | | | | | |
| | Fair Value of Net Assets Acquired, before Settlement of Pre-existing Relationships | | Net effect of Settlement of Pre-existing Relationships | | Net Effect of Radian Asset Acquisition |
| | (in millions) |
| Cash purchase price(1) | $ | 804 |
| | $ | — |
| | $ | 804 |
|
| Identifiable assets acquired: | | | | | |
| Investments | 1,473 |
| | — |
| | 1,473 |
|
| Cash | 4 |
| | — |
| | 4 |
|
| Ceded unearned premium reserve | (3 | ) | | (65 | ) | | (68 | ) |
| Credit derivative assets | 30 |
| | — |
| | 30 |
|
| Deferred tax asset, net | 263 |
| | (56 | ) | | 207 |
|
| Financial guaranty variable interest entities’ assets | 122 |
| | — |
| | 122 |
|
| Other assets | 86 |
| | (67 | ) | | 19 |
|
| Total assets | 1,975 |
| | (188 | ) | | 1,787 |
|
| | |
| | | | |
| Liabilities assumed: | | | | | |
| Unearned premium reserves | 697 |
| | (216 | ) | | 481 |
|
| Credit derivative liabilities | 271 |
| | (26 | ) | | 245 |
|
| Financial guaranty variable interest entities’ liabilities | 118 |
| | — |
| | 118 |
|
| Other liabilities | 30 |
| | (49 | ) | | (19 | ) |
| Total liabilities | 1,116 |
| | (291 | ) | | 825 |
|
| Net asset effect of Radian Asset Acquisition | 859 |
| | 103 |
| | 962 |
|
| Bargain purchase gain and settlement of pre-existing relationships resulting from Radian Asset Acquisition, after-tax | 55 |
| | 103 |
| | 158 |
|
| Deferred tax | — |
| | 56 |
| | 56 |
|
| Bargain purchase gain and settlement of pre-existing relationships resulting from Radian Asset Acquisition, pre-tax | $ | 55 |
| | $ | 159 |
| | $ | 214 |
|
_____________________
| |
(1) | The cash purchase price of $804 million was the cash transferred for the acquisition which was allocated as follows: (1) $987 million for the purchase of net assets of $1,042 million, and (2) the settlement of pre-existing relationships between Radian Asset and Assured Guaranty at a fair value of $(183) million. |
Revenue and net income related to Radian Asset from the Radian Acquisition Date through December 31, 2015 included in the consolidated statement of operations were approximately $560 million and $366 million, respectively. In 2015, the Company recorded transaction expenses related to the Radian Asset Acquisition in net income as part of other operating expenses. These expenses were primarily driven by the fees paid to the Company's legal and financial advisors and to the Company's independent auditor.
Radian Asset Acquisition-Related Expenses
|
| | | |
| | Year Ended December 31, 2015 |
| | (in millions) |
| Professional services | $ | 2 |
|
| Financial advisory fees | 10 |
|
| Total | $ | 12 |
|
Unaudited Pro Forma Results of Operations
The following unaudited pro forma information presents the combined results of operations of Assured Guaranty and Radian AssetBlueMountain as if the acquisition had been completed on January 1, 2014,2018, as required under GAAP. The pro forma accounts include the estimated historical results of the Company and Radian Asset and pro forma adjustments primarily comprising the earning of the unearned premium reserve and the expected losses that would be recognized in net income for each prior period presented, as well as the accounting for bargain purchase gain, settlement of pre-existing relationships and Radian Asset acquisition related expenses,both companies, all net of tax at the applicable statutory rate.
The unaudited pro forma combined financial information is presented for illustrative purposes only and does not indicate the financial results of the combined company had the companies actually been combined as of January 1, 2014,2018, nor is it indicative of the results of operations in future periods.
Unaudited Pro Forma Results of Operations(1)
| | | | Year Ended December 31, 2015 | | Year Ended December 31, 2014 | Year Ended
December 31, 2019 | | Year Ended
December 31, 2018 |
| | (in millions, except per share amounts) | (dollars in millions) |
| Pro forma revenues | $ | 2,030 |
| | $ | 2,501 |
| $ | 1,079 |
| | $ | 1,210 |
|
| Pro forma net income | 922 |
| | 1,531 |
| 358 |
| | 436 |
|
| Pro forma earnings per share (EPS): | | | | | | |
| Basic | 6.22 |
| | 8.86 |
| 3.60 |
| | 3.96 |
|
| Diluted | 6.18 |
| | 8.81 |
| 3.57 |
| | 3.92 |
|
_____________________
| |
| (1) | Pro forma adjustments were made for transaction expenses, amortization of intangible assets and income tax impact related to the BlueMountain Acquisition as if the companies had been combined as of January 1, 2018. |
MBIA UK Insurance Limited
On January 10, 2017, AGL announced that its subsidiary AGC completed its acquisition of MBIA UK Insurance Limited (MBIA UK) (the MBIA UK Acquisition), the EuropeanU.K. operating subsidiary of MBIA Insurance Corporation (MBIA), in accordance with the agreement announced on September 29, 2016.January 10, 2017 (the MBIA UK Acquisition Date). As consideration for the outstanding shares of MBIA UK plus $23 million in cash, AGC exchanged all its holdings of notes issued in the Zohar II 2005-1 transaction.transaction (Zohar II Notes), which were insured by MBIA. AGC’s Zohar II 2005-1 notesNotes had a total outstanding principal of approximately $347 million and fair value of $334 million as of the date of acquisition. MBIA insured all of the notes issued in the Zohar II 2005-1 transaction. As of December 31, 2016, MBIA UK had an insured portfolio ofAcquisition Date. The MBIA UK Acquisition added approximately $12 billion of net par.par insured on January 10, 2017.
MBIA UK has beenwas renamed Assured Guaranty (London) Ltd. (AGLN)and on June 1, 2017, was re-registered as a public limited company (plc). The Company combined the operations of its European subsidiaries, AGE UK, Assured Guaranty currently maintains AGLN as a stand-alone entity.(UK) plc (AGUK), Assured Guaranty is actively working(London) plc (AGLN) and CIFG Europe S.A. (CIFGE) on November 7, 2018. Under the combination, AGUK, AGLN and CIFGE transferred their insurance portfolios to combine AGLNand merged with its other affiliated European insurance companies. Any such combination will be subject to regulatory and court approvals; as a result, Assured Guaranty cannot predict when, or if, such a combination will be completed.into AGE UK (the Combination).
The Company is infollowing table shows the processnet effect of allocating the purchase price toMBIA UK Acquisition on January 10, 2017, including the assets acquired and liabilities assumed and conforming accounting policies but has not yet completedeffects of the acquisition date balance sheet. The Company intends to include this information in its first quarter 2017 Form 10-Q.settlement of pre-existing relationships.
|
| | | | | | | | | | | |
| | Fair Value of Net Assets Acquired, before Settlement of Pre-existing Relationships | | Net effect of Settlement of Pre-existing Relationships | | Net Effect of MBIA UK Acquisition |
| | (in millions) |
| Purchase price (1) | $ | 334 |
| | $ | — |
| | $ | 334 |
|
| | | | | | |
| Identifiable assets acquired: | | | | | |
| Investments | 459 |
| | — |
| | 459 |
|
| Cash | 72 |
| | — |
| | 72 |
|
| Premiums receivable, net of commissions payable | 274 |
| | (4 | ) | | 270 |
|
| Other assets | 16 |
| | (6 | ) | | 10 |
|
| Total assets | 821 |
| | (10 | ) | | 811 |
|
| | |
| | | | |
|
| Liabilities assumed: | | | | | |
| Unearned premium reserves | 389 |
| | (6 | ) | | 383 |
|
| Current tax payable | 25 |
| | — |
| | 25 |
|
| Other liabilities | 4 |
| | (5 | ) | | (1 | ) |
| Total liabilities | 418 |
| | (11 | ) | | 407 |
|
| Net assets of MBIA UK | 403 |
| | 1 |
| | 404 |
|
| Cash acquired from MBIA Holdings | 23 |
| | — |
| | 23 |
|
| Deferred tax liability | (36 | ) | | — |
| | (36 | ) |
| Net asset effect of MBIA UK Acquisition | 390 |
| | 1 |
| | 391 |
|
| Bargain purchase gain and settlement of pre-existing relationships resulting from MBIA UK Acquisition, after-tax | 56 |
| | 1 |
| | 57 |
|
| Deferred tax | — |
| | 1 |
| | 1 |
|
| Bargain purchase gain and settlement of pre-existing relationships resulting from MBIA UK Acquisition, pre-tax | $ | 56 |
| | $ | 2 |
| | $ | 58 |
|
| |
3.(1) | Rating ActionsThe purchase price of $334 million was allocated as follows: (1) $329 million for the purchase of net assets of $385 million, and (2) the settlement of pre-existing relationships between MBIA UK and Assured Guaranty at a fair value of $5 million |
The Company believes the bargain purchase gain resulted from MBIA's strategy to address its insurance obligations with regards to the Zohar II Notes, the issuers of which MBIA did not expect would have sufficient funds to repay such notes in full on the scheduled maturity date of such notes in January 2017.
Revenue and net income (excluding the effects of subsequent tax reform) related to MBIA UK from the MBIA UK Acquisition Date through December 31, 2017 included in the consolidated statement of operations were approximately $192 million and $139 million, respectively, including the bargain purchase gain, settlement of pre-existing relationships, activity during the year and realized gain on the disposition of AGC's Zohar II Notes. For 2017, the Company recognized transaction expenses related to the MBIA UK Acquisition of $7 million, primarily related to legal and financial advisors fees.
WhenReinsurance of Syncora Guarantee Inc.’s Insured Portfolio
On June 1, 2018, the Company closed a rating agency assignsreinsurance transaction with Syncora Guarantee Inc. (SGI) under which AGC assumed, generally on a 100% quota share basis, substantially all of SGI’s insured portfolio and AGM reassumed a book of business previously ceded to SGI by AGM (SGI Transaction). As of June 1, 2018, the net par value of exposures reinsured and commuted totaled approximately $12 billion (including credit derivative net par of approximately $1.5 billion). The reinsured portfolio consists predominantly of public ratingfinance and infrastructure obligations that meet AGC’s underwriting criteria and generated $330 million of gross written premiums. On June 1, 2018, as consideration, SGI paid $363 million and assigned to aAssured Guaranty financial obligation guaranteed by oneguaranty future insurance installment premiums of $45 million, and future credit derivative installments of approximately $17 million. The assumed portfolio from SGI included BIG contracts which had, as of June 1, 2018, expected losses to be paid of $131 million (present value basis using risk free rates), which will be expensed over the expected terms of those contracts as unearned premium reserve amortizes. In connection with the SGI Transaction, the Company incurred and expensed $4 million in fees to professional advisors.
The effect of the SGI Transaction on the insurance and credit derivative balances as of June 1, 2018 is summarized below: |
| | | | | | | | | | | | |
| | | Commutation | | Assumption | | Total |
| | | (in millions) |
| Cash | | $ | 20 |
| | $ | 343 |
| | $ | 363 |
|
| | | | | | | |
| Premiums receivable/payable, net of commissions | | $ | 16 |
| | $ | 45 |
| | $ | 61 |
|
| Unearned premium reserve, net | | (56 | ) | | (319 | ) | | (375 | ) |
| Credit derivative liability, net | | — |
| | (68 | ) | | (68 | ) |
| Other | | 2 |
| | (1 | ) | | 1 |
|
| Impact to net assets (liabilities), excluding cash | | $ | (38 | ) | | $ | (343 | ) | | $ | (381 | ) |
| | | | | | | |
| Commutation loss | | $ | 18 |
| | $ | — |
| | $ | 18 |
|
Additionally, beginning on June 1, 2018, on behalf of SGI, AGC began providing certain administrative services on the assumed portfolio, including surveillance, risk management, and claims processing.
3. Ratings
The financial strength ratings (or similar ratings) for AGL’s insurance company subsidiaries, it generally awards that obligationalong with the same rating it has assigned to the financial strengthdate of the AGL subsidiary that provides the guaranty. Investors in products insured by AGL’s insurance company subsidiaries frequently rely on ratings publishedmost recent rating action (or confirmation) by the rating agencies because such ratings influenceagency, are shown in the trading value of securities and form the basis for many institutions’ investment guidelines as well as individuals’ bond purchase decisions. Therefore, the Company manages its business with the goal of achieving strong financial strength ratings. However, the methodologies and models used by rating agencies differ, presenting conflicting goals that may make it inefficient or impractical to reach the highest rating level. The methodologies and models are not fully transparent, contain subjective elements and data (such as assumptions about future market demand for the Company’s products) and may change.table below. Ratings are subject to continuous rating agency review and revision or withdrawal at any time. IfIn addition, the financial strength ratings of one (or more) of the Company’s insurance subsidiaries were reduced below current levels, the Company expects it could have adverse effects on the impacted subsidiary's future business opportunities as well as the premiums the impacted subsidiary could charge for its insurance policies.
The Company periodically assesses the value of each rating assigned to each of its companies, and as a result of such assessment may request that a rating agency add or drop a rating from certain of its companies. For example, the Kroll Bond Rating Agency (KBRA) ratings were first assigned to MAC in 2013, to AGM in 2014, and to AGC in 2016, while the A.M. Best Company, Inc. (Best) rating was first assigned to Assured Guaranty Re Overseas Ltd. (AGRO) in 2015, and a Moody's Investors Service, Inc. (Moody's) rating was never requested for MAC and was dropped from AG Re and AGRO in 2015. On January 13, 2017, AGC announced that it had requested that Moody's withdraw its financial strength rating of AGC.
In the last several years, S&P Global Ratings, a division of Standard & Poor's Financial Services LLC (S&P) and Moody's have changed, multiple times, their financial strength ratings of AGL's insurance subsidiaries, or changed the outlook on such ratings. More recently, KBRA and Best have assigned financial strength ratings to some of AGL's insurance subsidiaries. The rating agencies' most recent actions related to AGL's insurance subsidiaries are: |
| | | | | | | |
| S&P Global Ratings, a division of Standard & Poor’s Financial Services LLC | | Kroll Bond Rating Agency | | Moody’s Investors Service, Inc. | | A.M. Best Company, Inc. |
| AGM | AA (stable) (11/7/19) | | AA+ (stable) (12/19/19) | | A2 (stable) (8/13/19) | | — |
| AGC | AA (stable) (11/7/19) | | AA (stable) (11/22/19) | | (1) | | — |
| MAC | AA (stable) (11/7/19) | | AA+ (stable) (7/12/19) | | — | | — |
| AG Re | AA (stable) (11/7/19) | | — | | — | | — |
| AGRO | AA (stable) (11/7/19) | | — | | — | | A+ (stable) (7/12/19) |
| AGE UK | AA (stable) (11/7/19) | | AA+ (stable) (12/19/19) | | A2 (stable) (8/13/19) | | — |
| AGE SA | AA (stable) (1/29/20) | | AA+ (stable) (1/21/20) | | — | | — |
On September 20, 2016, KBRA assigned a financial strength rating of AA (stable outlook) to AGC. On December 14, 2016 and July 8, 2016, KBRA affirmed the AA+ (stable outlook) financial strength ratings of AGM and MAC, respectively.___________________
| |
| (1) | AGC requested that Moody’s Investors Service, Inc. (Moody's) withdraw its financial strength ratings of AGC in January 2017, but Moody's denied that request. Moody’s continues to rate AGC A3 (stable). |
On August 8, 2016, Moody's affirmed the A2 (stable outlook) on AGM and AGE and A3 insurance financial strength rating on AGC and AGC's subsidiary Assured Guaranty (U.K.) Ltd. (AGUK) raising the outlook to stable from negative, although AGC has requested that Moody's withdraw its financial strength rating of AGC and AGUK. Effective April 8, 2015, at the Company's request, Moody’s withdrew the financial strength ratings it had assigned to AG Re and AGRO.
On July 27, 2016, S&P affirmed the AA (stable) financial strength ratings of AGL's insurance subsidiaries.
On May 27, 2016, Best affirmed the A+ (stable) financial strength rating, which is their second highest rating, of AGRO.
There can be no assurance that any of the rating agencies will not take negative action on theirthe financial strength ratings (or similar ratings) of AGL's insurance subsidiaries in the future.future or cease to rate one or more of AGL's insurance subsidiaries, either voluntarily or at the request of that subsidiary.
For a discussion of the effects of rating actions on the Company, see the following:
Note 6,7, Contracts Accounted for as Insurance,
and Note 8, Contracts Accounted forReinsurance.
4. Segment Information
The Company reports its results of operations consistent with the manner in which the Company's chief operating decision maker (CODM) reviews the business to assess performance and allocate resources. Prior to the BlueMountain Acquisition Date, the Company's operating subsidiaries were all insurance companies, and results of operations were viewed by the CODM as Credit Derivatives
Note 13, Reinsurance1 segment. Beginning in fourth quarter 2019, with the BlueMountain Acquisition and expansion into the asset management business, the Company established the Assured Investment Management platform and now operates in 2 distinct segments, Insurance and Asset Management. The following describes the components of each segment, along with the Corporate division and Other Monoline Exposurescategories. The Insurance and Asset Management segments are presented without giving effect to the consolidation of the FG VIEs and investment vehicles. See Note 14, Variable Interest Entities.
The Insurance segment primarily consists of the Company's domestic and foreign insurance subsidiaries and their wholly-owned subsidiaries that provide credit protection products to the U.S. and international public finance (including infrastructure) and structured finance markets. The Insurance segment also includes the income (loss) from its proportionate equity investments in funds managed by Assured Investment Management (Assured Investment Management funds).
The Asset Management segment consists of the Company's Assured Investment Management subsidiaries, which provide asset management services to outside investors as well as to the Company's Insurance segment.
The Corporate division consists primarily of interest expense on the debt of AGUS and AGMH, as well as other operating expenses attributed to holding company activities, including administrative services performed by operating subsidiaries for the holding companies.
Other items consist of intersegment eliminations, reclassifications, and consolidation adjustments, including the effect of consolidating FG VIEs and certain Assured Investment Management investment vehicles in which Insurance segment invests. See Note 14. Variable Interest Entities.
The Company does not report assets by reportable segment as the CODM does not use assets to assess performance and allocate resources and only reviews assets at a consolidated level.
Total adjusted operating income includes the effect of consolidating both FG VIEs and investment vehicles; however the effect of consolidating such entities, including the related eliminations, is included in the "other" column in the tables below, which represents the CODM's view, consistent with the management approach guidance for presentation of segment metrics.
The Company analyzes the operating performance of each segment using "adjusted operating income." Results for each segment include specifically identifiable expenses as well as allocations of expenses between legal entities based on time studies and other cost allocation methodologies based on headcount or other metrics. Adjusted operating income is defined as net income (loss) attributable to AGL, as reported under GAAP, adjusted for the following:
| |
4.1) | Outstanding ExposureElimination of realized gains (losses) on the Company’s investments, except for gains and losses on securities classified as trading. |
| |
| 2) | Elimination of non-credit-impairment unrealized fair value gains (losses) on credit derivatives that are recognized in net income, which is the amount of unrealized fair value gains (losses) in excess of the present value of the expected estimated economic credit losses, and non-economic payments. |
| |
| 3) | Elimination of fair value gains (losses) on the Company’s committed capital securities (CCS) that are recognized in net income. |
| |
| 4) | Elimination of foreign exchange gains (losses) on remeasurement of net premium receivables and loss and LAE reserves that are recognized in net income. |
| |
| 5) | Elimination of the tax effects related to the above adjustments, which are determined by applying the statutory tax rate in each of the jurisdictions that generate these adjustments. |
The following tables present the Company's operations by operating segment. The information for prior years has been conformed to the new segment presentation.
Segment Information (1)
|
| | | | | | | | | | | | | | | | | | | |
| | Year Ended December 31, 2019 |
| | Insurance | | Asset Management | | Corporate | | Other | | Total |
| | (in millions) |
| Net investment income | $ | 383 |
| | $ | — |
| | $ | 4 |
| | $ | (9 | ) | | $ | 378 |
|
| Interest expense | — |
| | — |
| | 94 |
| | (5 | ) | | 89 |
|
| Non-cash compensation and operating expenses (1) | 39 |
| | 3 |
| | 6 |
| | — |
| | 48 |
|
| | | | | | | | | | |
| Intersegment revenues | $ | 5 |
| | $ | — |
| | $ | — |
| | $ | (5 | ) | | $ | — |
|
| Third-party revenues | 912 |
| | 22 |
| | 3 |
| | 27 |
| | 964 |
|
| Total revenues | 917 |
| | 22 |
| | 3 |
| | 22 |
| | 964 |
|
| Total expenses | 324 |
| | 34 |
| | 133 |
| | 25 |
| | 516 |
|
| Income (loss) before income taxes and equity in net earnings of investees | 593 |
| | (12 | ) | | (130 | ) | | (3 | ) | | 448 |
|
| Equity in net earnings of investees | 2 |
| | — |
| | — |
| | 2 |
| | 4 |
|
| Adjusted operating income (loss) before income taxes | 595 |
| | (12 | ) | | (130 | ) | | (1 | ) | | 452 |
|
| Provision (benefit) for income taxes | 83 |
| | (2 | ) | | (19 | ) | | — |
| | 62 |
|
| Noncontrolling interests | — |
| | — |
| | — |
| | (1 | ) | | (1 | ) |
| Adjusted operating income (loss) | 512 |
| | (10 | ) | | (111 | ) | | — |
| | 391 |
|
| Reconciling items from adjusted operating income (loss) to net income (loss) attributable to AGL: | | | | | | | | | |
| Plus pre-tax adjustments: | | | | | | | | | |
| Realized gains (losses) on investments | | | | | | | | | 22 |
|
| Non-credit impairment unrealized fair value gains (losses) on credit derivatives | | | | | | | | | (10 | ) |
| Fair value gains (losses) on CCS | | | | | | | | | (22 | ) |
| Foreign exchange gains (losses) on remeasurement of premiums receivable and loss and LAE reserves | | | | | | | | | 22 |
|
| Total pre-tax adjustments |
|
| |
|
| |
|
| |
|
| | 12 |
|
| Plus tax effect on pre-tax adjustments | | | | | | | | | (1 | ) |
| Net income (loss) attributable to AGL |
|
| |
|
| |
|
| |
|
| | $ | 402 |
|
|
| | | | | | | | | | | | | | | | | | | |
| Year Ended December 31, 2018 |
| Insurance |
| Asset Management | | Corporate |
| Other |
| Total |
| (in millions) |
| Net investment income | $ | 396 |
|
| $ | — |
| | $ | 6 |
| | $ | (7 | ) |
| $ | 395 |
|
| Interest expense | — |
| | — |
| | 97 |
| | (3 | ) |
| 94 |
|
| Non-cash compensation and operating expenses (1) | 35 |
| | — |
| | 6 |
| | — |
|
| 41 |
|
| | | | | | | | | | |
| Intersegment revenues | $ | 3 |
| | $ | — |
| | $ | — |
| | $ | (3 | ) | | $ | — |
|
| Third-party revenues | 989 |
| | — |
| | (28 | ) | | (2 | ) | | 959 |
|
| Total revenues | 992 |
| | — |
| | (28 | ) | | (5 | ) |
| 959 |
|
| Total expenses | 302 |
| | — |
| | 129 |
| | — |
|
| 431 |
|
| Income (loss) before income taxes and equity in net earnings of investees | 690 |
| | — |
| | (157 | ) | | (5 | ) | | 528 |
|
| Equity in net earnings of investees | 1 |
| | — |
| | — |
| | — |
| | 1 |
|
| Adjusted operating income (loss) before income taxes | 691 |
| | — |
| | (157 | ) | | (5 | ) | | 529 |
|
| Provision (benefit) for income taxes | 109 |
| | — |
| | (61 | ) | | (1 | ) | | 47 |
|
| Noncontrolling interests | — |
| | — |
| | — |
| | — |
| | — |
|
| Adjusted operating income (loss) | 582 |
| | — |
| | (96 | ) | | (4 | ) | | 482 |
|
| Reconciling items from adjusted operating income (loss) to net income (loss) attributable to AGL: | | | | | | | |
|
|
|
| Plus pre-tax adjustments: | | | | | | | |
|
|
|
| Realized gains (losses) on investments | | | | | | | |
| (32 | ) |
| Non-credit impairment unrealized fair value gains (losses) on credit derivatives |
|
| | | |
|
| |
|
|
| 101 |
|
| Fair value gains (losses) on CCS |
|
| | | |
|
| |
|
|
| 14 |
|
| Foreign exchange gains (losses) on remeasurement of premiums receivable and loss and LAE reserves | | | | | | | |
| (32 | ) |
| Total pre-tax adjustments | | | | | | | |
| 51 |
|
| Plus tax effect on pre-tax adjustments | | | | | | | |
| (12 | ) |
| Net income (loss) attributable to AGL | | | | | | | |
| $ | 521 |
|
|
| | | | | | | | | | | | | | | | | | | |
| Year Ended December 31, 2017 |
| Insurance |
| Asset Management | | Corporate |
| Other |
| Total |
| (in millions) |
| Net investment income | $ | 423 |
|
| $ | — |
| | $ | 2 |
| | $ | (8 | ) |
| $ | 417 |
|
| Interest expense | — |
| | — |
| | 100 |
| | (3 | ) |
| 97 |
|
| Non-cash compensation and operating expenses (1) | 36 |
| | — |
| | 5 |
| | — |
|
| 41 |
|
| | | | | | | | | | |
| Intersegment revenues | $ | 3 |
| | $ | — |
| | $ | — |
| | $ | (3 | ) | | $ | — |
|
| Third-party revenues | 1,556 |
| | — |
| | (8 | ) | | 10 |
| | 1,558 |
|
| Total revenues | 1,559 |
| | — |
| | (8 | ) | | 7 |
| | 1,558 |
|
| Total expenses | 586 |
| | — |
| | 129 |
| | (10 | ) |
| 705 |
|
| Income (loss) before income taxes and equity in net earnings of investees | 973 |
| | — |
| | (137 | ) | | 17 |
| | 853 |
|
| Equity in net earnings of investees | — |
| | — |
| | — |
| | — |
| | — |
|
| Adjusted operating income (loss) before income taxes | 973 |
| | — |
| | (137 | ) | | 17 |
| | 853 |
|
| Provision (benefit) for income taxes | 241 |
| | — |
| | (54 | ) | | 5 |
|
| 192 |
|
| Noncontrolling interests | — |
| | — |
| | — |
| | — |
| | — |
|
| Adjusted operating income (loss) | 732 |
| | — |
| | (83 | ) | | 12 |
|
| 661 |
|
| Reconciling items from adjusted operating income (loss) to net income (loss) attributable to AGL: | | | | | | | |
|
|
|
| Plus pre-tax adjustments: | | | | | | | |
|
|
|
| Realized gains (losses) on investments | | | | | | | |
| 40 |
|
| Non-credit impairment unrealized fair value gains (losses) on credit derivatives | | | | | | | |
| 43 |
|
| Fair value gains (losses) on CCS |
|
| | | |
|
| |
|
|
| (2 | ) |
| Foreign exchange gains (losses) on remeasurement of premiums receivable and loss and LAE reserves |
|
| | | |
|
| |
|
|
| 57 |
|
| Total pre-tax adjustments | | | | | | | |
| 138 |
|
| Plus tax effect on pre-tax adjustments | | | | | | | |
| (69 | ) |
| Net income (loss) attributable to AGL | | | | | | | |
| $ | 730 |
|
_____________________
| |
| (1) | Consists of amortization of DAC and intangible assets, depreciation and share-based compensation. |
Revenue by Country of Domicile
|
| | | | | | | | | | | |
| | Year Ended December 31, |
| | 2019 | | 2018 | | 2017 |
| | (in millions) |
| U.S. | $ | 761 |
| | $ | 732 |
| | $ | 1,193 |
|
| Bermuda | 161 |
| | 203 |
| | 224 |
|
| U.K. and other | 42 |
| | 24 |
| | 141 |
|
| Total | $ | 964 |
| | $ | 959 |
| | $ | 1,558 |
|
The following table reconciles the Company's total GAAP revenues to segment revenues:
Reconciliation of Total GAAP Revenues to Segment Revenues
|
| | | | | | | | | | | |
| | Year Ended December 31, |
| | 2019 | | 2018 | | 2017 |
| | (in millions) |
| Total GAAP revenues | $ | 963 |
| | $ | 1,001 |
| | $ | 1,739 |
|
| Less: Realized gains (losses) on investments | 22 |
| | (32 | ) | | 40 |
|
| Less: Non-credit impairment unrealized fair value gains (losses) on credit derivatives | (10 | ) | | 101 |
| | 43 |
|
| Less: Fair value gains (losses) on CCS | (22 | ) | | 14 |
| | (2 | ) |
| Less: Foreign exchange gains (losses) on remeasurement of premiums receivable and loss and LAE reserves | 22 |
| | (32 | ) | | 57 |
|
| Plus: Credit derivative impairment (recoveries) (1) | 13 |
| | 9 |
| | (43 | ) |
| Total segment revenues | $ | 964 |
| | $ | 959 |
| | $ | 1,558 |
|
_____________________
| |
| (1) | Credit derivative impairment (recoveries) are included in "Net change in fair value of credit derivatives" in the Company's consolidated statements of operations. |
The following table reconciles the Company's total GAAP expenses to segment expenses:
Reconciliation of Total GAAP Expenses to Segment Expenses
|
| | | | | | | | | | | |
| | Year Ended December 31, |
| | 2019 |
| 2018 |
| 2017 |
| | (in millions) |
| Total GAAP expenses | $ | 503 |
| | $ | 422 |
| | $ | 748 |
|
| Plus: Credit derivative impairment (recoveries) (1) | 13 |
| | 9 |
| | (43 | ) |
| Total segment expenses | $ | 516 |
| | $ | 431 |
| | $ | 705 |
|
_____________________
| |
| (1) | Credit derivative impairment (recoveries) are included in "Net change in fair value of credit derivatives" in the Company's consolidated statements of operations. |
5. Outstanding Insurance Exposure
The Company primarily sells credit protection contracts in financial guaranty insurance form. Until 2009, the Company also sold credit protection by issuing policies that guaranteed payment obligations under credit derivatives, primarily credit default swaps (CDS). The Company's contracts accounted for as credit derivatives are generally structured such that the circumstances giving rise to the Company’s obligation to make loss payments are similar to those for its financial guaranty insurance contracts. The Company has not entered into any new CDS in order to sell credit protection in the U.S. since the beginning of 2009, when regulatory guidelines were issued that limited the terms under which such protection could be sold. The capital and margin requirements applicable under the Dodd-Frank Wall Street Reform and Consumer Protection Act also contributed to the Company not entering into such new CDS in the U.S. since 2009. The Company has, however, acquired or reinsured portfolios both before and after 2009 that include financial guaranty contracts are written in either insurance or credit derivative form, but collectively are considered financial guaranty contracts. form.
The Company also writes specialty insurance that is consistent with its risk profile and benefits from its underwriting experience.
The Company seeks to limit its exposure to losses by underwriting obligations that it views as investment grade at inception, although on occasion it may underwrite new issuances that it views as BIG, typically as part of its loss mitigation strategy for existing troubled credits,exposures. The Company also seeks to acquire portfolios of insurance from financial guarantors that are no longer writing new business by acquiring such companies, providing reinsurance on a portfolio of insurance or reassuming a portfolio of reinsurance it had previously ceded; in such instances, it evaluates the risk characteristics of the target portfolio, which may underwrite new issuances that it viewsinclude some BIG exposures, as BIG.a whole in the context of the proposed transaction. The Company diversifies its insured portfolio across asset classes and, in the structured finance portfolio, typically requires rigorous subordination or collateralization requirements.collateral to protect it from loss. Reinsurance may be used in order to reduce net exposure to certain insured transactions.
Public finance obligations insured by the Company primarily consist primarily of general obligation bonds supported by the taxing powers of U.S. state or municipal governmental authorities, as well as tax-supported bonds, revenue bonds and other obligations supported by covenants from state or municipal governmental authorities or other municipal obligors to impose and collect fees and charges for public services or specific infrastructure projects. The Company also includes within public finance obligations those obligations backed by the cash flow from leases or other revenues from projects serving substantial public purposes, including utilities, toll roads, health carehealthcare facilities and government office buildings. The Company also includes within public finance similar obligations issued by territorial and non-U.S. sovereign and sub-sovereign issuers and governmental authorities.
Structured finance obligations insured by the Company are generally issued by special purpose entities, including VIEs, and backed by pools of assets having an ascertainable cash flow or market value or other specialized financial obligations. Some of these VIEs are consolidated as described in Note 9, Consolidated14, Variable Interest Entities. Unless
otherwise specified, the outstanding par and debt service amounts presented in this note include outstanding exposures on VIEs whether or not they are consolidated. The Company also provides specialty insurance and reinsurance on transactions without special purpose entities but with similar risk profiles to its structured finance exposures written in financial guaranty form.
Second-to-pay insured par outstanding represents transactions the Company has insured that are already insured by another financial guaranty insurer and where the Company's obligation to pay under its insurance of such transactions arises only if both the obligor on the underlying insured obligation and the primary financial guaranty insurer default. The Company underwrites such transactions based on the underlying insured obligation without regard to the primary financial guaranty insurer and internally rates the transaction the higher of the rating of the underlying obligation and the rating of the primary financial guarantor. The second-to-pay insured par outstanding as of December 31, 2019 and 2018 was $6.6 billion and $6.7 billion, respectively. The par on second-to-pay exposure where the ratings of the primary financial guaranty insurer and underlying insured transaction that are BIG was $105 million and $111 million as of December 31, 2019 and December 31, 2018, respectively.
Significant Risk Management Activities
The Portfolio Risk Management Committee, which includes members of senior management and senior creditrisk and surveillance officers, setsestablishes company-wide credit policy for the Company's direct and assumed business. It implements specific risk policiesunderwriting procedures and limits for the Company and allocates underwriting capacity among the Company's subsidiaries. The Portfolio Risk Management Committee is responsible for enterprise risk management establishingfor the Company'soverall company and focuses on measuring and managing credit, market and liquidity risk appetite, credit underwritingfor the overall company. All transactions in new asset classes or new jurisdictions must be approved by this committee. The U.S., U.K., AG Re and AGRO risk management committees conduct an in-depth review of new business,the insured portfolios of the relevant subsidiaries, focusing on varying portions of the portfolio at each meeting. They review and may revise internal ratings assigned to the insured transactions and review sector reports, monthly product line surveillance reports and work-out.compliance reports.
All transactions in the insured portfolio are assigned internal credit ratings by the relevant underwriting committee at inception, which credit ratings are updated by the relevant risk management committee based on changes in transaction credit quality. As part of the surveillance process, the Company monitors trends and changes in transaction credit quality, detects any deterioration in credit quality, and recommends such remedial actions as may be necessary or appropriate. All transactions in the insured portfolio are assigned internal credit ratings, which are updated based on changes in transaction credit quality. The Company also develops strategies to enforce its contractual rights and remedies and to mitigate its losses, engage in negotiation discussions with transaction participants and, when necessary, manage the Company's litigation proceedings.
Surveillance Categories
The Company segregates its insured portfolio into investment grade and BIG surveillance categories to facilitate the appropriate allocation of resources to monitoring and loss mitigation efforts and to aid in establishing the appropriate cycle for periodic review for each exposure. BIG exposures include all exposures with internal credit ratings below BBB-. The Company’s internal credit ratings are based on internal assessments of the likelihood of default and loss severity in the event of default. Internal credit ratings are expressed on a ratings scale similar to that used by the rating agencies and are generally reflective of an approach similar to that employed by the rating agencies, except that the Company's internal credit ratings focus on future performance rather than lifetime performance.
The Company monitors its investment grade credits to determine whether any need to be internally downgraded to BIGinsured portfolio and refreshes its internal credit ratings on individual creditsexposures in quarterly, semi-annual or annual cycles based on the Company’s view of the credit’sexposure’s credit quality, loss potential, volatility and sector. Ratings on creditsexposures in sectors identified as under the most stress or with the most potential volatility are reviewed every quarter. The Company’squarter, although the Company may also review a rating in response to developments impacting the credit when a ratings on assumed credits are based on the Company’s reviews of low-rated credits or credits in volatile sectors, unless such informationreview is not available, in which case,scheduled. For assumed exposures, the Company may use the ceding company’s credit ratings of the transactions are used.where it is impractical for it to assign its own rating.
CreditsExposures identified as BIG are subjected to further review to determine the probability of a loss. See Note 5,6, Expected Loss to be Paid, for additional information. Surveillance personnel then assign each BIG transaction to the appropriate BIG surveillance category based upon whether a future loss is expected and whether a claim has been paid. The Company uses a tax-equivalent yield to calculate the present value of projected payments and recoveries and determine whether a future loss is expected in order to assign the appropriate BIG surveillance category to a transaction. For surveillancefinancial statement measurement purposes, the Company calculates present value using a discount rate of 4% or 5% depending on the insurance subsidiary. (Risk-freeuses risk-free rates, which are used for calculatingdetermined each quarter, to calculate the expected loss for financial statement measurement purposes.)loss.
More extensive monitoring and intervention is employed for all BIG surveillance categories, with internal credit ratings reviewed quarterly. TheFor purposes of determining the appropriate surveillance category, the Company expects “future losses” on a transaction when the Company believes there is at least a 50% chance that, on a present value basis, it will pay more claims in the future ofpay claims on that transaction than itthat will havenot be fully reimbursed. The three BIG categories are:
BIG Category 1: Below-investment-grade transactions showing sufficient deterioration to make future losses possible, but for which none are currently expected.
BIG Category 2: Below-investment-grade transactions for which future losses are expected but for which no claims (other than liquidity claims, which are claims that the Company expects to be reimbursed within one year) have yet been paid.
| |
| • | BIG Category 2: Below-investment-grade transactions for which future losses are expected but for which no claims (other than liquidity claims, which are claims that the Company expects to be reimbursed within one year) have yet been paid. |
BIG Category 3: Below-investment-grade transactions for which future losses are expected and on which claims (other than liquidity claims) have been paid.
Components of Outstanding Exposure
Unless otherwise noted, ratings disclosed herein on the Company's insured portfolio reflect its internal ratings. The Company classifies those portions of risks benefiting from reimbursement obligations collateralized by eligible assets held in trust in acceptable reimbursement structures as the higher of 'AA' or their current internal rating.
Financial Guaranty Exposure
The Company measures its financial guaranty exposure in terms of (a) gross and net par outstanding and (b) gross and net debt service.
The Company typically guarantees the payment of principal and interest when due. Since most of these payments are due in the future, the Company generally uses gross and net par outstanding as a proxy for its financial guaranty exposure. Gross par outstanding generally represents the principal amount of the insured obligation at a point in time. Net par outstanding equals gross par outstanding net of any third-party reinsurance. The Company includes in its par outstanding calculation the impact of any consumer price index inflator to the reporting date as well as, in the case of accreting (zero-coupon) obligations, accretion to the reporting date.
The Company purchases securities that it has insured, and for which it has expected losses to be paid, in order to mitigate the economic effect of insured losses (loss mitigation securities). The Company excludes amounts attributable to loss mitigation securities (unless otherwise indicated) from par and debt service outstanding, which amounts are included in the investment portfolio, because it
the Company manages such securities as investments and not insurance exposure. As of December 31, 20162019 and December 31, 2015,2018, the Company excluded $2.1$1.4 billion and $1.5$1.9 billion, respectively, of net par attributable to loss mitigation securities.
Gross debt service outstanding represents the sum of all estimated future principal and interest payments on the obligations insured, on an undiscounted basis. Net debt service outstanding equals gross debt service outstanding net of any third-party reinsurance. Future debt service payments include the impact of any consumer price index inflator after the reporting date, as well as, in the case of accreting (zero-coupon) obligations, accretion after the reporting date.
The Company calculates its debt service outstanding as follows:
for insured obligations that are not supported by homogeneous pools of assets (which category includes most of the Company's public finance transactions), as the total estimated contractual future principal and interest due through maturity, regardless of whether the obligations may be called and regardless of whether, in the case of obligations where principal payments are due when an underlying asset makes a principal payment, the Company believes the obligations will be repaid prior to contractual maturity;
for insured obligations that are supported by homogeneous pools of assets that are contractually permitted to prepay principal (which category includes, for example, residential mortgage-backed securities (RMBS) and CLOs), as total estimated expected future principal and interest due on insured obligations through their respective expected terms, which includes the Company's expectations as to whether the obligations may be called and, in the case of obligations where principal payments are due when an underlying asset makes a principal payment, when the Company expects principal payments to be made prior to contractual maturity.
The calculation of debt service requires the use of estimates, which the Company updates periodically, including estimates for the expected remaining term of insured obligations supported by homogeneous pools of assets, updated interest rates for floating and variable rate insured obligations, behavior of consumer price indices for obligations with consumer price index inflators, foreign exchange rates and other assumptions based on the characteristics of each insured obligation. The anticipated sunset of London Interbank Offered Rate (LIBOR) at the end of 2021 has introduced another variable into the Company's calculation of future debt service. See the Risk Factor captioned “The Company may be adversely impacted by the transition from LIBOR as a resultreference rate” under Operational Risks in Part 1, Item 1A, Risk Factors. Debt service is a measure of loss mitigation strategies, including loss mitigation securities held in the investment portfolio, which are primarily BIG. The following table presentsestimated maximum potential exposure to insured obligations before considering the grossCompany’s various legal rights to the underlying collateral and netother remedies available to it under its financial guaranty contract.
Actual debt service for financial guaranty contracts.may differ from estimated debt service due to refundings, terminations, negotiated restructurings, prepayments, changes in interest rates on variable rate insured obligations, consumer price index behavior differing from that projected, changes in foreign exchange rates on non-U.S. denominated insured obligations and other factors.
Financial Guaranty Portfolio
Debt Service Outstanding
|
| | | | | | | | | | | | | | | |
| | Gross Debt Service Outstanding | | Net Debt Service Outstanding |
| | As of December 31, 2019 | | As of December 31, 2018 | | As of December 31, 2019 | | As of December 31, 2018 |
| | (in millions) |
| Public finance | $ | 363,497 |
| | $ | 361,511 |
| | $ | 362,361 |
| | $ | 358,438 |
|
| Structured finance | 12,279 |
| | 13,569 |
| | 11,769 |
| | 13,148 |
|
| Total financial guaranty | $ | 375,776 |
| | $ | 375,080 |
| | $ | 374,130 |
| | $ | 371,586 |
|
|
| | | | | | | | | | | | | | | |
| | Gross Debt Service Outstanding | | Net Debt Service Outstanding |
| | December 31,
2016 | | December 31,
2015 | | December 31,
2016 | | December 31,
2015 |
| | (in millions) |
| Public finance | $ | 425,849 |
| | $ | 515,494 |
| | $ | 409,447 |
| | $ | 494,426 |
|
| Structured finance | 29,151 |
| | 43,976 |
| | 28,088 |
| | 41,915 |
|
| Total financial guaranty | $ | 455,000 |
| | $ | 559,470 |
| | $ | 437,535 |
| | $ | 536,341 |
|
In addition to the financial guaranty debt service shown in the table above, the Company provided structured capital relief Triple-X excess of loss life reinsurance on approximately $390 million of exposure as of December 31, 2016, which is expected to increase to approximately $1 billion prior to September 30, 2036. There was no exposure to structured capital relief Triple-X excess of loss life reinsurance as of December 31, 2015. The Company also has mortgage guaranty reinsurance related to loans originated in Ireland on debt service of approximately $36 million as of December 31, 2016 and $102 million as of December 31, 2015. These transactions are all rated investment grade internally.
Financial Guaranty Portfolio by Internal Rating(1)Rating
As of December 31, 20162019
| | | | | Public Finance
U.S. | | Public Finance Non-U.S. | | Structured Finance U.S | | Structured Finance Non-U.S | | Total | | Public Finance
U.S. | | Public Finance Non-U.S. | | Structured Finance U.S | | Structured Finance Non-U.S | | Total |
Rating
Category | | Net Par
Outstanding | | % | | Net Par Outstanding | | % | | Net Par Outstanding | | % | | Net Par Outstanding | | % | | Net Par Outstanding | | % | | Net Par
Outstanding | | % | | Net Par Outstanding | | % | | Net Par Outstanding | | % | | Net Par Outstanding | | % | | Net Par Outstanding | | % |
| | | (dollars in millions) | | (dollars in millions) |
| AAA | | $ | 2,066 |
| | 0.8 | % | | $ | 2,221 |
| | 8.4 | % | | $ | 9,757 |
| | 44.2 | % | | $ | 1,447 |
| | 47.0 | % | | $ | 15,491 |
| | 5.2 | % | | $ | 381 |
| | 0.2 | % | | $ | 2,541 |
| | 5.0 | % | | $ | 1,258 |
| | 13.5 | % | | $ | 181 |
| | 23.8 | % | | $ | 4,361 |
| | 1.8 | % |
| AA | | 46,420 |
| | 19.0 |
| | 170 |
| | 0.6 |
| | 5,773 |
| | 26.2 |
| | 127 |
| | 4.1 |
| | 52,490 |
| | 17.7 |
| | 19,847 |
| | 11.3 |
| | 5,142 |
| | 10.0 |
| | 4,010 |
| | 43.1 |
| | 38 |
| | 5.0 |
| | 29,037 |
| | 12.3 |
|
| A | | 133,829 |
| | 54.7 |
| | 6,270 |
| | 23.8 |
| | 1,589 |
| | 7.2 |
| | 456 |
| | 14.8 |
| | 142,144 |
| | 48.0 |
| | 94,488 |
| | 53.9 |
| | 15,627 |
| | 30.4 |
| | 1,030 |
| | 11.1 |
| | 184 |
| | 24.2 |
| | 111,329 |
| | 47.0 |
|
| BBB | | 55,103 |
| | 22.5 |
| | 16,378 |
| | 62.1 |
| | 879 |
| | 4.0 |
| | 759 |
| | 24.6 |
| | 73,119 |
| | 24.7 |
| | 55,000 |
| | 31.3 |
| | 27,051 |
| | 52.8 |
| | 1,206 |
| | 13.0 |
| | 317 |
| | 41.6 |
| | 83,574 |
| | 35.3 |
|
| BIG | | 7,380 |
| | 3.0 |
| | 1,342 |
| | 5.1 |
| | 4,059 |
| | 18.4 |
| | 293 |
| | 9.5 |
| | 13,074 |
| | 4.4 |
| | 5,771 |
| | 3.3 |
| | 898 |
| | 1.8 |
| | 1,796 |
| | 19.3 |
| | 41 |
| | 5.4 |
| | 8,506 |
| | 3.6 |
|
| Total net par outstanding | | $ | 244,798 |
| | 100.0 | % | | $ | 26,381 |
| | 100.0 | % | | $ | 22,057 |
| | 100.0 | % | | $ | 3,082 |
| | 100.0 | % | | $ | 296,318 |
| | 100.0 | % | | $ | 175,487 |
| | 100.0 | % | | $ | 51,259 |
| | 100.0 | % | | $ | 9,300 |
| | 100.0 | % | | $ | 761 |
| | 100.0 | % | | $ | 236,807 |
| | 100.0 | % |
_____________________
(1)The December 31, 2016 amounts include $2.9 billion of net par from the CIFG Acquisition.
Financial Guaranty Portfolio by Internal Rating(1)Rating
As of December 31, 20152018
|
| | | | | | | | | | | | | | | | | | | | | | | | | | | | | | | | | | | |
| | | Public Finance U.S. | | Public Finance Non-U.S. | | Structured Finance U.S | | Structured Finance Non-U.S | | Total |
Rating Category | | Net Par Outstanding | | % | | Net Par Outstanding | | % | | Net Par Outstanding | | % | | Net Par Outstanding | | % | | Net Par Outstanding | | % |
| | | (dollars in millions) |
| AAA | | $ | 413 |
| | 0.2 | % | | $ | 2,399 |
| | 5.4 | % | | $ | 1,533 |
| | 15.4 | % | | $ | 273 |
| | 22.9 | % | | $ | 4,618 |
| | 1.9 | % |
| AA | | 21,646 |
| | 11.6 |
| | 1,711 |
| | 3.9 |
| | 3,599 |
| | 36.2 |
| | 65 |
| | 5.4 |
| | 27,021 |
| | 11.2 |
|
| A | | 105,180 |
| | 56.4 |
| | 13,013 |
| | 29.5 |
| | 1,016 |
| | 10.2 |
| | 206 |
| | 17.3 |
| | 119,415 |
| | 49.4 |
|
| BBB | | 52,935 |
| | 28.4 |
| | 25,939 |
| | 58.8 |
| | 1,164 |
| | 11.7 |
| | 550 |
| | 46.1 |
| | 80,588 |
| | 33.3 |
|
| BIG | | 6,388 |
| | 3.4 |
| | 1,041 |
| | 2.4 |
| | 2,632 |
| | 26.5 |
| | 99 |
| | 8.3 |
| | 10,160 |
| | 4.2 |
|
| Total net par outstanding | | $ | 186,562 |
| | 100.0 | % | | $ | 44,103 |
| | 100.0 | % | | $ | 9,944 |
| | 100.0 | % | | $ | 1,193 |
| | 100.0 | % | | $ | 241,802 |
| | 100.0 | % |
|
| | | | | | | | | | | | | | | | | | | | | | | | | | | | | | | | | | | |
| | | Public Finance U.S. | | Public Finance Non-U.S. | | Structured Finance U.S | | Structured Finance Non-U.S | | Total |
Rating Category | | Net Par Outstanding | | % | | Net Par Outstanding | | % | | Net Par Outstanding | | % | | Net Par Outstanding | | % | | Net Par Outstanding | | % |
| | | (dollars in millions) |
| AAA | | $ | 3,053 |
| | 1.1 | % | | $ | 709 |
| | 2.4 | % | | $ | 14,366 |
| | 45.2 | % | | $ | 2,709 |
| | 50.6 | % | | $ | 20,837 |
| | 5.8 | % |
| AA | | 69,274 |
| | 23.7 |
| | 2,017 |
| | 6.8 |
| | 7,934 |
| | 25.0 |
| | 177 |
| | 3.3 |
| | 79,402 |
| | 22.1 |
|
| A | | 157,440 |
| | 53.9 |
| | 6,765 |
| | 22.9 |
| | 2,486 |
| | 7.8 |
| | 555 |
| | 10.3 |
| | 167,246 |
| | 46.7 |
|
| BBB | | 54,315 |
| | 18.6 |
| | 18,708 |
| | 63.2 |
| | 1,515 |
| | 4.8 |
| | 1,365 |
| | 25.5 |
| | 75,903 |
| | 21.2 |
|
| BIG | | 7,784 |
| | 2.7 |
| | 1,378 |
| | 4.7 |
| | 5,469 |
| | 17.2 |
| | 552 |
| | 10.3 |
| | 15,183 |
| | 4.2 |
|
| Total net par outstanding | | $ | 291,866 |
| | 100.0 | % | | $ | 29,577 |
| | 100.0 | % | | $ | 31,770 |
| | 100.0 | % | | $ | 5,358 |
| | 100.0 | % | | $ | 358,571 |
| | 100.0 | % |
_____________________
| |
(1) | The December 31, 2015 amounts include $10.9 billion of net par from the Radian Asset Acquisition. |
The following tables present gross and net par outstanding for the financial guaranty portfolio.
Financial Guaranty Portfolio
Gross Par Outstanding
|
| | | | | | | |
| | As of
December 31, 2019 | | As of
December 31, 2018 |
| | (in millions) |
| U.S. public finance | $ | 176,047 |
| | $ | 187,919 |
|
| Non-U.S. public finance | 51,538 |
| | 44,714 |
|
| U.S. structured finance | 9,800 |
| | 10,352 |
|
| Non-U.S. structured finance | 771 |
| | 1,206 |
|
| Total gross par outstanding | $ | 238,156 |
| | $ | 244,191 |
|
Financial Guaranty Portfolio
Net Par Outstanding
by Sector
| | | | Gross Par Outstanding | | Ceded Par Outstanding | | Net Par Outstanding | |
| Sector | As of December 31, 2016 | | As of December 31, 2015 | | As of December 31, 2016 | | As of December 31, 2015 | | As of December 31, 2016 | | As of December 31, 2015 | |
| Sector (1) | | | As of
December 31, 2019 |
| As of
December 31, 2018 |
| | (in millions) | | (in millions) |
| Public finance: | | | | | | | | | |
| | |
| | |
| | |
|
| U.S.: | | | | | | | | | |
| | |
| | |
| | |
|
| General obligation | $ | 110,167 |
| | $ | 129,386 |
| | $ | 2,450 |
| | $ | 3,131 |
| | $ | 107,717 |
| | $ | 126,255 |
| | $ | 73,467 |
| | $ | 78,800 |
|
| Tax backed | 51,325 |
| | 59,649 |
| | 1,394 |
| | 1,587 |
| | 49,931 |
| | 58,062 |
| | 37,047 |
| | 40,616 |
|
| Municipal utilities | 38,442 |
| | 46,951 |
| | 839 |
| | 1,015 |
| | 37,603 |
| | 45,936 |
| | 26,195 |
| | 28,402 |
|
| Transportation | 19,915 |
| | 24,351 |
| | 512 |
| | 897 |
| | 19,403 |
| | 23,454 |
| | 16,209 |
| | 15,197 |
|
| Healthcare | 11,940 |
| | 15,967 |
| | 702 |
| | 961 |
| | 11,238 |
| | 15,006 |
| | 7,148 |
| | 6,750 |
|
| Higher education | 10,114 |
| | 11,984 |
| | 29 |
| | 48 |
| | 10,085 |
| | 11,936 |
| | 5,916 |
| | 6,643 |
|
| Infrastructure finance | 3,902 |
| | 5,241 |
| | 133 |
| | 248 |
| | 3,769 |
| | 4,993 |
| | 5,429 |
| | 5,489 |
|
| Housing | 1,593 |
| | 2,075 |
| | 34 |
| | 38 |
| | 1,559 |
| | 2,037 |
| |
| Housing revenue | | | 1,321 |
| | 1,435 |
|
| Investor-owned utilities | 697 |
| | 916 |
| | 0 |
| | 0 |
| | 697 |
| | 916 |
| | 655 |
| | 846 |
|
| Renewable energy | | | 210 |
| | 215 |
|
| Other public finance | 2,810 |
| | 3,288 |
| | 14 |
| | 17 |
| | 2,796 |
| | 3,271 |
| | 1,890 |
| | 2,169 |
|
| Total public finance—U.S. | 250,905 |
| | 299,808 |
| | 6,107 |
| | 7,942 |
| | 244,798 |
| | 291,866 |
| | 175,487 |
| | 186,562 |
|
| Non-U.S.: | | | | | | | | | |
| | |
| | |
| | |
|
| Regulated utilities | | | 18,995 |
| | 18,124 |
|
| Infrastructure finance | 11,818 |
| | 14,040 |
| | 1,087 |
| | 1,312 |
| | 10,731 |
| | 12,728 |
| | 17,952 |
| | 17,166 |
|
| Regulated utilities | 11,395 |
| | 12,616 |
| | 2,132 |
| | 2,568 |
| | 9,263 |
| | 10,048 |
| |
| Sovereign and sub-sovereign | | | 11,341 |
| | 6,094 |
|
| Renewable energy | | | 1,555 |
| | 1,346 |
|
| Pooled infrastructure | 1,621 |
| | 2,013 |
| | 108 |
| | 134 |
| | 1,513 |
| | 1,879 |
| | 1,416 |
| | 1,373 |
|
| Other public finance | 5,653 |
| | 5,714 |
| | 779 |
| | 792 |
| | 4,874 |
| | 4,922 |
| |
| Total public finance—non-U.S. | 30,487 |
| | 34,383 |
| | 4,106 |
| | 4,806 |
| | 26,381 |
| | 29,577 |
| | 51,259 |
| | 44,103 |
|
| Total public finance | 281,392 |
| | 334,191 |
| | 10,213 |
| | 12,748 |
| | 271,179 |
| | 321,443 |
| | 226,746 |
| | 230,665 |
|
| Structured finance: | | | | | | | | | |
| | |
| | |
| | |
|
| U.S.: | | | | | | | | | |
| | |
| | |
| | |
|
| RMBS | | | 3,546 |
| | 4,270 |
|
| Life insurance transactions | | | 1,776 |
| | 1,435 |
|
| Pooled corporate obligations | 10,273 |
| | 16,757 |
| | 223 |
| | 749 |
| | 10,050 |
| | 16,008 |
| | 1,401 |
| | 1,215 |
|
| Residential Mortgage-Backed Securities (RMBS) | 5,933 |
| | 7,441 |
| | 296 |
| | 374 |
| | 5,637 |
| | 7,067 |
| |
| Insurance securitizations | 2,355 |
| | 3,047 |
| | 47 |
| | 47 |
| | 2,308 |
| | 3,000 |
| |
| Financial products | | | 1,019 |
| | 1,094 |
|
| Consumer receivables | 1,707 |
| | 2,153 |
| | 55 |
| | 54 |
| | 1,652 |
| | 2,099 |
| | 962 |
| | 1,255 |
|
| Financial products | 1,540 |
| | 1,906 |
| | — |
| | — |
| | 1,540 |
| | 1,906 |
| |
| Commercial receivables | 234 |
| | 432 |
| | 4 |
| | 5 |
| | 230 |
| | 427 |
| |
| Commercial mortgage-backed securities (CMBS) and other commercial real estate related exposures | 43 |
| | 549 |
| | — |
| | 16 |
| | 43 |
| | 533 |
| |
| Other structured finance | 646 |
| | 823 |
| | 49 |
| | 93 |
| | 597 |
| | 730 |
| | 596 |
| | 675 |
|
| Total structured finance—U.S. | 22,731 |
| | 33,108 |
| | 674 |
| | 1,338 |
| | 22,057 |
| | 31,770 |
| | 9,300 |
| | 9,944 |
|
| Non-U.S.: | | | | | | | | | |
| | |
| | |
| | |
|
| RMBS | | | 427 |
| | 576 |
|
| Pooled corporate obligations | 1,716 |
| | 4,087 |
| | 181 |
| | 442 |
| | 1,535 |
| | 3,645 |
| | 55 |
| | 126 |
|
| RMBS | 661 |
| | 552 |
| | 57 |
| | 60 |
| | 604 |
| | 492 |
| |
| Commercial receivables | 373 |
| | 619 |
| | 17 |
| | 19 |
| | 356 |
| | 600 |
| |
| Other structured finance | 601 |
| | 635 |
| | 14 |
| | 14 |
| | 587 |
| | 621 |
| | 279 |
| | 491 |
|
| Total structured finance—non-U.S. | 3,351 |
| | 5,893 |
| | 269 |
| | 535 |
| | 3,082 |
| | 5,358 |
| | 761 |
| | 1,193 |
|
| Total structured finance | 26,082 |
| | 39,001 |
| | 943 |
| | 1,873 |
| | 25,139 |
| | 37,128 |
| | 10,061 |
| | 11,137 |
|
| Total net par outstanding | $ | 307,474 |
| | $ | 373,192 |
| | $ | 11,156 |
| | $ | 14,621 |
| | $ | 296,318 |
| | $ | 358,571 |
| | $ | 236,807 |
| | $ | 241,802 |
|
_____________________
(1) Prior period has been presented on a basis consistent with current period sector classifications.
In addition to amounts shown in the tablestable above, the Company had outstanding commitments to provide guaranties of $123$301 million for structured finance and $394 millionof gross par for public finance obligationsand $610 million of gross par of structured finance as of December 31, 2016. The expiration dates for the public finance commitments range between January 1, 2017 and March 12, 2017, with $380 million expiring prior to the date of this filing. The2019. These commitments are contingent on the satisfaction of all conditions set forth in them and may expire unused or be canceled at the counterparty’s request. Therefore, the total commitment amount does not necessarily reflect actual future guaranteed amounts.
Actual maturities of insured obligations could differ from contractual maturities because borrowers have the right to call or prepay certain obligations with or without call or prepayment penalties.obligations. The expected maturities of structured finance obligations are, in general, considerably shorter than the contractual maturities for such obligations.
Financial Guaranty Portfolio
Expected Amortization of
Net Par Outstanding
As of December 31, 20162019
|
| | | | | | | | | | | |
| | Public Finance | | Structured Finance | | Total |
| | (in millions) |
| 0 to 5 years | $ | 55,219 |
| | $ | 4,161 |
| | $ | 59,380 |
|
| 5 to 10 years | 48,500 |
| | 1,852 |
| | 50,352 |
|
| 10 to 15 years | 42,901 |
| | 1,917 |
| | 44,818 |
|
| 15 to 20 years | 33,820 |
| | 1,698 |
| | 35,518 |
|
| 20 years and above | 46,306 |
| | 433 |
| | 46,739 |
|
| Total net par outstanding | $ | 226,746 |
| | $ | 10,061 |
| | $ | 236,807 |
|
|
| | | | | | | | | | | |
| | Public Finance | | Structured Finance | | Total |
| | (in millions) |
| 0 to 5 years | $ | 90,563 |
| | $ | 16,394 |
| | $ | 106,957 |
|
| 5 to 10 years | 56,351 |
| | 3,692 |
| | 60,043 |
|
| 10 to 15 years | 45,712 |
| | 2,548 |
| | 48,260 |
|
| 15 to 20 years | 37,057 |
| | 1,859 |
| | 38,916 |
|
| 20 years and above | 41,496 |
| | 646 |
| | 42,142 |
|
| Total net par outstanding | $ | 271,179 |
| | $ | 25,139 |
| | $ | 296,318 |
|
Components of BIGFinancial Guaranty Portfolio
Components of BIG Net Par Outstanding
(Insurance and Credit Derivative Form)
As of December 31, 20162019
| | | | BIG Net Par Outstanding | | Net Par | BIG Net Par Outstanding | | Net Par |
| | BIG 1 | | BIG 2 | | BIG 3 | | Total BIG | | Outstanding | BIG 1 | | BIG 2 | | BIG 3 | | Total BIG | | Outstanding |
| | | | | | (in millions) | | | | | | | | | (in millions) | | | | |
| Public finance: | | | | | | | | | | | | | | | | | | |
| U.S. public finance | $ | 2,402 |
| | $ | 3,123 |
| | $ | 1,855 |
| | $ | 7,380 |
| | $ | 244,798 |
| $ | 1,582 |
| | $ | 430 |
| | $ | 3,759 |
| | $ | 5,771 |
| | $ | 175,487 |
|
| Non-U.S. public finance | 1,288 |
| | 54 |
| | — |
| | 1,342 |
| | 26,381 |
| 854 |
| | — |
| | 44 |
| | 898 |
| | 51,259 |
|
| Public finance | 3,690 |
| | 3,177 |
| | 1,855 |
| | 8,722 |
| | 271,179 |
| 2,436 |
| | 430 |
| | 3,803 |
| | 6,669 |
| | 226,746 |
|
| Structured finance: | | | | | | | | | | | | | | | | | | |
| U.S. RMBS | 197 |
| | 493 |
| | 2,461 |
| | 3,151 |
| | 5,637 |
| 162 |
| | 74 |
| | 1,382 |
| | 1,618 |
| | 3,546 |
|
| Triple-X life insurance transactions | — |
| | — |
| | 126 |
| | 126 |
| | 2,057 |
| |
| Trust preferred securities (TruPS) | 304 |
| | 126 |
| | — |
| | 430 |
| | 1,892 |
| |
| Life insurance transactions | | — |
| | — |
| | 40 |
| | 40 |
| | 1,771 |
|
| Other structured finance | 304 |
| | 263 |
| | 78 |
| | 645 |
| | 15,553 |
| 69 |
| | 62 |
| | 48 |
| | 179 |
| | 4,744 |
|
| Structured finance | 805 |
| | 882 |
| | 2,665 |
| | 4,352 |
| | 25,139 |
| 231 |
| | 136 |
| | 1,470 |
| | 1,837 |
| | 10,061 |
|
| Total | $ | 4,495 |
| | $ | 4,059 |
| | $ | 4,520 |
| | $ | 13,074 |
| | $ | 296,318 |
| $ | 2,667 |
| | $ | 566 |
| | $ | 5,273 |
| | $ | 8,506 |
| | $ | 236,807 |
|
Financial Guaranty Portfolio
Components of BIG Net Par Outstanding
(Insurance and Credit Derivative Form)
As of December 31, 20152018
|
| | | | | | | | | | | | | | | | | | | |
| | BIG Net Par Outstanding | | Net Par |
| | BIG 1 | | BIG 2 | | BIG 3 | | Total BIG | | Outstanding |
| | | | | | (in millions) | | | | |
| Public finance: | | | | | | | | | |
| U.S. public finance | $ | 1,767 |
| | $ | 399 |
| | $ | 4,222 |
| | $ | 6,388 |
| | $ | 186,562 |
|
| Non-U.S. public finance | 796 |
| | 245 |
| | — |
| | 1,041 |
| | 44,103 |
|
| Public finance | 2,563 |
| | 644 |
| | 4,222 |
| | 7,429 |
| | 230,665 |
|
| Structured finance: | | | | | | | | | |
| U.S. RMBS | 368 |
| | 214 |
| | 1,805 |
| | 2,387 |
| | 4,270 |
|
| Life insurance transactions | — |
| | — |
| | 85 |
| | 85 |
| | 1,184 |
|
| Other structured finance | 127 |
| | 79 |
| | 53 |
| | 259 |
| | 5,683 |
|
| Structured finance | 495 |
| | 293 |
| | 1,943 |
| | 2,731 |
| | 11,137 |
|
| Total | $ | 3,058 |
| | $ | 937 |
| | $ | 6,165 |
| | $ | 10,160 |
| | $ | 241,802 |
|
|
| | | | | | | | | | | | | | | | | | | |
| | BIG Net Par Outstanding | | Net Par |
| | BIG 1 | | BIG 2 | | BIG 3 | | Total BIG | | Outstanding |
| | | | | | (in millions) | | | | |
| Public finance: | | | | | | | | | |
| U.S. public finance | $ | 4,765 |
| | $ | 2,883 |
| | $ | 136 |
| | $ | 7,784 |
| | $ | 291,866 |
|
| Non-U.S. public finance | 875 |
| | 503 |
| | — |
| | 1,378 |
| | 29,577 |
|
| Public finance | 5,640 |
| | 3,386 |
| | 136 |
| | 9,162 |
| | 321,443 |
|
| Structured finance: | | | | | | | | | |
| U.S. RMBS | 1,020 |
| | 397 |
| | 2,556 |
| | 3,973 |
| | 7,067 |
|
| Triple-X life insurance transactions | — |
| | — |
| | 216 |
| | 216 |
| | 2,750 |
|
| TruPS | 679 |
| | 127 |
| | — |
| | 806 |
| | 4,379 |
|
| Other structured finance | 684 |
| | 219 |
| | 123 |
| | 1,026 |
| | 22,932 |
|
| Structured finance | 2,383 |
| | 743 |
| | 2,895 |
| | 6,021 |
| | 37,128 |
|
| Total | $ | 8,023 |
| | $ | 4,129 |
| | $ | 3,031 |
| | $ | 15,183 |
| | $ | 358,571 |
|
Financial Guaranty Portfolio
BIG Net Par Outstanding
and Number of Risks
As of December 31, 20162019
| | | | | Net Par Outstanding | | Number of Risks(2) | | Net Par Outstanding | | Number of Risks(2) |
| Description | | Financial Guaranty Insurance(1) | | Credit Derivative | | Total | | Financial Guaranty Insurance(1) | | Credit Derivative | | Total | | Financial Guaranty Insurance(1) | | Credit Derivative | | Total | | Financial Guaranty Insurance(1) | | Credit Derivative | | Total |
| | | (dollars in millions) | | (dollars in millions) |
| BIG: | | |
| | |
| | |
| | |
| | |
| | |
| | |
| | |
| | |
| | |
| | |
| | |
|
| Category 1 | | $ | 3,861 |
| | $ | 634 |
| | $ | 4,495 |
| | 165 |
| | 10 |
| | 175 |
| | $ | 2,600 |
| | $ | 67 |
| | $ | 2,667 |
| | 121 |
| | 6 |
| | 127 |
|
| Category 2 | | 3,857 |
| | 202 |
| | 4,059 |
| | 79 |
| | 6 |
| | 85 |
| | 561 |
| | 5 |
| | 566 |
| | 24 |
| | 1 |
| | 25 |
|
| Category 3 | | 4,383 |
| | 137 |
| | 4,520 |
| | 148 |
| | 9 |
| | 157 |
| | 5,216 |
| | 57 |
| | 5,273 |
| | 131 |
| | 7 |
| | 138 |
|
| Total BIG | | $ | 12,101 |
| | $ | 973 |
| | $ | 13,074 |
| | 392 |
| | 25 |
| | 417 |
| | $ | 8,377 |
| | $ | 129 |
| | $ | 8,506 |
| | 276 |
| | 14 |
| | 290 |
|
Financial Guaranty Portfolio
BIG Net Par Outstanding
and Number of Risks
As of December 31, 20152018
| | | | | Net Par Outstanding | | Number of Risks(2) | | Net Par Outstanding | | Number of Risks(2) |
| Description | | Financial Guaranty Insurance(1) | | Credit Derivative | | Total | | Financial Guaranty Insurance(1) | | Credit Derivative | | Total | | Financial Guaranty Insurance(1) | | Credit Derivative | | Total | | Financial Guaranty Insurance(1) | | Credit Derivative | | Total |
| | | (dollars in millions) | | (dollars in millions) |
| BIG: | | |
| | |
| | |
| | |
| | |
| | |
| | |
| | |
| | |
| | |
| | |
| | |
|
| Category 1 | | $ | 7,019 |
| | $ | 1,004 |
| | $ | 8,023 |
| | 202 |
| | 12 |
| | 214 |
| | $ | 2,981 |
| | $ | 77 |
| | $ | 3,058 |
| | 128 |
| | 6 |
| | 134 |
|
| Category 2 | | 3,655 |
| | 474 |
| | 4,129 |
| | 85 |
| | 8 |
| | 93 |
| | 932 |
| | 5 |
| | 937 |
| | 39 |
| | 1 |
| | 40 |
|
| Category 3 | | 2,900 |
| | 131 |
| | 3,031 |
| | 132 |
| | 12 |
| | 144 |
| | 6,090 |
| | 75 |
| | 6,165 |
| | 145 |
| | 8 |
| | 153 |
|
| Total BIG | | $ | 13,574 |
| | $ | 1,609 |
| | $ | 15,183 |
| | 419 |
| | 32 |
| | 451 |
| | $ | 10,003 |
| | $ | 157 |
| | $ | 10,160 |
| | 312 |
| | 15 |
| | 327 |
|
(1)Includes net par outstanding for VIEs.
| |
| (2) | A risk represents the aggregate of the financial guaranty policies that share the same revenue source for purposes of making debt service payments. |
Geographic Distribution of Net Par Outstanding
The Company seeks to maintain a diversified portfolio of insured obligations designed to spread its risk across a number of geographic areas.
Financial Guaranty Portfolio
Geographic Distribution of
Net Par Outstanding
As of December 31, 20162019
|
| | | | | | | | | |
| | Number of Risks | | Net Par Outstanding | | Percent of Total Net Par Outstanding |
| | (dollars in millions) |
| U.S.: | | | | | |
| U.S. Public finance: | | | | | |
| California | 1,318 |
| | $ | 33,368 |
| | 14.1 | % |
| Pennsylvania | 665 |
| | 15,895 |
| | 6.7 |
|
| Texas | 1,090 |
| | 14,860 |
| | 6.3 |
|
| New York | 749 |
| | 14,682 |
| | 6.2 |
|
| Illinois | 602 |
| | 13,977 |
| | 5.9 |
|
| New Jersey | 337 |
| | 10,504 |
| | 4.4 |
|
| Florida | 266 |
| | 7,107 |
| | 3.0 |
|
| Michigan | 305 |
| | 5,345 |
| | 2.3 |
|
| Puerto Rico | 17 |
| | 4,270 |
| | 1.8 |
|
| Louisiana | 162 |
| | 4,167 |
| | 1.8 |
|
| Other | 2,529 |
| | 51,312 |
| | 21.7 |
|
| Total U.S. public finance | 8,040 |
| | 175,487 |
| | 74.2 |
|
| U.S. Structured finance (multiple states) | 450 |
| | 9,300 |
| | 3.9 |
|
| Total U.S. | 8,490 |
| | 184,787 |
| | 78.1 |
|
| Non-U.S.: | | | | | |
| United Kingdom | 288 |
| | 38,450 |
| | 16.2 |
|
| France | 7 |
| | 3,130 |
| | 1.3 |
|
| Canada | 8 |
| | 2,495 |
| | 1.1 |
|
| Australia | 11 |
| | 2,112 |
| | 0.9 |
|
| Austria | 3 |
| | 1,250 |
| | 0.5 |
|
| Other | 42 |
| | 4,583 |
| | 1.9 |
|
| Total non-U.S. | 359 |
| | 52,020 |
| | 21.9 |
|
| Total | 8,849 |
| | $ | 236,807 |
| | 100.0 | % |
|
| | | | | | | | | |
| | Number of Risks | | Net Par Outstanding | | Percent of Total Net Par Outstanding |
| | (dollars in millions) |
| U.S.: | | | | | |
| U.S. Public finance: | | | | | |
| California | 1,459 |
| | $ | 42,404 |
| | 14.3 | % |
| Texas | 1,271 |
| | 20,599 |
| | 7.0 |
|
| Pennsylvania | 852 |
| | 20,232 |
| | 6.8 |
|
| New York | 935 |
| | 19,637 |
| | 6.6 |
|
| Illinois | 776 |
| | 17,967 |
| | 6.1 |
|
| Florida | 324 |
| | 12,643 |
| | 4.3 |
|
| New Jersey | 495 |
| | 12,560 |
| | 4.2 |
|
| Michigan | 506 |
| | 7,985 |
| | 2.7 |
|
| Georgia | 172 |
| | 6,372 |
| | 2.2 |
|
| Ohio | 409 |
| | 5,554 |
| | 1.9 |
|
| Other states and U.S. territories | 3,475 |
| | 78,845 |
| | 26.6 |
|
| Total U.S. public finance | 10,674 |
| | 244,798 |
| | 82.7 |
|
| U.S. Structured finance (multiple states) | 610 |
| | 22,057 |
| | 7.4 |
|
| Total U.S. | 11,284 |
| | 266,855 |
| | 90.1 |
|
| Non-U.S.: | | | | | |
| United Kingdom | 112 |
| | 15,940 |
| | 5.4 |
|
| Australia | 18 |
| | 3,036 |
| | 1.0 |
|
| Canada | 9 |
| | 2,730 |
| | 0.9 |
|
| France | 14 |
| | 1,809 |
| | 0.6 |
|
| Italy | 9 |
| | 1,311 |
| | 0.4 |
|
| Other | 53 |
| | 4,637 |
| | 1.6 |
|
| Total non-U.S. | 215 |
| | 29,463 |
| | 9.9 |
|
| Total | 11,499 |
| | $ | 296,318 |
| | 100.0 | % |
Exposure to Puerto Rico
The Company hashad insured exposure to general obligation bonds of the Commonwealth of Puerto Rico (Puerto Rico or the Commonwealth) and various obligations of its related authorities and public corporations aggregating $4.8$4.3 billion net par as of December 31, 2016,2019, all of which arewas rated BIG. Puerto Rico has experienced significant general fund budget deficits in recent years and a challenging economic environment. Beginning on January 1, 2016, a number of Puerto Rico creditsexposures have defaulted on bond payments, and the Company has now paid claims on severalall of its Puerto Rico credits as shown in the table "Puertoexposures except for Puerto Rico Net Par Outstanding" below.Aqueduct and Sewer Authority (PRASA), Municipal Finance Agency (MFA) and University of Puerto Rico (U of PR).
On November 30, 2015 and December 8, 2015, Governor García Padillathe then governor of Puerto Rico (the Former Governor) issued executive orders (Clawback Orders) directing the Puerto Rico Department of Treasury and the Puerto Rico Tourism Company to retain or transfer"claw back" certain taxes pledged to secure the payment of bonds issued by the Puerto Rico Highways and Transportation Authority (PRHTA), Puerto Rico Infrastructure Financing Authority (PRIFA), and Puerto Rico Convention
Center District Authority (PRCCDA). On January 7, 2016, the Company sued various Puerto Rico governmental officials in the United States District Court, District of Puerto Rico, asserting that this attempt to “claw back” pledged taxes is unconstitutional, and demanding declaratory and injunctive relief. The Puerto Rico creditsexposures insured by the Company subject to the Clawback Ordersclawback are shown in the table “Puerto Rico Net Par Outstanding” below.Outstanding.”
On April 6, 2016, the Former Governor signed into law theThe fiscal and political issues in Puerto Rico Emergency Moratorium & Financial Rehabilitation Act (the Moratorium Act). The Moratorium Act purportedly empowers the governor to declare, entityhave been exacerbated by entity, states of emergencies and moratoriums on debt service payments on obligations of the Commonwealth and its related authorities and public corporations, as well as instituting a stay against related litigation, among other things. The Former Governor used the authority of the Moratorium Act to take a number of actions related to issuers of obligations the Company insures. National Public Finance Guarantee Corporation (National) (another financial guarantor), holders of the Commonwealth general obligation bonds and certainnatural disasters. On September 20, 2017, Hurricane Maria made landfall in Puerto Rico residents (the National Plaintiffs)as a Category 4 hurricane on the Saffir-Simpson scale, causing loss of life and widespread destruction. More recently, beginning on December 28, 2019, and progressing into early 2020, Puerto Rico has been struck by a swarm of earthquakes, including at least 11 that were of magnitude 5 or greater based on the the Richter magnitude scale. While not nearly as deadly or destructive as Hurricane Maria, the earthquakes have filed suits to invalidatedamaged buildings and infrastructure, including the Moratorium Act, and after the passage ofpower grid.
On June 30, 2016, the Puerto Rico Oversight, Management, and Economic Stability Act (PROMESA), the National Plaintiffs sought a relief from the stay of litigation imposed by PROMESA to pursue the action. On July 21, 2016, the Company filed a motion and form of complaint in the U.S. District Court for the District of Puerto Rico seeking relief from the stay of litigation imposed by PROMESA to seek a declaration that the Moratorium Act is preempted by Federal bankruptcy law. In November 2016 that court denied both the Company's and the National Plaintiffs' motions for relief from stay in the respective actions. The PROMESA stay expires on May 1, 2017.
On June 30, 2016, PROMESA was signed into law by the President of the United States.law. PROMESA establishesestablished a seven-member federal financial oversight board (Oversight Board) with authority to require that balanced budgets and fiscal plans be adopted and implemented by Puerto Rico. Title III of PROMESA provides for a legal frameworkprocess analogous to a voluntary bankruptcy process under which the debt of the Commonwealth and its related authorities and public corporations may be voluntarily restructured, and grants the Oversight Board the sole authority to file restructuring petitions in a federal court to restructure the debt of the Commonwealth and its related authorities and public corporations if voluntary negotiations fail, provided that any such restructuring must be in accordance with an Oversight Board approved fiscal plan that respects the liens and priorities provided under Puerto Rico law. PROMESA also appears to preempt at least portions of the Moratorium Act and to stay debt-related litigation, including the Company’s litigation regarding the Clawback Orders. On August 31, 2016, the Presidentchapter 9 of the United States appointed the seven membersBankruptcy Code.
The Company believes that a number of the Oversight Board.
Theactions taken by the Commonwealth, the Oversight Board has begun meeting and has hired Ramón Ruiz-Comas as interim executive director. On January 2, 2017, Ricardo Antonio Rosselló Nevares (the Governor) took office, replacing the Former Governor. On January 29, 2017, the Governor signed the Puerto Rico Emergency and Fiscal Responsibility Act (Emergency Act) that, among other things, repeals portions of the Moratorium Act, defines an emergency period until May 1, 2017, continues diversion of collateral away from bondsothers with respect to obligations the Company insures are illegal or unconstitutional or both, and defineshas taken legal action, and may take additional legal action in the powersfuture, to enforce its rights with respect to these matters. In addition, the Commonwealth, the Oversight Board and duties ofothers have taken legal action naming the Fiscal AgencyCompany as a party. See “Puerto Rico Litigation” below.
The Company also participates in mediation and Financial Advisory Authority (FAFAA). negotiations relating to its Puerto Rico exposure.
The final shape,form and timing and validity of responses to Puerto Rico’s financial distress and the devastation of Hurricane Maria eventually enactedtaken by the federal government or implemented under the auspices of PROMESA and the Oversight Board or otherwise, and the final impact on the Company, after resolution of legal challenges, of any such responses on obligations insured by the Company, isare uncertain. The impact of developments relating to Puerto Rico during any quarter or year could be material to the Company's results of operations in that particular quarter or year.
The Company groups its Puerto Rico exposure into three categories:
| |
| • | Constitutionally Guaranteed. The Company includes in this category public debt benefiting from Article VI of the Constitution of the Commonwealth, which expressly provides that interest and principal payments on the public debt are to be paid before other disbursements are made. |
| |
| • | Public Corporations – Certain Revenues Potentially Subject to Clawback. The Company includes in this category the debt of public corporations for which applicable law permits the Commonwealth to claw back, subject to certain conditions and for the payment of public debt, at least a portion of the revenues supporting the bonds the Company insures. As a constitutional condition to clawback, available Commonwealth revenues for any fiscal year must be insufficient to pay Commonwealth debt service before the payment of any appropriations for that year. The Company believes that this condition has not been satisfied to date, and accordingly that the Commonwealth has not to date been entitled to claw back revenues supporting debt insured by the Company. |
Constitutionally Guaranteed. The Company includes in this category public debt benefiting from Article VI of the Constitution of the Commonwealth, which expressly provides that interest and principal payments on the public debt are to be paid before other disbursements are made.
| |
| • | Other Public Corporations. The Company includes in this category the debt of public corporations that are supported by revenues it does not believe are subject to clawback. |
Public Corporations – Certain Revenues Potentially Subject to Clawback. The Company includes in this category the debt of public corporations for which applicable law permits the Commonwealth to claw back, subject to certain conditions and for the payment of public debt, at least a portion of the revenues supporting the bonds the Company insures. As a Constitutional condition to clawback, available Commonwealth revenues for any fiscal year must be insufficient to pay Commonwealth debt service before the payment of any appropriations for that year. The Company believes that this condition has not been satisfied to date, and accordingly that the Commonwealth has not to date been entitled to clawback revenues supporting debt insured by the Company. As noted above, the Company sued various Puerto Rico governmental officials in the United States District Court, District of Puerto Rico asserting that Puerto Rico's recent attempt to claw back pledged taxes is unconstitutional, and demanding declaratory and injunctive relief.
Other Public Corporations. The Company includes in this category the debt of public corporations that are supported by revenues it does not believe are subject to clawback.
Constitutionally Guaranteed
General Obligation. As of December 31, 2016,2019, the Company had $1,476$1,253 million insured net par outstanding of the general obligations of Puerto Rico, which are supported by the good faith, credit and taxing power of the Commonwealth. On July 1, 2016, despiteDespite the requirements of Article VI of its Constitution, but pursuant to an executive order issued by the Former Governor under the Moratorium Act, the Commonwealth defaulted on most of the debt service payment due that day,on July 1, 2016, and the Company made its firsthas been making claim payments on these bonds since that date. The Oversight Board has filed a petition under Title III of PROMESA with respect to the Commonwealth.
On May 9, 2019, the Oversight Board certified a revised fiscal plan for the Commonwealth. The revised certified Commonwealth fiscal plan indicates an expected primary budget surplus, if fiscal plan reforms are enacted, of $13.7 billion that would be available for debt service over the six-year forecast period ending 2024. The Company believes the available surplus set forth in the Oversight Board's revised certified fiscal plan (which assumes certain fiscal reforms are implemented by the Commonwealth) should be sufficient to cover contractual debt service of Commonwealth general obligation issuances and has continuedof authorities and public corporations directly implicated by the Commonwealth’s general fund during the forecast period. However, the revised certified Commonwealth fiscal plan indicates a net cumulative primary budget deficit through 2049, and there can be no assurance that the fiscal reforms will be enacted or, if they are, that the forecasted primary budget surplus will occur or, if it does, that such funds will be used to make claim payments on these bonds.cover contractual debt service.
On February 9, 2020, the Oversight Board announced it had entered into an amended general obligation Plan Support Agreement (Amended GO PSA) with certain general obligation (GO) and Puerto Rico Public Buildings Authority (PBA) bondholders representing approximately $8 billion of the aggregate amount of general obligation and PBA bond claims. The Amended GO PSA purports to provide a framework to address approximately $35 billion of Commonwealth debt (including PBA debt) and unsecured claims. The Company is not a party to that agreement and does not support it.
The Amended GO PSA provides for different recoveries based on the bonds’ vintage issuance date, with GO and PBA bonds issued before 2011(Vintage) receiving higher recoveries than GO and PBA bonds issued in 2011 and thereafter (except that, for purposes of the Amended GO PSA, Series 2011A GO bonds would be treated as Vintage bonds). The recoveries for the GO bonds, by vintage issuance date, are set forth in the table included below. The differentiated recovery scheme provided under the Amended GO PSA is purportedly based on the Oversight Board’s attempt to invalidate the non-Vintage GO and PBA bonds (see “Puerto Rico Litigation” below). Under the Amended GO PSA, GO and PBA bondholders generally would receive newly issued Commonwealth GO bonds, Puerto Rico Sales Tax Financing Corporation (COFINA) junior lien bonds and cash equal to the amounts set out below, expressed as a percent of their outstanding pre-petition claims (which excludes post-petition accrued interest), based on the vintage issuance date of the bonds they hold. In all cases, holders of GO/PBA bonds supporting the Amended GO PSA are also entitled to certain fees.
|
| | | | | | | | | | | | | | | |
| General Obligation Bonds | | Assured Guaranty
Net Par Outstanding
as of
December 31,
2019 |
| Assured Guaranty
Total Net Principal Claims Paid
as of
December 31,
2019 |
| Assured Guaranty
Total Net Interest Claims Paid as of
December 31,
2019 | | Base Recovery as a % of Pre-Petition Claims |
| | | (in millions) | (percent) |
| Vintage GO | | $ | 669 |
| | $ | 383 |
| | $ | 147 |
| | 74.9 | % |
| 2011 GO (Series D, E and PIB) | | 5 |
| | 6 |
| | 1 |
| | 73.8 |
|
| 2011 GO (Series C) | | 210 |
| | — |
| | 42 |
| | 70.4 |
|
| 2012 GO | | 369 |
| | — |
| | 63 |
| | 69.9 |
|
| 2014 GO | | — |
| | — |
| | — |
| | 65.4 |
|
On September 27, 2019, the Oversight Board filed with the Title III court a Plan of Adjustment (POA) to restructure approximately $35 billion of debt (including the GO bonds) and other claims against the government of Puerto Rico and certain entities and $50 billion in pension obligations. The POA is expected to be amended to incorporate the terms related to the GO bonds proposed under the Amended GO PSA. The Company believes the POA, as currently constituted, does not comply with the laws and constitution of Puerto Rico and the provisions of PROMESA and does not satisfy the statutory requirements for confirmation of a plan of adjustment under Title III of PROMESA.
PBA. As of December 31, 2016,2019, the Company had $169$140 million insured net par outstanding of PBA bonds, which are supported by a pledge of the rents due under leases of government facilities to departments, agencies, instrumentalities and municipalities of the Commonwealth, and that benefit from a Commonwealth guaranty supported by a pledge of the Commonwealth’s good faith, credit and taxing power. On July 1, 2016, despiteDespite the requirements of Article VI of its Constitution, but pursuant to an executive order issued by the Former Governor under the Moratorium Act, the PBA defaulted on most of the debt service payment due that day,on July 1, 2016, and the Company made its firsthas been making claim payments on these bonds since then. On September 27, 2019, the Oversight Board filed a petition under Title III of PROMESA with respect to the PBA to allow the restructuring of the PBA claims through the POA.
Under the Amended GO PSA (which does not include the Company as a party and has continuedwhich the Company does not support), PBA bondholders generally would receive newly issued Commonwealth GO bonds, COFINA junior lien bonds and cash equal to make claim paymentsthe amounts set out below, expressed as a percent of their outstanding pre-petition claims (which excludes post-petition accrued interest), based on these bonds.the vintage issuance date of the bonds they hold. In all cases, holders of PBA bonds supporting the Amended GO PSA are also entitled to certain fees.
|
| | | | | | | | | | | | | | | |
| PBA Bonds | | Assured Guaranty
Net Par Outstanding
as of
December 31,
2019 | | Assured Guaranty
Total Net Principal Claims Paid
as of
December 31,
2019 | | Assured Guaranty
Total Net Interest Claims Paid as of
December 31,
2019 | | Base Recovery as % of Pre-Petition Claims
|
| | | (in millions) | | (percent) |
| Vintage PBA | | $ | 140 |
| | $ | 32 |
| | $ | 24 |
| | 77.6 | % |
| 2011 PBA | | — |
| | — |
| | — |
| | 76.8 |
|
| 2012 PBA | | — |
| | — |
| | — |
| | 72.2 |
|
As noted above, on September 27, 2019, the Oversight Board filed with the Title III court a POA to restructure approximately $35 billion of debt (including the PBA bonds) and other claims against the government of Puerto Rico and certain entities and $50 billion in pension obligations. The POA is expected to be amended to incorporate the terms related to the PBA bonds proposed under the GO PSA. The Company believes the POA, as currently constituted, does not comply with the laws and constitution of Puerto Rico and the provisions of PROMESA and does not satisfy the statutory requirements for confirmation of a plan of adjustment under Title III of PROMESA.
Public Corporations - Certain Revenues Potentially Subject to Clawback
PRHTA. As of December 31, 2016,2019, the Company had $918$811 million insured net par outstanding of PRHTA (Transportation(transportation revenue) bonds and $350$454 million insured net par outstanding of PRHTA (Highways(highways revenue) bonds. The transportation revenue bonds are secured by a subordinate gross pledge oflien on gasoline and gas oil and diesel oil taxes, motor vehicle license fees and certain tolls, plus a first lien on up to $120 million annually of taxes on crude oil, unfinished oil and derivative products. The highways revenue bonds are secured by a gross pledge oflien on gasoline and gas oil and diesel oil taxes, motor vehicle license fees and certain tolls. The Clawback Orders cover Commonwealth-derivednon-toll revenues consisting of excise taxes and fees collected by the Commonwealth on behalf of PRHTA and its bondholders that are statutorily allocated to PRHTA and its bondholders are potentially subject to clawback. Despite the presence of funds in relevant debt service reserve accounts that the Company believes should have been employed to fund debt service, PRHTA defaulted on the full July 1, 2017 insured debt service payment, and the Company has been making claim payments on these bonds since that date. The Oversight Board has filed a petition under Title III of PROMESA with respect to PRHTA.
On June 5, 2019, the Oversight Board certified a revised fiscal plan for PRHTA. The Company believes that such sources represented a substantial majority of PRHTA’s revenues in 2015. Therevised certified PRHTA bonds are subjectfiscal plan projects very limited capacity to executive orders issued pursuant to the Moratorium Act. As noted above, the Company filed a motion and form of complaint in the U.S. District Court for the District of Puerto Rico seeking relief from the PROMESA stay to seek a declaration that the Moratorium Act is preempted by Federal bankruptcy law and that certain gubernatorial executive orders diverting PRHTA pledged toll revenues (which are not subject to the Clawback Orders) are preempted by PROMESA and violate the U.S. Constitution, and also seeking damages and injunctive relief. That motion was denied on November 2, 2016, on procedural grounds. The PROMESA stay expires on May 1, 2017. There were sufficient funds in the PRHTA bond accounts to make the July 1, 2016 and January 1, 2017 PRHTApay debt service payments guaranteed byover the Company on a primary basis, and those payments were made in full.six-year forecast period.
PRCCDA. As of December 31, 2016,2019, the Company had $152 million insured net par outstanding of PRCCDA bonds, which are secured by certain hotel tax revenues. These revenues are sensitive to the level of economic activity in the area and are potentially subject to the Clawback Orders, and the bonds are subject to an executive order issued pursuant to the Moratorium Act.clawback. There were sufficient funds in the PRCCDA bond accounts to make only partial payments on the July 1, 2016 and January 1, 2017 PRCCDA bond payments guaranteed by the Company, and thosethe Company has been making claim payments were made in full.on these bonds since that date.
PRIFA. As of December 31, 2016,2019, the Company had $18$16 million insured net par outstanding of PRIFA bonds, which are secured primarily by the return to Puerto RicoPRIFA and its bondholders of a portion of federal excise taxes paid on rum. These revenues are potentially subject to the Clawback Orders and the bonds are subject to an executive order issued pursuant to the Moratorium Act.clawback. The Company made its first claim payment on PRIFA bonds in January 2016, and has continued to makebeen making claim payments on the PRIFA bonds.bonds since January 2016.
Other Public Corporations
Puerto Rico Electric Power Authority (PREPA) (PREPA). As of December 31, 2016,2019, the Company had $724$822 million insured net par outstanding of PREPA obligations, which are payable fromsecured by a pledge of netlien on the revenues of the electric system. The Company has been making claim payments on these bonds since July 1, 2017. On July 2, 2017, the Oversight Board commenced proceedings for PREPA under Title III of PROMESA. On June 27, 2019, the Oversight Board certified a revised fiscal plan for PREPA.
On December 24, 2015,May 3, 2019, AGM and AGC entered into a Restructuring Support Agreement (RSA)restructuring support agreement with PREPA an ad hoc(PREPA RSA) and other stakeholders, including a group of uninsured PREPA bondholders, the Commonwealth of Puerto Rico, and a group of fuel-line lendersthe Oversight Board, that would, subjectis intended to, certain conditions, result in, among other things, modernizationprovide a framework for the consensual resolution of the utility and a restructuring of current debt. Upon finalizationtreatment of the contemplated restructuring transaction,Company’s insured PREPA revenue bonds (with no reduction to par or stated interest rate or extensionin PREPA's recovery plan. Upon consummation of maturity)the restructuring transaction, PREPA’s revenue bonds will be supported byexchanged into new securitization bonds issued by a special
purpose corporation and secured by a segregated transition charge assessed on ratepayers. To facilitateelectricity bills. The revised fiscal plan of PREPA certified by the securitization transaction and in exchange for a market premium, Assured Guaranty will issue surety insurance policies in an aggregate amount not expected to exceed $113 million ($14 million for AGC and $99 million for AGM) to support a portionOversight Board on June 27, 2019 reflects the relevant terms of the reserve fund for the securitization bonds. Certain of the creditors also agreed, subject to certain conditions, to participate in a bridge financing, which was closed in two tranches on May 19, 2016 and June 22, 2016.PREPA RSA.
AGM's and AGC's share of the bridge financing was approximately $15 million ($2 million for AGC and $13 million for AGM). Legislation meeting the requirements of the RSA was enacted on February 16, 2016, and a transition charge to be paid by PREPA rate payers for debt service on the securitization bonds as contemplated by the RSA was approved by the Puerto Rico Energy Commission on June 20, 2016. The closing of the restructuring transaction andis subject to a number of conditions, including approval by the issuanceTitle III Court of the suretyPREPA RSA and settlement described therein, a minimum of 67% support of voting bondholders for a plan of adjustment that includes this proposed treatment of PREPA revenue bonds are subject to certain conditions, includingand confirmation of such plan by the Title III court, and execution of acceptable documentation and legal opinions. TheUnder the PREPA RSA, the Company has been extendedthe option to March 31, 2017.
On July 1, 2016, PREPA made full paymentguarantee its allocated share of the $41 million of principalsecuritization exchange bonds, which may then be offered and interest due on PREPA revenue bonds insured by AGM and AGC. That payment was fundedsold in part by AGM’s purchase of $26 million of PREPA bonds maturing in 2020. Upon finalization of the transactions contemplated by the RSA, these new PREPA revenue bonds will be supported by securitization bonds contemplated by the RSA. On January 1, 2017, PREPA made full payment of the $18 million of interest due on PREPA revenue bonds insured by AGM and AGC.
There can be no assurancecapital markets. The Company believes that the conditionsadditive value created by attaching its guarantee to the securitization exchange bonds would materially improve its overall recovery under the transaction, as well as generate new insurance premiums; and therefore that its economic results could differ from those reflected in the RSA will be met or that, if the conditions are met, the RSA's other provisions, including those related to the insured PREPA revenue bonds, will be implemented as currently agreed. In addition, the impact of PROMESA , the Moratorium Act and Emergency Act or any attempt to exercise the power purportedly granted by the Moratorium Act or the Emergency Act on the implementation of the RSA is uncertain. PREPA, during the pendency of the agreements, has suspended deposits into its debt service fund.RSA.
Puerto Rico Aqueduct and Sewer Authority (PRASA). PRASA. As of December 31, 2016,2019, the Company had $373 million of insured net par outstanding toof PRASA bonds, which are secured by a lien on the gross revenues of the water and sewer system. On September 15, 2015,June 29, 2019, the Oversight Board certified a revised fiscal plan for PRASA. In July 2019, PRASA entered into a settlementrestructuring transaction with the U.S.Department of Justicefederal government and the U.S. Environmental Protection AgencyOversight Board to restructure its subordinated loans from federal agencies that requires it to spend $1.6 billion to upgrade and improve its sewer system island-wide. According to a material event noticehad been under forbearance for over three years (the PRASA filed on March 4, 2016, PRASA owed its contractors $140 million.Agreement). The PRASA Revitalization Act, which establishesAgreement extends the maturity of the loans for up to 40 years and provides for low interest rates and no interest accrual for the first ten years on a securitization mechanism that could facilitate debt issuance, was signed into lawportion of the loans, but also places the subordinated loans on July 13, 2016. While certaina parity with the PRASA bonds benefiting from a guarantee by the Commonwealth are subject to an executive order issued under the Moratorium Act, bonds insured by the Company areguarantees. The Company was not subjectasked to that order. There wereconsent to the PRASA Agreement. The PRASA Agreement reduces the amount of annual debt service owed by PRASA for its current debt. The PRASA bond accounts contained sufficient funds into make the PRASA bond accounts to makepayments due through the July 1, 2016 and January 1, 2017 PRASA bond paymentsdate of this filing that were guaranteed by the Company, and those payments were made in full.
Municipal Finance Agency (MFA). MFA. As of December 31, 2016,2019, the Company had $334$248 million net par outstanding of bonds issued by MFA secured by a pledge oflien on local property tax revenues. There wereThe MFA bond accounts contained sufficient funds into make the MFA bond accounts to makepayments due through the July 1, 2016 and January 1, 2017 MFA bond paymentsdate of this filing that were guaranteed by the Company, and those payments were made in full.
Puerto Rico Sales Tax Financing Corporation (COFINA). U of PR. As of December 31, 2016, the Company had $271 million insured net par outstanding of junior COFINA bonds, which are secured primarily by a second lien on certain sales and use taxes. There were no debt service payments due on July 1, 2016, or January 1, 2017, on Company-insured COFINA bonds, and, as of the date of this filing, all payments on Company-insured COFINA bonds had been made.
University of Puerto Rico (U of PR). As of December 31, 2016,2019, the Company had $1 million insured net par outstanding of U of PR bonds, which are general obligations of the university and are secured by a subordinate lien on the proceeds, profits and other income of the University,university, subject to a senior pledge and lien for the benefit of outstanding university system revenue bonds. The U of PR bonds are subject to an executive order issued under the Moratorium Act. There were no debt service payments due on July 1, 2016, or January 1, 2017 on Company-insured U of PR bonds, and, asAs of the date of this filing, all debt service payments on Company-insured U of PR bonds hadinsured by the Company have been made.
Resolved Commonwealth Credit
COFINA. On February 12, 2019, pursuant to a plan of adjustment approved by the PROMESA Title III Court on February 4, 2019 (COFINA Plan of Adjustment), the Company paid off in full its $273 million net par outstanding of insured COFINA bonds, plus accrued and unpaid interest. Pursuant to the COFINA Plan of Adjustment, the Company received $152 million in initial par of closed lien senior bonds of COFINA validated by the PROMESA Title III Court (COFINA Exchange Senior Bonds), along with cash. The total recovery (cash and COFINA Exchange Senior Bonds) represented 60% of the Company’s official Title III claim, which related to amounts owed as of the date COFINA entered Title III proceedings. The fair value of the COFINA Exchange Senior Bonds, excluding accrued interest, was $139 million at February 12, 2019, and was recorded as salvage received. During the third quarter of 2019 the Company sold all of its COFINA Exchange Senior Bonds.
Puerto Rico Litigation
The Company believes that a number of the actions taken by the Commonwealth, the Oversight Board and others with respect to obligations it insures are illegal or unconstitutional or both, and has taken legal action, and may take additional legal action in the future, to enforce its rights with respect to these matters. In addition, the Commonwealth, the Oversight Board and others have taken legal action naming the Company as party.
Currently there are numerous legal actions relating to the default by the Commonwealth and certain of its entities on debt service payments, and related matters, and the Company is a party to a number of them. On July 24, 2019, Judge Laura Taylor Swain of the United States District Court for the District of Puerto Rico (Federal District Court for Puerto Rico) held an omnibus hearing on litigation matters relating to the Commonwealth. At that hearing, she imposed a stay through November 30, 2019, on a series of adversary proceedings and contested matters amongst the stakeholders and imposed mandatory mediation on all parties through that date. On October 28, 2019, Judge Swain extended the stay until December 31, 2019, and further extended the stay until March 11, 2020 for certain matters (as noted below). Among the goals of the mediation is to reach an agreed-upon schedule for addressing the resolution of numerous issues, including, among others: (a) issues related to
the validity, secured status and priority regarding bonds issued by the Commonwealth and certain of its entities; (b) the validity and impact of the Clawback Orders and other diversion of collateral securing certain bonds; (c) classification of claims; (d) constitutional issues; and (e) identification of essential services. A number of the legal actions in which the Company is involved are covered by the stay and mandatory mediation order.
On January 7, 2016, AGM, AGC and Ambac Assurance Corporation commenced an action for declaratory judgment and injunctive relief in the Federal District Court for Puerto Rico to invalidate the executive orders issued on November 30, 2015 and December 8, 2015 by the then governor of Puerto Rico directing that the Secretary of the Treasury of the Commonwealth of Puerto Rico and the Puerto Rico Tourism Company claw back certain taxes and revenues pledged to secure the payment of bonds issued by the PRHTA, the PRCCDA and PRIFA. The Commonwealth defendants filed a motion to dismiss the action for lack of subject matter jurisdiction, which the court denied on October 4, 2016. On October 14, 2016, the Commonwealth defendants filed a notice of PROMESA automatic stay. While the PROMESA automatic stay expired on May 1, 2017, on May 17, 2017, the court stayed the action under Title III of PROMESA.
On June 3, 2017, AGC and AGM filed an adversary complaint in the Federal District Court for Puerto Rico seeking (i) a judgment declaring that the application of pledged special revenues to the payment of the PRHTA bonds is not subject to the PROMESA Title III automatic stay and that the Commonwealth has violated the special revenue protections provided to the PRHTA bonds under the United States Bankruptcy Code (Bankruptcy Code); (ii) an injunction enjoining the Commonwealth from taking or causing to be taken any action that would further violate the special revenue protections provided to the PRHTA bonds under the Bankruptcy Code; and (iii) an injunction ordering the Commonwealth to remit the pledged special revenues securing the PRHTA bonds in accordance with the terms of the special revenue provisions set forth in the Bankruptcy Code. On January 30, 2018, the court rendered an opinion dismissing the complaint and holding, among other things, that (x) even though the special revenue provisions of the Bankruptcy Code protect a lien on pledged special revenues, those provisions do not mandate the turnover of pledged special revenues to the payment of bonds and (y) actions to enforce liens on pledged special revenues remain stayed. A hearing on AGM and AGC’s appeal of the trial court’s decision to the United States Court of Appeals for the First Circuit (First Circuit) was held on November 5, 2018. On March 26, 2019, the First Circuit issued its opinion affirming the trial court’s decision and held that Sections 928(a) and 922(d) of the Bankruptcy Code permit, but do not require, continued payments during the pendency of the Title III proceedings. The First Circuit agreed with the trial court that (i) Section 928(a) of the Bankruptcy Code does not mandate the turnover of special revenues or require continuity of payments to the PRHTA bonds during the pendency of the Title III proceedings, and (ii) Section 922(d) of the Bankruptcy Code is not an exception to the automatic stay that would compel PRHTA, or third parties holding special revenues, to apply special revenues to outstanding obligations. On April 9, 2019, AGM, AGC and other petitioners filed a petition with the First Circuit seeking a rehearing by the full court; the petition was denied by the First Circuit on July 31, 2019. On September 20, 2019, AGC, AGM and other petitioners filed a petition for review by the U.S. Supreme Court of the First Circuit's holding, which was denied on January 13, 2020.
On June 26, 2017, AGM and AGC filed a complaint in the Federal District Court for Puerto Rico seeking (i) a declaratory judgment that the PREPA restructuring support agreement executed in December 2015 (2015 PREPA RSA) is a “Preexisting Voluntary Agreement” under Section 104 of PROMESA and the Oversight Board’s failure to certify the 2015 PREPA RSA is an unlawful application of Section 601 of PROMESA; (ii) an injunction enjoining the Oversight Board from unlawfully applying Section 601 of PROMESA and ordering it to certify the 2015 PREPA RSA; and (iii) a writ of mandamus requiring the Oversight Board to comply with its duties under PROMESA and certify the 2015 PREPA RSA. On July 21, 2017, in light of its PREPA Title III petition on July 2, 2017, the Oversight Board filed a notice of stay under PROMESA.
On July 18, 2017, AGM and AGC filed in the Federal District Court for Puerto Rico a motion for relief from the automatic stay in the PREPA Title III bankruptcy proceeding and a form of complaint seeking the appointment of a receiver for PREPA. The court denied the motion on September 14, 2017, but on August 8, 2018, the First Circuit vacated and remanded the court's decision. On October 3, 2018, AGM and AGC, together with other bond insurers, filed a motion with the court to lift the automatic stay to commence an action against PREPA for the appointment of a receiver. Under the PREPA RSA, AGM and AGC have agreed to withdraw from the lift stay motion upon the Title III Court’s approval of the settlement of claims embodied in the PREPA RSA.
On May 23, 2018, AGM and AGC filed an adversary complaint in the Federal District Court for Puerto Rico seeking a judgment declaring that (i) the Oversight Board lacked authority to develop or approve the new fiscal plan for Puerto Rico which it certified on April 19, 2018 (Revised Fiscal Plan); (ii) the Revised Fiscal Plan and the Fiscal Plan Compliance Law (Compliance Law) enacted by the Commonwealth to implement the original Commonwealth Fiscal Plan violate various sections of PROMESA; (iii) the Revised Fiscal Plan, the Compliance Law and various moratorium laws and executive orders enacted by the Commonwealth to prevent the payment of debt service (a) are unconstitutional and void because they violate the Contracts, Takings and Due Process Clauses of the U.S. Constitution and (b) are preempted by various sections of PROMESA;
and (iv) no Title III plan of adjustment based on the Revised Fiscal Plan can be confirmed under PROMESA. On August 13, 2018, the court-appointed magistrate judge granted the Commonwealth's and the Oversight Board's motion to stay this adversary proceeding pending a decision by the First Circuit in an appeal by Ambac Assurance Corporation of an unrelated adversary proceeding decision, which the First Circuit rendered on June 24, 2019. On July 24, 2019, Judge Swain announced a court-imposed stay of a series of adversary proceedings and contested matters through November 30, 2019, with a mandatory mediation element; Judge Swain extended the stay until December 31, 2019, and further extended the stay until March 11, 2020. Pursuant to the request of AGM, AGC and the defendants, Judge Swain ordered on September 6, 2019 that the claims in this complaint be addressed in the Commonwealth plan confirmation process and be subject to her July 24, 2019 stay and mandatory mediation order and be incorporated into the same schedule and mediation process.
On July 23, 2018, AGC and AGM filed an adversary complaint in the Federal District Court for Puerto Rico seeking a judgment (i) declaring the members of the Oversight Board are officers of the U.S. whose appointments were unlawful under the Appointments Clause of the U.S. Constitution; (ii) declaring void from the beginning the unlawful actions taken by the Oversight Board to date, including (x) development of the Commonwealth's Fiscal Plan, (y) development of PRHTA's Fiscal Plan, and (z) filing of the Title III cases on behalf of the Commonwealth and PRHTA; and (iii) enjoining the Oversight Board from taking any further action until the Oversight Board members have been lawfully appointed in conformity with the Appointments Clause of the U.S. Constitution. The Title III court dismissed a similar lawsuit filed by another party in the Commonwealth’s Title III case in July 2018. On August 3, 2018, a stipulated judgment was entered against AGM and AGC at their request based upon the court's July decision in the other Appointments Clause lawsuit and, on the same date, AGM and AGC appealed the stipulated judgment to the First Circuit. On August 15, 2018, the court consolidated, for purposes of briefing and oral argument, AGM and AGC's appeal with the other Appointments Clause lawsuit. The First Circuit consolidated AGM and AGC's appeal with a third Appointments Clause lawsuit on September 7, 2018 and held a hearing on December 3, 2018. On February 15, 2019, the First Circuit issued its ruling on the appeal and held that members of the Oversight Board were not appointed in compliance with the Appointments Clause of the U.S. Constitution but declined to dismiss the Title III petitions citing the (i) de facto officer doctrine and (ii) negative consequences to the many innocent third parties who relied on the Oversight Board’s actions to date, as well as the further delay which would result from a dismissal of the Title III petitions. The case was remanded back to the Federal District Court for Puerto Rico for the appellants’ requested declaratory relief that the appointment of the board members of the Oversight Board is unconstitutional. The First Circuit delayed the effectiveness of its ruling for 90 days so as to allow the President and the Senate to validate the currently defective appointments or reconstitute the Oversight Board in accordance with the Appointments Clause. On April 23, 2019, the Oversight Board filed a petition for review by the U.S. Supreme Court of the First Circuit's holding that its members were not appointed in compliance with the Appointments Clause and on the following day filed a motion in the First Circuit to further stay the effectiveness of the First Circuit’s February 15, 2019 ruling pending final disposition by the U.S. Supreme Court. On May 24, 2019, AGC and AGM filed a petition for a review by the U.S. Supreme Court of the First Circuit’s holding that the de facto officer doctrine allows courts to deny meaningful relief to successful challengers suffering ongoing injury at the hands of unconstitutionally appointed officers. On July 2, 2019, the First Circuit granted the Oversight Board’s motion to stay the effectiveness of the First Circuit’s February 15, 2019 ruling pending final disposition by the U.S. Supreme Court. On October 15, 2019, the U.S. Supreme Court heard oral arguments on the First Circuit's ruling.
On December 21, 2018, the Oversight Board and the Official Committee of Unsecured Creditors of all Title III Debtors (other than COFINA) filed an adversary complaint in the Federal District Court for Puerto Rico seeking a judgment declaring that (i) the leases to public occupants entered into by the PBA are not “true leases” for purposes of Section 365(d)(3) of the Bankruptcy Code and therefore the Commonwealth has no obligation to make payments to the PBA under the leases or Section 365(d)(3) of the Bankruptcy Code, (ii) the PBA is not entitled to a priority administrative expense claim under the leases pursuant to Sections 503(b)(1) and 507(a)(2) of the Bankruptcy Code, and (iii) any such claims filed or asserted against the Commonwealth are disallowed. On January 28, 2019, the PBA filed an answer to the complaint. On March 12, 2019, the Federal District Court for Puerto Rico granted, with certain limitations, AGM’s and AGC’s motion to intervene. On March 21, 2019, AGM and AGC, together with certain other intervenors, filed a motion for judgment on the pleadings. On July 24, 2019, Judge Swain announced a court-imposed stay of a series of adversary proceedings and contested matters, which include this proceeding, through November 30, 2019, with a mandatory mediation element; Judge Swain extended the stay until December 31, 2019, and further extended the stay until March 11, 2020.
On January 14, 2019, the Oversight Board and the Official Committee of Unsecured Creditors filed an omnibus objection in the Title III Court to claims filed by holders of approximately $6 billion of Commonwealth general obligation bonds issued in 2012 and 2014, asserting among other things that such bonds were issued in violation of the Puerto Rico constitutional debt service limit, such bonds are null and void, and the holders have no equitable remedy against the Commonwealth. Pursuant to procedures established by Judge Swain, on April 10, 2019, AGM filed a notice of participation in these proceedings. As of December 31, 2019, $369 million of the Company’s insured net par outstanding of the general obligation bonds of Puerto Rico were issued on or after March 2012. On May 21, 2019, the Official Committee of Unsecured
Creditors filed a claim objection to certain Commonwealth general obligation bonds issued in 2011, approximately $215 million of which are insured by the Company as of December 31, 2019, on substantially the same bases as the January 14, 2019 filing, and which the plaintiffs propose to be subject to the proceedings relating to the 2012 and 2014 bonds. On July 24, 2019, Judge Swain announced a court-imposed stay of a series of adversary proceedings and contested matters, which include this proceeding, through November 30, 2019, with a mandatory mediation element. Judge Swain extended the stay until December 31, 2019, but did not further extend the stay with respect to this matter. On January 8, 2020, certain Commonwealth general obligation bondholders (self-styled as the Lawful Constitutional Debt Coalition) filed a claim objection to the 2012 and 2014 bonds, asserting among other things that those bonds were issued in violation of the Puerto Rico constitutional debt limit and are not entitled to first priority status under the Puerto Rico Constitution.
On May 2, 2019, the Oversight Board and the Official Committee of Unsecured Creditors filed an adversary complaint in the Federal District Court for Puerto Rico against various Commonwealth general obligation bondholders and bond insurers, including AGC and AGM, that had asserted in their proofs of claim that their bonds are secured. The complaint seeks a judgment declaring that defendants do not hold consensual or statutory liens and are unsecured claimholders to the extent they hold allowed claims. The complaint also asserts that even if Commonwealth law granted statutory liens, such liens are avoidable under Section 545 of the Bankruptcy Code. On July 24, 2019, Judge Swain announced a court-imposed stay of a series of adversary proceedings and contested matters, which include this proceeding, through November 30, 2019, with a mandatory mediation element; Judge Swain extended the stay until December 31, 2019, but did not further extend the stay with respect to this matter.
On May 20, 2019, the Oversight Board and the Official Committee of Unsecured Creditors filed an adversary complaint in the Federal District Court for Puerto Rico against the fiscal agent and holders and/or insurers, including AGC and AGM, that have asserted their PRHTA bond claims are entitled to secured status in PRHTA’s Title III case. Plaintiffs are seeking to avoid the PRHTA bondholders’ liens and contend that (i) the scope of any lien only applies to revenues that have been both received by PRHTA and deposited in certain accounts held by the fiscal agent and does not include PRHTA’s right to receive such revenues; (ii) any lien on revenues was not perfected because the fiscal agent does not have “control” of all accounts holding such revenues; (iii) any lien on the excise tax revenues is no longer enforceable because any rights PRHTA had to receive such revenues are preempted by PROMESA; and (iv) even if PRHTA held perfected liens on PRHTA’s revenues and the right to receive such revenues, such liens were terminated by Section 552(a) of the Bankruptcy Code as of the petition date. On July 24, 2019, Judge Swain announced a court-imposed stay of a series of adversary proceedings and contested matters, which include this proceeding, through November 30, 2019, with a mandatory mediation element; Judge Swain extended the stay through December 31, 2019, and extended the stay again pending further order of the court.
On September 30, 2019, certain parties that either had advanced funds to PREPA for the purchase of fuel or had succeeded to such claims (Fuel Line Lenders) filed an amended adversary complaint in the Federal District Court for Puerto Rico against the Oversight Board, PREPA, the Puerto Rico Fiscal Agency and Financial Advisory Authority (AAFAF), U.S. Bank National Association, as trustee for PREPA bondholders, and various PREPA bondholders and bond insurers, including AGC and AGM. The complaint seeks, among other things, declarations that the advances made by the Fuel Line Lenders are Current Expenses as defined in the trust agreement pursuant to which the PREPA bonds were issued and there is no valid lien securing the PREPA bonds unless and until the Fuel Line Lenders are paid in full, as well as orders subordinating the PREPA bondholders’ lien and claim to the Fuel Line Lenders’ claims and declaring the PREPA RSA null and void. A hearing on a motion to dismiss is scheduled for June 2020.
On October 30, 2019, the retirement system for PREPA employees (SREAEE) filed an amended adversary complaint in the Federal District Court for Puerto Rico against the Oversight Board, PREPA, AAFAF, the Commonwealth, the Governor, and U.S. Bank National Association, as trustee for PREPA bondholders. The complaint seeks, among other things, declarations that amounts owed to SREAEE are Current Expenses as defined in the trust agreement pursuant to which the PREPA bonds were issued, that there is no valid lien securing the PREPA bonds other than on amounts in the sinking funds and that SREAEE is a third-party beneficiary of certain trust agreement provisions, as well as orders subordinating the PREPA bondholders’ lien and claim to the SREAEE claims. On November 7, 2019, the court granted a motion to intervene by AGC and AGM. A hearing on the defendants’ motion to dismiss is scheduled for June 2020.
On January 16, 2020, AGM and AGC along with certain other monoline insurers filed in Federal District Court for Puerto Rico a motion (amending and superseding a motion filed by AGM and AGC on August 23, 2019) for relief from the automatic stay imposed pursuant to Title III of PROMESA to permit movants to enforce in another forum the application of the revenues securing the PRHTA Bonds (the “PRHTA Revenues”) or, in the alternative, for adequate protection for their property interests in PRHTA Revenues.
On January 16, 2020, the Financial Oversight and Management Board brought an adversary proceeding in the Federal District Court for Puerto Rico against AGM, AGC and other insurers of PRHTA Bonds, objecting to the bond insurers claims in the Commonwealth Title III proceedings and seeking to disallow such claims, among other reasons, as being duplicative of the master claims filed by the trustee, for lack of standing and for any assertions of secured status or property interests with respect to PRHTA Revenues.
On January 16, 2020, the Financial Oversight and Management Board, on behalf of the PRHTA, brought an adversary proceeding in the Federal District Court for Puerto Rico against AGM, AGC and other insurers of PRHTA Bonds, objecting to the bond insurers claims in the PRHTA Title III proceedings and seeking to disallow such claims, among other reasons, as being duplicative of the master claims filed by the trustee and for any assertions of secured status or property interests with respect to PRHTA Revenues.
On January 16, 2020, AGM and AGC along with certain other monoline insurers and the trustee for the PRIFA Rum Tax Bonds filed in Federal District Court for Puerto Rico a motion concerning application of the automatic stay to the revenues securing the PRIFA Bonds (the PRIFA Revenues), seeking an order lifting the automatic stay so that movants can enforce rights respecting the PRIFA Revenues in another forum or, in the alternative, that the Commonwealth must provide adequate protection for movants’ lien on the PRIFA Revenues.
On January 16, 2020, the Financial Oversight and Management Board brought an adversary proceeding in the Federal District Court for Puerto Rico against AGC and other insurers of PRIFA Bonds, objecting to the bond insurers claims and seeking to disallow such claims, among other reasons, as being duplicative of the master claims filed by the trustee, for lack of standing and for any assertions of secured status or ownership interests with respect to PRIFA Revenues.
On January 16, 2020, AGM and AGC along with certain other monoline insurers and the trustee for the PRCCDA Bonds filed in Federal District Court for Puerto Rico a motion concerning application of the automatic stay to the revenues securing the PRCCDA Bonds (the PRCCDA Revenues), seeking an order that an action to enforce rights respecting the PRCCDA Revenues in another forum is not subject to the automatic stay associated with the Commonwealth’s Title III proceeding or, in the alternative, if the court finds that the stay is applicable, lifting the automatic stay so that movants can enforce such rights in another forum or, in the further alternative, if the court finds the automatic stay applicable and does not lift it, that the Commonwealth must provide adequate protection for movants’ lien on the PRCCDA Revenues.
On January 16, 2020, the Financial Oversight and Management Board brought an adversary proceeding in the Federal District Court for Puerto Rico against AGC and other insurers of PRCCDA Bonds, objecting to the bond insurers claims and seeking to disallow such claims, among other reasons, as being duplicative of the master claims filed by the trustee and for any assertions of secured status or property interests with respect to PRCCDA Revenues.
Puerto Rico Par and Debt Service Schedules
All Puerto Rico exposures are internally rated BIG. The following tables show the Company’s insured exposure to general obligation bonds of Puerto Rico and various obligations of its related authorities and public corporations.
Puerto Rico
Gross Par and Gross Debt Service Outstanding
|
| | | | | | | | | | | | | | | |
| | Gross Par Outstanding | | Gross Debt Service Outstanding |
| | December 31,
2019 | | December 31,
2018 | | December 31,
2019 | | December 31,
2018 |
| | (in millions) |
| Exposure to Puerto Rico | $ | 4,458 |
| | $ | 4,971 |
| | $ | 6,956 |
| | $ | 8,035 |
|
|
| | | | | | | | | | | | | | | |
| | Gross Par Outstanding | | Gross Debt Service Outstanding |
| | December 31,
2016 | | December 31,
2015 | | December 31,
2016 | | December 31,
2015 |
| | (in millions) |
| Exposure to Puerto Rico | $ | 5,435 |
| | $ | 5,755 |
| | $ | 9,038 |
| | $ | 9,632 |
|
Puerto Rico
Net Par Outstanding
| | | | As of
December 31, 2016 | | As of
December 31, 2015 | As of
December 31, 2019 | | As of
December 31, 2018 |
| | (in millions) | (in millions) |
| Commonwealth Constitutionally Guaranteed | | | | | | |
| Commonwealth of Puerto Rico - General Obligation Bonds (1) | $ | 1,476 |
| | $ | 1,615 |
| $ | 1,253 |
| | $ | 1,340 |
|
| Puerto Rico Public Buildings Authority (1) | 169 |
| | 188 |
| |
| PBA | | 140 |
| | 142 |
|
| Public Corporations - Certain Revenues Potentially Subject to Clawback | | | | | | |
| PRHTA (Transportation revenue) (1) (2) | 918 |
| | 909 |
| |
| PRHTA (Transportation revenue) (1) | | 811 |
| | 844 |
|
PRHTA (Highways revenue) | 350 |
| | 370 |
| 454 |
| | 475 |
|
| PRCCDA | 152 |
| | 164 |
| 152 |
| | 152 |
|
PRIFA (1) | 18 |
| | 18 |
| 16 |
| | 16 |
|
| Other Public Corporations | | | | | | |
PREPA | 724 |
| | 744 |
| 822 |
| | 848 |
|
| PRASA | 373 |
| | 388 |
| 373 |
| | 373 |
|
| MFA | 334 |
| | 387 |
| 248 |
| | 303 |
|
| COFINA | 271 |
| | 269 |
| — |
| | 273 |
|
| U of PR | 1 |
| | 1 |
| 1 |
| | 1 |
|
| Total net exposure to Puerto Rico | $ | 4,786 |
| | $ | 5,053 |
| $ | 4,270 |
| | $ | 4,767 |
|
| |
| (1) | As of the date of this filing, the Oversight Board has certified a filing under Title III of PROMESA for these exposures. |
(1) As of the date of this filing, the Company has paid claims on these credits.
(2) The December 31, 2016 amount includes $46 million of net par from the CIFG Acquisition.
The following table shows the scheduled amortization of the insured general obligation bonds of Puerto Rico and various obligations of its related authorities and public corporations. The Company guarantees payments of interest and principal when those amounts are scheduled to be paid and cannot be required to pay on an accelerated basis. In the event that obligors default on their obligations, the Company would only be required to pay the shortfall between the principal and interest due in any given period and the amount paid by the obligors.
Amortization Schedule of Puerto Rico Net Par Outstanding
and Net Debt Service Outstanding
As of December 31, 20162019
|
| | | | | | | |
| | Scheduled Net Par Amortization | | Scheduled Net Debt Service Amortization |
| | (in millions) |
| 2020 (January 1 - March 31) | $ | — |
| | $ | 106 |
|
| 2020 (April 1 - June 30) | — |
| | 3 |
|
| 2020 (July 1 - September 30) | 286 |
| | 392 |
|
| 2020 (October 1 - December 31) | — |
| | 3 |
|
| Subtotal 2020 | 286 |
| | 504 |
|
| 2021 | 149 |
| | 351 |
|
| 2022 | 139 |
| | 332 |
|
| 2023 | 205 |
| | 392 |
|
| 2024 | 222 |
| | 398 |
|
| 2025-2029 | 1,158 |
| | 1,862 |
|
| 2030-2034 | 1,021 |
| | 1,484 |
|
| 2035-2039 | 740 |
| | 917 |
|
| 2040-2044 | 104 |
| | 179 |
|
| 2045-2047 | 246 |
| | 272 |
|
| Total | $ | 4,270 |
| | $ | 6,691 |
|
|
| | | | | | | |
| | Scheduled Net Par Amortization | | Scheduled Net Debt Service Amortization |
| | (in millions) |
| 2017 (January 1 - March 31) | $ | 0 |
| | $ | 118 |
|
| 2017 (April 1 - June 30) | 0 |
| | 2 |
|
| 2017 (July 1 - September 30) | 220 |
| | 339 |
|
| 2017 (October 1 - December 31) | 0 |
| | 2 |
|
| Subtotal 2017 | 220 |
| | 461 |
|
| 2018 | 175 |
| | 408 |
|
| 2019 | 206 |
| | 429 |
|
| 2020 | 266 |
| | 480 |
|
| 2021 | 125 |
| | 326 |
|
| 2022-2026 | 869 |
| | 1,759 |
|
| 2027-2031 | 889 |
| | 1,534 |
|
| 2032-2036 | 1,201 |
| | 1,612 |
|
| 2037-2041 | 417 |
| | 588 |
|
| 2042-2047 | 418 |
| | 492 |
|
| Total | $ | 4,786 |
| | $ | 8,089 |
|
Exposure to the Selected European CountriesU.S. Virgin Islands
As of December 31, 2019, the Company had $485 million insured net par outstanding to the U.S. Virgin Islands and its related authorities (USVI), of which it rated $218 million BIG. The $267 million USVI net par the Company rated investment grade primarily consisted of bonds secured by a lien on matching fund revenues related to excise taxes on products produced in the USVI and exported to the U.S., primarily rum. The $218 million BIG USVI net par consisted of (a) Public Finance Authority bonds secured by a gross receipts tax and the general obligation, full faith and credit pledge of the USVI and (b) bonds of the Virgin Islands Water and Power Authority secured by a net revenue pledge of the electric system.
Hurricane Irma caused significant damage in St. John and St. Thomas, while Hurricane Maria made landfall on St. Croix as a Category 4 hurricane on the Saffir-Simpson scale, causing loss of life and substantial damage to St. Croix’s businesses and infrastructure, including the power grid. The USVI is benefiting from the federal response to the 2017 hurricanes and has made its debt service payments to date.
The European countries where the Company has exposureSpecialty Insurance and believes heightened uncertainties exist are: Hungary, Italy, Portugal, Spain and Turkey (collectively, the Selected European Countries). Reinsurance Exposure
The Company added Turkeyalso provides specialty insurance and reinsurance on transactions with similar risk profiles to its list of Selected European Countriesstructured finance exposures written in 2016, as a result of the recent political turmoil in the country. The Company’s direct economic exposure to the Selected European Countries (based on par for financial guaranty contractsform. All specialty insurance and notional amount for financial guaranty contracts accounted for as derivatives) isreinsurance exposures shown in the following table net of ceded reinsurance.below are rated investment grade internally.
Specialty Insurance and Reinsurance
Net Direct Economic Exposure to Selected European Countries(1)
As of December 31, 2016
|
| | | | | | | | | | | | | | | | |
| | | Gross Exposure | | Net Exposure |
| | | As of December 31, 2019 | | As of December 31, 2018 | | As of December 31, 2019 | | As of December 31, 2018 |
| | | (in millions) |
| Life insurance transactions (1) | | $ | 1,046 |
| | $ | 880 |
| | $ | 898 |
| | $ | 763 |
|
| Aircraft residual value insurance policies | | 398 |
| | 340 |
| | 243 |
| | 218 |
|
|
| | | | | | | | | | | | | | | | | | | | | | | |
| | Hungary | | Italy | | Portugal | | Spain | | Turkey | | Total |
| | (in millions) |
| Sub-sovereign exposure(2) | $ | 236 |
| | $ | 880 |
| | $ | 76 |
| | $ | 342 |
| | $ | — |
| | $ | 1,534 |
|
| Non-sovereign exposure(3) | 114 |
| | 399 |
| | — |
| | — |
| | 202 |
| | 715 |
|
| Total | $ | 350 |
| | $ | 1,279 |
| | $ | 76 |
| | $ | 342 |
| | $ | 202 |
| | $ | 2,249 |
|
| Total BIG (See Note 5) | $ | 283 |
| | $ | — |
| | $ | 76 |
| | $ | 342 |
| | $ | — |
| | $ | 701 |
|
____________________
| |
| (1) | While exposures are shown in U.S. dollars, the obligations are in various currencies, primarily euros.
The life insurance transactions net exposure is projected to increase to approximately $1.0 billion by December 31, 2023. |
| |
(2) | Sub-sovereign exposure in Selected European Countries includes transactions backed by receivables from, or supported by, sub-sovereigns, which are governmental or government-backed entities other than the ultimate governing body of the country.
|
| |
(3) | Non-sovereign exposure in Selected European Countries includes debt of regulated utilities, RMBS and diversified payment rights (DPR) securitizations.
|
When the Company directly insures an obligation, it assigns the obligation to a geographic location or locations based on its view of the geographic location of the risk. The Company may also have direct exposures to the Selected European Countries in business assumed from unaffiliated monoline insurance companies, in which case the Company depends upon geographic information provided by the primary insurer.
The Company's $202 million net insured par exposure in Turkey is to DPR securitizations sponsored by a major Turkish bank. These DPR securitizations were established outside of Turkey and involve payment orders in U.S. dollars, pounds sterling and Euros from persons outside of Turkey to beneficiaries in Turkey who are customers of the sponsoring bank. The sponsoring bank's correspondent banks have agreed to remit all such payments to a trustee-controlled account outside Turkey, where debt service payments for the DPR securitization are given priority over payments to the sponsoring bank.
The Company has excluded from the exposure tables above its indirect economic exposure to the Selected European Countries through policies it provides on pooled corporate and commercial receivables transactions. The Company calculates indirect exposure to a country by multiplying the par amount of a transaction insured by the Company times the percent of the relevant collateral pool reported as having a nexus to the country. On that basis, the Company has calculated exposure of $115 million to Selected European Countries (plus Greece) in transactions with $2.8 billion of net par outstanding. The indirect exposure to credits with a nexus to Greece is $3 million across several highly rated pooled corporate obligations with net par outstanding of $129 million.
| |
5.6. | Expected Loss to be Paid |
The insured portfolio includes policies accountedManagement compiles and analyzes loss information for under three separate accounting models dependingall exposures on the characteristics of the contract and the Company's control rights. The Company has paid and expects to pay future losses on policies which fall under each of the three accounting models. The following provides a summarized description of the three accounting models prescribed by GAAP with a reference to the notes that describe the accounting policies and required disclosures throughout this report. The three models are: (1) insurance, (2) derivative and (3) VIE consolidation.
Inconsistent basis, in order to effectively evaluate and manage the economics and liquidity of the entire insured portfolio, management compiles and analyzes loss information for all policies on a consistent basis.portfolio. The Company monitors and assigns ratings and calculates expected losses in the same manner for all its exposures regardless of form or differing accounting models.
This note provides information regarding expected claim payments to be made under all contracts in the insured portfolio, regardless of the accounting model. Net expected loss to be paid in the tables below consists of the present value of future: expected claim and LAE payments, expected recoveries in the transaction structures, cessions to reinsurers, and expected recoveries for breaches of representations and warranties (R&W) and other loss mitigation strategies. portfolio.
Expected loss to be paid is important from a liquidity perspective in that it represents the present value of amounts that the Company expects to
pay or recover in future periods regardless of the accounting model. Expected loss to be paid is an important measure used by management to analyze the net economic loss onfor all contracts.
Accounting Policy
Insurance Accounting
For contracts accounted for as financial guaranty insurance, loss and LAE reserve is recorded only to the extent and for the amount that expected losses to be paid, exceed unearned premium reserve. As a result, the Company has expected loss to be paid that have not yet been expensed. Such amounts will be recognized in future periods as deferred premium revenue amortizes into income. Expected loss to be expensed is important because it represents the Company's projection of incurred losses that will be recognized in future periods (excluding accretion of discount). See "Financial Guaranty Insurance Losses" in Note 6, Contracts Accounted for as Insurance.
Derivative Accounting, at Fair Value
For contracts that do not meet the financial guaranty scope exception in the derivative accounting guidance (primarily due to the fact that the insured is not required to be exposed to the insured risk throughout the life of the contract), the Company records such credit derivative contracts at fair value on the consolidated balance sheet with changes in fair value recorded in the consolidated statement of operations. The fair value recorded on the balance sheet represents an exit price in a hypothetical market because the Company does not trade its credit derivative contracts. The fair value is determined using significant Level 3 inputs in an internally developed model while the expected loss to be paid (which represents the net present value of expected cash outflows) uses methodologies and assumptions consistent with financial guaranty insurance expected losses to be paid. See Note 7, Fair Value Measurement and Note 8, Contracts Accounted for as Credit Derivatives.
VIE Consolidation, at Fair Value
For financial guaranty (FG) insurance contracts issued on the debt of variable interest entities over which the Company is deemed to be the primary beneficiary due to its control rights, as defined in GAAP, the Company consolidates the FG VIE. The Company carries the assets and liabilities of the FG VIEs at fair value under the fair value option. Management assesses the expected losses on the insured debt of the consolidated FG VIEs in the same manner as other financial guaranty insurance and credit derivative contracts. See Note 9, Consolidated Variable Interest Entities.
Expected Loss to be Paid
The expected loss to be paid is equal to the present value of expected future cash outflows for claim and LAE payments, net of inflows for expected salvage and subrogation (e.g.,and other recoveries including future payments by obligors pursuant to restructuring agreements, settlements or litigation judgments, excess spread on the underlying collateral, and expectedother estimated recoveries, including those from restructuring bonds and contractual recoveries for breaches of R&W or other expected recoveries), usingrepresentations and warranties (R&W). Expected losses are discounted at current risk-free rates. When the Company becomes entitled to the cash flow from the underlying collateral of an insured credit under salvage and subrogation rights as a result of a claim payment or estimated future claim payment, it reduces the expected loss to be paid on the contract. Net expected loss to be paid is defined as expected loss to be paid, net of amounts ceded to reinsurers.
The Company updates the discount rate each quarter and reflects the effect of such changes in economic loss development. Expected cash outflows and inflows are probability weighted cash flows that reflect the likelihood of all possible outcomes. The Company estimates the expected cash outflows and inflows using management's assumptions about the likelihood of all possible outcomes based on all information available to it. Those assumptions consider the relevant facts and circumstances and are consistent with the information tracked and monitored through the Company's risk-management activities. The Company updates the discount rates each quarter and reflects the effect of such changes in economic loss development. Net expected loss to be paid is defined as expected loss to be paid, net of amounts ceded to reinsurers.
Economic Loss DevelopmentIn circumstances where the Company has purchased its own insured obligations that have expected losses, and in certain cases where issuers of insured obligations elected or the Company and an issuer mutually agreed as part of a negotiation to deliver the underlying collateral or insured obligation to the Company, expected loss to be paid is reduced by the proportionate share of the insured obligation that is held in the investment portfolio. The difference between the purchase price of the insured obligation and the fair value excluding the value of the Company's insurance is treated as a paid loss. Insured obligations with expected losses that are purchased by the Company are referred to as loss mitigation securities and are recorded in the investment portfolio, at fair value excluding the value of the Company's insurance. See Note 10, Investments and Cash and Note 9, Fair Value Measurement.
Economic loss development represents the change in net expected loss to be paid attributable to the effects of changes in assumptions based on observed market trends, changes in discount rates, accretion of discount and the economic effects of loss mitigation efforts.
Expected loss to beThe insured portfolio includes policies accounted for under three separate accounting models depending on the characteristics of the contract and the Company's control rights. The three models are: (1) insurance as described in "Financial Guaranty Insurance Losses" in Note 7, Contracts Accounted for as Insurance, (2) derivative as described in Note 9, Fair Value Measurement and Note 11, Contracts Accounted for as Credit Derivatives, and (3) VIE consolidation as described in Note 14, Variable Interest Entities. The Company has paid and economic loss development includeexpects to pay future losses and/or recover past losses on policies which fall under each of the effects of loss mitigation strategies such as negotiated and estimated recoveries for breaches of R&W, and purchases of insured debt obligations. Additionally, in certain cases, issuers of insured obligations elected, or the Company and an issuer mutually agreed as part of a negotiation, to deliver the underlying collateral or insured obligation to the Company.three accounting models.
In circumstances where the Company has purchased its own insured obligations that have expected losses, expected loss to be paid is reduced by the proportionate share of the insured obligation that is held in the investment portfolio. The difference between the purchase price of the obligation and the fair value excluding the value of the Company's insurance is treated as a paid loss. Assets that are purchased by the Company are recorded in the investment portfolio, at fair value, excluding the value of the Company's insurance. See Note 10, Investments and Cash and Note 7, Fair Value Measurement.
Loss Estimation Process
The Company’s loss reserve committees estimate expected loss to be paid for all contracts by reviewing analyses that consider various scenarios with corresponding probabilities assigned to them. Depending upon the nature of the risk, the Company’s view of the potential size of any loss and the information available to the Company, that analysis may be based upon individually developed cash flow models, internal credit rating assessments, and sector-driven loss severity assumptions and/or judgmental assessments. In the case of its assumed business, the Company may conduct its own analysis as just described or, depending on the Company’s view of the potential size of any loss and the information available to the Company, the Company may use loss estimates provided by ceding insurers. The Company monitors the performance of its transactions with expected losses and each quarter the Company’s loss reserve committees review and refresh their loss projection assumptions, and scenarios and the probabilities they assign to those scenarios based on actual developments during the quarter and their view of future performance.
The financial guaranties issued by the Company insure the credit performance of the guaranteed obligations over an extended period of time, in some cases over 30 years, and in most circumstances the Company has no right to cancel such financial guaranties. As a result, the Company's estimate of ultimate lossesloss on a policy is subject to significant uncertainty over the life of the insured transaction. Credit performance can be adversely affected by economic, fiscal and financial market variability over the long life of most contracts.
The Company does not use traditional actuarial approaches to determine its estimates of expected losses. The determination of expected loss to be paid is an inherently subjective process involving numerous estimates, assumptions and judgments by management, using both internal and external data sources with regard to frequency, severity of loss, economic projections, governmental actions, negotiations and other factors that affect credit performance. These estimates, assumptions and judgments, and the factors on which they are based, may change materially over a reporting period, and as a result the Company’s loss estimates may change materially over that same period.
Changes in the Company’s loss estimates for structured finance transactions generally will be influenced by factors impacting the performance of the assets supporting those transactions. For example, changes over a reporting period in the Company’s loss estimates for its RMBS transactions may be influenced by such factors as the level and timing of loan defaults experienced; changes in housing prices; results from the Company's loss mitigation activities; and other variables.
Similarly, changes over a reporting period in the Company’s loss estimates for municipal obligations supported by specified revenue streams, such as revenue bonds issued by toll road authorities, municipal utilities or airport authorities, generally will be influenced by factors impacting their revenue levels, such as changes in demand; changing demographics; and other economic factors, especially if the obligations do not benefit from financial support from other tax revenues or governmental authorities. Changes over a reporting period in the Company’s loss estimates for its tax-supported public finance transactions generally will be influenced by factors impacting the public issuer’s ability and willingness to pay, such as changes in the economy and population of the relevant area; changes in the issuer’s ability or willingness to raise taxes, decrease spending or receive federal assistance; new legislation; rating agency downgradesactions that reduceaffect the issuer’s ability to refinance maturing obligations or issue new debt at a reasonable cost; changes in the priority or amount of pensions and other obligations owed to workers; developments in restructuring or settlement negotiations; and other political and economic factors. Changes in loss estimates may also be affected by the Company's loss mitigation efforts and other variables.
The Company does not use traditional actuarial approaches to determineChanges in the Company’s loss estimates for structured finance transactions generally will be influenced by factors impacting the performance of the assets supporting those transactions. For example, changes over a reporting period in the Company’s loss estimates for its estimatesRMBS transactions may be influenced by factors such as the level and timing of expected losses. loan defaults experienced, changes in housing prices, results from the Company's loss mitigation activities, and other variables.
Actual losses will ultimately depend on future events or transaction performance and may be influenced by many interrelated factors that are difficult to predict. As a result, the Company's current projections of probable and estimable losses may be subject to considerable volatility and may not reflect the Company's ultimate claims paid.
In some instances, the terms of the Company's policy gives it the option to pay principal losses that have been recognized in the transaction but which it is not yet required to pay, thereby reducing the amount of guaranteed interest due in the future. The Company has sometimes exercised this option, which uses cash but reduces projected future losses.
The following tables present a roll forward of the present value of net expected loss to be paid for all contracts, whether accounted for as insurance, credit derivatives or FG VIEs, by sector, after the benefit for expected recoveries for breaches of R&W and other expected recoveries.contracts. The Company used risk-free rates for U.S. dollar denominated obligations that ranged from 0.0%0.00% to 3.23%2.45% with a weighted average of 2.73%1.94% as of December 31, 20162019 and 0.0%0.00% to 3.25%3.06% with a weighted average of 2.36%2.74% as of December 31, 2015.2018. Expected losses to be paid for transactions denominated in currencies other than the U.S. dollar represented approximately 3.2% and 2.7% of the total as of December 31, 2019 and December 31, 2018, respectively.
Net Expected Loss to be Paid
Roll Forward
|
| | | | | | | |
| | Year Ended December 31, |
| | 2019 |
| 2018 |
| | (in millions) |
| Net expected loss to be paid, beginning of period | $ | 1,183 |
| | $ | 1,303 |
|
| Net expected loss to be paid on the SGI portfolio as of June 1, 2018 (see Note 2) | — |
| | 131 |
|
| Economic loss development (benefit) due to: | | | |
| Accretion of discount | 22 |
| | 36 |
|
| Changes in discount rates | (11 | ) | | (17 | ) |
| Changes in timing and assumptions | (12 | ) | | (24 | ) |
| Total economic loss development (benefit) | (1 | ) | | (5 | ) |
| Net (paid) recovered losses | (445 | ) | | (246 | ) |
| Net expected loss to be paid, end of period | $ | 737 |
| | $ | 1,183 |
|
|
| | | | | | | |
| | Year Ended December 31, |
| | 2016 | | 2015 |
| | (in millions) |
| Net expected loss to be paid, beginning of period | $ | 1,391 |
| | $ | 1,169 |
|
| Net expected loss to be paid on the CIFGH portfolio as of July 1, 2016 | 22 |
| | — |
|
| Net expected loss to be paid on Radian Asset portfolio as of April 1, 2015 | — |
| | 190 |
|
| Economic loss development due to: | | | |
| Accretion of discount | 26 |
| | 32 |
|
| Changes in discount rates | (15 | ) | | (23 | ) |
| Changes in timing and assumptions | 128 |
| | 310 |
|
| Total economic loss development | 139 |
| | 319 |
|
| Paid losses | (354 | ) | | (287 | ) |
| Net expected loss to be paid, end of period | $ | 1,198 |
| | $ | 1,391 |
|
Net Expected Loss to be Paid
Roll Forward by Sector
Year Ended December 31, 2016
|
| | | | | | | | | | | | | | | |
| | Year Ended December 31, 2019 |
| | Net Expected
Loss to be
Paid (Recovered) as of
December 31, 2018 | | Economic Loss Development / (Benefit) | | (Paid) Recovered Losses (1) | | Net Expected
Loss to be
Paid (Recovered) as of
December 31, 2019 |
| | (in millions) |
| Public finance: | | | | | | | |
| U.S. public finance | $ | 832 |
| | $ | 224 |
| | $ | (525 | ) | | $ | 531 |
|
| Non-U.S. public finance | 32 |
| | (9 | ) | | — |
| | 23 |
|
| Public finance | 864 |
| | 215 |
| | (525 | ) | | 554 |
|
| Structured finance: | | | | | | | |
| U.S. RMBS | 293 |
| | (234 | ) | | 87 |
| | 146 |
|
| Other structured finance | 26 |
| | 18 |
| | (7 | ) | | 37 |
|
| Structured finance | 319 |
| | (216 | ) | | 80 |
| | 183 |
|
| Total | $ | 1,183 |
| | $ | (1 | ) | | $ | (445 | ) | | $ | 737 |
|
|
| | | | | | | | | | | | | | | | | | | |
| | Net Expected Loss to be Paid (Recovered) as of December 31, 2015(2) | | Net Expected
Loss to be
Paid
(Recovered)
on CIFG as of
July 1, 2016 | | Economic Loss Development | | (Paid) Recovered Losses (1) | | Net Expected
Loss to be
Paid (Recovered) as of
December 31, 2016 (2) |
| | (in millions) |
| Public finance: | | | | | | | | | |
| U.S. public finance | $ | 771 |
| | $ | 40 |
| | $ | 276 |
| | $ | (216 | ) | | $ | 871 |
|
| Non-U.S. public finance | 38 |
| | 2 |
| | (7 | ) | | — |
| | 33 |
|
| Public finance | 809 |
| | 42 |
| | 269 |
| | (216 | ) | | 904 |
|
| Structured finance: | | | | | | | | | |
| U.S. RMBS | 409 |
| | (22 | ) | | (91 | ) | | (90 | ) | | 206 |
|
| Triple-X life insurance transactions | 99 |
| | — |
| | (22 | ) | | (23 | ) | | 54 |
|
| Other structured finance | 74 |
| | 2 |
| | (17 | ) | | (25 | ) | | 34 |
|
| Structured finance | 582 |
| | (20 | ) | | (130 | ) | | (138 | ) | | 294 |
|
| Total | $ | 1,391 |
| | $ | 22 |
| | $ | 139 |
| | $ | (354 | ) | | $ | 1,198 |
|
Net Expected Loss to be Paid
Roll Forward by Sector
Year Ended December 31, 2015
| | | | | | | | | | | | | Year Ended December 31, 2018 |
| | Net Expected Loss to be Paid (Recovered) as of December 31, 2014 | | Net Expected
Loss to be
Paid
(Recovered)
on Radian Asset portfolio as of
April 1, 2015 | | Economic Loss Development | | (Paid) Recovered Losses (1) | | Net Expected
Loss to be
Paid (Recovered) as of
December 31, 2015 (2) | Net Expected
Loss to be
Paid (Recovered) as of
December 31, 2017 | | Net Expected
Loss to be Paid on SGI portfolio as of
June 1, 2018 | | Economic Loss Development / (Benefit) | | (Paid) Recovered Losses (1) | | Net Expected
Loss to be
Paid (Recovered) as of
December 31, 2018 |
| | (in millions) | (in millions) |
| Public finance: | | | | | | | | | | | | | | | | | | |
| U.S. public finance | $ | 303 |
| | $ | 81 |
| | $ | 416 |
| | $ | (29 | ) | | $ | 771 |
| $ | 1,157 |
| | $ | — |
| | $ | 70 |
| | $ | (395 | ) | | $ | 832 |
|
| Non-U.S. public finance | 45 |
| | 4 |
| | (11 | ) | | — |
| | 38 |
| 46 |
| | 1 |
| | (14 | ) | | (1 | ) | | 32 |
|
| Public finance | 348 |
| | 85 |
| | 405 |
| | (29 | ) | | 809 |
| 1,203 |
| | 1 |
| | 56 |
| | (396 | ) | | 864 |
|
| Structured finance: | | | | | | | | | | | | | | | | | | |
| U.S. RMBS | 584 |
| | 4 |
| | (82 | ) | | (97 | ) | | 409 |
| 73 |
| | 130 |
| | (69 | ) | | 159 |
| | 293 |
|
| Triple-X life insurance transactions | 161 |
| | — |
| | 11 |
| | (73 | ) | | 99 |
| |
| Other structured finance | 76 |
| | 101 |
| | (15 | ) | | (88 | ) | | 74 |
| 27 |
| | — |
| | 8 |
| | (9 | ) | | 26 |
|
| Structured finance | 821 |
| | 105 |
| | (86 | ) | | (258 | ) | | 582 |
| 100 |
| | 130 |
| | (61 | ) | | 150 |
| | 319 |
|
| Total | $ | 1,169 |
| | $ | 190 |
| | $ | 319 |
| | $ | (287 | ) | | $ | 1,391 |
| $ | 1,303 |
| | $ | 131 |
| | $ | (5 | ) | | $ | (246 | ) | | $ | 1,183 |
|
____________________
| |
| (1) | Net of ceded paid losses, whether or not such amounts have been settled with reinsurers. Ceded paid losses are typically settled 45 days after the end of the reporting period. Such amounts are recorded inas reinsurance recoverable on paid losses included in other assets. The Company paid $16 millionamounts for 2019 are net of the COFINA Exchange Senior Bonds and $25 million in LAEcash that were received pursuant to the COFINA Plan of Adjustment. See Note 5, Outstanding Insurance Exposure, for the years ended December 31, 2016 and 2015, respectively.additional information. |
| |
The tables above include (1) LAE paid of $35 million and $28 million for the years ended December 31, 2019 and 2018, respectively, and (2) | Includes expected LAE to be paid of $12 million as of December 31, 2016 and $12 million as of December 31, 2015. |
Future Net R&W Recoverable (Payable)(1)
|
| | | | | | | | | | | |
| | Future Net
R&W Benefit as of
December 31, 2016 | | Future Net
R&W Benefit as of
December 31, 2015 | | Future Net
R&W Benefit as of
December 31, 2014 |
| | (in millions) |
| U.S. RMBS: | | | | | |
| First lien | $ | (53 | ) | | $ | 0 |
| | $ | 232 |
|
| Second lien | 47 |
| | 79 |
| | 85 |
|
| Total | $ | (6 | ) | | $ | 79 |
| | $ | 317 |
|
____________________
| |
(1) | The Company’s agreements with R&W providers generally provide that, as the Company makes claim payments, the R&W providers reimburse it for those claims; if the Company later receives reimbursement through the transaction (for example, from excess spread), the Company repays the R&W providers. See the section “Breaches of Representations and Warranties” for information about the R&W agreements. When the Company projects receiving more reimbursements in the future than it projects paying in claims on transactions covered by R&W settlement agreements, the Company will have a net R&W payable.
|
The following table presents the present value of net expected loss to be paid for all contracts by accounting model, by sectorof $33 million as of December 31, 2019 and after the benefit for expected recoveries for breaches$31 million as of R&W. December 31, 2018.
Net Expected Loss to be Paid (Recovered)
By Accounting Model
|
| | | | | | | | | | | | | | | | | | | | | | | |
| | As of December 31, 2016 | | As of December 31, 2015 |
| | Public Finance | | Structured Finance | | Total | | Public Finance | | Structured Finance | | Total |
| | (in millions) |
| Financial guaranty insurance | $ | 904 |
| | $ | 179 |
| | $ | 1,083 |
| | $ | 809 |
| | $ | 430 |
| | $ | 1,239 |
|
| FG VIEs (1) and other | — |
| | 105 |
| | 105 |
| | — |
| | 136 |
| | 136 |
|
| Credit derivatives (2) | 0 |
| | 10 |
| | 10 |
| | — |
| | 16 |
| | 16 |
|
| Total | $ | 904 |
| | $ | 294 |
| | $ | 1,198 |
| | $ | 809 |
| | $ | 582 |
| | $ | 1,391 |
|
___________
(1) Refer to Note 9, Consolidated Variable Interest Entities.
(2) Refer to Note 8, Contracts Accounted for as Credit Derivatives.
The following table presents the net economic loss development for all contracts by accounting model, by sector and after the benefit for expected recoveries for breaches of R&W.
Net Economic Loss Development (Benefit)
By Accounting Model
|
| | | | | | | | | | | | | | | |
| | Net Expected Loss to be Paid (Recovered) | | Net Economic Loss Development (Benefit) |
| | As of December 31, | | Year Ended December 31, |
| | 2019 | | 2018 | | 2019 | | 2018 |
| | (in millions) |
| Insurance | $ | 683 |
| | $ | 1,110 |
| | $ | 14 |
| | $ | (9 | ) |
| FG VIEs (See Note 14) | 58 |
| | 75 |
| | (29 | ) | | (13 | ) |
| Credit derivatives (See Note 11) | (4 | ) | | (2 | ) | | 14 |
| | 17 |
|
| Total | $ | 737 |
| | $ | 1,183 |
| | $ | (1 | ) | | $ | (5 | ) |
|
| | | | | | | | | | | | | | | | | | | | | | | |
| | Year Ended December 31, 2016 | | Year Ended December 31, 2015 |
| | Public Finance | | Structured Finance | | Total | | Public Finance | | Structured Finance | | Total |
| | (in millions) |
| Financial guaranty insurance | $ | 269 |
| | $ | (105 | ) | | $ | 164 |
| | $ | 410 |
| | $ | (25 | ) | | $ | 385 |
|
| FG VIEs (1) and other | — |
| | (8 | ) | | (8 | ) | | — |
| | 16 |
| | 16 |
|
| Credit derivatives (2) | — |
| | (17 | ) | | (17 | ) | | (5 | ) | | (77 | ) | | (82 | ) |
| Total | $ | 269 |
| | $ | (130 | ) | | $ | 139 |
| | $ | 405 |
| | $ | (86 | ) | | $ | 319 |
|
__________
(1) Refer to Note 9, Consolidated Variable Interest Entities.
(2) Refer to Note 8, Contracts Accounted for as Credit Derivatives.
Selected U.S. Public Finance Transactions
The Company insuresinsured general obligation bonds of the Commonwealth of Puerto Rico and various obligations of its related authorities and public corporations aggregating $4.8$4.3 billion net par as of December 31, 2016,2019, all of which arewas BIG. For additional information regarding the Company's exposure to general obligations of Commonwealth of Puerto Rico and various obligations of its related authorities and public corporations, please refer toexposure, see "Exposure to Puerto Rico" in Note 4,5, Outstanding Insurance Exposure.
As of December 31, 2018, the Company had approximately $18 million of net par exposure to bonds issued by Parkway East Public Improvement District (District), which is located in Madison County, Mississippi (the County). The bonds were rated BIG. As part of a settlement with the County, during the third quarter of 2019 the bonds were paid off, reducing the Company's net par exposure to zero, and the Company received new bonds issued by the District, which the Company holds in its investment portfolio.
On February 25, 2015, a plan of adjustment resolving the bankruptcy filing of the City of Stockton, California under chapter 9 of the U.S. Bankruptcy Code became effective. As of December 31, 2016,2019, the Company’s net par subject to the plan consists
consisted of $113$107 million of pension obligation bonds. As part of the plan settlement,of adjustment, the City will repay claims paid on the pension obligation bonds from certain fixed payments and certain variable payments contingent on the City's revenue growth.
The Company projects that its total net expected loss across its troubled U.S. public finance creditsexposures as of December 31, 2016,2019, including those mentioned above, which incorporated the likelihood of the various outcomes, willto be $871$531 million,
compared with a net expected loss of $771$832 million as of December 31, 2015. On July 1, 2016,2018. The total net expected loss for troubled U.S. public finance exposures is net of a credit for estimated future recoveries of claims already paid. At December 31, 2019, that credit was $819 million, compared with $586 million at December 31, 2018. The Company’s net expected losses incorporate management’s probability weighted estimates of possible scenarios. Each quarter, the CIFG Acquisition added $40 million in netCompany may revise its scenarios, update assumptions and/or shift probability weightings of its scenarios based on public information as well as nonpublic information obtained through its surveillance and loss mitigation activities. Management assesses the possible implications of such information on each insured obligation, considering the unique characteristics of each transaction.
The economic losses to be paidloss development for U.S. public finance credits. Economic loss developmenttransactions was $224 million in 2016 was $276 million,2019, which was primarily attributable to Puerto Rico exposures. The loss development attributable to the Company’s Puerto Rico exposures reflects adjustments the Company made to the assumptions and weightings it uses in its scenarios based on the public information summarized under "Exposure to Puerto Rico" in Note 5, Outstanding Insurance Exposure as well as nonpublic information related to its loss mitigation activities during the period.
Certain Selected European Country Sub-SovereignNon-U.S. Public Finance Transactions
The Company insures and reinsures creditsExpected loss to be paid for non-U.S. public finance transactions was $23 million as of December 31, 2019, compared with $32 million as of December 31, 2018, primarily consisting of: (i) transactions with sub-sovereign exposure to various Spanish and Portuguese issuers where a Spanish and Portuguese sovereign default may cause the sub-sovereigns also to default. The Company's exposure netdefault, (ii) an obligation backed by the availability and toll revenues of reinsurance to these Spanish and Portuguese credits is $342 million and $76 million, respectively. The Company rates most of these issuers BIGa major arterial road into a city in the U.K., which has been underperforming due to higher costs compared with expectations at underwriting, and (iii) an obligation backed by payments from a region in Italy, and for which the financial conditionCompany has been paying claims because of Spain and Portugal and their dependencethe impact of negative Euro Interbank Offered Rate (Euribor) on the sovereign. The Company's Hungary exposure is to infrastructure bonds dependent on payments from Hungarian governmental entities. The Company's exposure net of reinsurance to these Hungarian credits is $236 million, all of which is rated BIG. The Company estimated net expected losses of $29 million related to these Spanish, Portuguese and Hungarian credits. transaction.
The economic benefit offor non-U.S. public finance transactions, including those mentioned above, was approximately $7$9 million during 20162019, which was primarily relatedmainly attributable to changes in the exchange rate between the euroimproved internal outlook of certain Spanish sovereigns and U.S. Dollar.sub-sovereigns.
Approach to Projecting Losses in U.S. RMBS Loss Projections
The Company projects losses on its insured U.S. RMBS on a transaction-by-transaction basis by projecting the performance of the underlying pool of mortgages over time and then applying the structural features (i.e., payment priorities and tranching) of the RMBS and any expected R&W agreementsrecoveries/payables to the projected performance of the collateral over time. The resulting projected claim payments or reimbursements are then discounted using risk-free rates.
The further behind a mortgage borrower falls in making payments, the more likely it is that he or she will default. The rate at which borrowers from a particular delinquency category (number of monthly payments behind) eventually default is referred to as the “liquidation rate.” The Company derives its liquidation rate assumptions from observed roll rates, which are the rates at which loans progress from one delinquency category to the next and eventually to default and liquidation. The Company applies liquidation rates to the mortgage loan collateral in each delinquency category and makes certain timing assumptions to project near-term mortgage collateral defaults from loans that are currently delinquent.
Mortgage borrowers that are not more than one1 payment behind (generally considered performing borrowers) have demonstrated an ability and willingness to pay throughoutthrough the recession and mortgage crisis, and as a result are viewed as less likely to default than delinquent borrowers. Performing borrowers that eventually default will also need to progress through delinquency categories before any defaults occur. The Company projects how many of the currently performing loans will default and when they will default, by first converting the projected near term defaults of delinquent borrowers derived from liquidation rates into a vector of conditional default rates (CDR), then projecting how the CDR will develop over time. Loans that are defaulted pursuant to the CDR after the near-term liquidation of currently delinquent loans represent defaults of currently performing loans and projected re-performing loans. A CDR is the outstanding principal amount of defaulted loans liquidated in the current month divided by the remaining outstanding amount of the whole pool of loans (or “collateral pool balance”). The collateral pool balance decreases over time as a result of scheduled principal payments, partial and whole principal prepayments, and defaults.
In order to derive collateral pool losses from the collateral pool defaults it has projected, the Company applies a loss severity. The loss severity is the amount of loss the transaction experiences on a defaulted loan after the application of net proceeds from the disposal of the underlying property. The Company projects loss severities by sector and vintage based on its experience to date. The Company continues to update its evaluation of these loss severities as new information becomes available.
As of December 31, 2019, the Company had a net R&W payable of $53 million to R&W counterparties, compared with a net R&W receivable of $5 million as of December 31, 2018. The Company has been enforcing claims for breachesCompany’s agreements with providers of R&W regardinggenerally provide for reimbursement to the characteristicsCompany as claim payments are made and, to the extent the Company later receives reimbursements of such claims from excess spread or other sources, for the loans includedCompany to provide reimbursement to the R&W providers. When the Company projects receiving more reimbursements in the collateral pools. The Company calculates a credit forfuture than it projects to pay in claims on transactions covered by R&W recoveries to include in its cash flow projections. Wheresettlement agreements, the Company has an agreement with anwill have a net R&W provider (such as its agreements with Bank of America and UBS, which are described in more detail under "Breaches of Representations and Warranties" below), that credit is based on the agreement. Where the Company does not have an agreement with the R&W provider but the Company believes the R&W provider to be economically viable, the Company estimates what portion of its past and projected future claims it believes will be reimbursed by that provider.payable.
The Company projects the overall future cash flow from a collateral pool by adjusting the payment stream from the principal and interest contractually due on the underlying mortgages for the collateral losses it projects as described above; assumed voluntary prepayments; and servicer advances. The Company then applies an individual model of the structure of the transaction to the projected future cash flow from that transaction’s collateral pool to project the Company’s future claims and
claim reimbursements for that individual transaction. Finally, the projected claims and reimbursements are discounted using risk-free rates. The Company runs several sets of assumptions regarding mortgage collateral performance, or scenarios, and probability weights them.
The Company's RMBS loss projection methodology assumes that the housing and mortgage markets will continue improving. Each period the Company makes a judgment as to whether to change the assumptions it uses to make RMBS loss projections based on its observation during the period of the performance of its insured transactions (including early stage delinquencies, late stage delinquencies and loss severity) as well as the residential property market and economy in general, and, to the extent it observes changes, it makes a judgment as to whether those changes are normal fluctuations or part of a trend.
Year-End 2016 Compared to Year-End 2015 U.S. RMBS Loss Projections
Based on its observation during the period of the performance of its insured transactions (including early stage delinquencies, late stage delinquencies and loss severity) as well as the residential property market and economy in general, the Company chose to use the same general The assumptions to project RMBS losses as of December 31, 2016 as it used as of December 31, 2015, except it (1) increased severities for specific vintages of Alt-A first lien, Option ARM and subprime transactions, (2) decreased liquidation rates for specific non-performing categories of subprime transactions and Option ARM and (3) increased liquidation rates for specific non-performing categories of second lien transactions. In 2016 the economic benefit was $68 million for first lien U.S. RMBS and $23 million for second lien U.S. RMBS.
Year-End 2015 Compared to Year-End 2014 U.S. RMBS Loss Projections
Based on its observation during the period of the performance of its insured transactions (including early stage delinquencies, late stage delinquencies and loss severity) as well as the residential property market and economy in general, the Company chose to use the same general assumptions to project RMBS losses as of December 31, 2015 as it used as of December 31, 2014, except that for its first lien RMBS loss projections for 2015, it shortened by twelve months the period it is projecting it will take in the base case to reach the final CDR as compared with December 31, 2014. The methodology and revised assumptions the Company used to project first lien RMBS losses and the scenarios it employed are described in more detail below under " - U.S. First Lien RMBS Loss Projections: Alt A First Lien, Option ARM, Subprime and Prime", and the methodology and assumptions the Company uses to project second lien RMBS losses andare shown in the scenarios it employs are described in more detail below under " - U.S. Second Lien RMBSsections below.
Net Economic Loss Projections." In 2015 the economic benefit was $124 million for first lien Development (Benefit)
U.S. RMBS and loss development was $42 million for second lien U.S. RMBS.
|
| | | | | | | |
| | Year Ended December 31, |
| | 2019 | | 2018 |
| | (in millions) |
| First lien U.S. RMBS | $ | (77 | ) | | $ | 16 |
|
| Second lien U.S. RMBS | (157 | ) | | (85 | ) |
U.S. First Lien RMBS Loss Projections: Alt-A First Lien, Option ARM, Subprime and Prime
The majority of projected losses in first lien RMBS transactions are expected to come from non-performing mortgage loans (those that are or in the past twelve months have been two2 or more payments behind, have been modified, are in foreclosure, or have been foreclosed upon). Changes in the amount of non-performing loans from the amount projected in the previous period are one of the primary drivers of loss developmentprojections in this portfolio. In order to determine the number of defaults resulting from these delinquent and foreclosed loans, the Company applies a liquidation rate assumption to loans in each of various non-performing categories. The Company arrived at its liquidation rates based on data purchased from a third party provider and assumptions about how delays in the foreclosure process and loan modifications may ultimately affect the rate at which loans are liquidated. Each quarter the Company reviews the most recent twelve months of this data and (if necessary) adjusts its liquidation rates based on its observations. The following table shows liquidation assumptions for various non-performing categories.
First Lien Liquidation Rates
|
| | | | | |
| | As of December 31, |
| | 2019 | | 2018 | | 2017 |
| Delinquent/Modified in the Previous 12 Months | | | | | |
| Alt-A and Prime | 20% | | 20% | | 20% |
| Option ARM | 20 | | 20 | | 20 |
| Subprime | 20 | | 20 | | 20 |
| 30 – 59 Days Delinquent | | | | | |
| Alt-A and Prime | 30 | | 30 | | 30 |
| Option ARM | 35 | | 35 | | 35 |
| Subprime | 35 | | 40 | | 40 |
| 60 – 89 Days Delinquent | | | | | |
| Alt-A and Prime | 40 | | 40 | | 40 |
| Option ARM | 45 | | 45 | | 50 |
| Subprime | 45 | | 45 | | 50 |
| 90+ Days Delinquent | | | | | |
| Alt-A and Prime | 55 | | 50 | | 55 |
| Option ARM | 55 | | 55 | | 60 |
| Subprime | 50 | | 50 | | 55 |
| Bankruptcy | | | | | |
| Alt-A and Prime | 45 | | 45 | | 45 |
| Option ARM | 50 | | 50 | | 50 |
| Subprime | 40 | | 40 | | 40 |
| Foreclosure | | | | | |
| Alt-A and Prime | 65 | | 60 | | 65 |
| Option ARM | 65 | | 65 | | 70 |
| Subprime | 60 | | 60 | | 65 |
| Real Estate Owned | | | | | |
| All | 100 | | 100 | | 100 |
|
| | | | | |
| | December 31, 2016 | | December 31, 2015 | | December 31, 2014 |
| Current Loans Modified in the Previous 12 Months | | | | | |
| Alt-A and Prime | 25% | | 25% | | 25% |
| Option ARM | 25 | | 25 | | 25 |
| Subprime | 25 | | 25 | | 25 |
| Current Loans Delinquent in the Previous 12 Months | | | | | |
| Alt-A and Prime | 25 | | 25 | | 25 |
| Option ARM | 25 | | 25 | | 25 |
| Subprime | 25 | | 25 | | 25 |
| 30 – 59 Days Delinquent | | | | | |
| Alt-A and Prime | 35 | | 35 | | 35 |
| Option ARM | 35 | | 40 | | 40 |
| Subprime | 40 | | 45 | | 35 |
| 60 – 89 Days Delinquent | | | | | |
| Alt-A and Prime | 45 | | 45 | | 50 |
| Option ARM | 50 | | 50 | | 55 |
| Subprime | 50 | | 55 | | 40 |
| 90+ Days Delinquent | | | | | |
| Alt-A and Prime | 55 | | 55 | | 60 |
| Option ARM | 55 | | 60 | | 65 |
| Subprime | 55 | | 60 | | 55 |
| Bankruptcy | | | | | |
| Alt-A and Prime | 45 | | 45 | | 45 |
| Option ARM | 50 | | 50 | | 50 |
| Subprime | 40 | | 40 | | 40 |
| Foreclosure | | | | | |
| Alt-A and Prime | 65 | | 65 | | 75 |
| Option ARM | 65 | | 70 | | 80 |
| Subprime | 65 | | 70 | | 70 |
| Real Estate Owned | | | | | |
| All | 100 | | 100 | | 100 |
While the Company uses liquidation rates as described above to project defaults of non-performing loans (including current loans modified or delinquent within the last 12 months), it projects defaults on presently current loans by applying a CDR trend. The start of that CDR trend is based on the defaults the Company projects will emerge from currently nonperforming, recently nonperforming and modified loans. The total amount of expected defaults from the non-performing loans is translated into a constant CDR (i.e.(i.e., the CDR plateau), which, if applied for each of the next 36 months, would be sufficient to produce approximately the amount of defaults that were calculated to emerge from the various delinquency categories. The CDR thus calculated individually on the delinquent collateral pool for each RMBS is then used as the starting point for the CDR curve used to project defaults of the presently performing loans.
In the most heavily weighted scenario (the base case,case), after the initial 36-month CDR plateau period, each transaction’s CDR is projected to improve over 12 months to an intermediate CDR (calculated as 20% of its CDR plateau); that intermediate CDR is held constant for 36 months and then trails off in steps to a final CDR of 5% of the CDR plateau. In the base case, the Company assumes the final CDR will be reached 6.53.5 years after the initial 36-month CDR plateau period. Under the Company’s methodology, defaults projected to occur in the first 36 months represent defaults that can be attributed to loans that were modified or delinquent in the last 12 months or that are currently delinquent or in foreclosure, while the defaults projected to occur using the projected CDR trend after the first 36 month period represent defaults attributable to borrowers that are currently performing or are projected to reperform.
Another important driver of loss projections is loss severity, which is the amount of loss the transaction incurs on a loan after the application of net proceeds from the disposal of the underlying property. Loss severities experienced in first lien
transactions havehad reached historically high levels, and the Company is assuming in the base case that these highthe still elevated levels generally will continue for another 18 months. The Company determines its initial loss severity based on actual recent experience. As a result,Each quarter the Company updatedreviews available data and (if necessary) adjusts its severities for specific asset classes and vintages based on observed data, as shown in the tables below.its observations. The Company then assumes that loss severities begin returning to levels consistent with underwriting assumptions beginning after the initial 18 month period, declining to 40% in the base case over 2.5 years.
The following table shows the range as well as the average, weighted by outstanding net insured par, for key assumptions used in the calculation of expected loss to be paid for individual transactions for direct vintage 2004 - 2008 first lien U.S. RMBS.
Key Assumptions in Base Case Expected Loss Estimates
First Lien RMBS(1)RMBS
| | | | As of
December 31, 2016 | | As of
December 31, 2015 | | As of
December 31, 2014 | As of
December 31, 2019 | | As of
December 31, 2018 | | As of
December 31, 2017 |
| | Range | | Weighted Average | | Range | | Weighted Average | | Range | | Weighted Average | Range | | Weighted Average | | Range | | Weighted Average | | Range | | Weighted Average |
| Alt-A First Lien | | | | | | | | | | | | | | |
| Plateau CDR | 1.0 | % | – | 13.5% | | 5.7% | | 1.7 | % | – | 26.4% | | 6.4% | | 2.0 | % | – | 13.4% | | 7.3% | 0.3 | % | – | 8.4% | | 4.1% | | 1.2 | % | – | 11.4% | | 4.6% | | 1.3 | % | – | 9.8% | | 5.2% |
| Final CDR | 0.0 | % | – | 0.7% | | 0.3% | | 0.1 | % | – | 1.3% | | 0.3% | | 0.1 | % | – | 0.7% | | 0.3% | 0.0 | % | – | 0.4% | | 0.2% | | 0.1 | % | – | 0.6% | | 0.2% | | 0.1 | % | – | 0.5% | | 0.3% |
| Initial loss severity: | | | | | | | | | | | | |
| 2005 and prior | 60.0% | | 60.0% | | 60.0% | | 60% | | 60% | | 60% | |
| 2006 | 80.0% | | 70.0% | | 70.0% | | 70% | | 70% | | 80% | |
| 2007 | 70.0% | | 65.0% | | 65.0% | | |
| 2007+ | | 70% | | 70% | | 70% | |
| Option ARM | | | | | | | | | | | | | | |
| Plateau CDR | 3.2 | % | – | 7.0% | | 5.6% | | 3.5 | % | – | 10.3% | | 7.8% | | 4.3 | % | – | 14.2% | | 10.6% | 1.8 | % | – | 8.4% | | 5.4% | | 1.8 | % | – | 8.3% | | 5.6% | | 2.5 | % | – | 7.0% | | 5.9% |
| Final CDR | 0.2 | % | – | 0.3% | | 0.3% | | 0.2 | % | – | 0.5% | | 0.4% | | 0.2 | % | – | 0.7% | | 0.5% | 0.1 | % | – | 0.4% | | 0.3% | | 0.1 | % | – | 0.4% | | 0.3% | | 0.1 | % | – | 0.3% | | 0.3% |
| Initial loss severity: | | | | | | | | | | | | |
| 2005 and prior | 60.0% | | 60.0% | | 60.0% | | 60% | | 60% | | 60% | |
| 2006 | 70.0% | | 70.0% | | 70.0% | | 60% | | 60% | | 70% | |
| 2007 | 75.0% | | 65.0% | | 65.0% | | |
| 2007+ | | 70% | | 70% | | 75% | |
| Subprime | | | | | | | | | | | | | | |
| Plateau CDR | 2.8 | % | – | 14.1% | | 8.1% | | 4.7 | % | – | 13.2% | | 9.5% | | 4.9 | % | – | 15.0% | | 10.6% | 1.6 | % | – | 18.1% | | 5.6% | | 1.8 | % | – | 23.2% | | 6.2% | | 3.5 | % | – | 13.1% | | 7.8% |
| Final CDR | 0.1 | % | – | 0.7% | | 0.4% | | 0.2 | % | – | 0.7% | | 0.4% | | 0.2 | % | – | 0.7% | | 0.4% | 0.1 | % | – | 0.9% | | 0.3% | | 0.1 | % | – | 1.2% | | 0.3% | | 0.2 | % | – | 0.7% | | 0.4% |
| Initial loss severity: | | | | | | | | | | | | |
| 2005 and prior | 80.0% | | 75.0% | | 75.0% | | 75% | | 80% | | 80% | |
| 2006 | 90.0% | | 90.0% | | 90.0% | | 75% | | 75% | | 90% | |
| 2007 | 90.0% | | 90.0% | | 90.0% | | |
| 2007+ | | 75% | | 95% | | 95% | |
____________________
(1)Represents variables for most heavily weighted scenario (the “base case”).
The rate at which the principal amount of loans is voluntarily prepaid may impact both the amount of losses projected (since that amount is a function of the CDR, the loss severity and the loan balance over time) as well as the amount of excess spread (the amount by which the interest paid by the borrowers on the underlying loan exceeds the amount of interest owed on the insured obligations). The assumption for the voluntary conditional prepayment rate (CPR) follows a similar pattern to that of the CDR. The current level of voluntary prepayments is assumed to continue for the plateau period before gradually increasing over 12 months to the final CPR, which is assumed to be 15% in the base case. For transactions where the initial CPR is higher than the final CPR, the initial CPR is held constant and the final CPR is not used. These CPR assumptions are the same as those the Company used for December 31, 2015.2018.
In estimating expected losses, the Company modeled and probability weighted sensitivities for first lien transactions by varying its assumptions of how fast a recovery is expected to occur. One of the variables used to model sensitivities was how
quickly the CDR returned to its modeled equilibrium, which was defined as 5% of the initial CDR. The Company also stressed CPR and the speed of recovery of loss severity rates. The Company probability weighted a total of five5 scenarios as of December 31, 2016.2019 and December 31, 2018.
Total expected loss to be paid on all first lien U.S. RMBS was $166 million and $243 million as of December 31, 2019 and December 31, 2018, respectively. The $77 million economic benefit in 2019 for first lien U.S. RMBS was primarily attributable to higher excess spread on certain transactions supported by large portions of fixed rate assets (either originally fixed or modified to be fixed) and with insured floating rate debt linked to LIBOR, which decreased in 2019. The Company used a similar approach to establish its pessimistic and optimistic scenarios as of December 31, 20162019 as it used as of December 31, 2015,2018, increasing and decreasing the periods of stress from those used in the base case. LIBOR may be discontinued, and it is not yet clear how this will impact the calculation of the various interest rates in this portfolio referencing LIBOR.
In the Company's most stressful scenario where loss severities were assumed to rise and then recover over nine years and the initial ramp-down of the CDR was assumed to occur over 15 months, and other assumptions were the same as the other stress scenario, expected loss to be paid would increase from current projections by approximately $27$43 million for Alt-Aall first liens, $8 million for Option ARM, $46 million for subprime and $1 million for primelien U.S. RMBS transactions.
In the Company's least stressful scenario where the CDR plateau was six months shorter (30 months, effectively assuming that liquidation rates would improve) and the CDR recovery was more pronounced (including an initial ramp-down of the CDR over nine months), expected loss to be paid would decrease from current projections by approximately $13$38 million for Alt-Aall first liens, $22 million for Option ARM, $25 million for subprime and $0.1 million for primelien U.S. RMBS transactions.
U.S. Second Lien RMBS Loss Projections
Second lien RMBS transactions include both home equity lines of credit (HELOC) and closed end second lien.lien mortgages. The Company believes the primary variable affecting its expected losses in second lien RMBS transactions is the amount and timing of future losses or recoveries in the collateral pool supporting the transactions. Expected losses are also a function of the structure of the transaction;transaction, the voluntary prepayment rate (typically also referred to as CPR of the collateral);collateral, the interest rate environment;environment, and assumptions about the draw rate and loss severity.
In second lien transactions, the projection of near-term defaults from currently delinquent loans is relatively straightforward because loans in second lien transactions are generally “charged off” (treated as defaulted) by the securitization’s servicer once the loan is 180 days past due. The Company estimates the amount of loans that will default over the next six months by calculating current representative liquidation rates. A liquidation rate is the percent of loans in a given cohort (in this instance, delinquency category) that ultimately default. Similar to first liens, the Company then calculates a CDR for six months, which is the period over which the currently delinquent collateral is expected to be liquidated. That CDR is then used as the basis for the plateau CDR period that follows the embedded five months ofplateau losses.
For the base case scenario, the CDR (the plateau CDR) was held constant for six months. Once the plateau period has ended, the CDR is assumed to gradually trend down in uniform increments to its final long-term steady state CDR. (The long-term steady state CDR is calculated as the constant CDR that would have yielded the amount of losses originally expected at underwriting.) In the base case scenario, the time over which the CDR trends down to its final CDR is 28 months. Therefore, the total stress period for second lien transactions is 34 months, comprisingrepresenting six months of delinquent data andloan liquidations, followed by 28 months of decrease to the steady state CDR, the same as of December 31, 2015.2018.
HELOC loans generally permit the borrower to pay only interest for an initial period (often ten years) and, after that period, require the borrower to make both the monthly interest payment and a monthly principal payment, and so increasepayment. This causes the borrower's aggregatetotal monthly payment. Somepayment to increase, sometimes substantially, at the end of the initial interest-only period. In the prior periods, as the HELOC loans underlying the Company's insured HELOC transactions have reached their principal amortization period. Theperiod, the Company has observed that the increase in monthly payments occurring when a loan reaches its principal amortization period, even if mitigated by borrower relief offered by the servicer, is associated with increased borrower defaults. Thus, most of the Company's HELOC projections incorporateincorporated an assumption that a percentage of loans reaching their principal amortization periods willwould default around the time of the payment increase. These projected defaults
The HELOC loans underlying the Company's insured HELOC transactions are innow past their original interest-only reset date, although a significant number of HELOC loans were modified to extend the original interest-only period for another five years. As a result, the Company does not apply a CDR increase when such loans reach their principal amortization period. In addition, to those generated usingbased on the average performance history, the Company applies a CDR curve as described above. This assumption is similar tofloor of 2.5% for the one used as of December 31, 2015.future steady state CDR on all its HELOC transactions.
When a second lien loan defaults, there is generally a very low recovery. The Company assumed, as of December 31, 20162019 and December 31, 2018, that it will generally recover only 2% of future defaulting collateral at the collateral defaulting in the future and decliningtime of charge-off, with additional amounts of post-default receiptspost charge-off recoveries projected to come in over time. A second lien on previously defaulted collateral. Thisthe borrower’s home may be retained in the Company's second lien transactions after the loan is charged off and the same assumption usedloss applied to the transaction, particularly in cases where the holder of the first lien has not foreclosed. If the second lien is retained and the value of the home increases, the servicer may be able to use the second lien to increase recoveries, either by arranging for the borrower to resume
payments or by realizing value upon the sale of the underlying real estate. The Company evaluates its assumptions periodically based on actual recoveries of charged-off loans observed from period to period. In instances where the Company is able to obtain information on the lien status of charged-off loans, it assumes there will be a certain level of future recoveries of the balance of the charged-off loans where the second lien is still intact. The Company projected future recoveries on these charged-off loans of 20% as of December 31, 2015.2019 and 10% as of December 31, 2018, with such recoveries to be received evenly over the next five years. The increase in recovery assumptions is attributable to the higher actual recovery rates observed in certain transactions during the year. Increasing the recovery rate to 30% would result in an economic benefit of $57 million, while decreasing the recovery rate back to 10% would result in an economic loss of $57 million.
The rate at which the principal amount of loans is prepaid may impact both the amount of losses projected as well as the amount of excess spread. In the base case, an average CPR (based on experience of the past year) is assumed to continue until the end of the plateau before gradually increasing to the final CPR over the same period the CDR decreases. The final CPR is assumed to be 15% for second lien transactions (in the base case), which is lower than the historical average but reflects the Company’s continued uncertainty about the projected performance of the borrowers in these transactions. For transactions where the initial CPR is higher than the final CPR, the initial CPR is held constant and the final CPR is not used. This pattern is generally
consistent with how the Company modeled the CPR as of December 31, 2015.2018. To the extent that prepayments differ from projected levels it could materially change the Company’s projected excess spread and losses.
The Company uses a number of other variables in its second lien loss projections, including the spread between relevant interest rate indices. These variables have been relatively stable and in the relevant ranges have less impact on the projection results than the variables discussed above. However, in a number of HELOC transactions the servicers have been modifying poorly performing loans from floating to fixed rates, and, as a result, rising interest rates would negatively impact the excess spread available from these modified loans to support the transactions. The Company incorporated these modifications in its assumptions.
In estimating expected losses, the Company modeled and probability weighted five possible5 scenarios, each with a different CDR curvescurve applicable to the period preceding the return to the long-term steady state CDR. The Company used five scenarios at December 31, 2016 and December 31, 2015. The Company believes that the level of the elevated CDR and the length of time it will persist and the ultimate prepayment rate and the amount of additional defaults because of the expiry of the interest only period, are the primary drivers behind the likely amount of losses the collateral will likely suffer.
The Company continues to evaluate the assumptions affecting its modeling results.
The Company believes the most important driver of its projected second lien RMBS losses is the performance of its HELOC transactions. Total expected recovery on all second lien U.S. RMBS was $20 million as of December 31, 2019 and the expected loss to be paid was $50 million as of December 31, 2018. The $157 million economic benefit in 2019 for second lien U.S. RMBS was primarily attributable to higher projected recoveries for previously charged-off loans, improved performance, and loss mitigation efforts.
The following table shows the range as well as the average, weighted by outstanding net insured par outstanding, for key assumptions forused in the calculation of expected loss to be paid for individual transactions for direct vintage 2004 - 2008 HELOCs.
Key Assumptions in Base Case Expected Loss Estimates
HELOCs(1)HELOCs
|
| | | | | | | | | | | | | | | | | | | | |
| | As of
December 31, 2019 | | As of
December 31, 2018 | | As of
December 31, 2017 |
| | Range | | Weighted Average | | Range | | Weighted Average | | Range | | Weighted Average |
| Plateau CDR | 5.9 | % | – | 24.6% | | 9.5% | | 4.6 | % | – | 26.8% | | 10.1% | | 2.7 | % | – | 19.9% | | 11.4% |
| Final CDR trended down to | 2.5 | % | – | 3.2% | | 2.5% | | 2.5 | % | – | 3.2% | | 2.5% | | 2.5 | % | – | 3.2% | | 2.5% |
| Liquidation rates: | | | | | | | | | | | |
| Delinquent/Modified in the Previous 12 Months | 20% | | | | 20% | | | | 20% | | |
| 30 – 59 Days Delinquent | 30 | | | | 35 | | | | 45 | | |
| 60 – 89 Days Delinquent | 45 | | | | 50 | | | | 60 | | |
| 90+ Days Delinquent | 65 | | | | 70 | | | | 75 | | |
| Bankruptcy | 55 | | | | 55 | | | | 55 | | |
| Foreclosure | 55 | | | | 65 | | | | 70 | | |
| Real Estate Owned | 100 | | | | 100 | | | | 100 | | |
| Loss severity (1) | 98% | | | | 98% | | | | 98% | | |
|
| | | | | | | | | | | | | | | | | | | | |
| | As of
December 31, 2016 | | As of
December 31, 2015 | | As of
December 31, 2014 |
| | Range | | Weighted Average | | Range | | Weighted Average | | Range | | Weighted Average |
| Plateau CDR | 3.5 | % | – | 24.8% | | 13.6% | | 4.9 | % | – | 23.5% | | 10.3% | | 2.8 | % | – | 6.8% | | 4.1% |
| Final CDR trended down to | 0.5 | % | – | 3.2% | | 1.3% | | 0.5 | % | – | 3.2% | | 1.2% | | 0.5 | % | – | 3.2% | | 1.2% |
| Liquidation rates: | | | | | | | | | | | |
| Current Loans Modified in the Previous 12 Months | 25% | | | | 25% | | | | 25% | | |
| Current Loans Delinquent in the Previous 12 Months | 25 | | | | 25 | | | | 25 | | |
| 30 – 59 Days Delinquent | 50 | | | | 50 | | | | 55 | | |
| 60 – 89 Days Delinquent | 65 | | | | 65 | | | | 70 | | |
| 90+ Days Delinquent | 80 | | | | 75 | | | | 80 | | |
| Bankruptcy | 55 | | | | 55 | | | | 55 | | |
| Foreclosure | 75 | | | | 75 | | | | 75 | | |
| Real Estate Owned | 100 | | | | 100 | | | | 100 | | |
| Loss severity | 98% | | | | 98% | | | | 90 | % | – | 98% | | 90.4% |
____________________
| |
(1) | Represents variables for most heavily weighted scenario (the base case). |
(1) Loss severities on future defaults.
The Company’s base case assumed a six month CDR plateau and a 28 month ramp-down (for a total stress period of 34 months). The Company also modeled a scenario with a longer period of elevated defaults and another with a shorter period of elevated defaults. IncreasingIn the Company's most stressful scenario, increasing the CDR plateau to eight months and increasing the
ramp-down by three months to 31 months (for a total stress period of 39 months), and doubling the defaults relating to the end of the interest only period would increase the expected loss by approximately $39$6 million for HELOC transactions. On the other hand, in the Company's least stressful scenario, reducing the CDR plateau to four months and decreasing the length of the CDR ramp-down to 25 months (for a total stress period of 29 months), and lowering the ultimate prepayment rate to 10% would decrease the expected loss by approximately $23$7 million for HELOC transactions.
Breaches of Representations and WarrantiesOther Structured Finance
The Company entered into agreements with R&W providers under which those providers made payments to the Company, agreed to make payments to the Company in the future, and / or repurchased loans from the transactions, all in return for releases of related liability by the Company. As of December 31, 2016, the Company had two such agreements remaining. Under the Company's agreement with Bank of America Corporation and certain ofprojected that its subsidiaries (Bank of America), Bank of America agreed to reimburse the Company for 80% of claims on the first lien transactions covered by the agreement that the Company pays in the future, subject to a cap the Company currently projects it will not reach. Under the Company’s agreement with UBS Real Estate Securities Inc. and affiliates (UBS), UBS agreed to reimburse the Company for 85% of future losses on three first lien RMBS transactions. Bank of America and UBS have posted collateral to secure their obligations under these agreements. The Company also had an R&W reimbursement agreement with Deutsche Bank AG and certain oftotal net expected loss across its affiliates (collectively, Deutsche Bank), but Deutsche Bank's reimbursement obligations under that agreement were terminated in May 2016 in return for a cash payment to the Company. The Company uses the same RMBS projection scenarios and weightings to project its future R&W benefit or payable as it uses to project RMBS losses on its portfolio.
As of December 31, 2016, the Company had a net R&W payable of $6 million to R&W counterparties, compared to an R&W recoverable of $79 milliontroubled other structured finance exposures as of December 31, 2015. The decrease represents improvements2019 was $37 million and is primarily attributable to $84 million in underlying collateral performance and the termination of the Deutsche Bank agreement described above, partially offset by the addition of R&W recoverable related to a RMBS insured by CIFGNA and still being pursued by the Company. The Company’s agreements with providers of R&W generally provide for reimbursement to the Company as claim payments are made and, to the extent the Company later receives reimbursements of such claims from excess spread or other sources, for the Company to provide reimbursement to the R&W providers. When the Company projects receiving more reimbursements in the future than it projects to pay in claims on transactions covered by R&W settlement agreements, the Company will have a net R&W payable.
Triple-X Life Insurance Transactions
The Company had $2.1 billion of net par exposure to financial guaranty Triple-X life insurance transactions as of December 31, 2016. Two of these transactions, with $126 million of net par outstanding, are rated BIG. The Triple-X life insurance transactions are based on discrete blocks of individual life insurance business. In older vintage Triple-X life insurance transactions, which include the two BIG-rated transactions, the amounts raised by the sale of the notes insured by the Company were used to capitalize a special purpose vehicle that provides reinsurance to a life insurer or reinsurer. The amounts are invested at inception in accounts managed by third-party investment managers. In the case of the two BIG-rated transactions, material amounts of their assets were invested in U.S. RMBS. Based on its analysis of the information currently available, including estimates of future investment performance, and projected credit impairments on the invested assets and performance of the blocks of life insurance business at December 31, 2016, the Company’s projected net expected loss to be paid is $54 million. The economic benefit during 2016 was approximately $22 million, which was due primarily to a benefit resulting from a purchase of a portion of an insured obligation to mitigate loss.
Student Loan Transactions
The Company has insured or reinsured $1.4 billionBIG net par of student loan securitizations issued by private issuers and that it classifiesare classified as structured finance. Of this amount, $109 million is rated BIG. The Company is projecting approximately $32 million of net expected loss to be paid on these transactions. In general, the projected losses of these transactions are due to: (i) the poor credit performance of private student loan collateral and high loss severities, or (ii) high interest rates on auction rate securities with respect to which the auctions have failed.
The economic benefit during 2016Company also had exposure to troubled life insurance transactions. As of December 31, 2019, the Company's BIG net par in these transactions was approximately $14$40 million, which was driven primarily bylower than the commutation$85 million as of certain assumed student loan exposures earlier inDecember 31, 2018 because of the year.settlement of a transaction.
Other structured finance
The Company's other structured finance sector has BIG net par of $966 million, comprising primarily transactions backed by TruPS, perpetual preferred securities, commercial receivables and manufactured housing loans. The economic benefitloss development during 20162019 was $3$18 million, which was primarily attributable primarily to improved performance of various credits.higher LAE related to certain exposures.
Recovery Litigation
In the ordinary course of their respective businesses, certain of AGL's subsidiaries are involved in litigation with third parties to recover insurance losses paid in prior periods or prevent losses in the future. The impact, if any, of these and other proceedings on the amount of recoveries the Company receives and losses it pays in the future is uncertain, and the impact of any one or more of these proceedings during any quarter or year could be material to the Company's results of operations in that particular quarter or year.
Public Finance Transactions
On January 7, 2016, AGM, AGC and Ambac Assurance Corporation (Ambac) commenced an actionThe Company has asserted claims in a number of legal proceedings in connection with its exposure to Puerto Rico. See Note 5, Outstanding Insurance Exposure, for declaratory judgment and injunctive relief in the U.S. District Court for the District of Puerto Rico to invalidate the executive orders issued by the Governor on November 30, 2015 and December 8, 2015 directing that the Secretary of the Treasury of the Commonwealth of Puerto Rico and the Puerto Rico Tourism Company retain or transfer (in other words, claw back) certain taxes and revenues pledged to secure the payment of bonds issued by the PRHTA, the PRCCDA and the PRIFA. The Commonwealth defendants filed a motion to dismiss the action for lack of subject matter jurisdiction, which the Court denied on October 4, 2016. On October 14, 2016, the Commonwealth defendants filed a notice of PROMESA automatic stay.
On July 21, 2016, AGC and AGM filed a motion and form of complaint in the U.S. District Court for the District of Puerto Rico seeking relief from the stay provided by PROMESA. Upon a grant of relief from the PROMESA stay, the lawsuit further seeks a declaration that the Moratorium Act is preempted by Federal bankruptcy law and that certain gubernatorial executive orders diverting PRHTA pledged toll revenues (which are not subject to the Clawback) are preempted by PROMESA and violate the U.S. Constitution. Additionally, it seeks damages for the value of the PRHTA toll revenues diverted and injunctive relief prohibiting the defendants from taking any further action under these executive orders. On October 28, 2016, the Oversight Board filed a motion seeking leave to intervene in the action, which motion was denied on November 1, 2016, without prejudice, on procedural grounds. On November 2, 2016, the Court denied AGC’s and AGM’s motion for relief from the PROMESA stay on procedural grounds. The PROMESA stay expires on May 1, 2017.
For a discussion of the Company's exposure to Puerto Rico and related to therecovery litigation described above, please see Note 4, Outstanding Exposure.
On November 1, 2013, Radian Asset commenced a declaratory judgment action in the U.S. District Court for the Southern District of Mississippi against Madison County, Mississippi and the Parkway East Public Improvement District to establish its rights under a contribution agreement from the County supporting certain special assessment bonds issuedbeing pursued by the District and insured by Radian Asset (now AGC). As of December 31, 2016, $20 million of such bonds were outstanding. The County maintained that its payment obligation is limited to two years of annual debt service, while AGC contended the County’s obligations under the contribution agreement continue so long as the bonds remain outstanding. On April 27, 2016, the Court granted AGC's motion for summary judgment, agreeing with AGC's interpretation of the County's obligations. On May 11, 2016, the County filed a notice of appeal of that ruling to the United States Court of Appeals for the Fifth Circuit.Company.
Triple-X Life Insurance Transactions
In December 2008 AGUK filed an action in the Supreme Court of the State of New York against J.P. Morgan Investment Management Inc. (JPMIM), the investment manager for a triple-X life insurance transaction, Orkney Re II plc (Orkney), involving securities guaranteed by AGUK. As of December 31, 2016, the Company insures $423 million net par of Orkney securities. The action alleges that JPMIM engaged in breaches of fiduciary duty, gross negligence and breaches of contract based upon its handling of the Orkney investments. After AGUK’s claims were dismissed with prejudice in January 2010, AGUK was successful in its subsequent motions and appeals and, as of December 2011, all of AGUK’s claims for breaches of fiduciary duty, gross negligence and contract were reinstated in full. On January 22, 2016, AGUK filed a motion for partial summary judgment with respect to one of its claims for breach of contract relating to a failure to invest in compliance with the Delaware Insurance Code. On February 21, 2017, the court issued a decision on the motion. While the court denied the motion on the ground that the gross negligence of JPMIM in breaching the contract was a fact issue to be decided at trial, the court did find as a matter of law that JPMIM breached the contract relating to a failure to invest in compliance with the Delaware Insurance Code. A trial date has been set for mid-March 2017.
RMBS Transactions
On February 5, 2009, U.S. Bank National Association, as indenture trustee (U.S. Bank), CIFGNA, as insurer of the Class Ac Notes, and Syncora Guarantee Inc. (Syncora), as insurer of the Class Ax Notes, filed a complaint in the Supreme Court of the State of New York against GreenPoint Mortgage Funding, Inc. (GreenPoint) alleging GreenPoint breached its R&W with respect to the underlying mortgage loans in the GreenPoint Mortgage Funding Trust 2006-HE1 transaction. On March 3, 2010, the court dismissed CIFGNA's and Syncora’s causes of action on standing grounds. On December 16, 2013, GreenPoint moved to dismiss the remaining claims of U.S. Bank on the grounds that it too lacked standing. U.S. Bank cross-moved for partial summary judgment striking GreenPoint’s defense that U.S. Bank lacked standing to directly pursue claims against GreenPoint. On January 28, 2016, the court denied GreenPoint’s motion for summary judgment and granted U.S.
Bank’s cross-motion for partial summary judgment, finding that as a matter of law U.S. Bank has standing to directly assert claims against GreenPoint. On November 28, 2016, GreenPoint filed an appeal. CIFGNA originally had $500 million insured net par exposure to this transaction; $23 million insured net par remains outstanding at December 31, 2016.
On November 26, 2012, CIFGNACIFG Assurance North America, Inc. (CIFGNA) filed a complaint in the Supreme Court of the State of New York against JP Morgan Securities LLC (JP Morgan) for material misrepresentation in the inducement of insurance and common law fraud, alleging that JP Morgan Securities LLC fraudulently induced CIFGNA to insure $400 million of securities issued by ACA ABS CDO 2006-2 Ltd. and $325 million of securities issued by Libertas Preferred Funding II, Ltd. On June 26, 2015, the Courtcourt dismissed with prejudice CIFGNA’s material misrepresentation in the inducement of insurance claim and dismissed without prejudice CIFGNA’s common law fraud claim. On September 24, 2015, the Courtcourt denied CIFGNA’s motion to amend but allowed CIFGNA to re-plead a cause of action for common law fraud. On November 20, 2015, CIFGNA filed a motion for leave to amend its complaint to re-plead common law fraud. On April 29, 2016, CIFGNA filed an appeal to reverse the Court’scourt’s decision dismissing CIFGNA’s material misrepresentation in the inducement of insurance claim. On November 29, 2016, the Appellate Division of the Supreme Court of the State of New York ruled that the Court’scourt’s decision dismissing with prejudice CIFGNA’s material misrepresentation in the inducement of insurance claim should be modified to grant CIFGNA leave to repleadre-plead such claim.
On January 15, 2013, CIFGNAFebruary 27, 2017, AGC (as successor to CIFGNA) filed an amended complaint which included a complaint in the Supreme Court of the State of New York against Goldman, Sachs & Co. (Goldman)claim for material misrepresentation in the inducement of insuranceinsurance. On July 31, 2019, the parties entered into a confidential settlement and, common law fraud, alleging that Goldman fraudulently induced CIFGNA to insure $325 million of Class A-1 Notes (the Class A-1 Notes) and to purchase $10 million of Class A-2 Notes (the Class A-2 Notes) issued by Fortius II Funding, Ltd. CDO. CIFGNA and Goldmanon August 12, 2019, agreed to separately arbitratedismiss, with prejudice, the issue of liability with respect to CIFG’s purchase of the Class A-2 Notes,action and on February 4, 2015, an arbitration panel awarded CIFGNA $2.5 million in damages. On September 11, 2015, CIFGNA filed an amended complaint to allege that the arbitration award collaterally estopped Goldman from disputing its liability for fraudulent inducement in respect of the Class A-1 Notes. On October 20, 2016, AGC (as successor to CIFGNA) and Goldman reached a settlement of the action.all claims.
| |
6.7. | Contracts Accounted for as Insurance |
Financial Guaranty Insurance Premiums
The portfolio of outstanding exposures discussed in Note 4,5, Outstanding Insurance Exposure, and Note 6, Expected Loss to be Paid, includes financial guaranty contracts that meet the definition of insurance contracts as well as those that meet the definition of a derivative under GAAP, as well as those that are accounted for as insurance contracts, derivatives, and consolidated FG VIEs. Amounts presented in this note relate only to financial guaranty insurance contracts unless otherwise noted.accounted for as insurance. See Note 8,11, Contracts Accounted for as Credit Derivatives for amounts that relate to CDS and Note 9, Consolidated14, Variable Interest Entities for amounts that relate toare accounted for as consolidated FG VIEs.
Accounting Policies
Accounting for financial guaranty contracts that meet the scope exception under derivative accounting guidance are subject to industry specific guidance for financial guaranty insurance. The accounting for contracts that fall under the financial guaranty insurance definition are consistent whether the contract wascontracts are written on a direct basis, assumed from another financial guarantor under a reinsurance treaty, ceded to another insurer under a reinsurance treaty, or acquired in a business combination.
Premiums receivable compriserepresent the present value of contractual or expected future premium collections discounted using the risk-free rate.risk free rates. Unearned premium reserve represents deferred premium revenue, less claim payments made and recoveries received that have not yet been recognized in the statement of operations (contra-paid). The following discussion relates to the deferred premium revenue component of the unearned premium reserve, while the contra-paid is discussed below under "Financial Guaranty Insurance Losses."
The amount of deferred premium revenue at contract inception is determined as follows:
For premiums received upfront on financial guaranty insurance contracts that were originally underwritten by the Company, deferred premium revenue is equal to the amount of cash received. Upfront premiums typically relate to public finance transactions.
For premiums received in installments on financial guaranty insurance contracts that were originally underwritten by the Company, deferred premium revenue is the present value (discounted at risk free rates) of either (1) contractual premiums due or (2) in cases where the underlying collateral is comprisedcomposed of homogeneous pools of assets, the expected premiums to be
collected over the life of the contract. To be considered a homogeneous pool of assets, prepayments must be contractually prepayable,allowable, the amount of prepayments must be probable, and the timing and amount of prepayments must be reasonably estimable. When the Company adjusts prepayment assumptions or expected premium collections, an adjustment is recorded to the deferred premium revenue, with a corresponding adjustment to the premium receivable, and prospective changes are recognized in premium revenues. Premiums receivable are discounted at the risk-free rate at inception and such discount rate is updated only when changes to prepayment assumptions are made that change the expected date of final maturity. Installment premiums typically relate to structured finance and infrastructure transactions, where the insurance premium rate is determined at the inception of the contract but the insured par is subject to prepayment throughout the life of the transaction.
For financial guaranty insurance contracts acquired in a business combination, deferred premium revenue is equal to the fair value of the Company's stand-ready obligation portion of the insurance contract at the date of acquisition based on what a hypothetical similarly rated financial guaranty insurer would have charged for the contract at that date and not the actual cash flows under the insurance contract. The amount of deferred premium revenue may differ significantly from cash collections primarily due primarily to fair value adjustments recorded in connection with a business combination.
For premiums received in a reinsurance transaction, the cash received is allocated to individual policies in the assumed portfolio and recorded as unearned premium reserve.
When the Company adjusts prepayment assumptions or expected premium collections, an adjustment is recorded to the deferred premium revenue, with a corresponding adjustment to the premium receivable. Premiums receivable are discounted at the risk-free rate at inception and such discount rate is updated only when changes to prepayment assumptions are made that change the expected date of final maturity.
The Company recognizes deferred premium revenue as earned premium over the contractual period or expected period of the contract in proportion to the amount of insurance protection provided. As premium revenue is recognized, a corresponding decrease to the deferred premium revenue is recorded. The amount of insurance protection provided is a function of the insured principalpar amount outstanding. Accordingly, the proportionate share of premium revenue recognized in a given reporting period is a constant rate calculated based on the relationship between the insured principalpar amounts outstanding in the reporting period compared with the sum of each of the insured principal amounts outstanding for all periods. When an insured
financial obligation is retired before its maturity, the financial guaranty insurance contract is extinguished. Any nonrefundable deferred premium revenue related to that contract is accelerated and recognized as premium revenue. When a premium receivable balance is deemed uncollectible, it is written off to bad debt expense.
For assumed reinsurance assumed contracts, net earned premiums reported in the Company's consolidated statements of operations are calculated based upon data received from ceding companies,companies; however, some ceding companies report premium data between 30 and 90 days after the end of the reporting period. The Company estimates net earned premiums for the lag period. Differences between such estimates and actual amounts are recorded in the period in which the actual amounts are determined. When installment premiums are related to assumed reinsurance assumed contracts, the Company assesses the credit quality and liquidity of the ceding companies and the impact of any potential regulatory constraints to determine the collectability of such amounts.
Deferred premium revenue ceded to reinsurers (cededCeded unearned premium reserve)reserve is recorded as an asset. Direct, assumed and ceded earned premium revenuepremiums are presented together as net earned premiums in the statement of operations. NetSee Note 8, Reinsurance, for a breakout of direct, assumed and ceded premiums. The components of net earned premiums compriseare shown in the following:table below:
Net Earned Premiums
|
| | | | | | | | | | | |
| | Year Ended December 31, |
| | 2016 | | 2015 | | 2014 |
| | (in millions) |
| Scheduled net earned premiums | $ | 381 |
| | $ | 416 |
| | $ | 415 |
|
| Accelerations | | | | | |
| Refundings | 390 |
| | 294 |
| | 133 |
|
| Terminations | 79 |
| | 37 |
| | 3 |
|
| Total Accelerations | 469 |
| | 331 |
| | 136 |
|
| Accretion of discount on net premiums receivable | 14 |
| | 17 |
| | 16 |
|
| Financial guaranty insurance net earned premiums | 864 |
| | 764 |
| | 567 |
|
| Other | 0 |
| | 2 |
| | 3 |
|
| Net earned premiums (1) | $ | 864 |
| | $ | 766 |
| | $ | 570 |
|
|
| | | | | | | | | | | |
| | Year Ended December 31, |
| | 2019 | | 2018 | | 2017 |
| | (in millions) |
| Financial guaranty: | | | | | |
| Scheduled net earned premiums | $ | 331 |
| | $ | 367 |
| | $ | 385 |
|
| Accelerations from refundings and terminations | 122 |
| | 159 |
| | 286 |
|
| Accretion of discount on net premiums receivable | 17 |
| | 18 |
| | 17 |
|
| Financial guaranty insurance net earned premiums | 470 |
| | 544 |
| | 688 |
|
| Specialty net earned premiums | 6 |
| | 4 |
| | 2 |
|
| Net earned premiums (1) | $ | 476 |
| | $ | 548 |
| | $ | 690 |
|
___________________
| |
| (1) | Excludes $16$18 million, $21$12 million and $32$15 million for the yearyears ended December 31, 2016, 20152019, 2018 and 2014,2017, respectively, related to consolidated FG VIEs. |
Components of
Unearned Premium Reserve
|
| | | | | | | | | | | | | | | | | | | | | | | |
| | As of December 31, 2016 | | As of December 31, 2015 |
| | Gross | | Ceded | | Net(1) | | Gross | | Ceded | | Net(1) |
| | (in millions) |
| Deferred premium revenue | $ | 3,548 |
| | $ | 206 |
| | $ | 3,342 |
| | $ | 4,008 |
| | $ | 238 |
| | $ | 3,770 |
|
| Contra-paid(2) | (37 | ) | | 0 |
| | (37 | ) | | (12 | ) | | (6 | ) | | (6 | ) |
| Unearned premium reserve | $ | 3,511 |
| | $ | 206 |
| | $ | 3,305 |
| | $ | 3,996 |
| | $ | 232 |
| | $ | 3,764 |
|
____________________
| |
(1) | Excludes $90 million and $110 million of deferred premium revenue and $25 million and $30 million of contra-paid related to FG VIEs as of December 31, 2016 and December 31, 2015, respectively. |
| |
(2) | See "Financial Guaranty Insurance Losses – Insurance Contracts' Loss Information" below for an explanation of "contra-paid". |
Gross Premium Receivable,
Net of Commissions on Assumed Business
Roll Forward
|
| | | | | | | | | | | |
| | Year Ended December 31, |
| | 2016 | | 2015 | | 2014 |
| | (in millions) |
| Beginning of period, December 31 | $ | 693 |
| | $ | 729 |
| | $ | 876 |
|
| Premiums receivable from acquisitions (see Note 2) | 18 |
| | 2 |
| | — |
|
| Gross written premiums on new business, net of commissions on assumed business | 193 |
| | 198 |
| | 171 |
|
| Gross premiums received, net of commissions on assumed business | (258 | ) | | (206 | ) | | (230 | ) |
| Adjustments: | | | | | |
| Changes in the expected term | (38 | ) | | (19 | ) | | (66 | ) |
| Accretion of discount, net of commissions on assumed business | 9 |
| | 18 |
| | 10 |
|
| Foreign exchange translation | (41 | ) | | (25 | ) | | (31 | ) |
| Consolidation/deconsolidation of FG VIEs | 0 |
| | (4 | ) | | (1 | ) |
| End of period, December 31 (1) | $ | 576 |
| | $ | 693 |
| | $ | 729 |
|
|
| | | | | | | | | | | |
| | Year Ended December 31, |
| | 2019 | | 2018 | | 2017 |
| | (in millions) |
| Beginning of year | $ | 904 |
| | $ | 915 |
| | $ | 576 |
|
| Less: Specialty insurance premium receivable | 1 |
| | 1 |
| | — |
|
| Financial guaranty insurance premiums receivable | 903 |
| | 914 |
| | 576 |
|
| Premiums receivable from acquisitions (see Note 2) | — |
| | — |
| | 270 |
|
| Gross written premiums on new business, net of commissions (1) | 689 |
| | 610 |
| | 301 |
|
| Gross premiums received, net of commissions | (318 | ) | | (577 | ) | | (301 | ) |
| Adjustments: | | | | | |
| Changes in the expected term | (21 | ) | | (8 | ) | | (8 | ) |
| Accretion of discount, net of commissions on assumed business | 10 |
| | 9 |
| | 12 |
|
| Foreign exchange translation and remeasurement (2) | 21 |
| | (35 | ) | | 64 |
|
| Cancellation of assumed reinsurance | — |
| | (10 | ) | | — |
|
| Financial guaranty insurance premium receivable (3) | 1,284 |
| | 903 |
| | 914 |
|
| Specialty insurance premium receivable | 2 |
| | 1 |
| | 1 |
|
| December 31, | $ | 1,286 |
| | $ | 904 |
| | $ | 915 |
|
____________________
| |
| (1) | For transactions where one of the Company's financial guaranty contracts is replaced by another of the Company's insurance subsidiary's contracts, gross written premium in this table represents only the incremental amount in excess of the original gross written premiums. The year ended December 31, 2018 included $330 million of gross written premiums assumed from SGI on June 1, 2018, when the Company closed an SGI Transaction. See Note 2, Business Combinations and Assumption of Insured Portfolio. |
| |
| (2) | Includes foreign exchange gain (loss) on remeasurement recorded in the consolidated statements of operations of $21 million in 2019, $(33) million in 2018, $61 million in 2017. The remaining foreign exchange translation in 2018 and 2017 was recorded in OCI prior to the Combination, some of which had functional currencies other than the U.S. dollar |
| |
| (3) | Excludes $11$7 million, $17$9 million and $19$10 million as of December 31, 2016 , 20152019, 2018 and 2014,2017, respectively, related to consolidated FG VIEs. |
Foreign exchange translation relates to installment premiums receivable denominated in currencies other than the U.S. dollar. Approximately 50%78% and 52%72% of installment premiums at December 31, 20162019 and 2015,December 31, 2018, respectively, are denominated in currencies other than the U.S. dollar, primarily the europound sterling and pound sterling.euro.
The timing and cumulative amount of actual collections may differ from those of expected collections in the tablestable below due to factors such as foreign exchange rate fluctuations, counterparty collectability issues, accelerations, commutations, and changes in expected lives.lives and new business.
Expected Collections of
Financial Guaranty Insurance Gross Premiums Receivable,
Net of Commissions on Assumed Business
(Undiscounted)
|
| | | |
| | As of December 31, 2016 |
| | (in millions) |
| 2017 (January 1 – March 31) | $ | 27 |
|
| 2017 (April 1 – June 30) | 21 |
|
| 2017 (July 1 – September 30) | 14 |
|
| 2017 (October 1 – December 31) | 16 |
|
| 2018 | 58 |
|
| 2019 | 52 |
|
| 2020 | 50 |
|
| 2021 | 49 |
|
| 2022-2026 | 179 |
|
| 2027-2031 | 120 |
|
| 2032-2036 | 80 |
|
| After 2036 | 65 |
|
| Total(1) | $ | 731 |
|
|
| | | |
| | As of December 31, 2019 |
| | (in millions) |
| 2020 (January 1 - March 31) | $ | 35 |
|
| 2020 (April 1 - June 30) | 47 |
|
| 2020 (July 1 - September 30) | 30 |
|
| 2020 (October 1 - December 31) | 18 |
|
| 2021 | 92 |
|
| 2022 | 94 |
|
| 2023 | 82 |
|
| 2024 | 82 |
|
| 2025-2029 | 343 |
|
| 2030-2034 | 240 |
|
| 2035-2039 | 151 |
|
| After 2039 | 352 |
|
| Total (1) | $ | 1,566 |
|
____________________
| |
| (1) | Excludes expected cash collections on consolidated FG VIEs of $13$9 million. |
The timing and cumulative amount of actual net earned premiums may differ from those of expected net earned premiums in the table below due to factors such as accelerations, commutations, changes in expected lives and new business.
Scheduled Financial Guaranty Insurance Net Earned Premiums
|
| | | |
| | As of December 31, 2016 |
| | (in millions) |
| 2017 (January 1 – March 31) | $ | 89 |
|
| 2017 (April 1 – June 30) | 87 |
|
| 2017 (July 1 – September 30) | 82 |
|
| 2017 (October 1 – December 31) | 80 |
|
| Subtotal 2017 | 338 |
|
| 2018 | 304 |
|
| 2019 | 268 |
|
| 2020 | 243 |
|
| 2021 | 223 |
|
| 2022-2026 | 856 |
|
| 2027-2031 | 545 |
|
| 2032-2036 | 315 |
|
| After 2036 | 250 |
|
| Net deferred premium revenue(1) | 3,342 |
|
| Future accretion | 145 |
|
| Total future net earned premiums | $ | 3,487 |
|
|
| | | |
| | As of December 31, 2019 |
| | (in millions) |
| 2020 (January 1 - March 31) | $ | 80 |
|
| 2020 (April 1 - June 30) | 79 |
|
| 2020 (July 1 - September 30) | 77 |
|
| 2020 (October 1 - December 31) | 75 |
|
| Subtotal 2020 | 311 |
|
| 2021 | 284 |
|
| 2022 | 263 |
|
| 2023 | 245 |
|
| 2024 | 227 |
|
| 2025-2029 | 909 |
|
| 2030-2034 | 634 |
|
| 2035-2039 | 368 |
|
| After 2039 | 494 |
|
| Net deferred premium revenue (1) | 3,735 |
|
| Future accretion | 281 |
|
| Total future net earned premiums | $ | 4,016 |
|
____________________
| |
| (1) | Excludes scheduled net earned premiums on consolidated FG VIEs of $90$47 million. |
Selected Information for Financial Guaranty Insurance
Policies with Premiums Paid in Installments
|
| | | | | | | |
| | As of
December 31, 2019 | | As of
December 31, 2018 |
| | (dollars in millions) |
| Premiums receivable, net of commission payable | $ | 1,284 |
| | $ | 903 |
|
| Gross deferred premium revenue | 1,637 |
| | 1,313 |
|
| Weighted-average risk-free rate used to discount premiums | 1.7 | % | | 2.3 | % |
| Weighted-average period of premiums receivable (in years) | 13.3 |
| | 9.1 |
|
|
| | | | | | | |
| | As of
December 31, 2016 | | As of
December 31, 2015 |
| | (dollars in millions) |
| Premiums receivable, net of commission payable | $ | 576 |
| | $ | 693 |
|
| Gross deferred premium revenue | 1,041 |
| | 1,240 |
|
| Weighted-average risk-free rate used to discount premiums | 3.0 | % | | 3.1 | % |
| Weighted-average period of premiums receivable (in years) | 9.1 |
| | 9.4 |
|
Financial Guaranty Insurance Acquisition Costs
Accounting Policy
Policy acquisition costs that are directly related and essential to successful insurance contract acquisition, andas well as ceding commission income and expense on ceded and assumed reinsurance contracts, are deferred for contracts accounted for as insurance, and reported net. Amortization of deferred policy acquisition costs includes the accretion of discount on ceding commission income and expense.
Capitalized policy acquisition costs include expenses such as ceding commissions expense on assumed reinsurance contracts and the cost of underwriting personnel attributable to successful underwriting efforts. Management uses its judgment in determining the type and amount of costs to be deferred. The Company conducts an annual study to determine deferral rates.
Ceding commission expense on assumed reinsurance contracts and ceding commission income on ceded reinsurance contracts that are associated with premiums received in installments are calculated at their contractually defined commission rates, discounted consistent with premiums receivable for all future periods, and included in deferred acquisition costs (DAC),DAC, with a corresponding offset to net premiums receivable or reinsurance balances payable. Management uses its judgment in determining the type and amount of costs to be deferred. The Company conducts an annual study to determine which operating costs qualify for deferral. Costs
DAC is amortized in proportion to net earned premiums. Amortization of deferred policy acquisition costs includes the accretion of discount on ceding commission receivable and payable. When an insured obligation is retired early, the remaining related DAC is recognized at that time. Costs incurred for soliciting potential customers, market research, training, administration, unsuccessful acquisition efforts, and product development as well as all overhead type costs are charged to expense as incurred. DAC is amortized in proportion to net earned premiums. When an insured obligation is retired early, the remaining related DAC, net of ceding commission income is recognized at that time.
Expected losses and LAE, investment income, and the remaining costs of servicing the insured or reinsured business, are considered in determining the recoverability of DAC.
Rollforward of
Deferred Acquisition Costs
|
| | | | | | | | | | | |
| | Year Ended December 31, |
| | 2019 | | 2018 | | 2017 |
| | (in millions) |
| Beginning of year | $ | 105 |
| | $ | 101 |
| | $ | 106 |
|
| DAC adjustments from acquisitions (see Note 2) | — |
| | — |
| | (2 | ) |
| Costs deferred during the period | 23 |
| | 19 |
| | 16 |
|
| Costs amortized during the period | (17 | ) | | (15 | ) | | (19 | ) |
| December 31, | $ | 111 |
| | $ | 105 |
| | $ | 101 |
|
|
| | | | | | | | | | | |
| | Year Ended December 31, |
| | 2016 | | 2015 | | 2014 |
| | (in millions) |
| Beginning of period | $ | 114 |
| | $ | 121 |
| | $ | 124 |
|
| DAC adjustments from acquisitions (see Note 2) | 0 |
| | 1 |
| | — |
|
| Costs deferred during the period: | | | | | |
| Commissions on assumed and ceded business | (2 | ) | | (1 | ) | | 7 |
|
| Premium taxes | 4 |
| | 2 |
| | 3 |
|
| Compensation and other acquisition costs | 9 |
| | 11 |
| | 10 |
|
| Total | 11 |
| | 12 |
| | 20 |
|
| Costs amortized during the period | (19 | ) | | (20 | ) | | (23 | ) |
| End of period | $ | 106 |
| | $ | 114 |
| | $ | 121 |
|
Financial Guaranty Insurance Losses
Accounting Policies
Loss and LAE Reserve
Loss and LAE reserve reported on the balance sheet relates only to direct and assumed reinsurance contracts that are accounted for as insurance, substantially all of which are financial guaranty insurance contracts. The corresponding reserve ceded to reinsurers is reported as reinsurance recoverable on unpaid losses.losses and reported in other assets. As discussed in Note 7,9, Fair Value Measurement, contracts that meet the definition of a derivative, as well as consolidated FG VIEVIEs’ assets and liabilities, are recorded separately at fair value. Any expected losses related to consolidated FG VIEs are eliminated upon consolidation. Any expected losses on credit derivatives are not recorded as loss and LAE reserve onreflected in the consolidated balance sheet, rather, credit derivatives are recorded at fair value on the balance sheet.of credit derivatives.
Under financial guaranty insurance accounting, the sum of unearned premium reserve and loss and LAE reserve represents the Company's stand‑ready obligation. Unearned premium reserve is deferred premium revenue, less claim payments and recoveries received that have not yet been recognized in the statement of operations (contra-paid). At contract inception, the entire stand-ready obligation is represented by unearned premium reserve. A loss and LAE reserve for an insurance contract is recorded only to the extent, and for the amount, that expected loss to be paid net ofplus contra-paid (“total losses”) exceed the deferred premium revenue, on a contract by contract basis. As a result, the Company has expected loss to be paid that has not yet been expensed. Such amounts will be recognized in future periods as deferred premium revenue amortizes into income.
When a claim or LAE payment is made on a contract, it first reduces any recorded loss and LAE reserve. To the extent there is no loss and LAE reserve on a contract, then such claim payment is recorded as “contra-paid,” which reduces the unearned premium reserve. The contra-paid is recognized in the line item “loss and LAE” in the consolidated statement of operations when and for the amount that total losses exceed the remaining deferred premium revenue on the insurance contract. Loss and LAE in the consolidated statement of operations is presented net of cessions to reinsurers.
Salvage and Subrogation Recoverable
When the Company becomes entitled to the cash flow from the underlying collateral of an insured creditexposure under salvage and subrogation rights as a result of a claim payment or estimated future claim payment, it reduces the expected loss to be paid on the contract. Such reduction in expected loss to be paid can result in one of the following:
a reduction in the corresponding loss and LAE reserve with a benefit to the income statement,
no entry recorded, if “total loss” is not in excess of deferred premium revenue, or
the recording of a salvage asset with a benefit to the income statement if the transaction is in a net recovery position at the reporting date.
The Company recognizes the expected recovery of claim payments (including recoveries from settlement with R&W providers) made by an acquired subsidiary prior to the date of acquisition, consistent with its policy for recognizing recoveries on all financial guaranty insurance contracts. To the extent that the estimated amount of recoveries increases or decreases due to changes in facts and circumstances the Company would recognize a benefit or expense consistent with how changes in the expected recovery of all other claim payments are recorded. The ceded component of salvage and subrogation recoverable is recorded in the line item reinsurance balances payable.other liabilities.
Expected Loss to be Expensed
Expected loss to be expensed represents past or expected future net claim payments that have not yet been expensed. Such amounts will be expensed in future periods as deferred premium revenue amortizes into income on financial guaranty insurance policies. Expected loss to be expensed is the Company's projection of incurred losses that will be recognized in future periods, excluding accretion of discount.
Insurance Contracts' Loss Information
The following table provides information on net reserve (salvage), which includes loss and LAE reserves and salvage and subrogation recoverable, both net of reinsurance. TheTo discount loss reserves, the Company used risk-free rates for U.S. dollar denominated financial guaranty insurance obligations that ranged from 0.0% to 3.23%2.45% with a weighted average of 1.94% as of December 31, 2019 and 0.0% to 3.06% with a weighted average of 2.74% as of December 31, 2016 and 0.0% to 3.25% with a weighted average of 2.37% as of December 31, 2015.2018.
Loss and LAE Reserve and Salvage and Subrogation Recoverable
Net of ReinsuranceReserve (Salvage)
Insurance Contracts
|
| | | | | | | |
| | As of
December 31, 2019 | | As of
December 31, 2018 |
| | (in millions) |
| Public finance: | | | |
| U.S. public finance | $ | 328 |
| | $ | 612 |
|
| Non-U.S. public finance | 5 |
| | 14 |
|
| Public finance | 333 |
| | 626 |
|
| Structured finance: | | | |
| U.S. RMBS (1) | (78 | ) | | 21 |
|
| Other structured finance | 40 |
| | 30 |
|
| Structured finance | (38 | ) | | 51 |
|
| Subtotal | 295 |
| | 677 |
|
| Other payable (recoverable) | — |
| | (3 | ) |
| Total | $ | 295 |
| | $ | 674 |
|
|
| | | | | | | | | | | | | | | | | | | | | | | |
| | As of December 31, 2016 | | As of December 31, 2015 |
| | Loss and LAE Reserve, net | | Salvage and Subrogation Recoverable, net | | Net Reserve (Recoverable) | | Loss and LAE Reserve, net | | Salvage and Subrogation Recoverable, net | | Net Reserve (Recoverable) |
| | (in millions) |
| Public finance: | | | | | | | | | | | |
| U.S. public finance | $ | 711 |
| | $ | 86 |
| | $ | 625 |
| | $ | 604 |
| | $ | 7 |
| | $ | 597 |
|
| Non-U.S. public finance | 21 |
| | — |
| | 21 |
| | 25 |
| | — |
| | 25 |
|
| Public finance | 732 |
| | 86 |
| | 646 |
| | 629 |
| | 7 |
| | 622 |
|
| Structured finance: | | | | | | | | | | | |
| U.S. RMBS | 283 |
| | 262 |
| | 21 |
| | 262 |
| | 116 |
| | 146 |
|
| Triple-X life insurance transactions | 36 |
| | — |
| | 36 |
| | 82 |
| | — |
| | 82 |
|
| Other structured finance | 60 |
| | — |
| | 60 |
| | 99 |
| | — |
| | 99 |
|
| Structured finance | 379 |
| | 262 |
| | 117 |
| | 443 |
| | 116 |
| | 327 |
|
| Subtotal | 1,111 |
| | 348 |
| | 763 |
| | 1,072 |
| | 123 |
| | 949 |
|
| Other recoverable (payable) | — |
| | (1 | ) | | 1 |
| | — |
| | 3 |
| | (3 | ) |
| Subtotal | 1,111 |
| | 347 |
| | 764 |
| | 1,072 |
| | 126 |
| | 946 |
|
| Elimination of losses attributable to FG VIEs | (64 | ) | | — |
| | (64 | ) | | (74 | ) | | 0 |
| | (74 | ) |
| Total (1) | $ | 1,047 |
| | $ | 347 |
| | $ | 700 |
| | $ | 998 |
| | $ | 126 |
| | $ | 872 |
|
| |
| (1) | Excludes net reserves of $33 million and $47 million as of December 31, 2019 and December 31, 2018, respectively, related to consolidated FG VIEs. |
______________
(1)See “Components of Net Reserves (Salvage)” table for loss and LAE reserve and salvage and subrogation recoverable components.
Components of Net Reserves (Salvage)
| | | | As of
December 31, 2016 | | As of
December 31, 2015 | As of
December 31, 2019 | | As of
December 31, 2018 |
| | (in millions) | (in millions) |
| Loss and LAE reserve | $ | 1,127 |
| | $ | 1,067 |
| $ | 1,050 |
| | $ | 1,177 |
|
Reinsurance recoverable on unpaid losses | (80 | ) | | (69 | ) | (38 | ) | | (34 | ) |
| Loss and LAE reserve, net | 1,047 |
| | 998 |
| 1,012 |
| | 1,143 |
|
| Salvage and subrogation recoverable | (365 | ) | | (126 | ) | (747 | ) | | (490 | ) |
| Salvage and subrogation payable(1) | 17 |
| | 3 |
| |
| Salvage and subrogation reinsurance payable (2) | | 30 |
| | 24 |
|
Other payable (recoverable) | 1 |
| | (3 | ) | — |
| | (3 | ) |
| Salvage and subrogation recoverable, net, and other recoverable | (347 | ) | | (126 | ) | |
| Salvage and subrogation recoverable, net and other recoverable | | (717 | ) | | (469 | ) |
| Net reserves (salvage) | $ | 700 |
| | $ | 872 |
| $ | 295 |
| | $ | 674 |
|
(1) Recorded as a component of reinsurance balances payable.other assets in the consolidated balance sheets.
(2) Recorded as a component of other liabilities in the consolidated balance sheets.
The table below provides a reconciliation of net expected loss to be paid to net expected loss to be expensed. Expected loss to be paid differs from expected loss to be expensed due to: (i) the contra-paid which representrepresents the claim payments made and recoveries received that have not yet been recognized in the statement of operations, (ii) salvage and subrogation recoverable for transactions that are in a net recovery position where the Company has not yet received recoveries on claims previously paid (having the effect of reducing net expected loss to be paid by the amount of the previously paid claim and the expected recovery), but will have no future income effect (because the previously paid claims and the corresponding recovery of those claims will offset(and therefore recognized in income in future periods)but not yet received), and (iii) loss reserves that have already been established (and therefore expensed but not yet paid).
Reconciliation of Net Expected Loss to be Paid and
Net Expected Loss to be Expensed
Financial Guaranty Insurance Contracts
| | | | As of December 31, 2016 | As of
December 31, 2019 |
| | (in millions) | (in millions) |
Net expected loss to be paid - financial guaranty insurance (1) | $ | 1,083 |
| $ | 683 |
|
| Contra-paid, net | 37 |
| 51 |
|
| Salvage and subrogation recoverable, net of reinsurance | 348 |
| |
| Salvage and subrogation recoverable, net, and other recoverable | | 717 |
|
| Loss and LAE reserve - financial guaranty insurance contracts, net of reinsurance | (1,046 | ) | (1,012 | ) |
| Other recoverable (payable) | (1 | ) | |
| Net expected loss to be expensed (present value) (2) | $ | 421 |
| |
| Net expected loss to be expensed (present value) (1) | | $ | 439 |
|
____________________
| |
| (1) | See "Net Expected Loss to be Paid (Recovered) by Accounting Model" table in Note 5, Expected Loss to be Paid. |
| |
(2) | Excludes $64$33 million as of December 31, 20162019 related to consolidated FG VIEs. |
The following table provides a schedule of the expected timing of net expected losses to be expensed. The amount and timing of actual loss and LAE may differ from the estimates shown below due to factors such as accelerations, commutations, changes in expected lives and updates to loss estimates. This table excludes amounts related to FG VIEs, which are eliminated in consolidation.
Net Expected Loss to be Expensed
Financial Guaranty Insurance Contracts
|
| | | |
| | As of December 31, 2016 |
| | (in millions) |
| 2017 (January 1 – March 31) | $ | 8 |
|
| 2017 (April 1 – June 30) | 10 |
|
| 2017 (July 1 – September 30) | 8 |
|
| 2017 (October 1 – December 31) | 9 |
|
| Subtotal 2017 | 35 |
|
| 2018 | 34 |
|
| 2019 | 32 |
|
| 2020 | 32 |
|
| 2021 | 28 |
|
| 2022-2026 | 117 |
|
| 2027-2031 | 82 |
|
| 2032-2036 | 44 |
|
| After 2036 | 17 |
|
| Net expected loss to be expensed | 421 |
|
| Future accretion | 373 |
|
| Total expected future loss and LAE | $ | 794 |
|
|
| | | |
| | As of
December 31, 2019 |
| | (in millions) |
| 2020 (January 1 - March 31) | $ | 9 |
|
| 2020 (April 1 - June 30) | 9 |
|
| 2020 (July 1 - September 30) | 9 |
|
| 2020 (October 1 - December 31) | 9 |
|
| Subtotal 2020 | 36 |
|
| 2021 | 35 |
|
| 2022 | 34 |
|
| 2023 | 32 |
|
| 2024 | 33 |
|
| 2025-2029 | 138 |
|
| 2030-2034 | 91 |
|
| 2035-2039 | 32 |
|
| After 2039 | 8 |
|
| Net expected loss to be expensed | 439 |
|
| Future accretion | 105 |
|
| Total expected future loss and LAE | $ | 544 |
|
The following table presents the loss and LAE recorded in the consolidated statements of operations by sector for insurance contracts. Amounts presented are net of reinsurance.
Loss and LAE
Reported on the
Consolidated Statements of Operations
|
| | | | | | | | | | | |
| | Loss (Benefit) |
| | Year Ended December 31, |
| | 2019 | | 2018 | | 2017 |
| | (in millions) |
| Public finance: | | | | | |
| U.S. public finance | $ | 247 |
| | $ | 90 |
| | $ | 553 |
|
| Non-U.S. public finance | (7 | ) | | (7 | ) | | (4 | ) |
| Public finance | 240 |
| | 83 |
| | 549 |
|
| Structured finance: | | | | | |
| U.S. RMBS (1) | (154 | ) | | (15 | ) | | (113 | ) |
| Other structured finance | 7 |
| | (4 | ) | | (48 | ) |
| Structured finance | (147 | ) | | (19 | ) | | (161 | ) |
| Loss and LAE | $ | 93 |
| | $ | 64 |
| | $ | 388 |
|
|
| | | | | | | | | | | |
| | Year Ended December 31, |
| | 2016 | | 2015 | | 2014 |
| | (in millions) |
| Public finance: | | | | | |
| U.S. public finance | $ | 307 |
| | $ | 392 |
| | $ | 192 |
|
| Non-U.S. public finance | (3 | ) | | 1 |
| | (1 | ) |
| Public finance | 304 |
| | 393 |
| | 191 |
|
| Structured finance: | | | | | |
| U.S. RMBS | 37 |
| | 54 |
| | (129 | ) |
| Triple-X life insurance transactions | (22 | ) | | 16 |
| | 85 |
|
| Other structured finance | (17 | ) | | (11 | ) | | 9 |
|
| Structured finance | (2 | ) | | 59 |
| | (35 | ) |
| Loss and LAE on insurance contracts before FG VIE consolidation | 302 |
| | 452 |
| | 156 |
|
| Gain (loss) related to FG VIE consolidation | (7 | ) | | (28 | ) | | (30 | ) |
| Loss and LAE | $ | 295 |
| | $ | 424 |
| | $ | 126 |
|
| |
| (1) | Excludes a benefit of $20 million, a benefit of $3 million and a loss of $7 million for the years ended December 31, 2019, 2018 and 2017, respectively, related to consolidated FG VIEs. |
The following table providestables provide information on financial guaranty insurance contracts categorized as BIG.
Financial Guaranty Insurance
BIG Transaction Loss Summary
As of December 31, 2019
|
| | | | | | | | | | | | | | | | | | | | | | | | | | | | | | | | | | | |
| | BIG Categories |
| | BIG 1 | | BIG 2 | | BIG 3 | | Total BIG, Net | | Effect of Consolidating FG VIEs | | Total |
| | Gross | | Ceded | | Gross | | Ceded | | Gross | | Ceded | | | |
| | (dollars in millions) |
| Number of risks (1) | 121 |
| | (6 | ) | | 24 |
| | — |
| | 131 |
| | (7 | ) | | 276 |
| | — |
| | 276 |
|
| Remaining weighted-average contract period (in years) | 8.0 |
| | 5.2 |
| | 17.0 |
| | — |
| | 9.7 |
| | 8.3 |
| | 9.7 |
| | — |
| | 9.7 |
|
| Outstanding exposure: | |
| | |
| | |
| | |
| | |
| | |
| | |
| | |
| | |
|
| Par | $ | 2,654 |
| | $ | (54 | ) | | $ | 561 |
| | $ | — |
| | $ | 5,386 |
| | $ | (170 | ) | | $ | 8,377 |
| | $ | — |
| | $ | 8,377 |
|
| Interest | 1,149 |
| | (15 | ) | | 481 |
| | — |
| | 2,507 |
| | (73 | ) | | 4,049 |
| | — |
| | 4,049 |
|
| Total (2) | $ | 3,803 |
| | $ | (69 | ) | | $ | 1,042 |
| | $ | — |
| | $ | 7,893 |
| | $ | (243 | ) | | $ | 12,426 |
| | $ | — |
| | $ | 12,426 |
|
| Expected cash outflows (inflows) | $ | 135 |
| | $ | (3 | ) | | $ | 84 |
| | $ | — |
| | $ | 4,185 |
| | $ | (132 | ) | | $ | 4,269 |
| | $ | (264 | ) | | $ | 4,005 |
|
| Potential recoveries (3) | (598 | ) | | 21 |
| | (10 | ) | | — |
| | (2,926 | ) | | 107 |
| | $ | (3,406 | ) | | 189 |
| | (3,217 | ) |
| Subtotal | (463 | ) | | 18 |
| | 74 |
| | — |
| | 1,259 |
| | (25 | ) | | 863 |
| | (75 | ) | | 788 |
|
| Discount | 54 |
| | (1 | ) | | (21 | ) | | — |
| | (151 | ) | | (3 | ) | | (122 | ) | | 17 |
| | (105 | ) |
| Present value of expected cash flows | $ | (409 | ) | | $ | 17 |
| | $ | 53 |
| | $ | — |
| | $ | 1,108 |
| | $ | (28 | ) | | $ | 741 |
| | $ | (58 | ) | | $ | 683 |
|
| Deferred premium revenue | $ | 142 |
| | $ | (1 | ) | | $ | 34 |
| | $ | — |
| | $ | 480 |
| | $ | (4 | ) | | $ | 651 |
| | $ | (48 | ) | | $ | 603 |
|
| Reserves (salvage) | $ | (441 | ) | | $ | 17 |
| | $ | 35 |
| | $ | — |
| | $ | 742 |
| | $ | (25 | ) | | $ | 328 |
| | $ | (33 | ) | | $ | 295 |
|
Financial Guaranty Insurance
BIG Transaction Loss Summary
As of December 31, 20162018
|
| | | | | | | | | | | | | | | | | | | | | | | | | | | | | | | | | | | |
| | BIG Categories |
| | BIG 1 | | BIG 2 | | BIG 3 | | Total BIG, Net | | Effect of Consolidating FG VIEs | | Total |
| | Gross | | Ceded | | Gross | | Ceded | | Gross | | Ceded | | | |
| | (dollars in millions) |
| Number of risks(1) | 165 |
| | (35 | ) | | 79 |
| | (11 | ) | | 148 |
| | (49 | ) | | 392 |
| | — |
| | 392 |
|
| Remaining weighted-average contract period (in years) | 8.6 |
| | 7.0 |
| | 13.2 |
| | 10.5 |
| | 8.1 |
| | 6.0 |
| | 10.1 |
| | — |
| | 10.1 |
|
| Outstanding exposure: | |
| | |
| | |
| | |
| | |
| | |
| | |
| | |
| | |
|
| Principal | $ | 4,187 |
| | $ | (326 | ) | | $ | 4,273 |
| | $ | (416 | ) | | $ | 4,703 |
| | $ | (320 | ) | | $ | 12,101 |
| | $ | — |
| | $ | 12,101 |
|
| Interest | 1,932 |
| | (140 | ) | | 2,926 |
| | (219 | ) | | 1,867 |
| | (87 | ) | | 6,279 |
| | — |
| | 6,279 |
|
| Total(2) | $ | 6,119 |
| | $ | (466 | ) | | $ | 7,199 |
| | $ | (635 | ) | | $ | 6,570 |
| | $ | (407 | ) | | $ | 18,380 |
| | $ | — |
| | $ | 18,380 |
|
| Expected cash outflows (inflows) | $ | 172 |
| | $ | (19 | ) | | $ | 1,404 |
| | $ | (86 | ) | | $ | 1,435 |
| | $ | (65 | ) | | $ | 2,841 |
| | $ | (326 | ) | | $ | 2,515 |
|
| Potential recoveries | | | | | | | | | | | | | | | | | |
| Undiscounted R&W | 120 |
| | (3 | ) | | (2 | ) | | — |
| | (62 | ) | | 1 |
| | 54 |
| | — |
| | 54 |
|
| Other(3) | (560 | ) | | 26 |
| | (144 | ) | | 4 |
| | (681 | ) | | 44 |
| | (1,311 | ) | | 198 |
| | (1,113 | ) |
| Total potential recoveries | (440 | ) | | 23 |
| | (146 | ) | | 4 |
| | (743 | ) | | 45 |
| | (1,257 | ) | | 198 |
| | (1,059 | ) |
| Subtotal | (268 | ) | | 4 |
| | 1,258 |
| | (82 | ) | | 692 |
| | (20 | ) | | 1,584 |
| | (128 | ) | | 1,456 |
|
| Discount | 61 |
| | (4 | ) | | (355 | ) | | 19 |
| | (114 | ) | | (4 | ) | | (397 | ) | | 24 |
| | (373 | ) |
| Present value of expected cash flows | $ | (207 | ) | | $ | 0 |
| | $ | 903 |
| | $ | (63 | ) | | $ | 578 |
| | $ | (24 | ) | | $ | 1,187 |
| | $ | (104 | ) | | $ | 1,083 |
|
| Deferred premium revenue | $ | 131 |
| | $ | (5 | ) | | $ | 246 |
| | $ | (6 | ) | | $ | 476 |
| | $ | (30 | ) | | $ | 812 |
| | $ | (86 | ) | | $ | 726 |
|
| Reserves (salvage) | $ | (255 | ) | | $ | 5 |
| | $ | 738 |
| | $ | (58 | ) | | $ | 343 |
| | $ | (10 | ) | | $ | 763 |
| | $ | (64 | ) | | $ | 699 |
|
Financial Guaranty Insurance
BIG Transaction Loss Summary
As of December 31, 2015
| | | | BIG Categories | BIG Categories |
| | BIG 1 | | BIG 2 | | BIG 3 | | Total BIG, Net | | Effect of Consolidating FG VIEs | | Total | BIG 1 | | BIG 2 | | BIG 3 | | Total BIG, Net | | Effect of Consolidating FG VIEs | | Total |
| | Gross | | Ceded | | Gross | | Ceded | | Gross | | Ceded | | Gross | | Ceded | | Gross | | Ceded | | Gross | | Ceded | |
| | (dollars in millions) | (dollars in millions) |
| Number of risks(1) | 202 |
| | (46 | ) | | 85 |
| | (13 | ) | | 132 |
| | (44 | ) | | 419 |
| | — |
| | 419 |
| |
| Number of risks (1) | | 128 |
| | (8 | ) | | 39 |
| | (1 | ) | | 145 |
| | (7 | ) | | 312 |
| | — |
| | 312 |
|
| Remaining weighted-average contract period (in years) | 10.0 |
| | 8.7 |
| | 13.8 |
| | 9.5 |
| | 7.7 |
| | 5.9 |
| | 10.7 |
| | — |
| | 10.7 |
| 7.9 |
| | 6.5 |
| | 13.2 |
| | 2.1 |
| | 10.1 |
| | 9.1 |
| | 9.8 |
| | — |
| | 9.8 |
|
| Outstanding exposure: | |
| | |
| | |
| | |
| | |
| | |
| | |
| | |
| | |
| |
| | |
| | |
| | |
| | |
| | |
| | |
| | |
| | |
|
| Principal | $ | 7,751 |
| | $ | (732 | ) | | $ | 3,895 |
| | $ | (240 | ) | | $ | 3,087 |
| | $ | (187 | ) | | $ | 13,574 |
| | $ | — |
| | $ | 13,574 |
| |
| Par | | $ | 3,052 |
| | $ | (71 | ) | | $ | 938 |
| | $ | (6 | ) | | $ | 6,249 |
| | $ | (159 | ) | | $ | 10,003 |
| | $ | — |
| | $ | 10,003 |
|
| Interest | 4,109 |
| | (354 | ) | | 2,805 |
| | (110 | ) | | 1,011 |
| | (42 | ) | | 7,419 |
| | — |
| | 7,419 |
| 1,319 |
| | (29 | ) | | 592 |
| | (1 | ) | | 3,140 |
| | (72 | ) | | 4,949 |
| | — |
| | 4,949 |
|
| Total(2) | $ | 11,860 |
| | $ | (1,086 | ) | | $ | 6,700 |
| | $ | (350 | ) | | $ | 4,098 |
| | $ | (229 | ) | | $ | 20,993 |
| | $ | — |
| | $ | 20,993 |
| |
| Total (2) | | $ | 4,371 |
| | $ | (100 | ) | | $ | 1,530 |
| | $ | (7 | ) | | $ | 9,389 |
| | $ | (231 | ) | | $ | 14,952 |
| | $ | — |
| | $ | 14,952 |
|
| Expected cash outflows (inflows) | 386 |
| | (42 | ) | | 1,158 |
| | (60 | ) | | 1,464 |
| | (53 | ) | | 2,853 |
| | (343 | ) | | 2,510 |
| $ | 98 |
| | $ | (5 | ) | | $ | 264 |
| | $ | (1 | ) | | $ | 4,029 |
| | $ | (80 | ) | | $ | 4,305 |
| | $ | (290 | ) | | $ | 4,015 |
|
Potential recoveries | | | | | | | | | | | | | | | | | | (465 | ) | | 23 |
| | (81 | ) | | — |
| | (2,542 | ) | | 55 |
| | (3,010 | ) | | 192 |
| | (2,818 | ) |
| Undiscounted R&W | 69 |
| | (2 | ) | | (49 | ) | | 1 |
| | (85 | ) | | 5 |
| | (61 | ) | | 7 |
| | (54 | ) | |
| Other(3) | (372 | ) | | 12 |
| | (167 | ) | | 8 |
| | (672 | ) | | 24 |
| | (1,167 | ) | | 182 |
| | (985 | ) | |
| Total potential recoveries | (303 | ) | | 10 |
| | (216 | ) | | 9 |
| | (757 | ) | | 29 |
| | (1,228 | ) | | 189 |
| | (1,039 | ) | |
| Subtotal | 83 |
| | (32 | ) | | 942 |
| | (51 | ) | | 707 |
| | (24 | ) | | 1,625 |
| | (154 | ) | | 1,471 |
| (367 | ) | | 18 |
| | 183 |
| | (1 | ) | | 1,487 |
| | (25 | ) | | 1,295 |
| | (98 | ) | | 1,197 |
|
| Discount | 22 |
| | 5 |
| | (237 | ) | | 11 |
| | 27 |
| | (94 | ) | | (266 | ) | | 34 |
| | (232 | ) | 83 |
| | (5 | ) | | (53 | ) | | — |
| | (134 | ) | | (2 | ) | | (111 | ) | | 23 |
| | (88 | ) |
| Present value of expected cash flows | $ | 105 |
| | $ | (27 | ) | | $ | 705 |
| | $ | (40 | ) | | $ | 734 |
| | $ | (118 | ) | | $ | 1,359 |
| | $ | (120 | ) | | $ | 1,239 |
| $ | (284 | ) | | $ | 13 |
|
| $ | 130 |
| | $ | (1 | ) | | $ | 1,353 |
| | $ | (27 | ) | | $ | 1,184 |
| | $ | (75 | ) | | $ | 1,109 |
|
| Deferred premium revenue | $ | 371 |
| | $ | (37 | ) | | $ | 150 |
| | $ | (4 | ) | | $ | 386 |
| | $ | (32 | ) | | $ | 834 |
| | $ | (100 | ) | | $ | 734 |
| $ | 125 |
| | $ | (4 | ) | | $ | 151 |
| | $ | — |
| | $ | 518 |
| | $ | (2 | ) | | $ | 788 |
| | $ | (64 | ) | | $ | 724 |
|
| Reserves (salvage) | $ | 2 |
| | $ | (19 | ) | | $ | 591 |
| | $ | (38 | ) | | $ | 404 |
| | $ | (9 | ) | | $ | 931 |
| | $ | (74 | ) | | $ | 857 |
| $ | (311 | ) | | $ | 15 |
| | $ | 48 |
| | $ | (1 | ) | | $ | 993 |
| | $ | (24 | ) | | $ | 720 |
| | $ | (47 | ) | | $ | 673 |
|
____________________
| |
| (1) | A risk represents the aggregate of the financial guaranty policies that share the same revenue source for purposes of making debt service payments. The ceded number of risks represents the number of risks for which the Company ceded a portion of its exposure. |
| |
| (2) | Includes BIG amounts related to FG VIEs. |
| |
| (3) | IncludesRepresents expected inflows for future payments by obligors pursuant to restructuring agreements, settlements or litigation judgments, excess spread.spread on any underlying collateral and other estimated recoveries. Potential recoveries also include recoveries on certain investment grade credits, related mainly to exposures that were previously BIG and for which claims have been paid in the past. |
Ratings Impact on Financial Guaranty Business
A downgrade of one of AGL’s insurance subsidiaries may result in increased claims under financial guaranties issued by the Company if counterparties exercise contractual rights triggered by the downgrade against insured obligors, and the insured obligors wereare unable to pay.
For example, AGM has issued financial guaranty insurance policies in respect of the obligations of municipal obligors under interest rate swaps. AGM insures periodic payments owed by the municipal obligors to the bank counterparties. In certain cases, AGM also insures termination payments that may be owed by the municipal obligors to the bank counterparties. If (i) AGM has been downgraded below the rating trigger set forth in a swap under which it has insured the termination payment, which rating trigger varies on a transaction by transaction basis; (ii) the municipal obligor has the right to cure by, but has failed in, posting collateral, replacing AGM or otherwise curing the downgrade of AGM; (iii) the transaction documents include as a condition that an event of default or termination event with respect to the municipal obligor has occurred, such as the rating of the municipal obligor being downgraded past a specified level, and such condition has been met; (iv) the bank counterparty has elected to terminate the swap; (v) a termination payment is payable by the municipal obligor; and (vi) the municipal obligor has failed to make the termination payment payable by it, then AGM would be required to pay the termination payment due by the municipal obligor, in an amount not to exceed the policy limit set forth in the financial guaranty insurance policy. At AGM's current financial strength ratings, if the conditions giving rise to the obligation of AGM to make a termination payment under the swap termination policies were all satisfied, then AGM could pay claims in an amount
not exceeding approximately $125 million in respect of such termination payments. Taking into consideration whether the rating of the municipal obligor is below any applicable specified trigger, if the financial strength ratings of AGM were further downgraded below "A" by S&P Global Ratings, a division of
Standard & Poor’s Financial Services LLC (S&P) or below "A2" by Moody's, and the conditions giving rise to the obligation of AGM to make a payment under the swap policies were all satisfied, then AGM could pay claims in an additional amount not exceeding approximately $291$377 million in respect of such termination payments.
As another example, with respect to variable rate demand obligations (VRDOs) for which a bank has agreed to provide a liquidity facility, a downgrade of AGM or AGC may provide the bank with the right to give notice to bondholders that the bank will terminate the liquidity facility, causing the bondholders to tender their bonds to the bank. Bonds held by the bank accrue interest at a “bank bond rate” that is higher than the rate otherwise borne by the bond (typically the prime rate plus 2.00% — 3.00%, and capped at the lesser of 25% and the maximum legal limit). In the event the bank holds such bonds for longer than a specified period of time, usually 90-180 days, the bank has the right to demand accelerated repayment of bond principal, usually through payment of equal installments over a period of not less than five years. In the event that a municipal obligor is unable to pay interest accruing at the bank bond rate or to pay principal during the shortened amortization period, a claim could be submitted to AGM or AGC under its financial guaranty policy. As of December 31, 20162019, AGM and AGC had insured approximately $4.9$3.1 billion net par of VRDOs, of which approximately $0.3 billion$43 million of net par constituted VRDOs issued by municipal obligors rated BBB- or lower pursuant to the Company’s internal rating. The specific terms relating to the rating levels that trigger the bank’s termination right, and whether it is triggered by a downgrade by one rating agency or a downgrade by all rating agencies then rating the insurer, vary depending on the transaction.
In addition, AGM may be required to pay claims in respect of AGMH’s former financial products business if Dexia SA and its affiliates, from which the Company had purchased AGMH and its subsidiaries, do not comply with their obligations following a downgrade of the financial strength rating of AGM. A downgrade of the financial strength rating of AGM could trigger a payment obligation of AGM in respect to AGMH's former GICguaranteed investment contracts (GIC) business. Most GICs insured by AGM allow for the termination of the GIC contract and a withdrawal of GIC funds at the option of the GIC holder in the event of a downgrade of AGM below a specified threshold, generally below A- by S&P or A3 by Moody's. FSAMAGMH's former subsidiary FSA Asset Management LLC is expected to have sufficient eligible and liquid assets to satisfy any expected withdrawal and collateral posting obligations resulting from future rating actions affecting AGM.
The Company assumes exposure (Assumed Business) from third party insurers, primarily other monoline financial guaranty companies that currently are in runoff and no longer actively writing new business (Legacy Monoline Insurers), and may cede portions of exposure it has insured (Ceded Business) in exchange for premiums, net of any ceding commissions. The Company, if required, secures its reinsurance obligations to these Legacy Monoline Insurers, typically by depositing in trust assets with a market value equal to its assumed liabilities calculated on a U.S. statutory basis.
Substantially all of the Company’s Assumed Business and Ceded Business relates to financial guaranty business, except for a modest amount that relates to AGRO's specialty business. The Company historically entered into, and with respect to new business originated by AGRO continues to enter into, ceded reinsurance contracts in order to obtain greater business diversification and reduce the net potential loss from large risks.
Accounting Policy
For business assumed and ceded, the accounting model of the underlying direct financial guaranty contract dictates the accounting model used for the reinsurance contract (except for those eliminated as FG VIEs). For any assumed or ceded financial guaranty insurance premiums and losses, the accounting models described in Note 7, Contracts Accounted for as Insurance, are followed. For any assumed or ceded credit derivative contracts, the accounting model in Note 11, Contracts Accounted for as Credit Derivatives, is followed.
Financial Guaranty Business
The Company’s facultative and treaty assumed agreements with the Legacy Monoline Insurers are generally subject to termination at the option of the ceding company:
if the Company fails to meet certain financial and regulatory criteria;
if the Company fails to maintain a specified minimum financial strength rating; or
upon certain changes of control of the Company.
Upon termination due to one of the above events, the Company typically would be required to return to the ceding company unearned premiums (net of ceding commissions) and loss reserves, calculated on a U.S. statutory basis, attributable to the Assumed Business (plus in certain cases, an additional required amount), after which the Company would be released from liability with respect to such business.
As of December 31, 2019, if each third party company ceding business to any of the Company's insurance subsidiaries had a right to recapture such business, and chose to exercise such right, the aggregate amounts that AG Re and AGC could be required to pay to all such companies would be approximately $40 million and $287 million, respectively.
The Company has ceded financial guaranty business to non-affiliated companies to limit its exposure to risk. The Company remains primarily liable for all risks it directly underwrites and is required to pay all gross claims. It then seeks reimbursement from the reinsurer for its proportionate share of claims. The Company may be exposed to risk for this exposure if it were required to pay the gross claims and not be able to collect ceded claims from an assuming company experiencing financial distress. The Company’s ceded contracts generally allow the Company to recapture ceded financial guaranty business after certain triggering events, such as reinsurer downgrades.
Specialty Business
The Company, through AGRO, assumes specialty business from third party insurers (Assumed Specialty Business). It also cedes and retrocedes some of its specialty business to third party reinsurers. A downgrade of AGRO’s financial strength rating by S&P below “A” would require AGRO to post, as of December 31, 2019, an estimated $0.1 million of collateral in respect of certain of its Assumed Specialty Business. A further downgrade of AGRO’s S&P rating below A- would give the company ceding such business the right to recapture the business for AGRO’s collateral amount, and, if also accompanied by a downgrade of AGRO's financial strength rating by A.M. Best Company, Inc. below A-, would also require AGRO to post, as of December 31, 2019, an estimated $14 million of collateral in respect of a different portion of AGRO’s Assumed Specialty Business. AGRO’s ceded/retroceded contracts generally have equivalent provisions requiring the assuming reinsurer to post collateral and/or allowing AGRO to recapture the ceded/retroceded business upon certain triggering events, such as reinsurer rating downgrades.
Effect of Reinsurance
The following table presents the components of premiums and losses reported in the consolidated statements of operations and the contribution of the Company's Assumed and Ceded Businesses (both financial guaranty and specialty).
Effect of Reinsurance on Statement of Operations
|
| | | | | | | | | | | |
| | Year Ended December 31, |
| | 2019 | | 2018 | | 2017 |
| | (in millions) |
| Premiums Written: | | | | | |
| Direct | $ | 663 |
| | $ | 288 |
| | $ | 297 |
|
| Assumed | 14 |
| | 324 |
| | 10 |
|
| Ceded (1) | 10 |
| | 14 |
| | 18 |
|
| Net | $ | 687 |
| | $ | 626 |
| | $ | 325 |
|
| Premiums Earned: | | | | | |
| Direct | $ | 429 |
| | $ | 509 |
| | $ | 693 |
|
| Assumed | 54 |
| | 51 |
| | 27 |
|
| Ceded | (7 | ) | | (12 | ) | | (30 | ) |
| Net | $ | 476 |
| | $ | 548 |
| | $ | 690 |
|
| Loss and LAE: | | | | | |
| Direct | $ | 101 |
| | $ | 68 |
| | $ | 404 |
|
| Assumed | 2 |
| | (1 | ) | | 11 |
|
| Ceded | (10 | ) | | (3 | ) | | (27 | ) |
| Net | $ | 93 |
| | $ | 64 |
| | $ | 388 |
|
____________________
| |
| (1) | Positive ceded premiums written were due to commutations and changes in expected debt service schedules. |
Ceded Reinsurance (1)
|
| | | | | | | |
| | As of December 31, |
| | 2019 | | 2018 |
| | (in millions) |
| Ceded premium payable, net of commissions | $ | 20 |
| | $ | 26 |
|
| Ceded expected loss to be recovered (paid) | 11 |
| | 14 |
|
| Financial guaranty ceded par outstanding (2) | 1,349 |
| | 2,389 |
|
| Specialty ceded exposure (see Note 5) | 303 |
| | 239 |
|
| |
| (1) | The total collateral posted by all non-affiliated reinsurers required to post, or that had agreed to post, collateral as of December 31, 2019 and December 31, 2018 was approximately $68 million and $80 million, respectively. Such collateral is posted (i) in the case of certain reinsurers not authorized or "accredited" in the U.S., in order for the Company to receive credit for the liabilities ceded to such reinsurers in statutory financial statements, and (ii) in the case of certain reinsurers authorized in the U.S., on terms negotiated with the Company. |
| |
| (2) | Of the total par ceded to unrated or BIG rated reinsurers, $224 million and $236 million is rated BIG as of December 31, 2019 and December 31, 2018, respectively. |
In accordance with U.S. statutory accounting requirements and U.S. insurance laws and regulations, in order for the Company to receive credit for liabilities ceded to reinsurers domiciled outside of the U.S., such reinsurers must secure their liabilities to the Company. These reinsurers are required to post collateral for the benefit of the Company in an amount at least equal to the sum of their ceded unearned premium reserve, loss reserves and contingency reserves all calculated on a statutory basis of accounting. In addition, certain authorized reinsurers post collateral on terms negotiated with the Company.
Commutations
Commutations of Ceded Reinsurance Contracts
|
| | | | | | | | | | | |
| | Year Ended December 31, |
| | 2019 | | 2018 | | 2017 |
| | (in millions) |
| Increase in net unearned premium reserve | $ | 15 |
| | $ | 64 |
| | $ | 82 |
|
| Increase in net par outstanding | 1,069 |
| | 1,457 |
| | 5,107 |
|
| Commutation gains (losses) | 1 |
| | (16 | ) | | 328 |
|
Excess of Loss Reinsurance Facility
Effective January 1, 2018, AGC, AGM and MAC entered into a $400 million aggregate excess of loss reinsurance facility of which $180 million was placed with an unaffiliated reinsurer. This facility covered losses occurring from January 1, 2018 through December 31, 2025, and terminated on January 1, 2020, after AGC, AGM and MAC chose not to extend it. The facility covered certain U.S. public finance exposures insured or reinsured by AGC, AGM and MAC as of September 30, 2017, excluding exposures that were rated below investment grade as of December 31, 2017 by Moody’s or S&P or internally by AGC, AGM or MAC and was subject to certain per credit limits. Among the exposures excluded were those associated with the Commonwealth of Puerto Rico and its related authorities and public corporations. AGC, AGM and MAC paid approximately $3.2 million of premiums in 2018 for the term January 1, 2018 through December 31, 2018 and approximately $3.2 million of premiums in 2019 for the term January 1, 2019 through December 31, 2019.
The Company carries a significant portion of its assets and liabilities at fair value. Fair value is defined as the price that would be received to sell an asset or paid to transfer a liability in an orderly transaction between market participants at the measurement date (i.e., exit price). The price represents the price available in the principal market for the asset or liability. If there is no principal market, then the price is based on a hypothetical market that maximizes the value received for an asset or minimizes the amount paid for a liability (i.e., the most advantageous market).
Fair value is based on quoted market prices, where available. If listed prices or quotes are not available, fair value is based on either internally developed models that primarily use, as inputs, market-based or independently sourced market parameters, including but not limited to yield curves, interest rates and debt prices or with the assistance of an independent third-party using a discounted cash flow approach and the third party’s proprietary pricing models. In addition to market information, models also incorporate transaction details, such as maturity of the instrument and contractual features designed to reduce the Company’s credit exposure, such as collateral rights as applicable.
Valuation adjustments may be made to ensure that financial instruments are recorded at fair value. These adjustments include amounts to reflect counterparty credit quality, the Company’s creditworthiness and constraints on liquidity. As markets and products develop and the pricing for certain products becomes more or less transparent, the Company may refine its methodologies and assumptions. During 2016,2019, no changes were made to the Company’s valuation models that had or are expected to have, a material impact on the Company’s consolidated balance sheets or statements of operations and comprehensive income.
The Company’s methods for calculating fair value produce a fair value that may not be indicative of net realizable value or reflective of future fair values. The use of different methodologies or assumptions to determine fair value of certain financial instruments could result in a different estimate of fair value at the reporting date.
The categorization within the fair value hierarchy is determined based on whether the inputs to valuation techniques used to measure fair value are observable or unobservable. Observable inputs reflect market data obtained from independent sources, while unobservable inputs reflect Company estimates of market assumptions. The fair value hierarchy prioritizes
model inputs into three broad levels as follows, with Level 1 being the highest and Level 3 the lowest. An assetasset's or liability’s categorization is based on the lowest level of significant input to its valuation.
Level 1—Quoted prices for identical instruments in active markets. The Company generally defines an active market as a market in which trading occurs at significant volumes. Active markets generally are more liquid and have a lower bid-ask spread than an inactive market.
Level 2—Quoted prices for similar instruments in active markets; quoted prices for identical or similar instruments in markets that are not active; and observable inputs other than quoted prices, such as interest rates or yield curves and other inputs derived from or corroborated by observable market inputs.
Level 3—Model derived valuations in which one or more significant inputs or significant value drivers are unobservable. Financial instruments are considered Level 3 when their values are determined using pricing models, discounted cash flow methodologies or similar techniques and at least one significant model assumption or input is unobservable. Level 3 financial instruments also include those for which the determination of fair value requires significant management judgment or estimation.
Transfers between Levels 1, 2 and 3 are recognized at the end of the period when the transfer occurs. The Company reviews the classification between Levels 1, 2 and 3 quarterly to determine whetherThere was a transfer is necessary. During the periods
presented, there were no transfers between Level 1 and Level 2. There were transfers of a fixed-maturity securitiessecurity from Level 2 into Level 3 during 2016 because of a lack of observability relating to the valuation inputs and collateral pricing.2019. There were no other transfers into or out offrom Level 3 during 2015.the periods presented.
Measured and Carried at Fair Value
Fixed-Maturity Securities and Short-Term Investments
The fair value of bondsfixed-maturity securities in the investment portfolio is generally based on prices received from third partythird-party pricing services or alternative pricing sources with reasonable levels of price transparency. The pricing services prepare estimates of fair value measurements using their pricing models, which include available relevant market information,take into account: benchmark curves, benchmarking of likeyields, reported trades, broker/dealer quotes, issuer spreads, two-sided markets, benchmark securities, bids, offers, reference data, industry and economic events and sector groupings. Additional valuation factors that can be taken into account are nominal spreads and liquidity adjustments. The pricing services evaluate each asset class based on relevant market and credit information, perceived market movements, and sector news. The market inputs used in the pricing evaluation include: benchmark yields, reported trades, broker/dealer quotes, issuer spreads, two-sided markets, benchmark securities, bids, offers, reference data and industry and economic events.
Benchmark yields have in many cases taken priority over reported trades for securities that trade less frequently or those that are distressed trades, and therefore may not be indicative of the market. The extent of the use of each input is dependent on the asset class and the market conditions. Given the asset class, the priority of the use of inputs may change or some market inputs may not be relevant. Additionally, theThe valuation of fixed-maturity investments is more subjective when markets are less liquid due to the lack of market based inputs, which may increase the potential that the estimated fair value of an investment is not reflective of the price at which an actual transaction would occur.inputs.
Short-term investments that are traded in active markets are classified within Level 1 in the fair value hierarchy andas their value is based on quoted market prices. Securities such as discount notes are classified within Level 2 because these securities are typically not actively traded due to their approaching maturity and, as such, their cost approximates fair value. Short term securities that were obtained as part of loss mitigation efforts and whose prices were determined based on models, where at least one significant model assumption or input is unobservable, are considered to be Level 3 in the fair value hierarchy.
Annually, the Company reviews each pricing service’s procedures, controls and models used in the valuations of the Company’s investment portfolio, as well as the competency of the pricing service’s key personnel. In addition, on a quarterly basis, the Company holds a meeting of the internal valuation committee (comprised of individuals within the Company with market, valuation, accounting, and/or finance experience) that reviews and approves prices and assumptions used by the pricing services.
For Level 1 and 2 securities, the Company, on a quarterly basis, reviews internally developed analytic packages that highlight, at a CUSIP level, price changes from the previous quarter to the current quarter. Where unexpected price movements are noted for a specific CUSIP, the Company formally challenges the price provided, and reviews all key inputs utilized in the third party’s pricing model, and compares such information to management’s own market information.
For Level 3 securities, the Company, on a quarterly basis:
reviews methodologies, any model updates and inputs and compares such information to management’s own market information and, where applicable, the internal models,
reviews internally developed analytic packages that highlight, at a CUSIP level, price changes from the previous quarter to the current quarter, and evaluates, documents, and resolves any significant pricing differences with the assistance of the third party pricing source, and
compares prices received from different third party pricing sources, and evaluates, documents the rationale for, and resolves any significant pricing differences.
As of December 31, 2016,2019, the Company used models to price 80 fixed-maturity129 securities, (primarilyincluding securities that were purchased or obtained for loss mitigation or other risk management purposes), which were 11.7% or $1,269 millionpurposes, with a Level 3 fair value of the Company’s fixed-maturity securities and short-term investments at fair value.$1,114 million. Most Level 3 securities were priced with the assistance of an independent third-party. The pricing is based on a discounted cash flow approach using the third-party’s proprietary pricing models. The models use inputs such as projected prepayment speeds; severity assumptions; recovery lag assumptions; estimated default rates (determined on the basis of an analysis of collateral attributes, historical collateral performance, borrower profiles and other features relevant to the evaluation of collateral credit quality); home price appreciation/depreciation rates based on macroeconomic forecasts and recent trading activity. The yield used to discount the projected cash flows is determined by reviewing various attributes of the bondsecurity including collateral type, weighted average life, sensitivity to losses, vintage, and convexity, in conjunction with market data on comparable securities. Significant changes to any of these inputs could have materially changechanged the expected timing of cash flows within these securities which is a significant factor in determining the fair value of the securities.
Other Invested Assets
As of December 31, 2016 and December 31, 2015, other invested assets include investments carried and measured at fair value on a recurring basis of $52 million and $53 million, respectively, and include primarily an investment in the global property catastrophe risk market and an investment in a fund that invests primarily in senior loans and bonds. Fair values for the majority of these investments are based on their respective net asset value (NAV) per share or equivalent.
Other Assets
Committed Capital Securities
The fair value of committed capital securities (CCS),CCS, which is recorded in “other assets”other assets on the consolidated balance sheets, represents the difference between the present value of remaining expected put option premium payments under AGC’s CCS (the AGC CCS) and AGM’s Committed Preferred Trust Securities (the AGM CPS) agreements, and the estimated present value that the Company would hypothetically have to pay currently for a comparable security (see Note 16,15, Long Term Debt and Credit Facilities). The change in fair value of the AGC CCS and AGM CPS are carried at fair value with changesrecorded in fair value recordedother income in the consolidated statement of operations. Fair value changes on CCS recorded in other income were losses of $22 million and $2 million in 2019 and 2017, respectively, and gains of $14 million in 2018. The estimated current cost of the Company’s CCS is based on several factors, including AGM and AGC CDS spreads, the U.S. dollar forward swap curve, London Interbank Offered Rate (LIBOR)LIBOR curve projections, the Company's publicly traded debt and the term the securities are estimated to remain outstanding. The AGC CCS and AGM CPS are classified as Level 3 in the fair value hierarchy.
Supplemental Executive Retirement Plans
The Company classifies the fair value measurement of the assets of the Company's various supplemental executive retirement plans as either Level 1 or Level 2. The fair value of these assets is valued based on the observable published daily values of the underlying mutual fund included in the aforementioned plans (Level 1) or based upon the NAVnet asset value (NAV) of the funds if a published daily value is not available (Level 2). The NAVNAVs are based on observable information. Change in fair value of these assets is recorded in other operating expenses in the consolidated statement of operations.
Contracts Accounted for as Credit Derivatives
The Company’s credit derivatives primarily consist primarily of insured CDS contracts, and also include interest rate swaps andthat qualify as of December 31, 2016, hedges on other financial guarantors that fallderivatives under derivative accounting standards requiringGAAP, which requires fair value accounting throughmeasurement with changes recorded in the statement of operations. The following is a description of the fair value methodology applied to the Company's insured CDS that are accounted for as credit derivatives, which constitute the vast majority of the net credit derivative liability in the consolidated balance sheets. The Company did not enter into CDS with the intent to trade these
contracts and the Company may not unilaterally terminate a CDS contract absent an event of default or termination event that entitles the Company to terminate such contracts; however, the Company has mutually agreed with various counterparties to terminate certain CDS transactions. Such terminationsIn transactions where the counterparty does not have the right to terminate, such transactions are generally are doneterminated for an amount that approximates the present value of future premiums or for a negotiated amount; notamount, rather than at fair value.
The terms of the Company’s CDS contracts differ from more standardized credit derivative contracts sold by companies outside the financial guaranty industry. The non-standard terms generally include the absence of collateral support agreements or immediate settlement provisions. In addition, the Company employs relatively high attachment points and does not exit derivatives it sells, or purchases for credit protection purposes, except under specific circumstances such as mutual agreements with counterparties. Management considers the non-standard terms of itsthe Company's credit derivative contracts in determining the fair value of these contracts.
Due to the lack of quoted prices and other observable inputs for its instruments or for similar instruments, the Company determines the fair value of its credit derivative contracts primarily through internally developed, proprietary models that use both observable and unobservable market data inputs to derive an estimate of the fair value of the Company's contracts in its principal markets (see "Assumptions and Inputs").inputs. There is no established market where financial guaranty insured credit derivatives are actively traded,traded; therefore, management has determined that the exit market for the Company’s credit derivatives is a hypothetical one based on its entry market. Management has tracked the historical pricing of the Company’s deals to establish historical price points in the hypothetical market that are used in the fair value calculation. These contracts are classified as Level 3 in the fair value hierarchy sinceas there is reliance on at least oneare multiple unobservable inputinputs deemed significant to the valuation model, most importantly the Company’s estimate of the value of the non-standard terms and conditions of its credit derivative contracts and ofhow the Company’s currentown credit standing.
The Company’s models andspread affects the related assumptions are continuously reevaluated by management and enhanced, as appropriate, based upon improvements in modeling techniques and availabilitypricing of more timely and relevant market information.its transactions.
The fair value of the Company’s credit derivative contracts represents the difference between the present value of remaining premiums the Company expects to receive or pay and the estimated present value of premiums that a financial guarantor of comparable credit-worthiness would hypothetically charge or pay at the reporting date for the same protection. The fair value of the Company’s credit derivatives depends on a number of factors, including notional amount of the contract, expected term, credit spreads, changes in interest rates, the credit ratings of referenced entities, the Company’s own credit risk and remaining contractual cash flows. The expected remaining contractual premium cash flows are the most readily observable inputs since they are based on the CDS contractual terms. Credit spreads capture the effect of recovery rates and performance of underlying assets of these contracts, among other factors. Consistent with previous years, market conditions at December 31, 20162019 were such that market prices of the Company’s CDS contracts were not available.
Management considers factors such as current prices charged for similar agreements, when available, performance of underlying assets, life of the instrument, and the nature and extent of activity in the financial guaranty credit derivative marketplace. The assumptions that management uses to determine the fair value may change in the future due to market conditions. Due to the inherent uncertainties of the assumptions used in the valuation models, actual experience may differ from the estimates reflected in the Company’s consolidated financial statements and the differences may be material.
Assumptions and Inputs
The various inputs and assumptions that are key to the establishment of the Company’s fair value for CDS contracts are as follows:
Gross spread.
The the gross spread, the allocation of gross spread among:
| |
◦ | among the bank profit, net spread and hedge cost, and the profit the originator, usually an investment bank, realizes for putting the deal together and funding the transaction (bank profit); |
| |
◦ | premiums paid to the Company for the Company’s credit protection provided (“net spread”); and
|
| |
◦ | the cost of CDS protection purchased by the originator to hedge their counterparty credit risk exposure to the Company (hedge cost). |
The weighted average life which is based on debt service schedules.
The rates used to discount future expected premium cash flows ranged from 1.00% to 2.55% at December 31, 2016 and 0.44% to 2.51% at December 31, 2015.
The Company obtains gross spreads on its outstanding contracts from market data sources published by third parties (e.g., dealer spread tables for the collateral similar to assets within the Company’s transactions), as well as collateral-specific spreads provided by trustees or obtained from market sources. If observable market credit spreads are not available or reliableThe bank profit represents the profit the originator, usually an investment bank, realizes for structuring and funding the transaction; the net spread represents the premiums paid to the Company for the underlying reference obligations, then market indices are used Company’s credit protection provided; and the hedge cost represents the cost of CDS protection purchased by the originator to hedge its counterparty credit risk exposure to the Company.
With respect to CDS transactions for which there is an expected claim payment within the next twelve months, the allocation of gross spread reflects a higher allocation to the cost of credit rather than the bank profit component. It is assumed
that most closely resemble the underlying reference obligations, considering asset class, credit quality rating and maturity of the underlying reference obligations. These indices are adjusteda bank would be willing to reflect the non-standard terms of the Company’s CDS contracts. accept a lower profit on distressed transactions in order to remove these transactions from its financial statements.
Market sources determine credit spreads by reviewing new issuance pricing for specific asset classes and receiving price quotes from their trading desks for the specific asset in question. Management validates these quotes by cross-referencing quotes received from one market source against quotes received from another market source to ensure reasonableness. In addition, the Company compares the relative change in price quotes received from one quarter to another, with the relative change experienced by published market indices for a specific asset class. Collateral specific spreads obtained from third-party, independent market sources are un-published spread quotes from market participants or market traders who are not trustees. Management obtains this information as the result of direct communication with these sources as part of the valuation process.
With respect to CDS transactions for which there is an expected claim payment within the next twelve months, the allocation of gross spread reflects a higher allocation to the cost of credit rather than the bank profit component. In the current market, it is assumed that a bank would be willing to accept a lower profit on distressed transactions in order to remove these transactions from its financial statements.
The following spread hierarchy is utilized in determining which source of gross spread to use, with the rule being to use CDS spreads where available. If not available, CDS spreads are either interpolated or extrapolated based on similar transactions or market indices.use.
Actual collateral specific credit spreads (if up-to-date and reliable market-based spreads are available).
DealsTransactions priced or closed during a specific quarter within a specific asset class and specific rating. No transactions closed during the periods presented.
Credit spreads interpolated based upon market indices.
Credit spreads provided byindices adjusted to reflect the counterpartynon-standard terms of the CDS.Company's CDS contracts.
Credit spreads extrapolated based upon transactions of similar asset classes, similar ratings, and similar time to maturity.
Information by Credit Spread Type (1)
|
| | | | | |
| | As of
December 31, 2016 | | As of
December 31, 2015 |
| Based on actual collateral specific spreads | 7 | % | | 13 | % |
| Based on market indices | 77 | % | | 73 | % |
| Provided by the CDS counterparty | 16 | % | | 14 | % |
| Total | 100 | % | | 100 | % |
____________________
(1) Based on par.
Over time the data inputs can change as new sources become available or existing sources are discontinued or are no longer considered to be the most appropriate. It is the Company’s objective to move to higher levels on the hierarchy whenever possible, but it is sometimes necessary to move to lower priority inputs because of discontinued data sources or management’s assessment that the higher priority inputs are no longer considered to be representative of market spreads for a given type of collateral. This can happen, for example, if transaction volume changes such that a previously used spread index is no longer viewed as being reflective of current market levels.
The Company interpolates a curve based on the historical relationship between therates used to discount future expected premium the Company receives when a credit derivative is closedcash flows ranged from 1.69% to the daily closing price of the market index related2.08% at December 31, 2019 and 2.47% to the specific asset class and rating of the deal. This curve indicates expected credit spreads2.89% at each indicative level on the related market index. For transactions with unique terms or characteristics where no price quotes are available, management extrapolates credit spreads based on a similar transaction for which the Company has received a spread quote from one of the first three sources within the Company’s spread hierarchy. This alternative transaction will be within the same asset class, have similar underlying assets, similar credit ratings, and similar time to maturity. The Company then calculates the percentage of relative spread change quarter over quarter for the alternative transaction. This percentage change is then applied to the historical credit spread of the transaction for which no price quote was received in order to calculate the transactions’ current spread. Counterparties determine credit spreads by reviewing new issuance pricing for specific asset classes and receiving price quotes from their trading desks for the specific asset in question. These quotes are validated by cross-referencing quotes received from one market source with those quotes received from another market source to ensure reasonableness.December 31, 2018.
The premium the Company receives is referred to as the “net spread.” The Company’s pricing model takes into account not only how credit spreads on risks that it assumes affect pricing, but also how the Company’s own credit spread affects the pricing of its deals.transactions. The Company’s own credit risk is factored into the determination of net spread based on the impact of changes in the quoted market price for credit protection bought on the Company, as reflected by quoted market prices on CDS referencing AGC or AGM.AGC. For credit spreads on the Company’s name the Company obtains the quoted price of CDS contracts traded on AGC and AGM from market data sources published by third parties. The cost to acquire CDS protection referencing AGC or AGM affects the amount of spread on CDS dealstransactions that the Company retains and, hence, their fair value. As the cost to acquire CDS protection referencing AGC or AGM increases, the amount of premium the Company retains on a dealtransaction generally decreases. AsDue to the cost to acquirerelatively low volume and characteristics of CDS protection referencing AGC or AGM decreases,contracts remaining in AGM's portfolio, changes in AGM's credit spreads do not significantly affect the amountfair value of premium the Company retains on a deal generally increases. these CDS contracts.
In the Company’s valuation model, the premium the Company captures is not permitted to go below the minimum rate that the Company would currently charge to assume similar risks. This assumption can have the effect of mitigating the amount of unrealized gains that are recognized on certain CDS contracts. Given the current market conditions and the Company’s own credit spreads, approximately 26% and 20% ,17% based on number of deals,fair value, of the Company's CDS contracts arewere fair valued using this minimum premium as of December 31, 2016 and2018. As of December 31, 2015, respectively.2019, the corresponding number was de minimis. The percentage of dealstransactions that price using the minimum premiums fluctuates due to changes in AGM's and AGC's credit spreads. In general, when AGM's and AGC's credit spreads narrow, the cost to hedge AGM's and AGC's name declines and more transactions price above previously established floor levels. Meanwhile, when AGM's and AGC's credit spreads widen, the cost to hedge AGM's and AGC's name increases causing more transactions to price at previously established floor levels. The Company corroborates the assumptions in its fair value model, including the portion of exposure to AGC and AGM hedged by its counterparties, with independent third parties each reporting period.periodically. The currentimplied credit risk of AGC, indicated by the trading level of AGC’s and AGM’s own credit spread, has resultedis a significant factor in the bank or deal originator hedging a significant portionamount of its exposure to AGC and AGM. This reducesthat a bank or transaction hedges. When AGC's credit spreads widen, the hedging cost of a bank or originator increases. Higher hedging costs reduce the amount of contractual cash flows AGC and AGM can capture as premium for selling its protection.protection, while lower hedging costs increase the amount of contractual cash flows AGC can capture.
The amount of premium a financial guaranty insurance market participant can demand is inversely related to the cost of credit protection on the insurance company as measured by market credit spreads assuming all other assumptions remain constant. This is because the buyers of credit protection typically hedge a portion of their risk to the financial guarantor, due to the fact that the contractual terms of the Company's contracts typically do not require the posting of collateral by the guarantor. The extent of the hedge depends on the types of instruments insured and the current market conditions.
A fair value resulting in a credit derivative assetliability on protection sold is the result of contractual cash inflows on in-force deals in excess oftransactions that are less than what a hypothetical financial guarantor could receive if it sold protection on the same risk as of the reporting date. If
the Company were able to freely exchange these contracts (i.e., assuming its contracts did not contain proscriptions on transfer and there was a viable exchange market), it would be able to realize a gainloss representing the difference between the higherlower contractual premiums to which it is entitled and the current market premiums for a similar contract. The Company determines the fair value of its CDS contracts by applying the difference between the current net spread and the contractual net spread for the remaining duration of each contract to the notional value of its CDS contracts and taking the present value of such amounts discounted at the LIBOR corresponding LIBOR overto the weighted average remaining life of the contract.
Example
The following is an example of how changes in gross spreads, the Company’s own credit spread and the cost to buy protection on the Company affect the amount of premium the Company can demand for its credit protection. The assumptions used in these examples are hypothetical amounts. Scenario 1 represents the market conditions in effect on the transaction date and Scenario 2 represents market conditions at a subsequent reporting date.
|
| | | | | | | | | | | |
| | Scenario 1 | | Scenario 2 |
| | bps | | % of Total | | bps | | % of Total |
| Original gross spread/cash bond price (in bps) | 185 |
| | |
| | 500 |
| | |
|
| Bank profit (in bps) | 115 |
| | 62 | % | | 50 |
| | 10 | % |
| Hedge cost (in bps) | 30 |
| | 16 | % | | 440 |
| | 88 | % |
| The premium the Company receives per annum (in bps) | 40 |
| | 22 | % | | 10 |
| | 2 | % |
In Scenario 1, the gross spread is 185 basis points. The bank or deal originator captures 115 basis points of the original gross spread and hedges 10% of its exposure to AGC, when the CDS spread on AGC was 300 basis points (300 basis points × 10% = 30 basis points). Under this scenario the Company receives premium of 40 basis points, or 22% of the gross spread.
In Scenario 2, the gross spread is 500 basis points. The bank or deal originator captures 50 basis points of the original gross spread and hedges 25% of its exposure to AGC, when the CDS spread on AGC was 1,760 basis points (1,760 basis points × 25% = 440 basis points). Under this scenario the Company would receive premium of 10 basis points, or 2% of the gross spread. Due to the increased cost to hedge AGC’s name, the amount of profit the bank would expect to receive, and the premium the Company would expect to receive decline significantly.
In this example, the contractual cash flows (the Company premium received per annum above) exceed the amount a market participant would require the Company to pay in today’s market to accept its obligations under the CDS contract, thus resulting in an asset.
Strengths and Weaknesses of Model
The Company’s credit derivative valuation model, like any financial model, has certain strengths and weaknesses.
The primary strengths of the Company’s CDS modeling techniques are:
The model takes into account the transaction structure and the key drivers of market value. The transaction structure includes par insured, weighted average life, level of subordination and composition of collateral.
The model maximizes the use of market-driven inputs whenever they are available. The key inputs to the model are market-based spreads for the collateral, and the credit rating of referenced entities. These are viewed by the Company to be the key parameters that affect fair value of the transaction.
The model is a consistent approach to valuing positions. The Company has developed a hierarchy for market-based spread inputs that helps mitigate the degree of subjectivity during periods of high illiquidity.
The primary weaknesses of the Company’s CDS modeling techniques are:
There is no exit market or any actual exit transactions. Thereforetransactions; therefore, the Company’s exit market is a hypothetical one based on the Company’s entry market.
There is a very limited market in which to validate the reasonableness of the fair values developed by the Company’s model.
The markets for the inputs to the model wereare highly illiquid, which impacts their reliability.
Due to the non-standard terms under which the Company enters into derivative contracts, the fair value of its credit derivatives may not reflect the same prices observed in an actively traded market of credit derivatives that do not contain terms and conditions similar to those observed in the financial guaranty market.
These contracts were classified as Level 3 in the fair value hierarchy because there is a reliance on at least one unobservable input deemed significant to the valuation model, most significantly the Company's estimate of the value of non-standard terms and conditions of its credit derivative contracts and amount of protection purchased on AGC or AGM's name.
Fair Value Option on FG VIEs’ Assets and Liabilities
The Company elected the fair value option for all the FG VIEs’ assets and liabilities. See Note 9, Consolidated Variableliabilities and classifies them as Level 3 in the fair value hierarchy. The prices are generally determined with the assistance of an independent third party, based on a discounted cash flow approach. The net change in the fair value of consolidated FG VIEs’ assets and liabilities is recorded in "fair value gains (losses) on FG VIEs" in the consolidated statements of operations, except for change in fair value of FG VIEs’ liabilities with recourse caused by changes in instrument-specific credit risk (ISCR) which is separately presented in OCI. Interest Entities.
income and interest expense are derived from the trustee reports and also included in "fair value gains (losses) on FG VIEs." The FG VIEs issued securities collateralized by first lien and second lien RMBS as well as loans and receivables. The lowest level input that is significant to the fair value measurement of these assets and liabilities was a Level 3 input (i.e., unobservable), therefore management classified them as Level 3 in the fair value hierarchy. Prices are generally determined with the assistance of an independent third-party, based on a discounted cash flow approach. The models to price the FG VIEs’ liabilities used, where appropriate, inputs such as estimated prepayment speeds; market values of the assets that collateralize the securities; estimated default rates (determined on the basis of an analysis of collateral attributes, historical collateral performance, borrower profiles and other features relevant to the evaluation of collateral credit quality); yields implied by market prices for similar securities; house price depreciation/appreciation rates based on macroeconomic forecasts and, for those liabilities insured by the Company, the benefit from the Company’s insurance policy guaranteeing the timely payment of principal and interest, taking into account the timing of the potential default and the Company’s own credit rating. The third-party also utilizes an internal model to determine an appropriate yield at which to discount the cash flows of the security, by factoring in collateral types, weighted-average lives, and other structural attributes specific to the security being priced. The expected yield is further calibrated by utilizing algorithms designed to aggregate market color, received by the third-party, on comparable bonds.
The fair value of the Company’s FG VIEVIEs’ assets is generally sensitive to changes related toin estimated prepayment speeds; estimated default rates (determined on the basis of an analysis of collateral attributes such as: historical collateral performance, borrower profiles and other features relevant to the evaluation of collateral credit quality); yields implied by market prices for similar securities; and house price depreciation/appreciation rates based on macroeconomic forecasts. Significant changes to some of these inputs could have materially changechanged the market value of the FG VIE’sVIEs’ assets and the implied collateral losses within the transaction. In general, the fair value of the FG VIE assetVIEs’ assets is most sensitive to changes in the projected collateral losses, where an increase in collateral losses typically leadscould lead to a decrease in the fair value of FG VIEVIEs’ assets, while a decrease in collateral losses typically leads to an increase in the fair value of FG VIEVIEs’ assets. These factors also directly impactThe third-party utilizes an internal model to determine an appropriate yield at which to discount the cash flows of the security, by factoring in collateral types, weighted-average lives, and other structural attributes specific to the security being priced. The expected yield is further calibrated by utilizing algorithms designed to aggregate market color, received by the independent third-party, on comparable bonds.
The models used to price the FG VIEs’ liabilities generally apply the same inputs used in determining fair value of FG VIEs’ assets. For those liabilities insured by the Company’s FG VIE liabilities.Company, the benefit of the Company's insurance policy guaranteeing the timely payment of principal and interest is also taken into account.
The fair value of the Company’s FG VIE liabilities is generally sensitive to the various model inputs described above. In addition, the Company’s FG VIE liabilities with recourse are also sensitive to changes in the Company’s implied credit worthiness. Significant changes to any of thesethe inputs described above could have materially changechanged the timing of expected losses within the insured transaction which is a significant factor in determining the implied benefit fromof the Company’s insurance policy guaranteeing the timely payment of principal and interest for the insured tranches of debt issued by the FG VIE that is insured by the Company.VIEs. In general, extending the timing of expected loss payments by the Company into the future typically leadscould lead to a decrease in the value of the Company’s insurance and a decrease in the fair value of the Company’s FG VIEVIEs’ liabilities with recourse, while a shortening of the timing of expected loss payments by the Company typically leadscould lead to an increase in the value of the Company’s insurance and an increase in the fair value of the Company’s FG VIEVIEs’ liabilities with recourse.
Assets and Liabilities of Consolidated Investment Vehicles
Due to the fact that BlueMountain manages and the Insurance segment has an investment in certain Assured Investment Management funds, the Company consolidated 1 Assured Investment Management managed CLO and 3 Assured Investment Management funds (collectively, the consolidated investment vehicles). The consolidated Assured Investment Management funds are: AHP Capital Solutions, LP (AHP), AIM Asset Backed Income Fund (US) L.P. (ABIF) and a BlueMountain CLO Warehouse Fund (US) L.P. (CLO Warehouse Fund). CLO Warehouse Fund invested in BlueMountain CLO XXVI Ltd. (CLO XXVI). All four consolidated investment vehicles are accounted for at fair value. See Note 14, Variable Interest Entities.
AHP and ABIF are investment companies, subject to the guidance in Accounting Standards Codification (ASC) 946, Financial Services — Investment Companies.
CLO XXVI is a collateralized financing entity (CFE) under ASC 810, Consolidation, and has elected to measure assets and liabilities using the fair value of its assets, which are more observable. The financial assets of CLO XXVI are all Level 2 assets, and therefore more observable than the fair value of the financial liabilities of CLO XXVI, which are all Level 3 liabilities. As a result, the financial assets of CLO XXVI are measured at fair value and the financial liabilities of CLO XXVI are measured as: (1) the sum of the fair value of the financial assets, and the carrying value of any nonfinancial assets held temporarily, less (2) the sum of the fair value of any beneficial interests retained by the Company (other than those that represent compensation for services), and the Company’s carrying value of any beneficial interests that represent compensation for services. The resulting amount is allocated to the individual financial liabilities (other than the beneficial interests retained by the Company).
Investments of consolidated investment vehicles which are not listed or quoted on an exchange, but are traded over-the-counter, or are listed on an exchange which have no reported sales, are valued at their fair value as determined by the Company, after giving consideration to third party data generally at the average between the offer and bid prices. These fair values are generally based on dealer quotes, indications of value or pricing models that consider the time value of money, the current market, contractual prices and potential volatilities of the underlying financial instruments. Inputs are used in applying the various valuation techniques and broadly refer to the current assumptions that market participants use to make valuation decisions, including assumptions about risk. Inputs may include dealer price quotations, yield curves, credit curves, forward/CDS/index spreads, prepayments rates, strike and expiry dates, volatility statistics and other factors.
Assets in consolidated Assured Investment Management funds that are carried at fair value primarily consist of corporate loans and other investments. Assets supporting CLO XXVI are Level 2 and all other assets of consolidated investment vehicles are Level 3. Liabilities include various tranches of CLO debt and classified as Level 3 in the fair value hierarchy. Significant changes to any of the inputs described above could have a material effect the fair value of the consolidated assets and liabilities.
Amounts recorded at fair value in the Company’s financial statements are presented in the tables below.
Fair Value Hierarchy of Financial Instruments Carried at Fair Value
As of December 31, 2019
|
| | | | | | | | | | | | | | | |
| | | | Fair Value Hierarchy |
| | Fair Value | | Level 1 | | Level 2 | | Level 3 |
| | (in millions) |
| Assets: | |
| | |
| | |
| | |
|
| Investment portfolio, available-for-sale: | |
| | |
| | |
| | |
|
| Fixed-maturity securities | |
| | |
| | |
| | |
|
| Obligations of state and political subdivisions | $ | 4,340 |
| | $ | — |
| | $ | 4,233 |
| | $ | 107 |
|
| U.S. government and agencies | 147 |
| | — |
| | 147 |
| | — |
|
| Corporate securities | 2,221 |
| | — |
| | 2,180 |
| | 41 |
|
| Mortgage-backed securities: | |
| | | | | | |
| RMBS | 775 |
| | — |
| | 467 |
| | 308 |
|
| Commercial mortgage-backed securities (CMBS) | 419 |
| | — |
| | 419 |
| | — |
|
| Asset-backed securities | 720 |
| | — |
| | 62 |
| | 658 |
|
| Non-U.S. government securities | 232 |
| | — |
| | 232 |
| | — |
|
| Total fixed-maturity securities | 8,854 |
|
| — |
| | 7,740 |
| | 1,114 |
|
| Short-term investments | 1,268 |
| | 1,061 |
| | 207 |
| | — |
|
| Other invested assets (1) | 6 |
| | — |
| | — |
| | 6 |
|
| FG VIEs’ assets, at fair value | 442 |
| | — |
| | — |
| | 442 |
|
| Assets of consolidated investment vehicles | 558 |
| | — |
| | 494 |
| | 64 |
|
| Other assets | 135 |
| | 32 |
| | 45 |
| | 58 |
|
| Total assets carried at fair value | $ | 11,263 |
| | $ | 1,093 |
| | $ | 8,486 |
| | $ | 1,684 |
|
| Liabilities: | |
| | |
| | |
| | |
|
| Credit derivative liabilities | $ | 191 |
| | $ | — |
| | $ | — |
| | $ | 191 |
|
| FG VIEs’ liabilities with recourse, at fair value | 367 |
| | — |
| | — |
| | 367 |
|
| FG VIEs’ liabilities without recourse, at fair value | 102 |
| | — |
| | — |
| | 102 |
|
| Liabilities of consolidated investment vehicles | 481 |
| | — |
| | — |
| | 481 |
|
| Total liabilities carried at fair value | $ | 1,141 |
| | $ | — |
| | $ | — |
| | $ | 1,141 |
|
Fair Value Hierarchy of Financial Instruments Carried at Fair Value
As of December 31, 2018
|
| | | | | | | | | | | | | | | |
| | | | Fair Value Hierarchy |
| | Fair Value | | Level 1 | | Level 2 | | Level 3 |
| | (in millions) |
| Assets: | |
| | |
| | |
| | |
|
| Investment portfolio, available-for-sale: | |
| | |
| | |
| | |
|
| Fixed-maturity securities | |
| | |
| | |
| | |
|
| Obligations of state and political subdivisions | $ | 4,911 |
| | $ | — |
| | $ | 4,812 |
| | $ | 99 |
|
| U.S. government and agencies | 175 |
| | — |
| | 175 |
| | — |
|
| Corporate securities | 2,136 |
| | — |
| | 2,080 |
| | 56 |
|
| Mortgage-backed securities: | |
| | |
| | |
| | |
|
| RMBS | 982 |
| | — |
| | 673 |
| | 309 |
|
| CMBS | 539 |
| | — |
| | 539 |
| | — |
|
| Asset-backed securities | 1,068 |
| | — |
| | 121 |
| | 947 |
|
| Non-U.S. government securities | 278 |
| | — |
| | 278 |
| | — |
|
| Total fixed-maturity securities | 10,089 |
| | — |
| | 8,678 |
| | 1,411 |
|
| Short-term investments | 729 |
| | 429 |
| | 300 |
| | — |
|
| Other invested assets (1) | 7 |
| | — |
| | — |
| | 7 |
|
| FG VIEs’ assets, at fair value | 569 |
| | — |
| | — |
| | 569 |
|
| Other assets | 139 |
| | 25 |
| | 38 |
| | 76 |
|
| Total assets carried at fair value | $ | 11,533 |
| | $ | 454 |
| | $ | 9,016 |
| | $ | 2,063 |
|
| Liabilities: | |
| | |
| | |
| | |
|
| Credit derivative liabilities | $ | 209 |
| | $ | — |
| | $ | — |
| | $ | 209 |
|
| FG VIEs’ liabilities with recourse, at fair value | 517 |
| | — |
| | — |
| | 517 |
|
| FG VIEs’ liabilities without recourse, at fair value | 102 |
| | — |
| | — |
| | 102 |
|
| Total liabilities carried at fair value | $ | 828 |
| | $ | — |
| | $ | — |
| | $ | 828 |
|
____________________
(1) Includes Level 3 mortgage loans that are recorded at fair value on a non-recurring basis.
Changes in Level 3 Fair Value Measurements
The tables below present a roll forward of the Company’s Level 3 financial instruments carried at fair value on a recurring basis during the years ended December 31, 2019 and 2018.
Rollforward of Level 3 Assets
At Fair Value on a Recurring Basis
Year Ended December 31, 2019
|
| | | | | | | | | | | | | | | | | | | | | | | | | | | | | | | | | | | |
| | Fixed-Maturity Securities | | | | | | | |
| | Obligations
of State and
Political
Subdivisions | | Corporate Securities | | RMBS | | Asset-
Backed
Securities | | FG VIEs’
Assets at
Fair
Value | | Assets of Consolidated Investment Vehicles | | Other
(7) | |
| | (in millions) |
| Fair value as of December 31, 2018 | $ | 99 |
| | $ | 56 |
| | $ | 309 |
| | $ | 947 |
| |
| $ | 569 |
| |
| $ | — |
| | $ | 77 |
| |
|
| Total pretax realized and unrealized gains/(losses) recorded in: | | | | | | | | |
| |
| |
| | | |
| |
|
| Net income (loss) | 6 |
| (1 | ) | (8 | ) | (1 | ) | 17 |
| (1 | ) | 58 |
| (1 | ) | 68 |
| (2 | ) | — |
| (4 | ) | (22 | ) | (3 | ) |
| Other comprehensive income (loss) | (1 | ) | | (7 | ) | | 25 |
| | (91 | ) | |
| — |
| |
| — |
| | — |
| |
|
| Purchases | 6 |
| | — |
| | 11 |
| | 20 |
| |
| — |
| |
| 64 |
| | — |
| |
|
| Sales | — |
| | — |
| | — |
| | (29 | ) | | (51 | ) | | — |
| | — |
| |
| Settlements | (3 | ) | | — |
| | (54 | ) | | (248 | ) | | (139 | ) | | — |
| | — |
| |
|
| VIE consolidations | — |
| | — |
| | — |
| | — |
| | 6 |
| | — |
| | — |
| |
| VIE deconsolidations | — |
| | — |
| | — |
| | — |
| | (11 | ) | | — |
| | — |
| |
| Transfers into Level 3 | — |
| | — |
| | — |
| | 1 |
| | — |
| | — |
| | — |
| |
Fair value as of
December 31, 2019 | $ | 107 |
| | $ | 41 |
| | $ | 308 |
| | $ | 658 |
| |
| $ | 442 |
| |
| $ | 64 |
| | $ | 55 |
| |
|
Change in unrealized gains/(losses) included in earnings related to financial instruments held as of
December 31, 2019 | | | | | | | | | $ | 77 |
| (2 | ) | $ | — |
| (4 | ) | $ | (22 | ) | (3 | ) |
Change in unrealized gains/(losses) included in OCI related to financial instruments held as of
December 31, 2019 | $ | — |
| | $ | (7 | ) | | $ | 25 |
| | $ | 15 |
| | | | | | | |
Rollforward of Level 3 Liabilities
At Fair Value on a Recurring Basis
Year Ended December 31, 2019
|
| | | | | | | | | | | | | | | | | | | | |
| | | | FG VIEs’ Liabilities, at Fair Value | | | |
| | Credit
Derivative
Asset (Liability), net (5) | | With Recourse | | Without Recourse | | Liabilities of Consolidated Investment Vehicles | |
| | (in millions) | |
| Fair value as of December 31, 2018 | $ | (207 | ) | | $ | (517 | ) | | $ | (102 | ) | | $ | — |
| |
| Total pretax realized and unrealized gains/(losses) recorded in: | |
| |
| |
| |
| | | | |
| Net income (loss) | (6 | ) | (6 | ) | (32 | ) | (2 | ) | (9 | ) | (2 | ) | (9 | ) | (4 | ) |
| Other comprehensive income (loss) | — |
| |
| 5 |
| |
| — |
| | — |
| |
| Issuances | — |
| |
| — |
| |
| — |
| | (472 | ) | |
| Settlements | 28 |
| |
| 173 |
| |
| 8 |
| | — |
| |
| VIE consolidations | — |
| | (5 | ) | | (1 | ) | | — |
| |
| VIE deconsolidations | — |
| | 9 |
| | 2 |
| | — |
| |
| Fair value as of December 31, 2019 | $ | (185 | ) | | $ | (367 | ) | | $ | (102 | ) | | $ | (481 | ) | |
| Change in unrealized gains/(losses) included in earnings related to financial instruments held as of December 31, 2019 | $ | 3 |
| (6 | ) | $ | (31 | ) | (2 | ) | $ | (17 | ) | (2 | ) | $ | (9 | ) | (4 | ) |
| Change in unrealized gains/(losses) included in OCI related to financial instruments held as of December 31, 2019 | | | $ | 5 |
| | | |
|
| |
Rollforward of Level 3 Assets and Liabilities
At Fair Value on a Recurring Basis
Year Ended December 31, 2018
|
| | | | | | | | | | | | | | | | | | | | | | | | | | | | | | | | | | | | | | | | | | | | | |
| | Fixed-Maturity Securities | | | | | | | | FG VIEs’ Liabilities, at Fair Value | |
| | Obligations
of State and
Political
Subdivisions | | Corporate Securities | | RMBS | | Asset-
Backed
Securities | | FG VIEs’
Assets at
Fair
Value | | Other
(7) | | Credit
Derivative
Asset
(Liability),
net (5) | | With Recourse | | Without Recourse | |
| | (in millions) | |
Fair value as of
December 31, 2017 | $ | 76 |
| | $ | 67 |
| | $ | 334 |
| | $ | 787 |
| | $ | 700 |
| |
| $ | 64 |
| | $ | (269 | ) | |
| $ | (627 | ) | | $ | (130 | ) | |
| Total pretax realized and unrealized gains/(losses) recorded in: | | | | | | | | | | |
| | | | |
| | |
| | |
| Net income (loss) | 3 |
| (1 | ) | (14 | ) | (1 | ) | 21 |
| (1 | ) | 57 |
| (1 | ) | 2 |
| (2 | ) | 14 |
| (3 | ) | 112 |
| (6 | ) | (1 | ) | (2 | ) | 4 |
| (2 | ) |
| Other comprehensive income (loss) | 18 |
| | 3 |
| | (17 | ) | | (40 | ) | | — |
| |
| — |
| | — |
| |
| 2 |
| |
| — |
| |
| Purchases | 4 |
| | — |
| | 35 |
| | 189 |
| | — |
| |
| — |
| | — |
| |
| — |
| |
| — |
| |
| Issuances | — |
| | — |
| | — |
| | — |
| | — |
| | — |
| | (68 | ) | (8 | ) | — |
| |
| — |
| |
| Settlements | (2 | ) | | — |
| | (64 | ) | | (46 | ) | | (116 | ) | |
| (1 | ) | | 18 |
| |
| 108 |
| | 8 |
| |
| FG VIE deconsolidations | — |
| | — |
| | — |
| | — |
| | (17 | ) | | — |
| | — |
| | 1 |
| | 16 |
| |
Fair value as of
December 31, 2018 | $ | 99 |
| | $ | 56 |
| | $ | 309 |
| | $ | 947 |
| | $ | 569 |
| |
| $ | 77 |
| | $ | (207 | ) | |
| $ | (517 | ) | | $ | (102 | ) | |
| Change in unrealized gains/(losses) included in earnings related to financial instruments held as of December 31, 2018 | | | | | | | | | $ | 13 |
| (2 | ) | $ | 14 |
| (3 | ) | $ | 122 |
| (6 | ) | $ | 1 |
| (2 | ) | $ | 3 |
| (2 | ) |
| Change in unrealized gains/(losses) included in OCI related to financial instruments held as of December 31, 2018 | $ | 18 |
| | $ | 3 |
| | $ | (14 | ) | | $ | (38 | ) | | | | $ | — |
| | | | $ | 2 |
| | | |
____________________
| |
| (1) | Included in net realized investment gains (losses) and net investment income. |
| |
| (2) | Included in fair value gains (losses) on FG VIEs. |
| |
| (3) | Recorded in net investment income and other income. |
| |
| (4) | Recorded in other income. |
| |
| (5) | Represents the net position of credit derivatives. Credit derivative assets (recorded in other assets) and credit derivative liabilities (presented as a separate line item) are shown as either assets or liabilities in the consolidated balance sheet based on net exposure by counterparty. |
| |
| (6) | Reported in net change in fair value of credit derivatives. |
| |
| (7) | Includes CCS and other invested assets. |
| |
| (8) | Relates to SGI Transaction. See Note 2, Business Combinations and Assumption of Insured Portfolio. |
Level 3 Fair Value Disclosures
Quantitative Information about Level 3 Fair Value Inputs
At December 31, 2019
|
| | | | | | | | | | | | | |
| Financial Instrument Description | | Fair Value at
December 31, 2019
(in millions) | | Significant Unobservable Inputs | | Range | | Weighted Average as a Percentage of Current Par Outstanding |
| Assets (2): | | |
| | | | | | | | |
| Fixed-maturity securities (1): | | |
| | | | | | | | |
| Obligations of state and political subdivisions | | $ | 107 |
| | Yield | | 4.5 | % | - | 31.1% | | 8.5% |
| | | | | | | | | | | |
| Corporate securities | | 41 |
| | Yield | | 35.9% | | |
| | | | | | | | | | | |
| RMBS | | 308 |
| | CPR | | 2.0 | % | - | 15.0% | | 6.3% |
| | | CDR | | 1.5 | % | - | 7.0% | | 4.9% |
| | | Loss severity | | 40.0 | % | - | 125.0% | | 78.8% |
| | | Yield | | 3.7 | % | - | 6.1% | | 4.8% |
| Asset-backed securities: | | | | | | | | | | |
| Life insurance transactions | | 350 |
| | Yield | | 5.8% | | |
| | | | | | | | | | | |
| CLOs/Trust preferred securities (TruPS) | | 256 |
| | Yield | | 2.5 | % | - | 4.1% | | 2.9% |
| | | | | | | | | | | |
| Others | | 52 |
| | Yield | | 2.3 | % | - | 9.4% | | 9.3% |
| | | | | | | | | | | |
| FG VIEs’ assets, at fair value (1) | | 442 |
| | CPR | | 0.1 | % | - | 18.6% | | 8.6% |
| | | CDR | | 1.2 | % | - | 24.7% | | 4.9% |
| | | Loss severity | | 40.0 | % | - | 100.0% | | 76.1% |
| | | Yield | | 3.0 | % | - | 8.4% | | 5.2% |
| | | | | | | | | | | |
| Assets of consolidated investment vehicles (3) | | 64 |
| | Discount rate | | 16.0 | % | - | 28.0% | | 21% |
| | | | Market multiple - enterprise/revenue value | | 0.5x |
| - | 6.7x | | |
| | | | | Yield | | 12.5% | | |
| | | | | | | | | | | |
| Other assets (1) | | 52 |
| | Implied Yield | | 5.1 | % | - | 5.8% | | 5.5% |
| | | Term (years) | | 10 years | | |
|
| | | | | | | | | | | | | |
| Financial Instrument Description(1) | | Fair Value at
December 31, 2019
(in millions) | | Significant Unobservable Inputs | | Range | | Weighted Average as a Percentage of Current Par Outstanding |
| Liabilities: | | |
| | | | | | | | |
| | | | | | | | | | | |
| Credit derivative liabilities, net | | $ | (185 | ) | | Year 1 loss estimates | | 0.0 | % | - | 46.0% | | 1.3% |
| | | Hedge cost (in basis points (bps)) | | 5.0 |
| - | 31.0 | | 11.0 |
| | | Bank profit (in bps) | | 51.0 |
| - | 212.0 | | 76.0 |
| | | Internal floor (in bps) | | 30.0 | | |
| | | Internal credit rating | | AAA |
| - | CCC | | AA- |
| | | | | | | | | | | |
| FG VIEs’ liabilities, at fair value | | (469 | ) | | CPR | | 0.1 | % | - | 18.6% | | 8.6% |
| | | CDR | | 1.2 | % | - | 24.7% | | 4.9% |
| | | Loss severity | | 40.0 | % | - | 100.0% | | 76.1% |
| | | Yield | | 2.7 | % | - | 8.4% | | 4.2% |
| | | | | | | | | | | |
| Liabilities of consolidated investment vehicles: | | | | | | | | | | |
| CLO obligations | | (481 | ) | | Yield | | 10.0% | | |
____________________
(1) Discounted cash flow is used as the primary valuation technique.
| |
| (2) | Excludes several investments recorded in other invested assets with fair value of $6 million. |
| |
| (3) | The primary inputs to the valuation are recent market transaction prices, supported by market multiples and yields/discount rates. |
Quantitative Information about Level 3 Fair Value Inputs
At December 31, 2018
|
| | | | | | | | | | | | | |
| Financial Instrument Description(1) | | Fair Value at
December 31, 2018
(in millions) | | Significant Unobservable Inputs | | Range | | Weighted Average as a Percentage of Current Par Outstanding |
| Assets (liabilities) (2): | | |
| | | | | | | | |
| Fixed-maturity securities : | | |
| | | | | | | | |
| Obligations of state and political subdivisions | | $ | 99 |
| | Yield | | 4.5 | % | - | 32.7% | | 12.0% |
| | | | | | | | | | | |
| Corporate securities | | 56 |
| | Yield | | 29.5% | | |
| | | | | | | | | | | |
| RMBS | | 309 |
| | CPR | | 3.4 | % | - | 19.4% | | 6.2% |
| | | CDR | | 1.5 | % | - | 6.9% | | 5.2% |
| | | Loss severity | | 40.0 | % | - | 125.0% | | 82.7% |
| | | Yield | | 5.3 | % | - | 8.1% | | 6.3% |
| Asset-backed securities: | | | | | | | | | | |
| Life insurance transactions | | 620 |
| | Yield | | 6.5 | % | - | 7.1% | | 6.8% |
| | | | | | | | | | | |
| CLOs/TruPS | | 274 |
| | Yield | | 3.8 | % | - | 4.7% | | 4.3% |
| | | | | | | | | | | |
| Others | | 53 |
| | Yield | | 11.5% | | |
| | | | | | | | | | | |
| FG VIEs’ assets, at fair value | | 569 |
| | CPR | | 0.9 | % | - | 18.1% | | 9.3% |
| | | CDR | | 1.3 | % | - | 23.7% | | 5.1% |
| | | Loss severity | | 60.0 | % | - | 100.0% | | 79.8% |
| | | Yield | | 5.0 | % | - | 10.2% | | 7.1% |
| | | | | | | | | | | |
| Other assets | | 74 |
| | Implied Yield | | 6.6 | % | - | 7.2% | | 6.9% |
| | | | Term (years) | | 10 years | | |
| | | |
| | | | | | | | |
| Credit derivative liabilities, net | | (207 | ) | | Year 1 loss estimates | | 0.0 | % | - | 66.0% | | 2.2% |
| | | Hedge cost (in bps) | | 5.5 |
| - | 82.5 | | 23.3 |
| | | Bank profit (in bps) | | 7.2 |
| - | 509.9 | | 77.3 |
| | | Internal floor (in bps) | | 8.8 |
| - | 30.0 | | 19.0 |
| | | Internal credit rating | | AAA |
| - | CCC | | AA- |
| | | | | | | | | | | |
| FG VIEs’ liabilities, at fair value | | (619 | ) | | CPR | | 0.9 | % | - | 18.1% | | 9.3% |
| | | CDR | | 1.3 | % | - | 23.7% | | 5.1% |
| | | Loss severity | | 60.0 | % | - | 100.0% | | 79.8% |
| | | Yield | | 5.0 | % | - | 10.2% | | 5.6% |
____________________
| |
| (1) | Discounted cash flow is used as the primary valuation technique for all financial instruments listed in this table. |
| |
| (2) | Excludes several investments recorded in other invested assets with fair value of $7 million. |
Not Carried at Fair Value
Financial Guaranty Insurance Contracts
For financial guaranty insurance contracts that are acquired in a business combination, the Company measures each contract at fair value on the date of acquisition, and then follows insurance accounting guidance on a recurring basis thereafter. On a quarterly basis, the Company also discloses the fair value of its outstanding financial guaranty insurance contracts. In both cases, fairFair value is based on management’s estimate of what a similarly rated financial guaranty insurance company would demand to acquire the Company’s in-force book of financial guaranty insurance business. It is based on a variety of factors that may include pricing assumptions management has observed for portfolio transfers, commutations, and acquisitions that have occurred in the financial guaranty market, as well as prices observed in the credit derivative market with an adjustment for illiquidity so that the terms would be similar to a financial guaranty insurance contract, and also includes adjustments to the carrying value of unearned premium reserve for stressed losses, ceding commissions and return on capital. The significant inputs were not readily observable. The Company accordingly classified thisthe fair value measurementof financial guaranty insurance contracts as Level 3.
Long-Term Debt
The Company’s long-termLong-term debt excluding notes payable,issued by AGUS and AGMH is valued by broker-dealers using third party independent pricing sources and standard market conventions.conventions and classified as Level 2 in the fair value hierarchy. The market conventions utilize market quotations, market transactions for the Company’s comparable instruments, and to a lesser extent, similar instruments in the broader insurance industry. The fair value measurement was classified as Level 2 in the fair value hierarchy.
The fair value of the notes payable was determined by calculating the present value of the expected cash flows. The fair value measurementflows, and was classified as Level 3 in the fair value hierarchy.
Other Invested Assets
The other invested assets not carried at fair value consist primarily of investments in a guaranteed investment contract. The fair value of the investments in the guaranteed investment contract approximated their carrying value due to their short term nature. The fair value measurement of the guaranteed investment contract was classified as Level 2 in the fair value hierarchy.
Other Assets and Other Liabilities
The Company’s other assets and other liabilities consist predominantly of accrued interest, receivables for securities sold and payables for securities purchased, the carrying values of which approximate fair value.
Financial Instruments Carried at Fair Value
Amounts recorded at fair value in the Company’s financial statements are presented in the tables below.
Fair Value Hierarchy of Financial Instruments Carried at Fair Value
As of December 31, 2016
|
| | | | | | | | | | | | | | | |
| | | | Fair Value Hierarchy |
| | Fair Value | | Level 1 | | Level 2 | | Level 3 |
| | (in millions) |
| Assets: | |
| | |
| | |
| | |
|
| Investment portfolio, available-for-sale: | |
| | |
| | |
| | |
|
| Fixed-maturity securities | |
| | |
| | |
| | |
|
| Obligations of state and political subdivisions | $ | 5,432 |
| | $ | — |
| | $ | 5,393 |
| | $ | 39 |
|
| U.S. government and agencies | 440 |
| | — |
| | 440 |
| | — |
|
| Corporate securities | 1,613 |
| | — |
| | 1,553 |
| | 60 |
|
| Mortgage-backed securities: | |
| | | | | | |
| RMBS | 987 |
| | — |
| | 622 |
| | 365 |
|
| CMBS | 583 |
| | — |
| | 583 |
| | — |
|
| Asset-backed securities | 945 |
| | — |
| | 140 |
| | 805 |
|
| Foreign government securities | 233 |
| | — |
| | 233 |
| | — |
|
| Total fixed-maturity securities | 10,233 |
|
| — |
| | 8,964 |
| | 1,269 |
|
| Short-term investments | 590 |
| | 319 |
| | 271 |
| | — |
|
| Other invested assets (1) | 8 |
| | — |
| | 0 |
| | 8 |
|
| Credit derivative assets | 13 |
| | — |
| | — |
| | 13 |
|
| FG VIEs’ assets, at fair value | 876 |
| | — |
| | — |
| | 876 |
|
| Other assets | 114 |
| | 24 |
| | 28 |
| | 62 |
|
| Total assets carried at fair value | $ | 11,834 |
| | $ | 343 |
| | $ | 9,263 |
| | $ | 2,228 |
|
| Liabilities: | |
| | |
| | |
| | |
|
| Credit derivative liabilities | $ | 402 |
| | $ | — |
| | $ | — |
| | $ | 402 |
|
| FG VIEs’ liabilities with recourse, at fair value | 807 |
| | — |
| | — |
| | 807 |
|
| FG VIEs’ liabilities without recourse, at fair value | 151 |
| | — |
| | — |
| | 151 |
|
| Total liabilities carried at fair value | $ | 1,360 |
| | $ | — |
| | $ | — |
| | $ | 1,360 |
|
Fair Value Hierarchy of Financial Instruments Carried at Fair Value
As of December 31, 2015
|
| | | | | | | | | | | | | | | |
| | | | Fair Value Hierarchy |
| | Fair Value | | Level 1 | | Level 2 | | Level 3 |
| | (in millions) |
| Assets: | |
| | |
| | |
| | |
|
| Investment portfolio, available-for-sale: | |
| | |
| | |
| | |
|
| Fixed-maturity securities | |
| | |
| | |
| | |
|
| Obligations of state and political subdivisions | $ | 5,841 |
| | $ | — |
| | $ | 5,833 |
| | $ | 8 |
|
| U.S. government and agencies | 400 |
| | — |
| | 400 |
| | — |
|
| Corporate securities | 1,520 |
| | — |
| | 1,449 |
| | 71 |
|
| Mortgage-backed securities: | |
| | |
| | |
| | |
|
| RMBS | 1,245 |
| | — |
| | 897 |
| | 348 |
|
| CMBS | 513 |
| | — |
| | 513 |
| | — |
|
| Asset-backed securities | 825 |
| | — |
| | 168 |
| | 657 |
|
| Foreign government securities | 283 |
| | — |
| | 283 |
| | — |
|
| Total fixed-maturity securities | 10,627 |
| | — |
| | 9,543 |
| | 1,084 |
|
| Short-term investments | 396 |
| | 305 |
| | 31 |
| | 60 |
|
| Other invested assets(1) | 12 |
| | — |
| | 5 |
| | 7 |
|
| Credit derivative assets | 81 |
| | — |
| | — |
| | 81 |
|
| FG VIEs’ assets, at fair value | 1,261 |
| | — |
| | — |
| | 1,261 |
|
| Other assets | 106 |
| | 23 |
| | 21 |
| | 62 |
|
| Total assets carried at fair value | $ | 12,483 |
| | $ | 328 |
| | $ | 9,600 |
| | $ | 2,555 |
|
| Liabilities: | |
| | |
| | |
| | |
|
| Credit derivative liabilities | $ | 446 |
| | $ | — |
| | $ | — |
| | $ | 446 |
|
| FG VIEs’ liabilities with recourse, at fair value | 1,225 |
| | — |
| | — |
| | 1,225 |
|
| FG VIEs’ liabilities without recourse, at fair value | 124 |
| | — |
| | — |
| | 124 |
|
| Total liabilities carried at fair value | $ | 1,795 |
| | $ | — |
| | $ | — |
| | $ | 1,795 |
|
____________________
| |
(1) | Excluded from the table above are investments funds of $48 million and $45 million as of December 31, 2016 and December 31, 2015, respectively, measured using NAV per share. Includes Level 3 mortgage loans that are recorded at fair value on a non-recurring basis. |
Changes in Level 3 Fair Value Measurements
The table below presents a roll forward of the Company’s Level 3 financial instruments carried at fair value on a recurring basis during the years ended December 31, 2016 and 2015.
Fair Value Level 3 Rollforward
Recurring Basis
Year Ended December 31,2016
|
| | | | | | | | | | | | | | | | | | | | | | | | | | | | | | | | | | | | | | | | | | | | | | | | | | |
| | Fixed-Maturity Securities | | | | | | | | | | | | | |
| | Obligations
of State and
Political
Subdivisions | | Corporate Securities | | RMBS | | Asset-
Backed
Securities | | Short-Term Investments | | FG VIEs’
Assets at
Fair
Value | | Other
Assets (8) | | Credit
Derivative
Asset
(Liability),
net (5) | | FG VIEs' Liabilities with Recourse,
at Fair
Value | | FG VIEs' Liabilities without Recourse,
at Fair
Value | |
| | (in millions) |
| Fair value as of December 31, 2015 | $ | 8 |
| | $ | 71 |
| | $ | 348 |
| | $ | 657 |
| |
| $ | 60 |
| | $ | 1,261 |
| |
| $ | 65 |
| |
| $ | (365 | ) | | $ | (1,225 | ) | | $ | (124 | ) | |
| CIFG Acquisition | 1 |
| | — |
| | 20 |
| | 36 |
| | 0 |
| | — |
| | — |
| | (67 | ) | | — |
| | — |
| |
| Total pretax realized and unrealized gains/(losses) recorded in: (1) | | | | | | | | |
| | | |
| |
| |
| |
| |
| |
| |
| |
| | |
| Net income (loss) | 2 |
| (2 | ) | (16 | ) | (2 | ) | 10 |
| (2 | ) | 51 |
| (2 | ) | 0 |
| (2 | ) | 167 |
| (3 | ) | 0 |
| (4 | ) | 74 |
| (6 | ) | (125 | ) | (3 | ) | (18 | ) | (3 | ) |
| Other comprehensive income (loss) | (4 | ) | | 5 |
| | (13 | ) | | 116 |
| |
| 0 |
| | — |
| |
| 0 |
| |
| — |
| |
| — |
| |
| — |
| |
| Purchases | 33 |
| | — |
| | 70 |
| | 76 |
| |
| — |
| | — |
| |
| — |
| |
| — |
| |
| — |
| |
| — |
| |
| Settlements | (1 | ) | | — |
| | (70 | ) | | (139 | ) | | (60 | ) | | (629 | ) | | — |
| |
| (31 | ) | |
| 597 |
| |
| 14 |
| |
| FG VIE consolidations | — |
| | — |
| | — |
| | — |
| |
| — |
| | 97 |
| |
| — |
| |
| — |
| |
| (54 | ) | | (43 | ) | |
| FG VIE deconsolidations | — |
| | — |
| | 0 |
| | — |
| | — |
| | (20 | ) | | — |
| | — |
| | — |
| | 20 |
| |
| Transfers into Level 3 | — |
| | — |
| | — |
| | 8 |
| | — |
| | — |
| | — |
| | — |
| | — |
| | — |
| |
| Fair value as of December 31, 2016 | $ | 39 |
| | $ | 60 |
| | $ | 365 |
| | $ | 805 |
| |
| $ | — |
| | $ | 876 |
| |
| $ | 65 |
| |
| $ | (389 | ) | | $ | (807 | ) | | $ | (151 | ) | |
| Change in unrealized gains/(losses) related to financial instruments held as of December 31, 2016 | $ | (4 | ) | | $ | 5 |
| | $ | (15 | ) | | $ | 116 |
| | $ | — |
| | $ | 93 |
| | $ | 0 |
| | $ | (33 | ) | | $ | (12 | ) | | $ | (17 | ) | |
Fair Value Level 3 Rollforward
Recurring Basis
Year Ended December 31, 2015
|
| | | | | | | | | | | | | | | | | | | | | | | | | | | | | | | | | | | | | | | | | | | | | | | | | | |
| | Fixed-Maturity Securities | | | | | | | | | | | | | |
| | Obligations
of State and
Political
Subdivisions | | Corporate Securities | | RMBS | | Asset-
Backed
Securities | | Short-Term Investments | | FG VIEs’
Assets at
Fair
Value | | Other
Assets (8) | | Credit
Derivative
Asset
(Liability),
net (5) | | FG VIEs' Liabilities with Recourse,
at Fair
Value | | FG VIEs' Liabilities without Recourse,
at Fair
Value | |
| | (in millions) | |
| Fair value as of December 31, 2014 | $ | 38 |
| | $ | 79 |
| | $ | 425 |
| | $ | 228 |
| | $ | — |
| | $ | 1,398 |
| |
| $ | 37 |
| | $ | (895 | ) | |
| $ | (1,277 | ) | | $ | (142 | ) | |
| Radian Asset Acquisition | — |
| | — |
| | 4 |
| | — |
| | — |
| | 122 |
| | 2 |
| | (215 | ) | | (114 | ) | | (4 | ) | |
| Total pretax realized and unrealized gains/(losses) recorded in: (1) | | | | | | | | | | | | |
| | | | |
| | |
| | |
| Net income (loss) | 3 |
| (2 | ) | 3 |
| (2 | ) | 18 |
| (2 | ) | 1 |
| (2 | ) | 24 |
| (2 | ) | 59 |
| (3 | ) | 26 |
| (4 | ) | 728 |
| (6 | ) | 111 |
| (3 | ) | (28 | ) | (3 | ) |
| Other comprehensive income (loss) | (2 | ) | | (11 | ) | | (12 | ) | | (9 | ) | | 0 |
| | — |
| |
| 0 |
| | — |
| |
| — |
| |
| — |
| |
| Purchases | — |
| | — |
| | 48 |
| | 471 |
| | 52 |
| (7 | ) | — |
| |
| — |
| | — |
| |
| — |
| |
| — |
| |
| Settlements | (31 | ) | (7 | ) | — |
| | (134 | ) | | (34 | ) | | (16 | ) | | (400 | ) | | — |
| | 17 |
| |
| 186 |
| |
| 28 |
| |
| FG VIE consolidations | — |
| | — |
| | (1 | ) | | — |
| | — |
| | 104 |
| |
| — |
| | — |
| |
| (131 | ) | | — |
| |
| FG VIE deconsolidations | — |
| | — |
| | — |
| | — |
| | — |
| | (22 | ) | | — |
| | — |
| | — |
| | 22 |
| |
| Fair value as of December 31, 2015 | $ | 8 |
| | $ | 71 |
| | $ | 348 |
| | $ | 657 |
| | $ | 60 |
| | $ | 1,261 |
| |
| $ | 65 |
| | $ | (365 | ) | |
| $ | (1,225 | ) | | $ | (124 | ) | |
| Change in unrealized gains/(losses) related to financial instruments held as of December 31, 2015 | $ | 0 |
| | $ | (11 | ) | | $ | (9 | ) | | $ | (9 | ) | | $ | 0 |
| | $ | 110 |
| | $ | 26 |
| | $ | 281 |
| | $ | 4 |
| | $ | (22 | ) | |
____________________
| |
(1) | Realized and unrealized gains (losses) from changes in values of Level 3 financial instruments represent gains (losses) from changes in values of those financial instruments only for the periods in which the instruments were classified as Level 3. |
| |
(2) | Included in net realized investment gains (losses) and net investment income. |
| |
(3) | Included in fair value gains (losses) on FG VIEs. |
| |
(4) | Recorded in fair value gains (losses) on CCS, net realized investment gains (losses), net investment income and other income. |
| |
(5) | Represents net position of credit derivatives. The consolidated balance sheet presents gross assets and liabilities based on net counterparty exposure. |
| |
(6) | Reported in net change in fair value of credit derivatives and other income. |
| |
(7) | Primarily non-cash transaction. |
| |
(8) | Includes CCS and other invested assets. |
Level 3 Fair Value Disclosures
Quantitative Information About Level 3 Fair Value Inputs
At December 31, 2016
|
| | | | | | | | | | | | | |
| Financial Instrument Description(1) | | Fair Value at December 31, 2016(in millions) | | Significant Unobservable Inputs | | Range | | Weighted Average as a Percentage of Current Par Outstanding |
| Assets (2): | | |
| | | | | | | | |
| Fixed-maturity securities: | | |
| | | | | | | | |
| Obligations of state and political subdivisions | | $ | 39 |
| | Yield | | 4.3 | % | - | 22.8% | | 11.1% |
| | | | | | | | | | | |
| Corporate securities | | 60 |
| | Yield | | 20.1% | | |
| | | | | | | | | | | |
| RMBS | | 365 |
| | CPR | | 1.6 | % | - | 17.0% | | 4.6% |
| | | CDR | | 1.5 | % | - | 10.1% | | 6.7% |
| | | Loss severity | | 30.0 | % | - | 100.0% | | 77.8% |
| | | Yield | | 3.3 | % | - | 9.7% | | 6.0% |
| Asset-backed securities: | | | | | | | | | | |
| Triple-X life insurance transactions | | 425 |
| | Yield | | 5.7 | % | - | 6.0% | | 5.8% |
| | | | | | | | | | | |
| Collateralized debt obligations (CDO) | | 332 |
| | Yield | | 10.0% | | |
| | | | | | | | | | | |
| CLO/TruPS | | 19 |
| | Yield | | 1.5 | % | - | 4.8% | | 3.1% |
| | | | | | | | | | | |
| Others | | 29 |
| | Yield | | 7.2% | | |
| | | | | | | | | | | |
| FG VIEs’ assets, at fair value | | 876 |
| | CPR | | 3.5 | % | - | 12.0% | | 7.8% |
| | | CDR | | 2.5 | % | - | 21.6% | | 5.7% |
| | | Loss severity | | 35.0 | % | - | 100.0% | | 78.6% |
| | | Yield | | 2.9 | % | - | 20.0% | | 6.5% |
| | | | | | | | | | | |
| Other assets | | 62 |
| | Implied Yield | | 4.5 | % | - | 5.1% | | 4.8% |
| | | Term (years) | | 10 years | | |
| Liabilities: | | |
| | | | | | | | |
| Credit derivative liabilities, net | | (389 | ) | | Year 1 loss estimates | | 0.0 | % | - | 38.0% | | 1.3% |
| | | Hedge cost (in bps) | | 7.2 |
| - | 118.1 | | 24.5 |
| | | Bank profit (in bps) | | 3.8 |
| - | 825.0 | | 61.8 |
| | | Internal floor (in bps) | | 7.0 |
| - | 100.0 | | 13.9 |
| | | Internal credit rating | | AAA |
| - | CCC | | AA+ |
| | | | | | | | | | | |
| FG VIEs’ liabilities, at fair value | | (958 | ) | | CPR | | 3.5 | % | - | 12.0% | | 7.8% |
| | | CDR | | 2.5 | % | - | 21.6% | | 5.7% |
| | | Loss severity | | 35.0 | % | - | 100.0% | | 78.6% |
| | | Yield | | 2.4 | % | - | 20.0% | | 5.0% |
____________________ | |
(1) | Discounted cash flow is used as valuation technique for all financial instruments. |
| |
(2) | Excludes several investments recorded in other invested assets with fair value of $8 million. |
Quantitative Information About Level 3 Fair Value Inputs
At December 31, 2015
|
| | | | | | | | | | | | | |
| Financial Instrument Description(1) | | Fair Value at December 31, 2015(in millions) | | Significant Unobservable Inputs | | Range | | Weighted Average as a Percentage of Current Par Outstanding |
| Assets (2): | | |
| | | | | | | | |
| Fixed-maturity securities (3): | | |
| | | | | | | | |
| Corporate securities | | $ | 71 |
| | Yield | | 21.8% | | |
| | | | | | | | | |
| | | | | | | | | | | |
| RMBS | | 348 |
| | CPR | | 0.3 | % | - | 9.0% | | 2.6% |
| | | CDR | | 2.7 | % | - | 9.3% | | 7.0% |
| | | Loss severity | | 60.0 | % | - | 100.0% | | 74.0% |
| | | Yield | | 4.7 | % | - | 8.2% | | 6.0% |
| Asset-backed securities: | | | | | | | | | | |
| Investor owned utility | | 69 |
| | Cash flow receipts | | 100.0% | | |
| | | Collateral recovery period | | 2.9 years | | |
| | | Discount factor | | 7.0% | | |
| | | | | | | | | | | |
| Triple-X life insurance transactions | | 329 |
| | Yield | | 3.5 | % | - | 7.5% | | 5.0% |
| | | | | | | | | | | |
| CDO | | 259 |
| | Yield | | 20.0% | | |
| | | | | | | | | | | |
| Short-term investments | | 60 |
| | Yield | | 17.0% | | |
| | | | | | | | | | | |
| FG VIEs’ assets, at fair value | | 1,261 |
| | CPR | | 0.3 | % | - | 9.2% | | 3.9% |
| | | CDR | | 1.2 | % | - | 16.0% | | 4.7% |
| | | Loss severity | | 40.0 | % | - | 100.0% | | 85.9% |
| | | Yield | | 1.9 | % | - | 20.0% | | 6.4% |
| | | | | | | | | | | |
| Other assets | | 62 |
| | Implied Yield | | 5.5 | % | - | 6.4% | | 5.9% |
| | | | Term (years) | | 5 years | | |
| Liabilities: | | |
| | | | | | | | |
| Credit derivative liabilities, net | | (365 | ) | | Year 1 loss estimates | | 0.0 | % | - | 41.0% | | 0.6% |
| | | Hedge cost (in bps) | | 32.8 |
| - | 282.0 | | 66.3 |
| | | Bank profit (in bps) | | 3.8 |
| - | 1,017.5 | | 110.8 |
| | | Internal floor (in bps) | | 7.0 |
| - | 100.0 | | 16.8 |
| | | Internal credit rating | | AAA |
| - | CCC | | AA+ |
| | | | | | | | | | | |
| FG VIEs’ liabilities, at fair value | | (1,349 | ) | | CPR | | 0.3 | % | - | 9.2% | | 3.9% |
| | | CDR | | 1.2 | % | - | 16.0% | | 4.7% |
| | | Loss severity | | 40.0 | % | - | 100.0% | | 85.9% |
| | | Yield | | 1.9 | % | - | 20.0% | | 5.6% |
____________________
| |
(1) | Discounted cash flow is used as valuation technique for all financial instruments. |
| |
(2) | Excludes several investments recorded in other invested assets with fair value of $7 million. |
| |
(3) | Excludes obligations of state and political subdivisions investments with fair value of $8 million. |
The carrying amount and estimated fair value of the Company’s financial instruments not carried at fair value are presented in the following table.
Fair Value of Financial Instruments Not Carried at Fair Value
|
| | | | | | | | | | | | | | | |
| | As of
December 31, 2016 | | As of
December 31, 2015 |
| | Carrying Amount | | Estimated Fair Value | | Carrying Amount | | Estimated Fair Value |
| | (in millions) |
| Assets: | |
| | |
| | |
| | |
|
| Fixed-maturity securities | $ | 10,233 |
| | $ | 10,233 |
| | $ | 10,627 |
| | $ | 10,627 |
|
| Short-term investments | 590 |
| | 590 |
| | 396 |
| | 396 |
|
| Other invested assets(1) | 146 |
| | 147 |
| | 150 |
| | 152 |
|
| Credit derivative assets | 13 |
| | 13 |
| | 81 |
| | 81 |
|
| FG VIEs’ assets, at fair value | 876 |
| | 876 |
| | 1,261 |
| | 1,261 |
|
| Other assets | 205 |
| | 205 |
| | 206 |
| | 206 |
|
| Liabilities: | |
| | |
| | |
| | |
|
| Financial guaranty insurance contracts(2) | 3,483 |
| | 8,738 |
| | 3,998 |
| | 8,712 |
|
| Long-term debt | 1,306 |
| | 1,546 |
| | 1,300 |
| | 1,512 |
|
| Credit derivative liabilities | 402 |
| | 402 |
| | 446 |
| | 446 |
|
| FG VIEs’ liabilities with recourse, at fair value | 807 |
| | 807 |
| | 1,225 |
| | 1,225 |
|
| FG VIEs’ liabilities without recourse, at fair value | 151 |
| | 151 |
| | 124 |
| | 124 |
|
| Other liabilities | 12 |
| | 12 |
| | 9 |
| | 9 |
|
|
| | | | | | | | | | | | | | | |
| | As of
December 31, 2019 | | As of
December 31, 2018 |
| | Carrying Amount | | Estimated Fair Value | | Carrying Amount | | Estimated Fair Value |
| | (in millions) |
| Assets (liabilities): | |
| | |
| | |
| | |
|
| Other invested assets | $ | 1 |
| | $ | 2 |
| | $ | 1 |
| | $ | 2 |
|
| Other assets (1) | 97 |
| | 97 |
| | 130 |
| | 130 |
|
| Financial guaranty insurance contracts (2) | (2,714 | ) | | (4,013 | ) | | (3,240 | ) | | (5,932 | ) |
| Long-term debt | (1,235 | ) | | (1,573 | ) | | (1,233 | ) | | (1,496 | ) |
| Other liabilities (1) | (14 | ) | | (14 | ) | | (12 | ) | | (12 | ) |
____________________
| |
| (1) | Includes investments not carried atThe Company's other assets and other liabilities consist predominantly of: accrued interest, management fees receivables, receivables for securities sold and payables for securities purchased, for which the carrying value approximates fair value, withand a carrying value of $93 million and $93 million as of December 31, 2016 and December 31, 2015, respectively. Excludes investments carried under the equity method.promissory note receivable. |
| |
| (2) | Carrying amount includes the assets and liabilities related to financial guaranty insurance contract premiums, losses, and salvage and subrogation and other recoverables net of reinsurance. |
The amounts and descriptions in the note relate to the Company's investments and cash other than those of the consolidated investment vehicles described in Note 14, Variable interest Entities.
Accounting Policy
The vast majority of the Company's investment portfolio consists of fixed-maturity and short-term investments, classified as available-for-sale at the time of purchase (approximately 98.8% based on fair value as of December 31, 2019), and therefore carried at fair value. Changes in fair value for other-than-temporarily-impaired securities are bifurcated between credit losses and non-credit changes in fair value. The credit loss on other-than-temporarily-impaired securities is recorded in the statement of operations and the non-credit component of the change in fair value of securities is recorded in OCI. For securities in an unrealized loss position where the Company has the intent to sell or it is more-likely-than-not that it will be required to sell the security before recovery, the entire impairment loss (i.e., the difference between the security's fair value and its amortized cost) is recorded in the consolidated statements of operations. Credit losses reduce the amortized cost of impaired securities. The amortized cost basis is adjusted for accretion and amortization (using the effective interest method) with a corresponding entry recorded in net investment income.
Realized gains and losses on sales of investments are determined using the specific identification method. Realized loss includes amounts recorded for other-than-temporary impairments (OTTI) on debt securities and the declines in fair value of securities for which the Company has the intent to sell the security or inability to hold until recovery of amortized cost.
For mortgage‑backed securities, other than loss mitigation securities, and any other holdings for which there is prepayment risk, prepayment assumptions are evaluated and revised as necessary. Any necessary adjustments due to changes in effective yields and maturities are recognized in net investment income using the retrospective method.
Loss mitigation securities are generally purchased at a discount and are accounted for based on their underlying investment type, excluding the effects of the Company’s insurance. Interest income on loss mitigation securities is recognized on a level yield basis over the remaining life of the security.
Short-term investments, which are those investments with a maturity of less than one year at time of purchase, are carried at fair value and include amounts deposited in money market funds.
Other invested assets primarily consist of equity method investments. The Company's equity method investments primarily consist of an investment in a renewable energy company, as well as investments in private equity funds and managed account investment advisors. Changes in the value of equity method investments are recorded in the consolidated statements of operations in "equity in earnings of investees." Other invested assets also includes other equity investments carried at fair value. Up until December 31, 2017, the change in fair value of preferred stock investments and certain other equity investments was recorded in OCI. Effective January 1, 2018, in accordance with ASU 2016-01, the change in fair value of these investments is recorded in other income in the consolidated statements of operations. In addition, in accordance with ASU 2016-01, the Company elected the new measurement alternative for equity securities that were accounted for under the cost method as of December 31, 2017 because they did not have a readily determinable fair value. Effective January 1, 2018, these equity securities are accounted at cost less any impairment, plus or minus the change resulting from observable price changes in orderly transactions for identical or a similar investment of the same issuer in the consolidated statements of operations.
Cash consists of cash on hand and demand deposits. As a result of the lag in reporting FG VIEs, cash and short-term investments do not reflect cash outflow to the holders of the debt issued by the FG VIEs for claim payments made by the Company's insurance subsidiaries to the consolidated FG VIEs until the subsequent reporting period.
Assessment for Other-Than Temporary Impairments
The Company has a formal review process to determine OTTI for securities in its investment portfolio where there is no intent to sell and it is not more-likely-than-not that it will be required to sell the security before recovery. Factors considered when assessing impairment include:
a decline in the market value of a security by 20% or more below amortized cost for a continuous period of at least six months;
a decline in the market value of a security for a continuous period of 12 months;
recent credit downgrades of the applicable security or the issuer by rating agencies;
the financial condition of the applicable issuer;
whether loss of investment principal is anticipated;
the impact of foreign exchange rates; and
whether scheduled interest payments are past due.
The Company assesses the ability to recover the amortized cost by comparing the net present value of projected future cash flows with the amortized cost of the security. If the security is in an unrealized loss position and its net present value is less than the amortized cost of the investment, an OTTI is recorded. The net present value is calculated by discounting the Company's estimate of projected future cash flows at the effective interest rate implicit in the debt security at the time of purchase. The Company's estimates of projected future cash flows are driven by assumptions regarding probability of default and estimates regarding timing and amount of recoveries associated with a default. The Company develops these estimates using information based on historical experience, credit analysis and market observable data, such as industry analyst reports and forecasts, sector credit ratings and other relevant data. For mortgage‑backed and asset backed securities, cash flow estimates also include prepayment and other assumptions regarding the underlying collateral such as default rates, recoveries and changes in value. The assumptions used in these projections require the use of significant management judgment. If management's assessment changes in the future, the Company may ultimately record a loss after having originally concluded that the decline in value was temporary.
In addition to the factors noted above, the Company also seeks advice from its outside investment managers.
Net Investment Income and Equity Method Investment Earnings
Net investment income is a function of the yield that the Company earns on invested assets and the size of the portfolio. Net investment income includes the income earned on fixed-maturity securities, short-term investments and other invested assets, other than investments accounted for under the equity method, which are recorded in equity in earnings of investees. The investment yield is a function of market interest rates at the time of investment as well as the type, credit quality and maturity of the invested assets. Accrued investment income, which is recorded in other assets, was $79 million and $91 million as of December 31, 2019 and December 31, 2018, respectively.
Net Investment Income
|
| | | | | | | | | | | |
| | Year Ended December 31, |
| | 2019 | | 2018 | | 2017 |
| | (in millions) |
| Income from securities managed by third parties | $ | 273 |
|
| $ | 297 |
|
| $ | 298 |
|
| Income from internally managed securities (1) | 114 |
| | 107 |
| | 128 |
|
| Gross investment income | 387 |
| | 404 |
| | 426 |
|
| Investment expenses | (9 | ) |
| (9 | ) |
| (9 | ) |
| Net investment income | $ | 378 |
| | $ | 395 |
| | $ | 417 |
|
____________________
| |
| (1) | Year ended December 31, 2017 included accretion on Zohar II Notes used as consideration for the MBIA UK Acquisition. See Note 2, Business Combinations and Assumption of Insured Portfolio. |
Realized Investment Gains (Losses)
The table below presents the components of net realized investment gains (losses).
Net Realized Investment Gains (Losses)
|
| | | | | | | | | | | |
| | Year Ended December 31, |
| | 2019 | | 2018 | | 2017 |
| | (in millions) |
| Gross realized gains on available-for-sale securities (1) | $ | 63 |
| | $ | 20 |
| | $ | 95 |
|
| Gross realized losses on available-for-sale securities | (5 | ) | | (12 | ) | | (12 | ) |
| Net realized gains (losses) on other invested assets | (1 | ) | | (1 | ) | | — |
|
| OTTI: | | | | | |
| Total OTTI | (29 | ) | | (35 | ) | | (33 | ) |
| Less: portion of OTTI recognized in OCI | 6 |
| | 4 |
| | 10 |
|
| Net OTTI recognized in net income (loss) (2) | (35 | ) | | (39 | ) | | (43 | ) |
| Net realized investment gains (losses) (3) | $ | 22 |
| | $ | (32 | ) | | $ | 40 |
|
____________________
| |
| (1) | Year ended December 31, 2017 included a gain on Zohar II Notes used as consideration for the MBIA UK Acquisition. See Note 2, Business Combinations and Assumption of Insured Portfolio. |
| |
| (2) | Net OTTI recognized in net income for 2019, 2018 and 2017 was attributable to securities purchased for loss mitigation and other risk management purposes and change in foreign exchange rates. |
| |
| (3) | Includes foreign currency gains (losses) of $(15) million, $1 million and $18 million for 2019, 2018 and 2017, respectively. |
The proceeds from sales of fixed-maturity securities classified as available-for-sale were $1,805 million, $1,180 million and $1,701 million for the years ended December 31, 2019, 2018 and 2017, respectively.
The Company recorded a gain on change in fair value of equity securities in other income of $27 million for the year ended December 31, 2018, which includes a gain of $31 million related to the Company's minority interest in the parent company of TMC Bonds LLC, which it sold in 2018. The loss on change in fair value of equity securities for the year ended December 31, 2019 was de minimis.
The following table presents the roll-forward of the credit losses on fixed-maturity securities for which the Company has recognized an OTTI and for which unrealized loss was recognized in OCI.
Roll Forward of Credit Losses
in the Investment Portfolio
|
| | | | | | | | | | | |
| | Year Ended December 31, |
| | 2019 | | 2018 | | 2017 |
| | (in millions) |
| Balance, beginning of period | $ | 185 |
| | $ | 162 |
| | $ | 134 |
|
| Additions for credit losses on securities for which an OTTI was not previously recognized | — |
| | — |
| | 13 |
|
| Reductions for securities sold and other settlements | (15 | ) | | — |
| | (4 | ) |
| Additions for credit losses on securities for which an OTTI was previously recognized | 16 |
| | 23 |
| | 19 |
|
| Balance, end of period | $ | 186 |
| | $ | 185 |
| | $ | 162 |
|
Investment Portfolio
As of December 31, 2019, the majority of the investment portfolio is managed by 6 outside managers (including Wasmer, Schroeder & Company LLC, in which the Company has a minority interest). The Company has established detailed guidelines regarding credit quality, exposure to a particular sector and exposure to a particular obligor within a sector. The managed portfolio must maintain a minimum average rating of A+ by S&P or A1 by Moody's.
The investment portfolio tables shown below include assets managed both externally and internally. The internally managed portfolio primarily consists of the Company's investments in securities for (i) loss mitigation purposes, (ii) other risk management purposes and (iii) other alternative investments that the Company believes present an attractive investment opportunity.
One of the Company's strategies for mitigating losses has been to purchase loss mitigation securities, at discounted prices. The Company also holds other invested assets that were obtained or purchased as part of negotiated settlements with insured counterparties or under the terms of the financial guaranties (other risk management assets).
Alternative investments include investing in both equity and debt securities. The Company has made minority investments in investment managers as part of its strategy of participating in that market and has also made other unrelated investments that it believes present attractive investment opportunities. In February 2017, the Company agreed to purchase up to $100 million of limited partnership interests in a fund that invests in the equity of private equity managers of which $86 million of the commitment was not funded as of December 31, 2019. In December 2019, the Company invested in a limited liability company that owns fuel cells.
The insurance subsidiaries currently intend to invest $500 million in Assured Investment Management funds plus additional amounts in other accounts managed by Assured Investment Management. As of December 31, 2019, the Insurance segment had committed capital to the 3 consolidated Assured Investment Management funds, of which $79 million has been drawn and invested by the respective Assured Investment Management funds and $114 million on the commitment remained outstanding. See Note 14. Variable Interest Entities. As of December 31, 2019, the uninvested portion is reflected in short-term investments in the table below.
Investment Portfolio
Carrying Value
|
| | | | | | | |
| | As of December 31, |
| | 2019 | | 2018 |
| | (in millions) |
| Fixed-maturity securities (1): | | | |
| Externally managed | $ | 7,978 |
| | $ | 8,909 |
|
| Internally managed | 876 |
| | 1,180 |
|
| Short-term investments | 1,268 |
| | 729 |
|
| Other invested assets-internally managed | | | |
| Equity method investments | 111 |
| | 47 |
|
| Other | 7 |
| | 8 |
|
| Total | $ | 10,240 |
| | $ | 10,873 |
|
____________________
| |
| (1) | 8.6% and 10.8% of fixed-maturity securities are rated BIG as of December 31, 2019 and December 31, 2018, respectively. |
Fixed-Maturity Securities and Short-Term Investments
by Security Type
As of December 31, 2019
|
| | | | | | | | | | | | | | | | | | | | | | | | | |
| Security Type | | Percent of Total(1) | | Amortized Cost | | Gross Unrealized Gains | | Gross Unrealized Losses | | Estimated Fair Value | | AOCI (2)
Pre-tax Gain
(Loss) on
Securities
with
OTTI | | Weighted Average Credit Rating (3) |
| | | (dollars in millions) |
| Fixed-maturity securities: | | |
| | |
| | |
| | |
| | |
| | |
| | |
| Obligations of state and political subdivisions | | 42 | % | | $ | 4,036 |
| | $ | 305 |
| | $ | (1 | ) | | $ | 4,340 |
| | $ | 40 |
| | AA- |
| U.S. government and agencies | | 1 |
| | 137 |
| | 10 |
| | — |
| | 147 |
| | — |
| | AA+ |
| Corporate securities | | 23 |
| | 2,137 |
| | 103 |
| | (19 | ) | | 2,221 |
| | (8 | ) | | A |
| Mortgage-backed securities(4): | | — |
| | | | | | |
| | | | |
| | |
| RMBS | | 8 |
| | 745 |
| | 37 |
| | (7 | ) | | 775 |
| | 8 |
| | A- |
| CMBS | | 4 |
| | 402 |
| | 17 |
| | — |
| | 419 |
| | — |
| | AAA |
| Asset-backed securities | | 7 |
| | 684 |
| | 38 |
| | (2 | ) | | 720 |
| | 16 |
| | BB+ |
| Non-U.S. government securities | | 2 |
| | 230 |
| | 7 |
| | (5 | ) | | 232 |
| | 3 |
| | AA |
| Total fixed-maturity securities | | 87 |
| | 8,371 |
| | 517 |
| | (34 | ) | | 8,854 |
| | 59 |
| | A+ |
| Short-term investments | | 13 |
| | 1,268 |
| | — |
| | — |
| | 1,268 |
| | — |
| | AAA |
| Total investment portfolio | | 100 | % | | $ | 9,639 |
| | $ | 517 |
| | $ | (34 | ) | | $ | 10,122 |
| | $ | 59 |
| | AA- |
Fixed-Maturity Securities and Short-Term Investments
by Security Type
As of December 31, 2018
|
| | | | | | | | | | | | | | | | | | | | | | | | | |
| Security Type | | Percent of Total(1) | | Amortized Cost | | Gross Unrealized Gains | | Gross Unrealized Losses | | Estimated Fair Value | | AOCI
Pre-tax Gain
(Loss) on
Securities
with
OTTI | | Weighted Average Credit Rating (3) |
| | | (dollars in millions) |
| Fixed-maturity securities: | | |
| | |
| | |
| | |
| | |
| | |
| | |
| Obligations of state and political subdivisions | | 45 | % | | $ | 4,761 |
| | $ | 168 |
| | $ | (18 | ) | | $ | 4,911 |
| | $ | 40 |
| | AA- |
| U.S. government and agencies | | 2 |
| | 167 |
| | 9 |
| | (1 | ) | | 175 |
| | — |
| | AA+ |
| Corporate securities | | 20 |
| | 2,175 |
| | 13 |
| | (52 | ) | | 2,136 |
| | (4 | ) | | A |
| Mortgage-backed securities(4): | | |
| | |
| | |
| | |
| | |
| | |
| | |
| RMBS | | 9 |
| | 999 |
| | 17 |
| | (34 | ) | | 982 |
| | (15 | ) | | A- |
| CMBS | | 5 |
| | 542 |
| | 4 |
| | (7 | ) | | 539 |
| | — |
| | AAA |
| Asset-backed securities | | 9 |
| | 942 |
| | 131 |
| | (5 | ) | | 1,068 |
| | 97 |
| | BB |
| Non-U.S. government securities | | 3 |
| | 298 |
| | 2 |
| | (22 | ) | | 278 |
| | — |
| | AA |
| Total fixed-maturity securities | | 93 |
| | 9,884 |
| | 344 |
| | (139 | ) | | 10,089 |
| | 118 |
| | A+ |
| Short-term investments | | 7 |
| | 729 |
| | — |
| | — |
| | 729 |
| | — |
| | AAA |
| Total investment portfolio | | 100 | % | | $ | 10,613 |
| | $ | 344 |
| | $ | (139 | ) | | $ | 10,818 |
| | $ | 118 |
| | A+ |
____________________
| |
| (1) | Based on amortized cost. |
| |
| (2) | Accumulated OCI (AOCI). |
| |
| (3) | Ratings represent the lower of the Moody’s and S&P classifications, except for bonds purchased for loss mitigation or risk management strategies, which use internal ratings classifications. The Company’s portfolio primarily consists of high-quality, liquid instruments. |
| |
| (4) | U.S. government-agency obligations were approximately 42% of mortgage backed securities as of December 31, 2019 and 48% as of December 31, 2018, based on fair value. |
The Company’s investment portfolio in tax-exempt and taxable municipal securities includes issuances by a wide number of municipal authorities across the U.S. and its territories.
The following tables present the fair value of the Company’s available-for-sale portfolio of obligations of state and political subdivisions as of December 31, 2019 and December 31, 2018 by state.
Fair Value of Available-for-Sale Portfolio of
Obligations of State and Political Subdivisions
As of December 31, 2019 (1)
|
| | | | | | | | | | | | | | | | | | | | | | |
| State | | State General Obligation | | Local General Obligation | | Revenue Bonds | | Total Fair Value | | Amortized Cost | | Average Credit Rating |
| | | (in millions) |
| California | | 68 |
| | 70 |
| | 380 |
| | $ | 518 |
| | 457 |
| | A |
| New York | | $ | 6 |
| | $ | 46 |
| | $ | 408 |
| | $ | 460 |
| | $ | 431 |
| | AA |
| Texas | | 23 |
| | 122 |
| | 287 |
| | 432 |
| | 404 |
| | AA |
| Washington | | 52 |
| | 69 |
| | 181 |
| | 302 |
| | 284 |
| | AA |
| Florida | | 8 |
| | 3 |
| | 233 |
| | 244 |
| | 229 |
| | A+ |
| Illinois | | 18 |
| | 53 |
| | 125 |
| | 196 |
| | 182 |
| | A |
| Massachusetts | | 71 |
| | — |
| | 115 |
| | 186 |
| | 171 |
| | AA |
| Pennsylvania | | 38 |
| | 4 |
| | 95 |
| | 137 |
| | 128 |
| | A+ |
| Georgia | | 11 |
| | 10 |
| | 92 |
| | 113 |
| | 104 |
| | AA- |
| District of Columbia | | 30 |
| | — |
| | 69 |
| | 99 |
| | 94 |
| | AA |
| All others | | 71 |
| | 172 |
| | 915 |
| | 1,158 |
| | 1,080 |
| | AA- |
| Total | | $ | 396 |
| | $ | 549 |
| | $ | 2,900 |
| | $ | 3,845 |
| | $ | 3,564 |
| | AA- |
Fair Value of Available-for-Sale Portfolio of
Obligations of State and Political Subdivisions
As of December 31, 2018 (1)
|
| | | | | | | | | | | | | | | | | | | | | | |
| State | | State General Obligation | | Local General Obligation | | Revenue Bonds | | Total Fair Value | | Amortized Cost | | Average Credit Rating |
| | | (in millions) |
| New York | | $ | 5 |
| | $ | 49 |
| | $ | 492 |
| | $ | 546 |
| | $ | 536 |
| | AA |
| Texas | | 19 |
| | 170 |
| | 344 |
| | 533 |
| | 520 |
| | AA |
| California | | 63 |
| | 77 |
| | 378 |
| | 518 |
| | 482 |
| | A |
| Washington | | 80 |
| | 81 |
| | 193 |
| | 354 |
| | 349 |
| | AA |
| Florida | | 8 |
| | 13 |
| | 220 |
| | 241 |
| | 236 |
| | A+ |
| Massachusetts | | 75 |
| | — |
| | 144 |
| | 219 |
| | 211 |
| | AA |
| Illinois | | 16 |
| | 55 |
| | 127 |
| | 198 |
| | 192 |
| | A |
| Pennsylvania | | 35 |
| | 5 |
| | 98 |
| | 138 |
| | 136 |
| | A+ |
| District of Columbia | | 41 |
| | — |
| | 92 |
| | 133 |
| | 131 |
| | AA |
| Georgia | | 10 |
| | 10 |
| | 94 |
| | 114 |
| | 110 |
| | AA- |
| All others | | 96 |
| | 210 |
| | 1,103 |
| | 1,409 |
| | 1,369 |
| | AA- |
| Total | | $ | 448 |
| | $ | 670 |
| | $ | 3,285 |
| | $ | 4,403 |
| | $ | 4,272 |
| | AA- |
____________________
| |
| (1) | Excludes $495 million and $508 million as of December 31, 2019 and 2018, respectively, of pre-refunded bonds, at fair value. The credit ratings are based on the underlying ratings and do not include any benefit from bond insurance. |
The revenue bond portfolio primarily consists of essential service revenue bonds issued by transportation authorities and other utilities, water and sewer authorities and universities.
Revenue Bonds
Sources of Funds
|
| | | | | | | | | | | | | | | | |
| | | As of December 31, 2019 | | As of December 31, 2018 |
| Type | | Fair Value | | Amortized Cost | | Fair Value | | Amortized Cost |
| | | (in millions) |
| Transportation | | $ | 916 |
| | $ | 835 |
| | $ | 967 |
| | $ | 925 |
|
| Higher education | | 488 |
| | 456 |
| | 557 |
| | 543 |
|
| Water and sewer | | 453 |
| | 422 |
| | 580 |
| | 566 |
|
| Tax backed | | 426 |
| | 397 |
| | 471 |
| | 458 |
|
| Healthcare | | 236 |
| | 220 |
| | 278 |
| | 270 |
|
| Municipal utilities | | 234 |
| | 212 |
| | 287 |
| | 267 |
|
| All others | | 147 |
| | 137 |
| | 145 |
| | 143 |
|
| Total | | $ | 2,900 |
| | $ | 2,679 |
| | $ | 3,285 |
| | $ | 3,172 |
|
The following tables summarize, for all fixed-maturity securities in an unrealized loss position, the aggregate fair value and gross unrealized loss by length of time the amounts have continuously been in an unrealized loss position.
Fixed-Maturity Securities
Gross Unrealized Loss by Length of Time
As of December 31, 2019
|
| | | | | | | | | | | | | | | | | | | | | | | |
| | Less than 12 months | | 12 months or more | | Total |
| | Fair Value | | Unrealized Loss | | Fair Value | | Unrealized Loss | | Fair Value | | Unrealized Loss |
| | (dollars in millions) |
| Obligations of state and political subdivisions | $ | 45 |
| | $ | (1 | ) | | $ | — |
| | $ | — |
| | $ | 45 |
| | $ | (1 | ) |
| U.S. government and agencies | 5 |
| | — |
| | 5 |
| | — |
| | 10 |
| | — |
|
| Corporate securities | 61 |
| | — |
| | 119 |
| | (19 | ) | | 180 |
| | (19 | ) |
| Mortgage-backed securities: | | | | | | | |
| |
|
| |
|
|
| RMBS | 10 |
| | — |
| | 75 |
| | (7 | ) | | 85 |
| | (7 | ) |
| CMBS | — |
| | — |
| | 4 |
| | — |
| | 4 |
| | — |
|
| Asset-backed securities | 24 |
| | — |
| | 183 |
| | (2 | ) | | 207 |
| | (2 | ) |
| Non-U.S. government securities | — |
| | — |
| | 56 |
| | (5 | ) | | 56 |
| | (5 | ) |
| Total | $ | 145 |
| | $ | (1 | ) | | $ | 442 |
| | $ | (33 | ) | | $ | 587 |
| | $ | (34 | ) |
| Number of securities | |
| | 57 |
| | |
| | 119 |
| | |
| | 176 |
|
| Number of securities with OTTI | |
| | 1 |
| | |
| | 7 |
| | |
| | 8 |
|
Fixed-Maturity Securities
Gross Unrealized Loss by Length of Time
As of December 31, 2018
|
| | | | | | | | | | | | | | | | | | | | | | | |
| | Less than 12 months | | 12 months or more | | Total |
| | Fair Value | | Unrealized Loss | | Fair Value | | Unrealized Loss | | Fair Value | | Unrealized Loss |
| | (dollars in millions) |
| Obligations of state and political subdivisions | $ | 195 |
| | $ | (4 | ) | | $ | 658 |
| | $ | (14 | ) | | $ | 853 |
| | $ | (18 | ) |
| U.S. government and agencies | 11 |
| | — |
| | 24 |
| | (1 | ) | | 35 |
| | (1 | ) |
| Corporate securities | 836 |
| | (19 | ) | | 522 |
| | (33 | ) | | 1,358 |
| | (52 | ) |
| Mortgage-backed securities: | |
| | |
| | |
| | |
| | | | |
| RMBS | 85 |
| | (2 | ) | | 447 |
| | (32 | ) | | 532 |
| | (34 | ) |
| CMBS | 111 |
| | (1 | ) | | 164 |
| | (6 | ) | | 275 |
| | (7 | ) |
| Asset-backed securities | 322 |
| | (4 | ) | | 38 |
| | (1 | ) | | 360 |
| | (5 | ) |
| Non-U.S. government securities | 83 |
| | (4 | ) | | 99 |
| | (18 | ) | | 182 |
| | (22 | ) |
| Total | $ | 1,643 |
| | $ | (34 | ) | | $ | 1,952 |
| | $ | (105 | ) | | $ | 3,595 |
| | $ | (139 | ) |
| Number of securities (1) | |
| | 417 |
| | |
| | 608 |
| | |
| | 997 |
|
| Number of securities with OTTI (1) | |
| | 22 |
| | |
| | 22 |
| | |
| | 42 |
|
___________________
| |
| (1) | The number of securities does not add across because lots consisting of the same securities have been purchased at different times and appear in both categories above (i.e., less than 12 months and 12 months or more). If a security appears in both categories, it is counted only once in the total column. |
Of the securities in an unrealized loss position for 12 months or more as of December 31, 2019 and December 31, 2018, 19 and 38 securities, respectively, had unrealized losses greater than 10% of book value. The total unrealized loss for these securities was $25 million as of December 31, 2019 and $43 million as of December 31, 2018. The Company considered the credit quality, cash flows, interest rate movements, ability to hold a security to recovery and intent to sell a security in determining whether a security had a credit loss. The Company has determined that the unrealized losses recorded as of December 31, 2019 and December 31, 2018 were not related to credit quality.
The amortized cost and estimated fair value of available-for-sale fixed-maturity securities by contractual maturity as of December 31, 2019 are shown below. Expected maturities will differ from contractual maturities because borrowers may have the right to call or prepay obligations with or without call or prepayment penalties.
Distribution of Fixed-Maturity Securities
by Contractual Maturity
As of December 31, 2019
|
| | | | | | | |
| | Amortized Cost | | Estimated Fair Value |
| | (in millions) |
| Due within one year | $ | 326 |
| | $ | 334 |
|
| Due after one year through five years | 1,538 |
| | 1,591 |
|
| Due after five years through 10 years | 2,022 |
| | 2,128 |
|
| Due after 10 years | 3,338 |
| | 3,607 |
|
| Mortgage-backed securities: | |
| | |
|
| RMBS | 745 |
| | 775 |
|
| CMBS | 402 |
| | 419 |
|
| Total | $ | 8,371 |
| | $ | 8,854 |
|
Based on fair value, investments and restricted assets that are either held in trust for the benefit of third party ceding insurers in accordance with statutory requirements, placed on deposit to fulfill state licensing requirements, or otherwise pledged or restricted totaled $280 million and $266 million, as of December 31, 2019 and December 31, 2018, respectively. The investment portfolio also contains securities that are held in trust by certain AGL subsidiaries or otherwise restricted for the benefit of other AGL subsidiaries in accordance with statutory and regulatory requirements in the amount of $1,502 million and $1,855 million, based on fair value as of December 31, 2019 and December 31, 2018, respectively.
No material investments of the Company were non-income producing for years ended December 31, 2019 and 2018, respectively.
| |
8.11. | Contracts Accounted for as Credit Derivatives |
The Company has a portfolio of financial guaranty contracts that meet the definition of a derivative in accordance with GAAP (primarily CDS). The credit derivativesderivative portfolio also includes interest rate swapsswaps.
Credit derivative transactions are governed by International Swaps and hedgesDerivatives Association, Inc. documentation and have certain characteristics that differ from financial guaranty insurance contracts. For example, the Company’s control rights with respect to a reference obligation under a credit derivative may be more limited than when the Company issues a financial guaranty insurance contract. In addition, there are more circumstances under which the Company may be obligated to make payments. Similar to a financial guaranty insurance contract, the Company would be obligated to pay if the obligor failed to make a scheduled payment of principal or interest in full. However, the Company may also be required to pay if the obligor becomes bankrupt or if the reference obligation were restructured if, after negotiation, those credit events are specified in the documentation for the credit derivative transactions. Furthermore, the Company may be required to make a payment due to an event that is unrelated to the performance of the obligation referenced in the credit derivative. If events of default or termination events specified in the credit derivative documentation were to occur, the non-defaulting or the non-affected party, which may be either the Company or the counterparty, depending upon the circumstances, may decide to terminate a credit derivative prior to maturity. In that case, the Company may be required to make a termination payment to its swap counterparty upon such termination. Absent such an event of default or termination event, the Company may not unilaterally terminate a CDS contract; however, the Company on other financial guarantors.occasion has mutually agreed with various counterparties to terminate certain CDS transactions.
Accounting Policy
Credit derivatives are recorded at fair value. Changes in fair value are recorded in “net change in fair value of credit derivatives” on the consolidated statement of operations. Realized gains (losses) and other settlements on credit derivatives include credit derivative premiums received and receivable for credit protection the Company has sold under its insured CDS contracts, premiums paid and payable for credit protection the Company has purchased, claims paid and payable and received and receivable related to insured credit events under these contracts, ceding commission expense or income and realized gains or losses related to their early termination. FairThe fair value of credit derivatives is reflected as either net assets or net liabilities determined on a contract by contract basis in the Company's consolidated balance sheets. See Note 7,9, Fair Value Measurement, for a discussion on the fair value methodology for credit derivatives.
Credit Derivative Net Par Outstanding by Sector
Credit derivative transactions are governed by ISDA documentation and have different characteristics from financial guaranty insurance contracts. For example, the Company’s control rights with respect to a reference obligation under a credit derivative may be more limited than when the Company issues a financial guaranty insurance contract. In addition, there are more circumstances under which the Company may be obligated to make payments. Similar to a financial guaranty insurance contract, the Company would be obligated to pay if the obligor failed to make a scheduled payment of principal or interest in
full. However, the Company may also be required to pay if the obligor becomes bankrupt or if the reference obligation were restructured if, after negotiation, those credit events are specified in the documentation for the credit derivative transactions. Furthermore, the Company may be required to make a payment due to an event that is unrelated to the performance of the obligation referenced in the credit derivative. If events of default or termination events specified in the credit derivative documentation were to occur, the non-defaulting or the non-affected party, which may be either the Company or the counterparty, depending upon the circumstances, may decide to terminate a credit derivative prior to maturity. In that case, the Company may be required to make a termination payment to its swap counterparty upon such termination. Absent such an event of default or termination event, the Company may not unilaterally terminate a CDS contract; however, the Company on occasion has mutually agreed with various counterparties to terminate certain CDS transactions.
The estimated remaining weighted average life of credit derivatives was 5.3 years at December 31, 2016 and 5.4 years at December 31, 2015. The components of the Company’s credit derivative net par outstanding are presented in the table below. The estimated remaining weighted average life of credit derivatives was 11.5 years and 11.6 years as of at December 31, 2019 and December 31, 2018, respectively.
Credit Derivatives (1)
|
| | | | | | | | | | | | |
| | | As of December 31, 2016 | | As of December 31, 2015 |
| Asset Type | | Net Par Outstanding | | Weighted Average Credit Rating | | Net Par Outstanding | | Weighted Average Credit Rating |
| | | (dollars in millions) |
| Pooled corporate obligations: | | |
| | | | |
| | |
| Collateralized loan obligations (CLO) /collateralized bond obligations | | $ | 2,022 |
| | AAA | | $ | 5,873 |
| | AAA |
| Synthetic investment grade pooled corporate | | 7,224 |
| | AAA | | 7,108 |
| | AAA |
| TruPS CDOs | | 1,179 |
| | BBB+ | | 3,429 |
| | A- |
| Market value CDOs of corporate obligations | | — |
| | -- | | 1,113 |
| | AAA |
| Total pooled corporate obligations | | 10,425 |
| | AAA | | 17,523 |
| | AAA |
| U.S. RMBS | | 1,142 |
| | AA- | | 1,526 |
| | A+ |
| CMBS | | — |
| | -- | | 530 |
| | AAA |
| Other | | 5,430 |
| | A+ | | 6,015 |
| | A |
| Total(1) | | $ | 16,997 |
| | AA+ | | $ | 25,594 |
| | AA+ |
|
| | | | | | | | | | | | | | | | |
| | | As of December 31, 2019 | | As of December 31, 2018 (2) |
| | | Net Par Outstanding | | Net Fair Value Asset (Liability) | | Net Par Outstanding | | Net Fair Value Asset (Liability) |
| | | (in millions) |
| | | | | | | | | |
| U.S public finance | | $ | 1,942 |
| | $ | (83 | ) | | $ | 1,783 |
| | $ | (65 | ) |
| Non-U.S public finance | | 2,676 |
| | (39 | ) | | 2,807 |
| | (51 | ) |
| U.S structured finance | | 1,206 |
| | (58 | ) | | 1,465 |
| | (85 | ) |
| Non-U.S structured finance | | 132 |
| | (5 | ) | | 127 |
| | (6 | ) |
| Total | | $ | 5,956 |
| | $ | (185 | ) | | $ | 6,182 |
| | $ | (207 | ) |
____________________
(1) Expected recoveries were $4 million as of December 31, 2019 and $2 million as of December 31, 2018.
| |
(1)(2) | The December 31, 2016 total amount includes $1.7 billion net par outstanding of credit derivatives from CIFG Acquisition.Prior year presentation has been conformed to the current year's presentation. |
Except for TruPS CDOs, the Company’s exposure to pooled corporate obligations is highly diversified in terms of obligors and industries. Most pooled corporate transactions are structured to limit exposure to any given obligor and industry. The majority of the Company’s pooled corporate exposure consists of CLO or synthetic pooled corporate obligations. Most of these CLOs have an average obligor size of less than 1% of the total transaction and typically restrict the maximum exposure to any one industry to approximately 10%. The Company’s exposure also benefits from embedded credit enhancement in the transactions which allows a transaction to sustain a certain level of losses in the underlying collateral, further insulating the Company from industry specific concentrations of credit risk on these deals.
The Company’s TruPS CDO asset pools are generally less diversified by obligors and industries than the typical CLO asset pool. Also, the underlying collateral in TruPS CDOs consists primarily of subordinated debt instruments such as TruPS issued by bank holding companies and similar instruments issued by insurance companies, real estate investment trusts and other real estate related issuers while CLOs typically contain primarily senior secured obligations. However, to mitigate these risks TruPS CDOs were typically structured with higher levels of embedded credit enhancement than typical CLOs.
The Company’s exposure to “Other” CDS contracts is also highly diversified. It includes $1.5 billion of exposure to one pooled infrastructure transaction comprising diversified pools of international infrastructure project transactions and loans to regulated utilities. These pools were all structured with underlying credit enhancement sufficient for the Company to attach at AAA levels at origination. The remaining $3.9 billion of exposure in “Other” CDS contracts comprises numerous deals across various asset classes, such as commercial receivables, international RMBS, infrastructure, regulated utilities and consumer receivables.
Distribution of Credit Derivative Net Par Outstanding by Internal Rating
|
| | | | | | | | | | | | | | |
| | | As of December 31, 2019 | | As of December 31, 2018 |
| Ratings | | Net Par Outstanding | | % of Total | | Net Par Outstanding | | % of Total |
| | | (dollars in millions) |
| AAA | | $ | 1,730 |
| | 29.0 | % | | $ | 1,813 |
| | 29.4 | % |
| AA | | 1,695 |
| | 28.5 |
| | 1,690 |
| | 27.3 |
|
| A | | 1,110 |
| | 18.6 |
| | 1,171 |
| | 18.9 |
|
| BBB | | 1,292 |
| | 21.7 |
| | 1,351 |
| | 21.9 |
|
| BIG (1) | | 129 |
| | 2.2 |
| | 157 |
| | 2.5 |
|
| Credit derivative net par outstanding | | $ | 5,956 |
| | 100.0 | % | | $ | 6,182 |
| | 100.0 | % |
|
| | | | | | | | | | | | | | |
| | | As of December 31, 2016 | | As of December 31, 2015 |
| Ratings | | Net Par Outstanding | | % of Total | | Net Par Outstanding | | % of Total |
| | | (dollars in millions) |
| AAA | | $ | 10,967 |
| | 64.6 | % | | $ | 14,808 |
| | 57.9 | % |
| AA | | 2,167 |
| | 12.7 |
| | 4,821 |
| | 18.8 |
|
| A | | 1,499 |
| | 8.8 |
| | 2,144 |
| | 8.4 |
|
| BBB | | 1,391 |
| | 8.2 |
| | 2,212 |
| | 8.6 |
|
| BIG | | 973 |
| | 5.7 |
| | 1,609 |
| | 6.3 |
|
| Credit derivative net par outstanding | | $ | 16,997 |
| | 100.0 | % | | $ | 25,594 |
| | 100.0 | % |
| |
| (1) | All BIG credit derivatives are U.S. RMBS transactions. |
Fair Value of Credit Derivatives
Net Change in Fair Value of Credit Derivatives Gain (Loss)Derivative Gains (Losses)
|
| | | | | | | | | | | |
| | Year Ended December 31, |
| | 2019 | | 2018 | | 2017 |
| | (in millions) |
| Realized gains on credit derivatives | $ | 8 |
| | $ | 9 |
| | $ | 17 |
|
| Net credit derivative losses (paid and payable) recovered and recoverable and other settlements | (35 | ) | | (25 | ) | | (27 | ) |
| Realized gains (losses) and other settlements | (27 | ) | | (16 | ) | | (10 | ) |
| Net unrealized gains (losses) | 21 |
| | 128 |
| | 121 |
|
| Net change in fair value of credit derivatives | $ | (6 | ) | | $ | 112 |
| | $ | 111 |
|
|
| | | | | | | | | | | |
| | Year Ended December 31, |
| | 2016 | | 2015 | | 2014 |
| | (in millions) |
| Realized gains on credit derivatives | $ | 56 |
| | $ | 63 |
| | $ | 73 |
|
| Net credit derivative losses (paid and payable) recovered and recoverable and other settlements | (27 | ) | | (81 | ) | | (50 | ) |
| Realized gains (losses) and other settlements | 29 |
| | (18 | ) | | 23 |
|
| Net unrealized gains (losses): | | | | | |
| Pooled corporate obligations | (16 | ) | | 147 |
| | (18 | ) |
| U.S. RMBS | 22 |
| | 396 |
| | 814 |
|
| CMBS | 0 |
| | 42 |
| | 2 |
|
| Other | 63 |
| | 161 |
| | 2 |
|
| Net unrealized gains (losses) | 69 |
| | 746 |
| | 800 |
|
| Net change in fair value of credit derivatives | $ | 98 |
| | $ | 728 |
| | $ | 823 |
|
Realized losses and other settlements for 2019 were primarily due to payments related to various U.S. structured finance transactions, including those for a final maturity paydown and for which there was an offsetting unrealized gain. Realized losses and other settlements for 2018 and 2017 were primarily due to a paydown of a U.S. structured finance transaction, for which there was an offsetting unrealized gain.
Terminations and Settlements
of Direct Credit Derivative Contracts
|
| | | | | | | | | | | |
| | Year Ended December 31, |
| | 2016 | | 2015 | | 2014 |
| | (in millions) |
| Net par of terminated credit derivative contracts | $ | 3,811 |
| | $ | 2,777 |
| | $ | 3,591 |
|
| Realized gains on credit derivatives | 20 |
| | 13 |
| | 1 |
|
| Net credit derivative losses (paid and payable) recovered and recoverable and other settlements | — |
| | (116 | ) | | (26 | ) |
| Net unrealized gains (losses) on credit derivatives | 103 |
| | 465 |
| | 546 |
|
During 2016, unrealized2019, non-credit impairment fair value gains were generated primarily as a result of price improvements on the underlying collateral of the Company's CDS. These unrealized fair value gains were partially offset by unrealized fair value losses resulting from wider implied net spreads driven by the decreased market cost to buy protection in AGC’s name during the period. For those CDS transactions that were pricing at or above their floor levels, when the cost of purchasing CDS protection on AGC, which management refers to as the CDS spread on AGC, decreased, the implied spreads that the Company would expect to receive on these transactions increased.
During 2018, non-credit impairment fair value gains were primarily generated by CDS terminations, in the U.S. RMBS and other sectors, run-off of CDS par and price improvements on the underlying collateral of the Company’s CDS. In addition, unrealized fair value gains were generated by the increase in credit given to the primary insurer on one of the Company's second-to-pay CDS policies during the period. The unrealized fair value gains were partially offset by unrealized fair value losses resulting from wider implied net spreads driven by the decreased cost to buy protection in AGC’s name, as the market cost of AGC’s credit protection decreased during the period.
During 2017, non-credit impairment fair value gains were primarily generated by CDS terminations, run-off of net par outstanding, and price improvements on the underlying collateral of the Company’s CDS. The majority of the CDS transactions that were terminated were as a result of settlement agreements with several CDS counterparties. The unrealized fair value gains were partially offset by unrealized losses resulting from wider implied net spreads across all sectors. The wider implied net spreads were primarily a result ofDuring 2017, the decreased cost to buy protection in AGC’s and AGM’s name, asspecifically the market cost of AGC’s and AGM’s credit protection decreased significantlyfive-year CDS spread, did not change materially during the period. These transactions were pricing at or above their floor levels (orperiod, and therefore did not have a material impact on the minimum rate at which the Company would consider assuming these risks based on historical experience); therefore when the cost of purchasing CDS protection on AGC and AGM, which management refers to as the CDS spread on AGC and AGM, decreased the implied spreads that the Company would expect to receive on these transactions increased.
During 2015,Company’s unrealized fair value gains were generated primarily as a result of CDS terminations. The Company reached a settlement agreement with one CDS counterparty to terminate five Alt-A first lien CDS transactions resulting in unrealized fair value gains of $213 million and was the primary driver of the unrealized fair value gains in the U.S. RMBS sector. The Company also terminated a CMBS transaction, a Triple-X life insurance securitization transaction, and a distressed middle market CLO securitization during the period and recognized unrealized fair value gains of $41 million, $99 million and $99 million, respectively. These were the primary drivers of the unrealized fair value gains in the CMBS, Other, and pooled corporate CLO sectors, respectively, during the period. The remainder of the fair value gains for the period were a result of tighter implied net spreads across all sectors. The tighter implied net spreads were primarily a result of the increased cost to buy protection in AGC’s and AGM’s name, particularly for the one year CDS spread. These transactions were pricing at or above their floor levels, therefore when the cost of purchasing CDS protectionlosses on AGC and AGM increased, the implied spreads that the Company would expect to receive on these transactions decreased. Finally, during 2015, there was a refinement in methodology to address an instance in a U.S. RMBS transaction where the Company now expects recoveries. This refinement resulted in approximately $49 million in fair value gains in 2015.CDS.
During 2014, unrealized fair value gains were generated primarily in the U.S. RMBS prime first lien, Option ARM and subprime sectors. This is primarily due to a significant unrealized fair value gain in the Option ARM and Alt-A first lien sector of approximately $543 million, as a result of the terminations of three large Alt-A first lien resecuritization transactions and one Option ARM first lien transaction during the period. In addition, there was an unrealized gain of approximately $346 million related to the change in index used to determine fair value during the fourth quarter of 2014. In the fourth quarter of 2014, new market indices were published on Option ARM and Alt-A first lien securitizations. As part of the Company’s normal review process the Company reviewed these indices and based upon the collateral make-up, collateral vintage, and collateral loss experience, determined it to be a better market indication for the Company’s Option ARM and Alt-A first lien securitizations. The unrealized fair value gains were partially offset by unrealized fair value losses generated by wider implied net spreads. The wider implied net spreads were primarily a result of the decreased cost to buy protection in AGC’s and AGM’s name, as the market cost of AGC's and AGM’s credit protection decreased during the period. These transactions were pricing at or above their floor levels (or the minimum rate at which the Company would consider assuming these risks based on historical experience); therefore when the cost of purchasing CDS protection on AGC and AGM decreased, the implied spreads that the Company would expect to receive on these transactions increased.
The impact of changes in credit spreads will vary based upon the volume, tenor, interest rates, and other market conditions at the time these fair values are determined. In addition, since each transaction has unique collateral and structural terms, the underlying change in fair value of each transaction may vary considerably. The fair value of credit derivative contracts also reflects the change in the Company’s own credit cost based on the price to purchase credit protection on AGC and AGM.AGC. The Company determines its own credit risk based on quoted CDS prices traded on the Company at each balance sheet date.
CDS Spread on AGC and AGM
Quoted price of CDS contract (in basis points)bps)
|
| | | | | | | | |
| | As of
December 31, 2019 | | As of
December 31, 2018 | | As of
December 31, 2017 |
| Five-year CDS spread | 41 |
| | 110 |
| | 163 |
|
| One-year CDS spread | 9 |
| | 22 |
| | 70 |
|
|
| | | | | | | | |
| | As of
December 31, 2016 | | As of
December 31, 2015 | | As of
December 31, 2014 |
| Five-year CDS spread: | | | | | |
| AGC | 158 |
| | 376 |
| | 323 |
|
| AGM | 158 |
| | 366 |
| | 325 |
|
| | | | | | |
| One-year CDS spread: | | | | | |
| AGC | 35 |
| | 139 |
| | 80 |
|
| AGM | 29 |
| | 131 |
| | 85 |
|
Fair Value of Credit DerivativesDerivative Assets (Liabilities)
and Effect of AGC and AGM
Credit SpreadsSpread
|
| | | | | | | |
| | As of
December 31, 2019 | | As of
December 31, 2018 |
| | (in millions) |
| Fair value of credit derivatives before effect of AGC credit spread | $ | (261 | ) | | $ | (407 | ) |
| Plus: Effect of AGC credit spread | 76 |
| | 200 |
|
| Net fair value of credit derivatives | $ | (185 | ) | | $ | (207 | ) |
|
| | | | | | | |
| | As of
December 31, 2016 | | As of
December 31, 2015 |
| | (in millions) |
| Fair value of credit derivatives before effect of AGC and AGM credit spreads | $ | (811 | ) | | $ | (1,448 | ) |
| Plus: Effect of AGC and AGM credit spreads | 422 |
| | 1,083 |
|
| Net fair value of credit derivatives | $ | (389 | ) | | $ | (365 | ) |
The fair value of CDS contracts at December 31, 2016,2019, before considering the implications ofbenefit applicable to AGC’s and AGM’s credit spreads, is a direct result of continuedthe relatively wide credit spreads in the fixed income security markets and ratings downgrades. The asset classes that remain most affected are TruPS and pooled corporate securities as well as 2005-2007 vintages of Alt-A, Option ARM and subprime RMBS deals. The mark to market benefit between December 31, 2016, and December 31, 2015, resulted primarily from several CDS terminations and a narrowing of credit spreads related to the Company's TruPS and U.S. RMBS obligations.
Management believes that the trading level of AGC’s and AGM’s credit spreads over the past several years has beencertain underlying credits generally due to the correlation between AGC’s and AGM’s risk profile and the current risk profilelong tenor of the broader financial markets, as well as the overall lack of liquidity in the CDS market. Offsetting the benefit attributable to AGC’s and AGM’s credit spread were higher credit spreads in the fixed income security markets. The higher credit spreads in the fixed income security market are due to the lack of liquidity in the high yield CDO, TruPS CDO, and CLO markets as well as continuing market concerns over the 2005-2007 vintages of RMBS.these credits.
The following table presents the fair value and the present value of expected claim payments or recoveries (i.e., net expected loss to be paid as described in Note 5)Collateral Posting for contracts accounted for as derivatives.
Net Fair Value and Expected Losses
of Credit Derivatives
|
| | | | | | | |
| | As of
December 31, 2016 | | As of
December 31, 2015 |
| | (in millions) |
| Fair value of credit derivative asset (liability), net | $ | (389 | ) | | $ | (365 | ) |
| Expected loss to be (paid) recovered | (10 | ) | | (16 | ) |
Ratings Sensitivities ofCertain Credit Derivative Contracts
Within the Company’s insured CDS portfolio, theThe transaction documentation with 1 counterparty for approximately $0.7 billion$180 million in CDS grossnet par insured as of December 31, 2016by the Company requires AGCthe Company to post eligible collateral, subject to a $180 million cap, to secure its obligationsobligation to make payments under such contracts. This constitutes a reduction of approximately $3.1 billion from the $3.8 billion subject to such a requirement as of December 31, 2015, primarily due to an agreement reached in May 2016 with a CDS counterparty reducing the collateral posting requirement with respect to that counterparty to zero. Eligible collateral is generally cash or U.S. government or agency securities; eligible collateral other than cash is valued at a discount to the face amount. As of December 31, 2019, AGC did not have to post collateral to satisfy these requirements.
For approximately $516 million gross par
Accounting Policy
In connection with the BlueMountain Acquisition, the FASB's new revenue recognition guidance, Topic 606 Revenue from Contracts with Customers (ASC 606), is applicable to the Company. Management, CLO and performance fees earned by Assured Investment Management are accounted for as contracts with customers. Under the guidance for contracts with customers, an entity is required to (a) identify the contract(s) with a customer, (b) identify the performance obligations in the contract, (c) determine the transaction price, (d) allocate the transaction price to the performance obligations in the contract, and (e) recognize revenue when (or as) the entity satisfies a performance obligation. In determining the transaction price, an entity may include variable consideration only to the extent that it is probable that a significant reversal in the amount of such contracts, AGC has negotiated caps such thatcumulative revenue recognized would not occur when the posting requirement cannot exceed a certain fixed amount, regardless ofuncertainty associated with the mark-to-market valuation ofvariable consideration is resolved.
Management and CLO fees are derived from providing professional services to manage investment funds and CLOs. Investment management services are satisfied over time as the exposure or the financial strength ratings of AGC. For such contracts, AGC need not postservices are provided and are typically based on a cash basis an aggregatepercentage of more than $500 million, although the value of the collateral postedclient’s assets under management. Performance fee revenue will fluctuate from period to period and may exceed such fixed amount dependingnot correlate with general market changes, since most of these fees are driven by absolute performance. Performance fee revenues are generated on certain management contracts when performance hurdles are achieved. Such fee revenues are recorded when the advance rate agreed withcontractual performance criteria have been met and when it is probable that a significant reversal of revenue recognized will not occur in future reporting periods. Given the counterpartyuniqueness of each fee arrangement, performance fee contracts are evaluated on an individual basis to determine the timing of revenue recognition.
Asset Management Fees
Management and CLO Fees
The Company receives a management fee in exchange for providing investment advisory and management services. These annual management fees are generally as follows.
Fees range from 0.70% to 2.00% per annum calculated on either the particular typebeginning of collateral posted.the month or quarter, or month-end NAV of the respective funds.
For the remaining approximately $174 million gross parCompany's management or servicing of such contracts, AGC could be required from timethe Assured Investment Management CLOs the Company receives, generally 0.35% to time to post additional collateral without such cap0.50% (combined senior investment management fee and subordinated investment management fee) per annum based on movementsNAV, and 20% per annum of the remaining interest proceeds and principal proceeds after the incentive management fee threshold has been satisfied. The portion of these fees that pertains to the investment by Assured Investment Management funds is typically rebated to the Assured Investment Management funds.
The Company may waive some or the entire management fee with respect to any investor. Certain current and former employees of the Company who have investments in the mark-to-market valuationAssured Investment Management funds are not charged any management fees.
Performance Fees
In accordance with the investment management agreements, and by serving as the general partner, managing member or managing general partner, the Company also receives performance fees. Annual performance fee rates are generally as follows:
Range from 10% to 20% of the underlying exposure. net profits in excess of the high-water mark for the respective fund, or
Range from 18% to 30% of the total cash received by investors in excess of certain benchmarks, or
30% of the net profits in excess of the high-water mark and a credit for management fees
Performance fees related to certain Assured Investment Management funds may be subject to future clawback and repayment. Determining the amount of performance fees to record is subject to qualitative and quantitative factors including where the fund is in its life-cycle, whether the Company has received or is entitled to receive performance fees and potential sales of fund investments. To the extent that performance fees have been received, but not earned, the company will recognize a liability for unearned revenue in the consolidated balance sheets. The general partner has the right, in its sole discretion, to
Asrequire certain Assured Investment Management funds to distribute to the general partner an amount equal to its presumed tax liability attributable to the allocated taxable income relating to performance fees with respect to such fiscal year and are contractually not subject to clawback. There were no tax distributions recorded during 2019.
The Company may waive some or all of the performance fees with respect to any investor. Certain current and former employees of the Company who have investments in the Assured Investment Management funds are not charged any performance fees.
The following table presents the sources of asset management fees since the BlueMountain Acquisition Date:
Asset Management Fees
|
| | | |
| | Year Ended
December 31, 2019 |
| | (in millions) |
| Management fees: | |
| CLOs (1) | $ | 3 |
|
| Opportunity funds | 2 |
|
| Wind-down funds | 13 |
|
| Total management fees | 18 |
|
| Performance fees | 4 |
|
| Total asset management fees | $ | 22 |
|
_____________________
| |
| (1) | Gross management fees from CLOs, before rebates were $11 million. |
The Company had management and performance fees receivable, which are included in other assets on the consolidated balance sheets, of $9 million as of December 31, 2016, the2019. The Company was posting approximately $116 million to secure its obligations under CDS, of which approximately $16 million related to the $174 million of gross par described above,had 0 unearned revenues as to which the obligation to collateralize is not capped. As of December 31, 2015,2019.
| |
| 13. | Goodwill and Other Intangible Assets |
Accounting Policy
Goodwill is attributable to the BlueMountain Acquisition in the Asset Management segment and represents the excess cost over identifiable net assets of an acquired business. The Company tests goodwill annually for impairment or more frequently if circumstances indicate an impairment may have occurred. The goodwill impairment analysis is performed at the reporting unit level which is equal to the Company's operating segment level. If, after assessing qualitative factors, the Company was posting approximately $305 million to securebelieves that it is more likely than not that the fair value of the reporting unit is less than its obligations under CDS, of which approximately $23 million related to $221 million of gross par as to which the obligation to collateralize was not capped. In February 2017,carrying amount, the Company terminated allwill evaluate impairment quantitatively to determine and record the amount of goodwill impairment as the excess of the carrying amount of the reporting unit over its remaining CDS contractsfair value. Inherent in such fair value determinations are certain judgments and estimates relating to future cash flows, including the Company’s interpretation of current economic indicators and market valuations, and assumptions about the Company’s strategic plans with one ofregard to its counterparties as to which it had a posting requirement (subject to a cap); the CDS contracts related to approximately $183 million gross par and $73 million of collateral posted, as December 31, 2016; and all the collateral is being returnedoperations. Due to the Company.uncertainties associated with such estimates, actual results could differ from such estimates.
The Company's finite-lived intangible assets consist primarily of contractual rights to earn future asset management fees from the acquired management and CLO contracts as well as a CLO distribution network. Such finite-lived intangible assets are recorded at fair value on the date of acquisition and amortized over their estimated useful lives.
The Company tests finite‑lived intangible assets for impairment if certain events occur or circumstances change indicating that the carrying amount of the intangible asset may not be recoverable. The Company evaluates impairment by comparing the estimated fair value attributable to the intangible asset being evaluated with its carrying amount. If an impairment is determined to exist by management, the Company accelerates amortization expense so that the carrying amount represents fair value.
The Company's indefinite-lived intangible assets consist of the value of insurance licenses acquired in prior business combinations. The Company assesses indefinite-lived intangible assets for impairment annually or more frequently if
Sensitivity to Changes in Credit Spreadcircumstances indicate an impairment may have occurred. If a qualitative assessment reveals that it is more-likely-than-not that the asset is impaired, the Company calculates an updated fair value.
The following table summarizes the estimated change in fair values oncarrying value for the net balance of the Company’s credit derivative positions assuming immediate parallel shifts in credit spreads on AGCCompany's goodwill and AGMother intangible assets:
Goodwill and on the risks that they both assume.Other Intangible Assets
Effect of Changes in Credit Spread
As of December 31, 2016
|
| | | | | | | | |
| Credit Spreads(1) | | Estimated Net Fair Value (Pre-Tax) | | Estimated Change in Gain/(Loss) (Pre-Tax) |
| | | (in millions) |
| 100% widening in spreads | | $ | (791 | ) | | $ | (402 | ) |
| 50% widening in spreads | | (590 | ) | | (201 | ) |
| 25% widening in spreads | | (490 | ) | | (101 | ) |
| 10% widening in spreads | | (430 | ) | | (41 | ) |
| Base Scenario | | (389 | ) | | — |
|
| 10% narrowing in spreads | | (351 | ) | | 38 |
|
| 25% narrowing in spreads | | (295 | ) | | 94 |
|
| 50% narrowing in spreads | | (203 | ) | | 186 |
|
|
| | | | | | | | | |
| | Weighted Average Amortization Period as of | | As of December 31 |
| | December 31, 2019 | | 2019 | | 2018 |
| | | | (in millions) |
| Goodwill (1) | | | $ | 117 |
| | $ | — |
|
| Finite-lived intangible assets: | | | | | |
| CLO contracts | 8.8 years | | 42 |
| | — |
|
| Investment management contracts | 4.5 years | | 24 |
| | — |
|
| CLO distribution network | 4.8 years | | 9 |
| | — |
|
| Trade name | 9.8 years | | 3 |
| | — |
|
| Favorable sublease | 4.2 years | | 1 |
| | — |
|
| Lease-related intangibles | 7.0 years | | 3 |
| | 3 |
|
| Finite-lived intangible assets, gross | 7.0 years | | 82 |
| | 3 |
|
| Accumulated amortization | | | (5 | ) | | (1 | ) |
| Finite-lived intangible assets, net | | | 77 |
| | 2 |
|
| Licenses (indefinite-lived) | | | 22 |
| | 22 |
|
| Total goodwill and other intangible assets | | | $ | 216 |
| | $ | 24 |
|
_________________________________________
| |
| (1) | Includes goodwill allocated to the effectsEuropean subsidiaries of spreads on both the underlying asset classes and the Company’s own credit spread.BlueMountain. The balance changes due to foreign currency translation. The amount of goodwill deductible for tax purposes was approximately $115 million as of December 31, 2019. |
Goodwill and substantially all finite-lived intangible assets relate to the Company’s acquisition of BlueMountain on October 1, 2019. To date, there have been 0 impairments of goodwill or intangible assets. Amortization expense, which is recorded in other operating expenses in the consolidated statements of operations, associated with finite-lived intangible assets was $3 million for the year ended December 31, 2019, and $1 million in 2017. For 2018, amortization expense was de minimis.
As of December 31, 2019, future annual amortization of finite-lived intangible assets for the years 2020 through 2024 and thereafter is estimated to be:
Estimated Future Amortization Expense
for Finite-Lived Intangible Assets
|
| | | | |
| | | As of December 31, 2019 |
| Year | | (in millions) |
| 2020 | $ | 13 |
|
| 2021 | 12 |
|
| 2022 | 11 |
|
| 2023 | 11 |
|
| 2024 | 10 |
|
| Thereafter | 20 |
|
| Total | $ | 77 |
|
| |
9.14. | Consolidated Variable Interest Entities |
BackgroundAccounting Policy
The types of entities the Company assesses for consolidation principally include (1) entities whose debt obligations the insurance subsidiaries insures in its financial guaranty business, and (2) investment vehicles such as collateralized financing entities and investment funds managed by the asset management subsidiaries, in which the Company has a variable interest. For each of these types of entities, the Company assesses whether it is the primary beneficiary. If the Company concludes that it is the primary beneficiary, it consolidates the VIE in the Company's financial statements and eliminates the effects of intercompany transactions with the insurance subsidiaries and intercompany transactions between consolidated VIEs.
The Company determines whether it is the primary beneficiary of a VIE at the time it becomes involved with a VIE and continuously reconsiders the conclusion at each reporting date. In determining whether it is the primary beneficiary, the Company evaluates its direct and indirect interests in the VIE. The primary beneficiary of a VIE is the enterprise that has both 1) the power to direct the activities of a VIE that most significantly impact the entity's economic performance; and 2) the obligation to absorb losses of the entity that could potentially be significant to the VIE or the right to receive benefits from the entity that could potentially be significant to the VIE.
Financial Guaranty Variable Interest Entities
The Company provides financial guaranties with respect to debt obligations of special purpose entities, including VIEs. Assured GuarantyVIEs but does not act as the servicer or collateral manager for any VIE obligations insuredguaranteed by its companies.insurance subsidiaries. The transaction structure generally provides certain financial protections to the Company. This financial protection can take several forms, the most common of which are overcollateralization, first loss protection (or subordination) and excess spread. In the case of overcollateralization (i.e., the principal amount of the securitized assets exceeds the principal amount of the structured finance obligations guaranteed by the Company), the structure allows defaults of the securitized assets before a default is experienced on the structured finance obligation guaranteed by the Company. In the case of first loss, the Company's financial guaranty insurance policy only covers a senior layer of losses experienced by multiple obligations issued by special purpose entities, includingthe VIEs. The first loss exposure with respect to the assets is either retained by the seller or sold off in the form of equity or mezzanine debt to other investors. In the case of excess spread, the financial assets contributed to special purpose entities, including VIEs, generate interest income that are in excess of the interest payments on the debt issued by the special purpose entity.VIE. Such excess spread is typically distributed through the transaction’s cash flow waterfall and may be used to create additional credit enhancement, applied to redeem debt issued by the special purpose entities, including VIEsVIE (thereby, creating additional overcollateralization), or distributed to equity or other investors in the transaction.
Assured Guaranty is not primarily liable for the debt obligations issued by the VIEs it insures and would only be required to make payments on those insured debt obligations in the event that the issuer of such debt obligations defaults on any principal or interest due and only for the amount of the shortfall. AGL’s and its Subsidiaries’subsidiaries’ creditors do not have any rights with regard to the collateral supporting the debt issued by the FG VIEs. Proceeds from sales, maturities, prepayments and interest from such underlying collateral may only be used to pay debt service on VIEFG VIEs’ liabilities. Net fair value gains and losses on FG VIEs are expected to reverse to zero0 at maturity of the VIEFG VIEs’ debt, except for net premiums received and net claims paid by Assured Guaranty under the financial guaranty insurance contract. The Company’s estimate of expected loss to be paid for FG VIEs is included in Note 5,6, Expected Loss to be Paid.
Accounting Policy
The Company evaluates whether it is the primary beneficiary of its VIEs. If the Company concludes that it is the primary beneficiary, it is required to consolidate the entire VIE in the Company's financial statements and eliminate the effects of the financial guaranty insurance contracts issued by AGM and AGC on the consolidated FG VIEs debt obligations.
The primary beneficiary of a VIE is the enterprise that has both 1) the power to direct the activities of a VIE that most significantly impact the entity's economic performance; and 2) the obligation to absorb losses of the entity that could potentially be significant to the VIE or the right to receive benefits from the entity that could potentially be significant to the VIE.
As part of the terms of its financial guaranty contracts, the Company, under its insurance contract, obtains certain protective rights with respect to the VIE that give the Company additional controls over a VIE. These protective rights are triggered by the occurrence of certain events, such as failure to be in compliance with a covenant due to poor deal performance or a deterioration in a servicer or collateral manager's financial condition. At deal inception, the Company typically is not deemed to control a VIE; however, once a trigger event occurs, the Company's control of the VIE typically increases. The Company continuously evaluates its power to direct the activities that most significantly impact the economic performance of VIEs that have debt obligations insured by the Company and, accordingly, where the Company is obligated to absorb VIE losses or receive benefits that could potentially be significant to the VIE. The Company obtains protective rights under its insurance contracts that give the Company additional controls over a VIE if there is either deterioration of deal performance or in the financial health of the deal servicer. The Company is deemed to be the control party for certain VIEs under GAAP, typically when its protective rights give it the power to both terminate and replace the deal servicer, which are characteristics specific to the Company's financial guaranty contracts. If the protective rights that could make the Company the control party have not been triggered, then the VIE is not consolidated. If the Company is deemed no longer to have those protective rights, the transactionVIE is deconsolidated.
The FG VIEs'VIEs’ liabilities that are insured by the Company are considered to be with recourse, because the Company guarantees the payment of principal and interest regardless of the performance of the related FG VIEs'VIEs’ assets. FG VIEs' VIEs’
liabilities that are not insured by the Company are considered to be without recourse, because the payment of principal and interest of these liabilities is wholly dependent on the performance of the FG VIEs'VIEs’ assets.
The Company has limited contractual rights to obtain the financial records of its consolidated FG VIEs. The FG VIEs do not prepare separate GAAP financial statements; therefore, the Company compiles GAAP financial information for them based on trustee reports prepared by and received from third parties. Such trustee reports are not available to the Company until approximately 30 days after the end of any given period. The time required to perform adequate reconciliations and analyses of the information in these trustee reports results in a one quarter lag in reporting the FG VIEs'VIEs’ activities. The Company records the fair value of FG VIEVIEs’ assets and liabilities based on modeled prices. The Company updates the model assumptions each reporting period for the most recent available information, which incorporates the impact of material events that may have occurred since the quarter lag date. The net change in the fair value of consolidated FG VIEVIEs’ assets and liabilities is recorded in "fair value gains (losses) on FG VIEs" in the consolidated statements of operations.operations, except for change in fair value of FG VIEs’ liabilities with recourse caused by changes in ISCR which is now separately presented in OCI, effective January 1, 2018. The inception to date change in fair value of the FG VIEs’ liabilities with recourse attributable to the ISCR is calculated by holding all current period assumptions constant for each security and isolating the effect of the change in the Company’s CDS spread from the most recent date of consolidation to the current period. In general, if the Company’s CDS spread tightens, more value will be assigned to the Company’s credit; however, if the Company’s CDS widens, less value is assigned to the Company’s credit. Interest income and interest expense are derived from the trustee reports and also included in “fair"fair value gains (losses) on FG VIEs.”" The Company has elected the fair value option for assets and liabilities classified as FG VIEs'VIEs’ assets and liabilities because the carrying amount transition method was not practical.
The cash flows generated by the FG VIE assets, including R&W recoveries, are classified as cash flows from investing activities. Paydowns of FG liabilities are supported by the cash flows generated by FG VIE assets, and for liabilities with recourse, possibly claim payments made by AGM or AGC under its financial guaranty insurance contracts. Paydowns of FG liabilities both with and without recourse are classified as cash flows used in financing activities by the Company. Interest income, interest expense and other expenses of the FG VIE assets and liabilities are classified as operating cash flows. Claim payments made by AGC and AGM under the financial guaranty contracts issued to the FG VIEs are eliminated upon consolidation and therefore such claim payments are treated as paydowns of FG VIE liabilities as a financing activity as opposed to an operating activity of AGM and AGC.
Consolidated FG VIEs
Number of FG VIEs Consolidated
|
| | | | | | | | |
| | Year Ended December 31, |
| | 2019 | | 2018 | | 2017 |
| | |
| Beginning of year | 31 |
| | 32 |
| | 32 |
|
| Consolidated | 1 |
| | — |
| | 2 |
|
| Deconsolidated | (3 | ) | | (1 | ) | | (2 | ) |
| Matured | (2 | ) | | — |
| | — |
|
| December 31 | 27 |
| | 31 |
| | 32 |
|
|
| | | | | | | | |
| | Year Ended December 31, |
| | 2016 | | 2015 | | 2014 |
| | |
| Beginning of the period, December 31 | 34 |
| | 32 |
| | 40 |
|
| Radian Asset Acquisition | — |
| | 4 |
| | — |
|
| Consolidated(1) | 1 |
| | 1 |
| | 2 |
|
| Deconsolidated(1) | (2 | ) | | (1 | ) | | (8 | ) |
| Matured | (1 | ) | | (2 | ) | | (2 | ) |
| End of the period, December 31 | 32 |
| | 34 |
| | 32 |
|
____________________
| |
(1) | Net loss on consolidation and deconsolidation was de minimis in 2016. Net loss on consolidation was $26 million in 2015. Net gain on deconsolidation was $120 million and net loss on consolidation was $26 million in 2014.
|
The total unpaid principal balance for the FG VIEs’ assets that were over 90 days or more past due was approximately $137 million at December 31, 2016 and $154 million at December 31, 2015. The aggregate unpaid principal of the FG VIEs’ assets was approximately $432 million greater than the aggregate fair value at December 31, 2016. The aggregate unpaid principal of the FG VIEs’ assets was approximately $804 million greater than the aggregate fair value at December 31, 2015, excluding the effect of R&W settlements. The change in the instrument-specific credit riskISCR of the FG VIEs’ assets held as of December 31, 20162019 that was recorded in the consolidated statements of operations for 2016 were gains2019 was a gain of $55$39 million. The change in the instrument-specific credit riskISCR of the FG VIEs’ assets held aswas a gain of December 31, 2015 that was recorded in the consolidated statements$7 million for 2018 and a gain of operations$35 million for 2015 were gains of $90 million. The change in the instrument-specific credit risk of the FG VIEs’ assets for 2014 were gains of $116 million.2017. To calculate ISCR, the instrument specific credit risk, the changeschange in the fair value of the FG VIEVIEs’ assets areis allocated between changes that are due to the instrument specific credit riskISCR and changes due to other factors, including interest rates. The instrument specific credit riskISCR amount is determined by using expected contractual cash flows versusat the original date of consolidation discounted at the effective yield less current expected cash flows discounted at that same original contractual rate. The net present value is calculated by discounting the expected cash flows of the underlying security, at the relevant effective interest rate.yield.
|
| | | | | | | |
| | As of
December 31, 2019 | | As of
December 31, 2018 |
| | (in millions) |
| Excess of unpaid principal over fair value of: | | | |
| FG VIEs' assets | $ | 279 |
| | $ | 350 |
|
| FG VIEs' liabilities with recourse | 21 |
| | 48 |
|
| FG VIEs' liabilities without recourse | 19 |
| | 28 |
|
| Unpaid principal balance for FG VIEs’ assets that were 90 days or more past due | 52 |
| | 71 |
|
| Unpaid principal for FG VIEs’ liabilities with recourse (1) | 388 |
| | 565 |
|
____________________
(1) FG VIE liabilities with recourse, which represent obligations insured by AGC or AGM, was $871 million and $1,436 million as of December 31, 2016 and December 31, 2015, respectively. FG VIEVIEs’ liabilities with recourse will mature at various dates ranging from 20252019 to 2038. The aggregate unpaid principal balance of the FG VIE
liabilities with and without recourse was approximately $109 million greater than the aggregate fair value of the FG VIEs’ liabilities as of December 31, 2016. The aggregate unpaid principal balance was approximately $423 million greater than the aggregate fair value of the FG VIEs’ liabilities as of December 31, 2015.
The table below shows the carrying value of the consolidated FG VIEs’ assets and liabilities in the consolidated financial statements, segregated by the types of assets that collateralize theirthe respective debt obligations for FG VIEVIEs’ liabilities with recourse.
Consolidated FG VIEs
By Type of Collateral
|
| | | | | | | | | | | | | | | |
| | As of December 31, 2019 | | As of December 31, 2018 |
| | Assets | | Liabilities | | Assets | | Liabilities |
| | (in millions) |
| With recourse: | |
| | |
| | |
| | |
|
| U.S. RMBS first lien | $ | 270 |
| | $ | 297 |
| | $ | 299 |
| | $ | 326 |
|
| U.S. RMBS second lien | 70 |
| | 70 |
| | 115 |
| | 137 |
|
| Manufactured housing | — |
| | — |
| | 53 |
| | 54 |
|
| Total with recourse | 340 |
| | 367 |
| | 467 |
| | 517 |
|
| Without recourse | 102 |
| | 102 |
| | 102 |
| | 102 |
|
| Total | $ | 442 |
| | $ | 469 |
| | $ | 569 |
| | $ | 619 |
|
Consolidated Investment Vehicles
Through a jointly owned subsidiary, AGM, AGC and MAC, the U.S. insurance subsidiaries, initially intend to invest $500 million in Assured Investment Management funds. In the fourth quarter of 2019, $79 million was invested in three separate Assured Investment Management funds; AHP, ABIF and CLO Warehouse Fund. As of December 31, 2019, the fair value of such investments was $77 million. CLO Warehouse Fund invested in the subordinated notes of CLO XXVI.
AHP, ABIF, CLO Warehouse Fund and CLO XXVI (collectively, the consolidated investment vehicles) are VIEs. The Company consolidates these investment vehicles as it is deemed to be the primary beneficiary based on its power to direct the most significant activities of each VIE (through its Assured Investment Management asset management subsidiaries) and its level of economic interest in the entities (through its U.S. insurance subsidiaries).
AHP and ABIF are investment companies under ASC 946, and therefore account for their underlying investments at fair value. CLO XXVI is a CFE under ASC 810. Under the ASC 810 practical expedient for CFEs, the Company elected to measure CLO XXVI's assets and liabilities using the fair value of its assets, which are more observable. Changes in the fair value of assets and liabilities of consolidated investment vehicles are recorded in "other income" in the consolidated statement of operations.
As a result of consolidating AHP, ABIF and CLO Warehouse Fund, the Company records noncontrolling interest (NCI) for the portion of each fund owned by employees and any third party investors. As of December 31, 2019, redeemable employee-owned NCI, held in ABIF and CLO Warehouse Fund, is classified outside of stockholder’s equity, within temporary equity. For AHP, nonredeemable NCI is presented within shareholders' equity in the consolidated balance sheets.
The assets and liabilities of the Company's consolidated investment vehicles (which include consolidated funds: AHP, ABIF and CLO Warehouse Fund as well as CLO XXVI) are held within separate legal entities. The assets of the consolidated investment vehicles are not available to creditors of the Company, other than creditors of the applicable consolidated investment vehicles. In addition, creditors of the consolidated investment vehicles have no recourse against the assets of the Company, other than the assets of such applicable consolidated investment vehicles.
Generally, the consolidation of the Company's consolidated investment vehicles and FG VIEs has a significant gross-up effect on the Company's assets, liabilities and cash flows. The consolidated investment vehicles have no net effect on the net income attributable to the Company, other than the economic interest the Company holds in consolidated funds in the Company's Insurance segment. The ownership interests of the Company's consolidated funds, to which the Company has no economic rights, are reflected as either redeemable or nonredeemable NCI in the consolidated funds in the Company's consolidated financial statements. Liquidity available at the Company's consolidated investment vehicles is typically not available for corporate liquidity needs, except to the extent of the Company's investment in the fund.
Assets and Liabilities
of Consolidated Investment Vehicles
|
| | | | | | | | | | | | | | | |
| | As of December 31, 2016 | | As of December 31, 2015 |
| | Assets | | Liabilities | | Assets | | Liabilities |
| | (in millions) |
| With recourse: | |
| | |
| | |
| | |
|
| U.S. RMBS first lien | $ | 473 |
| | $ | 509 |
| | $ | 506 |
| | $ | 521 |
|
| U.S. RMBS second lien | 178 |
| | 223 |
| | 194 |
| | 273 |
|
| Life insurance | — |
| | — |
| | 347 |
| | 347 |
|
| Manufactured housing | 74 |
| | 75 |
| | 84 |
| | 84 |
|
| Total with recourse | 725 |
| | 807 |
| | 1,131 |
| | 1,225 |
|
| Without recourse | 151 |
| | 151 |
| | 130 |
| | 124 |
|
| Total | $ | 876 |
| | $ | 958 |
| | $ | 1,261 |
| | $ | 1,349 |
|
|
| | | |
| | As of
December 31, 2019 |
| | (in millions) |
| Assets: | |
| Cash and restricted cash (1) | $ | 14 |
|
| Corporate loans of CFE, at fair value | 494 |
|
| Corporate loans, at fair value | 47 |
|
| Other assets (2) | 17 |
|
| Total assets | $ | 572 |
|
| Liabilities: | |
| CLO obligations of CFE, at fair value (3) | $ | 481 |
|
| Other liabilities | 1 |
|
| Total liabilities | $ | 482 |
|
____________________
| |
| (1) | Cash held by consolidated investment vehicles are not available to fund the general liquidity needs of the Company. |
| |
| (2) | Includes investment in affiliates of $9 million. |
| |
| (3) | The weighted average maturity and weighted average interest rate of CLO obligations were 12.8 years and 3.8%, respectively. CLO obligations will mature in 2032. |
As of December 31, 2019, the consolidated investment vehicles had a commitment to invest $13 million.
Redeemable Noncontrolling Interests in Consolidated Investment Vehicles
|
| | | |
| | Year Ended December 31, 2019 |
| | (in millions) |
| Beginning balance | $ | — |
|
| Contributions to investment vehicles | 12 |
|
| Distributions from investment vehicles | (4 | ) |
| Net loss | (1 | ) |
| December 31, | $ | 7 |
|
Interest income and interest expense are included in "other income." Investment purchases and sales for all consolidated investment vehicles are classified as operating activities, debt issuances and repayments are classified in financing activities.
Effect of Consolidating VIEs
The consolidationeffect on the statements of operations and financial condition of consolidating FG VIEs affects net income and shareholders' equity due toincludes (i) changes in fair value gains (losses) on FG VIEVIEs’ assets and liabilities, (ii) the elimination of premiums and losses related to the AGC and AGM FG VIEVIEs’ liabilities with recourse and (iii) the elimination of investment balances related to the Company’s purchase of AGC and AGM insured FG VIEVIEs’ debt. Upon consolidation of a FG VIE, the related insurance and, if applicable, the related investment balances, are considered intercompany transactions and therefore eliminated. Such eliminations are included in the table below to present the full effect of consolidating FG VIEs.
The effect on the statements of operations and balance sheets of consolidating Assured Investment Management investment vehicles includes (i) changes in fair value of consolidated investment vehicles, (2) the elimination of the equity in earnings in investees related to the Insurance segment's investments in the consolidated Assured Investment Management funds, (3) the elimination of debt of the consolidated CLO against the assets of the consolidated CLO Warehouse Fund, and (4) the recording of NCI for the proportion of each consolidated Assured Investment Management fund that is not owned by any other subsidiary of the Company.
The cash flows generated by the FG VIEs’ assets are classified as cash flows from investing activities. Paydowns of FG VIEs' liabilities are supported by the cash flows generated by FG VIEs’ assets, and for liabilities with recourse, possibly claim payments made by AGM or AGC under its financial guaranty insurance contracts. Paydowns of FG VIEs' liabilities both with and without recourse are classified as cash flows used in financing activities. Interest income, interest expense and other expenses of the FG VIEs’ assets and liabilities are classified as operating cash flows. Claim payments made by AGC and AGM under the financial guaranty contracts issued to the FG VIEs are eliminated upon consolidation and therefore such claim payments are treated as paydowns of FG VIEs’ liabilities as a financing activity as opposed to an operating activity of AGM and AGC.
Cash flows of the consolidated investment vehicles attributable to such entities' investment purchases and dispositions, as well as operating expenses of the investment vehicles are presented as cash flow from operating activities in the consolidated statement of cash flows. Financing activities and capital cash flows to and from investors are presented as financing activities consistent with investment company guidelines.
Effect of Consolidating VIEs
on the Consolidated Balance Sheets
Increase (Decrease)
|
| | | | | | | |
| | As of
December 31, 2019 | | As of
December 31, 2018 |
| | (in millions) |
| Assets | | | |
| Investment portfolio: | | | |
| Fixed maturity securities and short-term investments | $ | (39 | ) | | $ | (38 | ) |
| Equity method investments (1) | (77 | ) | | — |
|
| Total investments | (116 | ) | | (38 | ) |
| Premiums receivable, net of commissions payable | (7 | ) | | (9 | ) |
| Salvage and subrogation recoverable | (8 | ) | | (1 | ) |
| FG VIEs’ assets, at fair value | 442 |
| | 569 |
|
| Assets of consolidated investment vehicles (1) | 572 |
| | — |
|
| Total assets | $ | 883 |
| | $ | 521 |
|
| Liabilities and shareholders’ equity | | | |
| Unearned premium reserve | $ | (39 | ) | | $ | (51 | ) |
| Loss and LAE reserve | (41 | ) | | (48 | ) |
| FG VIEs’ liabilities with recourse, at fair value | 367 |
| | 517 |
|
| FG VIEs’ liabilities without recourse, at fair value | 102 |
| | 102 |
|
| Liabilities of consolidated investment vehicles (1) | 482 |
| | — |
|
| Total liabilities | 871 |
| | 520 |
|
| | | | |
| Redeemable noncontrolling interests in consolidated investment vehicles (1) | 7 |
| | — |
|
| | | | |
| Retained earnings | 34 |
| | 34 |
|
| Accumulated other comprehensive income | (35 | ) | | (33 | ) |
| Total shareholders’ equity attributable to Assured Guaranty Ltd. | (1 | ) | | 1 |
|
| Nonredeemable noncontrolling interests (1) | 6 |
| | — |
|
| Total shareholders’ equity | 5 |
| | 1 |
|
| Total liabilities, redeemable noncontrolling interests and shareholders’ equity | $ | 883 |
| | $ | 521 |
|
____________________
| |
| (1) | These line items represent the components of the effect of consolidating Assured Investment Management investment vehicles. |
Effect of Consolidating FG VIEs
on Net Income,the Consolidated Statements of Operations
Cash Flows From Operating Activities and Shareholders’ EquityIncrease (Decrease)
|
| | | | | | | | | | | |
| | Year Ended December 31, |
| | 2016 | | 2015 | | 2014 |
| | (in millions) |
| Net earned premiums | $ | (16 | ) | | $ | (21 | ) | | $ | (32 | ) |
| Net investment income | (10 | ) | | (32 | ) | | (11 | ) |
| Net realized investment gains (losses) | 1 |
| | 10 |
| | (5 | ) |
| Fair value gains (losses) on FG VIEs | 38 |
| | 38 |
| | 255 |
|
| Bargain purchase gain | — |
| | 2 |
| | — |
|
| Loss and LAE | 7 |
| | 28 |
| | 30 |
|
| Other income (loss) | 0 |
| | 0 |
| | (2 | ) |
| Effect on income before tax | 20 |
| | 25 |
| | 235 |
|
| Less: tax provision (benefit) | 7 |
| | 8 |
| | 82 |
|
| Effect on net income (loss) | $ | 13 |
| | $ | 17 |
| | $ | 153 |
|
| | | | | | |
| Effect on cash flows from operating activities | $ | 24 |
| | $ | 43 |
| | $ | 68 |
|
|
| | | | | | | | | | | |
| | Year Ended December 31, |
| | 2019 | | 2018 | | 2017 |
| | (in millions) |
| Net earned premiums | $ | (18 | ) | | $ | (12 | ) | | $ | (15 | ) |
| Net investment income | (4 | ) | | (4 | ) | | (5 | ) |
| Fair value gains (losses) on FG VIEs (1) | 42 |
| | 14 |
| | 30 |
|
| Other income (loss) (2) | (3 | ) | | — |
| | — |
|
| Loss and LAE | (20 | ) | | (3 | ) | | 7 |
|
| Equity in net earnings of investees | 2 |
| | — |
| | — |
|
| Effect on income before tax | (1 | ) | | (5 | ) | | 17 |
|
| Less: Tax provision (benefit) | — |
| | (1 | ) | | 6 |
|
| Effect on net income (loss) | (1 | ) | | (4 | ) | | 11 |
|
| Effect on redeemable noncontrolling interests | (1 | ) | | — |
| | — |
|
| Effect on net income (loss) attributable to AGL | $ | — |
| | $ | (4 | ) | | $ | 11 |
|
____________________
| |
| (1) | See consolidated statements of comprehensive income and Note 22, Other Comprehensive Income, for information on changes in fair value of the FG VIEs’ liabilities with recourse that are attributable to changes in the Company's own credit risk. |
| |
| (2) | Represents change in fair value of consolidated investment vehicles. |
Effect of Consolidating VIEs
on Consolidated Statements of Cash Flows
Inflows (Outflows)
|
| | | | | | | |
| | As of
December 31, 2016 | | As of
December 31, 2015 |
| | (in millions) |
| Effect on shareholders’ equity (decrease) increase | $ | (9 | ) | | $ | (23 | ) |
|
| | | | | | | | | | | |
| | Year Ended December 31, |
| | 2019 | | 2018 | | 2017 |
| | (in millions) |
| Effect on cash flows from operating activities | $ | (254 | ) | | $ | 11 |
| | $ | 19 |
|
| Effect on cash flows from investing activities | 259 |
| | 105 |
| | 138 |
|
| Effect on cash flows from financing activities | 9 |
| | (116 | ) | | (157 | ) |
| Total effect on cash flows | $ | 14 |
| | $ | — |
| | $ | — |
|
FairFor 2019, the fair value gains (losses) on FG VIEs representwere attributable to higher recoveries on second lien U.S. RMBS FG VIEs' assets. For 2018 and 2017, the net change in fair value on the consolidated FG VIEs’ assets and liabilities. In 2016, the Company recorded a pre-tax net fair value gain on consolidated FG VIEs of $38 million. The primary driver of the 2016 gain in fair value of FG VIEVIEs’ assets and FG VIEs’ liabilities was net mark-to-market gains due to price appreciationan increase in the value of the FG VIEs’ assets resulting from improvementsimprovement in the underlying collateral of HELOC RMBS assets of the FG VIEs.
In 2015, the Company recorded a pre-tax netcollateral. The change in fair value gain onof consolidated FG VIEsinvestment vehicles was a loss of $38$3 million which was primarily driven by price appreciation on the Company's FG VIE assets duringfor the year that resulted from improvements in the underlying collateral, as well as large principal paydowns made on the Company's FG VIEs.ended December 31, 2019.
In 2014, the Company recorded a pre-tax net fair value gain on consolidated FG VIEs of $255 million. The primary driver of this gain, $120 million, was a result of the deconsolidation of seven VIEs. There was an additional gain of $37 million resulting from the Company exercising its option to accelerate two second lien RMBS VIEs. These two VIEs were treated as maturities during the period. The remainder of the gain for the period was driven by the price appreciation on the Company's FG VIE assets during the year resulting from improvements in the underlying collateral, as well as large principal paydowns made on the Company's FG VIEs.
Other Consolidated VIEsRevenue Bonds
In certain instances where the Company consolidates a VIE that was established as partSources of a loss mitigation negotiated settlement agreement that results in the termination of the original insured financial guaranty insurance or credit derivative contract the Company classifies the assets and liabilities of those VIEs in the line items that most accurately reflect the nature of the items, as opposed to within the FG VIE assets and FG VIE liabilities.
Non-Consolidated VIEsFunds
|
| | | | | | | | | | | | | | | | |
| | | As of December 31, 2019 | | As of December 31, 2018 |
| Type | | Fair Value | | Amortized Cost | | Fair Value | | Amortized Cost |
| | | (in millions) |
| Transportation | | $ | 916 |
| | $ | 835 |
| | $ | 967 |
| | $ | 925 |
|
| Higher education | | 488 |
| | 456 |
| | 557 |
| | 543 |
|
| Water and sewer | | 453 |
| | 422 |
| | 580 |
| | 566 |
|
| Tax backed | | 426 |
| | 397 |
| | 471 |
| | 458 |
|
| Healthcare | | 236 |
| | 220 |
| | 278 |
| | 270 |
|
| Municipal utilities | | 234 |
| | 212 |
| | 287 |
| | 267 |
|
| All others | | 147 |
| | 137 |
| | 145 |
| | 143 |
|
| Total | | $ | 2,900 |
| | $ | 2,679 |
| | $ | 3,285 |
| | $ | 3,172 |
|
The following tables summarize, for all fixed-maturity securities in an unrealized loss position, the aggregate fair value and gross unrealized loss by length of time the amounts have continuously been in an unrealized loss position.
Fixed-Maturity Securities
Gross Unrealized Loss by Length of Time
As of December 31, 20162019
|
| | | | | | | | | | | | | | | | | | | | | | | |
| | Less than 12 months | | 12 months or more | | Total |
| | Fair Value | | Unrealized Loss | | Fair Value | | Unrealized Loss | | Fair Value | | Unrealized Loss |
| | (dollars in millions) |
| Obligations of state and political subdivisions | $ | 45 |
| | $ | (1 | ) | | $ | — |
| | $ | — |
| | $ | 45 |
| | $ | (1 | ) |
| U.S. government and agencies | 5 |
| | — |
| | 5 |
| | — |
| | 10 |
| | — |
|
| Corporate securities | 61 |
| | — |
| | 119 |
| | (19 | ) | | 180 |
| | (19 | ) |
| Mortgage-backed securities: | | | | | | | |
| |
|
| |
|
|
| RMBS | 10 |
| | — |
| | 75 |
| | (7 | ) | | 85 |
| | (7 | ) |
| CMBS | — |
| | — |
| | 4 |
| | — |
| | 4 |
| | — |
|
| Asset-backed securities | 24 |
| | — |
| | 183 |
| | (2 | ) | | 207 |
| | (2 | ) |
| Non-U.S. government securities | — |
| | — |
| | 56 |
| | (5 | ) | | 56 |
| | (5 | ) |
| Total | $ | 145 |
| | $ | (1 | ) | | $ | 442 |
| | $ | (33 | ) | | $ | 587 |
| | $ | (34 | ) |
| Number of securities | |
| | 57 |
| | |
| | 119 |
| | |
| | 176 |
|
| Number of securities with OTTI | |
| | 1 |
| | |
| | 7 |
| | |
| | 8 |
|
Fixed-Maturity Securities
Gross Unrealized Loss by Length of Time
As of December 31, 2018
|
| | | | | | | | | | | | | | | | | | | | | | | |
| | Less than 12 months | | 12 months or more | | Total |
| | Fair Value | | Unrealized Loss | | Fair Value | | Unrealized Loss | | Fair Value | | Unrealized Loss |
| | (dollars in millions) |
| Obligations of state and political subdivisions | $ | 195 |
| | $ | (4 | ) | | $ | 658 |
| | $ | (14 | ) | | $ | 853 |
| | $ | (18 | ) |
| U.S. government and agencies | 11 |
| | — |
| | 24 |
| | (1 | ) | | 35 |
| | (1 | ) |
| Corporate securities | 836 |
| | (19 | ) | | 522 |
| | (33 | ) | | 1,358 |
| | (52 | ) |
| Mortgage-backed securities: | |
| | |
| | |
| | |
| | | | |
| RMBS | 85 |
| | (2 | ) | | 447 |
| | (32 | ) | | 532 |
| | (34 | ) |
| CMBS | 111 |
| | (1 | ) | | 164 |
| | (6 | ) | | 275 |
| | (7 | ) |
| Asset-backed securities | 322 |
| | (4 | ) | | 38 |
| | (1 | ) | | 360 |
| | (5 | ) |
| Non-U.S. government securities | 83 |
| | (4 | ) | | 99 |
| | (18 | ) | | 182 |
| | (22 | ) |
| Total | $ | 1,643 |
| | $ | (34 | ) | | $ | 1,952 |
| | $ | (105 | ) | | $ | 3,595 |
| | $ | (139 | ) |
| Number of securities (1) | |
| | 417 |
| | |
| | 608 |
| | |
| | 997 |
|
| Number of securities with OTTI (1) | |
| | 22 |
| | |
| | 22 |
| | |
| | 42 |
|
___________________
| |
| (1) | The number of securities does not add across because lots consisting of the same securities have been purchased at different times and appear in both categories above (i.e., less than 12 months and 12 months or more). If a security appears in both categories, it is counted only once in the total column. |
Of the securities in an unrealized loss position for 12 months or more as of December 31, 2019 and December 31, 2015,2018, 19 and 38 securities, respectively, had unrealized losses greater than 10% of book value. The total unrealized loss for these securities was $25 million as of December 31, 2019 and $43 million as of December 31, 2018. The Company considered the credit quality, cash flows, interest rate movements, ability to hold a security to recovery and intent to sell a security in determining whether a security had a credit loss. The Company has determined that the unrealized losses recorded as of December 31, 2019 and December 31, 2018 were not related to credit quality.
The amortized cost and estimated fair value of available-for-sale fixed-maturity securities by contractual maturity as of December 31, 2019 are shown below. Expected maturities will differ from contractual maturities because borrowers may have the right to call or prepay obligations with or without call or prepayment penalties.
Distribution of Fixed-Maturity Securities
by Contractual Maturity
As of December 31, 2019
|
| | | | | | | |
| | Amortized Cost | | Estimated Fair Value |
| | (in millions) |
| Due within one year | $ | 326 |
| | $ | 334 |
|
| Due after one year through five years | 1,538 |
| | 1,591 |
|
| Due after five years through 10 years | 2,022 |
| | 2,128 |
|
| Due after 10 years | 3,338 |
| | 3,607 |
|
| Mortgage-backed securities: | |
| | |
|
| RMBS | 745 |
| | 775 |
|
| CMBS | 402 |
| | 419 |
|
| Total | $ | 8,371 |
| | $ | 8,854 |
|
Based on fair value, investments and restricted assets that are either held in trust for the benefit of third party ceding insurers in accordance with statutory requirements, placed on deposit to fulfill state licensing requirements, or otherwise pledged or restricted totaled $280 million and $266 million, as of December 31, 2019 and December 31, 2018, respectively. The investment portfolio also contains securities that are held in trust by certain AGL subsidiaries or otherwise restricted for the benefit of other AGL subsidiaries in accordance with statutory and regulatory requirements in the amount of $1,502 million and $1,855 million, based on fair value as of December 31, 2019 and December 31, 2018, respectively.
No material investments of the Company hadwere non-income producing for years ended December 31, 2019 and 2018, respectively.
| |
| 11. | Contracts Accounted for as Credit Derivatives |
The Company has a portfolio of financial guaranty contracts that meet the definition of a derivative in accordance with GAAP (primarily CDS). The credit derivative portfolio also includes interest rate swaps.
Credit derivative transactions are governed by International Swaps and Derivatives Association, Inc. documentation and have certain characteristics that differ from financial guaranty insurance contracts. For example, the Company’s control rights with respect to a reference obligation under a credit derivative may be more limited than when the Company issues a financial guaranty insurance contract. In addition, there are more circumstances under which the Company may be obligated to make payments. Similar to a financial guaranty insurance contract, the Company would be obligated to pay if the obligor failed to make a scheduled payment of principal or interest in full. However, the Company may also be required to pay if the obligor becomes bankrupt or if the reference obligation were restructured if, after negotiation, those credit events are specified in the documentation for the credit derivative transactions. Furthermore, the Company may be required to make a payment due to an event that is unrelated to the performance of the obligation referenced in the credit derivative. If events of default or termination events specified in the credit derivative documentation were to occur, the non-defaulting or the non-affected party, which may be either the Company or the counterparty, depending upon the circumstances, may decide to terminate a credit derivative prior to maturity. In that case, the Company may be required to make a termination payment to its swap counterparty upon such termination. Absent such an event of default or termination event, the Company may not unilaterally terminate a CDS contract; however, the Company on occasion has mutually agreed with various counterparties to terminate certain CDS transactions.
Accounting Policy
Credit derivatives are recorded at fair value. Changes in fair value are recorded in “net change in fair value of credit derivatives” on the consolidated statement of operations. The fair value of credit derivatives is reflected as either net assets or net liabilities determined on a contract by contract basis in the Company's consolidated balance sheets. See Note 9, Fair Value Measurement, for a discussion on the fair value methodology for credit derivatives.
Credit Derivative Net Par Outstanding by Sector
The components of the Company’s credit derivative net par outstanding are presented in the table below. The estimated remaining weighted average life of credit derivatives was 11.5 years and 11.6 years as of at December 31, 2019 and December 31, 2018, respectively.
Credit Derivatives (1)
|
| | | | | | | | | | | | | | | | |
| | | As of December 31, 2019 | | As of December 31, 2018 (2) |
| | | Net Par Outstanding | | Net Fair Value Asset (Liability) | | Net Par Outstanding | | Net Fair Value Asset (Liability) |
| | | (in millions) |
| | | | | | | | | |
| U.S public finance | | $ | 1,942 |
| | $ | (83 | ) | | $ | 1,783 |
| | $ | (65 | ) |
| Non-U.S public finance | | 2,676 |
| | (39 | ) | | 2,807 |
| | (51 | ) |
| U.S structured finance | | 1,206 |
| | (58 | ) | | 1,465 |
| | (85 | ) |
| Non-U.S structured finance | | 132 |
| | (5 | ) | | 127 |
| | (6 | ) |
| Total | | $ | 5,956 |
| | $ | (185 | ) | | $ | 6,182 |
| | $ | (207 | ) |
____________________
(1) Expected recoveries were $4 million as of December 31, 2019 and $2 million as of December 31, 2018.
| |
| (2) | Prior year presentation has been conformed to the current year's presentation. |
Distribution of Credit Derivative Net Par Outstanding by Internal Rating
|
| | | | | | | | | | | | | | |
| | | As of December 31, 2019 | | As of December 31, 2018 |
| Ratings | | Net Par Outstanding | | % of Total | | Net Par Outstanding | | % of Total |
| | | (dollars in millions) |
| AAA | | $ | 1,730 |
| | 29.0 | % | | $ | 1,813 |
| | 29.4 | % |
| AA | | 1,695 |
| | 28.5 |
| | 1,690 |
| | 27.3 |
|
| A | | 1,110 |
| | 18.6 |
| | 1,171 |
| | 18.9 |
|
| BBB | | 1,292 |
| | 21.7 |
| | 1,351 |
| | 21.9 |
|
| BIG (1) | | 129 |
| | 2.2 |
| | 157 |
| | 2.5 |
|
| Credit derivative net par outstanding | | $ | 5,956 |
| | 100.0 | % | | $ | 6,182 |
| | 100.0 | % |
____________________
| |
| (1) | All BIG credit derivatives are U.S. RMBS transactions. |
Fair Value of Credit Derivatives
Net Change in Fair Value of Credit Derivative Gains (Losses)
|
| | | | | | | | | | | |
| | Year Ended December 31, |
| | 2019 | | 2018 | | 2017 |
| | (in millions) |
| Realized gains on credit derivatives | $ | 8 |
| | $ | 9 |
| | $ | 17 |
|
| Net credit derivative losses (paid and payable) recovered and recoverable and other settlements | (35 | ) | | (25 | ) | | (27 | ) |
| Realized gains (losses) and other settlements | (27 | ) | | (16 | ) | | (10 | ) |
| Net unrealized gains (losses) | 21 |
| | 128 |
| | 121 |
|
| Net change in fair value of credit derivatives | $ | (6 | ) | | $ | 112 |
| | $ | 111 |
|
Realized losses and other settlements for approximately 6002019 were primarily due to payments related to various U.S. structured finance transactions, including those for a final maturity paydown and 750 VIEs, respectively,for which there was an offsetting unrealized gain. Realized losses and other settlements for 2018 and 2017 were primarily due to a paydown of a U.S. structured finance transaction, for which there was an offsetting unrealized gain.
During 2019, non-credit impairment fair value gains were generated primarily as a result of price improvements on the underlying collateral of the Company's CDS. These unrealized fair value gains were partially offset by unrealized fair value losses resulting from wider implied net spreads driven by the decreased market cost to buy protection in AGC’s name during the period. For those CDS transactions that itwere pricing at or above their floor levels, when the cost of purchasing CDS protection on AGC, which management refers to as the CDS spread on AGC, decreased, the implied spreads that the Company would expect to receive on these transactions increased.
During 2018, non-credit impairment fair value gains were primarily generated by CDS terminations, run-off of CDS par and price improvements on the underlying collateral of the Company’s CDS. In addition, unrealized fair value gains were generated by the increase in credit given to the primary insurer on one of the Company's second-to-pay CDS policies during the period. The unrealized fair value gains were partially offset by unrealized fair value losses resulting from wider implied net spreads driven by the decreased cost to buy protection in AGC’s name, as the market cost of AGC’s credit protection decreased during the period.
During 2017, non-credit impairment fair value gains were primarily generated by CDS terminations, run-off of net par outstanding, and price improvements on the underlying collateral of the Company’s CDS. The majority of the CDS transactions that were terminated were as a result of settlement agreements with several CDS counterparties. During 2017, the cost to buy protection in AGC’s name, specifically the five-year CDS spread, did not consolidate. To date,change materially during the period, and therefore did not have a material impact on the Company’s analyses have indicated that it doesunrealized fair value gains and losses on CDS.
The impact of changes in credit spreads will vary based upon the volume, tenor, interest rates, and other market conditions at the time these fair values are determined. In addition, since each transaction has unique collateral and structural terms, the underlying change in fair value of each transaction may vary considerably. The fair value of credit derivative contracts also reflects the change in the Company’s own credit cost based on the price to purchase credit protection on AGC. The Company determines its own credit risk based on quoted CDS prices traded on the Company at each balance sheet date.
CDS Spread on AGC (in bps)
|
| | | | | | | | |
| | As of
December 31, 2019 | | As of
December 31, 2018 | | As of
December 31, 2017 |
| Five-year CDS spread | 41 |
| | 110 |
| | 163 |
|
| One-year CDS spread | 9 |
| | 22 |
| | 70 |
|
Fair Value of Credit Derivative Assets (Liabilities)
and Effect of AGC
Credit Spread
|
| | | | | | | |
| | As of
December 31, 2019 | | As of
December 31, 2018 |
| | (in millions) |
| Fair value of credit derivatives before effect of AGC credit spread | $ | (261 | ) | | $ | (407 | ) |
| Plus: Effect of AGC credit spread | 76 |
| | 200 |
|
| Net fair value of credit derivatives | $ | (185 | ) | | $ | (207 | ) |
The fair value of CDS contracts at December 31, 2019, before considering the benefit applicable to AGC’s credit spreads, is a direct result of the relatively wide credit spreads of certain underlying credits generally due to the long tenor of these credits.
Collateral Posting for Certain Credit Derivative Contracts
The transaction documentation with 1 counterparty for $180 million in CDS net par insured by the Company requires the Company to post collateral, subject to a $180 million cap, to secure its obligation to make payments under such contracts. Eligible collateral is generally cash or U.S. government or agency securities; eligible collateral other than cash is valued at a discount to the face amount. As of December 31, 2019, AGC did not have indicatedto post collateral to satisfy these requirements.
Accounting Policy
In connection with the BlueMountain Acquisition, the FASB's new revenue recognition guidance, Topic 606 Revenue from Contracts with Customers (ASC 606), is applicable to the Company. Management, CLO and performance fees earned by Assured Investment Management are accounted for as contracts with customers. Under the guidance for contracts with customers, an entity is required to (a) identify the contract(s) with a customer, (b) identify the performance obligations in the contract, (c) determine the transaction price, (d) allocate the transaction price to the performance obligations in the contract, and (e) recognize revenue when (or as) the entity satisfies a performance obligation. In determining the transaction price, an entity may include variable consideration only to the extent that it is probable that a significant reversal in the amount of cumulative revenue recognized would not occur when the uncertainty associated with the variable consideration is resolved.
Management and CLO fees are derived from providing professional services to manage investment funds and CLOs. Investment management services are satisfied over time as the services are provided and are typically based on a percentage of the value of the client’s assets under management. Performance fee revenue will fluctuate from period to period and may not correlate with general market changes, since most of these fees are driven by absolute performance. Performance fee revenues are generated on certain management contracts when performance hurdles are achieved. Such fee revenues are recorded when the contractual performance criteria have been met and when it is probable that a significant reversal of revenue recognized will not occur in future reporting periods. Given the uniqueness of each fee arrangement, performance fee contracts are evaluated on an individual basis to determine the timing of revenue recognition.
Asset Management Fees
Management and CLO Fees
The Company receives a management fee in exchange for providing investment advisory and management services. These annual management fees are generally as follows.
Fees range from 0.70% to 2.00% per annum calculated on either the beginning of the month or quarter, or month-end NAV of the respective funds.
For the Company's management or servicing of the Assured Investment Management CLOs the Company receives, generally 0.35% to 0.50% (combined senior investment management fee and subordinated investment management fee) per annum based on NAV, and 20% per annum of the remaining interest proceeds and principal proceeds after the incentive management fee threshold has been satisfied. The portion of these fees that pertains to the investment by Assured Investment Management funds is typically rebated to the Assured Investment Management funds.
The Company may waive some or the entire management fee with respect to any investor. Certain current and former employees of the Company who have investments in the Assured Investment Management funds are not charged any management fees.
Performance Fees
In accordance with the investment management agreements, and by serving as the general partner, managing member or managing general partner, the Company also receives performance fees. Annual performance fee rates are generally as follows:
Range from 10% to 20% of the net profits in excess of the high-water mark for the respective fund, or
Range from 18% to 30% of the total cash received by investors in excess of certain benchmarks, or
30% of the net profits in excess of the high-water mark and a credit for management fees
Performance fees related to certain Assured Investment Management funds may be subject to future clawback and repayment. Determining the amount of performance fees to record is subject to qualitative and quantitative factors including where the fund is in its life-cycle, whether the Company has received or is entitled to receive performance fees and potential sales of fund investments. To the extent that performance fees have been received, but not earned, the company will recognize a liability for unearned revenue in the consolidated balance sheets. The general partner has the right, in its sole discretion, to
require certain Assured Investment Management funds to distribute to the general partner an amount equal to its presumed tax liability attributable to the allocated taxable income relating to performance fees with respect to such fiscal year and are contractually not subject to clawback. There were no tax distributions recorded during 2019.
The Company may waive some or all of the performance fees with respect to any investor. Certain current and former employees of the Company who have investments in the Assured Investment Management funds are not charged any performance fees.
The following table presents the sources of asset management fees since the BlueMountain Acquisition Date:
Asset Management Fees
|
| | | |
| | Year Ended
December 31, 2019 |
| | (in millions) |
| Management fees: | |
| CLOs (1) | $ | 3 |
|
| Opportunity funds | 2 |
|
| Wind-down funds | 13 |
|
| Total management fees | 18 |
|
| Performance fees | 4 |
|
| Total asset management fees | $ | 22 |
|
_____________________
| |
| (1) | Gross management fees from CLOs, before rebates were $11 million. |
The Company had management and performance fees receivable, which are included in other assets on the consolidated balance sheets, of $9 million as of December 31, 2019. The Company had 0 unearned revenues as of December 31, 2019.
| |
| 13. | Goodwill and Other Intangible Assets |
Accounting Policy
Goodwill is attributable to the BlueMountain Acquisition in the Asset Management segment and represents the excess cost over identifiable net assets of an acquired business. The Company tests goodwill annually for impairment or more frequently if circumstances indicate an impairment may have occurred. The goodwill impairment analysis is performed at the reporting unit level which is equal to the Company's operating segment level. If, after assessing qualitative factors, the Company believes that it is more likely than not that the fair value of the reporting unit is less than its carrying amount, the Company will evaluate impairment quantitatively to determine and record the amount of goodwill impairment as the excess of the carrying amount of the reporting unit over its fair value. Inherent in such fair value determinations are certain judgments and estimates relating to future cash flows, including the Company’s interpretation of current economic indicators and market valuations, and assumptions about the Company’s strategic plans with regard to its operations. Due to the uncertainties associated with such estimates, actual results could differ from such estimates.
The Company's finite-lived intangible assets consist primarily of contractual rights to earn future asset management fees from the acquired management and CLO contracts as well as a CLO distribution network. Such finite-lived intangible assets are recorded at fair value on the date of acquisition and amortized over their estimated useful lives.
The Company tests finite‑lived intangible assets for impairment if certain events occur or circumstances change indicating that the carrying amount of the intangible asset may not be recoverable. The Company evaluates impairment by comparing the estimated fair value attributable to the intangible asset being evaluated with its carrying amount. If an impairment is determined to exist by management, the Company accelerates amortization expense so that the carrying amount represents fair value.
The Company's indefinite-lived intangible assets consist of the value of insurance licenses acquired in prior business combinations. The Company assesses indefinite-lived intangible assets for impairment annually or more frequently if
circumstances indicate an impairment may have occurred. If a qualitative assessment reveals that it is more-likely-than-not that the asset is impaired, the Company calculates an updated fair value.
The following table summarizes the carrying value for the Company's goodwill and other intangible assets:
Goodwill and Other Intangible Assets
|
| | | | | | | | | |
| | Weighted Average Amortization Period as of | | As of December 31 |
| | December 31, 2019 | | 2019 | | 2018 |
| | | | (in millions) |
| Goodwill (1) | | | $ | 117 |
| | $ | — |
|
| Finite-lived intangible assets: | | | | | |
| CLO contracts | 8.8 years | | 42 |
| | — |
|
| Investment management contracts | 4.5 years | | 24 |
| | — |
|
| CLO distribution network | 4.8 years | | 9 |
| | — |
|
| Trade name | 9.8 years | | 3 |
| | — |
|
| Favorable sublease | 4.2 years | | 1 |
| | — |
|
| Lease-related intangibles | 7.0 years | | 3 |
| | 3 |
|
| Finite-lived intangible assets, gross | 7.0 years | | 82 |
| | 3 |
|
| Accumulated amortization | | | (5 | ) | | (1 | ) |
| Finite-lived intangible assets, net | | | 77 |
| | 2 |
|
| Licenses (indefinite-lived) | | | 22 |
| | 22 |
|
| Total goodwill and other intangible assets | | | $ | 216 |
| | $ | 24 |
|
_____________________
| |
| (1) | Includes goodwill allocated to the European subsidiaries of BlueMountain. The balance changes due to foreign currency translation. The amount of goodwill deductible for tax purposes was approximately $115 million as of December 31, 2019. |
Goodwill and substantially all finite-lived intangible assets relate to the Company’s acquisition of BlueMountain on October 1, 2019. To date, there have been 0 impairments of goodwill or intangible assets. Amortization expense, which is recorded in other operating expenses in the consolidated statements of operations, associated with finite-lived intangible assets was $3 million for the year ended December 31, 2019, and $1 million in 2017. For 2018, amortization expense was de minimis.
As of December 31, 2019, future annual amortization of finite-lived intangible assets for the years 2020 through 2024 and thereafter is estimated to be:
Estimated Future Amortization Expense
for Finite-Lived Intangible Assets
|
| | | | |
| | | As of December 31, 2019 |
| Year | | (in millions) |
| 2020 | $ | 13 |
|
| 2021 | 12 |
|
| 2022 | 11 |
|
| 2023 | 11 |
|
| 2024 | 10 |
|
| Thereafter | 20 |
|
| Total | $ | 77 |
|
| |
| 14. | Variable Interest Entities |
Accounting Policy
The types of entities the Company assesses for consolidation principally include (1) entities whose debt obligations the insurance subsidiaries insures in its financial guaranty business, and (2) investment vehicles such as collateralized financing entities and investment funds managed by the asset management subsidiaries, in which the Company has a variable interest. For each of these types of entities, the Company assesses whether it is the primary beneficiary. If the Company concludes that it is the primary beneficiary, it consolidates the VIE in the Company's financial statements and eliminates the effects of intercompany transactions with the insurance subsidiaries and intercompany transactions between consolidated VIEs.
The Company determines whether it is the primary beneficiary of any other VIEsa VIE at the time it becomes involved with a VIE and ascontinuously reconsiders the conclusion at each reporting date. In determining whether it is the primary beneficiary, the Company evaluates its direct and indirect interests in the VIE. The primary beneficiary of a result, they are not consolidated. VIE is the enterprise that has both 1) the power to direct the activities of a VIE that most significantly impact the entity's economic performance; and 2) the obligation to absorb losses of the entity that could potentially be significant to the VIE or the right to receive benefits from the entity that could potentially be significant to the VIE.
Financial Guaranty Variable Interest Entities
The Company’s exposure provided through itsCompany provides financial guaranties with respect to debt obligations of special purpose entities, including VIEs but does not act as the servicer or collateral manager for any VIE obligations guaranteed by its insurance subsidiaries. The transaction structure generally provides certain financial protections to the Company. This financial protection can take several forms, the most common of which are overcollateralization, first loss protection (or subordination) and excess spread. In the case of overcollateralization (i.e., the principal amount of the securitized assets exceeds the principal amount of the structured finance obligations guaranteed by the Company), the structure allows defaults of the securitized assets before a default is experienced on the structured finance obligation guaranteed by the Company. In the case of first loss, the Company's financial guaranty insurance policy only covers a senior layer of losses experienced by multiple obligations issued by the VIEs. The first loss exposure with respect to the assets is either retained by the seller or sold off in the form of equity or mezzanine debt to other investors. In the case of excess spread, the financial assets contributed to VIEs, generate interest income that are in excess of the interest payments on the debt issued by the VIE. Such excess spread is typically distributed through the transaction’s cash flow waterfall and may be used to create additional credit enhancement, applied to redeem debt issued by the VIE (thereby, creating additional overcollateralization), or distributed to equity or other investors in the transaction.
Assured Guaranty is not primarily liable for the debt obligations issued by the VIEs it insures and would only be required to make payments on those insured debt obligations in the event that the issuer of such debt obligations defaults on any principal or interest due and only for the amount of the shortfall. AGL’s and its subsidiaries’ creditors do not have any rights with regard to the collateral supporting the debt issued by the FG VIEs. Proceeds from sales, maturities, prepayments and interest from such underlying collateral may only be used to pay debt service on FG VIEs’ liabilities. Net fair value gains and losses on FG VIEs are expected to reverse to 0 at maturity of the FG VIEs’ debt, except for net premiums received and net claims paid by Assured Guaranty under the financial guaranty insurance contract. The Company’s estimate of expected loss to be paid for FG VIEs is included within net par outstanding in Note 4, Outstanding Exposure.6, Expected Loss to be Paid.
As part of the terms of its financial guaranty contracts, the Company, under its insurance contract, obtains certain protective rights with respect to the VIE that give the Company additional controls over a VIE. These protective rights are triggered by the occurrence of certain events, such as failure to be in compliance with a covenant due to poor deal performance or a deterioration in a servicer or collateral manager's financial condition. At deal inception, the Company typically is not deemed to control a VIE; however, once a trigger event occurs, the Company's control of the VIE typically increases. The Company continuously evaluates its power to direct the activities that most significantly impact the economic performance of VIEs that have debt obligations insured by the Company and, accordingly, where the Company is obligated to absorb VIE losses or receive benefits that could potentially be significant to the VIE. The Company is deemed to be the control party for certain VIEs under GAAP, typically when its protective rights give it the power to both terminate and replace the deal servicer, which are characteristics specific to the Company's financial guaranty contracts. If the protective rights that could make the Company the control party have not been triggered, then the VIE is not consolidated. If the Company is deemed no longer to have those protective rights, the VIE is deconsolidated.
Accounting Policy
The FG VIEs’ liabilities that are insured by the Company are considered to be with recourse, because the Company guarantees the payment of principal and interest regardless of the performance of the related FG VIEs’ assets. FG VIEs’
The vast majorityliabilities that are not insured by the Company are considered to be without recourse, because the payment of principal and interest of these liabilities is wholly dependent on the performance of the Company's investment portfolio is composedFG VIEs’ assets.
The Company has limited contractual rights to obtain the financial records of fixed-maturity and short-term investments, classified as available-for-sale atits consolidated FG VIEs. The FG VIEs do not prepare separate GAAP financial statements; therefore, the time of purchase (approximately 98.5%Company compiles GAAP financial information for them based on trustee reports prepared by and received from third parties. Such trustee reports are not available to the Company until approximately 30 days after the end of any given period. The time required to perform adequate reconciliations and analyses of the information in these trustee reports results in a one quarter lag in reporting the FG VIEs’ activities. The Company records the fair value as of December 31, 2016),FG VIEs’ assets and therefore carried at fair value. Changesliabilities based on modeled prices. The Company updates the model assumptions each reporting period for the most recent available information, which incorporates the impact of material events that may have occurred since the quarter lag date. The net change in the fair value for other-than-temporarily-impaired (OTTI) securities are bifurcated between credit lossesof consolidated FG VIEs’ assets and non-credit changes in fair value. The credit loss on OTTI securitiesliabilities is recorded in "fair value gains (losses) on FG VIEs" in the statementconsolidated statements of operations, and the non-credit component of theexcept for change in fair value of securities, whether OTTI or not,FG VIEs’ liabilities with recourse caused by changes in ISCR which is recordednow separately presented in OCI. For securitiesOCI, effective January 1, 2018. The inception to date change in an unrealized loss position wherefair value of the FG VIEs’ liabilities with recourse attributable to the ISCR is calculated by holding all current period assumptions constant for each security and isolating the effect of the change in the Company’s CDS spread from the most recent date of consolidation to the current period. In general, if the Company’s CDS spread tightens, more value will be assigned to the Company’s credit; however, if the Company’s CDS widens, less value is assigned to the Company’s credit. Interest income and interest expense are derived from the trustee reports and also included in "fair value gains (losses) on FG VIEs." The Company has elected the intent to sell or it is more-likely-than-not that it will be required to sell the security before recovery, the entire impairment loss (i.e., the difference between the security's fair value option for assets and its amortized cost) isliabilities classified as FG VIEs’ assets and liabilities because the carrying amount transition method was not practical.
Number of FG VIEs Consolidated
|
| | | | | | | | |
| | Year Ended December 31, |
| | 2019 | | 2018 | | 2017 |
| | |
| Beginning of year | 31 |
| | 32 |
| | 32 |
|
| Consolidated | 1 |
| | — |
| | 2 |
|
| Deconsolidated | (3 | ) | | (1 | ) | | (2 | ) |
| Matured | (2 | ) | | — |
| | — |
|
| December 31 | 27 |
| | 31 |
| | 32 |
|
The change in the ISCR of the FG VIEs’ assets held as of December 31, 2019 that was recorded in the consolidated statements of operations.
Credit losses reduceoperations for 2019 was a gain of $39 million. The change in the amortized costISCR of impaired securities. The amortized cost basis is adjustedthe FG VIEs’ assets was a gain of $7 million for accretion2018 and amortization (usinga gain of $35 million for 2017. To calculate ISCR, the effective interest method) with a corresponding entry recordedchange in net investment income.
Realized gains and losses on sales of investments are determined using the specific identification method. Realized loss includes amounts recorded for other-than-temporary impairments on debt securities and the declines in fair value of securitiesthe FG VIEs’ assets is allocated between changes that are due to ISCR and changes due to other factors, including interest rates. The ISCR amount is determined by using expected cash flows at the original date of consolidation discounted at the effective yield less current expected cash flows discounted at that same original effective yield.
|
| | | | | | | |
| | As of
December 31, 2019 | | As of
December 31, 2018 |
| | (in millions) |
| Excess of unpaid principal over fair value of: | | | |
| FG VIEs' assets | $ | 279 |
| | $ | 350 |
|
| FG VIEs' liabilities with recourse | 21 |
| | 48 |
|
| FG VIEs' liabilities without recourse | 19 |
| | 28 |
|
| Unpaid principal balance for FG VIEs’ assets that were 90 days or more past due | 52 |
| | 71 |
|
| Unpaid principal for FG VIEs’ liabilities with recourse (1) | 388 |
| | 565 |
|
____________________
(1) FG VIEs’ liabilities with recourse will mature at various dates ranging from 2019 to 2038.
The table below shows the carrying value of the consolidated FG VIEs’ assets and liabilities in the consolidated financial statements, segregated by the types of assets that collateralize the respective debt obligations for FG VIEs’ liabilities with recourse.
Consolidated FG VIEs
By Type of Collateral
|
| | | | | | | | | | | | | | | |
| | As of December 31, 2019 | | As of December 31, 2018 |
| | Assets | | Liabilities | | Assets | | Liabilities |
| | (in millions) |
| With recourse: | |
| | |
| | |
| | |
|
| U.S. RMBS first lien | $ | 270 |
| | $ | 297 |
| | $ | 299 |
| | $ | 326 |
|
| U.S. RMBS second lien | 70 |
| | 70 |
| | 115 |
| | 137 |
|
| Manufactured housing | — |
| | — |
| | 53 |
| | 54 |
|
| Total with recourse | 340 |
| | 367 |
| | 467 |
| | 517 |
|
| Without recourse | 102 |
| | 102 |
| | 102 |
| | 102 |
|
| Total | $ | 442 |
| | $ | 469 |
| | $ | 569 |
| | $ | 619 |
|
Consolidated Investment Vehicles
Through a jointly owned subsidiary, AGM, AGC and MAC, the U.S. insurance subsidiaries, initially intend to invest $500 million in Assured Investment Management funds. In the fourth quarter of 2019, $79 million was invested in three separate Assured Investment Management funds; AHP, ABIF and CLO Warehouse Fund. As of December 31, 2019, the fair value of such investments was $77 million. CLO Warehouse Fund invested in the subordinated notes of CLO XXVI.
AHP, ABIF, CLO Warehouse Fund and CLO XXVI (collectively, the consolidated investment vehicles) are VIEs. The Company consolidates these investment vehicles as it is deemed to be the primary beneficiary based on its power to direct the most significant activities of each VIE (through its Assured Investment Management asset management subsidiaries) and its level of economic interest in the entities (through its U.S. insurance subsidiaries).
AHP and ABIF are investment companies under ASC 946, and therefore account for their underlying investments at fair value. CLO XXVI is a CFE under ASC 810. Under the ASC 810 practical expedient for CFEs, the Company elected to measure CLO XXVI's assets and liabilities using the fair value of its assets, which are more observable. Changes in the fair value of assets and liabilities of consolidated investment vehicles are recorded in "other income" in the consolidated statement of operations.
As a result of consolidating AHP, ABIF and CLO Warehouse Fund, the Company records noncontrolling interest (NCI) for the portion of each fund owned by employees and any third party investors. As of December 31, 2019, redeemable employee-owned NCI, held in ABIF and CLO Warehouse Fund, is classified outside of stockholder’s equity, within temporary equity. For AHP, nonredeemable NCI is presented within shareholders' equity in the consolidated balance sheets.
The assets and liabilities of the Company's consolidated investment vehicles (which include consolidated funds: AHP, ABIF and CLO Warehouse Fund as well as CLO XXVI) are held within separate legal entities. The assets of the consolidated investment vehicles are not available to creditors of the Company, other than creditors of the applicable consolidated investment vehicles. In addition, creditors of the consolidated investment vehicles have no recourse against the assets of the Company, other than the assets of such applicable consolidated investment vehicles.
Generally, the consolidation of the Company's consolidated investment vehicles and FG VIEs has a significant gross-up effect on the Company's assets, liabilities and cash flows. The consolidated investment vehicles have no net effect on the net income attributable to the Company, other than the economic interest the Company holds in consolidated funds in the Company's Insurance segment. The ownership interests of the Company's consolidated funds, to which the Company has no economic rights, are reflected as either redeemable or nonredeemable NCI in the intentconsolidated funds in the Company's consolidated financial statements. Liquidity available at the Company's consolidated investment vehicles is typically not available for corporate liquidity needs, except to sell the security or inability to hold until recoveryextent of amortized cost.the Company's investment in the fund.
For mortgage‑backed securities,Assets and any other holdings for which there is prepayment risk, prepayment assumptions are evaluated and revised as necessary. Any necessary adjustments due to changes in effective yields and maturities are recognized in net investment income using the retrospective method.Liabilities
of Consolidated Investment Vehicles
Loss mitigation securities are generally purchased at a discount and are accounted for based on their underlying investment type, excluding the effects of the Company’s insurance. Interest income on loss mitigation securities is recognized on a level yield basis over the remaining life of the security.
Short-term investments, which are those investments with a maturity of less than one year at time of purchase, are carried at fair value and include amounts deposited in money market funds.
Other invested assets primarily include guaranteed investment contracts, which are carried at amortized cost plus accrued interest and preferred stocks, which are carried at fair value with changes in unrealized gains and losses recorded in OCI.
Cash consists of cash on hand and demand deposits. As a result of the lag in reporting FG VIEs, cash and short-term investments do not reflect cash outflow to the holders of the debt issued by the FG VIEs for claim payments made by the Company's insurance subsidiaries to the consolidated FG VIEs until the subsequent reporting period.
Assessment for Other-Than Temporary Impairments
If an entity does not intend to sell the security and it is not more-likely-than-not that the Company will be required to sell the security before recovery of its amortized cost basis, the other-than-temporary-impairment is separated into (1) the amount representing the credit loss and (2) the amount related to all other factors.
The Company has a formal review process to determine other-than-temporary-impairment for securities in its investment portfolio where there is no intent to sell and it is not more-likely-than-not that it will be required to sell the security before recovery. Factors considered when assessing impairment include:
a decline in the market value of a security by 20% or more below amortized cost for a continuous period of at least six months;
a decline in the market value of a security for a continuous period of 12 months;
recent credit downgrades of the applicable security or the issuer by rating agencies;
the financial condition of the applicable issuer;
whether loss of investment principal is anticipated;
the impact of foreign exchange rates; and
whether scheduled interest payments are past due.
The Company assesses the ability to recover the amortized cost by comparing the net present value of projected future cash flows with the amortized cost of the security. If the security is in an unrealized loss position and its net present value is less than the amortized cost of the investment, an other-than-temporary impairment is recorded. The net present value is calculated by discounting the Company's estimate of projected future cash flows at the effective interest rate implicit in the debt security at the time of purchase. The Company's estimates of projected future cash flows are driven by assumptions regarding probability of default and estimates regarding timing and amount of recoveries associated with a default. The Company develops these estimates using information based on historical experience, credit analysis and market observable data, such as industry analyst reports and forecasts, sector credit ratings and other relevant data. For mortgage‑backed and asset backed securities, cash flow estimates also include prepayment and other assumptions regarding the underlying collateral including default rates, recoveries and changes in value. The assumptions used in these projections requires the use of significant management judgment.
The Company's assessment of a decline in value included management's current assessment of the factors noted above. The Company also seeks advice from its outside investment managers. If that assessment changes in the future, the Company may ultimately record a loss after having originally concluded that the decline in value was temporary.
Net Investment Income and Realized Gains (Losses)
Net investment income is a function of the yield that the Company earns on invested assets and the size of the portfolio. The investment yield is a function of market interest rates at the time of investment as well as the type, credit quality and maturity of the invested assets. Accrued investment income, which is recorded in Other Assets, was $91 million and $99 million as of December 31, 2016 and December 31, 2015, respectively.
Net Investment Income
|
| | | | | | | | | | | |
| | Year Ended December 31, |
| | 2016 | | 2015 | | 2014 |
| | (in millions) |
| Income from fixed-maturity securities managed by third parties | $ | 306 |
|
| $ | 335 |
|
| $ | 324 |
|
| Income from internally managed securities: | | | | | |
| Fixed maturities | 103 |
|
| 61 |
|
| 74 |
|
| Other | 7 |
| | 37 |
| | 14 |
|
| Other | 1 |
| | 0 |
| | 0 |
|
| Gross investment income | 417 |
|
| 433 |
|
| 412 |
|
| Investment expenses | (9 | ) |
| (10 | ) |
| (9 | ) |
| Net investment income | $ | 408 |
| | $ | 423 |
| | $ | 403 |
|
Net Realized Investment Gains (Losses)
|
| | | | | | | | | | | |
| | Year Ended December 31, |
| | 2016 | | 2015 | | 2014 |
| | (in millions) |
| Gross realized gains on available-for-sale securities | $ | 28 |
| | $ | 44 |
| | $ | 14 |
|
| Gross realized losses on available-for-sale securities | (8 | ) | | (15 | ) | | (5 | ) |
| Net realized gains (losses) on other invested assets | 2 |
| | (8 | ) | | 6 |
|
| Other-than-temporary impairment | (51 | ) | | (47 | ) | | (75 | ) |
| Net realized investment gains (losses) | $ | (29 | ) | | $ | (26 | ) | | $ | (60 | ) |
The following table presents the roll-forward of the credit losses of fixed-maturity securities for which the Company has recognized an other-than-temporary-impairment and where the portion of the fair value adjustment related to other factors was recognized in OCI.
Roll Forward of Credit Losses
in the Investment Portfolio
|
| | | | | | | | | | | |
| | Year Ended December 31, |
| | 2016 | | 2015 | | 2014 |
| | (in millions) |
| Balance, beginning of period | $ | 108 |
| | $ | 124 |
| | $ | 80 |
|
| Additions for credit losses on securities for which an other-than-temporary-impairment was not previously recognized | 3 |
| | 3 |
| | 64 |
|
| Eliminations of securities issued by FG VIEs | — |
| | — |
| | (15 | ) |
| Reductions for securities sold and other settlement during the period | (4 | ) | | (28 | ) | | (12 | ) |
| Additions for credit losses on securities for which an other-than-temporary-impairment was previously recognized | 27 |
| | 9 |
| | 7 |
|
| Balance, end of period | $ | 134 |
| | $ | 108 |
| | $ | 124 |
|
Investment Portfolio
Fixed-Maturity Securities and Short-Term Investments
by Security Type
As of December 31, 2016
|
| | | | | | | | | | | | | | | | | | | | | | | | | |
| Investment Category | | Percent of Total(1) | | Amortized Cost | | Gross Unrealized Gains | | Gross Unrealized Losses | | Estimated Fair Value | | AOCI(2) Gain (Loss) on Securities with Other-Than-Temporary Impairment | | Weighted Average Credit Rating (3) |
| | | (dollars in millions) |
| Fixed-maturity securities: | | |
| | |
| | |
| | |
| | |
| | |
| | |
| Obligations of state and political subdivisions | | 50 | % | | $ | 5,269 |
| | $ | 202 |
| | $ | (39 | ) | | $ | 5,432 |
| | $ | 13 |
| | AA |
| U.S. government and agencies | | 4 |
| | 424 |
| | 17 |
| | (1 | ) | | 440 |
| | — |
| | AA+ |
| Corporate securities | | 15 |
| | 1,612 |
| | 32 |
| | (31 | ) | | 1,613 |
| | (8 | ) | | A- |
| Mortgage-backed securities(4): | | — |
| | | | | | |
| | | | |
| |
|
| RMBS | | 9 |
| | 998 |
| | 27 |
| | (38 | ) | | 987 |
| | (21 | ) | | A- |
| CMBS | | 5 |
| | 575 |
| | 13 |
| | (5 | ) | | 583 |
| | — |
| | AAA |
| Asset-backed securities | | 8 |
| | 835 |
| | 110 |
| | 0 |
| | 945 |
| | 33 |
| | B |
| Foreign government securities | | 3 |
| | 261 |
| | 4 |
| | (32 | ) | | 233 |
| | — |
| | AA |
| Total fixed-maturity securities | | 94 |
| | 9,974 |
| | 405 |
| | (146 | ) | | 10,233 |
| | 17 |
| | A+ |
| Short-term investments | | 6 |
| | 590 |
| | 0 |
| | 0 |
| | 590 |
| | — |
| | AAA |
| Total investment portfolio | | 100 | % | | $ | 10,564 |
| | $ | 405 |
| | $ | (146 | ) | | $ | 10,823 |
| | 17 |
| | A+ |
Fixed-Maturity Securities and Short-Term Investments
by Security Type
As of December 31, 2015
|
| | | | | | | | | | | | | | | | | | | | | | | | | |
| Investment Category | | Percent of Total(1) | | Amortized Cost | | Gross Unrealized Gains | | Gross Unrealized Losses | | Estimated Fair Value | | AOCI Gain (Loss) on Securities with Other-Than-Temporary Impairment | | Weighted Average Credit Rating (3) |
| | | (dollars in millions) |
| Fixed-maturity securities: | | |
| | |
| | |
| | |
| | |
| | |
| | |
| Obligations of state and political subdivisions | | 52 | % | | $ | 5,528 |
| | $ | 323 |
| | $ | (10 | ) | | $ | 5,841 |
| | $ | 5 |
| | AA |
| U.S. government and agencies | | 3 |
| | 377 |
| | 23 |
| | 0 |
| | 400 |
| | — |
| | AA+ |
| Corporate securities | | 14 |
| | 1,505 |
| | 38 |
| | (23 | ) | | 1,520 |
| | (13 | ) | | A- |
| Mortgage-backed securities(4): | | |
| | |
| | |
| | |
| | |
| | |
| | |
| RMBS | | 11 |
| | 1,238 |
| | 29 |
| | (22 | ) | | 1,245 |
| | (7 | ) | | A |
| CMBS | | 5 |
| | 506 |
| | 9 |
| | (2 | ) | | 513 |
| | — |
| | AAA |
| Asset-backed securities | | 8 |
| | 831 |
| | 4 |
| | (10 | ) | | 825 |
| | (6 | ) | | B+ |
| Foreign government securities | | 3 |
| | 290 |
| | 4 |
| | (11 | ) | | 283 |
| | — |
| | AA+ |
| Total fixed-maturity securities | | 96 |
| | 10,275 |
| | 430 |
| | (78 | ) | | 10,627 |
| | (21 | ) | | A+ |
| Short-term investments | | 4 |
| | 396 |
| | 0 |
| | 0 |
| | 396 |
| | — |
| | AA- |
| Total investment portfolio | | 100 | % | | $ | 10,671 |
| | $ | 430 |
| | $ | (78 | ) | | $ | 11,023 |
| | $ | (21 | ) | | A+ |
|
| | | |
| | As of
December 31, 2019 |
| | (in millions) |
| Assets: | |
| Cash and restricted cash (1) | $ | 14 |
|
| Corporate loans of CFE, at fair value | 494 |
|
| Corporate loans, at fair value | 47 |
|
| Other assets (2) | 17 |
|
| Total assets | $ | 572 |
|
| Liabilities: | |
| CLO obligations of CFE, at fair value (3) | $ | 481 |
|
| Other liabilities | 1 |
|
| Total liabilities | $ | 482 |
|
____________________
| |
| (1) | Based on amortized cost.Cash held by consolidated investment vehicles are not available to fund the general liquidity needs of the Company. |
| |
| (2) | Accumulated OCI. See also Note 20, Other Comprehensive Income.Includes investment in affiliates of $9 million. |
| |
| (3) | RatingsThe weighted average maturity and weighted average interest rate of CLO obligations were 12.8 years and 3.8%, respectively. CLO obligations will mature in the tables above represent the lower of the Moody’s and S&P classifications except for bonds purchased for loss mitigation or risk management strategies, which use internal ratings classifications. The Company’s portfolio consists primarily of high-quality, liquid instruments.2032. |
| |
(4) | Government-agency obligations were approximately 42% of mortgage backed securities as of December 31, 2016 and 54% as of December 31, 2015 based on fair value.
|
The Company’s investment portfolio in tax-exempt and taxable municipal securities includes issuances by a wide number of municipal authorities across the U.S. and its territories.
The following tables present the fair value of the Company’s available-for-sale portfolio of obligations of state and political subdivisions as of December 31, 2016 and December 31, 2015 by state.
Fair Value of Available-for-Sale Portfolio of
Obligations of State and Political Subdivisions
As of December 31, 2016 (1)2019, the consolidated investment vehicles had a commitment to invest $13 million.
Redeemable Noncontrolling Interests in Consolidated Investment Vehicles
|
| | | |
| | Year Ended December 31, 2019 |
| | (in millions) |
| Beginning balance | $ | — |
|
| Contributions to investment vehicles | 12 |
|
| Distributions from investment vehicles | (4 | ) |
| Net loss | (1 | ) |
| December 31, | $ | 7 |
|
Interest income and interest expense are included in "other income." Investment purchases and sales for all consolidated investment vehicles are classified as operating activities, debt issuances and repayments are classified in financing activities.
Effect of Consolidating VIEs
The effect on the statements of operations and financial condition of consolidating FG VIEs includes (i) changes in fair value gains (losses) on FG VIEs’ assets and liabilities, (ii) the elimination of premiums and losses related to the AGC and AGM FG VIEs’ liabilities with recourse and (iii) the elimination of investment balances related to the Company’s purchase of AGC and AGM insured FG VIEs’ debt. Upon consolidation of a FG VIE, the related insurance and, if applicable, the related investment balances, are considered intercompany transactions and therefore eliminated. Such eliminations are included in the table below to present the full effect of consolidating FG VIEs.
The effect on the statements of operations and balance sheets of consolidating Assured Investment Management investment vehicles includes (i) changes in fair value of consolidated investment vehicles, (2) the elimination of the equity in earnings in investees related to the Insurance segment's investments in the consolidated Assured Investment Management funds, (3) the elimination of debt of the consolidated CLO against the assets of the consolidated CLO Warehouse Fund, and (4) the recording of NCI for the proportion of each consolidated Assured Investment Management fund that is not owned by any other subsidiary of the Company.
The cash flows generated by the FG VIEs’ assets are classified as cash flows from investing activities. Paydowns of FG VIEs' liabilities are supported by the cash flows generated by FG VIEs’ assets, and for liabilities with recourse, possibly claim payments made by AGM or AGC under its financial guaranty insurance contracts. Paydowns of FG VIEs' liabilities both with and without recourse are classified as cash flows used in financing activities. Interest income, interest expense and other expenses of the FG VIEs’ assets and liabilities are classified as operating cash flows. Claim payments made by AGC and AGM under the financial guaranty contracts issued to the FG VIEs are eliminated upon consolidation and therefore such claim payments are treated as paydowns of FG VIEs’ liabilities as a financing activity as opposed to an operating activity of AGM and AGC.
Cash flows of the consolidated investment vehicles attributable to such entities' investment purchases and dispositions, as well as operating expenses of the investment vehicles are presented as cash flow from operating activities in the consolidated statement of cash flows. Financing activities and capital cash flows to and from investors are presented as financing activities consistent with investment company guidelines.
Effect of Consolidating VIEs
on the Consolidated Balance Sheets
Increase (Decrease)
|
| | | | | | | | | | | | | | | | | | | | | | |
| State | | State General Obligation | | Local General Obligation | | Revenue Bonds | | Fair Value | | Amortized Cost | | Average Credit Rating |
| | | (in millions) |
| Fixed-maturity securities: | | | | | | | | | | | | |
| New York | | $ | 13 |
| | $ | 38 |
| | $ | 570 |
| | $ | 621 |
| | $ | 604 |
| | AA |
| California | | 73 |
| | 62 |
| | 391 |
| | 526 |
| | 497 |
| | A+ |
| Texas | | 16 |
| | 186 |
| | 316 |
| | 518 |
| | 503 |
| | AA |
| Washington | | 81 |
| | 68 |
| | 201 |
| | 350 |
| | 348 |
| | AA |
| Florida | | 16 |
| | 11 |
| | 247 |
| | 274 |
| | 266 |
| | AA- |
| Massachusetts | | 74 |
| | — |
| | 149 |
| | 223 |
| | 215 |
| | AA |
| Illinois | | 18 |
| | 65 |
| | 127 |
| | 210 |
| | 205 |
| | A+ |
| Arizona | | — |
| | 3 |
| | 122 |
| | 125 |
| | 122 |
| | AA |
| Georgia | | — |
| | 9 |
| | 104 |
| | 113 |
| | 109 |
| | A+ |
| Pennsylvania | | 38 |
| | 17 |
| | 58 |
| | 113 |
| | 111 |
| | A+ |
| All others | | 153 |
| | 155 |
| | 1,085 |
| | 1,393 |
| | 1,364 |
| | AA- |
| Total | | $ | 482 |
| | $ | 614 |
| | $ | 3,370 |
| | $ | 4,466 |
| | $ | 4,344 |
| | AA- |
|
| | | | | | | |
| | As of
December 31, 2019 | | As of
December 31, 2018 |
| | (in millions) |
| Assets | | | |
| Investment portfolio: | | | |
| Fixed maturity securities and short-term investments | $ | (39 | ) | | $ | (38 | ) |
| Equity method investments (1) | (77 | ) | | — |
|
| Total investments | (116 | ) | | (38 | ) |
| Premiums receivable, net of commissions payable | (7 | ) | | (9 | ) |
| Salvage and subrogation recoverable | (8 | ) | | (1 | ) |
| FG VIEs’ assets, at fair value | 442 |
| | 569 |
|
| Assets of consolidated investment vehicles (1) | 572 |
| | — |
|
| Total assets | $ | 883 |
| | $ | 521 |
|
| Liabilities and shareholders’ equity | | | |
| Unearned premium reserve | $ | (39 | ) | | $ | (51 | ) |
| Loss and LAE reserve | (41 | ) | | (48 | ) |
| FG VIEs’ liabilities with recourse, at fair value | 367 |
| | 517 |
|
| FG VIEs’ liabilities without recourse, at fair value | 102 |
| | 102 |
|
| Liabilities of consolidated investment vehicles (1) | 482 |
| | — |
|
| Total liabilities | 871 |
| | 520 |
|
| | | | |
| Redeemable noncontrolling interests in consolidated investment vehicles (1) | 7 |
| | — |
|
| | | | |
| Retained earnings | 34 |
| | 34 |
|
| Accumulated other comprehensive income | (35 | ) | | (33 | ) |
| Total shareholders’ equity attributable to Assured Guaranty Ltd. | (1 | ) | | 1 |
|
| Nonredeemable noncontrolling interests (1) | 6 |
| | — |
|
| Total shareholders’ equity | 5 |
| | 1 |
|
| Total liabilities, redeemable noncontrolling interests and shareholders’ equity | $ | 883 |
| | $ | 521 |
|
Fair Value of Available-for-Sale Portfolio of
Obligations of State and Political Subdivisions
As of December 31, 2015 (1)
|
| | | | | | | | | | | | | | | | | | | | | | |
| State | | State General Obligation | | Local General Obligation | | Revenue Bonds | | Fair Value | | Amortized Cost | | Average Credit Rating |
| | | (in millions) |
| Fixed-maturity securities: | | | | | | | | | | | | |
| New York | | $ | 13 |
| | $ | 59 |
| | $ | 571 |
| | $ | 643 |
| | $ | 610 |
| | AA |
| Texas | | 28 |
| | 224 |
| | 325 |
| | 577 |
| | 542 |
| | AA |
| California | | 78 |
| | 66 |
| | 411 |
| | 555 |
| | 521 |
| | A+ |
| Washington | | 59 |
| | 79 |
| | 200 |
| | 338 |
| | 323 |
| | AA |
| Florida | | 17 |
| | — |
| | 268 |
| | 285 |
| | 266 |
| | AA- |
| Illinois | | 47 |
| | 69 |
| | 128 |
| | 244 |
| | 234 |
| | A |
| Massachusetts | | 75 |
| | — |
| | 148 |
| | 223 |
| | 207 |
| | AA |
| Arizona | | — |
| | 10 |
| | 181 |
| | 191 |
| | 181 |
| | AA |
| Pennsylvania | | 48 |
| | 26 |
| | 47 |
| | 121 |
| | 115 |
| | A |
| Ohio | | 17 |
| | 14 |
| | 83 |
| | 114 |
| | 106 |
| | AA |
| All others | | 156 |
| | 168 |
| | 1,148 |
| | 1,472 |
| | 1,396 |
| | AA- |
| Subtotal | | 538 |
| | 715 |
| | 3,510 |
| | 4,763 |
| | 4,501 |
| | AA- |
| Short-term investments (2) | | — |
| | — |
| | 60 |
| | 60 |
| | 60 |
| | CC |
| Total | | $ | 538 |
| | $ | 715 |
| | $ | 3,570 |
| | $ | 4,823 |
| | $ | 4,561 |
| | AA- |
____________________
| |
| (1) | Excludes $966 million and $1,078 million asThese line items represent the components of December 31, 2016 and 2015, respectively,the effect of pre-refunded bonds, at fair value. The credit ratings are based on the underlying ratings and do not include any benefit from bond insurance.consolidating Assured Investment Management investment vehicles. |
(2) MaturedEffect of Consolidating VIEs
on the Consolidated Statements of Operations
Increase (Decrease)
|
| | | | | | | | | | | |
| | Year Ended December 31, |
| | 2019 | | 2018 | | 2017 |
| | (in millions) |
| Net earned premiums | $ | (18 | ) | | $ | (12 | ) | | $ | (15 | ) |
| Net investment income | (4 | ) | | (4 | ) | | (5 | ) |
| Fair value gains (losses) on FG VIEs (1) | 42 |
| | 14 |
| | 30 |
|
| Other income (loss) (2) | (3 | ) | | — |
| | — |
|
| Loss and LAE | (20 | ) | | (3 | ) | | 7 |
|
| Equity in net earnings of investees | 2 |
| | — |
| | — |
|
| Effect on income before tax | (1 | ) | | (5 | ) | | 17 |
|
| Less: Tax provision (benefit) | — |
| | (1 | ) | | 6 |
|
| Effect on net income (loss) | (1 | ) | | (4 | ) | | 11 |
|
| Effect on redeemable noncontrolling interests | (1 | ) | | — |
| | — |
|
| Effect on net income (loss) attributable to AGL | $ | — |
| | $ | (4 | ) | | $ | 11 |
|
____________________
| |
| (1) | See consolidated statements of comprehensive income and Note 22, Other Comprehensive Income, for information on changes in fair value of the FG VIEs’ liabilities with recourse that are attributable to changes in the Company's own credit risk. |
| |
| (2) | Represents change in fair value of consolidated investment vehicles. |
Effect of Consolidating VIEs
on Consolidated Statements of Cash Flows
Inflows (Outflows)
|
| | | | | | | | | | | |
| | Year Ended December 31, |
| | 2019 | | 2018 | | 2017 |
| | (in millions) |
| Effect on cash flows from operating activities | $ | (254 | ) | | $ | 11 |
| | $ | 19 |
|
| Effect on cash flows from investing activities | 259 |
| | 105 |
| | 138 |
|
| Effect on cash flows from financing activities | 9 |
| | (116 | ) | | (157 | ) |
| Total effect on cash flows | $ | 14 |
| | $ | — |
| | $ | — |
|
For 2019, the fair value gains on FG VIEs were attributable to higher recoveries on second lien U.S. RMBS FG VIEs' assets. For 2018 and 2017, the primary driver of the gain in fair value of FG VIEs’ assets and FG VIEs’ liabilities was an increase in the first quartervalue of 2016.the FG VIEs’ assets resulting from improvement in the underlying collateral. The change in fair value of consolidated investment vehicles was a loss of $3 million for the year ended December 31, 2019.
The revenue bond portfolio is comprised primarily of essential service revenue bonds issued by transportation authorities and other utilities, water and sewer authorities, universities and healthcare providers.
Revenue BondsCarrying Value
Sources of Funds
|
| | | | | | | | | | | | | | | | |
| | | As of December 31, 2016 | | As of December 31, 2015 |
| Type | | Fair Value | | Amortized Cost | | Fair Value | | Amortized Cost |
| | | (in millions) |
| Fixed-maturity securities: | | | | | | | | |
| Transportation | | $ | 860 |
| | $ | 824 |
| | $ | 867 |
| | $ | 815 |
|
| Tax backed | | 617 |
| | 601 |
| | 610 |
| | 576 |
|
| Water and sewer | | 545 |
| | 531 |
| | 612 |
| | 576 |
|
| Higher education | | 513 |
| | 499 |
| | 518 |
| | 487 |
|
| Municipal utilities | | 365 |
| | 360 |
| | 414 |
| | 393 |
|
| Healthcare | | 310 |
| | 298 |
| | 344 |
| | 321 |
|
| All others | | 160 |
| | 158 |
| | 145 |
| | 141 |
|
| Subtotal | | 3,370 |
| | 3,271 |
| | 3,510 |
| | 3,309 |
|
| Short-term investments (1) | | — |
| | — |
| | 60 |
| | 60 |
|
| Total | | $ | 3,370 |
| | $ | 3,271 |
| | $ | 3,570 |
| | $ | 3,369 |
|
|
| | | | | | | |
| | As of December 31, |
| | 2019 | | 2018 |
| | (in millions) |
| Fixed-maturity securities (1): | | | |
| Externally managed | $ | 7,978 |
| | $ | 8,909 |
|
| Internally managed | 876 |
| | 1,180 |
|
| Short-term investments | 1,268 |
| | 729 |
|
| Other invested assets-internally managed | | | |
| Equity method investments | 111 |
| | 47 |
|
| Other | 7 |
| | 8 |
|
| Total | $ | 10,240 |
| | $ | 10,873 |
|
____________________
(1) Matured in the first quarter of 2016.
The following tables summarize, for all fixed-maturity securities in an unrealized loss position, the aggregate fair value and gross unrealized loss by length of time the amounts have continuously been in an unrealized loss position.
Fixed-Maturity Securities
Gross Unrealized Loss by Length of Time
As of December 31, 2016
|
| | | | | | | | | | | | | | | | | | | | | | | |
| | Less than 12 months | | 12 months or more | | Total |
| | Fair Value | | Unrealized Loss | | Fair Value | | Unrealized Loss | | Fair Value | | Unrealized Loss |
| | (dollars in millions) |
| Obligations of state and political subdivisions | $ | 1,110 |
| | $ | (38 | ) | | $ | 6 |
| | $ | (1 | ) | | $ | 1,116 |
| | $ | (39 | ) |
| U.S. government and agencies | 87 |
| | (1 | ) | | — |
| | — |
| | 87 |
| | (1 | ) |
| Corporate securities | 492 |
| | (11 | ) | | 118 |
| | (20 | ) | | 610 |
| | (31 | ) |
| Mortgage-backed securities: | | | | | | | |
| |
|
| |
|
|
| RMBS | 391 |
| | (23 | ) | | 94 |
| | (15 | ) | | 485 |
| | (38 | ) |
| CMBS | 165 |
| | (5 | ) | | — |
| | — |
| | 165 |
| | (5 | ) |
| Asset-backed securities | 36 |
| | 0 |
| | 0 |
| | 0 |
| | 36 |
| | 0 |
|
| Foreign government securities | 44 |
| | (5 | ) | | 114 |
| | (27 | ) | | 158 |
| | (32 | ) |
| Total | $ | 2,325 |
| | $ | (83 | ) | | $ | 332 |
| | $ | (63 | ) | | $ | 2,657 |
| | $ | (146 | ) |
| Number of securities(1) | |
| | 622 |
| | |
| | 60 |
| | |
| | 676 |
|
| Number of securities with other-than-temporary impairment | |
| | 8 |
| | |
| | 9 |
| | |
| | 17 |
|
Fixed-Maturity Securities
Gross Unrealized Loss by Length of Time
As of December 31, 2015
|
| | | | | | | | | | | | | | | | | | | | | | | |
| | Less than 12 months | | 12 months or more | | Total |
| | Fair Value | | Unrealized Loss | | Fair Value | | Unrealized Loss | | Fair Value | | Unrealized Loss |
| | (dollars in millions) |
| Obligations of state and political subdivisions | $ | 316 |
| | $ | (10 | ) | | $ | 7 |
| | $ | 0 |
| | $ | 323 |
| | $ | (10 | ) |
| U.S. government and agencies | 77 |
| | 0 |
| | — |
| | — |
| | 77 |
| | 0 |
|
| Corporate securities | 381 |
| | (8 | ) | | 95 |
| | (15 | ) | | 476 |
| | (23 | ) |
| Mortgage-backed securities: | |
| | |
| | |
| | |
| | | | |
| RMBS | 438 |
| | (8 | ) | | 90 |
| | (14 | ) | | 528 |
| | (22 | ) |
| CMBS | 140 |
| | (2 | ) | | 2 |
| | 0 |
| | 142 |
| | (2 | ) |
| Asset-backed securities | 517 |
| | (10 | ) | | — |
| | — |
| | 517 |
| | (10 | ) |
| Foreign government securities | 97 |
| | (4 | ) | | 82 |
| | (7 | ) | | 179 |
| | (11 | ) |
| Total | $ | 1,966 |
| | $ | (42 | ) | | $ | 276 |
| | $ | (36 | ) | | $ | 2,242 |
| | $ | (78 | ) |
| Number of securities(1) | |
| | 335 |
| | |
| | 71 |
| | |
| | 396 |
|
| Number of securities with other-than-temporary impairment | |
| | 9 |
| | |
| | 4 |
| | |
| | 13 |
|
___________________
| |
| (1) | The number8.6% and 10.8% of fixed-maturity securities does not add across because lots consistingare rated BIG as of the same securities have been purchased at different timesDecember 31, 2019 and appear in both categories above (i.e., less than 12 months and 12 months or more). If a security appears in both categories, it is counted only once in the total column.
December 31, 2018, respectively. |
Of the securities in an unrealized loss position for 12 months or more as of December 31, 2016, 41 securities had unrealized losses greater than 10% of book value. The total unrealized loss for these securities as of December 31, 2016 was $59 million. As of December 31, 2015, of the securities in an unrealized loss position for 12 months or more, nine securities had unrealized losses greater than 10% of book value with an unrealized loss of $26 million. The Company has determined that the unrealized losses recorded as of December 31, 2016 and December 31, 2015 were yield related and not the result of other-than-temporary-impairment.
The amortized cost and estimated fair value of available-for-sale fixed-maturity securities by contractual maturity as of December 31, 2016 are shown below. Expected maturities will differ from contractual maturities because borrowers may have the right to call or prepay obligations with or without call or prepayment penalties.
Distribution of Fixed-Maturity Securities and Short-Term Investments
by Contractual MaturitySecurity Type
As of December 31, 20162019
|
| | | | | | | |
| | Amortized Cost | | Estimated Fair Value |
| | (in millions) |
| Due within one year | $ | 482 |
| | $ | 550 |
|
| Due after one year through five years | 1,725 |
| | 1,727 |
|
| Due after five years through 10 years | 2,112 |
| | 2,155 |
|
| Due after 10 years | 4,082 |
| | 4,231 |
|
| Mortgage-backed securities: | |
| | |
|
| RMBS | 998 |
| | 987 |
|
| CMBS | 575 |
| | 583 |
|
| Total | $ | 9,974 |
| | $ | 10,233 |
|
|
| | | | | | | | | | | | | | | | | | | | | | | | | |
| Security Type | | Percent of Total(1) | | Amortized Cost | | Gross Unrealized Gains | | Gross Unrealized Losses | | Estimated Fair Value | | AOCI (2)
Pre-tax Gain
(Loss) on
Securities
with
OTTI | | Weighted Average Credit Rating (3) |
| | | (dollars in millions) |
| Fixed-maturity securities: | | |
| | |
| | |
| | |
| | |
| | |
| | |
| Obligations of state and political subdivisions | | 42 | % | | $ | 4,036 |
| | $ | 305 |
| | $ | (1 | ) | | $ | 4,340 |
| | $ | 40 |
| | AA- |
| U.S. government and agencies | | 1 |
| | 137 |
| | 10 |
| | — |
| | 147 |
| | — |
| | AA+ |
| Corporate securities | | 23 |
| | 2,137 |
| | 103 |
| | (19 | ) | | 2,221 |
| | (8 | ) | | A |
| Mortgage-backed securities(4): | | — |
| | | | | | |
| | | | |
| | |
| RMBS | | 8 |
| | 745 |
| | 37 |
| | (7 | ) | | 775 |
| | 8 |
| | A- |
| CMBS | | 4 |
| | 402 |
| | 17 |
| | — |
| | 419 |
| | — |
| | AAA |
| Asset-backed securities | | 7 |
| | 684 |
| | 38 |
| | (2 | ) | | 720 |
| | 16 |
| | BB+ |
| Non-U.S. government securities | | 2 |
| | 230 |
| | 7 |
| | (5 | ) | | 232 |
| | 3 |
| | AA |
| Total fixed-maturity securities | | 87 |
| | 8,371 |
| | 517 |
| | (34 | ) | | 8,854 |
| | 59 |
| | A+ |
| Short-term investments | | 13 |
| | 1,268 |
| | — |
| | — |
| | 1,268 |
| | — |
| | AAA |
| Total investment portfolio | | 100 | % | | $ | 9,639 |
| | $ | 517 |
| | $ | (34 | ) | | $ | 10,122 |
| | $ | 59 |
| | AA- |
The investment portfolio contains securitiesFixed-Maturity Securities and cash that are either held in trust for the benefit of third party reinsurers in accordance with statutory requirements, invested in a guaranteed investment contract for future claims payments, placed on deposit to fulfill state licensing requirements, or otherwise restricted in the amount of $285 million and $283 million, based on fair value, asShort-Term Investments
by Security Type
As of December 31, 2016 and December 31, 2015, respectively.2018
|
| | | | | | | | | | | | | | | | | | | | | | | | | |
| Security Type | | Percent of Total(1) | | Amortized Cost | | Gross Unrealized Gains | | Gross Unrealized Losses | | Estimated Fair Value | | AOCI
Pre-tax Gain
(Loss) on
Securities
with
OTTI | | Weighted Average Credit Rating (3) |
| | | (dollars in millions) |
| Fixed-maturity securities: | | |
| | |
| | |
| | |
| | |
| | |
| | |
| Obligations of state and political subdivisions | | 45 | % | | $ | 4,761 |
| | $ | 168 |
| | $ | (18 | ) | | $ | 4,911 |
| | $ | 40 |
| | AA- |
| U.S. government and agencies | | 2 |
| | 167 |
| | 9 |
| | (1 | ) | | 175 |
| | — |
| | AA+ |
| Corporate securities | | 20 |
| | 2,175 |
| | 13 |
| | (52 | ) | | 2,136 |
| | (4 | ) | | A |
| Mortgage-backed securities(4): | | |
| | |
| | |
| | |
| | |
| | |
| | |
| RMBS | | 9 |
| | 999 |
| | 17 |
| | (34 | ) | | 982 |
| | (15 | ) | | A- |
| CMBS | | 5 |
| | 542 |
| | 4 |
| | (7 | ) | | 539 |
| | — |
| | AAA |
| Asset-backed securities | | 9 |
| | 942 |
| | 131 |
| | (5 | ) | | 1,068 |
| | 97 |
| | BB |
| Non-U.S. government securities | | 3 |
| | 298 |
| | 2 |
| | (22 | ) | | 278 |
| | — |
| | AA |
| Total fixed-maturity securities | | 93 |
| | 9,884 |
| | 344 |
| | (139 | ) | | 10,089 |
| | 118 |
| | A+ |
| Short-term investments | | 7 |
| | 729 |
| | — |
| | — |
| | 729 |
| | — |
| | AAA |
| Total investment portfolio | | 100 | % | | $ | 10,613 |
| | $ | 344 |
| | $ | (139 | ) | | $ | 10,818 |
| | $ | 118 |
| | A+ |
____________________
| |
| (1) | Based on amortized cost. |
| |
| (2) | Accumulated OCI (AOCI). |
| |
| (3) | Ratings represent the lower of the Moody’s and S&P classifications, except for bonds purchased for loss mitigation or risk management strategies, which use internal ratings classifications. The Company’s portfolio primarily consists of high-quality, liquid instruments. |
| |
| (4) | U.S. government-agency obligations were approximately 42% of mortgage backed securities as of December 31, 2019 and 48% as of December 31, 2018, based on fair value. |
The Company’s investment portfolio also containsin tax-exempt and taxable municipal securities that are held in trustincludes issuances by certain AGL subsidiaries fora wide number of municipal authorities across the benefit of other AGL subsidiaries in accordance with statutoryU.S. and regulatory requirements in the amount of $1,420 million and $1,411 million, based on fair value as of December 31, 2016 and December 31, 2015, respectively.its territories.
The following tables present the fair value of the Company’s pledged securities to secure itsavailable-for-sale portfolio of obligations under its CDS exposure totaled $116 millionof state and $305 million as of December 31, 2016 and December 31, 2015, respectively.
No material investments of the Company were non-income producing for years ended December 31, 2016 and 2015, respectively.
Externally Managed Portfolio
The majority of the investment portfolio is managed by four outside managers. The Company has established detailed guidelines regarding credit quality, exposure to a particular sector and exposure to a particular obligor within a sector. The Company's investment guidelines generally do not permit its outside managers to purchase securities rated lower than A- by S&P or A3 by Moody’s, excluding a 2.5% allocation to corporate securities not rated lower than BBB by S&P or Baa2 by Moody’s.
Internally Managed Portfolio
The investment portfolio tables shown above include both assets managed externally and internally. In the table below, more detailed information is provided for the component of the total investment portfolio that is internally managed (excluding short-term investments). The internally managed portfolio, as defined below, represents approximately 15% and 13% of the investment portfolio, on a fair value basispolitical subdivisions as of December 31, 20162019 and December 31, 2015, respectively. The internally managed portfolio consists primarily of the Company's investments in securities for (i) loss mitigation purposes, (ii) other risk management purposes and (iii) where the Company believes a particular security presents an attractive investment opportunity.2018 by state.
OneFair Value of the Company's strategies for mitigating losses has been to purchase securities it has insured that have expected losses, at discounted prices (loss mitigation securities). In addition, the Company holds other invested assets that were obtained or purchased as partAvailable-for-Sale Portfolio of negotiated settlements with insured counterparties or under the terms
Obligations of our financial guaranties (other risk management assets). During 2016, the Company established an alternative investments group to focus on deploying a portionState and Political Subdivisions
As of the Company's excess capital to pursue acquisitionsDecember 31, 2019 (1)
|
| | | | | | | | | | | | | | | | | | | | | | |
| State | | State General Obligation | | Local General Obligation | | Revenue Bonds | | Total Fair Value | | Amortized Cost | | Average Credit Rating |
| | | (in millions) |
| California | | 68 |
| | 70 |
| | 380 |
| | $ | 518 |
| | 457 |
| | A |
| New York | | $ | 6 |
| | $ | 46 |
| | $ | 408 |
| | $ | 460 |
| | $ | 431 |
| | AA |
| Texas | | 23 |
| | 122 |
| | 287 |
| | 432 |
| | 404 |
| | AA |
| Washington | | 52 |
| | 69 |
| | 181 |
| | 302 |
| | 284 |
| | AA |
| Florida | | 8 |
| | 3 |
| | 233 |
| | 244 |
| | 229 |
| | A+ |
| Illinois | | 18 |
| | 53 |
| | 125 |
| | 196 |
| | 182 |
| | A |
| Massachusetts | | 71 |
| | — |
| | 115 |
| | 186 |
| | 171 |
| | AA |
| Pennsylvania | | 38 |
| | 4 |
| | 95 |
| | 137 |
| | 128 |
| | A+ |
| Georgia | | 11 |
| | 10 |
| | 92 |
| | 113 |
| | 104 |
| | AA- |
| District of Columbia | | 30 |
| | — |
| | 69 |
| | 99 |
| | 94 |
| | AA |
| All others | | 71 |
| | 172 |
| | 915 |
| | 1,158 |
| | 1,080 |
| | AA- |
| Total | | $ | 396 |
| | $ | 549 |
| | $ | 2,900 |
| | $ | 3,845 |
| | $ | 3,564 |
| | AA- |
Fair Value of Available-for-Sale Portfolio of
Obligations of State and develop new business opportunities that complement the Company's financial guaranty business, are in line with its risk profile and benefit from its core competencies. The alternative investments group has been investigating a numberPolitical Subdivisions
As of such opportunities, including, among others, both controlling and non-controlling investments in investment managers.December 31, 2018 (1)
|
| | | | | | | | | | | | | | | | | | | | | | |
| State | | State General Obligation | | Local General Obligation | | Revenue Bonds | | Total Fair Value | | Amortized Cost | | Average Credit Rating |
| | | (in millions) |
| New York | | $ | 5 |
| | $ | 49 |
| | $ | 492 |
| | $ | 546 |
| | $ | 536 |
| | AA |
| Texas | | 19 |
| | 170 |
| | 344 |
| | 533 |
| | 520 |
| | AA |
| California | | 63 |
| | 77 |
| | 378 |
| | 518 |
| | 482 |
| | A |
| Washington | | 80 |
| | 81 |
| | 193 |
| | 354 |
| | 349 |
| | AA |
| Florida | | 8 |
| | 13 |
| | 220 |
| | 241 |
| | 236 |
| | A+ |
| Massachusetts | | 75 |
| | — |
| | 144 |
| | 219 |
| | 211 |
| | AA |
| Illinois | | 16 |
| | 55 |
| | 127 |
| | 198 |
| | 192 |
| | A |
| Pennsylvania | | 35 |
| | 5 |
| | 98 |
| | 138 |
| | 136 |
| | A+ |
| District of Columbia | | 41 |
| | — |
| | 92 |
| | 133 |
| | 131 |
| | AA |
| Georgia | | 10 |
| | 10 |
| | 94 |
| | 114 |
| | 110 |
| | AA- |
| All others | | 96 |
| | 210 |
| | 1,103 |
| | 1,409 |
| | 1,369 |
| | AA- |
| Total | | $ | 448 |
| | $ | 670 |
| | $ | 3,285 |
| | $ | 4,403 |
| | $ | 4,272 |
| | AA- |
____________________
| |
| (1) | Excludes $495 million and $508 million as of December 31, 2019 and 2018, respectively, of pre-refunded bonds, at fair value. The credit ratings are based on the underlying ratings and do not include any benefit from bond insurance. |
Internally Managed PortfolioThe revenue bond portfolio primarily consists of essential service revenue bonds issued by transportation authorities and other utilities, water and sewer authorities and universities.
Carrying Value
|
| | | | | | | |
| | As of December 31, |
| | 2016 | | 2015 |
| | (in millions) |
| Assets purchased for loss mitigation and other risk management purposes: | | | |
| Fixed-maturity securities, at fair value | $ | 1,492 |
| | $ | 1,266 |
|
| Other invested assets | 107 |
| | 114 |
|
| Other | 55 |
| | 55 |
|
| Total | $ | 1,654 |
| | $ | 1,435 |
|
|
| | | | | | | |
| | As of December 31, |
| | 2019 | | 2018 |
| | (in millions) |
| Fixed-maturity securities (1): | | | |
| Externally managed | $ | 7,978 |
| | $ | 8,909 |
|
| Internally managed | 876 |
| | 1,180 |
|
| Short-term investments | 1,268 |
| | 729 |
|
| Other invested assets-internally managed | | | |
| Equity method investments | 111 |
| | 47 |
|
| Other | 7 |
| | 8 |
|
| Total | $ | 10,240 |
| | $ | 10,873 |
|
____________________
| |
| (1) | 8.6% and 10.8% of fixed-maturity securities are rated BIG as of December 31, 2019 and December 31, 2018, respectively. |
Fixed-Maturity Securities and Short-Term Investments
by Security Type
As of December 31, 2019
|
| | | | | | | | | | | | | | | | | | | | | | | | | |
| Security Type | | Percent of Total(1) | | Amortized Cost | | Gross Unrealized Gains | | Gross Unrealized Losses | | Estimated Fair Value | | AOCI (2)
Pre-tax Gain
(Loss) on
Securities
with
OTTI | | Weighted Average Credit Rating (3) |
| | | (dollars in millions) |
| Fixed-maturity securities: | | |
| | |
| | |
| | |
| | |
| | |
| | |
| Obligations of state and political subdivisions | | 42 | % | | $ | 4,036 |
| | $ | 305 |
| | $ | (1 | ) | | $ | 4,340 |
| | $ | 40 |
| | AA- |
| U.S. government and agencies | | 1 |
| | 137 |
| | 10 |
| | — |
| | 147 |
| | — |
| | AA+ |
| Corporate securities | | 23 |
| | 2,137 |
| | 103 |
| | (19 | ) | | 2,221 |
| | (8 | ) | | A |
| Mortgage-backed securities(4): | | — |
| | | | | | |
| | | | |
| | |
| RMBS | | 8 |
| | 745 |
| | 37 |
| | (7 | ) | | 775 |
| | 8 |
| | A- |
| CMBS | | 4 |
| | 402 |
| | 17 |
| | — |
| | 419 |
| | — |
| | AAA |
| Asset-backed securities | | 7 |
| | 684 |
| | 38 |
| | (2 | ) | | 720 |
| | 16 |
| | BB+ |
| Non-U.S. government securities | | 2 |
| | 230 |
| | 7 |
| | (5 | ) | | 232 |
| | 3 |
| | AA |
| Total fixed-maturity securities | | 87 |
| | 8,371 |
| | 517 |
| | (34 | ) | | 8,854 |
| | 59 |
| | A+ |
| Short-term investments | | 13 |
| | 1,268 |
| | — |
| | — |
| | 1,268 |
| | — |
| | AAA |
| Total investment portfolio | | 100 | % | | $ | 9,639 |
| | $ | 517 |
| | $ | (34 | ) | | $ | 10,122 |
| | $ | 59 |
| | AA- |
Fixed-Maturity Securities and Short-Term Investments
by Security Type
As of December 31, 2018
|
| | | | | | | | | | | | | | | | | | | | | | | | | |
| Security Type | | Percent of Total(1) | | Amortized Cost | | Gross Unrealized Gains | | Gross Unrealized Losses | | Estimated Fair Value | | AOCI
Pre-tax Gain
(Loss) on
Securities
with
OTTI | | Weighted Average Credit Rating (3) |
| | | (dollars in millions) |
| Fixed-maturity securities: | | |
| | |
| | |
| | |
| | |
| | |
| | |
| Obligations of state and political subdivisions | | 45 | % | | $ | 4,761 |
| | $ | 168 |
| | $ | (18 | ) | | $ | 4,911 |
| | $ | 40 |
| | AA- |
| U.S. government and agencies | | 2 |
| | 167 |
| | 9 |
| | (1 | ) | | 175 |
| | — |
| | AA+ |
| Corporate securities | | 20 |
| | 2,175 |
| | 13 |
| | (52 | ) | | 2,136 |
| | (4 | ) | | A |
| Mortgage-backed securities(4): | | |
| | |
| | |
| | |
| | |
| | |
| | |
| RMBS | | 9 |
| | 999 |
| | 17 |
| | (34 | ) | | 982 |
| | (15 | ) | | A- |
| CMBS | | 5 |
| | 542 |
| | 4 |
| | (7 | ) | | 539 |
| | — |
| | AAA |
| Asset-backed securities | | 9 |
| | 942 |
| | 131 |
| | (5 | ) | | 1,068 |
| | 97 |
| | BB |
| Non-U.S. government securities | | 3 |
| | 298 |
| | 2 |
| | (22 | ) | | 278 |
| | — |
| | AA |
| Total fixed-maturity securities | | 93 |
| | 9,884 |
| | 344 |
| | (139 | ) | | 10,089 |
| | 118 |
| | A+ |
| Short-term investments | | 7 |
| | 729 |
| | — |
| | — |
| | 729 |
| | — |
| | AAA |
| Total investment portfolio | | 100 | % | | $ | 10,613 |
| | $ | 344 |
| | $ | (139 | ) | | $ | 10,818 |
| | $ | 118 |
| | A+ |
____________________
| |
| (1) | Based on amortized cost. |
| |
| (2) | Accumulated OCI (AOCI). |
| |
| (3) | Ratings represent the lower of the Moody’s and S&P classifications, except for bonds purchased for loss mitigation or risk management strategies, which use internal ratings classifications. The Company’s portfolio primarily consists of high-quality, liquid instruments. |
| |
| (4) | U.S. government-agency obligations were approximately 42% of mortgage backed securities as of December 31, 2019 and 48% as of December 31, 2018, based on fair value. |
The Company’s investment portfolio in tax-exempt and taxable municipal securities includes issuances by a wide number of municipal authorities across the U.S. and its territories.
The following tables present the fair value of the Company’s available-for-sale portfolio of obligations of state and political subdivisions as of December 31, 2019 and December 31, 2018 by state.
Fair Value of Available-for-Sale Portfolio of
Obligations of State and Political Subdivisions
As of December 31, 2019 (1)
|
| | | | | | | | | | | | | | | | | | | | | | |
| State | | State General Obligation | | Local General Obligation | | Revenue Bonds | | Total Fair Value | | Amortized Cost | | Average Credit Rating |
| | | (in millions) |
| California | | 68 |
| | 70 |
| | 380 |
| | $ | 518 |
| | 457 |
| | A |
| New York | | $ | 6 |
| | $ | 46 |
| | $ | 408 |
| | $ | 460 |
| | $ | 431 |
| | AA |
| Texas | | 23 |
| | 122 |
| | 287 |
| | 432 |
| | 404 |
| | AA |
| Washington | | 52 |
| | 69 |
| | 181 |
| | 302 |
| | 284 |
| | AA |
| Florida | | 8 |
| | 3 |
| | 233 |
| | 244 |
| | 229 |
| | A+ |
| Illinois | | 18 |
| | 53 |
| | 125 |
| | 196 |
| | 182 |
| | A |
| Massachusetts | | 71 |
| | — |
| | 115 |
| | 186 |
| | 171 |
| | AA |
| Pennsylvania | | 38 |
| | 4 |
| | 95 |
| | 137 |
| | 128 |
| | A+ |
| Georgia | | 11 |
| | 10 |
| | 92 |
| | 113 |
| | 104 |
| | AA- |
| District of Columbia | | 30 |
| | — |
| | 69 |
| | 99 |
| | 94 |
| | AA |
| All others | | 71 |
| | 172 |
| | 915 |
| | 1,158 |
| | 1,080 |
| | AA- |
| Total | | $ | 396 |
| | $ | 549 |
| | $ | 2,900 |
| | $ | 3,845 |
| | $ | 3,564 |
| | AA- |
Fair Value of Available-for-Sale Portfolio of
Obligations of State and Political Subdivisions
As of December 31, 2018 (1)
|
| | | | | | | | | | | | | | | | | | | | | | |
| State | | State General Obligation | | Local General Obligation | | Revenue Bonds | | Total Fair Value | | Amortized Cost | | Average Credit Rating |
| | | (in millions) |
| New York | | $ | 5 |
| | $ | 49 |
| | $ | 492 |
| | $ | 546 |
| | $ | 536 |
| | AA |
| Texas | | 19 |
| | 170 |
| | 344 |
| | 533 |
| | 520 |
| | AA |
| California | | 63 |
| | 77 |
| | 378 |
| | 518 |
| | 482 |
| | A |
| Washington | | 80 |
| | 81 |
| | 193 |
| | 354 |
| | 349 |
| | AA |
| Florida | | 8 |
| | 13 |
| | 220 |
| | 241 |
| | 236 |
| | A+ |
| Massachusetts | | 75 |
| | — |
| | 144 |
| | 219 |
| | 211 |
| | AA |
| Illinois | | 16 |
| | 55 |
| | 127 |
| | 198 |
| | 192 |
| | A |
| Pennsylvania | | 35 |
| | 5 |
| | 98 |
| | 138 |
| | 136 |
| | A+ |
| District of Columbia | | 41 |
| | — |
| | 92 |
| | 133 |
| | 131 |
| | AA |
| Georgia | | 10 |
| | 10 |
| | 94 |
| | 114 |
| | 110 |
| | AA- |
| All others | | 96 |
| | 210 |
| | 1,103 |
| | 1,409 |
| | 1,369 |
| | AA- |
| Total | | $ | 448 |
| | $ | 670 |
| | $ | 3,285 |
| | $ | 4,403 |
| | $ | 4,272 |
| | AA- |
____________________
| |
| (1) | Excludes $495 million and $508 million as of December 31, 2019 and 2018, respectively, of pre-refunded bonds, at fair value. The credit ratings are based on the underlying ratings and do not include any benefit from bond insurance. |
The revenue bond portfolio primarily consists of essential service revenue bonds issued by transportation authorities and other utilities, water and sewer authorities and universities.
Revenue Bonds
Sources of Funds
|
| | | | | | | | | | | | | | | | |
| | | As of December 31, 2019 | | As of December 31, 2018 |
| Type | | Fair Value | | Amortized Cost | | Fair Value | | Amortized Cost |
| | | (in millions) |
| Transportation | | $ | 916 |
| | $ | 835 |
| | $ | 967 |
| | $ | 925 |
|
| Higher education | | 488 |
| | 456 |
| | 557 |
| | 543 |
|
| Water and sewer | | 453 |
| | 422 |
| | 580 |
| | 566 |
|
| Tax backed | | 426 |
| | 397 |
| | 471 |
| | 458 |
|
| Healthcare | | 236 |
| | 220 |
| | 278 |
| | 270 |
|
| Municipal utilities | | 234 |
| | 212 |
| | 287 |
| | 267 |
|
| All others | | 147 |
| | 137 |
| | 145 |
| | 143 |
|
| Total | | $ | 2,900 |
| | $ | 2,679 |
| | $ | 3,285 |
| | $ | 3,172 |
|
The following tables summarize, for all fixed-maturity securities in an unrealized loss position, the aggregate fair value and gross unrealized loss by length of time the amounts have continuously been in an unrealized loss position.
Fixed-Maturity Securities
Gross Unrealized Loss by Length of Time
As of December 31, 2019
|
| | | | | | | | | | | | | | | | | | | | | | | |
| | Less than 12 months | | 12 months or more | | Total |
| | Fair Value | | Unrealized Loss | | Fair Value | | Unrealized Loss | | Fair Value | | Unrealized Loss |
| | (dollars in millions) |
| Obligations of state and political subdivisions | $ | 45 |
| | $ | (1 | ) | | $ | — |
| | $ | — |
| | $ | 45 |
| | $ | (1 | ) |
| U.S. government and agencies | 5 |
| | — |
| | 5 |
| | — |
| | 10 |
| | — |
|
| Corporate securities | 61 |
| | — |
| | 119 |
| | (19 | ) | | 180 |
| | (19 | ) |
| Mortgage-backed securities: | | | | | | | |
| |
|
| |
|
|
| RMBS | 10 |
| | — |
| | 75 |
| | (7 | ) | | 85 |
| | (7 | ) |
| CMBS | — |
| | — |
| | 4 |
| | — |
| | 4 |
| | — |
|
| Asset-backed securities | 24 |
| | — |
| | 183 |
| | (2 | ) | | 207 |
| | (2 | ) |
| Non-U.S. government securities | — |
| | — |
| | 56 |
| | (5 | ) | | 56 |
| | (5 | ) |
| Total | $ | 145 |
| | $ | (1 | ) | | $ | 442 |
| | $ | (33 | ) | | $ | 587 |
| | $ | (34 | ) |
| Number of securities | |
| | 57 |
| | |
| | 119 |
| | |
| | 176 |
|
| Number of securities with OTTI | |
| | 1 |
| | |
| | 7 |
| | |
| | 8 |
|
Fixed-Maturity Securities
Gross Unrealized Loss by Length of Time
As of December 31, 2018
|
| | | | | | | | | | | | | | | | | | | | | | | |
| | Less than 12 months | | 12 months or more | | Total |
| | Fair Value | | Unrealized Loss | | Fair Value | | Unrealized Loss | | Fair Value | | Unrealized Loss |
| | (dollars in millions) |
| Obligations of state and political subdivisions | $ | 195 |
| | $ | (4 | ) | | $ | 658 |
| | $ | (14 | ) | | $ | 853 |
| | $ | (18 | ) |
| U.S. government and agencies | 11 |
| | — |
| | 24 |
| | (1 | ) | | 35 |
| | (1 | ) |
| Corporate securities | 836 |
| | (19 | ) | | 522 |
| | (33 | ) | | 1,358 |
| | (52 | ) |
| Mortgage-backed securities: | |
| | |
| | |
| | |
| | | | |
| RMBS | 85 |
| | (2 | ) | | 447 |
| | (32 | ) | | 532 |
| | (34 | ) |
| CMBS | 111 |
| | (1 | ) | | 164 |
| | (6 | ) | | 275 |
| | (7 | ) |
| Asset-backed securities | 322 |
| | (4 | ) | | 38 |
| | (1 | ) | | 360 |
| | (5 | ) |
| Non-U.S. government securities | 83 |
| | (4 | ) | | 99 |
| | (18 | ) | | 182 |
| | (22 | ) |
| Total | $ | 1,643 |
| | $ | (34 | ) | | $ | 1,952 |
| | $ | (105 | ) | | $ | 3,595 |
| | $ | (139 | ) |
| Number of securities (1) | |
| | 417 |
| | |
| | 608 |
| | |
| | 997 |
|
| Number of securities with OTTI (1) | |
| | 22 |
| | |
| | 22 |
| | |
| | 42 |
|
___________________
| |
| (1) | The number of securities does not add across because lots consisting of the same securities have been purchased at different times and appear in both categories above (i.e., less than 12 months and 12 months or more). If a security appears in both categories, it is counted only once in the total column. |
Of the securities in an unrealized loss position for 12 months or more as of December 31, 2019 and December 31, 2018, 19 and 38 securities, respectively, had unrealized losses greater than 10% of book value. The total unrealized loss for these securities was $25 million as of December 31, 2019 and $43 million as of December 31, 2018. The Company considered the credit quality, cash flows, interest rate movements, ability to hold a security to recovery and intent to sell a security in determining whether a security had a credit loss. The Company has determined that the unrealized losses recorded as of December 31, 2019 and December 31, 2018 were not related to credit quality.
The amortized cost and estimated fair value of available-for-sale fixed-maturity securities by contractual maturity as of December 31, 2019 are shown below. Expected maturities will differ from contractual maturities because borrowers may have the right to call or prepay obligations with or without call or prepayment penalties.
Distribution of Fixed-Maturity Securities
by Contractual Maturity
As of December 31, 2019
|
| | | | | | | |
| | Amortized Cost | | Estimated Fair Value |
| | (in millions) |
| Due within one year | $ | 326 |
| | $ | 334 |
|
| Due after one year through five years | 1,538 |
| | 1,591 |
|
| Due after five years through 10 years | 2,022 |
| | 2,128 |
|
| Due after 10 years | 3,338 |
| | 3,607 |
|
| Mortgage-backed securities: | |
| | |
|
| RMBS | 745 |
| | 775 |
|
| CMBS | 402 |
| | 419 |
|
| Total | $ | 8,371 |
| | $ | 8,854 |
|
Based on fair value, investments and restricted assets that are either held in trust for the benefit of third party ceding insurers in accordance with statutory requirements, placed on deposit to fulfill state licensing requirements, or otherwise pledged or restricted totaled $280 million and $266 million, as of December 31, 2019 and December 31, 2018, respectively. The investment portfolio also contains securities that are held in trust by certain AGL subsidiaries or otherwise restricted for the benefit of other AGL subsidiaries in accordance with statutory and regulatory requirements in the amount of $1,502 million and $1,855 million, based on fair value as of December 31, 2019 and December 31, 2018, respectively.
No material investments of the Company were non-income producing for years ended December 31, 2019 and 2018, respectively.
| |
| 11. | Contracts Accounted for as Credit Derivatives |
The Company has a portfolio of financial guaranty contracts that meet the definition of a derivative in accordance with GAAP (primarily CDS). The credit derivative portfolio also includes interest rate swaps.
Credit derivative transactions are governed by International Swaps and Derivatives Association, Inc. documentation and have certain characteristics that differ from financial guaranty insurance contracts. For example, the Company’s control rights with respect to a reference obligation under a credit derivative may be more limited than when the Company issues a financial guaranty insurance contract. In addition, there are more circumstances under which the Company may be obligated to make payments. Similar to a financial guaranty insurance contract, the Company would be obligated to pay if the obligor failed to make a scheduled payment of principal or interest in full. However, the Company may also be required to pay if the obligor becomes bankrupt or if the reference obligation were restructured if, after negotiation, those credit events are specified in the documentation for the credit derivative transactions. Furthermore, the Company may be required to make a payment due to an event that is unrelated to the performance of the obligation referenced in the credit derivative. If events of default or termination events specified in the credit derivative documentation were to occur, the non-defaulting or the non-affected party, which may be either the Company or the counterparty, depending upon the circumstances, may decide to terminate a credit derivative prior to maturity. In that case, the Company may be required to make a termination payment to its swap counterparty upon such termination. Absent such an event of default or termination event, the Company may not unilaterally terminate a CDS contract; however, the Company on occasion has mutually agreed with various counterparties to terminate certain CDS transactions.
Accounting Policy
Credit derivatives are recorded at fair value. Changes in fair value are recorded in “net change in fair value of credit derivatives” on the consolidated statement of operations. The fair value of credit derivatives is reflected as either net assets or net liabilities determined on a contract by contract basis in the Company's consolidated balance sheets. See Note 9, Fair Value Measurement, for a discussion on the fair value methodology for credit derivatives.
Credit Derivative Net Par Outstanding by Sector
The components of the Company’s credit derivative net par outstanding are presented in the table below. The estimated remaining weighted average life of credit derivatives was 11.5 years and 11.6 years as of at December 31, 2019 and December 31, 2018, respectively.
Credit Derivatives (1)
|
| | | | | | | | | | | | | | | | |
| | | As of December 31, 2019 | | As of December 31, 2018 (2) |
| | | Net Par Outstanding | | Net Fair Value Asset (Liability) | | Net Par Outstanding | | Net Fair Value Asset (Liability) |
| | | (in millions) |
| | | | | | | | | |
| U.S public finance | | $ | 1,942 |
| | $ | (83 | ) | | $ | 1,783 |
| | $ | (65 | ) |
| Non-U.S public finance | | 2,676 |
| | (39 | ) | | 2,807 |
| | (51 | ) |
| U.S structured finance | | 1,206 |
| | (58 | ) | | 1,465 |
| | (85 | ) |
| Non-U.S structured finance | | 132 |
| | (5 | ) | | 127 |
| | (6 | ) |
| Total | | $ | 5,956 |
| | $ | (185 | ) | | $ | 6,182 |
| | $ | (207 | ) |
____________________
(1) Expected recoveries were $4 million as of December 31, 2019 and $2 million as of December 31, 2018.
| |
| (2) | Prior year presentation has been conformed to the current year's presentation. |
Distribution of Credit Derivative Net Par Outstanding by Internal Rating
|
| | | | | | | | | | | | | | |
| | | As of December 31, 2019 | | As of December 31, 2018 |
| Ratings | | Net Par Outstanding | | % of Total | | Net Par Outstanding | | % of Total |
| | | (dollars in millions) |
| AAA | | $ | 1,730 |
| | 29.0 | % | | $ | 1,813 |
| | 29.4 | % |
| AA | | 1,695 |
| | 28.5 |
| | 1,690 |
| | 27.3 |
|
| A | | 1,110 |
| | 18.6 |
| | 1,171 |
| | 18.9 |
|
| BBB | | 1,292 |
| | 21.7 |
| | 1,351 |
| | 21.9 |
|
| BIG (1) | | 129 |
| | 2.2 |
| | 157 |
| | 2.5 |
|
| Credit derivative net par outstanding | | $ | 5,956 |
| | 100.0 | % | | $ | 6,182 |
| | 100.0 | % |
____________________
| |
| (1) | All BIG credit derivatives are U.S. RMBS transactions. |
Fair Value of Credit Derivatives
Net Change in Fair Value of Credit Derivative Gains (Losses)
|
| | | | | | | | | | | |
| | Year Ended December 31, |
| | 2019 | | 2018 | | 2017 |
| | (in millions) |
| Realized gains on credit derivatives | $ | 8 |
| | $ | 9 |
| | $ | 17 |
|
| Net credit derivative losses (paid and payable) recovered and recoverable and other settlements | (35 | ) | | (25 | ) | | (27 | ) |
| Realized gains (losses) and other settlements | (27 | ) | | (16 | ) | | (10 | ) |
| Net unrealized gains (losses) | 21 |
| | 128 |
| | 121 |
|
| Net change in fair value of credit derivatives | $ | (6 | ) | | $ | 112 |
| | $ | 111 |
|
Realized losses and other settlements for 2019 were primarily due to payments related to various U.S. structured finance transactions, including those for a final maturity paydown and for which there was an offsetting unrealized gain. Realized losses and other settlements for 2018 and 2017 were primarily due to a paydown of a U.S. structured finance transaction, for which there was an offsetting unrealized gain.
During 2019, non-credit impairment fair value gains were generated primarily as a result of price improvements on the underlying collateral of the Company's CDS. These unrealized fair value gains were partially offset by unrealized fair value losses resulting from wider implied net spreads driven by the decreased market cost to buy protection in AGC’s name during the period. For those CDS transactions that were pricing at or above their floor levels, when the cost of purchasing CDS protection on AGC, which management refers to as the CDS spread on AGC, decreased, the implied spreads that the Company would expect to receive on these transactions increased.
During 2018, non-credit impairment fair value gains were primarily generated by CDS terminations, run-off of CDS par and price improvements on the underlying collateral of the Company’s CDS. In addition, unrealized fair value gains were generated by the increase in credit given to the primary insurer on one of the Company's second-to-pay CDS policies during the period. The unrealized fair value gains were partially offset by unrealized fair value losses resulting from wider implied net spreads driven by the decreased cost to buy protection in AGC’s name, as the market cost of AGC’s credit protection decreased during the period.
During 2017, non-credit impairment fair value gains were primarily generated by CDS terminations, run-off of net par outstanding, and price improvements on the underlying collateral of the Company’s CDS. The majority of the CDS transactions that were terminated were as a result of settlement agreements with several CDS counterparties. During 2017, the cost to buy protection in AGC’s name, specifically the five-year CDS spread, did not change materially during the period, and therefore did not have a material impact on the Company’s unrealized fair value gains and losses on CDS.
The impact of changes in credit spreads will vary based upon the volume, tenor, interest rates, and other market conditions at the time these fair values are determined. In addition, since each transaction has unique collateral and structural terms, the underlying change in fair value of each transaction may vary considerably. The fair value of credit derivative contracts also reflects the change in the Company’s own credit cost based on the price to purchase credit protection on AGC. The Company determines its own credit risk based on quoted CDS prices traded on the Company at each balance sheet date.
CDS Spread on AGC (in bps)
|
| | | | | | | | |
| | As of
December 31, 2019 | | As of
December 31, 2018 | | As of
December 31, 2017 |
| Five-year CDS spread | 41 |
| | 110 |
| | 163 |
|
| One-year CDS spread | 9 |
| | 22 |
| | 70 |
|
Fair Value of Credit Derivative Assets (Liabilities)
and Effect of AGC
Credit Spread
|
| | | | | | | |
| | As of
December 31, 2019 | | As of
December 31, 2018 |
| | (in millions) |
| Fair value of credit derivatives before effect of AGC credit spread | $ | (261 | ) | | $ | (407 | ) |
| Plus: Effect of AGC credit spread | 76 |
| | 200 |
|
| Net fair value of credit derivatives | $ | (185 | ) | | $ | (207 | ) |
The fair value of CDS contracts at December 31, 2019, before considering the benefit applicable to AGC’s credit spreads, is a direct result of the relatively wide credit spreads of certain underlying credits generally due to the long tenor of these credits.
Collateral Posting for Certain Credit Derivative Contracts
The transaction documentation with 1 counterparty for $180 million in CDS net par insured by the Company requires the Company to post collateral, subject to a $180 million cap, to secure its obligation to make payments under such contracts. Eligible collateral is generally cash or U.S. government or agency securities; eligible collateral other than cash is valued at a discount to the face amount. As of December 31, 2019, AGC did not have to post collateral to satisfy these requirements.
| |
11.12. | Asset Management Fees |
Accounting Policy
In connection with the BlueMountain Acquisition, the FASB's new revenue recognition guidance, Topic 606 Revenue from Contracts with Customers (ASC 606), is applicable to the Company. Management, CLO and performance fees earned by Assured Investment Management are accounted for as contracts with customers. Under the guidance for contracts with customers, an entity is required to (a) identify the contract(s) with a customer, (b) identify the performance obligations in the contract, (c) determine the transaction price, (d) allocate the transaction price to the performance obligations in the contract, and (e) recognize revenue when (or as) the entity satisfies a performance obligation. In determining the transaction price, an entity may include variable consideration only to the extent that it is probable that a significant reversal in the amount of cumulative revenue recognized would not occur when the uncertainty associated with the variable consideration is resolved.
Management and CLO fees are derived from providing professional services to manage investment funds and CLOs. Investment management services are satisfied over time as the services are provided and are typically based on a percentage of the value of the client’s assets under management. Performance fee revenue will fluctuate from period to period and may not correlate with general market changes, since most of these fees are driven by absolute performance. Performance fee revenues are generated on certain management contracts when performance hurdles are achieved. Such fee revenues are recorded when the contractual performance criteria have been met and when it is probable that a significant reversal of revenue recognized will not occur in future reporting periods. Given the uniqueness of each fee arrangement, performance fee contracts are evaluated on an individual basis to determine the timing of revenue recognition.
Asset Management Fees
Management and CLO Fees
The Company receives a management fee in exchange for providing investment advisory and management services. These annual management fees are generally as follows.
Fees range from 0.70% to 2.00% per annum calculated on either the beginning of the month or quarter, or month-end NAV of the respective funds.
For the Company's management or servicing of the Assured Investment Management CLOs the Company receives, generally 0.35% to 0.50% (combined senior investment management fee and subordinated investment management fee) per annum based on NAV, and 20% per annum of the remaining interest proceeds and principal proceeds after the incentive management fee threshold has been satisfied. The portion of these fees that pertains to the investment by Assured Investment Management funds is typically rebated to the Assured Investment Management funds.
The Company may waive some or the entire management fee with respect to any investor. Certain current and former employees of the Company who have investments in the Assured Investment Management funds are not charged any management fees.
Performance Fees
In accordance with the investment management agreements, and by serving as the general partner, managing member or managing general partner, the Company also receives performance fees. Annual performance fee rates are generally as follows:
Range from 10% to 20% of the net profits in excess of the high-water mark for the respective fund, or
Range from 18% to 30% of the total cash received by investors in excess of certain benchmarks, or
30% of the net profits in excess of the high-water mark and a credit for management fees
Performance fees related to certain Assured Investment Management funds may be subject to future clawback and repayment. Determining the amount of performance fees to record is subject to qualitative and quantitative factors including where the fund is in its life-cycle, whether the Company has received or is entitled to receive performance fees and potential sales of fund investments. To the extent that performance fees have been received, but not earned, the company will recognize a liability for unearned revenue in the consolidated balance sheets. The general partner has the right, in its sole discretion, to
require certain Assured Investment Management funds to distribute to the general partner an amount equal to its presumed tax liability attributable to the allocated taxable income relating to performance fees with respect to such fiscal year and are contractually not subject to clawback. There were no tax distributions recorded during 2019.
The Company may waive some or all of the performance fees with respect to any investor. Certain current and former employees of the Company who have investments in the Assured Investment Management funds are not charged any performance fees.
The following table presents the sources of asset management fees since the BlueMountain Acquisition Date:
Asset Management Fees
|
| | | |
| | Year Ended
December 31, 2019 |
| | (in millions) |
| Management fees: | |
| CLOs (1) | $ | 3 |
|
| Opportunity funds | 2 |
|
| Wind-down funds | 13 |
|
| Total management fees | 18 |
|
| Performance fees | 4 |
|
| Total asset management fees | $ | 22 |
|
_____________________
| |
| (1) | Gross management fees from CLOs, before rebates were $11 million. |
The Company had management and performance fees receivable, which are included in other assets on the consolidated balance sheets, of $9 million as of December 31, 2019. The Company had 0 unearned revenues as of December 31, 2019.
| |
| 13. | Goodwill and Other Intangible Assets |
Accounting Policy
Goodwill is attributable to the BlueMountain Acquisition in the Asset Management segment and represents the excess cost over identifiable net assets of an acquired business. The Company tests goodwill annually for impairment or more frequently if circumstances indicate an impairment may have occurred. The goodwill impairment analysis is performed at the reporting unit level which is equal to the Company's operating segment level. If, after assessing qualitative factors, the Company believes that it is more likely than not that the fair value of the reporting unit is less than its carrying amount, the Company will evaluate impairment quantitatively to determine and record the amount of goodwill impairment as the excess of the carrying amount of the reporting unit over its fair value. Inherent in such fair value determinations are certain judgments and estimates relating to future cash flows, including the Company’s interpretation of current economic indicators and market valuations, and assumptions about the Company’s strategic plans with regard to its operations. Due to the uncertainties associated with such estimates, actual results could differ from such estimates.
The Company's finite-lived intangible assets consist primarily of contractual rights to earn future asset management fees from the acquired management and CLO contracts as well as a CLO distribution network. Such finite-lived intangible assets are recorded at fair value on the date of acquisition and amortized over their estimated useful lives.
The Company tests finite‑lived intangible assets for impairment if certain events occur or circumstances change indicating that the carrying amount of the intangible asset may not be recoverable. The Company evaluates impairment by comparing the estimated fair value attributable to the intangible asset being evaluated with its carrying amount. If an impairment is determined to exist by management, the Company accelerates amortization expense so that the carrying amount represents fair value.
The Company's indefinite-lived intangible assets consist of the value of insurance licenses acquired in prior business combinations. The Company assesses indefinite-lived intangible assets for impairment annually or more frequently if
circumstances indicate an impairment may have occurred. If a qualitative assessment reveals that it is more-likely-than-not that the asset is impaired, the Company calculates an updated fair value.
The following table summarizes the carrying value for the Company's goodwill and other intangible assets:
Goodwill and Other Intangible Assets
|
| | | | | | | | | |
| | Weighted Average Amortization Period as of | | As of December 31 |
| | December 31, 2019 | | 2019 | | 2018 |
| | | | (in millions) |
| Goodwill (1) | | | $ | 117 |
| | $ | — |
|
| Finite-lived intangible assets: | | | | | |
| CLO contracts | 8.8 years | | 42 |
| | — |
|
| Investment management contracts | 4.5 years | | 24 |
| | — |
|
| CLO distribution network | 4.8 years | | 9 |
| | — |
|
| Trade name | 9.8 years | | 3 |
| | — |
|
| Favorable sublease | 4.2 years | | 1 |
| | — |
|
| Lease-related intangibles | 7.0 years | | 3 |
| | 3 |
|
| Finite-lived intangible assets, gross | 7.0 years | | 82 |
| | 3 |
|
| Accumulated amortization | | | (5 | ) | | (1 | ) |
| Finite-lived intangible assets, net | | | 77 |
| | 2 |
|
| Licenses (indefinite-lived) | | | 22 |
| | 22 |
|
| Total goodwill and other intangible assets | | | $ | 216 |
| | $ | 24 |
|
_____________________
| |
| (1) | Includes goodwill allocated to the European subsidiaries of BlueMountain. The balance changes due to foreign currency translation. The amount of goodwill deductible for tax purposes was approximately $115 million as of December 31, 2019. |
Goodwill and substantially all finite-lived intangible assets relate to the Company’s acquisition of BlueMountain on October 1, 2019. To date, there have been 0 impairments of goodwill or intangible assets. Amortization expense, which is recorded in other operating expenses in the consolidated statements of operations, associated with finite-lived intangible assets was $3 million for the year ended December 31, 2019, and $1 million in 2017. For 2018, amortization expense was de minimis.
As of December 31, 2019, future annual amortization of finite-lived intangible assets for the years 2020 through 2024 and thereafter is estimated to be:
Estimated Future Amortization Expense
for Finite-Lived Intangible Assets
|
| | | | |
| | | As of December 31, 2019 |
| Year | | (in millions) |
| 2020 | $ | 13 |
|
| 2021 | 12 |
|
| 2022 | 11 |
|
| 2023 | 11 |
|
| 2024 | 10 |
|
| Thereafter | 20 |
|
| Total | $ | 77 |
|
| |
| 14. | Variable Interest Entities |
Accounting Policy
The types of entities the Company assesses for consolidation principally include (1) entities whose debt obligations the insurance subsidiaries insures in its financial guaranty business, and (2) investment vehicles such as collateralized financing entities and investment funds managed by the asset management subsidiaries, in which the Company has a variable interest. For each of these types of entities, the Company assesses whether it is the primary beneficiary. If the Company concludes that it is the primary beneficiary, it consolidates the VIE in the Company's financial statements and eliminates the effects of intercompany transactions with the insurance subsidiaries and intercompany transactions between consolidated VIEs.
The Company determines whether it is the primary beneficiary of a VIE at the time it becomes involved with a VIE and continuously reconsiders the conclusion at each reporting date. In determining whether it is the primary beneficiary, the Company evaluates its direct and indirect interests in the VIE. The primary beneficiary of a VIE is the enterprise that has both 1) the power to direct the activities of a VIE that most significantly impact the entity's economic performance; and 2) the obligation to absorb losses of the entity that could potentially be significant to the VIE or the right to receive benefits from the entity that could potentially be significant to the VIE.
Financial Guaranty Variable Interest Entities
The Company provides financial guaranties with respect to debt obligations of special purpose entities, including VIEs but does not act as the servicer or collateral manager for any VIE obligations guaranteed by its insurance subsidiaries. The transaction structure generally provides certain financial protections to the Company. This financial protection can take several forms, the most common of which are overcollateralization, first loss protection (or subordination) and excess spread. In the case of overcollateralization (i.e., the principal amount of the securitized assets exceeds the principal amount of the structured finance obligations guaranteed by the Company), the structure allows defaults of the securitized assets before a default is experienced on the structured finance obligation guaranteed by the Company. In the case of first loss, the Company's financial guaranty insurance policy only covers a senior layer of losses experienced by multiple obligations issued by the VIEs. The first loss exposure with respect to the assets is either retained by the seller or sold off in the form of equity or mezzanine debt to other investors. In the case of excess spread, the financial assets contributed to VIEs, generate interest income that are in excess of the interest payments on the debt issued by the VIE. Such excess spread is typically distributed through the transaction’s cash flow waterfall and may be used to create additional credit enhancement, applied to redeem debt issued by the VIE (thereby, creating additional overcollateralization), or distributed to equity or other investors in the transaction.
Assured Guaranty is not primarily liable for the debt obligations issued by the VIEs it insures and would only be required to make payments on those insured debt obligations in the event that the issuer of such debt obligations defaults on any principal or interest due and only for the amount of the shortfall. AGL’s and its subsidiaries’ creditors do not have any rights with regard to the collateral supporting the debt issued by the FG VIEs. Proceeds from sales, maturities, prepayments and interest from such underlying collateral may only be used to pay debt service on FG VIEs’ liabilities. Net fair value gains and losses on FG VIEs are expected to reverse to 0 at maturity of the FG VIEs’ debt, except for net premiums received and net claims paid by Assured Guaranty under the financial guaranty insurance contract. The Company’s estimate of expected loss to be paid for FG VIEs is included in Note 6, Expected Loss to be Paid.
As part of the terms of its financial guaranty contracts, the Company, under its insurance contract, obtains certain protective rights with respect to the VIE that give the Company additional controls over a VIE. These protective rights are triggered by the occurrence of certain events, such as failure to be in compliance with a covenant due to poor deal performance or a deterioration in a servicer or collateral manager's financial condition. At deal inception, the Company typically is not deemed to control a VIE; however, once a trigger event occurs, the Company's control of the VIE typically increases. The Company continuously evaluates its power to direct the activities that most significantly impact the economic performance of VIEs that have debt obligations insured by the Company and, accordingly, where the Company is obligated to absorb VIE losses or receive benefits that could potentially be significant to the VIE. The Company is deemed to be the control party for certain VIEs under GAAP, typically when its protective rights give it the power to both terminate and replace the deal servicer, which are characteristics specific to the Company's financial guaranty contracts. If the protective rights that could make the Company the control party have not been triggered, then the VIE is not consolidated. If the Company is deemed no longer to have those protective rights, the VIE is deconsolidated.
The FG VIEs’ liabilities that are insured by the Company are considered to be with recourse, because the Company guarantees the payment of principal and interest regardless of the performance of the related FG VIEs’ assets. FG VIEs’
liabilities that are not insured by the Company are considered to be without recourse, because the payment of principal and interest of these liabilities is wholly dependent on the performance of the FG VIEs’ assets.
The Company has limited contractual rights to obtain the financial records of its consolidated FG VIEs. The FG VIEs do not prepare separate GAAP financial statements; therefore, the Company compiles GAAP financial information for them based on trustee reports prepared by and received from third parties. Such trustee reports are not available to the Company until approximately 30 days after the end of any given period. The time required to perform adequate reconciliations and analyses of the information in these trustee reports results in a one quarter lag in reporting the FG VIEs’ activities. The Company records the fair value of FG VIEs’ assets and liabilities based on modeled prices. The Company updates the model assumptions each reporting period for the most recent available information, which incorporates the impact of material events that may have occurred since the quarter lag date. The net change in the fair value of consolidated FG VIEs’ assets and liabilities is recorded in "fair value gains (losses) on FG VIEs" in the consolidated statements of operations, except for change in fair value of FG VIEs’ liabilities with recourse caused by changes in ISCR which is now separately presented in OCI, effective January 1, 2018. The inception to date change in fair value of the FG VIEs’ liabilities with recourse attributable to the ISCR is calculated by holding all current period assumptions constant for each security and isolating the effect of the change in the Company’s CDS spread from the most recent date of consolidation to the current period. In general, if the Company’s CDS spread tightens, more value will be assigned to the Company’s credit; however, if the Company’s CDS widens, less value is assigned to the Company’s credit. Interest income and interest expense are derived from the trustee reports and also included in "fair value gains (losses) on FG VIEs." The Company has elected the fair value option for assets and liabilities classified as FG VIEs’ assets and liabilities because the carrying amount transition method was not practical.
Number of FG VIEs Consolidated
|
| | | | | | | | |
| | Year Ended December 31, |
| | 2019 | | 2018 | | 2017 |
| | |
| Beginning of year | 31 |
| | 32 |
| | 32 |
|
| Consolidated | 1 |
| | — |
| | 2 |
|
| Deconsolidated | (3 | ) | | (1 | ) | | (2 | ) |
| Matured | (2 | ) | | — |
| | — |
|
| December 31 | 27 |
| | 31 |
| | 32 |
|
The change in the ISCR of the FG VIEs’ assets held as of December 31, 2019 that was recorded in the consolidated statements of operations for 2019 was a gain of $39 million. The change in the ISCR of the FG VIEs’ assets was a gain of $7 million for 2018 and a gain of $35 million for 2017. To calculate ISCR, the change in the fair value of the FG VIEs’ assets is allocated between changes that are due to ISCR and changes due to other factors, including interest rates. The ISCR amount is determined by using expected cash flows at the original date of consolidation discounted at the effective yield less current expected cash flows discounted at that same original effective yield.
|
| | | | | | | |
| | As of
December 31, 2019 | | As of
December 31, 2018 |
| | (in millions) |
| Excess of unpaid principal over fair value of: | | | |
| FG VIEs' assets | $ | 279 |
| | $ | 350 |
|
| FG VIEs' liabilities with recourse | 21 |
| | 48 |
|
| FG VIEs' liabilities without recourse | 19 |
| | 28 |
|
| Unpaid principal balance for FG VIEs’ assets that were 90 days or more past due | 52 |
| | 71 |
|
| Unpaid principal for FG VIEs’ liabilities with recourse (1) | 388 |
| | 565 |
|
____________________
(1) FG VIEs’ liabilities with recourse will mature at various dates ranging from 2019 to 2038.
The table below shows the carrying value of the consolidated FG VIEs’ assets and liabilities in the consolidated financial statements, segregated by the types of assets that collateralize the respective debt obligations for FG VIEs’ liabilities with recourse.
Consolidated FG VIEs
By Type of Collateral
|
| | | | | | | | | | | | | | | |
| | As of December 31, 2019 | | As of December 31, 2018 |
| | Assets | | Liabilities | | Assets | | Liabilities |
| | (in millions) |
| With recourse: | |
| | |
| | |
| | |
|
| U.S. RMBS first lien | $ | 270 |
| | $ | 297 |
| | $ | 299 |
| | $ | 326 |
|
| U.S. RMBS second lien | 70 |
| | 70 |
| | 115 |
| | 137 |
|
| Manufactured housing | — |
| | — |
| | 53 |
| | 54 |
|
| Total with recourse | 340 |
| | 367 |
| | 467 |
| | 517 |
|
| Without recourse | 102 |
| | 102 |
| | 102 |
| | 102 |
|
| Total | $ | 442 |
| | $ | 469 |
| | $ | 569 |
| | $ | 619 |
|
Consolidated Investment Vehicles
Through a jointly owned subsidiary, AGM, AGC and MAC, the U.S. insurance subsidiaries, initially intend to invest $500 million in Assured Investment Management funds. In the fourth quarter of 2019, $79 million was invested in three separate Assured Investment Management funds; AHP, ABIF and CLO Warehouse Fund. As of December 31, 2019, the fair value of such investments was $77 million. CLO Warehouse Fund invested in the subordinated notes of CLO XXVI.
AHP, ABIF, CLO Warehouse Fund and CLO XXVI (collectively, the consolidated investment vehicles) are VIEs. The Company consolidates these investment vehicles as it is deemed to be the primary beneficiary based on its power to direct the most significant activities of each VIE (through its Assured Investment Management asset management subsidiaries) and its level of economic interest in the entities (through its U.S. insurance subsidiaries).
AHP and ABIF are investment companies under ASC 946, and therefore account for their underlying investments at fair value. CLO XXVI is a CFE under ASC 810. Under the ASC 810 practical expedient for CFEs, the Company elected to measure CLO XXVI's assets and liabilities using the fair value of its assets, which are more observable. Changes in the fair value of assets and liabilities of consolidated investment vehicles are recorded in "other income" in the consolidated statement of operations.
As a result of consolidating AHP, ABIF and CLO Warehouse Fund, the Company records noncontrolling interest (NCI) for the portion of each fund owned by employees and any third party investors. As of December 31, 2019, redeemable employee-owned NCI, held in ABIF and CLO Warehouse Fund, is classified outside of stockholder’s equity, within temporary equity. For AHP, nonredeemable NCI is presented within shareholders' equity in the consolidated balance sheets.
The assets and liabilities of the Company's consolidated investment vehicles (which include consolidated funds: AHP, ABIF and CLO Warehouse Fund as well as CLO XXVI) are held within separate legal entities. The assets of the consolidated investment vehicles are not available to creditors of the Company, other than creditors of the applicable consolidated investment vehicles. In addition, creditors of the consolidated investment vehicles have no recourse against the assets of the Company, other than the assets of such applicable consolidated investment vehicles.
Generally, the consolidation of the Company's consolidated investment vehicles and FG VIEs has a significant gross-up effect on the Company's assets, liabilities and cash flows. The consolidated investment vehicles have no net effect on the net income attributable to the Company, other than the economic interest the Company holds in consolidated funds in the Company's Insurance segment. The ownership interests of the Company's consolidated funds, to which the Company has no economic rights, are reflected as either redeemable or nonredeemable NCI in the consolidated funds in the Company's consolidated financial statements. Liquidity available at the Company's consolidated investment vehicles is typically not available for corporate liquidity needs, except to the extent of the Company's investment in the fund.
Assets and Liabilities
of Consolidated Investment Vehicles
|
| | | |
| | As of
December 31, 2019 |
| | (in millions) |
| Assets: | |
| Cash and restricted cash (1) | $ | 14 |
|
| Corporate loans of CFE, at fair value | 494 |
|
| Corporate loans, at fair value | 47 |
|
| Other assets (2) | 17 |
|
| Total assets | $ | 572 |
|
| Liabilities: | |
| CLO obligations of CFE, at fair value (3) | $ | 481 |
|
| Other liabilities | 1 |
|
| Total liabilities | $ | 482 |
|
____________________
| |
| (1) | Cash held by consolidated investment vehicles are not available to fund the general liquidity needs of the Company. |
| |
| (2) | Includes investment in affiliates of $9 million. |
| |
| (3) | The weighted average maturity and weighted average interest rate of CLO obligations were 12.8 years and 3.8%, respectively. CLO obligations will mature in 2032. |
As of December 31, 2019, the consolidated investment vehicles had a commitment to invest $13 million.
Redeemable Noncontrolling Interests in Consolidated Investment Vehicles
|
| | | |
| | Year Ended December 31, 2019 |
| | (in millions) |
| Beginning balance | $ | — |
|
| Contributions to investment vehicles | 12 |
|
| Distributions from investment vehicles | (4 | ) |
| Net loss | (1 | ) |
| December 31, | $ | 7 |
|
Interest income and interest expense are included in "other income." Investment purchases and sales for all consolidated investment vehicles are classified as operating activities, debt issuances and repayments are classified in financing activities.
Effect of Consolidating VIEs
The effect on the statements of operations and financial condition of consolidating FG VIEs includes (i) changes in fair value gains (losses) on FG VIEs’ assets and liabilities, (ii) the elimination of premiums and losses related to the AGC and AGM FG VIEs’ liabilities with recourse and (iii) the elimination of investment balances related to the Company’s purchase of AGC and AGM insured FG VIEs’ debt. Upon consolidation of a FG VIE, the related insurance and, if applicable, the related investment balances, are considered intercompany transactions and therefore eliminated. Such eliminations are included in the table below to present the full effect of consolidating FG VIEs.
The effect on the statements of operations and balance sheets of consolidating Assured Investment Management investment vehicles includes (i) changes in fair value of consolidated investment vehicles, (2) the elimination of the equity in earnings in investees related to the Insurance segment's investments in the consolidated Assured Investment Management funds, (3) the elimination of debt of the consolidated CLO against the assets of the consolidated CLO Warehouse Fund, and (4) the recording of NCI for the proportion of each consolidated Assured Investment Management fund that is not owned by any other subsidiary of the Company.
The cash flows generated by the FG VIEs’ assets are classified as cash flows from investing activities. Paydowns of FG VIEs' liabilities are supported by the cash flows generated by FG VIEs’ assets, and for liabilities with recourse, possibly claim payments made by AGM or AGC under its financial guaranty insurance contracts. Paydowns of FG VIEs' liabilities both with and without recourse are classified as cash flows used in financing activities. Interest income, interest expense and other expenses of the FG VIEs’ assets and liabilities are classified as operating cash flows. Claim payments made by AGC and AGM under the financial guaranty contracts issued to the FG VIEs are eliminated upon consolidation and therefore such claim payments are treated as paydowns of FG VIEs’ liabilities as a financing activity as opposed to an operating activity of AGM and AGC.
Cash flows of the consolidated investment vehicles attributable to such entities' investment purchases and dispositions, as well as operating expenses of the investment vehicles are presented as cash flow from operating activities in the consolidated statement of cash flows. Financing activities and capital cash flows to and from investors are presented as financing activities consistent with investment company guidelines.
Effect of Consolidating VIEs
on the Consolidated Balance Sheets
Increase (Decrease)
|
| | | | | | | |
| | As of
December 31, 2019 | | As of
December 31, 2018 |
| | (in millions) |
| Assets | | | |
| Investment portfolio: | | | |
| Fixed maturity securities and short-term investments | $ | (39 | ) | | $ | (38 | ) |
| Equity method investments (1) | (77 | ) | | — |
|
| Total investments | (116 | ) | | (38 | ) |
| Premiums receivable, net of commissions payable | (7 | ) | | (9 | ) |
| Salvage and subrogation recoverable | (8 | ) | | (1 | ) |
| FG VIEs’ assets, at fair value | 442 |
| | 569 |
|
| Assets of consolidated investment vehicles (1) | 572 |
| | — |
|
| Total assets | $ | 883 |
| | $ | 521 |
|
| Liabilities and shareholders’ equity | | | |
| Unearned premium reserve | $ | (39 | ) | | $ | (51 | ) |
| Loss and LAE reserve | (41 | ) | | (48 | ) |
| FG VIEs’ liabilities with recourse, at fair value | 367 |
| | 517 |
|
| FG VIEs’ liabilities without recourse, at fair value | 102 |
| | 102 |
|
| Liabilities of consolidated investment vehicles (1) | 482 |
| | — |
|
| Total liabilities | 871 |
| | 520 |
|
| | | | |
| Redeemable noncontrolling interests in consolidated investment vehicles (1) | 7 |
| | — |
|
| | | | |
| Retained earnings | 34 |
| | 34 |
|
| Accumulated other comprehensive income | (35 | ) | | (33 | ) |
| Total shareholders’ equity attributable to Assured Guaranty Ltd. | (1 | ) | | 1 |
|
| Nonredeemable noncontrolling interests (1) | 6 |
| | — |
|
| Total shareholders’ equity | 5 |
| | 1 |
|
| Total liabilities, redeemable noncontrolling interests and shareholders’ equity | $ | 883 |
| | $ | 521 |
|
____________________
| |
| (1) | These line items represent the components of the effect of consolidating Assured Investment Management investment vehicles. |
Effect of Consolidating VIEs
on the Consolidated Statements of Operations
Increase (Decrease)
|
| | | | | | | | | | | |
| | Year Ended December 31, |
| | 2019 | | 2018 | | 2017 |
| | (in millions) |
| Net earned premiums | $ | (18 | ) | | $ | (12 | ) | | $ | (15 | ) |
| Net investment income | (4 | ) | | (4 | ) | | (5 | ) |
| Fair value gains (losses) on FG VIEs (1) | 42 |
| | 14 |
| | 30 |
|
| Other income (loss) (2) | (3 | ) | | — |
| | — |
|
| Loss and LAE | (20 | ) | | (3 | ) | | 7 |
|
| Equity in net earnings of investees | 2 |
| | — |
| | — |
|
| Effect on income before tax | (1 | ) | | (5 | ) | | 17 |
|
| Less: Tax provision (benefit) | — |
| | (1 | ) | | 6 |
|
| Effect on net income (loss) | (1 | ) | | (4 | ) | | 11 |
|
| Effect on redeemable noncontrolling interests | (1 | ) | | — |
| | — |
|
| Effect on net income (loss) attributable to AGL | $ | — |
| | $ | (4 | ) | | $ | 11 |
|
____________________
| |
| (1) | See consolidated statements of comprehensive income and Note 22, Other Comprehensive Income, for information on changes in fair value of the FG VIEs’ liabilities with recourse that are attributable to changes in the Company's own credit risk. |
| |
| (2) | Represents change in fair value of consolidated investment vehicles. |
Effect of Consolidating VIEs
on Consolidated Statements of Cash Flows
Inflows (Outflows)
|
| | | | | | | | | | | |
| | Year Ended December 31, |
| | 2019 | | 2018 | | 2017 |
| | (in millions) |
| Effect on cash flows from operating activities | $ | (254 | ) | | $ | 11 |
| | $ | 19 |
|
| Effect on cash flows from investing activities | 259 |
| | 105 |
| | 138 |
|
| Effect on cash flows from financing activities | 9 |
| | (116 | ) | | (157 | ) |
| Total effect on cash flows | $ | 14 |
| | $ | — |
| | $ | — |
|
For 2019, the fair value gains on FG VIEs were attributable to higher recoveries on second lien U.S. RMBS FG VIEs' assets. For 2018 and 2017, the primary driver of the gain in fair value of FG VIEs’ assets and FG VIEs’ liabilities was an increase in the value of the FG VIEs’ assets resulting from improvement in the underlying collateral. The change in fair value of consolidated investment vehicles was a loss of $3 million for the year ended December 31, 2019.
Other Consolidated VIEs
In certain instances where the Company consolidates a VIE that was established as part of a loss mitigation negotiated settlement that results in the termination of the original insured financial guaranty insurance or credit derivative contract, the Company classifies the assets and liabilities of those VIEs in the line items that most accurately reflect the nature of the items, as opposed to within the FG VIEs’ assets and FG VIEs’ liabilities. The largest of these VIEs had assets of $91 million and liabilities of $12 million as of December 31, 2019 and assets of $87 million and liabilities of $21 million as of December 31, 2018, primarily recorded in the investment portfolio and credit derivative liabilities on the consolidated balance sheets.
Non-Consolidated VIEs
As described in Note 5, Outstanding Insurance Exposure, the Company monitors all policies in the insured portfolio. Of the approximately 18 thousand policies monitored as of December 31, 2019, approximately 16 thousand policies are not within the scope of ASC 810 because these financial guaranties relate to the debt obligations of governmental organizations or financing entities established by a governmental organization. The majority of the remaining policies involve transactions where the Company is not deemed to currently have control over the FG VIEs’ most significant activities. As of December 31, 2019 and 2018, the Company identified 90 and 110 policies, respectively, that contain provisions and experienced events that may trigger consolidation. Based on management’s assessment of these potential triggers or events, the Company consolidated 27 and 31 FG VIEs as of December 31, 2019 and December 31, 2018, respectively. The Company’s exposure provided through its financial guaranties with respect to debt obligations of FG VIEs is included within net par outstanding in Note 5, Outstanding Insurance Exposure.
The Company manages funds and CLOs that have been determined to be a VIE or voting interest entity, in which the Company concluded that it held no variable interests, through either equity interests held, debt interests held or decision-making fees received by the Assured Investment Management subsidiaries. As such, the Company does not consolidate these entities.
15. Long-Term Debt and Credit Facilities
Accounting Policy
Long-term debt is recorded at principal amounts net of any unamortized original issue discount or premium and unamortized acquisition date fair value adjustment for AGM and AGMH debt. Discounts and acquisition date fair value adjustments are accreted into interest expense over the life of the applicable debt.
Long Term Debt
The Company has outstanding long-term debt primarily consisting of debt issued by AGUS and AGMH. All of the AGUS and AGMH debt is fully and unconditionally guaranteed by AGL; AGL's guarantee of the junior subordinated debentures is on a junior subordinated basis.
Intercompany Loans Payable
On October 1, 2019, AGM, AGC and MAC made 10 year, 3.5% interest rate intercompany loans to AGUS totaling $250 million to fund the BlueMountain Acquisition and the related capital contributions. Interest will be payable annually in arrears on each anniversary of the note, commencing on October 1, 2020. Interest will accrue daily and be computed on a basis of a 360 day year from October 1, 2019 until the date on which the principal amount is paid in full. AGUS will pay 20% of the original principal amount of each note on the sixth, seventh, eighth, and ninth anniversaries. The remaining 20% of the original principal amount and all accrued and unpaid interest will be paid on the maturity date. AGUS has the right to prepay the principal amount of the notes in whole or in part at any time, or from time to time, without payment of any premium or penalty.
See Note 2, Business Combinations and Assumption of Insured Portfolio, for additional information.
In addition, in 2012 AGUS borrowed $90 million from its affiliate AGRO to fund the acquisition of MAC. In 2018, the maturity date was extended to November 2023. During 2019, 2018 and 2017, AGUS repaid $10 million, $10 million and $10 million, respectively, in outstanding principal as well as accrued and unpaid interest. As of December 31, 2019, $40 million remained outstanding.
Debt Issued by AGUS
7% Senior Notes. On May 18, 2004, AGUS issued $200 million of 7% Senior Notes due 2034 (7% Senior Notes) for net proceeds of $197 million. Although the coupon on the Senior Notes is 7%, the effective rate is approximately 6.4%, taking into account the effect of a cash flow hedge executed by the Company in March 2004. The notes are redeemable, in whole or in part, at their principal amount plus accrued and unpaid interest to the date of redemption or, if greater, the make-whole redemption price.
5% Senior Notes. On June 20, 2014, AGUS issued $500 million of 5% Senior Notes due 2024 (5% Senior Notes) for net proceeds of $495 million. The net proceeds from the sale of the notes were used for general corporate purposes, including
the purchase of AGL common shares. The notes are redeemable, in whole or in part, at their principal amount plus accrued and unpaid interest to the date of redemption or, if greater, the make-whole redemption price.
Series A Enhanced Junior Subordinated Debentures. On December 20, 2006, AGUS issued $150 million of Debentures due 2066. The Debentures paid a fixed 6.4% rate of interest until December 15, 2016, and thereafter pay a floating rate of interest, reset quarterly, at a rate equal to three month LIBOR plus a margin equal to 2.38%. AGUS may select at 1 or more times to defer payment of interest for 1 or more consecutive periods for up to ten years. Any unpaid interest bears interest at the then applicable rate. AGUS may not defer interest past the maturity date. The debentures are redeemable, in whole or in part, at their principal amount plus accrued and unpaid interest to the date of redemption.
Debt Issued by AGMH
6 7/8% QUIBS. On December 19, 2001, AGMH issued $100 million face amount of 6 7/8% QUIBS due December 15, 2101, which are redeemable without premium or penalty in whole or in part at their principal amount plus accrued and unpaid interest to the date of redemption.
6.25% Notes. On November 26, 2002, AGMH issued $230 million face amount of 6.25% Notes due November 1, 2102, which are redeemable without premium or penalty in whole or in part at their principal amount plus accrued and unpaid interest to the date of redemption.
5.6% Notes. On July 31, 2003, AGMH issued $100 million face amount of 5.6% Notes due July 15, 2103, which are redeemable without premium or penalty in whole or in part at their principal amount plus accrued and unpaid interest to the date of redemption.
Junior Subordinated Debentures. On November 22, 2006, AGMH issued $300 million face amount of Junior Subordinated Debentures with a scheduled maturity date of December 15, 2036 and a final repayment date of December 15, 2066. The final repayment date of December 15, 2066 may be automatically extended up to 4 times in five-year increments provided certain conditions are met. The debentures are redeemable, in whole or in part, at any time prior to December 15, 2036 at their principal amount plus accrued and unpaid interest to the date of redemption or, if greater, the make-whole redemption price. Interest on the debentures will accrue from November 22, 2006 to December 15, 2036 at the annual rate of 6.4%. If any amount of the debentures remains outstanding after December 15, 2036, then the principal amount of the outstanding debentures will bear interest at a floating interest rate equal to one-month LIBOR plus 2.215% until repaid. AGMH may elect at 1 or more times to defer payment of interest on the debentures for 1 or more consecutive interest periods that do not exceed ten years. In connection with the completion of this offering, AGMH entered into a replacement capital covenant for the benefit of persons that buy, hold or sell a specified series of AGMH long-term indebtedness ranking senior to the debentures. Under the covenant, the debentures will not be repaid, redeemed, repurchased or defeased by AGMH or any of its subsidiaries on or before the date that is 20 years prior to the final repayment date, except to the extent that AGMH has received proceeds from the sale of replacement capital securities. The proceeds from this offering were used to pay a dividend to the shareholders of AGMH.
The principal and carrying values of the Company’s debt are presented in the table below.
Principal and Carrying Amounts of Debt
|
| | | | | | | | | | | | | | | |
| | As of December 31, 2019 | | As of December 31, 2018 |
| | Principal |
| Carrying Value |
| Principal |
| Carrying Value |
| | (in millions) |
| AGUS: | |
|
| |
|
| |
|
| |
|
| 7% Senior Notes (1) | $ | 200 |
| | $ | 197 |
|
| $ | 200 |
| | $ | 197 |
|
| 5% Senior Notes (1) | 500 |
| | 497 |
| | 500 |
| | 497 |
|
| Series A Enhanced Junior Subordinated Debentures (2) | 150 |
| | 150 |
|
| 150 |
| | 150 |
|
| AGUS long-term debt | 850 |
| | 844 |
|
| 850 |
| | 844 |
|
| Intercompany loans payable | 290 |
| | 290 |
| | 50 |
| | 50 |
|
| Total AGUS | 1,140 |
| | 1,134 |
| | 900 |
| | 894 |
|
| AGMH (3): | |
| | |
|
| |
| | |
|
67/8% QUIBS (1) | 100 |
| | 70 |
|
| 100 |
| | 70 |
|
| 6.25% Notes (1) | 230 |
| | 144 |
|
| 230 |
| | 143 |
|
| 5.6% Notes (1) | 100 |
| | 58 |
|
| 100 |
| | 57 |
|
| Junior Subordinated Debentures (2) | 300 |
| | 204 |
|
| 300 |
| | 198 |
|
| Total AGMH | 730 |
| | 476 |
|
| 730 |
| | 468 |
|
| AGM (3): | |
| | |
|
| |
| | |
|
| AGM Notes Payable | 4 |
| | 4 |
|
| 5 |
| | 5 |
|
| Total AGM | 4 |
| | 4 |
|
| 5 |
| | 5 |
|
| AGMH's debt purchased by AGUS | (131 | ) | | (89 | ) | | (128 | ) | | (84 | ) |
| Elimination of intercompany loans payable | (290 | ) | | (290 | ) | | (50 | ) | | (50 | ) |
| Total | $ | 1,453 |
| | $ | 1,235 |
|
| $ | 1,457 |
| | $ | 1,233 |
|
____________________
| |
| (1) | AGL fully and unconditionally guarantees these obligations. |
| |
| (2) | Guaranteed by AGL on a junior subordinated basis. |
| |
| (3) | Carrying amounts are different than principal amounts primarily due to fair value adjustments at the date of the AGMH acquisition, which are accreted or amortized into interest expense over the remaining terms of these obligations. |
The following table presents the principal amounts of AGMH's outstanding Junior Subordinated Debentures that AGUS purchased and the loss on extinguishment of debt recognized by the Company. The Company may choose to make additional purchases of this or other Company debt in the future.
AGUS's Purchase
of AGMH's Junior Subordinated Debentures
|
| | | | | | | | | | | |
| | Year Ended December 31, |
| | 2019 | | 2018 | | 2017 |
| | (in millions) |
| Principal amount repurchased | $ | 3 |
| | $ | 100 |
| | $ | 28 |
|
| Loss on extinguishment of debt (1) | 1 |
| | 34 |
| | 9 |
|
____________________
| |
| (1) | Included in other income in the consolidated statements of operations. The loss represents the difference between the amount paid to purchase AGMH's debt and the carrying value of the debt, which includes the unamortized fair value adjustments that were recorded upon the acquisition of AGMH in 2009. |
Principal payments due under the long-term debt are as follows:
Expected Maturity Schedule of Debt
As of December 31, 2019
|
| | | | | | | | | | | | | | | | | | | | |
| | | AGUS | | AGMH (1) | | AGM | | Eliminations (2) | | Total |
| | | (in millions) |
| 2020 | | $ | — |
| | $ | — |
| | $ | 2 |
| | $ | — |
| | $ | 2 |
|
| 2021 | | — |
| | — |
| | — |
| | — |
| | — |
|
| 2022 | | — |
| | — |
| | — |
| | — |
| | — |
|
| 2023 | | 40 |
| | — |
| | — |
| | (40 | ) | | — |
|
| 2024 | | 500 |
| | — |
| | — |
| | — |
| | 500 |
|
| 2025-2044 | | 450 |
| | — |
| | 2 |
| | (250 | ) | | 202 |
|
| 2045-2064 | | — |
| | — |
| | — |
| | — |
| | — |
|
| 2065-2084 | | 150 |
| | 300 |
| | — |
| | (131 | ) | | 319 |
|
| Thereafter | | — |
| | 430 |
| | — |
| | — |
| | 430 |
|
| Total | | $ | 1,140 |
| | $ | 730 |
| | $ | 4 |
| | $ | (421 | ) | | $ | 1,453 |
|
____________________
| |
| (1) | Includes AGMH's debt purchased by AGUS of $131 million. |
| |
| (2) | Includes eliminations of intercompany loans payable and AGMH's debt purchased by AGUS. |
Interest Expense
|
| | | | | | | | | | | |
| | Year Ended December 31, |
| | 2019 | | 2018 | | 2017 |
| | (in millions) |
| AGUS: | |
| | |
| | |
|
| 7% Senior Notes | $ | 13 |
| | $ | 13 |
| | $ | 13 |
|
| 5% Senior Notes | 26 |
| | 26 |
| | 26 |
|
| Series A Enhanced Junior Subordinated Debentures | 7 |
| | 7 |
| | 5 |
|
| AGUS long-term debt | 46 |
| | 46 |
| | 44 |
|
| Intercompany loans payable | 5 |
| | 3 |
| | 3 |
|
| Total AGUS | 51 |
| | 49 |
| | 47 |
|
| AGMH: | |
| | |
| | |
|
67/8% QUIBS | 7 |
| | 7 |
| | 7 |
|
| 6.25% Notes | 16 |
| | 15 |
| | 16 |
|
| 5.6% Notes | 6 |
| | 6 |
| | 6 |
|
| Junior Subordinated Debentures | 25 |
| | 25 |
| | 25 |
|
| Total AGMH | 54 |
| | 53 |
| | 54 |
|
| AGMH's debt purchased by AGUS | (11 | ) |
| (5 | ) |
| (1 | ) |
| Elimination of intercompany loans payable | (5 | ) | | (3 | ) | | (3 | ) |
| Total | $ | 89 |
| | $ | 94 |
| | $ | 97 |
|
Intercompany Credit Facility
On October 25, 2013, AGL, as borrower, and AGUS, as lender, entered into a revolving credit facility pursuant to which AGL may, from time to time, borrow for general corporate purposes. Under the credit facility, AGUS committed to lend a principal amount not exceeding $225 million in the aggregate. In September 2018, AGL and AGUS amended the revolving credit facility to extend the commitment until October 25, 2023 (the loan commitment termination date). The unpaid principal amount of each loan will bear interest at a fixed rate equal to 100% of the then applicable interest rate as determined under Section 1274(d) of the Code, and interest on all loans will be computed for the actual number of days elapsed on the basis of a year consisting of 360 days. Accrued interest on all loans will be paid on the last day of each June and December, beginning on December 31, 2013, and at maturity. AGL must repay the then unpaid principal amounts of the loans by the third anniversary of the loan commitment termination date. NaN amounts are currently outstanding under the credit facility.
Committed Capital Securities
Each of AGC and AGM have entered into put agreements with 4 separate custodial trusts allowing AGC and AGM, respectively, to issue an aggregate of $200 million of non-cumulative redeemable perpetual preferred securities to the trusts in exchange for cash. Each custodial trust was created for the primary purpose of issuing $50 million face amount of CCS, investing the proceeds in high-quality assets and entering into put options with AGC or AGM, as applicable. The Company does not consider itself to be the primary beneficiary of the trusts and the trusts are not consolidated in Assured Guaranty's financial statements.
The trusts provide AGC and AGM access to new equity capital at their respective sole discretion through the exercise of the put options. Upon AGC's or AGM's exercise of its put option, the relevant trust will liquidate its portfolio of eligible assets and use the proceeds to purchase the AGC or AGM preferred stock, as applicable. AGC or AGM may use the proceeds from its sale of preferred stock to the trusts for any purpose, including the payment of claims. The put agreements have no scheduled termination date or maturity. However, each put agreement will terminate if (subject to certain grace periods) specified events occur. Both AGC and AGM continue to have the ability to exercise their respective put options and cause the related trusts to purchase their preferred stock.
Prior to 2008 or 2007, the amounts paid on the CCS were established through an auction process. All of those auctions failed in 2008 or 2007, and the rates paid on the CCS increased to their respective maximums. The annualized rate on the AGC CCS is one-month LIBOR plus 250 bps, and the annualized rate on the AGM CPS is one-month LIBOR plus 200 bps.
See Note 9, Fair Value Measurement, –Other Assets–Committed Capital Securities, for a discussion of the fair value measurement of the CCS.
| |
| 16. | Employee Benefit Plans |
Accounting Policy
Share-based compensation expense is based on the grant date fair value using the grant date closing price, the lattice, Monte Carlo or Black-Scholes-Merton (Black-Scholes) pricing models. The Company amortizes the fair value of share-based awards on a straight-line basis over the requisite service periods of the awards, which are generally the vesting periods, with the exception of retirement‑eligible employees. For retirement-eligible employees, certain awards contain retirement provisions and therefore are amortized over the period through the date the employee first becomes eligible to retire and is no longer required to provide service to earn part or all of the award.
The fair value of each award under the Assured Guaranty Ltd. Employee Stock Purchase Plan is estimated at the beginning of the offering period using the Black-Scholes option valuation model.
The expense for Performance Retention Plan awards is recognized straight-line over the requisite service period, with the exception of retirement eligible employees. For retirement eligible employees, the expense is recognized immediately.
Assured Guaranty Ltd. 2004 Long-Term Incentive Plan
Under the Assured Guaranty Ltd. 2004 Long-Term Incentive Plan, as amended (the Incentive Plan), the number of AGL common shares that may be delivered under the Incentive Plan may not exceed 18,670,000. In the event of certain transactions affecting AGL's common shares, the number or type of shares subject to the Incentive Plan, the number and type of shares subject to outstanding awards under the Incentive Plan, and the exercise price of awards under the Incentive Plan, may be adjusted.
The Incentive Plan authorizes the grant of incentive stock options, non-qualified stock options, stock appreciation rights, and full value awards that are based on AGL's common shares. The grant of full value awards may be in return for a participant's previously performed services, or in return for the participant surrendering other compensation that may be due, or may be contingent on the achievement of performance or other objectives during a specified period, or may be subject to a risk of forfeiture or other restrictions that will lapse upon the achievement of one or more goals relating to completion of service by the participant, or achievement of performance or other objectives. Awards under the Incentive Plan may accelerate and become vested upon a change in control of AGL.
The Incentive Plan is administered by the Compensation Committee of AGL's Board of Directors (the Board), except as otherwise determined by the Board. The Board may amend or terminate the Incentive Plan. As of December 31, 2019, 9,311,090 common shares were available for grant under the Incentive Plan.
Time Vested Stock Options
Stock options are generally granted once a year with exercise prices equal to the closing price on the date of grant. To date, the Company has only issued non-qualified stock options. All stock options, except for performance stock options, granted to employees vest in equal annual installments over a three-year period and expire seven years or ten years from the date of grant. Stock options granted to directors vest over one year and expire in seven years or ten years from grant date. None of the Company's options, except for performance stock options, have a performance or market condition.
Time Vested Stock Options
|
| | | | | | | | | |
| | Options for Common Shares | | Weighted Average Exercise Price | | Number of Exercisable Options |
| Balance as of December 31, 2018 | 373,628 |
| | $ | 18.77 |
| | 373,628 |
|
| Options granted | — |
| | — |
| | |
| Options exercised | (283,277 | ) | | 18.16 |
| | |
| Options forfeited/expired | — |
| | — |
| | |
| Balance as of December 31, 2019 | 90,351 |
| | $ | 20.68 |
| | 90,351 |
|
As of December 31, 2019, the aggregate intrinsic value and weighted average remaining contractual term of stock options outstanding were $2.6 million and 0.7 years, respectively. As of December 31, 2019, the aggregate intrinsic value and weighted average remaining contractual term of exercisable stock options were $2.6 million and 0.7 years, respectively.
NaN options were granted in 2019, 2018 and 2017. As of December 31, 2019, there were 0 unexpensed outstanding non-vested options.
The total intrinsic value of stock options exercised during the years ended December 31, 2019, 2018 and 2017 was $8.2 million, $9.9 million and $6.6 million, respectively. During the years ended December 31, 2019, 2018 and 2017, $2.3 million, $2.4 million and $4.7 million, respectively, was received from the exercise of stock options. In order to satisfy stock option exercises, the Company issues new shares.
Performance Stock Options
The Company grants performance stock options under the Incentive Plan. These awards are non-qualified stock options with exercise prices equal to the closing price of an AGL common share on the applicable date of grant. These awards vest 35%, 50% or 100%, if the price of AGL's common shares using the highest 40-day average share price reaches certain hurdles. If the share price is between the specified levels, the vesting level will be interpolated accordingly. These awards expire seven years from the date of grant.
Performance Stock Options
|
| | | | | | | | | |
| | Options for Common Shares | | Weighted Average Exercise Price | | Number of Exercisable Options |
| Balance as of December 31, 2018 | 27,552 |
| | $ | 19.24 |
| | 27,552 |
|
| Options granted | — |
| | — |
| | |
| Options exercised | (27,552 | ) | | 19.24 |
| | |
| Options forfeited/expired | — |
| | — |
| | |
| Balance as of December 31, 2019 | — |
| | $ | — |
| | — |
|
NaN options were granted in 2019, 2018 and 2017.
The total intrinsic value of performance stock options exercised during the years ended December 31, 2019, 2018 and 2017 was $0.7 million, $3.8 million and $0.7 million, respectively. During the years ended December 31, 2019, 2018 and 2017, $0.5 million, $2.7 million and $0.2 million, respectively, was received from the exercise of performance stock options. In order to satisfy stock option exercises, the Company issues new shares. The tax benefit from time vested and performance stock options exercised during 2019 was $0.9 million.
Restricted Stock Awards
Restricted stock awards are valued based on the closing price of the underlying shares at the date of grant. Restricted stock awards to employees generally vest in equal annual installments over a four-year period and restricted stock awards to outside director's vest in full in one year. Restricted stock awards to employees are amortized on a straight-line basis over the requisite service periods of the awards, and restricted stock awards to outside directors are amortized over one year, which are generally the vesting periods, with the exception of retirement‑eligible employees, discussed above.
Restricted Stock Award Activity
|
| | | | | | | |
| Nonvested Shares | | Number of Shares | | Weighted Average Grant Date Fair Value Per Share |
| Nonvested at December 31, 2018 | 51,746 |
| | $ | 35.56 |
|
| Granted | 48,241 |
| | 45.98 |
|
| Vested | (51,746 | ) | | 35.56 |
|
| Forfeited | — |
| | — |
|
| Nonvested at December 31, 2019 | 48,241 |
| | $ | 45.98 |
|
As of December 31, 2019, the total unrecognized compensation cost related to outstanding nonvested restricted stock awards was $0.7 million, which the Company expects to recognize over the weighted‑average remaining service period of 0.3 years. The total fair value of shares vested during the years ended December 31, 2019, 2018 and 2017 was $1.8 million, $1.9 million and $1.5 million, respectively.
Restricted Stock Units
Restricted stock units are valued based on the closing price of the underlying shares at the date of grant. Restricted stock units awarded to employees have vesting terms similar to those of the restricted stock awards and are delivered on the vesting date. The Company has granted restricted stock units to directors of the Company.
Restricted Stock Unit Activity
|
| | | | | | | |
| Nonvested Stock Units | | Number of Stock Units | | Weighted Average Grant Date Fair Value Per Share |
| Nonvested at December 31, 2018 | 900,276 |
| | $ | 33.83 |
|
| Granted | 464,500 |
| | 44.40 |
|
| Vested | (375,981 | ) | | 28.03 |
|
| Forfeited | (1,528 | ) | | 40.90 |
|
| Nonvested at December 31, 2019 | 987,267 |
| | $ | 41.24 |
|
As of December 31, 2019, the total unrecognized compensation cost related to outstanding nonvested restricted stock units was $25 million, which the Company expects to recognize over the weighted‑average remaining service period of 2.5 years. The total fair value of restricted stock units vested during the years ended December 31, 2019, 2018 and 2017 was $11 million, $8 million and $7 million, respectively.
Performance Restricted Stock Units
The Company has granted performance restricted stock units under the Incentive Plan. These awards vest if AGL's common share price, total shareholder return (TSR) relative to the performance of a peer group and growth in core adjusted book value during the relevant three-year performance period reaches certain hurdles, with a minimum vesting percentage of 0, a target vesting percentage of 100% and a maximum vesting percentage of 200%, 250% and 200%, respectively. If the performance is between the specified levels, the vesting level will be interpolated accordingly. At the end of the performance cycle, participants are entitled to an amount equivalent to the accumulated dividends paid on common stock during the performance cycle for the number of shares earned.
Performance Restricted Stock Unit Activity
|
| | | | | | | |
| Performance Restricted Stock Units | | Number of Performance Share Units | | Weighted Average Grant Date Fair Value Per Share |
| Nonvested at December 31, 2018 | 596,728 |
| | $ | 39.42 |
|
| Granted (1) | 436,690 |
| | 44.00 |
|
| Vested | (489,161 | ) | | 12.66 |
|
| Forfeited | — |
| | — |
|
| Nonvested at December 31, 2019 (2) | 544,257 |
| | $ | 47.23 |
|
____________________
| |
| (1) | Includes 244,581 performance restricted stock units that were granted prior to 2019 at a weighted average grant date fair value of $12.66, but met performance hurdles and vested during 2019. The weighted average grant date fair value per share excludes these shares. |
| |
| (2) | Excludes 263,093 performance restricted stock units that have met performance hurdles and will be eligible for vesting after December 31, 2019. |
As of December 31, 2019, the total unrecognized compensation cost related to outstanding nonvested performance share units was $10 million, which the Company expects to recognize over the weighted‑average remaining service period of 1.8 years. The total value of performance restricted stock units vested during the years ended December 31, 2019, 2018 and 2017 was based on grant date fair value and was $6 million, $6 million and $8 million, respectively.
The Company used a Monte Carlo model to value its performance restricted stock units granted in 2018 and 2017 that contain a performance hurdle based on AGL's common share price.
Monte Carlo Pricing
Weighted Average Assumptions
|
| | | | | | | | |
| | | 2018 | | 2017 |
| Dividend yield | | 1.68 | % | | 1.37 | % |
| Expected volatility | | 27.65 | % | | 25.19 | % |
| Risk free interest rate | | 2.43 | % | | 1.48 | % |
| Weighted average grant date fair value | | $ | 45.64 |
| | $ | 53.74 |
|
The expected dividend yield is based on the current expected annual dividend and share price on the grant date. The expected volatility is estimated at the date of grant based on an average of the 3-year historical share price volatility and implied volatilities of certain at-the-money actively traded call options in the Company. The risk-free interest rate is the implied 3-year yield currently available on U.S. Treasury zero-coupon issues at the date of grant. The expected life is based on the 18-month term of the performance period.
For the 2019 awards, the grant-date fair value of the performance restricted stock units tied to relative TSR was calculated using a Monte Carlo simulation in order to determine the total return of the Company’s shares relative to the total return of approximately 200 financial companies in the Russell 2000 Index. The inputs to the simulation include the beginning prices of shares, historical volatilities, and dividend yields of all relevant companies as well as all possible pairwise correlation coefficients among the relevant companies. In addition, the risk-free return and discount for illiquidity are also included. The grant date fair value of these awards was $46.66 per share.
For the 2019 awards, the grant-date fair value of the core adjusted book value performance restricted stock units was based on the grant date closing price.
Employee Stock Purchase Plan
The Company established the AGL Employee Stock Purchase Plan (Stock Purchase Plan) in accordance with Internal Revenue Code Section 423, and participation is available to all eligible employees. Maximum annual purchases by participants are limited to the number of whole shares that can be purchased by an amount equal to 10% of the participant's compensation or, if less, shares having a value of $25,000. Participants may purchase shares at a purchase price equal to 85% of the lesser of the fair market value of the stock on the first day or the last day of the subscription period. The Company has reserved for issuance and purchases under the Stock Purchase Plan 850,000 Assured Guaranty Ltd. common shares.
The fair value of each award under the Stock Purchase Plan is estimated at the beginning of each offering period using the Black‑Scholes option‑pricing model and the following assumptions: a) the expected dividend yield is based on the current expected annual dividend and share price on the grant date; b) the expected volatility is estimated at the date of grant based on the historical share price volatility, calculated on a daily basis; c) the risk-free rate for periods within the contractual life of the option is based on the U.S. Treasury yield curve in effect at the time of grant; and d) the expected life is based on the term of the offering period.
Stock Purchase Plan
|
| | | | | | | | | | | |
| | Year Ended December 31, |
| | 2019 | | 2018 | | 2017 |
| | (dollars in millions) |
| Proceeds from purchase of shares by employees | $ | 1.5 |
| | $ | 1.2 |
| | $ | 1.0 |
|
| Number of shares issued by the Company | 40,732 |
| | 39,532 |
| | 33,666 |
|
| Recorded in share-based compensation, net of deferral | $ | 0.4 |
| | $ | 0.3 |
| | $ | 0.3 |
|
Share‑Based Compensation Expense
The following table presents stock based compensation costs and the amount of such costs that are deferred as policy acquisition costs, pre-tax. Amortization of previously deferred stock compensation costs is not shown in the table below.
Share‑Based Compensation Expense Summary
|
| | | | | | | | | | | |
| | Year Ended December 31, |
| | 2019 | | 2018 | | 2017 |
| | (in millions) |
| Share‑based compensation expense | $ | 21 |
| | $ | 19 |
| | $ | 16 |
|
| Share‑based compensation capitalized as DAC | 1.1 |
| | 0.8 |
| | 0.6 |
|
| Income tax benefit | 3 |
| | 3 |
| | 2 |
|
Defined Contribution Plan
The Company maintains a savings incentive plan, which is qualified under Section 401(a) of the Internal Revenue Code for U.S. employees. The savings incentive plan is available to eligible full-time employees upon hire. Eligible participants could contribute a percentage of their eligible compensation subject to U.S. Internal Revenue Service (IRS) limitations. Contributions were matched by the Company at a rate of 100% up to 6% of participant's eligible compensation, subject to IRS limitations. Any amounts over the IRS limits are contributed to and matched by the Company into a nonqualified supplemental executive retirement plan for employees eligible to participate in such nonqualified plan. The Company also made a core contribution of 6% of the participant's eligible compensation to the qualified plan, subject to IRS limitations, and the nonqualified supplemental executive retirement plan for eligible employees, regardless of whether the employee contributes to the plan(s). Employees become fully vested in Company contributions after one year of service, as defined in the plan. Plan eligibility is immediate upon hire. The Company also maintains similar non-qualified plans for non-U.S. employees.
The Company recognized defined contribution expenses of $12 million, $12 million and $11 million for the years ended December 31, 2019, 2018 and 2017, respectively.
Accounting Policy
The provision for income taxes consists of an amount for taxes currently payable and an amount for deferred taxes. Deferred income taxes are provided for temporary differences between the financial statement carrying amounts and tax bases of assets and liabilities, using enacted rates in effect for the year in which the differences are expected to reverse. A valuation allowance is recorded to reduce the deferred tax asset to an amount that is more likely than not to be realized.
Non-interest-bearing tax and loss bonds are purchased in the amount of the tax benefit that results from deducting statutory-basis contingency reserves as provided under Internal Revenue Code Section 832(e). The Company records the purchase of tax and loss bonds in deferred taxes.
The Company recognizes tax benefits only if a tax position is “more likely than not” to prevail.
The Company elected to account for tax associated with Global Intangible Low-Taxed Income (GILTI) as a current-period expense when incurred.
Overview
AGL and its Bermuda subsidiaries, AG Re, AGRO, and Cedar Personnel Ltd. (Bermuda Subsidiaries), are not subject to any income, withholding or capital gains taxes under current Bermuda law. The Company has received an assurance from the Minister of Finance in Bermuda that, in the event of any taxes being imposed, AGL and its Bermuda Subsidiaries will be exempt from taxation in Bermuda until March 31, 2035. AGL's U.S. and U.K. subsidiaries are subject to income taxes imposed by U.S. and U.K. authorities, respectively, and file applicable tax returns. In addition, AGRO, a Bermuda domiciled company, has elected under Section 953(d) of the U.S. Internal Revenue Code (the Code) to be taxed as a U.S. domestic corporation.
In November 2013, AGL became tax resident in the U.K. although it remains a Bermuda-based company and it's administrative and head office functions continue to be carried on in Bermuda. As a U.K. tax resident company, AGL is required to file a corporation tax return with Her Majesty’s Revenue & Customs. AGL is subject to U.K. corporation tax in respect of its worldwide profits (both income and capital gains), subject to any applicable exemptions. The corporation tax rate was 19% for 2019. Assured Guaranty expects that the dividends AGL receives from its direct subsidiaries will be exempt from U.K. corporation tax due to the exemption in section 931D of the U.K. Corporation Tax Act 2009. In addition, any dividends paid by AGL to its shareholders should not be subject to any withholding tax in the U.K. Assured Guaranty does not expect any profits of non-U.K. resident members of the group to be taxed under the U.K. "controlled foreign companies" regime and has obtained a clearance from Her Majesty’s Revenue & Customs confirming this on the basis of current facts.
AGUS files a consolidated federal income tax return with all of its U.S. subsidiaries. AGE UK, the Company’s U.K. subsidiary, had previously elected under U.S. Internal Revenue Code Section 953(d) to be taxed as a U.S. company. In January 2017, AGE UK filed a request with the IRS to revoke the election, which was approved in May 2017. As a result of the revocation of the Section 953(d) election, AGE UK is no longer liable to pay future U.S. taxes beginning in 2017.
On January 10, 2017, AGC purchased MBIA UK, a U.K. based insurance company. After the purchase, MBIA UK changed its name to AGLN and files its tax returns in the U.K. as a separate entity for the period prior to its merger with AGE UK. For additional information on the MBIA UK Acquisition, see Note 2, Business Combinations and Assumption of Insured Portfolio.
Assured Guaranty Overseas US Holdings Inc. and its subsidiaries AGRO and AG Intermediary Inc. file their own consolidated federal income tax return.
As a result of the BlueMountain Acquisition referred to in Note 2, the entities acquired will be included in the AGUS consolidated federal income tax return.
Tax Assets (Liabilities)
Deferred and Current Tax Assets (Liabilities) (1)
|
| | | | | | | |
| | As of
December 31, 2019 | | As of
December 31, 2018 |
| | (in millions) |
| Deferred tax assets (liabilities) | $ | (17 | ) | | $ | 68 |
|
| Current tax assets (liabilities) | 47 |
| | 22 |
|
____________________
| |
| (1) | Included in other assets or other liabilities on the consolidated balance sheets. |
Components of Net Deferred Tax Assets
|
| | | | | | | |
| | As of December 31, |
| | 2019 | | 2018 |
| | (in millions) |
| Deferred tax assets: | | | |
| Unearned premium reserves, net | $ | 76 |
| | $ | 98 |
|
| Investment basis differences | 48 |
| | 49 |
|
| Foreign tax credit | 36 |
| | 36 |
|
| Net operating loss | 32 |
| | 34 |
|
| Deferred compensation | 26 |
| | 25 |
|
| Alternative minimum tax credit | 12 |
| | 20 |
|
| Other | 24 |
| | 35 |
|
| Total deferred income tax assets | 254 |
| | 297 |
|
| Deferred tax liabilities: | | | |
| Unrealized appreciation on investments | 86 |
| | 54 |
|
| Public debt | 44 |
| | 50 |
|
| Market discount | 11 |
| | 31 |
|
| DAC | 33 |
| | 23 |
|
| Unrealized gains on CCS | 11 |
| | 16 |
|
| Loss and LAE reserve | 29 |
| | 7 |
|
| Other | 21 |
| | 12 |
|
| Total deferred income tax liabilities | 235 |
| | 193 |
|
| Less: Valuation allowance | 36 |
| | 36 |
|
| Net deferred income tax asset (liabilities) | $ | (17 | ) | | $ | 68 |
|
As of December 31, 2019, the Company had alternative minimum tax credits of $12 million which, pursuant to the 2017 Tax Cuts and Jobs Act (Tax Act), are available as a credit to offset regular tax liability over the next two years with any excess refundable by 2021.
As part of the acquisition of CIFG Holding Inc. (CIFGH, and together with its subsidiaries, CIFG), the Company acquired $189 million of net operating losses (NOL) which will begin to expire in 2033. The NOL has been limited under Internal Revenue Code Section 382 due to a change in control as a result of the acquisition. As of December 31, 2019, the Company had $151 million of NOLs available to offset its future U.S. taxable income.
Valuation Allowance
The Company has $13 million of foreign tax credits (FTC) carryovers from previous acquisitions and $23 million of FTC due to the Tax Act for use against regular tax in future years. FTCs will begin to expire in 2020 and will fully expire by 2027. In analyzing the future realizability of FTCs, the Company notes limitations on future foreign source income due to overall foreign losses as negative evidence. After reviewing positive and negative evidence, the Company came to the conclusion that it is more likely than not that the FTC of $36 million will not be utilized, and therefore recorded a valuation allowance with respect to this tax attribute.
The Company came to the conclusion that it is more likely than not that the remaining deferred tax assets will be fully realized after weighing all positive and negative evidence available as required under GAAP. The positive evidence that was considered included the cumulative income the Company has earned over the last three years, and the significant unearned premium income to be included in taxable income. The positive evidence outweighs any negative evidence that exists. As such, the Company believes that no valuation allowance is necessary in connection with the remaining deferred tax assets. The Company will continue to analyze the need for a valuation allowance on a quarterly basis.
Provision for Income Taxes
The effective tax rates reflect the proportion of income recognized by each of the Company’s operating subsidiaries, with U.S. subsidiaries taxed at the U.S. marginal corporate income tax rate of 21% in 2019 and 2018 and 35% in 2017, U.K. subsidiaries taxed at the U.K. marginal corporate tax rate of 19%, and no taxes for the Company’s Bermuda Subsidiaries unless subject to U.S. tax by election. In 2018, due to the Tax Act, controlled foreign corporations (CFCs) apply the local marginal corporate tax rate. In addition, the Tax Act creates a new requirement that a portion of the GILTI earned by CFCs must be included currently in the gross income of the CFCs' U.S. shareholder. For the periods between April 1, 2015 and March 31, 2017, the U.K. corporation tax rate was 20%. The Company’s overall effective tax rate fluctuates based on the distribution of income across jurisdictions.
A reconciliation of the difference between the provision for income taxes and the expected tax provision at statutory rates in taxable jurisdictions is presented below.
Effective Tax Rate Reconciliation
|
| | | | | | | | | | | |
| | Year Ended December 31, |
| | 2019 | | 2018 | | 2017 |
| | (in millions) |
| Expected tax provision (benefit) | $ | 91 |
| | $ | 97 |
| | $ | 300 |
|
| Tax-exempt interest | (19 | ) | | (23 | ) | | (49 | ) |
| Bargain purchase gain | — |
| | — |
| | (20 | ) |
| Change in liability for uncertain tax positions | 1 |
| | (15 | ) | | (26 | ) |
| Effect of provision to tax return filing adjustments | (6 | ) | | (1 | ) | | (8 | ) |
| State tax | 1 |
| | 6 |
| | 9 |
|
| Taxes on reinsurance | (5 | ) | | 6 |
| | (4 | ) |
| Effect of adjustments to the provisional amounts as a result of 2017 Tax Cuts and Jobs Act | — |
| | (4 | ) | | 61 |
|
| Foreign taxes | 6 |
| | — |
| | 4 |
|
| Other | (6 | ) | | (7 | ) | | (6 | ) |
| Total provision (benefit) for income taxes | $ | 63 |
| | $ | 59 |
| | $ | 261 |
|
| Effective tax rate | 13.7 | % | | 10.2 | % | | 26.3 | % |
The expected tax provision (benefit) is calculated as the sum of pretax income in each jurisdiction multiplied by the statutory tax rate of the jurisdiction by which it will be taxed. Where there is a pretax loss in one jurisdiction and pretax income in another, the total combined expected tax rate may be higher or lower than any of the individual statutory rates.
The following tables present pretax income and revenue by jurisdiction.
Pretax Income (Loss) by Tax Jurisdiction
|
| | | | | | | | | | | |
| | Year Ended December 31, |
| | 2019 | | 2018 | | 2017 |
| | (in millions) |
| U.S. | $ | 440 |
| | $ | 461 |
| | $ | 873 |
|
| Bermuda | 33 |
| | 121 |
| | 145 |
|
| U.K. and other | (9 | ) | | (2 | ) | | (27 | ) |
| Total | $ | 464 |
| | $ | 580 |
| | $ | 991 |
|
Revenue by Tax Jurisdiction
|
| | | | | | | | | | | |
| | Year Ended December 31, |
| | 2019 | | 2018 | | 2017 |
| | (in millions) |
| U.S. | $ | 779 |
| | $ | 801 |
| | $ | 1,543 |
|
| Bermuda | 146 |
| | 177 |
| | 216 |
|
| U.K. and other | 38 |
| | 23 |
| | (20 | ) |
| Total | $ | 963 |
| | $ | 1,001 |
| | $ | 1,739 |
|
Pretax income by jurisdiction may be disproportionate to revenue by jurisdiction to the extent that insurance losses incurred are disproportionate.
Effect of the 2017 Tax Cuts and Jobs Act
On December 22, 2017, the Tax Act was signed into law. The Tax Act changed many items of U.S. corporate income taxation, including a reduction of the corporate income tax rate from 35% to 21%, implementation of a territorial tax system and imposition of a tax on deemed repatriated earnings of non-U.S. subsidiaries. At December 31, 2017, the Company had not completed accounting for the tax effects of the Tax Act; however, the Company made a reasonable estimate of the effects on the existing deferred tax balances and the one-time transition tax. The Company recognized a provisional income tax expense of $61 million, which was included as a component of income tax expense from continuing operations in 2017. During 2018, the Company recorded an adjustment to the provisional amount with a $4 million tax benefit as a component of income tax expense from continuing operations. As of December 31, 2018, the accounting for the income tax effects of the Tax Act have been completed and the total net impact resulting from the Tax Act is an expense of $57 million.
The Tax Act includes provisions for GILTI wherein taxes are imposed on foreign income in excess of a deemed return on tangible assets of foreign corporations. The Tax Act also includes a Base Erosion Anti-abuse Tax provision, which taxes certain payments from a U.S. corporation to its foreign subsidiaries.
Deferred Tax Assets and Liabilities
The Company remeasured certain deferred tax assets and liabilities based on the rates at which they are expected to reverse in the future, which is generally 21%. The provisional amount recorded related to the remeasurement of the deferred tax balance was an income tax expense of $37 million. As a result of adjustments identified from filing the 2017 tax return, the total remeasurement of the deferred tax balance resulting from the Tax Act is an income tax expense of $34 million.
Foreign Tax Effects
The one-time transition tax is based on total post-1986 earnings and profits for which the Company had previously deferred U.S. income taxes. The Company recorded a provisional amount for its one-time transition tax liability on non-U.S. subsidiaries less realizable FTCs and a write off of deferred tax liabilities on unremitted earnings, resulting in an increase in income tax expense of $24 million. As a result of adjustments identified from filing the 2017 tax return, the total impact to the transition tax resulting from the Tax Act is an income tax expense of $23 million.
The table below summarizes the impact of the Tax Act on the consolidated statements of operations.
Summary of the Tax Act Effect
(Benefit) Provision
|
| | | | | | | |
| | Year Ended December 31, |
| | 2018 | | 2017 |
| | (in millions) |
| Transition tax | $ | (1 | ) | | $ | 93 |
|
| Foreign tax credit realized | — |
| | (31 | ) |
| Write down of unremitted earnings | — |
| | (38 | ) |
| Net impact of repatriation | (1 | ) | | 24 |
|
| Write down of deferred tax asset due to tax rate change | (3 | ) | | 37 |
|
| Net impact of Tax Act | $ | (4 | ) | | $ | 61 |
|
Uncertain Tax Positions
The following table provides a reconciliation of the beginning and ending balances of the total liability for unrecognized tax positions.
|
| | | | | | | | | | | |
| | 2019 | | 2018 | | 2017 |
| | (in millions) |
| Beginning of year | $ | 14 |
| | $ | 28 |
| | $ | 50 |
|
| Effect of provision to tax return filing adjustments | 5 |
| | 1 |
| | 8 |
|
| Increase in unrecognized tax positions as a result of position taken during the current period | — |
| | — |
| | 1 |
|
| Decrease in unrecognized tax positions as a result of settlement of positions taken during the prior period | — |
| | — |
| | (31 | ) |
| Reductions to unrecognized tax benefits as a result of the applicable statute of limitations | (4 | ) | | (15 | ) | | — |
|
| Balance as of December 31, | $ | 15 |
| | $ | 14 |
| | $ | 28 |
|
The Company's policy is to recognize interest related to uncertain tax positions in income tax expense and has accrued $1 million for full years 2019, 2018 and 2017. As of both December 31, 2019 and December 31, 2018, the Company has accrued $2 million of interest.
The total amount of reserves for unrecognized tax positions, including accrued interest, as of December 31, 2019 and December 31, 2018 that would affect the effective tax rate, if recognized, was $17 million and $16 million, respectively.
Audits
As of December 31, 2019, AGUS had open tax years with the U.S. IRS for 2016 to present and is currently under audit for the 2016 tax year. It is expected that the audit will close in 2020 and, depending on the final outcome, reserves for uncertain tax positions may be released. In December 2016, the IRS issued a Revenue Agent Report for the 2009 - 2012 audit period, which did not identify any material adjustments that were not already accounted for in prior periods. In April 2017, the Company received a final letter from the IRS to close the audit with no additional findings or changes, and as a result the Company released previously recorded uncertain tax position reserves and accrued interest of approximately $37 million in the second quarter of 2017. The 2013 and 2014 tax years closed in 2018. The 2015 tax year closed in 2019. Assured Guaranty Overseas US Holdings Inc. has open tax years of 2016 forward but is not currently under audit with the IRS. The Company's U.K. subsidiaries are not currently under examination and have open tax years of 2017 forward. CIFGNA, which was acquired by AGC during 2016, is not currently under examination and has open tax years of 2016 to the date of acquisition.
| |
| 18. | Insurance Company Regulatory Requirements |
The following table summarizes the equity and income amounts reported to local regulatory bodies in the U.S. and Bermuda for insurance subsidiaries within the group. The discussion that follows describes the basis of accounting and differences to GAAP.
Insurance Regulatory Amounts Reported
U.S. and Bermuda
|
| | | | | | | | | | | | | | | | | | | |
| | Policyholders' Surplus | | Net Income (Loss) |
| | As of December 31, | | Year Ended December 31, |
| | 2019 | | 2018 | | 2019 | | 2018 | | 2017 |
| | (in millions) |
| U.S. statutory companies: | | | | | | | | | |
| AGM (1) (2) | $ | 2,691 |
| | $ | 2,533 |
| | $ | 312 |
| | $ | 172 |
| | $ | 152 |
|
| AGC (1) (2) | 1,775 |
| | 1,793 |
| | 226 |
| | (5 | ) | | 219 |
|
| MAC (2) | 276 |
| | 321 |
| | 53 |
| | 55 |
| | 32 |
|
| Bermuda statutory companies: | | | | | | | | | |
| AG Re | 1,098 |
| | 1,249 |
| | 45 |
| | 131 |
| | 155 |
|
| AGRO | 410 |
| | 383 |
| | 12 |
| | 10 |
| | 10 |
|
____________________
| |
| (1) | Policyholders' surplus of AGM and AGC includes their indirect share of MAC. AGM and AGC own 60.7% and 39.3%, respectively, of the outstanding stock of Municipal Assurance Holdings Inc. (MAC Holdings), which owns 100% of the outstanding common stock of MAC. |
| |
| (2) | As of December 31, 2019, policyholders' surplus is net of contingency reserves of $869 million, $546 million and $192 million for AGM, AGC and MAC, respectively. As of December 31, 2018, policyholders' surplus is net of contingency reserves of $913 million, $550 million and $200 million for AGM, AGC and MAC, respectively. |
Basis of Regulatory Financial Reporting
United States
Each of the Company's U.S. domiciled insurance companies' ability to pay dividends depends, among other things, upon theirits financial condition, results of operations, cash requirements, compliance with rating agency requirements, and is also subject to restrictions contained in the insurance laws and related regulations of theirits state of domicile and other states. Financial statements prepared in accordance with accounting practices prescribed or permitted by local insurance regulatory authorities differ in certain respects from GAAP.
The Company's U.S. domiciled insurance companies prepare statutory financial statements in accordance with accounting practices prescribed or permitted by the National Association of Insurance Commissioners (NAIC) and their respective insurance departments. Prescribed statutory accounting practices are set forth in the NAICNational Association of Insurance Commissioners Accounting Practices and Procedures Manual. The Company has no permitted accounting practices on a statutory basis, except for those related to CIFGNA which was merged into AGC and therefore subject to statutory merger accounting requiring the restatement of prior year balances of AGC to include CIFGNA. On the CIFG Acquisition Date, accounting policies were conformed with AGC's accounting policies which do not include any permitted practices.basis.
GAAP differs in certain significant respects from U.S. insurance companies' statutory accounting practices prescribed or permitted by insurance regulatory authorities. The principal differences result from the following statutory accounting practices:practices listed below.
upfrontUpfront premiums are earned when related principal and interest have expiredupon expiration of risk rather than earned over the expected period of coverage;coverage. Premium earnings are accelerated when transactions are economically defeased, rather than legally defeased.
acquisitionAcquisition costs are charged to expense as incurred rather than over the period that related premiums are earned;earned.
aA contingency reserve is computed based on statutory requirements, whereas no such reserve is required under GAAP;GAAP.
certainCertain assets designated as “non-admitted assets” are charged directly to statutory surplus, rather than reflected as assets under GAAP;GAAP.
investmentsInvestments in subsidiaries are carried on the balance sheet on the equity basis, to the extent admissible, rather than consolidated with the parent;parent.
the amount ofAdmitted deferred tax assets that may be admitted isare subject to an adjusted surplus threshold and is generally limited to the lesser of those assets the Company expects to realize within three years of the balance sheet date or fifteen percent of the Company's adjusted surplus. This realization period and surplus percentage is subject to change based on the amount of adjusted surplus.a limitation calculated in accordance with SAP. Under GAAP there is no non-admitted asset determination, rather a valuation allowance is recorded to reduce the deferred tax asset to an amount that is more likely than not to be realized;realized.
insuredInsured credit derivatives are accounted for as insurance contracts rather than as derivative contracts measured at fair value;value.
bondsBonds are generally carried at amortized cost rather than fair value;value.
insuredInsured obligations of VIEs and refinancing vehiclesvehicles’ debt, where the Company is deemed the primary beneficiary, are accounted for as insurance contracts. Under GAAP, such VIEs and refinancing vehicles are consolidated and any transactions with the Company are eliminated;eliminated.
surplusSurplus notes are recognized as surplus and each payment of principal and interest is recorded only upon approval of the insurance regulator rather than as liabilities with periodic accrual of interest;interest.
push-down acquisition accounting is not applicableAcquisitions are accounted for as either statutory purchases or statutory mergers, rather than under statutory accounting practices, as it isthe purchase method under GAAP;GAAP.
lossesLosses are discounted at a rate of 4.0% or 5.0%,tax equivalent yields, and recorded when the loss is deemed probable and without consideration of the deferred premium revenue. Under GAAP, expected losses are discounted at the risk free rate at the end of each reporting period and are recorded only to the extent they exceed deferred premium revenue;revenue.
theThe present value of installment premiums and commissions are not recorded on the balance sheet as they are under GAAP; and
mergers of acquired companies are treated as statutory mergers at historical balances and financial statements are retroactively revised assuming the merger occurred at the beginning of the prior year, rather than prospectively beginning with the date of acquisition at fair value under GAAP.
Bermuda
AG Re, a Bermuda regulated Class 3B insurer, prepares itsand AGRO, a Bermuda regulated Class 3A and Class C insurer,
prepare their statutory financial statements in conformity with the accounting principles set forth in the Insurance Act 1978, amendments thereto and related regulations. As of December 31, 2016, the Bermuda Monetary Authority (Authority) now(the Authority) requires insurers to prepare statutory financial statements in accordance with the particular accounting principles adopted by the insurer (which, in the case of AG Re and AGRO, are U.S. GAAP), subject to certain adjustments. The principal difference relates to certain assets designated as “non-admitted assets” which are charged directly to statutory surplus rather than reflected as assets as they are under U.S. GAAP.
Insurance Regulatory Amounts ReportedUnited Kingdom
|
| | | | | | | | | | | | | | | | | | | |
| | Policyholders' Surplus | | Net Income (Loss) |
| | As of December 31, | | Year Ended December 31, |
| | 2016 | | 2015 | | 2016 | | 2015 | | 2014 |
| | (in millions) |
| U.S. statutory companies: | | | | | | | | | |
| AGM(1) | $ | 2,321 |
| | $ | 2,441 |
| | $ | 191 |
| | $ | 217 |
| | $ | 304 |
|
| AGC(1)(2) | 1,896 |
| | 1,365 |
| | 108 |
| | (92 | ) | | 116 |
|
| MAC | 487 |
| | 730 |
| | 142 |
| | 102 |
| | 75 |
|
| Bermuda statutory company: | | | | | | | | | |
| AG Re | 1,255 |
| | 984 |
| | 139 |
| | 51 |
| | 28 |
|
____________________
| |
(1) | Policyholders' surplus of AGM and AGC include their indirect share of MAC. AGM and AGC own approximately 61% and 39%, respectively, of the outstanding stock of Municipal Assurance Holdings Inc. (MAC Holdings), which owns 100% of the outstanding common stock of MAC. |
| |
(2) | As indicated in Note 2, Acquisitions, AGC completed the acquisition of CIFGH (the parent company of CIFGNA) on July 1, 2016 and Radian Asset on April 1, 2015. Both CIFGNA and Radian Asset was merged with and into AGC, with AGC as the surviving company of the merger. The impact to AGC's policyholders' surplus was approximately $287 million from the CIFGH acquisition, on a statutory basis, as of July 1, 2016 and $333 million from the Radian Asset acquisition, on a statutory basis, as of April 1, 2015. |
Contingency Reserves
On July 15, 2013, AGMAGE UK prepares its Solvency and its wholly-owned subsidiaryFinancial Condition Report and other required regulatory financial report based on Prudential Regulation Authority and Solvency II Regulations (Solvency II). AGE (together,UK adopted the AGM Group) and AGC, were notified thatfull framework required by Solvency II on January 1, 2016, which is the New York State Department of Financial Services (NYDFS) and the Maryland Insurance Administration (MIA) did not object to the AGM Group and AGC, respectively, reassuming all of the outstanding contingency reserves that the AGM Group and AGC had ceded to AG Re and electing to cease ceding future contingency reserves to AG Re. The insurance regulators permitted the AGM Group and AGC to reassume the contingency reserves in increments over three years. In the third quarter of 2015, the AGM Group and AGC each reassumed their respective final installments and asdate they became effective. As of December 31, 2015, the AGM Group2019 and AGC had collectively reassumed an aggregate of approximately $522 million.
From time to time, AGM and AGC have obtained the approval of their regulators to release contingency reserves based on losses or because the accumulated reserve is deemed excessive in relation to the insurer's outstanding insured obligations. In 2016, on the latter basis, AGM obtained the NYDFS's approval for a contingency reserve release of approximately $175December 31, 2018, AGE UK's Own Funds were £684 million and AGC obtained the MIA's approval for a contingency reserve release of approximately $152 million. In addition, MAC also released approximately $53£693 million, of contingency reserves, which consisted of the assumed contingency reserves maintained by MAC, as reinsurer of AGM, in respect of the same obligations that were the subject of AGM's $175 million release.respectively.
With respect to the regular, quarterly contributions to contingency reserves required by the applicable Maryland and New York laws and regulations, such laws and regulations permit the discontinuation of such quarterly contributions to a company’s contingency reserves when such company’s aggregate contingency reserves for a particular line of business (i.e., municipal or non-municipal) exceed the sum of the company’s outstanding principal for each specified category of obligations within the particular line of business multiplied by the specified contingency reserve factor for each such category. In accordance with such laws and regulations, and with the approval of the MIA and the NYDFS, respectively, AGC ceased making quarterly contributions to its contingency reserves for both municipal and non-municipal business and AGM ceased making quarterly contributions to its contingency reserves for non-municipal business, in each case beginning in the fourth quarter of 2014. Such cessations are expected to continue for as long as AGC and AGM satisfy the foregoing condition for their applicable lines of business.
Dividend RestrictionsProvision for Income Taxes
The effective tax rates reflect the proportion of income recognized by each of the Company’s operating subsidiaries, with U.S. subsidiaries taxed at the U.S. marginal corporate income tax rate of 21% in 2019 and Capital Requirements
Under New York insurance law, AGM2018 and MAC may only pay dividends out35% in 2017, U.K. subsidiaries taxed at the U.K. marginal corporate tax rate of "earned surplus," which is19%, and no taxes for the Company’s Bermuda Subsidiaries unless subject to U.S. tax by election. In 2018, due to the Tax Act, controlled foreign corporations (CFCs) apply the local marginal corporate tax rate. In addition, the Tax Act creates a new requirement that a portion of the company's surplus that representsGILTI earned by CFCs must be included currently in the net earnings, gains or profits (after deduction of all losses) that have not been distributed to shareholders as dividends, transferred to stated capital or capital surplus, or applied to other purposes permitted by law, but does not include unrealized appreciation of assets. AGM and MAC may each pay dividends without the prior approvalgross income of the New York SuperintendentCFCs' U.S. shareholder. For the periods between April 1, 2015 and March 31, 2017, the U.K. corporation tax rate was 20%. The Company’s overall effective tax rate fluctuates based on the distribution of Financial Services (New York Superintendent)income across jurisdictions.
A reconciliation of the difference between the provision for income taxes and the expected tax provision at statutory rates in taxable jurisdictions is presented below.
Effective Tax Rate Reconciliation
|
| | | | | | | | | | | |
| | Year Ended December 31, |
| | 2019 | | 2018 | | 2017 |
| | (in millions) |
| Expected tax provision (benefit) | $ | 91 |
| | $ | 97 |
| | $ | 300 |
|
| Tax-exempt interest | (19 | ) | | (23 | ) | | (49 | ) |
| Bargain purchase gain | — |
| | — |
| | (20 | ) |
| Change in liability for uncertain tax positions | 1 |
| | (15 | ) | | (26 | ) |
| Effect of provision to tax return filing adjustments | (6 | ) | | (1 | ) | | (8 | ) |
| State tax | 1 |
| | 6 |
| | 9 |
|
| Taxes on reinsurance | (5 | ) | | 6 |
| | (4 | ) |
| Effect of adjustments to the provisional amounts as a result of 2017 Tax Cuts and Jobs Act | — |
| | (4 | ) | | 61 |
|
| Foreign taxes | 6 |
| | — |
| | 4 |
|
| Other | (6 | ) | | (7 | ) | | (6 | ) |
| Total provision (benefit) for income taxes | $ | 63 |
| | $ | 59 |
| | $ | 261 |
|
| Effective tax rate | 13.7 | % | | 10.2 | % | | 26.3 | % |
The expected tax provision (benefit) is calculated as the sum of pretax income in each jurisdiction multiplied by the statutory tax rate of the jurisdiction by which it will be taxed. Where there is a pretax loss in one jurisdiction and pretax income in another, the total combined expected tax rate may be higher or lower than any of the individual statutory rates.
The following tables present pretax income and revenue by jurisdiction.
Pretax Income (Loss) by Tax Jurisdiction
|
| | | | | | | | | | | |
| | Year Ended December 31, |
| | 2019 | | 2018 | | 2017 |
| | (in millions) |
| U.S. | $ | 440 |
| | $ | 461 |
| | $ | 873 |
|
| Bermuda | 33 |
| | 121 |
| | 145 |
|
| U.K. and other | (9 | ) | | (2 | ) | | (27 | ) |
| Total | $ | 464 |
| | $ | 580 |
| | $ | 991 |
|
Revenue by Tax Jurisdiction
|
| | | | | | | | | | | |
| | Year Ended December 31, |
| | 2019 | | 2018 | | 2017 |
| | (in millions) |
| U.S. | $ | 779 |
| | $ | 801 |
| | $ | 1,543 |
|
| Bermuda | 146 |
| | 177 |
| | 216 |
|
| U.K. and other | 38 |
| | 23 |
| | (20 | ) |
| Total | $ | 963 |
| | $ | 1,001 |
| | $ | 1,739 |
|
Pretax income by jurisdiction may be disproportionate to revenue by jurisdiction to the extent that togetherinsurance losses incurred are disproportionate.
Effect of the 2017 Tax Cuts and Jobs Act
On December 22, 2017, the Tax Act was signed into law. The Tax Act changed many items of U.S. corporate income taxation, including a reduction of the corporate income tax rate from 35% to 21%, implementation of a territorial tax system and imposition of a tax on deemed repatriated earnings of non-U.S. subsidiaries. At December 31, 2017, the Company had not completed accounting for the tax effects of the Tax Act; however, the Company made a reasonable estimate of the effects on the existing deferred tax balances and the one-time transition tax. The Company recognized a provisional income tax expense of $61 million, which was included as a component of income tax expense from continuing operations in 2017. During 2018, the Company recorded an adjustment to the provisional amount with all dividends declared or distributed by it duringa $4 million tax benefit as a component of income tax expense from continuing operations. As of December 31, 2018, the preceding 12 months, do not exceedaccounting for the lesserincome tax effects of 10%the Tax Act have been completed and the total net impact resulting from the Tax Act is an expense of $57 million.
The Tax Act includes provisions for GILTI wherein taxes are imposed on foreign income in excess of a deemed return on tangible assets of foreign corporations. The Tax Act also includes a Base Erosion Anti-abuse Tax provision, which taxes certain payments from a U.S. corporation to its policyholders' surplus (asforeign subsidiaries.
Deferred Tax Assets and Liabilities
The Company remeasured certain deferred tax assets and liabilities based on the rates at which they are expected to reverse in the future, which is generally 21%. The provisional amount recorded related to the remeasurement of the deferred tax balance was an income tax expense of $37 million. As a result of adjustments identified from filing the 2017 tax return, the total remeasurement of the deferred tax balance resulting from the Tax Act is an income tax expense of $34 million.
Foreign Tax Effects
The one-time transition tax is based on total post-1986 earnings and profits for which the Company had previously deferred U.S. income taxes. The Company recorded a provisional amount for its last annual or quarterly statement filedone-time transition tax liability on non-U.S. subsidiaries less realizable FTCs and a write off of deferred tax liabilities on unremitted earnings, resulting in an increase in income tax expense of $24 million. As a result of adjustments identified from filing the 2017 tax return, the total impact to the transition tax resulting from the Tax Act is an income tax expense of $23 million.
The table below summarizes the impact of the Tax Act on the consolidated statements of operations.
Summary of the Tax Act Effect
(Benefit) Provision
|
| | | | | | | |
| | Year Ended December 31, |
| | 2018 | | 2017 |
| | (in millions) |
| Transition tax | $ | (1 | ) | | $ | 93 |
|
| Foreign tax credit realized | — |
| | (31 | ) |
| Write down of unremitted earnings | — |
| | (38 | ) |
| Net impact of repatriation | (1 | ) | | 24 |
|
| Write down of deferred tax asset due to tax rate change | (3 | ) | | 37 |
|
| Net impact of Tax Act | $ | (4 | ) | | $ | 61 |
|
Uncertain Tax Positions
The following table provides a reconciliation of the beginning and ending balances of the total liability for unrecognized tax positions.
|
| | | | | | | | | | | |
| | 2019 | | 2018 | | 2017 |
| | (in millions) |
| Beginning of year | $ | 14 |
| | $ | 28 |
| | $ | 50 |
|
| Effect of provision to tax return filing adjustments | 5 |
| | 1 |
| | 8 |
|
| Increase in unrecognized tax positions as a result of position taken during the current period | — |
| | — |
| | 1 |
|
| Decrease in unrecognized tax positions as a result of settlement of positions taken during the prior period | — |
| | — |
| | (31 | ) |
| Reductions to unrecognized tax benefits as a result of the applicable statute of limitations | (4 | ) | | (15 | ) | | — |
|
| Balance as of December 31, | $ | 15 |
| | $ | 14 |
| | $ | 28 |
|
The Company's policy is to recognize interest related to uncertain tax positions in income tax expense and has accrued $1 million for full years 2019, 2018 and 2017. As of both December 31, 2019 and December 31, 2018, the Company has accrued $2 million of interest.
The total amount of reserves for unrecognized tax positions, including accrued interest, as of December 31, 2019 and December 31, 2018 that would affect the effective tax rate, if recognized, was $17 million and $16 million, respectively.
Audits
As of December 31, 2019, AGUS had open tax years with the New York Superintendent)U.S. IRS for 2016 to present and is currently under audit for the 2016 tax year. It is expected that the audit will close in 2020 and, depending on the final outcome, reserves for uncertain tax positions may be released. In December 2016, the IRS issued a Revenue Agent Report for the 2009 - 2012 audit period, which did not identify any material adjustments that were not already accounted for in prior periods. In April 2017, the Company received a final letter from the IRS to close the audit with no additional findings or 100%changes, and as a result the Company released previously recorded uncertain tax position reserves and accrued interest of its adjusted net investment income during that period. The maximum amount available during 2017 for AGM to distribute as dividends without regulatory approval is estimated to be approximately $232$37 million of which approximately $81 million is estimated to be available for distribution in the firstsecond quarter of 2017. The maximum2013 and 2014 tax years closed in 2018. The 2015 tax year closed in 2019. Assured Guaranty Overseas US Holdings Inc. has open tax years of 2016 forward but is not currently under audit with the IRS. The Company's U.K. subsidiaries are not currently under examination and have open tax years of 2017 forward. CIFGNA, which was acquired by AGC during 2016, is not currently under examination and has open tax years of 2016 to the date of acquisition.
| |
| 18. | Insurance Company Regulatory Requirements |
The following table summarizes the equity and income amounts reported to local regulatory bodies in the U.S. and Bermuda for insurance subsidiaries within the group. The discussion that follows describes the basis of accounting and differences to GAAP.
Insurance Regulatory Amounts Reported
U.S. and Bermuda
|
| | | | | | | | | | | | | | | | | | | |
| | Policyholders' Surplus | | Net Income (Loss) |
| | As of December 31, | | Year Ended December 31, |
| | 2019 | | 2018 | | 2019 | | 2018 | | 2017 |
| | (in millions) |
| U.S. statutory companies: | | | | | | | | | |
| AGM (1) (2) | $ | 2,691 |
| | $ | 2,533 |
| | $ | 312 |
| | $ | 172 |
| | $ | 152 |
|
| AGC (1) (2) | 1,775 |
| | 1,793 |
| | 226 |
| | (5 | ) | | 219 |
|
| MAC (2) | 276 |
| | 321 |
| | 53 |
| | 55 |
| | 32 |
|
| Bermuda statutory companies: | | | | | | | | | |
| AG Re | 1,098 |
| | 1,249 |
| | 45 |
| | 131 |
| | 155 |
|
| AGRO | 410 |
| | 383 |
| | 12 |
| | 10 |
| | 10 |
|
____________________
| |
| (1) | Policyholders' surplus of AGM and AGC includes their indirect share of MAC. AGM and AGC own 60.7% and 39.3%, respectively, of the outstanding stock of Municipal Assurance Holdings Inc. (MAC Holdings), which owns 100% of the outstanding common stock of MAC. |
| |
| (2) | As of December 31, 2019, policyholders' surplus is net of contingency reserves of $869 million, $546 million and $192 million for AGM, AGC and MAC, respectively. As of December 31, 2018, policyholders' surplus is net of contingency reserves of $913 million, $550 million and $200 million for AGM, AGC and MAC, respectively. |
Basis of Regulatory Financial Reporting
United States
Each of the Company's U.S. domiciled insurance companies' ability to pay dividends depends, among other things, upon its financial condition, results of operations, cash requirements, compliance with rating agency requirements, and is also subject to restrictions contained in the insurance laws and related regulations of its state of domicile and other states. Financial statements prepared in accordance with accounting practices prescribed or permitted by local insurance regulatory authorities differ in certain respects from GAAP.
The Company's U.S. domiciled insurance companies prepare statutory financial statements in accordance with accounting practices prescribed or permitted by the National Association of Insurance Commissioners and their respective insurance departments. Prescribed statutory accounting practices are set forth in the National Association of Insurance Commissioners Accounting Practices and Procedures Manual. The Company has no permitted accounting practices on a statutory basis.
GAAP differs in certain significant respects from U.S. insurance companies' statutory accounting practices prescribed or permitted by insurance regulatory authorities. The principal differences result from the statutory accounting practices listed below.
Upfront premiums are earned upon expiration of risk rather than earned over the expected period of coverage. Premium earnings are accelerated when transactions are economically defeased, rather than legally defeased.
Acquisition costs are charged to expense as incurred rather than over the period that related premiums are earned.
A contingency reserve is computed based on statutory requirements, whereas no such reserve is required under GAAP.
Certain assets designated as “non-admitted assets” are charged directly to statutory surplus, rather than reflected as assets under GAAP.
Investments in subsidiaries are carried on the balance sheet on the equity basis, to the extent admissible, rather than consolidated with the parent.
Admitted deferred tax assets are subject to an adjusted surplus threshold and subject to a limitation calculated in accordance with SAP. Under GAAP there is no non-admitted asset determination, rather a valuation allowance is recorded to reduce the deferred tax asset to an amount available during 2017 for MAC to distribute as dividends without regulatory approvalthat is estimatedmore likely than not to be approximately $49 million. Since its capitalization in 2013, MAC has not distributedrealized.
Insured credit derivatives are accounted for as insurance contracts rather than as derivative contracts measured at fair value.
Bonds are generally carried at amortized cost rather than fair value.
Insured obligations of VIEs and refinancing vehicles’ debt, where the Company is deemed the primary beneficiary, are accounted for as insurance contracts. Under GAAP, such VIEs and refinancing vehicles are consolidated and any dividends. MAC currently intends to allocatetransactions with the distributionCompany are eliminated.
Surplus notes are recognized as surplus and each payment of such amount quarterly in 2017.
Under Maryland's insurance law, AGC may, with prior notice to the Maryland Insurance Commissioner, pay an ordinary dividend that, together with all dividends paid in the prior 12 months, does not exceed the lesser of 10% of its policyholders' surplus (as of the prior December 31) or 100% of its adjusted net investment income during that period. The maximum amount available during 2017 for AGC to distribute as ordinary dividendsprincipal and interest is approximately $107 million, of which approximately $29 million is available for distribution in the first quarter of 2017.
On June 30, 2016, MAC obtained approval from the NYDFS to repay its $300 million surplus note to MAC Holdings and its $100 million surplus note (plus accrued interest) to AGM. Accordingly, on June 30, 2016, MAC transferred cash and/or marketable securities to (i) MAC Holdings in an aggregate amount equal to $300 million, and (ii) AGM in an aggregate amount of $102.5 million. MAC Holdings,recorded only upon receipt of such $300 million from MAC, distributed cash and/or marketable securities in an aggregate amount of $300 million to its shareholders, AGM and AGC, in proportion to their respective 61% and 39% ownership interests such that AGM received $182 million and AGC received $118 million.
For AG Re, any distribution (including repurchase of shares) of any share capital, contributed surplus or other statutory capital that would reduce its total statutory capital by 15% or more of its total statutory capital as set out in its previous year's financial statements requires the prior approval of the insurance regulator rather than as liabilities with periodic accrual of interest.
Acquisitions are accounted for as either statutory purchases or statutory mergers, rather than under the purchase method under GAAP.
Losses are discounted at tax equivalent yields, and recorded when the loss is deemed probable and without consideration of the deferred premium revenue. Under GAAP, expected losses are discounted at the risk free rate at the end of each reporting period and are recorded only to the extent they exceed deferred premium revenue.
The present value of installment premiums and commissions are not recorded on the balance sheet as they are under GAAP.
Bermuda
AG Re, a Bermuda Monetary Authority (Authority). Separately, dividends are paid out of an insurer'sregulated Class 3B insurer, and AGRO, a Bermuda regulated Class 3A and Class C insurer,
prepare their statutory surplus and cannot exceed that surplus. Further, annual dividends cannot exceed 25% of total statutory capital and surplus as set out in its previous year's financial statements which is $314 million, without AG Re certifying toin conformity with the Authority that it will continue to meet required margins.accounting principles set forth in the Insurance Act 1978, amendments thereto and related regulations. As of December 31, 2016, the Bermuda Monetary Authority now(the Authority) requires insurers to prepare statutory financial statements in accordance with the particular accounting principles adopted by the insurer (which, in the case of AG Re and AGRO, are U.S. GAAP), subject to certain adjustments. As a result of this new requirement,The principal difference relates to certain assets previously non-admitted by AG Redesignated as “non-admitted assets” which are now admitted, resulting in an increasecharged directly to AG Re’s statutory capitalsurplus rather than reflected as assets as they are under U.S. GAAP.
United Kingdom
AGE UK prepares its Solvency and surplus limitation. BasedFinancial Condition Report and other required regulatory financial report based on the foregoing limitations, in 2017 AG Re has the capacity to (i) make capital distributions in an aggregate amount up to $128 million without the prior approval of thePrudential Regulation Authority and (ii) declare and pay dividends in an aggregate amount up toSolvency II Regulations (Solvency II). AGE UK adopted the limit of its outstanding statutory surplus,full framework required by Solvency II on January 1, 2016, which was approximately $314 million as of December 31, 2016. Such dividend capacity is further limited by the actual amount of AG Re’s unencumbered assets, which amount changes from time to time due in part to collateral posting requirements.date they became effective. As of December 31, 2016, AG Re had unencumbered assets of approximately $596 million.
U.K. company law prohibits each of2019 and December 31, 2018, AGE and AGUK from declaring a dividend to its shareholders unless it has “profits available for distribution.” The determination of whether a company has profits available for distribution is based on its accumulated realized profits less its accumulated realized losses. While the U.K. insurance regulatory laws impose no statutory restrictions on a general insurer's ability to declare a dividend, the Prudential Regulation Authority's capital requirements may in practice act as a restriction on dividends.
Dividends and Surplus Notes
By Insurance Company Subsidiaries
|
| | | | | | | | | | | |
| | Year Ended December 31, |
| | 2016 | | 2015 | | 2014 |
| | (in millions) |
| Dividends paid by AGC to AGUS | $ | 79 |
| | $ | 90 |
| | $ | 69 |
|
| Dividends paid by AGM to AGMH | 247 |
| | 215 |
| | 160 |
|
| Dividends paid by AG Re to AGL | 100 |
| | 150 |
| | 82 |
|
| Repayment of surplus note by AGM to AGMH | — |
| | 25 |
| | 50 |
|
| Repayment of surplus note by MAC to AGM | 100 |
| | — |
| | — |
|
| Repayment of surplus note by MAC to MAC Holdings (1) | 300 |
| | — |
| | — |
|
____________________
| |
(1) | MAC Holdings returned $300 million to AGM and AGC, in proportion to their ownership percentages, in the second quarter of 2016. |
Stock Redemption Plan
On November 25, 2016, the New York Superintendent approved AGM's request to repurchase 125 of its shares of common stock from its direct parent, AGMH, for approximately $300 million. AGM implemented the stock redemption plan in December 2016. Each share repurchased by AGM was retired and ceased to be an authorized share. Pursuant to AGM's Amended and Restated Charter, the par value of AGM's remaining shares of common stock issued and outstanding increased automatically in order to maintain AGM's total paid-in capital at $15UK's Own Funds were £684 million and its authorized capital at $20 million.£693 million, respectively.
Accounting Policy
The provision for income taxes consists of an amount for taxes currently payable and an amount for deferred taxes. Deferred income taxes are provided for temporary differences between the financial statement carrying amounts and tax bases of assets and liabilities, using enacted rates in effect for the year in which the differences are expected to reverse. A valuation allowance is recorded to reduce the deferred tax asset to an amount that is more likely than not to be realized.
Non-interest-bearing tax and loss bonds are purchased in the amount of the tax benefit that results from deducting contingency reserves as provided under Internal Revenue Code Section 832(e). The Company records the purchase of tax and loss bonds in deferred taxes.
The Company recognizes tax benefits only if a tax position is “more likely than not” to prevail.
Overview
AGL, and its "Bermuda Subsidiaries," which consist of AG Re, AGRO, and Cedar Personnel Ltd., are not subject to any income, withholding or capital gains taxes under current Bermuda law. The Company has received an assurance from the Minister of Finance in Bermuda that, in the event of any taxes being imposed, AGL and its Bermuda Subsidiaries will be exempt from taxation in Bermuda until March 31, 2035. AGL's U.S. and U.K. subsidiaries are subject to income taxes imposed by U.S. and U.K. authorities, respectively, and file applicable tax returns. In addition, AGRO, a Bermuda domiciled company and AGE, a U.K. domiciled company, have elected under Section 953(d) of the U.S. Internal Revenue Code to be taxed as a U.S. domestic corporation.
In November 2013, AGL became tax resident in the U.K. although it will remain a Bermuda-based company and its administrative and head office functions will continue to be carried on in Bermuda. As a U.K. tax resident company, AGL is required to file a corporation tax return with Her Majesty’s Revenue & Customs (HMRC). AGL is subject to U.K. corporation tax in respect of its worldwide profits (both income and capital gains), subject to any applicable exemptions. The main rate of corporation tax remains at 20% for 2016. AGL has also registered in the U.K. to report its Value Added Tax (VAT) liability. The current rate of VAT is 20%. Assured Guaranty expects that the dividends AGL receives from its direct subsidiaries will be exempt from U.K. corporation tax due to the exemption in section 931D of the U.K. Corporation Tax Act 2009. In addition, any dividends paid by AGL to its shareholders should not be subject to any withholding tax in the U.K. Assured Guaranty does not expect any profits of non-U.K. resident members of the group to be taxed under the U.K. "controlled foreign companies" regime and has obtained a clearance from HMRC confirming this on the basis of current facts.
AGUS files a consolidated federal income tax return with AGC, AG Financial Products Inc. (AGFP), AG Analytics Inc., AGMH and subsidiaries. On April 1, 2015 AGC purchased Radian Asset and Van American. Subsequent to the purchase, Radian Asset merged into AGC and dissolved. Van American joined AGUS consolidated tax group. On July 1, 2016 AGC purchased CIFGNA, which subsequently merged into AGC and dissolved. Assured Guaranty Overseas U.S. Holdings Inc. and its subsidiaries AGRO and AG Intermediary Inc., file their own consolidated federal income tax return.
Provision for Income Taxes
The effective tax rates reflect the proportion of income recognized by each of the Company’s operating subsidiaries, with U.S. subsidiaries taxed at the U.S. marginal corporate income tax rate of 35%, U.K. subsidiaries taxed at the U.K. marginal corporate tax rate of 20% unless subject to U.S. tax by election or as a U.S. controlled foreign corporation, and no taxes for the Company’s Bermuda subsidiaries unless subject to U.S. tax by election or as a U.S. controlled foreign corporation. For periods subsequent to April 1, 2015, the U.K. corporation tax rate has been reduced to 20% and is expected to remain unchanged until April 1, 2017. For period April 1, 2014 to April 1, 2015 the U.K. corporation tax rate was 21% resulting in a blended tax rate of 20.25% in 2015. The Company’s overall effective tax rate fluctuates based on the distribution of income across jurisdictions.Valuation Allowance
A reconciliation of the difference between the provision for income taxes and the expected tax provision at statutory rates in taxable jurisdictions is presented below.
Effective Tax Rate Reconciliation
|
| | | | | | | | | | | |
| | Year Ended December 31, |
| | 2016 | | 2015 | | 2014 |
| | (in millions) |
| Expected tax provision (benefit) at statutory rates in taxable jurisdictions | $ | 316 |
| | $ | 443 |
| | $ | 490 |
|
| Tax-exempt interest | (49 | ) | | (54 | ) | | (53 | ) |
| Gain on bargain purchase | (125 | ) | | (19 | ) | | — |
|
| Change in liability for uncertain tax positions | 11 |
| | 12 |
| | 9 |
|
| Effect of provision to tax return filing adjustments | (15 | ) | | (11 | ) | | (6 | ) |
| Other | (2 | ) | | 4 |
| | 3 |
|
| Total provision (benefit) for income taxes | $ | 136 |
| | $ | 375 |
| | $ | 443 |
|
| Effective tax rate | 13.4 | % | | 26.2 | % | | 28.9 | % |
The expected tax provision at statutory rates in taxable jurisdictions is calculated as the sum of pretax income in each jurisdiction multiplied by the statutory tax rate of the jurisdiction by which it will be taxed. Pretax income of the Company’s subsidiaries which are not U.S. or U.K. domiciled but are subject to U.S. or U.K. tax by election, establishment of tax residency or as controlled foreign corporations, are included at the U.S. or U.K. statutory tax rate. Where there is a pretax loss in one jurisdiction and pretax income in another, the total combined expected tax rate may be higher or lower than any of the individual statutory rates.
The following table presents pretax income and revenue by jurisdiction.
Pretax Income (Loss) by Tax Jurisdiction
|
| | | | | | | | | | | |
| | Year Ended December 31, |
| | 2016 | | 2015 | | 2014 |
| | (in millions) |
| United States | $ | 921 |
| | $ | 1,284 |
| | $ | 1,420 |
|
| Bermuda | 126 |
| | 177 |
| | 142 |
|
| U.K. | (30 | ) | | (30 | ) | | (31 | ) |
| Total | $ | 1,017 |
| | $ | 1,431 |
| | $ | 1,531 |
|
Revenue by Tax Jurisdiction
|
| | | | | | | | | | | |
| | Year Ended December 31, |
| | 2016 | | 2015 | | 2014 |
| | (in millions) |
| United States | $ | 1,442 |
| | $ | 1,853 |
| | $ | 1,633 |
|
| Bermuda | 239 |
| | 361 |
| | 365 |
|
| U.K. | (4 | ) | | (7 | ) | | (4 | ) |
| Total | $ | 1,677 |
| | $ | 2,207 |
| | $ | 1,994 |
|
Pretax income by jurisdiction may be disproportionate to revenue by jurisdiction to the extent that insurance losses incurred are disproportionate.
Components of Net Deferred Tax Assets
|
| | | | | | | |
| | As of December 31, |
| | 2016 | | 2015 |
| | (in millions) |
| Deferred tax assets: | | | |
| Unrealized losses on credit derivative financial instruments, net | $ | 66 |
| | $ | 33 |
|
| Unearned premium reserves, net | 229 |
| | 254 |
|
| Loss and LAE reserve | 216 |
| | 64 |
|
| Tax and loss bonds | 50 |
| | 39 |
|
| Alternative minimum tax credit | 17 |
| | 55 |
|
| Foreign tax credit | 20 |
| | 11 |
|
| DAC | 29 |
| | 27 |
|
| Investment basis difference | 76 |
| | 86 |
|
| Deferred compensation | 40 |
| | 41 |
|
| Net operating loss | 64 |
| | — |
|
| Other | 43 |
| | 17 |
|
| Total deferred income tax assets | 850 |
| | 627 |
|
| Deferred tax liabilities: | | | |
| Contingency reserves | 82 |
| | 64 |
|
| Public debt | 91 |
| | 94 |
|
| Unrealized appreciation on investments | 84 |
| | 108 |
|
| Unrealized gains on CCS | 22 |
| | 22 |
|
| Market discount | 22 |
| | 21 |
|
| Other | 33 |
| | 31 |
|
| Total deferred income tax liabilities | 334 |
| | 340 |
|
| Less: Valuation allowance | 19 |
| | 11 |
|
| Net deferred income tax asset | $ | 497 |
| | $ | 276 |
|
As of December 31, 2016, the Company had alternative minimum tax credits of $17 million which do not expire. During 2016 the Company generated $1has $13 million of foreign tax credit which will expire in 2026. Management believes sufficient future taxable income exists to realize the full benefit of these tax credits.
As part of the CIFG Acquisition, the Company acquired $189credits (FTC) carryovers from previous acquisitions and $23 million of net operating losses (NOL) whichFTC due to the Tax Act for use against regular tax in future years. FTCs will begin to expire in 2033. The NOL has been limited under Internal Revenue Code Section 3822020 and will fully expire by 2027. In analyzing the future realizability of FTCs, the Company notes limitations on future foreign source income due to a change in controloverall foreign losses as a result of the acquisition. As of December 31, 2016,negative evidence. After reviewing positive and negative evidence, the Company had $184came to the conclusion that it is more likely than not that the FTC of $36 million of NOL’swill not be utilized, and therefore recorded a valuation allowance with respect to this tax attribute.
The Company came to the conclusion that it is more likely than not that the remaining deferred tax assets will be fully realized after weighing all positive and negative evidence available as required under GAAP. The positive evidence that was considered included the cumulative income the Company has earned over the last three years, and the significant unearned premium income to offset its future U.S.be included in taxable income. The positive evidence outweighs any negative evidence that exists. As such, the Company believes that no valuation allowance is necessary in connection with the remaining deferred tax assets. The Company will continue to analyze the need for a valuation allowance on a quarterly basis.
Valuation Allowance
As part of the Radian Asset Acquisition, theThe Company acquired $19has $13 million of foreign tax credits (FTC) whichcarryovers from previous acquisitions and $23 million of FTC due to the Tax Act for use against regular tax in future years. FTCs will begin to expire in 2020. Of that balance, $11 million was guaranteed at2020 and will fully expire by 2027. In analyzing the timefuture realizability of FTCs, the purchase with an additional $8 million allocated after filing 2015 tax return.Company notes limitations on future foreign source income due to overall foreign losses as negative evidence. After reviewing positive and negative evidence, the Company came to the conclusion that it is more likely than not that the FTC of $36 million will not be utilized, and therefore recorded a valuation allowance with respect to this tax attribute.
The Company came to the conclusion that it is more likely than not that the remaining net deferred tax assetassets will be fully realized after weighing all positive and negative evidence available as required under GAAP. The positive evidence that was considered included the cumulative income the Company has earned over the last three years, and the significant unearned premium income to be included in taxable income. The positive evidence outweighs any negative evidence that exists. As such, the Company believes that no valuation allowance is necessary in connection with thisthe remaining deferred tax asset.assets. The Company will continue to analyze the need for a valuation allowance on a quarterly basis.
Provision for Income Taxes
Audits
The effective tax rates reflect the proportion of income recognized by each of the Company’s operating subsidiaries, with U.S. subsidiaries taxed at the U.S. marginal corporate income tax rate of 21% in 2019 and 2018 and 35% in 2017, U.K. subsidiaries taxed at the U.K. marginal corporate tax rate of 19%, and no taxes for the Company’s Bermuda Subsidiaries unless subject to U.S. tax by election. In 2018, due to the Tax Act, controlled foreign corporations (CFCs) apply the local marginal corporate tax rate. In addition, the Tax Act creates a new requirement that a portion of the GILTI earned by CFCs must be included currently in the gross income of the CFCs' U.S. shareholder. For the periods between April 1, 2015 and March 31, 2017, the U.K. corporation tax rate was 20%. The Company’s overall effective tax rate fluctuates based on the distribution of income across jurisdictions.
A reconciliation of the difference between the provision for income taxes and the expected tax provision at statutory rates in taxable jurisdictions is presented below.
Effective Tax Rate Reconciliation
|
| | | | | | | | | | | |
| | Year Ended December 31, |
| | 2019 | | 2018 | | 2017 |
| | (in millions) |
| Expected tax provision (benefit) | $ | 91 |
| | $ | 97 |
| | $ | 300 |
|
| Tax-exempt interest | (19 | ) | | (23 | ) | | (49 | ) |
| Bargain purchase gain | — |
| | — |
| | (20 | ) |
| Change in liability for uncertain tax positions | 1 |
| | (15 | ) | | (26 | ) |
| Effect of provision to tax return filing adjustments | (6 | ) | | (1 | ) | | (8 | ) |
| State tax | 1 |
| | 6 |
| | 9 |
|
| Taxes on reinsurance | (5 | ) | | 6 |
| | (4 | ) |
| Effect of adjustments to the provisional amounts as a result of 2017 Tax Cuts and Jobs Act | — |
| | (4 | ) | | 61 |
|
| Foreign taxes | 6 |
| | — |
| | 4 |
|
| Other | (6 | ) | | (7 | ) | | (6 | ) |
| Total provision (benefit) for income taxes | $ | 63 |
| | $ | 59 |
| | $ | 261 |
|
| Effective tax rate | 13.7 | % | | 10.2 | % | | 26.3 | % |
The expected tax provision (benefit) is calculated as the sum of pretax income in each jurisdiction multiplied by the statutory tax rate of the jurisdiction by which it will be taxed. Where there is a pretax loss in one jurisdiction and pretax income in another, the total combined expected tax rate may be higher or lower than any of the individual statutory rates.
The following tables present pretax income and revenue by jurisdiction.
Pretax Income (Loss) by Tax Jurisdiction
|
| | | | | | | | | | | |
| | Year Ended December 31, |
| | 2019 | | 2018 | | 2017 |
| | (in millions) |
| U.S. | $ | 440 |
| | $ | 461 |
| | $ | 873 |
|
| Bermuda | 33 |
| | 121 |
| | 145 |
|
| U.K. and other | (9 | ) | | (2 | ) | | (27 | ) |
| Total | $ | 464 |
| | $ | 580 |
| | $ | 991 |
|
AGUS has openRevenue by Tax Jurisdiction
|
| | | | | | | | | | | |
| | Year Ended December 31, |
| | 2019 | | 2018 | | 2017 |
| | (in millions) |
| U.S. | $ | 779 |
| | $ | 801 |
| | $ | 1,543 |
|
| Bermuda | 146 |
| | 177 |
| | 216 |
|
| U.K. and other | 38 |
| | 23 |
| | (20 | ) |
| Total | $ | 963 |
| | $ | 1,001 |
| | $ | 1,739 |
|
Pretax income by jurisdiction may be disproportionate to revenue by jurisdiction to the extent that insurance losses incurred are disproportionate.
Effect of the 2017 Tax Cuts and Jobs Act
On December 22, 2017, the Tax Act was signed into law. The Tax Act changed many items of U.S. corporate income taxation, including a reduction of the corporate income tax years withrate from 35% to 21%, implementation of a territorial tax system and imposition of a tax on deemed repatriated earnings of non-U.S. subsidiaries. At December 31, 2017, the U.S. Internal Revenue Service (IRS) for 2009 forward and is currently under auditCompany had not completed accounting for the 2009-2012 tax years. Ineffects of the Tax Act; however, the Company made a reasonable estimate of the effects on the existing deferred tax balances and the one-time transition tax. The Company recognized a provisional income tax expense of $61 million, which was included as a component of income tax expense from continuing operations in 2017. During 2018, the Company recorded an adjustment to the provisional amount with a $4 million tax benefit as a component of income tax expense from continuing operations. As of December 31, 2018, the accounting for the income tax effects of 2016 the IRS issuedTax Act have been completed and the total net impact resulting from the Tax Act is an expense of $57 million.
The Tax Act includes provisions for GILTI wherein taxes are imposed on foreign income in excess of a Revenue Agent Report (RAR)deemed return on tangible assets of foreign corporations. The Tax Act also includes a Base Erosion Anti-abuse Tax provision, which did not identify any material adjustments that were not already accounted fortaxes certain payments from a U.S. corporation to its foreign subsidiaries.
Deferred Tax Assets and Liabilities
The Company remeasured certain deferred tax assets and liabilities based on the rates at which they are expected to reverse in the prior periods. Itfuture, which is expected thatgenerally 21%. The provisional amount recorded related to the audit will closeremeasurement of the deferred tax balance was an income tax expense of $37 million. As a result of adjustments identified from filing the 2017 tax return, the total remeasurement of the deferred tax balance resulting from the Tax Act is an income tax expense of $34 million.
Foreign Tax Effects
The one-time transition tax is based on total post-1986 earnings and profits for which the Company had previously deferred U.S. income taxes. The Company recorded a provisional amount for its one-time transition tax liability on non-U.S. subsidiaries less realizable FTCs and a write off of deferred tax liabilities on unremitted earnings, resulting in an increase in income tax expense of $24 million. As a result of adjustments identified from filing the 2017 and, dependingtax return, the total impact to the transition tax resulting from the Tax Act is an income tax expense of $23 million.
The table below summarizes the impact of the Tax Act on the final outcome, reserves for uncertain tax positions may be released. Assured Guaranty Oversees U.S. Holdings Inc. has open tax yearsconsolidated statements of 2013 forward. The Company's U.K. subsidiaries are not currently under examination and have open tax yearsoperations.
Summary of 2014 forward. CIFGNA, which was acquired by AGC during 2016, is not currently under examination and has open tax years of 2013 forward.the Tax Act Effect
(Benefit) Provision
|
| | | | | | | |
| | Year Ended December 31, |
| | 2018 | | 2017 |
| | (in millions) |
| Transition tax | $ | (1 | ) | | $ | 93 |
|
| Foreign tax credit realized | — |
| | (31 | ) |
| Write down of unremitted earnings | — |
| | (38 | ) |
| Net impact of repatriation | (1 | ) | | 24 |
|
| Write down of deferred tax asset due to tax rate change | (3 | ) | | 37 |
|
| Net impact of Tax Act | $ | (4 | ) | | $ | 61 |
|
Uncertain Tax Positions
The following table provides a reconciliation of the beginning and ending balances of the total liability for unrecognized tax positions.
|
| | | | | | | | | | | |
| | 2019 | | 2018 | | 2017 |
| | (in millions) |
| Beginning of year | $ | 14 |
| | $ | 28 |
| | $ | 50 |
|
| Effect of provision to tax return filing adjustments | 5 |
| | 1 |
| | 8 |
|
| Increase in unrecognized tax positions as a result of position taken during the current period | — |
| | — |
| | 1 |
|
| Decrease in unrecognized tax positions as a result of settlement of positions taken during the prior period | — |
| | — |
| | (31 | ) |
| Reductions to unrecognized tax benefits as a result of the applicable statute of limitations | (4 | ) | | (15 | ) | | — |
|
| Balance as of December 31, | $ | 15 |
| | $ | 14 |
| | $ | 28 |
|
|
| | | | | | | | | | | |
| | 2016 | | 2015 | | 2014 |
| | (in millions) |
| Balance as of January 1, | $ | 40 |
| | $ | 28 |
| | $ | 20 |
|
| Effect of provision to tax return filing adjustments | 6 |
| | 10 |
| | 6 |
|
| Increase in unrecognized tax positions as a result of position taken during the current period | 4 |
| | 2 |
| | 2 |
|
| Balance as of December 31, | $ | 50 |
| | $ | 40 |
| | $ | 28 |
|
The Company's policy is to recognize interest related to uncertain tax positions in income tax expense and has accrued $2$1 million for 2016full years 2019, 2018 and $1 million per year for the year ended 2015 and 2014 respectively.2017. As of both December 31, 20162019 and December 31, 2015,2018, the Company has accrued $7 million and $5$2 million of interest, respectively.interest.
The total amount of reserves for unrecognized tax positions, including accrued interest, as of December 31, 20162019 and December 31, 2018 that would affect the effective tax rate, if recognized.recognized, was $17 million and $16 million, respectively.
Tax TreatmentAudits
As of CDS
TheDecember 31, 2019, AGUS had open tax years with the U.S. IRS for 2016 to present and is currently under audit for the 2016 tax year. It is expected that the audit will close in 2020 and, depending on the final outcome, reserves for uncertain tax positions may be released. In December 2016, the IRS issued a Revenue Agent Report for the 2009 - 2012 audit period, which did not identify any material adjustments that were not already accounted for in prior periods. In April 2017, the Company treatsreceived a final letter from the guaranty it provides on CDS as an insurance contract for tax purposesIRS to close the audit with no additional findings or changes, and as such a taxable loss does not occur untilresult the Company expects to make a loss paymentreleased previously recorded uncertain tax position reserves and accrued interest of approximately $37 million in the second quarter of 2017. The 2013 and 2014 tax years closed in 2018. The 2015 tax year closed in 2019. Assured Guaranty Overseas US Holdings Inc. has open tax years of 2016 forward but is not currently under audit with the IRS. The Company's U.K. subsidiaries are not currently under examination and have open tax years of 2017 forward. CIFGNA, which was acquired by AGC during 2016, is not currently under examination and has open tax years of 2016 to the buyerdate of credit protection based upon the occurrence of one or more specified credit events with respect to the contractually referenced obligation or entity. The Company holds its CDS to maturity, at which time any unrealized fair value loss in excess of credit-related losses would revert to zero. The tax treatment of CDS is an unsettled area of the law. The uncertainty relates to the IRS determination of the income or potential loss associated with CDS as either subject to capital gain (loss) or ordinary income (loss) treatment. In treating CDS as insurance contracts the Company treats both the receipt of premium and payment of losses as ordinary income and believes it is more likely than not that any CDS credit related losses will be treated as ordinary by the IRS. To the extent the IRS takes the view that the losses are capital losses in the future and the Company incurred actual losses associated with the CDS, the Company would need sufficient taxable income of the same character within the carryback and carryforward period available under the tax law.acquisition.
| |
13.18. | Reinsurance and Other Monoline ExposuresInsurance Company Regulatory Requirements |
The Company assumes exposure on insured obligations (Assumed Business)following table summarizes the equity and may cede portions of its exposure on obligations it has insured (Ceded Business)income amounts reported to local regulatory bodies in exchangethe U.S. and Bermuda for premiums, net of ceding commissions.insurance subsidiaries within the group. The Company historically entered into ceded reinsurance contracts in order to obtain greater business diversification and reducediscussion that follows describes the net potential loss from large risks.
Accounting Policy
For business assumed and ceded, the accounting model of the underlying direct financial guaranty contract dictates the accounting model used for the reinsurance contract (except for those eliminated as FG VIEs). For any assumed or ceded financial guaranty insurance premiums and financial guaranty insurance losses, the accounting models described in Note 6 are followed. For any assumed or ceded credit derivative contracts, the accounting model in Note 8 is followed.
Assumed and Ceded Business
The Company assumes business from third party insurers and reinsurers, including other monoline financial guaranty companies. Under these relationships, the Company assumes a portion of the ceding company’s insured risk in exchange for a portion of the ceding Company's premium for the insured risk (typically, net of a ceding commission). The Company’s facultative and treaty agreements are generally subject to termination at the option of the ceding company:
if the Company fails to meet certain financial and regulatory criteria and to maintain a specified minimum financial strength rating, or
upon certain changes of control of the Company.
Upon termination under these conditions, the Company may be required (under some of its reinsurance agreements) to return to the ceding company unearned premiums (net of ceding commissions) and loss reserves calculated on a statutory basis of accounting attributableand differences to reinsurance assumed pursuant to such agreements after which the Company would be released from liability with respect to the Assumed Business.GAAP.
Upon the occurrence of the conditions set forth in the first bullet above, whether or not an agreement is terminated, the Company may be required to obtain a letter of credit or alternative form of security to collateralize its obligation to perform under such agreement or it may be obligated to increase the level of ceding commission paid.Insurance Regulatory Amounts Reported
The downgrade of the financial strength ratings of AG Re or of AGC gives certain ceding companies the right to recapture business they had ceded to AG ReU.S. and AGC, which would lead to a reduction in the Company's unearned premium reserve and related earnings on such reserve. With respect to a significant portion of the Company's in-force financial guaranty assumed business, based on AG Re's and AGC's current ratings and subject to the terms of each reinsurance agreement, the third party ceding company may have the right to recapture business it had ceded to AG Re and/or AGC, and in connection therewith, to receive payment from AG Re or AGC of an amount equal to the statutory unearned premium (net of ceding commissions) and statutory loss reserves (if any) associated with that business, plus, in certain cases, an additional required payment. As of December 31, 2016, if each third party insurer ceding business to AG Re and/or AGC had a right to recapture such business, and chose to exercise such right, the aggregate amounts that AG Re and AGC could be required to pay to all such companies would be approximately $45 million and $18 million, respectively.
The Company has Ceded Business to non-affiliated companies to limit its exposure to risk. Under these relationships, the Company ceded a portion of its insured risk to the reinsurer in exchange for the reinsurer receiving a share of the Company's premiums for the insured risk (typically, net of a ceding commission). The Company remains primarily liable for all risks it directly underwrites and is required to pay all gross claims. It then seeks reimbursement from the reinsurer for its proportionate share of claims. The Company may be exposed to risk for this exposure if it were required to pay the gross claims and not be able to collect ceded claims from an assuming company experiencing financial distress. A number of the financial guaranty insurers to which the Company has ceded par have experienced financial distress and been downgraded by the rating agencies as a result. In addition, state insurance regulators have intervened with respect to some of these insurers. The Company’s ceded contracts generally allow the Company to recapture Ceded Business after certain triggering events, such as reinsurer downgrades.
Over the past several years, the Company has entered into several commutations in order to reassume previously ceded books of business from its reinsurers. The Company has also canceled assumed reinsurance contracts.
Net Effect of Commutations of Ceded and
Cancellations of Assumed Reinsurance Contracts
Bermuda
|
| | | | | | | | | | | |
| | Year Ended December 31, |
| | 2016 | | 2015 | | 2014 |
| | (in millions) |
| Increase (decrease) in net unearned premium reserve | $ | — |
| | $ | 23 |
| | $ | 20 |
|
| Increase (decrease) in net par outstanding | 28 |
| | 855 |
| | 1,167 |
|
| Commutation gains (losses) | 8 |
| | 28 |
| | 23 |
|
The following table presents the components of premiums and losses reported in the consolidated statement of operations and the contribution of the Company's Assumed and Ceded Businesses.
Effect of Reinsurance on Statement of Operations
|
| | | | | | | | | | | |
| | Year Ended December 31, |
| | 2016 | | 2015 | | 2014 |
| | (in millions) |
| Premiums Written: | | | | | |
| Direct | $ | 165 |
| | $ | 164 |
| | $ | 116 |
|
| Assumed(1) | (11 | ) | | 17 |
| | (12 | ) |
| Ceded(2) | (17 | ) | | 10 |
| | 15 |
|
| Net | $ | 137 |
| | $ | 191 |
| | $ | 119 |
|
| Premiums Earned: | | | | | |
| Direct | $ | 887 |
| | $ | 792 |
| | $ | 581 |
|
| Assumed | 27 |
| | 40 |
| | 47 |
|
| Ceded | (50 | ) | | (66 | ) | | (58 | ) |
| Net | $ | 864 |
| | $ | 766 |
| | $ | 570 |
|
| Loss and LAE: | | | | | |
| Direct | $ | 327 |
| | $ | 399 |
| | $ | 132 |
|
| Assumed | 0 |
| | 45 |
| | 37 |
|
| Ceded | (32 | ) | | (20 | ) | | (43 | ) |
| Net | $ | 295 |
| | $ | 424 |
| | $ | 126 |
|
|
| | | | | | | | | | | | | | | | | | | |
| | Policyholders' Surplus | | Net Income (Loss) |
| | As of December 31, | | Year Ended December 31, |
| | 2019 | | 2018 | | 2019 | | 2018 | | 2017 |
| | (in millions) |
| U.S. statutory companies: | | | | | | | | | |
| AGM (1) (2) | $ | 2,691 |
| | $ | 2,533 |
| | $ | 312 |
| | $ | 172 |
| | $ | 152 |
|
| AGC (1) (2) | 1,775 |
| | 1,793 |
| | 226 |
| | (5 | ) | | 219 |
|
| MAC (2) | 276 |
| | 321 |
| | 53 |
| | 55 |
| | 32 |
|
| Bermuda statutory companies: | | | | | | | | | |
| AG Re | 1,098 |
| | 1,249 |
| | 45 |
| | 131 |
| | 155 |
|
| AGRO | 410 |
| | 383 |
| | 12 |
| | 10 |
| | 10 |
|
____________________
| |
| (1) | Negative assumed premiums written were due to changes in expected debt service schedules.Policyholders' surplus of AGM and AGC includes their indirect share of MAC. AGM and AGC own 60.7% and 39.3%, respectively, of the outstanding stock of Municipal Assurance Holdings Inc. (MAC Holdings), which owns 100% of the outstanding common stock of MAC. |
| |
| (2) | Positive ceded premiums written were due to commutationsAs of December 31, 2019, policyholders' surplus is net of contingency reserves of $869 million, $546 million and changes in expected debt service schedules.$192 million for AGM, AGC and MAC, respectively. As of December 31, 2018, policyholders' surplus is net of contingency reserves of $913 million, $550 million and $200 million for AGM, AGC and MAC, respectively. |
In additionBasis of Regulatory Financial Reporting
United States
Each of the Company's U.S. domiciled insurance companies' ability to the items presentedpay dividends depends, among other things, upon its financial condition, results of operations, cash requirements, compliance with rating agency requirements, and is also subject to restrictions contained in the table above,insurance laws and related regulations of its state of domicile and other states. Financial statements prepared in accordance with accounting practices prescribed or permitted by local insurance regulatory authorities differ in certain respects from GAAP.
The Company's U.S. domiciled insurance companies prepare statutory financial statements in accordance with accounting practices prescribed or permitted by the National Association of Insurance Commissioners and their respective insurance departments. Prescribed statutory accounting practices are set forth in the National Association of Insurance Commissioners Accounting Practices and Procedures Manual. The Company recordshas no permitted accounting practices on a statutory basis.
GAAP differs in net change in fair valuecertain significant respects from U.S. insurance companies' statutory accounting practices prescribed or permitted by insurance regulatory authorities. The principal differences result from the statutory accounting practices listed below.
Upfront premiums are earned upon expiration of credit derivativesrisk rather than earned over the expected period of coverage. Premium earnings are accelerated when transactions are economically defeased, rather than legally defeased.
Acquisition costs are charged to expense as incurred rather than over the period that related premiums are earned.
A contingency reserve is computed based on the consolidated statements of operations, the effect of assumed and ceded credit derivative exposures. These amounts were losses of $27 million in 2016 and $3 million in 2015 and gains of $2 million in 2014.statutory requirements, whereas no such reserve is required under GAAP.
Other Monoline ExposuresCertain assets designated as “non-admitted assets” are charged directly to statutory surplus, rather than reflected as assets under GAAP.
In addition to assumed and ceded reinsurance arrangements, the Company may also have exposure to some financial guaranty reinsurers (i.e., monolines)Investments in other areas. Second-to-pay insured par outstanding represents transactions the Company has insured that were previously insured by third party insurers and reinsurers. The Company underwrites such transactions basedsubsidiaries are carried on the underlying insured obligation without regardbalance sheet on the equity basis, to the primary insurer. Another areaextent admissible, rather than consolidated with the parent.
Admitted deferred tax assets are subject to an adjusted surplus threshold and subject to a limitation calculated in accordance with SAP. Under GAAP there is no non-admitted asset determination, rather a valuation allowance is recorded to reduce the deferred tax asset to an amount that is more likely than not to be realized.
Insured credit derivatives are accounted for as insurance contracts rather than as derivative contracts measured at fair value.
Bonds are generally carried at amortized cost rather than fair value.
Insured obligations of exposure is in the investment portfolioVIEs and refinancing vehicles’ debt, where the Company holds fixed-maturity securities thatis deemed the primary beneficiary, are wrapped by monolinesaccounted for as insurance contracts. Under GAAP, such VIEs and whoserefinancing vehicles are consolidated and any transactions with the Company are eliminated.
Surplus notes are recognized as surplus and each payment of principal and interest is recorded only upon approval of the insurance regulator rather than as liabilities with periodic accrual of interest.
Acquisitions are accounted for as either statutory purchases or statutory mergers, rather than under the purchase method under GAAP.
Losses are discounted at tax equivalent yields, and recorded when the loss is deemed probable and without consideration of the deferred premium revenue. Under GAAP, expected losses are discounted at the risk free rate at the end of each reporting period and are recorded only to the extent they exceed deferred premium revenue.
The present value may change basedof installment premiums and commissions are not recorded on the rating ofbalance sheet as they are under GAAP.
Bermuda
AG Re, a Bermuda regulated Class 3B insurer, and AGRO, a Bermuda regulated Class 3A and Class C insurer,
prepare their statutory financial statements in conformity with the monoline. As of December 31, 2016, based on fair value,accounting principles set forth in the Company had fixed-maturity securities in its investment portfolio consisting of $110 million insured by National, $83 million insured by AmbacInsurance Act 1978, amendments thereto and $8 million insured by other guarantors.
In addition, the Company acquired bonds for loss mitigation or other risk management purposes.related regulations. As of December 31, 2016, these bonds hadthe Bermuda Monetary Authority (the Authority) requires insurers to prepare statutory financial statements in accordance with the particular accounting principles adopted by the insurer (which, in the case of AG Re and AGRO, are U.S. GAAP), subject to certain adjustments. The principal difference relates to certain assets designated as “non-admitted assets” which are charged directly to statutory surplus rather than reflected as assets as they are under U.S. GAAP.
United Kingdom
AGE UK prepares its Solvency and Financial Condition Report and other required regulatory financial report based on Prudential Regulation Authority and Solvency II Regulations (Solvency II). AGE UK adopted the full framework required by Solvency II on January 1, 2016, which is the date they became effective. As of December 31, 2019 and December 31, 2018, AGE UK's Own Funds were £684 million and £693 million, respectively.
Dividend Restrictions and Capital Requirements
United States
Under New York insurance law, AGM and MAC may only pay dividends out of "earned surplus," which is the portion of the company's surplus that represents the net earnings, gains or profits (after deduction of all losses) that have not been distributed to shareholders as dividends, transferred to stated capital or capital surplus, or applied to other purposes permitted by law, but does not include unrealized appreciation of assets. AGM and MAC may each pay dividends without the prior approval of the New York Superintendent of Financial Services (New York Superintendent) that, together with all dividends declared or distributed by it during the preceding 12 months, do not exceed the lesser of 10% of its policyholders' surplus (as of
its last annual or quarterly statement filed with the New York Superintendent) or 100% of its adjusted net investment income during that period.
The maximum amount available during 2020 for AGM to distribute to AGMH as dividends without regulatory approval is estimated to be approximately $218 million. Of such $218 million, $72 million is estimated to be available for distribution in the first quarter of 2020.
In March 2019, MAC received approval from the New York State Department of Financial Services to dividend to MAC Holdings, which is owned by AGM and AGC, $100 million in 2019, an amount that exceeded the dividend capacity that was available for distribution without regulatory approval. MAC distributed a fair value$100 million dividend to MAC Holdings in the second quarter of $3322019. The maximum amount available during 2020 for MAC to distribute to MAC Holdings as dividends without regulatory approval is estimated to be approximately $21 million, insuredNaN of which is available for distribution in the first quarter of 2020.
Under Maryland's insurance law, AGC may, with prior notice to the Maryland Insurance Commissioner, pay an ordinary dividend that, together with all dividends paid in the prior 12 months, does not exceed the lesser of 10% of its policyholders' surplus (as of the prior December 31) or 100% of its adjusted net investment income during that period. The maximum amount available during 2020 for AGC to distribute as ordinary dividends is approximately $166 million. Of such $166 million, approximately $85 million is available for distribution in the first quarter of 2020.
Bermuda
For AG Re, any distribution (including repurchase of shares) of any share capital, contributed surplus or other statutory capital that would reduce its total statutory capital by MBIA15% or more of its total statutory capital as set out in its previous year's financial statements requires the prior approval of the Authority. Separately, dividends are paid out of an insurer's statutory surplus and $126cannot exceed that surplus. Furthermore, annual dividends cannot exceed 25% of total statutory capital and surplus as set out in its previous year's financial statements, which is $274 million, insured by FGIC UK Limited. On January 10, 2017,without AG Re certifying to the Company delivered the bonds insured by MBIA in connection with its acquisition of AGLN. See Note 2, Acquisitions, for more informationAuthority that it will continue to meet required margins.Based on the acquisitionforegoing limitations, in 2020 AG Re has the capacity to (i) make capital distributions in an aggregate amount up to $128 million without the prior approval of AGLN.the Authority and (ii) declare and pay dividends in an aggregate amount up to approximately $274 million as of December 31, 2019. Such dividend capacity is further limited by (i) the actual amount of AG Re’s unencumbered assets, which amount changes from time to time due in part to collateral posting requirements and which was approximately $264 million as of December 31, 2019, and (ii) the amount of statutory surplus, which as of December 31, 2019 was $240 million.
For AGRO, annual dividends cannot exceed $103 million, without AGRO certifying to the Authority that it will continue to meet required margins. Based on the foregoing limitations, in 2020 AGRO has the capacity to (i) make capital distributions in an aggregate amount up to $21 million without the prior approval of the Authority and (ii) declare and pay dividends in an aggregate amount up to approximately $103 million as of December 31, 2019. Such dividend capacity is further limited by (i) the actual amount of AGRO’s unencumbered assets, which amount changes from time to time due in part to collateral posting requirements and which was approximately $383 million as of December 31, 2019, and (ii) the amount of statutory surplus, which as of December 31, 2019 was $273 million.
United Kingdom
U.K. company law prohibits AGE UK from declaring a dividend to its shareholders unless it has “profits available for distribution.” The determination of whether a company has profits available for distribution is based on its accumulated realized profits less its accumulated realized losses. While the U.K. insurance regulatory laws impose no statutory restrictions on a general insurer's ability to declare a dividend, the Prudential Regulation Authority's capital requirements may in practice act as a restriction on dividends.
In accordance with U.S. statutory accounting requirementsDividend Restrictions and U.S. insurance laws and regulations, in order for the Company to receive credit for liabilities ceded to reinsurers domiciled outside of the U.S., such reinsurers must secure their liabilities to the Company. All of the unauthorized reinsurers in the tables below are required to post collateral for the benefit of the Company in an amount at least equal to the sum of their ceded unearned premium reserve, loss reserves and contingency reserves all calculated on a statutory basis of accounting. In addition, certain authorized reinsurers in the tables below post collateral on terms negotiated with the Company.Capital Requirements
Distributions by
Monoline and Reinsurer Exposure by CompanyInsurance Subsidiaries
|
| | | | | | | | | | | | |
| | | Par Outstanding |
| | | As of December 31, 2016 |
| Reinsurer | | Ceded Par
Outstanding (1) | | Second-to-
Pay Insured
Par
Outstanding (2) | | Assumed Par
Outstanding |
| | | (in millions) |
| Reinsurers rated investment grade: | | | | | | |
| Tokio Marine & Nichido Fire Insurance Co., Ltd. (3) (4) | | $ | 3,436 |
| | $ | — |
| | $ | — |
|
| Mitsui Sumitomo Insurance Co. Ltd. (3) (4) | | 1,273 |
| | — |
| | — |
|
| National | | — |
| | 4,420 |
| | 4,364 |
|
| Subtotal | | 4,709 |
| | 4,420 |
| | 4,364 |
|
| Reinsurers rated BIG, had rating withdrawn or not rated: | | | | | | |
| American Overseas Reinsurance Company Limited (3) | | 3,573 |
| | — |
| | 30 |
|
| Syncora (3) | | 2,062 |
| | 1,098 |
| | 655 |
|
| ACA Financial Guaranty Corp. | | 637 |
| | 20 |
| | — |
|
| Ambac | | 115 |
| | 2,862 |
| | 6,695 |
|
| MBIA | | — |
|
| 1,024 |
|
| 165 |
|
| MBIA UK (5) | | — |
|
| 319 |
|
| 211 |
|
| FGIC (6) | | — |
| | 1,194 |
| | 410 |
|
| Ambac Assurance Corp. Segregated Account | | — |
| | 73 |
| | 614 |
|
| Other (3) | | 60 |
| | 529 |
| | 120 |
|
| Subtotal | | 6,447 |
| | 7,119 |
| | 8,900 |
|
| Total | | $ | 11,156 |
| | $ | 11,539 |
| | $ | 13,264 |
|
|
| | | | | | | | | | | |
| | Year Ended December 31, |
| | 2019 | | 2018 | | 2017 |
| | (in millions) |
| Dividends paid by AGC to AGUS | $ | 123 |
| | $ | 133 |
| | $ | 107 |
|
| Dividends paid by AGM to AGMH | 220 |
| | 171 |
| | 196 |
|
| Dividends paid by AG Re to AGL | 275 |
| | 125 |
| | 125 |
|
| Dividends paid by MAC to MAC Holdings (1) | 105 |
| | 27 |
| | 36 |
|
| Repurchase of common stock by AGM from AGMH | — |
| | — |
| | 101 |
|
| Repurchase of common stock by AGC from AGUS | 100 |
| | 200 |
| | — |
|
| Redemption of common stock by MAC from MAC Holdings (1) | — |
| | — |
| | 250 |
|
____________________
| |
| (1) | OfMAC Holdings distributed nearly the total ceded parentire amounts to reinsurers rated BIG, had rating withdrawn or not rated, $384 million is rated BIG.AGM and AGC, in proportion to their ownership percentages. |
| |
(2) | The par on second-to-pay exposure where the primary insurer and underlying transaction rating are both BIG is $788 million. |
| |
(3) | The total collateral posted by all non-affiliated reinsurers required or had agreed to post collateral as of December 31, 2016 was approximately $387 million.
|
(4) The Company benefits from trust arrangements that satisfy the triple-A credit requirement of S&P and/or Moody’s.
| |
(5) | See Note 2, Acquisitions, for more information on MBIA UK. |
| |
(6) | FGIC includes subsidiaries Financial Guaranty Insurance Company and FGIC UK Limited. |
Amounts Due (To) From Reinsurers
As of December 31, 2016
|
| | | | | | | | | | | | | | | |
| | Assumed Premium, net of Commissions | | Ceded Premium, net of Commissions | | Assumed
Expected
Loss to be Paid | | Ceded
Expected
Loss to be Paid |
| | (in millions) |
| Reinsurers rated investment grade | $ | 5 |
| | $ | (11 | ) | | $ | (1 | ) | | $ | 62 |
|
| Reinsurers rated BIG, had rating withdrawn or not rated: | | | | | | | |
| Ambac | 33 |
| | — |
| | (1 | ) | | — |
|
| Syncora | 13 |
| | (18 | ) | | — |
| | (3 | ) |
| Ambac Assurance Corp. Segregated Account | 6 |
| | — |
| | (47 | ) | | — |
|
| FGIC | 4 |
| | — |
| | (13 | ) | | — |
|
| MBIA | 0 |
| | — |
| | (8 | ) | | — |
|
| MBIA UK | 4 |
| | — |
| | 0 |
| | — |
|
| American Overseas Reinsurance Company Limited | — |
| | (5 | ) | | — |
| | 28 |
|
| Other | — |
| | (12 | ) | | — |
| | — |
|
| Subtotal | 60 |
| | (35 | ) | | (69 | ) | | 25 |
|
| Total | $ | 65 |
| | $ | (46 | ) | | $ | (70 | ) | | $ | 87 |
|
Excess of Loss Reinsurance Facility
AGC, AGM and MAC entered into a $360 million aggregate excess of loss reinsurance facility with a number of reinsurers, effective as of January 1, 2016. This facility replaces a similar $450 million aggregate excess of loss reinsurance facility that AGC, AGM and MAC had entered into effective January 1, 2014 and which terminated on December 31, 2015. The new facility covers losses occurring either from January 1, 2016 through December 31, 2023, or January 1, 2017 through December 31, 2024, at the option of AGC, AGM and MAC. It terminates on January 1, 2018, unless AGC, AGM and MAC choose to extend it. The new facility covers certain U.S. public finance credits insured or reinsured by AGC, AGM and MAC as of September 30, 2015, excluding credits that were rated non-investment grade as of December 31, 2015 by Moody’s or S&P or internally by AGC, AGM or MAC and is subject to certain per credit limits. Among the credits excluded are those associated with the Commonwealth of Puerto Rico and its related authorities and public corporations. The new facility attaches when AGC’s, AGM’s and MAC’s net losses (net of AGC’s and AGM's reinsurance (including from affiliates) and net of recoveries) exceed $1.25 billion in the aggregate. The new facility covers a portion of the next $400 million of losses, with the reinsurers assuming pro rata in the aggregate $360 million of the $400 million of losses and AGC, AGM and MAC jointly retaining the remaining $40 million. The reinsurers are required to be rated at least AA- or to post collateral sufficient to provide AGM, AGC and MAC with the same reinsurance credit as reinsurers rated AA-. AGM, AGC and MAC are obligated to pay the reinsurers their share of recoveries relating to losses during the coverage period in the covered portfolio. AGC, AGM and MAC paid approximately $9 million of premiums in 2016 for the term January 1, 2016 through December 31, 2016 and had approximately $9 million of cash in trust accounts for the benefit of the reinsurers to be used to pay the premium for January 1, 2017 through December 31, 2017.
| |
14.19. | Related Party Transactions |
From time to time, certain officers, directors, employees, their family members and related charitable foundations may make investments in various private funds, vehicles or accounts managed by the Company. These investments are available to those of the Company's employees whom the Company has determined to have a status that reasonably permits the Company to offer them these types of investments in compliance with applicable laws. Generally, these investments are not subject to the management fees and performance allocations or incentive fees charged to other investors. As of December 31, 2019, all noncontrolling interests in the consolidated balance sheets represent employees' ownership interests in consolidated Assured Investment Management funds. Andrew Feldstein, the Company’s Chief Investment Officer and Head of Asset Management, is among the Company’s employees who invest in various private funds, vehicles or accounts managed by the Company. See also Note 12, Asset Management Fees, for additional information.
NaN of the Company's investment portfolio managers, Wellington Management Company, LLP (Wellington) and BlackRock Financial Management, Inc. (BlackRock), each own more than 5% of the Company's common shares, and each are investment managers forshares. In addition, the Company has a portionminority interest in Wasmer, Schroeder & Company LLC, which is also one of the Company's investment portfolio.portfolio managers. The investment management expense from transactions with these related parties was approximately $3.8 million in 2019, $4.0 million in 2018 and $4.1 million in 2017. In addition, the Company recognized $1.0 million and $1.2 million in 2019 and 2018, respectively, in income from its investment in Wasmer, Schroeder & Company LLC, which is included in "equity in net earnings of investees" in the consolidated statements of operations. Accrued expenses from transactions with Wellington and BlackRockthese related parties were approximately $4.2$2 million in 2016. The net expenses from transactions with Wellington were $1.9 million in 2015 and $1.9 million in 2014. Asas of both December 31, 20162019 and 2015 there were no other significant amounts payableDecember 31, 2018.
The Charles Schwab Corporation announced on February 24, 2020 that it had entered into an agreement to or amounts receivable from related parties, other than compensationacquire Wasmer, Schroeder & Company, LLC, and that, subject to customary closing conditions, it expects to close the transaction in the ordinary course of business.mid-2020.
On January 6, 2017, as part of the Company's share repurchase program, the Company repurchased 297,131 common shares from its Chief Executive Officer and 23,062 common shares from its General Counsel. The Company repurchased the shares at the closing price of an AGL common share on the New York Stock Exchange on January 6, 2017. Separately, on that same date, these officers received 297,131 and 23,062 other common shares, respectively, in settlement of share units held by them in the employer stock fund of the Assured Guaranty Ltd. Supplemental Employee Retirement Plan (the AGL SERP). The units needed to be settled in January 2017 pursuant to the terms of an amendment adopted in 2011 to the AGL SERP, which amendment was adopted to comply with requirements of Section 409A of the Internal Revenue Code (the Code) and Section 457A of the Code.
| |
15.20. | Commitments and Contingencies |
Leases
AGL and its subsidiaries areThe Company is party to various non-cancelable lease agreements, accounted for asthese leases include both operating and finance leases. The Company leases and occupieslargest lease relates to approximately 103,500 square feet of office space in New York City, throughand expires in 2032. In addition, AGL and its subsidiaries lease additional office space in various locations under non-cancelable operating leases which expire at various dates through 2029. Rent expense was $13.4 million in 2016, $10.5 million in 2015 and $10.1 million in 2014.
AGM entered into an operating lease effective January 1, 2016, for new office space comprising one full floor and one partial floor at 1633 Broadway in New York City. The Company moved the principal place of business of AGM, AGC, MAC and the Company's other U.S. based subsidiaries from 31 West 52nd Street in New York City to this new location during the summer of 2016. The new lease is for approximately 88,000 square feet and runs until 2032, with an option, subjectSubject to certain conditions, the Company has an option to renew this lease for an additional five years at a fair market rent. The fixed annual rent, which commences after an initial rent holiday, begins at $6.2 million, rising in two steps to $7.3 million for the last five yearsCompany also leases another 78,400 square feet of the initial term. In connection with the move and in return for rent abatement and certain other concessions, AGM terminated its lease on its existing office space at 31 West 52nd Street, which had been scheduled to run until 2026.On September 23, 2016, AGM entered into an amendment toa second location in New York City, and that lease expires in 2024. Additionally, the Company leases additional office space in several other locations, an apartment, and certain equipment. These leases expire at various dates through 2029.
Accounting Policy
Effective January 1, 2019, the Company adopted Topic 842, which required the establishment of a right-of-use (ROU) asset and a lease liability on the balance sheet for operating and finance leases. An ROU asset represents the Company's right to includeuse an underlying asset for the lease term, and a lease liability represents the Company's obligation to make lease payments arising from the lease. Upon adoption, all of the Company’s leases were classified as operating leases; however, the Company made an accounting policy election not to apply the recognition requirements of Topic 842 to short-term leases with an initial term of 12 months or less. At the inception of a lease, the total payments under a lease agreement were discounted utilizing an incremental borrowing rate that represents the Company’s collateralized borrowing rate. Upon adoption, the incremental borrowing rate for each lease was determined based on the remaining portionlease term as of January 1, 2019. The Company does not include renewal options in calculating the lease liability.
The Company elected the package of practical expedients, which permitted organizations not to reassess (i) whether any expired or existing contracts are or contain leases, (ii) the lease classification of expired or existing leases, and (iii) the initial direct costs for existing leases. The Company also elected the practical expedient to account for all lease components and their associated non-lease components (i.e., common area maintenance, real estate taxes, building insurance, etc.) as a single lease component and include all fixed payments in the measurement of ROU assets and lease liabilities.
Upon adoption, the Company recognized lease liabilities of approximately $95 million (recorded in other liabilities), ROU assets of approximately $69 million (recorded in other assets), and derecognized existing deferred rent and lease incentive liabilities of approximately $26 million, which resulted in no cumulative-effect adjustment to retained earnings.
Operating lease expense is recognized on a straight-line basis over the lease term and finance lease expense is comprised of the partial floor for the remainderstraight-line amortization of the lease term. The fixed annual rent, which commences after an initial rent holiday, begins at $1.1 million per annum, rising in two stepsasset and the accretion of interest expense under the effective interest method. Costs related to $1.3 millionvariable lease and non-lease components for the last five years ofCompany’s leases are expensed in the initial term.period incurred. The Company also subleases office space that is not used for its operations.
Lease Assets and Liabilities
|
| | | | | | | | | | | | | |
| | | As of December 31, 2019 |
| | | Assets(1) | | Liabilities(2) | | Weighted Average Remaining Lease Term (in years) | | Weighted Average Discount Rate |
| | | (in millions) | | | | |
| Operating leases | | $ | 100 |
| | $ | 130 |
| | 9.4 | | 2.61 | % |
| Finance leases | | 2 |
| | 2 |
| | 1.8 | | 1.74 | % |
| Total | | $ | 102 |
| | $ | 132 |
| | | | |
____________________
| |
| (1) | Recorded in other assets in the consolidated balance sheets. Finance lease assets are recorded net of accumulated amortization of $0.1 million as of December 31, 2019. |
| |
| (2) | Recorded in other liabilities in the consolidated balance sheets. |
Components of Lease Expense and Other Information
|
| | | | |
| | | Year Ended December 31, |
| | | 2019 |
| | | (in millions) |
| Operating lease cost | | $ | 10 |
|
| Variable lease cost | | 2 |
|
| Total lease cost (1) | | $ | 12 |
|
| Cash paid for amounts included in the measurement of lease liabilities (2) | | |
| Operating cash flows from operating leases | | $ | 11 |
|
| ROU assets obtained in exchange for new operating lease liabilities (3) | | 37 |
|
| ROU assets obtained in exchange for new finance lease liabilities (3) | | 2 |
|
____________________
| |
| (1) | Short-term lease costs, finance lease costs and sublease income are de minimis. Includes amortization on finance lease ROU assets and interest on finance lease liabilities. |
| |
| (2) | Operating and financing cash flows from finance leases are de minimis. |
| |
| (3) | Relates primarily to BlueMountain Acquisition. See Note 2, Business Combinations and Assumption of Insured Portfolio, for additional information. |
Rent expense was $9 million in 2018 and $9 million in 2017.
Future Minimum Rental PaymentsLong Term Debt
|
| | | | |
| Year | | (in millions) |
| 2017 | $ | 6 |
|
| 2018 | 8 |
|
| 2019 | 9 |
|
| 2020 | 9 |
|
| 2021 | 8 |
|
| Thereafter | 88 |
|
| Total | $ | 128 |
|
Legal Proceedings
Lawsuits arise in the ordinary courseThe Company has outstanding long-term debt primarily consisting of debt issued by AGUS and AGMH. All of the Company’s business. ItAGUS and AGMH debt is the opinionfully and unconditionally guaranteed by AGL; AGL's guarantee of the Company’s management, based uponjunior subordinated debentures is on a junior subordinated basis.
Intercompany Loans Payable
On October 1, 2019, AGM, AGC and MAC made 10 year, 3.5% interest rate intercompany loans to AGUS totaling $250 million to fund the information available, thatBlueMountain Acquisition and the expected outcomerelated capital contributions. Interest will be payable annually in arrears on each anniversary of litigation against the Company, individuallynote, commencing on October 1, 2020. Interest will accrue daily and be computed on a basis of a 360 day year from October 1, 2019 until the date on which the principal amount is paid in full. AGUS will pay 20% of the original principal amount of each note on the sixth, seventh, eighth, and ninth anniversaries. The remaining 20% of the original principal amount and all accrued and unpaid interest will be paid on the maturity date. AGUS has the right to prepay the principal amount of the notes in whole or in the aggregate, will not have a material adverse effect on the Company’s financial positionpart at any time, or liquidity, although an adverse resolutionfrom time to time, without payment of litigation against the Company in a fiscal quarterany premium or year could have a material adverse effect on the Company’s resultspenalty.
See Note 2, Business Combinations and Assumption of operations in a particular quarter or year.Insured Portfolio, for additional information.
In addition, in 2012 AGUS borrowed $90 million from its affiliate AGRO to fund the ordinary courseacquisition of MAC. In 2018, the maturity date was extended to November 2023. During 2019, 2018 and 2017, AGUS repaid $10 million, $10 million and $10 million, respectively, in outstanding principal as well as accrued and unpaid interest. As of December 31, 2019, $40 million remained outstanding.
Debt Issued by AGUS
7% Senior Notes. On May 18, 2004, AGUS issued $200 million of 7% Senior Notes due 2034 (7% Senior Notes) for net proceeds of $197 million. Although the coupon on the Senior Notes is 7%, the effective rate is approximately 6.4%, taking into account the effect of a cash flow hedge executed by the Company in March 2004. The notes are redeemable, in whole or in part, at their principal amount plus accrued and unpaid interest to the date of redemption or, if greater, the make-whole redemption price.
5% Senior Notes. On June 20, 2014, AGUS issued $500 million of 5% Senior Notes due 2024 (5% Senior Notes) for net proceeds of $495 million. The net proceeds from the sale of the notes were used for general corporate purposes, including
the purchase of AGL common shares. The notes are redeemable, in whole or in part, at their principal amount plus accrued and unpaid interest to the date of redemption or, if greater, the make-whole redemption price.
Series A Enhanced Junior Subordinated Debentures. On December 20, 2006, AGUS issued $150 million of Debentures due 2066. The Debentures paid a fixed 6.4% rate of interest until December 15, 2016, and thereafter pay a floating rate of interest, reset quarterly, at a rate equal to three month LIBOR plus a margin equal to 2.38%. AGUS may select at 1 or more times to defer payment of interest for 1 or more consecutive periods for up to ten years. Any unpaid interest bears interest at the then applicable rate. AGUS may not defer interest past the maturity date. The debentures are redeemable, in whole or in part, at their principal amount plus accrued and unpaid interest to the date of redemption.
Debt Issued by AGMH
6 7/8% QUIBS. On December 19, 2001, AGMH issued $100 million face amount of 6 7/8% QUIBS due December 15, 2101, which are redeemable without premium or penalty in whole or in part at their principal amount plus accrued and unpaid interest to the date of redemption.
6.25% Notes. On November 26, 2002, AGMH issued $230 million face amount of 6.25% Notes due November 1, 2102, which are redeemable without premium or penalty in whole or in part at their principal amount plus accrued and unpaid interest to the date of redemption.
5.6% Notes. On July 31, 2003, AGMH issued $100 million face amount of 5.6% Notes due July 15, 2103, which are redeemable without premium or penalty in whole or in part at their principal amount plus accrued and unpaid interest to the date of redemption.
Junior Subordinated Debentures. On November 22, 2006, AGMH issued $300 million face amount of Junior Subordinated Debentures with a scheduled maturity date of December 15, 2036 and a final repayment date of December 15, 2066. The final repayment date of December 15, 2066 may be automatically extended up to 4 times in five-year increments provided certain conditions are met. The debentures are redeemable, in whole or in part, at any time prior to December 15, 2036 at their principal amount plus accrued and unpaid interest to the date of redemption or, if greater, the make-whole redemption price. Interest on the debentures will accrue from November 22, 2006 to December 15, 2036 at the annual rate of 6.4%. If any amount of the debentures remains outstanding after December 15, 2036, then the principal amount of the outstanding debentures will bear interest at a floating interest rate equal to one-month LIBOR plus 2.215% until repaid. AGMH may elect at 1 or more times to defer payment of interest on the debentures for 1 or more consecutive interest periods that do not exceed ten years. In connection with the completion of this offering, AGMH entered into a replacement capital covenant for the benefit of persons that buy, hold or sell a specified series of AGMH long-term indebtedness ranking senior to the debentures. Under the covenant, the debentures will not be repaid, redeemed, repurchased or defeased by AGMH or any of its subsidiaries on or before the date that is 20 years prior to the final repayment date, except to the extent that AGMH has received proceeds from the sale of replacement capital securities. The proceeds from this offering were used to pay a dividend to the shareholders of AGMH.
The principal and carrying values of the Company’s debt are presented in the table below.
Principal and Carrying Amounts of Debt
|
| | | | | | | | | | | | | | | |
| | As of December 31, 2019 | | As of December 31, 2018 |
| | Principal |
| Carrying Value |
| Principal |
| Carrying Value |
| | (in millions) |
| AGUS: | |
|
| |
|
| |
|
| |
|
| 7% Senior Notes (1) | $ | 200 |
| | $ | 197 |
|
| $ | 200 |
| | $ | 197 |
|
| 5% Senior Notes (1) | 500 |
| | 497 |
| | 500 |
| | 497 |
|
| Series A Enhanced Junior Subordinated Debentures (2) | 150 |
| | 150 |
|
| 150 |
| | 150 |
|
| AGUS long-term debt | 850 |
| | 844 |
|
| 850 |
| | 844 |
|
| Intercompany loans payable | 290 |
| | 290 |
| | 50 |
| | 50 |
|
| Total AGUS | 1,140 |
| | 1,134 |
| | 900 |
| | 894 |
|
| AGMH (3): | |
| | |
|
| |
| | |
|
67/8% QUIBS (1) | 100 |
| | 70 |
|
| 100 |
| | 70 |
|
| 6.25% Notes (1) | 230 |
| | 144 |
|
| 230 |
| | 143 |
|
| 5.6% Notes (1) | 100 |
| | 58 |
|
| 100 |
| | 57 |
|
| Junior Subordinated Debentures (2) | 300 |
| | 204 |
|
| 300 |
| | 198 |
|
| Total AGMH | 730 |
| | 476 |
|
| 730 |
| | 468 |
|
| AGM (3): | |
| | |
|
| |
| | |
|
| AGM Notes Payable | 4 |
| | 4 |
|
| 5 |
| | 5 |
|
| Total AGM | 4 |
| | 4 |
|
| 5 |
| | 5 |
|
| AGMH's debt purchased by AGUS | (131 | ) | | (89 | ) | | (128 | ) | | (84 | ) |
| Elimination of intercompany loans payable | (290 | ) | | (290 | ) | | (50 | ) | | (50 | ) |
| Total | $ | 1,453 |
| | $ | 1,235 |
|
| $ | 1,457 |
| | $ | 1,233 |
|
____________________
| |
| (1) | AGL fully and unconditionally guarantees these obligations. |
| |
| (2) | Guaranteed by AGL on a junior subordinated basis. |
| |
| (3) | Carrying amounts are different than principal amounts primarily due to fair value adjustments at the date of the AGMH acquisition, which are accreted or amortized into interest expense over the remaining terms of these obligations. |
The following table presents the principal amounts of AGMH's outstanding Junior Subordinated Debentures that AGUS purchased and the loss on extinguishment of debt recognized by the Company. The Company may choose to make additional purchases of this or other Company debt in the future.
AGUS's Purchase
of AGMH's Junior Subordinated Debentures
|
| | | | | | | | | | | |
| | Year Ended December 31, |
| | 2019 | | 2018 | | 2017 |
| | (in millions) |
| Principal amount repurchased | $ | 3 |
| | $ | 100 |
| | $ | 28 |
|
| Loss on extinguishment of debt (1) | 1 |
| | 34 |
| | 9 |
|
____________________
| |
| (1) | Included in other income in the consolidated statements of operations. The loss represents the difference between the amount paid to purchase AGMH's debt and the carrying value of the debt, which includes the unamortized fair value adjustments that were recorded upon the acquisition of AGMH in 2009. |
Principal payments due under the long-term debt are as follows:
Expected Maturity Schedule of Debt
As of December 31, 2019
|
| | | | | | | | | | | | | | | | | | | | |
| | | AGUS | | AGMH (1) | | AGM | | Eliminations (2) | | Total |
| | | (in millions) |
| 2020 | | $ | — |
| | $ | — |
| | $ | 2 |
| | $ | — |
| | $ | 2 |
|
| 2021 | | — |
| | — |
| | — |
| | — |
| | — |
|
| 2022 | | — |
| | — |
| | — |
| | — |
| | — |
|
| 2023 | | 40 |
| | — |
| | — |
| | (40 | ) | | — |
|
| 2024 | | 500 |
| | — |
| | — |
| | — |
| | 500 |
|
| 2025-2044 | | 450 |
| | — |
| | 2 |
| | (250 | ) | | 202 |
|
| 2045-2064 | | — |
| | — |
| | — |
| | — |
| | — |
|
| 2065-2084 | | 150 |
| | 300 |
| | — |
| | (131 | ) | | 319 |
|
| Thereafter | | — |
| | 430 |
| | — |
| | — |
| | 430 |
|
| Total | | $ | 1,140 |
| | $ | 730 |
| | $ | 4 |
| | $ | (421 | ) | | $ | 1,453 |
|
____________________
| |
| (1) | Includes AGMH's debt purchased by AGUS of $131 million. |
| |
| (2) | Includes eliminations of intercompany loans payable and AGMH's debt purchased by AGUS. |
Interest Expense
|
| | | | | | | | | | | |
| | Year Ended December 31, |
| | 2019 | | 2018 | | 2017 |
| | (in millions) |
| AGUS: | |
| | |
| | |
|
| 7% Senior Notes | $ | 13 |
| | $ | 13 |
| | $ | 13 |
|
| 5% Senior Notes | 26 |
| | 26 |
| | 26 |
|
| Series A Enhanced Junior Subordinated Debentures | 7 |
| | 7 |
| | 5 |
|
| AGUS long-term debt | 46 |
| | 46 |
| | 44 |
|
| Intercompany loans payable | 5 |
| | 3 |
| | 3 |
|
| Total AGUS | 51 |
| | 49 |
| | 47 |
|
| AGMH: | |
| | |
| | |
|
67/8% QUIBS | 7 |
| | 7 |
| | 7 |
|
| 6.25% Notes | 16 |
| | 15 |
| | 16 |
|
| 5.6% Notes | 6 |
| | 6 |
| | 6 |
|
| Junior Subordinated Debentures | 25 |
| | 25 |
| | 25 |
|
| Total AGMH | 54 |
| | 53 |
| | 54 |
|
| AGMH's debt purchased by AGUS | (11 | ) |
| (5 | ) |
| (1 | ) |
| Elimination of intercompany loans payable | (5 | ) | | (3 | ) | | (3 | ) |
| Total | $ | 89 |
| | $ | 94 |
| | $ | 97 |
|
Intercompany Credit Facility
On October 25, 2013, AGL, as borrower, and AGUS, as lender, entered into a revolving credit facility pursuant to which AGL may, from time to time, borrow for general corporate purposes. Under the credit facility, AGUS committed to lend a principal amount not exceeding $225 million in the aggregate. In September 2018, AGL and AGUS amended the revolving credit facility to extend the commitment until October 25, 2023 (the loan commitment termination date). The unpaid principal amount of each loan will bear interest at a fixed rate equal to 100% of the then applicable interest rate as determined under Section 1274(d) of the Code, and interest on all loans will be computed for the actual number of days elapsed on the basis of a year consisting of 360 days. Accrued interest on all loans will be paid on the last day of each June and December, beginning on December 31, 2013, and at maturity. AGL must repay the then unpaid principal amounts of the loans by the third anniversary of the loan commitment termination date. NaN amounts are currently outstanding under the credit facility.
Committed Capital Securities
Each of AGC and AGM have entered into put agreements with 4 separate custodial trusts allowing AGC and AGM, respectively, to issue an aggregate of $200 million of non-cumulative redeemable perpetual preferred securities to the trusts in exchange for cash. Each custodial trust was created for the primary purpose of issuing $50 million face amount of CCS, investing the proceeds in high-quality assets and entering into put options with AGC or AGM, as applicable. The Company does not consider itself to be the primary beneficiary of the trusts and the trusts are not consolidated in Assured Guaranty's financial statements.
The trusts provide AGC and AGM access to new equity capital at their respective businesses, certainsole discretion through the exercise of the Company's subsidiaries assert claims in legal proceedings against third partiesput options. Upon AGC's or AGM's exercise of its put option, the relevant trust will liquidate its portfolio of eligible assets and use the proceeds to recover losses paid in prior periodspurchase the AGC or prevent losses inAGM preferred stock, as applicable. AGC or AGM may use the future,proceeds from its sale of preferred stock to the trusts for any purpose, including those described in the "Recovery Litigation," section of Note 5, Expected Loss to be Paid. For example, as described there, in January 2016 the Company commenced an action for declaratory judgment and injunctive relief in the U.S. District Court for the District of Puerto Rico to invalidate executive orders issued by the Governor of Puerto Rico directing the retention or transfer of certain taxes and revenues pledged to secure the payment of claims. The put agreements have no scheduled termination date or maturity. However, each put agreement will terminate if (subject to certain bonds insured bygrace periods) specified events occur. Both AGC and AGM continue to have the Company,ability to exercise their respective put options and cause the related trusts to purchase their preferred stock.
Prior to 2008 or 2007, the amounts paid on the CCS were established through an auction process. All of those auctions failed in July 2016,2008 or 2007, and the Company filedrates paid on the CCS increased to their respective maximums. The annualized rate on the AGC CCS is one-month LIBOR plus 250 bps, and the annualized rate on the AGM CPS is one-month LIBOR plus 200 bps.
See Note 9, Fair Value Measurement, –Other Assets–Committed Capital Securities, for a motion and form of complaint in the U.S. District Court for the District of Puerto Rico seeking relief from the PROMESA stay in order to file a complaint to protect its interest in certain pledged PRHTA toll revenues. As another example, in December 2008, the Company filed a claim in the Supreme Courtdiscussion of the State of New York against an investment manager in a transaction it insured alleging breach of fiduciary duty, gross negligence and breach of contract. The amounts, if any, the Company will recover in these and other proceedings to recover losses are uncertain, and recoveries, or failure to obtain recoveries, in any one or more of these proceedings during any quarter or year could be material to the Company's results of operations in that particular quarter or year.
Accounting Policy
The Company establishes accruals for litigation and regulatory matters to the extent it is probable that a loss has been incurred and the amount of that loss can be reasonably estimated. For litigation and regulatory matters where a loss may be reasonably possible, but not probable, or is probable but not reasonably estimable, no accrual is established, but if the matter is material, it is disclosed, including matters discussed below. The Company reviews relevant information with respect to its litigation and regulatory matters on a quarterly, and annual basis and updates its accruals, disclosures and estimates of reasonably possible loss based on such reviews.
Litigation
Proceedings Relating to the Company’s Financial Guaranty Business
The Company receives subpoenas duces tecum and interrogatories from regulators from time to time.
On November 28, 2011, Lehman Brothers International (Europe) (in administration) (LBIE) sued AGFP, an affiliate of AGC which in the past had provided credit protection to counterparties under CDS. AGC acts as the credit support provider of AGFP under these CDS. LBIE’s complaint, which was filed in the Supreme Courtfair value measurement of the State of New York, alleged that AGFP improperly terminated nine credit derivative transactions between LBIE and AGFP and improperly calculated the termination payment in connection with the termination of 28 other credit derivative transactions between LBIE and AGFP. Following defaults by LBIE, AGFP properly terminated the transactions in question in compliance with the agreement between AGFP and LBIE, and calculated the termination payment properly. AGFP calculated that LBIE owes AGFP approximately $29 million in connection with the termination of the credit derivative transactions, whereas LBIE asserted in the complaint that AGFP owes LBIE a termination payment of approximately $1.4 billion. On February 3, 2012, AGFP filed a motion to dismiss certain of the counts in the complaint, and on March 15, 2013, the court granted AGFP's motion to dismiss the count relating to improper termination of the nine credit derivative transactions and denied AGFP's motion to dismiss the counts relating to the remaining transactions. On February 22, 2016, AGFP filed a motion for summary judgment on the remaining causes of action asserted by LBIE and on AGFP's counterclaims. Oral argument on AGFP's motion took place on July 21, 2016. LBIE's administrators disclosed in an April 10, 2015 report to LBIE’s unsecured creditors that LBIE's valuation expert has calculated LBIE's claim for damages in aggregate for the 28 transactions to range between a minimum of approximately $200 million and a maximum of approximately $500 million, depending on what adjustment, if any, is made for AGFP's credit risk and excluding any applicable interest.CCS.
On September 25, 2013, Wells Fargo Bank, N.A., as trust administrator of the MASTR Adjustable Rate Mortgages Trust 2007-3 (Wells Fargo), filed an interpleader complaint in the U.S. District Court for the Southern District of New York seeking adjudication of a dispute between Wales LLC (Wales) and AGM as to whether AGM is entitled to reimbursement from
certain cashflows for principal claims paid in respect of insured certificates. On September 30, 2016, the court issued an opinion denying a motion for judgment on the pleadings filed by Wales. On January 3, 2017, the Court approved a Stipulation and Order of Dismissal of Wales from the action due to Wales having sold its interests in the MASTR Adjustable Rate Mortgages Trust 2007-3 certificates. On February 9, 2017, the remaining parties submitted a Stipulation and (Proposed) Order of Voluntary Dismissal, which the Court has not yet so-ordered. The Company estimates that an adverse outcome to the interpleader proceeding could increase losses on the transaction by approximately $10 - $20 million, net of expected settlement payments and reinsurance in force.
On December 22, 2014, Deutsche Bank National Trust Company, as indenture trustee for the AAA Trust 2007-2 Re-REMIC (the Trustee), filed a “trust instructional proceeding” petition in the State of California Superior Court (Probate Division, Orange County), seeking the court’s instruction as to how it should allocate the losses resulting from its December 2014 sale of four RMBS owned by the AAA Trust 2007-2 Re-REMIC. This sale of approximately $70 million principal balance of RMBS was made pursuant to AGC’s liquidation direction in November 2014, and resulted in approximately $27 million of gross proceeds to the Re-REMIC. On December 22, 2014, AGC directed the indenture trustee to allocate to the uninsured Class A-3 Notes the losses realized from the sale. On May 4, 2015, the Superior Court rejected AGC’s allocation direction, and ordered the Trustee to allocate to the Class A-3 noteholders a pro rata share of the $27 million of gross proceeds. AGC is appealing the Superior Court’s decision to the California Court of Appeal.
On May 28, 2014, Houston Casualty Company Europe, Seguros y Reseguros, S.A. (HCCE) notified Radian Asset that it was demanding arbitration against Radian Asset in connection with housing cooperative losses presented to Radian Asset by HCCE under several years of quota-share surety reinsurance contracts. Through November 30, 2015, HCCE had presented AGC, as successor to Radian Asset, with approximately €15 million in claims. In January 2016, Assured Guaranty and HCCE settled all the claims related to the Spanish housing cooperative losses.
Proceedings Related to AGMH’s Former Financial Products Business
The following is a description of legal proceedings involving AGMH’s former Financial Products Business. Although the Company did not acquire AGMH’s former Financial Products Business, which included AGMH’s former GIC business, medium term notes business and portions of the leveraged lease businesses, certain legal proceedings relating to those businesses were against entities that the Company did acquire. While Dexia SA and Dexia Crédit Local S.A. (together, Dexia) have paid all expenses and settlement amounts due to date as a result of the proceedings described below, such indemnification might not be sufficient to fully hold the Company harmless against any injunctive relief or civil or criminal sanction that is imposed against AGMH or its subsidiaries as a result of any potential newly asserted claims related to these matters.
Governmental Investigations into Former Financial Products Business
AGMH and/or AGM received subpoenas duces tecum and interrogatories or civil investigative demands from the Attorneys General of the States of Connecticut, Florida, Illinois, Massachusetts, Missouri, New York, Texas and West Virginia relating to their investigations of alleged bid rigging of municipal GICs. In addition, AGMH received a subpoena from the Antitrust Division of the Department of Justice in November 2006 issued in connection with an ongoing criminal investigation of bid rigging of awards of municipal GICs and other municipal derivatives. AGMH responded to such requests when they were received several years ago. While it is possible AGMH may receive additional inquiries from these or other regulators, the Company is not currently aware that any governmental authority, including such Attorneys General or the Department of Justice, are actively pursuing or contemplating legal proceedings with respect to AGMH's former Financial Products Business.
Lawsuits Relating to Former Financial Products Business
From 2008 through 2010, complaints were brought on behalf of a purported class of state, local and municipal government entities alleging federal antitrust violations in the municipal derivatives industry, seeking damages and alleging, among other things, a conspiracy to fix the pricing of, and manipulate bids for, municipal derivatives, including GICs. These actions were consolidated before one judge in the Southern District of New York as Municipal Derivatives Antitrust Litigation (MDL 1950). Following motions to dismiss, amended class action complaints were filed on behalf of a putative class of plaintiffs. The most recently amended, operative class action complaint does not list AGMH or its affiliates as defendants or co-conspirators. On July 8, 2016, the MDL 1950 Court entered an order approving settlement of the remaining class claims, resolving the putative class case.
In addition, the Attorney General of the State of West Virginia filed a lawsuit that, as amended, named AGM and Assured Guaranty U.S. Holdings as defendants and alleged a conspiracy to decrease the returns that West Virginia public entities earned on municipal derivative instruments. Also, approximately 19 California and New York government entities
brought individual lawsuits that were not a part of the class action and that did not dismiss AGMH or its affiliates. All these cases were transferred to the Southern District of New York and consolidated with MDL 1950 for pretrial purposes. In June and July 2016, Dexia executed settlement agreements covering the action brought by the Attorney General of the State of West Virginia and the actions brought by the individual California and New York plaintiffs, and on July 1, 2016 and July 27, 2016, respectively, the MDL 1950 court dismissed with prejudice the claims against Assured Guaranty U.S. Holdings and AGM in all such actions. Those settlements release all claims as to Assured Guaranty U.S. Holdings, AGMH and AGM, as well as their parents, subsidiaries and affiliates.
| |
| 16. | Long-Term DebtEmployee Benefit Plans |
Accounting Policy
Share-based compensation expense is based on the grant date fair value using the grant date closing price, the lattice, Monte Carlo or Black-Scholes-Merton (Black-Scholes) pricing models. The Company amortizes the fair value of share-based awards on a straight-line basis over the requisite service periods of the awards, which are generally the vesting periods, with the exception of retirement‑eligible employees. For retirement-eligible employees, certain awards contain retirement provisions and therefore are amortized over the period through the date the employee first becomes eligible to retire and is no longer required to provide service to earn part or all of the award.
The fair value of each award under the Assured Guaranty Ltd. Employee Stock Purchase Plan is estimated at the beginning of the offering period using the Black-Scholes option valuation model.
The expense for Performance Retention Plan awards is recognized straight-line over the requisite service period, with the exception of retirement eligible employees. For retirement eligible employees, the expense is recognized immediately.
Assured Guaranty Ltd. 2004 Long-Term Incentive Plan
Under the Assured Guaranty Ltd. 2004 Long-Term Incentive Plan, as amended (the Incentive Plan), the number of AGL common shares that may be delivered under the Incentive Plan may not exceed 18,670,000. In the event of certain transactions affecting AGL's common shares, the number or type of shares subject to the Incentive Plan, the number and type of shares subject to outstanding awards under the Incentive Plan, and the exercise price of awards under the Incentive Plan, may be adjusted.
The Incentive Plan authorizes the grant of incentive stock options, non-qualified stock options, stock appreciation rights, and full value awards that are based on AGL's common shares. The grant of full value awards may be in return for a participant's previously performed services, or in return for the participant surrendering other compensation that may be due, or may be contingent on the achievement of performance or other objectives during a specified period, or may be subject to a risk of forfeiture or other restrictions that will lapse upon the achievement of one or more goals relating to completion of service by the participant, or achievement of performance or other objectives. Awards under the Incentive Plan may accelerate and become vested upon a change in control of AGL.
The Incentive Plan is administered by the Compensation Committee of AGL's Board of Directors (the Board), except as otherwise determined by the Board. The Board may amend or terminate the Incentive Plan. As of December 31, 2019, 9,311,090 common shares were available for grant under the Incentive Plan.
Time Vested Stock Options
Stock options are generally granted once a year with exercise prices equal to the closing price on the date of grant. To date, the Company has only issued non-qualified stock options. All stock options, except for performance stock options, granted to employees vest in equal annual installments over a three-year period and expire seven years or ten years from the date of grant. Stock options granted to directors vest over one year and expire in seven years or ten years from grant date. None of the Company's options, except for performance stock options, have a performance or market condition.
Time Vested Stock Options
|
| | | | | | | | | |
| | Options for Common Shares | | Weighted Average Exercise Price | | Number of Exercisable Options |
| Balance as of December 31, 2018 | 373,628 |
| | $ | 18.77 |
| | 373,628 |
|
| Options granted | — |
| | — |
| | |
| Options exercised | (283,277 | ) | | 18.16 |
| | |
| Options forfeited/expired | — |
| | — |
| | |
| Balance as of December 31, 2019 | 90,351 |
| | $ | 20.68 |
| | 90,351 |
|
As of December 31, 2019, the aggregate intrinsic value and weighted average remaining contractual term of stock options outstanding were $2.6 million and 0.7 years, respectively. As of December 31, 2019, the aggregate intrinsic value and weighted average remaining contractual term of exercisable stock options were $2.6 million and 0.7 years, respectively.
NaN options were granted in 2019, 2018 and 2017. As of December 31, 2019, there were 0 unexpensed outstanding non-vested options.
The total intrinsic value of stock options exercised during the years ended December 31, 2019, 2018 and 2017 was $8.2 million, $9.9 million and $6.6 million, respectively. During the years ended December 31, 2019, 2018 and 2017, $2.3 million, $2.4 million and $4.7 million, respectively, was received from the exercise of stock options. In order to satisfy stock option exercises, the Company issues new shares.
Performance Stock Options
The Company grants performance stock options under the Incentive Plan. These awards are non-qualified stock options with exercise prices equal to the closing price of an AGL common share on the applicable date of grant. These awards vest 35%, 50% or 100%, if the price of AGL's common shares using the highest 40-day average share price reaches certain hurdles. If the share price is between the specified levels, the vesting level will be interpolated accordingly. These awards expire seven years from the date of grant.
Performance Stock Options
|
| | | | | | | | | |
| | Options for Common Shares | | Weighted Average Exercise Price | | Number of Exercisable Options |
| Balance as of December 31, 2018 | 27,552 |
| | $ | 19.24 |
| | 27,552 |
|
| Options granted | — |
| | — |
| | |
| Options exercised | (27,552 | ) | | 19.24 |
| | |
| Options forfeited/expired | — |
| | — |
| | |
| Balance as of December 31, 2019 | — |
| | $ | — |
| | — |
|
NaN options were granted in 2019, 2018 and 2017.
The total intrinsic value of performance stock options exercised during the years ended December 31, 2019, 2018 and 2017 was $0.7 million, $3.8 million and $0.7 million, respectively. During the years ended December 31, 2019, 2018 and 2017, $0.5 million, $2.7 million and $0.2 million, respectively, was received from the exercise of performance stock options. In order to satisfy stock option exercises, the Company issues new shares. The tax benefit from time vested and performance stock options exercised during 2019 was $0.9 million.
Restricted Stock Awards
Restricted stock awards are valued based on the closing price of the underlying shares at the date of grant. Restricted stock awards to employees generally vest in equal annual installments over a four-year period and restricted stock awards to outside director's vest in full in one year. Restricted stock awards to employees are amortized on a straight-line basis over the requisite service periods of the awards, and restricted stock awards to outside directors are amortized over one year, which are generally the vesting periods, with the exception of retirement‑eligible employees, discussed above.
Restricted Stock Award Activity
|
| | | | | | | |
| Nonvested Shares | | Number of Shares | | Weighted Average Grant Date Fair Value Per Share |
| Nonvested at December 31, 2018 | 51,746 |
| | $ | 35.56 |
|
| Granted | 48,241 |
| | 45.98 |
|
| Vested | (51,746 | ) | | 35.56 |
|
| Forfeited | — |
| | — |
|
| Nonvested at December 31, 2019 | 48,241 |
| | $ | 45.98 |
|
As of December 31, 2019, the total unrecognized compensation cost related to outstanding nonvested restricted stock awards was $0.7 million, which the Company expects to recognize over the weighted‑average remaining service period of 0.3 years. The total fair value of shares vested during the years ended December 31, 2019, 2018 and 2017 was $1.8 million, $1.9 million and $1.5 million, respectively.
Restricted Stock Units
Restricted stock units are valued based on the closing price of the underlying shares at the date of grant. Restricted stock units awarded to employees have vesting terms similar to those of the restricted stock awards and are delivered on the vesting date. The Company has granted restricted stock units to directors of the Company.
Restricted Stock Unit Activity
|
| | | | | | | |
| Nonvested Stock Units | | Number of Stock Units | | Weighted Average Grant Date Fair Value Per Share |
| Nonvested at December 31, 2018 | 900,276 |
| | $ | 33.83 |
|
| Granted | 464,500 |
| | 44.40 |
|
| Vested | (375,981 | ) | | 28.03 |
|
| Forfeited | (1,528 | ) | | 40.90 |
|
| Nonvested at December 31, 2019 | 987,267 |
| | $ | 41.24 |
|
As of December 31, 2019, the total unrecognized compensation cost related to outstanding nonvested restricted stock units was $25 million, which the Company expects to recognize over the weighted‑average remaining service period of 2.5 years. The total fair value of restricted stock units vested during the years ended December 31, 2019, 2018 and 2017 was $11 million, $8 million and $7 million, respectively.
Performance Restricted Stock Units
The Company has granted performance restricted stock units under the Incentive Plan. These awards vest if AGL's common share price, total shareholder return (TSR) relative to the performance of a peer group and growth in core adjusted book value during the relevant three-year performance period reaches certain hurdles, with a minimum vesting percentage of 0, a target vesting percentage of 100% and a maximum vesting percentage of 200%, 250% and 200%, respectively. If the performance is between the specified levels, the vesting level will be interpolated accordingly. At the end of the performance cycle, participants are entitled to an amount equivalent to the accumulated dividends paid on common stock during the performance cycle for the number of shares earned.
Performance Restricted Stock Unit Activity
|
| | | | | | | |
| Performance Restricted Stock Units | | Number of Performance Share Units | | Weighted Average Grant Date Fair Value Per Share |
| Nonvested at December 31, 2018 | 596,728 |
| | $ | 39.42 |
|
| Granted (1) | 436,690 |
| | 44.00 |
|
| Vested | (489,161 | ) | | 12.66 |
|
| Forfeited | — |
| | — |
|
| Nonvested at December 31, 2019 (2) | 544,257 |
| | $ | 47.23 |
|
____________________
| |
| (1) | Includes 244,581 performance restricted stock units that were granted prior to 2019 at a weighted average grant date fair value of $12.66, but met performance hurdles and Credit Facilitiesvested during 2019. The weighted average grant date fair value per share excludes these shares. |
| |
| (2) | Excludes 263,093 performance restricted stock units that have met performance hurdles and will be eligible for vesting after December 31, 2019. |
As of December 31, 2019, the total unrecognized compensation cost related to outstanding nonvested performance share units was $10 million, which the Company expects to recognize over the weighted‑average remaining service period of 1.8 years. The total value of performance restricted stock units vested during the years ended December 31, 2019, 2018 and 2017 was based on grant date fair value and was $6 million, $6 million and $8 million, respectively.
The Company used a Monte Carlo model to value its performance restricted stock units granted in 2018 and 2017 that contain a performance hurdle based on AGL's common share price.
Monte Carlo Pricing
Weighted Average Assumptions
|
| | | | | | | | |
| | | 2018 | | 2017 |
| Dividend yield | | 1.68 | % | | 1.37 | % |
| Expected volatility | | 27.65 | % | | 25.19 | % |
| Risk free interest rate | | 2.43 | % | | 1.48 | % |
| Weighted average grant date fair value | | $ | 45.64 |
| | $ | 53.74 |
|
The expected dividend yield is based on the current expected annual dividend and share price on the grant date. The expected volatility is estimated at the date of grant based on an average of the 3-year historical share price volatility and implied volatilities of certain at-the-money actively traded call options in the Company. The risk-free interest rate is the implied 3-year yield currently available on U.S. Treasury zero-coupon issues at the date of grant. The expected life is based on the 18-month term of the performance period.
For the 2019 awards, the grant-date fair value of the performance restricted stock units tied to relative TSR was calculated using a Monte Carlo simulation in order to determine the total return of the Company’s shares relative to the total return of approximately 200 financial companies in the Russell 2000 Index. The inputs to the simulation include the beginning prices of shares, historical volatilities, and dividend yields of all relevant companies as well as all possible pairwise correlation coefficients among the relevant companies. In addition, the risk-free return and discount for illiquidity are also included. The grant date fair value of these awards was $46.66 per share.
For the 2019 awards, the grant-date fair value of the core adjusted book value performance restricted stock units was based on the grant date closing price.
Employee Stock Purchase Plan
The Company established the AGL Employee Stock Purchase Plan (Stock Purchase Plan) in accordance with Internal Revenue Code Section 423, and participation is available to all eligible employees. Maximum annual purchases by participants are limited to the number of whole shares that can be purchased by an amount equal to 10% of the participant's compensation or, if less, shares having a value of $25,000. Participants may purchase shares at a purchase price equal to 85% of the lesser of the fair market value of the stock on the first day or the last day of the subscription period. The Company has reserved for issuance and purchases under the Stock Purchase Plan 850,000 Assured Guaranty Ltd. common shares.
The fair value of each award under the Stock Purchase Plan is estimated at the beginning of each offering period using the Black‑Scholes option‑pricing model and the following assumptions: a) the expected dividend yield is based on the current expected annual dividend and share price on the grant date; b) the expected volatility is estimated at the date of grant based on the historical share price volatility, calculated on a daily basis; c) the risk-free rate for periods within the contractual life of the option is based on the U.S. Treasury yield curve in effect at the time of grant; and d) the expected life is based on the term of the offering period.
Stock Purchase Plan
|
| | | | | | | | | | | |
| | Year Ended December 31, |
| | 2019 | | 2018 | | 2017 |
| | (dollars in millions) |
| Proceeds from purchase of shares by employees | $ | 1.5 |
| | $ | 1.2 |
| | $ | 1.0 |
|
| Number of shares issued by the Company | 40,732 |
| | 39,532 |
| | 33,666 |
|
| Recorded in share-based compensation, net of deferral | $ | 0.4 |
| | $ | 0.3 |
| | $ | 0.3 |
|
Share‑Based Compensation Expense
The following table presents stock based compensation costs and the amount of such costs that are deferred as policy acquisition costs, pre-tax. Amortization of previously deferred stock compensation costs is not shown in the table below.
Share‑Based Compensation Expense Summary
|
| | | | | | | | | | | |
| | Year Ended December 31, |
| | 2019 | | 2018 | | 2017 |
| | (in millions) |
| Share‑based compensation expense | $ | 21 |
| | $ | 19 |
| | $ | 16 |
|
| Share‑based compensation capitalized as DAC | 1.1 |
| | 0.8 |
| | 0.6 |
|
| Income tax benefit | 3 |
| | 3 |
| | 2 |
|
Defined Contribution Plan
The Company maintains a savings incentive plan, which is qualified under Section 401(a) of the Internal Revenue Code for U.S. employees. The savings incentive plan is available to eligible full-time employees upon hire. Eligible participants could contribute a percentage of their eligible compensation subject to U.S. Internal Revenue Service (IRS) limitations. Contributions were matched by the Company at a rate of 100% up to 6% of participant's eligible compensation, subject to IRS limitations. Any amounts over the IRS limits are contributed to and matched by the Company into a nonqualified supplemental executive retirement plan for employees eligible to participate in such nonqualified plan. The Company also made a core contribution of 6% of the participant's eligible compensation to the qualified plan, subject to IRS limitations, and the nonqualified supplemental executive retirement plan for eligible employees, regardless of whether the employee contributes to the plan(s). Employees become fully vested in Company contributions after one year of service, as defined in the plan. Plan eligibility is immediate upon hire. The Company also maintains similar non-qualified plans for non-U.S. employees.
The Company recognized defined contribution expenses of $12 million, $12 million and $11 million for the years ended December 31, 2019, 2018 and 2017, respectively.
Accounting Policy
The provision for income taxes consists of an amount for taxes currently payable and an amount for deferred taxes. Deferred income taxes are provided for temporary differences between the financial statement carrying amounts and tax bases of assets and liabilities, using enacted rates in effect for the year in which the differences are expected to reverse. A valuation allowance is recorded to reduce the deferred tax asset to an amount that is more likely than not to be realized.
Non-interest-bearing tax and loss bonds are purchased in the amount of the tax benefit that results from deducting statutory-basis contingency reserves as provided under Internal Revenue Code Section 832(e). The Company records the purchase of tax and loss bonds in deferred taxes.
The Company recognizes tax benefits only if a tax position is “more likely than not” to prevail.
The Company elected to account for tax associated with Global Intangible Low-Taxed Income (GILTI) as a current-period expense when incurred.
Overview
AGL and its Bermuda subsidiaries, AG Re, AGRO, and Cedar Personnel Ltd. (Bermuda Subsidiaries), are not subject to any income, withholding or capital gains taxes under current Bermuda law. The Company has received an assurance from the Minister of Finance in Bermuda that, in the event of any taxes being imposed, AGL and its Bermuda Subsidiaries will be exempt from taxation in Bermuda until March 31, 2035. AGL's U.S. and U.K. subsidiaries are subject to income taxes imposed by U.S. and U.K. authorities, respectively, and file applicable tax returns. In addition, AGRO, a Bermuda domiciled company, has elected under Section 953(d) of the U.S. Internal Revenue Code (the Code) to be taxed as a U.S. domestic corporation.
In November 2013, AGL became tax resident in the U.K. although it remains a Bermuda-based company and it's administrative and head office functions continue to be carried on in Bermuda. As a U.K. tax resident company, AGL is required to file a corporation tax return with Her Majesty’s Revenue & Customs. AGL is subject to U.K. corporation tax in respect of its worldwide profits (both income and capital gains), subject to any applicable exemptions. The corporation tax rate was 19% for 2019. Assured Guaranty expects that the dividends AGL receives from its direct subsidiaries will be exempt from U.K. corporation tax due to the exemption in section 931D of the U.K. Corporation Tax Act 2009. In addition, any dividends paid by AGL to its shareholders should not be subject to any withholding tax in the U.K. Assured Guaranty does not expect any profits of non-U.K. resident members of the group to be taxed under the U.K. "controlled foreign companies" regime and has obtained a clearance from Her Majesty’s Revenue & Customs confirming this on the basis of current facts.
AGUS files a consolidated federal income tax return with all of its U.S. subsidiaries. AGE UK, the Company’s U.K. subsidiary, had previously elected under U.S. Internal Revenue Code Section 953(d) to be taxed as a U.S. company. In January 2017, AGE UK filed a request with the IRS to revoke the election, which was approved in May 2017. As a result of the revocation of the Section 953(d) election, AGE UK is no longer liable to pay future U.S. taxes beginning in 2017.
On January 10, 2017, AGC purchased MBIA UK, a U.K. based insurance company. After the purchase, MBIA UK changed its name to AGLN and files its tax returns in the U.K. as a separate entity for the period prior to its merger with AGE UK. For additional information on the MBIA UK Acquisition, see Note 2, Business Combinations and Assumption of Insured Portfolio.
Assured Guaranty Overseas US Holdings Inc. and its subsidiaries AGRO and AG Intermediary Inc. file their own consolidated federal income tax return.
As a result of the BlueMountain Acquisition referred to in Note 2, the entities acquired will be included in the AGUS consolidated federal income tax return.
Tax Assets (Liabilities)
Deferred and Current Tax Assets (Liabilities) (1)
|
| | | | | | | |
| | As of
December 31, 2019 | | As of
December 31, 2018 |
| | (in millions) |
| Deferred tax assets (liabilities) | $ | (17 | ) | | $ | 68 |
|
| Current tax assets (liabilities) | 47 |
| | 22 |
|
____________________
| |
| (1) | Included in other assets or other liabilities on the consolidated balance sheets. |
Components of Net Deferred Tax Assets
|
| | | | | | | |
| | As of December 31, |
| | 2019 | | 2018 |
| | (in millions) |
| Deferred tax assets: | | | |
| Unearned premium reserves, net | $ | 76 |
| | $ | 98 |
|
| Investment basis differences | 48 |
| | 49 |
|
| Foreign tax credit | 36 |
| | 36 |
|
| Net operating loss | 32 |
| | 34 |
|
| Deferred compensation | 26 |
| | 25 |
|
| Alternative minimum tax credit | 12 |
| | 20 |
|
| Other | 24 |
| | 35 |
|
| Total deferred income tax assets | 254 |
| | 297 |
|
| Deferred tax liabilities: | | | |
| Unrealized appreciation on investments | 86 |
| | 54 |
|
| Public debt | 44 |
| | 50 |
|
| Market discount | 11 |
| | 31 |
|
| DAC | 33 |
| | 23 |
|
| Unrealized gains on CCS | 11 |
| | 16 |
|
| Loss and LAE reserve | 29 |
| | 7 |
|
| Other | 21 |
| | 12 |
|
| Total deferred income tax liabilities | 235 |
| | 193 |
|
| Less: Valuation allowance | 36 |
| | 36 |
|
| Net deferred income tax asset (liabilities) | $ | (17 | ) | | $ | 68 |
|
As of December 31, 2019, the Company had alternative minimum tax credits of $12 million which, pursuant to the 2017 Tax Cuts and Jobs Act (Tax Act), are available as a credit to offset regular tax liability over the next two years with any excess refundable by 2021.
As part of the acquisition of CIFG Holding Inc. (CIFGH, and together with its subsidiaries, CIFG), the Company acquired $189 million of net operating losses (NOL) which will begin to expire in 2033. The NOL has been limited under Internal Revenue Code Section 382 due to a change in control as a result of the acquisition. As of December 31, 2019, the Company had $151 million of NOLs available to offset its future U.S. taxable income.
Valuation Allowance
The Company has $13 million of foreign tax credits (FTC) carryovers from previous acquisitions and $23 million of FTC due to the Tax Act for use against regular tax in future years. FTCs will begin to expire in 2020 and will fully expire by 2027. In analyzing the future realizability of FTCs, the Company notes limitations on future foreign source income due to overall foreign losses as negative evidence. After reviewing positive and negative evidence, the Company came to the conclusion that it is more likely than not that the FTC of $36 million will not be utilized, and therefore recorded a valuation allowance with respect to this tax attribute.
The Company came to the conclusion that it is more likely than not that the remaining deferred tax assets will be fully realized after weighing all positive and negative evidence available as required under GAAP. The positive evidence that was considered included the cumulative income the Company has earned over the last three years, and the significant unearned premium income to be included in taxable income. The positive evidence outweighs any negative evidence that exists. As such, the Company believes that no valuation allowance is necessary in connection with the remaining deferred tax assets. The Company will continue to analyze the need for a valuation allowance on a quarterly basis.
Provision for Income Taxes
The effective tax rates reflect the proportion of income recognized by each of the Company’s operating subsidiaries, with U.S. subsidiaries taxed at the U.S. marginal corporate income tax rate of 21% in 2019 and 2018 and 35% in 2017, U.K. subsidiaries taxed at the U.K. marginal corporate tax rate of 19%, and no taxes for the Company’s Bermuda Subsidiaries unless subject to U.S. tax by election. In 2018, due to the Tax Act, controlled foreign corporations (CFCs) apply the local marginal corporate tax rate. In addition, the Tax Act creates a new requirement that a portion of the GILTI earned by CFCs must be included currently in the gross income of the CFCs' U.S. shareholder. For the periods between April 1, 2015 and March 31, 2017, the U.K. corporation tax rate was 20%. The Company’s overall effective tax rate fluctuates based on the distribution of income across jurisdictions.
A reconciliation of the difference between the provision for income taxes and the expected tax provision at statutory rates in taxable jurisdictions is presented below.
Effective Tax Rate Reconciliation
|
| | | | | | | | | | | |
| | Year Ended December 31, |
| | 2019 | | 2018 | | 2017 |
| | (in millions) |
| Expected tax provision (benefit) | $ | 91 |
| | $ | 97 |
| | $ | 300 |
|
| Tax-exempt interest | (19 | ) | | (23 | ) | | (49 | ) |
| Bargain purchase gain | — |
| | — |
| | (20 | ) |
| Change in liability for uncertain tax positions | 1 |
| | (15 | ) | | (26 | ) |
| Effect of provision to tax return filing adjustments | (6 | ) | | (1 | ) | | (8 | ) |
| State tax | 1 |
| | 6 |
| | 9 |
|
| Taxes on reinsurance | (5 | ) | | 6 |
| | (4 | ) |
| Effect of adjustments to the provisional amounts as a result of 2017 Tax Cuts and Jobs Act | — |
| | (4 | ) | | 61 |
|
| Foreign taxes | 6 |
| | — |
| | 4 |
|
| Other | (6 | ) | | (7 | ) | | (6 | ) |
| Total provision (benefit) for income taxes | $ | 63 |
| | $ | 59 |
| | $ | 261 |
|
| Effective tax rate | 13.7 | % | | 10.2 | % | | 26.3 | % |
The expected tax provision (benefit) is calculated as the sum of pretax income in each jurisdiction multiplied by the statutory tax rate of the jurisdiction by which it will be taxed. Where there is a pretax loss in one jurisdiction and pretax income in another, the total combined expected tax rate may be higher or lower than any of the individual statutory rates.
The following tables present pretax income and revenue by jurisdiction.
Pretax Income (Loss) by Tax Jurisdiction
|
| | | | | | | | | | | |
| | Year Ended December 31, |
| | 2019 | | 2018 | | 2017 |
| | (in millions) |
| U.S. | $ | 440 |
| | $ | 461 |
| | $ | 873 |
|
| Bermuda | 33 |
| | 121 |
| | 145 |
|
| U.K. and other | (9 | ) | | (2 | ) | | (27 | ) |
| Total | $ | 464 |
| | $ | 580 |
| | $ | 991 |
|
Revenue by Tax Jurisdiction
|
| | | | | | | | | | | |
| | Year Ended December 31, |
| | 2019 | | 2018 | | 2017 |
| | (in millions) |
| U.S. | $ | 779 |
| | $ | 801 |
| | $ | 1,543 |
|
| Bermuda | 146 |
| | 177 |
| | 216 |
|
| U.K. and other | 38 |
| | 23 |
| | (20 | ) |
| Total | $ | 963 |
| | $ | 1,001 |
| | $ | 1,739 |
|
Pretax income by jurisdiction may be disproportionate to revenue by jurisdiction to the extent that insurance losses incurred are disproportionate.
Effect of the 2017 Tax Cuts and Jobs Act
On December 22, 2017, the Tax Act was signed into law. The Tax Act changed many items of U.S. corporate income taxation, including a reduction of the corporate income tax rate from 35% to 21%, implementation of a territorial tax system and imposition of a tax on deemed repatriated earnings of non-U.S. subsidiaries. At December 31, 2017, the Company had not completed accounting for the tax effects of the Tax Act; however, the Company made a reasonable estimate of the effects on the existing deferred tax balances and the one-time transition tax. The Company recognized a provisional income tax expense of $61 million, which was included as a component of income tax expense from continuing operations in 2017. During 2018, the Company recorded an adjustment to the provisional amount with a $4 million tax benefit as a component of income tax expense from continuing operations. As of December 31, 2018, the accounting for the income tax effects of the Tax Act have been completed and the total net impact resulting from the Tax Act is an expense of $57 million.
The Tax Act includes provisions for GILTI wherein taxes are imposed on foreign income in excess of a deemed return on tangible assets of foreign corporations. The Tax Act also includes a Base Erosion Anti-abuse Tax provision, which taxes certain payments from a U.S. corporation to its foreign subsidiaries.
Deferred Tax Assets and Liabilities
The Company remeasured certain deferred tax assets and liabilities based on the rates at which they are expected to reverse in the future, which is generally 21%. The provisional amount recorded related to the remeasurement of the deferred tax balance was an income tax expense of $37 million. As a result of adjustments identified from filing the 2017 tax return, the total remeasurement of the deferred tax balance resulting from the Tax Act is an income tax expense of $34 million.
Foreign Tax Effects
The one-time transition tax is based on total post-1986 earnings and profits for which the Company had previously deferred U.S. income taxes. The Company recorded a provisional amount for its one-time transition tax liability on non-U.S. subsidiaries less realizable FTCs and a write off of deferred tax liabilities on unremitted earnings, resulting in an increase in income tax expense of $24 million. As a result of adjustments identified from filing the 2017 tax return, the total impact to the transition tax resulting from the Tax Act is an income tax expense of $23 million.
The table below summarizes the impact of the Tax Act on the consolidated statements of operations.
Summary of the Tax Act Effect
(Benefit) Provision
|
| | | | | | | |
| | Year Ended December 31, |
| | 2018 | | 2017 |
| | (in millions) |
| Transition tax | $ | (1 | ) | | $ | 93 |
|
| Foreign tax credit realized | — |
| | (31 | ) |
| Write down of unremitted earnings | — |
| | (38 | ) |
| Net impact of repatriation | (1 | ) | | 24 |
|
| Write down of deferred tax asset due to tax rate change | (3 | ) | | 37 |
|
| Net impact of Tax Act | $ | (4 | ) | | $ | 61 |
|
Uncertain Tax Positions
The following table provides a reconciliation of the beginning and ending balances of the total liability for unrecognized tax positions.
|
| | | | | | | | | | | |
| | 2019 | | 2018 | | 2017 |
| | (in millions) |
| Beginning of year | $ | 14 |
| | $ | 28 |
| | $ | 50 |
|
| Effect of provision to tax return filing adjustments | 5 |
| | 1 |
| | 8 |
|
| Increase in unrecognized tax positions as a result of position taken during the current period | — |
| | — |
| | 1 |
|
| Decrease in unrecognized tax positions as a result of settlement of positions taken during the prior period | — |
| | — |
| | (31 | ) |
| Reductions to unrecognized tax benefits as a result of the applicable statute of limitations | (4 | ) | | (15 | ) | | — |
|
| Balance as of December 31, | $ | 15 |
| | $ | 14 |
| | $ | 28 |
|
The Company's policy is to recognize interest related to uncertain tax positions in income tax expense and has accrued $1 million for full years 2019, 2018 and 2017. As of both December 31, 2019 and December 31, 2018, the Company has accrued $2 million of interest.
The total amount of reserves for unrecognized tax positions, including accrued interest, as of December 31, 2019 and December 31, 2018 that would affect the effective tax rate, if recognized, was $17 million and $16 million, respectively.
Audits
As of December 31, 2019, AGUS had open tax years with the U.S. IRS for 2016 to present and is currently under audit for the 2016 tax year. It is expected that the audit will close in 2020 and, depending on the final outcome, reserves for uncertain tax positions may be released. In December 2016, the IRS issued a Revenue Agent Report for the 2009 - 2012 audit period, which did not identify any material adjustments that were not already accounted for in prior periods. In April 2017, the Company received a final letter from the IRS to close the audit with no additional findings or changes, and as a result the Company released previously recorded uncertain tax position reserves and accrued interest of approximately $37 million in the second quarter of 2017. The 2013 and 2014 tax years closed in 2018. The 2015 tax year closed in 2019. Assured Guaranty Overseas US Holdings Inc. has open tax years of 2016 forward but is not currently under audit with the IRS. The Company's U.K. subsidiaries are not currently under examination and have open tax years of 2017 forward. CIFGNA, which was acquired by AGC during 2016, is not currently under examination and has open tax years of 2016 to the date of acquisition.
| |
| 18. | Insurance Company Regulatory Requirements |
The following table summarizes the equity and income amounts reported to local regulatory bodies in the U.S. and Bermuda for insurance subsidiaries within the group. The discussion that follows describes the basis of accounting and differences to GAAP.
Insurance Regulatory Amounts Reported
U.S. and Bermuda
|
| | | | | | | | | | | | | | | | | | | |
| | Policyholders' Surplus | | Net Income (Loss) |
| | As of December 31, | | Year Ended December 31, |
| | 2019 | | 2018 | | 2019 | | 2018 | | 2017 |
| | (in millions) |
| U.S. statutory companies: | | | | | | | | | |
| AGM (1) (2) | $ | 2,691 |
| | $ | 2,533 |
| | $ | 312 |
| | $ | 172 |
| | $ | 152 |
|
| AGC (1) (2) | 1,775 |
| | 1,793 |
| | 226 |
| | (5 | ) | | 219 |
|
| MAC (2) | 276 |
| | 321 |
| | 53 |
| | 55 |
| | 32 |
|
| Bermuda statutory companies: | | | | | | | | | |
| AG Re | 1,098 |
| | 1,249 |
| | 45 |
| | 131 |
| | 155 |
|
| AGRO | 410 |
| | 383 |
| | 12 |
| | 10 |
| | 10 |
|
____________________
| |
| (1) | Policyholders' surplus of AGM and AGC includes their indirect share of MAC. AGM and AGC own 60.7% and 39.3%, respectively, of the outstanding stock of Municipal Assurance Holdings Inc. (MAC Holdings), which owns 100% of the outstanding common stock of MAC. |
| |
| (2) | As of December 31, 2019, policyholders' surplus is net of contingency reserves of $869 million, $546 million and $192 million for AGM, AGC and MAC, respectively. As of December 31, 2018, policyholders' surplus is net of contingency reserves of $913 million, $550 million and $200 million for AGM, AGC and MAC, respectively. |
Basis of Regulatory Financial Reporting
United States
Each of the Company's U.S. domiciled insurance companies' ability to pay dividends depends, among other things, upon its financial condition, results of operations, cash requirements, compliance with rating agency requirements, and is also subject to restrictions contained in the insurance laws and related regulations of its state of domicile and other states. Financial statements prepared in accordance with accounting practices prescribed or permitted by local insurance regulatory authorities differ in certain respects from GAAP.
The Company's U.S. domiciled insurance companies prepare statutory financial statements in accordance with accounting practices prescribed or permitted by the National Association of Insurance Commissioners and their respective insurance departments. Prescribed statutory accounting practices are set forth in the National Association of Insurance Commissioners Accounting Practices and Procedures Manual. The Company has no permitted accounting practices on a statutory basis.
GAAP differs in certain significant respects from U.S. insurance companies' statutory accounting practices prescribed or permitted by insurance regulatory authorities. The principal differences result from the statutory accounting practices listed below.
Upfront premiums are earned upon expiration of risk rather than earned over the expected period of coverage. Premium earnings are accelerated when transactions are economically defeased, rather than legally defeased.
Acquisition costs are charged to expense as incurred rather than over the period that related premiums are earned.
A contingency reserve is computed based on statutory requirements, whereas no such reserve is required under GAAP.
Certain assets designated as “non-admitted assets” are charged directly to statutory surplus, rather than reflected as assets under GAAP.
Investments in subsidiaries are carried on the balance sheet on the equity basis, to the extent admissible, rather than consolidated with the parent.
Admitted deferred tax assets are subject to an adjusted surplus threshold and subject to a limitation calculated in accordance with SAP. Under GAAP there is no non-admitted asset determination, rather a valuation allowance is recorded to reduce the deferred tax asset to an amount that is more likely than not to be realized.
Insured credit derivatives are accounted for as insurance contracts rather than as derivative contracts measured at fair value.
Bonds are generally carried at amortized cost rather than fair value.
Insured obligations of VIEs and refinancing vehicles’ debt, where the Company is deemed the primary beneficiary, are accounted for as insurance contracts. Under GAAP, such VIEs and refinancing vehicles are consolidated and any transactions with the Company are eliminated.
Surplus notes are recognized as surplus and each payment of principal and interest is recorded only upon approval of the insurance regulator rather than as liabilities with periodic accrual of interest.
Acquisitions are accounted for as either statutory purchases or statutory mergers, rather than under the purchase method under GAAP.
Losses are discounted at tax equivalent yields, and recorded when the loss is deemed probable and without consideration of the deferred premium revenue. Under GAAP, expected losses are discounted at the risk free rate at the end of each reporting period and are recorded only to the extent they exceed deferred premium revenue.
The present value of installment premiums and commissions are not recorded on the balance sheet as they are under GAAP.
Bermuda
AG Re, a Bermuda regulated Class 3B insurer, and AGRO, a Bermuda regulated Class 3A and Class C insurer,
prepare their statutory financial statements in conformity with the accounting principles set forth in the Insurance Act 1978, amendments thereto and related regulations. As of December 31, 2016, the Bermuda Monetary Authority (the Authority) requires insurers to prepare statutory financial statements in accordance with the particular accounting principles adopted by the insurer (which, in the case of AG Re and AGRO, are U.S. GAAP), subject to certain adjustments. The principal difference relates to certain assets designated as “non-admitted assets” which are charged directly to statutory surplus rather than reflected as assets as they are under U.S. GAAP.
United Kingdom
AGE UK prepares its Solvency and Financial Condition Report and other required regulatory financial report based on Prudential Regulation Authority and Solvency II Regulations (Solvency II). AGE UK adopted the full framework required by Solvency II on January 1, 2016, which is the date they became effective. As of December 31, 2019 and December 31, 2018, AGE UK's Own Funds were £684 million and £693 million, respectively.
Dividend Restrictions and Capital Requirements
United States
Under New York insurance law, AGM and MAC may only pay dividends out of "earned surplus," which is the portion of the company's surplus that represents the net earnings, gains or profits (after deduction of all losses) that have not been distributed to shareholders as dividends, transferred to stated capital or capital surplus, or applied to other purposes permitted by law, but does not include unrealized appreciation of assets. AGM and MAC may each pay dividends without the prior approval of the New York Superintendent of Financial Services (New York Superintendent) that, together with all dividends declared or distributed by it during the preceding 12 months, do not exceed the lesser of 10% of its policyholders' surplus (as of
its last annual or quarterly statement filed with the New York Superintendent) or 100% of its adjusted net investment income during that period.
The maximum amount available during 2020 for AGM to distribute to AGMH as dividends without regulatory approval is estimated to be approximately $218 million. Of such $218 million, $72 million is estimated to be available for distribution in the first quarter of 2020.
In March 2019, MAC received approval from the New York State Department of Financial Services to dividend to MAC Holdings, which is owned by AGM and AGC, $100 million in 2019, an amount that exceeded the dividend capacity that was available for distribution without regulatory approval. MAC distributed a $100 million dividend to MAC Holdings in the second quarter of 2019. The maximum amount available during 2020 for MAC to distribute to MAC Holdings as dividends without regulatory approval is estimated to be approximately $21 million, NaN of which is available for distribution in the first quarter of 2020.
Under Maryland's insurance law, AGC may, with prior notice to the Maryland Insurance Commissioner, pay an ordinary dividend that, together with all dividends paid in the prior 12 months, does not exceed the lesser of 10% of its policyholders' surplus (as of the prior December 31) or 100% of its adjusted net investment income during that period. The maximum amount available during 2020 for AGC to distribute as ordinary dividends is approximately $166 million. Of such $166 million, approximately $85 million is available for distribution in the first quarter of 2020.
Bermuda
For AG Re, any distribution (including repurchase of shares) of any share capital, contributed surplus or other statutory capital that would reduce its total statutory capital by 15% or more of its total statutory capital as set out in its previous year's financial statements requires the prior approval of the Authority. Separately, dividends are paid out of an insurer's statutory surplus and cannot exceed that surplus. Furthermore, annual dividends cannot exceed 25% of total statutory capital and surplus as set out in its previous year's financial statements, which is $274 million, without AG Re certifying to the Authority that it will continue to meet required margins.Based on the foregoing limitations, in 2020 AG Re has the capacity to (i) make capital distributions in an aggregate amount up to $128 million without the prior approval of the Authority and (ii) declare and pay dividends in an aggregate amount up to approximately $274 million as of December 31, 2019. Such dividend capacity is further limited by (i) the actual amount of AG Re’s unencumbered assets, which amount changes from time to time due in part to collateral posting requirements and which was approximately $264 million as of December 31, 2019, and (ii) the amount of statutory surplus, which as of December 31, 2019 was $240 million.
For AGRO, annual dividends cannot exceed $103 million, without AGRO certifying to the Authority that it will continue to meet required margins. Based on the foregoing limitations, in 2020 AGRO has the capacity to (i) make capital distributions in an aggregate amount up to $21 million without the prior approval of the Authority and (ii) declare and pay dividends in an aggregate amount up to approximately $103 million as of December 31, 2019. Such dividend capacity is further limited by (i) the actual amount of AGRO’s unencumbered assets, which amount changes from time to time due in part to collateral posting requirements and which was approximately $383 million as of December 31, 2019, and (ii) the amount of statutory surplus, which as of December 31, 2019 was $273 million.
United Kingdom
U.K. company law prohibits AGE UK from declaring a dividend to its shareholders unless it has “profits available for distribution.” The determination of whether a company has profits available for distribution is based on its accumulated realized profits less its accumulated realized losses. While the U.K. insurance regulatory laws impose no statutory restrictions on a general insurer's ability to declare a dividend, the Prudential Regulation Authority's capital requirements may in practice act as a restriction on dividends.
Dividend Restrictions and Capital Requirements
Distributions by
Insurance Subsidiaries
|
| | | | | | | | | | | |
| | Year Ended December 31, |
| | 2019 | | 2018 | | 2017 |
| | (in millions) |
| Dividends paid by AGC to AGUS | $ | 123 |
| | $ | 133 |
| | $ | 107 |
|
| Dividends paid by AGM to AGMH | 220 |
| | 171 |
| | 196 |
|
| Dividends paid by AG Re to AGL | 275 |
| | 125 |
| | 125 |
|
| Dividends paid by MAC to MAC Holdings (1) | 105 |
| | 27 |
| | 36 |
|
| Repurchase of common stock by AGM from AGMH | — |
| | — |
| | 101 |
|
| Repurchase of common stock by AGC from AGUS | 100 |
| | 200 |
| | — |
|
| Redemption of common stock by MAC from MAC Holdings (1) | — |
| | — |
| | 250 |
|
____________________
| |
| (1) | MAC Holdings distributed nearly the entire amounts to AGM and AGC, in proportion to their ownership percentages. |
| |
| 19. | Related Party Transactions |
From time to time, certain officers, directors, employees, their family members and related charitable foundations may make investments in various private funds, vehicles or accounts managed by the Company. These investments are available to those of the Company's employees whom the Company has determined to have a status that reasonably permits the Company to offer them these types of investments in compliance with applicable laws. Generally, these investments are not subject to the management fees and performance allocations or incentive fees charged to other investors. As of December 31, 2019, all noncontrolling interests in the consolidated balance sheets represent employees' ownership interests in consolidated Assured Investment Management funds. Andrew Feldstein, the Company’s Chief Investment Officer and Head of Asset Management, is among the Company’s employees who invest in various private funds, vehicles or accounts managed by the Company. See also Note 12, Asset Management Fees, for additional information.
NaN of the Company's investment portfolio managers, Wellington Management Company, LLP (Wellington) and BlackRock Financial Management, Inc. (BlackRock), each own more than 5% of the Company's common shares. In addition, the Company has a minority interest in Wasmer, Schroeder & Company LLC, which is also one of the Company's investment portfolio managers. The investment management expense from transactions with these related parties was approximately $3.8 million in 2019, $4.0 million in 2018 and $4.1 million in 2017. In addition, the Company recognized $1.0 million and $1.2 million in 2019 and 2018, respectively, in income from its investment in Wasmer, Schroeder & Company LLC, which is included in "equity in net earnings of investees" in the consolidated statements of operations. Accrued expenses from transactions with these related parties were $2 million as of both December 31, 2019 and December 31, 2018.
The Charles Schwab Corporation announced on February 24, 2020 that it had entered into an agreement to acquire Wasmer, Schroeder & Company, LLC, and that, subject to customary closing conditions, it expects to close the transaction in mid-2020.
| |
| 20. | Commitments and Contingencies |
Leases
The Company is party to various non-cancelable lease agreements, these leases include both operating and finance leases. The largest lease relates to approximately 103,500 square feet of office space in New York City, and expires in 2032. Subject to certain conditions, the Company has an option to renew this lease for an additional five years at a fair market rent. The Company also leases another 78,400 square feet of office space at a second location in New York City, and that lease expires in 2024. Additionally, the Company leases additional office space in several other locations, an apartment, and certain equipment. These leases expire at various dates through 2029.
Accounting Policy
Long-term debt is recorded at principal amounts netEffective January 1, 2019, the Company adopted Topic 842, which required the establishment of any unamortized original issue discount or premiuma right-of-use (ROU) asset and unamortized fair value adjustmenta lease liability on the balance sheet for AGMH debt (asoperating and finance leases. An ROU asset represents the Company's right to use an underlying asset for the lease term, and a lease liability represents the Company's obligation to make lease payments arising from the lease. Upon adoption, all of the dateCompany’s leases were classified as operating leases; however, the Company made an accounting policy election not to apply the recognition requirements of Topic 842 to short-term leases with an initial term of 12 months or less. At the inception of a lease, the total payments under a lease agreement were discounted utilizing an incremental borrowing rate that represents the Company’s collateralized borrowing rate. Upon adoption, the incremental borrowing rate for each lease was determined based on the remaining lease term as of January 1, 2019. The Company does not include renewal options in calculating the lease liability.
The Company elected the package of practical expedients, which permitted organizations not to reassess (i) whether any expired or existing contracts are or contain leases, (ii) the lease classification of expired or existing leases, and (iii) the initial direct costs for existing leases. The Company also elected the practical expedient to account for all lease components and their associated non-lease components (i.e., common area maintenance, real estate taxes, building insurance, etc.) as a single lease component and include all fixed payments in the measurement of ROU assets and lease liabilities.
Upon adoption, the Company recognized lease liabilities of approximately $95 million (recorded in other liabilities), ROU assets of approximately $69 million (recorded in other assets), and derecognized existing deferred rent and lease incentive liabilities of approximately $26 million, which resulted in no cumulative-effect adjustment to retained earnings.
Operating lease expense is recognized on a straight-line basis over the lease term and finance lease expense is comprised of the AGMH acquisition). Discountsstraight-line amortization of the lease asset and acquisition date fair value adjustments are accreted intothe accretion of interest expense overunder the life ofeffective interest method. Costs related to variable lease and non-lease components for the applicable debt.Company’s leases are expensed in the period incurred. The Company also subleases office space that is not used for its operations.
Lease Assets and Liabilities
|
| | | | | | | | | | | | | |
| | | As of December 31, 2019 |
| | | Assets(1) | | Liabilities(2) | | Weighted Average Remaining Lease Term (in years) | | Weighted Average Discount Rate |
| | | (in millions) | | | | |
| Operating leases | | $ | 100 |
| | $ | 130 |
| | 9.4 | | 2.61 | % |
| Finance leases | | 2 |
| | 2 |
| | 1.8 | | 1.74 | % |
| Total | | $ | 102 |
| | $ | 132 |
| | | | |
____________________
| |
| (1) | Recorded in other assets in the consolidated balance sheets. Finance lease assets are recorded net of accumulated amortization of $0.1 million as of December 31, 2019. |
| |
| (2) | Recorded in other liabilities in the consolidated balance sheets. |
Components of Lease Expense and Other Information
|
| | | | |
| | | Year Ended December 31, |
| | | 2019 |
| | | (in millions) |
| Operating lease cost | | $ | 10 |
|
| Variable lease cost | | 2 |
|
| Total lease cost (1) | | $ | 12 |
|
| Cash paid for amounts included in the measurement of lease liabilities (2) | | |
| Operating cash flows from operating leases | | $ | 11 |
|
| ROU assets obtained in exchange for new operating lease liabilities (3) | | 37 |
|
| ROU assets obtained in exchange for new finance lease liabilities (3) | | 2 |
|
____________________
| |
| (1) | Short-term lease costs, finance lease costs and sublease income are de minimis. Includes amortization on finance lease ROU assets and interest on finance lease liabilities. |
| |
| (2) | Operating and financing cash flows from finance leases are de minimis. |
| |
| (3) | Relates primarily to BlueMountain Acquisition. See Note 2, Business Combinations and Assumption of Insured Portfolio, for additional information. |
Rent expense was $9 million in 2018 and $9 million in 2017.
Committed Capital Securities
The fair value of CCS, which is recorded in other assets on the consolidated balance sheets, represents the difference between the present value of remaining expected put option premium payments under AGC’s CCS and AGM’s Committed Preferred Trust Securities (the AGM CPS) agreements, and the estimated present value that the Company would hypothetically have to pay currently for a comparable security (see Note 15, Long Term Debt and Credit Facilities). The change in fair value of the AGC CCS and AGM CPS are recorded in other income in the consolidated statement of operations. Fair value changes on CCS recorded in other income were losses of $22 million and $2 million in 2019 and 2017, respectively, and gains of $14 million in 2018. The estimated current cost of the Company’s CCS is based on several factors, including AGM and AGC CDS spreads, LIBOR curve projections, the Company's publicly traded debt and the term the securities are estimated to remain outstanding. The AGC CCS and AGM CPS are classified as Level 3 in the fair value hierarchy.
Supplemental Executive Retirement Plans
The Company classifies the fair value measurement of the assets of the Company's various supplemental executive retirement plans as either Level 1 or Level 2. The fair value of these assets is valued based on the observable published daily values of the underlying mutual fund included in the plans (Level 1) or based upon the net asset value (NAV) of the funds if a published daily value is not available (Level 2). The NAVs are based on observable information. Change in fair value of these assets is recorded in other operating expenses in the consolidated statement of operations.
Contracts Accounted for as Credit Derivatives
The Company’s credit derivatives primarily consist of insured CDS contracts, and also include interest rate swaps that qualify as derivatives under GAAP, which requires fair value measurement with changes recorded in the statement of operations. The Company did not enter into CDS with the intent to trade these contracts and the Company may not unilaterally terminate a CDS contract absent an event of default or termination event that entitles the Company to terminate such contracts; however, the Company has mutually agreed with various counterparties to terminate certain CDS transactions. In transactions where the counterparty does not have the right to terminate, such transactions are generally terminated for an amount that approximates the present value of future premiums or for a negotiated amount, rather than at fair value.
The terms of the Company’s CDS contracts differ from more standardized credit derivative contracts sold by companies outside the financial guaranty industry. The non-standard terms generally include the absence of collateral support agreements or immediate settlement provisions. In addition, the Company employs relatively high attachment points and does not exit derivatives it sells, except under specific circumstances such as mutual agreements with counterparties. Management considers the non-standard terms of the Company's credit derivative contracts in determining the fair value of these contracts.
Due to the lack of quoted prices and other observable inputs for its instruments or for similar instruments, the Company determines the fair value of its credit derivative contracts primarily through internally developed, proprietary models that use both observable and unobservable market data inputs. There is no established market where financial guaranty insured credit derivatives are actively traded; therefore, management has determined that the exit market for the Company’s credit derivatives is a hypothetical one based on its entry market. These contracts are classified as Level 3 in the fair value hierarchy as there are multiple unobservable inputs deemed significant to the valuation model, most importantly the Company’s estimate of the value of the non-standard terms and conditions of its credit derivative contracts and how the Company’s own credit spread affects the pricing of its transactions.
The fair value of the Company’s credit derivative contracts represents the difference between the present value of remaining premiums the Company expects to receive and the estimated present value of premiums that a financial guarantor of comparable credit-worthiness would hypothetically charge at the reporting date for the same protection. The fair value of the Company’s credit derivatives depends on a number of factors, including notional amount of the contract, expected term, credit spreads, changes in interest rates, the credit ratings of referenced entities, the Company’s own credit risk and remaining contractual cash flows. The expected remaining contractual premium cash flows are the most readily observable inputs since they are based on the CDS contractual terms. Credit spreads capture the effect of recovery rates and performance of underlying assets of these contracts, among other factors. Consistent with previous years, market conditions at December 31, 2019 were such that market prices of the Company’s CDS contracts were not available.
Assumptions and Inputs
The various inputs and assumptions that are key to the establishment of the Company’s fair value for CDS contracts are as follows: the gross spread, the allocation of gross spread among the bank profit, net spread and hedge cost, and the weighted average life which is based on debt service schedules. The Company obtains gross spreads on its outstanding long-termcontracts from market data sources published by third parties (e.g., dealer spread tables for the collateral similar to assets within the Company’s transactions), as well as collateral-specific spreads provided or obtained from market sources. The bank profit represents the profit the originator, usually an investment bank, realizes for structuring and funding the transaction; the net spread represents the premiums paid to the Company for the Company’s credit protection provided; and the hedge cost represents the cost of CDS protection purchased by the originator to hedge its counterparty credit risk exposure to the Company.
With respect to CDS transactions for which there is an expected claim payment within the next twelve months, the allocation of gross spread reflects a higher allocation to the cost of credit rather than the bank profit component. It is assumed
that a bank would be willing to accept a lower profit on distressed transactions in order to remove these transactions from its financial statements.
Market sources determine credit spreads by reviewing new issuance pricing for specific asset classes and receiving price quotes from their trading desks for the specific asset in question. Management validates these quotes by cross-referencing quotes received from one market source against quotes received from another market source to ensure reasonableness. In addition, the Company compares the relative change in price quotes received from one quarter to another, with the relative change experienced by published market indices for a specific asset class. Collateral specific spreads obtained from third-party, independent market sources are un-published spread quotes from market participants or market traders who are not trustees. Management obtains this information as the result of direct communication with these sources as part of the valuation process. The following spread hierarchy is utilized in determining which source of gross spread to use.
Actual collateral specific credit spreads (if up-to-date and reliable market-based spreads are available).
Transactions priced or closed during a specific quarter within a specific asset class and specific rating.
Credit spreads interpolated based upon market indices adjusted to reflect the non-standard terms of the Company's CDS contracts.
Credit spreads extrapolated based upon transactions of similar asset classes, similar ratings, and similar time to maturity.
The rates used to discount future expected premium cash flows ranged from 1.69% to 2.08% at December 31, 2019 and 2.47% to 2.89% at December 31, 2018.
The premium the Company receives is referred to as the “net spread.” The Company’s pricing model takes into account not only how credit spreads on risks that it assumes affect pricing, but also how the Company’s own credit spread affects the pricing of its transactions. The Company’s own credit risk is factored into the determination of net spread based on the impact of changes in the quoted market price for credit protection bought on the Company, as reflected by quoted market prices on CDS referencing AGC. For credit spreads on the Company’s name the Company obtains the quoted price of CDS contracts traded on AGC from market data sources published by third parties. The cost to acquire CDS protection referencing AGC affects the amount of spread on CDS transactions that the Company retains and, hence, their fair value. As the cost to acquire CDS protection referencing AGC increases, the amount of premium the Company retains on a transaction generally decreases. Due to the relatively low volume and characteristics of CDS contracts remaining in AGM's portfolio, changes in AGM's credit spreads do not significantly affect the fair value of these CDS contracts.
In the Company’s valuation model, the premium the Company captures is not permitted to go below the minimum rate that the Company would currently charge to assume similar risks. This assumption can have the effect of mitigating the amount of unrealized gains that are recognized on certain CDS contracts. Given market conditions and the Company’s own credit spreads, approximately 17% based on fair value, of the Company's CDS contracts were fair valued using this minimum premium as of December 31, 2018. As of December 31, 2019, the corresponding number was de minimis. The percentage of transactions that price using the minimum premiums fluctuates due to changes in AGC's credit spreads. In general, when AGC's credit spreads narrow, the cost to hedge AGC's name declines and more transactions price above previously established floor levels. Meanwhile, when AGC's credit spreads widen, the cost to hedge AGC's name increases causing more transactions to price at established floor levels. The Company corroborates the assumptions in its fair value model, including the portion of exposure to AGC hedged by its counterparties, with independent third parties periodically. The implied credit risk of AGC, indicated by the trading level of AGC’s own credit spread, is a significant factor in the amount of exposure to AGC that a bank or transaction hedges. When AGC's credit spreads widen, the hedging cost of a bank or originator increases. Higher hedging costs reduce the amount of contractual cash flows AGC can capture as premium for selling its protection, while lower hedging costs increase the amount of contractual cash flows AGC can capture.
The amount of premium a financial guaranty insurance market participant can demand is inversely related to the cost of credit protection on the insurance company as measured by market credit spreads assuming all other assumptions remain constant. This is because the buyers of credit protection typically hedge a portion of their risk to the financial guarantor, due to the fact that the contractual terms of the Company's contracts typically do not require the posting of collateral by the guarantor. The extent of the hedge depends on the types of instruments insured and the current market conditions.
A credit derivative liability on protection sold is the result of contractual cash inflows on in-force transactions that are less than what a hypothetical financial guarantor could receive if it sold protection on the same risk as of the reporting date. If
the Company were able to freely exchange these contracts (i.e., assuming its contracts did not contain proscriptions on transfer and there was a viable exchange market), it would realize a loss representing the difference between the lower contractual premiums to which it is entitled and the current market premiums for a similar contract. The Company determines the fair value of its CDS contracts by applying the difference between the current net spread and the contractual net spread for the remaining duration of each contract to the notional value of its CDS contracts and taking the present value of such amounts discounted at the LIBOR corresponding to the weighted average remaining life of the contract.
Strengths and Weaknesses of Model
The Company’s credit derivative valuation model, like any financial model, has certain strengths and weaknesses.
The primary strengths of the Company’s CDS modeling techniques are:
The model takes into account the transaction structure and the key drivers of market value.
The model maximizes the use of market-driven inputs whenever they are available.
The model is a consistent approach to valuing positions.
The primary weaknesses of the Company’s CDS modeling techniques are:
There is no exit market or any actual exit transactions; therefore, the Company’s exit market is a hypothetical one based on the Company’s entry market.
There is a very limited market in which to validate the reasonableness of the fair values developed by the Company’s model.
The markets for the inputs to the model are highly illiquid, which impacts their reliability.
Due to the non-standard terms under which the Company enters into derivative contracts, the fair value of its credit derivatives may not reflect the same prices observed in an actively traded market of credit derivatives that do not contain terms and conditions similar to those observed in the financial guaranty market.
Fair Value Option on FG VIEs’ Assets and Liabilities
The Company elected the fair value option for all the FG VIEs’ assets and liabilities and classifies them as Level 3 in the fair value hierarchy. The prices are generally determined with the assistance of an independent third party, based on a discounted cash flow approach. The net change in the fair value of consolidated FG VIEs’ assets and liabilities is recorded in "fair value gains (losses) on FG VIEs" in the consolidated statements of operations, except for change in fair value of FG VIEs’ liabilities with recourse caused by changes in instrument-specific credit risk (ISCR) which is separately presented in OCI. Interest income and interest expense are derived from the trustee reports and also included in "fair value gains (losses) on FG VIEs." The FG VIEs issued securities collateralized by first lien and second lien RMBS as well as loans and receivables.
The fair value of the Company’s FG VIEs’ assets is generally sensitive to changes in estimated prepayment speeds; estimated default rates (determined on the basis of an analysis of collateral attributes such as: historical collateral performance, borrower profiles and other features relevant to the evaluation of collateral credit quality); yields implied by market prices for similar securities; and house price depreciation/appreciation rates based on macroeconomic forecasts. Significant changes to some of these inputs could have materially changed the market value of the FG VIEs’ assets and the implied collateral losses within the transaction. In general, the fair value of the FG VIEs’ assets is most sensitive to changes in the projected collateral losses, where an increase in collateral losses typically could lead to a decrease in the fair value of FG VIEs’ assets, while a decrease in collateral losses typically leads to an increase in the fair value of FG VIEs’ assets. The third-party utilizes an internal model to determine an appropriate yield at which to discount the cash flows of the security, by factoring in collateral types, weighted-average lives, and other structural attributes specific to the security being priced. The expected yield is further calibrated by utilizing algorithms designed to aggregate market color, received by the independent third-party, on comparable bonds.
The models used to price the FG VIEs’ liabilities generally apply the same inputs used in determining fair value of FG VIEs’ assets. For those liabilities insured by the Company, the benefit of the Company's insurance policy guaranteeing the timely payment of principal and interest is also taken into account.
Significant changes to any of the inputs described above could have materially changed the timing of expected losses within the insured transaction which is a significant factor in determining the implied benefit of the Company’s insurance policy guaranteeing the timely payment of principal and interest for the insured tranches of debt comprisingissued by the FG VIEs. In general, extending the timing of expected loss payments by the Company into the future typically could lead to a decrease in the value of the Company’s insurance and a decrease in the fair value of the Company’s FG VIEs’ liabilities with recourse, while a shortening of the timing of expected loss payments by the Company typically could lead to an increase in the value of the Company’s insurance and an increase in the fair value of the Company’s FG VIEs’ liabilities with recourse.
Assets and Liabilities of Consolidated Investment Vehicles
Due to the fact that BlueMountain manages and the Insurance segment has an investment in certain Assured Investment Management funds, the Company consolidated 1 Assured Investment Management managed CLO and 3 Assured Investment Management funds (collectively, the consolidated investment vehicles). The consolidated Assured Investment Management funds are: AHP Capital Solutions, LP (AHP), AIM Asset Backed Income Fund (US) L.P. (ABIF) and a BlueMountain CLO Warehouse Fund (US) L.P. (CLO Warehouse Fund). CLO Warehouse Fund invested in BlueMountain CLO XXVI Ltd. (CLO XXVI). All four consolidated investment vehicles are accounted for at fair value. See Note 14, Variable Interest Entities.
AHP and ABIF are investment companies, subject to the guidance in Accounting Standards Codification (ASC) 946, Financial Services — Investment Companies.
CLO XXVI is a collateralized financing entity (CFE) under ASC 810, Consolidation, and has elected to measure assets and liabilities using the fair value of its assets, which are more observable. The financial assets of CLO XXVI are all Level 2 assets, and therefore more observable than the fair value of the financial liabilities of CLO XXVI, which are all Level 3 liabilities. As a result, the financial assets of CLO XXVI are measured at fair value and the financial liabilities of CLO XXVI are measured as: (1) the sum of the fair value of the financial assets, and the carrying value of any nonfinancial assets held temporarily, less (2) the sum of the fair value of any beneficial interests retained by the Company (other than those that represent compensation for services), and the Company’s carrying value of any beneficial interests that represent compensation for services. The resulting amount is allocated to the individual financial liabilities (other than the beneficial interests retained by the Company).
Investments of consolidated investment vehicles which are not listed or quoted on an exchange, but are traded over-the-counter, or are listed on an exchange which have no reported sales, are valued at their fair value as determined by the Company, after giving consideration to third party data generally at the average between the offer and bid prices. These fair values are generally based on dealer quotes, indications of value or pricing models that consider the time value of money, the current market, contractual prices and potential volatilities of the underlying financial instruments. Inputs are used in applying the various valuation techniques and broadly refer to the current assumptions that market participants use to make valuation decisions, including assumptions about risk. Inputs may include dealer price quotations, yield curves, credit curves, forward/CDS/index spreads, prepayments rates, strike and expiry dates, volatility statistics and other factors.
Assets in consolidated Assured Investment Management funds that are carried at fair value primarily consist of corporate loans and other investments. Assets supporting CLO XXVI are Level 2 and all other assets of consolidated investment vehicles are Level 3. Liabilities include various tranches of CLO debt and classified as Level 3 in the fair value hierarchy. Significant changes to any of the inputs described above could have a material effect the fair value of the consolidated assets and liabilities.
Amounts recorded at fair value in the Company’s financial statements are presented in the tables below.
Fair Value Hierarchy of Financial Instruments Carried at Fair Value
As of December 31, 2019
|
| | | | | | | | | | | | | | | |
| | | | Fair Value Hierarchy |
| | Fair Value | | Level 1 | | Level 2 | | Level 3 |
| | (in millions) |
| Assets: | |
| | |
| | |
| | |
|
| Investment portfolio, available-for-sale: | |
| | |
| | |
| | |
|
| Fixed-maturity securities | |
| | |
| | |
| | |
|
| Obligations of state and political subdivisions | $ | 4,340 |
| | $ | — |
| | $ | 4,233 |
| | $ | 107 |
|
| U.S. government and agencies | 147 |
| | — |
| | 147 |
| | — |
|
| Corporate securities | 2,221 |
| | — |
| | 2,180 |
| | 41 |
|
| Mortgage-backed securities: | |
| | | | | | |
| RMBS | 775 |
| | — |
| | 467 |
| | 308 |
|
| Commercial mortgage-backed securities (CMBS) | 419 |
| | — |
| | 419 |
| | — |
|
| Asset-backed securities | 720 |
| | — |
| | 62 |
| | 658 |
|
| Non-U.S. government securities | 232 |
| | — |
| | 232 |
| | — |
|
| Total fixed-maturity securities | 8,854 |
|
| — |
| | 7,740 |
| | 1,114 |
|
| Short-term investments | 1,268 |
| | 1,061 |
| | 207 |
| | — |
|
| Other invested assets (1) | 6 |
| | — |
| | — |
| | 6 |
|
| FG VIEs’ assets, at fair value | 442 |
| | — |
| | — |
| | 442 |
|
| Assets of consolidated investment vehicles | 558 |
| | — |
| | 494 |
| | 64 |
|
| Other assets | 135 |
| | 32 |
| | 45 |
| | 58 |
|
| Total assets carried at fair value | $ | 11,263 |
| | $ | 1,093 |
| | $ | 8,486 |
| | $ | 1,684 |
|
| Liabilities: | |
| | |
| | |
| | |
|
| Credit derivative liabilities | $ | 191 |
| | $ | — |
| | $ | — |
| | $ | 191 |
|
| FG VIEs’ liabilities with recourse, at fair value | 367 |
| | — |
| | — |
| | 367 |
|
| FG VIEs’ liabilities without recourse, at fair value | 102 |
| | — |
| | — |
| | 102 |
|
| Liabilities of consolidated investment vehicles | 481 |
| | — |
| | — |
| | 481 |
|
| Total liabilities carried at fair value | $ | 1,141 |
| | $ | — |
| | $ | — |
| | $ | 1,141 |
|
Fair Value Hierarchy of Financial Instruments Carried at Fair Value
As of December 31, 2018
|
| | | | | | | | | | | | | | | |
| | | | Fair Value Hierarchy |
| | Fair Value | | Level 1 | | Level 2 | | Level 3 |
| | (in millions) |
| Assets: | |
| | |
| | |
| | |
|
| Investment portfolio, available-for-sale: | |
| | |
| | |
| | |
|
| Fixed-maturity securities | |
| | |
| | |
| | |
|
| Obligations of state and political subdivisions | $ | 4,911 |
| | $ | — |
| | $ | 4,812 |
| | $ | 99 |
|
| U.S. government and agencies | 175 |
| | — |
| | 175 |
| | — |
|
| Corporate securities | 2,136 |
| | — |
| | 2,080 |
| | 56 |
|
| Mortgage-backed securities: | |
| | |
| | |
| | |
|
| RMBS | 982 |
| | — |
| | 673 |
| | 309 |
|
| CMBS | 539 |
| | — |
| | 539 |
| | — |
|
| Asset-backed securities | 1,068 |
| | — |
| | 121 |
| | 947 |
|
| Non-U.S. government securities | 278 |
| | — |
| | 278 |
| | — |
|
| Total fixed-maturity securities | 10,089 |
| | — |
| | 8,678 |
| | 1,411 |
|
| Short-term investments | 729 |
| | 429 |
| | 300 |
| | — |
|
| Other invested assets (1) | 7 |
| | — |
| | — |
| | 7 |
|
| FG VIEs’ assets, at fair value | 569 |
| | — |
| | — |
| | 569 |
|
| Other assets | 139 |
| | 25 |
| | 38 |
| | 76 |
|
| Total assets carried at fair value | $ | 11,533 |
| | $ | 454 |
| | $ | 9,016 |
| | $ | 2,063 |
|
| Liabilities: | |
| | |
| | |
| | |
|
| Credit derivative liabilities | $ | 209 |
| | $ | — |
| | $ | — |
| | $ | 209 |
|
| FG VIEs’ liabilities with recourse, at fair value | 517 |
| | — |
| | — |
| | 517 |
|
| FG VIEs’ liabilities without recourse, at fair value | 102 |
| | — |
| | — |
| | 102 |
|
| Total liabilities carried at fair value | $ | 828 |
| | $ | — |
| | $ | — |
| | $ | 828 |
|
____________________
(1) Includes Level 3 mortgage loans that are recorded at fair value on a non-recurring basis.
Changes in Level 3 Fair Value Measurements
The tables below present a roll forward of the Company’s Level 3 financial instruments carried at fair value on a recurring basis during the years ended December 31, 2019 and 2018.
Rollforward of Level 3 Assets
At Fair Value on a Recurring Basis
Year Ended December 31, 2019
|
| | | | | | | | | | | | | | | | | | | | | | | | | | | | | | | | | | | |
| | Fixed-Maturity Securities | | | | | | | |
| | Obligations
of State and
Political
Subdivisions | | Corporate Securities | | RMBS | | Asset-
Backed
Securities | | FG VIEs’
Assets at
Fair
Value | | Assets of Consolidated Investment Vehicles | | Other
(7) | |
| | (in millions) |
| Fair value as of December 31, 2018 | $ | 99 |
| | $ | 56 |
| | $ | 309 |
| | $ | 947 |
| |
| $ | 569 |
| |
| $ | — |
| | $ | 77 |
| |
|
| Total pretax realized and unrealized gains/(losses) recorded in: | | | | | | | | |
| |
| |
| | | |
| |
|
| Net income (loss) | 6 |
| (1 | ) | (8 | ) | (1 | ) | 17 |
| (1 | ) | 58 |
| (1 | ) | 68 |
| (2 | ) | — |
| (4 | ) | (22 | ) | (3 | ) |
| Other comprehensive income (loss) | (1 | ) | | (7 | ) | | 25 |
| | (91 | ) | |
| — |
| |
| — |
| | — |
| |
|
| Purchases | 6 |
| | — |
| | 11 |
| | 20 |
| |
| — |
| |
| 64 |
| | — |
| |
|
| Sales | — |
| | — |
| | — |
| | (29 | ) | | (51 | ) | | — |
| | — |
| |
| Settlements | (3 | ) | | — |
| | (54 | ) | | (248 | ) | | (139 | ) | | — |
| | — |
| |
|
| VIE consolidations | — |
| | — |
| | — |
| | — |
| | 6 |
| | — |
| | — |
| |
| VIE deconsolidations | — |
| | — |
| | — |
| | — |
| | (11 | ) | | — |
| | — |
| |
| Transfers into Level 3 | — |
| | — |
| | — |
| | 1 |
| | — |
| | — |
| | — |
| |
Fair value as of
December 31, 2019 | $ | 107 |
| | $ | 41 |
| | $ | 308 |
| | $ | 658 |
| |
| $ | 442 |
| |
| $ | 64 |
| | $ | 55 |
| |
|
Change in unrealized gains/(losses) included in earnings related to financial instruments held as of
December 31, 2019 | | | | | | | | | $ | 77 |
| (2 | ) | $ | — |
| (4 | ) | $ | (22 | ) | (3 | ) |
Change in unrealized gains/(losses) included in OCI related to financial instruments held as of
December 31, 2019 | $ | — |
| | $ | (7 | ) | | $ | 25 |
| | $ | 15 |
| | | | | | | |
Rollforward of Level 3 Liabilities
At Fair Value on a Recurring Basis
Year Ended December 31, 2019
|
| | | | | | | | | | | | | | | | | | | | |
| | | | FG VIEs’ Liabilities, at Fair Value | | | |
| | Credit
Derivative
Asset (Liability), net (5) | | With Recourse | | Without Recourse | | Liabilities of Consolidated Investment Vehicles | |
| | (in millions) | |
| Fair value as of December 31, 2018 | $ | (207 | ) | | $ | (517 | ) | | $ | (102 | ) | | $ | — |
| |
| Total pretax realized and unrealized gains/(losses) recorded in: | |
| |
| |
| |
| | | | |
| Net income (loss) | (6 | ) | (6 | ) | (32 | ) | (2 | ) | (9 | ) | (2 | ) | (9 | ) | (4 | ) |
| Other comprehensive income (loss) | — |
| |
| 5 |
| |
| — |
| | — |
| |
| Issuances | — |
| |
| — |
| |
| — |
| | (472 | ) | |
| Settlements | 28 |
| |
| 173 |
| |
| 8 |
| | — |
| |
| VIE consolidations | — |
| | (5 | ) | | (1 | ) | | — |
| |
| VIE deconsolidations | — |
| | 9 |
| | 2 |
| | — |
| |
| Fair value as of December 31, 2019 | $ | (185 | ) | | $ | (367 | ) | | $ | (102 | ) | | $ | (481 | ) | |
| Change in unrealized gains/(losses) included in earnings related to financial instruments held as of December 31, 2019 | $ | 3 |
| (6 | ) | $ | (31 | ) | (2 | ) | $ | (17 | ) | (2 | ) | $ | (9 | ) | (4 | ) |
| Change in unrealized gains/(losses) included in OCI related to financial instruments held as of December 31, 2019 | | | $ | 5 |
| | | |
|
| |
Rollforward of Level 3 Assets and Liabilities
At Fair Value on a Recurring Basis
Year Ended December 31, 2018
|
| | | | | | | | | | | | | | | | | | | | | | | | | | | | | | | | | | | | | | | | | | | | | |
| | Fixed-Maturity Securities | | | | | | | | FG VIEs’ Liabilities, at Fair Value | |
| | Obligations
of State and
Political
Subdivisions | | Corporate Securities | | RMBS | | Asset-
Backed
Securities | | FG VIEs’
Assets at
Fair
Value | | Other
(7) | | Credit
Derivative
Asset
(Liability),
net (5) | | With Recourse | | Without Recourse | |
| | (in millions) | |
Fair value as of
December 31, 2017 | $ | 76 |
| | $ | 67 |
| | $ | 334 |
| | $ | 787 |
| | $ | 700 |
| |
| $ | 64 |
| | $ | (269 | ) | |
| $ | (627 | ) | | $ | (130 | ) | |
| Total pretax realized and unrealized gains/(losses) recorded in: | | | | | | | | | | |
| | | | |
| | |
| | |
| Net income (loss) | 3 |
| (1 | ) | (14 | ) | (1 | ) | 21 |
| (1 | ) | 57 |
| (1 | ) | 2 |
| (2 | ) | 14 |
| (3 | ) | 112 |
| (6 | ) | (1 | ) | (2 | ) | 4 |
| (2 | ) |
| Other comprehensive income (loss) | 18 |
| | 3 |
| | (17 | ) | | (40 | ) | | — |
| |
| — |
| | — |
| |
| 2 |
| |
| — |
| |
| Purchases | 4 |
| | — |
| | 35 |
| | 189 |
| | — |
| |
| — |
| | — |
| |
| — |
| |
| — |
| |
| Issuances | — |
| | — |
| | — |
| | — |
| | — |
| | — |
| | (68 | ) | (8 | ) | — |
| |
| — |
| |
| Settlements | (2 | ) | | — |
| | (64 | ) | | (46 | ) | | (116 | ) | |
| (1 | ) | | 18 |
| |
| 108 |
| | 8 |
| |
| FG VIE deconsolidations | — |
| | — |
| | — |
| | — |
| | (17 | ) | | — |
| | — |
| | 1 |
| | 16 |
| |
Fair value as of
December 31, 2018 | $ | 99 |
| | $ | 56 |
| | $ | 309 |
| | $ | 947 |
| | $ | 569 |
| |
| $ | 77 |
| | $ | (207 | ) | |
| $ | (517 | ) | | $ | (102 | ) | |
| Change in unrealized gains/(losses) included in earnings related to financial instruments held as of December 31, 2018 | | | | | | | | | $ | 13 |
| (2 | ) | $ | 14 |
| (3 | ) | $ | 122 |
| (6 | ) | $ | 1 |
| (2 | ) | $ | 3 |
| (2 | ) |
| Change in unrealized gains/(losses) included in OCI related to financial instruments held as of December 31, 2018 | $ | 18 |
| | $ | 3 |
| | $ | (14 | ) | | $ | (38 | ) | | | | $ | — |
| | | | $ | 2 |
| | | |
____________________
| |
| (1) | Included in net realized investment gains (losses) and net investment income. |
| |
| (2) | Included in fair value gains (losses) on FG VIEs. |
| |
| (3) | Recorded in net investment income and other income. |
| |
| (4) | Recorded in other income. |
| |
| (5) | Represents the net position of credit derivatives. Credit derivative assets (recorded in other assets) and credit derivative liabilities (presented as a separate line item) are shown as either assets or liabilities in the consolidated balance sheet based on net exposure by counterparty. |
| |
| (6) | Reported in net change in fair value of credit derivatives. |
| |
| (7) | Includes CCS and other invested assets. |
| |
| (8) | Relates to SGI Transaction. See Note 2, Business Combinations and Assumption of Insured Portfolio. |
Level 3 Fair Value Disclosures
Quantitative Information about Level 3 Fair Value Inputs
At December 31, 2019
|
| | | | | | | | | | | | | |
| Financial Instrument Description | | Fair Value at
December 31, 2019
(in millions) | | Significant Unobservable Inputs | | Range | | Weighted Average as a Percentage of Current Par Outstanding |
| Assets (2): | | |
| | | | | | | | |
| Fixed-maturity securities (1): | | |
| | | | | | | | |
| Obligations of state and political subdivisions | | $ | 107 |
| | Yield | | 4.5 | % | - | 31.1% | | 8.5% |
| | | | | | | | | | | |
| Corporate securities | | 41 |
| | Yield | | 35.9% | | |
| | | | | | | | | | | |
| RMBS | | 308 |
| | CPR | | 2.0 | % | - | 15.0% | | 6.3% |
| | | CDR | | 1.5 | % | - | 7.0% | | 4.9% |
| | | Loss severity | | 40.0 | % | - | 125.0% | | 78.8% |
| | | Yield | | 3.7 | % | - | 6.1% | | 4.8% |
| Asset-backed securities: | | | | | | | | | | |
| Life insurance transactions | | 350 |
| | Yield | | 5.8% | | |
| | | | | | | | | | | |
| CLOs/Trust preferred securities (TruPS) | | 256 |
| | Yield | | 2.5 | % | - | 4.1% | | 2.9% |
| | | | | | | | | | | |
| Others | | 52 |
| | Yield | | 2.3 | % | - | 9.4% | | 9.3% |
| | | | | | | | | | | |
| FG VIEs’ assets, at fair value (1) | | 442 |
| | CPR | | 0.1 | % | - | 18.6% | | 8.6% |
| | | CDR | | 1.2 | % | - | 24.7% | | 4.9% |
| | | Loss severity | | 40.0 | % | - | 100.0% | | 76.1% |
| | | Yield | | 3.0 | % | - | 8.4% | | 5.2% |
| | | | | | | | | | | |
| Assets of consolidated investment vehicles (3) | | 64 |
| | Discount rate | | 16.0 | % | - | 28.0% | | 21% |
| | | | Market multiple - enterprise/revenue value | | 0.5x |
| - | 6.7x | | |
| | | | | Yield | | 12.5% | | |
| | | | | | | | | | | |
| Other assets (1) | | 52 |
| | Implied Yield | | 5.1 | % | - | 5.8% | | 5.5% |
| | | Term (years) | | 10 years | | |
|
| | | | | | | | | | | | | |
| Financial Instrument Description(1) | | Fair Value at
December 31, 2019
(in millions) | | Significant Unobservable Inputs | | Range | | Weighted Average as a Percentage of Current Par Outstanding |
| Liabilities: | | |
| | | | | | | | |
| | | | | | | | | | | |
| Credit derivative liabilities, net | | $ | (185 | ) | | Year 1 loss estimates | | 0.0 | % | - | 46.0% | | 1.3% |
| | | Hedge cost (in basis points (bps)) | | 5.0 |
| - | 31.0 | | 11.0 |
| | | Bank profit (in bps) | | 51.0 |
| - | 212.0 | | 76.0 |
| | | Internal floor (in bps) | | 30.0 | | |
| | | Internal credit rating | | AAA |
| - | CCC | | AA- |
| | | | | | | | | | | |
| FG VIEs’ liabilities, at fair value | | (469 | ) | | CPR | | 0.1 | % | - | 18.6% | | 8.6% |
| | | CDR | | 1.2 | % | - | 24.7% | | 4.9% |
| | | Loss severity | | 40.0 | % | - | 100.0% | | 76.1% |
| | | Yield | | 2.7 | % | - | 8.4% | | 4.2% |
| | | | | | | | | | | |
| Liabilities of consolidated investment vehicles: | | | | | | | | | | |
| CLO obligations | | (481 | ) | | Yield | | 10.0% | | |
____________________
(1) Discounted cash flow is used as the primary valuation technique.
| |
| (2) | Excludes several investments recorded in other invested assets with fair value of $6 million. |
| |
| (3) | The primary inputs to the valuation are recent market transaction prices, supported by market multiples and yields/discount rates. |
Quantitative Information about Level 3 Fair Value Inputs
At December 31, 2018
|
| | | | | | | | | | | | | |
| Financial Instrument Description(1) | | Fair Value at
December 31, 2018
(in millions) | | Significant Unobservable Inputs | | Range | | Weighted Average as a Percentage of Current Par Outstanding |
| Assets (liabilities) (2): | | |
| | | | | | | | |
| Fixed-maturity securities : | | |
| | | | | | | | |
| Obligations of state and political subdivisions | | $ | 99 |
| | Yield | | 4.5 | % | - | 32.7% | | 12.0% |
| | | | | | | | | | | |
| Corporate securities | | 56 |
| | Yield | | 29.5% | | |
| | | | | | | | | | | |
| RMBS | | 309 |
| | CPR | | 3.4 | % | - | 19.4% | | 6.2% |
| | | CDR | | 1.5 | % | - | 6.9% | | 5.2% |
| | | Loss severity | | 40.0 | % | - | 125.0% | | 82.7% |
| | | Yield | | 5.3 | % | - | 8.1% | | 6.3% |
| Asset-backed securities: | | | | | | | | | | |
| Life insurance transactions | | 620 |
| | Yield | | 6.5 | % | - | 7.1% | | 6.8% |
| | | | | | | | | | | |
| CLOs/TruPS | | 274 |
| | Yield | | 3.8 | % | - | 4.7% | | 4.3% |
| | | | | | | | | | | |
| Others | | 53 |
| | Yield | | 11.5% | | |
| | | | | | | | | | | |
| FG VIEs’ assets, at fair value | | 569 |
| | CPR | | 0.9 | % | - | 18.1% | | 9.3% |
| | | CDR | | 1.3 | % | - | 23.7% | | 5.1% |
| | | Loss severity | | 60.0 | % | - | 100.0% | | 79.8% |
| | | Yield | | 5.0 | % | - | 10.2% | | 7.1% |
| | | | | | | | | | | |
| Other assets | | 74 |
| | Implied Yield | | 6.6 | % | - | 7.2% | | 6.9% |
| | | | Term (years) | | 10 years | | |
| | | |
| | | | | | | | |
| Credit derivative liabilities, net | | (207 | ) | | Year 1 loss estimates | | 0.0 | % | - | 66.0% | | 2.2% |
| | | Hedge cost (in bps) | | 5.5 |
| - | 82.5 | | 23.3 |
| | | Bank profit (in bps) | | 7.2 |
| - | 509.9 | | 77.3 |
| | | Internal floor (in bps) | | 8.8 |
| - | 30.0 | | 19.0 |
| | | Internal credit rating | | AAA |
| - | CCC | | AA- |
| | | | | | | | | | | |
| FG VIEs’ liabilities, at fair value | | (619 | ) | | CPR | | 0.9 | % | - | 18.1% | | 9.3% |
| | | CDR | | 1.3 | % | - | 23.7% | | 5.1% |
| | | Loss severity | | 60.0 | % | - | 100.0% | | 79.8% |
| | | Yield | | 5.0 | % | - | 10.2% | | 5.6% |
____________________
| |
| (1) | Discounted cash flow is used as the primary valuation technique for all financial instruments listed in this table. |
| |
| (2) | Excludes several investments recorded in other invested assets with fair value of $7 million. |
Not Carried at Fair Value
Financial Guaranty Insurance Contracts
Fair value is based on management’s estimate of what a similarly rated financial guaranty insurance company would demand to acquire the Company’s in-force book of financial guaranty insurance business. It is based on a variety of factors that may include pricing assumptions management has observed for portfolio transfers, commutations, and acquisitions that have occurred in the financial guaranty market, as well as prices observed in the credit derivative market with an adjustment for illiquidity so that the terms would be similar to a financial guaranty insurance contract, and also includes adjustments for stressed losses, ceding commissions and return on capital. The Company classified the fair value of financial guaranty insurance contracts as Level 3.
Long-Term Debt
Long-term debt issued by AGUS and AGMH. AGUSAGMH is valued by broker-dealers using third party independent pricing sources and standard market conventions and classified as Level 2 in the fair value hierarchy. The market conventions utilize market quotations, market transactions for the Company’s comparable instruments, and to a lesser extent, similar instruments in the broader insurance industry. The fair value of notes payable was determined by calculating the present value of the expected cash flows, and was classified as Level 3 in the fair value hierarchy.
The carrying amount and estimated fair value of the Company’s financial instruments not carried at fair value are presented in the following table.
Fair Value of Financial Instruments Not Carried at Fair Value
|
| | | | | | | | | | | | | | | |
| | As of
December 31, 2019 | | As of
December 31, 2018 |
| | Carrying Amount | | Estimated Fair Value | | Carrying Amount | | Estimated Fair Value |
| | (in millions) |
| Assets (liabilities): | |
| | |
| | |
| | |
|
| Other invested assets | $ | 1 |
| | $ | 2 |
| | $ | 1 |
| | $ | 2 |
|
| Other assets (1) | 97 |
| | 97 |
| | 130 |
| | 130 |
|
| Financial guaranty insurance contracts (2) | (2,714 | ) | | (4,013 | ) | | (3,240 | ) | | (5,932 | ) |
| Long-term debt | (1,235 | ) | | (1,573 | ) | | (1,233 | ) | | (1,496 | ) |
| Other liabilities (1) | (14 | ) | | (14 | ) | | (12 | ) | | (12 | ) |
____________________
| |
| (1) | The Company's other assets and other liabilities consist predominantly of: accrued interest, management fees receivables, receivables for securities sold and payables for securities purchased, for which the carrying value approximates fair value, and a promissory note receivable. |
| |
| (2) | Carrying amount includes the assets and liabilities related to financial guaranty insurance contract premiums, losses, and salvage and subrogation and other recoverables net of reinsurance. |
The amounts and descriptions in the note relate to the Company's investments and cash other than those of the consolidated investment vehicles described in Note 14, Variable interest Entities.
Accounting Policy
The vast majority of the Company's investment portfolio consists of fixed-maturity and short-term investments, classified as available-for-sale at the time of purchase (approximately 98.8% based on fair value as of December 31, 2019), and therefore carried at fair value. Changes in fair value for other-than-temporarily-impaired securities are bifurcated between credit losses and non-credit changes in fair value. The credit loss on other-than-temporarily-impaired securities is recorded in the statement of operations and the non-credit component of the change in fair value of securities is recorded in OCI. For securities in an unrealized loss position where the Company has issued 7% Senior Notes, 5% Senior Notesthe intent to sell or it is more-likely-than-not that it will be required to sell the security before recovery, the entire impairment loss (i.e., the difference between the security's fair value and Series A, Enhanced Junior Subordinated Debentures. AGMHits amortized cost) is recorded in the consolidated statements of operations. Credit losses reduce the amortized cost of impaired securities. The amortized cost basis is adjusted for accretion and amortization (using the effective interest method) with a corresponding entry recorded in net investment income.
Realized gains and losses on sales of investments are determined using the specific identification method. Realized loss includes amounts recorded for other-than-temporary impairments (OTTI) on debt securities and the declines in fair value of securities for which the Company has issued 6 7/8% Quarterly Income Bonds Securities (QUIBS), 6.25% Notesthe intent to sell the security or inability to hold until recovery of amortized cost.
For mortgage‑backed securities, other than loss mitigation securities, and 5.6% Notes,any other holdings for which there is prepayment risk, prepayment assumptions are evaluated and revised as necessary. Any necessary adjustments due to changes in effective yields and maturities are recognized in net investment income using the retrospective method.
Loss mitigation securities are generally purchased at a discount and are accounted for based on their underlying investment type, excluding the effects of the Company’s insurance. Interest income on loss mitigation securities is recognized on a level yield basis over the remaining life of the security.
Short-term investments, which are those investments with a maturity of less than one year at time of purchase, are carried at fair value and include amounts deposited in money market funds.
Other invested assets primarily consist of equity method investments. The Company's equity method investments primarily consist of an investment in a renewable energy company, as well as $300 million Junior Subordinated Debentures. Allinvestments in private equity funds and managed account investment advisors. Changes in the value of such debtequity method investments are recorded in the consolidated statements of operations in "equity in earnings of investees." Other invested assets also includes other equity investments carried at fair value. Up until December 31, 2017, the change in fair value of preferred stock investments and certain other equity investments was recorded in OCI. Effective January 1, 2018, in accordance with ASU 2016-01, the change in fair value of these investments is fully and unconditionally guaranteed by AGL; AGL's guaranteerecorded in other income in the consolidated statements of operations. In addition, in accordance with ASU 2016-01, the Company elected the new measurement alternative for equity securities that were accounted for under the cost method as of December 31, 2017 because they did not have a readily determinable fair value. Effective January 1, 2018, these equity securities are accounted at cost less any impairment, plus or minus the change resulting from observable price changes in orderly transactions for identical or a similar investment of the junior subordinated debenturessame issuer in the consolidated statements of operations.
Cash consists of cash on hand and demand deposits. As a result of the lag in reporting FG VIEs, cash and short-term investments do not reflect cash outflow to the holders of the debt issued by the FG VIEs for claim payments made by the Company's insurance subsidiaries to the consolidated FG VIEs until the subsequent reporting period.
Assessment for Other-Than Temporary Impairments
The Company has a formal review process to determine OTTI for securities in its investment portfolio where there is no intent to sell and it is not more-likely-than-not that it will be required to sell the security before recovery. Factors considered when assessing impairment include:
a decline in the market value of a security by 20% or more below amortized cost for a continuous period of at least six months;
a decline in the market value of a security for a continuous period of 12 months;
recent credit downgrades of the applicable security or the issuer by rating agencies;
the financial condition of the applicable issuer;
whether loss of investment principal is anticipated;
the impact of foreign exchange rates; and
whether scheduled interest payments are past due.
The Company assesses the ability to recover the amortized cost by comparing the net present value of projected future cash flows with the amortized cost of the security. If the security is in an unrealized loss position and its net present value is less than the amortized cost of the investment, an OTTI is recorded. The net present value is calculated by discounting the Company's estimate of projected future cash flows at the effective interest rate implicit in the debt security at the time of purchase. The Company's estimates of projected future cash flows are driven by assumptions regarding probability of default and estimates regarding timing and amount of recoveries associated with a default. The Company develops these estimates using information based on historical experience, credit analysis and market observable data, such as industry analyst reports and forecasts, sector credit ratings and other relevant data. For mortgage‑backed and asset backed securities, cash flow estimates also include prepayment and other assumptions regarding the underlying collateral such as default rates, recoveries and changes in value. The assumptions used in these projections require the use of significant management judgment. If management's assessment changes in the future, the Company may ultimately record a loss after having originally concluded that the decline in value was temporary.
In addition to the factors noted above, the Company also seeks advice from its outside investment managers.
Net Investment Income and Equity Method Investment Earnings
Net investment income is a function of the yield that the Company earns on invested assets and the size of the portfolio. Net investment income includes the income earned on fixed-maturity securities, short-term investments and other invested assets, other than investments accounted for under the equity method, which are recorded in equity in earnings of investees. The investment yield is a function of market interest rates at the time of investment as well as the type, credit quality and maturity of the invested assets. Accrued investment income, which is recorded in other assets, was $79 million and $91 million as of December 31, 2019 and December 31, 2018, respectively.
Net Investment Income
|
| | | | | | | | | | | |
| | Year Ended December 31, |
| | 2019 | | 2018 | | 2017 |
| | (in millions) |
| Income from securities managed by third parties | $ | 273 |
|
| $ | 297 |
|
| $ | 298 |
|
| Income from internally managed securities (1) | 114 |
| | 107 |
| | 128 |
|
| Gross investment income | 387 |
| | 404 |
| | 426 |
|
| Investment expenses | (9 | ) |
| (9 | ) |
| (9 | ) |
| Net investment income | $ | 378 |
| | $ | 395 |
| | $ | 417 |
|
____________________
| |
| (1) | Year ended December 31, 2017 included accretion on Zohar II Notes used as consideration for the MBIA UK Acquisition. See Note 2, Business Combinations and Assumption of Insured Portfolio. |
Realized Investment Gains (Losses)
The table below presents the components of net realized investment gains (losses).
Net Realized Investment Gains (Losses)
|
| | | | | | | | | | | |
| | Year Ended December 31, |
| | 2019 | | 2018 | | 2017 |
| | (in millions) |
| Gross realized gains on available-for-sale securities (1) | $ | 63 |
| | $ | 20 |
| | $ | 95 |
|
| Gross realized losses on available-for-sale securities | (5 | ) | | (12 | ) | | (12 | ) |
| Net realized gains (losses) on other invested assets | (1 | ) | | (1 | ) | | — |
|
| OTTI: | | | | | |
| Total OTTI | (29 | ) | | (35 | ) | | (33 | ) |
| Less: portion of OTTI recognized in OCI | 6 |
| | 4 |
| | 10 |
|
| Net OTTI recognized in net income (loss) (2) | (35 | ) | | (39 | ) | | (43 | ) |
| Net realized investment gains (losses) (3) | $ | 22 |
| | $ | (32 | ) | | $ | 40 |
|
____________________
| |
| (1) | Year ended December 31, 2017 included a gain on Zohar II Notes used as consideration for the MBIA UK Acquisition. See Note 2, Business Combinations and Assumption of Insured Portfolio. |
| |
| (2) | Net OTTI recognized in net income for 2019, 2018 and 2017 was attributable to securities purchased for loss mitigation and other risk management purposes and change in foreign exchange rates. |
| |
| (3) | Includes foreign currency gains (losses) of $(15) million, $1 million and $18 million for 2019, 2018 and 2017, respectively. |
The proceeds from sales of fixed-maturity securities classified as available-for-sale were $1,805 million, $1,180 million and $1,701 million for the years ended December 31, 2019, 2018 and 2017, respectively.
The Company recorded a gain on change in fair value of equity securities in other income of $27 million for the year ended December 31, 2018, which includes a gain of $31 million related to the Company's minority interest in the parent company of TMC Bonds LLC, which it sold in 2018. The loss on change in fair value of equity securities for the year ended December 31, 2019 was de minimis.
The following table presents the roll-forward of the credit losses on fixed-maturity securities for which the Company has recognized an OTTI and for which unrealized loss was recognized in OCI.
Roll Forward of Credit Losses
in the Investment Portfolio
|
| | | | | | | | | | | |
| | Year Ended December 31, |
| | 2019 | | 2018 | | 2017 |
| | (in millions) |
| Balance, beginning of period | $ | 185 |
| | $ | 162 |
| | $ | 134 |
|
| Additions for credit losses on securities for which an OTTI was not previously recognized | — |
| | — |
| | 13 |
|
| Reductions for securities sold and other settlements | (15 | ) | | — |
| | (4 | ) |
| Additions for credit losses on securities for which an OTTI was previously recognized | 16 |
| | 23 |
| | 19 |
|
| Balance, end of period | $ | 186 |
| | $ | 185 |
| | $ | 162 |
|
Investment Portfolio
As of December 31, 2019, the majority of the investment portfolio is managed by 6 outside managers (including Wasmer, Schroeder & Company LLC, in which the Company has a minority interest). The Company has established detailed guidelines regarding credit quality, exposure to a particular sector and exposure to a particular obligor within a sector. The managed portfolio must maintain a minimum average rating of A+ by S&P or A1 by Moody's.
The investment portfolio tables shown below include assets managed both externally and internally. The internally managed portfolio primarily consists of the Company's investments in securities for (i) loss mitigation purposes, (ii) other risk management purposes and (iii) other alternative investments that the Company believes present an attractive investment opportunity.
One of the Company's strategies for mitigating losses has been to purchase loss mitigation securities, at discounted prices. The Company also holds other invested assets that were obtained or purchased as part of negotiated settlements with insured counterparties or under the terms of the financial guaranties (other risk management assets).
Alternative investments include investing in both equity and debt securities. The Company has made minority investments in investment managers as part of its strategy of participating in that market and has also made other unrelated investments that it believes present attractive investment opportunities. In February 2017, the Company agreed to purchase up to $100 million of limited partnership interests in a fund that invests in the equity of private equity managers of which $86 million of the commitment was not funded as of December 31, 2019. In December 2019, the Company invested in a limited liability company that owns fuel cells.
The insurance subsidiaries currently intend to invest $500 million in Assured Investment Management funds plus additional amounts in other accounts managed by Assured Investment Management. As of December 31, 2019, the Insurance segment had committed capital to the 3 consolidated Assured Investment Management funds, of which $79 million has been drawn and invested by the respective Assured Investment Management funds and $114 million on the commitment remained outstanding. See Note 14. Variable Interest Entities. As of December 31, 2019, the uninvested portion is reflected in short-term investments in the table below.
Investment Portfolio
Carrying Value
|
| | | | | | | |
| | As of December 31, |
| | 2019 | | 2018 |
| | (in millions) |
| Fixed-maturity securities (1): | | | |
| Externally managed | $ | 7,978 |
| | $ | 8,909 |
|
| Internally managed | 876 |
| | 1,180 |
|
| Short-term investments | 1,268 |
| | 729 |
|
| Other invested assets-internally managed | | | |
| Equity method investments | 111 |
| | 47 |
|
| Other | 7 |
| | 8 |
|
| Total | $ | 10,240 |
| | $ | 10,873 |
|
____________________
| |
| (1) | 8.6% and 10.8% of fixed-maturity securities are rated BIG as of December 31, 2019 and December 31, 2018, respectively. |
Fixed-Maturity Securities and Short-Term Investments
by Security Type
As of December 31, 2019
|
| | | | | | | | | | | | | | | | | | | | | | | | | |
| Security Type | | Percent of Total(1) | | Amortized Cost | | Gross Unrealized Gains | | Gross Unrealized Losses | | Estimated Fair Value | | AOCI (2)
Pre-tax Gain
(Loss) on
Securities
with
OTTI | | Weighted Average Credit Rating (3) |
| | | (dollars in millions) |
| Fixed-maturity securities: | | |
| | |
| | |
| | |
| | |
| | |
| | |
| Obligations of state and political subdivisions | | 42 | % | | $ | 4,036 |
| | $ | 305 |
| | $ | (1 | ) | | $ | 4,340 |
| | $ | 40 |
| | AA- |
| U.S. government and agencies | | 1 |
| | 137 |
| | 10 |
| | — |
| | 147 |
| | — |
| | AA+ |
| Corporate securities | | 23 |
| | 2,137 |
| | 103 |
| | (19 | ) | | 2,221 |
| | (8 | ) | | A |
| Mortgage-backed securities(4): | | — |
| | | | | | |
| | | | |
| | |
| RMBS | | 8 |
| | 745 |
| | 37 |
| | (7 | ) | | 775 |
| | 8 |
| | A- |
| CMBS | | 4 |
| | 402 |
| | 17 |
| | — |
| | 419 |
| | — |
| | AAA |
| Asset-backed securities | | 7 |
| | 684 |
| | 38 |
| | (2 | ) | | 720 |
| | 16 |
| | BB+ |
| Non-U.S. government securities | | 2 |
| | 230 |
| | 7 |
| | (5 | ) | | 232 |
| | 3 |
| | AA |
| Total fixed-maturity securities | | 87 |
| | 8,371 |
| | 517 |
| | (34 | ) | | 8,854 |
| | 59 |
| | A+ |
| Short-term investments | | 13 |
| | 1,268 |
| | — |
| | — |
| | 1,268 |
| | — |
| | AAA |
| Total investment portfolio | | 100 | % | | $ | 9,639 |
| | $ | 517 |
| | $ | (34 | ) | | $ | 10,122 |
| | $ | 59 |
| | AA- |
Fixed-Maturity Securities and Short-Term Investments
by Security Type
As of December 31, 2018
|
| | | | | | | | | | | | | | | | | | | | | | | | | |
| Security Type | | Percent of Total(1) | | Amortized Cost | | Gross Unrealized Gains | | Gross Unrealized Losses | | Estimated Fair Value | | AOCI
Pre-tax Gain
(Loss) on
Securities
with
OTTI | | Weighted Average Credit Rating (3) |
| | | (dollars in millions) |
| Fixed-maturity securities: | | |
| | |
| | |
| | |
| | |
| | |
| | |
| Obligations of state and political subdivisions | | 45 | % | | $ | 4,761 |
| | $ | 168 |
| | $ | (18 | ) | | $ | 4,911 |
| | $ | 40 |
| | AA- |
| U.S. government and agencies | | 2 |
| | 167 |
| | 9 |
| | (1 | ) | | 175 |
| | — |
| | AA+ |
| Corporate securities | | 20 |
| | 2,175 |
| | 13 |
| | (52 | ) | | 2,136 |
| | (4 | ) | | A |
| Mortgage-backed securities(4): | | |
| | |
| | |
| | |
| | |
| | |
| | |
| RMBS | | 9 |
| | 999 |
| | 17 |
| | (34 | ) | | 982 |
| | (15 | ) | | A- |
| CMBS | | 5 |
| | 542 |
| | 4 |
| | (7 | ) | | 539 |
| | — |
| | AAA |
| Asset-backed securities | | 9 |
| | 942 |
| | 131 |
| | (5 | ) | | 1,068 |
| | 97 |
| | BB |
| Non-U.S. government securities | | 3 |
| | 298 |
| | 2 |
| | (22 | ) | | 278 |
| | — |
| | AA |
| Total fixed-maturity securities | | 93 |
| | 9,884 |
| | 344 |
| | (139 | ) | | 10,089 |
| | 118 |
| | A+ |
| Short-term investments | | 7 |
| | 729 |
| | — |
| | — |
| | 729 |
| | — |
| | AAA |
| Total investment portfolio | | 100 | % | | $ | 10,613 |
| | $ | 344 |
| | $ | (139 | ) | | $ | 10,818 |
| | $ | 118 |
| | A+ |
____________________
| |
| (1) | Based on amortized cost. |
| |
| (2) | Accumulated OCI (AOCI). |
| |
| (3) | Ratings represent the lower of the Moody’s and S&P classifications, except for bonds purchased for loss mitigation or risk management strategies, which use internal ratings classifications. The Company’s portfolio primarily consists of high-quality, liquid instruments. |
| |
| (4) | U.S. government-agency obligations were approximately 42% of mortgage backed securities as of December 31, 2019 and 48% as of December 31, 2018, based on fair value. |
The Company’s investment portfolio in tax-exempt and taxable municipal securities includes issuances by a wide number of municipal authorities across the U.S. and its territories.
The following tables present the fair value of the Company’s available-for-sale portfolio of obligations of state and political subdivisions as of December 31, 2019 and December 31, 2018 by state.
Fair Value of Available-for-Sale Portfolio of
Obligations of State and Political Subdivisions
As of December 31, 2019 (1)
|
| | | | | | | | | | | | | | | | | | | | | | |
| State | | State General Obligation | | Local General Obligation | | Revenue Bonds | | Total Fair Value | | Amortized Cost | | Average Credit Rating |
| | | (in millions) |
| California | | 68 |
| | 70 |
| | 380 |
| | $ | 518 |
| | 457 |
| | A |
| New York | | $ | 6 |
| | $ | 46 |
| | $ | 408 |
| | $ | 460 |
| | $ | 431 |
| | AA |
| Texas | | 23 |
| | 122 |
| | 287 |
| | 432 |
| | 404 |
| | AA |
| Washington | | 52 |
| | 69 |
| | 181 |
| | 302 |
| | 284 |
| | AA |
| Florida | | 8 |
| | 3 |
| | 233 |
| | 244 |
| | 229 |
| | A+ |
| Illinois | | 18 |
| | 53 |
| | 125 |
| | 196 |
| | 182 |
| | A |
| Massachusetts | | 71 |
| | — |
| | 115 |
| | 186 |
| | 171 |
| | AA |
| Pennsylvania | | 38 |
| | 4 |
| | 95 |
| | 137 |
| | 128 |
| | A+ |
| Georgia | | 11 |
| | 10 |
| | 92 |
| | 113 |
| | 104 |
| | AA- |
| District of Columbia | | 30 |
| | — |
| | 69 |
| | 99 |
| | 94 |
| | AA |
| All others | | 71 |
| | 172 |
| | 915 |
| | 1,158 |
| | 1,080 |
| | AA- |
| Total | | $ | 396 |
| | $ | 549 |
| | $ | 2,900 |
| | $ | 3,845 |
| | $ | 3,564 |
| | AA- |
Fair Value of Available-for-Sale Portfolio of
Obligations of State and Political Subdivisions
As of December 31, 2018 (1)
|
| | | | | | | | | | | | | | | | | | | | | | |
| State | | State General Obligation | | Local General Obligation | | Revenue Bonds | | Total Fair Value | | Amortized Cost | | Average Credit Rating |
| | | (in millions) |
| New York | | $ | 5 |
| | $ | 49 |
| | $ | 492 |
| | $ | 546 |
| | $ | 536 |
| | AA |
| Texas | | 19 |
| | 170 |
| | 344 |
| | 533 |
| | 520 |
| | AA |
| California | | 63 |
| | 77 |
| | 378 |
| | 518 |
| | 482 |
| | A |
| Washington | | 80 |
| | 81 |
| | 193 |
| | 354 |
| | 349 |
| | AA |
| Florida | | 8 |
| | 13 |
| | 220 |
| | 241 |
| | 236 |
| | A+ |
| Massachusetts | | 75 |
| | — |
| | 144 |
| | 219 |
| | 211 |
| | AA |
| Illinois | | 16 |
| | 55 |
| | 127 |
| | 198 |
| | 192 |
| | A |
| Pennsylvania | | 35 |
| | 5 |
| | 98 |
| | 138 |
| | 136 |
| | A+ |
| District of Columbia | | 41 |
| | — |
| | 92 |
| | 133 |
| | 131 |
| | AA |
| Georgia | | 10 |
| | 10 |
| | 94 |
| | 114 |
| | 110 |
| | AA- |
| All others | | 96 |
| | 210 |
| | 1,103 |
| | 1,409 |
| | 1,369 |
| | AA- |
| Total | | $ | 448 |
| | $ | 670 |
| | $ | 3,285 |
| | $ | 4,403 |
| | $ | 4,272 |
| | AA- |
____________________
| |
| (1) | Excludes $495 million and $508 million as of December 31, 2019 and 2018, respectively, of pre-refunded bonds, at fair value. The credit ratings are based on the underlying ratings and do not include any benefit from bond insurance. |
The revenue bond portfolio primarily consists of essential service revenue bonds issued by transportation authorities and other utilities, water and sewer authorities and universities.
Revenue Bonds
Sources of Funds
|
| | | | | | | | | | | | | | | | |
| | | As of December 31, 2019 | | As of December 31, 2018 |
| Type | | Fair Value | | Amortized Cost | | Fair Value | | Amortized Cost |
| | | (in millions) |
| Transportation | | $ | 916 |
| | $ | 835 |
| | $ | 967 |
| | $ | 925 |
|
| Higher education | | 488 |
| | 456 |
| | 557 |
| | 543 |
|
| Water and sewer | | 453 |
| | 422 |
| | 580 |
| | 566 |
|
| Tax backed | | 426 |
| | 397 |
| | 471 |
| | 458 |
|
| Healthcare | | 236 |
| | 220 |
| | 278 |
| | 270 |
|
| Municipal utilities | | 234 |
| | 212 |
| | 287 |
| | 267 |
|
| All others | | 147 |
| | 137 |
| | 145 |
| | 143 |
|
| Total | | $ | 2,900 |
| | $ | 2,679 |
| | $ | 3,285 |
| | $ | 3,172 |
|
The following tables summarize, for all fixed-maturity securities in an unrealized loss position, the aggregate fair value and gross unrealized loss by length of time the amounts have continuously been in an unrealized loss position.
Fixed-Maturity Securities
Gross Unrealized Loss by Length of Time
As of December 31, 2019
|
| | | | | | | | | | | | | | | | | | | | | | | |
| | Less than 12 months | | 12 months or more | | Total |
| | Fair Value | | Unrealized Loss | | Fair Value | | Unrealized Loss | | Fair Value | | Unrealized Loss |
| | (dollars in millions) |
| Obligations of state and political subdivisions | $ | 45 |
| | $ | (1 | ) | | $ | — |
| | $ | — |
| | $ | 45 |
| | $ | (1 | ) |
| U.S. government and agencies | 5 |
| | — |
| | 5 |
| | — |
| | 10 |
| | — |
|
| Corporate securities | 61 |
| | — |
| | 119 |
| | (19 | ) | | 180 |
| | (19 | ) |
| Mortgage-backed securities: | | | | | | | |
| |
|
| |
|
|
| RMBS | 10 |
| | — |
| | 75 |
| | (7 | ) | | 85 |
| | (7 | ) |
| CMBS | — |
| | — |
| | 4 |
| | — |
| | 4 |
| | — |
|
| Asset-backed securities | 24 |
| | — |
| | 183 |
| | (2 | ) | | 207 |
| | (2 | ) |
| Non-U.S. government securities | — |
| | — |
| | 56 |
| | (5 | ) | | 56 |
| | (5 | ) |
| Total | $ | 145 |
| | $ | (1 | ) | | $ | 442 |
| | $ | (33 | ) | | $ | 587 |
| | $ | (34 | ) |
| Number of securities | |
| | 57 |
| | |
| | 119 |
| | |
| | 176 |
|
| Number of securities with OTTI | |
| | 1 |
| | |
| | 7 |
| | |
| | 8 |
|
Fixed-Maturity Securities
Gross Unrealized Loss by Length of Time
As of December 31, 2018
|
| | | | | | | | | | | | | | | | | | | | | | | |
| | Less than 12 months | | 12 months or more | | Total |
| | Fair Value | | Unrealized Loss | | Fair Value | | Unrealized Loss | | Fair Value | | Unrealized Loss |
| | (dollars in millions) |
| Obligations of state and political subdivisions | $ | 195 |
| | $ | (4 | ) | | $ | 658 |
| | $ | (14 | ) | | $ | 853 |
| | $ | (18 | ) |
| U.S. government and agencies | 11 |
| | — |
| | 24 |
| | (1 | ) | | 35 |
| | (1 | ) |
| Corporate securities | 836 |
| | (19 | ) | | 522 |
| | (33 | ) | | 1,358 |
| | (52 | ) |
| Mortgage-backed securities: | |
| | |
| | |
| | |
| | | | |
| RMBS | 85 |
| | (2 | ) | | 447 |
| | (32 | ) | | 532 |
| | (34 | ) |
| CMBS | 111 |
| | (1 | ) | | 164 |
| | (6 | ) | | 275 |
| | (7 | ) |
| Asset-backed securities | 322 |
| | (4 | ) | | 38 |
| | (1 | ) | | 360 |
| | (5 | ) |
| Non-U.S. government securities | 83 |
| | (4 | ) | | 99 |
| | (18 | ) | | 182 |
| | (22 | ) |
| Total | $ | 1,643 |
| | $ | (34 | ) | | $ | 1,952 |
| | $ | (105 | ) | | $ | 3,595 |
| | $ | (139 | ) |
| Number of securities (1) | |
| | 417 |
| | |
| | 608 |
| | |
| | 997 |
|
| Number of securities with OTTI (1) | |
| | 22 |
| | |
| | 22 |
| | |
| | 42 |
|
___________________
| |
| (1) | The number of securities does not add across because lots consisting of the same securities have been purchased at different times and appear in both categories above (i.e., less than 12 months and 12 months or more). If a security appears in both categories, it is counted only once in the total column. |
Of the securities in an unrealized loss position for 12 months or more as of December 31, 2019 and December 31, 2018, 19 and 38 securities, respectively, had unrealized losses greater than 10% of book value. The total unrealized loss for these securities was $25 million as of December 31, 2019 and $43 million as of December 31, 2018. The Company considered the credit quality, cash flows, interest rate movements, ability to hold a security to recovery and intent to sell a security in determining whether a security had a credit loss. The Company has determined that the unrealized losses recorded as of December 31, 2019 and December 31, 2018 were not related to credit quality.
The amortized cost and estimated fair value of available-for-sale fixed-maturity securities by contractual maturity as of December 31, 2019 are shown below. Expected maturities will differ from contractual maturities because borrowers may have the right to call or prepay obligations with or without call or prepayment penalties.
Distribution of Fixed-Maturity Securities
by Contractual Maturity
As of December 31, 2019
|
| | | | | | | |
| | Amortized Cost | | Estimated Fair Value |
| | (in millions) |
| Due within one year | $ | 326 |
| | $ | 334 |
|
| Due after one year through five years | 1,538 |
| | 1,591 |
|
| Due after five years through 10 years | 2,022 |
| | 2,128 |
|
| Due after 10 years | 3,338 |
| | 3,607 |
|
| Mortgage-backed securities: | |
| | |
|
| RMBS | 745 |
| | 775 |
|
| CMBS | 402 |
| | 419 |
|
| Total | $ | 8,371 |
| | $ | 8,854 |
|
Based on fair value, investments and restricted assets that are either held in trust for the benefit of third party ceding insurers in accordance with statutory requirements, placed on deposit to fulfill state licensing requirements, or otherwise pledged or restricted totaled $280 million and $266 million, as of December 31, 2019 and December 31, 2018, respectively. The investment portfolio also contains securities that are held in trust by certain AGL subsidiaries or otherwise restricted for the benefit of other AGL subsidiaries in accordance with statutory and regulatory requirements in the amount of $1,502 million and $1,855 million, based on fair value as of December 31, 2019 and December 31, 2018, respectively.
No material investments of the Company were non-income producing for years ended December 31, 2019 and 2018, respectively.
| |
| 11. | Contracts Accounted for as Credit Derivatives |
The Company has a portfolio of financial guaranty contracts that meet the definition of a derivative in accordance with GAAP (primarily CDS). The credit derivative portfolio also includes interest rate swaps.
Credit derivative transactions are governed by International Swaps and Derivatives Association, Inc. documentation and have certain characteristics that differ from financial guaranty insurance contracts. For example, the Company’s control rights with respect to a reference obligation under a credit derivative may be more limited than when the Company issues a financial guaranty insurance contract. In addition, there are more circumstances under which the Company may be obligated to make payments. Similar to a financial guaranty insurance contract, the Company would be obligated to pay if the obligor failed to make a scheduled payment of principal or interest in full. However, the Company may also be required to pay if the obligor becomes bankrupt or if the reference obligation were restructured if, after negotiation, those credit events are specified in the documentation for the credit derivative transactions. Furthermore, the Company may be required to make a payment due to an event that is unrelated to the performance of the obligation referenced in the credit derivative. If events of default or termination events specified in the credit derivative documentation were to occur, the non-defaulting or the non-affected party, which may be either the Company or the counterparty, depending upon the circumstances, may decide to terminate a credit derivative prior to maturity. In that case, the Company may be required to make a termination payment to its swap counterparty upon such termination. Absent such an event of default or termination event, the Company may not unilaterally terminate a CDS contract; however, the Company on occasion has mutually agreed with various counterparties to terminate certain CDS transactions.
Accounting Policy
Credit derivatives are recorded at fair value. Changes in fair value are recorded in “net change in fair value of credit derivatives” on the consolidated statement of operations. The fair value of credit derivatives is reflected as either net assets or net liabilities determined on a junior subordinated basis.contract by contract basis in the Company's consolidated balance sheets. See Note 9, Fair Value Measurement, for a discussion on the fair value methodology for credit derivatives.
Credit Derivative Net Par Outstanding by Sector
The components of the Company’s credit derivative net par outstanding are presented in the table below. The estimated remaining weighted average life of credit derivatives was 11.5 years and 11.6 years as of at December 31, 2019 and December 31, 2018, respectively.
Debt Issued by AGUSCredit Derivatives (1)
7% Senior Notes. On May 18, 2004, AGUS issued $200 |
| | | | | | | | | | | | | | | | |
| | | As of December 31, 2019 | | As of December 31, 2018 (2) |
| | | Net Par Outstanding | | Net Fair Value Asset (Liability) | | Net Par Outstanding | | Net Fair Value Asset (Liability) |
| | | (in millions) |
| | | | | | | | | |
| U.S public finance | | $ | 1,942 |
| | $ | (83 | ) | | $ | 1,783 |
| | $ | (65 | ) |
| Non-U.S public finance | | 2,676 |
| | (39 | ) | | 2,807 |
| | (51 | ) |
| U.S structured finance | | 1,206 |
| | (58 | ) | | 1,465 |
| | (85 | ) |
| Non-U.S structured finance | | 132 |
| | (5 | ) | | 127 |
| | (6 | ) |
| Total | | $ | 5,956 |
| | $ | (185 | ) | | $ | 6,182 |
| | $ | (207 | ) |
____________________
(1) Expected recoveries were $4 million as of 7% Senior NotesDecember 31, 2019 and $2 million as of December 31, 2018.
| |
| (2) | Prior year presentation has been conformed to the current year's presentation. |
Distribution of Credit Derivative Net Par Outstanding by Internal Rating
|
| | | | | | | | | | | | | | |
| | | As of December 31, 2019 | | As of December 31, 2018 |
| Ratings | | Net Par Outstanding | | % of Total | | Net Par Outstanding | | % of Total |
| | | (dollars in millions) |
| AAA | | $ | 1,730 |
| | 29.0 | % | | $ | 1,813 |
| | 29.4 | % |
| AA | | 1,695 |
| | 28.5 |
| | 1,690 |
| | 27.3 |
|
| A | | 1,110 |
| | 18.6 |
| | 1,171 |
| | 18.9 |
|
| BBB | | 1,292 |
| | 21.7 |
| | 1,351 |
| | 21.9 |
|
| BIG (1) | | 129 |
| | 2.2 |
| | 157 |
| | 2.5 |
|
| Credit derivative net par outstanding | | $ | 5,956 |
| | 100.0 | % | | $ | 6,182 |
| | 100.0 | % |
____________________
| |
| (1) | All BIG credit derivatives are U.S. RMBS transactions. |
Fair Value of Credit Derivatives
Net Change in Fair Value of Credit Derivative Gains (Losses)
|
| | | | | | | | | | | |
| | Year Ended December 31, |
| | 2019 | | 2018 | | 2017 |
| | (in millions) |
| Realized gains on credit derivatives | $ | 8 |
| | $ | 9 |
| | $ | 17 |
|
| Net credit derivative losses (paid and payable) recovered and recoverable and other settlements | (35 | ) | | (25 | ) | | (27 | ) |
| Realized gains (losses) and other settlements | (27 | ) | | (16 | ) | | (10 | ) |
| Net unrealized gains (losses) | 21 |
| | 128 |
| | 121 |
|
| Net change in fair value of credit derivatives | $ | (6 | ) | | $ | 112 |
| | $ | 111 |
|
Realized losses and other settlements for 2019 were primarily due 2034 (7% Senior Notes)to payments related to various U.S. structured finance transactions, including those for net proceedsa final maturity paydown and for which there was an offsetting unrealized gain. Realized losses and other settlements for 2018 and 2017 were primarily due to a paydown of $197 million. Although the coupona U.S. structured finance transaction, for which there was an offsetting unrealized gain.
During 2019, non-credit impairment fair value gains were generated primarily as a result of price improvements on the Senior Notesunderlying collateral of the Company's CDS. These unrealized fair value gains were partially offset by unrealized fair value losses resulting from wider implied net spreads driven by the decreased market cost to buy protection in AGC’s name during the period. For those CDS transactions that were pricing at or above their floor levels, when the cost of purchasing CDS protection on AGC, which management refers to as the CDS spread on AGC, decreased, the implied spreads that the Company would expect to receive on these transactions increased.
During 2018, non-credit impairment fair value gains were primarily generated by CDS terminations, run-off of CDS par and price improvements on the underlying collateral of the Company’s CDS. In addition, unrealized fair value gains were generated by the increase in credit given to the primary insurer on one of the Company's second-to-pay CDS policies during the period. The unrealized fair value gains were partially offset by unrealized fair value losses resulting from wider implied net spreads driven by the decreased cost to buy protection in AGC’s name, as the market cost of AGC’s credit protection decreased during the period.
During 2017, non-credit impairment fair value gains were primarily generated by CDS terminations, run-off of net par outstanding, and price improvements on the underlying collateral of the Company’s CDS. The majority of the CDS transactions that were terminated were as a result of settlement agreements with several CDS counterparties. During 2017, the cost to buy protection in AGC’s name, specifically the five-year CDS spread, did not change materially during the period, and therefore did not have a material impact on the Company’s unrealized fair value gains and losses on CDS.
The impact of changes in credit spreads will vary based upon the volume, tenor, interest rates, and other market conditions at the time these fair values are determined. In addition, since each transaction has unique collateral and structural terms, the underlying change in fair value of each transaction may vary considerably. The fair value of credit derivative contracts also reflects the change in the Company’s own credit cost based on the price to purchase credit protection on AGC. The Company determines its own credit risk based on quoted CDS prices traded on the Company at each balance sheet date.
CDS Spread on AGC (in bps)
|
| | | | | | | | |
| | As of
December 31, 2019 | | As of
December 31, 2018 | | As of
December 31, 2017 |
| Five-year CDS spread | 41 |
| | 110 |
| | 163 |
|
| One-year CDS spread | 9 |
| | 22 |
| | 70 |
|
Fair Value of Credit Derivative Assets (Liabilities)
and Effect of AGC
Credit Spread
|
| | | | | | | |
| | As of
December 31, 2019 | | As of
December 31, 2018 |
| | (in millions) |
| Fair value of credit derivatives before effect of AGC credit spread | $ | (261 | ) | | $ | (407 | ) |
| Plus: Effect of AGC credit spread | 76 |
| | 200 |
|
| Net fair value of credit derivatives | $ | (185 | ) | | $ | (207 | ) |
The fair value of CDS contracts at December 31, 2019, before considering the benefit applicable to AGC’s credit spreads, is 7%,a direct result of the effective rate is approximately 6.4%, taking into accountrelatively wide credit spreads of certain underlying credits generally due to the effectlong tenor of a cash flow hedge executedthese credits.
Collateral Posting for Certain Credit Derivative Contracts
The transaction documentation with 1 counterparty for $180 million in CDS net par insured by the Company in March 2004.requires the Company to post collateral, subject to a $180 million cap, to secure its obligation to make payments under such contracts. Eligible collateral is generally cash or U.S. government or agency securities; eligible collateral other than cash is valued at a discount to the face amount. As of December 31, 2019, AGC did not have to post collateral to satisfy these requirements.
5% Senior Notes. On June 20, 2014, AGUS issued $500
Accounting Policy
In connection with the BlueMountain Acquisition, the FASB's new revenue recognition guidance, Topic 606 Revenue from Contracts with Customers (ASC 606), is applicable to the Company. Management, CLO and performance fees earned by Assured Investment Management are accounted for as contracts with customers. Under the guidance for contracts with customers, an entity is required to (a) identify the contract(s) with a customer, (b) identify the performance obligations in the contract, (c) determine the transaction price, (d) allocate the transaction price to the performance obligations in the contract, and (e) recognize revenue when (or as) the entity satisfies a performance obligation. In determining the transaction price, an entity may include variable consideration only to the extent that it is probable that a significant reversal in the amount of cumulative revenue recognized would not occur when the uncertainty associated with the variable consideration is resolved.
Management and CLO fees are derived from providing professional services to manage investment funds and CLOs. Investment management services are satisfied over time as the services are provided and are typically based on a percentage of the value of the client’s assets under management. Performance fee revenue will fluctuate from period to period and may not correlate with general market changes, since most of these fees are driven by absolute performance. Performance fee revenues are generated on certain management contracts when performance hurdles are achieved. Such fee revenues are recorded when the contractual performance criteria have been met and when it is probable that a significant reversal of revenue recognized will not occur in future reporting periods. Given the uniqueness of each fee arrangement, performance fee contracts are evaluated on an individual basis to determine the timing of revenue recognition.
Asset Management Fees
Management and CLO Fees
The Company receives a management fee in exchange for providing investment advisory and management services. These annual management fees are generally as follows.
Fees range from 0.70% to 2.00% per annum calculated on either the beginning of the month or quarter, or month-end NAV of the respective funds.
For the Company's management or servicing of the Assured Investment Management CLOs the Company receives, generally 0.35% to 0.50% (combined senior investment management fee and subordinated investment management fee) per annum based on NAV, and 20% per annum of the remaining interest proceeds and principal proceeds after the incentive management fee threshold has been satisfied. The portion of these fees that pertains to the investment by Assured Investment Management funds is typically rebated to the Assured Investment Management funds.
The Company may waive some or the entire management fee with respect to any investor. Certain current and former employees of the Company who have investments in the Assured Investment Management funds are not charged any management fees.
Performance Fees
In accordance with the investment management agreements, and by serving as the general partner, managing member or managing general partner, the Company also receives performance fees. Annual performance fee rates are generally as follows:
Range from 10% to 20% of the net profits in excess of the high-water mark for the respective fund, or
Range from 18% to 30% of the total cash received by investors in excess of certain benchmarks, or
30% of the net profits in excess of the high-water mark and a credit for management fees
Performance fees related to certain Assured Investment Management funds may be subject to future clawback and repayment. Determining the amount of performance fees to record is subject to qualitative and quantitative factors including where the fund is in its life-cycle, whether the Company has received or is entitled to receive performance fees and potential sales of fund investments. To the extent that performance fees have been received, but not earned, the company will recognize a liability for unearned revenue in the consolidated balance sheets. The general partner has the right, in its sole discretion, to
require certain Assured Investment Management funds to distribute to the general partner an amount equal to its presumed tax liability attributable to the allocated taxable income relating to performance fees with respect to such fiscal year and are contractually not subject to clawback. There were no tax distributions recorded during 2019.
The Company may waive some or all of the performance fees with respect to any investor. Certain current and former employees of the Company who have investments in the Assured Investment Management funds are not charged any performance fees.
The following table presents the sources of asset management fees since the BlueMountain Acquisition Date:
Asset Management Fees
|
| | | |
| | Year Ended
December 31, 2019 |
| | (in millions) |
| Management fees: | |
| CLOs (1) | $ | 3 |
|
| Opportunity funds | 2 |
|
| Wind-down funds | 13 |
|
| Total management fees | 18 |
|
| Performance fees | 4 |
|
| Total asset management fees | $ | 22 |
|
_____________________
| |
| (1) | Gross management fees from CLOs, before rebates were $11 million. |
The Company had management and performance fees receivable, which are included in other assets on the consolidated balance sheets, of $9 million as of 5% Senior Notes due 2024 (5% Senior Notes)December 31, 2019. The Company had 0 unearned revenues as of December 31, 2019.
| |
| 13. | Goodwill and Other Intangible Assets |
Accounting Policy
Goodwill is attributable to the BlueMountain Acquisition in the Asset Management segment and represents the excess cost over identifiable net assets of an acquired business. The Company tests goodwill annually for net proceedsimpairment or more frequently if circumstances indicate an impairment may have occurred. The goodwill impairment analysis is performed at the reporting unit level which is equal to the Company's operating segment level. If, after assessing qualitative factors, the Company believes that it is more likely than not that the fair value of $495 million. the reporting unit is less than its carrying amount, the Company will evaluate impairment quantitatively to determine and record the amount of goodwill impairment as the excess of the carrying amount of the reporting unit over its fair value. Inherent in such fair value determinations are certain judgments and estimates relating to future cash flows, including the Company’s interpretation of current economic indicators and market valuations, and assumptions about the Company’s strategic plans with regard to its operations. Due to the uncertainties associated with such estimates, actual results could differ from such estimates.
The notes are guaranteed by AGL. The net proceedsCompany's finite-lived intangible assets consist primarily of contractual rights to earn future asset management fees from the sale of the notes were used for general corporate purposes, including the purchase of AGL common shares.
Series A Enhanced Junior Subordinated Debentures. On December 20, 2006, AGUS issued $150 million of the Debentures due 2066. The Debentures payacquired management and CLO contracts as well as a fixed 6.4% rate of interest until December 15, 2016, and thereafter pay a floating rate of interest, reset quarterly,CLO distribution network. Such finite-lived intangible assets are recorded at a rate equal to three month LIBOR plus a margin equal to 2.38%. AGUS may select at one or more times to defer payment of interest for one or more consecutive periods for up to ten years. Any unpaid interest bears interest at the then applicable rate. AGUS may not defer interest past the maturity date.
Debt Issued by AGMH
6 7/8% QUIBS. On December 19, 2001, AGMH issued $100 million face amount of 6 7/8% QUIBS due December 15, 2101, which are callable without premium or penalty.
6.25% Notes. On November 26, 2002, AGMH issued $230 million face amount of 6.25% Notes due November 1, 2102, which are callable without premium or penalty in whole or in part.
5.6% Notes. On July 31, 2003, AGMH issued $100 million face amount of 5.6% Notes due July 15, 2103, which are callable without premium or penalty in whole or in part.
Junior Subordinated Debentures. On November 22, 2006, AGMH issued $300 million face amount of Junior Subordinated Debentures with a scheduled maturity date of December 15, 2036 and a final repayment date of December 15, 2066. The final repayment date of December 15, 2066 may be automatically extended up to four times in five-year increments provided certain conditions are met. The debentures are redeemable, in whole or in part, at any time prior to December 15, 2036 at their principal amount plus accrued and unpaid interest tofair value on the date of redemptionacquisition and amortized over their estimated useful lives.
The Company tests finite‑lived intangible assets for impairment if certain events occur or if greater,circumstances change indicating that the make-whole redemption price. Interest on the debentures will accrue from November 22, 2006 to December 15, 2036 at the annual rate of 6.4%. If anycarrying amount of the debentures remains outstanding afterintangible asset may not be recoverable. The Company evaluates impairment by comparing the estimated fair value attributable to the intangible asset being evaluated with its carrying amount. If an impairment is determined to exist by management, the Company accelerates amortization expense so that the carrying amount represents fair value.
The Company's indefinite-lived intangible assets consist of the value of insurance licenses acquired in prior business combinations. The Company assesses indefinite-lived intangible assets for impairment annually or more frequently if
circumstances indicate an impairment may have occurred. If a qualitative assessment reveals that it is more-likely-than-not that the asset is impaired, the Company calculates an updated fair value.
The following table summarizes the carrying value for the Company's goodwill and other intangible assets:
Goodwill and Other Intangible Assets
|
| | | | | | | | | |
| | Weighted Average Amortization Period as of | | As of December 31 |
| | December 31, 2019 | | 2019 | | 2018 |
| | | | (in millions) |
| Goodwill (1) | | | $ | 117 |
| | $ | — |
|
| Finite-lived intangible assets: | | | | | |
| CLO contracts | 8.8 years | | 42 |
| | — |
|
| Investment management contracts | 4.5 years | | 24 |
| | — |
|
| CLO distribution network | 4.8 years | | 9 |
| | — |
|
| Trade name | 9.8 years | | 3 |
| | — |
|
| Favorable sublease | 4.2 years | | 1 |
| | — |
|
| Lease-related intangibles | 7.0 years | | 3 |
| | 3 |
|
| Finite-lived intangible assets, gross | 7.0 years | | 82 |
| | 3 |
|
| Accumulated amortization | | | (5 | ) | | (1 | ) |
| Finite-lived intangible assets, net | | | 77 |
| | 2 |
|
| Licenses (indefinite-lived) | | | 22 |
| | 22 |
|
| Total goodwill and other intangible assets | | | $ | 216 |
| | $ | 24 |
|
_____________________
| |
| (1) | Includes goodwill allocated to the European subsidiaries of BlueMountain. The balance changes due to foreign currency translation. The amount of goodwill deductible for tax purposes was approximately $115 million as of December 31, 2019. |
Goodwill and substantially all finite-lived intangible assets relate to the Company’s acquisition of BlueMountain on October 1, 2019. To date, there have been 0 impairments of goodwill or intangible assets. Amortization expense, which is recorded in other operating expenses in the consolidated statements of operations, associated with finite-lived intangible assets was $3 million for the year ended December 15, 2036, then31, 2019, and $1 million in 2017. For 2018, amortization expense was de minimis.
As of December 31, 2019, future annual amortization of finite-lived intangible assets for the years 2020 through 2024 and thereafter is estimated to be:
Estimated Future Amortization Expense
for Finite-Lived Intangible Assets
|
| | | | |
| | | As of December 31, 2019 |
| Year | | (in millions) |
| 2020 | $ | 13 |
|
| 2021 | 12 |
|
| 2022 | 11 |
|
| 2023 | 11 |
|
| 2024 | 10 |
|
| Thereafter | 20 |
|
| Total | $ | 77 |
|
| |
| 14. | Variable Interest Entities |
Accounting Policy
The types of entities the Company assesses for consolidation principally include (1) entities whose debt obligations the insurance subsidiaries insures in its financial guaranty business, and (2) investment vehicles such as collateralized financing entities and investment funds managed by the asset management subsidiaries, in which the Company has a variable interest. For each of these types of entities, the Company assesses whether it is the primary beneficiary. If the Company concludes that it is the primary beneficiary, it consolidates the VIE in the Company's financial statements and eliminates the effects of intercompany transactions with the insurance subsidiaries and intercompany transactions between consolidated VIEs.
The Company determines whether it is the primary beneficiary of a VIE at the time it becomes involved with a VIE and continuously reconsiders the conclusion at each reporting date. In determining whether it is the primary beneficiary, the Company evaluates its direct and indirect interests in the VIE. The primary beneficiary of a VIE is the enterprise that has both 1) the power to direct the activities of a VIE that most significantly impact the entity's economic performance; and 2) the obligation to absorb losses of the entity that could potentially be significant to the VIE or the right to receive benefits from the entity that could potentially be significant to the VIE.
Financial Guaranty Variable Interest Entities
The Company provides financial guaranties with respect to debt obligations of special purpose entities, including VIEs but does not act as the servicer or collateral manager for any VIE obligations guaranteed by its insurance subsidiaries. The transaction structure generally provides certain financial protections to the Company. This financial protection can take several forms, the most common of which are overcollateralization, first loss protection (or subordination) and excess spread. In the case of overcollateralization (i.e., the principal amount of the outstanding debentures will bearsecuritized assets exceeds the principal amount of the structured finance obligations guaranteed by the Company), the structure allows defaults of the securitized assets before a default is experienced on the structured finance obligation guaranteed by the Company. In the case of first loss, the Company's financial guaranty insurance policy only covers a senior layer of losses experienced by multiple obligations issued by the VIEs. The first loss exposure with respect to the assets is either retained by the seller or sold off in the form of equity or mezzanine debt to other investors. In the case of excess spread, the financial assets contributed to VIEs, generate interest income that are in excess of the interest payments on the debt issued by the VIE. Such excess spread is typically distributed through the transaction’s cash flow waterfall and may be used to create additional credit enhancement, applied to redeem debt issued by the VIE (thereby, creating additional overcollateralization), or distributed to equity or other investors in the transaction.
Assured Guaranty is not primarily liable for the debt obligations issued by the VIEs it insures and would only be required to make payments on those insured debt obligations in the event that the issuer of such debt obligations defaults on any principal or interest due and only for the amount of the shortfall. AGL’s and its subsidiaries’ creditors do not have any rights with regard to the collateral supporting the debt issued by the FG VIEs. Proceeds from sales, maturities, prepayments and interest from such underlying collateral may only be used to pay debt service on FG VIEs’ liabilities. Net fair value gains and losses on FG VIEs are expected to reverse to 0 at maturity of the FG VIEs’ debt, except for net premiums received and net claims paid by Assured Guaranty under the financial guaranty insurance contract. The Company’s estimate of expected loss to be paid for FG VIEs is included in Note 6, Expected Loss to be Paid.
As part of the terms of its financial guaranty contracts, the Company, under its insurance contract, obtains certain protective rights with respect to the VIE that give the Company additional controls over a floatingVIE. These protective rights are triggered by the occurrence of certain events, such as failure to be in compliance with a covenant due to poor deal performance or a deterioration in a servicer or collateral manager's financial condition. At deal inception, the Company typically is not deemed to control a VIE; however, once a trigger event occurs, the Company's control of the VIE typically increases. The Company continuously evaluates its power to direct the activities that most significantly impact the economic performance of VIEs that have debt obligations insured by the Company and, accordingly, where the Company is obligated to absorb VIE losses or receive benefits that could potentially be significant to the VIE. The Company is deemed to be the control party for certain VIEs under GAAP, typically when its protective rights give it the power to both terminate and replace the deal servicer, which are characteristics specific to the Company's financial guaranty contracts. If the protective rights that could make the Company the control party have not been triggered, then the VIE is not consolidated. If the Company is deemed no longer to have those protective rights, the VIE is deconsolidated.
The FG VIEs’ liabilities that are insured by the Company are considered to be with recourse, because the Company guarantees the payment of principal and interest rate equal to one-month LIBOR plus 2.215% until repaid. AGMHregardless of the performance of the related FG VIEs’ assets. FG VIEs’
may elect at one or more timesliabilities that are not insured by the Company are considered to deferbe without recourse, because the payment of principal and interest of these liabilities is wholly dependent on the debentures for one or more consecutive interest periods thatperformance of the FG VIEs’ assets.
The Company has limited contractual rights to obtain the financial records of its consolidated FG VIEs. The FG VIEs do not exceed ten years. In connection withprepare separate GAAP financial statements; therefore, the completionCompany compiles GAAP financial information for them based on trustee reports prepared by and received from third parties. Such trustee reports are not available to the Company until approximately 30 days after the end of this offering, AGMH entered intoany given period. The time required to perform adequate reconciliations and analyses of the information in these trustee reports results in a replacement capital covenantone quarter lag in reporting the FG VIEs’ activities. The Company records the fair value of FG VIEs’ assets and liabilities based on modeled prices. The Company updates the model assumptions each reporting period for the benefitmost recent available information, which incorporates the impact of personsmaterial events that buy, hold or sell a specified seriesmay have occurred since the quarter lag date. The net change in the fair value of AGMH long-term indebtedness ranking seniorconsolidated FG VIEs’ assets and liabilities is recorded in "fair value gains (losses) on FG VIEs" in the consolidated statements of operations, except for change in fair value of FG VIEs’ liabilities with recourse caused by changes in ISCR which is now separately presented in OCI, effective January 1, 2018. The inception to date change in fair value of the FG VIEs’ liabilities with recourse attributable to the debentures.ISCR is calculated by holding all current period assumptions constant for each security and isolating the effect of the change in the Company’s CDS spread from the most recent date of consolidation to the current period. In general, if the Company’s CDS spread tightens, more value will be assigned to the Company’s credit; however, if the Company’s CDS widens, less value is assigned to the Company’s credit. Interest income and interest expense are derived from the trustee reports and also included in "fair value gains (losses) on FG VIEs." The Company has elected the fair value option for assets and liabilities classified as FG VIEs’ assets and liabilities because the carrying amount transition method was not practical.
Number of FG VIEs Consolidated
|
| | | | | | | | |
| | Year Ended December 31, |
| | 2019 | | 2018 | | 2017 |
| | |
| Beginning of year | 31 |
| | 32 |
| | 32 |
|
| Consolidated | 1 |
| | — |
| | 2 |
|
| Deconsolidated | (3 | ) | | (1 | ) | | (2 | ) |
| Matured | (2 | ) | | — |
| | — |
|
| December 31 | 27 |
| | 31 |
| | 32 |
|
The change in the ISCR of the FG VIEs’ assets held as of December 31, 2019 that was recorded in the consolidated statements of operations for 2019 was a gain of $39 million. The change in the ISCR of the FG VIEs’ assets was a gain of $7 million for 2018 and a gain of $35 million for 2017. To calculate ISCR, the change in the fair value of the FG VIEs’ assets is allocated between changes that are due to ISCR and changes due to other factors, including interest rates. The ISCR amount is determined by using expected cash flows at the original date of consolidation discounted at the effective yield less current expected cash flows discounted at that same original effective yield.
|
| | | | | | | |
| | As of
December 31, 2019 | | As of
December 31, 2018 |
| | (in millions) |
| Excess of unpaid principal over fair value of: | | | |
| FG VIEs' assets | $ | 279 |
| | $ | 350 |
|
| FG VIEs' liabilities with recourse | 21 |
| | 48 |
|
| FG VIEs' liabilities without recourse | 19 |
| | 28 |
|
| Unpaid principal balance for FG VIEs’ assets that were 90 days or more past due | 52 |
| | 71 |
|
| Unpaid principal for FG VIEs’ liabilities with recourse (1) | 388 |
| | 565 |
|
____________________
(1) FG VIEs’ liabilities with recourse will mature at various dates ranging from 2019 to 2038.
The table below shows the carrying value of the consolidated FG VIEs’ assets and liabilities in the consolidated financial statements, segregated by the types of assets that collateralize the respective debt obligations for FG VIEs’ liabilities with recourse.
Consolidated FG VIEs
By Type of Collateral
|
| | | | | | | | | | | | | | | |
| | As of December 31, 2019 | | As of December 31, 2018 |
| | Assets | | Liabilities | | Assets | | Liabilities |
| | (in millions) |
| With recourse: | |
| | |
| | |
| | |
|
| U.S. RMBS first lien | $ | 270 |
| | $ | 297 |
| | $ | 299 |
| | $ | 326 |
|
| U.S. RMBS second lien | 70 |
| | 70 |
| | 115 |
| | 137 |
|
| Manufactured housing | — |
| | — |
| | 53 |
| | 54 |
|
| Total with recourse | 340 |
| | 367 |
| | 467 |
| | 517 |
|
| Without recourse | 102 |
| | 102 |
| | 102 |
| | 102 |
|
| Total | $ | 442 |
| | $ | 469 |
| | $ | 569 |
| | $ | 619 |
|
Consolidated Investment Vehicles
Through a jointly owned subsidiary, AGM, AGC and MAC, the U.S. insurance subsidiaries, initially intend to invest $500 million in Assured Investment Management funds. In the fourth quarter of 2019, $79 million was invested in three separate Assured Investment Management funds; AHP, ABIF and CLO Warehouse Fund. As of December 31, 2019, the fair value of such investments was $77 million. CLO Warehouse Fund invested in the subordinated notes of CLO XXVI.
AHP, ABIF, CLO Warehouse Fund and CLO XXVI (collectively, the consolidated investment vehicles) are VIEs. The Company consolidates these investment vehicles as it is deemed to be the primary beneficiary based on its power to direct the most significant activities of each VIE (through its Assured Investment Management asset management subsidiaries) and its level of economic interest in the entities (through its U.S. insurance subsidiaries).
AHP and ABIF are investment companies under ASC 946, and therefore account for their underlying investments at fair value. CLO XXVI is a CFE under ASC 810. Under the covenant,ASC 810 practical expedient for CFEs, the debentures will not be repaid, redeemed, repurchased or defeased by AGMH or anyCompany elected to measure CLO XXVI's assets and liabilities using the fair value of its subsidiariesassets, which are more observable. Changes in the fair value of assets and liabilities of consolidated investment vehicles are recorded in "other income" in the consolidated statement of operations.
As a result of consolidating AHP, ABIF and CLO Warehouse Fund, the Company records noncontrolling interest (NCI) for the portion of each fund owned by employees and any third party investors. As of December 31, 2019, redeemable employee-owned NCI, held in ABIF and CLO Warehouse Fund, is classified outside of stockholder’s equity, within temporary equity. For AHP, nonredeemable NCI is presented within shareholders' equity in the consolidated balance sheets.
The assets and liabilities of the Company's consolidated investment vehicles (which include consolidated funds: AHP, ABIF and CLO Warehouse Fund as well as CLO XXVI) are held within separate legal entities. The assets of the consolidated investment vehicles are not available to creditors of the Company, other than creditors of the applicable consolidated investment vehicles. In addition, creditors of the consolidated investment vehicles have no recourse against the assets of the Company, other than the assets of such applicable consolidated investment vehicles.
Generally, the consolidation of the Company's consolidated investment vehicles and FG VIEs has a significant gross-up effect on or before the date that is 20 years priorCompany's assets, liabilities and cash flows. The consolidated investment vehicles have no net effect on the net income attributable to the final repayment date,Company, other than the economic interest the Company holds in consolidated funds in the Company's Insurance segment. The ownership interests of the Company's consolidated funds, to which the Company has no economic rights, are reflected as either redeemable or nonredeemable NCI in the consolidated funds in the Company's consolidated financial statements. Liquidity available at the Company's consolidated investment vehicles is typically not available for corporate liquidity needs, except to the extent that AGMH has received proceeds fromof the sale Company's investment in the fund.
Assets and Liabilities
of replacement capital securities. Consolidated Investment Vehicles
|
| | | |
| | As of
December 31, 2019 |
| | (in millions) |
| Assets: | |
| Cash and restricted cash (1) | $ | 14 |
|
| Corporate loans of CFE, at fair value | 494 |
|
| Corporate loans, at fair value | 47 |
|
| Other assets (2) | 17 |
|
| Total assets | $ | 572 |
|
| Liabilities: | |
| CLO obligations of CFE, at fair value (3) | $ | 481 |
|
| Other liabilities | 1 |
|
| Total liabilities | $ | 482 |
|
____________________
| |
| (1) | Cash held by consolidated investment vehicles are not available to fund the general liquidity needs of the Company. |
| |
| (2) | Includes investment in affiliates of $9 million. |
| |
| (3) | The weighted average maturity and weighted average interest rate of CLO obligations were 12.8 years and 3.8%, respectively. CLO obligations will mature in 2032. |
As of December 31, 2019, the consolidated investment vehicles had a commitment to invest $13 million.
Redeemable Noncontrolling Interests in Consolidated Investment Vehicles
|
| | | |
| | Year Ended December 31, 2019 |
| | (in millions) |
| Beginning balance | $ | — |
|
| Contributions to investment vehicles | 12 |
|
| Distributions from investment vehicles | (4 | ) |
| Net loss | (1 | ) |
| December 31, | $ | 7 |
|
Interest income and interest expense are included in "other income." Investment purchases and sales for all consolidated investment vehicles are classified as operating activities, debt issuances and repayments are classified in financing activities.
Effect of Consolidating VIEs
The proceeds from this offering were used to pay a dividendeffect on the statements of operations and financial condition of consolidating FG VIEs includes (i) changes in fair value gains (losses) on FG VIEs’ assets and liabilities, (ii) the elimination of premiums and losses related to the shareholdersAGC and AGM FG VIEs’ liabilities with recourse and (iii) the elimination of AGMH.investment balances related to the Company’s purchase of AGC and AGM insured FG VIEs’ debt. Upon consolidation of a FG VIE, the related insurance and, if applicable, the related investment balances, are considered intercompany transactions and therefore eliminated. Such eliminations are included in the table below to present the full effect of consolidating FG VIEs.
The effect on the statements of operations and balance sheets of consolidating Assured Investment Management investment vehicles includes (i) changes in fair value of consolidated investment vehicles, (2) the elimination of the equity in earnings in investees related to the Insurance segment's investments in the consolidated Assured Investment Management funds, (3) the elimination of debt of the consolidated CLO against the assets of the consolidated CLO Warehouse Fund, and (4) the recording of NCI for the proportion of each consolidated Assured Investment Management fund that is not owned by any other subsidiary of the Company.
The principalcash flows generated by the FG VIEs’ assets are classified as cash flows from investing activities. Paydowns of FG VIEs' liabilities are supported by the cash flows generated by FG VIEs’ assets, and carrying valuesfor liabilities with recourse, possibly claim payments made by AGM or AGC under its financial guaranty insurance contracts. Paydowns of FG VIEs' liabilities both with and without recourse are classified as cash flows used in financing activities. Interest income, interest expense and other expenses of the Company’s long-term debtFG VIEs’ assets and liabilities are classified as operating cash flows. Claim payments made by AGC and AGM under the financial guaranty contracts issued to the FG VIEs are eliminated upon consolidation and therefore such claim payments are treated as paydowns of FG VIEs’ liabilities as a financing activity as opposed to an operating activity of AGM and AGC.
Cash flows of the consolidated investment vehicles attributable to such entities' investment purchases and dispositions, as well as operating expenses of the investment vehicles are presented as cash flow from operating activities in the table below.consolidated statement of cash flows. Financing activities and capital cash flows to and from investors are presented as financing activities consistent with investment company guidelines.
Principal and Carrying AmountsEffect of DebtConsolidating VIEs
on the Consolidated Balance Sheets
Increase (Decrease)
|
| | | | | | | | | | | | | | | |
| | As of December 31, 2016 | | As of December 31, 2015 |
| | Principal |
| Carrying Value |
| Principal |
| Carrying Value |
| | (in millions) |
| AGUS: | |
|
| |
|
| |
|
| |
|
| 7% Senior Notes | $ | 200 |
| | $ | 197 |
|
| $ | 200 |
| | $ | 197 |
|
| 5% Senior Notes | 500 |
| | 496 |
| | 500 |
| | 495 |
|
| Series A Enhanced Junior Subordinated Debentures | 150 |
| | 150 |
|
| 150 |
| | 150 |
|
| Total AGUS | 850 |
| | 843 |
|
| 850 |
| | 842 |
|
| AGMH: | |
| | |
|
| |
| | |
|
67/8% QUIBS | 100 |
| | 69 |
|
| 100 |
| | 69 |
|
| 6.25% Notes | 230 |
| | 141 |
|
| 230 |
| | 140 |
|
| 5.6% Notes | 100 |
| | 56 |
|
| 100 |
| | 56 |
|
| Junior Subordinated Debentures | 300 |
| | 187 |
|
| 300 |
| | 180 |
|
| Total AGMH | 730 |
| | 453 |
|
| 730 |
| | 445 |
|
| AGM: | |
| | |
|
| |
| | |
|
| Notes Payable | 9 |
| | 10 |
|
| 12 |
| | 13 |
|
| Total AGM | 9 |
| | 10 |
|
| 12 |
| | 13 |
|
| Total | $ | 1,589 |
| | $ | 1,306 |
|
| $ | 1,592 |
| | $ | 1,300 |
|
|
| | | | | | | |
| | As of
December 31, 2019 | | As of
December 31, 2018 |
| | (in millions) |
| Assets | | | |
| Investment portfolio: | | | |
| Fixed maturity securities and short-term investments | $ | (39 | ) | | $ | (38 | ) |
| Equity method investments (1) | (77 | ) | | — |
|
| Total investments | (116 | ) | | (38 | ) |
| Premiums receivable, net of commissions payable | (7 | ) | | (9 | ) |
| Salvage and subrogation recoverable | (8 | ) | | (1 | ) |
| FG VIEs’ assets, at fair value | 442 |
| | 569 |
|
| Assets of consolidated investment vehicles (1) | 572 |
| | — |
|
| Total assets | $ | 883 |
| | $ | 521 |
|
| Liabilities and shareholders’ equity | | | |
| Unearned premium reserve | $ | (39 | ) | | $ | (51 | ) |
| Loss and LAE reserve | (41 | ) | | (48 | ) |
| FG VIEs’ liabilities with recourse, at fair value | 367 |
| | 517 |
|
| FG VIEs’ liabilities without recourse, at fair value | 102 |
| | 102 |
|
| Liabilities of consolidated investment vehicles (1) | 482 |
| | — |
|
| Total liabilities | 871 |
| | 520 |
|
| | | | |
| Redeemable noncontrolling interests in consolidated investment vehicles (1) | 7 |
| | — |
|
| | | | |
| Retained earnings | 34 |
| | 34 |
|
| Accumulated other comprehensive income | (35 | ) | | (33 | ) |
| Total shareholders’ equity attributable to Assured Guaranty Ltd. | (1 | ) | | 1 |
|
| Nonredeemable noncontrolling interests (1) | 6 |
| | — |
|
| Total shareholders’ equity | 5 |
| | 1 |
|
| Total liabilities, redeemable noncontrolling interests and shareholders’ equity | $ | 883 |
| | $ | 521 |
|
____________________
| |
| (1) | These line items represent the components of the effect of consolidating Assured Investment Management investment vehicles. |
Effect of Consolidating VIEs
Principal payments due underon the long-term debt are as follows:Consolidated Statements of Operations
Increase (Decrease)
Expected Maturity Schedule of Debt
|
| | | | | | | | | | | | | | | | |
| Expected Withdrawal Date | | AGUS | | AGMH | | AGM | | Total |
| | | (in millions) |
| 2017 | | $ | — |
| | $ | — |
| | $ | 4 |
| | $ | 4 |
|
| 2018 | | — |
| | — |
| | 2 |
| | 2 |
|
| 2019 | | — |
| | — |
| | 1 |
| | 1 |
|
| 2020 | | — |
| | — |
| | 1 |
| | 1 |
|
| 2021 | | — |
| | — |
| | 0 |
| | 0 |
|
| 2022-2041 | | 700 |
| | — |
| | 1 |
| | 701 |
|
| 2042-2061 | | — |
| | — |
| | — |
| | — |
|
| 2062-2081 | | 150 |
| | 300 |
| | — |
| | 450 |
|
| Thereafter | | — |
| | 430 |
| | — |
| | 430 |
|
| Total | | $ | 850 |
| | $ | 730 |
| | $ | 9 |
| | $ | 1,589 |
|
|
| | | | | | | | | | | |
| | Year Ended December 31, |
| | 2019 | | 2018 | | 2017 |
| | (in millions) |
| Net earned premiums | $ | (18 | ) | | $ | (12 | ) | | $ | (15 | ) |
| Net investment income | (4 | ) | | (4 | ) | | (5 | ) |
| Fair value gains (losses) on FG VIEs (1) | 42 |
| | 14 |
| | 30 |
|
| Other income (loss) (2) | (3 | ) | | — |
| | — |
|
| Loss and LAE | (20 | ) | | (3 | ) | | 7 |
|
| Equity in net earnings of investees | 2 |
| | — |
| | — |
|
| Effect on income before tax | (1 | ) | | (5 | ) | | 17 |
|
| Less: Tax provision (benefit) | — |
| | (1 | ) | | 6 |
|
| Effect on net income (loss) | (1 | ) | | (4 | ) | | 11 |
|
| Effect on redeemable noncontrolling interests | (1 | ) | | — |
| | — |
|
| Effect on net income (loss) attributable to AGL | $ | — |
| | $ | (4 | ) | | $ | 11 |
|
____________________
| |
| (1) | See consolidated statements of comprehensive income and Note 22, Other Comprehensive Income, for information on changes in fair value of the FG VIEs’ liabilities with recourse that are attributable to changes in the Company's own credit risk. |
| |
| (2) | Represents change in fair value of consolidated investment vehicles. |
Effect of Consolidating VIEs
on Consolidated Statements of Cash Flows
Interest ExpenseInflows (Outflows)
|
| | | | | | | | | | | |
| | Year Ended December 31, |
| | 2016 | | 2015 | | 2014 |
| | (in millions) |
| AGUS: | |
| | |
| | |
|
| 7% Senior Notes | $ | 13 |
| | $ | 13 |
| | $ | 13 |
|
| 5% Senior Notes | 26 |
| | 26 |
| | 13 |
|
| Series A Enhanced Junior Subordinated Debentures | 9 |
| | 10 |
| | 10 |
|
| Total AGUS | 48 |
| | 49 |
| | 36 |
|
| AGMH: | |
| | |
| | |
|
67/8% QUIBS | 7 |
| | 7 |
| | 7 |
|
| 6.25% Notes | 16 |
| | 16 |
| | 16 |
|
| 5.6% Notes | 6 |
| | 6 |
| | 6 |
|
| Junior Subordinated Debentures | 25 |
| | 25 |
| | 25 |
|
| Total AGMH | 54 |
| | 54 |
| | 54 |
|
| AGM: | |
| | |
| | |
|
| Notes Payable | 0 |
| | (2 | ) | | 2 |
|
| Total AGM | 0 |
| | (2 | ) | | 2 |
|
| Total | $ | 102 |
| | $ | 101 |
| | $ | 92 |
|
|
| | | | | | | | | | | |
| | Year Ended December 31, |
| | 2019 | | 2018 | | 2017 |
| | (in millions) |
| Effect on cash flows from operating activities | $ | (254 | ) | | $ | 11 |
| | $ | 19 |
|
| Effect on cash flows from investing activities | 259 |
| | 105 |
| | 138 |
|
| Effect on cash flows from financing activities | 9 |
| | (116 | ) | | (157 | ) |
| Total effect on cash flows | $ | 14 |
| | $ | — |
| | $ | — |
|
Recourse Credit FacilitiesFor 2019, the fair value gains on FG VIEs were attributable to higher recoveries on second lien U.S. RMBS FG VIEs' assets. For 2018 and 2017, the primary driver of the gain in fair value of FG VIEs’ assets and FG VIEs’ liabilities was an increase in the value of the FG VIEs’ assets resulting from improvement in the underlying collateral. The change in fair value of consolidated investment vehicles was a loss of $3 million for the year ended December 31, 2019.
2009 Strip Coverage FacilityOther Consolidated VIEs
In connection withcertain instances where the Company's acquisitionCompany consolidates a VIE that was established as part of AGMH and its subsidiaries from Dexia Holdings Inc., AGM agreed to retaina loss mitigation negotiated settlement that results in the risks relating to the debt and strip policy portionstermination of the leveraged lease business.
In a leveraged lease transaction, a tax-exempt entity (such as a transit agency) transfers tax benefits to a tax-paying entity by transferring ownership of a depreciable asset, such as subway cars. The tax-exempt entity then leases the asset back from its new owner.
If the lease is terminated early, the tax-exempt entity must make an early termination payment to the lessor. A portion of this early termination payment is funded from monies that were pre-funded and invested at the closing of the leveraged lease transaction (along with earnings on those invested funds). The tax-exempt entity is obligated to pay the remaining, unfunded portion of this early termination payment (known as the strip coverage) from its own sources. AGM issuedoriginal insured financial guaranty insurance policies (knownor credit derivative contract, the Company classifies the assets and liabilities of those VIEs in the line items that most accurately reflect the nature of the items, as strip policies) that guaranteedopposed to within the paymentFG VIEs’ assets and FG VIEs’ liabilities. The largest of these unfunded strip coverage amounts to the lessor, in the event that a tax-exempt entity defaulted on its obligation to pay this portionVIEs had assets of its early termination payment. Following such events, AGM can then seek reimbursement$91 million and liabilities of its strip policy payments from the tax-exempt entity, and can also sell the transferred depreciable asset and reimburse itself from the sale proceeds.
Currently, all the leveraged lease transactions in which AGM acts as strip coverage provider are breaching a rating trigger related to AGM and are subject to early termination. However, early termination of a lease does not result in a draw on the AGM policy if the tax-exempt entity makes the required termination payment. If all the leases were to terminate early and the tax-exempt entities do not make the required early termination payments, then AGM would be exposed to possible liquidity claims on gross exposure of approximately $953$12 million as of December 31, 2016. To date, none2019 and assets of $87 million and liabilities of $21 million as of December 31, 2018, primarily recorded in the investment portfolio and credit derivative liabilities on the consolidated balance sheets.
Non-Consolidated VIEs
As described in Note 5, Outstanding Insurance Exposure, the Company monitors all policies in the insured portfolio. Of the approximately 18 thousand policies monitored as of December 31, 2019, approximately 16 thousand policies are not within the scope of ASC 810 because these financial guaranties relate to the debt obligations of governmental organizations or financing entities established by a governmental organization. The majority of the leveraged leaseremaining policies involve transactions that involve AGM has experienced an early termination due to a lease default and a claim on the AGM policy. At December 31, 2016, approximately $1.5 billion of cumulative strip par exposure had been terminated since 2008 on a consensual basis. The consensual terminations have resulted in no claims on AGM.
On July 1, 2009, AGM and Dexia Crédit Local S.A., acting through its New York Branch (Dexia Crédit Local (NY)), entered into a credit facility (the Strip Coverage Facility). Under the Strip Coverage Facility, Dexia Crédit Local (NY) agreed to make loans to AGM to finance all draws made by lessors on AGM strip policies that were outstanding as of November 13, 2008, up to the commitment amount. There have never been any borrowings under the Strip Coverage Facility, the amount of the leveraged leases covered by the Strip Coverage Facility has declined since July 1, 2009 and, to date, none of the leveraged
lease transactions in which AGM acts as the strip coverage provider has experienced an early termination due to a lease default. Consequently, and in view of the credit quality of the relevant tax-exempt entities and the cost of the Strip Coverage Facility,where the Company determined that maintainingis not deemed to currently have control over the Strip Coverage Facility was no longer warranted. On July 29, 2016, the parties terminated the Strip Coverage Facility.
Intercompany Credit Facility and Intercompany Debt
On October 25, 2013, AGL, as borrower, and AGUS, as lender, entered into a revolving credit facility pursuant to which AGL may, from time to time, borrow for general corporate purposes. Under the credit facility, AGUS committed to lend a principal amount not exceeding $225 million in the aggregate. Such commitment terminates on October 25, 2018 (the “loan termination date”). The unpaid principal amount of each loan will bear interest at a fixed rate equal to 100% of the then applicable Federal short-term or mid-term interest rate, as the case may be, as determined under Internal Revenue Code Sec. 1274(d), and interest on all loans will be computed for the actual number of days elapsed on the basis of a year consisting of 360 days. Accrued interest on all loans will be paid on the last day of each June and December, beginning on December 31, 2013, and at maturity. AGL must repay the then unpaid principal amounts of the loans by the third anniversary of the loan termination date. No amounts are currently outstanding under the credit facility.
On March 30, 2015, AGUS loaned $200 million to AGC to facilitate the acquisition of Radian Asset on April 1, 2015. AGC repaid the loan in full on April 14, 2015.
In addition, in 2012 AGUS borrowed $90 million from its affiliate AGRO to fund the acquisition of MAC. During 2016, AGUS repaid $20 million in outstanding principal as well as accrued and unpaid interest, and the parties agreed to extend the maturity date of the loan from May 2017 to November 2019.FG VIEs’ most significant activities. As of December 31, 2016, $70 million remained outstanding.2019 and 2018, the Company identified 90 and 110 policies, respectively, that contain provisions and experienced events that may trigger consolidation. Based on management’s assessment of these potential triggers or events, the Company consolidated 27 and 31 FG VIEs as of December 31, 2019 and December 31, 2018, respectively. The Company’s exposure provided through its financial guaranties with respect to debt obligations of FG VIEs is included within net par outstanding in Note 5, Outstanding Insurance Exposure.
The Company manages funds and CLOs that have been determined to be a VIE or voting interest entity, in which the Company concluded that it held no variable interests, through either equity interests held, debt interests held or decision-making fees received by the Assured Investment Management subsidiaries. As such, the Company does not consolidate these entities.
15. Long-Term Debt and Credit Facilities
Accounting Policy
Long-term debt is recorded at principal amounts net of any unamortized original issue discount or premium and unamortized acquisition date fair value adjustment for AGM and AGMH debt. Discounts and acquisition date fair value adjustments are accreted into interest expense over the life of the applicable debt.
Committed Capital Securities
The fair value of CCS, which is recorded in other assets on the consolidated balance sheets, represents the difference between the present value of remaining expected put option premium payments under AGC’s CCS and AGM’s Committed Preferred Trust Securities (the AGM CPS) agreements, and the estimated present value that the Company would hypothetically have to pay currently for a comparable security (see Note 15, Long Term Debt and Credit Facilities). The change in fair value of the AGC CCS and AGM CPS are recorded in other income in the consolidated statement of operations. Fair value changes on CCS recorded in other income were losses of $22 million and $2 million in 2019 and 2017, respectively, and gains of $14 million in 2018. The estimated current cost of the Company’s CCS is based on several factors, including AGM and AGC CDS spreads, LIBOR curve projections, the Company's publicly traded debt and the term the securities are estimated to remain outstanding. The AGC CCS and AGM CPS are classified as Level 3 in the fair value hierarchy.
On April 8, 2005,
Supplemental Executive Retirement Plans
The Company classifies the fair value measurement of the assets of the Company's various supplemental executive retirement plans as either Level 1 or Level 2. The fair value of these assets is valued based on the observable published daily values of the underlying mutual fund included in the plans (Level 1) or based upon the net asset value (NAV) of the funds if a published daily value is not available (Level 2). The NAVs are based on observable information. Change in fair value of these assets is recorded in other operating expenses in the consolidated statement of operations.
Contracts Accounted for as Credit Derivatives
The Company’s credit derivatives primarily consist of insured CDS contracts, and also include interest rate swaps that qualify as derivatives under GAAP, which requires fair value measurement with changes recorded in the statement of operations. The Company did not enter into CDS with the intent to trade these contracts and the Company may not unilaterally terminate a CDS contract absent an event of default or termination event that entitles the Company to terminate such contracts; however, the Company has mutually agreed with various counterparties to terminate certain CDS transactions. In transactions where the counterparty does not have the right to terminate, such transactions are generally terminated for an amount that approximates the present value of future premiums or for a negotiated amount, rather than at fair value.
The terms of the Company’s CDS contracts differ from more standardized credit derivative contracts sold by companies outside the financial guaranty industry. The non-standard terms generally include the absence of collateral support agreements or immediate settlement provisions. In addition, the Company employs relatively high attachment points and does not exit derivatives it sells, except under specific circumstances such as mutual agreements with counterparties. Management considers the non-standard terms of the Company's credit derivative contracts in determining the fair value of these contracts.
Due to the lack of quoted prices and other observable inputs for its instruments or for similar instruments, the Company determines the fair value of its credit derivative contracts primarily through internally developed, proprietary models that use both observable and unobservable market data inputs. There is no established market where financial guaranty insured credit derivatives are actively traded; therefore, management has determined that the exit market for the Company’s credit derivatives is a hypothetical one based on its entry market. These contracts are classified as Level 3 in the fair value hierarchy as there are multiple unobservable inputs deemed significant to the valuation model, most importantly the Company’s estimate of the value of the non-standard terms and conditions of its credit derivative contracts and how the Company’s own credit spread affects the pricing of its transactions.
The fair value of the Company’s credit derivative contracts represents the difference between the present value of remaining premiums the Company expects to receive and the estimated present value of premiums that a financial guarantor of comparable credit-worthiness would hypothetically charge at the reporting date for the same protection. The fair value of the Company’s credit derivatives depends on a number of factors, including notional amount of the contract, expected term, credit spreads, changes in interest rates, the credit ratings of referenced entities, the Company’s own credit risk and remaining contractual cash flows. The expected remaining contractual premium cash flows are the most readily observable inputs since they are based on the CDS contractual terms. Credit spreads capture the effect of recovery rates and performance of underlying assets of these contracts, among other factors. Consistent with previous years, market conditions at December 31, 2019 were such that market prices of the Company’s CDS contracts were not available.
Assumptions and Inputs
The various inputs and assumptions that are key to the establishment of the Company’s fair value for CDS contracts are as follows: the gross spread, the allocation of gross spread among the bank profit, net spread and hedge cost, and the weighted average life which is based on debt service schedules. The Company obtains gross spreads on its outstanding contracts from market data sources published by third parties (e.g., dealer spread tables for the collateral similar to assets within the Company’s transactions), as well as collateral-specific spreads provided or obtained from market sources. The bank profit represents the profit the originator, usually an investment bank, realizes for structuring and funding the transaction; the net spread represents the premiums paid to the Company for the Company’s credit protection provided; and the hedge cost represents the cost of CDS protection purchased by the originator to hedge its counterparty credit risk exposure to the Company.
With respect to CDS transactions for which there is an expected claim payment within the next twelve months, the allocation of gross spread reflects a higher allocation to the cost of credit rather than the bank profit component. It is assumed
that a bank would be willing to accept a lower profit on distressed transactions in order to remove these transactions from its financial statements.
Market sources determine credit spreads by reviewing new issuance pricing for specific asset classes and receiving price quotes from their trading desks for the specific asset in question. Management validates these quotes by cross-referencing quotes received from one market source against quotes received from another market source to ensure reasonableness. In addition, the Company compares the relative change in price quotes received from one quarter to another, with the relative change experienced by published market indices for a specific asset class. Collateral specific spreads obtained from third-party, independent market sources are un-published spread quotes from market participants or market traders who are not trustees. Management obtains this information as the result of direct communication with these sources as part of the valuation process. The following spread hierarchy is utilized in determining which source of gross spread to use.
Actual collateral specific credit spreads (if up-to-date and reliable market-based spreads are available).
Transactions priced or closed during a specific quarter within a specific asset class and specific rating.
Credit spreads interpolated based upon market indices adjusted to reflect the non-standard terms of the Company's CDS contracts.
Credit spreads extrapolated based upon transactions of similar asset classes, similar ratings, and similar time to maturity.
The rates used to discount future expected premium cash flows ranged from 1.69% to 2.08% at December 31, 2019 and 2.47% to 2.89% at December 31, 2018.
The premium the Company receives is referred to as the “net spread.” The Company’s pricing model takes into account not only how credit spreads on risks that it assumes affect pricing, but also how the Company’s own credit spread affects the pricing of its transactions. The Company’s own credit risk is factored into the determination of net spread based on the impact of changes in the quoted market price for credit protection bought on the Company, as reflected by quoted market prices on CDS referencing AGC. For credit spreads on the Company’s name the Company obtains the quoted price of CDS contracts traded on AGC entered into separate agreements (the Put Agreements)from market data sources published by third parties. The cost to acquire CDS protection referencing AGC affects the amount of spread on CDS transactions that the Company retains and, hence, their fair value. As the cost to acquire CDS protection referencing AGC increases, the amount of premium the Company retains on a transaction generally decreases. Due to the relatively low volume and characteristics of CDS contracts remaining in AGM's portfolio, changes in AGM's credit spreads do not significantly affect the fair value of these CDS contracts.
In the Company’s valuation model, the premium the Company captures is not permitted to go below the minimum rate that the Company would currently charge to assume similar risks. This assumption can have the effect of mitigating the amount of unrealized gains that are recognized on certain CDS contracts. Given market conditions and the Company’s own credit spreads, approximately 17% based on fair value, of the Company's CDS contracts were fair valued using this minimum premium as of December 31, 2018. As of December 31, 2019, the corresponding number was de minimis. The percentage of transactions that price using the minimum premiums fluctuates due to changes in AGC's credit spreads. In general, when AGC's credit spreads narrow, the cost to hedge AGC's name declines and more transactions price above previously established floor levels. Meanwhile, when AGC's credit spreads widen, the cost to hedge AGC's name increases causing more transactions to price at established floor levels. The Company corroborates the assumptions in its fair value model, including the portion of exposure to AGC hedged by its counterparties, with four custodial trusts (each,independent third parties periodically. The implied credit risk of AGC, indicated by the trading level of AGC’s own credit spread, is a Custodial Trust) pursuantsignificant factor in the amount of exposure to AGC that a bank or transaction hedges. When AGC's credit spreads widen, the hedging cost of a bank or originator increases. Higher hedging costs reduce the amount of contractual cash flows AGC can capture as premium for selling its protection, while lower hedging costs increase the amount of contractual cash flows AGC can capture.
The amount of premium a financial guaranty insurance market participant can demand is inversely related to the cost of credit protection on the insurance company as measured by market credit spreads assuming all other assumptions remain constant. This is because the buyers of credit protection typically hedge a portion of their risk to the financial guarantor, due to the fact that the contractual terms of the Company's contracts typically do not require the posting of collateral by the guarantor. The extent of the hedge depends on the types of instruments insured and the current market conditions.
A credit derivative liability on protection sold is the result of contractual cash inflows on in-force transactions that are less than what a hypothetical financial guarantor could receive if it sold protection on the same risk as of the reporting date. If
the Company were able to freely exchange these contracts (i.e., assuming its contracts did not contain proscriptions on transfer and there was a viable exchange market), it would realize a loss representing the difference between the lower contractual premiums to which AGC may,it is entitled and the current market premiums for a similar contract. The Company determines the fair value of its CDS contracts by applying the difference between the current net spread and the contractual net spread for the remaining duration of each contract to the notional value of its CDS contracts and taking the present value of such amounts discounted at its option, cause eachthe LIBOR corresponding to the weighted average remaining life of the Custodial Trustscontract.
Strengths and Weaknesses of Model
The Company’s credit derivative valuation model, like any financial model, has certain strengths and weaknesses.
The primary strengths of the Company’s CDS modeling techniques are:
The model takes into account the transaction structure and the key drivers of market value.
The model maximizes the use of market-driven inputs whenever they are available.
The model is a consistent approach to valuing positions.
The primary weaknesses of the Company’s CDS modeling techniques are:
There is no exit market or any actual exit transactions; therefore, the Company’s exit market is a hypothetical one based on the Company’s entry market.
There is a very limited market in which to validate the reasonableness of the fair values developed by the Company’s model.
The markets for the inputs to the model are highly illiquid, which impacts their reliability.
Due to the non-standard terms under which the Company enters into derivative contracts, the fair value of its credit derivatives may not reflect the same prices observed in an actively traded market of credit derivatives that do not contain terms and conditions similar to those observed in the financial guaranty market.
Fair Value Option on FG VIEs’ Assets and Liabilities
The Company elected the fair value option for all the FG VIEs’ assets and liabilities and classifies them as Level 3 in the fair value hierarchy. The prices are generally determined with the assistance of an independent third party, based on a discounted cash flow approach. The net change in the fair value of consolidated FG VIEs’ assets and liabilities is recorded in "fair value gains (losses) on FG VIEs" in the consolidated statements of operations, except for change in fair value of FG VIEs’ liabilities with recourse caused by changes in instrument-specific credit risk (ISCR) which is separately presented in OCI. Interest income and interest expense are derived from the trustee reports and also included in "fair value gains (losses) on FG VIEs." The FG VIEs issued securities collateralized by first lien and second lien RMBS as well as loans and receivables.
The fair value of the Company’s FG VIEs’ assets is generally sensitive to changes in estimated prepayment speeds; estimated default rates (determined on the basis of an analysis of collateral attributes such as: historical collateral performance, borrower profiles and other features relevant to the evaluation of collateral credit quality); yields implied by market prices for similar securities; and house price depreciation/appreciation rates based on macroeconomic forecasts. Significant changes to some of these inputs could have materially changed the market value of the FG VIEs’ assets and the implied collateral losses within the transaction. In general, the fair value of the FG VIEs’ assets is most sensitive to changes in the projected collateral losses, where an increase in collateral losses typically could lead to a decrease in the fair value of FG VIEs’ assets, while a decrease in collateral losses typically leads to an increase in the fair value of FG VIEs’ assets. The third-party utilizes an internal model to determine an appropriate yield at which to discount the cash flows of the security, by factoring in collateral types, weighted-average lives, and other structural attributes specific to the security being priced. The expected yield is further calibrated by utilizing algorithms designed to aggregate market color, received by the independent third-party, on comparable bonds.
The models used to price the FG VIEs’ liabilities generally apply the same inputs used in determining fair value of FG VIEs’ assets. For those liabilities insured by the Company, the benefit of the Company's insurance policy guaranteeing the timely payment of principal and interest is also taken into account.
Significant changes to any of the inputs described above could have materially changed the timing of expected losses within the insured transaction which is a significant factor in determining the implied benefit of the Company’s insurance policy guaranteeing the timely payment of principal and interest for the insured tranches of debt issued by the FG VIEs. In general, extending the timing of expected loss payments by the Company into the future typically could lead to a decrease in the value of the Company’s insurance and a decrease in the fair value of the Company’s FG VIEs’ liabilities with recourse, while a shortening of the timing of expected loss payments by the Company typically could lead to an increase in the value of the Company’s insurance and an increase in the fair value of the Company’s FG VIEs’ liabilities with recourse.
Assets and Liabilities of Consolidated Investment Vehicles
Due to the fact that BlueMountain manages and the Insurance segment has an investment in certain Assured Investment Management funds, the Company consolidated 1 Assured Investment Management managed CLO and 3 Assured Investment Management funds (collectively, the consolidated investment vehicles). The consolidated Assured Investment Management funds are: AHP Capital Solutions, LP (AHP), AIM Asset Backed Income Fund (US) L.P. (ABIF) and a BlueMountain CLO Warehouse Fund (US) L.P. (CLO Warehouse Fund). CLO Warehouse Fund invested in BlueMountain CLO XXVI Ltd. (CLO XXVI). All four consolidated investment vehicles are accounted for at fair value. See Note 14, Variable Interest Entities.
AHP and ABIF are investment companies, subject to the guidance in Accounting Standards Codification (ASC) 946, Financial Services — Investment Companies.
CLO XXVI is a collateralized financing entity (CFE) under ASC 810, Consolidation, and has elected to measure assets and liabilities using the fair value of its assets, which are more observable. The financial assets of CLO XXVI are all Level 2 assets, and therefore more observable than the fair value of the financial liabilities of CLO XXVI, which are all Level 3 liabilities. As a result, the financial assets of CLO XXVI are measured at fair value and the financial liabilities of CLO XXVI are measured as: (1) the sum of the fair value of the financial assets, and the carrying value of any nonfinancial assets held temporarily, less (2) the sum of the fair value of any beneficial interests retained by the Company (other than those that represent compensation for services), and the Company’s carrying value of any beneficial interests that represent compensation for services. The resulting amount is allocated to the individual financial liabilities (other than the beneficial interests retained by the Company).
Investments of consolidated investment vehicles which are not listed or quoted on an exchange, but are traded over-the-counter, or are listed on an exchange which have no reported sales, are valued at their fair value as determined by the Company, after giving consideration to third party data generally at the average between the offer and bid prices. These fair values are generally based on dealer quotes, indications of value or pricing models that consider the time value of money, the current market, contractual prices and potential volatilities of the underlying financial instruments. Inputs are used in applying the various valuation techniques and broadly refer to the current assumptions that market participants use to make valuation decisions, including assumptions about risk. Inputs may include dealer price quotations, yield curves, credit curves, forward/CDS/index spreads, prepayments rates, strike and expiry dates, volatility statistics and other factors.
Assets in consolidated Assured Investment Management funds that are carried at fair value primarily consist of corporate loans and other investments. Assets supporting CLO XXVI are Level 2 and all other assets of consolidated investment vehicles are Level 3. Liabilities include various tranches of CLO debt and classified as Level 3 in the fair value hierarchy. Significant changes to any of the inputs described above could have a material effect the fair value of the consolidated assets and liabilities.
Amounts recorded at fair value in the Company’s financial statements are presented in the tables below.
Fair Value Hierarchy of Financial Instruments Carried at Fair Value
As of December 31, 2019
|
| | | | | | | | | | | | | | | |
| | | | Fair Value Hierarchy |
| | Fair Value | | Level 1 | | Level 2 | | Level 3 |
| | (in millions) |
| Assets: | |
| | |
| | |
| | |
|
| Investment portfolio, available-for-sale: | |
| | |
| | |
| | |
|
| Fixed-maturity securities | |
| | |
| | |
| | |
|
| Obligations of state and political subdivisions | $ | 4,340 |
| | $ | — |
| | $ | 4,233 |
| | $ | 107 |
|
| U.S. government and agencies | 147 |
| | — |
| | 147 |
| | — |
|
| Corporate securities | 2,221 |
| | — |
| | 2,180 |
| | 41 |
|
| Mortgage-backed securities: | |
| | | | | | |
| RMBS | 775 |
| | — |
| | 467 |
| | 308 |
|
| Commercial mortgage-backed securities (CMBS) | 419 |
| | — |
| | 419 |
| | — |
|
| Asset-backed securities | 720 |
| | — |
| | 62 |
| | 658 |
|
| Non-U.S. government securities | 232 |
| | — |
| | 232 |
| | — |
|
| Total fixed-maturity securities | 8,854 |
|
| — |
| | 7,740 |
| | 1,114 |
|
| Short-term investments | 1,268 |
| | 1,061 |
| | 207 |
| | — |
|
| Other invested assets (1) | 6 |
| | — |
| | — |
| | 6 |
|
| FG VIEs’ assets, at fair value | 442 |
| | — |
| | — |
| | 442 |
|
| Assets of consolidated investment vehicles | 558 |
| | — |
| | 494 |
| | 64 |
|
| Other assets | 135 |
| | 32 |
| | 45 |
| | 58 |
|
| Total assets carried at fair value | $ | 11,263 |
| | $ | 1,093 |
| | $ | 8,486 |
| | $ | 1,684 |
|
| Liabilities: | |
| | |
| | |
| | |
|
| Credit derivative liabilities | $ | 191 |
| | $ | — |
| | $ | — |
| | $ | 191 |
|
| FG VIEs’ liabilities with recourse, at fair value | 367 |
| | — |
| | — |
| | 367 |
|
| FG VIEs’ liabilities without recourse, at fair value | 102 |
| | — |
| | — |
| | 102 |
|
| Liabilities of consolidated investment vehicles | 481 |
| | — |
| | — |
| | 481 |
|
| Total liabilities carried at fair value | $ | 1,141 |
| | $ | — |
| | $ | — |
| | $ | 1,141 |
|
Fair Value Hierarchy of Financial Instruments Carried at Fair Value
As of December 31, 2018
|
| | | | | | | | | | | | | | | |
| | | | Fair Value Hierarchy |
| | Fair Value | | Level 1 | | Level 2 | | Level 3 |
| | (in millions) |
| Assets: | |
| | |
| | |
| | |
|
| Investment portfolio, available-for-sale: | |
| | |
| | |
| | |
|
| Fixed-maturity securities | |
| | |
| | |
| | |
|
| Obligations of state and political subdivisions | $ | 4,911 |
| | $ | — |
| | $ | 4,812 |
| | $ | 99 |
|
| U.S. government and agencies | 175 |
| | — |
| | 175 |
| | — |
|
| Corporate securities | 2,136 |
| | — |
| | 2,080 |
| | 56 |
|
| Mortgage-backed securities: | |
| | |
| | |
| | |
|
| RMBS | 982 |
| | — |
| | 673 |
| | 309 |
|
| CMBS | 539 |
| | — |
| | 539 |
| | — |
|
| Asset-backed securities | 1,068 |
| | — |
| | 121 |
| | 947 |
|
| Non-U.S. government securities | 278 |
| | — |
| | 278 |
| | — |
|
| Total fixed-maturity securities | 10,089 |
| | — |
| | 8,678 |
| | 1,411 |
|
| Short-term investments | 729 |
| | 429 |
| | 300 |
| | — |
|
| Other invested assets (1) | 7 |
| | — |
| | — |
| | 7 |
|
| FG VIEs’ assets, at fair value | 569 |
| | — |
| | — |
| | 569 |
|
| Other assets | 139 |
| | 25 |
| | 38 |
| | 76 |
|
| Total assets carried at fair value | $ | 11,533 |
| | $ | 454 |
| | $ | 9,016 |
| | $ | 2,063 |
|
| Liabilities: | |
| | |
| | |
| | |
|
| Credit derivative liabilities | $ | 209 |
| | $ | — |
| | $ | — |
| | $ | 209 |
|
| FG VIEs’ liabilities with recourse, at fair value | 517 |
| | — |
| | — |
| | 517 |
|
| FG VIEs’ liabilities without recourse, at fair value | 102 |
| | — |
| | — |
| | 102 |
|
| Total liabilities carried at fair value | $ | 828 |
| | $ | — |
| | $ | — |
| | $ | 828 |
|
____________________
(1) Includes Level 3 mortgage loans that are recorded at fair value on a non-recurring basis.
Changes in Level 3 Fair Value Measurements
The tables below present a roll forward of the Company’s Level 3 financial instruments carried at fair value on a recurring basis during the years ended December 31, 2019 and 2018.
Rollforward of Level 3 Assets
At Fair Value on a Recurring Basis
Year Ended December 31, 2019
|
| | | | | | | | | | | | | | | | | | | | | | | | | | | | | | | | | | | |
| | Fixed-Maturity Securities | | | | | | | |
| | Obligations
of State and
Political
Subdivisions | | Corporate Securities | | RMBS | | Asset-
Backed
Securities | | FG VIEs’
Assets at
Fair
Value | | Assets of Consolidated Investment Vehicles | | Other
(7) | |
| | (in millions) |
| Fair value as of December 31, 2018 | $ | 99 |
| | $ | 56 |
| | $ | 309 |
| | $ | 947 |
| |
| $ | 569 |
| |
| $ | — |
| | $ | 77 |
| |
|
| Total pretax realized and unrealized gains/(losses) recorded in: | | | | | | | | |
| |
| |
| | | |
| |
|
| Net income (loss) | 6 |
| (1 | ) | (8 | ) | (1 | ) | 17 |
| (1 | ) | 58 |
| (1 | ) | 68 |
| (2 | ) | — |
| (4 | ) | (22 | ) | (3 | ) |
| Other comprehensive income (loss) | (1 | ) | | (7 | ) | | 25 |
| | (91 | ) | |
| — |
| |
| — |
| | — |
| |
|
| Purchases | 6 |
| | — |
| | 11 |
| | 20 |
| |
| — |
| |
| 64 |
| | — |
| |
|
| Sales | — |
| | — |
| | — |
| | (29 | ) | | (51 | ) | | — |
| | — |
| |
| Settlements | (3 | ) | | — |
| | (54 | ) | | (248 | ) | | (139 | ) | | — |
| | — |
| |
|
| VIE consolidations | — |
| | — |
| | — |
| | — |
| | 6 |
| | — |
| | — |
| |
| VIE deconsolidations | — |
| | — |
| | — |
| | — |
| | (11 | ) | | — |
| | — |
| |
| Transfers into Level 3 | — |
| | — |
| | — |
| | 1 |
| | — |
| | — |
| | — |
| |
Fair value as of
December 31, 2019 | $ | 107 |
| | $ | 41 |
| | $ | 308 |
| | $ | 658 |
| |
| $ | 442 |
| |
| $ | 64 |
| | $ | 55 |
| |
|
Change in unrealized gains/(losses) included in earnings related to financial instruments held as of
December 31, 2019 | | | | | | | | | $ | 77 |
| (2 | ) | $ | — |
| (4 | ) | $ | (22 | ) | (3 | ) |
Change in unrealized gains/(losses) included in OCI related to financial instruments held as of
December 31, 2019 | $ | — |
| | $ | (7 | ) | | $ | 25 |
| | $ | 15 |
| | | | | | | |
Rollforward of Level 3 Liabilities
At Fair Value on a Recurring Basis
Year Ended December 31, 2019
|
| | | | | | | | | | | | | | | | | | | | |
| | | | FG VIEs’ Liabilities, at Fair Value | | | |
| | Credit
Derivative
Asset (Liability), net (5) | | With Recourse | | Without Recourse | | Liabilities of Consolidated Investment Vehicles | |
| | (in millions) | |
| Fair value as of December 31, 2018 | $ | (207 | ) | | $ | (517 | ) | | $ | (102 | ) | | $ | — |
| |
| Total pretax realized and unrealized gains/(losses) recorded in: | |
| |
| |
| |
| | | | |
| Net income (loss) | (6 | ) | (6 | ) | (32 | ) | (2 | ) | (9 | ) | (2 | ) | (9 | ) | (4 | ) |
| Other comprehensive income (loss) | — |
| |
| 5 |
| |
| — |
| | — |
| |
| Issuances | — |
| |
| — |
| |
| — |
| | (472 | ) | |
| Settlements | 28 |
| |
| 173 |
| |
| 8 |
| | — |
| |
| VIE consolidations | — |
| | (5 | ) | | (1 | ) | | — |
| |
| VIE deconsolidations | — |
| | 9 |
| | 2 |
| | — |
| |
| Fair value as of December 31, 2019 | $ | (185 | ) | | $ | (367 | ) | | $ | (102 | ) | | $ | (481 | ) | |
| Change in unrealized gains/(losses) included in earnings related to financial instruments held as of December 31, 2019 | $ | 3 |
| (6 | ) | $ | (31 | ) | (2 | ) | $ | (17 | ) | (2 | ) | $ | (9 | ) | (4 | ) |
| Change in unrealized gains/(losses) included in OCI related to financial instruments held as of December 31, 2019 | | | $ | 5 |
| | | |
|
| |
Rollforward of Level 3 Assets and Liabilities
At Fair Value on a Recurring Basis
Year Ended December 31, 2018
|
| | | | | | | | | | | | | | | | | | | | | | | | | | | | | | | | | | | | | | | | | | | | | |
| | Fixed-Maturity Securities | | | | | | | | FG VIEs’ Liabilities, at Fair Value | |
| | Obligations
of State and
Political
Subdivisions | | Corporate Securities | | RMBS | | Asset-
Backed
Securities | | FG VIEs’
Assets at
Fair
Value | | Other
(7) | | Credit
Derivative
Asset
(Liability),
net (5) | | With Recourse | | Without Recourse | |
| | (in millions) | |
Fair value as of
December 31, 2017 | $ | 76 |
| | $ | 67 |
| | $ | 334 |
| | $ | 787 |
| | $ | 700 |
| |
| $ | 64 |
| | $ | (269 | ) | |
| $ | (627 | ) | | $ | (130 | ) | |
| Total pretax realized and unrealized gains/(losses) recorded in: | | | | | | | | | | |
| | | | |
| | |
| | |
| Net income (loss) | 3 |
| (1 | ) | (14 | ) | (1 | ) | 21 |
| (1 | ) | 57 |
| (1 | ) | 2 |
| (2 | ) | 14 |
| (3 | ) | 112 |
| (6 | ) | (1 | ) | (2 | ) | 4 |
| (2 | ) |
| Other comprehensive income (loss) | 18 |
| | 3 |
| | (17 | ) | | (40 | ) | | — |
| |
| — |
| | — |
| |
| 2 |
| |
| — |
| |
| Purchases | 4 |
| | — |
| | 35 |
| | 189 |
| | — |
| |
| — |
| | — |
| |
| — |
| |
| — |
| |
| Issuances | — |
| | — |
| | — |
| | — |
| | — |
| | — |
| | (68 | ) | (8 | ) | — |
| |
| — |
| |
| Settlements | (2 | ) | | — |
| | (64 | ) | | (46 | ) | | (116 | ) | |
| (1 | ) | | 18 |
| |
| 108 |
| | 8 |
| |
| FG VIE deconsolidations | — |
| | — |
| | — |
| | — |
| | (17 | ) | | — |
| | — |
| | 1 |
| | 16 |
| |
Fair value as of
December 31, 2018 | $ | 99 |
| | $ | 56 |
| | $ | 309 |
| | $ | 947 |
| | $ | 569 |
| |
| $ | 77 |
| | $ | (207 | ) | |
| $ | (517 | ) | | $ | (102 | ) | |
| Change in unrealized gains/(losses) included in earnings related to financial instruments held as of December 31, 2018 | | | | | | | | | $ | 13 |
| (2 | ) | $ | 14 |
| (3 | ) | $ | 122 |
| (6 | ) | $ | 1 |
| (2 | ) | $ | 3 |
| (2 | ) |
| Change in unrealized gains/(losses) included in OCI related to financial instruments held as of December 31, 2018 | $ | 18 |
| | $ | 3 |
| | $ | (14 | ) | | $ | (38 | ) | | | | $ | — |
| | | | $ | 2 |
| | | |
____________________
| |
| (1) | Included in net realized investment gains (losses) and net investment income. |
| |
| (2) | Included in fair value gains (losses) on FG VIEs. |
| |
| (3) | Recorded in net investment income and other income. |
| |
| (4) | Recorded in other income. |
| |
| (5) | Represents the net position of credit derivatives. Credit derivative assets (recorded in other assets) and credit derivative liabilities (presented as a separate line item) are shown as either assets or liabilities in the consolidated balance sheet based on net exposure by counterparty. |
| |
| (6) | Reported in net change in fair value of credit derivatives. |
| |
| (7) | Includes CCS and other invested assets. |
| |
| (8) | Relates to SGI Transaction. See Note 2, Business Combinations and Assumption of Insured Portfolio. |
Level 3 Fair Value Disclosures
Quantitative Information about Level 3 Fair Value Inputs
At December 31, 2019
|
| | | | | | | | | | | | | |
| Financial Instrument Description | | Fair Value at
December 31, 2019
(in millions) | | Significant Unobservable Inputs | | Range | | Weighted Average as a Percentage of Current Par Outstanding |
| Assets (2): | | |
| | | | | | | | |
| Fixed-maturity securities (1): | | |
| | | | | | | | |
| Obligations of state and political subdivisions | | $ | 107 |
| | Yield | | 4.5 | % | - | 31.1% | | 8.5% |
| | | | | | | | | | | |
| Corporate securities | | 41 |
| | Yield | | 35.9% | | |
| | | | | | | | | | | |
| RMBS | | 308 |
| | CPR | | 2.0 | % | - | 15.0% | | 6.3% |
| | | CDR | | 1.5 | % | - | 7.0% | | 4.9% |
| | | Loss severity | | 40.0 | % | - | 125.0% | | 78.8% |
| | | Yield | | 3.7 | % | - | 6.1% | | 4.8% |
| Asset-backed securities: | | | | | | | | | | |
| Life insurance transactions | | 350 |
| | Yield | | 5.8% | | |
| | | | | | | | | | | |
| CLOs/Trust preferred securities (TruPS) | | 256 |
| | Yield | | 2.5 | % | - | 4.1% | | 2.9% |
| | | | | | | | | | | |
| Others | | 52 |
| | Yield | | 2.3 | % | - | 9.4% | | 9.3% |
| | | | | | | | | | | |
| FG VIEs’ assets, at fair value (1) | | 442 |
| | CPR | | 0.1 | % | - | 18.6% | | 8.6% |
| | | CDR | | 1.2 | % | - | 24.7% | | 4.9% |
| | | Loss severity | | 40.0 | % | - | 100.0% | | 76.1% |
| | | Yield | | 3.0 | % | - | 8.4% | | 5.2% |
| | | | | | | | | | | |
| Assets of consolidated investment vehicles (3) | | 64 |
| | Discount rate | | 16.0 | % | - | 28.0% | | 21% |
| | | | Market multiple - enterprise/revenue value | | 0.5x |
| - | 6.7x | | |
| | | | | Yield | | 12.5% | | |
| | | | | | | | | | | |
| Other assets (1) | | 52 |
| | Implied Yield | | 5.1 | % | - | 5.8% | | 5.5% |
| | | Term (years) | | 10 years | | |
|
| | | | | | | | | | | | | |
| Financial Instrument Description(1) | | Fair Value at
December 31, 2019
(in millions) | | Significant Unobservable Inputs | | Range | | Weighted Average as a Percentage of Current Par Outstanding |
| Liabilities: | | |
| | | | | | | | |
| | | | | | | | | | | |
| Credit derivative liabilities, net | | $ | (185 | ) | | Year 1 loss estimates | | 0.0 | % | - | 46.0% | | 1.3% |
| | | Hedge cost (in basis points (bps)) | | 5.0 |
| - | 31.0 | | 11.0 |
| | | Bank profit (in bps) | | 51.0 |
| - | 212.0 | | 76.0 |
| | | Internal floor (in bps) | | 30.0 | | |
| | | Internal credit rating | | AAA |
| - | CCC | | AA- |
| | | | | | | | | | | |
| FG VIEs’ liabilities, at fair value | | (469 | ) | | CPR | | 0.1 | % | - | 18.6% | | 8.6% |
| | | CDR | | 1.2 | % | - | 24.7% | | 4.9% |
| | | Loss severity | | 40.0 | % | - | 100.0% | | 76.1% |
| | | Yield | | 2.7 | % | - | 8.4% | | 4.2% |
| | | | | | | | | | | |
| Liabilities of consolidated investment vehicles: | | | | | | | | | | |
| CLO obligations | | (481 | ) | | Yield | | 10.0% | | |
____________________
(1) Discounted cash flow is used as the primary valuation technique.
| |
| (2) | Excludes several investments recorded in other invested assets with fair value of $6 million. |
| |
| (3) | The primary inputs to the valuation are recent market transaction prices, supported by market multiples and yields/discount rates. |
Quantitative Information about Level 3 Fair Value Inputs
At December 31, 2018
|
| | | | | | | | | | | | | |
| Financial Instrument Description(1) | | Fair Value at
December 31, 2018
(in millions) | | Significant Unobservable Inputs | | Range | | Weighted Average as a Percentage of Current Par Outstanding |
| Assets (liabilities) (2): | | |
| | | | | | | | |
| Fixed-maturity securities : | | |
| | | | | | | | |
| Obligations of state and political subdivisions | | $ | 99 |
| | Yield | | 4.5 | % | - | 32.7% | | 12.0% |
| | | | | | | | | | | |
| Corporate securities | | 56 |
| | Yield | | 29.5% | | |
| | | | | | | | | | | |
| RMBS | | 309 |
| | CPR | | 3.4 | % | - | 19.4% | | 6.2% |
| | | CDR | | 1.5 | % | - | 6.9% | | 5.2% |
| | | Loss severity | | 40.0 | % | - | 125.0% | | 82.7% |
| | | Yield | | 5.3 | % | - | 8.1% | | 6.3% |
| Asset-backed securities: | | | | | | | | | | |
| Life insurance transactions | | 620 |
| | Yield | | 6.5 | % | - | 7.1% | | 6.8% |
| | | | | | | | | | | |
| CLOs/TruPS | | 274 |
| | Yield | | 3.8 | % | - | 4.7% | | 4.3% |
| | | | | | | | | | | |
| Others | | 53 |
| | Yield | | 11.5% | | |
| | | | | | | | | | | |
| FG VIEs’ assets, at fair value | | 569 |
| | CPR | | 0.9 | % | - | 18.1% | | 9.3% |
| | | CDR | | 1.3 | % | - | 23.7% | | 5.1% |
| | | Loss severity | | 60.0 | % | - | 100.0% | | 79.8% |
| | | Yield | | 5.0 | % | - | 10.2% | | 7.1% |
| | | | | | | | | | | |
| Other assets | | 74 |
| | Implied Yield | | 6.6 | % | - | 7.2% | | 6.9% |
| | | | Term (years) | | 10 years | | |
| | | |
| | | | | | | | |
| Credit derivative liabilities, net | | (207 | ) | | Year 1 loss estimates | | 0.0 | % | - | 66.0% | | 2.2% |
| | | Hedge cost (in bps) | | 5.5 |
| - | 82.5 | | 23.3 |
| | | Bank profit (in bps) | | 7.2 |
| - | 509.9 | | 77.3 |
| | | Internal floor (in bps) | | 8.8 |
| - | 30.0 | | 19.0 |
| | | Internal credit rating | | AAA |
| - | CCC | | AA- |
| | | | | | | | | | | |
| FG VIEs’ liabilities, at fair value | | (619 | ) | | CPR | | 0.9 | % | - | 18.1% | | 9.3% |
| | | CDR | | 1.3 | % | - | 23.7% | | 5.1% |
| | | Loss severity | | 60.0 | % | - | 100.0% | | 79.8% |
| | | Yield | | 5.0 | % | - | 10.2% | | 5.6% |
____________________
| |
| (1) | Discounted cash flow is used as the primary valuation technique for all financial instruments listed in this table. |
| |
| (2) | Excludes several investments recorded in other invested assets with fair value of $7 million. |
Not Carried at Fair Value
Financial Guaranty Insurance Contracts
Fair value is based on management’s estimate of what a similarly rated financial guaranty insurance company would demand to acquire the Company’s in-force book of financial guaranty insurance business. It is based on a variety of factors that may include pricing assumptions management has observed for portfolio transfers, commutations, and acquisitions that have occurred in the financial guaranty market, as well as prices observed in the credit derivative market with an adjustment for illiquidity so that the terms would be similar to a financial guaranty insurance contract, and also includes adjustments for stressed losses, ceding commissions and return on capital. The Company classified the fair value of financial guaranty insurance contracts as Level 3.
Long-Term Debt
Long-term debt issued by AGUS and AGMH is valued by broker-dealers using third party independent pricing sources and standard market conventions and classified as Level 2 in the fair value hierarchy. The market conventions utilize market quotations, market transactions for the Company’s comparable instruments, and to a lesser extent, similar instruments in the broader insurance industry. The fair value of notes payable was determined by calculating the present value of the expected cash flows, and was classified as Level 3 in the fair value hierarchy.
The carrying amount and estimated fair value of the Company’s financial instruments not carried at fair value are presented in the following table.
Fair Value of Financial Instruments Not Carried at Fair Value
|
| | | | | | | | | | | | | | | |
| | As of
December 31, 2019 | | As of
December 31, 2018 |
| | Carrying Amount | | Estimated Fair Value | | Carrying Amount | | Estimated Fair Value |
| | (in millions) |
| Assets (liabilities): | |
| | |
| | |
| | |
|
| Other invested assets | $ | 1 |
| | $ | 2 |
| | $ | 1 |
| | $ | 2 |
|
| Other assets (1) | 97 |
| | 97 |
| | 130 |
| | 130 |
|
| Financial guaranty insurance contracts (2) | (2,714 | ) | | (4,013 | ) | | (3,240 | ) | | (5,932 | ) |
| Long-term debt | (1,235 | ) | | (1,573 | ) | | (1,233 | ) | | (1,496 | ) |
| Other liabilities (1) | (14 | ) | | (14 | ) | | (12 | ) | | (12 | ) |
____________________
| |
| (1) | The Company's other assets and other liabilities consist predominantly of: accrued interest, management fees receivables, receivables for securities sold and payables for securities purchased, for which the carrying value approximates fair value, and a promissory note receivable. |
| |
| (2) | Carrying amount includes the assets and liabilities related to financial guaranty insurance contract premiums, losses, and salvage and subrogation and other recoverables net of reinsurance. |
The amounts and descriptions in the note relate to the Company's investments and cash other than those of the consolidated investment vehicles described in Note 14, Variable interest Entities.
Accounting Policy
The vast majority of the Company's investment portfolio consists of fixed-maturity and short-term investments, classified as available-for-sale at the time of purchase (approximately 98.8% based on fair value as of December 31, 2019), and therefore carried at fair value. Changes in fair value for other-than-temporarily-impaired securities are bifurcated between credit losses and non-credit changes in fair value. The credit loss on other-than-temporarily-impaired securities is recorded in the statement of operations and the non-credit component of the change in fair value of securities is recorded in OCI. For securities in an unrealized loss position where the Company has the intent to sell or it is more-likely-than-not that it will be required to sell the security before recovery, the entire impairment loss (i.e., the difference between the security's fair value and its amortized cost) is recorded in the consolidated statements of operations. Credit losses reduce the amortized cost of impaired securities. The amortized cost basis is adjusted for accretion and amortization (using the effective interest method) with a corresponding entry recorded in net investment income.
Realized gains and losses on sales of investments are determined using the specific identification method. Realized loss includes amounts recorded for other-than-temporary impairments (OTTI) on debt securities and the declines in fair value of securities for which the Company has the intent to sell the security or inability to hold until recovery of amortized cost.
For mortgage‑backed securities, other than loss mitigation securities, and any other holdings for which there is prepayment risk, prepayment assumptions are evaluated and revised as necessary. Any necessary adjustments due to changes in effective yields and maturities are recognized in net investment income using the retrospective method.
Loss mitigation securities are generally purchased at a discount and are accounted for based on their underlying investment type, excluding the effects of the Company’s insurance. Interest income on loss mitigation securities is recognized on a level yield basis over the remaining life of the security.
Short-term investments, which are those investments with a maturity of less than one year at time of purchase, are carried at fair value and include amounts deposited in money market funds.
Other invested assets primarily consist of equity method investments. The Company's equity method investments primarily consist of an investment in a renewable energy company, as well as investments in private equity funds and managed account investment advisors. Changes in the value of equity method investments are recorded in the consolidated statements of operations in "equity in earnings of investees." Other invested assets also includes other equity investments carried at fair value. Up until December 31, 2017, the change in fair value of preferred stock investments and certain other equity investments was recorded in OCI. Effective January 1, 2018, in accordance with ASU 2016-01, the change in fair value of these investments is recorded in other income in the consolidated statements of operations. In addition, in accordance with ASU 2016-01, the Company elected the new measurement alternative for equity securities that were accounted for under the cost method as of December 31, 2017 because they did not have a readily determinable fair value. Effective January 1, 2018, these equity securities are accounted at cost less any impairment, plus or minus the change resulting from observable price changes in orderly transactions for identical or a similar investment of the same issuer in the consolidated statements of operations.
Cash consists of cash on hand and demand deposits. As a result of the lag in reporting FG VIEs, cash and short-term investments do not reflect cash outflow to the holders of the debt issued by the FG VIEs for claim payments made by the Company's insurance subsidiaries to the consolidated FG VIEs until the subsequent reporting period.
Assessment for Other-Than Temporary Impairments
The Company has a formal review process to determine OTTI for securities in its investment portfolio where there is no intent to sell and it is not more-likely-than-not that it will be required to sell the security before recovery. Factors considered when assessing impairment include:
a decline in the market value of a security by 20% or more below amortized cost for a continuous period of at least six months;
a decline in the market value of a security for a continuous period of 12 months;
recent credit downgrades of the applicable security or the issuer by rating agencies;
the financial condition of the applicable issuer;
whether loss of investment principal is anticipated;
the impact of foreign exchange rates; and
whether scheduled interest payments are past due.
The Company assesses the ability to recover the amortized cost by comparing the net present value of projected future cash flows with the amortized cost of the security. If the security is in an unrealized loss position and its net present value is less than the amortized cost of the investment, an OTTI is recorded. The net present value is calculated by discounting the Company's estimate of projected future cash flows at the effective interest rate implicit in the debt security at the time of purchase. The Company's estimates of projected future cash flows are driven by assumptions regarding probability of default and estimates regarding timing and amount of recoveries associated with a default. The Company develops these estimates using information based on historical experience, credit analysis and market observable data, such as industry analyst reports and forecasts, sector credit ratings and other relevant data. For mortgage‑backed and asset backed securities, cash flow estimates also include prepayment and other assumptions regarding the underlying collateral such as default rates, recoveries and changes in value. The assumptions used in these projections require the use of significant management judgment. If management's assessment changes in the future, the Company may ultimately record a loss after having originally concluded that the decline in value was temporary.
In addition to the factors noted above, the Company also seeks advice from its outside investment managers.
Net Investment Income and Equity Method Investment Earnings
Net investment income is a function of the yield that the Company earns on invested assets and the size of the portfolio. Net investment income includes the income earned on fixed-maturity securities, short-term investments and other invested assets, other than investments accounted for under the equity method, which are recorded in equity in earnings of investees. The investment yield is a function of market interest rates at the time of investment as well as the type, credit quality and maturity of the invested assets. Accrued investment income, which is recorded in other assets, was $79 million and $91 million as of December 31, 2019 and December 31, 2018, respectively.
Net Investment Income
|
| | | | | | | | | | | |
| | Year Ended December 31, |
| | 2019 | | 2018 | | 2017 |
| | (in millions) |
| Income from securities managed by third parties | $ | 273 |
|
| $ | 297 |
|
| $ | 298 |
|
| Income from internally managed securities (1) | 114 |
| | 107 |
| | 128 |
|
| Gross investment income | 387 |
| | 404 |
| | 426 |
|
| Investment expenses | (9 | ) |
| (9 | ) |
| (9 | ) |
| Net investment income | $ | 378 |
| | $ | 395 |
| | $ | 417 |
|
____________________
| |
| (1) | Year ended December 31, 2017 included accretion on Zohar II Notes used as consideration for the MBIA UK Acquisition. See Note 2, Business Combinations and Assumption of Insured Portfolio. |
Realized Investment Gains (Losses)
The table below presents the components of net realized investment gains (losses).
Net Realized Investment Gains (Losses)
|
| | | | | | | | | | | |
| | Year Ended December 31, |
| | 2019 | | 2018 | | 2017 |
| | (in millions) |
| Gross realized gains on available-for-sale securities (1) | $ | 63 |
| | $ | 20 |
| | $ | 95 |
|
| Gross realized losses on available-for-sale securities | (5 | ) | | (12 | ) | | (12 | ) |
| Net realized gains (losses) on other invested assets | (1 | ) | | (1 | ) | | — |
|
| OTTI: | | | | | |
| Total OTTI | (29 | ) | | (35 | ) | | (33 | ) |
| Less: portion of OTTI recognized in OCI | 6 |
| | 4 |
| | 10 |
|
| Net OTTI recognized in net income (loss) (2) | (35 | ) | | (39 | ) | | (43 | ) |
| Net realized investment gains (losses) (3) | $ | 22 |
| | $ | (32 | ) | | $ | 40 |
|
____________________
| |
| (1) | Year ended December 31, 2017 included a gain on Zohar II Notes used as consideration for the MBIA UK Acquisition. See Note 2, Business Combinations and Assumption of Insured Portfolio. |
| |
| (2) | Net OTTI recognized in net income for 2019, 2018 and 2017 was attributable to securities purchased for loss mitigation and other risk management purposes and change in foreign exchange rates. |
| |
| (3) | Includes foreign currency gains (losses) of $(15) million, $1 million and $18 million for 2019, 2018 and 2017, respectively. |
The proceeds from sales of fixed-maturity securities classified as available-for-sale were $1,805 million, $1,180 million and $1,701 million for the years ended December 31, 2019, 2018 and 2017, respectively.
The Company recorded a gain on change in fair value of equity securities in other income of $27 million for the year ended December 31, 2018, which includes a gain of $31 million related to the Company's minority interest in the parent company of TMC Bonds LLC, which it sold in 2018. The loss on change in fair value of equity securities for the year ended December 31, 2019 was de minimis.
The following table presents the roll-forward of the credit losses on fixed-maturity securities for which the Company has recognized an OTTI and for which unrealized loss was recognized in OCI.
Roll Forward of Credit Losses
in the Investment Portfolio
|
| | | | | | | | | | | |
| | Year Ended December 31, |
| | 2019 | | 2018 | | 2017 |
| | (in millions) |
| Balance, beginning of period | $ | 185 |
| | $ | 162 |
| | $ | 134 |
|
| Additions for credit losses on securities for which an OTTI was not previously recognized | — |
| | — |
| | 13 |
|
| Reductions for securities sold and other settlements | (15 | ) | | — |
| | (4 | ) |
| Additions for credit losses on securities for which an OTTI was previously recognized | 16 |
| | 23 |
| | 19 |
|
| Balance, end of period | $ | 186 |
| | $ | 185 |
| | $ | 162 |
|
Investment Portfolio
As of December 31, 2019, the majority of the investment portfolio is managed by 6 outside managers (including Wasmer, Schroeder & Company LLC, in which the Company has a minority interest). The Company has established detailed guidelines regarding credit quality, exposure to a particular sector and exposure to a particular obligor within a sector. The managed portfolio must maintain a minimum average rating of A+ by S&P or A1 by Moody's.
The investment portfolio tables shown below include assets managed both externally and internally. The internally managed portfolio primarily consists of the Company's investments in securities for (i) loss mitigation purposes, (ii) other risk management purposes and (iii) other alternative investments that the Company believes present an attractive investment opportunity.
One of the Company's strategies for mitigating losses has been to purchase loss mitigation securities, at discounted prices. The Company also holds other invested assets that were obtained or purchased as part of negotiated settlements with insured counterparties or under the terms of the financial guaranties (other risk management assets).
Alternative investments include investing in both equity and debt securities. The Company has made minority investments in investment managers as part of its strategy of participating in that market and has also made other unrelated investments that it believes present attractive investment opportunities. In February 2017, the Company agreed to purchase up to $50$100 million of limited partnership interests in a fund that invests in the equity of private equity managers of which $86 million of the commitment was not funded as of December 31, 2019. In December 2019, the Company invested in a limited liability company that owns fuel cells.
The insurance subsidiaries currently intend to invest $500 million in Assured Investment Management funds plus additional amounts in other accounts managed by Assured Investment Management. As of December 31, 2019, the Insurance segment had committed capital to the 3 consolidated Assured Investment Management funds, of which $79 million has been drawn and invested by the respective Assured Investment Management funds and $114 million on the commitment remained outstanding. See Note 14. Variable Interest Entities. As of December 31, 2019, the uninvested portion is reflected in short-term investments in the table below.
Investment Portfolio
Carrying Value
|
| | | | | | | |
| | As of December 31, |
| | 2019 | | 2018 |
| | (in millions) |
| Fixed-maturity securities (1): | | | |
| Externally managed | $ | 7,978 |
| | $ | 8,909 |
|
| Internally managed | 876 |
| | 1,180 |
|
| Short-term investments | 1,268 |
| | 729 |
|
| Other invested assets-internally managed | | | |
| Equity method investments | 111 |
| | 47 |
|
| Other | 7 |
| | 8 |
|
| Total | $ | 10,240 |
| | $ | 10,873 |
|
____________________
| |
| (1) | 8.6% and 10.8% of fixed-maturity securities are rated BIG as of December 31, 2019 and December 31, 2018, respectively. |
Fixed-Maturity Securities and Short-Term Investments
by Security Type
As of December 31, 2019
|
| | | | | | | | | | | | | | | | | | | | | | | | | |
| Security Type | | Percent of Total(1) | | Amortized Cost | | Gross Unrealized Gains | | Gross Unrealized Losses | | Estimated Fair Value | | AOCI (2)
Pre-tax Gain
(Loss) on
Securities
with
OTTI | | Weighted Average Credit Rating (3) |
| | | (dollars in millions) |
| Fixed-maturity securities: | | |
| | |
| | |
| | |
| | |
| | |
| | |
| Obligations of state and political subdivisions | | 42 | % | | $ | 4,036 |
| | $ | 305 |
| | $ | (1 | ) | | $ | 4,340 |
| | $ | 40 |
| | AA- |
| U.S. government and agencies | | 1 |
| | 137 |
| | 10 |
| | — |
| | 147 |
| | — |
| | AA+ |
| Corporate securities | | 23 |
| | 2,137 |
| | 103 |
| | (19 | ) | | 2,221 |
| | (8 | ) | | A |
| Mortgage-backed securities(4): | | — |
| | | | | | |
| | | | |
| | |
| RMBS | | 8 |
| | 745 |
| | 37 |
| | (7 | ) | | 775 |
| | 8 |
| | A- |
| CMBS | | 4 |
| | 402 |
| | 17 |
| | — |
| | 419 |
| | — |
| | AAA |
| Asset-backed securities | | 7 |
| | 684 |
| | 38 |
| | (2 | ) | | 720 |
| | 16 |
| | BB+ |
| Non-U.S. government securities | | 2 |
| | 230 |
| | 7 |
| | (5 | ) | | 232 |
| | 3 |
| | AA |
| Total fixed-maturity securities | | 87 |
| | 8,371 |
| | 517 |
| | (34 | ) | | 8,854 |
| | 59 |
| | A+ |
| Short-term investments | | 13 |
| | 1,268 |
| | — |
| | — |
| | 1,268 |
| | — |
| | AAA |
| Total investment portfolio | | 100 | % | | $ | 9,639 |
| | $ | 517 |
| | $ | (34 | ) | | $ | 10,122 |
| | $ | 59 |
| | AA- |
Fixed-Maturity Securities and Short-Term Investments
by Security Type
As of December 31, 2018
|
| | | | | | | | | | | | | | | | | | | | | | | | | |
| Security Type | | Percent of Total(1) | | Amortized Cost | | Gross Unrealized Gains | | Gross Unrealized Losses | | Estimated Fair Value | | AOCI
Pre-tax Gain
(Loss) on
Securities
with
OTTI | | Weighted Average Credit Rating (3) |
| | | (dollars in millions) |
| Fixed-maturity securities: | | |
| | |
| | |
| | |
| | |
| | |
| | |
| Obligations of state and political subdivisions | | 45 | % | | $ | 4,761 |
| | $ | 168 |
| | $ | (18 | ) | | $ | 4,911 |
| | $ | 40 |
| | AA- |
| U.S. government and agencies | | 2 |
| | 167 |
| | 9 |
| | (1 | ) | | 175 |
| | — |
| | AA+ |
| Corporate securities | | 20 |
| | 2,175 |
| | 13 |
| | (52 | ) | | 2,136 |
| | (4 | ) | | A |
| Mortgage-backed securities(4): | | |
| | |
| | |
| | |
| | |
| | |
| | |
| RMBS | | 9 |
| | 999 |
| | 17 |
| | (34 | ) | | 982 |
| | (15 | ) | | A- |
| CMBS | | 5 |
| | 542 |
| | 4 |
| | (7 | ) | | 539 |
| | — |
| | AAA |
| Asset-backed securities | | 9 |
| | 942 |
| | 131 |
| | (5 | ) | | 1,068 |
| | 97 |
| | BB |
| Non-U.S. government securities | | 3 |
| | 298 |
| | 2 |
| | (22 | ) | | 278 |
| | — |
| | AA |
| Total fixed-maturity securities | | 93 |
| | 9,884 |
| | 344 |
| | (139 | ) | | 10,089 |
| | 118 |
| | A+ |
| Short-term investments | | 7 |
| | 729 |
| | — |
| | — |
| | 729 |
| | — |
| | AAA |
| Total investment portfolio | | 100 | % | | $ | 10,613 |
| | $ | 344 |
| | $ | (139 | ) | | $ | 10,818 |
| | $ | 118 |
| | A+ |
____________________
| |
| (1) | Based on amortized cost. |
| |
| (2) | Accumulated OCI (AOCI). |
| |
| (3) | Ratings represent the lower of the Moody’s and S&P classifications, except for bonds purchased for loss mitigation or risk management strategies, which use internal ratings classifications. The Company’s portfolio primarily consists of high-quality, liquid instruments. |
| |
| (4) | U.S. government-agency obligations were approximately 42% of mortgage backed securities as of December 31, 2019 and 48% as of December 31, 2018, based on fair value. |
The Company’s investment portfolio in tax-exempt and taxable municipal securities includes issuances by a wide number of municipal authorities across the U.S. and its territories.
The following tables present the fair value of the Company’s available-for-sale portfolio of obligations of state and political subdivisions as of December 31, 2019 and December 31, 2018 by state.
Fair Value of Available-for-Sale Portfolio of
Obligations of State and Political Subdivisions
As of December 31, 2019 (1)
|
| | | | | | | | | | | | | | | | | | | | | | |
| State | | State General Obligation | | Local General Obligation | | Revenue Bonds | | Total Fair Value | | Amortized Cost | | Average Credit Rating |
| | | (in millions) |
| California | | 68 |
| | 70 |
| | 380 |
| | $ | 518 |
| | 457 |
| | A |
| New York | | $ | 6 |
| | $ | 46 |
| | $ | 408 |
| | $ | 460 |
| | $ | 431 |
| | AA |
| Texas | | 23 |
| | 122 |
| | 287 |
| | 432 |
| | 404 |
| | AA |
| Washington | | 52 |
| | 69 |
| | 181 |
| | 302 |
| | 284 |
| | AA |
| Florida | | 8 |
| | 3 |
| | 233 |
| | 244 |
| | 229 |
| | A+ |
| Illinois | | 18 |
| | 53 |
| | 125 |
| | 196 |
| | 182 |
| | A |
| Massachusetts | | 71 |
| | — |
| | 115 |
| | 186 |
| | 171 |
| | AA |
| Pennsylvania | | 38 |
| | 4 |
| | 95 |
| | 137 |
| | 128 |
| | A+ |
| Georgia | | 11 |
| | 10 |
| | 92 |
| | 113 |
| | 104 |
| | AA- |
| District of Columbia | | 30 |
| | — |
| | 69 |
| | 99 |
| | 94 |
| | AA |
| All others | | 71 |
| | 172 |
| | 915 |
| | 1,158 |
| | 1,080 |
| | AA- |
| Total | | $ | 396 |
| | $ | 549 |
| | $ | 2,900 |
| | $ | 3,845 |
| | $ | 3,564 |
| | AA- |
Fair Value of Available-for-Sale Portfolio of
Obligations of State and Political Subdivisions
As of December 31, 2018 (1)
|
| | | | | | | | | | | | | | | | | | | | | | |
| State | | State General Obligation | | Local General Obligation | | Revenue Bonds | | Total Fair Value | | Amortized Cost | | Average Credit Rating |
| | | (in millions) |
| New York | | $ | 5 |
| | $ | 49 |
| | $ | 492 |
| | $ | 546 |
| | $ | 536 |
| | AA |
| Texas | | 19 |
| | 170 |
| | 344 |
| | 533 |
| | 520 |
| | AA |
| California | | 63 |
| | 77 |
| | 378 |
| | 518 |
| | 482 |
| | A |
| Washington | | 80 |
| | 81 |
| | 193 |
| | 354 |
| | 349 |
| | AA |
| Florida | | 8 |
| | 13 |
| | 220 |
| | 241 |
| | 236 |
| | A+ |
| Massachusetts | | 75 |
| | — |
| | 144 |
| | 219 |
| | 211 |
| | AA |
| Illinois | | 16 |
| | 55 |
| | 127 |
| | 198 |
| | 192 |
| | A |
| Pennsylvania | | 35 |
| | 5 |
| | 98 |
| | 138 |
| | 136 |
| | A+ |
| District of Columbia | | 41 |
| | — |
| | 92 |
| | 133 |
| | 131 |
| | AA |
| Georgia | | 10 |
| | 10 |
| | 94 |
| | 114 |
| | 110 |
| | AA- |
| All others | | 96 |
| | 210 |
| | 1,103 |
| | 1,409 |
| | 1,369 |
| | AA- |
| Total | | $ | 448 |
| | $ | 670 |
| | $ | 3,285 |
| | $ | 4,403 |
| | $ | 4,272 |
| | AA- |
____________________
| |
| (1) | Excludes $495 million and $508 million as of December 31, 2019 and 2018, respectively, of pre-refunded bonds, at fair value. The credit ratings are based on the underlying ratings and do not include any benefit from bond insurance. |
The revenue bond portfolio primarily consists of essential service revenue bonds issued by transportation authorities and other utilities, water and sewer authorities and universities.
Revenue Bonds
Sources of Funds
|
| | | | | | | | | | | | | | | | |
| | | As of December 31, 2019 | | As of December 31, 2018 |
| Type | | Fair Value | | Amortized Cost | | Fair Value | | Amortized Cost |
| | | (in millions) |
| Transportation | | $ | 916 |
| | $ | 835 |
| | $ | 967 |
| | $ | 925 |
|
| Higher education | | 488 |
| | 456 |
| | 557 |
| | 543 |
|
| Water and sewer | | 453 |
| | 422 |
| | 580 |
| | 566 |
|
| Tax backed | | 426 |
| | 397 |
| | 471 |
| | 458 |
|
| Healthcare | | 236 |
| | 220 |
| | 278 |
| | 270 |
|
| Municipal utilities | | 234 |
| | 212 |
| | 287 |
| | 267 |
|
| All others | | 147 |
| | 137 |
| | 145 |
| | 143 |
|
| Total | | $ | 2,900 |
| | $ | 2,679 |
| | $ | 3,285 |
| | $ | 3,172 |
|
The following tables summarize, for all fixed-maturity securities in an unrealized loss position, the aggregate fair value and gross unrealized loss by length of time the amounts have continuously been in an unrealized loss position.
Fixed-Maturity Securities
Gross Unrealized Loss by Length of Time
As of December 31, 2019
|
| | | | | | | | | | | | | | | | | | | | | | | |
| | Less than 12 months | | 12 months or more | | Total |
| | Fair Value | | Unrealized Loss | | Fair Value | | Unrealized Loss | | Fair Value | | Unrealized Loss |
| | (dollars in millions) |
| Obligations of state and political subdivisions | $ | 45 |
| | $ | (1 | ) | | $ | — |
| | $ | — |
| | $ | 45 |
| | $ | (1 | ) |
| U.S. government and agencies | 5 |
| | — |
| | 5 |
| | — |
| | 10 |
| | — |
|
| Corporate securities | 61 |
| | — |
| | 119 |
| | (19 | ) | | 180 |
| | (19 | ) |
| Mortgage-backed securities: | | | | | | | |
| |
|
| |
|
|
| RMBS | 10 |
| | — |
| | 75 |
| | (7 | ) | | 85 |
| | (7 | ) |
| CMBS | — |
| | — |
| | 4 |
| | — |
| | 4 |
| | — |
|
| Asset-backed securities | 24 |
| | — |
| | 183 |
| | (2 | ) | | 207 |
| | (2 | ) |
| Non-U.S. government securities | — |
| | — |
| | 56 |
| | (5 | ) | | 56 |
| | (5 | ) |
| Total | $ | 145 |
| | $ | (1 | ) | | $ | 442 |
| | $ | (33 | ) | | $ | 587 |
| | $ | (34 | ) |
| Number of securities | |
| | 57 |
| | |
| | 119 |
| | |
| | 176 |
|
| Number of securities with OTTI | |
| | 1 |
| | |
| | 7 |
| | |
| | 8 |
|
Fixed-Maturity Securities
Gross Unrealized Loss by Length of Time
As of December 31, 2018
|
| | | | | | | | | | | | | | | | | | | | | | | |
| | Less than 12 months | | 12 months or more | | Total |
| | Fair Value | | Unrealized Loss | | Fair Value | | Unrealized Loss | | Fair Value | | Unrealized Loss |
| | (dollars in millions) |
| Obligations of state and political subdivisions | $ | 195 |
| | $ | (4 | ) | | $ | 658 |
| | $ | (14 | ) | | $ | 853 |
| | $ | (18 | ) |
| U.S. government and agencies | 11 |
| | — |
| | 24 |
| | (1 | ) | | 35 |
| | (1 | ) |
| Corporate securities | 836 |
| | (19 | ) | | 522 |
| | (33 | ) | | 1,358 |
| | (52 | ) |
| Mortgage-backed securities: | |
| | |
| | |
| | |
| | | | |
| RMBS | 85 |
| | (2 | ) | | 447 |
| | (32 | ) | | 532 |
| | (34 | ) |
| CMBS | 111 |
| | (1 | ) | | 164 |
| | (6 | ) | | 275 |
| | (7 | ) |
| Asset-backed securities | 322 |
| | (4 | ) | | 38 |
| | (1 | ) | | 360 |
| | (5 | ) |
| Non-U.S. government securities | 83 |
| | (4 | ) | | 99 |
| | (18 | ) | | 182 |
| | (22 | ) |
| Total | $ | 1,643 |
| | $ | (34 | ) | | $ | 1,952 |
| | $ | (105 | ) | | $ | 3,595 |
| | $ | (139 | ) |
| Number of securities (1) | |
| | 417 |
| | |
| | 608 |
| | |
| | 997 |
|
| Number of securities with OTTI (1) | |
| | 22 |
| | |
| | 22 |
| | |
| | 42 |
|
___________________
| |
| (1) | The number of securities does not add across because lots consisting of the same securities have been purchased at different times and appear in both categories above (i.e., less than 12 months and 12 months or more). If a security appears in both categories, it is counted only once in the total column. |
Of the securities in an unrealized loss position for 12 months or more as of December 31, 2019 and December 31, 2018, 19 and 38 securities, respectively, had unrealized losses greater than 10% of book value. The total unrealized loss for these securities was $25 million as of December 31, 2019 and $43 million as of December 31, 2018. The Company considered the credit quality, cash flows, interest rate movements, ability to hold a security to recovery and intent to sell a security in determining whether a security had a credit loss. The Company has determined that the unrealized losses recorded as of December 31, 2019 and December 31, 2018 were not related to credit quality.
The amortized cost and estimated fair value of available-for-sale fixed-maturity securities by contractual maturity as of December 31, 2019 are shown below. Expected maturities will differ from contractual maturities because borrowers may have the right to call or prepay obligations with or without call or prepayment penalties.
Distribution of Fixed-Maturity Securities
by Contractual Maturity
As of December 31, 2019
|
| | | | | | | |
| | Amortized Cost | | Estimated Fair Value |
| | (in millions) |
| Due within one year | $ | 326 |
| | $ | 334 |
|
| Due after one year through five years | 1,538 |
| | 1,591 |
|
| Due after five years through 10 years | 2,022 |
| | 2,128 |
|
| Due after 10 years | 3,338 |
| | 3,607 |
|
| Mortgage-backed securities: | |
| | |
|
| RMBS | 745 |
| | 775 |
|
| CMBS | 402 |
| | 419 |
|
| Total | $ | 8,371 |
| | $ | 8,854 |
|
Based on fair value, investments and restricted assets that are either held in trust for the benefit of third party ceding insurers in accordance with statutory requirements, placed on deposit to fulfill state licensing requirements, or otherwise pledged or restricted totaled $280 million and $266 million, as of December 31, 2019 and December 31, 2018, respectively. The investment portfolio also contains securities that are held in trust by certain AGL subsidiaries or otherwise restricted for the benefit of other AGL subsidiaries in accordance with statutory and regulatory requirements in the amount of $1,502 million and $1,855 million, based on fair value as of December 31, 2019 and December 31, 2018, respectively.
No material investments of the Company were non-income producing for years ended December 31, 2019 and 2018, respectively.
| |
| 11. | Contracts Accounted for as Credit Derivatives |
The Company has a portfolio of financial guaranty contracts that meet the definition of a derivative in accordance with GAAP (primarily CDS). The credit derivative portfolio also includes interest rate swaps.
Credit derivative transactions are governed by International Swaps and Derivatives Association, Inc. documentation and have certain characteristics that differ from financial guaranty insurance contracts. For example, the Company’s control rights with respect to a reference obligation under a credit derivative may be more limited than when the Company issues a financial guaranty insurance contract. In addition, there are more circumstances under which the Company may be obligated to make payments. Similar to a financial guaranty insurance contract, the Company would be obligated to pay if the obligor failed to make a scheduled payment of principal or interest in full. However, the Company may also be required to pay if the obligor becomes bankrupt or if the reference obligation were restructured if, after negotiation, those credit events are specified in the documentation for the credit derivative transactions. Furthermore, the Company may be required to make a payment due to an event that is unrelated to the performance of the obligation referenced in the credit derivative. If events of default or termination events specified in the credit derivative documentation were to occur, the non-defaulting or the non-affected party, which may be either the Company or the counterparty, depending upon the circumstances, may decide to terminate a credit derivative prior to maturity. In that case, the Company may be required to make a termination payment to its swap counterparty upon such termination. Absent such an event of default or termination event, the Company may not unilaterally terminate a CDS contract; however, the Company on occasion has mutually agreed with various counterparties to terminate certain CDS transactions.
Accounting Policy
Credit derivatives are recorded at fair value. Changes in fair value are recorded in “net change in fair value of credit derivatives” on the consolidated statement of operations. The fair value of credit derivatives is reflected as either net assets or net liabilities determined on a contract by contract basis in the Company's consolidated balance sheets. See Note 9, Fair Value Measurement, for a discussion on the fair value methodology for credit derivatives.
Credit Derivative Net Par Outstanding by Sector
The components of the Company’s credit derivative net par outstanding are presented in the table below. The estimated remaining weighted average life of credit derivatives was 11.5 years and 11.6 years as of at December 31, 2019 and December 31, 2018, respectively.
Credit Derivatives (1)
|
| | | | | | | | | | | | | | | | |
| | | As of December 31, 2019 | | As of December 31, 2018 (2) |
| | | Net Par Outstanding | | Net Fair Value Asset (Liability) | | Net Par Outstanding | | Net Fair Value Asset (Liability) |
| | | (in millions) |
| | | | | | | | | |
| U.S public finance | | $ | 1,942 |
| | $ | (83 | ) | | $ | 1,783 |
| | $ | (65 | ) |
| Non-U.S public finance | | 2,676 |
| | (39 | ) | | 2,807 |
| | (51 | ) |
| U.S structured finance | | 1,206 |
| | (58 | ) | | 1,465 |
| | (85 | ) |
| Non-U.S structured finance | | 132 |
| | (5 | ) | | 127 |
| | (6 | ) |
| Total | | $ | 5,956 |
| | $ | (185 | ) | | $ | 6,182 |
| | $ | (207 | ) |
____________________
(1) Expected recoveries were $4 million as of December 31, 2019 and $2 million as of December 31, 2018.
| |
| (2) | Prior year presentation has been conformed to the current year's presentation. |
Distribution of Credit Derivative Net Par Outstanding by Internal Rating
|
| | | | | | | | | | | | | | |
| | | As of December 31, 2019 | | As of December 31, 2018 |
| Ratings | | Net Par Outstanding | | % of Total | | Net Par Outstanding | | % of Total |
| | | (dollars in millions) |
| AAA | | $ | 1,730 |
| | 29.0 | % | | $ | 1,813 |
| | 29.4 | % |
| AA | | 1,695 |
| | 28.5 |
| | 1,690 |
| | 27.3 |
|
| A | | 1,110 |
| | 18.6 |
| | 1,171 |
| | 18.9 |
|
| BBB | | 1,292 |
| | 21.7 |
| | 1,351 |
| | 21.9 |
|
| BIG (1) | | 129 |
| | 2.2 |
| | 157 |
| | 2.5 |
|
| Credit derivative net par outstanding | | $ | 5,956 |
| | 100.0 | % | | $ | 6,182 |
| | 100.0 | % |
____________________
| |
| (1) | All BIG credit derivatives are U.S. RMBS transactions. |
Fair Value of Credit Derivatives
Net Change in Fair Value of Credit Derivative Gains (Losses)
|
| | | | | | | | | | | |
| | Year Ended December 31, |
| | 2019 | | 2018 | | 2017 |
| | (in millions) |
| Realized gains on credit derivatives | $ | 8 |
| | $ | 9 |
| | $ | 17 |
|
| Net credit derivative losses (paid and payable) recovered and recoverable and other settlements | (35 | ) | | (25 | ) | | (27 | ) |
| Realized gains (losses) and other settlements | (27 | ) | | (16 | ) | | (10 | ) |
| Net unrealized gains (losses) | 21 |
| | 128 |
| | 121 |
|
| Net change in fair value of credit derivatives | $ | (6 | ) | | $ | 112 |
| | $ | 111 |
|
Realized losses and other settlements for 2019 were primarily due to payments related to various U.S. structured finance transactions, including those for a final maturity paydown and for which there was an offsetting unrealized gain. Realized losses and other settlements for 2018 and 2017 were primarily due to a paydown of a U.S. structured finance transaction, for which there was an offsetting unrealized gain.
During 2019, non-credit impairment fair value gains were generated primarily as a result of price improvements on the underlying collateral of the Company's CDS. These unrealized fair value gains were partially offset by unrealized fair value losses resulting from wider implied net spreads driven by the decreased market cost to buy protection in AGC’s name during the period. For those CDS transactions that were pricing at or above their floor levels, when the cost of purchasing CDS protection on AGC, which management refers to as the CDS spread on AGC, decreased, the implied spreads that the Company would expect to receive on these transactions increased.
During 2018, non-credit impairment fair value gains were primarily generated by CDS terminations, run-off of CDS par and price improvements on the underlying collateral of the Company’s CDS. In addition, unrealized fair value gains were generated by the increase in credit given to the primary insurer on one of the Company's second-to-pay CDS policies during the period. The unrealized fair value gains were partially offset by unrealized fair value losses resulting from wider implied net spreads driven by the decreased cost to buy protection in AGC’s name, as the market cost of AGC’s credit protection decreased during the period.
During 2017, non-credit impairment fair value gains were primarily generated by CDS terminations, run-off of net par outstanding, and price improvements on the underlying collateral of the Company’s CDS. The majority of the CDS transactions that were terminated were as a result of settlement agreements with several CDS counterparties. During 2017, the cost to buy protection in AGC’s name, specifically the five-year CDS spread, did not change materially during the period, and therefore did not have a material impact on the Company’s unrealized fair value gains and losses on CDS.
The impact of changes in credit spreads will vary based upon the volume, tenor, interest rates, and other market conditions at the time these fair values are determined. In addition, since each transaction has unique collateral and structural terms, the underlying change in fair value of each transaction may vary considerably. The fair value of credit derivative contracts also reflects the change in the Company’s own credit cost based on the price to purchase credit protection on AGC. The Company determines its own credit risk based on quoted CDS prices traded on the Company at each balance sheet date.
CDS Spread on AGC (in bps)
|
| | | | | | | | |
| | As of
December 31, 2019 | | As of
December 31, 2018 | | As of
December 31, 2017 |
| Five-year CDS spread | 41 |
| | 110 |
| | 163 |
|
| One-year CDS spread | 9 |
| | 22 |
| | 70 |
|
Fair Value of Credit Derivative Assets (Liabilities)
and Effect of AGC
Credit Spread
|
| | | | | | | |
| | As of
December 31, 2019 | | As of
December 31, 2018 |
| | (in millions) |
| Fair value of credit derivatives before effect of AGC credit spread | $ | (261 | ) | | $ | (407 | ) |
| Plus: Effect of AGC credit spread | 76 |
| | 200 |
|
| Net fair value of credit derivatives | $ | (185 | ) | | $ | (207 | ) |
The fair value of CDS contracts at December 31, 2019, before considering the benefit applicable to AGC’s credit spreads, is a direct result of the relatively wide credit spreads of certain underlying credits generally due to the long tenor of these credits.
Collateral Posting for Certain Credit Derivative Contracts
The transaction documentation with 1 counterparty for $180 million in CDS net par insured by the Company requires the Company to post collateral, subject to a $180 million cap, to secure its obligation to make payments under such contracts. Eligible collateral is generally cash or U.S. government or agency securities; eligible collateral other than cash is valued at a discount to the face amount. As of December 31, 2019, AGC did not have to post collateral to satisfy these requirements.
Accounting Policy
In connection with the BlueMountain Acquisition, the FASB's new revenue recognition guidance, Topic 606 Revenue from Contracts with Customers (ASC 606), is applicable to the Company. Management, CLO and performance fees earned by Assured Investment Management are accounted for as contracts with customers. Under the guidance for contracts with customers, an entity is required to (a) identify the contract(s) with a customer, (b) identify the performance obligations in the contract, (c) determine the transaction price, (d) allocate the transaction price to the performance obligations in the contract, and (e) recognize revenue when (or as) the entity satisfies a performance obligation. In determining the transaction price, an entity may include variable consideration only to the extent that it is probable that a significant reversal in the amount of cumulative revenue recognized would not occur when the uncertainty associated with the variable consideration is resolved.
Management and CLO fees are derived from providing professional services to manage investment funds and CLOs. Investment management services are satisfied over time as the services are provided and are typically based on a percentage of the value of the client’s assets under management. Performance fee revenue will fluctuate from period to period and may not correlate with general market changes, since most of these fees are driven by absolute performance. Performance fee revenues are generated on certain management contracts when performance hurdles are achieved. Such fee revenues are recorded when the contractual performance criteria have been met and when it is probable that a significant reversal of revenue recognized will not occur in future reporting periods. Given the uniqueness of each fee arrangement, performance fee contracts are evaluated on an individual basis to determine the timing of revenue recognition.
Asset Management Fees
Management and CLO Fees
The Company receives a management fee in exchange for providing investment advisory and management services. These annual management fees are generally as follows.
Fees range from 0.70% to 2.00% per annum calculated on either the beginning of the month or quarter, or month-end NAV of the respective funds.
For the Company's management or servicing of the Assured Investment Management CLOs the Company receives, generally 0.35% to 0.50% (combined senior investment management fee and subordinated investment management fee) per annum based on NAV, and 20% per annum of the remaining interest proceeds and principal proceeds after the incentive management fee threshold has been satisfied. The portion of these fees that pertains to the investment by Assured Investment Management funds is typically rebated to the Assured Investment Management funds.
The Company may waive some or the entire management fee with respect to any investor. Certain current and former employees of the Company who have investments in the Assured Investment Management funds are not charged any management fees.
Performance Fees
In accordance with the investment management agreements, and by serving as the general partner, managing member or managing general partner, the Company also receives performance fees. Annual performance fee rates are generally as follows:
Range from 10% to 20% of the net profits in excess of the high-water mark for the respective fund, or
Range from 18% to 30% of the total cash received by investors in excess of certain benchmarks, or
30% of the net profits in excess of the high-water mark and a credit for management fees
Performance fees related to certain Assured Investment Management funds may be subject to future clawback and repayment. Determining the amount of performance fees to record is subject to qualitative and quantitative factors including where the fund is in its life-cycle, whether the Company has received or is entitled to receive performance fees and potential sales of fund investments. To the extent that performance fees have been received, but not earned, the company will recognize a liability for unearned revenue in the consolidated balance sheets. The general partner has the right, in its sole discretion, to
require certain Assured Investment Management funds to distribute to the general partner an amount equal to its presumed tax liability attributable to the allocated taxable income relating to performance fees with respect to such fiscal year and are contractually not subject to clawback. There were no tax distributions recorded during 2019.
The Company may waive some or all of the performance fees with respect to any investor. Certain current and former employees of the Company who have investments in the Assured Investment Management funds are not charged any performance fees.
The following table presents the sources of asset management fees since the BlueMountain Acquisition Date:
Asset Management Fees
|
| | | |
| | Year Ended
December 31, 2019 |
| | (in millions) |
| Management fees: | |
| CLOs (1) | $ | 3 |
|
| Opportunity funds | 2 |
|
| Wind-down funds | 13 |
|
| Total management fees | 18 |
|
| Performance fees | 4 |
|
| Total asset management fees | $ | 22 |
|
_____________________
| |
| (1) | Gross management fees from CLOs, before rebates were $11 million. |
The Company had management and performance fees receivable, which are included in other assets on the consolidated balance sheets, of $9 million as of December 31, 2019. The Company had 0 unearned revenues as of December 31, 2019.
| |
| 13. | Goodwill and Other Intangible Assets |
Accounting Policy
Goodwill is attributable to the BlueMountain Acquisition in the Asset Management segment and represents the excess cost over identifiable net assets of an acquired business. The Company tests goodwill annually for impairment or more frequently if circumstances indicate an impairment may have occurred. The goodwill impairment analysis is performed at the reporting unit level which is equal to the Company's operating segment level. If, after assessing qualitative factors, the Company believes that it is more likely than not that the fair value of the reporting unit is less than its carrying amount, the Company will evaluate impairment quantitatively to determine and record the amount of goodwill impairment as the excess of the carrying amount of the reporting unit over its fair value. Inherent in such fair value determinations are certain judgments and estimates relating to future cash flows, including the Company’s interpretation of current economic indicators and market valuations, and assumptions about the Company’s strategic plans with regard to its operations. Due to the uncertainties associated with such estimates, actual results could differ from such estimates.
The Company's finite-lived intangible assets consist primarily of contractual rights to earn future asset management fees from the acquired management and CLO contracts as well as a CLO distribution network. Such finite-lived intangible assets are recorded at fair value on the date of acquisition and amortized over their estimated useful lives.
The Company tests finite‑lived intangible assets for impairment if certain events occur or circumstances change indicating that the carrying amount of the intangible asset may not be recoverable. The Company evaluates impairment by comparing the estimated fair value attributable to the intangible asset being evaluated with its carrying amount. If an impairment is determined to exist by management, the Company accelerates amortization expense so that the carrying amount represents fair value.
The Company's indefinite-lived intangible assets consist of the value of insurance licenses acquired in prior business combinations. The Company assesses indefinite-lived intangible assets for impairment annually or more frequently if
circumstances indicate an impairment may have occurred. If a qualitative assessment reveals that it is more-likely-than-not that the asset is impaired, the Company calculates an updated fair value.
The following table summarizes the carrying value for the Company's goodwill and other intangible assets:
Goodwill and Other Intangible Assets
|
| | | | | | | | | |
| | Weighted Average Amortization Period as of | | As of December 31 |
| | December 31, 2019 | | 2019 | | 2018 |
| | | | (in millions) |
| Goodwill (1) | | | $ | 117 |
| | $ | — |
|
| Finite-lived intangible assets: | | | | | |
| CLO contracts | 8.8 years | | 42 |
| | — |
|
| Investment management contracts | 4.5 years | | 24 |
| | — |
|
| CLO distribution network | 4.8 years | | 9 |
| | — |
|
| Trade name | 9.8 years | | 3 |
| | — |
|
| Favorable sublease | 4.2 years | | 1 |
| | — |
|
| Lease-related intangibles | 7.0 years | | 3 |
| | 3 |
|
| Finite-lived intangible assets, gross | 7.0 years | | 82 |
| | 3 |
|
| Accumulated amortization | | | (5 | ) | | (1 | ) |
| Finite-lived intangible assets, net | | | 77 |
| | 2 |
|
| Licenses (indefinite-lived) | | | 22 |
| | 22 |
|
| Total goodwill and other intangible assets | | | $ | 216 |
| | $ | 24 |
|
_____________________
| |
| (1) | Includes goodwill allocated to the European subsidiaries of BlueMountain. The balance changes due to foreign currency translation. The amount of goodwill deductible for tax purposes was approximately $115 million as of December 31, 2019. |
Goodwill and substantially all finite-lived intangible assets relate to the Company’s acquisition of BlueMountain on October 1, 2019. To date, there have been 0 impairments of goodwill or intangible assets. Amortization expense, which is recorded in other operating expenses in the consolidated statements of operations, associated with finite-lived intangible assets was $3 million for the year ended December 31, 2019, and $1 million in 2017. For 2018, amortization expense was de minimis.
As of December 31, 2019, future annual amortization of finite-lived intangible assets for the years 2020 through 2024 and thereafter is estimated to be:
Estimated Future Amortization Expense
for Finite-Lived Intangible Assets
|
| | | | |
| | | As of December 31, 2019 |
| Year | | (in millions) |
| 2020 | $ | 13 |
|
| 2021 | 12 |
|
| 2022 | 11 |
|
| 2023 | 11 |
|
| 2024 | 10 |
|
| Thereafter | 20 |
|
| Total | $ | 77 |
|
| |
| 14. | Variable Interest Entities |
Accounting Policy
The types of entities the Company assesses for consolidation principally include (1) entities whose debt obligations the insurance subsidiaries insures in its financial guaranty business, and (2) investment vehicles such as collateralized financing entities and investment funds managed by the asset management subsidiaries, in which the Company has a variable interest. For each of these types of entities, the Company assesses whether it is the primary beneficiary. If the Company concludes that it is the primary beneficiary, it consolidates the VIE in the Company's financial statements and eliminates the effects of intercompany transactions with the insurance subsidiaries and intercompany transactions between consolidated VIEs.
The Company determines whether it is the primary beneficiary of a VIE at the time it becomes involved with a VIE and continuously reconsiders the conclusion at each reporting date. In determining whether it is the primary beneficiary, the Company evaluates its direct and indirect interests in the VIE. The primary beneficiary of a VIE is the enterprise that has both 1) the power to direct the activities of a VIE that most significantly impact the entity's economic performance; and 2) the obligation to absorb losses of the entity that could potentially be significant to the VIE or the right to receive benefits from the entity that could potentially be significant to the VIE.
Financial Guaranty Variable Interest Entities
The Company provides financial guaranties with respect to debt obligations of special purpose entities, including VIEs but does not act as the servicer or collateral manager for any VIE obligations guaranteed by its insurance subsidiaries. The transaction structure generally provides certain financial protections to the Company. This financial protection can take several forms, the most common of which are overcollateralization, first loss protection (or subordination) and excess spread. In the case of overcollateralization (i.e., the principal amount of the securitized assets exceeds the principal amount of the structured finance obligations guaranteed by the Company), the structure allows defaults of the securitized assets before a default is experienced on the structured finance obligation guaranteed by the Company. In the case of first loss, the Company's financial guaranty insurance policy only covers a senior layer of losses experienced by multiple obligations issued by the VIEs. The first loss exposure with respect to the assets is either retained by the seller or sold off in the form of equity or mezzanine debt to other investors. In the case of excess spread, the financial assets contributed to VIEs, generate interest income that are in excess of the interest payments on the debt issued by the VIE. Such excess spread is typically distributed through the transaction’s cash flow waterfall and may be used to create additional credit enhancement, applied to redeem debt issued by the VIE (thereby, creating additional overcollateralization), or distributed to equity or other investors in the transaction.
Assured Guaranty is not primarily liable for the debt obligations issued by the VIEs it insures and would only be required to make payments on those insured debt obligations in the event that the issuer of such debt obligations defaults on any principal or interest due and only for the amount of the shortfall. AGL’s and its subsidiaries’ creditors do not have any rights with regard to the collateral supporting the debt issued by the FG VIEs. Proceeds from sales, maturities, prepayments and interest from such underlying collateral may only be used to pay debt service on FG VIEs’ liabilities. Net fair value gains and losses on FG VIEs are expected to reverse to 0 at maturity of the FG VIEs’ debt, except for net premiums received and net claims paid by Assured Guaranty under the financial guaranty insurance contract. The Company’s estimate of expected loss to be paid for FG VIEs is included in Note 6, Expected Loss to be Paid.
As part of the terms of its financial guaranty contracts, the Company, under its insurance contract, obtains certain protective rights with respect to the VIE that give the Company additional controls over a VIE. These protective rights are triggered by the occurrence of certain events, such as failure to be in compliance with a covenant due to poor deal performance or a deterioration in a servicer or collateral manager's financial condition. At deal inception, the Company typically is not deemed to control a VIE; however, once a trigger event occurs, the Company's control of the VIE typically increases. The Company continuously evaluates its power to direct the activities that most significantly impact the economic performance of VIEs that have debt obligations insured by the Company and, accordingly, where the Company is obligated to absorb VIE losses or receive benefits that could potentially be significant to the VIE. The Company is deemed to be the control party for certain VIEs under GAAP, typically when its protective rights give it the power to both terminate and replace the deal servicer, which are characteristics specific to the Company's financial guaranty contracts. If the protective rights that could make the Company the control party have not been triggered, then the VIE is not consolidated. If the Company is deemed no longer to have those protective rights, the VIE is deconsolidated.
The FG VIEs’ liabilities that are insured by the Company are considered to be with recourse, because the Company guarantees the payment of principal and interest regardless of the performance of the related FG VIEs’ assets. FG VIEs’
liabilities that are not insured by the Company are considered to be without recourse, because the payment of principal and interest of these liabilities is wholly dependent on the performance of the FG VIEs’ assets.
The Company has limited contractual rights to obtain the financial records of its consolidated FG VIEs. The FG VIEs do not prepare separate GAAP financial statements; therefore, the Company compiles GAAP financial information for them based on trustee reports prepared by and received from third parties. Such trustee reports are not available to the Company until approximately 30 days after the end of any given period. The time required to perform adequate reconciliations and analyses of the information in these trustee reports results in a one quarter lag in reporting the FG VIEs’ activities. The Company records the fair value of FG VIEs’ assets and liabilities based on modeled prices. The Company updates the model assumptions each reporting period for the most recent available information, which incorporates the impact of material events that may have occurred since the quarter lag date. The net change in the fair value of consolidated FG VIEs’ assets and liabilities is recorded in "fair value gains (losses) on FG VIEs" in the consolidated statements of operations, except for change in fair value of FG VIEs’ liabilities with recourse caused by changes in ISCR which is now separately presented in OCI, effective January 1, 2018. The inception to date change in fair value of the FG VIEs’ liabilities with recourse attributable to the ISCR is calculated by holding all current period assumptions constant for each security and isolating the effect of the change in the Company’s CDS spread from the most recent date of consolidation to the current period. In general, if the Company’s CDS spread tightens, more value will be assigned to the Company’s credit; however, if the Company’s CDS widens, less value is assigned to the Company’s credit. Interest income and interest expense are derived from the trustee reports and also included in "fair value gains (losses) on FG VIEs." The Company has elected the fair value option for assets and liabilities classified as FG VIEs’ assets and liabilities because the carrying amount transition method was not practical.
Number of FG VIEs Consolidated
|
| | | | | | | | |
| | Year Ended December 31, |
| | 2019 | | 2018 | | 2017 |
| | |
| Beginning of year | 31 |
| | 32 |
| | 32 |
|
| Consolidated | 1 |
| | — |
| | 2 |
|
| Deconsolidated | (3 | ) | | (1 | ) | | (2 | ) |
| Matured | (2 | ) | | — |
| | — |
|
| December 31 | 27 |
| | 31 |
| | 32 |
|
The change in the ISCR of the FG VIEs’ assets held as of December 31, 2019 that was recorded in the consolidated statements of operations for 2019 was a gain of $39 million. The change in the ISCR of the FG VIEs’ assets was a gain of $7 million for 2018 and a gain of $35 million for 2017. To calculate ISCR, the change in the fair value of the FG VIEs’ assets is allocated between changes that are due to ISCR and changes due to other factors, including interest rates. The ISCR amount is determined by using expected cash flows at the original date of consolidation discounted at the effective yield less current expected cash flows discounted at that same original effective yield.
|
| | | | | | | |
| | As of
December 31, 2019 | | As of
December 31, 2018 |
| | (in millions) |
| Excess of unpaid principal over fair value of: | | | |
| FG VIEs' assets | $ | 279 |
| | $ | 350 |
|
| FG VIEs' liabilities with recourse | 21 |
| | 48 |
|
| FG VIEs' liabilities without recourse | 19 |
| | 28 |
|
| Unpaid principal balance for FG VIEs’ assets that were 90 days or more past due | 52 |
| | 71 |
|
| Unpaid principal for FG VIEs’ liabilities with recourse (1) | 388 |
| | 565 |
|
____________________
(1) FG VIEs’ liabilities with recourse will mature at various dates ranging from 2019 to 2038.
The table below shows the carrying value of the consolidated FG VIEs’ assets and liabilities in the consolidated financial statements, segregated by the types of assets that collateralize the respective debt obligations for FG VIEs’ liabilities with recourse.
Consolidated FG VIEs
By Type of Collateral
|
| | | | | | | | | | | | | | | |
| | As of December 31, 2019 | | As of December 31, 2018 |
| | Assets | | Liabilities | | Assets | | Liabilities |
| | (in millions) |
| With recourse: | |
| | |
| | |
| | |
|
| U.S. RMBS first lien | $ | 270 |
| | $ | 297 |
| | $ | 299 |
| | $ | 326 |
|
| U.S. RMBS second lien | 70 |
| | 70 |
| | 115 |
| | 137 |
|
| Manufactured housing | — |
| | — |
| | 53 |
| | 54 |
|
| Total with recourse | 340 |
| | 367 |
| | 467 |
| | 517 |
|
| Without recourse | 102 |
| | 102 |
| | 102 |
| | 102 |
|
| Total | $ | 442 |
| | $ | 469 |
| | $ | 569 |
| | $ | 619 |
|
Consolidated Investment Vehicles
Through a jointly owned subsidiary, AGM, AGC and MAC, the U.S. insurance subsidiaries, initially intend to invest $500 million in Assured Investment Management funds. In the fourth quarter of 2019, $79 million was invested in three separate Assured Investment Management funds; AHP, ABIF and CLO Warehouse Fund. As of December 31, 2019, the fair value of such investments was $77 million. CLO Warehouse Fund invested in the subordinated notes of CLO XXVI.
AHP, ABIF, CLO Warehouse Fund and CLO XXVI (collectively, the consolidated investment vehicles) are VIEs. The Company consolidates these investment vehicles as it is deemed to be the primary beneficiary based on its power to direct the most significant activities of each VIE (through its Assured Investment Management asset management subsidiaries) and its level of economic interest in the entities (through its U.S. insurance subsidiaries).
AHP and ABIF are investment companies under ASC 946, and therefore account for their underlying investments at fair value. CLO XXVI is a CFE under ASC 810. Under the ASC 810 practical expedient for CFEs, the Company elected to measure CLO XXVI's assets and liabilities using the fair value of its assets, which are more observable. Changes in the fair value of assets and liabilities of consolidated investment vehicles are recorded in "other income" in the consolidated statement of operations.
As a result of consolidating AHP, ABIF and CLO Warehouse Fund, the Company records noncontrolling interest (NCI) for the portion of each fund owned by employees and any third party investors. As of December 31, 2019, redeemable employee-owned NCI, held in ABIF and CLO Warehouse Fund, is classified outside of stockholder’s equity, within temporary equity. For AHP, nonredeemable NCI is presented within shareholders' equity in the consolidated balance sheets.
The assets and liabilities of the Company's consolidated investment vehicles (which include consolidated funds: AHP, ABIF and CLO Warehouse Fund as well as CLO XXVI) are held within separate legal entities. The assets of the consolidated investment vehicles are not available to creditors of the Company, other than creditors of the applicable consolidated investment vehicles. In addition, creditors of the consolidated investment vehicles have no recourse against the assets of the Company, other than the assets of such applicable consolidated investment vehicles.
Generally, the consolidation of the Company's consolidated investment vehicles and FG VIEs has a significant gross-up effect on the Company's assets, liabilities and cash flows. The consolidated investment vehicles have no net effect on the net income attributable to the Company, other than the economic interest the Company holds in consolidated funds in the Company's Insurance segment. The ownership interests of the Company's consolidated funds, to which the Company has no economic rights, are reflected as either redeemable or nonredeemable NCI in the consolidated funds in the Company's consolidated financial statements. Liquidity available at the Company's consolidated investment vehicles is typically not available for corporate liquidity needs, except to the extent of the Company's investment in the fund.
Assets and Liabilities
of Consolidated Investment Vehicles
|
| | | |
| | As of
December 31, 2019 |
| | (in millions) |
| Assets: | |
| Cash and restricted cash (1) | $ | 14 |
|
| Corporate loans of CFE, at fair value | 494 |
|
| Corporate loans, at fair value | 47 |
|
| Other assets (2) | 17 |
|
| Total assets | $ | 572 |
|
| Liabilities: | |
| CLO obligations of CFE, at fair value (3) | $ | 481 |
|
| Other liabilities | 1 |
|
| Total liabilities | $ | 482 |
|
____________________
| |
| (1) | Cash held by consolidated investment vehicles are not available to fund the general liquidity needs of the Company. |
| |
| (2) | Includes investment in affiliates of $9 million. |
| |
| (3) | The weighted average maturity and weighted average interest rate of CLO obligations were 12.8 years and 3.8%, respectively. CLO obligations will mature in 2032. |
As of December 31, 2019, the consolidated investment vehicles had a commitment to invest $13 million.
Redeemable Noncontrolling Interests in Consolidated Investment Vehicles
|
| | | |
| | Year Ended December 31, 2019 |
| | (in millions) |
| Beginning balance | $ | — |
|
| Contributions to investment vehicles | 12 |
|
| Distributions from investment vehicles | (4 | ) |
| Net loss | (1 | ) |
| December 31, | $ | 7 |
|
Interest income and interest expense are included in "other income." Investment purchases and sales for all consolidated investment vehicles are classified as operating activities, debt issuances and repayments are classified in financing activities.
Effect of Consolidating VIEs
The effect on the statements of operations and financial condition of consolidating FG VIEs includes (i) changes in fair value gains (losses) on FG VIEs’ assets and liabilities, (ii) the elimination of premiums and losses related to the AGC and AGM FG VIEs’ liabilities with recourse and (iii) the elimination of investment balances related to the Company’s purchase of AGC and AGM insured FG VIEs’ debt. Upon consolidation of a FG VIE, the related insurance and, if applicable, the related investment balances, are considered intercompany transactions and therefore eliminated. Such eliminations are included in the table below to present the full effect of consolidating FG VIEs.
The effect on the statements of operations and balance sheets of consolidating Assured Investment Management investment vehicles includes (i) changes in fair value of consolidated investment vehicles, (2) the elimination of the equity in earnings in investees related to the Insurance segment's investments in the consolidated Assured Investment Management funds, (3) the elimination of debt of the consolidated CLO against the assets of the consolidated CLO Warehouse Fund, and (4) the recording of NCI for the proportion of each consolidated Assured Investment Management fund that is not owned by any other subsidiary of the Company.
The cash flows generated by the FG VIEs’ assets are classified as cash flows from investing activities. Paydowns of FG VIEs' liabilities are supported by the cash flows generated by FG VIEs’ assets, and for liabilities with recourse, possibly claim payments made by AGM or AGC under its financial guaranty insurance contracts. Paydowns of FG VIEs' liabilities both with and without recourse are classified as cash flows used in financing activities. Interest income, interest expense and other expenses of the FG VIEs’ assets and liabilities are classified as operating cash flows. Claim payments made by AGC and AGM under the financial guaranty contracts issued to the FG VIEs are eliminated upon consolidation and therefore such claim payments are treated as paydowns of FG VIEs’ liabilities as a financing activity as opposed to an operating activity of AGM and AGC.
Cash flows of the consolidated investment vehicles attributable to such entities' investment purchases and dispositions, as well as operating expenses of the investment vehicles are presented as cash flow from operating activities in the consolidated statement of cash flows. Financing activities and capital cash flows to and from investors are presented as financing activities consistent with investment company guidelines.
Effect of Consolidating VIEs
on the Consolidated Balance Sheets
Increase (Decrease)
|
| | | | | | | |
| | As of
December 31, 2019 | | As of
December 31, 2018 |
| | (in millions) |
| Assets | | | |
| Investment portfolio: | | | |
| Fixed maturity securities and short-term investments | $ | (39 | ) | | $ | (38 | ) |
| Equity method investments (1) | (77 | ) | | — |
|
| Total investments | (116 | ) | | (38 | ) |
| Premiums receivable, net of commissions payable | (7 | ) | | (9 | ) |
| Salvage and subrogation recoverable | (8 | ) | | (1 | ) |
| FG VIEs’ assets, at fair value | 442 |
| | 569 |
|
| Assets of consolidated investment vehicles (1) | 572 |
| | — |
|
| Total assets | $ | 883 |
| | $ | 521 |
|
| Liabilities and shareholders’ equity | | | |
| Unearned premium reserve | $ | (39 | ) | | $ | (51 | ) |
| Loss and LAE reserve | (41 | ) | | (48 | ) |
| FG VIEs’ liabilities with recourse, at fair value | 367 |
| | 517 |
|
| FG VIEs’ liabilities without recourse, at fair value | 102 |
| | 102 |
|
| Liabilities of consolidated investment vehicles (1) | 482 |
| | — |
|
| Total liabilities | 871 |
| | 520 |
|
| | | | |
| Redeemable noncontrolling interests in consolidated investment vehicles (1) | 7 |
| | — |
|
| | | | |
| Retained earnings | 34 |
| | 34 |
|
| Accumulated other comprehensive income | (35 | ) | | (33 | ) |
| Total shareholders’ equity attributable to Assured Guaranty Ltd. | (1 | ) | | 1 |
|
| Nonredeemable noncontrolling interests (1) | 6 |
| | — |
|
| Total shareholders’ equity | 5 |
| | 1 |
|
| Total liabilities, redeemable noncontrolling interests and shareholders’ equity | $ | 883 |
| | $ | 521 |
|
____________________
| |
| (1) | These line items represent the components of the effect of consolidating Assured Investment Management investment vehicles. |
Effect of Consolidating VIEs
on the Consolidated Statements of Operations
Increase (Decrease)
|
| | | | | | | | | | | |
| | Year Ended December 31, |
| | 2019 | | 2018 | | 2017 |
| | (in millions) |
| Net earned premiums | $ | (18 | ) | | $ | (12 | ) | | $ | (15 | ) |
| Net investment income | (4 | ) | | (4 | ) | | (5 | ) |
| Fair value gains (losses) on FG VIEs (1) | 42 |
| | 14 |
| | 30 |
|
| Other income (loss) (2) | (3 | ) | | — |
| | — |
|
| Loss and LAE | (20 | ) | | (3 | ) | | 7 |
|
| Equity in net earnings of investees | 2 |
| | — |
| | — |
|
| Effect on income before tax | (1 | ) | | (5 | ) | | 17 |
|
| Less: Tax provision (benefit) | — |
| | (1 | ) | | 6 |
|
| Effect on net income (loss) | (1 | ) | | (4 | ) | | 11 |
|
| Effect on redeemable noncontrolling interests | (1 | ) | | — |
| | — |
|
| Effect on net income (loss) attributable to AGL | $ | — |
| | $ | (4 | ) | | $ | 11 |
|
____________________
| |
| (1) | See consolidated statements of comprehensive income and Note 22, Other Comprehensive Income, for information on changes in fair value of the FG VIEs’ liabilities with recourse that are attributable to changes in the Company's own credit risk. |
| |
| (2) | Represents change in fair value of consolidated investment vehicles. |
Effect of Consolidating VIEs
on Consolidated Statements of Cash Flows
Inflows (Outflows)
|
| | | | | | | | | | | |
| | Year Ended December 31, |
| | 2019 | | 2018 | | 2017 |
| | (in millions) |
| Effect on cash flows from operating activities | $ | (254 | ) | | $ | 11 |
| | $ | 19 |
|
| Effect on cash flows from investing activities | 259 |
| | 105 |
| | 138 |
|
| Effect on cash flows from financing activities | 9 |
| | (116 | ) | | (157 | ) |
| Total effect on cash flows | $ | 14 |
| | $ | — |
| | $ | — |
|
For 2019, the fair value gains on FG VIEs were attributable to higher recoveries on second lien U.S. RMBS FG VIEs' assets. For 2018 and 2017, the primary driver of the gain in fair value of FG VIEs’ assets and FG VIEs’ liabilities was an increase in the value of the FG VIEs’ assets resulting from improvement in the underlying collateral. The change in fair value of consolidated investment vehicles was a loss of $3 million for the year ended December 31, 2019.
Other Consolidated VIEs
In certain instances where the Company consolidates a VIE that was established as part of a loss mitigation negotiated settlement that results in the termination of the original insured financial guaranty insurance or credit derivative contract, the Company classifies the assets and liabilities of those VIEs in the line items that most accurately reflect the nature of the items, as opposed to within the FG VIEs’ assets and FG VIEs’ liabilities. The largest of these VIEs had assets of $91 million and liabilities of $12 million as of December 31, 2019 and assets of $87 million and liabilities of $21 million as of December 31, 2018, primarily recorded in the investment portfolio and credit derivative liabilities on the consolidated balance sheets.
Non-Consolidated VIEs
As described in Note 5, Outstanding Insurance Exposure, the Company monitors all policies in the insured portfolio. Of the approximately 18 thousand policies monitored as of December 31, 2019, approximately 16 thousand policies are not within the scope of ASC 810 because these financial guaranties relate to the debt obligations of governmental organizations or financing entities established by a governmental organization. The majority of the remaining policies involve transactions where the Company is not deemed to currently have control over the FG VIEs’ most significant activities. As of December 31, 2019 and 2018, the Company identified 90 and 110 policies, respectively, that contain provisions and experienced events that may trigger consolidation. Based on management’s assessment of these potential triggers or events, the Company consolidated 27 and 31 FG VIEs as of December 31, 2019 and December 31, 2018, respectively. The Company’s exposure provided through its financial guaranties with respect to debt obligations of FG VIEs is included within net par outstanding in Note 5, Outstanding Insurance Exposure.
The Company manages funds and CLOs that have been determined to be a VIE or voting interest entity, in which the Company concluded that it held no variable interests, through either equity interests held, debt interests held or decision-making fees received by the Assured Investment Management subsidiaries. As such, the Company does not consolidate these entities.
15. Long-Term Debt and Credit Facilities
Accounting Policy
Long-term debt is recorded at principal amounts net of any unamortized original issue discount or premium and unamortized acquisition date fair value adjustment for AGM and AGMH debt. Discounts and acquisition date fair value adjustments are accreted into interest expense over the life of the applicable debt.
Long Term Debt
The Company has outstanding long-term debt primarily consisting of debt issued by AGUS and AGMH. All of the AGUS and AGMH debt is fully and unconditionally guaranteed by AGL; AGL's guarantee of the junior subordinated debentures is on a junior subordinated basis.
Intercompany Loans Payable
On October 1, 2019, AGM, AGC and MAC made 10 year, 3.5% interest rate intercompany loans to AGUS totaling $250 million to fund the BlueMountain Acquisition and the related capital contributions. Interest will be payable annually in arrears on each anniversary of the note, commencing on October 1, 2020. Interest will accrue daily and be computed on a basis of a 360 day year from October 1, 2019 until the date on which the principal amount is paid in full. AGUS will pay 20% of the original principal amount of each note on the sixth, seventh, eighth, and ninth anniversaries. The remaining 20% of the original principal amount and all accrued and unpaid interest will be paid on the maturity date. AGUS has the right to prepay the principal amount of the notes in whole or in part at any time, or from time to time, without payment of any premium or penalty.
See Note 2, Business Combinations and Assumption of Insured Portfolio, for additional information.
In addition, in 2012 AGUS borrowed $90 million from its affiliate AGRO to fund the acquisition of MAC. In 2018, the maturity date was extended to November 2023. During 2019, 2018 and 2017, AGUS repaid $10 million, $10 million and $10 million, respectively, in outstanding principal as well as accrued and unpaid interest. As of December 31, 2019, $40 million remained outstanding.
Debt Issued by AGUS
7% Senior Notes. On May 18, 2004, AGUS issued $200 million of 7% Senior Notes due 2034 (7% Senior Notes) for net proceeds of $197 million. Although the coupon on the Senior Notes is 7%, the effective rate is approximately 6.4%, taking into account the effect of a cash flow hedge executed by the Company in March 2004. The notes are redeemable, in whole or in part, at their principal amount plus accrued and unpaid interest to the date of redemption or, if greater, the make-whole redemption price.
5% Senior Notes. On June 20, 2014, AGUS issued $500 million of 5% Senior Notes due 2024 (5% Senior Notes) for net proceeds of $495 million. The net proceeds from the sale of the notes were used for general corporate purposes, including
the purchase of AGL common shares. The notes are redeemable, in whole or in part, at their principal amount plus accrued and unpaid interest to the date of redemption or, if greater, the make-whole redemption price.
Series A Enhanced Junior Subordinated Debentures. On December 20, 2006, AGUS issued $150 million of Debentures due 2066. The Debentures paid a fixed 6.4% rate of interest until December 15, 2016, and thereafter pay a floating rate of interest, reset quarterly, at a rate equal to three month LIBOR plus a margin equal to 2.38%. AGUS may select at 1 or more times to defer payment of interest for 1 or more consecutive periods for up to ten years. Any unpaid interest bears interest at the then applicable rate. AGUS may not defer interest past the maturity date. The debentures are redeemable, in whole or in part, at their principal amount plus accrued and unpaid interest to the date of redemption.
Debt Issued by AGMH
6 7/8% QUIBS. On December 19, 2001, AGMH issued $100 million face amount of 6 7/8% QUIBS due December 15, 2101, which are redeemable without premium or penalty in whole or in part at their principal amount plus accrued and unpaid interest to the date of redemption.
6.25% Notes. On November 26, 2002, AGMH issued $230 million face amount of 6.25% Notes due November 1, 2102, which are redeemable without premium or penalty in whole or in part at their principal amount plus accrued and unpaid interest to the date of redemption.
5.6% Notes. On July 31, 2003, AGMH issued $100 million face amount of 5.6% Notes due July 15, 2103, which are redeemable without premium or penalty in whole or in part at their principal amount plus accrued and unpaid interest to the date of redemption.
Junior Subordinated Debentures. On November 22, 2006, AGMH issued $300 million face amount of Junior Subordinated Debentures with a scheduled maturity date of December 15, 2036 and a final repayment date of December 15, 2066. The final repayment date of December 15, 2066 may be automatically extended up to 4 times in five-year increments provided certain conditions are met. The debentures are redeemable, in whole or in part, at any time prior to December 15, 2036 at their principal amount plus accrued and unpaid interest to the date of redemption or, if greater, the make-whole redemption price. Interest on the debentures will accrue from November 22, 2006 to December 15, 2036 at the annual rate of 6.4%. If any amount of the debentures remains outstanding after December 15, 2036, then the principal amount of the outstanding debentures will bear interest at a floating interest rate equal to one-month LIBOR plus 2.215% until repaid. AGMH may elect at 1 or more times to defer payment of interest on the debentures for 1 or more consecutive interest periods that do not exceed ten years. In connection with the completion of this offering, AGMH entered into a replacement capital covenant for the benefit of persons that buy, hold or sell a specified series of AGMH long-term indebtedness ranking senior to the debentures. Under the covenant, the debentures will not be repaid, redeemed, repurchased or defeased by AGMH or any of its subsidiaries on or before the date that is 20 years prior to the final repayment date, except to the extent that AGMH has received proceeds from the sale of replacement capital securities. The proceeds from this offering were used to pay a dividend to the shareholders of AGMH.
The principal and carrying values of the Company’s debt are presented in the table below.
Principal and Carrying Amounts of Debt
|
| | | | | | | | | | | | | | | |
| | As of December 31, 2019 | | As of December 31, 2018 |
| | Principal |
| Carrying Value |
| Principal |
| Carrying Value |
| | (in millions) |
| AGUS: | |
|
| |
|
| |
|
| |
|
| 7% Senior Notes (1) | $ | 200 |
| | $ | 197 |
|
| $ | 200 |
| | $ | 197 |
|
| 5% Senior Notes (1) | 500 |
| | 497 |
| | 500 |
| | 497 |
|
| Series A Enhanced Junior Subordinated Debentures (2) | 150 |
| | 150 |
|
| 150 |
| | 150 |
|
| AGUS long-term debt | 850 |
| | 844 |
|
| 850 |
| | 844 |
|
| Intercompany loans payable | 290 |
| | 290 |
| | 50 |
| | 50 |
|
| Total AGUS | 1,140 |
| | 1,134 |
| | 900 |
| | 894 |
|
| AGMH (3): | |
| | |
|
| |
| | |
|
67/8% QUIBS (1) | 100 |
| | 70 |
|
| 100 |
| | 70 |
|
| 6.25% Notes (1) | 230 |
| | 144 |
|
| 230 |
| | 143 |
|
| 5.6% Notes (1) | 100 |
| | 58 |
|
| 100 |
| | 57 |
|
| Junior Subordinated Debentures (2) | 300 |
| | 204 |
|
| 300 |
| | 198 |
|
| Total AGMH | 730 |
| | 476 |
|
| 730 |
| | 468 |
|
| AGM (3): | |
| | |
|
| |
| | |
|
| AGM Notes Payable | 4 |
| | 4 |
|
| 5 |
| | 5 |
|
| Total AGM | 4 |
| | 4 |
|
| 5 |
| | 5 |
|
| AGMH's debt purchased by AGUS | (131 | ) | | (89 | ) | | (128 | ) | | (84 | ) |
| Elimination of intercompany loans payable | (290 | ) | | (290 | ) | | (50 | ) | | (50 | ) |
| Total | $ | 1,453 |
| | $ | 1,235 |
|
| $ | 1,457 |
| | $ | 1,233 |
|
____________________
| |
| (1) | AGL fully and unconditionally guarantees these obligations. |
| |
| (2) | Guaranteed by AGL on a junior subordinated basis. |
| |
| (3) | Carrying amounts are different than principal amounts primarily due to fair value adjustments at the date of the AGMH acquisition, which are accreted or amortized into interest expense over the remaining terms of these obligations. |
The following table presents the principal amounts of AGMH's outstanding Junior Subordinated Debentures that AGUS purchased and the loss on extinguishment of debt recognized by the Company. The Company may choose to make additional purchases of this or other Company debt in the future.
AGUS's Purchase
of AGMH's Junior Subordinated Debentures
|
| | | | | | | | | | | |
| | Year Ended December 31, |
| | 2019 | | 2018 | | 2017 |
| | (in millions) |
| Principal amount repurchased | $ | 3 |
| | $ | 100 |
| | $ | 28 |
|
| Loss on extinguishment of debt (1) | 1 |
| | 34 |
| | 9 |
|
____________________
| |
| (1) | Included in other income in the consolidated statements of operations. The loss represents the difference between the amount paid to purchase AGMH's debt and the carrying value of the debt, which includes the unamortized fair value adjustments that were recorded upon the acquisition of AGMH in 2009. |
Principal payments due under the long-term debt are as follows:
Expected Maturity Schedule of Debt
As of December 31, 2019
|
| | | | | | | | | | | | | | | | | | | | |
| | | AGUS | | AGMH (1) | | AGM | | Eliminations (2) | | Total |
| | | (in millions) |
| 2020 | | $ | — |
| | $ | — |
| | $ | 2 |
| | $ | — |
| | $ | 2 |
|
| 2021 | | — |
| | — |
| | — |
| | — |
| | — |
|
| 2022 | | — |
| | — |
| | — |
| | — |
| | — |
|
| 2023 | | 40 |
| | — |
| | — |
| | (40 | ) | | — |
|
| 2024 | | 500 |
| | — |
| | — |
| | — |
| | 500 |
|
| 2025-2044 | | 450 |
| | — |
| | 2 |
| | (250 | ) | | 202 |
|
| 2045-2064 | | — |
| | — |
| | — |
| | — |
| | — |
|
| 2065-2084 | | 150 |
| | 300 |
| | — |
| | (131 | ) | | 319 |
|
| Thereafter | | — |
| | 430 |
| | — |
| | — |
| | 430 |
|
| Total | | $ | 1,140 |
| | $ | 730 |
| | $ | 4 |
| | $ | (421 | ) | | $ | 1,453 |
|
____________________
| |
| (1) | Includes AGMH's debt purchased by AGUS of $131 million. |
| |
| (2) | Includes eliminations of intercompany loans payable and AGMH's debt purchased by AGUS. |
Interest Expense
|
| | | | | | | | | | | |
| | Year Ended December 31, |
| | 2019 | | 2018 | | 2017 |
| | (in millions) |
| AGUS: | |
| | |
| | |
|
| 7% Senior Notes | $ | 13 |
| | $ | 13 |
| | $ | 13 |
|
| 5% Senior Notes | 26 |
| | 26 |
| | 26 |
|
| Series A Enhanced Junior Subordinated Debentures | 7 |
| | 7 |
| | 5 |
|
| AGUS long-term debt | 46 |
| | 46 |
| | 44 |
|
| Intercompany loans payable | 5 |
| | 3 |
| | 3 |
|
| Total AGUS | 51 |
| | 49 |
| | 47 |
|
| AGMH: | |
| | |
| | |
|
67/8% QUIBS | 7 |
| | 7 |
| | 7 |
|
| 6.25% Notes | 16 |
| | 15 |
| | 16 |
|
| 5.6% Notes | 6 |
| | 6 |
| | 6 |
|
| Junior Subordinated Debentures | 25 |
| | 25 |
| | 25 |
|
| Total AGMH | 54 |
| | 53 |
| | 54 |
|
| AGMH's debt purchased by AGUS | (11 | ) |
| (5 | ) |
| (1 | ) |
| Elimination of intercompany loans payable | (5 | ) | | (3 | ) | | (3 | ) |
| Total | $ | 89 |
| | $ | 94 |
| | $ | 97 |
|
Intercompany Credit Facility
On October 25, 2013, AGL, as borrower, and AGUS, as lender, entered into a revolving credit facility pursuant to which AGL may, from time to time, borrow for general corporate purposes. Under the credit facility, AGUS committed to lend a principal amount not exceeding $225 million in the aggregate. In September 2018, AGL and AGUS amended the revolving credit facility to extend the commitment until October 25, 2023 (the loan commitment termination date). The unpaid principal amount of each loan will bear interest at a fixed rate equal to 100% of the then applicable interest rate as determined under Section 1274(d) of the Code, and interest on all loans will be computed for the actual number of days elapsed on the basis of a year consisting of 360 days. Accrued interest on all loans will be paid on the last day of each June and December, beginning on December 31, 2013, and at maturity. AGL must repay the then unpaid principal amounts of the loans by the third anniversary of the loan commitment termination date. NaN amounts are currently outstanding under the credit facility.
Committed Capital Securities
Each of AGC and AGM have entered into put agreements with 4 separate custodial trusts allowing AGC and AGM, respectively, to issue an aggregate of $200 million of non-cumulative redeemable perpetual preferred stocksecurities to the trusts in exchange for cash. Each custodial trust was created for the primary purpose of issuing $50 million face amount of CCS, investing the proceeds in high-quality assets and entering into put options with AGC (theor AGM, as applicable. The Company does not consider itself to be the primary beneficiary of the trusts and the trusts are not consolidated in Assured Guaranty's financial statements.
The trusts provide AGC Preferred Stock). The custodial trusts were created as a vehicle for providing capital support to AGC by allowing AGC to obtain immediateand AGM access to new equity capital at itstheir respective sole discretion at any time through the exercise of the put option. If the put options were exercised, AGC would receive $200 million in return for the issuanceoptions. Upon AGC's or AGM's exercise of its own perpetualput option, the relevant trust will liquidate its portfolio of eligible assets and use the proceeds to purchase the AGC or AGM preferred stock, as applicable. AGC or AGM may use the proceeds from its sale of which may be usedpreferred stock to the trusts for any purpose, including the payment of claims. The put optionsagreements have not been exercised through theno scheduled termination date of this filing.
Distributions on theor maturity. However, each put agreement will terminate if (subject to certain grace periods) specified events occur. Both AGC CCS are determined pursuant to an auction process. Beginning on April 7, 2008 this auction process failed, thereby increasing the annualized rate on the AGC CCS to one-month LIBOR plus 250 basis points.
In June 2003, $200 million of “AGM CPS”, money market preferred trust securities, were issued by trusts created for the primary purpose of issuing theand AGM CPS, investing the proceeds in high-quality commercial paper and selling put options to AGM, allowing AGM to issue the trusts non-cumulative redeemable perpetual preferred stock (the AGM Preferred Stock) of AGM in exchange for cash. There are four trusts, each with an initial aggregate face amount of $50 million. These trusts hold auctions every 28 days, at which time investors submit bid orders to purchase AGM CPS. If AGM were to exercise a put option, the applicable trust would transfer the portion of the proceeds attributable to principal received upon maturity of its assets, net of expenses, to AGM in exchange for AGM Preferred Stock. AGM pays a floating put premium to the trusts, which represents the difference between the commercial paper yield and the winning auction rate (plus all fees and expenses of the trust). If an auction does not attract sufficient clearing bids, however, the auction rate is subject to a maximum rate of one-month LIBOR plus 200 basis points for the next succeeding distribution period. Beginning in August 2007, the AGM CPS required the maximum rate for each of the relevant trusts. AGM continuescontinue to have the ability to exercise itstheir respective put optionoptions and cause the related trusts to purchase their preferred stock.
Prior to 2008 or 2007, the amounts paid on the CCS were established through an auction process. All of those auctions failed in 2008 or 2007, and the rates paid on the CCS increased to their respective maximums. The annualized rate on the AGC CCS is one-month LIBOR plus 250 bps, and the annualized rate on the AGM Preferred Stock. The trusts provide AGM access to new capital at its sole discretion through the exercise of the put options. As of December 31, 2016 the put option had not been exercised.CPS is one-month LIBOR plus 200 bps.
See Note 7,9, Fair Value Measurement, –Other Assets–Committed Capital Securities, for a discussion of the fair value measurement discussion.of the CCS.
| |
| 16. | Employee Benefit Plans |
Accounting Policy
Share-based compensation expense is based on the grant date fair value using the grant date closing price, the lattice, Monte Carlo or Black-Scholes-Merton (Black-Scholes) pricing models. The Company amortizes the fair value of share-based awards on a straight-line basis over the requisite service periods of the awards, which are generally the vesting periods, with the exception of retirement‑eligible employees. For retirement-eligible employees, certain awards contain retirement provisions and therefore are amortized over the period through the date the employee first becomes eligible to retire and is no longer required to provide service to earn part or all of the award.
The fair value of each award under the Assured Guaranty Ltd. Employee Stock Purchase Plan is estimated at the beginning of the offering period using the Black-Scholes option valuation model.
The expense for Performance Retention Plan awards is recognized straight-line over the requisite service period, with the exception of retirement eligible employees. For retirement eligible employees, the expense is recognized immediately.
Assured Guaranty Ltd. 2004 Long-Term Incentive Plan
Under the Assured Guaranty Ltd. 2004 Long-Term Incentive Plan, as amended (the Incentive Plan), the number of AGL common shares that may be delivered under the Incentive Plan may not exceed 18,670,000. In the event of certain transactions affecting AGL's common shares, the number or type of shares subject to the Incentive Plan, the number and type of shares subject to outstanding awards under the Incentive Plan, and the exercise price of awards under the Incentive Plan, may be adjusted.
The Incentive Plan authorizes the grant of incentive stock options, non-qualified stock options, stock appreciation rights, and full value awards that are based on AGL's common shares. The grant of full value awards may be in return for a participant's previously performed services, or in return for the participant surrendering other compensation that may be due, or may be contingent on the achievement of performance or other objectives during a specified period, or may be subject to a risk of forfeiture or other restrictions that will lapse upon the achievement of one or more goals relating to completion of service by the participant, or achievement of performance or other objectives. Awards under the Incentive Plan may accelerate and become vested upon a change in control of AGL.
The Incentive Plan is administered by the Compensation Committee of AGL's Board of Directors (the Board), except as otherwise determined by the Board. The Board may amend or terminate the Incentive Plan. As of December 31, 2019, 9,311,090 common shares were available for grant under the Incentive Plan.
Time Vested Stock Options
Stock options are generally granted once a year with exercise prices equal to the closing price on the date of grant. To date, the Company has only issued non-qualified stock options. All stock options, except for performance stock options, granted to employees vest in equal annual installments over a three-year period and expire seven years or ten years from the date of grant. Stock options granted to directors vest over one year and expire in seven years or ten years from grant date. None of the Company's options, except for performance stock options, have a performance or market condition.
Time Vested Stock Options
|
| | | | | | | | | |
| | Options for Common Shares | | Weighted Average Exercise Price | | Number of Exercisable Options |
| Balance as of December 31, 2018 | 373,628 |
| | $ | 18.77 |
| | 373,628 |
|
| Options granted | — |
| | — |
| | |
| Options exercised | (283,277 | ) | | 18.16 |
| | |
| Options forfeited/expired | — |
| | — |
| | |
| Balance as of December 31, 2019 | 90,351 |
| | $ | 20.68 |
| | 90,351 |
|
As of December 31, 2019, the aggregate intrinsic value and weighted average remaining contractual term of stock options outstanding were $2.6 million and 0.7 years, respectively. As of December 31, 2019, the aggregate intrinsic value and weighted average remaining contractual term of exercisable stock options were $2.6 million and 0.7 years, respectively.
NaN options were granted in 2019, 2018 and 2017. As of December 31, 2019, there were 0 unexpensed outstanding non-vested options.
The total intrinsic value of stock options exercised during the years ended December 31, 2019, 2018 and 2017 was $8.2 million, $9.9 million and $6.6 million, respectively. During the years ended December 31, 2019, 2018 and 2017, $2.3 million, $2.4 million and $4.7 million, respectively, was received from the exercise of stock options. In order to satisfy stock option exercises, the Company issues new shares.
Performance Stock Options
The Company grants performance stock options under the Incentive Plan. These awards are non-qualified stock options with exercise prices equal to the closing price of an AGL common share on the applicable date of grant. These awards vest 35%, 50% or 100%, if the price of AGL's common shares using the highest 40-day average share price reaches certain hurdles. If the share price is between the specified levels, the vesting level will be interpolated accordingly. These awards expire seven years from the date of grant.
Performance Stock Options
|
| | | | | | | | | |
| | Options for Common Shares | | Weighted Average Exercise Price | | Number of Exercisable Options |
| Balance as of December 31, 2018 | 27,552 |
| | $ | 19.24 |
| | 27,552 |
|
| Options granted | — |
| | — |
| | |
| Options exercised | (27,552 | ) | | 19.24 |
| | |
| Options forfeited/expired | — |
| | — |
| | |
| Balance as of December 31, 2019 | — |
| | $ | — |
| | — |
|
NaN options were granted in 2019, 2018 and 2017.
The total intrinsic value of performance stock options exercised during the years ended December 31, 2019, 2018 and 2017 was $0.7 million, $3.8 million and $0.7 million, respectively. During the years ended December 31, 2019, 2018 and 2017, $0.5 million, $2.7 million and $0.2 million, respectively, was received from the exercise of performance stock options. In order to satisfy stock option exercises, the Company issues new shares. The tax benefit from time vested and performance stock options exercised during 2019 was $0.9 million.
Restricted Stock Awards
Restricted stock awards are valued based on the closing price of the underlying shares at the date of grant. Restricted stock awards to employees generally vest in equal annual installments over a four-year period and restricted stock awards to outside director's vest in full in one year. Restricted stock awards to employees are amortized on a straight-line basis over the requisite service periods of the awards, and restricted stock awards to outside directors are amortized over one year, which are generally the vesting periods, with the exception of retirement‑eligible employees, discussed above.
Restricted Stock Award Activity
|
| | | | | | | |
| Nonvested Shares | | Number of Shares | | Weighted Average Grant Date Fair Value Per Share |
| Nonvested at December 31, 2018 | 51,746 |
| | $ | 35.56 |
|
| Granted | 48,241 |
| | 45.98 |
|
| Vested | (51,746 | ) | | 35.56 |
|
| Forfeited | — |
| | — |
|
| Nonvested at December 31, 2019 | 48,241 |
| | $ | 45.98 |
|
As of December 31, 2019, the total unrecognized compensation cost related to outstanding nonvested restricted stock awards was $0.7 million, which the Company expects to recognize over the weighted‑average remaining service period of 0.3 years. The total fair value of shares vested during the years ended December 31, 2019, 2018 and 2017 was $1.8 million, $1.9 million and $1.5 million, respectively.
Restricted Stock Units
Restricted stock units are valued based on the closing price of the underlying shares at the date of grant. Restricted stock units awarded to employees have vesting terms similar to those of the restricted stock awards and are delivered on the vesting date. The Company has granted restricted stock units to directors of the Company.
Restricted Stock Unit Activity
|
| | | | | | | |
| Nonvested Stock Units | | Number of Stock Units | | Weighted Average Grant Date Fair Value Per Share |
| Nonvested at December 31, 2018 | 900,276 |
| | $ | 33.83 |
|
| Granted | 464,500 |
| | 44.40 |
|
| Vested | (375,981 | ) | | 28.03 |
|
| Forfeited | (1,528 | ) | | 40.90 |
|
| Nonvested at December 31, 2019 | 987,267 |
| | $ | 41.24 |
|
As of December 31, 2019, the total unrecognized compensation cost related to outstanding nonvested restricted stock units was $25 million, which the Company expects to recognize over the weighted‑average remaining service period of 2.5 years. The total fair value of restricted stock units vested during the years ended December 31, 2019, 2018 and 2017 was $11 million, $8 million and $7 million, respectively.
Performance Restricted Stock Units
The Company has granted performance restricted stock units under the Incentive Plan. These awards vest if AGL's common share price, total shareholder return (TSR) relative to the performance of a peer group and growth in core adjusted book value during the relevant three-year performance period reaches certain hurdles, with a minimum vesting percentage of 0, a target vesting percentage of 100% and a maximum vesting percentage of 200%, 250% and 200%, respectively. If the performance is between the specified levels, the vesting level will be interpolated accordingly. At the end of the performance cycle, participants are entitled to an amount equivalent to the accumulated dividends paid on common stock during the performance cycle for the number of shares earned.
Performance Restricted Stock Unit Activity
|
| | | | | | | |
| Performance Restricted Stock Units | | Number of Performance Share Units | | Weighted Average Grant Date Fair Value Per Share |
| Nonvested at December 31, 2018 | 596,728 |
| | $ | 39.42 |
|
| Granted (1) | 436,690 |
| | 44.00 |
|
| Vested | (489,161 | ) | | 12.66 |
|
| Forfeited | — |
| | — |
|
| Nonvested at December 31, 2019 (2) | 544,257 |
| | $ | 47.23 |
|
____________________
| |
| (1) | Includes 244,581 performance restricted stock units that were granted prior to 2019 at a weighted average grant date fair value of $12.66, but met performance hurdles and vested during 2019. The weighted average grant date fair value per share excludes these shares. |
| |
| (2) | Excludes 263,093 performance restricted stock units that have met performance hurdles and will be eligible for vesting after December 31, 2019. |
As of December 31, 2019, the total unrecognized compensation cost related to outstanding nonvested performance share units was $10 million, which the Company expects to recognize over the weighted‑average remaining service period of 1.8 years. The total value of performance restricted stock units vested during the years ended December 31, 2019, 2018 and 2017 was based on grant date fair value and was $6 million, $6 million and $8 million, respectively.
The Company used a Monte Carlo model to value its performance restricted stock units granted in 2018 and 2017 that contain a performance hurdle based on AGL's common share price.
Monte Carlo Pricing
Weighted Average Assumptions
|
| | | | | | | | |
| | | 2018 | | 2017 |
| Dividend yield | | 1.68 | % | | 1.37 | % |
| Expected volatility | | 27.65 | % | | 25.19 | % |
| Risk free interest rate | | 2.43 | % | | 1.48 | % |
| Weighted average grant date fair value | | $ | 45.64 |
| | $ | 53.74 |
|
The expected dividend yield is based on the current expected annual dividend and share price on the grant date. The expected volatility is estimated at the date of grant based on an average of the 3-year historical share price volatility and implied volatilities of certain at-the-money actively traded call options in the Company. The risk-free interest rate is the implied 3-year yield currently available on U.S. Treasury zero-coupon issues at the date of grant. The expected life is based on the 18-month term of the performance period.
For the 2019 awards, the grant-date fair value of the performance restricted stock units tied to relative TSR was calculated using a Monte Carlo simulation in order to determine the total return of the Company’s shares relative to the total return of approximately 200 financial companies in the Russell 2000 Index. The inputs to the simulation include the beginning prices of shares, historical volatilities, and dividend yields of all relevant companies as well as all possible pairwise correlation coefficients among the relevant companies. In addition, the risk-free return and discount for illiquidity are also included. The grant date fair value of these awards was $46.66 per share.
For the 2019 awards, the grant-date fair value of the core adjusted book value performance restricted stock units was based on the grant date closing price.
Employee Stock Purchase Plan
The Company established the AGL Employee Stock Purchase Plan (Stock Purchase Plan) in accordance with Internal Revenue Code Section 423, and participation is available to all eligible employees. Maximum annual purchases by participants are limited to the number of whole shares that can be purchased by an amount equal to 10% of the participant's compensation or, if less, shares having a value of $25,000. Participants may purchase shares at a purchase price equal to 85% of the lesser of the fair market value of the stock on the first day or the last day of the subscription period. The Company has reserved for issuance and purchases under the Stock Purchase Plan 850,000 Assured Guaranty Ltd. common shares.
The fair value of each award under the Stock Purchase Plan is estimated at the beginning of each offering period using the Black‑Scholes option‑pricing model and the following assumptions: a) the expected dividend yield is based on the current expected annual dividend and share price on the grant date; b) the expected volatility is estimated at the date of grant based on the historical share price volatility, calculated on a daily basis; c) the risk-free rate for periods within the contractual life of the option is based on the U.S. Treasury yield curve in effect at the time of grant; and d) the expected life is based on the term of the offering period.
Stock Purchase Plan
|
| | | | | | | | | | | |
| | Year Ended December 31, |
| | 2019 | | 2018 | | 2017 |
| | (dollars in millions) |
| Proceeds from purchase of shares by employees | $ | 1.5 |
| | $ | 1.2 |
| | $ | 1.0 |
|
| Number of shares issued by the Company | 40,732 |
| | 39,532 |
| | 33,666 |
|
| Recorded in share-based compensation, net of deferral | $ | 0.4 |
| | $ | 0.3 |
| | $ | 0.3 |
|
Share‑Based Compensation Expense
The following table presents stock based compensation costs and the amount of such costs that are deferred as policy acquisition costs, pre-tax. Amortization of previously deferred stock compensation costs is not shown in the table below.
Share‑Based Compensation Expense Summary
|
| | | | | | | | | | | |
| | Year Ended December 31, |
| | 2019 | | 2018 | | 2017 |
| | (in millions) |
| Share‑based compensation expense | $ | 21 |
| | $ | 19 |
| | $ | 16 |
|
| Share‑based compensation capitalized as DAC | 1.1 |
| | 0.8 |
| | 0.6 |
|
| Income tax benefit | 3 |
| | 3 |
| | 2 |
|
Defined Contribution Plan
The Company maintains a savings incentive plan, which is qualified under Section 401(a) of the Internal Revenue Code for U.S. employees. The savings incentive plan is available to eligible full-time employees upon hire. Eligible participants could contribute a percentage of their eligible compensation subject to U.S. Internal Revenue Service (IRS) limitations. Contributions were matched by the Company at a rate of 100% up to 6% of participant's eligible compensation, subject to IRS limitations. Any amounts over the IRS limits are contributed to and matched by the Company into a nonqualified supplemental executive retirement plan for employees eligible to participate in such nonqualified plan. The Company also made a core contribution of 6% of the participant's eligible compensation to the qualified plan, subject to IRS limitations, and the nonqualified supplemental executive retirement plan for eligible employees, regardless of whether the employee contributes to the plan(s). Employees become fully vested in Company contributions after one year of service, as defined in the plan. Plan eligibility is immediate upon hire. The Company also maintains similar non-qualified plans for non-U.S. employees.
The Company recognized defined contribution expenses of $12 million, $12 million and $11 million for the years ended December 31, 2019, 2018 and 2017, respectively.
| |
| 17. | Earnings Per ShareIncome Taxes |
Accounting Policy
The provision for income taxes consists of an amount for taxes currently payable and an amount for deferred taxes. Deferred income taxes are provided for temporary differences between the financial statement carrying amounts and tax bases of assets and liabilities, using enacted rates in effect for the year in which the differences are expected to reverse. A valuation allowance is recorded to reduce the deferred tax asset to an amount that is more likely than not to be realized.
Non-interest-bearing tax and loss bonds are purchased in the amount of the tax benefit that results from deducting statutory-basis contingency reserves as provided under Internal Revenue Code Section 832(e). The Company records the purchase of tax and loss bonds in deferred taxes.
The Company computes EPS usingrecognizes tax benefits only if a two-class methodtax position is “more likely than not” to prevail.
The Company elected to account for tax associated with Global Intangible Low-Taxed Income (GILTI) as a current-period expense when incurred.
Overview
AGL and its Bermuda subsidiaries, AG Re, AGRO, and Cedar Personnel Ltd. (Bermuda Subsidiaries), are not subject to any income, withholding or capital gains taxes under current Bermuda law. The Company has received an assurance from the Minister of Finance in Bermuda that, in the event of any taxes being imposed, AGL and its Bermuda Subsidiaries will be exempt from taxation in Bermuda until March 31, 2035. AGL's U.S. and U.K. subsidiaries are subject to income taxes imposed by including participating securities which entitle their holdersU.S. and U.K. authorities, respectively, and file applicable tax returns. In addition, AGRO, a Bermuda domiciled company, has elected under Section 953(d) of the U.S. Internal Revenue Code (the Code) to receive nonforfeitablebe taxed as a U.S. domestic corporation.
In November 2013, AGL became tax resident in the U.K. although it remains a Bermuda-based company and it's administrative and head office functions continue to be carried on in Bermuda. As a U.K. tax resident company, AGL is required to file a corporation tax return with Her Majesty’s Revenue & Customs. AGL is subject to U.K. corporation tax in respect of its worldwide profits (both income and capital gains), subject to any applicable exemptions. The corporation tax rate was 19% for 2019. Assured Guaranty expects that the dividends or dividend equivalents before vesting. Restricted stock awards and share unitsAGL receives from its direct subsidiaries will be exempt from U.K. corporation tax due to the exemption in section 931D of the U.K. Corporation Tax Act 2009. In addition, any dividends paid by AGL to its shareholders should not be subject to any withholding tax in the U.K. Assured Guaranty does not expect any profits of non-U.K. resident members of the group to be taxed under the U.K. "controlled foreign companies" regime and has obtained a clearance from Her Majesty’s Revenue & Customs confirming this on the basis of current facts.
AGUS files a consolidated federal income tax return with all of its U.S. subsidiaries. AGE UK, the Company’s U.K. subsidiary, had previously elected under U.S. Internal Revenue Code Section 953(d) to be taxed as a U.S. company. In January 2017, AGE UK filed a request with the IRS to revoke the election, which was approved in May 2017. As a result of the revocation of the Section 953(d) election, AGE UK is no longer liable to pay future U.S. taxes beginning in 2017.
On January 10, 2017, AGC supplemental executive retirement plan (AGC SERP)purchased MBIA UK, a U.K. based insurance company. After the purchase, MBIA UK changed its name to AGLN and files its tax returns in the U.K. as a separate entity for the period prior to its merger with AGE UK. For additional information on the MBIA UK Acquisition, see Note 2, Business Combinations and Assumption of Insured Portfolio.
Assured Guaranty Overseas US Holdings Inc. and its subsidiaries AGRO and AG Intermediary Inc. file their own consolidated federal income tax return.
As a result of the BlueMountain Acquisition referred to in Note 2, the entities acquired will be included in the AGUS consolidated federal income tax return.
Tax Assets (Liabilities)
Deferred and Current Tax Assets (Liabilities) (1)
|
| | | | | | | |
| | As of
December 31, 2019 | | As of
December 31, 2018 |
| | (in millions) |
| Deferred tax assets (liabilities) | $ | (17 | ) | | $ | 68 |
|
| Current tax assets (liabilities) | 47 |
| | 22 |
|
____________________
| |
| (1) | Included in other assets or other liabilities on the consolidated balance sheets. |
Components of Net Deferred Tax Assets
|
| | | | | | | |
| | As of December 31, |
| | 2019 | | 2018 |
| | (in millions) |
| Deferred tax assets: | | | |
| Unearned premium reserves, net | $ | 76 |
| | $ | 98 |
|
| Investment basis differences | 48 |
| | 49 |
|
| Foreign tax credit | 36 |
| | 36 |
|
| Net operating loss | 32 |
| | 34 |
|
| Deferred compensation | 26 |
| | 25 |
|
| Alternative minimum tax credit | 12 |
| | 20 |
|
| Other | 24 |
| | 35 |
|
| Total deferred income tax assets | 254 |
| | 297 |
|
| Deferred tax liabilities: | | | |
| Unrealized appreciation on investments | 86 |
| | 54 |
|
| Public debt | 44 |
| | 50 |
|
| Market discount | 11 |
| | 31 |
|
| DAC | 33 |
| | 23 |
|
| Unrealized gains on CCS | 11 |
| | 16 |
|
| Loss and LAE reserve | 29 |
| | 7 |
|
| Other | 21 |
| | 12 |
|
| Total deferred income tax liabilities | 235 |
| | 193 |
|
| Less: Valuation allowance | 36 |
| | 36 |
|
| Net deferred income tax asset (liabilities) | $ | (17 | ) | | $ | 68 |
|
As of December 31, 2019, the Company had alternative minimum tax credits of $12 million which, pursuant to the 2017 Tax Cuts and Jobs Act (Tax Act), are available as a credit to offset regular tax liability over the next two years with any excess refundable by 2021.
As part of the acquisition of CIFG Holding Inc. (CIFGH, and together with its subsidiaries, CIFG), the Company acquired $189 million of net operating losses (NOL) which will begin to expire in 2033. The NOL has been limited under Internal Revenue Code Section 382 due to a change in control as a result of the acquisition. As of December 31, 2019, the Company had $151 million of NOLs available to offset its future U.S. taxable income.
Valuation Allowance
The Company has $13 million of foreign tax credits (FTC) carryovers from previous acquisitions and $23 million of FTC due to the Tax Act for use against regular tax in future years. FTCs will begin to expire in 2020 and will fully expire by 2027. In analyzing the future realizability of FTCs, the Company notes limitations on future foreign source income due to overall foreign losses as negative evidence. After reviewing positive and negative evidence, the Company came to the conclusion that it is more likely than not that the FTC of $36 million will not be utilized, and therefore recorded a valuation allowance with respect to this tax attribute.
The Company came to the conclusion that it is more likely than not that the remaining deferred tax assets will be fully realized after weighing all positive and negative evidence available as required under GAAP. The positive evidence that was considered participating securities as they received non-forfeitable rightsincluded the cumulative income the Company has earned over the last three years, and the significant unearned premium income to dividendsbe included in taxable income. The positive evidence outweighs any negative evidence that exists. As such, the Company believes that no valuation allowance is necessary in connection with the remaining deferred tax assets. The Company will continue to analyze the need for a valuation allowance on a quarterly basis.
Provision for Income Taxes
The effective tax rates reflect the proportion of income recognized by each of the Company’s operating subsidiaries, with U.S. subsidiaries taxed at the sameU.S. marginal corporate income tax rate of 21% in 2019 and 2018 and 35% in 2017, U.K. subsidiaries taxed at the U.K. marginal corporate tax rate of 19%, and no taxes for the Company’s Bermuda Subsidiaries unless subject to U.S. tax by election. In 2018, due to the Tax Act, controlled foreign corporations (CFCs) apply the local marginal corporate tax rate. In addition, the Tax Act creates a new requirement that a portion of the GILTI earned by CFCs must be included currently in the gross income of the CFCs' U.S. shareholder. For the periods between April 1, 2015 and March 31, 2017, the U.K. corporation tax rate was 20%. The Company’s overall effective tax rate fluctuates based on the distribution of income across jurisdictions.
A reconciliation of the difference between the provision for income taxes and the expected tax provision at statutory rates in taxable jurisdictions is presented below.
Effective Tax Rate Reconciliation
|
| | | | | | | | | | | |
| | Year Ended December 31, |
| | 2019 | | 2018 | | 2017 |
| | (in millions) |
| Expected tax provision (benefit) | $ | 91 |
| | $ | 97 |
| | $ | 300 |
|
| Tax-exempt interest | (19 | ) | | (23 | ) | | (49 | ) |
| Bargain purchase gain | — |
| | — |
| | (20 | ) |
| Change in liability for uncertain tax positions | 1 |
| | (15 | ) | | (26 | ) |
| Effect of provision to tax return filing adjustments | (6 | ) | | (1 | ) | | (8 | ) |
| State tax | 1 |
| | 6 |
| | 9 |
|
| Taxes on reinsurance | (5 | ) | | 6 |
| | (4 | ) |
| Effect of adjustments to the provisional amounts as a result of 2017 Tax Cuts and Jobs Act | — |
| | (4 | ) | | 61 |
|
| Foreign taxes | 6 |
| | — |
| | 4 |
|
| Other | (6 | ) | | (7 | ) | | (6 | ) |
| Total provision (benefit) for income taxes | $ | 63 |
| | $ | 59 |
| | $ | 261 |
|
| Effective tax rate | 13.7 | % | | 10.2 | % | | 26.3 | % |
The expected tax provision (benefit) is calculated as common stock.the sum of pretax income in each jurisdiction multiplied by the statutory tax rate of the jurisdiction by which it will be taxed. Where there is a pretax loss in one jurisdiction and pretax income in another, the total combined expected tax rate may be higher or lower than any of the individual statutory rates.
The following tables present pretax income and revenue by jurisdiction.
Pretax Income (Loss) by Tax Jurisdiction
|
| | | | | | | | | | | |
| | Year Ended December 31, |
| | 2019 | | 2018 | | 2017 |
| | (in millions) |
| U.S. | $ | 440 |
| | $ | 461 |
| | $ | 873 |
|
| Bermuda | 33 |
| | 121 |
| | 145 |
|
| U.K. and other | (9 | ) | | (2 | ) | | (27 | ) |
| Total | $ | 464 |
| | $ | 580 |
| | $ | 991 |
|
Revenue by Tax Jurisdiction
|
| | | | | | | | | | | |
| | Year Ended December 31, |
| | 2019 | | 2018 | | 2017 |
| | (in millions) |
| U.S. | $ | 779 |
| | $ | 801 |
| | $ | 1,543 |
|
| Bermuda | 146 |
| | 177 |
| | 216 |
|
| U.K. and other | 38 |
| | 23 |
| | (20 | ) |
| Total | $ | 963 |
| | $ | 1,001 |
| | $ | 1,739 |
|
Pretax income by jurisdiction may be disproportionate to revenue by jurisdiction to the extent that insurance losses incurred are disproportionate.
Effect of the 2017 Tax Cuts and Jobs Act
On December 22, 2017, the Tax Act was signed into law. The Tax Act changed many items of U.S. corporate income taxation, including a reduction of the corporate income tax rate from 35% to 21%, implementation of a territorial tax system and imposition of a tax on deemed repatriated earnings of non-U.S. subsidiaries. At December 31, 2017, the Company had not completed accounting for the tax effects of the Tax Act; however, the Company made a reasonable estimate of the effects on the existing deferred tax balances and the one-time transition tax. The Company recognized a provisional income tax expense of $61 million, which was included as a component of income tax expense from continuing operations in 2017. During 2018, the Company recorded an adjustment to the provisional amount with a $4 million tax benefit as a component of income tax expense from continuing operations. As of December 31, 2018, the accounting for the income tax effects of the Tax Act have been completed and the total net impact resulting from the Tax Act is an expense of $57 million.
The Tax Act includes provisions for GILTI wherein taxes are imposed on foreign income in excess of a deemed return on tangible assets of foreign corporations. The Tax Act also includes a Base Erosion Anti-abuse Tax provision, which taxes certain payments from a U.S. corporation to its foreign subsidiaries.
Deferred Tax Assets and Liabilities
The Company remeasured certain deferred tax assets and liabilities based on the rates at which they are expected to reverse in the future, which is generally 21%. The provisional amount recorded related to the remeasurement of the deferred tax balance was an income tax expense of $37 million. As a result of adjustments identified from filing the 2017 tax return, the total remeasurement of the deferred tax balance resulting from the Tax Act is an income tax expense of $34 million.
Foreign Tax Effects
The one-time transition tax is based on total post-1986 earnings and profits for which the Company had previously deferred U.S. income taxes. The Company recorded a provisional amount for its one-time transition tax liability on non-U.S. subsidiaries less realizable FTCs and a write off of deferred tax liabilities on unremitted earnings, resulting in an increase in income tax expense of $24 million. As a result of adjustments identified from filing the 2017 tax return, the total impact to the transition tax resulting from the Tax Act is an income tax expense of $23 million.
The two-class methodtable below summarizes the impact of computing EPSthe Tax Act on the consolidated statements of operations.
Summary of the Tax Act Effect
(Benefit) Provision
|
| | | | | | | |
| | Year Ended December 31, |
| | 2018 | | 2017 |
| | (in millions) |
| Transition tax | $ | (1 | ) | | $ | 93 |
|
| Foreign tax credit realized | — |
| | (31 | ) |
| Write down of unremitted earnings | — |
| | (38 | ) |
| Net impact of repatriation | (1 | ) | | 24 |
|
| Write down of deferred tax asset due to tax rate change | (3 | ) | | 37 |
|
| Net impact of Tax Act | $ | (4 | ) | | $ | 61 |
|
Uncertain Tax Positions
The following table provides a reconciliation of the beginning and ending balances of the total liability for unrecognized tax positions.
|
| | | | | | | | | | | |
| | 2019 | | 2018 | | 2017 |
| | (in millions) |
| Beginning of year | $ | 14 |
| | $ | 28 |
| | $ | 50 |
|
| Effect of provision to tax return filing adjustments | 5 |
| | 1 |
| | 8 |
|
| Increase in unrecognized tax positions as a result of position taken during the current period | — |
| | — |
| | 1 |
|
| Decrease in unrecognized tax positions as a result of settlement of positions taken during the prior period | — |
| | — |
| | (31 | ) |
| Reductions to unrecognized tax benefits as a result of the applicable statute of limitations | (4 | ) | | (15 | ) | | — |
|
| Balance as of December 31, | $ | 15 |
| | $ | 14 |
| | $ | 28 |
|
The Company's policy is an earnings allocation formulato recognize interest related to uncertain tax positions in income tax expense and has accrued $1 million for full years 2019, 2018 and 2017. As of both December 31, 2019 and December 31, 2018, the Company has accrued $2 million of interest.
The total amount of reserves for unrecognized tax positions, including accrued interest, as of December 31, 2019 and December 31, 2018 that determines EPSwould affect the effective tax rate, if recognized, was $17 million and $16 million, respectively.
Audits
As of December 31, 2019, AGUS had open tax years with the U.S. IRS for each class2016 to present and is currently under audit for the 2016 tax year. It is expected that the audit will close in 2020 and, depending on the final outcome, reserves for uncertain tax positions may be released. In December 2016, the IRS issued a Revenue Agent Report for the 2009 - 2012 audit period, which did not identify any material adjustments that were not already accounted for in prior periods. In April 2017, the Company received a final letter from the IRS to close the audit with no additional findings or changes, and as a result the Company released previously recorded uncertain tax position reserves and accrued interest of common stockapproximately $37 million in the second quarter of 2017. The 2013 and participating security according to dividends declared (or accumulated) and participation rights2014 tax years closed in undistributed earnings. Basic EPS is then calculated by dividing net (loss) income available to common shareholders of2018. The 2015 tax year closed in 2019. Assured Guaranty byOverseas US Holdings Inc. has open tax years of 2016 forward but is not currently under audit with the weighted‑average number of common shares outstanding during the period. Diluted EPS adjusts basic EPS for the effects of restricted stock, restricted stock units, stock options and other potentially dilutive financial instruments (“dilutive securities”), only in the periods in which such effect is dilutive.IRS. The effect of the dilutive securities is reflected in diluted EPS by application of the more dilutive of (1) the treasury stock method or (2) the two-class method assuming nonvested sharesCompany's U.K. subsidiaries are not converted into common shares. The Companycurrently under examination and have open tax years of 2017 forward. CIFGNA, which was acquired by AGC during 2016, is not currently under examination and has a single classopen tax years of common stock.2016 to the date of acquisition.
Computation of Earnings Per Share
|
| | | | | | | | | | | |
| | Year Ended December 31, |
| | 2016 | | 2015 | | 2014 |
| | (in millions, except per share amounts) |
| Basic EPS: | | | | | |
| Net income (loss) attributable to AGL | $ | 881 |
| | $ | 1,056 |
| | 1,088 |
|
| Less: Distributed and undistributed income (loss) available to nonvested shareholders | 1 |
| | 1 |
| | 0 |
|
| Distributed and undistributed income (loss) available to common shareholders of AGL and subsidiaries, basic | $ | 880 |
| | $ | 1,055 |
| | 1,088 |
|
| Basic shares | 133.0 |
| | 148.1 |
| | 172.6 |
|
| Basic EPS | $ | 6.61 |
| | $ | 7.12 |
| | $ | 6.30 |
|
| | | | | | |
| Diluted EPS: | | | | | |
| Distributed and undistributed income (loss) available to common shareholders of AGL and subsidiaries, basic | $ | 880 |
| | $ | 1,055 |
| | $ | 1,088 |
|
| Plus: Re-allocation of undistributed income (loss) available to nonvested shareholders of AGL and subsidiaries | 0 |
| | 0 |
| | 0 |
|
| Distributed and undistributed income (loss) available to common shareholders of AGL and subsidiaries, diluted | $ | 880 |
| | $ | 1,055 |
| | $ | 1,088 |
|
| | | | | | |
| Basic shares | 133.0 |
| | 148.1 |
| | 172.6 |
|
| Dilutive securities | 1.1 |
| | 0.9 |
| | 1.0 |
|
| Diluted shares | 134.1 |
| | 149.0 |
| | 173.6 |
|
| Diluted EPS | $ | 6.56 |
| | $ | 7.08 |
| | $ | 6.26 |
|
| Potentially dilutive securities excluded from computation of EPS because of antidilutive effect | 0.3 |
| | 0.5 |
| | 1.6 |
|
| |
| 18. | Insurance Company Regulatory Requirements |
The following table summarizes the equity and income amounts reported to local regulatory bodies in the U.S. and Bermuda for insurance subsidiaries within the group. The discussion that follows describes the basis of accounting and differences to GAAP.
Insurance Regulatory Amounts Reported
U.S. and Bermuda
|
| | | | | | | | | | | | | | | | | | | |
| | Policyholders' Surplus | | Net Income (Loss) |
| | As of December 31, | | Year Ended December 31, |
| | 2019 | | 2018 | | 2019 | | 2018 | | 2017 |
| | (in millions) |
| U.S. statutory companies: | | | | | | | | | |
| AGM (1) (2) | $ | 2,691 |
| | $ | 2,533 |
| | $ | 312 |
| | $ | 172 |
| | $ | 152 |
|
| AGC (1) (2) | 1,775 |
| | 1,793 |
| | 226 |
| | (5 | ) | | 219 |
|
| MAC (2) | 276 |
| | 321 |
| | 53 |
| | 55 |
| | 32 |
|
| Bermuda statutory companies: | | | | | | | | | |
| AG Re | 1,098 |
| | 1,249 |
| | 45 |
| | 131 |
| | 155 |
|
| AGRO | 410 |
| | 383 |
| | 12 |
| | 10 |
| | 10 |
|
____________________
| |
| (1) | Policyholders' surplus of AGM and AGC includes their indirect share of MAC. AGM and AGC own 60.7% and 39.3%, respectively, of the outstanding stock of Municipal Assurance Holdings Inc. (MAC Holdings), which owns 100% of the outstanding common stock of MAC. |
| |
| (2) | As of December 31, 2019, policyholders' surplus is net of contingency reserves of $869 million, $546 million and $192 million for AGM, AGC and MAC, respectively. As of December 31, 2018, policyholders' surplus is net of contingency reserves of $913 million, $550 million and $200 million for AGM, AGC and MAC, respectively. |
Basis of Regulatory Financial Reporting
United States
Each of the Company's U.S. domiciled insurance companies' ability to pay dividends depends, among other things, upon its financial condition, results of operations, cash requirements, compliance with rating agency requirements, and is also subject to restrictions contained in the insurance laws and related regulations of its state of domicile and other states. Financial statements prepared in accordance with accounting practices prescribed or permitted by local insurance regulatory authorities differ in certain respects from GAAP.
The Company's U.S. domiciled insurance companies prepare statutory financial statements in accordance with accounting practices prescribed or permitted by the National Association of Insurance Commissioners and their respective insurance departments. Prescribed statutory accounting practices are set forth in the National Association of Insurance Commissioners Accounting Practices and Procedures Manual. The Company has no permitted accounting practices on a statutory basis.
GAAP differs in certain significant respects from U.S. insurance companies' statutory accounting practices prescribed or permitted by insurance regulatory authorities. The principal differences result from the statutory accounting practices listed below.
Upfront premiums are earned upon expiration of risk rather than earned over the expected period of coverage. Premium earnings are accelerated when transactions are economically defeased, rather than legally defeased.
Acquisition costs are charged to expense as incurred rather than over the period that related premiums are earned.
A contingency reserve is computed based on statutory requirements, whereas no such reserve is required under GAAP.
Certain assets designated as “non-admitted assets” are charged directly to statutory surplus, rather than reflected as assets under GAAP.
Investments in subsidiaries are carried on the balance sheet on the equity basis, to the extent admissible, rather than consolidated with the parent.
Admitted deferred tax assets are subject to an adjusted surplus threshold and subject to a limitation calculated in accordance with SAP. Under GAAP there is no non-admitted asset determination, rather a valuation allowance is recorded to reduce the deferred tax asset to an amount that is more likely than not to be realized.
Insured credit derivatives are accounted for as insurance contracts rather than as derivative contracts measured at fair value.
Bonds are generally carried at amortized cost rather than fair value.
Insured obligations of VIEs and refinancing vehicles’ debt, where the Company is deemed the primary beneficiary, are accounted for as insurance contracts. Under GAAP, such VIEs and refinancing vehicles are consolidated and any transactions with the Company are eliminated.
Surplus notes are recognized as surplus and each payment of principal and interest is recorded only upon approval of the insurance regulator rather than as liabilities with periodic accrual of interest.
Acquisitions are accounted for as either statutory purchases or statutory mergers, rather than under the purchase method under GAAP.
Losses are discounted at tax equivalent yields, and recorded when the loss is deemed probable and without consideration of the deferred premium revenue. Under GAAP, expected losses are discounted at the risk free rate at the end of each reporting period and are recorded only to the extent they exceed deferred premium revenue.
The present value of installment premiums and commissions are not recorded on the balance sheet as they are under GAAP.
Bermuda
AG Re, a Bermuda regulated Class 3B insurer, and AGRO, a Bermuda regulated Class 3A and Class C insurer,
prepare their statutory financial statements in conformity with the accounting principles set forth in the Insurance Act 1978, amendments thereto and related regulations. As of December 31, 2016, the Bermuda Monetary Authority (the Authority) requires insurers to prepare statutory financial statements in accordance with the particular accounting principles adopted by the insurer (which, in the case of AG Re and AGRO, are U.S. GAAP), subject to certain adjustments. The principal difference relates to certain assets designated as “non-admitted assets” which are charged directly to statutory surplus rather than reflected as assets as they are under U.S. GAAP.
United Kingdom
AGE UK prepares its Solvency and Financial Condition Report and other required regulatory financial report based on Prudential Regulation Authority and Solvency II Regulations (Solvency II). AGE UK adopted the full framework required by Solvency II on January 1, 2016, which is the date they became effective. As of December 31, 2019 and December 31, 2018, AGE UK's Own Funds were £684 million and £693 million, respectively.
Dividend Restrictions and Capital Requirements
United States
Under New York insurance law, AGM and MAC may only pay dividends out of "earned surplus," which is the portion of the company's surplus that represents the net earnings, gains or profits (after deduction of all losses) that have not been distributed to shareholders as dividends, transferred to stated capital or capital surplus, or applied to other purposes permitted by law, but does not include unrealized appreciation of assets. AGM and MAC may each pay dividends without the prior approval of the New York Superintendent of Financial Services (New York Superintendent) that, together with all dividends declared or distributed by it during the preceding 12 months, do not exceed the lesser of 10% of its policyholders' surplus (as of
its last annual or quarterly statement filed with the New York Superintendent) or 100% of its adjusted net investment income during that period.
The maximum amount available during 2020 for AGM to distribute to AGMH as dividends without regulatory approval is estimated to be approximately $218 million. Of such $218 million, $72 million is estimated to be available for distribution in the first quarter of 2020.
In March 2019, MAC received approval from the New York State Department of Financial Services to dividend to MAC Holdings, which is owned by AGM and AGC, $100 million in 2019, an amount that exceeded the dividend capacity that was available for distribution without regulatory approval. MAC distributed a $100 million dividend to MAC Holdings in the second quarter of 2019. The maximum amount available during 2020 for MAC to distribute to MAC Holdings as dividends without regulatory approval is estimated to be approximately $21 million, NaN of which is available for distribution in the first quarter of 2020.
Under Maryland's insurance law, AGC may, with prior notice to the Maryland Insurance Commissioner, pay an ordinary dividend that, together with all dividends paid in the prior 12 months, does not exceed the lesser of 10% of its policyholders' surplus (as of the prior December 31) or 100% of its adjusted net investment income during that period. The maximum amount available during 2020 for AGC to distribute as ordinary dividends is approximately $166 million. Of such $166 million, approximately $85 million is available for distribution in the first quarter of 2020.
Bermuda
For AG Re, any distribution (including repurchase of shares) of any share capital, contributed surplus or other statutory capital that would reduce its total statutory capital by 15% or more of its total statutory capital as set out in its previous year's financial statements requires the prior approval of the Authority. Separately, dividends are paid out of an insurer's statutory surplus and cannot exceed that surplus. Furthermore, annual dividends cannot exceed 25% of total statutory capital and surplus as set out in its previous year's financial statements, which is $274 million, without AG Re certifying to the Authority that it will continue to meet required margins.Based on the foregoing limitations, in 2020 AG Re has the capacity to (i) make capital distributions in an aggregate amount up to $128 million without the prior approval of the Authority and (ii) declare and pay dividends in an aggregate amount up to approximately $274 million as of December 31, 2019. Such dividend capacity is further limited by (i) the actual amount of AG Re’s unencumbered assets, which amount changes from time to time due in part to collateral posting requirements and which was approximately $264 million as of December 31, 2019, and (ii) the amount of statutory surplus, which as of December 31, 2019 was $240 million.
For AGRO, annual dividends cannot exceed $103 million, without AGRO certifying to the Authority that it will continue to meet required margins. Based on the foregoing limitations, in 2020 AGRO has the capacity to (i) make capital distributions in an aggregate amount up to $21 million without the prior approval of the Authority and (ii) declare and pay dividends in an aggregate amount up to approximately $103 million as of December 31, 2019. Such dividend capacity is further limited by (i) the actual amount of AGRO’s unencumbered assets, which amount changes from time to time due in part to collateral posting requirements and which was approximately $383 million as of December 31, 2019, and (ii) the amount of statutory surplus, which as of December 31, 2019 was $273 million.
United Kingdom
U.K. company law prohibits AGE UK from declaring a dividend to its shareholders unless it has “profits available for distribution.” The determination of whether a company has profits available for distribution is based on its accumulated realized profits less its accumulated realized losses. While the U.K. insurance regulatory laws impose no statutory restrictions on a general insurer's ability to declare a dividend, the Prudential Regulation Authority's capital requirements may in practice act as a restriction on dividends.
Dividend Restrictions and Capital Requirements
Distributions by
Insurance Subsidiaries
|
| | | | | | | | | | | |
| | Year Ended December 31, |
| | 2019 | | 2018 | | 2017 |
| | (in millions) |
| Dividends paid by AGC to AGUS | $ | 123 |
| | $ | 133 |
| | $ | 107 |
|
| Dividends paid by AGM to AGMH | 220 |
| | 171 |
| | 196 |
|
| Dividends paid by AG Re to AGL | 275 |
| | 125 |
| | 125 |
|
| Dividends paid by MAC to MAC Holdings (1) | 105 |
| | 27 |
| | 36 |
|
| Repurchase of common stock by AGM from AGMH | — |
| | — |
| | 101 |
|
| Repurchase of common stock by AGC from AGUS | 100 |
| | 200 |
| | — |
|
| Redemption of common stock by MAC from MAC Holdings (1) | — |
| | — |
| | 250 |
|
____________________
| |
| (1) | MAC Holdings distributed nearly the entire amounts to AGM and AGC, in proportion to their ownership percentages. |
| |
| 19. | Related Party Transactions |
From time to time, certain officers, directors, employees, their family members and related charitable foundations may make investments in various private funds, vehicles or accounts managed by the Company. These investments are available to those of the Company's employees whom the Company has determined to have a status that reasonably permits the Company to offer them these types of investments in compliance with applicable laws. Generally, these investments are not subject to the management fees and performance allocations or incentive fees charged to other investors. As of December 31, 2019, all noncontrolling interests in the consolidated balance sheets represent employees' ownership interests in consolidated Assured Investment Management funds. Andrew Feldstein, the Company’s Chief Investment Officer and Head of Asset Management, is among the Company’s employees who invest in various private funds, vehicles or accounts managed by the Company. See also Note 12, Asset Management Fees, for additional information.
NaN of the Company's investment portfolio managers, Wellington Management Company, LLP (Wellington) and BlackRock Financial Management, Inc. (BlackRock), each own more than 5% of the Company's common shares. In addition, the Company has a minority interest in Wasmer, Schroeder & Company LLC, which is also one of the Company's investment portfolio managers. The investment management expense from transactions with these related parties was approximately $3.8 million in 2019, $4.0 million in 2018 and $4.1 million in 2017. In addition, the Company recognized $1.0 million and $1.2 million in 2019 and 2018, respectively, in income from its investment in Wasmer, Schroeder & Company LLC, which is included in "equity in net earnings of investees" in the consolidated statements of operations. Accrued expenses from transactions with these related parties were $2 million as of both December 31, 2019 and December 31, 2018.
The Charles Schwab Corporation announced on February 24, 2020 that it had entered into an agreement to acquire Wasmer, Schroeder & Company, LLC, and that, subject to customary closing conditions, it expects to close the transaction in mid-2020.
| |
| 20. | Commitments and Contingencies |
Leases
The Company is party to various non-cancelable lease agreements, these leases include both operating and finance leases. The largest lease relates to approximately 103,500 square feet of office space in New York City, and expires in 2032. Subject to certain conditions, the Company has an option to renew this lease for an additional five years at a fair market rent. The Company also leases another 78,400 square feet of office space at a second location in New York City, and that lease expires in 2024. Additionally, the Company leases additional office space in several other locations, an apartment, and certain equipment. These leases expire at various dates through 2029.
Accounting Policy
Effective January 1, 2019, the Company adopted Topic 842, which required the establishment of a right-of-use (ROU) asset and a lease liability on the balance sheet for operating and finance leases. An ROU asset represents the Company's right to use an underlying asset for the lease term, and a lease liability represents the Company's obligation to make lease payments arising from the lease. Upon adoption, all of the Company’s leases were classified as operating leases; however, the Company made an accounting policy election not to apply the recognition requirements of Topic 842 to short-term leases with an initial term of 12 months or less. At the inception of a lease, the total payments under a lease agreement were discounted utilizing an incremental borrowing rate that represents the Company’s collateralized borrowing rate. Upon adoption, the incremental borrowing rate for each lease was determined based on the remaining lease term as of January 1, 2019. The Company does not include renewal options in calculating the lease liability.
The Company elected the package of practical expedients, which permitted organizations not to reassess (i) whether any expired or existing contracts are or contain leases, (ii) the lease classification of expired or existing leases, and (iii) the initial direct costs for existing leases. The Company also elected the practical expedient to account for all lease components and their associated non-lease components (i.e., common area maintenance, real estate taxes, building insurance, etc.) as a single lease component and include all fixed payments in the measurement of ROU assets and lease liabilities.
Upon adoption, the Company recognized lease liabilities of approximately $95 million (recorded in other liabilities), ROU assets of approximately $69 million (recorded in other assets), and derecognized existing deferred rent and lease incentive liabilities of approximately $26 million, which resulted in no cumulative-effect adjustment to retained earnings.
Operating lease expense is recognized on a straight-line basis over the lease term and finance lease expense is comprised of the straight-line amortization of the lease asset and the accretion of interest expense under the effective interest method. Costs related to variable lease and non-lease components for the Company’s leases are expensed in the period incurred. The Company also subleases office space that is not used for its operations.
Lease Assets and Liabilities
|
| | | | | | | | | | | | | |
| | | As of December 31, 2019 |
| | | Assets(1) | | Liabilities(2) | | Weighted Average Remaining Lease Term (in years) | | Weighted Average Discount Rate |
| | | (in millions) | | | | |
| Operating leases | | $ | 100 |
| | $ | 130 |
| | 9.4 | | 2.61 | % |
| Finance leases | | 2 |
| | 2 |
| | 1.8 | | 1.74 | % |
| Total | | $ | 102 |
| | $ | 132 |
| | | | |
____________________
| |
| (1) | Recorded in other assets in the consolidated balance sheets. Finance lease assets are recorded net of accumulated amortization of $0.1 million as of December 31, 2019. |
| |
| (2) | Recorded in other liabilities in the consolidated balance sheets. |
Components of Lease Expense and Other Information
|
| | | | |
| | | Year Ended December 31, |
| | | 2019 |
| | | (in millions) |
| Operating lease cost | | $ | 10 |
|
| Variable lease cost | | 2 |
|
| Total lease cost (1) | | $ | 12 |
|
| Cash paid for amounts included in the measurement of lease liabilities (2) | | |
| Operating cash flows from operating leases | | $ | 11 |
|
| ROU assets obtained in exchange for new operating lease liabilities (3) | | 37 |
|
| ROU assets obtained in exchange for new finance lease liabilities (3) | | 2 |
|
____________________
| |
| (1) | Short-term lease costs, finance lease costs and sublease income are de minimis. Includes amortization on finance lease ROU assets and interest on finance lease liabilities. |
| |
| (2) | Operating and financing cash flows from finance leases are de minimis. |
| |
| (3) | Relates primarily to BlueMountain Acquisition. See Note 2, Business Combinations and Assumption of Insured Portfolio, for additional information. |
Rent expense was $9 million in 2018 and $9 million in 2017.
Future Minimum Rental Payments
|
| | | | | | | | |
| | | As of December 31, 2019 |
| Year | | (in millions) |
| | | Operating Leases | | Finance Leases |
| 2020 | $ | 19 |
| | $ | 1 |
|
| 2021 | 19 |
| | 1 |
|
| 2022 | 19 |
| | — |
|
| 2023 | 19 |
| | — |
|
| 2024 | 11 |
| | — |
|
| Thereafter | 62 |
| | — |
|
| Total lease payments (1) | 149 |
| | 2 |
|
| Less: imputed interest | 19 |
| | — |
|
| Total lease liabilities | $ | 130 |
| | $ | 2 |
|
____________________
| |
| (1) | Prior to the adoption of ASC 842, future lease payments under operating leases at December 31, 2018 were $9 million, $9 million, $8 million, $8 million, and $9 million for 2019 through 2023, respectively, and $72 million in aggregate for all years thereafter. |
Legal Proceedings
Lawsuits arise in the ordinary course of the Company’s business. It is the opinion of the Company’s management, based upon the information available, that the expected outcome of litigation against the Company, individually or in the aggregate, will not have a material adverse effect on the Company’s financial position or liquidity, although an adverse resolution of litigation against the Company in a fiscal quarter or year could have a material adverse effect on the Company’s results of operations in a particular quarter or year.
In addition, in the ordinary course of their respective businesses, certain of AGL's insurance subsidiaries are involved in litigation with third parties to recover losses paid in prior periods or prevent or reduce losses in the future. For example, the Company is involved in a number of legal actions in the Federal District Court for Puerto Rico to enforce or defend its rights with respect to the obligations it insures of Puerto Rico and various of its related authorities and public corporations. See
"Exposure to Puerto Rico" section of Note 5, Outstanding Insurance Exposure, for a description of such actions. See "Recovery Litigation" section of Note 6, Expected Loss to be Paid, for a description of recovery litigation unrelated to Puerto Rico. Also in the ordinary course of their respective business, certain of AGL's investment management subsidiaries are involved in litigation with third parties regarding fees, appraisals, or portfolio companies. The impact, if any, of these and other proceedings on the amount of recoveries the Company receives and losses it pays in the future is uncertain, and the impact of any one or more of these proceedings during any quarter or year could be material to the Company's results of operations in that particular quarter or year.
The Company also receives subpoenas duces tecum and interrogatories from regulators from time to time.
Accounting Policy
The Company establishes accruals for litigation and regulatory matters to the extent it is probable that a loss has been incurred and the amount of that loss can be reasonably estimated. For litigation and regulatory matters where a loss may be reasonably possible, but not probable, or is probable but not reasonably estimable, no accrual is established, but if the matter is material, it is disclosed, including matters discussed below. The Company reviews relevant information with respect to its litigation and regulatory matters on a quarterly basis and updates its accruals, disclosures and estimates of reasonably possible loss based on such reviews.
Litigation
On November 28, 2011, Lehman Brothers International (Europe) (in administration) (LBIE) sued AG Financial Products Inc. (AGFP), an affiliate of AGC which in the past had provided credit protection to counterparties under CDS. AGC acts as the credit support provider of AGFP under these CDS. LBIE’s complaint, which was filed in the Supreme Court of the State of New York, asserted a claim for breach of the implied covenant of good faith and fair dealing based on AGFP's termination of 9 credit derivative transactions between LBIE and AGFP and asserted claims for breach of contract and breach of the implied covenant of good faith and fair dealing based on AGFP's termination of 28 other credit derivative transactions between LBIE and AGFP and AGFP's calculation of the termination payment in connection with those 28 other credit derivative transactions. Following defaults by LBIE, AGFP properly terminated the transactions in question in compliance with the agreement between AGFP and LBIE, and calculated the termination payment properly. AGFP calculated that LBIE owes AGFP approximately $4 million for the claims which were dismissed and approximately $25 million in connection with the termination of the other credit derivative transactions, whereas LBIE asserted in the complaint that AGFP owes LBIE a termination payment of approximately $1.4 billion. AGFP filed a motion to dismiss the claims for breach of the implied covenant of good faith in LBIE's complaint, and on March 15, 2013, the court granted AGFP's motion to dismiss in respect of the count relating to the 9 credit derivative transactions and narrowed LBIE's claim with respect to the 28 other credit derivative transactions. LBIE's administrators disclosed in an April 10, 2015 report to LBIE’s unsecured creditors that LBIE's valuation expert has calculated LBIE's claim for damages in aggregate for the 28 transactions to range between a minimum of approximately $200 million and a maximum of approximately $500 million, depending on what adjustment, if any, is made for AGFP's credit risk and excluding any applicable interest. AGFP filed a motion for summary judgment on the remaining causes of action asserted by LBIE and on AGFP's counterclaims, and on July 2, 2018, the court granted in part and denied in part AGFP’s motion. The court dismissed, in its entirety, LBIE’s remaining claim for breach of the implied covenant of good faith and fair dealing and also dismissed LBIE’s claim for breach of contract solely to the extent that it is based upon AGFP’s conduct in connection with the auction. With respect to LBIE’s claim for breach of contract, the court held that there are triable issues of fact regarding whether AGFP calculated its loss reasonably and in good faith. On October 1, 2018, AGFP filed an appeal with the Appellate Division of the Supreme Court of the State of New York, First Judicial Department, seeking reversal of the portions of the lower court's ruling denying AGFP’s motion for summary judgment with respect to LBIE’s sole remaining claim for breach of contract. On January 17, 2019, the Appellate Division affirmed the Supreme Court's decision, holding that the lower court correctly determined that there are triable issues of fact regarding whether AGFP calculated its loss reasonably and in good faith. A trial has been scheduled for March 2020.
Share Issuances
AGL has authorized share capital of $5$5 million divided into 500,000,000 shares with a par value $0.01$0.01 per share. Except as described below, AGL's common shares have no preemptive rights or other rights to subscribe for additional common shares, no rights of redemption, conversion or exchange and no sinking fund rights. In the event of liquidation, dissolution or winding-up, the holders of AGL's common shares are entitled to share equally, in proportion to the number of common shares held by such holder, in AGL's assets, if any remain after the payment of all its liabilities and the liquidation preference of any outstanding preferred shares. Under certain circumstances, AGL has the right to purchase all or a portion of the shares held by a shareholder at fair market value. All of the common shares are fully paid and non assessable.non-assessable. Holders of AGL's common shares are entitled to receive dividends as lawfully may be declared from time to time by AGL's Board of Directors (the Board).the Board.
In general, and except as provided below, shareholders have one1 vote for each common share held by them and are entitled to vote with respect to their fully paid shares at all meetings of shareholders. However, if, and so long as, the common shares (and other of AGL's shares) of a shareholder are treated as "controlled shares" (as determined pursuant to section 958 of the Code) of any U.S. Person and such controlled shares constitute 9.5% or more of the votes conferred by AGL's issued and outstanding shares, the voting rights with respect to the controlled shares owned by such U.S. Person shall be limited, in the aggregate, to a voting power of less than 9.5% of the voting power of all issued and outstanding shares, under a formula specified in AGL's Bye-laws. The formula is applied repeatedly until there is no U.S. Person whose controlled shares constitute 9.5% or more of the voting power of all issued and outstanding shares and who generally would be required to recognize income with respect to AGL under the Code if AGL were a controlled foreign corporationCFC as defined in the Code and if the ownership threshold under the Code were 9.5% (as defined in AGL's Bye-Laws as a 9.5% U.S. Shareholder).
Subject to AGL's Bye-Laws and Bermuda law, AGL's Board has the power to issue any of AGL's unissued shares as it determines, including the issuance of any shares or class of shares with preferred, deferred or other special rights.
Under AGL's Bye-Laws and subject to Bermuda law, if AGL's Board determines that any ownership of AGL's shares may result in adverse tax, legal or regulatory consequences to the Company, any of the Company's subsidiaries or any of its shareholders or indirect holders of shares or its Affiliates (other than such as AGL's Board considers de minimis), the Company has the option, but not the obligation, to require such shareholder to sell to AGL, or to a third party to whom AGL assigns the repurchase right, the minimum number of common shares necessary to avoid or cure any such adverse consequences at a price determined in the discretion of the Board to represent the shares' fair market value (as defined in AGL's Bye-Laws). In addition, AGL's Board may determine that shares held carry different voting rights when it deems it appropriate to do so to (i) avoid the existence of any 9.5% U.S. Shareholder; and (ii) avoid adverse tax, legal or regulatory consequences to AGL or any of its subsidiaries or any direct or indirect holder of shares or its affiliates. "Controlled shares" includes, among other things, all shares of AGL that such U.S. Person is deemed to own directly, indirectly or constructively (within the meaning of section 958 of the Code). Further, these provisions do not apply in the event one shareholder owns greater than 75% of the voting power of all issued and outstanding shares.
Under these provisions, certain shareholders may have their voting rights limited to less than one vote per share, while other shareholders may have voting rights in excess of one vote per share. Moreover, these provisions could have the effect of reducing the votes of certain shareholders who would not otherwise be subject to the 9.5% limitation by virtue of their direct share ownership. AGL's Bye-laws provide that it will use its best efforts to notify shareholders of their voting interests prior to any vote to be taken by them.
Share Repurchases
On February 22, 2017, the Board authorized an additional $300 million of share repurchases, bringing the total remaining authorization to $407 million as of February 23, 2017. The Company expects to repurchase shares from time to time in the open market or in privately negotiated transactions. The timing, form and amount of the share repurchases under the program are at the discretion of management and will depend on a variety of factors, including funds available at the parent company, market conditions, the Company's capital position, legal requirements and other factors. The repurchase program may be modified, extended or terminated by the Board at any time. It does not have an expiration date.
Share Repurchases
|
| | | | | | | | | | | |
| Year | | Number of Shares Repurchased | | Total Payments (in millions) | | Average Price Paid Per Share |
| 2014 | | 24,413,781 |
| | $ | 590 |
| | $ | 24.17 |
|
| 2015 | | 20,995,419 |
| | $ | 555 |
| | $ | 26.43 |
|
| 2016 | | 10,721,248 |
| | $ | 306 |
| | $ | 28.53 |
|
| 2017 (through February 23, 2017 on a settlement date basis) | | 3,591,369 |
| | $ | 142 |
| | $ | 39.65 |
|
Deferred Compensation
Each of the Chief Executive Officer and the General Counsel of the Company has elected to invest a portion of his AGL SERP account in the employer stock fund within the AGL SERP. Each unit in the employer stock fund represents the right to receive one AGL common share upon a distribution from the AGL SERP. Each unit equals the number of AGL common shares which could have been purchased with the value of the account deemed invested in the employer stock fund as of the date of such election. The election to invest in the employer stock fund is irrevocable (i.e., any portion of a AGL SERP account allocated to the employer stock fund and invested in units shall remain allocated to the employer stock fund until the participant receives a distribution from AGL SERP). At the same time such investment elections were made, the Company purchased AGL common shares and placed such shares in trust to be distributed to the Chief Executive Officer and the General Counsel upon a distribution from the AGL SERP in settlement of their units invested in the employer stock fund. As of December 31, 2016 and 2015, the Company had 320,193 and 320,193 shares, respectively, in the trust. The Company recorded the purchase of such shares in “deferred equity compensation” in the consolidated balance sheet. As indicated in Note 14, Related Party Transactions, on January 6, 2017, the 320,193 shares were distributed in settlement of the AGL SERP units and therefore, there are no shares remaining in trust.
Certain executives of the Company elected to invest a portion of their AGC SERP accounts in the employer stock fund in the AGC SERP. Each unit in the employer stock fund represents the right to receive one AGL common share upon a distribution from the AGC SERP. Each unit equals the number of AGL common shares which could have been purchased with the value of the account deemed invested in the employer stock fund as of the date of such election. As of December 31, 2016 and 2015, there were 74,309 and 74,309 units, respectively, in the AGC SERP. See Note 19, Employee Benefit Plans.
Dividends
Any determination to pay cash dividends is at the discretion of the Company's Board, and depends upon the Company's results of operations, cash flows from operating activities, its financial position, capital requirements, general business conditions, legal, tax, regulatory, rating agency and contractual restrictions on the payment of dividends, and any other factors the Company's Board deems relevant. For more information concerning regulatory constraints that affect the Company's ability to pay dividends, see Note 11, Insurance Company Regulatory Requirements.
On February 22, 2017, the Company declared a quarterly dividend of $0.1425 per common share, an increase of nearly 10% from a quarterly dividend of $0.13 per common share paid in 2016.
| |
19. | Employee Benefit Plans |
Accounting Policy
Share-based compensation expense is based on the grant date fair value using the grant date closing price, the lattice, Monte Carlo or Black-Scholes-Merton (Black-Scholes) pricing models. The Company amortizes the fair value of share-based awards on a straight-line basis over the requisite service periods of the awards, which are generally the vesting periods, with the exception of retirement‑eligible employees. For retirement-eligible employees, certain awards contain retirement provisions and therefore are amortized over the period through the date the employee first becomes eligible to retire and is no longer required to provide service to earn part or all of the award.
The fair value of each award under the Assured Guaranty Ltd. Employee Stock Purchase Plan is estimated at the beginning of each offering period using the Black-Scholes option valuation model.
The expense for Performance Retention Plan awards is recognized straight-line over the requisite service period, with the exception of retirement eligible employees. For retirement eligible employees, the expense is recognized immediately.
Assured Guaranty Ltd. 2004 Long-Term Incentive Plan
Under the Assured Guaranty Ltd. 2004 Long-Term Incentive Plan, as amended (the Incentive Plan), the number of AGL common shares that may be delivered under the Incentive Plan may not exceed 18,670,000. In the event of certain transactions affecting AGL's common shares, the number or type of shares subject to the Incentive Plan, the number and type of shares subject to outstanding awards under the Incentive Plan, and the exercise price of awards under the Incentive Plan, may be adjusted.
The Incentive Plan authorizes the grant of incentive stock options, non-qualified stock options, stock appreciation rights, and full value awards that are based on AGL's common shares. The grant of full value awards may be in return for a participant's previously performed services, or in return for the participant surrendering other compensation that may be due, or may be contingent on the achievement of performance or other objectives during a specified period, or may be subject to a risk of forfeiture or other restrictions that will lapse upon the achievement of one or more goals relating to completion of service by the participant, or achievement of performance or other objectives. Awards under the Incentive Plan may accelerate and become vested upon a change in control of AGL.
The Incentive Plan is administered by the Compensation Committee of the Board, except as otherwise determined by the Board. The Board may amend or terminate the Incentive Plan. As of December 31, 2016, 10,232,649 common shares were available for grant under the Incentive Plan.
Time Vested Stock Options
Stock options are generally granted once a year with exercise prices equal to the closing price on the date of grant. To date, the Company has only issued non-qualified stock options. All stock options, except for performance stock options, granted to employees vest in equal annual installments over a three-year period and expire seven years or ten years from the date of grant. Stock options granted to directors vest over one year and expire in seven years or ten years from grant date. None of the Company's options, except for performance stock options, have a performance or market condition.
Time Vested Stock Options
|
| | | | | | | | | |
| | Options for Common Shares | | Weighted Average Exercise Price | | Number of Exercisable Options |
| Balance as of December 31, 2018 | 373,628 |
| | $ | 18.77 |
| | 373,628 |
|
| Options granted | — |
| | — |
| | |
| Options exercised | (283,277 | ) | | 18.16 |
| | |
| Options forfeited/expired | — |
| | — |
| | |
| Balance as of December 31, 2019 | 90,351 |
| | $ | 20.68 |
| | 90,351 |
|
As of December 31, 2019, the aggregate intrinsic value and weighted average remaining contractual term of stock options outstanding were $2.6 million and 0.7 years, respectively. As of December 31, 2019, the aggregate intrinsic value and weighted average remaining contractual term of exercisable stock options were $2.6 million and 0.7 years, respectively.
NaN options were granted in 2019, 2018 and 2017. As of December 31, 2019, there were 0 unexpensed outstanding non-vested options.
The total intrinsic value of stock options exercised during the years ended December 31, 2019, 2018 and 2017 was $8.2 million, $9.9 million and $6.6 million, respectively. During the years ended December 31, 2019, 2018 and 2017, $2.3 million, $2.4 million and $4.7 million, respectively, was received from the exercise of stock options. In order to satisfy stock option exercises, the Company issues new shares.
Performance Stock Options
The Company grants performance stock options under the Incentive Plan. These awards are non-qualified stock options with exercise prices equal to the closing price of an AGL common share on the applicable date of grant. These awards vest 35%, 50% or 100%, if the price of AGL's common shares using the highest 40-day average share price reaches certain hurdles. If the share price is between the specified levels, the vesting level will be interpolated accordingly. These awards expire seven years from the date of grant.
Performance Stock Options
|
| | | | | | | | | |
| | Options for Common Shares | | Weighted Average Exercise Price | | Number of Exercisable Options |
| Balance as of December 31, 2018 | 27,552 |
| | $ | 19.24 |
| | 27,552 |
|
| Options granted | — |
| | — |
| | |
| Options exercised | (27,552 | ) | | 19.24 |
| | |
| Options forfeited/expired | — |
| | — |
| | |
| Balance as of December 31, 2019 | — |
| | $ | — |
| | — |
|
NaN options were granted in 2019, 2018 and 2017.
The total intrinsic value of performance stock options exercised during the years ended December 31, 2019, 2018 and 2017 was $0.7 million, $3.8 million and $0.7 million, respectively. During the years ended December 31, 2019, 2018 and 2017, $0.5 million, $2.7 million and $0.2 million, respectively, was received from the exercise of performance stock options. In order to satisfy stock option exercises, the Company issues new shares. The tax benefit from time vested and performance stock options exercised during 2019 was $0.9 million.
Restricted Stock Awards
Restricted stock awards are valued based on the closing price of the underlying shares at the date of grant. Restricted stock awards to employees generally vest in equal annual installments over a four-year period and restricted stock awards to outside director's vest in full in one year. Restricted stock awards to employees are amortized on a straight-line basis over the requisite service periods of the awards, and restricted stock awards to outside directors are amortized over one year, which are generally the vesting periods, with the exception of retirement‑eligible employees, discussed above.
Restricted Stock Award Activity
|
| | | | | | | |
| Nonvested Shares | | Number of Shares | | Weighted Average Grant Date Fair Value Per Share |
| Nonvested at December 31, 2018 | 51,746 |
| | $ | 35.56 |
|
| Granted | 48,241 |
| | 45.98 |
|
| Vested | (51,746 | ) | | 35.56 |
|
| Forfeited | — |
| | — |
|
| Nonvested at December 31, 2019 | 48,241 |
| | $ | 45.98 |
|
As of December 31, 2019, the total unrecognized compensation cost related to outstanding nonvested restricted stock awards was $0.7 million, which the Company expects to recognize over the weighted‑average remaining service period of 0.3 years. The total fair value of shares vested during the years ended December 31, 2019, 2018 and 2017 was $1.8 million, $1.9 million and $1.5 million, respectively.
Restricted Stock Units
Restricted stock units are valued based on the closing price of the underlying shares at the date of grant. Restricted stock units awarded to employees have vesting terms similar to those of the restricted stock awards and are delivered on the vesting date. The Company has granted restricted stock units to directors of the Company.
Restricted Stock Unit Activity
|
| | | | | | | |
| Nonvested Stock Units | | Number of Stock Units | | Weighted Average Grant Date Fair Value Per Share |
| Nonvested at December 31, 2018 | 900,276 |
| | $ | 33.83 |
|
| Granted | 464,500 |
| | 44.40 |
|
| Vested | (375,981 | ) | | 28.03 |
|
| Forfeited | (1,528 | ) | | 40.90 |
|
| Nonvested at December 31, 2019 | 987,267 |
| | $ | 41.24 |
|
As of December 31, 2019, the total unrecognized compensation cost related to outstanding nonvested restricted stock units was $25 million, which the Company expects to recognize over the weighted‑average remaining service period of 2.5 years. The total fair value of restricted stock units vested during the years ended December 31, 2019, 2018 and 2017 was $11 million, $8 million and $7 million, respectively.
Performance Restricted Stock Units
The Company has granted performance restricted stock units under the Incentive Plan. These awards vest if AGL's common share price, total shareholder return (TSR) relative to the performance of a peer group and growth in core adjusted book value during the relevant three-year performance period reaches certain hurdles, with a minimum vesting percentage of 0, a target vesting percentage of 100% and a maximum vesting percentage of 200%, 250% and 200%, respectively. If the performance is between the specified levels, the vesting level will be interpolated accordingly. At the end of the performance cycle, participants are entitled to an amount equivalent to the accumulated dividends paid on common stock during the performance cycle for the number of shares earned.
Performance Restricted Stock Unit Activity
|
| | | | | | | |
| Performance Restricted Stock Units | | Number of Performance Share Units | | Weighted Average Grant Date Fair Value Per Share |
| Nonvested at December 31, 2018 | 596,728 |
| | $ | 39.42 |
|
| Granted (1) | 436,690 |
| | 44.00 |
|
| Vested | (489,161 | ) | | 12.66 |
|
| Forfeited | — |
| | — |
|
| Nonvested at December 31, 2019 (2) | 544,257 |
| | $ | 47.23 |
|
____________________
| |
| (1) | Includes 244,581 performance restricted stock units that were granted prior to 2019 at a weighted average grant date fair value of $12.66, but met performance hurdles and vested during 2019. The weighted average grant date fair value per share excludes these shares. |
| |
| (2) | Excludes 263,093 performance restricted stock units that have met performance hurdles and will be eligible for vesting after December 31, 2019. |
As of December 31, 2019, the total unrecognized compensation cost related to outstanding nonvested performance share units was $10 million, which the Company expects to recognize over the weighted‑average remaining service period of 1.8 years. The total value of performance restricted stock units vested during the years ended December 31, 2019, 2018 and 2017 was based on grant date fair value and was $6 million, $6 million and $8 million, respectively.
The Company used a Monte Carlo model to value its performance restricted stock units granted in 2018 and 2017 that contain a performance hurdle based on AGL's common share price.
Monte Carlo Pricing
Weighted Average Assumptions
|
| | | | | | | | |
| | | 2018 | | 2017 |
| Dividend yield | | 1.68 | % | | 1.37 | % |
| Expected volatility | | 27.65 | % | | 25.19 | % |
| Risk free interest rate | | 2.43 | % | | 1.48 | % |
| Weighted average grant date fair value | | $ | 45.64 |
| | $ | 53.74 |
|
The expected dividend yield is based on the current expected annual dividend and share price on the grant date. The expected volatility is estimated at the date of grant based on an average of the 3-year historical share price volatility and implied volatilities of certain at-the-money actively traded call options in the Company. The risk-free interest rate is the implied 3-year yield currently available on U.S. Treasury zero-coupon issues at the date of grant. The expected life is based on the 18-month term of the performance period.
For the 2019 awards, the grant-date fair value of the performance restricted stock units tied to relative TSR was calculated using a Monte Carlo simulation in order to determine the total return of the Company’s shares relative to the total return of approximately 200 financial companies in the Russell 2000 Index. The inputs to the simulation include the beginning prices of shares, historical volatilities, and dividend yields of all relevant companies as well as all possible pairwise correlation coefficients among the relevant companies. In addition, the risk-free return and discount for illiquidity are also included. The grant date fair value of these awards was $46.66 per share.
For the 2019 awards, the grant-date fair value of the core adjusted book value performance restricted stock units was based on the grant date closing price.
Employee Stock Purchase Plan
The Company established the AGL Employee Stock Purchase Plan (Stock Purchase Plan) in accordance with Internal Revenue Code Section 423, and participation is available to all eligible employees. Maximum annual purchases by participants are limited to the number of whole shares that can be purchased by an amount equal to 10% of the participant's compensation or, if less, shares having a value of $25,000. Participants may purchase shares at a purchase price equal to 85% of the lesser of the fair market value of the stock on the first day or the last day of the subscription period. The Company has reserved for issuance and purchases under the Stock Purchase Plan 850,000 Assured Guaranty Ltd. common shares.
The fair value of each award under the Stock Purchase Plan is estimated at the beginning of each offering period using the Black‑Scholes option‑pricing model and the following assumptions: a) the expected dividend yield is based on the current expected annual dividend and share price on the grant date; b) the expected volatility is estimated at the date of grant based on the historical share price volatility, calculated on a daily basis; c) the risk-free rate for periods within the contractual life of the option is based on the U.S. Treasury yield curve in effect at the time of grant; and d) the expected life is based on the term of the offering period.
Stock Purchase Plan
|
| | | | | | | | | | | |
| | Year Ended December 31, |
| | 2019 | | 2018 | | 2017 |
| | (dollars in millions) |
| Proceeds from purchase of shares by employees | $ | 1.5 |
| | $ | 1.2 |
| | $ | 1.0 |
|
| Number of shares issued by the Company | 40,732 |
| | 39,532 |
| | 33,666 |
|
| Recorded in share-based compensation, net of deferral | $ | 0.4 |
| | $ | 0.3 |
| | $ | 0.3 |
|
Share‑Based Compensation Expense
The following table presents stock based compensation costs and the amount of such costs that are deferred as policy acquisition costs, pre-tax. Amortization of previously deferred stock compensation costs is not shown in the table below.
Share‑Based Compensation Expense Summary
|
| | | | | | | | | | | |
| | Year Ended December 31, |
| | 2019 | | 2018 | | 2017 |
| | (in millions) |
| Share‑based compensation expense | $ | 21 |
| | $ | 19 |
| | $ | 16 |
|
| Share‑based compensation capitalized as DAC | 1.1 |
| | 0.8 |
| | 0.6 |
|
| Income tax benefit | 3 |
| | 3 |
| | 2 |
|
Defined Contribution Plan
The Company maintains a savings incentive plan, which is qualified under Section 401(a) of the Internal Revenue Code for U.S. employees. The savings incentive plan is available to eligible full-time employees upon hire. Eligible participants could contribute a percentage of their eligible compensation subject to U.S. Internal Revenue Service (IRS) limitations. Contributions were matched by the Company at a rate of 100% up to 6% of participant's eligible compensation, subject to IRS limitations. Any amounts over the IRS limits are contributed to and matched by the Company into a nonqualified supplemental executive retirement plan for employees eligible to participate in such nonqualified plan. The Company also made a core contribution of 6% of the participant's eligible compensation to the qualified plan, subject to IRS limitations, and the nonqualified supplemental executive retirement plan for eligible employees, regardless of whether the employee contributes to the plan(s). Employees become fully vested in Company contributions after one year of service, as defined in the plan. Plan eligibility is immediate upon hire. The Company also maintains similar non-qualified plans for non-U.S. employees.
The Company recognized defined contribution expenses of $12 million, $12 million and $11 million for the years ended December 31, 2019, 2018 and 2017, respectively.
Accounting Policy
The provision for income taxes consists of an amount for taxes currently payable and an amount for deferred taxes. Deferred income taxes are provided for temporary differences between the financial statement carrying amounts and tax bases of assets and liabilities, using enacted rates in effect for the year in which the differences are expected to reverse. A valuation allowance is recorded to reduce the deferred tax asset to an amount that is more likely than not to be realized.
Non-interest-bearing tax and loss bonds are purchased in the amount of the tax benefit that results from deducting statutory-basis contingency reserves as provided under Internal Revenue Code Section 832(e). The Company records the purchase of tax and loss bonds in deferred taxes.
The Company recognizes tax benefits only if a tax position is “more likely than not” to prevail.
The Company elected to account for tax associated with Global Intangible Low-Taxed Income (GILTI) as a current-period expense when incurred.
Overview
AGL and its Bermuda subsidiaries, AG Re, AGRO, and Cedar Personnel Ltd. (Bermuda Subsidiaries), are not subject to any income, withholding or capital gains taxes under current Bermuda law. The Company has received an assurance from the Minister of Finance in Bermuda that, in the event of any taxes being imposed, AGL and its Bermuda Subsidiaries will be exempt from taxation in Bermuda until March 31, 2035. AGL's U.S. and U.K. subsidiaries are subject to income taxes imposed by U.S. and U.K. authorities, respectively, and file applicable tax returns. In addition, AGRO, a Bermuda domiciled company, has elected under Section 953(d) of the U.S. Internal Revenue Code (the Code) to be taxed as a U.S. domestic corporation.
In November 2013, AGL became tax resident in the U.K. although it remains a Bermuda-based company and it's administrative and head office functions continue to be carried on in Bermuda. As a U.K. tax resident company, AGL is required to file a corporation tax return with Her Majesty’s Revenue & Customs. AGL is subject to U.K. corporation tax in respect of its worldwide profits (both income and capital gains), subject to any applicable exemptions. The corporation tax rate was 19% for 2019. Assured Guaranty expects that the dividends AGL receives from its direct subsidiaries will be exempt from U.K. corporation tax due to the exemption in section 931D of the U.K. Corporation Tax Act 2009. In addition, any dividends paid by AGL to its shareholders should not be subject to any withholding tax in the U.K. Assured Guaranty does not expect any profits of non-U.K. resident members of the group to be taxed under the U.K. "controlled foreign companies" regime and has obtained a clearance from Her Majesty’s Revenue & Customs confirming this on the basis of current facts.
AGUS files a consolidated federal income tax return with all of its U.S. subsidiaries. AGE UK, the Company’s U.K. subsidiary, had previously elected under U.S. Internal Revenue Code Section 953(d) to be taxed as a U.S. company. In January 2017, AGE UK filed a request with the IRS to revoke the election, which was approved in May 2017. As a result of the revocation of the Section 953(d) election, AGE UK is no longer liable to pay future U.S. taxes beginning in 2017.
On January 10, 2017, AGC purchased MBIA UK, a U.K. based insurance company. After the purchase, MBIA UK changed its name to AGLN and files its tax returns in the U.K. as a separate entity for the period prior to its merger with AGE UK. For additional information on the MBIA UK Acquisition, see Note 2, Business Combinations and Assumption of Insured Portfolio.
Assured Guaranty Overseas US Holdings Inc. and its subsidiaries AGRO and AG Intermediary Inc. file their own consolidated federal income tax return.
As a result of the BlueMountain Acquisition referred to in Note 2, the entities acquired will be included in the AGUS consolidated federal income tax return.
Tax Assets (Liabilities)
Deferred and Current Tax Assets (Liabilities) (1)
|
| | | | | | | |
| | As of
December 31, 2019 | | As of
December 31, 2018 |
| | (in millions) |
| Deferred tax assets (liabilities) | $ | (17 | ) | | $ | 68 |
|
| Current tax assets (liabilities) | 47 |
| | 22 |
|
____________________
| |
| (1) | Included in other assets or other liabilities on the consolidated balance sheets. |
Components of Net Deferred Tax Assets
|
| | | | | | | |
| | As of December 31, |
| | 2019 | | 2018 |
| | (in millions) |
| Deferred tax assets: | | | |
| Unearned premium reserves, net | $ | 76 |
| | $ | 98 |
|
| Investment basis differences | 48 |
| | 49 |
|
| Foreign tax credit | 36 |
| | 36 |
|
| Net operating loss | 32 |
| | 34 |
|
| Deferred compensation | 26 |
| | 25 |
|
| Alternative minimum tax credit | 12 |
| | 20 |
|
| Other | 24 |
| | 35 |
|
| Total deferred income tax assets | 254 |
| | 297 |
|
| Deferred tax liabilities: | | | |
| Unrealized appreciation on investments | 86 |
| | 54 |
|
| Public debt | 44 |
| | 50 |
|
| Market discount | 11 |
| | 31 |
|
| DAC | 33 |
| | 23 |
|
| Unrealized gains on CCS | 11 |
| | 16 |
|
| Loss and LAE reserve | 29 |
| | 7 |
|
| Other | 21 |
| | 12 |
|
| Total deferred income tax liabilities | 235 |
| | 193 |
|
| Less: Valuation allowance | 36 |
| | 36 |
|
| Net deferred income tax asset (liabilities) | $ | (17 | ) | | $ | 68 |
|
As of December 31, 2019, the Company had alternative minimum tax credits of $12 million which, pursuant to the 2017 Tax Cuts and Jobs Act (Tax Act), are available as a credit to offset regular tax liability over the next two years with any excess refundable by 2021.
As part of the acquisition of CIFG Holding Inc. (CIFGH, and together with its subsidiaries, CIFG), the Company acquired $189 million of net operating losses (NOL) which will begin to expire in 2033. The NOL has been limited under Internal Revenue Code Section 382 due to a change in control as a result of the acquisition. As of December 31, 2019, the Company had $151 million of NOLs available to offset its future U.S. taxable income.
Valuation Allowance
The Company has $13 million of foreign tax credits (FTC) carryovers from previous acquisitions and $23 million of FTC due to the Tax Act for use against regular tax in future years. FTCs will begin to expire in 2020 and will fully expire by 2027. In analyzing the future realizability of FTCs, the Company notes limitations on future foreign source income due to overall foreign losses as negative evidence. After reviewing positive and negative evidence, the Company came to the conclusion that it is more likely than not that the FTC of $36 million will not be utilized, and therefore recorded a valuation allowance with respect to this tax attribute.
The Company came to the conclusion that it is more likely than not that the remaining deferred tax assets will be fully realized after weighing all positive and negative evidence available as required under GAAP. The positive evidence that was considered included the cumulative income the Company has earned over the last three years, and the significant unearned premium income to be included in taxable income. The positive evidence outweighs any negative evidence that exists. As such, the Company believes that no valuation allowance is necessary in connection with the remaining deferred tax assets. The Company will continue to analyze the need for a valuation allowance on a quarterly basis.
Provision for Income Taxes
The effective tax rates reflect the proportion of income recognized by each of the Company’s operating subsidiaries, with U.S. subsidiaries taxed at the U.S. marginal corporate income tax rate of 21% in 2019 and 2018 and 35% in 2017, U.K. subsidiaries taxed at the U.K. marginal corporate tax rate of 19%, and no taxes for the Company’s Bermuda Subsidiaries unless subject to U.S. tax by election. In 2018, due to the Tax Act, controlled foreign corporations (CFCs) apply the local marginal corporate tax rate. In addition, the Tax Act creates a new requirement that a portion of the GILTI earned by CFCs must be included currently in the gross income of the CFCs' U.S. shareholder. For the periods between April 1, 2015 and March 31, 2017, the U.K. corporation tax rate was 20%. The Company’s overall effective tax rate fluctuates based on the distribution of income across jurisdictions.
A reconciliation of the difference between the provision for income taxes and the expected tax provision at statutory rates in taxable jurisdictions is presented below.
Effective Tax Rate Reconciliation
|
| | | | | | | | | | | |
| | Year Ended December 31, |
| | 2019 | | 2018 | | 2017 |
| | (in millions) |
| Expected tax provision (benefit) | $ | 91 |
| | $ | 97 |
| | $ | 300 |
|
| Tax-exempt interest | (19 | ) | | (23 | ) | | (49 | ) |
| Bargain purchase gain | — |
| | — |
| | (20 | ) |
| Change in liability for uncertain tax positions | 1 |
| | (15 | ) | | (26 | ) |
| Effect of provision to tax return filing adjustments | (6 | ) | | (1 | ) | | (8 | ) |
| State tax | 1 |
| | 6 |
| | 9 |
|
| Taxes on reinsurance | (5 | ) | | 6 |
| | (4 | ) |
| Effect of adjustments to the provisional amounts as a result of 2017 Tax Cuts and Jobs Act | — |
| | (4 | ) | | 61 |
|
| Foreign taxes | 6 |
| | — |
| | 4 |
|
| Other | (6 | ) | | (7 | ) | | (6 | ) |
| Total provision (benefit) for income taxes | $ | 63 |
| | $ | 59 |
| | $ | 261 |
|
| Effective tax rate | 13.7 | % | | 10.2 | % | | 26.3 | % |
The expected tax provision (benefit) is calculated as the sum of pretax income in each jurisdiction multiplied by the statutory tax rate of the jurisdiction by which it will be taxed. Where there is a pretax loss in one jurisdiction and pretax income in another, the total combined expected tax rate may be higher or lower than any of the individual statutory rates.
The following tables present pretax income and revenue by jurisdiction.
Pretax Income (Loss) by Tax Jurisdiction
|
| | | | | | | | | | | |
| | Year Ended December 31, |
| | 2019 | | 2018 | | 2017 |
| | (in millions) |
| U.S. | $ | 440 |
| | $ | 461 |
| | $ | 873 |
|
| Bermuda | 33 |
| | 121 |
| | 145 |
|
| U.K. and other | (9 | ) | | (2 | ) | | (27 | ) |
| Total | $ | 464 |
| | $ | 580 |
| | $ | 991 |
|
Revenue by Tax Jurisdiction
|
| | | | | | | | | | | |
| | Year Ended December 31, |
| | 2019 | | 2018 | | 2017 |
| | (in millions) |
| U.S. | $ | 779 |
| | $ | 801 |
| | $ | 1,543 |
|
| Bermuda | 146 |
| | 177 |
| | 216 |
|
| U.K. and other | 38 |
| | 23 |
| | (20 | ) |
| Total | $ | 963 |
| | $ | 1,001 |
| | $ | 1,739 |
|
Pretax income by jurisdiction may be disproportionate to revenue by jurisdiction to the extent that insurance losses incurred are disproportionate.
Effect of the 2017 Tax Cuts and Jobs Act
On December 22, 2017, the Tax Act was signed into law. The Tax Act changed many items of U.S. corporate income taxation, including a reduction of the corporate income tax rate from 35% to 21%, implementation of a territorial tax system and imposition of a tax on deemed repatriated earnings of non-U.S. subsidiaries. At December 31, 2017, the Company had not completed accounting for the tax effects of the Tax Act; however, the Company made a reasonable estimate of the effects on the existing deferred tax balances and the one-time transition tax. The Company recognized a provisional income tax expense of $61 million, which was included as a component of income tax expense from continuing operations in 2017. During 2018, the Company recorded an adjustment to the provisional amount with a $4 million tax benefit as a component of income tax expense from continuing operations. As of December 31, 2018, the accounting for the income tax effects of the Tax Act have been completed and the total net impact resulting from the Tax Act is an expense of $57 million.
The Tax Act includes provisions for GILTI wherein taxes are imposed on foreign income in excess of a deemed return on tangible assets of foreign corporations. The Tax Act also includes a Base Erosion Anti-abuse Tax provision, which taxes certain payments from a U.S. corporation to its foreign subsidiaries.
Deferred Tax Assets and Liabilities
The Company remeasured certain deferred tax assets and liabilities based on the rates at which they are expected to reverse in the future, which is generally 21%. The provisional amount recorded related to the remeasurement of the deferred tax balance was an income tax expense of $37 million. As a result of adjustments identified from filing the 2017 tax return, the total remeasurement of the deferred tax balance resulting from the Tax Act is an income tax expense of $34 million.
Foreign Tax Effects
The one-time transition tax is based on total post-1986 earnings and profits for which the Company had previously deferred U.S. income taxes. The Company recorded a provisional amount for its one-time transition tax liability on non-U.S. subsidiaries less realizable FTCs and a write off of deferred tax liabilities on unremitted earnings, resulting in an increase in income tax expense of $24 million. As a result of adjustments identified from filing the 2017 tax return, the total impact to the transition tax resulting from the Tax Act is an income tax expense of $23 million.
The table below summarizes the impact of the Tax Act on the consolidated statements of operations.
Summary of the Tax Act Effect
(Benefit) Provision
|
| | | | | | | |
| | Year Ended December 31, |
| | 2018 | | 2017 |
| | (in millions) |
| Transition tax | $ | (1 | ) | | $ | 93 |
|
| Foreign tax credit realized | — |
| | (31 | ) |
| Write down of unremitted earnings | — |
| | (38 | ) |
| Net impact of repatriation | (1 | ) | | 24 |
|
| Write down of deferred tax asset due to tax rate change | (3 | ) | | 37 |
|
| Net impact of Tax Act | $ | (4 | ) | | $ | 61 |
|
Uncertain Tax Positions
The following table provides a reconciliation of the beginning and ending balances of the total liability for unrecognized tax positions.
|
| | | | | | | | | | | |
| | 2019 | | 2018 | | 2017 |
| | (in millions) |
| Beginning of year | $ | 14 |
| | $ | 28 |
| | $ | 50 |
|
| Effect of provision to tax return filing adjustments | 5 |
| | 1 |
| | 8 |
|
| Increase in unrecognized tax positions as a result of position taken during the current period | — |
| | — |
| | 1 |
|
| Decrease in unrecognized tax positions as a result of settlement of positions taken during the prior period | — |
| | — |
| | (31 | ) |
| Reductions to unrecognized tax benefits as a result of the applicable statute of limitations | (4 | ) | | (15 | ) | | — |
|
| Balance as of December 31, | $ | 15 |
| | $ | 14 |
| | $ | 28 |
|
The Company's policy is to recognize interest related to uncertain tax positions in income tax expense and has accrued $1 million for full years 2019, 2018 and 2017. As of both December 31, 2019 and December 31, 2018, the Company has accrued $2 million of interest.
The total amount of reserves for unrecognized tax positions, including accrued interest, as of December 31, 2019 and December 31, 2018 that would affect the effective tax rate, if recognized, was $17 million and $16 million, respectively.
Audits
As of December 31, 2019, AGUS had open tax years with the U.S. IRS for 2016 to present and is currently under audit for the 2016 tax year. It is expected that the audit will close in 2020 and, depending on the final outcome, reserves for uncertain tax positions may be released. In December 2016, the IRS issued a Revenue Agent Report for the 2009 - 2012 audit period, which did not identify any material adjustments that were not already accounted for in prior periods. In April 2017, the Company received a final letter from the IRS to close the audit with no additional findings or changes, and as a result the Company released previously recorded uncertain tax position reserves and accrued interest of approximately $37 million in the second quarter of 2017. The 2013 and 2014 tax years closed in 2018. The 2015 tax year closed in 2019. Assured Guaranty Overseas US Holdings Inc. has open tax years of 2016 forward but is not currently under audit with the IRS. The Company's U.K. subsidiaries are not currently under examination and have open tax years of 2017 forward. CIFGNA, which was acquired by AGC during 2016, is not currently under examination and has open tax years of 2016 to the date of acquisition.
| |
| 18. | Insurance Company Regulatory Requirements |
The following table summarizes the equity and income amounts reported to local regulatory bodies in the U.S. and Bermuda for insurance subsidiaries within the group. The discussion that follows describes the basis of accounting and differences to GAAP.
Insurance Regulatory Amounts Reported
U.S. and Bermuda
|
| | | | | | | | | | | | | | | | | | | |
| | Policyholders' Surplus | | Net Income (Loss) |
| | As of December 31, | | Year Ended December 31, |
| | 2019 | | 2018 | | 2019 | | 2018 | | 2017 |
| | (in millions) |
| U.S. statutory companies: | | | | | | | | | |
| AGM (1) (2) | $ | 2,691 |
| | $ | 2,533 |
| | $ | 312 |
| | $ | 172 |
| | $ | 152 |
|
| AGC (1) (2) | 1,775 |
| | 1,793 |
| | 226 |
| | (5 | ) | | 219 |
|
| MAC (2) | 276 |
| | 321 |
| | 53 |
| | 55 |
| | 32 |
|
| Bermuda statutory companies: | | | | | | | | | |
| AG Re | 1,098 |
| | 1,249 |
| | 45 |
| | 131 |
| | 155 |
|
| AGRO | 410 |
| | 383 |
| | 12 |
| | 10 |
| | 10 |
|
____________________
| |
| (1) | Policyholders' surplus of AGM and AGC includes their indirect share of MAC. AGM and AGC own 60.7% and 39.3%, respectively, of the outstanding stock of Municipal Assurance Holdings Inc. (MAC Holdings), which owns 100% of the outstanding common stock of MAC. |
| |
| (2) | As of December 31, 2019, policyholders' surplus is net of contingency reserves of $869 million, $546 million and $192 million for AGM, AGC and MAC, respectively. As of December 31, 2018, policyholders' surplus is net of contingency reserves of $913 million, $550 million and $200 million for AGM, AGC and MAC, respectively. |
Basis of Regulatory Financial Reporting
United States
Each of the Company's U.S. domiciled insurance companies' ability to pay dividends depends, among other things, upon its financial condition, results of operations, cash requirements, compliance with rating agency requirements, and is also subject to restrictions contained in the insurance laws and related regulations of its state of domicile and other states. Financial statements prepared in accordance with accounting practices prescribed or permitted by local insurance regulatory authorities differ in certain respects from GAAP.
The Company's U.S. domiciled insurance companies prepare statutory financial statements in accordance with accounting practices prescribed or permitted by the National Association of Insurance Commissioners and their respective insurance departments. Prescribed statutory accounting practices are set forth in the National Association of Insurance Commissioners Accounting Practices and Procedures Manual. The Company has no permitted accounting practices on a statutory basis.
GAAP differs in certain significant respects from U.S. insurance companies' statutory accounting practices prescribed or permitted by insurance regulatory authorities. The principal differences result from the statutory accounting practices listed below.
Upfront premiums are earned upon expiration of risk rather than earned over the expected period of coverage. Premium earnings are accelerated when transactions are economically defeased, rather than legally defeased.
Acquisition costs are charged to expense as incurred rather than over the period that related premiums are earned.
A contingency reserve is computed based on statutory requirements, whereas no such reserve is required under GAAP.
Certain assets designated as “non-admitted assets” are charged directly to statutory surplus, rather than reflected as assets under GAAP.
Investments in subsidiaries are carried on the balance sheet on the equity basis, to the extent admissible, rather than consolidated with the parent.
Admitted deferred tax assets are subject to an adjusted surplus threshold and subject to a limitation calculated in accordance with SAP. Under GAAP there is no non-admitted asset determination, rather a valuation allowance is recorded to reduce the deferred tax asset to an amount that is more likely than not to be realized.
Insured credit derivatives are accounted for as insurance contracts rather than as derivative contracts measured at fair value.
Bonds are generally carried at amortized cost rather than fair value.
Insured obligations of VIEs and refinancing vehicles’ debt, where the Company is deemed the primary beneficiary, are accounted for as insurance contracts. Under GAAP, such VIEs and refinancing vehicles are consolidated and any transactions with the Company are eliminated.
Surplus notes are recognized as surplus and each payment of principal and interest is recorded only upon approval of the insurance regulator rather than as liabilities with periodic accrual of interest.
Acquisitions are accounted for as either statutory purchases or statutory mergers, rather than under the purchase method under GAAP.
Losses are discounted at tax equivalent yields, and recorded when the loss is deemed probable and without consideration of the deferred premium revenue. Under GAAP, expected losses are discounted at the risk free rate at the end of each reporting period and are recorded only to the extent they exceed deferred premium revenue.
The present value of installment premiums and commissions are not recorded on the balance sheet as they are under GAAP.
Bermuda
AG Re, a Bermuda regulated Class 3B insurer, and AGRO, a Bermuda regulated Class 3A and Class C insurer,
prepare their statutory financial statements in conformity with the accounting principles set forth in the Insurance Act 1978, amendments thereto and related regulations. As of December 31, 2016, the Bermuda Monetary Authority (the Authority) requires insurers to prepare statutory financial statements in accordance with the particular accounting principles adopted by the insurer (which, in the case of AG Re and AGRO, are U.S. GAAP), subject to certain adjustments. The principal difference relates to certain assets designated as “non-admitted assets” which are charged directly to statutory surplus rather than reflected as assets as they are under U.S. GAAP.
United Kingdom
AGE UK prepares its Solvency and Financial Condition Report and other required regulatory financial report based on Prudential Regulation Authority and Solvency II Regulations (Solvency II). AGE UK adopted the full framework required by Solvency II on January 1, 2016, which is the date they became effective. As of December 31, 2019 and December 31, 2018, AGE UK's Own Funds were £684 million and £693 million, respectively.
Dividend Restrictions and Capital Requirements
United States
Under New York insurance law, AGM and MAC may only pay dividends out of "earned surplus," which is the portion of the company's surplus that represents the net earnings, gains or profits (after deduction of all losses) that have not been distributed to shareholders as dividends, transferred to stated capital or capital surplus, or applied to other purposes permitted by law, but does not include unrealized appreciation of assets. AGM and MAC may each pay dividends without the prior approval of the New York Superintendent of Financial Services (New York Superintendent) that, together with all dividends declared or distributed by it during the preceding 12 months, do not exceed the lesser of 10% of its policyholders' surplus (as of
its last annual or quarterly statement filed with the New York Superintendent) or 100% of its adjusted net investment income during that period.
The maximum amount available during 2020 for AGM to distribute to AGMH as dividends without regulatory approval is estimated to be approximately $218 million. Of such $218 million, $72 million is estimated to be available for distribution in the first quarter of 2020.
In March 2019, MAC received approval from the New York State Department of Financial Services to dividend to MAC Holdings, which is owned by AGM and AGC, $100 million in 2019, an amount that exceeded the dividend capacity that was available for distribution without regulatory approval. MAC distributed a $100 million dividend to MAC Holdings in the second quarter of 2019. The maximum amount available during 2020 for MAC to distribute to MAC Holdings as dividends without regulatory approval is estimated to be approximately $21 million, NaN of which is available for distribution in the first quarter of 2020.
Under Maryland's insurance law, AGC may, with prior notice to the Maryland Insurance Commissioner, pay an ordinary dividend that, together with all dividends paid in the prior 12 months, does not exceed the lesser of 10% of its policyholders' surplus (as of the prior December 31) or 100% of its adjusted net investment income during that period. The maximum amount available during 2020 for AGC to distribute as ordinary dividends is approximately $166 million. Of such $166 million, approximately $85 million is available for distribution in the first quarter of 2020.
Bermuda
For AG Re, any distribution (including repurchase of shares) of any share capital, contributed surplus or other statutory capital that would reduce its total statutory capital by 15% or more of its total statutory capital as set out in its previous year's financial statements requires the prior approval of the Authority. Separately, dividends are paid out of an insurer's statutory surplus and cannot exceed that surplus. Furthermore, annual dividends cannot exceed 25% of total statutory capital and surplus as set out in its previous year's financial statements, which is $274 million, without AG Re certifying to the Authority that it will continue to meet required margins.Based on the foregoing limitations, in 2020 AG Re has the capacity to (i) make capital distributions in an aggregate amount up to $128 million without the prior approval of the Authority and (ii) declare and pay dividends in an aggregate amount up to approximately $274 million as of December 31, 2019. Such dividend capacity is further limited by (i) the actual amount of AG Re’s unencumbered assets, which amount changes from time to time due in part to collateral posting requirements and which was approximately $264 million as of December 31, 2019, and (ii) the amount of statutory surplus, which as of December 31, 2019 was $240 million.
For AGRO, annual dividends cannot exceed $103 million, without AGRO certifying to the Authority that it will continue to meet required margins. Based on the foregoing limitations, in 2020 AGRO has the capacity to (i) make capital distributions in an aggregate amount up to $21 million without the prior approval of the Authority and (ii) declare and pay dividends in an aggregate amount up to approximately $103 million as of December 31, 2019. Such dividend capacity is further limited by (i) the actual amount of AGRO’s unencumbered assets, which amount changes from time to time due in part to collateral posting requirements and which was approximately $383 million as of December 31, 2019, and (ii) the amount of statutory surplus, which as of December 31, 2019 was $273 million.
United Kingdom
U.K. company law prohibits AGE UK from declaring a dividend to its shareholders unless it has “profits available for distribution.” The determination of whether a company has profits available for distribution is based on its accumulated realized profits less its accumulated realized losses. While the U.K. insurance regulatory laws impose no statutory restrictions on a general insurer's ability to declare a dividend, the Prudential Regulation Authority's capital requirements may in practice act as a restriction on dividends.
Dividend Restrictions and Capital Requirements
Distributions by
Insurance Subsidiaries
|
| | | | | | | | | | | |
| | Year Ended December 31, |
| | 2019 | | 2018 | | 2017 |
| | (in millions) |
| Dividends paid by AGC to AGUS | $ | 123 |
| | $ | 133 |
| | $ | 107 |
|
| Dividends paid by AGM to AGMH | 220 |
| | 171 |
| | 196 |
|
| Dividends paid by AG Re to AGL | 275 |
| | 125 |
| | 125 |
|
| Dividends paid by MAC to MAC Holdings (1) | 105 |
| | 27 |
| | 36 |
|
| Repurchase of common stock by AGM from AGMH | — |
| | — |
| | 101 |
|
| Repurchase of common stock by AGC from AGUS | 100 |
| | 200 |
| | — |
|
| Redemption of common stock by MAC from MAC Holdings (1) | — |
| | — |
| | 250 |
|
____________________
| |
| (1) | MAC Holdings distributed nearly the entire amounts to AGM and AGC, in proportion to their ownership percentages. |
| |
| 19. | Related Party Transactions |
From time to time, certain officers, directors, employees, their family members and related charitable foundations may make investments in various private funds, vehicles or accounts managed by the Company. These investments are available to those of the Company's employees whom the Company has determined to have a status that reasonably permits the Company to offer them these types of investments in compliance with applicable laws. Generally, these investments are not subject to the management fees and performance allocations or incentive fees charged to other investors. As of December 31, 2019, all noncontrolling interests in the consolidated balance sheets represent employees' ownership interests in consolidated Assured Investment Management funds. Andrew Feldstein, the Company’s Chief Investment Officer and Head of Asset Management, is among the Company’s employees who invest in various private funds, vehicles or accounts managed by the Company. See also Note 12, Asset Management Fees, for additional information.
NaN of the Company's investment portfolio managers, Wellington Management Company, LLP (Wellington) and BlackRock Financial Management, Inc. (BlackRock), each own more than 5% of the Company's common shares. In addition, the Company has a minority interest in Wasmer, Schroeder & Company LLC, which is also one of the Company's investment portfolio managers. The investment management expense from transactions with these related parties was approximately $3.8 million in 2019, $4.0 million in 2018 and $4.1 million in 2017. In addition, the Company recognized $1.0 million and $1.2 million in 2019 and 2018, respectively, in income from its investment in Wasmer, Schroeder & Company LLC, which is included in "equity in net earnings of investees" in the consolidated statements of operations. Accrued expenses from transactions with these related parties were $2 million as of both December 31, 2019 and December 31, 2018.
The Charles Schwab Corporation announced on February 24, 2020 that it had entered into an agreement to acquire Wasmer, Schroeder & Company, LLC, and that, subject to customary closing conditions, it expects to close the transaction in mid-2020.
| |
| 20. | Commitments and Contingencies |
Leases
The Company is party to various non-cancelable lease agreements, these leases include both operating and finance leases. The largest lease relates to approximately 103,500 square feet of office space in New York City, and expires in 2032. Subject to certain conditions, the Company has an option to renew this lease for an additional five years at a fair market rent. The Company also leases another 78,400 square feet of office space at a second location in New York City, and that lease expires in 2024. Additionally, the Company leases additional office space in several other locations, an apartment, and certain equipment. These leases expire at various dates through 2029.
Accounting Policy
Effective January 1, 2019, the Company adopted Topic 842, which required the establishment of a right-of-use (ROU) asset and a lease liability on the balance sheet for operating and finance leases. An ROU asset represents the Company's right to use an underlying asset for the lease term, and a lease liability represents the Company's obligation to make lease payments arising from the lease. Upon adoption, all of the Company’s leases were classified as operating leases; however, the Company made an accounting policy election not to apply the recognition requirements of Topic 842 to short-term leases with an initial term of 12 months or less. At the inception of a lease, the total payments under a lease agreement were discounted utilizing an incremental borrowing rate that represents the Company’s collateralized borrowing rate. Upon adoption, the incremental borrowing rate for each lease was determined based on the remaining lease term as of January 1, 2019. The Company does not include renewal options in calculating the lease liability.
The Company elected the package of practical expedients, which permitted organizations not to reassess (i) whether any expired or existing contracts are or contain leases, (ii) the lease classification of expired or existing leases, and (iii) the initial direct costs for existing leases. The Company also elected the practical expedient to account for all lease components and their associated non-lease components (i.e., common area maintenance, real estate taxes, building insurance, etc.) as a single lease component and include all fixed payments in the measurement of ROU assets and lease liabilities.
Upon adoption, the Company recognized lease liabilities of approximately $95 million (recorded in other liabilities), ROU assets of approximately $69 million (recorded in other assets), and derecognized existing deferred rent and lease incentive liabilities of approximately $26 million, which resulted in no cumulative-effect adjustment to retained earnings.
Operating lease expense is recognized on a straight-line basis over the lease term and finance lease expense is comprised of the straight-line amortization of the lease asset and the accretion of interest expense under the effective interest method. Costs related to variable lease and non-lease components for the Company’s leases are expensed in the period incurred. The Company also subleases office space that is not used for its operations.
Lease Assets and Liabilities
|
| | | | | | | | | | | | | |
| | | As of December 31, 2019 |
| | | Assets(1) | | Liabilities(2) | | Weighted Average Remaining Lease Term (in years) | | Weighted Average Discount Rate |
| | | (in millions) | | | | |
| Operating leases | | $ | 100 |
| | $ | 130 |
| | 9.4 | | 2.61 | % |
| Finance leases | | 2 |
| | 2 |
| | 1.8 | | 1.74 | % |
| Total | | $ | 102 |
| | $ | 132 |
| | | | |
____________________
| |
| (1) | Recorded in other assets in the consolidated balance sheets. Finance lease assets are recorded net of accumulated amortization of $0.1 million as of December 31, 2019. |
| |
| (2) | Recorded in other liabilities in the consolidated balance sheets. |
Components of Lease Expense and Other Information
|
| | | | |
| | | Year Ended December 31, |
| | | 2019 |
| | | (in millions) |
| Operating lease cost | | $ | 10 |
|
| Variable lease cost | | 2 |
|
| Total lease cost (1) | | $ | 12 |
|
| Cash paid for amounts included in the measurement of lease liabilities (2) | | |
| Operating cash flows from operating leases | | $ | 11 |
|
| ROU assets obtained in exchange for new operating lease liabilities (3) | | 37 |
|
| ROU assets obtained in exchange for new finance lease liabilities (3) | | 2 |
|
____________________
| |
| (1) | Short-term lease costs, finance lease costs and sublease income are de minimis. Includes amortization on finance lease ROU assets and interest on finance lease liabilities. |
| |
| (2) | Operating and financing cash flows from finance leases are de minimis. |
| |
| (3) | Relates primarily to BlueMountain Acquisition. See Note 2, Business Combinations and Assumption of Insured Portfolio, for additional information. |
Rent expense was $9 million in 2018 and $9 million in 2017.
Future Minimum Rental Payments
|
| | | | | | | | |
| | | As of December 31, 2019 |
| Year | | (in millions) |
| | | Operating Leases | | Finance Leases |
| 2020 | $ | 19 |
| | $ | 1 |
|
| 2021 | 19 |
| | 1 |
|
| 2022 | 19 |
| | — |
|
| 2023 | 19 |
| | — |
|
| 2024 | 11 |
| | — |
|
| Thereafter | 62 |
| | — |
|
| Total lease payments (1) | 149 |
| | 2 |
|
| Less: imputed interest | 19 |
| | — |
|
| Total lease liabilities | $ | 130 |
| | $ | 2 |
|
____________________
| |
| (1) | Prior to the adoption of ASC 842, future lease payments under operating leases at December 31, 2018 were $9 million, $9 million, $8 million, $8 million, and $9 million for 2019 through 2023, respectively, and $72 million in aggregate for all years thereafter. |
Legal Proceedings
Lawsuits arise in the ordinary course of the Company’s business. It is the opinion of the Company’s management, based upon the information available, that the expected outcome of litigation against the Company, individually or in the aggregate, will not have a material adverse effect on the Company’s financial position or liquidity, although an adverse resolution of litigation against the Company in a fiscal quarter or year could have a material adverse effect on the Company’s results of operations in a particular quarter or year.
In addition, in the ordinary course of their respective businesses, certain of AGL's insurance subsidiaries are involved in litigation with third parties to recover losses paid in prior periods or prevent or reduce losses in the future. For example, the Company is involved in a number of legal actions in the Federal District Court for Puerto Rico to enforce or defend its rights with respect to the obligations it insures of Puerto Rico and various of its related authorities and public corporations. See
"Exposure to Puerto Rico" section of Note 5, Outstanding Insurance Exposure, for a description of such actions. See "Recovery Litigation" section of Note 6, Expected Loss to be Paid, for a description of recovery litigation unrelated to Puerto Rico. Also in the ordinary course of their respective business, certain of AGL's investment management subsidiaries are involved in litigation with third parties regarding fees, appraisals, or portfolio companies. The impact, if any, of these and other proceedings on the amount of recoveries the Company receives and losses it pays in the future is uncertain, and the impact of any one or more of these proceedings during any quarter or year could be material to the Company's results of operations in that particular quarter or year.
The Company also receives subpoenas duces tecum and interrogatories from regulators from time to time.
Accounting Policy
The Company establishes accruals for litigation and regulatory matters to the extent it is probable that a loss has been incurred and the amount of that loss can be reasonably estimated. For litigation and regulatory matters where a loss may be reasonably possible, but not probable, or is probable but not reasonably estimable, no accrual is established, but if the matter is material, it is disclosed, including matters discussed below. The Company reviews relevant information with respect to its litigation and regulatory matters on a quarterly basis and updates its accruals, disclosures and estimates of reasonably possible loss based on such reviews.
Litigation
On November 28, 2011, Lehman Brothers International (Europe) (in administration) (LBIE) sued AG Financial Products Inc. (AGFP), an affiliate of AGC which in the past had provided credit protection to counterparties under CDS. AGC acts as the credit support provider of AGFP under these CDS. LBIE’s complaint, which was filed in the Supreme Court of the State of New York, asserted a claim for breach of the implied covenant of good faith and fair dealing based on AGFP's termination of 9 credit derivative transactions between LBIE and AGFP and asserted claims for breach of contract and breach of the implied covenant of good faith and fair dealing based on AGFP's termination of 28 other credit derivative transactions between LBIE and AGFP and AGFP's calculation of the termination payment in connection with those 28 other credit derivative transactions. Following defaults by LBIE, AGFP properly terminated the transactions in question in compliance with the agreement between AGFP and LBIE, and calculated the termination payment properly. AGFP calculated that LBIE owes AGFP approximately $4 million for the claims which were dismissed and approximately $25 million in connection with the termination of the other credit derivative transactions, whereas LBIE asserted in the complaint that AGFP owes LBIE a termination payment of approximately $1.4 billion. AGFP filed a motion to dismiss the claims for breach of the implied covenant of good faith in LBIE's complaint, and on March 15, 2013, the court granted AGFP's motion to dismiss in respect of the count relating to the 9 credit derivative transactions and narrowed LBIE's claim with respect to the 28 other credit derivative transactions. LBIE's administrators disclosed in an April 10, 2015 report to LBIE’s unsecured creditors that LBIE's valuation expert has calculated LBIE's claim for damages in aggregate for the 28 transactions to range between a minimum of approximately $200 million and a maximum of approximately $500 million, depending on what adjustment, if any, is made for AGFP's credit risk and excluding any applicable interest. AGFP filed a motion for summary judgment on the remaining causes of action asserted by LBIE and on AGFP's counterclaims, and on July 2, 2018, the court granted in part and denied in part AGFP’s motion. The court dismissed, in its entirety, LBIE’s remaining claim for breach of the implied covenant of good faith and fair dealing and also dismissed LBIE’s claim for breach of contract solely to the extent that it is based upon AGFP’s conduct in connection with the auction. With respect to LBIE’s claim for breach of contract, the court held that there are triable issues of fact regarding whether AGFP calculated its loss reasonably and in good faith. On October 1, 2018, AGFP filed an appeal with the Appellate Division of the Supreme Court of the State of New York, First Judicial Department, seeking reversal of the portions of the lower court's ruling denying AGFP’s motion for summary judgment with respect to LBIE’s sole remaining claim for breach of contract. On January 17, 2019, the Appellate Division affirmed the Supreme Court's decision, holding that the lower court correctly determined that there are triable issues of fact regarding whether AGFP calculated its loss reasonably and in good faith. A trial has been scheduled for March 2020.
Share Issuances
AGL has authorized share capital of $5 million divided into 500,000,000 shares with a par value $0.01 per share. Except as described below, AGL's common shares have no preemptive rights or other rights to subscribe for additional common shares, no rights of redemption, conversion or exchange and no sinking fund rights. In the event of liquidation, dissolution or winding-up, the holders of AGL's common shares are entitled to share equally, in proportion to the number of common shares held by such holder, in AGL's assets, if any remain after the payment of all its liabilities and the liquidation preference of any outstanding preferred shares. Under certain circumstances, AGL has the right to purchase all or a portion of the shares held by a shareholder at fair market value. All of the common shares are fully paid and non-assessable. Holders of AGL's common shares are entitled to receive dividends as lawfully may be declared from time to time by the Board.
In general, and except as provided below, shareholders have 1 vote for each common share held by them and are entitled to vote with respect to their fully paid shares at all meetings of shareholders. However, if, and so long as, the common shares (and other of AGL's shares) of a shareholder are treated as "controlled shares" (as determined pursuant to section 958 of the Code) of any U.S. Person and such controlled shares constitute 9.5% or more of the votes conferred by AGL's issued and outstanding shares, the voting rights with respect to the controlled shares owned by such U.S. Person shall be limited, in the aggregate, to a voting power of less than 9.5% of the voting power of all issued and outstanding shares, under a formula specified in AGL's Bye-laws. The formula is applied repeatedly until there is no U.S. Person whose controlled shares constitute 9.5% or more of the voting power of all issued and outstanding shares and who generally would be required to recognize income with respect to AGL under the Code if AGL were a CFC as defined in the Code and if the ownership threshold under the Code were 9.5% (as defined in AGL's Bye-Laws as a 9.5% U.S. Shareholder).
Subject to AGL's Bye-Laws and Bermuda law, AGL's Board has the power to issue any of AGL's unissued shares as it determines, including the issuance of any shares or class of shares with preferred, deferred or other special rights.
Under AGL's Bye-Laws and subject to Bermuda law, if AGL's Board determines that any ownership of AGL's shares may result in adverse tax, legal or regulatory consequences to the Company, any of the Company's subsidiaries or any of its shareholders or indirect holders of shares or its Affiliates (other than such as AGL's Board considers de minimis), the Company has the option, but not the obligation, to require such shareholder to sell to AGL, or to a third party to whom AGL assigns the repurchase right, the minimum number of common shares necessary to avoid or cure any such adverse consequences at a price determined in the discretion of the Board to represent the shares' fair market value (as defined in AGL's Bye-Laws). In addition, AGL's Board may determine that shares held carry different voting rights when it deems it appropriate to do so to (i) avoid the existence of any 9.5% U.S. Shareholder; and (ii) avoid adverse tax, legal or regulatory consequences to AGL or any of its subsidiaries or any direct or indirect holder of shares or its affiliates. "Controlled shares" includes, among other things, all shares of AGL that such U.S. Person is deemed to own directly, indirectly or constructively (within the meaning of section 958 of the Code). Further, these provisions do not apply in the event one shareholder owns greater than 75% of the voting power of all issued and outstanding shares.
Under these provisions, certain shareholders may have their voting rights limited to less than one vote per share, while other shareholders may have voting rights in excess of one vote per share. Moreover, these provisions could have the effect of reducing the votes of certain shareholders who would not otherwise be subject to the 9.5% limitation by virtue of their direct share ownership. AGL's Bye-laws provide that it will use its best efforts to notify shareholders of their voting interests prior to any vote to be taken by them.
Time Vested Stock Options
Stock options are generally granted once a year with exercise prices equal to the closing price on the date of grant. To date, the Company has only issued non-qualified stock options. All stock options, except for performance stock options, granted to employees vest in equal annual installments over a three-year period and expire seven years or ten years from the date of grant. Stock options granted to directors vest over one year and expire in seven years or ten years from grant date. None of the Company's options, except for performance stock options, have a performance or market condition.
Time Vested Stock Options
|
| | | | | | | | | |
| | Options for Common Shares | | Weighted Average Exercise Price | | Number of Exercisable Options |
| Balance as of December 31, 2018 | 373,628 |
| | $ | 18.77 |
| | 373,628 |
|
| Options granted | — |
| | — |
| | |
| Options exercised | (283,277 | ) | | 18.16 |
| | |
| Options forfeited/expired | — |
| | — |
| | |
| Balance as of December 31, 2019 | 90,351 |
| | $ | 20.68 |
| | 90,351 |
|
|
| | | | | | | | | |
| | Options for Common Shares | | Weighted Average Exercise Price | | Number of Exercisable Options |
| Balance as of December 31, 2015 | 2,360,340 |
| | $ | 21.73 |
| | 2,275,096 |
|
| Options granted | — |
| | — |
| | |
| Options exercised | (768,212 | ) | | 24.64 |
| | |
| Options forfeited/expired | (421,535 | ) | | 25.50 |
| | |
| Balance as of December 31, 2016 | 1,170,593 |
| | $ | 18.43 |
| | 1,145,356 |
|
As of December 31, 2016,2019, the aggregate intrinsic value and weighted average remaining contractual term of stock options outstanding were $23$2.6 million and 2.30.7 years, respectively. As of December 31, 2016,2019, the aggregate intrinsic value and weighted average remaining contractual term of exercisable stock options were $22$2.6 million and 2.30.7 years, respectively.
NaN options were granted in 2019, 2018 and 2017. As of December 31, 2016 the total unrecognized compensation expense related to2019, there were 0 unexpensed outstanding nonvested stock options was $27 thousand, which will be adjusted in the future for the difference between estimated and actual forfeitures. The Company expects to recognize that expense over the weighted average remaining service period of 0.1 years.
Lattice Option Pricing
Weighted Average Assumptions (1)
|
| | | | |
| | | 2014 |
| Dividend yield | | 2.03 | % |
| Expected volatility | | 53.24 | % |
| Risk free interest rate | | 2.21 | % |
| Expected life | | 6.6 years |
|
| Forfeiture rate | | 3.5 | % |
| Weighted average grant date fair value | | $ | 10.35 |
|
____________________ | |
(1) | No options were granted in 2016 and 2015. |
The Company uses a lattice model to value its employee and director stock options, rather than a simple Black-Scholes formula. The Black-Scholes approach is designed for options exercisable only at maturity (European style), but can still be used to value options exercisable at any time after they vest (American style) as long as no dividend payments are being made on the stock. A lattice model can be used for both European and American style options and regardless of whether or not the stock is paying regular dividends. Because the options the Company has granted to its employees and directors are American style and because the Company pays regular dividends on its stock, the Company has selected a lattice model as the appropriate method to value thesenon-vested options.
The expected dividend yield is based on the current expected annual dividend and share price on the grant date. The expected volatility is estimated at the date of grant based on an average of the 7-year historical share price volatility and implied volatilities of certain at-the-money actively traded call options in the Company. The risk-free interest rate is the implied 7-year yield currently available on U.S. Treasury zero-coupon issues at the date of grant. The forfeiture rate is based on the historical employee termination information.
The total intrinsic value of stock options exercised during the years ended December 31, 2016, 20152019, 2018 and 20142017 was $4.6$8.2 million, $2.8$9.9 million and $3.0$6.6 million,, respectively. During the years ended December 31, 2016, 20152019, 2018 and 2014, $12.02017, $2.3 million, $4.9$2.4 million and $4.3$4.7 million, respectively, was received from the exercise of stock options. In order to satisfy stock option exercises, the Company issues new shares.
Performance Stock Options
The Company grants performance stock options under the Incentive Plan. These awards are non-qualified stock options with exercise prices equal to the closing price of an AGL common share on the applicable date of grant. These awards vest 35%, 50% or 100%, if the price of AGL's common shares using the highest 40-day average share price during the relevant three-year performance period reaches certain hurdles. If the share price is between the specified levels, the vesting level will be interpolated accordingly. These awards expire seven years from the date of grant.
Performance Stock Options
|
| | | | | | | | | |
| | Options for Common Shares | | Weighted Average Exercise Price | | Number of Exercisable Options |
| Balance as of December 31, 2018 | 27,552 |
| | $ | 19.24 |
| | 27,552 |
|
| Options granted | — |
| | — |
| | |
| Options exercised | (27,552 | ) | | 19.24 |
| | |
| Options forfeited/expired | — |
| | — |
| | |
| Balance as of December 31, 2019 | — |
| | $ | — |
| | — |
|
|
| | | | | | | | | |
| | Options for Common Shares | | Weighted Average Exercise Price | | Number of Exercisable Options |
| Balance as of December 31, 2015 | 239,537 |
| | $ | 17.92 |
| | 166,897 |
|
| Options granted | — |
| | — |
| | |
| Options exercised | (5,533 | ) | | 19.08 |
| | |
| Options forfeited/expired | (12,595 | ) | | 19.24 |
| | |
| Balance as of December 31, 2016 | 221,409 |
| | $ | 17.89 |
| | 221,409 |
|
As of December 31, 2016, the aggregate intrinsic value and weighted average remaining contractual term of performance stock options outstanding were $4.4 million and 2.4 years, respectively. As of December 31, 2016, the aggregate intrinsic value and weighted average remaining contractual term of exercisable performance stock options were $4.4 million and 2.4 years, respectively.
As of December 31, 2016, there was no unexpensed outstanding nonvested performance stock options.
NoNaN options were granted in 2016, 20152019, 2018 and 2014.2017.
The expected dividend yield is based on the current expected annual dividend and share price on the grant date. The expected volatility is estimated at the date of grant based on an average of the 7-year historical share price volatility and implied volatilities of certain at-the-money actively traded call options in the Company. The risk-free interest rate is the implied 7-year yield currently available on U.S. Treasury zero-coupon issues at the date of grant. The forfeiture rate is based on the historical employee termination information.
The total intrinsic value of performance stock options exercised during the years ended December 31, 20162019, 2018 and 20152017 was $41 thousand$0.7 million, $3.8 million and $75 thousand,$0.7 million, respectively. During the years ended December 31, 20162019, 2018 and 2015, $106 thousand2017, $0.5 million, $2.7 million and $98 thousand,$0.2 million, respectively, was received from the exercise of performance stock options. In order to satisfy stock option exercises, the Company issues new shares. The tax benefit from time vested and performance stock options exercised during 2019 was $0.9 million.
Restricted Stock Awards
Restricted stock awards are valued based on the closing price of the underlying shares at the date of grant. Restricted stock awards to employees generally vest in equal annual installments over a four-year period and restricted stock awards to outside directorsdirector's vest in full in one year. year. Restricted stock awards to employees are amortized on a straight-line basis over the requisite service periods of the awards, and restricted stock awards to outside directors are amortized over one year, which are generally the vesting periods, with the exception of retirement‑eligible employees, discussed above.
Restricted Stock Award Activity
|
| | | | | | | |
| Nonvested Shares | | Number of Shares | | Weighted Average Grant Date Fair Value Per Share |
| Nonvested at December 31, 2018 | 51,746 |
| | $ | 35.56 |
|
| Granted | 48,241 |
| | 45.98 |
|
| Vested | (51,746 | ) | | 35.56 |
|
| Forfeited | — |
| | — |
|
| Nonvested at December 31, 2019 | 48,241 |
| | $ | 45.98 |
|
|
| | | | | | | |
| Nonvested Shares | | Number of Shares | | Weighted Average Grant Date Fair Value Per Share |
| Nonvested at December 31, 2015 | 62,145 |
| | $ | 25.67 |
|
| Granted | 58,858 |
| | 25.57 |
|
| Vested | (62,145 | ) | | 25.67 |
|
| Forfeited | — |
| | — |
|
| Nonvested at December 31, 2016 | 58,858 |
| | $ | 25.57 |
|
As of December 31, 20162019, the total unrecognized compensation cost related to outstanding nonvested restricted stock awards was $0.6$0.7 million, which the Company expects to recognize over the weighted‑average remaining service period of 0.40.3 years. The total fair value of shares vested during the years ended December 31, 2016, 20152019, 2018 and 20142017 was $1.6$1.8 million, $1$1.9 million and $1$1.5 million, respectively.
Restricted Stock Units
Restricted stock units are valued based on the closing price of the underlying shares at the date of grant. Restricted stock units awarded to employees have vesting terms similar to those of the restricted stock awards and are delivered on the vesting date. The Company has granted restricted stock units to directors of the Company. Restricted stock units awarded to directors vested over a one-year period and were delivered in January 2017.
Restricted Stock Unit Activity
|
| | | | | | | |
| Nonvested Stock Units | | Number of Stock Units | | Weighted Average Grant Date Fair Value Per Share |
| Nonvested at December 31, 2018 | 900,276 |
| | $ | 33.83 |
|
| Granted | 464,500 |
| | 44.40 |
|
| Vested | (375,981 | ) | | 28.03 |
|
| Forfeited | (1,528 | ) | | 40.90 |
|
| Nonvested at December 31, 2019 | 987,267 |
| | $ | 41.24 |
|
|
| | | | | | | |
| Nonvested Stock Units | | Number of Stock Units | | Weighted Average Grant Date Fair Value Per Share |
| Nonvested at December 31, 2015 | 689,281 |
| | $ | 23.23 |
|
| Granted | 377,661 |
| | 24.51 |
|
| Vested | (114,701 | ) | | 20.88 |
|
| Forfeited | (6,732 | ) | | 24.38 |
|
| Nonvested at December 31, 2016 | 945,509 |
| | $ | 24.01 |
|
As of December 31, 2016,2019, the total unrecognized compensation cost related to outstanding nonvested restricted stock units was $10.8$25 million, which the Company expects to recognize over the weighted‑average remaining service period of 2.5 years. The total fair value of restricted stock units vested during the years ended December 31, 2019, 2018 and 2017 was $11 million, $8 million and $7 million, respectively.
Performance Restricted Stock Units
The Company has granted performance restricted stock units under the Incentive Plan. These awards vest if AGL's common share price, total shareholder return (TSR) relative to the performance of a peer group and growth in core adjusted book value during the relevant three-year performance period reaches certain hurdles, with a minimum vesting percentage of 0, a target vesting percentage of 100% and a maximum vesting percentage of 200%, 250% and 200%, respectively. If the performance is between the specified levels, the vesting level will be interpolated accordingly. At the end of the performance cycle, participants are entitled to an amount equivalent to the accumulated dividends paid on common stock during the performance cycle for the number of shares earned.
Performance Restricted Stock Unit Activity
|
| | | | | | | |
| Performance Restricted Stock Units | | Number of Performance Share Units | | Weighted Average Grant Date Fair Value Per Share |
| Nonvested at December 31, 2018 | 596,728 |
| | $ | 39.42 |
|
| Granted (1) | 436,690 |
| | 44.00 |
|
| Vested | (489,161 | ) | | 12.66 |
|
| Forfeited | — |
| | — |
|
| Nonvested at December 31, 2019 (2) | 544,257 |
| | $ | 47.23 |
|
____________________
| |
| (1) | Includes 244,581 performance restricted stock units that were granted prior to 2019 at a weighted average grant date fair value of $12.66, but met performance hurdles and vested during 2019. The weighted average grant date fair value per share excludes these shares. |
| |
| (2) | Excludes 263,093 performance restricted stock units that have met performance hurdles and will be eligible for vesting after December 31, 2019. |
As of December 31, 2019, the total unrecognized compensation cost related to outstanding nonvested performance share units was $10 million, which the Company expects to recognize over the weighted‑average remaining service period of 1.8 years. The total fair value of performance restricted stock units deliveredvested during the years ended December 31, 2016, 20152019, 2018 and 20142017 was $2based on grant date fair value and was $6 million, $6$6 million and $5$8 million,, respectively.
Performance Restricted Stock Units
The Company has grantedused a Monte Carlo model to value its performance restricted stock units under the Incentive Plan. These awards vest 35%, 50%, 100%, or 200%, if the price ofgranted in 2018 and 2017 that contain a performance hurdle based on AGL's common shares usingshare price.
Monte Carlo Pricing
Weighted Average Assumptions
|
| | | | | | | | |
| | | 2018 | | 2017 |
| Dividend yield | | 1.68 | % | | 1.37 | % |
| Expected volatility | | 27.65 | % | | 25.19 | % |
| Risk free interest rate | | 2.43 | % | | 1.48 | % |
| Weighted average grant date fair value | | $ | 45.64 |
| | $ | 53.74 |
|
The expected dividend yield is based on the highest 40-day averagecurrent expected annual dividend and share price duringon the relevant three-year performance period reaches certain hurdles. Ifgrant date. The expected volatility is estimated at the date of grant based on an average of the 3-year historical share price volatility and implied volatilities of certain at-the-money actively traded call options in the Company. The risk-free interest rate is between the specified levels,implied 3-year yield currently available on U.S. Treasury zero-coupon issues at the vesting level will be interpolated accordingly.date of grant. The expected life is based on the 18-month term of the performance period.
Performance Restricted Stock Unit Activity
|
| | | | | | | |
| Performance Restricted Stock Units | | Number of Performance Share Units | | Weighted Average Grant Date Fair Value Per Share |
| Nonvested at December 31, 2015 | 408,260 |
| | $ | 27.32 |
|
| Granted | 270,612 |
| | 25.62 |
|
| Delivered | (69,437 | ) | | 29.43 |
|
| Forfeited | — |
| | — |
|
| Nonvested at December 31, 2016 (1) | 609,435 |
| | $ | 26.22 |
|
____________________
| |
(1) | Excludes 355,353 performance restricted stock units that have met performance hurdles and will be eligible for vesting after December 31, 2016. |
As of December 31, 2016,For the total unrecognized compensation cost related to outstanding nonvested performance share units was $6.8 million, which2019 awards, the Company expects to recognize over the weighted‑average remaining service period of 1.8 years. The totalgrant-date fair value of the performance restricted stock units delivered duringtied to relative TSR was calculated using a Monte Carlo simulation in order to determine the years ended December 31, 2016total return of the Company’s shares relative to the total return of approximately 200 financial companies in the Russell 2000 Index. The inputs to the simulation include the beginning prices of shares, historical volatilities, and 2015dividend yields of all relevant companies as well as all possible pairwise correlation coefficients among the relevant companies. In addition, the risk-free return and discount for illiquidity are also included. The grant date fair value of these awards was $2.1 million and $6 million, respectively.$46.66 per share.
For the 2019 awards, the grant-date fair value of the core adjusted book value performance restricted stock units was based on the grant date closing price.
Employee Stock Purchase Plan
The Company established the AGL Employee Stock Purchase Plan (Stock Purchase Plan) in accordance with Internal Revenue Code Section 423, and participation is available to all eligible employees. Maximum annual purchases by participants are limited to the number of whole shares that can be purchased by an amount equal to 10% of the participant's compensation or, if less, shares having a value of $25,000.$25,000. Participants may purchase shares at a purchase price equal to 85% of the lesser of the fair market value of the stock on the first day or the last day of the subscription period. The Company has reserved for issuance and purchases under the Stock Purchase Plan 600,000850,000 Assured Guaranty Ltd. common shares.
The fair value of each award under the Stock Purchase Plan is estimated at the beginning of each offering period using the Black‑Scholes option‑pricing model and the following assumptions: a) the expected dividend yield is based on the current expected annual dividend and share price on the grant date; b) the expected volatility is estimated at the date of grant based on
the historical share price volatility, calculated on a daily basis; c) the risk-free rate for periods within the contractual life of the option is based on the U.S. Treasury yield curve in effect at the time of grant; and d) the expected life is based on the term of the offering period.
Stock Purchase Plan
|
| | | | | | | | | | | |
| | Year Ended December 31, |
| | 2019 | | 2018 | | 2017 |
| | (dollars in millions) |
| Proceeds from purchase of shares by employees | $ | 1.5 |
| | $ | 1.2 |
| | $ | 1.0 |
|
| Number of shares issued by the Company | 40,732 |
| | 39,532 |
| | 33,666 |
|
| Recorded in share-based compensation, net of deferral | $ | 0.4 |
| | $ | 0.3 |
| | $ | 0.3 |
|
|
| | | | | | | | | | | |
| | Year Ended December 31, |
| | 2016 | | 2015 | | 2014 |
| | (dollars in millions) |
| Proceeds from purchase of shares by employees | $ | 0.9 |
| | $ | 0.8 |
| | $ | 0.9 |
|
| Number of shares issued by the Company | 39,055 |
| | 38,565 |
| | 43,273 |
|
| Recorded in share-based compensation, net of deferral | $ | 0.2 |
| | $ | 0.2 |
| | $ | 0.2 |
|
Share‑Based Compensation Expense
The following table presents stock based compensation costs and the effectamount of deferring such costs that are deferred as policy acquisition costs, pre-tax. Amortization of previously deferred stock compensation costs is not shown in the table below.
Share‑Based Compensation Expense Summary
|
| | | | | | | | | | | |
| | Year Ended December 31, |
| | 2019 | | 2018 | | 2017 |
| | (in millions) |
| Share‑based compensation expense | $ | 21 |
| | $ | 19 |
| | $ | 16 |
|
| Share‑based compensation capitalized as DAC | 1.1 |
| | 0.8 |
| | 0.6 |
|
| Income tax benefit | 3 |
| | 3 |
| | 2 |
|
|
| | | | | | | | | | | |
| | Year Ended December 31, |
| | 2016 | | 2015 | | 2014 |
| | (in millions) |
| Share‑based compensation expense | $ | 13 |
| | $ | 10 |
| | $ | 10 |
|
| Share‑based compensation capitalized as DAC | 0.4 |
| | 0.5 |
| | 0.3 |
|
| Income tax benefit | 3 |
| | 2 |
| | 2 |
|
Defined Contribution Plan
The Company maintains a savings incentive plan, which is qualified under Section 401(a) of the Internal Revenue Code for U.S. employees. The savings incentive plan is available to eligible full-time employees upon hire. Eligible participants could contribute a percentage of their salaryeligible compensation subject to a maximum of $18,000 for 2016.U.S. Internal Revenue Service (IRS) limitations. Contributions arewere matched by the Company at a rate of 100% up to 6% of participant's eligible compensation, subject to IRS limitations. Any amounts over the IRS limits are contributed to and matched by the Company into a nonqualified supplemental executive retirement plan for employees eligible to participate in such nonqualified plan. The Company also makesmade a core contribution of 6% of the participant's eligible compensation to the qualified plan, subject to IRS limitations, and the nonqualified supplemental executive retirement plan for eligible employees, regardless of whether the employee contributes to the plan(s). Employees become fully vested in Company contributions after one year of service, as defined in the plan. Plan eligibility is immediate upon hire. The Company also maintains similar non-qualified plans for non-U.S. employees.
The Company recognized defined contribution expenses of $11 million, $10 million and $11 million for the years ended December 31, 2016, 2015 and 2014, respectively.
Cash-Based Compensation Plans
The Company maintains a Performance Retention Plan (PRP) that permits the grant of deferred cash based awards to selected employees. Generally, each PRP award is divided into three installments that vest over four years. The cash payment depends on growth in certain measures of intrinsic value and financial return defined in each PRP award agreement. The Company recognized performance retention plan expenses of $12 million, $11$12 million and $15$11 million for the years ended December 31, 2016, 20152019, 2018 and 2014,2017, respectively.
The Company’s executive officers are eligible to receive compensation under a non-equity incentive plan. The amount of compensation payable is subject to a performance goal being met. The Compensation Committee then uses discretion to determine the actual amount of cash incentive compensation payable to each executive officer for such performance year based on factors and criteria as determined by the Compensation Committee, provided that such discretion cannot be used to increase
the amount that was determined to be payable to each executive officer. For an applicable performance year, the Compensation Committee establishes target financial performance measures for the Company and individual non-financial objectives for the executive officers. Most employees other than executive officers are eligible to receive discretionary bonuses.
Accounting Policy
The provision for income taxes consists of an amount for taxes currently payable and an amount for deferred taxes. Deferred income taxes are provided for temporary differences between the financial statement carrying amounts and tax bases of assets and liabilities, using enacted rates in effect for the year in which the differences are expected to reverse. A valuation allowance is recorded to reduce the deferred tax asset to an amount that is more likely than not to be realized.
Non-interest-bearing tax and loss bonds are purchased in the amount of the tax benefit that results from deducting statutory-basis contingency reserves as provided under Internal Revenue Code Section 832(e). The Company records the purchase of tax and loss bonds in deferred taxes.
The Company recognizes tax benefits only if a tax position is “more likely than not” to prevail.
The Company elected to account for tax associated with Global Intangible Low-Taxed Income (GILTI) as a current-period expense when incurred.
Overview
AGL and its Bermuda subsidiaries, AG Re, AGRO, and Cedar Personnel Ltd. (Bermuda Subsidiaries), are not subject to any income, withholding or capital gains taxes under current Bermuda law. The Company has received an assurance from the Minister of Finance in Bermuda that, in the event of any taxes being imposed, AGL and its Bermuda Subsidiaries will be exempt from taxation in Bermuda until March 31, 2035. AGL's U.S. and U.K. subsidiaries are subject to income taxes imposed by U.S. and U.K. authorities, respectively, and file applicable tax returns. In addition, AGRO, a Bermuda domiciled company, has elected under Section 953(d) of the U.S. Internal Revenue Code (the Code) to be taxed as a U.S. domestic corporation.
In November 2013, AGL became tax resident in the U.K. although it remains a Bermuda-based company and it's administrative and head office functions continue to be carried on in Bermuda. As a U.K. tax resident company, AGL is required to file a corporation tax return with Her Majesty’s Revenue & Customs. AGL is subject to U.K. corporation tax in respect of its worldwide profits (both income and capital gains), subject to any applicable exemptions. The corporation tax rate was 19% for 2019. Assured Guaranty expects that the dividends AGL receives from its direct subsidiaries will be exempt from U.K. corporation tax due to the exemption in section 931D of the U.K. Corporation Tax Act 2009. In addition, any dividends paid by AGL to its shareholders should not be subject to any withholding tax in the U.K. Assured Guaranty does not expect any profits of non-U.K. resident members of the group to be taxed under the U.K. "controlled foreign companies" regime and has obtained a clearance from Her Majesty’s Revenue & Customs confirming this on the basis of current facts.
AGUS files a consolidated federal income tax return with all of its U.S. subsidiaries. AGE UK, the Company’s U.K. subsidiary, had previously elected under U.S. Internal Revenue Code Section 953(d) to be taxed as a U.S. company. In January 2017, AGE UK filed a request with the IRS to revoke the election, which was approved in May 2017. As a result of the revocation of the Section 953(d) election, AGE UK is no longer liable to pay future U.S. taxes beginning in 2017.
On January 10, 2017, AGC purchased MBIA UK, a U.K. based insurance company. After the purchase, MBIA UK changed its name to AGLN and files its tax returns in the U.K. as a separate entity for the period prior to its merger with AGE UK. For additional information on the MBIA UK Acquisition, see Note 2, Business Combinations and Assumption of Insured Portfolio.
Assured Guaranty Overseas US Holdings Inc. and its subsidiaries AGRO and AG Intermediary Inc. file their own consolidated federal income tax return.
As a result of the BlueMountain Acquisition referred to in Note 2, the entities acquired will be included in the AGUS consolidated federal income tax return.
Tax Assets (Liabilities)
Deferred and Current Tax Assets (Liabilities) (1)
|
| | | | | | | |
| | As of
December 31, 2019 | | As of
December 31, 2018 |
| | (in millions) |
| Deferred tax assets (liabilities) | $ | (17 | ) | | $ | 68 |
|
| Current tax assets (liabilities) | 47 |
| | 22 |
|
____________________
| |
| (1) | Included in other assets or other liabilities on the consolidated balance sheets. |
Components of Net Deferred Tax Assets
|
| | | | | | | |
| | As of December 31, |
| | 2019 | | 2018 |
| | (in millions) |
| Deferred tax assets: | | | |
| Unearned premium reserves, net | $ | 76 |
| | $ | 98 |
|
| Investment basis differences | 48 |
| | 49 |
|
| Foreign tax credit | 36 |
| | 36 |
|
| Net operating loss | 32 |
| | 34 |
|
| Deferred compensation | 26 |
| | 25 |
|
| Alternative minimum tax credit | 12 |
| | 20 |
|
| Other | 24 |
| | 35 |
|
| Total deferred income tax assets | 254 |
| | 297 |
|
| Deferred tax liabilities: | | | |
| Unrealized appreciation on investments | 86 |
| | 54 |
|
| Public debt | 44 |
| | 50 |
|
| Market discount | 11 |
| | 31 |
|
| DAC | 33 |
| | 23 |
|
| Unrealized gains on CCS | 11 |
| | 16 |
|
| Loss and LAE reserve | 29 |
| | 7 |
|
| Other | 21 |
| | 12 |
|
| Total deferred income tax liabilities | 235 |
| | 193 |
|
| Less: Valuation allowance | 36 |
| | 36 |
|
| Net deferred income tax asset (liabilities) | $ | (17 | ) | | $ | 68 |
|
As of December 31, 2019, the Company had alternative minimum tax credits of $12 million which, pursuant to the 2017 Tax Cuts and Jobs Act (Tax Act), are available as a credit to offset regular tax liability over the next two years with any excess refundable by 2021.
As part of the acquisition of CIFG Holding Inc. (CIFGH, and together with its subsidiaries, CIFG), the Company acquired $189 million of net operating losses (NOL) which will begin to expire in 2033. The NOL has been limited under Internal Revenue Code Section 382 due to a change in control as a result of the acquisition. As of December 31, 2019, the Company had $151 million of NOLs available to offset its future U.S. taxable income.
Valuation Allowance
The Company has $13 million of foreign tax credits (FTC) carryovers from previous acquisitions and $23 million of FTC due to the Tax Act for use against regular tax in future years. FTCs will begin to expire in 2020 and will fully expire by 2027. In analyzing the future realizability of FTCs, the Company notes limitations on future foreign source income due to overall foreign losses as negative evidence. After reviewing positive and negative evidence, the Company came to the conclusion that it is more likely than not that the FTC of $36 million will not be utilized, and therefore recorded a valuation allowance with respect to this tax attribute.
The Company came to the conclusion that it is more likely than not that the remaining deferred tax assets will be fully realized after weighing all positive and negative evidence available as required under GAAP. The positive evidence that was considered included the cumulative income the Company has earned over the last three years, and the significant unearned premium income to be included in taxable income. The positive evidence outweighs any negative evidence that exists. As such, the Company believes that no valuation allowance is necessary in connection with the remaining deferred tax assets. The Company will continue to analyze the need for a valuation allowance on a quarterly basis.
Provision for Income Taxes
The effective tax rates reflect the proportion of income recognized by each of the Company’s operating subsidiaries, with U.S. subsidiaries taxed at the U.S. marginal corporate income tax rate of 21% in 2019 and 2018 and 35% in 2017, U.K. subsidiaries taxed at the U.K. marginal corporate tax rate of 19%, and no taxes for the Company’s Bermuda Subsidiaries unless subject to U.S. tax by election. In 2018, due to the Tax Act, controlled foreign corporations (CFCs) apply the local marginal corporate tax rate. In addition, the Tax Act creates a new requirement that a portion of the GILTI earned by CFCs must be included currently in the gross income of the CFCs' U.S. shareholder. For the periods between April 1, 2015 and March 31, 2017, the U.K. corporation tax rate was 20%. The Company’s overall effective tax rate fluctuates based on the distribution of income across jurisdictions.
A reconciliation of the difference between the provision for income taxes and the expected tax provision at statutory rates in taxable jurisdictions is presented below.
Effective Tax Rate Reconciliation
|
| | | | | | | | | | | |
| | Year Ended December 31, |
| | 2019 | | 2018 | | 2017 |
| | (in millions) |
| Expected tax provision (benefit) | $ | 91 |
| | $ | 97 |
| | $ | 300 |
|
| Tax-exempt interest | (19 | ) | | (23 | ) | | (49 | ) |
| Bargain purchase gain | — |
| | — |
| | (20 | ) |
| Change in liability for uncertain tax positions | 1 |
| | (15 | ) | | (26 | ) |
| Effect of provision to tax return filing adjustments | (6 | ) | | (1 | ) | | (8 | ) |
| State tax | 1 |
| | 6 |
| | 9 |
|
| Taxes on reinsurance | (5 | ) | | 6 |
| | (4 | ) |
| Effect of adjustments to the provisional amounts as a result of 2017 Tax Cuts and Jobs Act | — |
| | (4 | ) | | 61 |
|
| Foreign taxes | 6 |
| | — |
| | 4 |
|
| Other | (6 | ) | | (7 | ) | | (6 | ) |
| Total provision (benefit) for income taxes | $ | 63 |
| | $ | 59 |
| | $ | 261 |
|
| Effective tax rate | 13.7 | % | | 10.2 | % | | 26.3 | % |
The expected tax provision (benefit) is calculated as the sum of pretax income in each jurisdiction multiplied by the statutory tax rate of the jurisdiction by which it will be taxed. Where there is a pretax loss in one jurisdiction and pretax income in another, the total combined expected tax rate may be higher or lower than any of the individual statutory rates.
The following tables present pretax income and revenue by jurisdiction.
Pretax Income (Loss) by Tax Jurisdiction
|
| | | | | | | | | | | |
| | Year Ended December 31, |
| | 2019 | | 2018 | | 2017 |
| | (in millions) |
| U.S. | $ | 440 |
| | $ | 461 |
| | $ | 873 |
|
| Bermuda | 33 |
| | 121 |
| | 145 |
|
| U.K. and other | (9 | ) | | (2 | ) | | (27 | ) |
| Total | $ | 464 |
| | $ | 580 |
| | $ | 991 |
|
Revenue by Tax Jurisdiction
|
| | | | | | | | | | | |
| | Year Ended December 31, |
| | 2019 | | 2018 | | 2017 |
| | (in millions) |
| U.S. | $ | 779 |
| | $ | 801 |
| | $ | 1,543 |
|
| Bermuda | 146 |
| | 177 |
| | 216 |
|
| U.K. and other | 38 |
| | 23 |
| | (20 | ) |
| Total | $ | 963 |
| | $ | 1,001 |
| | $ | 1,739 |
|
Pretax income by jurisdiction may be disproportionate to revenue by jurisdiction to the extent that insurance losses incurred are disproportionate.
Effect of the 2017 Tax Cuts and Jobs Act
On December 22, 2017, the Tax Act was signed into law. The Tax Act changed many items of U.S. corporate income taxation, including a reduction of the corporate income tax rate from 35% to 21%, implementation of a territorial tax system and imposition of a tax on deemed repatriated earnings of non-U.S. subsidiaries. At December 31, 2017, the Company had not completed accounting for the tax effects of the Tax Act; however, the Company made a reasonable estimate of the effects on the existing deferred tax balances and the one-time transition tax. The Company recognized a provisional income tax expense of $61 million, which was included as a component of income tax expense from continuing operations in 2017. During 2018, the Company recorded an adjustment to the provisional amount with a $4 million tax benefit as a component of income tax expense from continuing operations. As of December 31, 2018, the accounting for the income tax effects of the Tax Act have been completed and the total net impact resulting from the Tax Act is an expense of $57 million.
The Tax Act includes provisions for GILTI wherein taxes are imposed on foreign income in excess of a deemed return on tangible assets of foreign corporations. The Tax Act also includes a Base Erosion Anti-abuse Tax provision, which taxes certain payments from a U.S. corporation to its foreign subsidiaries.
Deferred Tax Assets and Liabilities
The Company remeasured certain deferred tax assets and liabilities based on the rates at which they are expected to reverse in the future, which is generally 21%. The provisional amount recorded related to the remeasurement of the deferred tax balance was an income tax expense of $37 million. As a result of adjustments identified from filing the 2017 tax return, the total remeasurement of the deferred tax balance resulting from the Tax Act is an income tax expense of $34 million.
Foreign Tax Effects
The one-time transition tax is based on total post-1986 earnings and profits for which the Company had previously deferred U.S. income taxes. The Company recorded a provisional amount for its one-time transition tax liability on non-U.S. subsidiaries less realizable FTCs and a write off of deferred tax liabilities on unremitted earnings, resulting in an increase in income tax expense of $24 million. As a result of adjustments identified from filing the 2017 tax return, the total impact to the transition tax resulting from the Tax Act is an income tax expense of $23 million.
The table below summarizes the impact of the Tax Act on the consolidated statements of operations.
Summary of the Tax Act Effect
(Benefit) Provision
|
| | | | | | | |
| | Year Ended December 31, |
| | 2018 | | 2017 |
| | (in millions) |
| Transition tax | $ | (1 | ) | | $ | 93 |
|
| Foreign tax credit realized | — |
| | (31 | ) |
| Write down of unremitted earnings | — |
| | (38 | ) |
| Net impact of repatriation | (1 | ) | | 24 |
|
| Write down of deferred tax asset due to tax rate change | (3 | ) | | 37 |
|
| Net impact of Tax Act | $ | (4 | ) | | $ | 61 |
|
Uncertain Tax Positions
The following table provides a reconciliation of the beginning and ending balances of the total liability for unrecognized tax positions.
|
| | | | | | | | | | | |
| | 2019 | | 2018 | | 2017 |
| | (in millions) |
| Beginning of year | $ | 14 |
| | $ | 28 |
| | $ | 50 |
|
| Effect of provision to tax return filing adjustments | 5 |
| | 1 |
| | 8 |
|
| Increase in unrecognized tax positions as a result of position taken during the current period | — |
| | — |
| | 1 |
|
| Decrease in unrecognized tax positions as a result of settlement of positions taken during the prior period | — |
| | — |
| | (31 | ) |
| Reductions to unrecognized tax benefits as a result of the applicable statute of limitations | (4 | ) | | (15 | ) | | — |
|
| Balance as of December 31, | $ | 15 |
| | $ | 14 |
| | $ | 28 |
|
The Company's policy is to recognize interest related to uncertain tax positions in income tax expense and has accrued $1 million for full years 2019, 2018 and 2017. As of both December 31, 2019 and December 31, 2018, the Company has accrued $2 million of interest.
The total amount of reserves for unrecognized tax positions, including accrued interest, as of December 31, 2019 and December 31, 2018 that would affect the effective tax rate, if recognized, was $17 million and $16 million, respectively.
Audits
As of December 31, 2019, AGUS had open tax years with the U.S. IRS for 2016 to present and is currently under audit for the 2016 tax year. It is expected that the audit will close in 2020 and, depending on the final outcome, reserves for uncertain tax positions may be released. In December 2016, the IRS issued a Revenue Agent Report for the 2009 - 2012 audit period, which did not identify any material adjustments that were not already accounted for in prior periods. In April 2017, the Company received a final letter from the IRS to close the audit with no additional findings or changes, and as a result the Company released previously recorded uncertain tax position reserves and accrued interest of approximately $37 million in the second quarter of 2017. The 2013 and 2014 tax years closed in 2018. The 2015 tax year closed in 2019. Assured Guaranty Overseas US Holdings Inc. has open tax years of 2016 forward but is not currently under audit with the IRS. The Company's U.K. subsidiaries are not currently under examination and have open tax years of 2017 forward. CIFGNA, which was acquired by AGC during 2016, is not currently under examination and has open tax years of 2016 to the date of acquisition.
| |
| 18. | Insurance Company Regulatory Requirements |
The following table summarizes the equity and income amounts reported to local regulatory bodies in the U.S. and Bermuda for insurance subsidiaries within the group. The discussion that follows describes the basis of accounting and differences to GAAP.
Insurance Regulatory Amounts Reported
U.S. and Bermuda
|
| | | | | | | | | | | | | | | | | | | |
| | Policyholders' Surplus | | Net Income (Loss) |
| | As of December 31, | | Year Ended December 31, |
| | 2019 | | 2018 | | 2019 | | 2018 | | 2017 |
| | (in millions) |
| U.S. statutory companies: | | | | | | | | | |
| AGM (1) (2) | $ | 2,691 |
| | $ | 2,533 |
| | $ | 312 |
| | $ | 172 |
| | $ | 152 |
|
| AGC (1) (2) | 1,775 |
| | 1,793 |
| | 226 |
| | (5 | ) | | 219 |
|
| MAC (2) | 276 |
| | 321 |
| | 53 |
| | 55 |
| | 32 |
|
| Bermuda statutory companies: | | | | | | | | | |
| AG Re | 1,098 |
| | 1,249 |
| | 45 |
| | 131 |
| | 155 |
|
| AGRO | 410 |
| | 383 |
| | 12 |
| | 10 |
| | 10 |
|
____________________
| |
| (1) | Policyholders' surplus of AGM and AGC includes their indirect share of MAC. AGM and AGC own 60.7% and 39.3%, respectively, of the outstanding stock of Municipal Assurance Holdings Inc. (MAC Holdings), which owns 100% of the outstanding common stock of MAC. |
| |
| (2) | As of December 31, 2019, policyholders' surplus is net of contingency reserves of $869 million, $546 million and $192 million for AGM, AGC and MAC, respectively. As of December 31, 2018, policyholders' surplus is net of contingency reserves of $913 million, $550 million and $200 million for AGM, AGC and MAC, respectively. |
Basis of Regulatory Financial Reporting
United States
Each of the Company's U.S. domiciled insurance companies' ability to pay dividends depends, among other things, upon its financial condition, results of operations, cash requirements, compliance with rating agency requirements, and is also subject to restrictions contained in the insurance laws and related regulations of its state of domicile and other states. Financial statements prepared in accordance with accounting practices prescribed or permitted by local insurance regulatory authorities differ in certain respects from GAAP.
The Company's U.S. domiciled insurance companies prepare statutory financial statements in accordance with accounting practices prescribed or permitted by the National Association of Insurance Commissioners and their respective insurance departments. Prescribed statutory accounting practices are set forth in the National Association of Insurance Commissioners Accounting Practices and Procedures Manual. The Company has no permitted accounting practices on a statutory basis.
GAAP differs in certain significant respects from U.S. insurance companies' statutory accounting practices prescribed or permitted by insurance regulatory authorities. The principal differences result from the statutory accounting practices listed below.
Upfront premiums are earned upon expiration of risk rather than earned over the expected period of coverage. Premium earnings are accelerated when transactions are economically defeased, rather than legally defeased.
Acquisition costs are charged to expense as incurred rather than over the period that related premiums are earned.
A contingency reserve is computed based on statutory requirements, whereas no such reserve is required under GAAP.
Certain assets designated as “non-admitted assets” are charged directly to statutory surplus, rather than reflected as assets under GAAP.
Investments in subsidiaries are carried on the balance sheet on the equity basis, to the extent admissible, rather than consolidated with the parent.
Admitted deferred tax assets are subject to an adjusted surplus threshold and subject to a limitation calculated in accordance with SAP. Under GAAP there is no non-admitted asset determination, rather a valuation allowance is recorded to reduce the deferred tax asset to an amount that is more likely than not to be realized.
Insured credit derivatives are accounted for as insurance contracts rather than as derivative contracts measured at fair value.
Bonds are generally carried at amortized cost rather than fair value.
Insured obligations of VIEs and refinancing vehicles’ debt, where the Company is deemed the primary beneficiary, are accounted for as insurance contracts. Under GAAP, such VIEs and refinancing vehicles are consolidated and any transactions with the Company are eliminated.
Surplus notes are recognized as surplus and each payment of principal and interest is recorded only upon approval of the insurance regulator rather than as liabilities with periodic accrual of interest.
Acquisitions are accounted for as either statutory purchases or statutory mergers, rather than under the purchase method under GAAP.
Losses are discounted at tax equivalent yields, and recorded when the loss is deemed probable and without consideration of the deferred premium revenue. Under GAAP, expected losses are discounted at the risk free rate at the end of each reporting period and are recorded only to the extent they exceed deferred premium revenue.
The present value of installment premiums and commissions are not recorded on the balance sheet as they are under GAAP.
Bermuda
AG Re, a Bermuda regulated Class 3B insurer, and AGRO, a Bermuda regulated Class 3A and Class C insurer,
prepare their statutory financial statements in conformity with the accounting principles set forth in the Insurance Act 1978, amendments thereto and related regulations. As of December 31, 2016, the Bermuda Monetary Authority (the Authority) requires insurers to prepare statutory financial statements in accordance with the particular accounting principles adopted by the insurer (which, in the case of AG Re and AGRO, are U.S. GAAP), subject to certain adjustments. The principal difference relates to certain assets designated as “non-admitted assets” which are charged directly to statutory surplus rather than reflected as assets as they are under U.S. GAAP.
United Kingdom
AGE UK prepares its Solvency and Financial Condition Report and other required regulatory financial report based on Prudential Regulation Authority and Solvency II Regulations (Solvency II). AGE UK adopted the full framework required by Solvency II on January 1, 2016, which is the date they became effective. As of December 31, 2019 and December 31, 2018, AGE UK's Own Funds were £684 million and £693 million, respectively.
Dividend Restrictions and Capital Requirements
United States
Under New York insurance law, AGM and MAC may only pay dividends out of "earned surplus," which is the portion of the company's surplus that represents the net earnings, gains or profits (after deduction of all losses) that have not been distributed to shareholders as dividends, transferred to stated capital or capital surplus, or applied to other purposes permitted by law, but does not include unrealized appreciation of assets. AGM and MAC may each pay dividends without the prior approval of the New York Superintendent of Financial Services (New York Superintendent) that, together with all dividends declared or distributed by it during the preceding 12 months, do not exceed the lesser of 10% of its policyholders' surplus (as of
its last annual or quarterly statement filed with the New York Superintendent) or 100% of its adjusted net investment income during that period.
The maximum amount available during 2020 for AGM to distribute to AGMH as dividends without regulatory approval is estimated to be approximately $218 million. Of such $218 million, $72 million is estimated to be available for distribution in the first quarter of 2020.
In March 2019, MAC received approval from the New York State Department of Financial Services to dividend to MAC Holdings, which is owned by AGM and AGC, $100 million in 2019, an amount that exceeded the dividend capacity that was available for distribution without regulatory approval. MAC distributed a $100 million dividend to MAC Holdings in the second quarter of 2019. The maximum amount available during 2020 for MAC to distribute to MAC Holdings as dividends without regulatory approval is estimated to be approximately $21 million, NaN of which is available for distribution in the first quarter of 2020.
Under Maryland's insurance law, AGC may, with prior notice to the Maryland Insurance Commissioner, pay an ordinary dividend that, together with all dividends paid in the prior 12 months, does not exceed the lesser of 10% of its policyholders' surplus (as of the prior December 31) or 100% of its adjusted net investment income during that period. The maximum amount available during 2020 for AGC to distribute as ordinary dividends is approximately $166 million. Of such $166 million, approximately $85 million is available for distribution in the first quarter of 2020.
Bermuda
For AG Re, any distribution (including repurchase of shares) of any share capital, contributed surplus or other statutory capital that would reduce its total statutory capital by 15% or more of its total statutory capital as set out in its previous year's financial statements requires the prior approval of the Authority. Separately, dividends are paid out of an insurer's statutory surplus and cannot exceed that surplus. Furthermore, annual dividends cannot exceed 25% of total statutory capital and surplus as set out in its previous year's financial statements, which is $274 million, without AG Re certifying to the Authority that it will continue to meet required margins.Based on the foregoing limitations, in 2020 AG Re has the capacity to (i) make capital distributions in an aggregate amount up to $128 million without the prior approval of the Authority and (ii) declare and pay dividends in an aggregate amount up to approximately $274 million as of December 31, 2019. Such dividend capacity is further limited by (i) the actual amount of AG Re’s unencumbered assets, which amount changes from time to time due in part to collateral posting requirements and which was approximately $264 million as of December 31, 2019, and (ii) the amount of statutory surplus, which as of December 31, 2019 was $240 million.
For AGRO, annual dividends cannot exceed $103 million, without AGRO certifying to the Authority that it will continue to meet required margins. Based on the foregoing limitations, in 2020 AGRO has the capacity to (i) make capital distributions in an aggregate amount up to $21 million without the prior approval of the Authority and (ii) declare and pay dividends in an aggregate amount up to approximately $103 million as of December 31, 2019. Such dividend capacity is further limited by (i) the actual amount of AGRO’s unencumbered assets, which amount changes from time to time due in part to collateral posting requirements and which was approximately $383 million as of December 31, 2019, and (ii) the amount of statutory surplus, which as of December 31, 2019 was $273 million.
United Kingdom
U.K. company law prohibits AGE UK from declaring a dividend to its shareholders unless it has “profits available for distribution.” The determination of whether a company has profits available for distribution is based on its accumulated realized profits less its accumulated realized losses. While the U.K. insurance regulatory laws impose no statutory restrictions on a general insurer's ability to declare a dividend, the Prudential Regulation Authority's capital requirements may in practice act as a restriction on dividends.
Dividend Restrictions and Capital Requirements
Distributions by
Insurance Subsidiaries
|
| | | | | | | | | | | |
| | Year Ended December 31, |
| | 2019 | | 2018 | | 2017 |
| | (in millions) |
| Dividends paid by AGC to AGUS | $ | 123 |
| | $ | 133 |
| | $ | 107 |
|
| Dividends paid by AGM to AGMH | 220 |
| | 171 |
| | 196 |
|
| Dividends paid by AG Re to AGL | 275 |
| | 125 |
| | 125 |
|
| Dividends paid by MAC to MAC Holdings (1) | 105 |
| | 27 |
| | 36 |
|
| Repurchase of common stock by AGM from AGMH | — |
| | — |
| | 101 |
|
| Repurchase of common stock by AGC from AGUS | 100 |
| | 200 |
| | — |
|
| Redemption of common stock by MAC from MAC Holdings (1) | — |
| | — |
| | 250 |
|
____________________
| |
| (1) | MAC Holdings distributed nearly the entire amounts to AGM and AGC, in proportion to their ownership percentages. |
| |
| 19. | Related Party Transactions |
From time to time, certain officers, directors, employees, their family members and related charitable foundations may make investments in various private funds, vehicles or accounts managed by the Company. These investments are available to those of the Company's employees whom the Company has determined to have a status that reasonably permits the Company to offer them these types of investments in compliance with applicable laws. Generally, these investments are not subject to the management fees and performance allocations or incentive fees charged to other investors. As of December 31, 2019, all noncontrolling interests in the consolidated balance sheets represent employees' ownership interests in consolidated Assured Investment Management funds. Andrew Feldstein, the Company’s Chief Investment Officer and Head of Asset Management, is among the Company’s employees who invest in various private funds, vehicles or accounts managed by the Company. See also Note 12, Asset Management Fees, for additional information.
NaN of the Company's investment portfolio managers, Wellington Management Company, LLP (Wellington) and BlackRock Financial Management, Inc. (BlackRock), each own more than 5% of the Company's common shares. In addition, the Company has a minority interest in Wasmer, Schroeder & Company LLC, which is also one of the Company's investment portfolio managers. The investment management expense from transactions with these related parties was approximately $3.8 million in 2019, $4.0 million in 2018 and $4.1 million in 2017. In addition, the Company recognized $1.0 million and $1.2 million in 2019 and 2018, respectively, in income from its investment in Wasmer, Schroeder & Company LLC, which is included in "equity in net earnings of investees" in the consolidated statements of operations. Accrued expenses from transactions with these related parties were $2 million as of both December 31, 2019 and December 31, 2018.
The Charles Schwab Corporation announced on February 24, 2020 that it had entered into an agreement to acquire Wasmer, Schroeder & Company, LLC, and that, subject to customary closing conditions, it expects to close the transaction in mid-2020.
| |
| 20. | Commitments and Contingencies |
Leases
The Company is party to various non-cancelable lease agreements, these leases include both operating and finance leases. The largest lease relates to approximately 103,500 square feet of office space in New York City, and expires in 2032. Subject to certain conditions, the Company has an option to renew this lease for an additional five years at a fair market rent. The Company also leases another 78,400 square feet of office space at a second location in New York City, and that lease expires in 2024. Additionally, the Company leases additional office space in several other locations, an apartment, and certain equipment. These leases expire at various dates through 2029.
Accounting Policy
Effective January 1, 2019, the Company adopted Topic 842, which required the establishment of a right-of-use (ROU) asset and a lease liability on the balance sheet for operating and finance leases. An ROU asset represents the Company's right to use an underlying asset for the lease term, and a lease liability represents the Company's obligation to make lease payments arising from the lease. Upon adoption, all of the Company’s leases were classified as operating leases; however, the Company made an accounting policy election not to apply the recognition requirements of Topic 842 to short-term leases with an initial term of 12 months or less. At the inception of a lease, the total payments under a lease agreement were discounted utilizing an incremental borrowing rate that represents the Company’s collateralized borrowing rate. Upon adoption, the incremental borrowing rate for each lease was determined based on the remaining lease term as of January 1, 2019. The Company does not include renewal options in calculating the lease liability.
The Company elected the package of practical expedients, which permitted organizations not to reassess (i) whether any expired or existing contracts are or contain leases, (ii) the lease classification of expired or existing leases, and (iii) the initial direct costs for existing leases. The Company also elected the practical expedient to account for all lease components and their associated non-lease components (i.e., common area maintenance, real estate taxes, building insurance, etc.) as a single lease component and include all fixed payments in the measurement of ROU assets and lease liabilities.
Upon adoption, the Company recognized lease liabilities of approximately $95 million (recorded in other liabilities), ROU assets of approximately $69 million (recorded in other assets), and derecognized existing deferred rent and lease incentive liabilities of approximately $26 million, which resulted in no cumulative-effect adjustment to retained earnings.
Operating lease expense is recognized on a straight-line basis over the lease term and finance lease expense is comprised of the straight-line amortization of the lease asset and the accretion of interest expense under the effective interest method. Costs related to variable lease and non-lease components for the Company’s leases are expensed in the period incurred. The Company also subleases office space that is not used for its operations.
Lease Assets and Liabilities
|
| | | | | | | | | | | | | |
| | | As of December 31, 2019 |
| | | Assets(1) | | Liabilities(2) | | Weighted Average Remaining Lease Term (in years) | | Weighted Average Discount Rate |
| | | (in millions) | | | | |
| Operating leases | | $ | 100 |
| | $ | 130 |
| | 9.4 | | 2.61 | % |
| Finance leases | | 2 |
| | 2 |
| | 1.8 | | 1.74 | % |
| Total | | $ | 102 |
| | $ | 132 |
| | | | |
____________________
| |
| (1) | Recorded in other assets in the consolidated balance sheets. Finance lease assets are recorded net of accumulated amortization of $0.1 million as of December 31, 2019. |
| |
| (2) | Recorded in other liabilities in the consolidated balance sheets. |
Components of Lease Expense and Other Information
|
| | | | |
| | | Year Ended December 31, |
| | | 2019 |
| | | (in millions) |
| Operating lease cost | | $ | 10 |
|
| Variable lease cost | | 2 |
|
| Total lease cost (1) | | $ | 12 |
|
| Cash paid for amounts included in the measurement of lease liabilities (2) | | |
| Operating cash flows from operating leases | | $ | 11 |
|
| ROU assets obtained in exchange for new operating lease liabilities (3) | | 37 |
|
| ROU assets obtained in exchange for new finance lease liabilities (3) | | 2 |
|
____________________
| |
| (1) | Short-term lease costs, finance lease costs and sublease income are de minimis. Includes amortization on finance lease ROU assets and interest on finance lease liabilities. |
| |
| (2) | Operating and financing cash flows from finance leases are de minimis. |
| |
| (3) | Relates primarily to BlueMountain Acquisition. See Note 2, Business Combinations and Assumption of Insured Portfolio, for additional information. |
Rent expense was $9 million in 2018 and $9 million in 2017.
Future Minimum Rental Payments
|
| | | | | | | | |
| | | As of December 31, 2019 |
| Year | | (in millions) |
| | | Operating Leases | | Finance Leases |
| 2020 | $ | 19 |
| | $ | 1 |
|
| 2021 | 19 |
| | 1 |
|
| 2022 | 19 |
| | — |
|
| 2023 | 19 |
| | — |
|
| 2024 | 11 |
| | — |
|
| Thereafter | 62 |
| | — |
|
| Total lease payments (1) | 149 |
| | 2 |
|
| Less: imputed interest | 19 |
| | — |
|
| Total lease liabilities | $ | 130 |
| | $ | 2 |
|
____________________
| |
| (1) | Prior to the adoption of ASC 842, future lease payments under operating leases at December 31, 2018 were $9 million, $9 million, $8 million, $8 million, and $9 million for 2019 through 2023, respectively, and $72 million in aggregate for all years thereafter. |
Legal Proceedings
Lawsuits arise in the ordinary course of the Company’s business. It is the opinion of the Company’s management, based upon the information available, that the expected outcome of litigation against the Company, individually or in the aggregate, will not have a material adverse effect on the Company’s financial position or liquidity, although an adverse resolution of litigation against the Company in a fiscal quarter or year could have a material adverse effect on the Company’s results of operations in a particular quarter or year.
In addition, in the ordinary course of their respective businesses, certain of AGL's insurance subsidiaries are involved in litigation with third parties to recover losses paid in prior periods or prevent or reduce losses in the future. For example, the Company is involved in a number of legal actions in the Federal District Court for Puerto Rico to enforce or defend its rights with respect to the obligations it insures of Puerto Rico and various of its related authorities and public corporations. See
"Exposure to Puerto Rico" section of Note 5, Outstanding Insurance Exposure, for a description of such actions. See "Recovery Litigation" section of Note 6, Expected Loss to be Paid, for a description of recovery litigation unrelated to Puerto Rico. Also in the ordinary course of their respective business, certain of AGL's investment management subsidiaries are involved in litigation with third parties regarding fees, appraisals, or portfolio companies. The impact, if any, of these and other proceedings on the amount of recoveries the Company receives and losses it pays in the future is uncertain, and the impact of any one or more of these proceedings during any quarter or year could be material to the Company's results of operations in that particular quarter or year.
The Company also receives subpoenas duces tecum and interrogatories from regulators from time to time.
Accounting Policy
The Company establishes accruals for litigation and regulatory matters to the extent it is probable that a loss has been incurred and the amount of that loss can be reasonably estimated. For litigation and regulatory matters where a loss may be reasonably possible, but not probable, or is probable but not reasonably estimable, no accrual is established, but if the matter is material, it is disclosed, including matters discussed below. The Company reviews relevant information with respect to its litigation and regulatory matters on a quarterly basis and updates its accruals, disclosures and estimates of reasonably possible loss based on such reviews.
Litigation
On November 28, 2011, Lehman Brothers International (Europe) (in administration) (LBIE) sued AG Financial Products Inc. (AGFP), an affiliate of AGC which in the past had provided credit protection to counterparties under CDS. AGC acts as the credit support provider of AGFP under these CDS. LBIE’s complaint, which was filed in the Supreme Court of the State of New York, asserted a claim for breach of the implied covenant of good faith and fair dealing based on AGFP's termination of 9 credit derivative transactions between LBIE and AGFP and asserted claims for breach of contract and breach of the implied covenant of good faith and fair dealing based on AGFP's termination of 28 other credit derivative transactions between LBIE and AGFP and AGFP's calculation of the termination payment in connection with those 28 other credit derivative transactions. Following defaults by LBIE, AGFP properly terminated the transactions in question in compliance with the agreement between AGFP and LBIE, and calculated the termination payment properly. AGFP calculated that LBIE owes AGFP approximately $4 million for the claims which were dismissed and approximately $25 million in connection with the termination of the other credit derivative transactions, whereas LBIE asserted in the complaint that AGFP owes LBIE a termination payment of approximately $1.4 billion. AGFP filed a motion to dismiss the claims for breach of the implied covenant of good faith in LBIE's complaint, and on March 15, 2013, the court granted AGFP's motion to dismiss in respect of the count relating to the 9 credit derivative transactions and narrowed LBIE's claim with respect to the 28 other credit derivative transactions. LBIE's administrators disclosed in an April 10, 2015 report to LBIE’s unsecured creditors that LBIE's valuation expert has calculated LBIE's claim for damages in aggregate for the 28 transactions to range between a minimum of approximately $200 million and a maximum of approximately $500 million, depending on what adjustment, if any, is made for AGFP's credit risk and excluding any applicable interest. AGFP filed a motion for summary judgment on the remaining causes of action asserted by LBIE and on AGFP's counterclaims, and on July 2, 2018, the court granted in part and denied in part AGFP’s motion. The court dismissed, in its entirety, LBIE’s remaining claim for breach of the implied covenant of good faith and fair dealing and also dismissed LBIE’s claim for breach of contract solely to the extent that it is based upon AGFP’s conduct in connection with the auction. With respect to LBIE’s claim for breach of contract, the court held that there are triable issues of fact regarding whether AGFP calculated its loss reasonably and in good faith. On October 1, 2018, AGFP filed an appeal with the Appellate Division of the Supreme Court of the State of New York, First Judicial Department, seeking reversal of the portions of the lower court's ruling denying AGFP’s motion for summary judgment with respect to LBIE’s sole remaining claim for breach of contract. On January 17, 2019, the Appellate Division affirmed the Supreme Court's decision, holding that the lower court correctly determined that there are triable issues of fact regarding whether AGFP calculated its loss reasonably and in good faith. A trial has been scheduled for March 2020.
Share Issuances
AGL has authorized share capital of $5 million divided into 500,000,000 shares with a par value $0.01 per share. Except as described below, AGL's common shares have no preemptive rights or other rights to subscribe for additional common shares, no rights of redemption, conversion or exchange and no sinking fund rights. In the event of liquidation, dissolution or winding-up, the holders of AGL's common shares are entitled to share equally, in proportion to the number of common shares held by such holder, in AGL's assets, if any remain after the payment of all its liabilities and the liquidation preference of any outstanding preferred shares. Under certain circumstances, AGL has the right to purchase all or a portion of the shares held by a shareholder at fair market value. All of the common shares are fully paid and non-assessable. Holders of AGL's common shares are entitled to receive dividends as lawfully may be declared from time to time by the Board.
In general, and except as provided below, shareholders have 1 vote for each common share held by them and are entitled to vote with respect to their fully paid shares at all meetings of shareholders. However, if, and so long as, the common shares (and other of AGL's shares) of a shareholder are treated as "controlled shares" (as determined pursuant to section 958 of the Code) of any U.S. Person and such controlled shares constitute 9.5% or more of the votes conferred by AGL's issued and outstanding shares, the voting rights with respect to the controlled shares owned by such U.S. Person shall be limited, in the aggregate, to a voting power of less than 9.5% of the voting power of all issued and outstanding shares, under a formula specified in AGL's Bye-laws. The formula is applied repeatedly until there is no U.S. Person whose controlled shares constitute 9.5% or more of the voting power of all issued and outstanding shares and who generally would be required to recognize income with respect to AGL under the Code if AGL were a CFC as defined in the Code and if the ownership threshold under the Code were 9.5% (as defined in AGL's Bye-Laws as a 9.5% U.S. Shareholder).
Subject to AGL's Bye-Laws and Bermuda law, AGL's Board has the power to issue any of AGL's unissued shares as it determines, including the issuance of any shares or class of shares with preferred, deferred or other special rights.
Under AGL's Bye-Laws and subject to Bermuda law, if AGL's Board determines that any ownership of AGL's shares may result in adverse tax, legal or regulatory consequences to the Company, any of the Company's subsidiaries or any of its shareholders or indirect holders of shares or its Affiliates (other than such as AGL's Board considers de minimis), the Company has the option, but not the obligation, to require such shareholder to sell to AGL, or to a third party to whom AGL assigns the repurchase right, the minimum number of common shares necessary to avoid or cure any such adverse consequences at a price determined in the discretion of the Board to represent the shares' fair market value (as defined in AGL's Bye-Laws). In addition, AGL's Board may determine that shares held carry different voting rights when it deems it appropriate to do so to (i) avoid the existence of any 9.5% U.S. Shareholder; and (ii) avoid adverse tax, legal or regulatory consequences to AGL or any of its subsidiaries or any direct or indirect holder of shares or its affiliates. "Controlled shares" includes, among other things, all shares of AGL that such U.S. Person is deemed to own directly, indirectly or constructively (within the meaning of section 958 of the Code). Further, these provisions do not apply in the event one shareholder owns greater than 75% of the voting power of all issued and outstanding shares.
Under these provisions, certain shareholders may have their voting rights limited to less than one vote per share, while other shareholders may have voting rights in excess of one vote per share. Moreover, these provisions could have the effect of reducing the votes of certain shareholders who would not otherwise be subject to the 9.5% limitation by virtue of their direct share ownership. AGL's Bye-laws provide that it will use its best efforts to notify shareholders of their voting interests prior to any vote to be taken by them.
Share Repurchases
Accounting Policy
The Company records share repurchases as a reduction to common stock and additional paid-in capital. Once additional paid-in capital has been exhausted, share repurchases are recorded as a reduction to common stock and retained earnings.
Share Repurchases
As of February 27, 2020, the Company was authorized to purchase $408 million of its common shares; including a $250 million authorization that was approved by the Board on February 26, 2020. The Company expects to repurchase shares from time to time in the open market or in privately negotiated transactions. The timing, form and amount of the share repurchases under the program are at the discretion of management and will depend on a variety of factors, including funds available at the parent company, other potential uses for such funds, market conditions, the Company's capital position, legal requirements and other factors. The repurchase program may be modified, extended or terminated by the Board at any time. It does not have an expiration date.
Share Repurchases
|
| | | | | | | | | | | |
| Year | | Number of Shares Repurchased | | Total Payments (in millions) | | Average Price Paid Per Share |
| 2017 | | 12,669,643 |
| | $ | 501 |
| | $ | 39.57 |
|
| 2018 | | 13,243,107 |
| | $ | 500 |
| | $ | 37.76 |
|
| 2019 | | 11,163,929 |
| | $ | 500 |
| | $ | 44.79 |
|
| 2020 (through February 27, 2020 on a settlement date basis) | | 843,729 |
| | $ | 40 |
| | $ | 47.41 |
|
Deferred Compensation
Certain executives of the Company elected to invest a portion of their AG US Group Services Inc. supplemental executive retirement plan (AGS SERP) accounts in the employer stock fund in the AGS SERP. Each unit in the employer stock fund represents the right to receive 1 AGL common share upon a distribution from the AGS SERP. Each unit equals the number of AGL common shares which could have been purchased with the value of the account deemed invested in the employer stock fund as of the date of such election. As of December 31, 2019 and 2018, there were 74,309 and 74,309 units, respectively, in the AGS SERP. See Note 16, Employee Benefit Plans.
Dividends
Any determination to pay cash dividends is at the discretion of the Company's Board, and depends upon the Company's results of operations, cash flows from operating activities, its financial position, capital requirements, general business conditions, legal, tax, regulatory, rating agency and contractual restrictions on the payment of dividends, other potential uses for such funds, and any other factors the Company's Board deems relevant. For more information concerning regulatory constraints that affect the Company's ability to pay dividends, see Note 18, Insurance Company Regulatory Requirements.
On February 26, 2020, the Company declared a quarterly dividend of $0.20 per common share compared with $0.18 per common share paid in 2019, an increase of 11%.
| |
| 22. | Other Comprehensive Income |
The following tables present the changes in each component of AOCI and the effect of reclassifications out of AOCI on the respective line items in net income.
Changes in Accumulated Other Comprehensive Income by Component
Year Ended December 31, 20162019
| | | | Net Unrealized Gains (Losses) on Investments with no Other-Than-Temporary Impairment | | Net Unrealized Gains (Losses) on Investments with Other-Than-Temporary Impairment | | Cumulative Translation Adjustment | | Cash Flow Hedge | | Total Accumulated Other Comprehensive Income | Net Unrealized Gains (Losses) on Investments with no OTTI | | Net Unrealized Gains (Losses) on Investments with OTTI | | Net Unrealized Gains (Losses) on FG VIEs’ Liabilities with Recourse due to ISCR | | Cumulative Translation Adjustment | | Cash Flow Hedge | | Total AOCI |
| | (in millions) | (in millions) |
| Balance, December 31, 2015 | $ | 260 |
| | $ | (15 | ) | | $ | (16 | ) | | $ | 8 |
| | $ | 237 |
| |
| Balance, December 31, 2018 | | $ | 59 |
| | $ | 94 |
| | $ | (31 | ) | | $ | (37 | ) | | $ | 8 |
| | $ | 93 |
|
| Other comprehensive income (loss) before reclassifications | (71 | ) | | (9 | ) | | (23 | ) | | — |
| | (103 | ) | 339 |
| | (62 | ) | | (8 | ) | | (1 | ) | | — |
| | 268 |
|
| Amounts reclassified from AOCI to: | | | | | | | | | | |
| Less: Amounts reclassified from AOCI to: | | | | | | | | | | | | |
| Net realized investment gains (losses) | (23 | ) | | 52 |
| | — |
| | — |
| | 29 |
| 55 |
| | (32 | ) | | — |
| | — |
| | — |
| | 23 |
|
| Net investment income | (3 | ) | | — |
| | — |
| | — |
| | (3 | ) | 1 |
| | 15 |
| | — |
| | — |
| | — |
| | 16 |
|
| Fair value gains (losses) on FG VIEs | | — |
| | — |
| | (15 | ) | | — |
| | — |
| | (15 | ) |
| Interest expense | — |
| | — |
| | — |
| | (1 | ) | | (1 | ) | — |
| | — |
| | — |
| | — |
| | 1 |
| | 1 |
|
| Total before tax | (26 | ) | | 52 |
| | — |
| | (1 | ) | | 25 |
| 56 |
| | (17 | ) | | (15 | ) | | — |
| | 1 |
| | 25 |
|
| Tax (provision) benefit | 8 |
| | (18 | ) | | — |
| | 0 |
| | (10 | ) | (10 | ) | | 1 |
| | 3 |
| | — |
| | — |
| | (6 | ) |
| Total amount reclassified from AOCI, net of tax | (18 | ) | | 34 |
| | — |
| | (1 | ) | | 15 |
| 46 |
| | (16 | ) | | (12 | ) | | — |
| | 1 |
| | 19 |
|
| Net current period other comprehensive income (loss) | (89 | ) | | 25 |
| | (23 | ) | | (1 | ) | | (88 | ) | 293 |
| | (46 | ) | | 4 |
| | (1 | ) | | (1 | ) | | 249 |
|
| Balance, December 31, 2016 | $ | 171 |
| | $ | 10 |
| | $ | (39 | ) | | $ | 7 |
| | $ | 149 |
| |
| Balance, December 31, 2019 | | $ | 352 |
| | $ | 48 |
| | $ | (27 | ) | | $ | (38 | ) | | $ | 7 |
| | $ | 342 |
|
Changes in Accumulated Other Comprehensive Income by Component
Year Ended December 31, 20152018
| | | | Net Unrealized Gains (Losses) on Investments with no Other-Than-Temporary Impairment | | Net Unrealized Gains (Losses) on Investments with Other-Than-Temporary Impairment | | Cumulative Translation Adjustment | | Cash Flow Hedge | | Total Accumulated Other Comprehensive Income | Net Unrealized Gains (Losses) on Investments with no OTTI | | Net Unrealized Gains (Losses) on Investments with OTTI | | Net Unrealized Gains (Losses) on FG VIEs’ Liabilities with Recourse due to ISCR | | Cumulative Translation Adjustment | | Cash Flow Hedge | | Total AOCI |
| | (in millions) | (in millions) |
| Balance, December 31, 2014 | $ | 367 |
| | $ | 4 |
| | $ | (10 | ) | | $ | 9 |
| | $ | 370 |
| |
| Balance, December 31, 2017 | | $ | 273 |
| | $ | 120 |
| | — |
| | $ | (29 | ) | | $ | 8 |
| | $ | 372 |
|
| Effect of adoption of ASU 2016-01 (1) | | 1 |
| | — |
| | (33 | ) | | — |
| | — |
| | (32 | ) |
| Other comprehensive income (loss) before reclassifications | (93 | ) | | (43 | ) | | (6 | ) | | — |
| | (142 | ) | (208 | ) | | (58 | ) | | (5 | ) | | (8 | ) | | — |
| | (279 | ) |
| Amounts reclassified from AOCI to: | | | | | | | | | | |
| Less: Amounts reclassified from AOCI to: | | | | | | | | | | | | |
| Net realized investment gains (losses) | (11 | ) | | 37 |
| | — |
| | — |
| | 26 |
| 7 |
| | (38 | ) | | — |
| | — |
| | — |
| | (31 | ) |
| Net investment income | (9 | ) | | — |
| | — |
| | — |
| | (9 | ) | |
| Fair value gains (losses) on FG VIEs | | — |
| | — |
| | (9 | ) | | — |
| | — |
| | (9 | ) |
| Interest expense | — |
| | — |
| | — |
| | (1 | ) | | (1 | ) | — |
| | — |
| | — |
| | — |
| | — |
| | — |
|
| Total before tax | (20 | ) | | 37 |
| | — |
| | (1 | ) | | 16 |
| 7 |
| | (38 | ) | | (9 | ) | | — |
| | — |
| | (40 | ) |
| Tax (provision) benefit | 6 |
| | (13 | ) | | — |
| | 0 |
| | (7 | ) | — |
| | 6 |
| | 2 |
| | — |
| | — |
| | 8 |
|
| Total amount reclassified from AOCI, net of tax | (14 | ) | | 24 |
| | — |
| | (1 | ) | | 9 |
| 7 |
| | (32 | ) | | (7 | ) | | — |
| | — |
| | (32 | ) |
| Net current period other comprehensive income (loss) | (107 | ) | | (19 | ) | | (6 | ) | | (1 | ) | | (133 | ) | (215 | ) | | (26 | ) | | 2 |
| | (8 | ) | | — |
| | (247 | ) |
| Balance, December 31, 2015 | $ | 260 |
| | $ | (15 | ) | | $ | (16 | ) | | $ | 8 |
| | $ | 237 |
| |
| Balance, December 31, 2018 | | $ | 59 |
| | $ | 94 |
| | $ | (31 | ) | | $ | (37 | ) | | $ | 8 |
| | $ | 93 |
|
____________________
| |
| (1) | On January 1, 2018, the Company adopted ASU 2016-01, Financial Instruments - Overall (Subtopic 825-10) - Recognition and Measurement of Financial Assets and Financial Liabilities, resulting in a cumulative-effect reclassification of a $32 million loss, net of tax, from retained earnings to AOCI. |
Changes in Accumulated Other Comprehensive Income by Component
Year Ended December 31, 20142017
|
| | | | | | | | | | | | | | | | | | | |
| | Net Unrealized Gains (Losses) on Investments with no OTTI | | Net Unrealized Gains (Losses) on Investments with OTTI | | Cumulative Translation Adjustment | | Cash Flow
Hedge | | Total AOCI |
| | (in millions) |
| Balance, December 31, 2016 | $ | 171 |
| | $ | 10 |
| | $ | (39 | ) | | $ | 7 |
| | $ | 149 |
|
| Reclassification of stranded tax effects | 38 |
| | 21 |
| | (5 | ) | | 2 |
| | $ | 56 |
|
| Other comprehensive income (loss) before reclassifications | 128 |
| | 69 |
| | 15 |
| | — |
| | 212 |
|
| Less: Amounts reclassified from AOCI to: | | | | | | | | | |
| Net realized investment gains (losses) | 71 |
| | (31 | ) | | — |
| | — |
| | 40 |
|
| Net investment income | 27 |
| | 1 |
| | — |
| | — |
| | 28 |
|
| Interest expense | — |
| | — |
| | — |
| | 1 |
| | 1 |
|
| Total before tax | 98 |
| | (30 | ) | | — |
| | 1 |
| | 69 |
|
| Tax (provision) benefit | (34 | ) | | 10 |
| | — |
| | — |
| | (24 | ) |
| Total amount reclassified from AOCI, net of tax | 64 |
| | (20 | ) | | — |
| | 1 |
| | 45 |
|
| Net current period other comprehensive income (loss) | 64 |
| | 89 |
| | 15 |
| | (1 | ) | | 167 |
|
| Balance, December 31, 2017 | $ | 273 |
| | $ | 120 |
| | $ | (29 | ) | | $ | 8 |
| | $ | 372 |
|
|
| | | | | | | | | | | | | | | | | | | |
| | Net Unrealized Gains (Losses) on Investments with no Other-Than-Temporary Impairment | | Net Unrealized Gains (Losses) on Investments with Other-Than-Temporary Impairment | | Cumulative Translation Adjustment | | Cash Flow Hedge | | Total Accumulated Other Comprehensive Income |
| | (in millions) |
| Balance, December 31, 2013 | $ | 178 |
| | $ | (24 | ) | | $ | (3 | ) | | $ | 9 |
| | $ | 160 |
|
| Other comprehensive income (loss) before reclassifications | 196 |
| | (20 | ) | | (7 | ) | | — |
| | 169 |
|
| Amounts reclassified from AOCI to: | | | | | | | | | |
| Net realized investment gains (losses) | (12 | ) | | 74 |
| | — |
| | — |
| | 62 |
|
| Interest expense | — |
| | — |
| | — |
| | 0 |
| | 0 |
|
| Total before tax | (12 | ) | | 74 |
| | — |
| | 0 |
| | 62 |
|
| Tax (provision) benefit | 5 |
| | (26 | ) | | — |
| | 0 |
| | (21 | ) |
| Total amount reclassified from AOCI, net of tax | (7 | ) | | 48 |
| | — |
| | 0 |
| | 41 |
|
| Net current period other comprehensive income (loss) | 189 |
| | 28 |
| | (7 | ) | | 0 |
| | 210 |
|
| Balance, December 31, 2014 | $ | 367 |
| | $ | 4 |
| | $ | (10 | ) | | $ | 9 |
| | $ | 370 |
|
| |
21.23. | Subsidiary InformationEarnings Per Share |
Accounting Policy
The following tables presentCompany computes EPS using a two-class method, which is an earnings allocation formula that determines EPS for (i) each class of common stock (the Company has a single class of common stock), and (ii) participating securities according to dividends declared (or accumulated) and participation rights in undistributed earnings. Restricted stock awards and share units under the condensed consolidatingAGS SERP are considered participating securities as they received non-forfeitable rights to dividends (or dividend equivalents) similar to common stock.
Basic EPS is calculated by dividing net income (loss) available to common shareholders of Assured Guaranty by the weighted‑average number of common shares outstanding during the period. Diluted EPS adjusts basic EPS for the effects of restricted stock, restricted stock units, stock options and other potentially dilutive financial information for AGUS and AGMH, 100%-owned subsidiariesinstruments (dilutive securities), only in the periods in which such effect is dilutive. The effect of AGL, which have issued publicly traded debtthe dilutive securities (see Note 16, Long Term Debt and Credit Facilities). The information for AGL, AGUS and AGMH presents its subsidiaries onis reflected in diluted EPS by application of the equitymore dilutive of (1) the treasury stock method or (2) the two-class method assuming nonvested shares are not converted into common shares.
Computation of accounting.Earnings Per Share
CONDENSED CONSOLIDATING BALANCE SHEET
AS OF DECEMBER 31, 2016
(in millions)
|
| | | | | | | | | | | |
| | Year Ended December 31, |
| | 2019 | | 2018 | | 2017 |
| | (in millions, except per share amounts) |
| Basic EPS: | | | | | |
| Net income (loss) attributable to AGL | $ | 402 |
| | $ | 521 |
| | 730 |
|
| Less: Distributed and undistributed income (loss) available to nonvested shareholders | 1 |
| | 1 |
| | 1 |
|
| Distributed and undistributed income (loss) available to common shareholders of AGL and subsidiaries, basic | $ | 401 |
| | $ | 520 |
| | 729 |
|
| Basic shares | 99.3 |
| | 110.0 |
| | 120.6 |
|
| Basic EPS | $ | 4.04 |
| | $ | 4.73 |
| | $ | 6.05 |
|
| | | | | | |
| Diluted EPS: | | | | | |
| Distributed and undistributed income (loss) available to common shareholders of AGL and subsidiaries, basic | $ | 401 |
| | $ | 520 |
| | $ | 729 |
|
| Plus: Re-allocation of undistributed income (loss) available to nonvested shareholders of AGL and subsidiaries | — |
| | — |
| | — |
|
| Distributed and undistributed income (loss) available to common shareholders of AGL and subsidiaries, diluted | $ | 401 |
| | $ | 520 |
| | $ | 729 |
|
| | | | | | |
| Basic shares | 99.3 |
| | 110.0 |
| | 120.6 |
|
| Dilutive securities: | | | | | |
| Options and restricted stock awards | 0.9 |
| | 1.3 |
| | 1.7 |
|
| Diluted shares | 100.2 |
| | 111.3 |
| | 122.3 |
|
| Diluted EPS | $ | 4.00 |
| | $ | 4.68 |
| | $ | 5.96 |
|
| Potentially dilutive securities excluded from computation of EPS because of antidilutive effect | — |
| | 0.1 |
| | 0.1 |
|
|
| | | | | | | | | | | | | | | | | | | | | | | |
| | Assured Guaranty Ltd. (Parent) | | AGUS (Issuer) | | AGMH (Issuer) | | Other Entities | | Consolidating Adjustments | | Assured Guaranty Ltd. (Consolidated) |
| ASSETS | |
| | |
| | |
| | |
| | |
| | |
|
| Total investment portfolio and cash | $ | 36 |
| | $ | 384 |
| | $ | 22 |
| | $ | 11,029 |
| | $ | (368 | ) | | $ | 11,103 |
|
| Investment in subsidiaries | 6,164 |
| | 5,696 |
| | 3,734 |
| | 296 |
| | (15,890 | ) | | — |
|
| Premiums receivable, net of commissions payable | — |
| | — |
| | — |
| | 699 |
| | (123 | ) | | 576 |
|
| Ceded unearned premium reserve | — |
| | — |
| | — |
| | 1,099 |
| | (893 | ) | | 206 |
|
| Deferred acquisition costs | — |
| | — |
| | — |
| | 156 |
| | (50 | ) | | 106 |
|
| Reinsurance recoverable on unpaid losses | — |
| | — |
| | — |
| | 484 |
| | (404 | ) | | 80 |
|
| Credit derivative assets | — |
| | — |
| | — |
| | 69 |
| | (56 | ) | | 13 |
|
| Deferred tax asset, net | — |
| | 16 |
| | — |
| | 597 |
| | (116 | ) | | 497 |
|
| Intercompany receivable | — |
| | — |
| | — |
| | 70 |
| | (70 | ) | | — |
|
| Financial guaranty variable interest entities’ assets, at fair value | — |
| | — |
| | — |
| | 876 |
| | — |
| | 876 |
|
| Dividend receivable from affiliate | 300 |
| | — |
| | — |
| | — |
| | (300 | ) | | — |
|
| Other | 11 |
| | 78 |
| | 26 |
| | 801 |
| | (222 | ) | | 694 |
|
| TOTAL ASSETS | $ | 6,511 |
| | $ | 6,174 |
| | $ | 3,782 |
| | $ | 16,176 |
| | $ | (18,492 | ) | | $ | 14,151 |
|
| LIABILITIES AND SHAREHOLDERS’ EQUITY | |
| | |
| | |
| | |
| | |
| | |
|
| Unearned premium reserves | — |
| | — |
| | — |
| | 4,488 |
| | (977 | ) | | 3,511 |
|
| Loss and LAE reserve | — |
| | — |
| | — |
| | 1,596 |
| | (469 | ) | | 1,127 |
|
| Long-term debt | — |
| | 843 |
| | 453 |
| | 10 |
| | — |
| | 1,306 |
|
| Intercompany payable | — |
| | 70 |
| | — |
| | 300 |
| | (370 | ) | | — |
|
| Credit derivative liabilities | — |
| | — |
| | — |
| | 458 |
| | (56 | ) | | 402 |
|
| Deferred tax liabilities, net | — |
| | — |
| | 88 |
| | — |
| | (88 | ) | | — |
|
| Financial guaranty variable interest entities’ liabilities, at fair value | — |
| | — |
| | — |
| | 958 |
| | — |
| | 958 |
|
| Dividend payable to affiliate | — |
| | 300 |
| | — |
| | — |
| | (300 | ) | | — |
|
| Other | 7 |
| | 3 |
| | 14 |
| | 665 |
| | (346 | ) | | 343 |
|
| TOTAL LIABILITIES | 7 |
| | 1,216 |
| | 555 |
| | 8,475 |
| | (2,606 | ) | | 7,647 |
|
| TOTAL SHAREHOLDERS’ EQUITY ATTRIBUTABLE TO ASSURED GUARANTY LTD. | 6,504 |
| | 4,958 |
| | 3,227 |
| | 7,405 |
| | (15,590 | ) | | 6,504 |
|
| Noncontrolling interest | — |
| | — |
| | — |
| | 296 |
| | (296 | ) | | — |
|
| TOTAL SHAREHOLDERS’ EQUITY | 6,504 |
| | 4,958 |
| | 3,227 |
| | 7,701 |
| | (15,886 | ) | | 6,504 |
|
| TOTAL LIABILITIES AND SHAREHOLDERS’ EQUITY | $ | 6,511 |
| | $ | 6,174 |
| | $ | 3,782 |
| | $ | 16,176 |
| | $ | (18,492 | ) | | $ | 14,151 |
|
CONDENSED CONSOLIDATING BALANCE SHEET
AS OF DECEMBER 31, 2015
(in millions)
|
| | | | | | | | | | | | | | | | | | | | | | | |
| | Assured Guaranty Ltd. (Parent) | | AGUS (Issuer) | | AGMH (Issuer) | | Other Entities | | Consolidating Adjustments | | Assured Guaranty Ltd. (Consolidated) |
| ASSETS | |
| | |
| | |
| | |
| | |
| | |
|
| Total investment portfolio and cash | $ | 10 |
| | $ | 156 |
| | $ | 22 |
| | $ | 11,530 |
| | $ | (360 | ) | | $ | 11,358 |
|
| Investment in subsidiaries | 5,961 |
| | 5,569 |
| | 4,081 |
| | 377 |
| | (15,988 | ) | | — |
|
| Premiums receivable, net of commissions payable | — |
| | — |
| | — |
| | 833 |
| | (140 | ) | | 693 |
|
| Ceded unearned premium reserve | — |
| | — |
| | — |
| | 1,266 |
| | (1,034 | ) | | 232 |
|
| Deferred acquisition costs | — |
| | — |
| | — |
| | 176 |
| | (62 | ) | | 114 |
|
| Reinsurance recoverable on unpaid losses | — |
| | — |
| | — |
| | 467 |
| | (398 | ) | | 69 |
|
| Credit derivative assets | — |
| | — |
| | — |
| | 207 |
| | (126 | ) | | 81 |
|
| Deferred tax asset, net | — |
| | 52 |
| | — |
| | 357 |
| | (133 | ) | | 276 |
|
| Intercompany receivable | — |
| | — |
| | — |
| | 90 |
| | (90 | ) | | — |
|
| Financial guaranty variable interest entities’ assets, at fair value | — |
| | — |
| | — |
| | 1,261 |
| | — |
| | 1,261 |
|
| Dividend receivable from affiliate | 69 |
| | — |
| | — |
| | — |
| | — |
| | 69 |
|
| Other | 29 |
| | 29 |
| | 26 |
| | 571 |
| | (264 | ) | | 391 |
|
| TOTAL ASSETS | $ | 6,069 |
| | $ | 5,806 |
| | $ | 4,129 |
| | $ | 17,135 |
| | $ | (18,595 | ) | | $ | 14,544 |
|
| LIABILITIES AND SHAREHOLDERS’ EQUITY | |
| | |
| | |
| | |
| | |
| | |
|
| Unearned premium reserves | — |
| | — |
| | — |
| | 5,143 |
| | (1,147 | ) | | 3,996 |
|
| Loss and LAE reserve | — |
| | — |
| | — |
| | 1,537 |
| | (470 | ) | | 1,067 |
|
| Long-term debt | — |
| | 842 |
| | 445 |
| | 13 |
| | — |
| | 1,300 |
|
| Intercompany payable | — |
| | 90 |
| | — |
| | 300 |
| | (390 | ) | | — |
|
| Credit derivative liabilities | — |
| | — |
| | — |
| | 572 |
| | (126 | ) | | 446 |
|
| Deferred tax liabilities, net | — |
| | — |
| | 91 |
| | — |
| | (91 | ) | | — |
|
| Financial guaranty variable interest entities’ liabilities, at fair value | — |
| | — |
| | — |
| | 1,349 |
| | — |
| | 1,349 |
|
| Dividend payable to affiliate | — |
| | 69 |
| | — |
| | — |
| | — |
| | 69 |
|
| Other | 6 |
| | 13 |
| | 15 |
| | 622 |
| | (402 | ) | | 254 |
|
| TOTAL LIABILITIES | 6 |
| | 1,014 |
| | 551 |
| | 9,536 |
| | (2,626 | ) | | 8,481 |
|
| TOTAL SHAREHOLDERS’ EQUITY ATTRIBUTABLE TO ASSURED GUARANTY LTD. | 6,063 |
| | 4,792 |
| | 3,578 |
| | 7,222 |
| | (15,592 | ) | | 6,063 |
|
| Noncontrolling interest | — |
| | — |
| | — |
| | 377 |
| | (377 | ) | | — |
|
| TOTAL SHAREHOLDERS’ EQUITY | 6,063 |
| | 4,792 |
| | 3,578 |
| | 7,599 |
| | (15,969 | ) | | 6,063 |
|
| TOTAL LIABILITIES AND SHAREHOLDERS’ EQUITY | $ | 6,069 |
| | $ | 5,806 |
| | $ | 4,129 |
| | $ | 17,135 |
| | $ | (18,595 | ) | | $ | 14,544 |
|
CONDENSED CONSOLIDATING STATEMENT OF OPERATIONS
AND COMPREHENSIVE INCOME
FOR THE YEAR ENDED DECEMBER 31, 2016
(in millions)
|
| | | | | | | | | | | | | | | | | | | | | | | |
| | Assured Guaranty Ltd. (Parent) | | AGUS (Issuer) | | AGMH (Issuer) | | Other Entities | | Consolidating Adjustments | | Assured Guaranty Ltd. (Consolidated) |
| REVENUES | |
| | |
| | |
| | |
| | |
| | |
|
| Net earned premiums | $ | — |
| | $ | — |
| | $ | — |
| | $ | 892 |
| | $ | (28 | ) | | $ | 864 |
|
| Net investment income | 0 |
| | 0 |
| | 0 |
| | 412 |
| | (4 | ) | | 408 |
|
| Net realized investment gains (losses) | 0 |
| | 2 |
| | 0 |
| | (28 | ) | | (3 | ) | | (29 | ) |
| Net change in fair value of credit derivatives: | |
| | |
| | |
| | |
| | |
| | |
| Realized gains (losses) and other settlements | — |
| | — |
| | — |
| | 29 |
| | 0 |
| | 29 |
|
| Net unrealized gains (losses) | — |
| | — |
| | — |
| | 69 |
| | — |
| | 69 |
|
| Net change in fair value of credit derivatives | — |
| | — |
| | — |
| | 98 |
| | — |
| | 98 |
|
| Bargain purchase gain and settlement of pre-existing relationships | — |
| | — |
| | — |
| | 257 |
| | 2 |
| | 259 |
|
| Other | 0 |
| | — |
| | — |
| | 78 |
| | (1 | ) | | 77 |
|
| TOTAL REVENUES | 0 |
| | 2 |
| | 0 |
| | 1,709 |
| | (34 | ) | | 1,677 |
|
| EXPENSES | |
| | |
| | |
| | |
| | |
| | |
|
| Loss and LAE | — |
| | — |
| | — |
| | 296 |
| | (1 | ) | | 295 |
|
| Amortization of deferred acquisition costs | — |
| | — |
| | — |
| | 30 |
| | (12 | ) | | 18 |
|
| Interest expense | — |
| | 52 |
| | 54 |
| | 10 |
| | (14 | ) | | 102 |
|
| Other operating expenses | 29 |
| | 2 |
| | 2 |
| | 217 |
| | (5 | ) | | 245 |
|
| TOTAL EXPENSES | 29 |
| | 54 |
| | 56 |
| | 553 |
| | (32 | ) | | 660 |
|
| INCOME (LOSS) BEFORE INCOME TAXES AND EQUITY IN NET EARNINGS OF SUBSIDIARIES | (29 | ) | | (52 | ) | | (56 | ) | | 1,156 |
| | (2 | ) | | 1,017 |
|
| Total (provision) benefit for income taxes | — |
| | 18 |
| | 20 |
| | (175 | ) | | 1 |
| | (136 | ) |
| Equity in net earnings of subsidiaries | 910 |
| | 794 |
| | 274 |
| | 44 |
| | (2,022 | ) | | — |
|
| NET INCOME (LOSS) | 881 |
| | 760 |
| | 238 |
| | 1,025 |
| | (2,023 | ) | | 881 |
|
| Less: noncontrolling interest | — |
| | — |
| | — |
| | 44 |
| | (44 | ) | | — |
|
| NET INCOME (LOSS) ATTRIBUTABLE TO ASSURED GUARANTY LTD. | $ | 881 |
| | $ | 760 |
| | $ | 238 |
| | $ | 981 |
| | $ | (1,979 | ) | | $ | 881 |
|
| | | | | | | | | | | | |
| COMPREHENSIVE INCOME (LOSS) | $ | 793 |
| | $ | 685 |
| | $ | 163 |
| | $ | 953 |
| | $ | (1,801 | ) | | $ | 793 |
|
CONDENSED CONSOLIDATING STATEMENT OF OPERATIONS
AND COMPREHENSIVE INCOME
FOR THE YEAR ENDED DECEMBER 31, 2015
(in millions)
|
| | | | | | | | | | | | | | | | | | | | | | | |
| | Assured Guaranty Ltd. (Parent) | | AGUS (Issuer) | | AGMH (Issuer) | | Other Entities | | Consolidating Adjustments | | Assured Guaranty Ltd. (Consolidated) |
| REVENUES | |
| | |
| | |
| | |
| | |
| | |
|
| Net earned premiums | $ | — |
| | $ | — |
| | $ | — |
| | $ | 783 |
| | $ | (17 | ) | | $ | 766 |
|
| Net investment income | 0 |
| | 1 |
| | 0 |
| | 432 |
| | (10 | ) | | 423 |
|
| Net realized investment gains (losses) | 0 |
| | 0 |
| | 1 |
| | (19 | ) | | (8 | ) | | (26 | ) |
| Net change in fair value of credit derivatives: | |
| | |
| | |
| | |
| | |
| | |
| Realized gains (losses) and other settlements | — |
| | — |
| | — |
| | (18 | ) | | 0 |
| | (18 | ) |
| Net unrealized gains (losses) | — |
| | — |
| | — |
| | 773 |
| | (27 | ) | | 746 |
|
| Net change in fair value of credit derivatives | — |
| | — |
| | — |
| | 755 |
| | (27 | ) | | 728 |
|
| Bargain purchase gain and settlement of pre-existing relationships | — |
| | — |
| | — |
| | 54 |
| | 160 |
| | 214 |
|
| Other | — |
| | 0 |
| | — |
| | 102 |
| | 0 |
| | 102 |
|
| TOTAL REVENUES | 0 |
| | 1 |
| | 1 |
| | 2,107 |
| | 98 |
| | 2,207 |
|
| EXPENSES | |
| | |
| | |
| | |
| | |
| | |
|
| Loss and LAE | — |
| | — |
| | — |
| | 434 |
| | (10 | ) | | 424 |
|
| Amortization of deferred acquisition costs | — |
| | — |
| | — |
| | 29 |
| | (9 | ) | | 20 |
|
| Interest expense | — |
| | 52 |
| | 54 |
| | 14 |
| | (19 | ) | | 101 |
|
| Other operating expenses | 30 |
| | 1 |
| | 1 |
| | 202 |
| | (3 | ) | | 231 |
|
| TOTAL EXPENSES | 30 |
| | 53 |
| | 55 |
| | 679 |
| | (41 | ) | | 776 |
|
| INCOME (LOSS) BEFORE INCOME TAXES AND EQUITY IN NET EARNINGS OF SUBSIDIARIES | (30 | ) | | (52 | ) | | (54 | ) | | 1,428 |
| | 139 |
| | 1,431 |
|
| Total (provision) benefit for income taxes | — |
| | 18 |
| | 19 |
| | (365 | ) | | (47 | ) | | (375 | ) |
| Equity in net earnings of subsidiaries | 1,086 |
| | 923 |
| | 468 |
| | 39 |
| | (2,516 | ) | | — |
|
| NET INCOME (LOSS) | 1,056 |
| | 889 |
| | 433 |
| | 1,102 |
| | (2,424 | ) | | 1,056 |
|
| Less: noncontrolling interest | — |
| | — |
| | — |
| | 39 |
| | (39 | ) | | — |
|
| NET INCOME (LOSS) ATTRIBUTABLE TO ASSURED GUARANTY LTD. | $ | 1,056 |
| | $ | 889 |
| | $ | 433 |
| | $ | 1,063 |
| | $ | (2,385 | ) | | $ | 1,056 |
|
| | | | | | | | | | | | |
| COMPREHENSIVE INCOME (LOSS) | $ | 923 |
| | $ | 787 |
| | $ | 359 |
| | $ | 967 |
| | $ | (2,113 | ) | | $ | 923 |
|
CONDENSED CONSOLIDATING STATEMENT OF OPERATIONS
AND COMPREHENSIVE INCOME
FOR THE YEAR ENDED DECEMBER 31, 2014
(in millions)
|
| | | | | | | | | | | | | | | | | | | | | | | |
| | Assured Guaranty Ltd. (Parent) | | AGUS (Issuer) | | AGMH (Issuer) | | Other Entities | | Consolidating Adjustments | | Assured Guaranty Ltd. (Consolidated) |
| REVENUES | |
| | |
| | |
| | |
| | |
| | |
|
| Net earned premiums | $ | — |
| | $ | — |
| | $ | — |
| | $ | 566 |
| | $ | 4 |
| | $ | 570 |
|
| Net investment income | 0 |
| | 0 |
| | 1 |
| | 412 |
| | (10 | ) | | 403 |
|
| Net realized investment gains (losses) | 0 |
| | 0 |
| | 0 |
| | (58 | ) | | (2 | ) | | (60 | ) |
| Net change in fair value of credit derivatives: | |
| | |
| | |
| | |
| | |
| | |
| Realized gains (losses) and other settlements | — |
| | — |
| | — |
| | 23 |
| | — |
| | 23 |
|
| Net unrealized gains (losses) | — |
| | — |
| | — |
| | 800 |
| | — |
| | 800 |
|
| Net change in fair value of credit derivatives | — |
| | — |
| | — |
| | 823 |
| | — |
| | 823 |
|
| Other | — |
| | — |
| | — |
| | 259 |
| | (1 | ) | | 258 |
|
| TOTAL REVENUES | 0 |
| | 0 |
| | 1 |
| | 2,002 |
| | (9 | ) | | 1,994 |
|
| EXPENSES | |
| | |
| | |
| | |
| | |
| | |
|
| Loss and LAE | — |
| | — |
| | — |
| | 122 |
| | 4 |
| | 126 |
|
| Amortization of deferred acquisition costs | — |
| | — |
| | — |
| | 33 |
| | (8 | ) | | 25 |
|
| Interest expense | — |
| | 40 |
| | 54 |
| | 16 |
| | (18 | ) | | 92 |
|
| Other operating expenses | 31 |
| | 1 |
| | 1 |
| | 195 |
| | (8 | ) | | 220 |
|
| TOTAL EXPENSES | 31 |
| | 41 |
| | 55 |
| | 366 |
| | (30 | ) | | 463 |
|
| INCOME (LOSS) BEFORE INCOME TAXES AND EQUITY IN NET EARNINGS OF SUBSIDIARIES | (31 | ) | | (41 | ) | | (54 | ) | | 1,636 |
| | 21 |
| | 1,531 |
|
| Total (provision) benefit for income taxes | — |
| | 14 |
| | 19 |
| | (469 | ) | | (7 | ) | | (443 | ) |
| Equity in net earnings of subsidiaries | 1,119 |
| | 983 |
| | 513 |
| | 32 |
| | (2,647 | ) | | — |
|
| NET INCOME (LOSS) | 1,088 |
| | 956 |
| | 478 |
| | 1,199 |
| | (2,633 | ) | | 1,088 |
|
| Less: noncontrolling interest | — |
| | — |
| | — |
| | 32 |
| | (32 | ) | | — |
|
| NET INCOME (LOSS) ATTRIBUTABLE TO ASSURED GUARANTY LTD. | $ | 1,088 |
| | $ | 956 |
| | $ | 478 |
| | $ | 1,167 |
| | $ | (2,601 | ) | | $ | 1,088 |
|
| | | | | | | | | | | | |
| COMPREHENSIVE INCOME (LOSS) | $ | 1,298 |
| | $ | 1,114 |
| | $ | 577 |
| | $ | 1,570 |
| | $ | (3,261 | ) | | $ | 1,298 |
|
CONDENSED CONSOLIDATING STATEMENT OF CASH FLOWS
FOR THE YEAR ENDED DECEMBER 31, 2016
(in millions)
|
| | | | | | | | | | | | | | | | | | | | | | | |
| | Assured Guaranty Ltd. (Parent) | | AGUS (Issuer) | | AGMH (Issuer) | | Other Entities | | Consolidating Adjustments | | Assured Guaranty Ltd. (Consolidated) |
| Net cash flows provided by (used in) operating activities | $ | 390 |
| | $ | 533 |
| | $ | 213 |
| | $ | 64 |
| | $ | (1,341 | ) | | $ | (141 | ) |
| Cash flows from investing activities | |
| | |
| | |
| | |
| | |
| | |
|
| Fixed-maturity securities: | |
| | |
| | |
| | |
| | |
| | |
|
| Purchases | (4 | ) | | (143 | ) | | (10 | ) | | (1,489 | ) | | — |
| | (1,646 | ) |
| Sales | 4 |
| | 24 |
| | 12 |
| | 1,325 |
| | — |
| | 1,365 |
|
| Maturities | — |
| | 30 |
| | — |
| | 1,125 |
| | — |
| | 1,155 |
|
| Sales (purchases) of short-term investments, net | (26 | ) | | (237 | ) | | (10 | ) | | 290 |
| | — |
| | 17 |
|
| Net proceeds from financial guaranty variable entities’ assets | — |
| | — |
| | — |
| | 629 |
| | — |
| | 629 |
|
| Intercompany debt | — |
| | — |
| | — |
| | 20 |
| | (20 | ) | | — |
|
| Proceeds from stock redemption and return of capital from subsidiaries | — |
| | — |
| | 300 |
| | 4 |
| | (304 | ) | | — |
|
| Acquisition of CIFG, net of cash acquired | — |
| | — |
| | — |
| | (442 | ) | | 7 |
| | (435 | ) |
| Other | — |
| | 7 |
| | — |
| | (9 | ) | | (7 | ) | | (9 | ) |
| Net cash flows provided by (used in) investing activities | (26 | ) | | (319 | ) | | 292 |
| | 1,453 |
| | (324 | ) | | 1,076 |
|
| Cash flows from financing activities | |
| | |
| | |
| | |
| | |
| | |
|
| Return of capital | — |
| | — |
| | — |
| | (4 | ) | | 4 |
| | — |
|
| Dividends paid | (69 | ) | | (288 | ) | | (513 | ) | | (540 | ) | | 1,341 |
| | (69 | ) |
| Repurchases of common stock | (306 | ) | | — |
| | — |
| | (300 | ) | | 300 |
| | (306 | ) |
| Share activity under option and incentive plans | 11 |
| | — |
| | — |
| | (1 | ) | | — |
| | 10 |
|
| Net paydowns of financial guaranty variable entities’ liabilities | — |
| | — |
| | — |
| | (611 | ) | | — |
| | (611 | ) |
| Payment of long-term debt | — |
| | — |
| | — |
| | (2 | ) | | — |
| | (2 | ) |
| Intercompany debt | — |
| | (20 | ) | | — |
| | — |
| | 20 |
| | — |
|
| Net cash flows provided by (used in) financing activities | (364 | ) | | (308 | ) | | (513 | ) | | (1,458 | ) | | 1,665 |
| | (978 | ) |
| Effect of exchange rate changes | — |
| | — |
| | — |
| | (5 | ) | | — |
| | (5 | ) |
| Increase (decrease) in cash | — |
| | (94 | ) | | (8 | ) | | 54 |
| | — |
| | (48 | ) |
| Cash at beginning of period | 0 |
| | 95 |
| | 8 |
| | 63 |
| | — |
| | 166 |
|
| Cash at end of period | $ | 0 |
| | $ | 1 |
| | $ | 0 |
| | $ | 117 |
| | $ | — |
| | $ | 118 |
|
CONDENSED CONSOLIDATING STATEMENT OF CASH FLOWS
FOR THE YEAR ENDED DECEMBER 31, 2015
(in millions)
|
| | | | | | | | | | | | | | | | | | | | | | | |
| | Assured Guaranty Ltd. (Parent) | | AGUS (Issuer) | | AGMH (Issuer) | | Other Entities | | Consolidating Adjustments | | Assured Guaranty Ltd. (Consolidated) |
| Net cash flows provided by (used in) operating activities | $ | 513 |
| | $ | 408 |
| | $ | 185 |
| | $ | 52 |
| | $ | (1,210 | ) | | $ | (52 | ) |
| Cash flows from investing activities | |
| | |
| | |
| | |
| | |
| | |
|
| Fixed-maturity securities: | |
| | |
| | |
| | |
| | |
| | |
|
| Purchases | — |
| | (72 | ) | | (21 | ) | | (2,550 | ) | | 66 |
| | (2,577 | ) |
| Sales | — |
| | 177 |
| | 30 |
| | 1,900 |
| | — |
| | 2,107 |
|
| Maturities | — |
| | 9 |
| | — |
| | 889 |
| | — |
| | 898 |
|
| Sales (purchases) of short-term investments, net | 116 |
| | 33 |
| | 19 |
| | 729 |
| | — |
| | 897 |
|
| Net proceeds from financial guaranty variable entities’ assets | — |
| | — |
| | — |
| | 400 |
| | — |
| | 400 |
|
| Proceeds from repayment of surplus notes | — |
| | — |
| | 25 |
| | — |
| | (25 | ) | | — |
|
| Acquisition of Radian Asset, net of cash acquired | — |
| | — |
| | — |
| | (800 | ) | | — |
| | (800 | ) |
| Other | — |
| | (5 | ) | | — |
| | 74 |
| | — |
| | 69 |
|
| Net cash flows provided by (used in) investing activities | 116 |
| | 142 |
| | 53 |
| | 642 |
| | 41 |
| | 994 |
|
| Cash flows from financing activities | |
| | |
| | |
| | |
| | |
| | — |
|
| Return of capital | — |
| | — |
| | — |
| | (25 | ) | | 25 |
| | — |
|
| Dividends paid | (72 | ) | | (455 | ) | | (234 | ) | | (455 | ) | | 1,144 |
| | (72 | ) |
| Repurchases of common stock | (555 | ) | | — |
| | — |
| | — |
| | — |
| | (555 | ) |
| Share activity under option and incentive plans | (2 | ) | | — |
| | — |
| | — |
| | — |
| | (2 | ) |
| Net paydowns of financial guaranty variable entities’ liabilities | — |
| | — |
| | — |
| | (214 | ) | | — |
| | (214 | ) |
| Payment of long-term debt | — |
| | — |
| | — |
| | (4 | ) | | — |
| | (4 | ) |
| Net cash flows provided by (used in) financing activities | (629 | ) | | (455 | ) | | (234 | ) | | (698 | ) | | 1,169 |
| | (847 | ) |
| Effect of exchange rate changes | — |
| | — |
| | — |
| | (4 | ) | | — |
| | (4 | ) |
| Increase (decrease) in cash | — |
| | 95 |
| | 4 |
| | (8 | ) | | — |
| | 91 |
|
| Cash at beginning of period | 0 |
| | 0 |
| | 4 |
| | 71 |
| | — |
| | 75 |
|
| Cash at end of period | $ | 0 |
| | $ | 95 |
| | $ | 8 |
| | $ | 63 |
| | $ | — |
| | $ | 166 |
|
CONDENSED CONSOLIDATING STATEMENT OF CASH FLOWS
FOR THE YEAR ENDED DECEMBER 31, 2014
(in millions)
|
| | | | | | | | | | | | | | | | | | | | | | | |
| | Assured Guaranty Ltd. (Parent) | | AGUS (Issuer) | | AGMH (Issuer) | | Other Entities | | Consolidating Adjustments | | Assured Guaranty Ltd. (Consolidated) |
| Net cash flows provided by (used in) operating activities | $ | 758 |
| | $ | 223 |
| | $ | 144 |
| | $ | 663 |
| | $ | (1,211 | ) | | $ | 577 |
|
| Cash flows from investing activities | |
| | |
| | |
| | |
| | |
| | |
|
| Fixed-maturity securities: | |
| | |
| | |
| | |
| | |
| | |
|
| Purchases | — |
| | (540 | ) | | (8 | ) | | (2,253 | ) | | — |
| | (2,801 | ) |
| Sales | — |
| | 464 |
| | 10 |
| | 777 |
| | — |
| | 1,251 |
|
| Maturities | — |
| | 6 |
| | 1 |
| | 870 |
| | — |
| | 877 |
|
| Sales (purchases) of short-term investments, net | (93 | ) | | (15 | ) | | (3 | ) | | 269 |
| | — |
| | 158 |
|
| Net proceeds from financial guaranty variable entities’ assets | — |
| | — |
| | — |
| | 408 |
| | — |
| | 408 |
|
| Proceeds from repayment of surplus notes | — |
| | — |
| | 50 |
| | — |
| | (50 | ) | | — |
|
| Other | — |
| | — |
| | — |
| | 11 |
| | — |
| | 11 |
|
| Net cash flows provided by (used in) investing activities | (93 | ) | | (85 | ) | | 50 |
| | 82 |
| | (50 | ) | | (96 | ) |
| Cash flows from financing activities | |
| | |
| | |
| | |
| | |
| | |
| Return of capital | — |
| | — |
| | — |
| | (50 | ) | | 50 |
| | — |
|
| Dividends paid | (76 | ) | | (700 | ) | | (190 | ) | | (321 | ) | | 1,211 |
| | (76 | ) |
| Repurchases of common stock | (590 | ) | | — |
| | — |
| | — |
| | — |
| | (590 | ) |
| Share activity under option and incentive plans | 1 |
| | — |
| | — |
| | — |
| | — |
| | 1 |
|
| Net paydowns of financial guaranty variable entities’ liabilities | — |
| | — |
| | — |
| | (396 | ) | | — |
| | (396 | ) |
| Net proceeds from issuance of long-term debt | — |
| | 495 |
| | — |
| | — |
| | — |
| | 495 |
|
| Payment of long-term debt | — |
| | — |
| | — |
| | (19 | ) | | — |
| | (19 | ) |
| Net cash flows provided by (used in) financing activities | (665 | ) | | (205 | ) | | (190 | ) | | (786 | ) | | 1,261 |
| | (585 | ) |
| Effect of exchange rate changes | — |
| | — |
| | — |
| | (5 | ) | | — |
| | (5 | ) |
| Increase (decrease) in cash | — |
| | (67 | ) | | 4 |
| | (46 | ) | | — |
| | (109 | ) |
| Cash at beginning of period | 0 |
| | 67 |
| | 0 |
| | 117 |
| | — |
| | 184 |
|
| Cash at end of period | $ | 0 |
| | $ | 0 |
| | $ | 4 |
| | $ | 71 |
| | $ | — |
| | $ | 75 |
|
| |
22.24. | Quarterly Financial Information (Unaudited) |
A summary of selected quarterly information follows:
| | | 2016 | | First Quarter | | Second Quarter | | Third Quarter | | Fourth Quarter | | Full Year | |
| 2019 | | | First Quarter | | Second Quarter | | Third Quarter | | Fourth Quarter | | Full Year |
| | | (dollars in millions, except per share data) | | (dollars in millions, except per share data) |
| Revenues | Revenues | | | | | | | | | | Revenues | | | | | | | | | |
| Net earned premiums | Net earned premiums | $ | 183 |
| | $ | 214 |
| | $ | 231 |
| | $ | 236 |
| | $ | 864 |
| Net earned premiums | $ | 118 |
| | $ | 112 |
| | $ | 123 |
| | $ | 123 |
| | $ | 476 |
|
| Net investment income | Net investment income | 99 |
| | 98 |
| | 94 |
| | 117 |
| | 408 |
| Net investment income | 98 |
| | 110 |
| | 88 |
| | 82 |
| | 378 |
|
| Asset management fees | | Asset management fees | — |
| | — |
| | — |
| | 22 |
| | 22 |
|
| Net realized investment gains (losses) | Net realized investment gains (losses) | (13 | ) | | 10 |
| | (2 | ) | | (24 | ) | | (29 | ) | Net realized investment gains (losses) | (12 | ) | | 8 |
| | 16 |
| | 10 |
| | 22 |
|
| Net change in fair value of credit derivatives | Net change in fair value of credit derivatives | (60 | ) | | 63 |
| | 21 |
| | 74 |
| | 98 |
| Net change in fair value of credit derivatives | (22 | ) | | (8 | ) | | 5 |
| | 19 |
| | (6 | ) |
| Fair value gains (losses) on CCS | (16 | ) | | (11 | ) | | (23 | ) | | 50 |
| | 0 |
| |
| Fair value gains (losses) on FG VIEs | Fair value gains (losses) on FG VIEs | 18 |
| | 4 |
| | (11 | ) | | 27 |
| | 38 |
| Fair value gains (losses) on FG VIEs | 5 |
| | 33 |
| | 4 |
| | — |
| | 42 |
|
| Bargain purchase gain and settlement of pre-existing relationships | — |
| | — |
| | 259 |
| | — |
| | 259 |
| |
| Foreign exchange gains (losses) on remeasurement | | Foreign exchange gains (losses) on remeasurement | 11 |
| | (14 | ) | | (21 | ) | | 48 |
| | 24 |
|
| Commutation gains | | Commutation gains | — |
| | 1 |
| | — |
| | — |
| | 1 |
|
| Other income (loss) | Other income (loss) | 34 |
| | 18 |
| | (3 | ) | | (10 | ) | | 39 |
| Other income (loss) | (3 | ) | | 24 |
| | (9 | ) | | (8 | ) | | 4 |
|
| Expenses | Expenses | | | | | | | | | | Expenses | | | | | | | | | |
| Loss and LAE | Loss and LAE | 90 |
| | 102 |
| | (9 | ) | | 112 |
| | 295 |
| Loss and LAE | 46 |
| | (1 | ) | | 30 |
| | 18 |
| | 93 |
|
| Interest expense | | Interest expense | 23 |
| | 22 |
| | 22 |
| | 22 |
| | 89 |
|
| Amortization of DAC | Amortization of DAC | 4 |
| | 5 |
| | 4 |
| | 5 |
| | 18 |
| Amortization of DAC | 6 |
| | 4 |
| | 3 |
| | 5 |
| | 18 |
|
| Interest expense | 26 |
| | 25 |
| | 26 |
| | 25 |
| | 102 |
| |
| Employee compensation and benefit expenses | | Employee compensation and benefit expenses | 41 |
| | 39 |
| | 38 |
| | 60 |
| | 178 |
|
| Other operating expenses | Other operating expenses | 60 |
| | 63 |
| | 65 |
| | 57 |
| | 245 |
| Other operating expenses | 23 |
| | 21 |
| | 27 |
| | 54 |
| | 125 |
|
| Income (loss) before provision for income taxes | 65 |
| | 201 |
| | 480 |
| | 271 |
| | 1,017 |
| |
| Income (loss) before income taxes and equity in net earnings of investees | | Income (loss) before income taxes and equity in net earnings of investees | 56 |
| | 181 |
| | 86 |
| | 137 |
| | 460 |
|
| Equity in net earnings of investees | | Equity in net earnings of investees | 2 |
| | 1 |
| | — |
| | 1 |
| | 4 |
|
| Income (loss) before income taxes | | Income (loss) before income taxes | 58 |
| | 182 |
| | 86 |
| | 138 |
| | 464 |
|
| Provision (benefit) for income taxes | Provision (benefit) for income taxes | 6 |
| | 55 |
| | 1 |
| | 74 |
| | 136 |
| Provision (benefit) for income taxes | 4 |
| | 40 |
| | 17 |
| | 2 |
| | 63 |
|
| Net income (loss) | Net income (loss) | 59 |
| | 146 |
| | 479 |
| | 197 |
| | 881 |
| Net income (loss) | 54 |
| | 142 |
| | 69 |
| | 136 |
| | 401 |
|
| Less: Redeemable noncontrolling interests | | Less: Redeemable noncontrolling interests | — |
| | — |
| | — |
| | (1 | ) | | (1 | ) |
| Net income (loss) attributable to AGL | | Net income (loss) attributable to AGL | 54 |
| | 142 |
| | 69 |
| | 137 |
| | 402 |
|
| Earnings (loss) per share(1): | Earnings (loss) per share(1): | | | | | | | | | | Earnings (loss) per share(1): | | | | | | | | | |
| Basic | Basic | $ | 0.43 |
| | $ | 1.09 |
| | $ | 3.63 |
| | $ | 1.51 |
| | $ | 6.61 |
| Basic | $ | 0.52 |
| | $ | 1.40 |
| | $ | 0.71 |
| | $ | 1.43 |
| | $ | 4.04 |
|
| Diluted | Diluted | $ | 0.43 |
| | $ | 1.09 |
| | $ | 3.60 |
| | $ | 1.49 |
| | $ | 6.56 |
| Diluted | $ | 0.52 |
| | $ | 1.39 |
| | $ | 0.70 |
| | $ | 1.42 |
| | $ | 4.00 |
|
| Dividends per share | $ | 0.13 |
| | $ | 0.13 |
| | $ | 0.13 |
| | $ | 0.13 |
| | $ | 0.52 |
| |
| | | 2015 | | First Quarter | | Second Quarter | | Third Quarter | | Fourth Quarter | | Full Year | |
| 2018 | | | First Quarter | | Second Quarter | | Third Quarter | | Fourth Quarter | | Full Year |
| | | (dollars in millions, except per share data) | | (dollars in millions, except per share data) |
| Revenues | Revenues | | | | | | | | | | Revenues | | | | | | | | | |
| Net earned premiums | Net earned premiums | $ | 142 |
| | $ | 219 |
| | $ | 213 |
| | $ | 192 |
| | $ | 766 |
| Net earned premiums | $ | 145 |
| | $ | 136 |
| | $ | 142 |
| | $ | 125 |
| | $ | 548 |
|
| Net investment income | Net investment income | 101 |
| | 98 |
| | 112 |
| | 112 |
| | 423 |
| Net investment income | 100 |
| | 98 |
| | 99 |
| | 98 |
| | 395 |
|
| Net realized investment gains (losses) | Net realized investment gains (losses) | 16 |
| | (9 | ) | | (27 | ) | | (6 | ) | | (26 | ) | Net realized investment gains (losses) | (5 | ) | | (2 | ) | | (7 | ) | | (18 | ) | | (32 | ) |
| Net change in fair value of credit derivatives | Net change in fair value of credit derivatives | 124 |
| | 90 |
| | 86 |
| | 428 |
| | 728 |
| Net change in fair value of credit derivatives | 34 |
| | 48 |
| | 21 |
| | 9 |
| | 112 |
|
| Fair value gains (losses) on CCS | 2 |
| | 23 |
| | (15 | ) | | 17 |
| | 27 |
| |
| Fair value gains (losses) on FG VIEs | Fair value gains (losses) on FG VIEs | (7 | ) | | 5 |
| | 2 |
| | 38 |
| | 38 |
| Fair value gains (losses) on FG VIEs | 4 |
| | 2 |
| | 5 |
| | 3 |
| | 14 |
|
| Bargain purchase gain and settlement of pre-existing relationships | — |
| | 214 |
| | — |
| | — |
| | 214 |
| |
| Foreign exchange gains (losses) on remeasurement | | Foreign exchange gains (losses) on remeasurement | 22 |
| | (36 | ) | | (8 | ) | | (15 | ) | | (37 | ) |
| Commutation gains | | Commutation gains | 1 |
| | (18 | ) | | 1 |
| | — |
| | (16 | ) |
| Other income (loss) | Other income (loss) | (9 | ) | | 55 |
| | (3 | ) | | (6 | ) | | 37 |
| Other income (loss) | (8 | ) | | (8 | ) | | 22 |
| | 11 |
| | 17 |
|
| Expenses | Expenses | | | | | | | | | | Expenses | | | | | | | | | |
| Loss and LAE | Loss and LAE | 18 |
| | 188 |
| | 112 |
| | 106 |
| | 424 |
| Loss and LAE | (18 | ) | | 44 |
| | 17 |
| | 21 |
| | 64 |
|
| Interest expense | | Interest expense | 24 |
| | 24 |
| | 23 |
| | 23 |
| | 94 |
|
| Amortization of DAC | Amortization of DAC | 4 |
| | 6 |
| | 5 |
| | 5 |
| | 20 |
| Amortization of DAC | 5 |
| | 4 |
| | 3 |
| | 4 |
| | 16 |
|
| Interest expense | 25 |
| | 26 |
| | 25 |
| | 25 |
| | 101 |
| |
| Employee compensation and benefit expenses | | Employee compensation and benefit expenses | 40 |
| | 36 |
| | 36 |
| | 40 |
| | 152 |
|
| Other operating expenses | Other operating expenses | 56 |
| | 66 |
| | 54 |
| | 55 |
| | 231 |
| Other operating expenses | 25 |
| | 26 |
| | 20 |
| | 25 |
| | 96 |
|
| Income (loss) before provision for income taxes | 266 |
| | 409 |
| | 172 |
| | 584 |
| | 1,431 |
| |
| Income (loss) before income taxes and equity in net earnings of investees | | Income (loss) before income taxes and equity in net earnings of investees | 217 |
| | 86 |
| | 176 |
| | 100 |
| | 579 |
|
| Equity in net earnings of investees | | Equity in net earnings of investees | — |
| | 1 |
| | (1 | ) | | 1 |
| | 1 |
|
| Income (loss) before income taxes | | Income (loss) before income taxes | 217 |
| | 87 |
| | 175 |
| | 101 |
| | 580 |
|
| Provision (benefit) for income taxes | Provision (benefit) for income taxes | 65 |
| | 112 |
| | 43 |
| | 155 |
| | 375 |
| Provision (benefit) for income taxes | 20 |
| | 12 |
| | 14 |
| | 13 |
| | 59 |
|
| Net income (loss) | Net income (loss) | 201 |
| | 297 |
| | 129 |
| | 429 |
| | 1,056 |
| Net income (loss) | 197 |
| | 75 |
| | 161 |
| | 88 |
| | 521 |
|
| Less: Noncontrolling interests | | Less: Noncontrolling interests | — |
| | — |
| | — |
| | — |
| | — |
|
| Net income (loss) attributable to AGL | | Net income (loss) attributable to AGL | 197 |
| | 75 |
| | 161 |
| | 88 |
| | 521 |
|
| Earnings (loss) per share(1): | Earnings (loss) per share(1): | | | | | | | | | | Earnings (loss) per share(1): | | | | | | | | | |
| Basic | Basic | $ | 1.29 |
| | $ | 1.97 |
| | $ | 0.88 |
| | $ | 3.05 |
| | $ | 7.12 |
| Basic | $ | 1.71 |
| | $ | 0.67 |
| | $ | 1.48 |
| | $ | 0.84 |
| | $ | 4.73 |
|
| Diluted | Diluted | $ | 1.28 |
| | $ | 1.96 |
| | $ | 0.88 |
| | $ | 3.03 |
| | $ | 7.08 |
| Diluted | $ | 1.68 |
| | $ | 0.67 |
| | $ | 1.47 |
| | $ | 0.83 |
| | $ | 4.68 |
|
| Dividends per share | $ | 0.12 |
| | $ | 0.12 |
| | $ | 0.12 |
| | $ | 0.12 |
| | $ | 0.48 |
| |
____________________
| |
| (1) | Per share amounts for the quarters and the full years have each been calculated separately. Accordingly, quarterly amounts may not sum up to the annual amounts because of differences in the average common shares outstanding during each period and, with regard to diluted per share amounts only, because of the inclusion of the effect of potentially dilutive securities only in the periods in which such effect would have been dilutive. |
| |
| 25. | Subsidiary Information |
The following tables present the condensed consolidating financial information for AGUS and AGMH, 100%-owned subsidiaries of AGL, which have issued publicly traded debt securities that are fully and unconditionally guaranteed by AGL. The information for AGL, AGUS and AGMH presents their subsidiaries on the equity method of accounting.
CONDENSED CONSOLIDATING BALANCE SHEET
AS OF DECEMBER 31, 2019
(in millions)
|
| | | | | | | | | | | | | | | | | | | | | | | |
| | Assured Guaranty Ltd. (Parent) | | AGUS (Issuer) (1) | | AGMH (Issuer) | | Other Entities | | Consolidating Adjustments | | Assured Guaranty Ltd. (Consolidated) |
| Assets | |
| | |
| | |
| | |
| | |
| | |
|
| Total investment portfolio and cash | $ | 135 |
| | $ | 364 |
| | $ | 15 |
| | $ | 10,408 |
| | $ | (513 | ) | | $ | 10,409 |
|
| Investment in subsidiaries | 6,450 |
| | 6,224 |
| | 4,258 |
| | 383 |
| | (17,315 | ) | | — |
|
| Premiums receivable, net of commissions payable | — |
| | — |
| | — |
| | 1,502 |
| | (216 | ) | | 1,286 |
|
| Deferred acquisition costs | — |
| | — |
| | — |
| | 145 |
| | (34 | ) | | 111 |
|
| Intercompany loan receivable | — |
| | — |
| | — |
| | 290 |
| | (290 | ) | | — |
|
| FG VIEs’ assets, at fair value | — |
| | — |
| | — |
| | 442 |
| | — |
| | 442 |
|
| Assets of consolidated investment vehicles | — |
| | — |
| | — |
| | 595 |
| | (23 | ) | | 572 |
|
| Dividends receivable from affiliate | 40 |
| | 10 |
| | — |
| | — |
| | (50 | ) | | — |
|
| Goodwill and other intangible assets | — |
| | — |
| | — |
| | 216 |
| | — |
| | 216 |
|
| Other | 31 |
| | 32 |
| | 27 |
| | 2,769 |
| | (1,569 | ) | | 1,290 |
|
| Total assets | $ | 6,656 |
| | $ | 6,630 |
| | $ | 4,300 |
| | $ | 16,750 |
| | $ | (20,010 | ) | | $ | 14,326 |
|
| Liabilities and shareholders' equity | |
| | |
| | |
| | |
| | |
| | |
|
| Unearned premium reserves | $ | — |
| | $ | — |
| | $ | — |
| | $ | 4,584 |
| | $ | (848 | ) | | $ | 3,736 |
|
| Loss and LAE reserve | — |
| | — |
| | — |
| | 1,316 |
| | (266 | ) | | 1,050 |
|
| Long-term debt | — |
| | 844 |
| | 476 |
| | 4 |
| | (89 | ) | | 1,235 |
|
| Intercompany loans payable | — |
| | 290 |
| | — |
| | 300 |
| | (590 | ) | | — |
|
| Credit derivative liabilities | — |
| | — |
| | — |
| | 225 |
| | (34 | ) | | 191 |
|
| FG VIEs’ liabilities, at fair value | — |
| | — |
| | — |
| | 469 |
| | — |
| | 469 |
|
| Liabilities of consolidated investment vehicles | — |
| | — |
| | — |
| | 505 |
| | (23 | ) | | 482 |
|
| Dividends payable to affiliate | — |
| | 40 |
| | 10 |
| | — |
| | (50 | ) | | — |
|
| Other | 17 |
| | 69 |
| | 66 |
| | 1,010 |
| | (651 | ) | | 511 |
|
| Total liabilities | 17 |
| | 1,243 |
| | 552 |
| | 8,413 |
| | (2,551 | ) | | 7,674 |
|
| Redeemable noncontrolling interests in consolidated investment vehicles | — |
| | — |
| | — |
| | — |
| | 7 |
| | 7 |
|
| Total shareholders' equity attributable to AGL | 6,639 |
| | 5,387 |
| | 3,748 |
| | 7,954 |
| | (17,089 | ) | | 6,639 |
|
| Nonredeemable noncontrolling interests | — |
| | — |
| | — |
| | 383 |
| | (377 | ) | | 6 |
|
| Total shareholders' equity | 6,639 |
| | 5,387 |
| | 3,748 |
| | 8,337 |
| | (17,466 | ) | | 6,645 |
|
| Total liabilities, redeemable noncontrolling interests and shareholders' equity | $ | 6,656 |
| | $ | 6,630 |
| | $ | 4,300 |
| | $ | 16,750 |
| | $ | (20,010 | ) | | $ | 14,326 |
|
____________________
| |
| (1) | The fair value of the AGMH debt purchased by AGUS, and recorded in the AGUS investment portfolio, was $136 million. |
CONDENSED CONSOLIDATING BALANCE SHEET
AS OF DECEMBER 31, 2018
(in millions)
|
| | | | | | | | | | | | | | | | | | | | | | | |
| | Assured Guaranty Ltd. (Parent) | | AGUS (Issuer) (1) | | AGMH (Issuer) | | Other Entities | | Consolidating Adjustments | | Assured Guaranty Ltd. (Consolidated) |
| Assets | |
| | |
| | |
| | |
| | |
| | |
|
| Total investment portfolio and cash | $ | 45 |
| | $ | 334 |
| | $ | 23 |
| | $ | 11,000 |
| | $ | (425 | ) | | $ | 10,977 |
|
| Investment in subsidiaries | 6,440 |
| | 5,835 |
| | 3,991 |
| | 226 |
| | (16,492 | ) | | — |
|
| Premiums receivable, net of commissions payable | — |
| | — |
| | — |
| | 1,071 |
| | (167 | ) | | 904 |
|
| Deferred acquisition costs | — |
| | — |
| | — |
| | 143 |
| | (38 | ) | | 105 |
|
| Deferred tax asset, net | — |
| | — |
| | — |
| | 162 |
| | (94 | ) | | 68 |
|
| Intercompany loan receivable | — |
| | — |
| | — |
| | 50 |
| | (50 | ) | | — |
|
| FG VIEs’ assets, at fair value | — |
| | — |
| | — |
| | 569 |
| | — |
| | 569 |
|
| Dividends receivable from affiliate | 60 |
| | — |
| | — |
| | — |
| | (60 | ) | | — |
|
| Other | 29 |
| | 66 |
| | 24 |
| | 2,437 |
| | (1,576 | ) | | 980 |
|
| Total assets | $ | 6,574 |
| | $ | 6,235 |
| | $ | 4,038 |
| | $ | 15,658 |
| | $ | (18,902 | ) | | $ | 13,603 |
|
| Liabilities and shareholders' equity | |
| | |
| | |
| | |
| | |
| | |
|
| Unearned premium reserves | $ | — |
| | $ | — |
| | $ | — |
| | $ | 4,452 |
| | $ | (940 | ) | | $ | 3,512 |
|
| Loss and LAE reserve | — |
| | — |
| | — |
| | 1,467 |
| | (290 | ) | | 1,177 |
|
| Long-term debt | — |
| | 844 |
| | 468 |
| | 5 |
| | (84 | ) | | 1,233 |
|
| Intercompany loans payable | — |
| | 50 |
| | — |
| | 300 |
| | (350 | ) | | — |
|
| Credit derivative liabilities | — |
| | — |
| | — |
| | 236 |
| | (27 | ) | | 209 |
|
| Deferred tax liabilities, net | — |
| | 49 |
| | 50 |
| | — |
| | (99 | ) | | — |
|
| FG VIEs’ liabilities, at fair value | — |
| | — |
| | — |
| | 619 |
| | — |
| | 619 |
|
| Dividends payable to affiliate | — |
| | 60 |
| | — |
| | — |
| | (60 | ) | | — |
|
| Other | 19 |
| | 3 |
| | 17 |
| | 763 |
| | (504 | ) | | 298 |
|
| Total liabilities | 19 |
| | 1,006 |
| | 535 |
| | 7,842 |
| | (2,354 | ) | | 7,048 |
|
| Redeemable noncontrolling interests in consolidated investment vehicles | — |
| | — |
| | — |
| | — |
| | — |
| | — |
|
| Total shareholders' equity attributable to AGL | 6,555 |
| | 5,229 |
| | 3,503 |
| | 7,590 |
| | (16,322 | ) | | 6,555 |
|
| Noncontrolling interests | — |
| | — |
| | — |
| | 226 |
| | (226 | ) | | — |
|
| Total shareholders' equity | 6,555 |
| | 5,229 |
| | 3,503 |
| | 7,816 |
| | (16,548 | ) | | 6,555 |
|
| Total liabilities, redeemable noncontrolling interests and shareholders' equity | $ | 6,574 |
| | $ | 6,235 |
| | $ | 4,038 |
| | $ | 15,658 |
| | $ | (18,902 | ) | | $ | 13,603 |
|
____________________
| |
| (1) | The fair value of the AGMH debt purchased by AGUS, and recorded in the AGUS investment portfolio, was $125 million. |
CONDENSED CONSOLIDATING STATEMENT OF OPERATIONS AND COMPREHENSIVE INCOME
FOR THE YEAR ENDED DECEMBER 31, 2019
(in millions)
|
| | | | | | | | | | | | | | | | | | | | | | | |
| | Assured Guaranty Ltd. (Parent) | | AGUS (Issuer) | | AGMH (Issuer) | | Other Entities | | Consolidating Adjustments | | Assured Guaranty Ltd. (Consolidated) |
| Revenues | |
| | |
| | |
| | |
| | |
| | |
|
| Net earned premiums | $ | — |
| | $ | — |
| | $ | — |
| | $ | 486 |
| | $ | (10 | ) | | $ | 476 |
|
| Net investment income | — |
| | 11 |
| | 1 |
| | 388 |
| | (22 | ) | | 378 |
|
| Asset management fees | — |
| | — |
| | — |
| | 22 |
| | — |
| | 22 |
|
| Net realized investment gains (losses) | — |
| | — |
| | — |
| | 22 |
| | — |
| | 22 |
|
| Net change in fair value of credit derivatives | — |
| | — |
| | — |
| | (6 | ) | | — |
| | (6 | ) |
| Other | — |
| | — |
| | — |
| | 78 |
| | (7 | ) | | 71 |
|
| Total revenues | — |
| | 11 |
| | 1 |
| | 990 |
| | (39 | ) | | 963 |
|
| Expenses | |
| | |
| | |
| | |
| | |
| | |
|
| Loss and LAE | — |
| | — |
| | — |
| | 98 |
| | (5 | ) | | 93 |
|
| Interest expense | — |
| | 51 |
| | 54 |
| | 11 |
| | (27 | ) | | 89 |
|
| Amortization of deferred acquisition costs | — |
| | — |
| | — |
| | 22 |
| | (4 | ) | | 18 |
|
| Other operating expenses | 31 |
| | 10 |
| | — |
| | 266 |
| | (4 | ) | | 303 |
|
| Total expenses | 31 |
| | 61 |
| | 54 |
| | 397 |
| | (40 | ) | | 503 |
|
| Equity in net earnings of investees | — |
| | — |
| | — |
| | 2 |
| | 2 |
| | 4 |
|
| Income (loss) before income taxes and equity in net earnings of subsidiaries | (31 | ) | | (50 | ) | | (53 | ) | | 595 |
| | 3 |
| | 464 |
|
| Total (provision) benefit for income taxes | — |
| | 10 |
| | 11 |
| | (84 | ) | | — |
| | (63 | ) |
| Equity in net earnings of subsidiaries | 433 |
| | 422 |
| | 327 |
| | 18 |
| | (1,200 | ) | | — |
|
| Net income (loss) | 402 |
| | 382 |
| | 285 |
| | 529 |
| | (1,197 | ) | | 401 |
|
| Less: noncontrolling interests | — |
| | — |
| | — |
| | 18 |
| | (19 | ) | | (1 | ) |
| Net income (loss) attributable to AGL | $ | 402 |
| | $ | 382 |
| | $ | 285 |
| | $ | 511 |
| | $ | (1,178 | ) | | $ | 402 |
|
| | | | | | | | | | | | |
| Comprehensive income (loss) | $ | 651 |
| | $ | 553 |
| | $ | 440 |
| | $ | 781 |
| | $ | (1,775 | ) | | $ | 650 |
|
CONDENSED CONSOLIDATING STATEMENT OF OPERATIONS
AND COMPREHENSIVE INCOME
FOR THE YEAR ENDED DECEMBER 31, 2018
(in millions)
|
| | | | | | | | | | | | | | | | | | | | | | | |
| | Assured Guaranty Ltd. (Parent) | | AGUS (Issuer) | | AGMH (Issuer) | | Other Entities | | Consolidating Adjustments | | Assured Guaranty Ltd. (Consolidated) |
| Revenues | |
| | |
| | |
| | |
| | |
| | |
|
| Net earned premiums | $ | — |
| | $ | — |
| | $ | — |
| | $ | 563 |
| | $ | (15 | ) | | $ | 548 |
|
| Net investment income | 1 |
| | 9 |
| | 1 |
| | 398 |
| | (14 | ) | | 395 |
|
| Net realized investment gains (losses) | — |
| | — |
| | — |
| | (32 | ) | | — |
| | (32 | ) |
| Net change in fair value of credit derivatives | — |
| | — |
| | — |
| | 112 |
| | — |
| | 112 |
|
| Other | 12 |
| | — |
| | — |
| | 192 |
| | (226 | ) | | (22 | ) |
| Total revenues | 13 |
| | 9 |
| | 1 |
| | 1,233 |
| | (255 | ) | | 1,001 |
|
| Expenses | |
| | |
| | |
| | |
| | |
| | |
|
| Loss and LAE | — |
| | — |
| | — |
| | 70 |
| | (6 | ) | | 64 |
|
| Interest expense | — |
| | 49 |
| | 54 |
| | 10 |
| | (19 | ) | | 94 |
|
| Amortization of deferred acquisition costs | — |
| | — |
| | — |
| | 21 |
| | (5 | ) | | 16 |
|
| Other operating expenses | 41 |
| | 10 |
| | — |
| | 394 |
| | (197 | ) | | 248 |
|
| Total expenses | 41 |
| | 59 |
| | 54 |
| | 495 |
| | (227 | ) | | 422 |
|
| Equity in net earnings of investees | — |
| | — |
| | — |
| | 1 |
| | — |
| | 1 |
|
| Income (loss) before income taxes and equity in net earnings of subsidiaries | (28 | ) | | (50 | ) | | (53 | ) | | 739 |
| | (28 | ) | | 580 |
|
| Total (provision) benefit for income taxes | — |
| | 52 |
| | 11 |
| | (123 | ) | | 1 |
| | (59 | ) |
| Equity in net earnings of subsidiaries | 549 |
| | 412 |
| | 277 |
| | 24 |
| | (1,262 | ) | | — |
|
| Net income (loss) | 521 |
| | 414 |
| | 235 |
| | 640 |
| | (1,289 | ) | | 521 |
|
| Less: noncontrolling interests | — |
| | — |
| | — |
| | 24 |
| | (24 | ) | | — |
|
| Net income (loss) attributable to AGL | $ | 521 |
| | $ | 414 |
| | $ | 235 |
| | $ | 616 |
| | $ | (1,265 | ) | | $ | 521 |
|
| | | | | | | | | | | | |
| Comprehensive income (loss) | $ | 274 |
| | $ | 218 |
| | $ | 107 |
| | $ | 395 |
| | $ | (720 | ) | | $ | 274 |
|
CONDENSED CONSOLIDATING STATEMENT OF OPERATIONS
AND COMPREHENSIVE INCOME
FOR THE YEAR ENDED DECEMBER 31, 2017
(in millions)
|
| | | | | | | | | | | | | | | | | | | | | | | |
| | Assured Guaranty Ltd. (Parent) | | AGUS (Issuer) | | AGMH (Issuer) | | Other Entities | | Consolidating Adjustments | | Assured Guaranty Ltd. (Consolidated) |
| Revenues | |
| | |
| | |
| | |
| | |
| | |
|
| Net earned premiums | $ | — |
| | $ | — |
| | $ | — |
| | $ | 728 |
| | $ | (38 | ) | | $ | 690 |
|
| Net investment income | — |
| | 2 |
| | — |
| | 426 |
| | (11 | ) | | 417 |
|
| Net realized investment gains (losses) | — |
| | — |
| | — |
| | 45 |
| | (5 | ) | | 40 |
|
| Net change in fair value of credit derivatives | — |
| | — |
| | — |
| | 111 |
| | — |
| | 111 |
|
| Bargain purchase gain and settlement of pre-existing relationships | — |
| | — |
| | — |
| | 58 |
| | — |
| | 58 |
|
| Other | 10 |
| | — |
| | — |
| | 609 |
| | (196 | ) | | 423 |
|
| Total revenues | 10 |
| | 2 |
| | — |
| | 1,977 |
| | (250 | ) | | 1,739 |
|
| Expenses | |
| | |
| | |
| | |
| | |
| | |
|
| Loss and LAE | — |
| | — |
| | — |
| | 327 |
| | 61 |
| | 388 |
|
| Interest expense | — |
| | 47 |
| | 54 |
| | 11 |
| | (15 | ) | | 97 |
|
| Amortization of deferred acquisition costs | — |
| | — |
| | — |
| | 26 |
| | (7 | ) | | 19 |
|
| Other operating expenses | 38 |
| | 12 |
| | 1 |
| | 394 |
| | (201 | ) | | 244 |
|
| Total expenses | 38 |
| | 59 |
| | 55 |
| | 758 |
| | (162 | ) | | 748 |
|
| Equity in net earnings of investees | — |
| | — |
| | — |
| | — |
| | — |
| | — |
|
| Income (loss) before income taxes and equity in net earnings of subsidiaries | (28 | ) | | (57 | ) | | (55 | ) | | 1,219 |
| | (88 | ) | | 991 |
|
| Total (provision) benefit for income taxes | — |
| | 17 |
| | 54 |
| | (359 | ) | | 27 |
| | (261 | ) |
| Equity in net earnings of subsidiaries | 758 |
| | 636 |
| | 395 |
| | 32 |
| | (1,821 | ) | | — |
|
| Net income (loss) | 730 |
| | 596 |
| | 394 |
| | 892 |
| | (1,882 | ) | | 730 |
|
| Less: noncontrolling interests | — |
| | — |
| | — |
| | 32 |
| | (32 | ) | | — |
|
| Net income (loss) attributable to AGL | $ | 730 |
| | $ | 596 |
| | $ | 394 |
| | $ | 860 |
| | $ | (1,850 | ) | | $ | 730 |
|
| | | | | | | | | | | | |
| Comprehensive income (loss) | $ | 897 |
| | $ | 754 |
| | $ | 482 |
| | $ | 1,084 |
| | $ | (2,320 | ) | | $ | 897 |
|
CONDENSED CONSOLIDATING STATEMENT OF CASH FLOWS
FOR THE YEAR ENDED DECEMBER 31, 2019
(in millions)
|
| | | | | | | | | | | | | | | | | | | | | | | |
| | Assured Guaranty Ltd. (Parent) | | AGUS (Issuer) | | AGMH (Issuer) | | Other Entities | | Consolidating Adjustments | | Assured Guaranty Ltd. (Consolidated) |
| Net cash flows provided by (used in) operating activities | $ | 679 |
| | $ | 190 |
| | $ | 172 |
| | $ | (287 | ) | | $ | (1,263 | ) | | $ | (509 | ) |
| Cash flows from investing activities | |
| | |
| | |
| | |
| | |
| | |
|
| Fixed-maturity securities: | |
| | |
| | |
| | |
| | |
| | |
|
| Purchases | — |
| | (3 | ) | | — |
| | (873 | ) | | 3 |
| | (873 | ) |
| Sales | — |
| | — |
| | — |
| | 1,805 |
| | — |
| | 1,805 |
|
| Maturities and paydowns | — |
| | 11 |
| | 8 |
| | 762 |
| | — |
| | 781 |
|
| Short-term investments with maturities of over three months: | | | | | | | | | | | |
| Purchases | — |
| | — |
| | — |
| | (229 | ) | | — |
| | (229 | ) |
| Sales | — |
| | — |
| | — |
| | 2 |
| | — |
| | 2 |
|
| Maturities and paydowns | — |
| | 12 |
| | — |
| | 304 |
| | — |
| | 316 |
|
| Net sales (purchases) of short-term investments with maturities of less than three months | (90 | ) | | (44 | ) | | 4 |
| | (493 | ) | | — |
| | (623 | ) |
| Net proceeds from paydowns on FG VIEs’ assets | — |
| | — |
| | — |
| | 139 |
| | — |
| | 139 |
|
| Net proceeds from sales of FG VIEs’ assets | — |
| | — |
| | — |
| | 51 |
| | — |
| | 51 |
|
| Repayment of intercompany loans | — |
| | — |
| | — |
| | 10 |
| | (10 | ) | | — |
|
| Issuance of intercompany loans | — |
| | — |
| | — |
| | (250 | ) | | 250 |
| | — |
|
| Investment in subsidiaries | — |
| | 65 |
| | 5 |
| | (175 | ) | | 105 |
| | — |
|
| Return of capital from subsidiaries | — |
| | 100 |
| | — |
| | 10 |
| | (110 | ) | | — |
|
| BlueMountain Acquisition, net of cash acquired | — |
| | (157 | ) | | — |
| | 12 |
| | — |
| | (145 | ) |
| Other | — |
| | — |
| | — |
| | (55 | ) | | — |
| | (55 | ) |
| Net cash flows provided by (used in) investing activities | (90 | ) | | (16 | ) | | 17 |
| | 1,020 |
| | 238 |
| | 1,169 |
|
| Cash flows from financing activities | |
| | |
| | |
| | |
| | |
| | |
|
| Return of capital | — |
| | — |
| | — |
| | (10 | ) | | 10 |
| | — |
|
| Capital contribution | — |
| | — |
| | — |
| | 105 |
| | (105 | ) | | — |
|
| Dividends paid | (74 | ) | | (414 | ) | | (186 | ) | | (649 | ) | | 1,249 |
| | (74 | ) |
| Repurchases of common stock | (500 | ) | | — |
| | — |
| | (100 | ) | | 100 |
| | (500 | ) |
| Net paydowns of FG VIEs’ liabilities | — |
| | — |
| | — |
| | (181 | ) | | — |
| | (181 | ) |
| Paydown of long-term debt | — |
| | — |
| | — |
| | (1 | ) | | (3 | ) | | (4 | ) |
| Repayment of intercompany loans | — |
| | (10 | ) | | — |
| | — |
| | 10 |
| | — |
|
| Issuance of intercompany loans | — |
| | 250 |
| | — |
| | — |
| | (250 | ) | | — |
|
| Proceeds from issuance of CLO obligations | — |
| | — |
| | — |
| | 482 |
| | — |
| | 482 |
|
| Repayment of warehouse loans and equity | — |
| | — |
| | — |
| | (306 | ) | | — |
| | (306 | ) |
| Contributions from noncontrolling interests to investment vehicles | — |
| | — |
| | — |
| | — |
| | 18 |
| | 18 |
|
| Distributions to redeemable noncontrolling interests from investment vehicles | — |
| | — |
| | — |
| | — |
| | (4 | ) | | (4 | ) |
| Other | (15 | ) | | — |
| | — |
| | — |
| | — |
| | (15 | ) |
| Net cash flows provided by (used in) financing activities | (589 | ) | | (174 | ) | | (186 | ) | | (660 | ) | | 1,025 |
| | (584 | ) |
| Effect of exchange rate changes | — |
| | — |
| | — |
| | 3 |
| | — |
| | 3 |
|
| Increase (decrease) in cash and restricted cash | — |
| | — |
| | 3 |
| | 76 |
| | — |
| | 79 |
|
| Cash and restricted cash at beginning of period | — |
| | 1 |
| | — |
| | 103 |
| | — |
| | 104 |
|
| Cash and restricted cash at end of period | $ | — |
| | $ | 1 |
| | $ | 3 |
| | $ | 179 |
| | $ | — |
| | $ | 183 |
|
CONDENSED CONSOLIDATING STATEMENT OF CASH FLOWS
FOR THE YEAR ENDED DECEMBER 31, 2018
(in millions)
|
| | | | | | | | | | | | | | | | | | | | | | | |
| | Assured Guaranty Ltd. (Parent) | | AGUS (Issuer) | | AGMH (Issuer) | | Other Entities | | Consolidating Adjustments | | Assured Guaranty Ltd. (Consolidated) |
| Net cash flows provided by (used in) operating activities | $ | 587 |
| | $ | 308 |
| | $ | 183 |
| | $ | 517 |
| | $ | (1,133 | ) | | $ | 462 |
|
| Cash flows from investing activities | |
| | |
| | |
| | |
| | |
| | |
|
| Fixed-maturity securities: | |
| | |
| | |
| | |
| | |
| | |
|
| Purchases | — |
| | (104 | ) | | (12 | ) | | (1,865 | ) | | 100 |
| | (1,881 | ) |
| Sales | — |
| | 104 |
| | 8 |
| | 1,068 |
| | — |
| | 1,180 |
|
| Maturities and paydowns | — |
| | 28 |
| | — |
| | 934 |
| | — |
| | 962 |
|
| Short-term investments with maturities of over three months: | | | | | | | | | | | |
| Purchases | — |
| | (34 | ) | | — |
| | (209 | ) | | — |
| | (243 | ) |
| Sales | — |
| | 22 |
| | — |
| | 1 |
| | — |
| | 23 |
|
| Maturities and paydowns | — |
| | — |
| | — |
| | 207 |
| | — |
| | 207 |
|
| Net sales (purchases) of short-term investments with maturities of less than three months | (9 | ) | | (50 | ) | | 7 |
| | (32 | ) | | — |
| | (84 | ) |
| Net proceeds from paydowns on FG VIEs’ assets | — |
| | — |
| | — |
| | 116 |
| | — |
| | 116 |
|
| Investment in subsidiaries | — |
| | (9 | ) | | (1 | ) | | (1 | ) | | 11 |
| | — |
|
| Repayment of intercompany loans | — |
| | — |
| | — |
| | 10 |
| | (10 | ) | | — |
|
| Return of capital from subsidiaries | — |
| | 200 |
| | — |
| | — |
| | (200 | ) | | — |
|
| Other | — |
| | (15 | ) | | — |
| | 32 |
| | — |
| | 17 |
|
| Net cash flows provided by (used in) investing activities | (9 | ) | | 142 |
| | 2 |
| | 261 |
| | (99 | ) | | 297 |
|
| Cash flows from financing activities | |
| | |
| | |
| | |
| | |
| | |
| Capital contribution | — |
| | — |
| | — |
| | 11 |
| | (11 | ) | | — |
|
| Dividends paid | (71 | ) | | (472 | ) | | (187 | ) | | (474 | ) | | 1,133 |
| | (71 | ) |
| Repurchases of common stock | (500 | ) | | — |
| | — |
| | (200 | ) | | 200 |
| | (500 | ) |
| Net paydowns of FG VIEs’ liabilities | — |
| | — |
| | — |
| | (116 | ) | | — |
| | (116 | ) |
| Paydown of long-term debt | — |
| | — |
| | — |
| | (1 | ) | | (100 | ) | | (101 | ) |
| Repayment of intercompany loans | — |
| | (10 | ) | | — |
| | — |
| | 10 |
| | — |
|
| Other | (7 | ) | | — |
| | — |
| | — |
| | — |
| | (7 | ) |
| Net cash flows provided by (used in) financing activities | (578 | ) | | (482 | ) | | (187 | ) | | (780 | ) | | 1,232 |
| | (795 | ) |
| Effect of exchange rate changes | — |
| | — |
| | — |
| | (4 | ) | | — |
| | (4 | ) |
| Increase (decrease) in cash and restricted cash | — |
| | (32 | ) | | (2 | ) | | (6 | ) | | — |
| | (40 | ) |
| Cash and restricted cash at beginning of period | — |
| | 33 |
| | 2 |
| | 109 |
| | — |
| | 144 |
|
| Cash and restricted cash at end of period | $ | — |
| | $ | 1 |
| | $ | — |
| | $ | 103 |
| | $ | — |
| | $ | 104 |
|
CONDENSED CONSOLIDATING STATEMENT OF CASH FLOWS
FOR THE YEAR ENDED DECEMBER 31, 2017
(in millions)
|
| | | | | | | | | | | | | | | | | | | | | | | |
| | Assured Guaranty Ltd. (Parent) | | AGUS (Issuer) | | AGMH (Issuer) | | Other Entities | | Consolidating Adjustments | | Assured Guaranty Ltd. (Consolidated) |
| Net cash flows provided by (used in) operating activities | $ | 579 |
| | $ | 442 |
| | $ | 158 |
| | $ | 477 |
| | $ | (1,223 | ) | | $ | 433 |
|
| Cash flows from investing activities | |
| | |
| | |
| | |
| | |
| | |
|
| Fixed-maturity securities: | |
| | |
| | |
| | |
| | |
| | |
|
| Purchases | — |
| | (158 | ) | | (17 | ) | | (2,404 | ) | | 27 |
| | (2,552 | ) |
| Sales | — |
| | 112 |
| | 21 |
| | 1,568 |
| | — |
| | 1,701 |
|
| Maturities and paydowns | — |
| | 13 |
| | — |
| | 808 |
| | — |
| | 821 |
|
| Short-term investments with maturities of over three months: | | | | | | | | | | | |
| Purchases | — |
| | (26 | ) | | (5 | ) | | (224 | ) | | — |
| | (255 | ) |
| Sales | — |
| | 1 |
| | 5 |
| | 96 |
| | — |
| | 102 |
|
| Maturities and paydowns | — |
| | 30 |
| | — |
| | 161 |
| | — |
| | 191 |
|
| Net sales (purchases) of short-term investments with maturities of less than three months | — |
| | 126 |
| | (8 | ) | | (82 | ) | | — |
| | 36 |
|
| Net proceeds from paydowns on FG VIEs’ assets | — |
| | — |
| | — |
| | 147 |
| | — |
| | 147 |
|
| Investment in subsidiaries | — |
| | (28 | ) | | — |
| | (139 | ) | | 167 |
| | — |
|
| Repayment of intercompany loans | — |
| | — |
| | — |
| | 10 |
| | (10 | ) | | — |
|
| Proceeds from sale of subsidiaries | — |
| | — |
| | — |
| | 139 |
| | (139 | ) | | — |
|
| Return of capital from subsidiaries | — |
| | — |
| | 101 |
| | 70 |
| | (171 | ) | | — |
|
| Acquisition of MBIA UK, net of cash acquired | — |
| | — |
| | — |
| | 95 |
| | — |
| | 95 |
|
| Other | — |
| | — |
| | — |
| | 59 |
| | — |
| | 59 |
|
| Net cash flows provided by (used in) investing activities | — |
| | 70 |
| | 97 |
| | 304 |
| | (126 | ) | | 345 |
|
| Cash flows from financing activities | |
| | |
| | |
| | |
| | |
| | |
| Return of capital | — |
| | — |
| | — |
| | (70 | ) | | 70 |
| | — |
|
| Capital contribution | — |
| | — |
| | 25 |
| | 3 |
| | (28 | ) | | — |
|
| Dividends paid | (70 | ) | | (470 | ) | | (278 | ) | | (475 | ) | | 1,223 |
| | (70 | ) |
| Repurchases of common stock | (501 | ) | | — |
| | — |
| | (101 | ) | | 101 |
| | (501 | ) |
| Net paydowns of FG VIEs’ liabilities | — |
| | — |
| | — |
| | (157 | ) | | — |
| | (157 | ) |
| Paydown of long-term debt | — |
| | — |
| | — |
| | (3 | ) | | (27 | ) | | (30 | ) |
| Repayment of intercompany loans | — |
| | (10 | ) | | — |
| | — |
| | 10 |
| | — |
|
| Other | (8 | ) | | — |
| | — |
| | — |
| | — |
| | (8 | ) |
| Net cash flows provided by (used in) financing activities | (579 | ) | | (480 | ) | | (253 | ) | | (803 | ) | | 1,349 |
| | (766 | ) |
| Effect of exchange rate changes | — |
| | — |
| | — |
| | 5 |
| | — |
| | 5 |
|
| Increase (decrease) in cash and restricted cash | — |
| | 32 |
| | 2 |
| | (17 | ) | | — |
| | 17 |
|
| Cash and restricted cash at beginning of period | — |
| | 1 |
| | — |
| | 126 |
| | — |
| | 127 |
|
| Cash and restricted cash at end of period | $ | — |
| | $ | 33 |
| | $ | 2 |
| | $ | 109 |
| | $ | — |
| | $ | 144 |
|
| |
| ITEM 9. | CHANGES IN AND DISAGREEMENTS WITH ACCOUNTANTS ON ACCOUNTING AND FINANCIAL DISCLOSURE |
None.
| |
ITEM 9A. | CONTROLS AND PROCEDURES |
ITEM 9A. CONTROLS AND PROCEDURES
Disclosure Controls and Procedures
Assured Guaranty's management, with the participation of Assured Guaranty Ltd.'sAGL's President and Chief Executive Officer and Chief Financial Officer, has evaluated the effectiveness of Assured Guaranty Ltd.'sAGL's disclosure controls and procedures (as such term is defined in Rules 13a 15(e) and 15d 15(e) under the Securities Exchange Act of 1934, as amended (the Exchange Act)) as of the end of the period covered by this report. Based on this evaluation, Assured Guaranty Ltd.'sAGL's President and Chief Executive Officer and Chief Financial Officer have concluded that, as of the end of such period, Assured Guaranty Ltd.'sAGL's disclosure controls and procedures are effective in recording, processing, summarizing and reporting, on a timely basis, information required to be disclosed by Assured Guaranty Ltd.AGL (including its consolidated subsidiaries) in the reports that it files or submits under the Exchange Act.
ThereChanges in Internal Control over Financial Reporting
Other than integrating BlueMountain, and consolidating certain newly established BlueMountain funds and a CLO in which certain of the Company's insurance subsidiaries invest, there has been no change in the Company's internal controls over financial reporting during the Company's quarter ended December 31, 2016,2019, that has materially affected, or is reasonably likely to materially affect, the Company's internal controls over financial reporting.
Management's Report on Internal Control over Financial Reporting
The management of Assured Guaranty Ltd.AGL is responsible for establishing and maintaining adequate internal control over financial reporting, as such term is defined in Exchange Act Rule 13a-15(f). Internal control over financial reporting is a process designed by, or under the supervision of the Company's President and Chief Executive Officer and Chief Financial Officer to provide reasonable assurance regarding the reliability of financial reporting and the preparation of the Company's consolidated financial statements for external purposes in accordance with accounting principles generally accepted in the United States of America.GAAP.
Because of inherent limitations, internal control over financial reporting may not prevent or detect misstatements. Projections of any evaluation of effectiveness to future periods are subject to the risks that controls may become inadequate because of changes in conditions, or that the degree of compliance with the policies or procedures may deteriorate.
On JulyOctober 1, 2016,2019, the Company acquired CIFG Holding Inc.BlueMountain Capital Management, LLC (BlueMountain) and its subsidiaries.associated entities. See Part II, Item 8, Financial Statements and Supplementary Data, Note 2, Acquisitions,Business Combinations and Assumption of Insured Portfolio, for additional information. The Company is currently in the process of assessing the internal control over financial reporting associated with this acquired business. At December 31, 2019, the BlueMountain acquisition accounted for approximately 2% of consolidated assets and approximately 3% of consolidated revenues. As a result of the timing of this acquisition, the Company has extended its Section 404 compliance program underexcluded this business from the Sarbanes-Oxley ActCompany's annual assessment of 2002 andinternal control over financial reporting for the applicable rules and regulations under such Act to include the integration of CIFG Holding Inc. and its subsidiaries' financial data into the Company’s existing systems, processes and related controls, as well as the new processes and controls to accommodate the business combination accounting and financial consolidation of CIFG Holding Inc. and its subsidiaries.year ended December 31, 2019.
Management of the Company has assessed the effectiveness of the Company's internal control over financial reporting as of December 31, 20162019 using the criteria set forth by the Committee of Sponsoring Organizations of the Treadway Commission (COSO) in the 2013 Internal Control-Integrated Framework. Based on this evaluation, management concluded that the Company's internal control over financial reporting was effective as of December 31, 20162019 based on criteria in the 2013 Internal Control- Integrated Framework issued by the COSO.
The effectiveness of the Company's internal control over financial reporting as of December 31, 20162019 has been audited by PricewaterhouseCoopers LLP, an independent registered public accounting firm, as stated in their "Report of Independent Registered Public Accounting Firm" included in Part II, Item 8, Financial Statements and Supplementary Data.
| |
| ITEM 9B. | OTHER INFORMATION |
None.On February 26, 2020, Laura Bieling, age 53, was appointed as an executive officer and principal accounting officer of AGL. She has been the Chief Accounting Officer and Controller of AGL since May 2019 and was the chief accounting officer and controller of the U.S. subsidiaries of AGL since March 2019 and the Controller of AGM and AGC since 2011. Ms. Bieling has been with AGM since 2000, and was the Chief Accounting Officer and Controller of AGMH from 2004 until July of 2009. Prior to joining AGM, Ms. Bieling was a Senior Manager at PricewaterhouseCoopers, LLP. Robert Bailenson had been the principal accounting officer of AGL for SEC reporting purposes prior to Ms. Bieling’s appointment.
PART III
| |
| ITEM 10. | DIRECTORS, EXECUTIVE OFFICERS AND CORPORATE GOVERNANCE |
Information pertaining to this item is incorporated by reference to the sections entitled “Proposal No. 1: Election ofOf Directors”, “Corporate Governance—Did Our Insiders Comply withDelinquent Section 16(a) Beneficial Ownership Reporting in 2016?”Reports”, “Corporate Governance—How Are Directors nominated?Nominated?” and “Corporate Governance—The Committees of theOf The Board—The Audit Committee” of the definitive proxy statement for the Annual General Meeting of Shareholders, which involves the election of directors and will be filed with the SEC not later than 120 days after the close of the fiscal year pursuant to regulation 14A.
Information about the executive officers of AGL is set forth at the end of Part I of this Form 10-K and is hereby incorporated by reference.
Code of Conduct
The Company has adopted a Code of Conduct, which sets forth standards by which all employees, officers and directors of the Company must abide as they work for the Company. The Code of Conduct is available at www.assuredguaranty.com/governance. The Company intends to disclose on its internet site any amendments to, or waivers from, its Code of Conduct that are required to be publicly disclosed pursuant to the rules of the SEC or the New York Stock Exchange.NYSE.
| |
| ITEM 11. | EXECUTIVE COMPENSATION |
This item is incorporated by reference to the sections entitled “Executive Compensation”, “Corporate Governance—Compensation Committee interlocking and insider participation”Interlocking And Insider Participation” and “Corporate Governance—How are the directors compensated?Are Directors Compensated?” of the definitive proxy statement for the Annual General Meeting of Shareholders, which will be filed with the SEC not later than 120 days after the close of the fiscal year pursuant to regulation 14A.
| |
| ITEM 12. | SECURITY OWNERSHIP OF CERTAIN BENEFICIAL OWNERS AND MANAGEMENT AND RELATED STOCKHOLDER MATTERS |
This item is incorporated by reference to the sections entitled "Information about ourAbout Our Common Share Ownership" and "Equity Compensation Plans Information" of the definitive proxy statement for the Annual General Meeting of Shareholders, which will be filed with the SEC not later than 120 days after the close of the fiscal year pursuant to regulation 14A.
| |
| ITEM 13. | CERTAIN RELATIONSHIPS AND RELATED TRANSACTIONS, AND DIRECTOR INDEPENDENCE |
This item is incorporated by reference to the sections entitled “Corporate Governance—What is our related person transactions approval policy and what procedures do we use to implement it?Is Our Related Person Transactions Approval Policy And What Procedures Do We Use To Implement It?”, “Corporate Governance—What related person transactions do we have?Related Person Transactions Do We Have?” and “Corporate Governance—Director independence”Independence” of the definitive proxy statement for the Annual General Meeting of Shareholders, which will be filed with the SEC not later than 120 days after the close of the fiscal year pursuant to regulation 14A.
| |
| ITEM 14. | PRINCIPAL ACCOUNTING FEES AND SERVICES |
This item is incorporated by reference to the section entitled “Proposal No. 4:3: Appointment ofOf Independent Auditors—Auditor—Independent Auditor Fee Information” and “Proposal No. 4:3: Appointment ofOf Independent Auditors—Auditor—Pre-Approval Policy ofOf Audit andAnd Non-Audit Services” of the definitive proxy statement for the Annual General Meeting of Shareholders, which will be filed with the SEC not later than 120 days after the close of the fiscal year pursuant to regulation 14A.
PART IV
| |
| ITEM 15. | EXHIBITS, FINANCIAL STATEMENT SCHEDULES |
| |
| (a) | Financial Statements, Financial Statement Schedules and Exhibits |
The following financial statements of Assured Guaranty Ltd. have been included in Part II, Item 8, Financial Statements and Supplementary Data, hereof:
2. Financial Statement Schedules
The financial statement schedules are omitted because they are not applicable or the required information is shown in the consolidated financial statements or notes thereto.
3. Exhibits*
|
| |
Exhibit Number | Description of Document |
| 3.1 | |
| 3.2 | |
| 4.1 | |
| 4.2 | |
| 4.3 | |
| 4.4 | |
| 4.5 | |
| 4.6 | |
| 4.7 | |
| 4.8 | |
|
| |
Exhibit Number | Description of Document |
| 4.9 | |
|
| |
Exhibit
Number
| Description of Document |
4.94.10 | |
4.104.11 | |
4.114.12 | |
4.124.13 | |
4.134.14 | |
4.144.15 | |
4.154.16 | |
4.16 | First Supplemental Indenture, to be dated as of June 24, 2009, between Assured Guaranty U.S. Holdings Inc., Assured Guaranty Ltd. and The Bank of New York Mellon, as trustee (including the form of 8.50% Senior Note due 2014 of Assured Guaranty U.S. Holdings Inc.) (Incorporated by reference to Exhibit 4.1 to Form 8-K filed on June 23, 2009) |
| 4.17 | |
| 4.18 | |
| 10.1 | |
| 10.2 | |
| 10.3 | |
| 10.4 | |
| 10.5 | |
| 10.6 | |
| 10.7 | |
| 10.8 | |
| 10.9 | |
|
| |
Exhibit Number | Description of Document |
| 10.10 | |
|
| |
Exhibit
Number
| Description of Document |
| 10.11 | |
| 10.12 | |
| 10.13 | |
| 10.14 | |
| 10.15 | |
| 10.16 | |
| 10.17 | |
| 10.18 | |
| 10.19 | |
| 10.20 | |
| 10.21 | Pledge and Administration Agreement, dated as of June 30, 2009, among Dexia SA, Dexia Crédit Local S.A., Dexia Bank Belgium SA, Dexia FP Holdings Inc., Financial Security Assurance Inc., FSA Asset Management LLC, FSA Portfolio Asset Limited, FSA Capital Markets Services LLC, FSA Capital Markets Services (Caymans) Ltd., FSA Capital Management Services LLC and The Bank of New York Mellon Trust Company, National Association (Incorporated by reference to Exhibit 10.8 to Form 8-K filed on July 8, 2009) |
| 10.22 | |
| 10.23 | |
| 10.24 | |
| 10.25 | |
| 10.26 | Pledge and Administration Annex Amendment Agreement dated as of July 1, 2009 among Dexia SA, Dexia Crédit Local S.A., Dexia Bank Belgium SA, Dexia FP Holdings Inc., Financial Security Assurance Inc., FSA Asset Management LLC, FSA Portfolio Asset Limited, FSA Capital Markets Services LLC, FSA Capital Markets Services (Caymans) Ltd., FSA Capital Management Services LLC and The Bank of New York Mellon Trust Company, National Association (Incorporated by reference to Exhibit 10.14 to Form 8-K filed on July 8, 2009) |
|
| |
Exhibit Number | Description of Document |
| 10.27 | |
|
| |
Exhibit
Number
| Description of Document |
| 10.28 | |
| 10.29 | |
| 10.30 | |
| 10.31 | |
| 10.32 | |
| 10.33 | |
| 10.34 | |
| 10.35 | |
| 10.36 | |
| 10.37 | |
| 10.38 | Replacement Capital Covenant, dated as of November 22, 2006, by Financial Security Assurance Holdings Ltd. (Incorporated by reference to Exhibit 10.5 to Financial Security Assurance Holdings Ltd.'s Form 8-K filed on November 28, 2006) |
10.39 | |
10.4010.39 | |
| 10.40 | |
| 10.41 | Summary of Annual Compensation* |
10.42 | |
10.4310.42 | |
10.44 | Non-Qualified Stock Option Agreement under Assured Guaranty Ltd. 2004 Long-Term Incentive Plan to be used with employment agreementAmendment (Incorporated by reference to Exhibit 10.3410.43 to Form 10-K for the year ended December 31, 2005)2016)* |
10.4510.43 | Non-Qualified Stock Option Agreement under Assured Guaranty Ltd. 2004 Long-Term Incentive Plan (Incorporated by reference to Exhibit 10.35 to Form 10-K for the year ended December 31, 2005)* |
10.46 | Non-Qualified Stock Option Agreement under Assured Guaranty Ltd. 2004 Long-Term Incentive Plan to be used with employment agreement (Incorporated by reference to Exhibit 10.66 to Form 10-K for the year ended December 31, 2007)* |
10.47 | Non-Qualified Stock Option Agreement under Assured Guaranty Ltd. 2004 Long-Term Incentive Plan (Incorporated by reference to Exhibit 10.67 to Form 10-K for the year ended December 31, 2007)* |
|
10.52 | |
Exhibit Number | Description of Document |
| 10.47 | |
10.5310.48 | |
10.5410.49 | Restricted Stock Unit Agreement for Outside Directors under Assured Guaranty Ltd. 2004 Long Term Incentive Plan (Incorporated by reference to Exhibit 10.37 to Form 10-K for the year ended December 31, 2005)* |
10.55 | Restricted Stock Unit Agreement for Outside Directors under Assured Guaranty Ltd. 2004 Long-Term Incentive Plan (Incorporated by reference to Exhibit 10.1 to Form 10-Q for the quarter ended June 30, 2007)* |
10.56 | Restricted Stock Unit Agreement for Outside Directors under Assured Guaranty Ltd. 2004 Long-Term Incentive Plan (Incorporated by reference to Exhibit 10.1 to Form 10-Q for the quarter ended June 30, 2008)* |
10.57 | Form of amendment to Restricted Stock Unit Awards for Outside Directors (Incorporated by reference to Exhibit 10.3 to Form 10-Q for the quarter ended June 30, 2008)* |
10.58 | Restricted Stock Agreement for Outside Directors under Assured Guaranty Ltd. 2004 Long-Term Incentive Plan (Incorporated by reference to Exhibit 10.2 to Form 10-Q for the quarter ended June 30, 2008)* |
10.59 | 2014 Restricted Stock Agreement for Outside Directors under Assured Guaranty Ltd. 2004 Long-Term Incentive Plan (Incorporated by reference to Exhibit 10.5 to Form 10-Q for the quarter ended June 30, 2014)* |
10.60 | |
10.6110.50 | 2013 Form of Executive Restricted Stock Unit Agreement under Assured Guaranty Ltd. 2004 Long-Term Incentive Plan (Incorporated by reference to Exhibit 10.2 to Form 10-Q for the quarter ended March 31, 2013)* |
10.62 | 2014 Form of Executive Restricted Stock Unit Agreement under Assured Guaranty Ltd. 2004 Long-Term Incentive Plan (Incorporated by reference to Exhibit 10.2 to Form 10-Q for the quarter ended June 30, 2014)* |
10.63 | Form of Executive Restricted Stock Unit Agreement under Assured Guaranty Ltd. 2004 Long-Term Incentive Plan, as in effect for awards commencing in 2015 (Incorporated by reference to Exhibit 10.3 to Form 10-Q for the quarter ended March 31, 2015)* |
10.64 | 2013 Form of Executive Performance-Based Restricted Stock Unit Agreement under Assured Guaranty Ltd. 2004 Long-Term Incentive Plan (Incorporated by reference to Exhibit 10.3 to Form 10-Q for the quarter ended March 31, 2013)* |
10.65 | 2014 Form of Executive Performance-Based Restricted Stock Unit Agreement under Assured Guaranty Ltd. 2004 Long-Term Incentive Plan (Incorporated by reference to Exhibit 10.3 to Form 10-Q for the quarter ended June 30, 2014)* |
10.66 | |
10.6710.51 | First Amendment to the Restricted Stock Unit Agreement for Outside Directors (Incorporated by reference to Exhibit 10.106 to Form 10-K for the year ended December 31, 2012)* |
10.68 | |
10.6910.52 | Assured Guaranty Ltd. Performance Retention Plan (As Amended and Restated as of February 14, 2008 for Awards Granted during 2007) (Incorporated by reference to Exhibit 10.50 to Form 10-K for the year ended December 31, 2007)* |
|
| |
Exhibit
Number
| Description of Document |
10.70 | Assured Guaranty Ltd. Performance Retention Plan (As Amended and Restated as of February 14, 2008) (Incorporated by reference to Exhibit 10.58 to Form 10-K for the year ended December 31, 2007)* |
10.7110.53 | Terms of Performance Retention Award Four Year Installment Vesting Granted on February 9, 2012 for participants Subject to $1 million Limit (Incorporated by reference to Exhibit 10.10 to Form 10-Q for the quarter ended March 31, 2012)* |
10.72 | Terms of Performance Retention Award Four Year Installment Vesting Granted on February 7, 2013 for Participants Subject to $1 million Limit (Incorporated by reference to Exhibit 10.4 to Form 10-Q for the quarter ended March 31, 2013)* |
10.73 | |
10.7410.54 | |
10.7510.55 | |
10.7610.56 | |
10.7710.57 | |
10.7810.58 | Assured Guaranty Ltd. Executive Officer Recoupment Policy (Incorporated by reference to Exhibit 10.69 to Form 10-K for the year ended December 31, 2008)* |
10.79 | Form of Acknowledgement of Assured Guaranty Ltd. Executive Officer Recoupment Policy (Incorporated by reference to Exhibit 10.70 to Form 10-K for the year ended December 31, 2008)* |
10.80 | |
10.8110.59 | |
10.8210.60 | Assured Guaranty Ltd. Supplemental Employee Retirement Plan, as amended and restated effective January 1, 2009 and as amended by the First, Second, Third, Fourth and Fifth Amendments (Incorporated by reference to Exhibit 10.1 to Form 10-Q for the quarter ended September 30, 2012)* |
10.83 | Assured Guaranty Corp. |
10.8410.61 | |
10.8510.62 | |
10.8610.63 | |
10.8710.64 | Separation Agreement, dated February 4, 2015, between Robert B. Mills and the Registrant (Incorporated by reference to Exhibit 10.91 to Form 10-K for the year ended December 31, 2014)* |
10.88 | |
10.8910.65 | |
10.9010.66 | Share Repurchase Agreement dated as of January 3, 2017 between the Company and the Chief Executive Officer* |
10.91 | Share Repurchase Agreement dated as of January 5, 2017 between the Company and the General Counsel* |
10.92 | |
Plan (Incorporated by reference to Exhibit 10.92 to Form 10-K for the year ended December 31, 2016)*
|
| |
Exhibit Number | Description of EarningsDocument |
| 10.69 | |
| 10.70 | |
| 10.71 | |
| 10.72 | Purchase Agreement, dated as of August 7, 2019, among BlueMountain Capital Management, LLC, BlueMountain GP Holdings, LLC, BlueMountain CLO Management, LLC, Assured Guaranty US Holdings Inc., Assured Guaranty Ltd., Affiliated Managers Group, Inc. and the sellers named therein (Incorporated by reference to Exhibit 2.1 to Form 10-Q for the quarter ended June 30, 2019)* |
| 10.73 | |
| 10.74 | |
| 10.75 | |
| 21.1 | |
| 23.1 | |
| 31.1 | |
| 31.2 | |
| 32.1 | |
| 32.2 | |
| 101.1 | The following financial information from Registrant'sAssured Guaranty Ltd.'s Annual Report on Form 10-K for the year ended December 31, 20162019 formatted in XBRL (eXtensible Business Reporting Language) interactive data files pursuant to Rule 405 of Regulation S-T:inline XBRL: (i) Consolidated Balance Sheets at December 31, 20162019 and 2015;2018; (ii) Consolidated Statements of Operations for the years ended December 31, 2016, 20152019, 2018 and 2014;2017; (iii) Consolidated Statements of Comprehensive Income for the years ended December 31, 2016, 20152019, 2018 and 2014;2017; (iv) Consolidated Statements of Shareholders' Equity for the years ended December 31, 2016, 20152019, 2018 and 2014;2017; (v) Consolidated Statements of Cash Flows for the years ended December 31, 2016, 20152019, 2018 and 2014;2017; and (vi) Notes to Consolidated Financial Statements. |
| 104.1 | The Cover page from Assured Guaranty Ltd.’s Annual Report on Form 10-K for the year ended December 31, 2019 formatted, in inline XBRL (included in Exhibit 101). |
| |
| * | Management contract or compensatory plan |
| |
| ITEM 16. | FORM 10-K SUMMARY |
None.
SIGNATURES
Pursuant to the requirements of Section 13 or 15(d) of the Securities Exchange Act of 1934, the Registrant has caused this report to be signed on its behalf by the undersigned, thereunto duly authorized.
|
| | |
| | Assured Guaranty Ltd. |
| | |
| | |
| By: | /s/ /s/ Dominic J. Frederico
Name: Dominic J. Frederico Title: President and Chief Executive Officer |
Date: February 24, 201728, 2020
Pursuant to the requirements of the Securities Exchange Act of 1934, this report has been signed below by the following persons on behalf of the Registrant and in the capacities and on the dates indicated.
|
| | | | | | | | | | | | | | |
| | | Name | | | | | Position | | | | | Date | | |
| | | |
/s/ /s/ Francisco L. Borges
Francisco L. Borges | Chairman of the Board; Director | February 24, 201728, 2020 |
| | | |
/s/ /s/ Dominic J. Frederico
Dominic J. Frederico | President and Chief Executive Officer; Director | February 24, 201728, 2020 |
| | | |
/s/ /s/ Robert A. Bailenson
Robert A. Bailenson | Chief Financial Officer (Principal Financial and Accounting Officer and Duly Authorized Officer) | February 24, 201728, 2020 |
| | | |
/s/ /s/ Laura Bieling
Laura Bieling | Chief Accounting Officer and Controller (Principal Accounting Officer) | February 28, 2020 |
| | |
/s/ G. Lawrence Buhl G. Lawrence Buhl | Director | February 24, 201728, 2020 |
| | | |
/s/ /s/ Bonnie L. Howard
Bonnie L. Howard | Director | February 24, 201728, 2020 |
| | | |
/s/ /s/ Thomas W. Jones
Thomas W. Jones | Director | February 24, 201728, 2020 |
| | | |
/s/ /s/ Patrick W. Kenny
Patrick W. Kenny | Director | February 24, 201728, 2020 |
| | | |
/s/ /s/ Alan J. Kreczko
Alan J. Kreczko | Director | February 24, 201728, 2020 |
| | | |
/s/ /s/ Simon W. Leathes
Simon W. Leathes | Director | February 24, 201728, 2020 |
| | | |
/s/ /s/ Michael T. O'Kane
Michael T. O'Kane | Director | February 24, 201728, 2020 |
| | | |
/s/ /s/ Yukiko Omura
Yukiko Omura | Director | February 24, 201728, 2020 |