UNITED STATES
SECURITIES AND EXCHANGE COMMISSION
Washington, D.C. 20549
FORM 10-K
|
| | | | |
ý☒ | | ANNUAL REPORT PURSUANT TO SECTION 13 OR 15(d) OF THE SECURITIES EXCHANGE ACT OF 1934 |
For the fiscal year ended December 31, 2020OR | | | | | |
For the fiscal year ended December 31, 2018 |
OR |
o | ☐ | TRANSITION REPORT PURSUANT TO SECTION 13 OR 15(d) OF THE SECURITIES EXCHANGE ACT OF 1934 |
For the transition period from to |
|
For the transition period from to
Commission file number 001-32240
(Exact name of registrant as specified in its charter)
|
| | | | | | | | | | |
| Delaware | | | 20-1308307 |
(State or other jurisdiction of incorporation or organization) | | | (I.R.S. Employer Identification No.) |
| | | |
3460 Preston Ridge Road Alpharetta, Georgia
| Alpharetta | Georgia | 30005 |
(Address of principal executive offices)Principal Executive Offices) | | | (Zip Code) |
| | |
Registrant's telephone number, including area code: (678) 566-6500
|
Registrant's telephone number, including area code: (678) 566-6500
Securities registered pursuant to Section 12(b) of the Act: |
| | | | | | | |
Title of Each Class | Trading Symbol | Name of Each Exchange on Which Registered |
| Common Stock — $0.01 Par Value | NP | New York Stock Exchange |
Indicate by check mark if the registrant is a well-seasoned issuer, as defined in Rule 405 of the Securities Act. Yes ý☒ No o☐
Indicate by check mark if the registrant is not required to file reports pursuant to Section 13 or Section 15(d) of the Act. Yes o☐ No ý☒
Indicate by check mark whether the registrant (1) has filed all reports required to be filed by Section 13 or 15(d) of the Securities Exchange Act of 1934 during the preceding 12 months (or for such shorter period that the registrant was required to file such reports), and (2) has been subject to such filing requirements for the past 90 days. Yes ý☒ No o☐
Indicate by check mark whether the registrant has submitted electronically and posted on its corporate Web site, if any, every Interactive Data File required to be submitted and posted pursuant to Rule 405 of Regulation S-T (§232.405 of this chapter) during the preceding 12 months (or such shorter period that the registrant was required to submit and post such files). Yes ý☒ No o☐
Indicate by check mark if disclosure of delinquent filers pursuant to Item 405 of Regulation S-K is not contained herein, and will not be contained, to the best of registrant's knowledge, in definitive proxy or information statements incorporated by reference in Part III of this Form 10-K or any amendment to this Form 10-K. o☐
Indicate by check mark whether the registrant is a large accelerated filer, an accelerated filer, a non-accelerated filer, or a smaller reporting company. See definitions of "large accelerated filer," "accelerated filer," and "smaller reporting company" in Rule 12b-2 of the Exchange Act. (Check one):
|
| | | | | | | | | | |
Large accelerated filerý | ☒ | Accelerated filero | ☐ |
Non-accelerated filer o (Do not check if a smaller reporting company)
| ☐ | Smaller reporting companyo | ☐ |
| | Emerging growth companyo | ☐ |
If an emerging growth company, indicate by check mark if the registrant has elected not to use the extended transition period for complying with any new or revised financial accounting standards provided pursuant to Section 13(a) of the Exchange Act. o☐
Indicate by check mark whether the registrant has filed a report on and attestation to its management’s assessment of the effectiveness of its internal control over financial reporting under Section 404(b) of the Sarbanes-Oxley Act (15 USC. 7262(b)) by the registered public accounting firm that prepared or issued its audit report. Yes ☒ No ☐
Indicate by check mark whether the registrant is a shell company (as defined in Rule 12b-2 of the Act). Yes o☐ No ý☒
The aggregate market value of the registrant's common stock held by non-affiliates on June 30, 20182020 (based on the closing stock price on the New York Stock Exchange) on such date was approximately $1,205,000,000.$681,041,840.
As of February 20, 2019,17, 2021, there were 16,860,00016,837,000 shares of the Company's common stock outstanding.
DOCUMENTS INCORPORATED BY REFERENCE
Certain information contained in the definitive proxy statement for the Company's Annual Meeting of Stockholders to be held on May 22, 201920, 2021 is incorporated by reference into Part III hereof.
TABLE OF CONTENTS
PART I
In this report, unless the context requires otherwise, references to "we," "us," "our," "Neenah" or the "Company" are intended to mean Neenah, Inc., its consolidated subsidiaries and predecessor companies.
Item 1. Business
Overview
We areNeenah is a specialty materials company organized into two primary businesses: a performance-based technical products business and a premium fine paper and packaging business.
Our technical products business is a leading international producer of transportation, water and other filter media and durable, saturated and coated substrates for a variety of end markets. We focus on categories where we believe we are, or can be, a market leader. These categories include filtration media for transportation, water and other uses,end use applications, backings for specialty tapes and abrasives, performance labels, digital image transfer papers, and other specialty markets. custom engineered materials. Our products are typically used in high performance applications where our customers require specific standards and qualifications. Our dedicated technical products manufacturing facilities are located in Weidach and Bruckmühl, Germany, Eerbeek, Netherlands, Bolton, England, Munising, Michigan, Appleton, Wisconsin, and Pittsfield, Massachusetts. In addition, certain technical products are manufactured along with fine paper and packaging products in shared facilities located in Brattleboro, Vermont, Brownville and Lowville, New York, and Quakertown, Pennsylvania. In 2017, a filtration machine (which was converted from a fine paper machine) began production in Appleton, Wisconsin, a site also shared with the fine paper and packaging business.
Our fine paper and packaging business is a leading supplier of premium printing, packaging, and other high-end specialty papers predominantly in North America. Our products include some of the most recognized and preferred brands in North America, where we enjoy leading market positions in many of our product categories. Often these papers are characterized by distinctive finishing, colors, textures and coating. We sell our products primarily to authorized paper distributors, as well as through converters, major national retailers and specialty businesses. Our primarydedicated fine paper and packaging manufacturing facilities are located in Whiting and Neenah, Wisconsin, and Whiting, Wisconsin. CertainGreat Barrington, Massachusetts.
In addition, certain products of both businesses are manufactured in shared facilities located in Brattleboro, Vermont, Brownville and Lowville, New York, and Quakertown, Pennsylvania, as well as a site shared with technical products in 2017 in Appleton, Wisconsin. In August 2017, we purchased a laminating asset in Great Barrington, Massachusetts to support continued growth in our premium packaging business.
Pennsylvania. For a description of the sharedour facilities, see Item 2, "Properties."
Company Structure
Our corporate structure consists of Neenah, Inc. and eight direct wholly-owned subsidiaries.
Neenah, Inc. is a Delaware corporation that holds our trademarks and patents related to all of our U.S. businesses (except Neenah Paper FVC, Inc), all of our U.S. fine paper and packaging inventory, the real estate, mills and manufacturing assets associated with our fine paper and packaging operations in Neenah and Whiting, Wisconsin and all of the equity in our subsidiaries listed below. The common stock of Neenah is publicly traded on the New York Stock Exchange under the symbol "NP."
Neenah Paper Michigan, Inc. is a Delaware corporation and a wholly owned subsidiary of Neenah that owns the real estate, mill and manufacturing assets associated with our U.S. technical products business in Munising, Michigan.
Neenah Paper FVC, LLC is a Delaware limited liability company and wholly owned subsidiary of Neenah that owns all of the equity of Neenah Paper FR, LLC. Neenah Paper FR, LLC ("Fox River") is a Delaware limited liability company that owns the real estate, mill and manufacturing assets associated with our fine paper and packaging operation in Appleton, Wisconsin and leases the real estate and owns the manufacturing assets associated with our fine paper and packaging operations in Great Barrington, Massachusetts.
Neenah Paper International Holding Company, LLC is a Delaware limited liability company and wholly owned subsidiary of Neenah that owns all of the equity of Neenah Paper International, LLC. Neenah Paper International, LLC is a Delaware limited liability company that owns all of the equity of Neenah Germany GmbH and in conjunction with Neenah Germany GmbH all of the equity of Neenah Services GmbH & Co. KG.
NPCC Holding Company LLC is a Delaware limited liability company and wholly owned subsidiary of Neenah that owns all of the equity of Neenah Paper Company of Canada ("Neenah Canada"). Neenah Canada is a Nova Scotia unlimited liability corporation that holds certain post-employment liabilities of our former Canadian operations.
Neenah Paper International Finance Company BV is a private company with limited liability organized under the laws of the Netherlands and a wholly owned subsidiary of Neenah that facilitates the financing of our international operations.
Neenah Filtration, LLC is a Delaware limited liability company and wholly owned subsidiary of Neenah that owns all of the equity of Neenah Technical Materials, Inc. ("NTM") and Neenah Filtration Appleton, LLC ("NFA"). NTM is a Massachusetts corporation that owns all of the real estate, mills and manufacturing assets associated with our technical materials business in Pittsfield, Massachusetts. NFA is a Delaware limited liability company that owns certain assets associated with our filtration business in Appleton, Wisconsin. The filtration assets in Appleton, Wisconsin have started production in January 2017. See "Management's Discussion and Analysis of Financial Condition and Results of Operations — Liquidity and Capital Resources."
Neenah FMK Holdings, LLC is a Delaware limited liability company and a wholly owned subsidiary of Neenah that owns all of the equity of ASP FiberMark, LLC ("FiberMark"). FiberMark is a Delaware limited liability company that owns all of the equity of Neenah Northeast, LLC ("NNE") and Neenah International UK Limited, a United Kingdom corporation ("Neenah UK"). NNE is a Delaware limited liability company that owns certain real estate, mills and manufacturing assets associated with our fine paper and packaging business and technical products business located in Brattleboro, Vermont, West Springfield, Massachusetts, Quakertown, Pennsylvania, and Brownville and Lowville, New York. Neenah UK is a United Kingdom corporation that owns all of the equity of Neenah Red Bridge International Limited ("Red Bridge"). Red Bridge is a United Kingdom corporation that owns all of the real estate, manufacturing assets and inventory associated with our technical products business in Bolton, England.
Neenah Global Holdings B.V. is a private company with limited liability organized under the laws of the Netherlands and a wholly owned subsidiary of Neenah that owns all of the equity of W.A. Sanders Coldenhove Holding BV ("Coldenhove Holding") and Neenah Hong Kong Limited, a limited liability company organized under the laws of Hong Kong ("Neenah Hong Kong"). Coldenhove Holding is a private company with limited liability organized under the laws of the Netherlands that owns all of the equity of Neenah Coldenhove B.V. ("Neenah Coldenhove"). Neenah Coldenhove is a private company with limited liability organized under the laws of the Netherlands that owns substantially all of real estate, manufacturing assets and inventory associated with our technical products business in Eerbeek, Netherlands. Neenah Hong Kong provides certain sales and marketing services to Neenah, Inc. and its affiliated entities.
History of the Businesses
Neenah was incorporated in April 2004 in contemplation of the spin-off by Kimberly-Clark Corporation ("Kimberly-Clark") of its technical products and fine paper businesses in the United States and its Canadian pulp business (collectively, the "Pulp and Paper Business"). We had no material assets or activities until Kimberly-Clark's transfer to us of the Pulp and Paper business on November 30, 2004. On that date, Kimberly-Clark completed the distribution of all of the shares of our common stock to the stockholders of Kimberly-Clark (the "Spin-Off"). Following the Spin-Off, we are an independent public company and Kimberly-Clark has no ownership interest in us.Kimberly-Clark.
Former Pulp Operations. At the Spin-Off, our Our former pulp operations consisted of mills located in Terrace Bay, Ontario and Pictou, Nova Scotia and approximately 975,000 acres of related woodlands. We disposed of these mills and woodlands in a series of transactions from 2006 tothrough 2010.
Technical Products. The Munising, Michigan mill was purchased by Kimberly-Clark in 1952. Subsequent to the purchase, the mill was converted to produce durable, saturated and coated papers for sale and use in a variety of industrial applications for our technical products business.
In October 2006, we purchased the outstanding interests of FiberMark Services GmbH & Co. KG and the outstanding interests of FiberMark Beteiligungs GmbH (collectively "Neenah Germany"). At acquisition, the Neenah Germany assets consisted of three mills located in Weidach, Bruckmühl and Lahnstein, Germany. These mills producedproduce a wide range of products, including transportation filter media, nonwoven wall coverings, masking and other tapes, abrasive backings, and specialized printing and coating substrates. In October 2015, we sold the Lahnstein mill to the Kajo Neukirchen Group. The Lahnstein mill had been operating as a stand-alone business, manufacturing nonwoven wallcoverings and various other specialty papers. See Note 13 of Notes to Consolidated Financial Statements, "Discontinued Operations."
In July 2014, we purchased all of the outstanding equity of Crane Technical Materials, Inc. from Crane & Co., Inc. The acquired business provides performance-oriented wet laid nonwoven media for water filtration end markets as well as environmental, energy and industrial uses. The business has two manufacturing facilities in Pittsfield, Massachusetts.
In November 2017, we purchased all of the outstanding equity of Coldenhove.Neenah Coldenhove B.V. ("Neenah Coldenhove"). The acquired business is a specialty materials manufacturer based in the Netherlands, with a leading position in digital transfer media and other technical products. The business has one manufacturing facility in Eerbeek, Netherlands. See Note 4 of Notes to Consolidated Financial Statements, "Acquisitions."
Fine Paper and Packaging. The fine paper and packaging business was incorporated in 1885 as Neenah Paper Company, which initially operated a single paper mill in Neenah, Wisconsin. Kimberly-Clark acquired the mill in 1956. In 1981, Kimberly-Clark purchased an additional mill located in Whiting, Wisconsin and in the late 1980s and early 1990s, the capacity of the fine paper and packaging business was expanded by building two new paper machines at the Whiting mill and completing a major expansion of the Neenah facility with the installation of a new paper machine, finishing center, customer service center and an expanded distribution center.
In the first of the series of consolidating acquisitions, in March 2007, we acquired the assets and brands of Neenah Paper FR, LLC ("Fox RiverRiver") (including our mill located in Appleton, Wisconsin). In January 2012, we purchased certain premium fine paper brands and other assets from Wausau Paper Mills, LLC, a subsidiary of Wausau Paper Corp. ("Wausau") and in January 2013, we purchased certain premium business paper brands from the Southworth Company ("Southworth").
In August 2017, we purchased a laminating asset in Great Barrington, Massachusetts to support continued growth in our premium packaging business.
Shared Facilities. In August 2015, we purchased all of the outstanding equity of FiberMark.ASP FiberMark, LLC ("FiberMark"). We added specialty coating and finishing capabilities with this acquisition, particularly in luxury packaging and technical products. The results of operations and assets related to FiberMark are reflected in each of our business segments. These mills are located in Brattleboro, Vermont, Brownville and Lowville, New York, Quakertown, Pennsylvania and Bolton, England. On December 31, 2018, the Company completed the sale of certain equipment, inventory, real property and other specified assets relating to the Company’s premium fine paper and office products manufacturing facility located in Brattleboro, Vermont. See Note 1412 of Notes to Consolidated Financial Statements, "Sale of Brattleboro Mill"Asset Restructuring and Impairment Loss.Costs."
One of the two fine paper machines ofincluded in the Fox River acquisition and located in Appleton, Wisconsin (noted above) was converted to produce filtration products as part of NFA.products. This business, Neenah Filtration Appleton, began operations in 2017.2017 and produces transportation and other filtration media.
Business Strategy
Our missionWe have a long history, which is to create value by improving the image and performancerooted in a proud heritage of everything we touch. We expect to create value by growing in specialized niche markets that value performance or image and wheremanufacturing expertise. For over 100 years, we have competitive advantages. In managinggrown and evolved our businesses,technology and methodologies along with the materials we use and what we make. Enabled by our culture and capabilities, we are laser-focused on increasing our organic growth trajectory and leading the markets we serve. Our growth platforms include filtration media, specialty coatings, custom engineered solutions, image products and packaging. We believe that achieving and maintaining a leadership position in our markets, responding effectively to customer needsrequires prompt and competitive challenges, employing capital optimally, controlling costs, and managing risks are importantproactive responses to our long-term success. Strategiescustomers' needs. We know that prudent capital and cost management coupled with relentless risk-mitigation allow us to delivermanufacture growth, for our customers, end-users, shareholders and employees. We are committed to driving meaningful value include:
Enhancefor our leading positions in high value core categories — We will increase our participation in niche markets that can provide us with leading positions and value our core competencies in performance-based fiber and non-woven media production, coating and saturating. Key markets include transportation filtration, specialty backings and technical products, and premium fine paper and packaging.
Increasing our size, growth rate and portfolio diversification — We will invest and focus resources in higher growth specialty markets such as filtration, digital image transfer, and premium packaging, to grow with customers in new products and geographies and to enter into adjacent markets that are growing and profitable. We will do this both through organic initiatives that build on our technologies and capabilities, and through acquisitions that fit with our competencies and provide attractive financial returns.
Delivering consistent, attractive returns to our shareholders —stakeholders. We will continue to use Return on Invested Capital ("ROIC") as a key metric to evaluate investment decisions and measure our performance, and will alsooperate with financial discipline, maintain a prudent capital structure and deploy cash flows in ways that can provide value, including direct cash returns to shareholders through a meaningful dividend.dividend.
Products
Technical Products. Our technical products business is a leading international producer of fiber-formed, durable, coated and/or saturated specialized media that delivers high performance benefits to customers, such as filtration media for transportation, water and other filtration markets, and saturated and coated performance materials used for industrial backings,specialty tapes, abrasives, performance labels, digital image transfer papers, and a variety of other end markets. In general,Typically, our technical products are sold to other manufacturers as key components for their finished products. Many of our key market segments served, including filtration and specialty backings for tape and abrasives, are global in scope. JET-PRO®SofStretchTM, KIMDURA®, PREVAILTM, NEENAH®, and GESSNER® are some of the brands of our technical products business.
The following is a description of certain key products and markets:
Filtration media for transportation, including induction air, fuel, oil, and cabin air and other applications. Transportation filtration media are sold to suppliers offilter manufacturers who in turn supply automotive and other companies with filters used as original equipment on new cars and trucks as well as to the automotive aftermarket, which is a recurring sale and represents the large majority of our sales. In 2020, we introduced high performance face mask media in Europe.
Filtration media for water and other industrial end markets. Primary applications include reverse osmosis, catalytic conversion, nanofiltration, ultrafiltration, pervaporation and vapor permeation, as well as other applications for specialty markets.
Specialty backings including a)backings. Products in this market segment include (a) saturated and unsaturated crepe and flat paper tapes sold to manufacturers to produce finished pressure sensitive products for sale in automotive, transportation, manufacturing, building construction, and industrial general purpose applications, including sales in the consumer do-it-yourself retail channel and b)(b) coated lightweight abrasive paper used in the automotive, construction, metal and woodworking industries for both dry and wet sanding applications.
Digital image transfer media ismedia. Products in this market are used to transfer digital images onto clothing, sportswear, and other materials. A fiber-based sheet undergoes various coatings to impart required performance. Digital transfer papers are also used to digitally print images from paper to clothing, hats, coffee mugs, and other surfaces.
Label and tag productsproducts. Products in this market are made from both saturated base label stock and synthetic base label stock, with coatings applied to allow for high quality digital printing. The synthetic label stock is recognized as a high quality, UV (ultra-violet) stable product used for outdoor applications. Label and tag stock is sold to pressure sensitive coaters, who in turn sell the coated label and tag stock to the label printing community.
Other latex saturated and coated papers for use by a wide variety of manufacturers. Premask paper is used as a protective over wrap for products during the manufacturing process and for applying signs, labeling and other finished products. Medical packaging paper is typically a polymer impregnated base sheet that providesproviding a breathable sterilization barrier that provides unique properties.
Digital transfer papers are used to digitally print images from paper to clothing, hats, coffee mugs, and other surfaces. Publishing and security paperspapers. Products in this market are used to produce book covers, stationery, fancy packaging and passports. Other specialty products include clean room papers, durable printing papers, release papers and furniture backers.
Fine Paper and Packaging. Our fine paper and packaging business manufactures and sells world-class branded premium writing, text, cover and specialty papers and envelopes used in high-end commercial printing services, corporate identity packages and advertising collateral. In addition, we produce premium packaging, high end beverage labels and other forms of packaging, as well as wide format applications.applications used for display graphics and indoor/outdoor signage. Often these papers are characterized by distinctive coating, finishing, colors, textures and textures.distinctive coating.
The following is a description of certain key products and markets:
Commercial printing papers, includeincluding premium writing, text and cover papers and envelopes. Uses include advertising collateral, stationery, corporate identity packages and brochures, pocket folders, annual reports, advertising inserts, direct mail, business cards, scrapbooks, and a variety of other uses where colors, texture, coating, unique finishes or heavier weight papers are desired. Our market leading brands in this category include CLASSIC®, CLASSIC CREST®, ESSE®, ENVIRONMENT®, CAPITOL BOND®, ROYAL SUNDANCE®, SOUTHWORTH®, and TOUCHE® trademarks. Our fine paper and packaging business has an exclusive agreement to manufacture, market and distribute Crane & Co.'s CRANE'S CREST®, CRANE'S BOND®, and CRANE'S LETTRA®, branded fine papers in the commercial print category. Our fine paper and packaging business has an exclusive agreement to market and distribute Gruppo Cordenons SpA's SO...SILK®, PLIKE® and STARDREAM® branded fine papers in the U.S. and Canada. The fine paper and packaging business also sells private watermarked paper and other specialty writing, text, and cover papers. Additionally, the fine paper and packaging business provides leading solutions in the wide format arena, led by its Neenah Wide Format® and CONVERD® brands.
Bright papers. Products in this market are used in applications such as direct mail, advertising inserts, scrapbooks and marketing collateral. Our brands in this category include ASTROBRIGHTS®. Additionally, business papers for professionals and small businesses are sold under our Southworth® brand through major retailers.
Consumer products. Products such as bright papers, cardstock, stationary paper, envelopes, journals and planners are sold to national retailers like Staples, Office Depot, Walmart and Amazon. Our brands in this category include ASTROBRIGHTS®, SOUTHWORTH®, and Neenah® Bright White.
Premium packaging productspackaging. Products produced for this market are used for wine, spirits and beer labels, folding cartons, box wrap, bags, hang tags, and stored value cards servicing high-end retail, cosmetics, spirits, and electronics end-use markets. Our market leading brands in these categories include NEENAH® Folding Board, ESTATE LABEL®, Neenah® Box Wrap, PELLAQ®, KIVAR®, SKIVERTEX®, ILLUSIO®, and SENZO®.IMAGEMAX® Paper Card.
Bright papers are used in applications such as direct mail, advertising inserts, scrapbooks and marketing collateral. Our brands in this category include ASTROBRIGHTS® and CREATIVE COLLECTIONTM. Additionally, business papers for professionals and small businesses are sold under our Southworth® brand through major retailers.
Other.The fine paper and packaging business also produces and sells other specialty papers such as translucent papers, art papers, papers for optical scanning and other specialized applications.
There were no significant government contracts to disclose in either segment.
Markets and Customers
Technical Products. The technical products business sells its products globally to other manufacturers who convert our product for sale into product categories generally used as base materials in the following applications: filtration, component backing materials for manufactured products such as tape and abrasives, and other specialized product uses such as graphics and identification. Customers typically convert and transform base papers and film into finished rolls and sheets by adding adhesives, coatings, and finishes. These transformed products are then sold to end-users.
SeveralOur products (filtration media, abrasives, specialty tapes, labels) are generally used in markets that are directly affected by economic business cycles. OtherCertain market segments such as imagedigital transfer papers used in small/home office and consumer applications are relatively stable. Most products are performance-based and require extended qualification by customers; however, certain categories may also be subject to price competition and the substitution of lower cost substrates infor some less demanding applications.
The technical products business relies on a team of direct sales representatives and customer service representatives to market and sell a large majority of its sales volume directly to customers and converters.
The technical products business has more than 5001,000 customers worldwide. The distribution of sales in 20182020 was approximately 42 percent in Europe, 3744 percent in North America, and 2139 percent in Europe, and 17 percent in Asia, Latin America, and Asia. Customers typically convert and transform base papers and film into finished rolls and sheets by adding adhesives, coatings, and finishes. These transformed products are then sold to end-users.Africa.
Sales to the technical products business' three largest customers combined represented approximately 13 percent of total sales for the segment in 2018. Although a complete loss of any of these customers would cause a temporary decline in the business' sales volume, the decline could be partially offset by expanding sales to existing customers, and further offset over a several month period with the addition of new customers.
Fine Paper and Packaging. Our We believe our fine paper and packaging business is a leading supplier of premium writing, textprinting, packaging, and cover papers, bright papers andother high-end specialty papers predominantly in North America.America. These products are used in high-end collateral material, business and legal professions, andcommercial printing services, corporate identity products.packages, and advertising collateral. Our premium packaging business includes products such as food and beverage labels and high-end packaging materials such as folding cartons and box wrap used for luxury retail goods. In addition, we produce wide format applications used for display graphics and indoor/outdoor signage. Bright papers are generally used by consumers for flyers, direct mail and packaging.
The fine paper and packaging business has over 450 customers worldwide. The fine paper and packaging business sells its products in a variety of channels including authorized paper distributors, converters, major national retailers, specialty business converters, and direct to end users.end-users. Sales to distributors account for approximately 6050 percent of revenuenet sales in the fine paper and packaging business. During 2018,2020, approximately 107 percent of the net sales of our fine paper and packaging business were exported to markets outside North America.
Concentration. For the United States.
Salesyears ended December 31, 2020 and 2019, sales to the twotechnical products business' largest customer represented approximately 9 percent and 8 percent of consolidated net sales, respectively, and approximately 15 percent and 14 percent of net sales for the technical products segment, respectively. For the year ended December 31, 2018, there were no customers to which sales constituted over 10 percent of segment net sales for technical products. For the years ended December 31, 2020 and 2019, sales to the largest customer of fine paper and packaging business represented approximately 6 percent and 8 percent of consolidated net sales, respectively, and approximately 18 percent of net sales of the fine paper and packaging business for each of such years. For the year ended December 31, 2018, sales to the two largest customers of fine paper and packaging business represented approximately 7 percent and 5 percent, respectively, of consolidated net sales and approximately 16 percent and 12 percent, respectively, of its totalnet sales in 2018.of the fine paper and packaging business. We practice limited sales distribution to improve our ability to control the marketing of our products. Although a complete loss of these customers would cause a temporary decline in the business'srespective business' sales volume, we believe the decline could be partially offset by expanding sales to existing customers, and further offset over a several month period with the addition of new customers.
Concentration. For
Competition
Technical Products. Our technical products business competes in global markets with a number of large multinational competitors, including Ahlstrom-Munksjö, ArjoWiggins SAS and Hollingsworth & Vose Company. It also competes in some, but not all, of these segments with smaller regional manufacturers, such as Monadnock Paper Mills, Inc. and Potsdam Specialty Paper, Inc. We believe the year ended December 31, 2018, salesbases of competition in most of these categories are the ability to CNGdesign and Veritiv represented approximately 7 percentdevelop customized product features to meet customer performance specifications while maintaining quality, customer service and 5 percent, respectively, of consolidated net sales,a competitive price. We believe our research and approximately 16 percentdevelopment program gives us an advantage in customizing base papers and 12 percent, respectively, of net sales of thedeveloping advanced filter media to meet customer needs.
Fine Paper and Packaging. Our fine paper and packaging business. For the year ended December 31, 2017, sales to Veritivbusiness is a leading supplier of premium printing and CNG each represented approximately 7 percent of consolidated net sales and approximately 15 percent of net sales of theother high-end specialty papers in North America. Our fine paper and packaging business. Forbusiness also competes in the year ended December 31, 2016 sales to Veritiv represented approximately 8 percentpremium segment of consolidated net sales and approximately 15 percent of net sales of the uncoated free sheet market. The fine paper and packaging business.business competes directly in North America with Mohawk Fine Paper Inc. We believe the primary bases of competition for premium fine papers are product quality, customer service, product availability, promotional support, color and texture variety, and brand recognition. Price also can be a factor particularly for lower quality printing needs that may compete with opaque and offset papers. We have and will continue to invest in advertising and other programs aimed at graphic designers, printers and corporate end-users in order to maintain a high level of brand awareness and to communicate the advantages of using our products.
Our premium packaging business is focused on high-end packaging needs in end market verticals like beauty products, spirits and retail. Like our premium fine paper business, the primary bases of competition are similarly product quality, customer service, product availability, color and texture variety, and brand recognition. Premium packaging is primarily a North American business, but we also sell to customers in Asia and other markets outside the U.S. We believe the premium packaging market to be highly fragmented, with multiple competitors, many of which produce premium packaging products as a small subset of larger packaging operations.
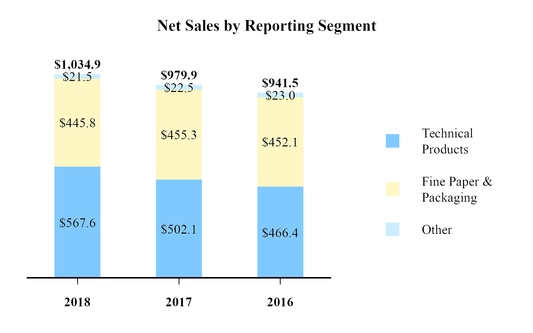
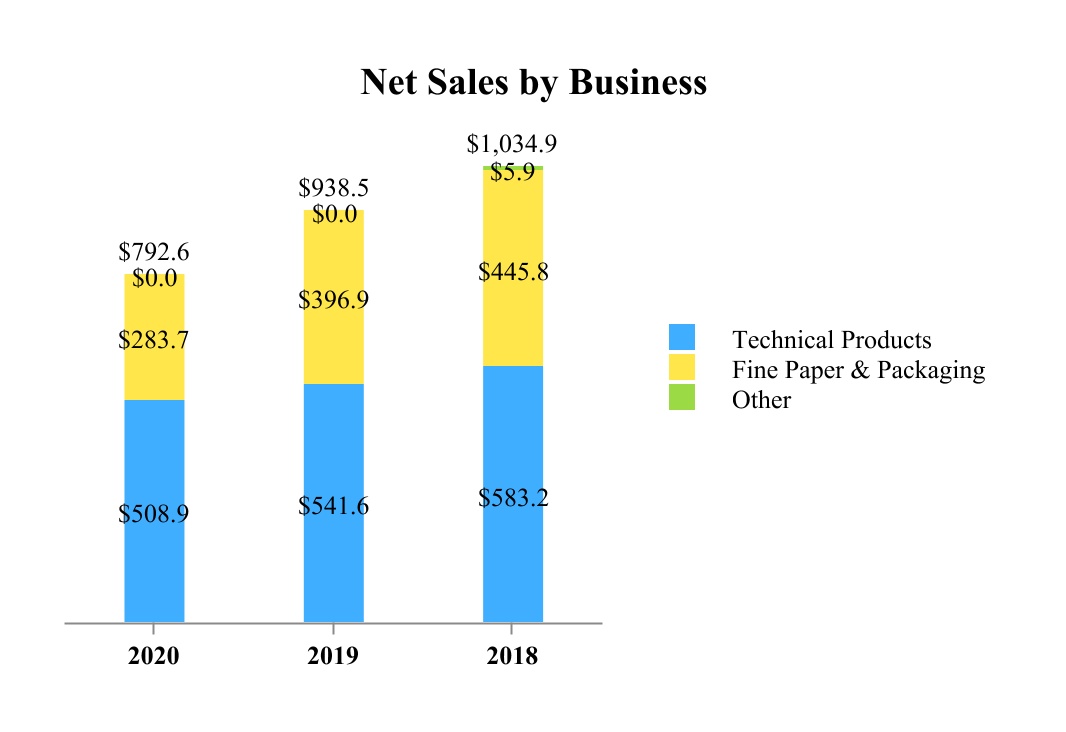
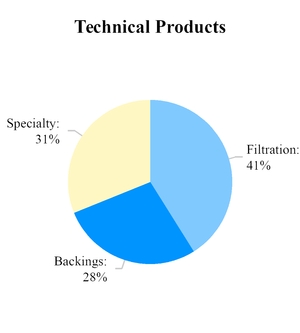
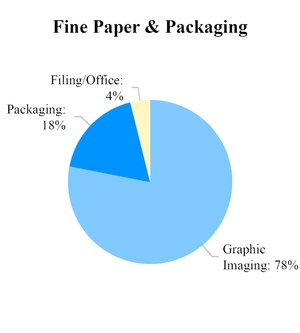
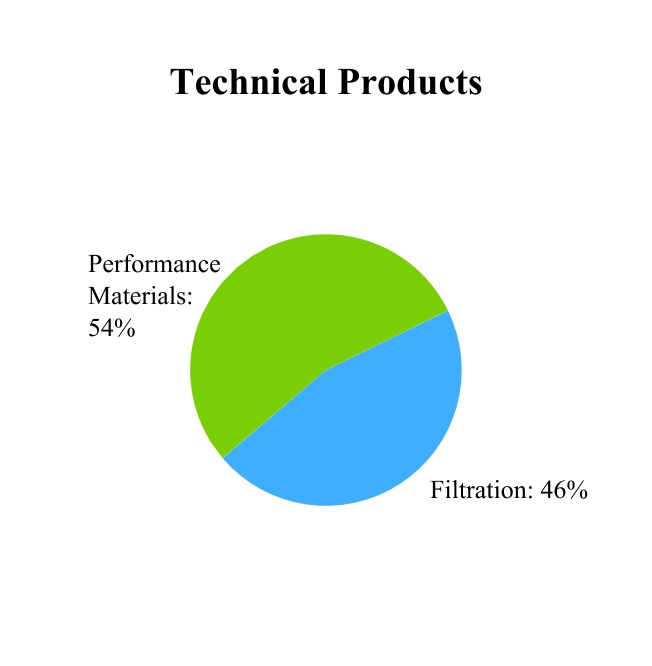
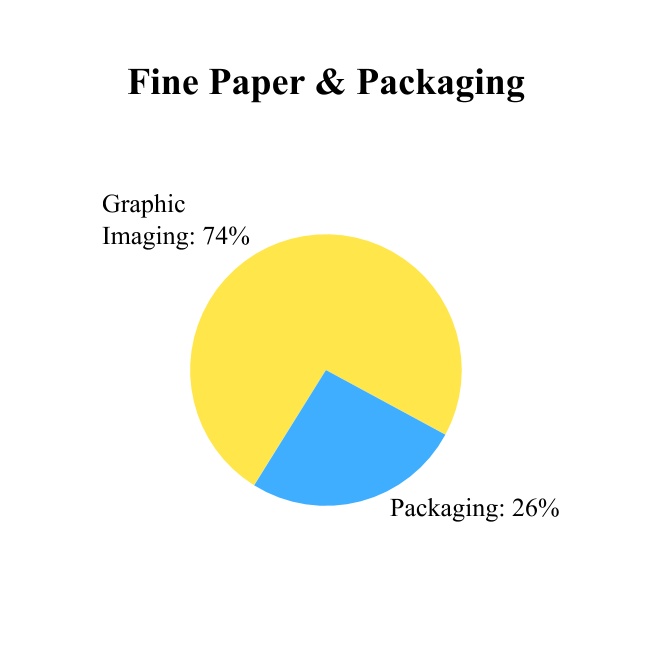
The following graphs present further information about our businessesnet sales by business, geographic area and product line (dollars in millions):
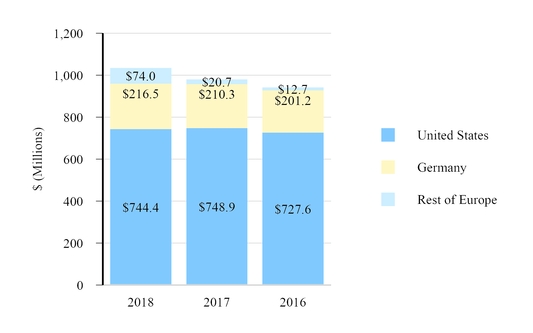
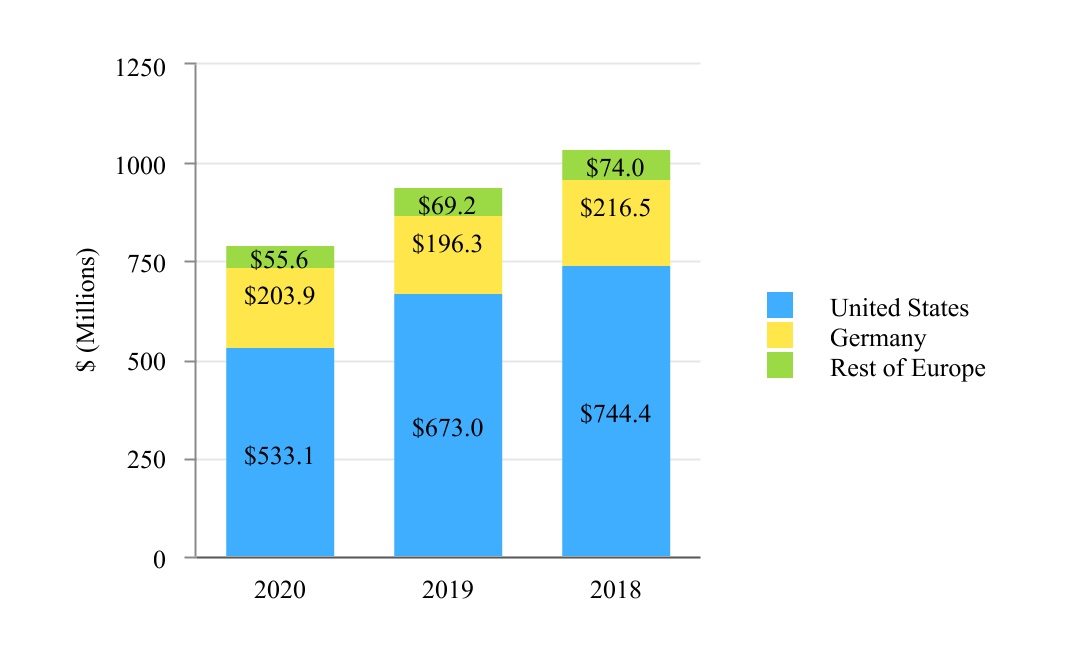
Net Sales fromby Geographic Region
(in Millions)
20182020 Net Sales by Product Line
Net sales are attributed to geographic areas based on the physical location of the Neenah selling entities and the physical location of the assets.entity. See Note 1513 of Notes to Consolidated Financial Statements, "Business Segment and Geographic Information", for information with respect to net sales, operating income and long-lived assets by business segment and location.
Seasonality
Technical Products. In general, sales and operating income for the technical products business have historically been relatively stronger in the first half of the year with reductions in the third quarter due to reduced customer converting schedules and in the fourth quarter due to a reduction in year-end inventory levels by our customers. The order flow for the technical products business is subject to seasonal peaks for several of its products, such as the larger volume grades of specialty tape, abrasives, premask, and label stock used primarily in the downstream finished goods manufacturing process. To assure timely shipments during these seasonal peaks, the technical products business provides certain customers with finished goods inventory on consignment. The technical products business periodically experiences periods where order entry levels surge, and order backlogs can increase substantially. Raw materials are purchased and manufacturing schedules are planned based on customer forecasts, current market conditions and individual orders for custom products.
Fine Paper and Packaging. The fine paper and packaging business has historically not experienced seasonality. Orders for stock products are typically shipped within two days, while custom orders are shipped within two to three weeks of receipt. Raw material purchases and manufacturing schedules are planned based on a combination of historical trends, customer forecasts and current market conditions.
The operating results for both of our businesses are influenced by the timing of our annual maintenance downs, which are generally scheduled in the third quarter.
Resources
Raw Materials
Technical Products. Softwood pulp, specialty pulps and fibers, and latex are the primary raw materials consumed by our technical products business. The technical products business purchases softwood pulp, specialty pulp and fibers, and latexthat are purchased from various external suppliers. We believe that all of the raw materials for our technical products operations, except for certain specialty latex grades and specialty pulps, are readily available from several sources and that the loss of a single supplier would not cause a shutdown of our manufacturing operations.
Our technical products business acquires all of its specialized pulp requirements from two global suppliers and certain critical specialty latex grades from four suppliers. In general, these supply arrangements are covered by formal contracts, and represent multi-year business relationships that have historically been sufficient to meet our needs. We expect these relationships to continue to operate in a satisfactory manner in the future. In the event of an interruption of production at any one supplier, we believe that each of these suppliers individually would be able to satisfy our short-term requirements for specialized pulp or specialty latex. In the event of a long-term disruption in our supply of specialized pulp or specialty latex, we believe we would be able to substitute other pulp grades or other latex grades that would allow us to meet required product performance characteristics and incur only a limited disruption in our production. As a result, we do not believe that the substitution of such alternative pulp or latex grades would have a material effect on our operations.
Fine Paper and Packaging. Hardwood pulp is the primary raw material used to produce products of the fine paper and packaging business. Other significant raw material inputs in the production of fine paper and packaging products include softwood pulp, recycled fiber, cotton fiber, dyes and fillers. The fine paper and packaging business purchases all of its raw materials externally. We believe that all of the raw materials for our fine paper and packaging operations are readily available from several sources and that the loss of a single supplier would not cause a shutdown of our manufacturing operations.
Working Capital
Technical Products. The technical products business maintains approximately 25 to 30 days of raw materials and supplies inventories to support its manufacturing operations and approximately 30 to 35 days of finished goods inventory to support customer orders for its products. Sales terms in the technical products business vary depending on the type of product sold and customer category. Extended credit terms of up to 120 days are offered to customers located in certain international markets. In general, sales are collected in approximately 45 to 55 days and supplier invoices are paid within 20 to 25 days.
Fine Paper and Packaging. The fine paper and packaging business maintains approximately 15 to 20 days of raw material inventories to support its paper making operations and about 60 to 65 days of finished goods inventory to fill customer orders. Fine paper and packaging sales terms range between 20 and 30 days with discounts of up to 2 percent for customer
payments, with discounts of 1 percent and 20-day terms used most often. Extended credit terms are offered to customers located in certain international markets. Supplier invoices are typically paid within 60 days.
Energy and Water
The equipment used to manufacture the products of our technical products and fine paper and packaging businesses uses significant amounts of energy, primarily electricity, natural gas, oil and coal. We have the ability to generate substantially all of our electrical energy at the Munising mill and approximately 25 percent of the electrical energy at our mills in Appleton, Wisconsin and Bruckmühl, Germany. We also purchase electrical energy from external sources, including electricity generated from renewable sources.
Availability of energy is not expected to be a problem in the foreseeable future, but the purchase price of such energy can and likely will fluctuate significantly based on changes in demand and other factors.
An adequate supply of water is needed to manufacture our products. We believe that there is an adequate supply of water for this purpose at each of our manufacturing locations.
Working Capital
Technical Products. The technical products business maintains approximately 25 to 30 days of raw materials and supplies inventories to support its manufacturing operations and approximately 25 to 35 days of finished goods and semi-finished goods inventory to support customer orders for its products. Sales terms in the technical products business vary depending on the type of product sold and customer category. Extended credit terms of up to 120 days are offered to customers located in certain international markets. In general, sales are collected in approximately 45 to 55 days and supplier invoices are paid within 20 to 30 days.
Fine Paper and Packaging. The fine paper and packaging business maintains approximately 10 days of raw material inventories to support its paper making operations and about 55 days of finished goods inventory to fill customer orders.
Fine paper and packaging sales terms range between 20 and 30 days with discounts of 0 to 2 percent for customer payments, with discounts of 1 percent and 20-day terms used most often. Extended credit terms are offered to customers located in certain international markets. Supplier invoices are typically paid within 60 days.
Competition
Technical Products. Our technical products business competes in global markets with a number of large multinational competitors, including Ahlstrom-Munksjö, ArjoWiggins SAS and Hollingsworth & Vose Company. It also competes in some, but not all, of these segments with smaller regional manufacturers, such as Monadnock Paper Mills, Inc., Potsdam Specialty Paper, Inc. and Paper Line S.p.A. We believe the basis of competition in most of these segments are the ability to design and develop customized product features to meet customer performance specifications while maintaining quality, customer service and price. We believe our research and development program gives us an advantage in customizing base papers and developing advanced filter media to meet customer needs.
Fine Paper and Packaging. Our fine paper and packaging business is a leading supplier of premium printing and other high-end specialty papers in North America. Our fine paper and packaging business also competes in the premium segment of the uncoated free sheet market. The fine paper and packaging business competes directly in North America with Mohawk Fine Paper Inc. and other smaller companies. We believe the primary basis of competition for premium fine papers are brand recognition, product quality, customer service, product availability, promotional support and variety of colors and textures. Price also can be a factor particularly for lower quality printing needs that may compete with opaque and offset papers. We have and will continue to invest in advertising and other programs aimed at graphic designers, printers and corporate end-users in order to maintain a high level of brand awareness as well as communicate the advantages of using our products.
Our premium packaging business is focused on high-end packaging needs in end market verticals like beauty products, spirits and retail. Primary bases of competition are similarly brand recognition, product quality, customer service, product availability, and a variety of colors and textures. Premium packaging is primarily a North American business, but we also sell to customers in Asia and other markets outside the U.S. We believe the premium packaging market to be highly fragmented, with multiple competitors, many of which produce premium packaging products as a small subset of larger packaging operations.
Research and Development
Our technical products business maintains research and development laboratories in Feldkirchen-Westerham, Germany, Eerbeek, Netherlands, Munising, Michigan, and Pittsfield, Massachusetts to support its strategy of developing new products and technologies, and to support growth in its existing product lines and other strategically important markets. We also have a research and development laboratory in West Springfield,East Longmeadow, Massachusetts that supports both our technical products and fine paper and packaging businesses. We have continually invested in product research and development with spending of $7.6 million in 2020, $8.7 million in 2019, and $9.2 million in 2018, $8.9 million in 2017 and $9.4 million in 2016.2018.
Intellectual Property
We own more than 100 granted patents and have multiple pending patent applications in the United States, Canada, Europe and certain other countries covering imagedigital transfer paper, abrasives and medical packaging, and other paper application and media processing. We also own more than 150 trademarks with registrations in approximately 80 countries. Our imagedigital transfer patents have contributed to establishing the technical products business as a leading global supplier of imagedigital transfer papers through our highly recognized JET-PRO®, 3G JET-OPAQUE®, TECHNIPRINT®TECHNI-PRINT®, LASER-ONE OPAQUE®LASER-1-OPAQUE® and IMAGE CLIP® brands. We add even more depth and strength to our technical products portfolio with the well-recognized dye-sublimation and digital decor JETCOL® and DIGICOL® brands,brand, as well as our TEXCOLTM brand, which are alsoenables industrial transfer on natural substrates, supported by patented technology.a pending patent, and our new FACECOL™ face mask media products. The KIMDURA® and MUNISING LP® trademarks have also made a significant contribution to the marketing of synthetic film and clean room papers offor our technical products business.
For more than 100 years, Neenah’s fine paper and packaging business has built its market leading reputation on creating and manufacturing trademarked brands for premium writing, text, cover, digital, packaging, and specialty needs. The Neenah signature portfolio includes innovative, market leading brands such as CLASSIC® (including CLASSIC
CREST®, CLASSIC® Linen, CLASSIC® Laid, CLASSIC COLUMNS®, CLASSIC® Stipple, CLASSIC® Woodgrain, and CLASSIC® Techweave), ASTROBRIGHTS®, ENVIRONMENT®, The Design Collection, ROYAL SUNDANCE®, SOUTHWORTH® and many more. Our fine paper and packaging business provides unique and sustainable packaging papers, as well as custom solutions for premium packaging needs. With brands that stand for quality and consistency, such as NEENAH® Folding Board, NEENAH® Box Wrap, ESTATE LABEL®, and NEENAH IMAGEMAX® Paper Card, our fine paper and packaging business enables leading brands to deliver on their promise. The business alsoaccordingly maintains a well-rounded and respected portfolio of brands that position Neenah as an industry leader, setting standards for quality, consistency, and dependability.
Neenah also boastshas significant trademarks recognized in both the publishing and packaging markets, including SKIVERTEX® and KIVAR®.
Finally, theThe GESSNER® trademark has playedsimilarly plays an important role in the marketing of Neenah’s filtration product lines. With
Human Capital
Our vision is to be a company known for manufacturing growth, for our customers, end-users, shareholders, and employees. Our talent strategy focuses on accelerating growth for our global employees by fostering a culture of possibility and cultivating the expansion of our newest filtration facility in Appleton, Wisconsin, Neenah expects increased recognition of this brand domestically and internationally.
Backlog and Seasonality
Technical Products. In general, sales and operating income for the technical products business have been relatively strongerright people in the first half ofright roles with the year with reductions inright skills at the third quarter due to reduced customer converting schedulesright time. We're doing this by continually evolving how we attract, engage, grow and in the fourth quarter due to a reduction in year-end inventory levels byreward our customers. The order flow for the technical products business is subject to seasonal peaks for several of its products, such as the larger volume grades of specialty tape, abrasives, premask, and label stock used primarily in the downstream finished goods manufacturing process. To assure timely shipments during these seasonal peaks, the technical products business provides certain customers with finished goods inventory on consignment. The technical products business periodically experiences periods where order entry levels surge, and order backlogs can increase substantially. Raw materials are purchased and manufacturing schedules are planned based on customer forecasts, current market conditions and individual orders for custom products. The order backlog in the technical products business on December 31, 2018 was approximately $119.1 million and represented approximately 21 percent of current year sales. The order backlog in the technical products business on December 31, 2017 was approximately $122.1 million and represented approximately 24 percent of prior year sales. We previously filled the order backlog from December 31, 2017 and expect to fill the order backlog from December 31, 2018 within the next year.people.
Fine Paper and Packaging. The fine paper and packaging business has historically not experienced seasonality. Orders for stock products are typically shipped within two days, while custom orders are shipped within two to three weeks of receipt. Raw material purchases and manufacturing schedules are planned based on a combination of historical trends, customer forecasts and current market conditions. The order backlogs in the fine paper and packaging business on December 31, 2018 and 2017 were $17.6 million and $19.9 million, respectively, which represent approximately 14 -15 days of sales. The order backlogs from December 31, 2018 and 2017 were filled in the respective following years.
The operating results for each of our businesses are influenced by the timing of our annual maintenance downs, which are generally scheduled in the third quarter.
Employee and Labor Relations
As of December 31, 2018,2020, we had approximately 2,6412,239 regular full-time employees of whom 1,180906 hourly and 580476 salaried employees were located in the United States and 434509 hourly and 447348 salaried employees were located in Europe.
Approximately 50 percent of salaried employees and 80 percent of hourlyCertain employees of Neenah Germany are eligible to be represented by the Mining, Chemicals and Energy Trade Union, Industriegewerkschaft Bergbau, Chemie and Energie (the "IG BCE"). The IG BCE and a national trade association representing all employers in the industry signed a collective bargaining agreement covering union employees of Neenah Germany that expires at the end of February 2019.in September 2022. Under German law union membership is voluntary and does not need to be disclosed to the Company. As a result, the number of employees covered by thea collective bargaining agreement with the IG BCE that expires in February 2019 cannot be determined. The negotiations for a new collective bargaining arrangement betweenIn Netherlands, most of our employees are eligible to be represented by the national trade associationChristelijke Nationale Vakbond ("CNV") and IG BCE are currently in progress. Until a new agreementthe Federatie Nederlandse Vakvereniging ("FNV"). Under Netherlands law, union membership is signed,voluntary and does not need to be disclosed to the current agreement will apply.
Company.
As of December 31, 2018, 1132020, 85 employees are covered under collective bargaining agreements that expire in the next 12 months, not including the employees covered by the collective bargaining arrangementarrangements with the IG BCE. CNV and FNV.
We believe we have satisfactory relations with our employees covered by collective bargaining agreements and do not expect the negotiation of new collective bargaining agreements to have a material effect on our results of operations or cash flows. See Note 1211 of Notes to Consolidated Financial Statements, "Contingencies"Commitments, Contingencies, and Legal Matters — Employees and Labor Relations."
Safety
"Safety Above All" is not just one of our company values, it is one of our strategic drivers. Our goal is to create a 100% safe work environment for our employees, and we are working towards this by focusing on three areas. First, we are deploying critical leadership behaviors and holding our leaders accountable to drive safety as a value. Second, we are expanding our risk assessment efforts to reduce injuries. Third, we are establishing global safety standards, by aligning our practices and procedures to ensure we are managing our efforts in a unified and consistent way.
COVID-19
Our commitment to safety was evident throughout 2020. We developed our protocols and action plans in response to the COVID-19 pandemic to help support our employees around the globe who were deemed essential. Some of the key actions taken included the following:
•Providing all hourly employees with additional paid sick days;
•Encouraging and providing employees with the flexibility to work from home;
•Adjusting attendance and sick leave policies to encourage those who are symptomatic, sick or who have been exposed to others with COVID-19 or COVID-19 symptoms to stay home;
•Increasing sanitization and cleaning protocols across all locations;
•Conducting regular meetings to review the impacts of the COVID-19 pandemic, including ongoing updates to our health and safety protocols and procedures to address actual and suspected COVID-19 cases and potential exposures;
•Implementing temperature screening of employees and visitors at our manufacturing facilities;
•Establishing social distancing procedures for employees who need to be onsite;
•Providing additional cleaning supplies and personal protective equipment;
•Requiring employees to wear masks in all locations deemed necessary in accordance with local laws; and
•Prohibiting all domestic and international non-essential travel for all employees.
All our facilities manufacture products deemed essential to the critical infrastructure. As a result, during 2020 and currently, our production sites continue to operate during the COVID-19 pandemic.
Diversity, Equity and Inclusion
We are committed to building and developing a diverse workforce and are proud to be an Equal Opportunity Employer. We encourage applications from veterans, minorities, women, and individuals with disabilities. We take pride in our policies that provide equal employment opportunities to all qualified applicants, without regard to race, color, religion, sex, sexual orientation, gender identity, national origin, age, protected veteran or disabled status or genetic information.
Neenah is also proud to establish Employee Resource Groups ("ERGs") to connect employees through shared identity or affinity. These groups are designed to provide networking opportunities for employees and create direct lines of communication between ERGs and leadership to address concerns, mitigate risks and solve problems.
Training and Development
Growing is at the heart of everything we do. Our company cannot grow if our people are not growing. That is why we recently launched a refreshed, consistent and simplified approach to talent management. The platform is called grow@Neenah. It is a framework that helps us set objectives, create a culture of ongoing feedback, differentiate and reward individual performance and create global learning and development opportunities.
We also believe in recognizing our progress and celebrating success throughout our journey. We look for opportunities to identify our company values in action, reinforcing the behaviors we want people to display. When it comes to financial growth, we have harmonized our pay to be equitable based on each person's role in the organization. We are also migrating to an incentive model that allows for more meaningful reward opportunities based on individual contributions and company performance.
Total Rewards
We aspire to be a different company, one that moves faster, thinks differently, and innovates in new ways. We know that our ideas contribute to a larger purpose. Through our efforts, distinctive user experiences are created across multiple categories and sectors. To create these possibilities and growth opportunities for our customers, end-users, and shareholders, we know that we must care for our employees' growth and well-being. To that end, we offer comprehensive benefits and well-being programs that support our employees' physical, financial, and emotional health and wellness. Our tools and resources include preventative services, fitness activities, counseling and educational resources, financial support as well as comprehensive medical, dental and vision coverage. We are committed to helping each employee feel their best so they can be their best.
Environmental, Health and Safety Matters
Our operations are subject to federal, state and local laws, regulations and ordinances relating to various environmental, health and safety matters. We believe our operations are in compliance with, or we are taking actions designed to ensure compliance with, these laws, regulations and ordinances. However, the nature of our operations exposes us to the risk of claims concerning non-compliance with environmental, health and safety laws or standards, and there can be no assurance that material costs or liabilities will not be incurred in connection with those claims. Except for certain orders issued by environmental, health and safety regulatory agencies with which we believe we are in compliance and which we believe are immaterial to our financial condition, results of operations and liquidity, we are not currently named as a party in any judicial or administrative proceeding relating to environmental, health and safety matters.
Greenhouse gas ("GHG") emissions have increasingly become the subject of political and regulatory focus. Concern over potential climate change, including global warming, has led to legislative and regulatory initiatives directed at limiting GHG emissions. In addition to certain federal proposals in the United States to regulate GHG emissions, Germany, the United Kingdom (“U.K.”) and all the states in which we operate are currently considering GHG legislation or regulations, either individually and/or as part of regional initiatives. While not all are likely tosuch proposals will become law, it is reasonably possiblelikely that additional climate change related mandates will be forthcoming, and it is expected that they may adversely impact our costs by increasing energy costs and raw material prices, requiring operational or equipment modifications to reduce emissions and creating costs to comply with regulations or to mitigate the financial consequences of such compliance.
As a company, we work to minimize the amount of fresh water we use at our manufacturing facilities, and to recycle water within a facility as much as practically possible, all while maintaining stringent quality requirements. Due to the high quality achieved through efficient water treatment systems, our mills have the unique opportunity of being able to recycle and reuse fully treated effluent back into our process to minimize fresh water draws. Furthermore, our processes are designed to return the water used in manufacturing at a quality level that does not negatively impact the receiving environment.
While we have incurred in the past several years, and will continue to incur, capital and operating expenditures in order to comply with environmental, health and safety laws, regulations and ordinances, we believe that our future cost of compliance with environmental, health and safety laws, regulations and ordinances, and our exposure to liability for environmental, health and safety claims will not have a material effect on our financial condition, results of operations or liquidity. However, future events, such as changes in existing laws and regulations, new legislation to limit GHG emissions or contamination of sites owned, operated or used for waste disposal by us (including currently unknown contamination and contamination caused by prior owners and operators of such sites or other waste generators) may give rise to additional costs which could have a material effect on our financial condition, results of operations or liquidity.
Our anticipated capital expenditures for environmental projects are not expected to have a material effect on our financial condition, results of operations or liquidity.
Company Structure
Our corporate structure consists of Neenah, Inc. and the following direct wholly-owned subsidiaries.
Neenah, Inc. is a Delaware corporation that holds our trademarks and patents related to all of our U.S. businesses (except Neenah Paper FVC, LLC), all of our U.S. fine paper and packaging inventory, the real estate, mills and manufacturing assets associated with our fine paper and packaging operations in Neenah and Whiting, Wisconsin and all of the equity in our subsidiaries listed below.
Neenah Paper Michigan, Inc. is a Delaware corporation and a wholly-owned subsidiary of Neenah, Inc. that owns the real estate, mill and manufacturing assets associated with our U.S. technical products business in Munising, Michigan.
Neenah Paper FVC, LLC is a Delaware limited liability company and wholly-owned subsidiary of Neenah, Inc. that owns all of the equity of Neenah Paper FR, LLC ("Neenah Paper FR"). Neenah Paper FR is a Delaware limited liability company that owns the real estate, mill and certain manufacturing assets associated with our filtration operation in Appleton, Wisconsin and leases the real estate and owns the manufacturing assets associated with our fine paper and packaging operations in Great Barrington, Massachusetts.
Neenah Paper International Holding Company, LLC is a Delaware limited liability company and wholly-owned subsidiary of Neenah, Inc. that owns all of the equity of Neenah Paper International, LLC ("NP International"). NP International is a Delaware limited liability company that owns all of the equity of Neenah Germany GmbH and in conjunction with Neenah Germany GmbH all of the equity of Neenah Services GmbH & Co. KG.
NPCC Holding Company LLC is a Delaware limited liability company and wholly-owned subsidiary of Neenah, Inc. that owns all of the equity of Neenah Paper Company of Canada ("Neenah Canada"). Neenah Canada is a Nova Scotia unlimited liability corporation that holds certain post-employment liabilities of our former Canadian operations.
Neenah Filtration, LLC is a Delaware limited liability company and wholly-owned subsidiary of Neenah, Inc. that owns all of the equity of Neenah Technical Materials, Inc. ("NTM") and Neenah Filtration Appleton, LLC ("NFA"). NTM is a Massachusetts corporation that owns all of the real estate, mills and manufacturing assets associated with our technical materials business in Pittsfield, Massachusetts. NFA is a Delaware limited liability company that owns certain assets associated with our filtration business in Appleton, Wisconsin.
Neenah FMK Holdings, LLC is a Delaware limited liability company and a wholly-owned subsidiary of Neenah, Inc. that owns all of the equity of ASP FiberMark, LLC ("ASP FiberMark"). ASP FiberMark is a Delaware limited liability company that owns all of the equity of Neenah Northeast, LLC ("NNE") and Neenah International UK Limited ("Neenah UK"). NNE is a Delaware limited liability company that owns certain real estate, mills and manufacturing assets associated with our fine paper and packaging business and technical products business located in Quakertown, Pennsylvania, and Brownville and Lowville, New York. Neenah UK is a United Kingdom limited company that owns all of the equity of Neenah Red Bridge International Limited ("Neenah Red Bridge"). Neenah Red Bridge is a United Kingdom corporation
that owns all of the real estate, manufacturing assets and inventory associated with our technical products business in Bolton, England.
Neenah Global Holdings B.V. is a private company with limited liability organized under the laws of the Netherlands and a wholly-owned subsidiary of Neenah, Inc. that owns all of the equity of Neenah Coldenhove Holding B.V. ("Coldenhove Holding") . Coldenhove Holding is a private company with limited liability organized under the laws of the Netherlands that owns all of the equity of Neenah Coldenhove B.V. ("Neenah Coldenhove") and Coldenhove Know How B.V. ("Coldenhove Know How"). Neenah Coldenhove is a private company with limited liability organized under the laws of the Netherlands that owns substantially all of the real estate, manufacturing assets and inventory associated with our technical products business in Eerbeek, Netherlands. Coldenhove Know How is a private company with limited liability organized under the laws of the Netherlands that owns substantially all of the intellectual property associated with our technical products business in Eerbeek, Netherlands.
Neenah Hong Kong Limited ("Neenah Hong Kong") is a limited liability company organized under the laws of Hong Kong and a wholly-owned subsidiary of Neenah, Inc. Neenah Hong Kong provides certain sales and marketing services to Neenah, Inc. and its affiliated entities and facilitates the financing of our international operations.
Neenah Paper International Finance Company B.V. ("Finco") is a private company with limited liability organized under the laws of the Netherlands and a wholly-owned subsidiary of Neenah, Inc. Finco does not currently have any operations or own any assets.
AVAILABLE INFORMATION
We are subject to the reporting requirements of Section 13(a) or 15(d) of the Securities Exchange Act of 1934. As such, we file annual, quarterly and current reports, proxy statements and other information with the Securities and Exchange Commission ("SEC"). Our SEC filings are available to the public on the SEC's web site at www.sec.gov. You may also read and copy any document we file at the SEC's Public Reference Room located at 100 F Street, N.E., Washington, D.C. 20549. Please call the SEC at 1-800-SEC-0330 for further information on the Public Reference Room. Our common stock is traded on the New York Stock Exchange under the symbol NP."NP". You may inspect the reports, proxy statements and other information concerning us at the offices of the New York Stock Exchange, 20 Broad Street, New York, New York 10005.
Our web site is www.neenah.com. Information on our web site is not incorporated by reference in this document. Our reports on Form 10-K, Form 10-Q and Form 8-K, as well as amendments to those reports, are and will be available free of charge on our web site as soon as reasonably practicable after we file or furnish such reports with the SEC. In addition, you may request a copy of any of these reports (excluding exhibits) at no cost upon written request to us at: Investor Relations, Neenah, Inc., 3460 Preston Ridge Road, Suite 600, Alpharetta, Georgia 30005.
Item 1A. Risk Factors
You should carefully consider each of the following risks and all of the other information contained in this Annual Report on Form 10-K. Some of the risks described below relate principally to our business and the industry in which we operate, while others relate principally to our indebtedness. The remaining risks relate principally to the securities markets generally and ownership of our common stock.
Our business, financial condition, results of operations or liquidity could be materially affected by any of these risks, and, as a result, the trading price of our common stock could decline. The risks described below are not the only ones we face. Additional risks not presently known to us or that we currently deem immaterial may also impair our business operations.
Risks Related to Our Business and Industry
Our financial condition and results of operations have been and are expected to continue to be adversely affected by the recent coronavirus pandemic.
A novel strain of coronavirus, COVID-19, was first identified in Wuhan, China in December 2019, and subsequently declared a pandemic by the World Health Organization. The pandemic and measures taken to contain or mitigate the pandemic have caused, and are continuing to cause, business slowdown or shutdown in affected areas and significant disruption in the financial markets both globally and in the U.S., which has led to a decline in discretionary spending by consumers, which in turn has adversely impacted our business, sales, financial condition and results of operations beginning in the second quarter of 2020. We cannot predict the degree to, or the time period over, which our sales and operations will continue to be affected by this pandemic and preventive measures.
COVID-19 and measures to prevent its spread, including imposition of quarantines and prolonged closures of manufacturing facilities and retail stores, may impact our business in a number of ways. These impacts are expected to include an adverse effect from significantly reduced global economic activity and resulting demand for our products and our customers’ products and, therefore, the products we manufacture. They could also adversely affect our ability to operate our business, including potential disruptions to our supply chain and workforce.
COVID-19 may continue to have a material adverse impact on our business operations and our financial results, including our net sales, earnings and cash flows in the upcoming quarters. We expect the ultimate significance of the impact of these disruptions, including the extent of their adverse impact on our financial results, will be determined by the length of time that such disruptions continue, which will, in turn, depend on the duration of COVID-19 and the impact of governmental regulations or guidelines in response to the pandemic. Although all of our global manufacturing facilities are currently operational and have been designated by governmental authorities as an "essential business", in the future they may be required to curtail or cease production in response to the spread of COVID-19, either in response to changing governmental orders or labor availability. In addition, our customers, distribution partners, service providers or suppliers may experience operational challenges, financial distress, file for bankruptcy protection, go out of business or suffer disruptions in their business due to COVID-19 which would have a material negative impact on our business.
The spread of COVID-19 and the requirements to take action to help limit the spread of the illness, have impacted our ability to carry out our business as usual and materially adversely impacted global economic conditions, our business, results of operations, cash flows and financial condition. Even in those regions where we are beginning to experience business recovery, should those regions fail to fully contain COVID-19 or suffer a COVID-19 relapse, those markets may not recover as quickly or at all, which could have a material adverse effect on our business and results of operations.
To the extent COVID-19 adversely affects our business, results of operations and financial condition, it may also have the effect of heightening many of the other risks described in this section.
Our business will suffer if we are unable to effectively respond to decreased demand for some of our products due to conditions in the global economy, or secular pressures in some markets.markets or consumer preferences.
We have experienced and may experience in the future decreased demand for some of our products due to slowing or negative global economic growth, uncertainty in credit markets, declining consumer and business confidence or preferences, fluctuating commodity prices, increased unemployment and other challenges affecting the global economy. Parts of our fine paper and packaging business are subject to electronic substitution and, for fine paper products in particular, are in secular decline. Our efforts to offset these declines with new fine paper and packaging products and growth in existing fine paper and office products categories are not certain to fully offset the market declines, and an evaluation of the scope of our manufacturing footprint may be required in the future. In addition, our customers may experience deterioration of their businesses, cash flow shortages, and difficulty obtaining financing. If we are unable to implement business strategies to effectively respond to decreased demand for our products, our financial position, cash flows and results of operations would be adversely affected.
Changes in international geopolitical and macro economic conditions generally, and particularly in Germany, could adversely affect our business and results of operations. Fluctuations in the prices of and the demand for products could result in smaller grossreduced profits and lower sales volumes.sales.
Our operating results and business prospects could be adversely affected by risks related to the countries outside the United States in which we have manufacturing facilities or sell our products, including Germany, the Eurozone and the U.K. Downturns in economic activity, adverse tax consequences, fluctuations in the value of local currency versus the U.S. dollar, or any change in social, political, macro economic or labor conditions in any of these countries or regions could negatively affect our financial results.
Historically, economic and market shifts, and fluctuations in capacity have created cyclical changes in prices, sales volume and gross profits for products in the paper, packaging and related industries. The length and magnitude of industry cycles have varied over time and by product, but generally reflect changes in macroeconomic conditions and levels of industry capacity. The overall levels of demand for many of our products reflect fluctuations in levels of end-user demand, which depend in large part on general macroeconomic conditions in North America and regional economic conditions in our markets (including Europe, Asia, and Central and South America), as well as foreign currency exchange rates. The foregoing factors could materially and adversely impact our sales, cash flows, profitability and results of operations.
Additionally, changes to the United States’ participation in, withdrawal out of, renegotiation of certain international trade agreements or other major trade related issues including the non-renewal of expiring favorable tariffs granted to developing countries, tariff quotas, and retaliatory tariffs (including, but not limited to, the current United States administration’sStates' tariffs on China and China's retaliatory tariffs on certain products from the United States), trade sanctions, new or onerous trade restrictions, embargoes and other stringent government controls could have a material adverse effect on our business, results of operations and financial condition.
The availability of and prices incurred for raw materials, energy and transportation services will significantly impact our business.
We purchase a substantial portion of the raw materials, energy, transportation and distribution services (primarily over-the-road freight) and other inputs necessary to produce our products on the open market, and, as a result, the price and other
terms of those purchases are subject to change based on factors such as worldwide supply and demand and government regulation. We do not have significant influence over our raw material, energy or transportation prices and our ability to pass increases in those costs along to our customers through selling price increases may be challenged. We have experienced and may experience in the future significant raw material, energy, transportation and other input cost increases and we may not be able to fully recover these incremental costs through selling price increases or our pricing actions may lag behind due to contractual quarterly adjusters or annual renewals. In addition, we may not be able to recoup other cost increases we may experience, such as those resulting from inflation or from increases in wages or salaries, health care, pension or other employee benefits costs, insurance costs and other costs.
Our technical products business acquires certain of its specialized pulp requirements from two global suppliers and certain critical specialty latex grades from a limited number of suppliers. In general, these supply arrangements are covered by formal contracts and represent multi-year business relationships that have historically been sufficient to meet our needs. We expect these relationships to continue to operate in a satisfactory manner in the future. In the event of an interruption of production at any one supplier, we believe that each of these suppliers individually would be able to satisfy our short-term requirements for specialized pulp or specialty latex. In the event of a long-term disruption in our supply of specialized pulp or specialty latex, we believe we would be able to substitute other pulp grades or other latex grades that would allow us to meet required product performance characteristics and incur only a limited disruption in our production.
Our fine paper and packaging business acquires a substantial majority of the cotton fiber used in the production of certain branded bond paper products pursuant to annual agreements with two North American producers. The balance of our cotton fiber requirements are acquired through spot market purchases from a variety of other producers. We believe that a partial or total disruption in the production of cotton fibers at our two primary suppliers would increase our reliance on spot market purchases with a likely corresponding increase in cost.
Our operating results are likely to fluctuate.
Our operating results are subject to substantial quarterly and annual fluctuations due to a number of factors, many of which are beyond our control. Operating results could be adversely affected by general economic conditions causing a downturn in the market for paper products. Additional factors that could affect our results include, among others, changes in the market price of pulp, other raw materials and distribution/transportation services, the effects of competitive pricing pressures, production capacity levels and manufacturing yields, availability and cost of products from our suppliers, the gain or loss of significant customers, our ability to develop, introduce and market new products and technologies on a
timely basis, changes in the mix of products produced and sold, seasonal customer demand, the relative strength of the Euro versus the U.S. dollar, increasing interest rates and environmental costs. The timing and effect of the foregoing factors are difficult to predict, and these or other factors could materially adversely affect our quarterly or annual operating results.
We face many competitors, several of which have greater financial and other resources.
We face competition in each of our business segments from companies that produce the same type of products that we produce or that produce lower priced alternative products that customers may use instead of our products. Some of our competitors have greater financial, sales and marketing, or research and development resources than we do. Greater financial resources and product development capabilities may also allow our competitors to respond more quickly to new opportunities or changes in customer requirements.
Our businesses are significantly dependent on sales to their largest customers.
Sales to the two largest customerscustomer of the fine paper and packaging business represented approximately 1618 percent and 12 percent, respectively, of its total sales in 2018.2020. Sales to the technical products business's three largest customers combinedcustomer represented approximately 1315 percent of total sales for the segment in 2018.2020. A significant loss of business from any of our major fine paper and packaging or technical products customers maycould have a material adverse effect on our financial condition, results of operations and liquidity. We are also subject to credit risk associated with our customer concentration. If one or more of our largest fine paper and packaging or technical products customers were to become bankrupt, insolvent or otherwise were unable to pay for services provided, we may incur significant write-offs of accounts receivable.
We cannot be certain that our tax planning strategies will be effective and that our research and development tax credits and net operating losses will continue to be available to offset our tax liability.available.
As of December 31, 2018,2020, we had $20.4$28.2 million of U.S. federal and $7.2$7.4 million of U.S. state research and development tax credits ("R&D Credits") which, if not used, will expire between 20292028 and 20382040 for the U.S. federal R&D Credits and between 20202021 and 20332035 for the state R&D Credits. The availability of state net operating losses (NOLs) and federal or state tax
credits to offset taxable income and income tax, respectively, could also be substantially reduced if we were to undergo an "ownership change" as defined within certain federal and state tax codes.
We are continuously undergoing examination by the Internal Revenue Service (the "IRS") as well as taxing authorities in various state and foreign jurisdictions in which we operate. The IRS and other taxing authorities routinely challenge certain deductions and credits reported on our income tax returns. On December 1, 2020, we received notice from the IRS that they will conduct an audit of tax year 2018 in the upcoming year.
In accordance with Accounting Standards Codification ("ASC") Topic 740, Income Taxes ("ASC Topic 740"), as of December 31, 2018,2020, we have recorded a liability of $10.1$8.0 million for uncertain tax positions where we believe it is "more likely than not" that the tax benefit reported on our income tax returns will not be realized. There can be no assurance, however, that the actual amount of unrealized deductions will not exceed the amounts we have recognized for uncertain tax positions.
We have significant obligations for pension and other postretirement benefits.
We have significant obligations for pension and other postretirement benefits which could require future funding beyond that which we have funded in the past or which we currently anticipate. At December 31, 2018,2020, our projected pension benefit obligations were $430.7$531.5 million and exceeded the fair value of pension plan assets by $55.5$67.1 million. In 2018,2020, we made total contributions to qualified pension trusts of $14.1$4.2 million. In addition, during 20182020 we paid pension benefits for unfunded qualified, insurance backed and supplemental retirement plans of $4.1$2.6 million. At December 31, 2018,2020, our projected other postretirement benefit obligations were $42.4$39.8 million. No assets have been set aside to satisfy our other postretirement benefit obligations. In 2018,2020, we made payments for postretirement benefits other than pensions of $4.9$4.7 million. A material increase in funding requirements or benefit payments could have a material effect on our cash flows.
We may be required to pay material amounts under multiemployer pension plans.
Historically, we have contributed to the PACE Industry Union-Management Pension Fund (the “PIUMPF"), a multiemployer pension plan. The amount of our annual contributions to the PIUMPF was negotiated with the plan and the bargaining unit representing our employees covered by the plan. The PIUMPF was certified to be in "critical status" for the plan year beginning January 1, 2010, and continued to be in critical status for the plan year beginning January 1, 2018.
In JuneEffective July 1, 2018, Neenahthe Company and representatives of the United Steelworkers Union (the "USW") of the Lowville mill reached an agreementinitiated actions to withdraw from the PIUMPF, effective July 1, 2018.PIUMPF. As a result, in the second quarter of 2018, weCompany recorded an estimated withdrawal liability of $1.0 million, which assumesassumed payment of $0.1 million per year over 20 years, discounted at a credit adjusted risk-free rate of 5.7 percent.5.7%. In addition toOctober 2019, the Company received a billing from PIUMPF for the withdrawal liability, PIUMPF may also demand paymentwhich confirmed the $1.0 million liability, and the Company began making monthly payments. Further withdrawals by other contributing employers could cause a "mass withdrawal" from, us ofor effectively a pro-rata sharetermination of, the fund's accumulated funding deficiency. Based onPIUMPF which could increase the latest information available from PIUMPF, we estimate the demand of accumulated funding deficiency to be in the range of $1.0 to $1.25 million. We reserve the right to challenge any such demandCompany's withdrawal liability. See Note 7, "Pension and believes this demand is unenforceable. As such, we have not recorded a liabilityOther Postretirement Benefits" for this amount as of December 31, 2018.
The outcome of legal actions and claims may adversely affect us.
We are involved in legal actions and claims arising in the ordinary course of our business. The outcome of such legal actions and claims against us cannot be predicted with certainty. Legal actions and claims against us could have a material effect on our financial condition, results of operations and liquidity.further discussion.
Labor interruptions would adversely affect our business.
Except for our Pittsfield, Massachusetts, Brownville, New York and Quakertown, Pennsylvania manufacturing facilities which are non-union, substantially all of our hourly employees are unionized. In addition, some key customers and suppliers are also unionized. Strikes, lockouts or other work stoppages or slowdowns involving our unionized employees, and/or those of our suppliers and customers, could have a material effect on us.
If we are unable to continue to implement our business strategies, our financial condition and operating results could be materially affected.
Our future operating results will depend, in part, on the extent to which we can successfully implement our business strategies, including expansion and growth of our technical products (filtration and performance materials) and packaging businesses in a cost effective manner. Additionally, a slower than anticipated loadingramp-up of our filtration asset in Appleton, Wisconsin due to the pace of certification of products by our customers could cause our results to be lower than expected in the future. Our strategies are subject to significant business, economic and competitive uncertainties and contingencies,
many of which are beyond our control. If we are unable to successfully implement our business strategies, our business, financial condition and operating results could be materially adversely affected.
We may not successfully integrate acquisitions and may be unable to achieve anticipated cost savings or other synergies.
The integration of the operations of acquired companies involves a number of risks and presents financial, managerial, legal and operational challenges. We may have difficulty, and may incur unanticipated expenses related to, integrating information systems, financial reporting activities, and integrating and retaining management and personnel from acquired companies. We may not be able to achieve anticipated cost savings or commercial or growth synergies, for a number of reasons, including contractual constraints and obligations or an inability to take advantage of expected commercial opportunities, increased operating efficiencies or commercial expansion of key technologies. Failure to successfully integrate acquired companies may have an adverse effect on our business, financial condition, results of operations, and cash flows.
We may not be able to adequately protect our intellectual property and proprietary rights, which could harm our future success and competitive position.
Our future success and competitive position also depends, in part, upon our ability to obtain and maintain protection for our intellectual property and proprietary rights. Failure to protect our existing intellectual property rights may result in the loss of valuable technologies or may require us to license other companies' intellectual property rights. It is possible that any of our patents may be invalidated, rendered unenforceable, circumvented, challenged or licensed to others or any of our pending or future patent applications may not be issued within the scope of the claims sought by us, if at all. Further, others may develop technologies that are similar or superior to our technologies, duplicate our technologies or design around our patents, and steps taken by us to protect our technologies may not prevent misappropriation of such technologies.
Future dividends on our common stock may be restricted or eliminated.
Dividends are declared at the discretion of our Board of Directors, and future dividends will depend on our future earnings, cash flow, financial requirements and other factors. Our ability to pay cash dividends on our common stock is limited under the terms of both our bank credit agreement and the indenture for our $175 million of senior notes due November 2021 (the "2021 Senior Notes"). As of December 31, 2018, underagreements. Under the most restrictive terms of our bank credit agreement and the indenture for the 2021 Senior Notes,agreements, our ability to pay cash dividends on our common stock is limited, as described under "Risks Relating to Our Indebtedness." There can be no assurance that we will continue to pay dividends in the future.
We may be required to record a charge to our earnings if our goodwill or intangible assets become impaired.
As of December 31, 2018,2020, we had goodwill of $84.0$87.4 million and other intangible assets of $70.7$62.6 million. Goodwill and other intangible assets are recorded at fair value on the date of acquisition. In accordance with applicable accounting
guidance, we review goodwill and other indefinite-lived intangible assets at least annually for impairment, and long-lived intangible assets when facts and circumstances warrant an impairment review. Impairment may result from, among other things, deterioration in performance, adverse market conditions, acceleration of the secular decline in fine paper and office products or a lack of success in our efforts to offset these declines with new fine paper and packaging products, which could lead to a reduction in the size of our manufacturing footprint, adverse changes in applicable laws or regulations, and a variety of other factors. The amount of any non-cash impairment would be recognized immediately through our consolidated statement of operations. Any future goodwill or other intangible asset impairment could have a material adverse effect on our results of operations and financial position.
If we have a catastrophic loss or unforeseen or recurring operational problems at any of our facilities, we could suffer significant lost production and/or cost increases.
Our technical products and fine paper and packaging businesses may suffer catastrophic loss due to fire, flood, terrorism, mechanical failure, or other natural or man-made events. If any of our facilities were to experience a catastrophic loss, it could disrupt our operations, delay production, delay or reduce shipments, reduce revenue, and result in significant expenses to repair or replace the facility. These expenses and losses may not be adequately covered by property or business interruption insurance. Even if covered by insurance, our inability to deliver our products to customers, even on a short-term basis, may cause us to lose market share on a more permanent basis.
Fluctuations in currency exchange rates could adversely affect our results.
Exchange rate fluctuations for the Euro do not have a material effect on the operations or cash flows of our German and Dutch technical products businesses. Our German and Dutch technical products business incurs most of its costs and sells most of its production in Europe and, therefore, its operations and cash flows are not materially affected by changes in the exchange rate of the Euro relative to the U.S. dollar. Changes in the Euro exchange rate relative to the U.S. dollar will, however, have an effect on our balance sheet and reported results of operations. See Item 7A, "Quantitative and Qualitative Disclosures About Market Risk — Foreign Currency Risk."
In addition, because we transact business in other foreign countries, some of our revenues and expenses are denominated in a currency other than the local currency of our operations. As a result, changes in exchange rates between the currency in which the transaction is denominated and the local currency of our operations into which the transaction is being recorded can impact the amount of local currency recorded for such transaction. This can result in more or less local currency revenues or costs related to such transaction, and thus have an effect on our reported sales and income before income taxes.
Our activities are subject to extensive government regulation, which could increase our costs, cause us to incur liabilities and adversely affect the manufacturing and marketing of our products.
Our operations are subject to federal, state and local laws, regulations and ordinances in the United States, the U.K., Germany, the Netherlands and elsewhere in the world relating to various environmental, health and safety matters. The nature of our operations requires that we invest capital and incur operating costs to comply with those laws, regulations and ordinances and exposes us to the risk of claims concerning non-compliance with environmental, health and safety laws or standards. We cannot assureThere is no assurance that significant additional expenditures will not be required to maintain compliance with, or satisfy potential claims arising from, such laws, regulations and ordinances. Future events, such as changes in existing laws and regulations or contamination of sites owned, operated or used for waste disposal by us (including currently unknown contamination and contamination caused by prior owners and operators of such sites or other waste generators) may give rise to additional costs that could require significantly higher capital expenditures and operating costs, which would reduce the funds otherwise available for operations, capital expenditures, future business opportunities or other purposes.
Additionally, in the U.S., portions of the Moving Ahead for Progress in the 21st Century Act (“MAP-21”, primarily, the electronic logging device (ELD) rules under MAP-21) have created a decrease inreduced levels of capacity in the over-the-road freight sector which couldcontinue to have an adverse impact on our business. The current operating environment in the over-the-road freight and transportation sector resulting from fluctuating fuel costs, industry-specific regulations (such as hours-of-service and ELD rules), a shortage of qualified drivers, and other economic factors are causing a tightening of capacity and an increase in prices charged to shippers, such as us, in the over-the-road transportation and distribution sector generally, and in our carrier networks specifically, which couldcontinue to have an adverse impact on our business.
We are subject to risks associated with possible climate change legislation and various cost and manufacturing issues associated with such legislation.
GHG emissions have increasingly become the subject of political and regulatory focus. Concern over potential climate change, including global warming, has led to legislative and regulatory initiatives directed at limiting GHG emissions. In addition to certain federal proposals to regulate GHG emissions in the United States, to regulate GHG emissions, Germany, the U.K. and all the states in which we operate are currently considering GHG legislation or regulations, either individually and/or as part of regional initiatives. While not all are likely to become law, it is reasonably possible that additional climate change related mandates will likely be forthcoming, and it is expected that they may adversely impact our costs by increasing energy costs and raw material prices, requiring operational or equipment modifications to reduce emissions and creating costs to comply with regulations or to mitigate the financial consequences of compliance.
Any failure to comply with applicable environmental laws, regulations or permit requirements may result in civil or criminal fines or penalties or enforcement actions. These may include regulatory or judicial orders enjoining or curtailing operations or requiring corrective measures, installing pollution control equipment or remedial actions, any of which could involve significant expenditures. Future development of such laws and regulations may require capital expenditures to ensure compliance. We may discover currently unknown environmental problems or conditions in relation to our past or present operations, or we may face unforeseen environmental liabilities in the future. These conditions and liabilities may require site remediation or other costs to maintain compliance or correct violations of environmental laws and regulations; or result in governmental or private claims for damage to person, property or the environment, any of which could have a material adverse effect on our financial condition and results of operations.
Risks Relating to Our Indebtedness
We may not be able to fund our future capital requirements internally or obtain third-party financing.
We may be required or choose to obtain additional debt or equity financing to meet our future working capital requirements, as well as to fund capital expenditures and acquisitions. To the extent we must obtain financing from external sources to fund our capital requirements, we cannot guarantee financing will be available on favorable terms, if at all. For example, during periods of volatile credit markets, there is a risk that lenders, even those with strong balance sheets and sound lending practices, could fail or refuse to honor their credit commitments and obligations, including, but not limited to, extending credit up to the maximum permitted by a credit facility and otherwise accessing capital and/or honoring loan commitments. If our lenders are unable to fund borrowings under their loan commitments or we are unable to borrow, it could be difficult to replace such loan commitments on similar terms or at all. If adequate funds are not available on acceptable terms, we may be unable to meet our future working capital requirements or fund capital expenditures and acquisitions, any of which could negatively affect our business. As of December 31, 2020, we have required debt payments of $4.9 million during the year ending December 31, 2021.
We may not be able to generate sufficient cash flow to meet our debt obligations.
Our ability to make scheduled payments or to refinance our debt and other liabilities will depend on our financial and operating performance, which, in turn, is subject to prevailing economic conditions and to certain financial, business and other factors beyond our control. If our cash flow and capital resources are insufficient to fund our debt obligations and other liabilities, we could face substantial liquidity problems and may be forced to reduce or delay scheduled expansions and capital expenditures, sell material assets or operations, obtain additional capital or restructure our debt. There can be no assurance that our operating performance, cash flow and capital resources will be sufficient to repay our debt in the future. In the event that we are required to dispose of material assets or operations or restructure our debt to meet our debt and other obligations, there can be no assurances as to the terms or timing of any such transaction.
If we cannot make scheduled payments on our debt, we will be in default and, as a result:
•our debt holders could declare all outstanding principal and interest to be due and payable;
•our senior secured lenders could terminate their commitments and commence foreclosure proceedings against our assets; and
•we could be forced into bankruptcy or liquidation.
If our operating performance declines in the future or we breach our covenants under our credit agreements, we may need to obtain waivers from the lenders to avoid being in default. We may not be able to obtain these waivers. If this occurs, we would be in default under our credit agreements.
We have significant indebtedness which subjects us to restrictive covenants relating to the operation of our business.
As of December 31, 2020, we had $199 million of debt under our Term B Facility, no revolving credit borrowings and $5 million of project financing outstanding. In addition, availability under our Global Revolving Credit Facility was approximately $139 million. Our leverage could have important consequences. For example, it could:
•make it difficult for us to satisfy our financial obligations, including making scheduled principal and interest payments on the Term Loan B and our other indebtedness;
•place us at a disadvantage to our competitors;
•require us to dedicate a substantial portion of our cash flow from operations to service payments on our indebtedness, thereby reducing funds available for other purposes;
•increase our vulnerability to a downturn in general economic conditions or the industry in which we operate;
•limit our ability to obtain additional financing for working capital, capital expenditures, acquisitions and general corporate and other purposes; and
•limit our ability to plan for and react to changes in our business and the industry in which we operate.
The terms of our indebtedness, contain covenants restricting our ability to, among other things, incur certain additional debt, incur or create certain liens, make specified restricted payments, pay dividends, authorize or issue capital stock, enter into transactions with our affiliates, consolidate or merge with or acquire another business, sell certain of our assets or liquidate, dissolve or wind-up our Company. Under the terms of our Fourth Amended and Restated Credit Agreement, we are permitted to pay cash dividends on or repurchase shares of our common stock, and to make voluntary prepayments or redemptions of certain indebtedness, without limitation, as long as the sum of the aggregate revolving credit availability under our Fourth Amended and Restated Credit Agreement as then in effect, plus (subject to certain limitations) any excess of our aggregate borrowing base over our aggregate revolving credit facility commitment, or our “specified excess availability” (on a pro forma basis after giving effect to such dividend, repurchase or voluntary prepayment/redemption), equals or exceeds the greater of (i) $20 million and (ii) 12.5 percent of the maximum aggregate commitments under our Global Revolving Credit Facility as then in effect. If our specified excess availability, on a pro forma basis, is less than the applicable threshold, then such cash dividends are limited to no more than $45 million in any 12 consecutive months, such share repurchases are limited to no more than $25 million in any fiscal year, and voluntary prepayments or redemptions of such indebtedness are prohibited. Refer to Item 7, "Management's Discussion and Analysis of Financial Condition and Results of Operations - Liquidity and Capital Resources" for the current limitations on our ability to pay dividends on or repurchase shares of our common stock.
In addition, if the specified excess availability under our Global Revolving Credit Facility is less than the greater of (i) $20 million and (ii) 12.5 percent of the maximum aggregate commitments under our Global Revolving Credit Facility as then in effect, we will be subject to increased reporting obligations and controls until such time as availability is more than the greater of (a) $25 million and (b) 17.5 percent of the maximum aggregate commitments under our Global Revolving Credit Facility as then in effect for at least 60 consecutive days and no default or event of default has occurred or is continuing during such 60-day period.
If specified excess availability under our Global Revolving Credit Facility is less than the greater of (i) $15 million and (ii) 10 percent of the maximum aggregate commitments under our Global Revolving Credit Facility as then in effect, we are required to comply with a fixed charge coverage ratio (as defined in our bank credit agreement) of not less than 1.1 to 1.0 for the preceding four-quarter period, tested as of the end of each quarter. Such compliance, once required, would no longer be necessary once (x) specified excess availability under our Global Revolving Credit Facility exceeds the greater of (i) 17.5 percent of the aggregate commitment for our Global Revolving Credit Facility as then in effect and (ii) $25 million for 60 consecutive days and (y) no default or event of default has occurred and is continuing during such 60-day period. As of December 31, 2020, specified excess availability under our revolving credit facility exceeded the minimum required amount, and we are not required to comply with such fixed charge coverage ratio.
Subject to certain exceptions, our Term Loan Credit Agreement contains provisions requiring mandatory prepayment of the term loan obligations from (a) net cash proceeds from non-ordinary course sales or other dispositions of assets, (b) net cash proceeds from the issuances of debt by the Company and its subsidiaries, and (c) the Excess Cash Flow of the Company and its subsidiaries. Under the terms of the Term Loan Credit Agreement, mandatory prepayments of the Term B Facility may not be reborrowed, thereby reducing funds available for other purposes. For more information on our liquidity, see Item 7, "Management's Discussion and Analysis of Financial Condition and Results of Operations — Liquidity and Capital Resources."
Changes in interest rates or the phaseout of LIBOR may significantly increase our borrowing costs.
Our Global Revolving Credit Facility and Term B Facility accrue interest at variable rates. As of December 31, 2020, we had no borrowings outstanding under our Global Revolving Credit Facility which matures on December 10, 2023 and $199 million of term loan borrowings which mature on June 30, 2027. We may reduce our exposure to rising interest rates by entering into interest rate hedging arrangements, although those arrangements may result in us incurring higher interest expenses than we would incur without the arrangements. If interest rates increase in the absence of such arrangements, we will need to dedicate more of our cash flow from operations to make payments on our debt. In addition, the variable interest rates on our Global Revolving Credit Facility and Term B Loan are based on LIBOR as a benchmark. LIBOR is the subject of national, international and other regulatory guidance and proposals for reform. In 2017, the United Kingdom's Financial Conduct Authority the "FCA"), which regulates LIBOR, announced that it intends to phase out LIBOR. On November 30, 2020 the administrator of LIBOR, with the support of the United States Federal Reserve and the FCA, announced plans to consult on ceasing publication of LIBOR on December 31, 2021 for only the one week and two month LIBOR tenors, and on June 30, 2023 for all other LIBOR tenors. While this announcement extends the transition period to June 2023, the United States Federal Reserve concurrently issued a statement advising banks to stop new LIBOR issuances by the end of 2021. In light of these recent announcements, the future of LIBOR at this time is uncertain and any changes in the methods by which LIBOR is determined or regulatory activity related to LIBOR’s phaseout could cause LIBOR to perform differently than in the past or cease to exist. The consequences of these developments cannot be entirely predicted, but could include an increase in the cost of our variable rate borrowings.
Our failure to comply with the covenants contained in our Credit Agreements could result in an event of default that could cause acceleration of our indebtedness.
Our failure to comply with the covenants and other requirements contained in the credit agreements or our other debt instruments could cause an event of default under the relevant debt instrument. The occurrence of an event of default could trigger a default under our other debt instruments, prohibit us from accessing additional borrowings and permit the holders of the defaulted debt to declare amounts outstanding with respect to that debt to be immediately due and payable. Our assets or cash flows may not be sufficient to fully repay borrowings under our outstanding debt instruments, and we may be unable to refinance or restructure the payments on indebtedness on favorable terms, or at all.
Despite our indebtedness levels, we and our subsidiaries may be able to incur substantially more indebtedness, which may increase the risks created by our substantial indebtedness.
Because the terms of our credit agreements do not fully prohibit us or our subsidiaries from incurring additional indebtedness, we and our subsidiaries may be able to incur substantial additional indebtedness in the future, some of which may be secured. If we or any of our subsidiaries incur additional indebtedness, the related risks that we and they face may intensify.
Our credit agreements are secured by a majority of our assets.
Our principal credit agreements are secured by a majority of our assets. Availability under our Global Revolving Credit Facility will fluctuate over time depending on the value of our inventory, receivables and various capital assets. An extended work stoppage or decline in sales volumes would result in a decrease in the value of the assets securing the Global Revolving Credit Facility. A reduction in availability under the Global Revolving Credit Facility could have a material effect on our liquidity.
Changes in credit ratings issued by nationally recognized statistical rating organizations could adversely affect our cost of financing and have an adverse effect on the market price of our securities.
There can be no assurance that any rating assigned by the rating agencies will remain in effect for any given period of time or that a rating will not be lowered or withdrawn entirely by a rating agency if, in that rating agency's judgment, future circumstances relating to the basis of the rating, such as adverse changes, so warrant. A lowering or withdrawal of the ratings assigned to our debt securities by rating agencies may increase our future borrowing costs and reduce our access to capital, which could have a material adverse impact on our financial condition and results of operations.
We depend on our subsidiaries to generate cash flow to meet our debt service obligations.
We conduct a substantial portion of our business through our subsidiaries. Consequently, our cash flow and ability to service our debt obligations depend upon the earnings of our subsidiaries and the distribution of those earnings to us, or upon loans, advances or other payments made by these entities to us. The ability of these entities to pay dividends or make
other payments or advances to us will be subject to applicable laws and contractual restrictions contained in the instruments governing their debt, including our credit agreements. These limitations are also subject to important exceptions and qualifications.
The ability of our subsidiaries to generate sufficient cash flow from operations to allow us to make scheduled payments on our debt will depend upon their future financial performance, which will be affected by a range of economic, competitive and business factors, many of which are outside of our control as well as their ability to repatriate cash to us. If our subsidiaries do not generate sufficient cash flow from operations to help us satisfy our debt obligations, or if they are unable to distribute sufficient cash flow to us, we may have to undertake alternative financing plans, such as refinancing or restructuring our debt, selling assets, reducing or delaying capital expenditures or seeking to raise additional capital. Refinancing may not be possible, and any assets may not be saleable, or, if sold, we may not realize sufficient amounts from those sales. Additional financing may not be available on acceptable terms, if at all, or we may be prohibited from incurring it, if available, under the terms of our various debt instruments then in effect. Our inability to generate sufficient cash flow to satisfy our debt obligations or to refinance our obligations on commercially reasonable terms would have an adverse effect on our business, financial condition and results of operations.
General Risk Factors
The outcome of legal actions and claims may adversely affect us.
We are involved in legal actions and claims arising in the ordinary course of our business. The outcome of such legal actions and claims against us cannot be predicted with certainty. Legal actions and claims against us could have a material effect on our financial condition, results of operations and liquidity.
We are subject to cybersecurity risks related to breaches of security pertaining to sensitive company, customer, employee and vendor information as well as breaches in the technology that manages operations and other business processes.
We use information technologies to securely manage operations and various business functions. We rely on various technologies to process, store and report on our business and interact with customers, vendors and employees. The secure processing, maintenance and transmission of this information is critical to our operations and business strategy. Despite our security design and controls, and those of our third party providers, our information technology and infrastructure may be vulnerable to cyber attacks by hackers or breaches due to employee error, malfeasance or other disruptions. Any such breach could result in operational disruptions or the misappropriation of sensitive data that could subject us to civil and criminal penalties, litigation or have a negative impact on our reputation. There can be no assurance that such disruptions or misappropriations and the resulting repercussions will not negatively impact our cash flows and materially affect our results of operations or financial condition. The U.S. Congress is considering cybersecurity legislation that, if enacted, could impose additional obligations on us and could expand our potential liability in the event of a cyber-securitycybersecurity incident.
Additionally, we collect, process, store, use and transmit personal data for use in our business, most of which relates to our global employees. Personal data is increasingly subject to legal and regulatory protections around the world, which vary widely in approach and which possibly conflict with one another. As discussed above, in recent years, U.S. legislators and regulatory agencies, such as the Federal Trade Commission, as well as U.S. states, have increased their focus on protecting personal data by law and regulation, and have increased enforcement actions for violations of privacy and data protection requirements. The European Commission also recently approved and adopted the General Data Protection Regulation ("GDPR"), which became effective in the European Union a new data protection law, which became effective in May 2018. These data protection laws and regulations are2018 intended to protect the privacy and security of personal data, including credit card information that is collected, processed and transmitted in or from the relevant jurisdiction. Implementation of and compliance with these laws and regulations may be more costly or take longer than we anticipate, or could otherwise adversely affect our business operations, which could negatively impact our financial position or cash flows. Additionally, media coverage of data breaches has escalated, in part because of the increased number of enforcement actions, investigations and lawsuits. As this focus and attention on privacy and data protection increases, we also risk exposure to potential liabilities and costs resulting from the compliance with, or any failure to comply with applicable legal requirements, conflicts among these legal requirements or differences in approaches to privacy and security of data. Our business could be materially adversely affected by our inability, or the inability of our vendors who receive personal data from us, to comply with legal obligations regarding the use of personal data, new data handling requirements that conflict with or negatively impact our business practices.
Our business may suffer if we do not retain our senior management.
We depend on our senior management. The loss of services of members of our senior management team could adversely affect our business until suitable replacements can be found. There may be a limited number of personscandidates with the requisite skills to serve in these positions and we may be unable to locate or employ qualified personnel on acceptable terms. In addition, our future success requires us to continue to attract and retain competent personnel.
Risks Relating to Our Indebtedness
We may not be able to fund our future capital requirements internally or obtain third-party financing.
We may be required or choose to obtain additional debt or equity financing to meet our future working capital requirements, as well as to fund capital expenditures and acquisitions. To the extent we must obtain financing from external sources to fund our capital requirements, we cannot guarantee financing will be available on favorable terms, if at all. As of December 31, 2018, we have required debt payments of $2.3 million during the year ending December 31, 2019.
We may not be able to generate sufficient cash flow to meet our debt obligations, including the 2021 Senior Notes.
Our ability to make scheduled payments or to refinance our obligations with respect to the 2021 Senior Notes, our other debt and our other liabilities will depend on our financial and operating performance, which, in turn, is subject to prevailing economic conditions and to certain financial, business and other factors beyond our control. If our cash flow and capital resources are insufficient to fund our debt obligations and other liabilities, we could face substantial liquidity problems and may be forced to reduce or delay scheduled expansions and capital expenditures, sell material assets or operations, obtain additional capital or restructure our debt. We cannot assure that our operating performance, cash flow and capital resources will be sufficient to repay our debt in the future. In the event that we are required to dispose of material assets or operations
or restructure our debt to meet our debt and other obligations, we can make no assurances as to the terms of any such transaction or how quickly any such transaction could be completed.
If we cannot make scheduled payments on our debt, we will be in default and, as a result:
our debt holders could declare all outstanding principal and interest to be due and payable;
our senior secured lenders could terminate their commitments and commence foreclosure proceedings against our assets; and
we could be forced into bankruptcy or liquidation.
If our operating performance declines in the future or we breach our covenants under our revolving credit facility, we may need to obtain waivers from the lenders under our revolving credit facility to avoid being in default. We may not be able to obtain these waivers. If this occurs, we would be in default under our revolving credit facility.
We have significant indebtedness which subjects us to restrictive covenants relating to the operation of our business.
As of December 31, 2018, we had $175 million of 2021 Senior Notes, $57.9 million in revolving credit borrowings and $9.7 million of project financing outstanding. In addition, availability under our bank credit agreement was approximately $154 million. Our leverage could have important consequences. For example, it could:
make it difficult for us to satisfy our financial obligations, including making scheduled principal and interest payments on the 2021 Senior Notes and our other indebtedness;
place us at a disadvantage to our competitors;
require us to dedicate a substantial portion of our cash flow from operations to service payments on our indebtedness, thereby reducing funds available for other purposes;
increase our vulnerability to a downturn in general economic conditions or the industry in which we operate;
limit our ability to obtain additional financing for working capital, capital expenditures, acquisitions and general corporate and other purposes; and
limit our ability to plan for and react to changes in our business and the industry in which we operate.
The terms of our indebtedness, including our bank credit agreement and the indenture governing the 2021 Senior Notes, contain covenants restricting our ability to, among other things, incur certain additional debt, incur or create certain liens, make specified restricted payments, pay dividends, authorize or issue capital stock, enter into transactions with our affiliates, consolidate or merge with or acquire another business, sell certain of our assets or liquidate, dissolve or wind-up our Company. Under the terms of our Fourth Amended and Restated Credit Agreement, we are permitted to pay cash dividends on or repurchase shares of our common stock, and to make voluntary prepayments or redemptions of certain indebtedness (including our 2021 Senior Notes), without limitation, as long as the sum of the aggregate revolving credit availability under our Fourth Amended and Restated Credit Agreement as then in effect, plus (subject to certain limitations) any excess of our aggregate borrowing base over our aggregate revolving credit facility commitment, or our “specified excess availability” (on a pro forma basis after giving effect to such dividend, repurchase or voluntary prepayment/redemption), equals or exceeds the greater of (i) $25 million and (ii) 12.5 percent of the maximum aggregate commitments under our revolving credit facility as then in effect (currently $28 million). If the specified excess availability is below that amount, then such cash dividends are limited to no more than $45 million in any 12 consecutive months, such share repurchases are limited to no more than $25 million in any fiscal year, and voluntary prepayments or redemptions of such indebtedness are prohibited. Under the most restrictive terms of the 2021 Senior Notes, we are permitted to pay cash dividends of up to $25 million in a calendar year, but not permitted to repurchase shares of our common stock. However, as long as the net leverage ratio (net debt/EBITDA) under the 2021 Senior Notes is below 2.5x, we can pay dividends or repurchase shares without limitation. Refer to Item 7, "Management's Discussion and Analysis of Financial Condition and Results of Operations — Liquidity and Capital Resources" for the current limitations on our ability to pay dividends on or repurchase shares of our common stock.
In addition, if the specified excess availability under our revolving credit facility is less than the greater of (i) $25 million and (ii) 12.5 percent of the maximum aggregate commitments under our revolving credit facilities as then in effect, we will be subject to increased reporting obligations and controls until such time as availability is more than the greater of (a) $35 million and (b) 17.5 percent of the maximum aggregate commitments under our revolving credit facility as then in
effect for at least 60 consecutive days and no default or event of default has occurred or is continuing during such 60-day period.
If specified excess availability under our revolving credit facilities is less than the greater of (i) $20 million and (ii) 10 percent of the maximum aggregate commitments under our revolving credit facilities as then in effect, we are required to comply with a fixed charge coverage ratio (as defined in our bank credit agreement) of not less than 1.1 to 1.0 for the preceding four-quarter period, tested as of the end of each quarter. Such compliance, once required, would no longer be necessary once (x) specified excess availability under our revolving credit facilities exceeds the greater of (i) 17.5 percent of the aggregate commitment for our revolving credit facility as then in effect and (ii) $35 million for 60 consecutive days and (y) no default or event of default has occurred and is continuing during such 60-day period. As of December 31, 2018, specified excess availability under our revolving credit facility exceeded the minimum required amount, and we are not required to comply with such fixed charge coverage ratio.
Our revolving credit facility accrues interest at variable rates. As of December 31, 2018, we had $57.9 million of revolving credit borrowings outstanding which mature on December 10, 2023. We may reduce our exposure to rising interest rates by entering into interest rate hedging arrangements, although those arrangements may result in us incurring higher interest expenses than we would incur without the arrangements. If interest rates increase in the absence of such arrangements, we will need to dedicate more of our cash flow from operations to make payments on our debt. For more information on our liquidity, see Item 7A, "Management's Discussion and Analysis of Financial Condition and Results of Operations — Liquidity and Capital Resources."
Our failure to comply with the covenants contained in our revolving credit facility or the indenture governing the 2021 Senior Notes could result in an event of default that could cause acceleration of our indebtedness.
Our failure to comply with the covenants and other requirements contained in the indenture governing the 2021 Senior Notes, our revolving credit facility or our other debt instruments could cause an event of default under the relevant debt instrument. The occurrence of an event of default could trigger a default under our other debt instruments, prohibit us from accessing additional borrowings and permit the holders of the defaulted debt to declare amounts outstanding with respect to that debt to be immediately due and payable. Our assets or cash flows may not be sufficient to fully repay borrowings under our outstanding debt instruments, and we may be unable to refinance or restructure the payments on indebtedness on favorable terms, or at all.
Despite our indebtedness levels, we and our subsidiaries may be able to incur substantially more indebtedness, which may increase the risks created by our substantial indebtedness.
Because the terms of our bank credit agreement and the indenture governing the 2021 Senior Notes do not fully prohibit us or our subsidiaries from incurring additional indebtedness, we and our subsidiaries may be able to incur substantial additional indebtedness in the future, some of which may be secured. If we or any of our subsidiaries incur additional indebtedness, the related risks that we and they face may intensify.
Our bank credit agreement is secured by a majority of our assets.
Our bank credit agreement is secured by a majority of our assets. Availability under our bank credit agreement will fluctuate over time depending on the value of our inventory, receivables and various capital assets. An extended work stoppage or decline in sales volumes would result in a decrease in the value of the assets securing the bank credit agreement. A reduction in availability under the bank credit agreement could have a material effect on our liquidity.
Changes in credit ratings issued by nationally recognized statistical rating organizations could adversely affect our cost of financing and have an adverse effect on the market price of our securities.
Our debt currently has a non-investment grade rating, and there can be no assurance that any rating assigned by the rating agencies will remain for any given period of time or that a rating will not be lowered or withdrawn entirely by a rating agency if, in that rating agency's judgment, future circumstances relating to the basis of the rating, such as adverse changes, so warrant. A lowering or withdrawal of the ratings assigned to our debt securities by rating agencies may increase our future borrowing costs and reduce our access to capital, which could have a material adverse impact on our financial condition and results of operations.
We depend on our subsidiaries to generate cash flow to meet our debt service obligations.
We conduct a substantial portion of our business through our subsidiaries. Consequently, our cash flow and ability to service our debt obligations depend upon the earnings of our subsidiaries and the distribution of those earnings to us, or
upon loans, advances or other payments made by these entities to us. The ability of these entities to pay dividends or make other payments or advances to us will be subject to applicable laws and contractual restrictions contained in the instruments governing their debt, including our revolving credit facility and the indenture governing the 2021 Senior Notes. These limitations are also subject to important exceptions and qualifications.
The ability of our subsidiaries to generate sufficient cash flow from operations to allow us to make scheduled payments on our debt will depend upon their future financial performance, which will be affected by a range of economic, competitive and business factors, many of which are outside of our control as well as their ability to repatriate cash to us. If our subsidiaries do not generate sufficient cash flow from operations to help us satisfy our debt obligations, including payments on the 2021 Senior Notes, or if they are unable to distribute sufficient cash flow to us, we may have to undertake alternative financing plans, such as refinancing or restructuring our debt, selling assets, reducing or delaying capital expenditures or seeking to raise additional capital. Refinancing may not be possible, and any assets may not be saleable, or, if sold, we may not realize sufficient amounts from those sales. Additional financing may not be available on acceptable terms, if at all, or we may be prohibited from incurring it, if available, under the terms of our various debt instruments then in effect. Our inability to generate sufficient cash flow to satisfy our debt obligations or to refinance our obligations on commercially reasonable terms would have an adverse effect on our business, financial condition and results of operations.
FORWARD-LOOKING STATEMENTS
Certain statements in this Annual Report on Form 10-K may constitute "forward-looking" statements as defined in Section 27A ofunder the Securities Act of 1933 (the "Securities Act"), Section 21E of the Securities Exchange Act of 1934 (the "Exchange Act"), the Private Securities Litigation Reform Act of 1995 (the "PSLRA"), or in releases made by the SEC, all as may be amended from time to time.federal securities laws. Statements contained in this Annual Report on Form 10-K that are not historical facts may be forward-looking statements within the meaning of the PSLRA.federal securities laws. Any such forward-looking statements reflect our beliefs and assumptions and are based on information currently available to us. Forward-looking statements are only predictions and involve known and unknown risks, uncertainties and other factors that may cause our actual results, performance or achievements, or industry results, to be materially different from any future results, performance or achievements expressed or implied by such forward-looking statements. These cautionary statements are being made pursuant to the Securities Act, the Exchange Act and the PSLRA with the intention of obtaining the benefits of the "safe harbor" provisions of suchfor forward-looking statements under the federal securities laws. We caution investors that any forward-looking statements we make are not guarantees or indicative of future performance. For additional information regarding factors that may cause our results of operations to differ materially from those presented herein, please see "Risk Factors" contained in this Annual Report on Form 10-K and as are detailed from time to time in other reports we file with the SEC.
You can identify forward-looking statements as those that are not historical in nature, particularly those that use terminology such as "may," "will," "should," "expect," "anticipate," "contemplate," "estimate," "believe," "plan," "project," "predict," "potential" or "continue," or the negative of these, or similar terms. In evaluating these forward-looking statements, you should consider the following factors, as well as others contained in our public filings from time to time, which may cause our actual results to differ materially from any forward-looking statement:
•changes in market demand for our products;products due to global economic and political conditions;
•the impact of competition, both domestic and international, changes in industry production capacity, including the construction of new mills or new machines, the closing of mills and incremental changes due to capital expenditures or productivity increases;
•the loss of current customers or the inability to obtain new customers;
•increases in commodity prices, (particularly for pulp, energy and latex);
our ability to successfully implement price increases for our products;
•our ability to control costs, including transportation, and implement measures designed to enhance operating efficiencies;
•the availability of raw materials and energy;
•the enactment of adverse state, federal or foreign tax or other legislation or changes in government policy or regulation, including the recent Tax Act;regulation;
•the impact of increased trade protectionism and tariffs on our business, results of operations and financial condition;
•unanticipated expenditures related to the cost of compliance with environmental and other governmental regulations;
•fluctuations in (i) exchange rates (in particular changes in the U.S. dollar/Euro currency exchange rates) and (ii) interest rates;
•increases in the funding requirements for our pension and postretirement liabilities;
•our ability identify attractive acquisition targets and to successfully integrate acquired businesses into our existing operations;
•changes in asset valuations including write-downs of assets including property, plant and equipment; inventory, accounts receivable, deferred income tax assets or other assets for impairment or other reasons;
•loss of key personnel;
•strikes, labor stoppages and changes in our collective bargaining agreements and relations with our employees and unions;
•capital and credit market volatility and fluctuations in global equity and fixed-income markets;
•our existing and future indebtedness;
•our net operating losses may not be available to offset our tax liability and other tax planning strategies may not be effective;
•other risks that are detailed from time to time in reports we file with the SEC; and
•other factors described under "Risk Factors."
You are cautioned not to unduly rely on such forward-looking statements, which speak only as of the date made, when evaluating the information presented in this information statement.Annual Report on Form 10-K. We undertake no duty to update these forward-looking statements after the date of this Annual Report on Form 10-K, even though our situation may change in the future.
Item 1B. Unresolved Staff Comments
None.
Item 2. Properties
Our principal executive offices are located in Alpharetta, Georgia, a suburb of Atlanta, Georgia. We have 10 manufacturing facilities in the United States that produce printing and writing, text, cover, durable saturated and coated substrates, premium packaging, filtration and other specialty papers for a variety of end uses. We have two manufacturing facilities in Germany that produce transportation and other filter media, and durable and saturated substrates. We have one manufacturing facility in the Netherlands that produces digital transfer media and other technical products. We have one manufacturing facility in the U.K. that produces durable printing and specialty paper.
We believe that each of these facilities is adequately maintained and is suitable for conducting our operations and business. We manage machine operating schedules at our manufacturing locations to fulfill customer orders in a timely manner and control inventory levels.
As of December 31, 2018, following are2020, the locations of our principal facilities and operating equipment and the products produced at each location:
location are listed below: | | | | | | | | | | | | | | | | | | | | |
| | | | | | |
| Location | | Equipment/Resources | | | | |
Location | | Equipment/Resources | | Owned or Leased | | Products |
| Fine Paper and Packaging Segment | | | | | | |
Neenah Mill
Neenah, Wisconsin
| | Two paper machines; paper finishing equipment | | Owned | | Printing and writing, text, cover, packaging and other specialty papers |
Whiting Mill
Whiting, Wisconsin
| | Four paper machines; paper finishing equipment | | Owned | | Printing and writing, text, cover, packaging and other specialty papers |
Converting Center
Neenah, Wisconsin
| | Paper finishing equipment | | Owned | | Printing and writing, text, cover, packaging and other specialty papers |
Great Barrington Mill
Great Barrington, Massachusetts
| | Paper finishing equipment | | Owned; leased facility | | Laminated specialty papers and toll converting services |
| | | | | | |
| Technical Products Segment | | | | | | |
Munising Mill
Munising, Michigan
| | Two paper machines; two off line saturators; two off line coaters; specialty finishing equipment | | Owned | | Tapes, abrasives, premask, medical packaging and other durable, saturated and coated substrates |
Appleton Mill
Appleton, Wisconsin | | Two paper machines; saturating equipment; paper finishing equipment | | Owned | | Transportation filtration, printing and writing, text, cover, packaging, and other specialty papers |
| Pittsfield Mill
Pittsfield, Massachusetts
| | Three paper machines; paper finishing equipment | | Owned | | Reverse osmosis filtration and glass applications |
Bruckmühl Mill
Bruckmühl, Germany
| | One paper machine; two saturator/coaters; finishing equipment | | Owned | | Masking tape backings and abrasive backings |
Weidach Mill
Feldkirchen-Westerham, Germany
| | Two paper machines; three saturators; one laminator; three meltblown machines; specialty finishing equipment | | Owned | | Transportation filtration and other industrial filter media |
Red BridgeBolton Mill
Bolton, England
| | Saturating, coating, and finishing equipment | | Owned | | Durable printing, specialty paper, and coated substrates |
Eerbeek Mill
Eerbeek, Netherlands
| | Two paper machines; paper finishing equipment | | Owned | | Digital dye sublimation and imagedigital transfer printing paper |
| | | | | | |
| Shared Facilities | | | | | | |
Appleton Mill
Appleton, Wisconsin
| | Two paper machines; saturating equipment; paper finishing equipment | | Owned | | Transportation filtration, printing and writing, text, cover, packaging, and other specialty papers |
Brattleboro Mill
Brattleboro, Vermont
| | One paper machine; coating and paper finishing equipment | | Owned | | Printing, packaging, specialty paper board, and coated substrates |
Brownville Mill
Brownville, New York
| | One paper machine; one off-line coater | | Owned | | Durable printing, packaging, and specialty paper |
Lowville Mill
Lowville, New York
| | Saturating, coating, embossing and finishing equipment | | Owned | | Durable printing, packaging, and specialty paper |
Quakertown Mill
Quakertown, Pennsylvania
| | Saturating, coating, embossing and finishing equipment | | Owned | | Durable printing, packaging, and specialty paper |
See Note 14 of Notes to Consolidated Financial Statements, "Sale of Brattleboro Mill and Impairment Loss", where noted the Brattleboro mill was sold on December 31, 2018. See Note 76 of Notes to Consolidated Financial Statements, "Debt", for a description of the material encumbrances attached to the properties described in the table above.
As of December 31, 2018, following are2020, the locations of our owned and leased office and laboratory space and the functions performed at each location.
location are listed below. | | | | | | | | | | | | | | |
| | | | |
| Administrative Location | | Office/Other Space | | Function |
Administrative Location | | Office/Other Space | | Function |
| Alpharetta, Georgia | | Leased Office Space | | Corporate Headquarters, Administration and Design Center |
Neenah, and Appleton, Wisconsin | | Owned Office Space | | Administration |
| | | | |
| Munising, Michigan | | Owned Office and Laboratory Space | | Administration and Research and Development for our technical products businesses |
| Pittsfield, Massachusetts | | Owned Office and Laboratory Space | | Administration and Research and Development for our technical products businesses |
West Springfield,East Longmeadow, Massachusetts | | OwnedLeased Office and Laboratory Space | | Administration and Research and Development for our technical products and fine paper and packaging businesses |
| Feldkirchen-Westerham, Germany | | Owned Office and Laboratory Space | | Administration and Research and Development for our technical product businesses |
| Eerbeek, Netherlands | | Owned Office and Laboratory Space | | Administration and Research and Development for our technical product businesses |
Capacity Utilization
Paper machines in our manufacturing facilities generally operate on a combination of three-shift five- or seven-day schedules to meet demand. We are not constrained by input factors and the maximum operating capacity of our manufacturing facilities is calculated based on operating days to account for variations in mix and different units of measure between assets. Due to required maintenance downtime and contract holidays, the maximum number of operating days is defined as 350 days per year. We generally expect to utilize approximately 80 to 90 percent of our maximum operating capacity. The following table presents our percentage utilization of maximum operating capacity by segment:
| | | | | | | | | | | | | | | | | | | | |
| | | Year Ended December 31, |
| | | 2020 | | 2019 | | 2018 |
| Technical Products | | 66 | % | | 66 | % | | 74 | % |
| Fine Paper and Packaging | | 79 | % | | 86 | % | | 78 | % |
|
| | | | | | | | | |
| | | Year Ended December 31, |
| | | 2018 | | 2017 | | 2016 |
| Technical Products | | 74 | % | | 78 | % | | 87 | % |
| Fine Paper and Packaging | | 78 | % | | 81 | % | | 80 | % |
Item 3. Legal Proceedings
Litigation
We are involved in certain legal actions and claims arising in the ordinary course of business. While the outcome of these legal actions and claims cannot be predicted with certainty, it is the opinion of management that the outcome of any such claim which is pending or threatened, either individually or on a combined basis, will not have a material effect on our consolidated financial condition, results of operations or liquidity.
Income Taxes
We periodically undergo examination by the IRS as well as the taxing authorities of various state and foreign jurisdictions. The IRS and other taxing authorities routinely challenge certain deductions and credits we report on our income tax returns.
Item 4. Mine Safety Disclosures
Not applicable.
PART II
Item 5. Market for Registrant's Common Equity, Related Stockholder Matters and Issuer Purchases of Equity Securities
Neenah common stock is listed on the New York Stock Exchange and is traded under the ticker symbol NP."NP".
For the year ended December 31, 20182020 we paid quarterly cash dividends of $0.41$0.47 per common share or $27.8$31.9 million annually. For the year ended December 31, 2017,2019, we paid quarterly cash dividends of $0.37$0.45 per common share or $25.1$30.5 million annually. In November 2018, our Board of Directors approved an 10 percent increase in the quarterly dividend rate on our common stock to $0.45 per share, scheduled to be paid in March 2019.
Dividends are declared at the discretion of the Board of Directors, and future dividends will depend on our future earnings, cash flow, financial requirements and other factors. Our ability to pay cash dividends on our common stock is limited under the terms of both our bank credit agreement and our 2021 Senior Notes.agreements. Under the most restrictive terms of the Fourth Amended and Restated Credit Agreement, we are permitted to pay cash dividends on, orand repurchase shares of our common stock up to the amount available under the Fourth Amended and Restated Credit Agreement,without limitation as long as theour specified excess availability under the Fourth Amended and Restated Credit Agreement exceeds $28 million.the greater of (i) $20 million and (ii) 12.5 percent of the maximum aggregate commitments under our revolving credit facility as then in effect (approximately $22 million as of December 31, 2020), on a pro forma basis after giving effect to such dividend or stock repurchase (as the case may be). If theour specified excess availability, on a pro forma basis, is below $28 million,that amount, we are restricted from payingsubject to certain restrictions on the amount of cash dividends or repurchasing shares.we are permitted to declare and the amount of share repurchases we are permitted to execute. As of December 31, 2018,2020, our availability exceeded $28 million,the applicable threshold, so this restriction did not apply.
Under the most restrictive terms of the 2021 Senior Notes,Term Loan Credit Agreement, we are permitted to pay cash dividends of up to $25 million in a calendar year, but not permitted toand repurchase shares of our common stock.stock in an aggregate amount not to exceed $8.75 million per fiscal quarter. However, as long as the nettotal leverage ratio (net debt/EBITDA) undercalculated in accordance with the 2021 Senior Notes is below 2.5x,Term Loan Credit Agreement does not exceed 2.5 to 1.0, we can pay dividends or repurchase shares without limitation. In the event the nettotal leverage ratio exceeds 2.5x,2.5 to 1.0 but is less than or equal to 3.5 to 1.0, we may still pay dividends or repurchase shares of our common stock in an aggregate amount in excess of $25$8.75 million or repurchase sharesper fiscal quarter by utilizing certain "restricted payment baskets" as defineddescribed in the indenture forTerm Loan Credit Agreement. In addition, we would be permitted to pay cash dividends and repurchase shares of, our common stock in excess of $8.75 million per fiscal quarter if the 2021 Senior Notes.aggregate amount of such payments, together with the amount of redemptions or prepayments of certain indebtedness, is less than or equal to the greater of (i) $65 million and (ii) 9% of our consolidated tangible assets. As of December 31, 2018,2020, since our total leverage ratio was less than 2.5x,2.5 to 1.0, none of these covenants were restrictive torestricted our ability to pay dividends on or repurchase shares of our common stock.
As of February 20, 2019,17, 2021, Neenah had approximately 1,1711,029 holders of record of its common stock. The closing price of Neenah's common stock on February 20, 201917, 2021 was $70.74.$56.97.
Purchases of Equity Securities:
The following table sets forth certain information regarding purchases of our common stock during the fourth quarter of 2018.2020.
|
| | | | | | | | | | | | | | |
| Period | | Total Number of Shares Purchased (a) | | Average Price Paid Per Share (c) | | Total Number of Shares Purchased as Part of Publicly Announced Plans or Programs (b) | | Approximate Dollar Value of Shares that May Yet Be Purchased Under Publicly Announced Plans or Programs |
| October 2018 | | 88 |
| | $ | — |
| | — |
| | $ | 18,702,438 |
|
| November 2018 | | 24,634 |
| | $ | 68.90 |
| | 24,634 |
| | $ | 17,005,155 |
|
| December 2018 | | 46,277 |
| | $ | 64.97 |
| | 20,621 |
| | $ | 15,665,409 |
|
| | | | | | | | | | | | | | | | | | | | | | | | | | |
| | | | Shares Purchased as Part of Publicly Announced Plans or Programs in 2020 (b) |
| Period | | Total Number
of Shares
Purchased (a) | | Average Price
Paid Per
Share | | Total Number of Shares
Purchased | | Approximate Dollar Value
of Shares that May Yet
Be Purchased |
| October 2020 | | 89 | | | $ | — | | | — | | | $ | 21,400,573 | |
| November 2020 | | — | | | $ | — | | | — | | | $ | 21,400,573 | |
| December 2020 | | 18,174 | | | $ | — | | | — | | | $ | 21,400,573 | |
_______________________
| |
(a) | Transactions include the purchase of vested restricted shares from employees to satisfy minimum tax withholding requirements upon vesting of stock-based awards. See Note 9 of Notes to Consolidated Financial Statements, "Stock Compensation Plans." |
| |
(b) | In November 2017, our Board of Directors authorized a program for the purchase of up to $25 million of outstanding common stock which was in effect till December 31, 2018. In November 2018, our Board of Directors authorized a program for the purchase of up to $25 million of outstanding common stock effective January 1, 2019. The program does not require the Company to purchase any specific number of shares and may be suspended or discontinued at any time. |
| |
(c) | Average price paid per share for shares purchased as part of our program. |
(a)Transactions include the purchase of vested restricted shares from employees to satisfy minimum tax withholding requirements upon vesting of stock-based awards. See Note 8 of Notes to Consolidated Financial Statements, "Stock Compensation Plans."
(b)In November 2019, our Board of Directors authorized a program for the purchase of up to $25 million of outstanding common stock which was in effect till December 31, 2019. In November 2020, our Board of Directors authorized a program for the purchase of up to $25 million of outstanding common stock effective January 1, 2021. The program does not require the Company to purchase any specific number of shares and may be suspended or discontinued at any time.
Equity Compensation Plan Information
The following table summarizes information about outstanding options (in this report, unless the context requires otherwise, references to "options" are intended to include stock appreciation rights) and restricted stock units and shares reserved for future issuance under our existing equity compensation plans as of December 31, 2018. |
| | | | | | | | | | |
| Plan Category | | (a)
Number of
securities
to be issued upon
exercise of
outstanding
options,
warrants, and
rights | | (b)
Weighted-
average
exercise price
of
outstanding
options,
warrants, and
rights (1) | | (c)
Number of securities
remaining available
for future issuance
under equity
compensation plans
(excluding securities
reflected in
column (a)) |
| Equity compensation plans approved by security holders | | 151,677 |
| (2)(3) | $ | 67.46 |
| | 1,260,000 |
|
| Equity compensation plans not approved by security holders | | — |
| | — |
| | — |
|
| Total | | 151,677 |
| | $ | 67.46 |
| | 1,260,000 |
|
| | | | | | | | | | | | | | | | | | | | |
| Plan Category | | (a)
Number of
securities
to be issued upon
exercise of
outstanding
options,
warrants, and
rights | | (b)
Weighted-
average
exercise price
of
outstanding
options,
warrants, and
rights (1) | | (c)
Number of securities
remaining available
for future issuance
under equity
compensation plans
(excluding securities
reflected in
column (a)) |
| Equity compensation plans approved by security holders | | 157,391 | | (2)(3) | $ | 70.99 | | | 879,000 | |
| Equity compensation plans not approved by security holders | | — | | | — | | | — | |
| Total | | 157,391 | | | $ | 70.99 | | | 879,000 | |
_______________________ | |
(1) | The weighted-average exercise price of outstanding options, warrants and rights does not take into account restricted stock units since they do not have an exercise price. |
| |
(2) | Includes (i) 50,996 shares issuable upon the exercise of outstanding options and stock appreciation rights ("SARs") for which the exercise price of outstanding options and SARs exceeds closing price of our common stock of $58.92, (ii) 47,221 shares issuable following the vesting and conversion of outstanding performance share unit awards, and (iii) 53,460 shares issuable upon the vesting and conversion of outstanding restricted stock units, all as of December 31, 2018. As of December 31, 2018, we had an aggregate of 451,081 stock options and SARs outstanding. The weighted average exercise price of the stock options and SARs was $67.46 per share and the remaining contractual life of such awards was 7.0 years. |
| |
(3) | Includes 42,559 shares that would be issued upon the assumed exercise of 169,693 SARs at the 58.92 per share closing price of our common stock on December 31, 2018. |
(1)The weighted-average exercise price of outstanding options, warrants and rights does not take into account restricted stock units since they do not have an exercise price.
(2)Includes (i) 21,139 shares issuable upon the exercise of outstanding options and stock appreciation rights ("SARs") for which the exercise price of outstanding options and SARs exceeds closing price of our common stock of $55.32, (ii) 54,048 shares issuable following the vesting and conversion of outstanding performance share unit awards, and (iii) 82,204 shares issuable upon the vesting and conversion of outstanding restricted stock units, all as of December 31, 2020. As of December 31, 2020, we had an aggregate of 380,844 stock options and SARs outstanding. The weighted average exercise price of the stock options and SARs was $70.99 per share and the remaining contractual life of such awards was 5.4 years. (3)Includes 20,280 shares that would be issued upon the assumed exercise of 53,610 SARs at the $55.32 per share closing price of our common stock on December 31, 2020.
Item 6. Selected Financial Data
The following table sets forth ourWe have voluntary elected early compliance with the SEC’s recent amendments to Form 10-K eliminating the requirement to present selected historical financial and other data. You should read the information set forth below in conjunction with "Management's Discussion and Analysis of Financial Condition and Results of Operations" and our historicalThe consolidated financial statements and the notes to those consolidatedreport of Deloitte & Touche LLP, Independent Registered Public Accounting Firm, on such financial statements included elsewhere inare filed as part of this Annual Report. The statement of operations data for the years ended December 31, 2018, 2017 and 2016 and the balance sheet data as of December 31, 2018 and 2017 set forth below are derived from our audited historical consolidated financial statements included elsewhere in this Annual Reportreport beginning on Form 10-K. The balance sheet data as of December 31, 2016, 2015 and 2014 and the statement of operations data for the years ended December 31, 2015 and 2014 set forth below are derived from our historical consolidated financial statements not included in this Annual Report on Form 10-K.
On October 31, 2015, we sold the Lahnstein Mill for net cash proceeds of approximately $5.4 million. For the year ended December 31, 2018, discontinued operations reported on the consolidated statements of operations reflect an additional loss on sale of $0.8 million arising from the final adjustment to the transaction price on the sale of the Lahnstein Mill in 2015. For the years ended December 31, 2016 and December 31, 2015, discontinued operations reported on the consolidated statements of operations reflect the results of operations and the loss on sale of the Lahnstein Mill. The consolidated statement of operations for the year ended December 31, 2014 has been restated to report results of the Lahnstein Mill as discontinued operations. As of December 31, 2015 and 2014, the assets and liabilities of the Lahnstein Mill are classified as assets held for sale on the consolidated balance sheet. See Note 13 of Notes to Consolidated Financial Statements, "Discontinued Operations."
page F-1.
|
| | | | | | | | | | | | | | | | | | | | |
| | | Year Ended December 31, |
| | | 2018 | | 2017 | | 2016 | | 2015 | | 2014 |
| | | |
| Consolidated Statement of Operations Data | | |
| | |
| | |
| | |
| | |
|
| Net sales | | $ | 1,034.9 |
| | $ | 979.9 |
| | $ | 941.5 |
| | $ | 887.7 |
| | $ | 839.7 |
|
| Cost of products sold (f) | | 851.5 |
| | 779.7 |
| | 724.2 |
| | 690.9 |
| | 666.8 |
|
| Gross profit (f) | | 183.4 |
| | 200.2 |
| | 217.3 |
| | 196.8 |
| | 172.9 |
|
| Selling, general and administrative expenses | | 95.9 |
| | 95.3 |
| | 90.0 |
| | 85.3 |
| | 76.3 |
|
| Impairment loss (a) | | 31.1 |
| | — |
| | — |
| | — |
| | — |
|
| Acquisition/integration/restructuring and costs (b) | | 2.1 |
| | 1.3 |
| | 7.0 |
| | 6.5 |
| | 2.3 |
|
| Pension plan settlement charge (c) | | 1.8 |
| | 0.6 |
| | 0.8 |
| | — |
| | 3.5 |
|
| Acquisition-related adjustments (d) | | (3.9 | ) | | — |
| | — |
| | — |
| | — |
|
| Insurance settlement (e) | | (0.4 | ) | | (3.2 | ) | | — |
| | — |
| | — |
|
| Loss on early extinguishment of debt (g) | | — |
| | — |
| | — |
| | — |
| | 0.2 |
|
| Other expense — net | | 2.7 |
| | 1.9 |
| | 5.4 |
| | 3.6 |
| | 4.0 |
|
| Operating income | | 54.1 |
| | 104.3 |
| | 114.1 |
| | 101.4 |
| | 86.6 |
|
| Interest expense — net | | 13.0 |
| | 12.6 |
| | 11.1 |
| | 11.5 |
| | 11.1 |
|
| Income from continuing operations before income taxes | | 41.1 |
| | 91.7 |
| | 103.0 |
| | 89.9 |
| | 75.5 |
|
| Provision for income taxes (k) | | 3.9 |
| | 11.4 |
| | 29.6 |
| | 29.4 |
| | 7.5 |
|
| Income from continuing operations | | 37.2 |
| | 80.3 |
| | 73.4 |
| | 60.5 |
| | 68.0 |
|
| (Loss) income from discontinued operations, net of taxes (h) | | (0.8 | ) | | — |
| | (0.4 | ) | | (9.4 | ) | | 0.7 |
|
| Net income | | $ | 36.4 |
| | $ | 80.3 |
| | $ | 73.0 |
| | $ | 51.1 |
| | $ | 68.7 |
|
| | | | | | | | | | | |
| Earnings from continuing operations per basic share | | $ | 2.20 |
| | $ | 4.74 |
| | $ | 4.33 |
| | $ | 3.58 |
| | $ | 4.05 |
|
| Earnings from continuing operations per diluted share | | $ | 2.17 |
| | $ | 4.68 |
| | $ | 4.26 |
| | $ | 3.53 |
| | $ | 3.99 |
|
| Cash dividends per common share | | $ | 1.64 |
| | $ | 1.48 |
| | $ | 1.32 |
| | $ | 1.20 |
| | $ | 1.02 |
|
| | | | | | | | | | | |
| Other Financial Data | | |
| | |
| | |
| | |
| | |
|
| Net cash flow provided by (used for): | | |
| | |
| | |
| | |
| | |
|
| Operating activities (k) | | $ | 92.7 |
| | $ | 100.0 |
| | $ | 115.8 |
| | $ | 111.2 |
| | $ | 94.5 |
|
| Capital expenditures (j) | | (38.1 | ) | | (42.7 | ) | | (68.5 | ) | | (48.1 | ) | | (27.9 | ) |
| Other investing activities (i) | | 3.8 |
| | (52.3 | ) | | 0.3 |
| | (112.0 | ) | | (77.0 | ) |
| Financing activities (g)(k) | | (52.6 | ) | | (3.8 | ) | | (48.4 | ) | | (18.8 | ) | | 10.2 |
|
|
| | | | | | | | | | | | | | | | | | | | |
| | | December 31, |
| | | 2018 | | 2017 | | 2016 | | 2015 | | 2014 |
| | | (Dollars in millions) |
| Consolidated Balance Sheet Data | | |
| | |
| | |
| | |
| | |
|
| Cash and cash equivalents | | $ | 9.9 |
| | $ | 4.5 |
| | $ | 3.1 |
| | $ | 4.2 |
| | $ | 72.6 |
|
| Working capital, less cash and cash equivalents | | 147.2 |
| | 156.1 |
| | 125.2 |
| | 136.3 |
| | 129.5 |
|
| Total assets (k) | | 861.2 |
| | 904.4 |
| | 765.6 |
| | 751.4 |
| | 724.5 |
|
| Long-term debt (g)(k) | | 236.8 |
| | 254.1 |
| | 219.7 |
| | 228.2 |
| | 226.8 |
|
| Total liabilities (k) | | 471.0 |
| | 504.5 |
| | 427.3 |
| | 439.8 |
| | 435.8 |
|
| Total stockholders' equity | | 390.2 |
| | 399.9 |
| | 338.3 |
| | 311.6 |
| | 288.7 |
|
_______________________
| |
(a) | For the year ended December 31, 2018, we recorded a non-cash impairment loss of $31.1 million related to our Brattleboro mill and associated research and office facilities. See Note 14 of Notes to Consolidated Financial Statements, "Sale of Brattleboro Mill and Impairment Loss." |
| |
(b) | For the year ended December 31, 2018, we incurred $0.5 million of integration costs related to the Coldenhove Acquisition and $1.6 million of restructuring and other one-time costs. For the year ended December 31, 2017, we incurred of $1.3 million of acquisition costs related to the Coldenhove Acquisition. For the year ended December 31, 2016, we incurred $4.1 million of integration costs related to the FiberMark Acquisition, $2.7 million of non-capitalized trial costs related to the U.S. filtration project, and $0.2 million of other one-time costs. For the year ended December 31, 2015, we incurred $5.3 million of integration costs related to the FiberMark Acquisition and $1.2 million of restructuring costs. For the year ended December 31, 2014, we incurred $1.0 million of integration costs related to the acquisition of the Crane technical materials business and $1.3 million of restructuring costs. |
| |
(c) | For the years ended December 31, 2018, 2017, 2016 and 2014, we recorded $0.8 million, $0.6 million, $0.8 million and $3.5 million of pension settlement charges, respectively. For the year ended December 31, 2018, we also recorded an estimated withdrawal liability of $1.0 million related to our withdrawal from PIUMPF. See Note 8 of Notes to Consolidated Financial Statements, "Pension and Other Postretirement Benefits." |
| |
(d) | For the year ended December 31, 2018, we recorded $3.9 million of acquisition-related adjustments arising from the operating results of Coldenhove subsequent to the acquisition. See Note 4 of Notes to Consolidated Financial Statements, "Acquisitions." |
| |
(e) | For the years ended December 31, 2018 and 2017, we recorded a representations and warranties insurance settlement of $0.4 million and $3.2 million, respectively, related to the FiberMark acquisition. |
| |
(f) | In March 2017, the FASB issued ASU 2017-07, Improving the Presentation of Net Periodic Pension Cost and Net Periodic Postretirement Benefit Cost (Topic 715). The Company adopted this ASU as of January 1, 2018. As a result of the adoption, the Company reclassified $1.5 million and $1.2 million of net cost for the year ended December 31, 2017, $2.8 million and $2.2 million of net cost for the year ended December 31, 2016, $1.4 million and $1.2 million of net cost for the year ended December 31, 2015, and $2.1 million and $1.7 million for the year ended December 31, 2014, respectively, of other components of net benefit cost from "Cost of products sold" and "Selling, general and administrative expenses" to "Other expense - net" on the consolidated statements of operations. There was no other material impact on its consolidated financial statements due to the adoption.
|
| |
(g) | For the year ended December 31, 2014, we amended and restated our existing bank credit facility and recognized a pre-tax loss of $0.2 million for the write-off of unamortized debt issuance costs. |
| |
(h) | The following table presents the results of discontinued operations: |
|
| | | | | | | | | | | | | | | | | | | | |
| | | Year Ended December 31, |
| | | 2018 (1) | | 2017 | | 2016 (1) | | 2015 (2) | | 2014 |
| Discontinued operations: (3) | | | | | | |
| | |
| | |
|
| Income from operations | | $ | — |
| | $ | — |
| | $ | — |
| | $ | 0.2 |
| | $ | 0.9 |
|
| Loss on sale of the Lahnstein Mill (3) | | (0.8 | ) | | — |
| | (0.6 | ) | | (13.6 | ) | | — |
|
| (Loss) income before income taxes | | (0.8 | ) | | — |
| | (0.6 | ) | | (13.4 | ) | | 0.9 |
|
| (Benefit) provision for income taxes | | — |
| | — |
| | (0.2 | ) | | (4.0 | ) | | 0.2 |
|
| (Loss) income from discontinued operations, net of taxes | | $ | (0.8 | ) | | $ | — |
| | $ | (0.4 | ) | | $ | (9.4 | ) | | $ | 0.7 |
|
_______________________
| |
(1) | The losses in 2018 and 2016 were due to the final adjustments of the sales price of the Lahnstein Mill. |
| |
(2) | The loss on sale of the Lahnstein Mill includes a net curtailment gain related to the divestiture of the pension plan of $15.8 million, including a $5.5 million write-off of deferred actuarial losses in 2015. |
| |
(3) | On October 31, 2015, we sold the Lahnstein Mill. For the years ended December 31, 2018, 2016, 2015 and 2014, the results of operations and the loss on sale of the Lahnstein Mill are reported as discontinued operations in the Consolidated Statements of Operations Data. |
| |
(i) | In December 2018, we sold the Brattleboro mill for $5 million. In November 2017, we purchased all of the outstanding equity of Coldenhove for approximately $45 million. In August 2015, we purchased all of the |
outstanding equity of FiberMark for approximately $118 million. In July 2014, we purchased all of the outstanding equity of Crane for approximately $72 million.
| |
(j) | During the year ended December 31, 2016, we completed our U.S. Filtration project. |
| |
(k) | At December 31, 2017, financial statements reflect the adjustments arising from the U.S. tax reform signed on December 22, 2017. See Note 6 of Notes to Consolidated Financial Statements, "Income Taxes." At December 31, 2016, we adopted ASC Topic No. 2016-09 and applied the guidance retroactively to January 1, 2016. At December 31, 2015, we adopted ASC Topic No. 2015-03 and ASC Topic No. 2015-17 and elected to apply the guidance retroactively to all periods presented. |
Item 7. Management's Discussion and Analysis of Financial Condition and Results of Operations
The following discussion and analysis presents the factors that had a material effect on our results of operations during the yearsyear ended December 31, 2018, 2017 and 2016.2020. Also discussed is our financial position as of the end of those years.this year. You should read this discussion in conjunction with our consolidated financial statements and the notes to those consolidated financial statements included elsewhere in this Annual Report on Form 10-K. This Management's Discussion and Analysis of Financial Condition and Results of Operations contains forward-looking statements. See "Forward-Looking Statements" for a discussion of the uncertainties, risks and assumptions associated with these statements. A detailed discussion of year ended December 31, 2019 can be found in Item 7. “Management’s Discussion and Analysis of Financial Condition and Results of Operations” in our Annual Report on Form 10-K filed on February 21, 2020.
Introduction
This Management's Discussion and Analysis of Financial Condition is intended to provide investors with an understanding of the historical performance of our business, its financial condition and its prospects. We will discuss and provide our analysis of the following:
•Overview of Business;
•Business Segments;
•Results of Operations and Related Information;
•Liquidity and Capital Resources;
•Adoption of New Accounting Pronouncements; and
•Critical Accounting Policies and Use of Estimates.
Overview of Business
We are a leading global producer of technical products and premium fine papers and packaging.specialty materials for niche markets. We have two primary operations: our technical products business and our fine paper and packaging business.
Our mission is to create value by improving the imagecritical components that create possibilities for our customers and performance of everything we touch.end-users. We expect to create value by growing in specialized niche markets that valuewhere product performance or image is valued and where we have competitive advantages. In managing our businesses, we believe that achieving and maintaining a leadership position in our markets, responding effectively to customer needs and competitive challenges, employing capital optimally, controlling costs and managing risks are important to long-term success. Changes in general economic conditions and timing of changes in input costs and general economic conditionsselling prices can also impact our results. In this discussion and analysis, we will refer to these factors.
Competitive Environment — Our past results have been and our future prospects will be significantly affected by the competitive environment in which we operate. While our businesses are oriented to premium performance and quality, they may also face competitive pressures from lower value products and in most of our markets our businesses compete directly with well-known competitors, some of which are larger and more diversified.
Economic Conditions and Input Costs — The markets for all of our products are affected to a significant degree by economic conditions, including rapid changes in freight and input costs, particularly for pulp, latex and natural gas that may not be recovered immediately through pricing or other actions. Our results are also affected by fluctuations in exchange rates, particularly for the Euro.
Business Segments
Our reportable operating segments consist of Technical Products and Fine Paper and Packaging, and Other.Packaging.
Our technical products business is a leading international producer of transportation, water and other filter media and durable, saturated and coated substrates for a variety of end markets. We focus on categories where we believe we are, or can be, a market leader. These categories include filtration media for transportation, water and other uses,end use applications, backings for
specialty tapes and abrasives, performance labels, digital image transfer papers, and other specialty markets. custom engineered materials. Our products are typically used in high performance applications where our customers require specific standards and qualifications. Our dedicated technical products manufacturing facilities are located in Weidach and Bruckmühl, Germany, Eerbeek, Netherlands, Bolton, England, Munising, Michigan, Appleton, Wisconsin, and Pittsfield, Massachusetts. In addition, certain technical products are manufactured along with fine paper and packaging products in shared facilities located in Brattleboro, Vermont, Brownville and Lowville, New York, and Quakertown, Pennsylvania. In 2017, a filtration machine (which was converted from a fine paper machine) began production in Appleton, Wisconsin, a site also shared with the fine paper and packaging business.
Our fine paper and packaging business is a leading supplier of premium printing, packaging, and other high-end specialty papers predominantly in North America. Our products include some of the most recognized and preferred brands in North America, where we enjoy leading market positions in many of our product categories. Often these papers are characterized by distinctive finishing, colors, textures and coating. We sell our products primarily to authorized paper distributors, as well as through converters, major national retailers and specialty businesses. Our primarydedicated fine paper and packaging
manufacturing facilities are located in Whiting and Neenah, Wisconsin, and Whiting, Wisconsin. CertainGreat Barrington, Massachusetts. In addition, certain products of both segments are manufactured in shared facilities located in Brattleboro, Vermont, Brownville and Lowville, New York, and Quakertown, Pennsylvania, as well as a site shared with technical products in 2017 in Appleton, Wisconsin. In August 2017, we purchased a laminating asset in Great Barrington, Massachusetts to support continued growth in our premium packaging business.Pennsylvania.
Our other segment includes certain product lines composed of papers sold to converters for end uses such as covering materials for datebooks, diaries, yearbooks and traditional photo albums. These products are primarily manufactured at our shared facilities located in Brownville, New York and Brattleboro, Vermont. See Note 14 of Notes to Consolidated Financial Statements, "Sale of Brattleboro Mill and Impairment Loss" where a realignment of this segment in 2019 is described.
Results of Operations and Related Information
In this section, we discuss and analyze our net sales, income before interest and income taxes (which we refer to as "operating income") and other information relevant to an understanding of our results of operations.
Impact of COVID-19 on Our Business
In 2020, we faced adverse impacts of the outbreak of COVID-19 which resulted in the decline in global economic activity and significantly reduced demand for our products and our customers’ products. While we experienced varying degrees of recovery in our markets, the pandemic had a material negative impact on our business operations and financial results, including net sales and earnings. Both of our business segments have continued to operate during the pandemic as essential suppliers of goods and services and we continue to take steps to ensure the safety of our employees, including frequent cleaning and disinfection of workspaces, property and equipment, instituting social distancing measures and providing remote working environments for administrative employees. We experienced a limited number of confirmed COVID-19 cases in our operations and quarantined those individuals and first level exposed employees in accordance with the U.S. Centers for Disease Control and Prevention (the "CDC") guidelines. Such cases did not cause any significant disruption to operations, nor have we experienced material disruptions to our supply chain.
Management implemented a number of actions to preserve the safety of our employees (as discussed in Human Capital section of Item 1. "Business"), carefully control and reduce spending, and preserve liquidity by actively managing working capital. These actions included the following:
•reducing discretionary spending;
•minimizing capital expenditures and discretionary contributions to pension plans;
•suspending stock repurchases under our 2020 Stock Purchase Plan;
•utilizing government initiatives and subsidies such as deferring payroll taxes under the CARES Act, government employee retention subsidies in the U.S., Europe and the U.K., and net operating loss carrybacks;
•consolidating our manufacturing footprint; and
•reducing payroll costs through a freeze on wage increases and hiring, furloughs for all U.S. employees, and reductions in our salaried and hourly headcount.
Executive Summary
For the year ended December 31, 2018,2020, consolidated net sales of $1,034.9$792.6 million increased $55.0decreased $145.9 million, or 616 percent, from $979.9$938.5 million in 2017.2019. The increasedecline in revenues resulted primarily from highersignificant adverse volume impacts from COVID-19. Net sales declined 6% in Technical Products volumes (including volumes from the November 2017 Coldenhove Acquisition), increasedand 29% in Fine Paper and Packaging. In addition, net selling prices were modestly lower in 2020 due both segments,to selling price and a higher value mix and favorable currency effectsmix. The decline in Technical Products. These itemsnet sales was more than offset lowerpronounced in the Fine Paper and Packaging volumes.segment due to reductions in end-use demand for commercial print papers used in advertising and marketing. While down versus prior year, third and fourth quarter 2020 consolidated net sales increased 18% and 8%, respectively, from each of the preceding quarters, as the global markets continued to recover.
Consolidated operating income decreased $84.4 million from the prior year to a loss of $54.1$6.1 million for the year ended December 31, 2018 decreased $50.2 million, or 48 percent, from the prior year. The decrease was mainly due to adjustments of $30.7 million consisting of a $31.1 million impairment loss related to the sale of the Brattleboro mill and associated research and office facilities, $1.8 million of pension settlement charges and $2.1 million of restructuring, integration and other costs, partly offset by $3.9 million for a favorable escrow receivable and liability adjustment related to the Coldenhove Acquisition and an insurance-related settlement of $0.4 million.2020. Excluding these net unfavorableadjusting items in 2018 and $1.3 million of net favorable adjustments in 2017, adjustednoted below, operating income decreased $18.2$18.7 million (18%),due primarily due to higherlower sales and manufacturing costs, including more than $35 millioncost inefficiencies related to COVID-19. The impact of higher input and distribution costs that werelower volumes was only partly offset by increasedspending reductions and lower input costs net of selling pricesprice reductions. As presented on the reconciliation table on page 35, we recorded $70.5 million of adjusting items in both segments,2020 including non-cash asset restructuring and by volume growth,impairment costs for long-lived assets, other restructuring and non-routine costs, incremental costs of responding to COVID-19, loss on debt extinguishment, pension and SERP settlements and acquisition due diligence costs. Adjusting items of $4.8 million in 2019 included accelerated depreciation due to idling of a higher value mixfine paper machine, restructuring and favorable currency effects in Technical Products. See later in this section for further information regarding the presentation of operating income, as adjusted.other non-routine costs and pension related gain.
Cash provided by operating activities of $92.7$93.4 million for the year ended December 31, 20182020 was $7.3$4.2 million lower than cash provided by operating activities of $100.0$97.6 million in the prior year. The decrease in cash flows resulted from a $19.1 million reduction in operating income (excluding the non-cash $31.1 million impairment loss of the Brattleboro mill) and higher contributionsActions to pension plans to take advantage of the effects of the 2017 Tax Act, partly offset by a $10.8 million lower investment inimprove working capital in 2018.and to reduce spending largely offset the impact from lower earnings.
Capital expenditures for the year ended December 31, 20182020 were $38.1$18.9 million compared to $42.7$21.4 million in the prior year, which were within our target rangeyear. Lower capital spending in 2020 of approximately 3$2.5 million was due to 5 percent of net sales.actions to minimize capital spending.
Analysis of Net Sales — Years Ended December 31, 2018, 20172020 and 20162019
The following table presents net sales by segment and net sales expressed as a percentage of total net sales:
| | | | | | | | | | | | | | | | | | | | | | | | | | |
| | | Year Ended December 31, |
| Net sales | | 2020 | | 2020 | | 2019 | | 2019 |
| Technical Products | | $ | 508.9 | | | 64 | % | | $ | 541.6 | | | 58 | % |
| Fine Paper and Packaging | | 283.7 | | | 36 | % | | 396.9 | | | 42 | % |
| Consolidated | | $ | 792.6 | | | 100 | % | | $ | 938.5 | | | 100 | % |
|
| | | | | | | | | | | | | | | | | | | | | |
| | | Year Ended December 31, |
| Net sales | | 2018 | | 2018 | | 2017 | | 2017 | | 2016 | | 2016 |
| Technical Products | | $ | 567.6 |
| | 55 | % | | $ | 502.1 |
| | 51 | % | | $ | 466.4 |
| | 50 | % |
| Fine Paper and Packaging | | 445.8 |
| | 43 | % | | 455.3 |
| | 47 | % | | 452.1 |
| | 48 | % |
| Other | | 21.5 |
| | 2 | % | | 22.5 |
| | 2 | % | | 23.0 |
| | 2 | % |
| Consolidated | | $ | 1,034.9 |
| | 100 | % | | $ | 979.9 |
| | 100 | % | | $ | 941.5 |
| | 100 | % |
Commentary:
Year 20182020 versus 20172019
| | | | | | | | | | | | | | | | | | | | | | | | | | | | | | | | | | | | | | |
| | | | | | | Change in Net Sales Compared to the
Prior Year |
| | | For the Year
Ended
December 31, | | | | Change Due To |
| | | | Total
Change | | | | Net Price | | |
| | | 2020 | | 2019 | | | Volume | | | Currency |
| Technical Products | | $ | 508.9 | | | $ | 541.6 | | | $ | (32.7) | | | $ | (13.4) | | | $ | (24.5) | | | $ | 5.2 | |
| Fine Paper and Packaging | | 283.7 | | | 396.9 | | | (113.2) | | | (102.0) | | | (11.2) | | | — | |
| Consolidated | | $ | 792.6 | | | $ | 938.5 | | | $ | (145.9) | | | $ | (115.4) | | | $ | (35.7) | | | $ | 5.2 | |
|
| | | | | | | | | | | | | | | | | | | | | | | | |
| | | | | | | Change in Net Sales Compared to the
Prior Year |
| | | For the Year
Ended
December 31, | | | | Change Due To |
| | | | Total
Change | | | | Net Price | | |
| | | 2018 | | 2017 | | | Volume | | | Currency |
| Technical Products | | $ | 567.6 |
| | $ | 502.1 |
| | $ | 65.5 |
| | $ | 35.8 |
| | $ | 18.7 |
| | $ | 11.0 |
|
| Fine Paper and Packaging | | 445.8 |
| | 455.3 |
| | (9.5 | ) | | (21.6 | ) | | 12.1 |
| | — |
|
| Other | | 21.5 |
| | 22.5 |
| | (1.0 | ) | | (1.8 | ) | | 0.8 |
| | — |
|
| Consolidated | | $ | 1,034.9 |
| | $ | 979.9 |
| | $ | 55.0 |
| | $ | 12.4 |
| | $ | 31.6 |
| | $ | 11.0 |
|
Consolidated net sales for the year ended December 31, 20182020 were $55.0$145.9 million (6%(16%) higherlower than the prior year. The increasedecline in revenues resulted primarily from highersignificant adverse volume impacts from COVID-19. Net sales declined 6% in Technical Products volumes (including volumes from the November 2017 Coldenhove Acquisition), increasedand 29% in Fine Paper and Packaging. In addition, net selling prices were modestly lower in 2020 due both segments,to selling price and a higher value mix and favorable currency effectsmix. The decline in Technical Products. These itemsnet sales was more than offset lowerpronounced in the Fine Paper and Packaging volumes.segment due to reductions in end-use demand for commercial print papers used in advertising and marketing. While down versus prior year, third and fourth quarter 2020 consolidated net sales increased 18% and 8%, respectively, from each of the preceding quarters, as the global markets continued to recover.
•Net sales in our technical products business increased $65.5decreased $32.7 million (13%(6%) from the prior year due to acquired volume, organic increasesyear. The revenue decrease resulted primarily from lower net selling prices partly as a result of declines in filtration sales,input costs as well as a higher-pricedlower value mix of products sold, and favorable currency effects due to a stronger eurolower volumes reflecting adverse impacts of COVID-19. These factors were only partly offset by increased sales of filtration products, including media for face masks in the first half of the year.Europe launched in 2020.
•Net sales in our fine paper and packaging business decreased $9.5$113.2 million (2%(29%) from the prior year. The decline was primarily due to lower volumes, reflecting adverse impacts of COVID-19. Volume declines were more pronounced in commercial print products were partly offset by higher selling prices and volume increases in premium packaging.
Net sales in our other business segment decreased $1.0 million from the prior year period dueas compared to lower volumes.
Year 2017 versus 2016
|
| | | | | | | | | | | | | | | | | | | | | | | | |
| | | | | | | Change in Net Sales Compared to the
Prior Year |
| | | For the Years Ended
December 31, | | | | Change Due To |
| | | 2017 | | 2016 | | Total
Change | | Volume | | Net Price | | Currency |
| Technical Products | | $ | 502.1 |
| | $ | 466.4 |
| | $ | 35.7 |
| | $ | 22.9 |
| | $ | 10.0 |
| | $ | 2.8 |
|
| Fine Paper and Packaging | | 455.3 |
| | 452.1 |
| | 3.2 |
| | 7.2 |
| | (4.0 | ) | | — |
|
| Other | | 22.5 |
| | 23.0 |
| | (0.5 | ) | | — |
| | (0.5 | ) | | — |
|
| Consolidated | | $ | 979.9 |
| | $ | 941.5 |
| | $ | 38.4 |
| | $ | 30.1 |
| | $ | 5.5 |
| | $ | 2.8 |
|
Consolidated net sales for the year ended December 31, 2017 were $38.4 million (4%) higher than the prior year. The increase resulted from growth in both Technical Products and Fine Paper and Packaging, due to higher volumes, higher priced mix and favorable currency effects in Technical Products, and due to growth in premium packaging and higherconsumer channel sales. Net selling prices were lower partly offset by lower priced mixas a result of declines in Fine Paper and Packaging. Excluding the Coldenhove Acquisition, consolidated net sales increased 3 percent from the prior year.
Net sales in our technical products business increased $35.7 million (8%) from the prior year due to higher volumes in backings, label and other filtration,input costs as well as higher priced mix, acquired volume and favorable currency effects. Excluding the Coldenhove Acquisition, technical product sales increased $28.2 million (6%). Net selling prices increased due to a higher-pricedlower value mix of products sold and increased selling prices.sold.
Net sales in our fine paper and packaging business increased $3.2 million (1%) from the prior year due to higher volumes largely offset by lower priced mix. Increased volumes reflected double digit growth in premium packaging as well as more direct sales of non-branded products, which more than offset the decline in commercial print.
Net sales in our other business segment decreased $0.5 million from the prior year period due to lower priced mix.
Analysis of Operating Income — Years Ended December 31, 2018, 20172020 and 20162019
The following table sets forth line items from our consolidated statements of operations as a percentage of net sales for the periods indicated and is intended to provide a perspective of trends in our historical results:
| | | | | | | | | | | | | | | | |
| | | Year Ended December 31, |
| | | 2020 | | 2019 | | |
| Net sales | | 100.0 | % | | 100.0 | % | | |
| Cost of products sold | | 80.7 | % | | 80.5 | % | | |
| Gross profit | | 19.3 | % | | 19.5 | % | | |
| Selling, general and administrative expenses | | 11.2 | % | | 10.5 | % | | |
| Asset restructuring and impairment costs | | 7.3 | % | | 0.4 | % | | |
| Other restructuring and non-routine costs | | 0.5 | % | | 0.2 | % | | |
| COVID-19 costs | | 0.4 | % | | — | % | | |
| Loss on debt extinguishment | | 0.2 | % | | — | % | | |
| Pension and SERP adjustments | | 0.2 | % | | (0.1) | % | | |
| Acquisition due diligence costs | | 0.2 | % | | — | % | | |
| | | | | | |
| Other expense, net | | 0.1 | % | | 0.2 | % | | |
| Operating income (loss) | | (0.8) | % | | 8.3 | % | | |
| Interest expense, net | | 1.6 | % | | 1.2 | % | | |
| Income (loss) from continuing operations before income taxes | | (2.4) | % | | 7.1 | % | | |
| Provision (benefit) for income taxes | | (0.4) | % | | 1.2 | % | | |
| Income (loss) from continuing operations | | (2.0) | % | | 5.9 | % | | |
|
| | | | | | | | | |
| | | Year Ended December 31, |
| | | 2018 | | 2017 | | 2016 |
| Net sales | | 100.0 | % | | 100.0 | % | | 100.0 | % |
| Cost of products sold | | 82.3 | % | | 79.6 | % | | 76.9 | % |
| Gross profit | | 17.7 | % | | 20.4 | % | | 23.1 | % |
| Selling, general and administrative expenses | | 9.3 | % | | 9.7 | % | | 9.6 | % |
| Impairment loss | | 3.0 | % | | — | % | | — | % |
| Restructuring, integration and other costs | | 0.2 | % | | 0.1 | % | | 0.7 | % |
| Pension and SERP plan settlement charges | | 0.2 | % | | 0.1 | % | | 0.1 | % |
| Acquisition-related adjustments | | (0.4 | )% | | — | % | | — | % |
| Insurance settlement | | — | % | | (0.3 | )% | | — | % |
| Other expense — net | | 0.2 | % | | 0.2 | % | | 0.6 | % |
| Operating income | | 5.2 | % | | 10.6 | % | | 12.1 | % |
| Interest expense — net | | 1.2 | % | | 1.2 | % | | 1.2 | % |
| Income from continuing operations before income taxes | | 4.0 | % | | 9.4 | % | | 10.9 | % |
| Provision for income taxes | | 0.4 | % | | 1.2 | % | | 3.1 | % |
| Income from continuing operations | | 3.6 | % | | 8.2 | % | | 7.8 | % |
Commentary:
Year 20182020 versus 20172019
| | | | | | | | | Change in Operating Income (Loss) Compared to the Prior Year | | | Change in Operating Income (Loss) Compared to the Prior Year |
| | | For the Years Ended
December 31, | | | | Change Due To | | | For the Years Ended
December 31, | | | Change Due To |
| | | 2018 | | 2017 | | Total
Change | | Volume | | Net Price (a) | | Input Costs (b) | | Currency | | Other (c) | | | 2020 | | 2019 | | Total
Change | | Volume | | Net Price (a) | | Input Costs (b) | | Currency | | Other (c) |
| Technical Products | | $ | 50.9 |
| | $ | 55.3 |
| | $ | (4.4 | ) | | $ | 9.0 |
| | $ | 14.7 |
| | $ | (12.0 | ) | | $ | 2.0 |
| | $ | (18.1 | ) | Technical Products | | $ | (4.8) | | | $ | 44.6 | | | $ | (49.4) | | | $ | (2.9) | | | $ | (10.2) | | | $ | 19.8 | | | $ | 1.0 | | | $ | (57.1) | |
| Fine Paper and Packaging | | 29.4 |
| | 69.5 |
| | (40.1 | ) | | (5.1 | ) | | 8.5 |
| | (16.4 | ) | | — |
| | (27.1 | ) | Fine Paper and Packaging | | 23.3 | | | 53.2 | | | (29.9) | | | (29.0) | | | (7.6) | | | 11.4 | | | — | | | (4.7) | |
| Other | | (6.4 | ) | | (0.4 | ) | | (6.0 | ) | | (0.4 | ) | | 0.8 |
| | (0.7 | ) | | — |
| | (5.7 | ) | |
| Unallocated corporate costs | | (19.8 | ) | | (20.1 | ) | | 0.3 |
| | — |
| | — |
| | — |
| | — |
| | 0.3 |
| Unallocated corporate costs | | (24.6) | | | (19.5) | | | (5.1) | | | — | | | — | | | — | | | — | | | (5.1) | |
| Consolidated | | $ | 54.1 |
| | $ | 104.3 |
| | $ | (50.2 | ) | | $ | 3.5 |
| | $ | 24.0 |
| | $ | (29.1 | ) | | $ | 2.0 |
| | $ | (50.6 | ) | Consolidated | | $ | (6.1) | | | $ | 78.3 | | | $ | (84.4) | | | $ | (31.9) | | | $ | (17.8) | | | $ | 31.2 | | | $ | 1.0 | | | $ | (66.9) | |
_______________________
| |
(a) | Includes price changes, net of changes in product mix. |
| |
(b) | Includes price changes for raw materials and energy. |
| |
(c) | Includes other manufacturing costs, over (under) absorption of fixed costs, distribution and selling, general and administrative ("SG&A") expenses. In addition, 2018 results include the Brattleboro mill impairment loss, pension settlement and other costs, acquisition-related adjustments, restructuring, integration, and other costs, and insurance-related settlement of $(1.4) million in Technical Products, $24.3 million in Fine Paper and Packaging, $5.9 million in Other, and $1.9 million in Unallocated corporate costs, which have been adjusted out from operating income. See the reconciliation table on page 37 for further detail. |
(a)Includes price changes, net of changes in product mix.
(b)Includes price changes for raw materials and energy.
(c)Includes other manufacturing costs, over (under) absorption of fixed costs, distribution and selling, general and administrative ("SG&A") expenses. In addition, in 2020, it included $57.1 million, $7.8 million, and $5.6 million of unfavorable adjustments in Technical Products, Fine Paper and Packaging, and Unallocated corporate costs, respectively. In 2019, it included non-routine costs of $6.2 million primarily related to the accelerated depreciation and other costs related to the consolidation of the fine paper manufacturing footprint with the idling of a paper machine, and $1.4 million of favorable adjustments primarily related to the curtailment gain for the Neenah Coldenhove pension plan. See the breakdown by segment and the reconciliation table on page 35 for further detail.
Consolidated operating income decreased $84.4 million from prior year to a loss of $54.1$6.1 million for the year ended December 31, 2018 decreased $50.2 million (48%) from the prior year. The decrease was mainly due to adjustments of $30.7 million consisting of a $31.1 million impairment loss related to the sale of the Brattleboro mill and associated research and office facilities, $1.8 million of pension settlement charges and $2.1 million of restructuring, integration and other costs, partly offset by $3.9 million for a favorable escrow receivable and liability adjustment related to the Coldenhove Acquisition and an insurance-related settlement of $0.4 million.2020. Excluding these net unfavorableadjusting items in 2018 and $1.3 million of net favorable adjustments in 2017, adjustednoted below, operating income decreased $18.2$18.7 million (18%),due primarily due to higherlower sales and manufacturing costs, including more than $35 millioncost inefficiencies related to COVID-19. The impact of higher input and distribution costs that werelower volumes was only partly offset by increasedspending reductions and lower input costs net of selling pricesprice reductions. As presented on the reconciliation table on page 35, we recorded $70.5 million of adjusting items in both segments,2020 including non-cash asset restructuring and by volume growth,impairment costs for long-lived assets, other restructuring and non-routine costs, incremental costs of responding to COVID-19, loss on debt extinguishment, pension and SERP settlements and acquisition due diligence costs. Adjusting items of $4.8 million in 2019 included accelerated depreciation due to idling of a higher value mixfine paper machine, restructuring and favorable currency effects in Technical Products. See later in this section for further information regarding the presentation of operating income, as adjusted.other non-routine costs and pension related gain.
•Operating income for our technical products business decreased $4.4$49.4 million (8%) from prior year to a loss of 4.8 million. Excluding unfavorable adjusting items discussed above and shown on the prior year. Increases from higher sales volumes, a higher-value mix, increased selling prices and favorable currency effects were more than offset by higher manufacturing costs, reflecting both increased input costs and operational inefficiencies and spending mostly related to incremental downtime for maintenance work, U.S. Filtration's ramp-up, and to management of global inventories. Excluding the previously noted favorable adjustments of $1.4 million,reconciliation table on page 35, adjusted operating income increased $8.9 million (21%), primarily as a result of lower input costs net of selling price reductions, a more profitable mix of filtration products (including media for the technical products business decreased $5.8 million (10%).face masks) and reductions in SG&A and other spending. These were partly offset by lower sales and production volumes and related manufacturing cost inefficiencies.
•Operating income for our fine paper and packaging business decreased $40.1$29.9 million (58%(56%) from the prior year period The decrease was mainly due to adjustments of $24.3 million of impairment related toperiod. Excluding unfavorable adjusting items discussed above and shown on the sale of the Brattleboro mill and associated research and office facilities, pension settlement costs related to withdrawing from a multiemployer pension plan, restructuring costs, and an insurance settlement. In addition,reconciliation table on page 35, adjusted operating income declined due to higher input and distribution costs,decreased $27.8 million (47%) from the prior year primarily as a result of lower sales and production volumes and a lower-priced mix that wererelated manufacturing cost inefficiencies. The impact of lower volumes was only partly offset by higherspending reductions and lower input costs net of selling prices and reduced SG&A expenses. Excluding the costs of $24.3 million in 2018 and $2.9 million of insurance settlement proceeds in 2017, adjusted operating income for the fine paper and packaging business decreased $12.9 million (19%).price reductions.
Operating loss for our Other segment was $6.4 million compared with $0.4 million in the prior year period due to costs of $5.9 million for impairment, pension settlement costs, restructuring, and insurance-related settlement in 2018. These costs of $5.9 million compared to $0.3 million insurance settlement proceeds received in 2017.
•Unallocated corporate costs for the year ended December 31, 20182020 were $19.8$24.6 million, or $0.3$5.1 million lowerhigher than the prior year. 2018 includedExcluding unfavorable adjusting items of $1.9discussed above and shown on the reconciliation table on page 35, the unallocated corporate costs decreased $0.2 million for pension settlement, restructuring and other costs. These costs compared to $1.9 million of acquisition, restructuring, and pension settlement costs in 2017.from prior year.
Year 2017 versus 2016
|
| | | | | | | | | | | | | | | | | | | | | | | | | | | | | | | | |
| | | | | | | Change in Operating Income (Loss) Compared to the Prior Year |
| | | For the Years Ended
December 31, | | | | Change Due To |
| | | 2017 | | 2016 | | Total Change | | Volume | | Net Price (a) | | Input Costs (b) | | Currency | | Other (c) |
| Technical Products | | $ | 55.3 |
| | $ | 65.6 |
| | $ | (10.3 | ) | | $ | 5.9 |
| | $ | 1.9 |
| | $ | (5.6 | ) | | $ | 0.4 |
| | $ | (12.9 | ) |
| Fine Paper and Packaging | | 69.5 |
| | 70.7 |
| | (1.2 | ) | | 2.9 |
| | (3.4 | ) | | (2.5 | ) | | — |
| | 1.8 |
|
| Other | | (0.4 | ) | | (1.1 | ) | | 0.7 |
| | (0.3 | ) | | (0.5 | ) | | (0.1 | ) | | — |
| | 1.6 |
|
| Unallocated corporate costs | | (20.1 | ) | | (21.1 | ) | | 1.0 |
| | — |
| | — |
| | — |
| | — |
| | 1.0 |
|
| Consolidated | | $ | 104.3 |
| | $ | 114.1 |
| | $ | (9.8 | ) | | $ | 8.5 |
| | $ | (2.0 | ) | | $ | (8.2 | ) | | $ | 0.4 |
| | $ | (8.5 | ) |
_______________________
| | | | | | | | | | | | | | | | | | | | | | | | | | | | | | | | | | | | | | | | | | | | | | | | | | |
(a) | Includes price changes, net of changes in product mix. |
| | | | | | | | | | | | | | |
(b) | Includes price changes for raw materials and energy. |
| | | | |
(c) | Includes other manufacturing costs, over (under) absorption of fixed costs, distribution and SG&A expenses, start-up and other costs for the U.S. filtration business, insurance settlement, and acquisition/integration/restructuring costs. | | | | | |
| | | | | | | | | | | | | | | | |
| | | | | | | | | | | | | | | | |
| | | | | | | | | | | | | | | | |
| | | | | | | | | | | | | | | | |
| | | | | | | | | | | | | | | | |
| | | | | | | | | | | | | | | | |
Consolidated operating income of $104.3 million for the year ended December 31, 2017 decreased $9.8 million (9%) from the prior year. The decline was primarily due to higher costs from the U.S. transportation filtration business start-up phase. Operating income benefited in 2017 from higher volumes and selling prices, proceeds from a representations and warranties insurance settlement and improved operational efficiencies. In addition to filtration start-up costs, operating income decreased due to higher input and freight costs, a lower value mix in Fine Paper and Packaging, and acquisition costs related to the Coldenhove Acquisition. Excluding the insurance settlement of $3.2 million, acquisition and integration costs of $1.3 million, and pension and SERP settlement charges of $0.6 million in 2017, and aggregate charges of $7.8 million for integration and restructuring costs and pension settlement losses, operating income for the year ended December 31, 2018 decreased $18.9 million (16%) from the prior year. See later in this section for further information regarding the presentation of operating income, as adjusted.
Operating income for our technical products business decreased $10.3 million (16%) from the prior year primarily due to higher costs from the U.S. transportation filtration start-up. Excluding the higher costs from the U.S. transportation filtration business, operating income for technical products increased due to higher sales volumes, manufacturing efficiencies, and lower integration and restructuring costs. These items were partially offset by unfavorable impacts from higher material and transportation costs. Results for the year ended December 31, 2016 include $1.4 million for integration/restructuring costs. Excluding integration/restructuring costs, operating income for the technical products business decreased $11.7 million (17%).
Operating income for our fine paper and packaging business decreased $1.2 million (2%) from the prior year period primarily due to higher material and transportation costs and a lower priced product mix, that were partly offset by higher sales volume, increased selling prices, lower integration costs, and an insurance settlement of $2.9 million. Results for the year ended December 31, 2016 include $1.8 million for integration costs related to the FiberMark Acquisition. Excluding the insurance settlement and integration costs, operating income for the fine paper and packaging business decreased $5.9 million (8%).
Unallocated corporate costs for the year ended December 31, 2017 were $20.1 million, or $1.0 million favorable to the prior year. Excluding charges of $1.3 million for acquisition and integration, and $0.6 million of pension and SERP settlement charges in 2017, and $0.8 million for a pension plan settlement charge and $2.7 million of restructuring costs in 2016, unallocated corporate expenses were $0.6 million unfavorable to the prior year.
The following table sets forth our operating income by segment, adjusted for the effects of certain costs, for the periods indicated:
| | | | | | | | | | | | | | | | | | | | |
| | | | | YTD |
| | | | | | | 2020 | | 2019 | | |
| Technical Products | | | | | | | | | | |
| GAAP Operating Income (Loss) | | | | | | $ | (4.8) | | | $ | 44.6 | | | |
| Asset restructuring and impairment costs | | | | | | 54.1 | | | — | | | |
| Other restructuring and non-routine costs | | | | | | 0.7 | | | 0.3 | | | |
| COVID-19 costs | | | | | | 1.4 | | | — | | | |
| Loss on debt extinguishment | | | | | | 0.1 | | | — | | | |
| Pension and SERP adjustments | | | | | | 0.8 | | | (1.5) | | | |
| | | | | | | | | | |
| Adjusted operating income | | | | | | $ | 52.3 | | | $ | 43.4 | | | |
| | | | | | | | | | |
| Fine Paper and Packaging | | | | | | | | | | |
| GAAP operating income | | | | | | $ | 23.3 | | | $ | 53.2 | | | |
| Asset restructuring and impairment costs | | | | | | 3.7 | | | 4.7 | | | |
| Other restructuring and non-routine costs | | | | | | 2.2 | | | 1.0 | | | |
| COVID-19 costs | | | | | | 1.5 | | | — | | | |
| Pension and SERP adjustments | | | | | | 0.4 | | | — | | | |
| Adjusted operating income | | | | | | $ | 31.1 | | | $ | 58.9 | | | |
| | | | | | | | | | |
| Other/Unallocated Corporate Costs | | | | | | | | | | |
| GAAP Operating Loss | | | | | | $ | (24.6) | | | $ | (19.5) | | | |
| Other restructuring and non-routine costs | | | | | | 1.3 | | | 0.2 | | | |
| COVID-19 costs | | | | | | 0.6 | | | — | | | |
| Loss on debt extinguishment | | | | | | 1.8 | | | — | | | |
| Pension and SERP adjustments | | | | | | 0.4 | | | 0.1 | | | |
| Acquisition due diligence costs | | | | | | 1.5 | | | — | | | |
| Adjusted operating loss | | | | | | $ | (19.0) | | | $ | (19.2) | | | |
| | | | | | | | | | |
| Consolidated | | | | | | | | | | |
| GAAP Operating Income (Loss) | | | | | | $ | (6.1) | | | $ | 78.3 | | | |
| Asset restructuring and impairment costs | | | | | | 57.8 | | | 4.7 | | | |
| Other restructuring and non-routine costs | | | | | | 4.2 | | | 1.5 | | | |
| COVID-19 costs | | | | | | 3.5 | | | — | | | |
| Loss on debt extinguishment | | | | | | 1.9 | | | — | | | |
| Pension and SERP adjustments | | | | | | 1.6 | | | (1.4) | | | |
| Acquisition due diligence costs | | | | | | 1.5 | | | — | | | |
| Adjusted operating income | | | | | | $ | 64.4 | | | $ | 83.1 | | | |
|
| | | | | | | | | | | | |
| | | YTD |
| | | 2018 | | 2017 | | 2016 |
| Technical Products | | |
| | |
| | |
| GAAP Operating Income | | $ | 50.9 |
| | $ | 55.3 |
| | $ | 65.6 |
|
| Impairment loss | | 1.1 |
| | — |
| | — |
|
| Restructuring and integration costs | | 1.0 |
| | — |
| | 1.4 |
|
| Pension settlement and other costs | | 0.4 |
| | — |
| | — |
|
| Acquisition-related adjustments | | (3.9 | ) | | — |
| | — |
|
| Adjusted operating income | | $ | 49.5 |
| | $ | 55.3 |
| | $ | 67.0 |
|
| | | | | | | |
| Fine Paper and Packaging | | |
| | |
| | |
| GAAP Operating Income | | $ | 29.4 |
| | $ | 69.5 |
| | $ | 70.7 |
|
| Impairment loss | | 24.4 |
| | — |
| | — |
|
| Restructuring and integration costs | | (0.2 | ) | | — |
| | 1.8 |
|
| Pension settlement and other costs | | 0.4 |
| | — |
| | — |
|
| Insurance Settlement | | (0.3 | ) | | (2.9 | ) | | — |
|
| Adjusted operating income | | $ | 53.7 |
| | $ | 66.6 |
| | $ | 72.5 |
|
| | | | | | | |
| Other/Unallocated Corporate | | |
| | |
| | |
| GAAP Operating Income | | $ | (26.2 | ) | | $ | (20.5 | ) | | (22.2 | ) |
| Impairment loss | | 5.6 |
| | — |
| | — |
|
| Restructuring, integration and other costs | | 1.3 |
| | 1.3 |
| | 3.8 |
|
| Pension settlement and other costs | | 1.0 |
| | 0.6 |
| | 0.8 |
|
| Insurance Settlement | | (0.1 | ) | | (0.3 | ) | | — |
|
| Adjusted operating income | | $ | (18.4 | ) | | $ | (18.9 | ) | | $ | (17.6 | ) |
| | | | | | | |
| Consolidated | | |
| | |
| | |
| GAAP Operating Income | | $ | 54.1 |
| | $ | 104.3 |
| | $ | 114.1 |
|
| Impairment loss | | 31.1 |
| | — |
| | — |
|
| Restructuring, integration and other costs | | 2.1 |
| | 1.3 |
| | 7.0 |
|
| Pension settlement and other costs | | 1.8 |
| | 0.6 |
| | 0.8 |
|
| Acquisition-related adjustments | | (3.9 | ) | | — |
| | — |
|
| Insurance Settlement | | (0.4 | ) | | (3.2 | ) | | — |
|
| Adjusted operating income | | $ | 84.8 |
| | $ | 103.0 |
| | $ | 121.9 |
|
In accordance with generally accepted accounting principles in the United States ("GAAP"), consolidated operating income includes the pre-tax effects of anasset restructuring and impairment costs, other restructuring and non-routine costs, COVID-19 costs, loss acquisition, integrationon debt extinguishment, pension and restructuring costs, pension plan settlement and other costs, acquisition-relatedSERP adjustments, and an insurance settlement.acquisition due diligence costs. We believe that by adjusting reported operating income to exclude the effects of thesesuch items, the resulting adjusted operating income is on a basis that reflects the results of our ongoing operations. In assessing COVID-19 impacts, we excluded only costs which were unusual, incremental and directly attributable to mitigating the effects COVID-19 on our operations. We believe that providing adjusted operating results will help investors gain an additional perspective of underlying business trends and results. Adjusted operating income is not a recognized term under GAAP and should not be considered in
isolation or as a substitute for operating income derived in accordance with GAAP. Other companies may use different methodologies for calculating their non-GAAP financial measures and, accordingly, our non-GAAP financial measures may not be comparable to their measures.
Additional Statement of Operations Commentary:
•SG&A expense of $88.0 million for the year ended December 31, 2020 was $10.6 million lower than 2019. Costs in 2020 were lower due to actions taken to reduce costs in areas including marketing, travel, and payroll-related spending, including impacts of furloughs, headcount reductions and wage and hiring freezes. SG&A expense as a percentage of net sales for the years ended December 31, 2018, 2017 and 2016 was 9.3 percent, 9.7 percent and 9.6 percent, respectively. SG&A expense for 2018 included the impact of lower accruals for incentive compensation. SG&A expense of $95.3 million for the year ended December 31, 2017 was $5.3 million higher than 2016 due2020 of 11.2 percent remained comparable to increased SG&A associated with U.S. transportation filtration business, incremental costs related to the Coldenhove Acquisition and higher spending due to increased sales10.5 percent in Technical Products.2019 despite lower sales.
•For the years ended December 31, 2018, 20172020 and 2016,2019, we incurred $13.0 million, $12.7$12.6 million and $11.2$11.8 million of interest expense, respectively. The increaseIn addition to higher debt in the second half of 2020, 2020 interest expense included an incremental $0.4 million due to an overlap in interest expenseincurred in 2017 from 2016 was primarily due to capitalization of interest of $0.8 million for the U.S. filtration project in 2016, higher interest rates in 2017July on both our Senior Notes and higher borrowing relatedTerm Loan B, prior to the Coldenhove Acquisition.redemption of the 2021 Senior Notes on July 16, 2020.
•Income tax expense (benefit) represented 9 percent, 12(16) percent and 2917 percent of income (loss) from continuing operations before income taxes for the years ended December 31, 2018, 20172020 and 2016,2019, respectively. In general, our effective tax rate differs from the U.S. statutory tax rate primarily due to impacts of changes in the mix of earnings in taxing jurisdictions with differing statutory rates, the impact of R&D and other tax credits, changes in tax laws and changes in corporate structure as a result of business acquisitions and dispositions.
•For the year ended December 31, 2020, our effective income tax (benefit) rate related to continuing operations of (16) percent was significantly impacted by the effects of the pre-tax loss in the U.S. resulting from the $52.3 million asset impairment loss of the U.S. transportation filtration asset (see Note 12, "Asset Restructuring and Impairment Costs" of Notes to Condensed Consolidated Financial Statements) recorded during the three months ended June 30, 2020. Also, as a result of the impacts of COVID-19 and other factors, we evaluated our ability to utilize our deferred tax assets, including research and development and other tax credits and NOLs, before they expire. During 2020, the effective income tax (benefit) rate was negatively impacted by a $4.6 million increase to the valuation allowance against our state tax credits and NOLs.
For the year ended December 31, 2018,2019, our effective income tax rate related to continuing operations was 917 percent, primarily due to the reduction in the U.S. federal tax rate from 35% to 21%. In addition, the effective tax rate was significantly reduced by the effects of the $31.1 million impairment loss of the Brattleboro mill and associated research and office facilities (see Note 14 of Notes to Consolidated Financial Statements, "Sale of Brattleboro Mill and Impairment Loss"), as similar sized reconciling items had a larger percentage impact on lower pre-tax book income. Throughout 2018, we completed our analysis of the Tax Act (see below) and recorded additional adjustments to reflect a measurement-period tax benefit of $0.9 million related toR&D tax credits generated during the effects of the statutory corporate tax rate reduction and a measurement-period tax expense of $0.8 million from U.S. federal and state taxes on accumulated earnings and profits ("E&P") of its foreign subsidiaries.year.
For the year ended December 31, 2017, our effective income tax rate related to continuing operations was 12 percent. •On December 22, 2017,March 27, 2020, the U.S. government enacted comprehensive tax legislation in the Tax CutsCoronavirus Aid, Relief and JobsEconomic Security Act of 2017 (the "Tax("CARES Act"). The TaxCARES Act significantly revisedincluded various income and payroll tax provisions designed to stimulate the economy and provide relief to businesses. Among its benefits was the ability to enhance the value of NOLs by allowing the carryback of NOLs to tax years in which the U.S. corporatefederal statutory income tax by, among other things, reducingrate was 35%. During the statutory corporate tax rate from 35% to 21% effective January 1, 2018, eliminating certain deductions, imposing a mandatory one-time tax on accumulated earnings of foreign subsidiaries, introducing new tax regimes and changing how foreign earnings are subject to U.S. tax. The Tax Act also enhanced and extended through 2026 the option to claim accelerated depreciation deductions on qualified property. In conjunction with the tax law changes, the SEC in Staff Accounting Bulletin No. 118 ("SAB 118") provided for a measurement period of one year from the enactment date to finalize the accounting for effects of the Tax Act. As ofthree months ended December 31, 2017,2020, we provisionally recorded an income tax benefit of $6.5$0.9 million relatedand a corresponding tax receivable of $8.0 million for this tax refund to the Tax Act. This amount was comprised of a $10.3 millionbe received during 2021. In addition, we generated cash tax benefitsavings from the remeasurementoption to delay payment of federal net deferred income tax liabilities resulting from the reduction in the U.S. statutory corporate tax rate to 21% from 35%, less $3.8$4.4 million of 2020 U.S. payroll taxes until December 31, 2021 and 2022. We also utilized the payroll tax expense from the mandatory one-time tax on the previously untaxed accumulated E&P of our foreign subsidiaries.
In June 2017, as partprovisions of the annual strategic plan review, we reassessed our intentions regardingEmployee Retention Credit of the indefinite reinvestmentCARES Act to partially offset qualified wages and benefits of undistributed earningsemployees impacted by COVID-19 travel and other work restrictions. We utilized similar COVID-19 relief measures in Germany, the Netherlands and the U.K. aimed at providing subsidies for employee retention and deferral of our German operations and asserted our intent to indefinitely reinvest them. As a result, effective in the second quarter of 2017, we did not provide deferred income taxes on 2017 unremitted earnings of our German operations. In addition, in that quarter the deferred income tax liability of $4.1 million which was recorded in 2016 on unremitted German earnings was eliminated with a reduction to 2017 income tax expense. As noted above, the Tax Act included a mandatory one-time tax on previously untaxed accumulated E&P of its foreign subsidiaries, and as a result, previously unremitted E&P from all foreign countries were subject to this U.S. tax and a liability of $3.8 million was recorded thereon as of December 31, 2017.payments.
For the year ended December 31, 2016, our effective income tax rate related to continuing operations was 29 percent. The adoption of ASU 2016-09, Compensation—Stock Compensation (Topic 718): Improvements to Employee Share-Based Payment Accounting, allowed excess tax benefits from share-based payments to be shown as a reduction to income tax expense and reduced the rate for the year by 3 percent.
Liquidity and Capital Resources
We believe that we have a strong financial position and the liquidity to withstand economic uncertainty during this volatile period, in consideration of the following: |
| | | | | | | | | | | | |
| | | Year Ended December 31, |
| | | 2018 | | 2017 | | 2016 |
| Net cash flow provided by (used in): | | |
| | |
| | |
|
| Operating activities | | $ | 92.7 |
| | $ | 100.0 |
| | $ | 115.8 |
|
| Investing activities: | | |
| | |
| | |
|
| Capital expenditures | | (38.1 | ) | | (42.7 | ) | | (68.5 | ) |
| Proceeds from sale of property, plant and equipment | | 5.0 |
| | — |
| | — |
|
| Acquisitions | | — |
| | (43.1 | ) | | — |
|
| Asset acquisition | | — |
| | (8.0 | ) | | — |
|
| Other investing activities | | (1.2 | ) | | (1.2 | ) | | 0.3 |
|
| Total | | (34.3 | ) | | (95.0 | ) | | (68.2 | ) |
| Financing activities | | (52.6 | ) | | (3.8 | ) | | (48.4 | ) |
| Effect of exchange rate changes on cash and cash equivalents | | (0.4 | ) | | 0.2 |
| | (0.3 | ) |
| Net increase (decrease) in cash and cash equivalents | | $ | 5.4 |
| | $ | 1.4 |
| | $ | (1.1 | ) |
•we had no outstanding borrowings as of December 31, 2020 under our Global Revolving Credit Facility; with a significant remaining availability of $138.6 million;
•we have no near-term debt maturities, as the Global Revolving Credit Facility matures in December 2023 and the Term Loan B facility matures in June 2027;
| | | | | | | | | | | | | | | | |
| | | Year Ended December 31, |
| | | 2020 | | 2019 | | |
| Net cash flow provided by (used in): | | | | | | |
| Operating activities | | $ | 93.4 | | | $ | 97.6 | | | |
| Investing activities: | | | | | | |
| Capital expenditures | | (18.9) | | | (21.4) | | | |
| Proceeds from sale of property, plant and equipment | | 0.5 | | | — | | | |
| | | | | | |
| | | | | | |
| | | | | | |
| | | | | | |
| Other investing activities | | (1.1) | | | (1.9) | | | |
| Total investing activities | | (19.5) | | | (23.3) | | | |
| Financing activities | | (47.0) | | | (75.2) | | | |
| Effect of exchange rate changes on cash and cash equivalents | | 1.2 | | | — | | | |
| Net increase (decrease) in cash and cash equivalents | | $ | 28.1 | | | $ | (0.9) | | | |
Operating Cash Flow Commentary
•Cash provided by operating activities of $92.7$93.4 million for the year ended December 31, 20182020 was $7.3$4.2 million lesslower than cash provided by operating activities of $100.0$97.6 million in the prior year. The decrease in cash flows resulted from a $19.1 million reduction in operating income (excluding the non-cash $31.1 million impairment loss of the Brattleboro mill) and higher contributionsActions to pension plans to take advantage of the effects of the 2017 Tax Act, partly offset by a $10.8 million lower investment inimprove working capital in 2018.and to reduce spending largely offset the impact from lower earnings.
Cash provided by operating activities of $100.0 million for the year ended December 31, 2017 was $15.8 million less than cash provided by operating activities of $115.8 million in the prior year. The unfavorable comparison was primarily due to a $9.8 million decrease in operating income and an increase of $10.6 million in our investment in working capital for the year ended December 31, 2018. These items were offset by lower cash tax payments and lower contributions and benefit payments for post-retirement benefit obligations in 2017.
Investing Cash Flow Commentary:
•For the years ended December 31, 20182020 and 2017,2019, cash used by investing activities was $34.3$19.5 million and $95.0$23.3 million, respectively. For the year ended December 31, 2018, cash usedCapital spending was reduced in 2020 by investing activities includes $5.0$2.5 million of proceeds for the sale of the Brattleboro mill. For the year ended December 31, 2017, cash used by investing activities includes $43.1 million for the Coldenhove Acquisition and $8.0 million for acquisition of a laminating asset.to preserve liquidity.
Capital expenditures for the year ended December 31, 2018 were $38.1 million compared to spending of $42.7 million in the prior year. Capital expenditures for the year ended December 31, 2017 were $42.7 million compared to spending of $68.5 million in the prior year. The capital expenditures were higher than normal due to the U.S. Filtration project which was completed in 2016.
For 2019,•Going forward, we expect aggregate annual capital expenditures to be within our targetreturn to a range of approximately 32 to 54 percent of net sales. We believe that thethis level of our capital spending can be more than adequately funded from cash provided from operating activities and allows us to maintain the efficiency and cost effectiveness of our assets andwhile also investinvesting in expanded manufacturing capabilities to successfully pursue strategic initiatives and deliver attractive returns.
Financing Cash Flow Commentary:
Our liquidity requirements are provided by cash generated from operations and shortshort- and long-term borrowings.
•On July 16, 2020, we completed the redemption in full of the $175 million of 2021 Senior Notes using the $200 million of proceeds from the Term Loan B which we entered into on June 30, 2020.
•For the year ended December 31, 2018,2020, cash used by financing activities was $52.6$47.0 million compared to cash used by financing activities of $3.8$75.2 million for the prior year. The increasechange was due to higherlower net debt repayments of $12.8$4.3 million in 20182020 compared to net borrowings of $30.4$38.1 million in the prior year, higher share repurchases and dividends paid in 2018. year.
•For the year ended December 31, 2017,2020, cash used by financing activities was $3.8and cash equivalents increased $28.1 million compared to cash used by financing activities of $48.4$37.1 million for the prior year.at December 31, 2020 from $9.0 million at December 31, 2019. Total debt decreased $6.4 million to $194.4 million at December 31, 2020 from $200.8 million at December 31, 2019. The decrease was due to higher netin total debt borrowings and lower share repurchases, offset by higher dividends paid in 2017.reflects repayment of all
We have the following short- and long-term borrowings:
Secured Bank Credit Facility
In December 2018, we entered into the Fourth Amended Credit Agreement. The Fourth Amended Credit Agreement, among other things: (1) increased the maximum principal amount of our existing credit facility for the U.S. Revolving Credit Facility to $150 million; (2) maintained the German Revolving Credit Facility in the maximum principal amount of $75 million; (3) caused Neenah and the other domestic borrowers to guarantee, among other things, the obligations arising under the German Revolving Credit Facility; (4) provides for the Global Revolving Credit Facilities to mature on December 10, 2023; and (5) modifies the accordion feature permitting one or more increases in the Global Revolving Credit Facilities in an aggregate principal amount not exceeding $125 million, such that the aggregate commitmentsamounts outstanding under the Global Revolving Credit Facilities do not exceed $350Facility and scheduled repayments of the Term Loan B and other debt (described below), which exceeded the net incremental borrowing from the Term Loan B (compared to the extinguished 2021 Senior Notes). Net debt (total debt minus cash and cash equivalents) decreased by $34.5 million. In addition, domestic borrowers may request letters
•We have the following credit facilities:
Global Revolving Credit Facility
On June 30, 2020, we amended our principal credit agreement (Fourth Amended and Restated Credit Agreement) to among other things, (a) remove the applicable components of creditthe Term Loan B Priority Collateral (as defined in Note 6 to our consolidated financial statement included herein) from the borrowing base calculation under the U.S.Global Revolving Credit Facility, in an aggregate face amount not to exceed $20 million outstanding at any time, and German borrowers may request letters(b) permit the pledging of creditthe Collateral under the Term B Facility and subordinate liens of the Fourth Amended and Restated Credit Agreement lenders on Term Loan B Priority Collateral to the first position liens on Term Loan B Priority Collateral under the Term B Facility, (c) reduce the U.S. revolving credit facility amount from $150 million to $125 million, (d) reduce the German revolving credit facility amount from $75 million to $50 million, and (e) adjust certain reporting and financial covenant activation and deactivation thresholds. The variable interest rates on our revolving credit facility are based on LIBOR as a benchmark, exposing us to possible changes in interest in the event that the method for determining LIBOR changes, LIBOR is replaced by an alternative reference rate or LIBOR is phased out altogether. The impact related to any changes cannot be predicted at this time. As of December 31, 2020, we had no borrowings outstanding under our Global Revolving Credit Facility in an aggregate face amount not to exceed $5 million outstanding at any time.Facility. See Note 76 of Notes to Consolidated Financial Statements, "Debt."
Unsecured Senior NotesTerm Loan B Facility
We haveOn July 16, 2020, we completed the redemption in full of the $175 million of 2021 Senior Notes. ProceedsNotes using the $200 million of proceeds from this offering were usedthe Term Loan B which we entered into on June 30, 2020. Under the terms of the Term Loan Credit Agreement, and subject to retirecertain conditions and adjustments, the remainingCompany may from time to time solicit the Term Loan B Lenders or new lenders to provide incremental term loan financings under the Term B Facility up to $125 million in the aggregate (each an "Incremental Term Facility"). Under the terms of the Term Loan Credit Agreement, borrowings under the Term B Facility will bear interest, as selected by the Company, at a per annum rate equal to either (a) the reserve-adjusted LIBOR rate for interest periods of one, two or three months, plus an applicable rate of 4.00% per annum, or (b) the Alternate Base Rate, plus an applicable rate of 2.00% per annum. “Alternate Base Rate” will be equal to the greatest of (1) the prime rate as quoted from time to time in The Wall Street Journal or published by the Federal Reserve Board, (2) the overnight bank funding rate established by the Federal Reserve Bank of New York, plus 50 basis points, and (3) one-month reserve-adjusted LIBOR plus 100 basis points. The Alternate Base Rate is subject to a “floor” of 2.0%, and the adjusted LIBOR rate is subject to a “floor” of 1.0%. As of December 31, 2020, the weighted-average interest rate on outstanding Term Loan borrowings was 5.0% per annum. The Term Loan B is repayable in equal quarterly installments commencing on September 30, 2020 in an aggregate annual amount equal to 1% of the original principal amount of 2014 Senior Notes,the Term B Facility (subject to repay approximately $56 millioncertain reductions in outstanding revolver borrowings under our bank credit agreementconnection with debt prepayments and for general corporate purposes.debt buybacks). The entire unpaid principal balance of the Term Loan B, together with all accrued and unpaid interest thereon, will be due and payable at maturity on June 30, 2027. See Note 76 of Notes to Consolidated Financial Statements, "Debt."
Other Debt
In January 2013, Neenah Germany entered into a project financing agreement for the construction of a melt blown machine (the "Second German Loan Agreement"). The Second German Loan Agreement provides for €9.0 million of construction financing which is secured by the melt blown machine. The loan matures in September 2022 and principal is repaid in equal quarterly installments. At December 31, 2018, €4.22020, €2.0 million ($4.82.4 million, based on exchange rates at December 31, 2018)2020) was outstanding under the Second German Loan Agreement.
In May 2018, Neenah Germany entered into a project financing agreement for construction of a regenerative thermal oxidizer (the "Third German Loan Agreement") to increase the capacity of the existing saturators and ensure compliance with new European air emission standards. The agreement provides for €5.0 million of financing and is secured by the asset. The loan matures in March 2023September 2022 and principal is repaid in 1613 equal quarterly installments beginning in June 2019. The interest rate on amounts outstanding is 1.45 percent based on actual days elapsed in a 360-day year and is payable quarterly. In the fourth quarter 2018, we received a subsidy from the German government of $0.9 million due to completion of the regenerative thermal oxidizer project. At December 31, 2018, €4.32020, €2.1 million ($4.92.6 million, based on exchange rates at December 31, 2018)2020) was outstanding under the Third German Loan Agreement.
•Availability under our revolving credit facilityGlobal Revolving Credit Facility varies over time depending on the value of our inventory, receivables and (in the case of the German Revolving Credit Facility) various capital assets. As of December 31, 2018,2020, we had $57.9no borrowings, and $0.3 million of outstanding letters of credit, outstanding under our RevolverGlobal Revolving Credit Facility and $154.0$138.6 million of available credit (based on exchange rates at December 31, 2018)2020).
•We have required debt payments through December 31, 20172021 of $2.3$4.9 million on the Term Loan B and the Second and Third German Loan Agreements.Agreements
For the year ended December 31, 2018, cash and cash equivalents increased $5.4 million to $9.9 million at December 31, 2018 from $4.5 million at December 31, 2017. Total debt decreased $16.4 million to $239.1 million at December 31, 2018 from $255.5 million at December 31, 2017. Net debt (total debt minus cash and cash equivalents) decreased by $21.8 million. Total debt was higher at December 31, 2017 due to higher borrowings to finance the Coldenhove Acquisition.
•As of December 31, 2018,2020, our cash balance of $9.9$37.1 million consists of $4.3$16.6 million in the U.S. and $5.6$20.5 million held at entities outside of the U.S. As of December 31, 2018,2020, there were no restrictions regarding the repatriation of our non-U.S. cash.
Transactions with Shareholders
•For the years ended December 31, 20182020 and 2017,2019, we paid quarterly cash dividends of $0.41$0.47 per common share or $27.8$31.9 million annually and $0.37$0.45 per common share or $25.1$30.5 million, annually, respectively.
•In November 2018, our Board of Directors approved a 10 percent increase in the quarterly dividend rate on our common stock to $0.45 per share, scheduled to be paid in March 2019.
In November 2018,2020, our Board of Directors authorized a program for the purchase of up to $25 million of outstanding common stock effective January 1, 20192021 ("2019 Stock Purchase Plan"). The program does not require the Company to purchase any specific number of shares and may be suspended or discontinued at any time. Purchases under the 2019 Stock Purchase Plan will be made from time to time in the open market or in privately negotiated transactions in accordance with the requirements of applicable law. The timing and amount of any purchases will depend on share price, market conditions and other factors. For the year ended December 31, 2018,2020, we acquired approximately 124,43459,577 shares of Common Stock at a cost of $9.3$3.6 million. For further details on our Stock Purchase Plans refer to Note 109 of Notes to Consolidated Financial Statements, "Stockholders' Equity."
•For the years ended December 31, 20182020 and 2017,2019, we acquired approximately 25,89022,064 and 28,00017,774 shares of Common Stock, respectively, at a cost of $1.5$1.2 million and $2.5$1.3 million, respectively, for shares surrendered by employees to pay taxes due on vested restricted stock awards and stock appreciation rights exercised. In addition, we received $0.6 million and $0.4 million in proceeds from the exercise of employee stock options for the years ended December 31, 2018 and 2017, respectively.
•Under the most restrictive terms of the Fourth Amended and Restated Credit Agreement, we are permitted to pay cash dividends on, orand repurchase shares of, our common stock up to the amount available under the Fourth Amended and Restated Credit Agreement,without limitation, as long as theour specified excess availability under the Fourth Amended and Restated Credit Agreement exceeds $28 million.the greater of (i) $20 million and (ii) 12.5% of our aggregate commitments under the Global Revolving Credit Facility (approximately $22 million as of December 31, 2020), on a pro forma basis after giving effect to such dividend or stock repurchase (as the case may be). If our specified excess availability, on a pro forma basis, is less than the availability is below $28 million,applicable threshold, we are restricted from payingsubject to certain restrictions on the amount of cash dividends or repurchasing shares.we are permitted to declare and the amount of share repurchases we are permitted to execute. As of December 31, 2018,2020, our availability was $154.0$138.6 million, so this restriction did not apply. See our availability under the Fourth Amended and Restated Credit Agreement in Note 76 of Notes to Consolidated Financial Statements, "Debt."
•Under the most restrictive terms of the 2021 Senior Notes,Term Loan Credit Agreement, we are permitted to pay cash dividends of up to $25 million in a calendar year, but not permitted toand repurchase shares of our common stock.stock in an aggregate amount not to exceed $8.75 million per fiscal quarter. However, as long as the nettotal leverage ratio (net debt/EBITDA) undercalculated in accordance with the 2021 Senior Notes is below 2.5x,Term Loan Credit Agreement does not exceed 2.5 to 1.0, we can pay dividends or repurchase shares without limitation. In the event the nettotal leverage ratio exceeds 2.5x,2.5 to 1.0, but is less than or equal to 3.5 to 1.0, we may still pay dividends or repurchase shares of our common stock in an aggregate amount in excess of $25$8.75 million or repurchase sharesper fiscal quarter by utilizing certain "restricted payment baskets" as defineddescribed in the indenture forTerm Loan Credit Agreement. In addition, we would be permitted to pay cash dividends and repurchase shares of our common stock in excess of $8.75 million per fiscal quarter if the 2021 Senior Notes.aggregate amount of such payments, together with the amount of redemptions or prepayments of certain indebtedness, is less than or equal to the greater of (i) $65 million and (ii) 9% of our consolidated tangible assets. As of December 31, 2018,2020, since our total leverage ratio was less than 2.5x,2.5 to 1.0, none of these covenants were restrictive to our ability to pay dividends on or repurchase shares of our common stock.
Contractual Obligations
The following table presents the total contractual obligations for which cash flows are fixed or determinable as of December 31, 2020:
| | | | | | | | | | | | | | | | | | | | | | | | | | | | | | | | | | | | | | | | | | | | |
| (In millions) | | 2021 | | 2022 | | 2023 | | 2024 | | 2025 | | Beyond
2025 | | Total |
| Long-term debt payments | | $ | 4.9 | | | $ | 4.1 | | | $ | 2.0 | | | $ | 2.0 | | | $ | 2.0 | | | $ | 189.0 | | | $ | 204.0 | |
| Interest payments on long-term debt (a) | | 10.0 | | | 9.8 | | | 9.7 | | | 9.6 | | | 9.5 | | | 14.1 | | | 62.7 | |
| Open purchase orders (b) | | 83.0 | | | — | | | — | | | — | | | — | | | — | | | 83.0 | |
| Other post-employment benefits (c) | | 6.0 | | | 4.8 | | | 4.5 | | | 4.1 | | | 3.7 | | | 12.3 | | | 35.4 | |
| Contributions to pension trusts and other benefit obligations (d) | | 5.8 | | | 0.1 | | | 0.1 | | | 0.1 | | | 0.1 | | | 1.1 | | | 7.3 | |
| Minimum purchase commitments (e) | | 1.5 | | | 0.8 | | | 0.2 | | | 0.2 | | | — | | | — | | | 2.7 | |
| Operating leases (f) | | 4.1 | | | 3.8 | | | 3.4 | | | 2.9 | | | 2.5 | | | 9.4 | | | 26.1 | |
| Total contractual obligations | | $ | 115.3 | | | $ | 23.4 | | | $ | 19.9 | | | $ | 18.9 | | | $ | 17.8 | | | $ | 225.9 | | | $ | 421.2 | |
_______________________
(a)Interest payments on long-term debt includes interest on variable rate debt at December 31, 2020 weighted average interest rates.
(b)The open purchase orders displayed in the table represent amounts we anticipate will become payable within the next 12 months for goods and services that we have negotiated for delivery.
(c)The above table includes future payments that we will make for postretirement benefits other than pensions. Those amounts are estimated using actuarial assumptions, including expected future service, to project the future obligations.
(d)We expect to make aggregate contributions to qualified and nonqualified defined benefit pension trusts and to pay pension benefits for unfunded pension of $5.8 million in 2021. The amount also includes estimated payments of $0.1 million per year over 20 years for the withdrawal liability from PIUMPF. See Note 7 of Notes to Consolidated Financial Statements, "Pension and Other Postretirement Benefits."
(e)The minimum purchase commitments in 2020 are primarily for utilities and information technology contracts. Although we are primarily liable for payments on the above minimum purchase commitments, based on historic operating performance and forecasted future cash flows, we believe our exposure to losses, if any, under these arrangements is not material.
(f)We adopted the ASU 2016-02, Leases (Topic 842) accounting standard in 2019 by recognizing the present value of the lease payments above as right-of-use assets and corresponding lease liabilities on our consolidated balance sheet. See Note 10 of Notes to Consolidated Financial Statements, "Leases."
Other Items:Items
•As of December 31, 2018,2020, we had $47.6 million of state NOLs. Our state NOLs may be used to offset approximately $3.0 million in state income taxes. If not used, substantially all of the state NOLs will expire in various amounts between 2019 and 2038. In addition, we had $20.4$28.2 million of U.S. federal and $7.2$7.4 million of U.S. state R&D Credits which, if not used, will expire between 20292028 and 20382040 for the U.S. federal R&D Credits and between 20202021 and 20332035 for the state R&D Credits. As of December 31, 2020, we had $71.8 million of state net operating losses (NOLs) which may be used to offset state taxable income. The NOLs are reflected in the consolidated financial statements as a deferred income tax asset of $4.4 million. If not used, substantially all of the NOLs will expire in various amounts between 2021 and 2040.
•Management believes that our ability to generate cash from operations and our borrowing capacity are adequate to fund working capital, capital spending and other cash needs for the next 12 months. Our ability to generate adequate cash from operations beyond 20182020 will depend on, among other things, our ability to successfully implement our business strategies, control costs in line with market conditions and manage the impact of changes in input prices and currencies. We can give no assurance we will be able to successfully implement these items.
Contractual Obligations
The following table presents the total contractual obligations for which cash flows are fixed or determinable as of December 31, 2018:
|
| | | | | | | | | | | | | | | | | | | | | | | | | | | | |
| (In millions) | | 2019 | | 2020 | | 2021 | | 2022 | | 2023 | | Beyond
2023 | | Total |
| Long-term debt payments | | $ | 2.3 |
| | $ | 2.4 |
| | $ | 177.4 |
| | $ | 2.0 |
| | $ | 58.5 |
| | $ | — |
| | $ | 242.6 |
|
| Interest payments on long-term debt (a) | | 11.1 |
| | 11.0 |
| | 6.0 |
| | 1.7 |
| | 1.5 |
| | — |
| | 31.3 |
|
| Open purchase orders (b) | | 66.3 |
| | — |
| | — |
| | — |
| | — |
| | — |
| | 66.3 |
|
| Other post-employment benefit and PIUMPF obligations (c) | | 5.3 |
| | 5.0 |
| | 5.4 |
| | 5.4 |
| | 5.1 |
| | 18.8 |
| | 45.0 |
|
| Contributions to pension trusts | | 9.4 |
| | — |
| | — |
| | — |
| | — |
| | — |
| | 9.4 |
|
| Minimum purchase commitments (d) | | 6.2 |
| | 0.7 |
| | 0.2 |
| | 0.2 |
| | — |
| | — |
| | 7.3 |
|
| Operating leases (e) | | 3.0 |
| | 2.5 |
| | 2.3 |
| | 2.1 |
| | 1.9 |
| | 9.6 |
| | 21.4 |
|
| Total contractual obligations | | $ | 103.6 |
| | $ | 21.6 |
| | $ | 191.3 |
| | $ | 11.4 |
| | $ | 67.0 |
| | $ | 28.4 |
| | $ | 423.3 |
|
_______________________
| |
(a) | Interest payments on long-term debt includes interest on variable rate debt at December 31, 2018 weighted average interest rates. |
| |
(b) | The open purchase orders displayed in the table represent amounts we anticipate will become payable within the next 12 months for goods and services that we have negotiated for delivery. |
| |
(c) | The above table includes future payments that we will make for postretirement benefits other than pensions. Those amounts are estimated using actuarial assumptions, including expected future service, to project the future obligations. The amount also includes estimated payments of $0.1 million per year over 20 years for the withdrawal liability from PIUMPF. See Note 8 of Notes to Consolidated Financial Statements, "Pension and Other Postretirement Benefits." |
| |
(d) | The minimum purchase commitments in 2019 are primarily for coal and corn starch contracts. Although we are primarily liable for payments on the above operating leases and minimum purchase commitments, based on historic operating performance and forecasted future cash flows, we believe our exposure to losses, if any, under these arrangements is not material. |
| |
(e) | We will adopt the ASU 2016-02, Leases (Topic 842) accounting standard on January 1, 2019 by recognizing the present value of the lease payments above (approximately $17 million) as right-of-use assets and corresponding lease liabilities on our consolidated balance sheet.
|
Adoption of New Accounting Pronouncements
See Note 2 of Notes to Consolidated Financial Statements, "Summary of Significant Accounting Policies — Recently Adopted Accounting Standards" for a description of accounting standards adopted in the year ended December 31, 2018.2020.
Critical Accounting Policies and Use of Estimates
The preparation of financial statements in conformity with GAAP in the United States requires estimates and assumptions that affect the reported amounts and related disclosures of assets and liabilities at the date of the financial statements and net sales and expenses during the reporting period. Actual results could differ from these estimates, and changes in these estimates are recorded when known. The critical accounting policies used in the preparation of the consolidated financial statements are those that are important both to the presentation of financial condition and results of operations and require significant judgments with regard to estimates used. These critical judgments relate to the reported amounts of assets and liabilities, disclosure of contingent assets and liabilities, and the reported amounts of expenses.
The following summary provides further information about the critical accounting policies and should be read in conjunction with the notes to the consolidated financial statements. We believe that the consistent application of our policies provides readers of our financial statements with useful and reliable information about our operating results and financial condition.
We have discussed the application of these critical accounting policies with the Audit Committee of our Board of Directors and Audit Committee.Directors.
Inventories
We value U.S. inventories at the lower of cost, using the last-in, first-out ("LIFO") method, or market. German and Dutch inventories are valued at the lower of cost, using a weighted-average cost method, or net realizable value. The first-in, first-out ("FIFO") value of U.S. inventories valued on the LIFO method was $109.1$88.5 million and $120.1$102.2 million at December 31, 20182020 and 2017,2019, respectively and exceeded such LIFO value by $15.4$6.4 million and $10.5$8.9 million, respectively. Cost includes labor, materials and production overhead. Under the LIFO inventory valuation method, changes in the cost of raw materials and production activities are recognized in cost of sales in the current period even though these materials and other costs may have been incurred at significantly different values due to the length of time of our production cycle. Since we value most of our inventory utilizing the LIFO inventory costing methodology, rapid changes in raw material costs have an immediate impact on our operating results.
Income Taxes
Significant judgment is required in determining our global provision for income taxes and recording the related tax assets and liabilities. In the ordinary course of our business, there are many transactions and calculations where the ultimate tax determination is less than certain. Our effective income tax rates include the tax effects of certain special items, such as R&D Credits, foreign tax rate differences, tax effects of foreign financing structures, changes in statutory tax rates and excess tax benefits from stock compensation. While we believe that these judgments and estimates are appropriate and reasonable under the circumstances, actual resolution of these matters may differ from recorded estimated amounts.
As of December 31, 20182020 and 2017,2019, our liability for uncertain income taxes positions was $10.1$8.0 million and $10.0$7.8 million, respectively. The determination of our provision for income taxes requires considerable judgment, the use of estimates, and the interpretation and application of complex tax laws. Significant judgment is also required in assessing the timing and amounts of deductible and taxable items and the probability of sustaining uncertain tax positions. Uncertain tax positions occur, and a resulting income tax liability is recorded when management concludes that an income tax position fails to achieve a more likely than not recognition threshold. When this occurs, the amount of tax benefits recognized may differ from the amount taken or expected to be taken on a tax return. These differences represent unrecognized tax benefits and
are reviewed at each reporting period based on facts, circumstances, available evidence and applicable laws. We haverecognize interest and penalties, if any, related to uncertain tax positions as a component of the provision for income taxes.
As of December 31, 2020 and 2019, the Company had $5.3 million and $5.2 million of foreign tax credits, all of which the Company believes will expire unutilized. Therefore, as of December 31, 2020 and 2019, the Company recorded a liability when we believevaluation allowance which was equal to the balance of the deferred income tax asset. As of December 31, 2020 and 2019, the Company also had a valuation allowance of $6.4 million and $0.7 million, respectively, against the gross value of its state tax credits and NOLs. Including the federal benefit of state taxes, the net valuation allowance reflected on the consolidated balance sheets was $5.1 million and $0.5 million as of December 31, 2020 and 2019, respectively. In determining the need for a valuation allowance, the Company considers many factors, including specific taxing jurisdictions, sources of taxable income, income tax strategies and forecasted earnings for the entities in each jurisdiction. A valuation allowance is recognized if, based on the weight of available evidence, the Company concludes that it is "moremore likely than not"not that some portion or all of the tax benefit reported on ourdeferred income tax returnsasset will not be realized. In evaluating and estimating tax positions and tax benefits, we consider many factors which may result in periodic adjustments and which may not accurately anticipate actual outcomes.
Pension and Other Postretirement Benefits
Consolidated pension expense related to continuing operations for defined benefit pension plans was $7.7$4.0 million, $7.0$3.7 million and $9.5$7.7 million for the years ended December 31, 2020, 2019 and 2018, 2017respectively. See Note 7, "Pension and 2016, respectively.Other Postretirement Benefits" for components of net periodic benefit cost. Accounting for defined
benefit pension plans requires various assumptions, including, but not limited to, discount rates, expected long-term rates of return on plan assets, future compensation growth rates and mortality rates. Accounting for our postretirement benefit plans also requires various assumptions, which include, but are not limited to, discount rates and annual rates of increase in the per capita costs of health care benefits.
The following chart summarizes the more significant assumptions used in the actuarial valuation of our defined benefit plans for each of the past three years:
| | | | | 2018 |
| | 2017 |
| | 2016 |
| | 2020 | | 2019 | | 2018 |
| Pension plans | | | | | | | Pension plans | |
| Weighted average discount rate for benefit expense | | 3.65 | % | | 4.18 | % | | 4.54 | % | Weighted average discount rate for benefit expense | | 2.98 | % | | 3.78 | % | | 3.65 | % |
| Weighted average discount rate for benefit obligation | | 3.94 | % | | 3.49 | % | | 4.16 | % | Weighted average discount rate for benefit obligation | | 2.28 | % | | 2.98 | % | | 3.94 | % |
| Expected long-term rate on plan assets | | 5.78 | % | | 6.31 | % | | 6.20 | % | Expected long-term rate on plan assets | | 5.42 | % | | 5.91 | % | | 5.78 | % |
| Rate of compensation increase | | 2.44 | % | | 2.49 | % | | 2.18 | % | |
| Rate of compensation increase for benefit expense | | Rate of compensation increase for benefit expense | | 2.05 | % | | 2.33 | % | | 2.44 | % |
| Postretirement benefit plans | | | | | | | Postretirement benefit plans | |
| Weighted average discount rate for benefit expense | | 3.42 | % | | 3.89 | % | | 4.07 | % | Weighted average discount rate for benefit expense | | 2.68 | % | | 3.84 | % | | 3.42 | % |
| Weighted average discount rate for benefit obligation | | 3.84 | % | | 3.27 | % | | 3.69 | % | Weighted average discount rate for benefit obligation | | 1.67 | % | | 2.68 | % | | 3.84 | % |
| Health care cost trend rate assumed for next year | | 6.80 | % | | 6.80 | % | | 7.00 | % | Health care cost trend rate assumed for next year | | 5.25 | % | | 6.10 | % | | 6.80 | % |
| Ultimate cost trend rate | | 4.50 | % | | 4.50 | % | | 4.50 | % | Ultimate cost trend rate | | 4.50 | % | | 4.50 | % | | 4.50 | % |
| Year that the ultimate cost trend rate is reached | | 2037 |
| | 2037 |
| | 2037 |
| Year that the ultimate cost trend rate is reached | | 2037 | | 2037 | | 2037 |
The discount (or settlement) rate that is utilized for determining the present value of future pension obligations in the U.S. is generally based on the yield for a theoretical basket of AA-rated corporate bonds currently available in the market place, whose duration matches the timing of expected pension benefit payments. The discount (or settlement) rate that is utilized for determining the present value of future pension obligations in Germany is generally based on the IBOXX index of AA-rated corporate bonds adjusted to match the timing of expected pension benefit payments.
The expected long-term rate of return on pension fund assets held by our pension trusts was determined based on several factors, including input from pension investment consultants and projected long-term returns of broad equity and bond indices. We also considered the plans' historical 10-year and 15-year compounded annual returns. We evaluate our investment strategy and long-term rate of return on pension asset assumptions at least annually.
For the years ended December 31, 2018, 20172020, 2019 and 2016,2018, consolidated postretirement health care and life insurance plan benefit expense was $3.1$2.9 million, $2.7$3.6 million and $3.3$3.1 million, respectively. The discount (or settlement) rate that is utilized for determining the present value of future postretirement health care and life insurance plan benefit obligations in the U.S. is generally based on the yield for a theoretical basket of AA-rated corporate bonds currently available in the market place, whose duration matches the timing of expected postretirement health care and life insurance benefit payments. The discount (or settlement) rate that is utilized for determining the present value of future postretirement health
care and life insurance obligations for our foreign benefit plans is generally based on an index of AA-rated corporate bonds adjusted to match the timing of expected benefit payments.
We evaluate these assumptions at least once each year or as facts and circumstances dictate and we make changes as conditions warrant. Changes to these assumptions will increase or decrease our reported net periodic benefit expense, which will result in changes to the recorded benefit plan assets and liabilities.
Useful Life and Impairment of Long-Lived Assets
Property, Plant and Equipment
For financial reporting purposes, depreciation is principally computed on the straight-line method over estimated useful asset lives. The weighted average remaining useful lives for buildings, land improvements and machinery and equipment are approximately 1817 years, 1920 years and 9 years respectively. We also use units-of-production method of depreciation for the U.S. transportation filtration production assets with a gross book value of $68.8$29.4 million, which reflects the nature of the assets' utilization.
Property, plant and equipment are tested for impairment in accordance with ASC Topic 360, Property, Plant, and Equipment ("ASC Topic 360"), whenever events or changes in circumstances indicate that the carrying amounts of such long-lived assets may not be recoverable from future net pre-tax cash flows. Impairment testing requires significant management judgment including estimating the future success of product lines, future sales volumes, growth rates for selling prices and costs, alternative uses for the assets and estimated proceeds from disposal of the assets. Impairment testing is conducted at the lowest level where cash flows can be measured and are independent of cash flows of other assets. An asset impairment would be indicated if the sum of the expected future net pre-tax cash flows from the use of the asset (undiscounted and without interest charges) is less than the carrying amount of the asset. An impairment loss would be measured based on the difference between the fair value of the asset and its carrying amount. We determineestimate fair value based on an expected present value technique using multiple cash flow scenarios that reflect a range of possible outcomes and a risk free rate of interest are used to estimate fair value.rate.
The estimates and assumptions used in the impairment analysis are consistent with the business plans and estimates we use to manage our business operations. The use of different assumptions would increase or decrease the estimated fair value of the asset and would increase or decrease the impairment charge. Actual outcomes may differ from the estimates.
There was no impairment indicated as ofDuring the year ended December 31, 2018, with2020, due to the exceptionadverse impacts of COVID-19, the $31.1Company recorded asset restructuring and impairment costs of $55.3 million, of which $52.3 million related to a non-cash impairment loss recognized relatedfor long-lived assets used primarily in the Technical Products segment. The other charge of $3.0 million arose from accelerated depreciation due to the saleidling of assets and related employee termination benefits for a workforce reduction in the Brattleboro mill.Fine Paper and Packaging segment. See Note 14, "Sale of Brattleboro mill and Impairment Loss",12 of Notes to Consolidated Financial Statements, included elsewhere in this Annual Report"Asset Restructuring and Impairment Costs" for further discussion.
Goodwill and Other Intangible Assets with Indefinite Lives
We test goodwill for impairment at least annually in conjunction with preparation of Neenah's annual business plan, or more frequently if events or circumstances indicate it might be impaired.
We tested goodwill for impairment as of November 30, 20182020 under ASC Topic 350, Intangibles — Goodwill and Other. In this quantitative assessment, wethe Company estimated the fair value of the reporting units using a market approach in combination with a discounted operating cash flow approach. Significant assumptions used in developing the discounted operating cash flow approach were revenue growth rates and pricing, costs for manufacturing inputs, levels of capital investment and estimated cost of capital for high, medium and low growth environments. Based on these assessments, the Company determined that the likelihood that a current fair value determination would be less than the current carrying amount of the reporting unit is not more likely than not. As of November 30, 2018,2020, no impairment was indicated.
Other Intangible Assets
Certain trade names are estimated to have indefinite useful lives and as such are not amortized. Intangible assets with indefinite lives are annually reviewed for impairment in accordance with ASC Topic 350.
Acquired intangible assets with finite useful lives are amortized on a straight-line basis over their respective estimated useful lives, and reviewed for impairment in accordance with ASC Topic 360. Intangible assets consist primarily of customer relationships, trade names and acquired intellectual property. Such intangible assets are amortized using the straight-line method over estimated useful lives of between 10 and 15 years.
During the second quarter of 2020, we recorded an impairment loss for its indefinite-lived intangible assets (brand names) of $0.9 million and $0.4 million in the Fine Paper and Packaging and Technical Products segments, respectively, due to the adverse impacts of the pandemic. See Note 12, "Asset Restructuring and Impairment Costs." Our annual test of other intangible assets for impairment at November 30, 2018, 20172020, 2019, and 20162018 indicated that the carrying amount of such assets was recoverable.
Acquisition Accounting
We account for acquisitions under ASC Topic 805, which requires companies to record assets acquired and liabilities assumed at their respective fair market values at the date of acquisition. The accounting for acquisitions involves a considerable amount of judgment and estimate,estimates, including the fair value of certain forms of consideration; fair value of acquired intangible assets involving projections of future revenues and cash flows that are then either discounted at an estimated discount rate or measured at an estimated royalty rate; fair value of other acquired assets and assumed liabilities, including potential contingencies; and the useful lives of the acquired assets. The assumptions used are determined at the time of the acquisition in accordance with accepted valuation models. Projections are developed using internal forecasts, available industry and market data and estimates of long-term rates of growth for our business. The impact of prior or future acquisitions on our financial position or results of operations may be materially impacted by the change in or initial selection of assumptions and estimates. Refer to Note 4, “Acquisitions”, of Notes to Consolidated Financial Statements included elsewhere in this Annual Report for further discussion of business combination accounting valuation methodology and assumptions.
Item 7A. Quantitative and Qualitative Disclosures About Market Risk
As a multinational enterprise, we are exposed to market risks such as changes in commodity prices, foreign currency exchange rates, and interest rates and environmental regulation.rates. A variety of practices are employed to manage these risks, including operating and financing activities.
Presented below is a description of our most significant market risks.
Foreign Currency Risk
Our reported operating results are affected by changes in the exchange rates of the local currencies of our non-U.S. operations relative to the U.S. dollar. For the year ended December 31, 2018, a hypothetical 10 percent strengthening of the U.S dollar relative to the local currencies of our non-U.S. operations would have decreased our income before income taxes by approximately $4.0 million. We do not hedge our exposure to exchange risk on reported operating results.
The translation of the balance sheets of our non-U.S. operations from their local currencies into U.S. dollars is also sensitive to changes in the exchange rate of the U.S. dollar. Consequently, we performed a sensitivity test to determine if changes in the exchange rate would have a significant effect on the translation of the balance sheets of our non-U.S. operations into U.S. dollars. These translation gains or losses are recorded as unrealized translation adjustments ("UTA", a component of accumulated other comprehensive income (loss) within stockholders' equity). The hypothetical change in UTA is calculated by multiplying the net assets of our non-U.S. operations by a 10 percent change in the exchange rate of their local currencies compared to the U.S. dollar. As of December 31, 2018, the net assets of our non-U.S. operations exceeded their net liabilities by approximately $212 million. As of December 31, 2018, a 10 percent strengthening of the U.S. dollar relative to the local currencies of our non-U.S. operations would have decreased our stockholders' equity by approximately $22 million.
Commodity Risk
Pulp
We purchase the wood pulp used to produce our products on the open market, and, as a result, the price and other terms of those purchases are subject to change based on factors such as worldwide supply and demand and government regulation. We do not have significant influence over the price paid for our wood pulp purchases. Therefore, an increase in wood pulp prices could adversely affect earnings if prices for our products are not increased or if such increases significantly trail the increases in wood pulp prices.
Based on our current quantity of pulp purchases, a $100 per ton increase in the average market price for pulp would have increased our annual costs for pulp by approximately $23$22 million.
Other Manufacturing Inputs
We purchase a substantial portion of the other manufacturing inputs necessary to produce our products on the open market, and, as a result, the price and other terms of those purchases are subject to change based on factors such as worldwide supply and demand and government regulation. We do not have significant influence over our costs for such manufacturing inputs. Therefore, an increase in manufacturing inputs could adversely affect earnings if prices for our products are not increased or if such increases significantly trail the increases in manufacturing inputs.
Our technical products business acquires certain of its specialized pulp requirements from two global suppliers and certain critical specialty latex grades from a limited number of suppliers. In general, these supply arrangements are covered by formal contracts and represent multi-year business relationships that have historically been sufficient to meet our needs.
We expect these relationships to continue to operate in a satisfactory manner in the future. In the event of an interruption of production at any one supplier, we believe that each of these suppliers individually would be able to satisfy our short-term requirements for specialized pulp or specialty latex. In the event of a long-term disruption in our supply of specialized pulp or specialty latex, we believe we would be able to substitute other pulp grades or other latex grades that would allow us to meet required product performance characteristics and incur only a limited disruption in our production. As a result, we do not believe that the substitution of such alternative pulp or latex grades would have a material effect on our operations.
We have the ability to generate substantially all of the electrical energy used by our Munising mill and approximately 25 percent of the electrical energy at our Appleton and Bruckmühl mills. Availability of energy is not expected to be a problem in the foreseeable future, but the purchase price of such energy can and likely will fluctuate significantly based on fluctuations in demand and other factors. There is no assurance that that we will be able to obtain electricity or natural gas purchases on favorable terms in the future.
Except for certain specialty latex grades and specialty pulps used by our technical products business, we are not aware of any significant concentration of business transacted with a particular supplier.
Our transportation costs are affected by various market factors as previously discussed under Item 1A, "Risk Factors." We do not have significant influence over our transportation prices. Therefore, an increase in transportation costs could adversely affect earnings if prices for our products are not increased or if such increases significantly trail the increases in transportation costs.
Foreign Currency Risk
Our reported operating results are affected by changes in the exchange rates of the local currencies of our non-U.S. operations relative to the U.S. dollar. A hypothetical 10 percent strengthening of the U.S dollar relative to the local currencies of our non-U.S. operations would change our income before income taxes by approximately $3.9 million. We do not hedge our exposure to exchange risk on reported operating results.
The translation of the balance sheets of our non-U.S. operations from their local currencies into U.S. dollars is also sensitive to changes in the exchange rate of the U.S. dollar. Consequently, we perform a sensitivity test to determine if changes in the exchange rate would have a significant effect on the translation of the balance sheets of our non-U.S. operations into U.S. dollars. These translation gains or losses are recorded as unrealized translation adjustments, a component of accumulated other comprehensive income (loss) within stockholders' equity. The hypothetical change in unrealized translation adjustment is calculated by multiplying the net assets of our non-U.S. operations by a 10 percent change in the exchange rate of their local currencies compared to the U.S. dollar. As of December 31, 2020, the net assets of our non-U.S. operations exceeded their net liabilities by approximately $246 million. As of December 31, 2020, a 10 percent strengthening of the U.S. dollar relative to the local currencies of our non-U.S. operations would have changed our stockholders' equity by approximately $25 million.
Interest Rate Risk
We are exposed to interest rate risk on our variable rate bank debt. At December 31, 2018,2020, we had $57.9$199.0 million of variable rate borrowings outstanding. A 100 basis point increase in interest rates would increase our annual interest expense on outstanding variable rate borrowings by approximately $0.6$2 million.
Environmental Regulation/Climate Change Legislation
Our manufacturing operations are subject to extensive regulation primarily by U.S., German, Dutch and other international authorities. We have made significant capital expenditures to comply with environmental laws, rules and regulations. Due to changes in environmental laws and regulations, including potential future legislation to limit GHG emissions, the application of such regulations and changes in environmental control technology, we are not able to predict with certainty the amount of future capital spending to be incurred for environmental purposes. Taking these uncertainties into account, our anticipated capital expenditures for environmental projects are not expected to have a material effect on our financial condition, results of operations or liquidity.
We believe these risks can be managed and will not have a material effect on our business or our consolidated financial position, results of operations or cash flows.
Item 8. Financial Statements and Supplementary Data
The information required in Item 8 is contained in and incorporated herein by reference from pages F-1 through F-52F-55 of this Annual Report on Form 10-K.
Item 9. Changes in and Disagreements with Accountants on Accounting and Financial Disclosure
None.
Item 9A. Controls and Procedures
Conclusion Regarding the Effectiveness of Disclosure Controls and Procedures
Our management, with the participation of its Chief Executive Officer and Chief Financial Officer, has evaluated the effectiveness of the Company's disclosure controls and procedures (as such term is defined in Rules 13a-15(e) and 15d-15(e) under the Securities Exchange Act of 1934, as amended (the Exchange Act)) as of the end of the period covered by this report. Based on such evaluation, our Chief Executive Officer and Chief Financial Officer have concluded that, as of the end of such period, the Company's disclosure controls and procedures are effective in recording, processing, summarizing and reporting, on a timely basis, information required to be disclosed by us in the reports that we file or submit under the Exchange Act and are effective in ensuring that information required to be disclosed by us in the reports that we file or submit under the Exchange Act is accumulated and communicated to our management, including our Chief Executive Officer and Chief Financial Officer, as appropriate to allow timely decisions regarding required disclosure.
Management's Annual Report on Internal Control Over Financial Reporting
Our management is responsible for establishing and maintaining effective internal control over financial reporting as defined in Rules 13a-15(f) or 15a-15(f) under the Securities Exchange Act of 1934.Act. The Company's internal control over financial reporting is designed to provide reasonable assurance to our management and Board of Directors regarding the preparation and fair presentation of published financial statements.
Because of its inherent limitations, internal control over financial reporting may not prevent or detect misstatements. Therefore, even those systems determined to be effective can provide only reasonable assurance with respect to financial statement preparation and presentation.
Management assessed the effectiveness of the Company's internal control over financial reporting as of December 31, 2018.2020. The scope of management's assessment of the effectiveness of internal control over financial reporting includes all of the Company's businesses for the year ended December 31, 2018.2020. In making this assessment, management used the criteria set forth by the Committee of Sponsoring Organizations of the Treadway Commission (COSO) in Internal Control — Integrated Framework (2013). Based upon its assessment, management believes that as of December 31, 2018,2020, the Company's internal controls over financial reporting were effective.
The effectiveness of internal control over financial reporting as of December 31, 2018,2020, has been audited by Deloitte & Touche LLP, the independent registered public accounting firm who also audited our consolidated financial statements. Deloitte & Touche's attestation report on the Company's internal control over financial reporting is included herein. See Item 15, "Exhibits and Financial Statement Schedule."
Neenah, Inc.
February 22, 201919, 2021
Changes in Internal Control Over Financial Reporting
There has been no significant change in the Company's internal control over financial reporting during the three months ended December 31, 20182020 that has materially affected, or is reasonably likely to materially affect, the Company's internal control over financial reporting.
Item 9B. Other Information
None.
PART III
Item 10. Directors and Executive Officers of the Registrant
The information required to be set forth herein, except for the information included under Executive Officers of the Company below, relating to nominees for director of Neenah and compliance with Section 16(a) of the Securities Exchange Act of 1934 is set forth under the captions "Election of Directors", "Meetings and Committees of the Board of Directors", "Corporate Governance" and "Section 16(a) Beneficial Ownership Reporting Compliance", respectively, in the Proxy Statement for the Annual Meeting of Stockholders ("Annual Meeting") to be held on May 22, 2019.20, 2021. Such information is incorporated herein by reference. The definitive Proxy Statement will be filed with the Securities and Exchange Commission no later than 120 days after December 31, 2018.2020.
Executive Officers of the Company
Set forth below is information concerning our executive officers. | | | | | | | | |
| | |
| Name | | Position |
NameJulie A. Schertell | | Position |
John P. O'Donnell | | President, Chief Executive Officer and Director |
Matthew L. DuncanPaul F. DeSantis | | Senior Vice President, Chief Human Resource Officer |
Noah S. Benz | | Senior Vice President, General Counsel and Secretary |
Bonnie C. Lind | | SeniorExecutive Vice President, Chief Financial Officer and Treasurer |
Julie A. SchertellByron J. Racki | | SeniorExecutive Vice President, —Segment President, Technical Products |
Byron J. RackiKingsley E. Shannon | | SeniorExecutive Vice President, —Segment President, Fine Paper and Packaging |
Armin SchwinnJason T. Free | | SeniorExecutive Vice President, — Managing Director of Neenah GermanyGlobal Operations |
| Noah S. Benz | | Executive Vice President, General Counsel and Secretary |
| Michael W. Rickheim | | Executive Vice President, Chief Human Resources Officer and Chief Administrative Officer |
| Larry N. Brownlee | | Vice President, — Controller and Principal Accounting Officer |
John P. O'Donnell,Julie A. Schertell, born in 1960,1969, is President and Chief Executive Officer and serves as a Director. HeShe has been in that role since May 2011.2020. Prior to becoming President and Chief Executive Office, Mr. O'DonnellOfficer, Ms. Schertell served as our Senior Vice President, Chief Operating Officer since June 2010. In November 2007, Mr. O'DonnellJanuary 2020. Ms. Schertell joined Neenah in 2008 and served as Vice President of Sales and Marketing for the Fine Paper division through December 2010, as a Senior Vice President and President, Fine Paper. Mr. O'DonnellPaper and Packaging through September 2018, and as a Senior Vice President and President, Technical Products through December 2019. Ms. Schertell was employed by Georgia-Pacific Corporation from 1985 until 2007 and held increasingly senior roles in the Consumer Products division. Mr. O'DonnellRetail division, where she served as Vice President of the North America Retail BusinessSales Strategy from 2004 through 2007,2007-2008, and as Vice President of the North American Commercial Tissue businessCustomer Solutions from 20022003 through 2004.2007.
Matthew L. Duncan,Paul F. DeSantis, born in 1973,1964, is SeniorExecutive Vice President, Chief Human ResourcesFinancial Officer and Treasurer and has been in that role since May 2020. Prior to joining Neenah, Mr. DeSantis served as Chief Financial Officer & Treasurer of OMNOVA Solutions Inc., a global producer of emulsion polymers, specialty chemicals, and decorative and functional surfaces. Mr. DeSantis has also served as Chief Financial Officer, Treasurer & Assistant Corporate Secretary of Bob Evans Farms, Inc. and as CFO of the A. Schulman Company. Mr. DeSantis also held a number of executive leadership roles with the Scotts-Miracle-Gro Company, culminating in March 2016. Prior to his employment with Neenah, Mr. Duncan servedrole as Vice President Human Resources& Corporate Treasurer.
Byron J. Racki, born in 1977, is Executive Vice President, Segment President, Technical Products, and has been in that role since July 2020. Prior to this role, Mr. Racki served as our Senior Vice President of Sales and Marketing since January 2020. Mr. Racki joined the Company in 2006 and has served in areas of increasing responsibility including Vice President of Sales and Marketing for Coca-Cola Refreshments,Fine Paper in 2012 and 2013, Vice President of Sales and Marketing, Performance Materials (Specialty Products) from 2014 through 2016, Senior Vice President and President, Performance Materials in 2017 and 2018 and Senior Vice President and President, Fine Paper and Packaging through December 2019. Prior to joining Neenah, Mr. Racki was employed by Kimberly-Clark in the Family Care division in various finance positions.
Kingsley E. Shannon, born in 1974, is Executive Vice President, Segment President, Fine Paper and Packaging and has been in this role since July 2020. Prior to this role, Ms. Shannon served as our Vice President, Consumer Sales and Marketing & Global Marketing Services since December of 2017. Ms. Shannon joined Neenah in February 2014 and has held various roles of increasing responsibility, including Vice President of Marketing & Global Marketing Services in 2015 through 2017 and Director of Marketing in 2014 and 2015. Prior to joining Neenah, Ms. Shannon was employed by Newell Brands in various Marketing Leadership positions and Maytag Corporation (now Whirlpool Corporation) in various Sales and Marketing positions.
Jason T. Free, born in 1969, is Executive Vice President of Global Operations and has been in this role since
January 2021. Prior to this role, Mr. Free was the Vice President of Global Operations from August 2020 to December 2020, Vice President of North American operating unit of The Coca-Cola Company. Before joining The Coca-Cola CompanyOperations from February 2020 to August 2020, and Vice President Fine Paper & Packaging Supply Chain from January 2018 to February 2020. Mr. Free joined Neenah in 2008, Mr. Duncan2006 and served in a variety of Human Resourcevarious operations leadership roles with The Home Depotacross multiple facilities in the Fine Paper & Packaging division through December 2017. Prior to joining Neenah, Mr. Free was employed by Stora Enso as a Global Customer Solutions Engineer and Nestle. Wausau Paper as a Manufacturing Manager. Mr. Free earned his Bachelor of Science degree in Paper Science and Engineering from the University of Wisconsin-Stevens Point.
Noah S. Benz, born in 1973, is SeniorExecutive Vice President, General Counsel and Secretary and has been in that role since August 2018. Mr. Benz served as Neenah’s Vice President, Deputy General Counsel and Assistant Secretary from 2010 through 2018 and Associate General Counsel from 2005 through 2010. Prior to his employment with Neenah, Mr. Benz served as Associate General Counsel for Mariner Health Care, Inc., a nursing home and long-term acute care hospital company. Mr. Benz engaged in the private practice of law with Nelson, Mullins, Riley & Scarborough and Chamberlain Hrdlicka from 1998 through 2003. Mr. Benz received his JD, with honors, from the Emory University School of Law in 1998.
Bonnie C. Lind,Michael W. Rickheim, born in 1958,1974, is SeniorExecutive Vice President, Chief FinancialHuman Resources Officer and Treasurer& Chief Administrative Officer and has been in that role since June 2004. Ms. Lind was an employee of Kimberly-Clark from 1982 until 2004, holding a variety of increasingly senior financial and operations positions. From 1999 until June 2004, Ms. Lind served as the Assistant Treasurer of Kimberly-Clark and was responsible for managing global treasury operations. Prior to that, she was Director of Kimfibers with overall responsibility for the sourcing and distribution of pulp to Kimberly-Clark's global operations.
Julie A. Schertell, born in 1969, is Senior Vice President — President, Technical Products, and has been in that role since October 2018. Ms. Schertell joined Neenah in 2008 and served as Vice President of Sales and Marketing for the Fine Paper division through December 2010 and as a Senior Vice President and President, Fine Paper and Packaging through September 2018. Ms. Schertell was employed by Georgia-Pacific Corporation in the Consumer Products Retail division, where she served as Vice President of Sales Strategy from 2007-2008, and as Vice President of Customer Solutions from 2003 through 2007.
Byron J. Racki, born in 1977, is Senior Vice President — President, Fine Paper and Packaging, and has been in that role since October 2018. Mr. Racki joined the Company in 2006 and has served in areas of increasing responsibility including Vice President of Sales and Marketing, Specialty Products in 2014 and 2015, Vice President of Sales and Marketing for the Fine Paper division in 2012 and 2013, and as the Senior Vice President and President, Performance Materials, in 2017 and 2018.April 2020. Prior to joining Neenah, Mr. Racki was employed by Kimberly-Clark inRickheim served as the Family Care division inChief Human Resources Officer for Newell Brands, where he held various finance positions. Mr. Racki earned an MBA from the Universityroles of Texas at Austinincreasing responsibility related to HR business partnership, talent acquisition, talent development, employee engagement, inclusion & diversity and a Bachelor of Arts degree in Political Science and Economics from the University of Iowa.communications.
Armin Schwinn, born in 1959, has been Senior Vice President — Managing Director of Neenah Germany since April 2010. Mr. Schwinn had been Vice President, Finance of Neenah Germany since our acquisition of FiberMark Germany in October 2006. Mr. Schwinn joined FiberMark Germany in 1995 and held increasingly senior positions within FiberMark Germany's financial, purchasing and administrative functions. Prior to this, Mr. Schwinn served in various leadership positions in other German manufacturing and service companies.
Larry N. Brownlee, born in 1956, is Vice President, — Controller and Principal Accounting Officer and has been in that role since July 2004. From 1990 to 2004, Mr. Brownlee served as Controller of several public companies in the electric utility, telephone and healthcare industries. From 1979 to 1990, Mr. Brownlee was with Arthur Andersen & Co. and provided audit services to clients primarily in the manufacturing, utility and healthcare industries. Mr. Brownlee is a Certified Public Accountant and received his Masters of Accountancy from the University of Georgia in 1979.
There are no family relationships among our directors or executive officers.
Code of Ethics
The Neenah, Inc. Code of Business Conduct and Ethics, applies to all directors, officers and employees of Neenah. The Code of Business Conduct and Ethics meets the requirements of a "code of ethics" as defined by Item 406 of Regulation S-K, and applies to our Chief Executive Officer, Chief Financial Officer (our principal financial officer) and Vice President, — Controller (our principal accounting officer), as well as all other employees, as indicated above. The Code of Business Conduct and Ethics also meets the requirements of a code of conduct under New York Stock Exchange listing standards. The Code of Business Conduct and Ethics is posted on our web site at www.neenah.com under the links "Investor Relations — Corporate Governance — Code of Ethics" and print copies are available upon request without charge. You can request print copies by contacting our General Counsel in writing at Neenah, Inc., 3460 Preston Ridge Road, Suite 600, Alpharetta, Georgia 30005 or by telephone at 678-566-6500. We intend to disclose any amendments to the Code of Business Conduct and Ethics, as well as any waivers for executive officers or directors, on our web site at www.neenah.com. Information on our web site is not incorporated by reference in this document.
Item 11. Executive Compensation
Information relating to executive compensation and other matters is set forth under the captions "Compensation, Discussion and Analysis", "Additional Executive Compensation", "Director Compensation", and "Compensation
Committee Report" in the Proxy Statement referred to in Item 10 above. Such information is incorporated herein by reference.
Item 12. Security Ownership of Certain Beneficial Owners and Management
Information relating to ownership of common stock of Neenah by certain persons is set forth under the caption "Security Ownership of Certain Beneficial Owners and Management" in the Proxy Statement referred to in Item 10 above. Such information is incorporated herein by reference. Information regarding securities authorized for issuance under equity compensation plans of Neenah is set forth under the caption "Equity Compensation Plan Information" in the Proxy Statement referred to in Item 10 above. Such information is incorporated herein by reference.
Item 13. Certain Relationships and Related Transactions and Director Independence
Information relating to existing or proposed relationships or transactions between Neenah and any affiliate of Neenah is set forth under the caption "Certain Relationships and Related Transactions" in the Proxy Statement referred to in Item 10 above. Such information is incorporated herein by reference.
Item 14. Principal Accountant Fees and Services
Information relating to Neenah's principal accounting fees and services is set forth under the caption "Independent Registered Public Accounting Firm Fees and Services" in the Proxy Statement referred to in Item 10 above. Such information is incorporated herein by reference.
PART IV
Item 15. Exhibits and Financial Statement Schedule
(a) Documents filed as part of this report:
1. Consolidated Financial Statements
The following reports and financial statements are filed herewith on the pages indicated:
2. Financial Statement schedule
The following schedule is filed herewith: All other schedules for which provision is made in the applicable accounting regulations of the Securities and Exchange Commission are not required under the related instructions or are inapplicable and, therefore, have been omitted.
3. Exhibits
See (b) below
(b) Exhibits
The following exhibits are filed with or incorporated by reference in this report. Where such filing is made by incorporation by reference to a previously filed registration statement or report, such registration statement or report is identified in parentheses. We will furnish any exhibit at no cost upon written request to us at: Investor Relations, Neenah, Inc., 3460 Preston Ridge Road, Suite 600, Alpharetta, Georgia 30005.
|
| | | | |
Exhibit
Number
| Exhibit |
| 2.1 | Interest Purchase Agreement by and among ASP FiberMark Holdings, LLC, ASP FiberMark, LLC, Neenah FMK Holdings, LLC and Neenah Paper, Inc. dated as of July 16, 2015 (filed as Exhibit 2.1 to the Neenah Paper, Inc. Quarterly Report on Form 10-Q for the three months ended September 30, 2015, filed November 9, 2015 and incorporated herein by reference). |
| 2.2 | |
|
| | | | |
Exhibit
Number
| Exhibit |
2.302.3 + | Securities Purchase Agreement by and among Crane Technical Materials, Inc., Crane & Co., Inc., Neenah Paper, Inc. and Neenah Filtration, LLC dated as of June 2, 2014 (filed as Exhibit 2.1 to the Neenah Paper, Inc. Quarterly Report on Form 10-Q for the three months ended June 30, 2014, filed August 7, 2014) (confidential treatment has been granted for certain portions of this exhibit pursuant to a Confidential Treatment Request filed with the Securities Exchange Commission). |
| 3.1 | |
| 3.2 | |
3.34.1 | |
| 4.2 |
|
4.110.1 | |
4.2 | |
10.1 | |
| 10.3* | |
| 10.4* | |
| 10.5* | |
| 10.6* | |
| 10.7* | |
| 10.8* | |
| 10.9* | |
| 10.10* | |
10.11 +10.11* | Third Amended and Restated Credit Agreement dated December 18, 2014 by and among Neenah Paper, Inc., certain of its subsidiaries, the lenders listed therein and JPMorgan Chase Bank, N.A., as agent for the Lenders (filed as Exhibit 10.31 to the Neenah Paper, Inc. Annual Report on Form 10-K for the year ended December 31, 2014, filed February 27, 2015 and incorporated herein by reference) (confidential treatment has been granted for certain portions of this exhibit pursuant to a Confidential Treatment Request filed with the Securities Exchange Commission). |
10.12 | First Amendment, dated as of July 28, 2016, to the Third Amended and Restated Credit Agreement dated December 18, 2014 by and among Neenah Paper, Inc., certain of its subsidiaries, the lenders listed therein and JPMorgan Chase Bank, N.A., as agent for the Lenders (filed as Exhibit 99.1 to the Neenah Paper, Inc. Current Report on Form 8-K, filed August 2, 2016 and incorporated herein by reference). |
10.13 | Second Amendment, dated as of December 13, 2016, to the Third Amended and Restated Credit Agreement dated December 18, 2014 by and among Neenah Paper, Inc., certain of its subsidiaries, the lenders listed therein and JPMorgan Chase Bank, N.A., as agent for the Lenders (filed as Exhibit 99.1 to the Neenah Paper, Inc. Current Report on Form 8-K, filed December 16, 2016 and incorporated herein by reference). |
|
| |
Exhibit
Number
| Exhibit |
10.14* | |
10.15 | Third Amendment, dated as of August 30, 2017, to the Third Amended and Restated Credit Agreement dated December 18, 2014 by and among Neenah Paper, Inc., certain of its subsidiaries, the lenders listed therein and JPMorgan Chase Bank, N.A., as agent for the Lenders (filed as Exhibit 10.1 to the Neenah Paper, Inc. Quarterly Report on Form 10-Q, filed November 8, 2017 and incorporated herein by reference). |
10.16 | Fourth Amendment, dated as of December 14, 2017, to the Third Amended and Restated Credit Agreement dated December 18, 2014 by and among Neenah Paper, Inc., certain of its subsidiaries, the lenders listed therein and JPMorgan Chase Bank, N.A., as agent for the Lenders (filed as Exhibit 10.16 to the Neenah, Inc. Annual Report on Form 10-K for the year ended December 31, 2017, filed February 23, 2018 and incorporated herein by reference). |
10.17* | |
10.18*10.12* | |
10.1910.13 | |
2110.14 | First Amendment, dated as of February 28, 2019, to the Fourth Amended and Restated Credit Agreement dated December 10, 2018 by and among Neenah, Inc., certain of its subsidiaries, the lenders listed therein and JPMorgan Chase Bank, N.A., as agent for the Lenders (filed as Exhibit 10.1 to the Neenah, Inc. Quarterly Report on Form 10-Q, filed May 3, 2019 and incorporated herein by reference) |
| 10.15* | |
| 10.16* | |
| 10.17* | |
| | | | | |
Exhibit
Number | Exhibit |
| 10.18* | |
| 10.19* | |
| 10.20* | |
| 10.21* | |
| 10.22 | Second Amendment, dated as of March 12, 2020, to the Fourth Amended and Restated Credit Agreement dated December 10, 2018 by and among Neenah, Inc., certain of its subsidiaries, the lenders listed therein and JPMorgan Chase Bank, N.A., as agent for the Lenders (filed as Exhibit 10.1 to the Neenah, Inc. Quarterly Report on Form 10-Q, filed May 11, 2020 and incorporated herein by reference) |
| 10.23 | Term Loan Credit Agreement, dated as of June 30, 2020, by and among Neenah, Inc., certain of its subsidiaries, the lenders listed therein and JPMorgan Chase Bank, N.A., as agent for the Lenders (filed as Exhibit 10.1 to the Neenah, Inc. Quarterly Report on Form 10-Q, filed August 5, 2020 and incorporated herein by reference) |
| 10.24 | Third Amendment, dated as of June 30, 2020, to the Fourth Amended and Restated Credit Agreement dated December 10, 2018 by and among Neenah, Inc., certain of its subsidiaries, the lenders listed therein and JPMorgan Chase Bank, N.A., as agent for the Lenders (filed as Exhibit 10.2 to the Neenah, Inc. Quarterly Report on Form 10-Q, filed August 5, 2020 and incorporated herein by reference) |
| 21 | |
| 23 | |
| 24 | |
| 31.1 | |
| 31.2 | |
| 32.1 | |
| 32.2 | |
| 101.INS | XBRL Instance Document (filed herewith). |
| 101.SCH | XBRL Taxonomy Extension Schema Document (filed herewith). |
| 101.CAL | XBRL Taxonomy Extension Calculation Linkbase Document (filed herewith). |
| 101.DEF | XBRL Taxonomy Extension Definition Linkbase Document (filed herewith). |
| 101.LAB | XBRL Taxonomy Extension Label Linkbase Document (filed herewith). |
| 101.PRE | XBRL Taxonomy Extension Presentation Linkbase Document (filed herewith). |
| 104 | Cover Page Interactive Data File (embedded within the Inline XBRL document and contained in Exhibit 101) |
_______________________
| |
* | Indicates management contract or compensatory plan or arrangement. |
| |
+ | Pursuant to a confidential treatment request portions of this exhibit have been furnished separately to the Securities and Exchange Commission. |
* Indicates management contract or compensatory plan or arrangement.
| |
(c) | Financial Statement Schedule |
+ Pursuant to a confidential treatment request portions of this exhibit have been furnished separately to the Securities and Exchange Commission.
(c)Financial Statement Schedule
See Item 15(a) (2) above
Item 16. Form 10-K Summary
None.
SIGNATURES
Pursuant to the requirements of Section 13 or 15(d) of the Securities Exchange Act of 1934, the registrant has duly caused this report to be signed on its behalf by the undersigned, thereunto duly authorized.
|
| | | | | | | |
| Neenah, Inc. |
| By: | /s/ JOHN P. O'DONNELLJULIE A. SCHERTELL |
| Name: | John P. O'DonnellJulie A. Schertell |
| Title: | President, Chief Executive Officer and Director (in hisher capacity as a duly authorized officer of the Registrant and in hisher capacity as Chief Executive Officer) |
| Date: | February 22, 201919, 2021 |
Pursuant to the requirements of the Securities Exchange Act of 1934, this report has been signed below by the following persons on behalf of the registrant and in the capacities and on the dates indicated. | | | | | | | | | | | | | | | | | | | | |
| | /s/ JULIE A. SCHERTELL | | President, Chief Executive Officer and Director (Principal Executive Officer) | | |
| | Julie A. Schertell | | | February 19, 2021 |
| | | | | | |
| | /s/ JOHN P. O'DONNELLPAUL F. DESANTIS | | President, Chief Executive Officer and Director (Principal Executive Officer) | | |
| | John P. O'Donnell | | | February 22, 2019 |
| | | | | | |
| | /s/ BONNIE C. LIND | | Senior Vice President, Chief Financial Officer and Treasurer (Principal Financial Officer) | | |
| | Bonnie C. LindPaul F. DeSantis | | | February 22, 201919, 2021 |
| | | | | | |
| | /s/ LARRY N. BROWNLEE | | Vice President, — Controller (Principal Accounting Officer) | | |
| | Larry N. Brownlee | | | February 22, 201919, 2021 |
| | | | | | |
| | /s/ SEAN T. ERWIN*WILLIAM M. COOK* | | Chairman of the Board and Director | | |
| | Sean T. Erwin | | | February 22, 2019 |
| | | | | | |
| | /s/ WILLIAM M. COOK* | | Director | | |
| | William M. Cook | | | February 22, 201919, 2021 |
| | | | | | |
| | /s/ DONNA M. COSTELLO* | | Director | | |
| | Donna M. Costello | | | February 19, 2021 |
| | | | | | |
| | /s/ MARGARET S. DANO* | | Director | | |
| | Margaret S. Dano | | | February 22, 201919, 2021 |
| | | | | | |
| | /s/ TIMOTHY S. LUCAS* | | Director | | |
| | Timothy S. Lucas | | | February 22, 201919, 2021 |
| | | | | | |
| | /s/ JOHN F. MCGOVERN* | | Director | | |
| | John F. McGovern | | | February 22, 2019 |
| | | | | | |
| | /s/ PHILIP C. MOORE* | | Director | | |
| | Philip C. Moore | | | February 22, 201919, 2021 |
| | | | | | |
| | /s/ TONY R. THENE* | | Director | | |
| | Tony R. Thene | | | February 22, 201919, 2021 |
| | | | | | |
| | /s/ STEPHEN M. WOOD* | | Director | | |
| | Stephen M. Wood | | | February 22, 201919, 2021 |
| | | | | | |
| *By: | /s/ NOAH S. BENZ | | | | |
| | Noah S. Benz Senior
Executive Vice President, General
Counsel and Secretary
Attorney-in-fact
| | | | |
TABLE OF CONTENTS
REPORT OF INDEPENDENT REGISTERED PUBLIC ACCOUNTING FIRM
To the stockholders and the Board of Directors of Neenah, Inc.
Opinion on the Financial Statements
We have audited the accompanying consolidated balance sheets of Neenah, Inc. and subsidiaries (the "Company") as of December 31, 2018 and 2017, the related consolidated statements of operations, comprehensive income, changes in stockholders’ equity, and cash flows, for each of the three years in the period ended December 31, 2018, and the related notes and the schedule listed in the Index at Item 15 (collectively referred to as the "financial statements"). In our opinion, the financial statements present fairly, in all material respects, the financial position of the Company as of December 31, 2018 and 2017, and the results of its operations and its cash flows for each of the three years in the period ended December 31, 2018, in conformity with accounting principles generally accepted in the United States of America.
We have also audited, in accordance with the standards of the Public Company Accounting Oversight Board (United States) (PCAOB), the Company's internal control over financial reporting as of December 31, 2018, based on criteria established in Internal Control - Integrated Framework (2013) issued by the Committee of Sponsoring Organizations of the Treadway Commission and our report dated February 22, 2019, expressed an unqualified opinion on the Company's internal control over financial reporting.
Basis for Opinion
These financial statements are the responsibility of the Company's management. Our responsibility is to express an opinion on the Company's financial statements based on our audits. We are a public accounting firm registered with the PCAOB and are required to be independent with respect to the Company in accordance with the U.S. federal securities laws and the applicable rules and regulations of the Securities and Exchange Commission and the PCAOB.
We conducted our audits in accordance with the standards of the PCAOB. Those standards require that we plan and perform the audit to obtain reasonable assurance about whether the financial statements are free of material misstatement, whether due to error or fraud. Our audits included performing procedures to assess the risks of material misstatement of the financial statements, whether due to error or fraud, and performing procedures that respond to those risks. Such procedures included examining, on a test basis, evidence regarding the amounts and disclosures in the financial statements. Our audits also included evaluating the accounting principles used and significant estimates made by management, as well as evaluating the overall presentation of the financial statements. We believe that our audits provide a reasonable basis for our opinion.
/s/ Deloitte & Touche LLP
Atlanta, Georgia
February 22, 2019
We have served as the Company's auditor since 2003.
REPORT OF INDEPENDENT REGISTERED PUBLIC ACCOUNTING FIRM
To the stockholders and the Board of Directors of Neenah, Inc.
Opinion on Internal Control over Financial Reporting
We have audited the internal control over financial reporting of Neenah, Inc. and subsidiaries (the “Company”) as of December 31, 2018,2020, based on criteria established in Internal Control - Integrated Framework (2013) issued by the Committee of Sponsoring Organizations of the Treadway Commission (COSO). In our opinion, the Company maintained, in all material respects, effective internal control over financial reporting as of December 31, 2018,2020, based on criteria established in Internal Control - Integrated Framework (2013) issued by COSO.
We have also audited, in accordance with the standards of the Public Company Accounting Oversight Board (United States) (PCAOB), the consolidated financial statements and financial statement schedule as of and for the year ended December 31, 2018,2020, of the Company and our report dated February 22, 2019,19, 2021, expressed an unqualified opinion on those consolidated financial statements and financial statement schedule.
Basis for Opinion
The Company’s management is responsible for maintaining effective internal control over financial reporting and for its assessment of the effectiveness of internal control over financial reporting, included in the accompanying Management’s Annual Report on Internal Control Over Financial Reporting. Our responsibility is to express an opinion on the Company’s internal control over financial reporting based on our audit. We are a public accounting firm registered with the PCAOB and are required to be independent with respect to the Company in accordance with the U.S. federal securities laws and the applicable rules and regulations of the Securities and Exchange Commission and the PCAOB.
We conducted our audit in accordance with the standards of the PCAOB. Those standards require that we plan and perform the audit to obtain reasonable assurance about whether effective internal control over financial reporting was maintained in all material respects. Our audit included obtaining an understanding of internal control over financial reporting, assessing the risk that a material weakness exists, testing and evaluating the design and operating effectiveness of internal control based on the assessed risk, and performing such other procedures as we considered necessary in the circumstances. We believe that our audit provides a reasonable basis for our opinion.
Definition and Limitations of Internal Control over Financial Reporting
A company’s internal control over financial reporting is a process designed to provide reasonable assurance regarding the reliability of financial reporting and the preparation of financial statements for external purposes in accordance with generally accepted accounting principles. A company’s internal control over financial reporting includes those policies and procedures that (1) pertain to the maintenance of records that, in reasonable detail, accurately and fairly reflect the transactions and dispositions of the assets of the company; (2) provide reasonable assurance that transactions are recorded as necessary to permit preparation of financial statements in accordance with generally accepted accounting principles, and that receipts and expenditures of the company are being made only in accordance with authorizations of management and directors of the company; and (3) provide reasonable assurance regarding prevention or timely detection of unauthorized acquisition, use, or disposition of the company’s assets that could have a material effect on the financial statements.
Because of its inherent limitations, internal control over financial reporting may not prevent or detect misstatements. Also, projections of any evaluation of effectiveness to future periods are subject to the risk that controls may become inadequate because of changes in conditions, or that the degree of compliance with the policies or procedures may deteriorate.
/s/ Deloitte & Touche LLP
Atlanta, Georgia
February 22,19, 2021
REPORT OF INDEPENDENT REGISTERED PUBLIC ACCOUNTING FIRM
To the stockholders and the Board of Directors of Neenah, Inc.
Opinion on the Financial Statements
We have audited the accompanying consolidated balance sheets of Neenah, Inc. and subsidiaries (the "Company") as of December 31, 2020 and 2019, the related consolidated statements of operations, comprehensive income, changes in stockholders’ equity, and cash flows, for each of the three years in the period ended December 31, 2020, and the related notes and the schedule listed in the Index at Item 15 (collectively referred to as the "financial statements"). In our opinion, the financial statements present fairly, in all material respects, the financial position of the Company as of December 31, 2020 and 2019, and the results of its operations and its cash flows for each of the three years in the period ended December 31, 2020, in conformity with accounting principles generally accepted in the United States of America.
We have also audited, in accordance with the standards of the Public Company Accounting Oversight Board (United States) (PCAOB), the Company's internal control over financial reporting as of December 31, 2020, based on criteria established in Internal Control — Integrated Framework (2013) issued by the Committee of Sponsoring Organizations of the Treadway Commission and our report dated February 19, 2021, expressed an unqualified opinion on the Company's internal control over financial reporting.
Basis for Opinion
These financial statements are the responsibility of the Company's management. Our responsibility is to express an opinion on the Company's financial statements based on our audits. We are a public accounting firm registered with the PCAOB and are required to be independent with respect to the Company in accordance with the U.S. federal securities laws and the applicable rules and regulations of the Securities and Exchange Commission and the PCAOB.
We conducted our audits in accordance with the standards of the PCAOB. Those standards require that we plan and perform the audit to obtain reasonable assurance about whether the financial statements are free of material misstatement, whether due to error or fraud. Our audits included performing procedures to assess the risks of material misstatement of the financial statements, whether due to error or fraud, and performing procedures that respond to those risks. Such procedures included examining, on a test basis, evidence regarding the amounts and disclosures in the financial statements. Our audits also included evaluating the accounting principles used and significant estimates made by management, as well as evaluating the overall presentation of the financial statements. We believe that our audits provide a reasonable basis for our opinion.
Critical Audit Matters
The critical audit matters communicated below are matters arising from the current-period audit of the financial statements that were communicated or required to be communicated to the audit committee and that (1) relate to accounts or disclosures that are material to the financial statements and (2) involved our especially challenging, subjective, or complex judgments. The communication of critical audit matters does not alter in any way our opinion on the financial statements, taken as a whole, and we are not, by communicating the critical audit matters below, providing separate opinions on the critical audit matters or on the accounts or disclosures to which they relate.
Income Taxes — Realizability of Deferred Tax Assets — Refer to Notes 2 and 5 to the financial statements
Critical Audit Matter Description
As discussed in Note 5 to the consolidated financial statements, at December 31, 2020 the Company had deferred tax assets on deductible temporary differences, tax credits, and tax loss carryforwards of $18.3 million (net of a $10.4 million valuation allowance). Deferred tax assets are reduced by a valuation allowance if, based upon the weight of all available evidence, it is more likely than not that some portion, or all, of the deferred tax assets will not be realized. Auditing management’s determination that all or some portion of certain deferred income tax assets will not be realized, and that it is more likely than not that sufficient taxable income will be generated in the future to realize the remaining deferred tax assets, is a critical audit matter because of the significant judgments management makes related to taxable income. This required a high degree of auditor judgment and an increased extent of effort, including the need to involve our income tax specialists, when performing audit procedures to evaluate the reasonableness of management’s forecasts of taxable income and the application and interpretations of accounting principles generally accepted in the United States of America.
How the Critical Audit Matter Was Addressed in the Audit
Our audit procedures related to the determination that it is more likely than not that sufficient taxable income will be generated in the future to realize deferred tax assets included the following, among others:
•We tested the effectiveness of controls over deferred tax assets, including management’s controls over the estimates of taxable income and the determination of whether it is more likely than not that the deferred tax assets will be realized.
•We evaluated the reasonableness of the methods, assumptions, and judgments used by management to determine whether a valuation allowance was necessary.
•With the assistance of our income tax specialists, we evaluated whether the sources of management’s estimated taxable income were of the appropriate character and sufficient to utilize the deferred tax assets under the relevant tax law.
•We tested the reasonableness of management’s estimates of taxable income by comparing the estimates to:
–Internal budgets.
–Historical taxable income, as adjusted for nonrecurring items.
–Internal communications to management and the Board of Directors.
–Forecasted information included in Company press releases as well as in analyst and industry reports for the Company and certain of its peer companies.
•We evaluated whether the estimates of future taxable income were consistent with evidence obtained in other areas of the audit.
•We evaluated whether the taxable income in prior carryback years was of the appropriate character and available under the tax law.
U.S. Transportation Filtration Asset Impairment — Refer to Notes 2 and 12 to the financial statements
Critical Audit Matter Description
The Company tests property, plant and equipment for impairment in accordance with Accounting Standards Codification Topic 360, Property, Plant, and Equipment whenever events or changes in circumstances indicate that the carrying amounts of such long-lived assets may not be recoverable. As discussed in Note 12, during the three months ended June 30, 2020, adverse impacts from the COVID-19 pandemic triggered the evaluation of the recoverability of carrying values of long-lived assets in the Technical Products segment, with the largest impact resulting from changes in the duration of the ramp-up of net sales of the Company’s U.S. transportation filtration asset group. The Company determined that the carrying value of the U.S. transportation filtration long-lived asset group was not recoverable, and as a result recorded a $51 million impairment charge, which is the amount by which the carrying value exceeded the estimated fair value of the asset group. Management determined the fair value of the long-lived assets principally on a probability-weighting of the discounted cash flows expected under multiple operating scenarios.
The Company’s fair value calculations are highly subjective and require management to make assumptions and apply judgments to estimates regarding the timing and amount of future cash flows, probabilities related to various cash flow scenarios, an appropriate discount rate based on the perceived risks, and current and future evaluation of economic conditions and operating plans under these assessed conditions. Changes in these assumptions could have a significant effect on both the fair value of the asset group and the related impairment expense.
Auditing the Company’s impairment measurement involved a high degree of subjectivity, as estimates underlying the determination of fair value of the U.S. transportation filtration asset group were based on assumptions requiring significant judgment, including management’s estimate of the timing and duration of the ramp-up of net sales and future sales volumes, the future success of product lines, growth rates for selling prices and costs, and future market and economic conditions. These assumptions required a high degree of auditor judgment and an increased extent of effort when performing audit procedures to evaluate the reasonableness of management’s forecasted cash flows.
How the Critical Audit Matter Was Addressed in the Audit
Our audit procedures related to the evaluation of the timing and duration of net-sales ramp-up and other significant assumptions used to estimate fair value included the following, among others:
•We tested the design and operating effectiveness of management’s controls over the forecasts, including future revenues.
•We evaluated management’s ability to accurately forecast future cash flows by comparing actual results to management’s historical forecasts.
•We tested actual sales through the impairment date.
•We performed inquiries throughout the organization, interviewing a cross-section of company personnel to compare expectations with forecasts and possible scenarios, including the estimated timeline to full capacity.
•We inspected internal and external evidence (e.g. correspondence, contracts, meetings minutes, customer commitments, industry reports) and evaluated evidence against the forecasted volumes.
•We compared management forecasts to information included in industry reports.
•We evaluated projected revenues and operating margins against historical results and management’s rationale and support for expected improvements over time.
/s/ Deloitte & Touche LLP
Atlanta, Georgia
February 19, 2021
We have served as the Company's auditor since 2003.
NEENAH, INC. AND SUBSIDIARIES
CONSOLIDATED STATEMENTS OF OPERATIONS
(In millions, except share and per share data)
| | | | | | | | | | | | | | | | | | | | |
| | | Year Ended December 31, |
| | | 2020 | | 2019 | | 2018 |
| Net Sales | | $ | 792.6 | | | $ | 938.5 | | | $ | 1,034.9 | |
| Cost of products sold | | 639.4 | | | 755.1 | | | 851.5 | |
| Gross Profit | | 153.2 | | | 183.4 | | | 183.4 | |
| Selling, general and administrative expenses | | 88.0 | | | 98.6 | | | 95.9 | |
| Asset restructuring and impairment costs (Note 12) | | 57.8 | | | 4.7 | | | 31.1 | |
| Other restructuring and non-routine costs | | 4.2 | | | 1.5 | | | 2.1 | |
| COVID-19 costs | | 3.5 | | | 0 | | | 0 | |
| Loss on debt extinguishment (Note 6) | | 1.9 | | | 0 | | | 0 | |
| Pension and SERP adjustments (Note 7) | | 1.6 | | | (1.4) | | | 1.8 | |
| Acquisition-related costs and adjustments (Note 2) | | 1.5 | | | 0 | | | (3.9) | |
| Insurance settlement | | 0 | | | 0 | | | (0.4) | |
| Other expense, net | | 0.8 | | | 1.7 | | | 2.7 | |
| Operating Income (Loss) | | (6.1) | | | 78.3 | | | 54.1 | |
| Interest expense | | 12.6 | | | 11.8 | | | 13.0 | |
| | | | | | |
| Income (Loss) From Continuing Operations Before Income taxes | | (18.7) | | | 66.5 | | | 41.1 | |
| Provision (benefit) for income taxes | | (2.9) | | | 11.1 | | | 3.9 | |
| Income (Loss) From Continuing Operations | | (15.8) | | | 55.4 | | | 37.2 | |
| Loss from discontinued operations, net of income taxes (Note 2) | | 0 | | | 0 | | | (0.8) | |
| Net Income (Loss) | | $ | (15.8) | | | $ | 55.4 | | | $ | 36.4 | |
| | | | | | |
| Earnings (Loss) Per Common Share | | | | | | |
| Basic | | | | | | |
| Continuing operations | | $ | (0.96) | | | $ | 3.27 | | | $ | 2.20 | |
| Discontinued operations | | 0 | | | 0 | | | (0.05) | |
| | $ | (0.96) | | | $ | 3.27 | | | $ | 2.15 | |
| | | | | | |
| Diluted | | | | | | |
| Continuing operations | | $ | (0.96) | | | $ | 3.26 | | | $ | 2.17 | |
| Discontinued operations | | 0 | | | 0 | | | (0.05) | |
| | $ | (0.96) | | | $ | 3.26 | | | $ | 2.12 | |
| | | | | | |
| Weighted Average Common Shares Outstanding (in thousands) | | | | | | |
| Basic | | 16,813 | | | 16,848 | | | 16,850 | |
| Diluted | | 16,813 | | | 16,906 | | | 16,968 | |
|
| | | | | | | | | | | | |
| | | Year Ended December 31, |
| | | 2018 | | 2017 | | 2016 |
| Net sales | | $ | 1,034.9 |
| | $ | 979.9 |
| | $ | 941.5 |
|
| Cost of products sold | | 851.5 |
| | 779.7 |
| | 724.2 |
|
| Gross profit | | 183.4 |
| | 200.2 |
| | 217.3 |
|
| Selling, general and administrative expenses | | 95.9 |
| | 95.3 |
| | 90.0 |
|
| Impairment loss (Note 14) | | 31.1 |
| | — |
| | — |
|
| Restructuring, integration and other costs | | 2.1 |
| | 1.3 |
| | 7.0 |
|
| Pension and SERP plan settlement charges (Note 8) | | 1.8 |
| | 0.6 |
| | 0.8 |
|
| Acquisition-related adjustments (Note 4) | | (3.9 | ) | | — |
| | — |
|
| Insurance settlement | | (0.4 | ) | | (3.2 | ) | | — |
|
| Other expense — net | | 2.7 |
| | 1.9 |
| | 5.4 |
|
| Operating income | | 54.1 |
| | 104.3 |
| | 114.1 |
|
| Interest expense | | 13.0 |
| | 12.7 |
| | 11.2 |
|
| Interest income | | — |
| | (0.1 | ) | | (0.1 | ) |
| Income from continuing operations before income taxes | | 41.1 |
| | 91.7 |
| | 103.0 |
|
| Provision for income taxes | | 3.9 |
| | 11.4 |
| | 29.6 |
|
| Income from continuing operations | | 37.2 |
| | 80.3 |
| | 73.4 |
|
| Loss from discontinued operations, net of taxes (Note 13) | | (0.8 | ) | | — |
| | (0.4 | ) |
| Net income | | $ | 36.4 |
| | $ | 80.3 |
| | $ | 73.0 |
|
| | | | | | | |
| Earnings (Loss) Per Common Share | | |
| | |
| | |
|
| Basic | | |
| | |
| | |
|
| Continuing operations | | $ | 2.20 |
| | $ | 4.74 |
| | $ | 4.33 |
|
| Discontinued operations | | (0.05 | ) | | — |
| | (0.02 | ) |
| | | $ | 2.15 |
| | $ | 4.74 |
| | $ | 4.31 |
|
| | | | | | | |
| Diluted | | |
| | |
| | |
|
| Continuing operations | | $ | 2.17 |
| | $ | 4.68 |
| | $ | 4.26 |
|
| Discontinued operations | | (0.05 | ) | | — |
| | (0.02 | ) |
| | | $ | 2.12 |
| | $ | 4.68 |
| | $ | 4.24 |
|
| | | | | | | |
| Weighted Average Common Shares Outstanding (in thousands) | | |
| | |
| | |
|
| Basic | | 16,850 |
| | 16,805 |
| | 16,773 |
|
| Diluted | | 16,968 |
| | 17,052 |
| | 17,087 |
|
See Notes to Consolidated Financial Statements
NEENAH, INC. AND SUBSIDIARIES
CONSOLIDATED STATEMENTS OF COMPREHENSIVE INCOME (LOSS)
(In millions)
| | | | | | | | | | | | | | | | | | | | |
| | | Year Ended December 31, |
| | | 2020 | | 2019 | | 2018 |
| Net Income (Loss) | | $ | (15.8) | | | $ | 55.4 | | | $ | 36.4 | |
| Reclassification of amounts recognized in the consolidated statement of operations: | | | | | | |
| Amortization of adjustments to pension and other postretirement benefit liabilities | | 6.6 | | | 6.0 | | | 6.0 | |
| Pension plan settlement/curtailment losses | | 0.3 | | | 1.3 | | | 0.8 | |
| Amounts recognized in the consolidated statement of operations | | 6.9 | | | 7.3 | | | 6.8 | |
| Unrealized foreign currency translation gain (loss) | | 18.0 | | | (3.5) | | | (7.9) | |
| Net loss from pension and other postretirement benefit plans | | (17.2) | | | (13.7) | | | (11.2) | |
| Income (Loss) From Other Comprehensive Income Items Before Income Taxes | | 7.7 | | | (9.9) | | | (12.3) | |
| Benefit for income taxes | | (1.9) | | | (1.7) | | | (1.0) | |
| Other Comprehensive Income (Loss) | | 9.6 | | | (8.2) | | | (11.3) | |
| Comprehensive Income (Loss) | | $ | (6.2) | | | $ | 47.2 | | | $ | 25.1 | |
|
| | | | | | | | | | | | |
| | | Year Ended December 31, |
| | | 2018 | | 2017 | | 2016 |
| Net income | | $ | 36.4 |
| | $ | 80.3 |
| | $ | 73.0 |
|
| Reclassification of amounts recognized in the consolidated statement of operations: | | |
| | |
| | |
|
| Amortization of adjustments to pension and other postretirement benefit liabilities | | 6.0 |
| | 5.9 |
| | 7.2 |
|
| Pension plan settlement/curtailment charge | | 0.8 |
| | 0.6 |
| | 0.8 |
|
| Amounts recognized in the consolidated statement of operations | | 6.8 |
| | 6.5 |
| | 8.0 |
|
| Unrealized foreign currency translation (loss) gain | | (7.9 | ) | | 20.0 |
| | (7.1 | ) |
| Net loss from pension and other postretirement benefit plans | | (11.2 | ) | | (20.3 | ) | | (18.0 | ) |
| Deferred loss on "available-for-sale" securities | | — |
| | (0.4 | ) | | — |
|
| (Loss) income from other comprehensive income items before income taxes | | (12.3 | ) | | 5.8 |
| | (17.1 | ) |
| Benefit for income taxes | | (1.0 | ) | | (3.0 | ) | | (3.4 | ) |
| Other comprehensive (loss) income | | (11.3 | ) | | 8.8 |
| | (13.7 | ) |
| Comprehensive income | | $ | 25.1 |
| | $ | 89.1 |
| | $ | 59.3 |
|
See Notes to Consolidated Financial Statements
NEENAH, INC. AND SUBSIDIARIES
CONSOLIDATED BALANCE SHEETS
(In millions, except share data)
|
| | | | | | | | |
| | | December 31, |
| | | 2018 | | 2017 |
| ASSETS | | |
| | |
|
| Current Assets | | |
| | |
|
| Cash and cash equivalents | | $ | 9.9 |
| | $ | 4.5 |
|
| Accounts receivable, net | | 114.8 |
| | 115.7 |
|
| Inventories | | 131.6 |
| | 143.5 |
|
| Prepaid and other current assets | | 21.6 |
| | 21.5 |
|
| Total Current Assets | | 277.9 |
| | 285.2 |
|
| Property, Plant and Equipment — net | | 396.2 |
| | 425.2 |
|
| Deferred Income Taxes | | 16.4 |
| | 10.1 |
|
| Goodwill (Note 5) | | 84.0 |
| | 85.3 |
|
| Intangible Assets — net (Note 5) | | 70.7 |
| | 78.7 |
|
| Other Assets | | 16.0 |
| | 19.9 |
|
| TOTAL ASSETS | | $ | 861.2 |
| | $ | 904.4 |
|
| | | | | |
| LIABILITIES AND STOCKHOLDERS' EQUITY | | |
| | |
|
| Current Liabilities | | |
| | |
|
| Debt payable within one year | | $ | 2.3 |
| | $ | 1.4 |
|
| Accounts payable | | 63.3 |
| | 65.7 |
|
| Accrued expenses | | 55.2 |
| | 57.5 |
|
| Total Current Liabilities | | 120.8 |
| | 124.6 |
|
| Long-Term Debt | | 236.8 |
| | 254.1 |
|
| Deferred Income Taxes | | 14.4 |
| | 15.0 |
|
| Noncurrent Employee Benefits | | 92.9 |
| | 100.3 |
|
| Other Noncurrent Obligations | | 6.1 |
| | 10.5 |
|
| TOTAL LIABILITIES | | 471.0 |
| | 504.5 |
|
| Commitments and Contingencies (Notes 11 and 12) | |
|
| |
|
|
| Stockholders' Equity | | |
| | |
|
| Common stock, par value $0.01 — authorized: 100,000,000 shares; issued and outstanding: 16,859,000 shares and 16,870,000 shares | | 0.2 |
| | 0.2 |
|
| Treasury stock, at cost: 1,738,000 shares and 1,588,000 shares | | (76.6 | ) | | (65.8 | ) |
| Additional paid-in capital | | 328.5 |
| | 323.9 |
|
| Retained earnings | | 243.2 |
| | 235.7 |
|
| Accumulated other comprehensive loss | | (105.1 | ) | | (94.1 | ) |
| Total Stockholders' Equity | | 390.2 |
| | 399.9 |
|
| TOTAL LIABILITIES AND STOCKHOLDERS' EQUITY | | $ | 861.2 |
| | $ | 904.4 |
|
| | | | | | | | | | | | | | |
| | | December 31, |
| | | 2020 | | 2019 |
| ASSETS | | | | |
| Current Assets | | | | |
| Cash and cash equivalents | | $ | 37.1 | | | $ | 9.0 | |
| Accounts receivable, net | | 100.2 | | | 102.6 | |
| Inventories | | 108.9 | | | 122.8 | |
| Prepaid and other current assets | | 25.1 | | | 18.3 | |
| | | | |
| Total Current Assets | | 271.3 | | | 252.7 | |
| Property, Plant and Equipment, net | | 329.4 | | | 380.6 | |
| Lease Right-of-Use Assets | | 20.2 | | | 13.9 | |
| Deferred Income Taxes | | 18.3 | | | 13.4 | |
| Goodwill (Note 4) | | 87.4 | | | 83.1 | |
| Intangible Assets, net (Note 4) | | 62.6 | | | 66.7 | |
| Other Assets | | 17.4 | | | 17.4 | |
| TOTAL ASSETS | | $ | 806.6 | | | $ | 827.8 | |
| | | | |
| LIABILITIES AND STOCKHOLDERS' EQUITY | | | | |
| Current Liabilities | | | | |
| Debt payable within one year | | $ | 4.9 | | | $ | 2.6 | |
| Lease liabilities payable within one year | | 3.2 | | | 1.9 | |
| Accounts payable | | 46.0 | | | 48.9 | |
| Accrued expenses | | 61.9 | | | 47.0 | |
| | | | |
| Total Current Liabilities | | 116.0 | | | 100.4 | |
| Long-Term Debt | | 189.5 | | | 198.2 | |
| Noncurrent Lease Liabilities | | 18.4 | | | 13.0 | |
| Noncurrent Employee Benefits | | 96.8 | | | 93.1 | |
| Deferred Income Taxes | | 12.3 | | | 12.9 | |
| Other Noncurrent Obligations | | 6.0 | | | 3.9 | |
| TOTAL LIABILITIES | | 439.0 | | | 421.5 | |
| Commitments and Contingencies (Note 11) | | 0 | | 0 |
| Stockholders' Equity | | | | |
| Common stock, par value $0.01, authorized: 100,000,000 shares; issued and outstanding: 16,829,000 shares and 16,843,000 shares | | 0.2 | | | 0.2 | |
| Treasury stock, at cost: 1,917,000 shares and 1,835,000 shares | | (87.6) | | | (82.8) | |
| Additional paid-in capital | | 338.3 | | | 334.1 | |
| Retained earnings | | 220.4 | | | 268.1 | |
| Accumulated other comprehensive loss | | (103.7) | | | (113.3) | |
| Total Stockholders' Equity | | 367.6 | | | 406.3 | |
| TOTAL LIABILITIES AND STOCKHOLDERS' EQUITY | | $ | 806.6 | | | $ | 827.8 | |
See Notes to Consolidated Financial Statements
NEENAH, INC. AND SUBSIDIARIES
CONSOLIDATED STATEMENTS OF CHANGES IN STOCKHOLDERS' EQUITY
(In millions, shares in thousands)
| | | | | | | | | | | | | | | | | | | | | | | | | | | | | | | | | | | | | | |
| | | Common Stock | | | | | | | | |
| | | Shares | | Amount | | Treasury
Stock | | Additional
Paid-In
Capital | | Retained
Earnings | | Accumulated
Other
Comprehensive
Loss |
| Balance, December 31, 2017 | | 18,458 | | | $ | 0.2 | | | $ | (65.8) | | | $ | 323.9 | | | $ | 235.7 | | | $ | (94.1) | |
| Net income | | — | | | — | | | — | | | — | | | 36.4 | | | — | |
| Other comprehensive loss, after income tax benefit | | — | | | — | | | — | | | — | | | — | | | (11.3) | |
| Reclassification of the unrealized loss on "available-for-sale" securities | | — | | | — | | | — | | | — | | | (0.3) | | | 0.3 | |
| Reclassification of deferred income taxes on intra-entity asset transfers | | — | | | — | | | — | | | — | | | (0.8) | | | — | |
| Dividends declared | | — | | | — | | | — | | | — | | | (27.8) | | | — | |
| Shares purchased (Note 9) | | — | | | — | | | (9.3) | | | — | | | — | | | — | |
| Stock options exercised | | 67 | | | — | | | — | | | 0.7 | | | — | | | — | |
| Restricted stock vesting (Note 9) | | 72 | | | — | | | (1.5) | | | — | | | — | | | — | |
| Stock-based compensation | | — | | | — | | | — | | | 4.0 | | | — | | | — | |
| Other/Currency | | — | | | — | | | — | | | (0.1) | | | — | | | — | |
| Balance, December 31, 2018 | | 18,597 | | | 0.2 | | | (76.6) | | | 328.5 | | | 243.2 | | | (105.1) | |
| Net income | | — | | | — | | | — | | | — | | | 55.4 | | | — | |
| Other comprehensive loss, after income tax benefit | | — | | | — | | | — | | | — | | | — | | | (8.2) | |
| Dividends declared | | — | | | — | | | — | | | — | | | (30.5) | | | — | |
| Shares purchased (Note 9) | | — | | | — | | | (4.9) | | | — | | | — | | | — | |
| Stock options exercised | | 17 | | | — | | | — | | | — | | | — | | | — | |
| Restricted stock vesting (Note 9) | | 64 | | | — | | | (1.3) | | | — | | | — | | | — | |
| Stock-based compensation | | — | | | — | | | — | | | 5.6 | | | — | | | — | |
| | | | | | | | | | | | |
| Balance, December 31, 2019 | | 18,678 | | | 0.2 | | | (82.8) | | | 334.1 | | | 268.1 | | | (113.3) | |
| Net loss | | — | | | — | | | — | | | — | | | (15.8) | | | — | |
| Other comprehensive income, net of income tax | | — | | | — | | | — | | | — | | | — | | | 9.6 | |
| Dividends declared | | — | | | — | | | — | | | — | | | (31.9) | | | — | |
| Shares purchased (Note 9) | | — | | | — | | | (3.6) | | | — | | | — | | | — | |
| Stock options exercised | | 6 | | | — | | | — | | | — | | | — | | | — | |
| Restricted stock vesting (Note 9) | | 62 | | | — | | | (1.2) | | | — | | | — | | | — | |
| Stock-based compensation | | — | | | — | | | — | | | 4.2 | | | — | | | — | |
| | | | | | | | | | | | |
| Balance, December 31, 2020 | | 18,746 | | | $ | 0.2 | | | $ | (87.6) | | | $ | 338.3 | | | $ | 220.4 | | | $ | (103.7) | |
|
| | | | | | | | | | | | | | | | | | | | | | | |
| | | Common Stock | | | | | | | | |
| | | Shares | | Amount | | Treasury
Stock | | Additional
Paid-In
Capital | | Retained
Earnings | | Accumulated
Other
Comprehensive
Loss |
| Balance, December 31, 2015 | | 18,063 |
| | $ | 0.2 |
| | $ | (40.1 | ) | | $ | 310.8 |
| | $ | 119.0 |
| | $ | (78.3 | ) |
| Net income | | — |
| | — |
| | — |
| | — |
| | 73.0 |
| | — |
|
| Other comprehensive loss, after income tax benefit | | — |
| | — |
| | — |
| | — |
| | — |
| | (13.7 | ) |
| Dividends declared | | — |
| | — |
| | — |
| | — |
| | (22.4 | ) | | — |
|
| Shares purchased (Note 10) | | — |
| | — |
| | (12.6 | ) | | — |
| | — |
| | — |
|
| Stock options exercised | | 71 |
| | — |
| | — |
| | 0.4 |
| | — |
| | — |
|
| Restricted stock vesting (Note 10) | | 111 |
| | — |
| | (3.8 | ) | | — |
| | — |
| | — |
|
| Stock-based compensation (Note 10) | | — |
| | — |
| | — |
| | 5.8 |
| | — |
| | — |
|
| Balance, December 31, 2016 | | 18,245 |
| | 0.2 |
| | (56.5 | ) | | 317.0 |
| | 169.6 |
| | (92.0 | ) |
| Net income | | — |
| | — |
| | — |
| | — |
| | 80.3 |
| | — |
|
| Other comprehensive income, net of income taxes | | — |
| | — |
| | — |
| | — |
| | — |
| | 8.8 |
|
| Reclassification of the stranded tax effects related to the Tax Act (Note 10) | | — |
| | — |
| | — |
| | — |
| | 10.9 |
| | (10.9 | ) |
| Dividends declared | | — |
| | — |
| | — |
| | — |
| | (25.1 | ) | | — |
|
| Shares purchased (Note 10) | | — |
| | — |
| | (6.8 | ) | | — |
| | — |
| | — |
|
| Stock options exercised | | 140 |
| | — |
| | — |
| | 0.4 |
| | — |
| | — |
|
| Restricted stock vesting (Note 10) | | 73 |
| | — |
| | (2.5 | ) | | — |
| | — |
| | — |
|
| Stock-based compensation | | — |
| | — |
| | — |
| | 6.4 |
| | — |
| | — |
|
| Other/Currency | | — |
| | — |
| | — |
| | 0.1 |
| | — |
| | — |
|
| Balance, December 31, 2017 | | 18,458 |
| | 0.2 |
| | (65.8 | ) | | 323.9 |
| | 235.7 |
| | (94.1 | ) |
| Net income | | — |
| | — |
| | — |
| | — |
| | 36.4 |
| | — |
|
| Other comprehensive loss, after income tax benefit | | — |
| | — |
| | — |
| | — |
| | — |
| | (11.3 | ) |
| Reclassification of the unrealized loss on "available-for-sale" securities (Note 10) | | — |
| | — |
| | — |
| | — |
| | (0.3 | ) | | 0.3 |
|
| Reclassification of deferred income taxes on intra-entity asset transfers (Note 6) | | — |
| | — |
| | — |
| | — |
| | (0.8 | ) | | — |
|
| Dividends declared | | — |
| | — |
| | — |
| | — |
| | (27.8 | ) | | — |
|
| Shares purchased (Note 10) | | — |
| | — |
| | (9.3 | ) | | — |
| | — |
| | — |
|
| Stock options exercised | | 67 |
| | — |
| | — |
| | 0.7 |
| | — |
| | — |
|
| Restricted stock vesting (Note 10) | | 72 |
| | — |
| | (1.5 | ) | | — |
| | — |
| | — |
|
| Stock-based compensation | | — |
| | — |
| | — |
| | 4.0 |
| | — |
| | — |
|
| Other/Currency | | — |
| | — |
| | — |
| | (0.1 | ) | | — |
| | — |
|
| Balance, December 31, 2018 | | 18,597 |
| | $ | 0.2 |
| | $ | (76.6 | ) | | $ | 328.5 |
| | $ | 243.2 |
| | $ | (105.1 | ) |
See Notes to Consolidated Financial Statements
NEENAH, INC. AND SUBSIDIARIES
CONSOLIDATED STATEMENTS OF CASH FLOWS
(In millions)
| | | | | | | | | | | | | | | | | | | | |
| | | Year Ended December 31, |
| | | 2020 | | 2019 | | 2018 |
| OPERATING ACTIVITIES | | | | | | |
| Net income (loss) | | $ | (15.8) | | | $ | 55.4 | | | $ | 36.4 | |
| Adjustments to reconcile net income to net cash provided by operating activities: | | | | | | |
| Depreciation and amortization | | 36.7 | | | 38.9 | | | 36.1 | |
| Stock-based compensation | | 4.2 | | | 5.6 | | | 4.0 | |
| Deferred income tax provision (benefit) | | (4.9) | | | 3.4 | | | (1.9) | |
| Asset impairment costs (Note 12) | | 54.8 | | | 0 | | | 31.1 | |
| Loss on debt extinguishment (Note 6) | | 1.9 | | | 0 | | | 0 | |
| Pension curtailment (gain)/settlement charge, net of plan payments (Note 7) | | 1.6 | | | (1.4) | | | 1.8 | |
| Loss on asset dispositions | | 0 | | | 0.1 | | | 0.3 | |
| Non-cash effects of changes in liabilities for uncertain income tax positions | | (0.2) | | | (0.7) | | | 0.1 | |
| Net cash provided by (used in) changes in operating working capital, net of effect of acquisitions (Note 14) | | 18.2 | | | (0.6) | | | (1.0) | |
| Pension and other post-employment benefits | | (5.8) | | | (3.7) | | | (12.3) | |
| Noncurrent payroll taxes | | 2.2 | | | 0 | | | 0 | |
| Other | | 0.5 | | | 0.6 | | | (1.9) | |
| Net Cash Provided By Operating Activities | | 93.4 | | | 97.6 | | | 92.7 | |
| | | | | | |
| INVESTING ACTIVITIES | | | | | | |
| Capital expenditures | | (18.9) | | | (21.4) | | | (38.1) | |
| | | | | | |
| | | | | | |
| Proceeds from sale of property, plant and equipment (Note 12) | | 0.5 | | | 0 | | | 5.0 | |
| Sales (purchases) of marketable securities | | (0.1) | | | (0.4) | | | 0.1 | |
| | | | | | |
| | | | | | |
| Other | | (1.0) | | | (1.5) | | | (1.3) | |
| Net Cash Used In Investing Activities | | (19.5) | | | (23.3) | | | (34.3) | |
| | | | | | |
| FINANCING ACTIVITIES | | | | | | |
| Proceeds from issuance of long-term debt (Note 6) | | 291.6 | | | 163.5 | | | 272.8 | |
| Debt issuance costs (Note 6) | | (6.0) | | | (0.4) | | | (1.8) | |
| Repayments of long-term debt (Note 6) | | (295.9) | | | (201.6) | | | (285.6) | |
| | | | | | |
| | | | | | |
| Cash dividends paid | | (31.9) | | | (30.5) | | | (27.8) | |
| Shares purchased (Note 9) | | (4.8) | | | (6.2) | | | (10.8) | |
| Proceeds from exercise of stock options | | 0 | | | 0 | | | 0.6 | |
| | | | | | |
| Net Cash Used In Financing Activities | | (47.0) | | | (75.2) | | | (52.6) | |
| Effect of Exchange Rate Changes on Cash and Cash Equivalents | | 1.2 | | | 0 | | | (0.4) | |
| Net Increase (Decrease) in Cash and Cash Equivalents | | 28.1 | | | (0.9) | | | 5.4 | |
| Cash and Cash Equivalents, Beginning of Year | | 9.0 | | | 9.9 | | | 4.5 | |
| Cash and Cash Equivalents, End of Year | | $ | 37.1 | | | $ | 9.0 | | | $ | 9.9 | |
|
| | | | | | | | | | | | |
| | | Year Ended December 31, |
| | | 2018 | | 2017 | | 2016 |
| OPERATING ACTIVITIES | | |
| | |
| | |
|
| Net income | | $ | 36.4 |
| | $ | 80.3 |
| | $ | 73.0 |
|
| Adjustments to reconcile net income to net cash provided by operating activities: | | |
| | |
| | |
|
| Impairment loss (Note 14) | | 31.1 |
| | — |
| | — |
|
| Depreciation and amortization | | 36.1 |
| | 33.3 |
| | 32.0 |
|
| Stock-based compensation | | 4.0 |
| | 6.4 |
| | 5.8 |
|
| Deferred income tax provision | | (1.9 | ) | | (0.2 | ) | | 16.9 |
|
| Pension settlement charge, net of plan payments (Note 8) | | 1.8 |
| | 0.6 |
| | 0.8 |
|
| Loss on asset dispositions | | 0.3 |
| | 0.2 |
| | 0.1 |
|
| Non-cash effects of changes in liabilities for uncertain income tax positions | | 0.1 |
| | (0.1 | ) | | (1.5 | ) |
| Net cash used in changes in operating working capital, net of effect of acquisitions (Note 16) | | (1.0 | ) | | (11.8 | ) | | (1.2 | ) |
| Pension and other post-employment benefits | | (12.3 | ) | | (8.0 | ) | | (10.9 | ) |
| Other | | (1.9 | ) | | (0.7 | ) | | 0.8 |
|
| NET CASH PROVIDED BY OPERATING ACTIVITIES | | 92.7 |
| | 100.0 |
| | 115.8 |
|
| | | | | | | |
| INVESTING ACTIVITIES | | |
| | |
| | |
|
| Capital expenditures | | (38.1 | ) | | (42.7 | ) | | (68.5 | ) |
| Proceeds from sale of property, plant and equipment (Note 14) | | 5.0 |
| | — |
| | 0.1 |
|
| Asset acquisition | | — |
| | (8.0 | ) | | — |
|
| Sales (purchases) of marketable securities | | 0.1 |
| | (0.6 | ) | | (0.1 | ) |
| Acquisitions (Note 4) | | — |
| | (43.1 | ) | | — |
|
| Other | | (1.3 | ) | | (0.6 | ) | | 0.3 |
|
| NET CASH USED IN INVESTING ACTIVITIES | | (34.3 | ) | | (95.0 | ) | | (68.2 | ) |
| | | | | | | |
| FINANCING ACTIVITIES | | |
| | |
| | |
|
| Proceeds from issuance of long-term debt (Note 7) | | 272.8 |
| | 323.7 |
| | 243.0 |
|
| Debt issuance costs (Note 7) | | (1.8 | ) | | (0.3 | ) | | (0.1 | ) |
| Repayments of long-term debt (Note 7) | | (285.6 | ) | | (293.3 | ) | | (252.9 | ) |
| Proceeds from exercise of stock options | | 0.6 |
| | 0.4 |
| | 0.4 |
|
| Cash dividends paid | | (27.8 | ) | | (25.1 | ) | | (22.4 | ) |
| Shares purchased (Note 10) | | (10.8 | ) | | (9.3 | ) | | (16.4 | ) |
| Other | | — |
| | 0.1 |
| | — |
|
| NET CASH USED IN FINANCING ACTIVITIES | | (52.6 | ) | | (3.8 | ) | | (48.4 | ) |
| EFFECT OF EXCHANGE RATE CHANGES ON CASH AND CASH EQUIVALENTS | | (0.4 | ) | | 0.2 |
| | (0.3 | ) |
| NET INCREASE (DECREASE) IN CASH AND CASH EQUIVALENTS | | 5.4 |
| | 1.4 |
| | (1.1 | ) |
| CASH AND CASH EQUIVALENTS, BEGINNING OF YEAR | | 4.5 |
| | 3.1 |
| | 4.2 |
|
| CASH AND CASH EQUIVALENTS, END OF YEAR | | $ | 9.9 |
| | $ | 4.5 |
| | $ | 3.1 |
|
See Notes to Consolidated Financial Statements
NEENAH, INC. AND SUBSIDIARIES
NOTES TO CONSOLIDATED FINANCIAL STATEMENTS
(Dollars in millions, except as noted)
Note 1. Background and Basis of Presentation
Background
Neenah, Inc. ("Neenah" or the "Company"), is a Delaware corporation incorporated in April 2004. The Company has two2 primary operations: its technical products business and its fine paper and packaging business.
The technical products business is an international producer of fiber-formed, coated and/or saturated specialized media that delivers high performance benefits to customers. Included in this segment are filtration media, tape and abrasives backings products, digital image transfer papers, durable label and other specialty substrate products. The fine paper and packaging business is a supplier of branded premium printing, packaging and other high-end specialty papers primarily in North America. The Company's premium writing, text and cover papers, and specialty papers are used in commercial printing and imaging applications for corporate identity packages, invitations, personal stationery and high-end advertising, as well as premium labels and luxury packaging.
Basis of Presentation
The consolidated financial statements include the financial statements of the Company and its wholly owned and majority owned subsidiaries. All inter-company balances and transactions have been eliminated in consolidation.
The Company continues to assess the impacts of the novel coronavirus pandemic (“COVID-19” or the "pandemic") on its various accounting estimates and significant judgments, including those that require consideration of forecasted financial information in the context of the unknown future impacts of COVID-19, using information that is reasonably available at this time. The accounting estimates and other matters assessed included, but were not limited to, goodwill, indefinite-lived intangibles and other long-lived assets, allowance for uncollectible accounts receivable, valuation allowances for tax assets and revenue recognition. Based on the Company’s assessment of these estimates and due to the adverse impacts of COVID-19, during the year ended December 31, 2020, the Company recorded non-cash impairment losses of $54.8 million to write-down certain long-lived assets and investments, $2.6 million of restructuring charges due to the idling of a fine paper machine and other smaller assets and $0.4 million of related severance costs. See Note 12, "Asset Restructuring and Impairment Costs" for further discussion. As of November 30, 2020, the Company quantitatively assessed the carrying values of its intangible assets, including goodwill and indefinite-lived intangibles, and determined no additional assets were impaired. In addition, as a result of the impacts of COVID-19 and other factors, the Company recorded a $4.6 million increase to the valuation allowance against our state tax credits and NOLs. See Note 5, "Income Taxes" for further discussion.
The Company also incurred incremental and direct costs of responding to COVID-19, including costs of personal protective equipment, additional cleaning and sanitation supplies, and labor costs of quarantined workers of $3.5 million for the year ended December 31, 2020.
NEENAH, INC. AND SUBSIDIARIES
NOTES TO CONSOLIDATED FINANCIAL STATEMENTS (Continued)
(Dollars in millions, except as noted)
Note 2. Summary of Significant Accounting Policies
Use of Estimates
The preparation of financial statements in conformity with accounting principles generally accepted in the United States ("GAAP") requires management to make estimates and assumptions that affect the reported amounts of assets and liabilities at the date of the financial statements and the reported amounts of net sales and expenses during the reporting periods. Actual results could differ from these estimates, and changes in these estimates are recorded when known. Significant management judgment is required in determining the accounting for, among other things, reserves for uncertain tax positions, pension and postretirement benefits,benefit obligations, retained insurable risks, reserves for sales discounts and allowances, purchase price allocations, useful lives for depreciation and amortization, asset retirement obligations ("AROs"), future cash flows associated with impairment testing for tangible and intangible long-lived assets, goodwill, income taxes,valuation allowance for deferred tax assets, contingencies, inventory obsolescence and market reserves and the valuation of stock-based compensation.
Revenue Recognition
The Company recognizes sales revenue at a point in time following the transfer of control of the product to the customer, which typically occurs upon shipment or delivery depending on the terms of the underlying contracts.contractual arrangements. Sales are reported net of allowable discounts and estimated returns. Reserves for cash discounts, trade allowances and sales returns are estimated using historical experience. The Company accounts for shipping and handling activities related to contracts with customers as costs to fulfill our promise to transfer the associated products. Accordingly, the Company records customer payments of shipping and handling costs as a component of net sales and classifies such costs as a component of cost of sales. The Company excludes tax amounts assessed by governmental authorities that are both (i) imposed on and concurrent with a specific revenue-producing transaction and (ii) collected from customers from our measurement of transaction prices. Accordingly, such tax amounts are not included as a component of net sales or cost of sales. The Company considers each transaction/shipment as a separate performance obligation. Neenah recognizes revenue when the title transfers to the customer. As such, the remaining performance obligations at period end are not considered significant.material. Sales terms in the technical products business vary depending on the type of product sold and customer category. In general, sales are collected in approximately 45 to 55 days. Extended credit terms of up to 120 days are offered to
customers located in certain international markets. Fine paper and packaging sales terms range between 20 and 30 days with discounts of 0 to 2 percent for early customer payments, with discounts of one1 percent and 20-day terms used most often. Extended credit terms are offered to customers located in certain international markets. Refer to Note 15,13, "Business Segment and Geographic Information", for further disaggregation of revenue.
Cash and Cash Equivalents
Cash and cash equivalents include all cash balances and highly liquid investments with an initial maturity of three months or less. The Company places its temporary cash investments with high credit quality financial institutions. As of December 31, 20182020 and 2017, $0.12019, $0.3 million and $0.1 million, respectively, of the Company's cash and cash equivalents is restricted to the payment of postretirement benefits for certain former Fox River executives.
Inventories
U.S. inventories are valued at the lower of cost, using the last-in, first-out ("LIFO") method for financial reporting purposes, or market. European inventories are valued at the lower of cost, using a weighted-average cost method, or net realizable value. Cost includes labor, materials and production overhead.
NEENAH, INC. AND SUBSIDIARIES
NOTES TO CONSOLIDATED FINANCIAL STATEMENTS (Continued)
(Dollars in millions, except as noted)
Foreign Currency
Balance sheet accounts of the Company's operations in Germany and the Netherlands, the United Kingdom (the "U.K."), and Canada are translated from Euros, British Pounds, and Canadian dollars, respectively, into U.S. dollars at period-end exchange rates, and income and expense accounts are translated at average exchange rates during the period. Translation gains or losses related to net assets located in Germany, the Netherlands, the U.K., and Canada are recorded as unrealized foreign currency translation adjustments within accumulated other comprehensive income (loss) ("AOCI") in stockholders' equity. Gains and losses resulting from foreign currency transactions (transactions denominated in a currency other than the entity's functional currency) are included in Other expense, — net in the consolidated statements of operations.
Property and Depreciation
Property, plant and equipment are stated at cost, less accumulated depreciation. Certain costs of software developed or obtained for internal use are capitalized. When property, plant and equipment is sold or retired, the costs and the related accumulated depreciation are removed from the accounts, and the gains or losses are recorded in Other (income) expense, — net. For financial reporting purposes, depreciation is principally computed on the straight-line method over estimated useful asset lives. The weighted average remaining useful lives for buildings, land improvements and machinery and equipment are approximately 1817 years, 1920 years and 9 years, respectively. The units-of-production method of depreciation is used for the U.S. transportation filtration production assets with a gross book value of $68.8$29.4 million, which reflects the nature of the assets' utilization. For income tax purposes, accelerated methods of depreciation are used.
The costs of major rebuilds and replacements of plant and equipment are capitalized, and the cost of maintenance performed on manufacturing facilities, composed of labor, materials and other incremental costs, is expensed as incurred. Start-up costs for new or expanded facilities, including costs related to trial production, are expensed as incurred.
The Company accounts for AROs in accordance with Accounting Standards Codification ("ASC") Topic 410, Asset Retirements and Environmental Obligations, which requires companies to make estimates regarding future events in order to record a liability for AROs in the period in which a legal obligation is created. Such liabilities are recorded at fair value, with an offsetting increase to the carrying value of the related long-lived asset. As of December 31, 2018,2020, the Company is unable to estimate its AROs for environmental liabilities at its manufacturing facilities.facilities, but does not believe the liabilities related to AROs, if any, are material.
NEENAH, INC. AND SUBSIDIARIES
NOTES TO CONSOLIDATED FINANCIAL STATEMENTS (Continued)
(Dollars in millions, except as noted)
Stock-Based Compensation
The Company accounts for stock-based compensation in accordance with the fair value recognition provisions of ASC Topic 718, Compensation — Stock Compensation ("ASC Topic 718"). The amount of stock-based compensation cost recognized is based on the fair value of grants that are ultimately expected to vest and is recognized pro-rata over the requisite service period for the entire award.
Research and Development Expense
Research and development costs are charged to expense as incurred and are recorded in "Selling, general and administrative expenses" on the consolidated statement of operations. See Note 16,14, "Supplemental Data — Supplemental Statement of Operations Data."
Fair Value Measurements
The Company measures the fair value of pension plan assets in accordance with ASC Topic 820, Fair Value Measurements and Disclosures ("ASC Topic 820") which establishes a framework for measuring fair value. ASC Topic 820 provides a fair value hierarchy that
NEENAH, INC. AND SUBSIDIARIES
NOTES TO CONSOLIDATED FINANCIAL STATEMENTS (Continued)
(Dollars in millions, except as noted)
prioritizes the inputs to valuation techniques used to measure fair value. The hierarchy gives the highest priority to unadjusted quoted prices in active markets for identical assets or liabilities (Level 1 measurements) and the lowest priority to unobservable inputs (Level 3 measurements).
Fair Value of Financial Instruments
TheAs of December 31, 2020 and 2019, the carrying amounts reflected invalues of the consolidated balance sheets for cash and cash equivalents, accounts receivable and accounts payable approximateCompany’s debt approximated fair value.The fair value due to their short maturities. The fair value of short and long-termfor all debt isinstruments was estimated from Level 2 measurements using rates currently available to the Company for debt of the same remaining maturities. The following table presents the carrying value and the fair value of the Company's debt.
|
| | | | | | | | | | | | | | | | |
| | | 12/31/2018 | | 12/31/2017 |
| | | Carrying
Value | | Fair
Value (a) | | Carrying
Value | | Fair
Value (a) |
| 2021 Senior Notes (5.25% fixed rate) | | $ | 175.0 |
| | $ | 170.5 |
| | $ | 175.0 |
| | $ | 170.2 |
|
| Global Revolving Credit Facilities (variable rates) | | 57.9 |
| | 57.9 |
| | 76.9 |
| | 76.9 |
|
| Second German Loan Agreement (2.5% fixed rate) | | 4.8 |
| | 5.1 |
| | 6.4 |
| | 6.4 |
|
| Third German Loan Agreement (1.45% fixed rate) | | 4.9 |
| | 4.9 |
| | — |
| | — |
|
| Total debt | | $ | 242.6 |
| | $ | 238.4 |
| | $ | 258.3 |
| | $ | 253.5 |
|
_______________________
| | | | | | | | | | | | | | | | | | | | | | | | | | |
(a) | Fair value for all debt instruments was estimated from Level 2 measurements. | | | | | | | |
| | | | |
| | | | | | | | |
| | | | | | | | |
| | | | | | | | |
| | | | | | | | |
| | | | | | | | |
| | | | | | | | |
| | | | | | | | |
The Company's investments in marketable securities are accounted for as "available-for-sale securities" in accordance with ASC Topic 320, Investments — Debt and Equity Securities ("ASC Topic 320"). Pursuant to ASC Topic 320, marketable securities are reported at fair value on the consolidated balance sheet and holding gains and losses are reported in "Other Income (Expense), net" on the Company's consolidated statements of operations. At December 31, 2018,2020, the Company had
NEENAH, INC. AND SUBSIDIARIES
NOTES TO CONSOLIDATED FINANCIAL STATEMENTS (Continued)
(Dollars in millions, except as noted)
$3.6 $4.3 million in marketable securities classified as Other assets on the consolidated balance sheet. The cost of such marketable securities was $4.3$4.7 million. Fair value for the Company's marketable securities was estimated from Level 1 inputs. The Company's marketable securities are designated for the payment of benefits under its supplemental employee retirement plan ("SERP").
Fair Value of Pension Plan Assets
With the exception of cash and cash equivalents which are considered Level 1, and thecertain annuity contracts which are considered Level 3, pension plan assets are measured at Net Asset Value ("NAV") (or its equivalent) as an alternative to fair market value due to the absence of readily available market prices, and as such are not subject to the fair value hierarchy. Following is the fair value of each investment category:
•Cash and cash equivalents ($1.73.8 million and $1.6$0.8 million at December 31, 20182020 and 2017,2019, respectively).
•U.S and non-U.S. Equities ($107.8144.1 million and $123.2$122.5 million at December 31, 20182020 and 2017,2019, respectively) — These proprietary collective funds have observable NAVs (based on the fair value of the underlying investments of the funds) that are provided to investors and provide for liquidity either immediately or within a few days.
•U.S and non-U.S. Fixed Income Securities ($192.7224.8 million and $199.0$219.4 million at December 31, 20182020 and 2017,2019, respectively) — These proprietary collective funds have observable NAVs (based on the fair value of the underlying investments of the funds) that are provided to investors and provide for liquidity either immediately or within a few days.
•Hedge FundFund/Other ($27.931.6 million and $28.2$29.9 million at December 31, 20182020 and 2017,2019, respectively) — This fund is valued using NAVs calculated by the underlying investment managers and allow for quarterly or more frequent redemptions.
In conjunction with the Coldenhove Acquisition, there were purchases of $46.8 million into Level 3 plan assets during the year ended December 31, 2017, as the defined benefit plan for Coldenhove is administered through an insurance contract.
The following table summarizes the changes in Level 3 defined benefit pension plan assets (Dutch insurance contract) measured at fair value on a recurring basis for the year ended December 31, 2018 and 2017:
|
| | | | | | | | | | | | | | | | | | | | | | | | | | | | |
| | | | | Return on plan assets | | |
| | | Fair Value at January 1 | | Attributable to Assets Held at December 31 | | Attributable to Assets Sold | | Net Purchases/ (Settlements) | | Transfers into/ (out of) Level 3 | | Foreign currency effects | | Fair
Value at December 31 |
| For the year ended December 31, 2017 | | $ | — |
| | $ | 0.2 |
| | $ | — |
| | $ | 46.9 |
| | $ | — |
| | $ | 1.3 |
| | $ | 48.4 |
|
| For the year ended December 31, 2018 | | $ | 48.4 |
| | $ | (0.9 | ) | | $ | — |
| | $ | (0.3 | ) | | $ | — |
| | $ | (2.1 | ) | | $ | 45.1 |
|
Accounting Standards Changes
In March 2017, the FASB issued ASU 2017-07, Improving the Presentation of Net Periodic Pension Cost and Net Periodic Postretirement Benefit Cost (Topic 715). ASU 2017-07 requires entities to (1) disaggregate the current service-cost component from the other components of net benefit cost (the "other components") and present it with other current compensation costs for related employees in the income statement and (2) present the other components elsewhere in the income statement and outside of income from operations if such a subtotal is presented. In addition, only the service-cost component of net benefit cost is eligible for capitalization in inventories. The Company adopted this ASU as of January 1, 2018. As a result of the adoption, the Company reclassified $1.5 million and $1.2 million of net cost for the year ended December 31, 2017, and $2.8 million and $2.2 million of net cost for the year ended December 31, 2016, respectively, of
NEENAH, INC. AND SUBSIDIARIES
NOTES TO CONSOLIDATED FINANCIAL STATEMENTS (Continued)
(Dollars in millions, except as noted)
The following table summarizes the changes in Level 3 defined benefit pension plan assets (Neenah Coldenhove insurance contract for which fair value is determined based on actuarial assumptions) measured at fair value on a recurring basis for the year ended December 31, 2020 and 2019:
other components | | | | | | | | | | | | | | | | | | | | | | | | | | | | | | | | | | | | | | | | | | | | |
| | | | | Return on plan assets | | |
| | | Fair Value at January 1 | | Attributable to Assets Held at December 31 | | Attributable to Assets Sold | | Net Purchases/ (Settlements) | | Transfers into/ (out of) Level 3 | | Foreign currency effects | | Fair
Value at December 31 |
| For the year ended December 31, 2018 | | $ | 48.4 | | | (0.9) | | | 0 | | | (0.3) | | | 0 | | | (2.1) | | | $ | 45.1 | |
| For the year ended December 31, 2019 | | $ | 45.1 | | | 7.5 | | | 0 | | | (0.2) | | | 0 | | | (0.9) | | | $ | 51.5 | |
| For the year ended December 31, 2020 | | $ | 51.5 | | | 5.0 | | | 0 | | | (1.5) | | | 0 | | | 5.1 | | | $ | 60.1 | |
Acquisition-related costs and adjustments
During the year ended December 31, 2020, the Company incurred $1.5 million of net benefit costdue diligence and transaction costs of acquisition attempts that were not consummated. NaN such costs were incurred during the year ended December 31, 2019. During the year ended December 31, 2018, the Company recognized $3.9 million of acquisition-related adjustments as income related to the acquisition of Coldenhove.
Discontinued Operations
During the three months ended September 30, 2018, the Company recorded an additional loss on sale of $0.8 million arising from "Cost of products sold" and "Selling, general and administrative expenses"the final adjustment to "Other Expense - net"the transaction price on the consolidated statementssale of operations. There was nothe Lahnstein Mill in 2015.
Accounting Standards Changes
In August 2018, the Financial Accounting Standards Board (the "FASB") issued the Accounting Standards Update ("ASU") 2018-14, Compensation—Retirement Benefits—Defined Benefit Plans—General (Topic 715-20): Disclosure Framework—Changes to the Disclosure Requirements For Defined Benefit Plans. The ASU modified the annual disclosure requirements for employers that sponsor defined benefit pension or other materialpostretirement plans. The guidance requires disclosure changes to be presented on a retrospective basis. The Company adopted the guidance as of year-ended December 31, 2020. As this standard relates only to financial disclosures, its adoption did not have an impact on its consolidatedresults of operations, financial statements due to the adoption.position or cash flows.
In February 2016, the FASB issued ASU 2016-02, Leases (Topic 842) ("ASU 2016-02"). ASU 2016-02 requires lessees to put most leases on their balance sheets but recognize expenses on their income statements in a manner similar to current lease accounting. The amendments in this ASU are effective January 1, 2019. In July 2018, the FASB issued ASU 2018-11, Leases - Targeted Improvements, to allow a company to elect an optional modified retrospective transition method that applies the new lease requirements through a cumulative-effect adjustment in the period of adoption. Effective January 1, 2019,2020, the Company adopted ASU 2016-13, Financial Instruments - Credit Losses (Topic 326): Measurement of Credit Losses on Financial Instruments, which amends the new lease accounting standard usingFASB's guidance on the modified retrospective transition optionimpairment of applyingfinancial instruments. The ASU adds to U.S. GAAP an impairment model (known as the new standard at the adoption date. The Company elected the package of practical expedients permitted under the transition guidance within the new standard, which among other things, allowed the Company to carry forward the historical lease classification. The most significant change was related to the recognition of $17 million of right-of-use assets and corresponding lease liabilities"current expected credit loss model" or "CECL") that is based on its consolidated balance sheet as of January 1, 2019.expected losses rather than incurred losses. The adoption of this standard did not have a material impact relatedon the Company's financial position, results of operations and cash flows.
In March 2020, the FASB issued ASU 2020-04, Reference Rate Reform (Topic 848)-Facilitation of the Effects of Reference Rate Reform on Financial Reporting. This ASU addresses accounting implications of the replacement of LIBOR (London Inter-Bank Offered Rate) with SOFR (Secured Overnight Financing Rate) or other alternatives by the end of 2021. The FASB allows immediate relief from application of contract modification accounting triggered by reference rate reform that otherwise would be costly to existing leasesimplement and as a result a cumulative-effect adjustment was not recorded.in burdensome financial reporting. The Company is currently workingintends to completeelect the implementation of new processes to assistexpedients and exceptions offered in the ongoing lease data collection and analysis, and updating its accounting policies and internal controlsASU.
NEENAH, INC. AND SUBSIDIARIES
NOTES TO CONSOLIDATED FINANCIAL STATEMENTS (Continued)
(Dollars in connection with the adoption of the new standard.millions, except as noted)
As of December 31, 2018,2020, no other amendments to the ASC had been issued and not adopted by the Company that will have or are reasonably likely to have a material effect on the its financial position, results of operations or cash flows.
Note 3. Earnings per Share ("EPS")
The Company's restricted stock units ("RSUs") are paid non-forfeitable common stock dividends and thus meet the criteria of participating securities. Accordingly, basic EPS has been calculated using the two-class method, under which earnings are allocated to both common stock and participating securities. Basic EPS has been computed by dividing net income allocated to common stock by the weighted average common shares outstanding. For the computation of basic EPS, weighted average RSUs outstanding are excluded from the calculation of weighted average shares outstanding.
ASC Topic 260, Earnings per Share ("ASC Topic 260") requires companies with participating securities to calculate diluted earnings per share using the "two class" method. The "two class" method requires first calculating diluted earnings per share using a denominator that includes the weighted average share equivalents from the assumed conversion of dilutive securities. Diluted earnings per share is then calculated using net income reduced by the amount of distributed and undistributed earnings allocated to participating securities calculated using the "Treasury Stock" method and a denominator that includes the weighted average share equivalents from the assumed conversion of dilutive securities excluding participating securities. Companies are required to report the lower of the diluted earnings per share amounts under the two calculations subject to the anti-dilution provisions of ASC Topic 260.
Diluted EPS has been computed by dividing net income allocated to common stock by the weighted average number of common shares used in computing basic EPS, further adjusted to include the dilutive impact of the exercise or conversion of common stock equivalents, such as stock options, stock appreciation rights ("SARs") and target awards of RSUs with performance conditions ("Performance Share Units" or "PSUs"), into shares of common stock as if those securities were exercised or converted. For the years ended December 31, 2020, 2019 and 2018, 2017approximately 332,000, 231,000 and 2016, approximately 143,000 72,000 and 35,000 potentially dilutive options, respectively, were excluded from the computation of dilutive common shares because the exercise price of such options exceeded the average market price of the Company's common stock for the respective 12-month periods during which the options were outstanding.
NEENAH, INC. AND SUBSIDIARIES
NOTES TO CONSOLIDATED FINANCIAL STATEMENTS (Continued)
(Dollars in millions, except In addition, as noted)
a result of the loss from continuing operations for the year ended December 31, 2020, incremental shares of 20,576, resulting from the dilutive options and performance share units, were excluded from the diluted earnings per share calculation as the effect would have been anti-dilutive.
The following table presents the computation of basic and diluted shares of common stock used in the calculation of EPS (amounts in millions, except share and per share amounts):
Earnings (loss) per basic common share | | | | | | | | | | | | | | | | | | | | |
| | | Year Ended December 31, |
| | | 2020 | | 2019 | | 2018 |
| Income (loss) from continuing operations | | $ | (15.8) | | | $ | 55.4 | | | $ | 37.2 | |
| Amounts attributable to participating securities | | (0.2) | | | (0.3) | | | (0.2) | |
| Income (loss) from continuing operations available to common stockholders | | (16.0) | | | 55.1 | | | 37.0 | |
| Loss from discontinued operations, net of income taxes | | 0 | | | 0 | | | (0.8) | |
| | | | | | |
| Net income (loss) available to common stockholders | | $ | (16.0) | | | $ | 55.1 | | | $ | 36.2 | |
| Weighted-average basic shares outstanding | | 16,813 | | | 16,848 | | | 16,850 | |
| Basic earnings (loss) per share | | | | | | |
| Continuing operations | | $ | (0.96) | | | $ | 3.27 | | | $ | 2.20 | |
| Discontinued operations | | 0 | | | 0 | | | (0.05) | |
| | $ | (0.96) | | | $ | 3.27 | | | $ | 2.15 | |
|
| | | | | | | | | | | | |
| | | Year Ended December 31, |
| | | 2018 | | 2017 | | 2016 |
| Income from continuing operations | | $ | 37.2 |
| | $ | 80.3 |
| | $ | 73.4 |
|
| Amounts attributable to participating securities | | (0.2 | ) | | (0.6 | ) | | (0.7 | ) |
| Income from continuing operations available to common stockholders | | 37.0 |
| | 79.7 |
| | 72.7 |
|
| Income (loss) from discontinued operations, net of income taxes | | (0.8 | ) | | — |
| | (0.4 | ) |
| Amounts attributable to participating securities | | — |
| | — |
| | — |
|
| Net income available to common stockholders | | $ | 36.2 |
| | $ | 79.7 |
| | $ | 72.3 |
|
| Weighted-average basic shares outstanding | | 16,850 |
| | 16,805 |
| | 16,773 |
|
| Basic earnings (loss) per share | | |
| | |
| | |
|
| Continuing operations | | $ | 2.20 |
| | $ | 4.74 |
| | $ | 4.33 |
|
| Discontinued operations | | (0.05 | ) | | — |
| | (0.02 | ) |
| | | $ | 2.15 |
| | $ | 4.74 |
| | $ | 4.31 |
|
Earnings per diluted common share |
| | | | | | | | | | | | |
| | | Year Ended December 31, |
| | | 2018 | | 2017 | | 2016 |
| Income from continuing operations | | $ | 37.2 |
| | $ | 80.3 |
| | $ | 73.4 |
|
| Amounts attributable to participating securities | | (0.4 | ) | | (0.5 | ) | | (0.6 | ) |
| Income from continuing operations available to common stockholders | | 36.8 |
| | 79.8 |
| | 72.8 |
|
| Income (loss) from discontinued operations, net of income taxes | | (0.8 | ) | | — |
| | (0.4 | ) |
| Amounts attributable to participating securities | | — |
| | — |
| | — |
|
| Net income available to common stockholders | | $ | 36.0 |
| | $ | 79.8 |
| | $ | 72.4 |
|
| Weighted-average basic shares outstanding | | 16,850 |
| | 16,805 |
| | 16,773 |
|
| Add: Assumed incremental shares under stock-based compensation plans | | 118 |
| | 247 |
| | 314 |
|
| Weighted average diluted shares | | 16,968 |
| | 17,052 |
| | 17,087 |
|
| Diluted earnings (loss) per share | | |
| | |
| | |
|
| Continuing operations | | $ | 2.17 |
| | $ | 4.68 |
| | $ | 4.26 |
|
| Discontinued operations | | (0.05 | ) | | — |
| | (0.02 | ) |
| | | $ | 2.12 |
| | $ | 4.68 |
| | $ | 4.24 |
|
Note 4. Acquisitions
On November 1, 2017, the Company purchased all of the outstanding equity of Coldenhove for net cash of approximately $43 million. Coldenhove is a specialty materials manufacturer based in the Netherlands, with a leading position in digital transfer media and other technical products.
NEENAH, INC. AND SUBSIDIARIES
NOTES TO CONSOLIDATED FINANCIAL STATEMENTS (Continued)
(Dollars in millions, except as noted)
Earnings (loss) per diluted common share | | | | | | | | | | | | | | | | | | | | |
| | | Year Ended December 31, |
| | | 2020 | | 2019 | | 2018 |
| Income (loss) from continuing operations | | $ | (15.8) | | | $ | 55.4 | | | $ | 37.2 | |
| Amounts attributable to participating securities | | (0.2) | | | (0.3) | | | (0.4) | |
| Income (loss) from continuing operations available to common stockholders | | (16.0) | | | 55.1 | | | 36.8 | |
| Loss from discontinued operations, net of income taxes | | 0 | | | 0 | | | (0.8) | |
| | | | | | |
| Net income (loss) available to common stockholders | | $ | (16.0) | | | $ | 55.1 | | | $ | 36.0 | |
| Weighted-average basic shares outstanding | | 16,813 | | | 16,848 | | | 16,850 | |
| Add: Assumed incremental shares under stock-based compensation plans | | 0 | | | 58 | | | 118 | |
| Weighted average diluted shares | | 16,813 | | | 16,906 | | | 16,968 | |
| Diluted earnings (loss) per share | | | | | | |
| Continuing operations | | $ | (0.96) | | | $ | 3.26 | | | $ | 2.17 | |
| Discontinued operations | | 0 | | | 0 | | | (0.05) | |
| | $ | (0.96) | | | $ | 3.26 | | | $ | 2.12 | |
The Company accounted for the transaction using the acquisition method in accordance with ASC Topic 805, Business Combinations ("ASC Topic 805"). The allocation of the purchase price was based on estimates of the fair value of assets acquired and liabilities assumed as of November 1, 2017. The Company did not recognize any in-process research and development assets as part of the acquisition.
The following table summarizes the allocation of the purchase price to the estimated fair value of the assets acquired and liabilities assumed as of December 31, 2017.
|
| | | | |
| | | December 31, 2017 |
| Assets Acquired | | |
|
| Cash and cash equivalents | | $ | 4.9 |
|
| Accounts receivable | | 4.7 |
|
| Inventories (a) | | 12.7 |
|
| Deferred income taxes | | 0.4 |
|
| Prepaid and other current assets | | 0.2 |
|
| Property, plant and equipment (a) | | 31.2 |
|
| Non-amortizable intangible assets | | 1.2 |
|
| Amortizable intangible assets | | 4.7 |
|
| Acquired goodwill (a) | | 10.0 |
|
| Other assets | | 0.1 |
|
| Total assets acquired | | 70.1 |
|
| Liabilities Assumed | | |
|
| Accounts payable | | 4.1 |
|
| Accrued expenses | | 5.4 |
|
| Contingent liability (b) | | 2.3 |
|
| Deferred income taxes (a) | | 3.5 |
|
| Noncurrent employee benefits | | 4.9 |
|
| Long-term debt | | 1.8 |
|
| Other noncurrent obligations | | 0.1 |
|
| Total liabilities assumed | | 22.1 |
|
| Net assets acquired | | $ | 48.0 |
|
________________________
(a) The Company had up to 12 months from the closing of the acquisition to finalize its valuations. Management evaluated additional information and determined that the preliminary valuation of inventory at the acquisition date should have been determined using fair value assumptions that would have resulted in the fair value of inventory being lower than originally estimated primarily due to changes in the assumptions related to inventory margins of the acquired business. In addition, management evaluated additional information related to fixed assets and updated the preliminary valuation of fixed assets at the acquisition date. Accordingly, during the nine months ended September 30, 2018, adjustments were made to reduce the carrying value of inventories and fixed assets by $1.5 million, with a corresponding increase to the value of goodwill of $1.1 million, net of tax.
(b) In conjunction with the acquisition, the Company assumed a contingent liability of $2.3 million related to the acquisition of direct customer relationships by Coldenhove, which amount is contingent on the growth of sales from these customer relationships in 2018 and 2019. As of December 31, 2018, the estimated liability amount was decreased to $0.8 million. In addition, during the year ended December 31, 2018, the Company recognized a receivable of $2.4 million from the former shareholders of Coldenhove related to a claim under an escrow arrangement
NEENAH, INC. AND SUBSIDIARIES
NOTES TO CONSOLIDATED FINANCIAL STATEMENTS (Continued)
(Dollars in millions, except as noted)
which reduced the purchase price. These two items totaling $3.9 million were recognized as income during the year ended December 31, 2018, as they relate to the operating results subsequent to the acquisition.
The Company estimated the fair value of the assets and liabilities acquired in accordance with ASC Topic 820, Fair Value Measurements and Disclosures ("ASC Topic 820"). The fair value of amortizable and non-amortizable intangible assets was estimated by applying a royalty rate to projected revenue, net of tax impacts and adjusted for present value considerations. The Company estimated the fair value of acquired property, plant and equipment using a combination of cost and market approaches. In general, the fair value of other acquired assets and liabilities was estimated using the cost basis of Coldenhove.
The excess of the purchase price over the estimated fair value of the tangible net assets and identifiable intangible assets acquired was recorded as acquired goodwill. The factors contributing to the amount of goodwill recognized are based on several strategic and synergistic benefits that are expected to be realized from the acquisition of Coldenhove. These benefits include entry into profitable new markets for performance materials and specialty papers with new capabilities and recognized brands and synergies from combining the business with Neenah's existing infrastructure. None of the goodwill recognized as part of the Coldenhove acquisition will be deductible for income tax purposes. All of the acquired goodwill was allocated to the Technical Products segment.
For the year ended December 31, 2018, the Company incurred $0.5 million of integration costs. For the year ended December 31, 2017, the Company incurred $1.3 million of acquisition and restructuring costs. For the year ended December 31, 2017, the Company recorded net sales of $7.5 million and insignificant loss from operations before income taxes (excluding the acquisition related costs described above) for the acquired business.
The following selected unaudited pro forma consolidated statements of operations data for the year ended December 31, 2017 and 2016 was prepared as though the Coldenhove acquisition had occurred on January 1, 2016. The information does not reflect future events that may occur after the acquisition or any operating efficiencies or inefficiencies that may result from the Coldenhove acquisition. Therefore, the information is not necessarily indicative of results that would have been achieved had the businesses been combined during the periods presented or the results that the Company will experience going forward.
|
| | | | | | | | |
| | | Year Ended December 31, |
| | | 2017 | | 2016 |
| Net sales | | $ | 1,019.8 |
| | $ | 986.9 |
|
| Operating income | | 108.9 |
| | 116.7 |
|
| Income from continuing operations | | 83.0 |
| | 74.8 |
|
| Income (loss) from discontinued operations | | — |
| | (0.4 | ) |
| Net income | | $ | 83.0 |
| | $ | 74.4 |
|
| Earnings (Loss) Per Common Share | | |
| | |
| Basic | | |
| | |
| Continuing operations | | $ | 4.90 |
| | $ | 4.42 |
|
| Discontinued operations | | — |
| | (0.02 | ) |
| | | $ | 4.90 |
| | $ | 4.40 |
|
| Diluted | | |
| | |
| Continuing operations | | $ | 4.84 |
| | $ | 4.34 |
|
| Discontinued operations | | — |
| | (0.02 | ) |
| | | $ | 4.84 |
| | $ | 4.32 |
|
NEENAH, INC. AND SUBSIDIARIES
NOTES TO CONSOLIDATED FINANCIAL STATEMENTS (Continued)
(Dollars in millions, except as noted)
Note 5.4. Goodwill and Other Intangible Assets
The Company follows the guidance of ASC Topic 805, Business Combinations ("ASC Topic 805"), in recording goodwill arising from a business combination as the excess of purchase price over the fair value of identifiable assets acquired and liabilities assumed.
The Company tests goodwill for impairment at least annually on November 30 in conjunction with preparation of its annual business plan, or more frequently if events or circumstances indicate it might be impaired.
The Company tested goodwill for impairment as of November 30, 20182020 under ASC Topic 350, Intangibles — Goodwill and Other. In this quantitative assessment, the Company estimated the fair value of the reporting units principally using a market approach in combination with a discounted operating cash flow approach. Significant assumptions used in developing the discounted operating cash flow approach were revenue growth rates and pricing, costs for manufacturing inputs, levels of capital investment and estimated cost of capital for high, medium and low growth environments. Based on these assessments, the Company determined that the current fair value determinations were higher than the current carrying amount of the reporting units. There was no0 impairment in the carrying value of goodwill for the years ended December 31, 2018, 20172020, 2019 and 2016,2018, with the exception of $0.1 million of goodwill impairment related to the sale of the Brattleboro mill in 2018. See Note 14, "Sale of Brattleboro mill12, "Asset Restructuring and Impairment Loss.Costs."
Intangible assets with finite useful lives are amortized on a straight-line basis over their respective estimated useful lives to their estimated residual values, and reviewed for impairment in accordance with ASC Topic 360, Property, Plant, and Equipment. Intangible assets consist primarily of customer relationships, trade names and acquired intellectual property. Such intangible assets are amortized using the straight-line method over estimated useful lives of between 10 and 15 years. Certain trade names are estimated to have indefinite useful lives and as such are not amortized. Intangible assets with indefinite lives are reviewed for impairment at least annually. During the second quarter of 2020, the Company recorded an impairment loss for its indefinite-lived intangible assets (brand names) of $0.9 million and $0.4 million in the Fine Paper and Packaging and Technical Products segments, respectively, due to the adverse impacts of the pandemic. See Note 12, "Asset Restructuring and Impairment Costs." There was no0 impairment in the carrying value of intangible assets with indefinite lives for the years ended December 31, 2018, 20172019 and 2016 .2018.
NEENAH, INC. AND SUBSIDIARIES
NOTES TO CONSOLIDATED FINANCIAL STATEMENTS (Continued)
(Dollars in millions, except as noted)
The following table presents the carrying value of goodwill by business segment and changes in the carrying value of goodwill.
| | | | | | | | | | | | | | | | | | | | | | | | | | | | | | | | | | | | | | | | | | | | | | | | | | | | | | | | | | | | | | |
| | | Technical Products | | Fine Paper and
Packaging | | Other | | |
| | | Gross
Amount | | Accumulated
Impairment
Losses | | | | Gross Amount | | Accumulated
Impairment
Losses | | | | Gross
Amount | | Accumulated
Impairment
Losses | | | | |
| | | | | Net | | | | Net | | | | Net | | Net |
| Balance at December 31, 2018 | | $ | 124.9 | | | $ | (47.4) | | | $ | 77.5 | | | $ | 6.2 | | | $ | — | | | $ | 6.2 | | | $ | 0.4 | | | $ | (0.1) | | | $ | 0.3 | | | $ | 84.0 | |
| Realignment of Other segment (a) | | 0.4 | | | (0.1) | | | 0.3 | | | — | | | — | | | — | | | (0.4) | | | 0.1 | | | (0.3) | | | 0 | |
| Foreign currency translation | | (1.9) | | | 1.0 | | | (0.9) | | | — | | | — | | | — | | | — | | | — | | | — | | | (0.9) | |
| Balance at December 31, 2019 | | 123.4 | | | (46.5) | | | 76.9 | | | 6.2 | | | — | | | 6.2 | | | 0 | | | 0 | | | 0 | | | 83.1 | |
| Foreign currency translation | | 8.6 | | | (4.3) | | | 4.3 | | | — | | | — | | | — | | | — | | | — | | | — | | | 4.3 | |
| Balance at December 31, 2020 | | $ | 132.0 | | | $ | (50.8) | | | $ | 81.2 | | | $ | 6.2 | | | $ | — | | | $ | 6.2 | | | $ | 0 | | | $ | 0 | | | $ | 0 | | | $ | 87.4 | |
|
| | | | | | | | | | | | | | | | | | | | | | | | | | | | | | | | | | | | |
| | | Technical Products | | Fine Paper and
Packaging | | Other | | |
| | | Gross
Amount | | Accumulated
Impairment
Losses | | | | Gross Amount | | Accumulated
Impairment
Losses | | | | Gross
Amount | | Accumulated
Impairment
Losses | | | | |
| | | | | Net | | | | Net | | | | Net | | Net |
| Balance at December 31, 2016 | | $ | 107.4 |
| | $ | (43.6 | ) | | $ | 63.8 |
| | $ | 6.2 |
| | — |
| | 6.2 |
| | $ | 0.4 |
| | — |
| | 0.4 |
| | $ | 70.4 |
|
| Goodwill acquired in the Coldenhove Acquisition | | 10.0 |
| | — |
| | 10.0 |
| | — |
| | — |
| | — |
| | — |
| | — |
| | — |
| | 10.0 |
|
| Foreign currency translation | | 10.9 |
| | (6.0 | ) | | 4.9 |
| | — |
| | — |
| | — |
| | — |
| | — |
| | — |
| | 4.9 |
|
| Balance at December 31, 2017 | | 128.3 |
| | (49.6 | ) | | 78.7 |
| | 6.2 |
| | — |
| | 6.2 |
| | 0.4 |
| | — |
| | 0.4 |
| | 85.3 |
|
| Adjustment of goodwill acquired in the Coldenhove Acquisition (1) | | 1.1 |
| | — |
| | 1.1 |
| | — |
| | — |
| | — |
| | — |
| | — |
| | — |
| | 1.1 |
|
| Impairment related to the Brattleboro mill and associated office and research facilities (2) | | — |
| | — |
| | — |
| | — |
| | — |
| | — |
| | — |
| | (0.1 | ) | | (0.1 | ) | | (0.1 | ) |
| Foreign currency translation | | (4.5 | ) | | 2.2 |
| | (2.3 | ) | | — |
| | — |
| | — |
| | — |
| | — |
| | — |
| | (2.3 | ) |
| Balance at December 31, 2018 | | $ | 124.9 |
| | $ | (47.4 | ) | | $ | 77.5 |
| | $ | 6.2 |
| | — |
| | 6.2 |
| | $ | 0.4 |
| | (0.1 | ) | | 0.3 |
| | $ | 84.0 |
|
___________________________
| |
(1) | As a result of finalizing the acquisition accounting for Coldenhove in the 2018, an adjustment of $1.1 million, net of tax, was recorded as a reduction to inventory and fixed assets and increase to goodwill. |
| |
(2) | In conjunction with the sale of the Brattleboro mill, a goodwill impairment loss of $0.1 million was recognized in 2018.
|
(a)In January 2019, the Company realigned the remaining products manufactured in the Other business segment to be managed as part of the Technical Products business segment. See Note 13, "Business Segment and Geographic Information."
NEENAH, INC. AND SUBSIDIARIES
NOTES TO CONSOLIDATED FINANCIAL STATEMENTS (Continued)
(Dollars in millions, except as noted)
Other Intangible Assets
As of December 31, 2018,2020, the Company had net identifiable intangible assets of $70.7$62.6 million. All such intangible assets were acquired in the acquisitions of Neenah Germany, Fox River, FiberMark, Neenah Coldenhove and the Crane technical materials business, and the acquisition of the Wausau and Southworth brands. The following table details amounts related to those assets.
| | | | | | | | | | | | | | | | | | | | | | | | | | |
| | | 12/31/2020 | | 12/31/2019 |
| | | Gross
Amount | | Accumulated
Amortization | | Gross
Amount | | Accumulated
Amortization |
| Amortizable intangible assets | | | | | | | | |
| Customer based intangibles | | $ | 39.6 | | | $ | (24.0) | | | $ | 38.2 | | | $ | (20.4) | |
| Trade names and trademarks | | 5.2 | | | (3.1) | | | 5.1 | | | (2.7) | |
| Acquired technology | | 17.3 | | | (9.3) | | | 16.9 | | | (8.0) | |
| Total amortizable intangible assets | | 62.1 | | | (36.4) | | | 60.2 | | | (31.1) | |
| Indefinite life trade names, net of impairment losses of $1.3 million as of 12/31/20 | | 36.9 | | | — | | | 37.6 | | | — | |
| Total | | $ | 99.0 | | | $ | (36.4) | | | $ | 97.8 | | | $ | (31.1) | |
|
| | | | | | | | | | | | | | | | |
| | | 12/31/2018 | | 12/31/2017 |
| | | Gross
Amount | | Accumulated
Amortization | | Gross
Amount | | Accumulated
Amortization |
| Amortizable intangible assets | | |
| | |
| | |
| | |
|
| Customer based intangibles | | $ | 38.3 |
| | $ | (18.2 | ) | | $ | 39.2 |
| | $ | (14.7 | ) |
| Trade names and trademarks | | 5.1 |
| | (2.5 | ) | | 5.2 |
| | (2.3 | ) |
| Acquired technology | | 16.9 |
| | (6.7 | ) | | 17.2 |
| | (3.9 | ) |
| Total amortizable intangible assets | | 60.3 |
| | (27.4 | ) | | 61.6 |
| | (20.9 | ) |
| Trade names | | 37.8 |
| | — |
| | 38.0 |
| | — |
|
| Total | | $ | 98.1 |
| | $ | (27.4 | ) | | $ | 99.6 |
| | $ | (20.9 | ) |
The following table presents intangible assets acquired in conjunction with the Coldenhove acquisition as of December 31, 2017:
|
| | | | | | |
| | | Intangibles | | Estimated Useful
Lives
(Years) |
| Intangible assets — definite lived | | |
| | |
| Trade names and trademarks | | $ | 0.5 |
| | 10 |
| Customer based intangibles | | 2.9 |
| | 15 |
| Acquired technology | | 1.3 |
| | 4 |
| Total | | 4.7 |
| | |
| Non-amortizable trade names | | 1.2 |
| | |
| Total intangible assets | | $ | 5.9 |
| | |
As of December 31, 2018, $45.8 million, $24.02020, $40.5 million and $0.9$22.1 million of such intangible assets are reported within the Technical Products and Fine Paper and Packaging, and Other segments, respectively. See Note 15,13, "Business Segment and Geographic Information." Aggregate amortization expense of acquired intangible assets for the years ended December 31, 2020, 2019 and 2018 2017 and 2016 was $4.3 million, $3.7 million, $3.9 million and $3.9$4.3 million, respectively and was reported in Cost of products soldselling, general and administrative expenses on the consolidated statement of operations. Estimated amortization expense for the years ended December 31, 2019, 2020, 2021, 2022, 2023, 2024 and 20232025 is $3.8 million, $3.6 million, $3.4$2.9 million, $2.7$2.8 million, $2.8 million and $2.5$2.8 million, respectively.
NEENAH, INC. AND SUBSIDIARIES
NOTES TO CONSOLIDATED FINANCIAL STATEMENTS (Continued)
(Dollars in millions, except as noted)
Note 6.5. Income Taxes
The Company accounts for income taxes in accordance with ASC Topic 740, Income Taxes. Income tax expense (benefit) represented (15.5) percent, 16.7 percent and 9.5 percent 12.4 percent and 28.7 percent of income (loss) from continuing operations before income taxes for the years ended December 31, 2020, 2019 and 2018, 2017respectively. The Company's effective income tax rate can be affected by many factors, including but not limited to, changes in the mix of earnings in taxing jurisdictions with differing statutory rates, the impact of research and 2016, respectively.development tax credits ("R&D Credits"), changes in tax laws and changes in corporate structure as a result of business acquisitions and dispositions. The 2020 effective income tax rate was significantly impacted by the $57.8 million of restructuring and impairment losses and the 2018 effective income tax rate was also reduced by the effects of the $31.1 million impairment loss of the Brattleboro mill and associated research and office facilities (see Note 12). In these two years, similar sized reconciling items had a significantly larger percentage impact on reduced pre-tax book income.
On December 22, 2017, the U.S. government enacted comprehensive tax legislation in the Tax Cuts and Jobs Act of 2017 (the "Tax Act""TCJA"). The Tax ActTCJA significantly revised the U.S. corporate income tax by, among other things, reducing the statutory corporate tax rate from 35% to 21% effective January 1, 2018, eliminating certain deductions, imposing a mandatory one-time tax on accumulated earnings of foreign subsidiaries, introducing new tax regimes and changing how foreign earnings are subject to U.S. tax. The Tax ActTCJA also enhanced and extended through 2026 the option to claim accelerated depreciation deductions on qualified property. In conjunction with the tax law changes, the Securities and Exchange Commission ("SEC") in Staff Accounting Bulletin No. 118 ("SAB 118") provided for a measurement period of one year from the enactment date to finalize the accounting for effects of the Tax Act. As of December 31, 2017, the Company provisionally recorded an income tax benefit of $6.5 million related to the Tax Act. This amount was comprised of a $10.3 million tax benefit from the remeasurement of federal net deferred income tax liabilities resulting from the reduction in the U.S. statutory corporate tax rate to 21% from 35%, less $3.8 million of tax expense from the mandatory one-time tax on the previously untaxed accumulated earnings and profits ("E&P") of its foreign subsidiaries. Also, as of December 31, 2017, the Company early adopted ASU 2018-02, Reclassification of Certain Tax Effects From Accumulated Other Comprehensive Income (Topic 740) and reclassified $10.9 million from AOCI to retained earnings to address the stranded tax effects resulting from the effect of lower tax rates in the Tax Act on items within AOCI.
In June 2017, as part of the annual strategic plan review, the Company reassessed its intentions regarding the indefinite reinvestment of undistributed earnings of the German operations and asserted its intent to indefinitely reinvest them. As a result, effective in the second quarter of 2017, the Company did not provide deferred income taxes on 2017 unremitted earnings of the German operations. In addition, in that quarter the deferred income tax liability of $4.1 million which was recorded in 2016 on unremitted German earnings was eliminated with a reduction to 2017 income tax expense. As noted above, the Tax Act included a mandatory one-time tax on previously untaxed accumulated E&P of its foreign subsidiaries, and as a result, previously unremitted E&P from all foreign countries were subject to this U.S. tax and a liability of $3.8 million was recorded thereon as of December 31, 2017.
During 2018, the Company completed its analysis of the Tax ActTCJA and interpreted additional guidance issued by the U.S. Treasury Department. In addition, legislative actions by the various U.S. states related to application of the Tax ActTCJA provisions on state tax returns waswere considered. The Company recorded additional adjustments throughout 2018 to reflect a measurement-period tax benefit of $0.9 million related to the effects of the statutory corporate tax rate reduction and a measurement-period tax expense of $0.8 million from U.S. federal and state taxes on accumulated earnings and profits ("E&P&P") of its foreign subsidiaries. As of December 31, 2018, a cumulative net tax benefit of $6.6 million related to the Tax ActTCJA was reflected, comprised of a $11.2 million tax benefit from the remeasurement of federal net deferred income tax liabilities resulting from the reduction in the U.S. statutory corporate tax rate, less $4.6 million of tax expense from the mandatory one-time U.S. federal tax on certain previously untaxed accumulated E&P of its foreign subsidiaries and related state income tax impacts. As of December 31, 2018, the measurement period for purposes of SAB 118 has ended and the Company has completed the accounting for all of the impacts of the Tax Act.TCJA.
AsThe TCJA also required a U.S. shareholder of December 31, 2017,a foreign corporation to include in taxable income its global intangible low-taxed income ("GILTI"). In general, GILTI is described as the Company was not yet ableexcess of a U.S. shareholder’s total net foreign income over a deemed return on tangible assets, which is defined as 10% of its foreign qualified business asset investment reduced by certain interest expense amounts. The TCJA allows a deduction of 50% of GILTI, but this deduction is limited by the taxpayer’s taxable income. An entity also is allowed a deemed paid foreign tax credit of up to reasonably estimate80% of foreign taxes attributable to the effectsunderlying foreign corporation. Unused foreign tax credits associated with GILTI cannot be carried forward or back or used against other foreign source income. A U.S. shareholder would increase its tax basis in the foreign corporation for the Global Intangible Low-Taxed Income ("GILTI") provisions of the Tax Act, therefore no provisional effects were recorded. Also, at that time, the Company had not made a policy decision regarding whether to record deferred income taxes on GILTI or use the period cost method. During the three months ended March 31, 2018, theinclusion. The Company elected an accounting policy to record GILTI tax expense as a period cost, if and when incurred. Also, beginning in that quarter, the Company was able to reasonably estimate the annual effects of GILTI and ultimately recordedincurred each year, in its annual effective tax rate for 2018 an annual impact of GILTI of $0.6 million of tax expense, plus $0.1 million of state taxation of foreign earnings.
During the three months ended March 31, 2018, the Company completed an assessment of its existing accounting assertion with regard to the indefinite reinvestment of undistributed foreign earnings, considering the effects of the Tax Act and U.S. state and foreign tax legislation on future repatriations. After consideration of the effects of the mandatory one-time U.S. federal tax and GILTI provisions and its foreign investment strategy, the Company is no longer asserting indefinite
rate.
NEENAH, INC. AND SUBSIDIARIES
NOTES TO CONSOLIDATED FINANCIAL STATEMENTS (Continued)
(Dollars in millions, except as noted)
reinvestmentOn March 27, 2020, the U.S. government enacted the Coronavirus Aid, Relief and Economic Security Act ("CARES Act"). The CARES Act included various income and payroll tax provisions designed to stimulate the economy and provide relief to businesses. Among its benefits was the ability to enhance the value of its unrepatriated German E&P. Except for immaterial foreign exchange considerations,NOLs by allowing the carryback of NOLs to tax years in which the U.S. federal statutory income tax rate was 35%. During the three months ended December 31, 2020, the Company willrecorded an income tax benefit of $0.9 million and a corresponding tax receivable for $8.0 million for the tax refund to be ablereceived during 2021. The Company also elected the option to repatriate its foreign earnings without U.S. federal taxation duedelay payment of $4.4 million of 2020 payroll taxes until December 31, 2021 and 2022. Also, the Company utilized the payroll tax provisions of the Employee Retention Credit of the CARES Act to partially offset qualified wages and benefits of employees impacted by COVID-19 travel and other restrictions. Similar COVID-19 relief legislation was also enacted in Germany, the previously taxed income generated fromNetherlands and the mandatory one-time U.S. federalU.K. aimed at providing subsidies for employee retention and deferral of tax and GILTI provisions.payments.
The following table presents the principal reasons for the difference between the Company's effective income tax rate and the U.S. federal statutory income tax rate:
|
| | | | | | | | | | | | | | | | | | | | | |
| | | Year Ended December 31, |
| | | 2018 | | 2018 | | 2017 | | 2017 | | 2016 | | 2016 |
| U.S. federal statutory income tax rate | | 21.0 | % | | $ | 8.6 |
| | 35.0 | % | | $ | 32.1 |
| | 35.0 | % | | $ | 36.1 |
|
| U.S. state income taxes, net of federal income tax benefit | | (1.0 | )% | | (0.4 | ) | | 1.9 | % | | 1.7 |
| | 1.9 | % | | 2.0 |
|
| Foreign tax rate differences (a) | | 6.8 | % | | 2.8 |
| | (3.4 | )% | | (3.1 | ) | | (2.7 | )% | | (2.8 | ) |
| Tax on foreign dividends (b) | | 3.6 | % | | 1.5 |
| | (0.3 | )% | | (0.3 | ) | | 4.5 | % | | 4.6 |
|
| Foreign financing structure (c) | | (5.1 | )% | | (2.1 | ) | | (2.2 | )% | | (2.0 | ) | | (1.6 | )% | | (1.7 | ) |
| Change in statutory tax rates (d) | | (3.9 | )% | | (1.6 | ) | | (10.6 | )% | | (9.7 | ) | | — | % | | — |
|
| Research and development and other tax credits | | (10.5 | )% | | (4.3 | ) | | (3.3 | )% | | (3.0 | ) | | (2.8 | )% | | (2.9 | ) |
| Excess tax benefits from stock compensation | | (2.9 | )% | | (1.2 | ) | | (4.9 | )% | | (4.5 | ) | | (3.0 | )% | | (3.1 | ) |
| Uncertain income tax positions | | 2.0 | % | | 0.8 |
| | 0.8 | % | | 0.7 |
| | (0.4 | )% | | (0.4 | ) |
| Domestic production activities deduction | | — | % | | — |
| | (0.6 | )% | | (0.5 | ) | | (1.5 | )% | | (1.5 | ) |
| Other differences — net | | (0.5 | )% | | (0.2 | ) | | — | % | | — |
| | (0.7 | )% | | (0.7 | ) |
| Effective income tax rate | | 9.5 | % | | $ | 3.9 |
| | 12.4 | % | | $ | 11.4 |
| | 28.7 | % | | $ | 29.6 |
|
| | | | | | | | | | | | | | | | | | | | | | | | | | | | | | | | | | | | | | |
| | | Year Ended December 31, |
| | | 2020 | | 2020 | | 2019 | | 2019 | | 2018 | | 2018 |
| U.S. federal statutory income tax rate | | (21.0) | % | | $ | (3.9) | | | 21.0 | % | | $ | 14.0 | | | 21.0 | % | | $ | 8.6 | |
| U.S. state income taxes, net of federal income tax benefit | | (10.2) | % | | (1.9) | | | 1.4 | % | | 0.9 | | | (1.0) | % | | (0.4) | |
| Foreign tax rate differences (a) | | 15.0 | % | | 2.8 | | | 3.6 | % | | 2.4 | | | 6.8 | % | | 2.8 | |
| Foreign financing structure (b) | | (11.2) | % | | (2.1) | | | (3.0) | % | | (2.0) | | | (5.1) | % | | (2.1) | |
| U.S. tax on foreign earnings (c) | | 4.3 | % | | 0.8 | | | 0.9 | % | | 0.6 | | | 3.6 | % | | 1.5 | |
| Research and development and other tax credits | | (15.5) | % | | (2.9) | | | (6.2) | % | | (4.1) | | | (10.5) | % | | (4.3) | |
| Benefit of CARES Act NOL carryback (d) | | (4.8) | % | | (0.9) | | | 0 | % | | 0 | | | 0 | % | | 0 | |
| Change in valuation allowances (e) | | 25.2 | % | | 4.7 | | | 0.2 | % | | 0.1 | | | 0 | % | | 0 | |
| Change in reserves for uncertain tax positions | | (3.7) | % | | (0.7) | | | (1.9) | % | | (1.3) | | | 2.0 | % | | 0.8 | |
| Change in statutory tax rates (f) | | 0 | % | | 0 | | | 0 | % | | 0 | | | (3.9) | % | | (1.6) | |
| Excess tax benefits from stock compensation | | 1.1 | % | | 0.2 | | | (0.2) | % | | (0.1) | | | (2.9) | % | | (1.2) | |
| Other differences, net | | 5.3 | % | | 1.0 | | | 0.9 | % | | 0.6 | | | (0.5) | % | | (0.2) | |
| Effective income tax rate | | (15.5) | % | | $ | (2.9) | | | 16.7 | % | | $ | 11.1 | | | 9.5 | % | | $ | 3.9 | |
_______________________
| |
(a) | (a)Represents the impact on the Company's effective tax rate due to changes in the mix of earnings among taxing jurisdictions with differing statutory rates. In 2018, the U.S. tax rate is now lower than the tax rate in Germany and the Netherlands. |
| |
(b) | For 2017, the amount reflects the net benefit of the indefinite reinvestment assertion of $4.1 million, less the $3.8 million mandatory one-time tax on the accumulated E&P of foreign subsidiaries from the Tax Act. For 2018, the amount reflects a measurement-period adjustment of $0.8 million to the mandatory one-time tax on the accumulated E&P of foreign subsidiaries and $0.7 million of federal GILTI and state taxation of foreign E&P for 2018. |
| |
(c) | Represents the impact on the Company's effective tax rate of the Company's financing strategies. |
| |
(d) | Represents the net benefit from remeasurement of the net deferred income tax liabilities from tax rate changes. For 2017, the amount reflects a tax benefit of $10.3 million from the Tax Act, less $0.6 million of tax expense from a state tax rate change in Germany. For 2018, the amount reflects an additional measurement-period tax benefit adjustment of $0.9 million from the Tax Act, plus $0.7 million of tax benefit from a federal tax rate change in the Netherlands. |
The Company's effective income tax rate can be affected by many factors, including but not limited to, changes in the mix of earnings in taxing jurisdictions with differing statutory rates,rates. In each year, the U.S. federal tax rate is lower than the tax rate in Germany and the Netherlands.
(b)Represents the impact on the Company's effective tax rate of researchthe Company's financing strategies.
(c)For 2018, the amount includes an adjustment of $0.8 million due to the mandatory one-time tax on the accumulated E&P of foreign subsidiaries and developmentin all years includes federal GILTI impacts and state taxation of foreign E&P.
(d)Represents the net benefit of the CARES Act provision to allow for the carryback of the NOL generated in 2020 to the 2015 tax credits ("year. The net tax benefit of $0.9 million included a $5.0 million benefit from the tax rate differential and other factors, offset by a $3.0 million impact from provisions of GILTI and a $1.1 million increase in the reserve for uncertain income tax positions for restored R&D Credits"), changes in tax laws, changes in corporate structureCredits.
(e)For 2020, as a result of business acquisitionsthe impacts of COVID-19 and dispositions,other factors, we evaluated our ability to utilize our deferred tax assets, including research and development and other tax credits and NOLs, before they expire. We recorded a $4.6 million increase to the valuation allowance against our state tax credits and NOLs, the majority of which related to adjustments to the beginning of year valuation allowance for changes in judgment about the valuationrealizability of these deferred income tax assets and liabilities and the results of audit examinations of previously filed tax returns. In addition to the impact of the reduction in the U.S. federal statutory tax rate from 35% to 21%, the 2018 effective income tax rate was significantly reduced by the effects of the $31.1 million impairment loss of the Brattleboro mill and associated research and office facilities (see Note 14), as similar sized reconciling items had a larger percentage impact on lower pre-tax book income.
future years.
NEENAH, INC. AND SUBSIDIARIES
NOTES TO CONSOLIDATED FINANCIAL STATEMENTS (Continued)
(Dollars in millions, except as noted)
(f)Represents the net benefit from remeasurement of the net deferred income tax liabilities from tax rate changes. For 2018, the amount reflects a tax benefit adjustment of $0.9 million from the TCJA, plus $0.7 million of tax benefit from a federal tax rate change in the Netherlands.
The following table presents the U.S. and foreign components of income from continuing operations before income taxes: | | | | | | | | | | | | | | | | | | | | |
| | | Year Ended December 31, |
| | | 2020 | | 2019 | | 2018 |
| Income (loss) from continuing operations before income taxes: | | | | | | |
| U.S. | | $ | (55.6) | | | $ | 30.1 | | | $ | (1.7) | |
| Foreign | | 36.9 | | | 36.4 | | | 42.8 | |
| Total | | $ | (18.7) | | | $ | 66.5 | | | $ | 41.1 | |
|
| | | | | | | | | | | | |
| | | Year Ended December 31, |
| | | 2018 | | 2017 | | 2016 |
| Income (loss) from continuing operations before income taxes: | | |
| | |
| | |
|
| U.S. | | $ | (1.7 | ) | | $ | 53.6 |
| | $ | 68.3 |
|
| Foreign | | 42.8 |
| | 38.1 |
| | 34.7 |
|
| Total | | $ | 41.1 |
| | $ | 91.7 |
| | $ | 103.0 |
|
The following table presents the components of the provision (benefit) for income taxes:
| | | | | | | | | | | | | | | | | | | | |
| | | Year Ended December 31, |
| | | 2020 | | 2019 | | 2018 |
| Provision (benefit) for income taxes: | | | | | | |
| Current: | | | | | | |
| Federal | | $ | (8.1) | | | $ | 0.3 | | | $ | (3.0) | |
| State | | 0.3 | | | (0.2) | | | 0.1 | |
| Foreign | | 9.8 | | | 7.6 | | | 8.7 | |
| Total current income tax provision | | 2.0 | | | 7.7 | | | 5.8 | |
| Deferred: | | | | | | |
| Federal | | (6.5) | | | 3.0 | | | (0.6) | |
| State | | 2.5 | | | 0.8 | | | (0.2) | |
| Foreign | | (0.9) | | | (0.4) | | | (1.1) | |
| Total deferred income tax provision | | (4.9) | | | 3.4 | | | (1.9) | |
| Total provision (benefit) for income taxes | | $ | (2.9) | | | $ | 11.1 | | | $ | 3.9 | |
|
| | | | | | | | | | | | |
| | | Year Ended December 31, |
| | | 2018 | | 2017 | | 2016 |
| Provision (benefit) for income taxes: | | |
| | |
| | |
|
| Current: | | |
| | |
| | |
|
| Federal | | $ | (3.0 | ) | | $ | 4.7 |
| | $ | 7.1 |
|
| State | | 0.1 |
| | 0.5 |
| | (0.5 | ) |
| Foreign | | 8.7 |
| | 6.4 |
| | 5.9 |
|
| Total current income tax provision | | 5.8 |
| | 11.6 |
| | 12.5 |
|
| Deferred: | | |
| | |
| | |
|
| Federal | | (0.6 | ) | | (1.8 | ) | | 14.8 |
|
| State | | (0.2 | ) | | (0.1 | ) | | 1.8 |
|
| Foreign | | (1.1 | ) | | 1.7 |
| | 0.5 |
|
| Total deferred income tax provision | | (1.9 | ) | | (0.2 | ) | | 17.1 |
|
| Total provision for income taxes | | $ | 3.9 |
| | $ | 11.4 |
| | $ | 29.6 |
|
The current federal and state tax provisions were reduced in 2018 as a result of incremental pension contributions which could be applied to the 2017 tax year at the 35% federal rate and from refund of half of the Alternative Minimum Tax credits. The 2018 federal and state deferred income tax provision was reduced by the effects of the book impairment loss of the Brattleboro mill in excess of the write-off of its tax basis. In 2017, the federal deferred income tax provision was reduced by a net $8.1 million as a result of the Tax Act and the German tax rate increase. This amount included $10.3 million of tax rate reduction from the Tax Act, less $0.6 million from the German tax rate increase, less $1.6 million of impact of the mandatory one-time tax on the accumulated earnings of foreign subsidiaries from the Tax Act. The 2017 federal current tax provision was increased by $2.2 million due to the mandatory one-time tax on foreign earnings.
The Company has elected to treat its Canadian operationssubsidiary as a branch for U.S. income tax purposes.purpose. Therefore, the amount of income (loss) before income taxesits pre-tax loss, arising primarily from Canadian operations areemployee benefit plan costs, is included in the Company's consolidateddetermining U.S. income tax returnsfederal and such amounts are subject to U.S.state income taxes.
NEENAH, INC. AND SUBSIDIARIES
NOTES TO CONSOLIDATED FINANCIAL STATEMENTS (Continued)
(Dollars in millions, except as noted)
The asset and liability approach is used to recognize deferred income tax assets and liabilities for the expected future tax consequences of temporary differences between the carrying amounts and the tax basis of assets and liabilities. The components of deferred income tax assets and liabilities, net of reserves for uncertain tax positions and valuation allowances, are as follows:
| | | | | | | | | | | | | | |
| | | December 31, |
| | | 2020 | | 2019 |
| Deferred income tax assets (liabilities) | | | | |
| Research and development tax credits | | $ | 27.5 | | | $ | 21.5 | |
| Employee benefits | | 15.6 | | | 15.9 | |
| Net operating losses and other tax credits | | 3.7 | | | 6.4 | |
| Lease liabilities | | 4.6 | | | 3.1 | |
| Accrued liabilities | | 1.4 | | | 2.1 | |
| Inventories (a) | | 0 | | | (0.6) | |
| Lease right-of-use assets | | (4.3) | | | (2.8) | |
| Intangibles | | (4.7) | | | (4.7) | |
| Property, plant and equipment (a) | | (26.7) | | | (28.0) | |
| Other | | 1.2 | | | 0.5 | |
| Net deferred income tax assets | | $ | 18.3 | | | $ | 13.4 | |
| | | | |
| Deferred income tax assets (liabilities) | | | | |
| Property, plant and equipment | | $ | (16.8) | | | $ | (16.7) | |
| Intangibles | | (3.0) | | | (3.0) | |
| Inventories | | (0.8) | | | (0.9) | |
| Lease right-of-use assets | | (0.9) | | | (0.7) | |
| Net operating losses | | 0.2 | | | 0.2 | |
| Lease liabilities | | 0.9 | | | 0.7 | |
| Employee benefits | | 9.5 | | | 7.5 | |
| Other | | (1.4) | | | 0 | |
| Net deferred income tax liabilities | | $ | (12.3) | | | $ | (12.9) | |
|
| | | | | | | | |
| | | December 31, |
| | | 2018 | | 2017 |
| Deferred income tax assets (liabilities) | | |
| | |
|
| Research and development tax credits | | $ | 20.0 |
| | $ | 6.6 |
|
| Employee benefits | | 16.5 |
| | 1.1 |
|
| Net operating losses and other tax credits | | 7.4 |
| | 4.2 |
|
| Accrued liabilities | | 2.3 |
| | 0.1 |
|
| Interest limitation | | 1.7 |
| | — |
|
| Inventories | | 1.0 |
| | 0.2 |
|
| Intangibles | | (4.2 | ) | | (0.5 | ) |
| Accelerated depreciation | | (28.8 | ) | | (1.6 | ) |
| Other | | 0.5 |
| | — |
|
| Net deferred income tax assets | | $ | 16.4 |
| | $ | 10.1 |
|
| | | | | |
| Deferred income tax assets (liabilities) | | |
| | |
|
| Accelerated depreciation | | $ | (16.6 | ) | | $ | (45.1 | ) |
| Intangibles | | (3.2 | ) | | (11.4 | ) |
| Inventories | | (1.0 | ) | | 1.8 |
|
| Accrued liabilities | | — |
| | 1.9 |
|
| Research and development tax credits | | — |
| | 8.6 |
|
| Net operating losses | | 0.2 |
| | 5.0 |
|
| Employee benefits | | 6.3 |
| | 22.9 |
|
| Other | | (0.1 | ) | | 1.3 |
|
| Net deferred income tax liabilities | | $ | (14.4 | ) | | $ | (15.0 | ) |
(a)As of December 31, 2020, included within property, plant and equipment and inventories was a deferred tax liability resulting from tax accounting method changes of $(3.5) million and $(0.6) million, respectively.
The presentation as of December 31, 2018 reflectedabove reflects net deferred income tax assets of U.S. federal and state jurisdictions and the net deferred income tax liabilities related to operations of Germany, the Netherlands and the U.K. As of December 31, 2017, the net deferred income tax assets relate to the state of Wisconsin and the net deferred income tax liabilities relate to U.S. federal and all other U.S. state jurisdictions, and operations of Germany, the Netherlands and the U.K.
On January 1, 2018, the Company implemented ASU 2016-16, Accounting for Income Taxes: Intra-Entity Asset Transfers of Assets Other Than Inventory. The standard requires the recognition of the income tax consequences of an intra-entity transfer of an asset other than inventory when the transfer occurs. For the Company, the tax effects related to a 2017 transfer of intellectual property were affected by this standard. The standard was applied on a modified retrospective basis through a cumulative-effect adjustment directly to retained earnings as of January 1, 2018. The Company recorded a $2.9 million deferred income tax asset in the U.S. and eliminated a $3.7 million prepaid tax asset in Germany, each with offsets to retained earnings.
As of December 31, 2018,2020, the Company had $58.4 million of undistributed earnings (net of foreign taxes) of foreign subsidiaries. There were $37.3 million undistributed earnings (net of foreign taxes) of foreign subsidiaries as of December 31, 2017.
NEENAH, INC. AND SUBSIDIARIES
NOTES TO CONSOLIDATED FINANCIAL STATEMENTS (Continued)
(Dollars in millions, except as noted)
As of December 31, 2018, the Company had $20.4$28.2 million of U.S. federal and $7.2$7.4 million of U.S. state R&D Credits which, if not used, will expire between 20292028 and 20382040 for the U.S. federal R&D Credits and between 20202021 and 20332035 for the state R&D Credits. As of December 31, 2018,2020, the Company had $47.6$71.8 million of state net operating losses (NOLs)NOLs which may be used to offset state taxable income. The NOLs are reflected in the consolidated financial statements as a deferred income tax asset of $3.0$4.4 million. If not used, substantially all of the NOLs will expire in various amounts between 20192021 and 2038.2040. The Company also had pre-acquisition and recognized built-in loss carryovers of $8.5$7.6 million, reflected as a deferred income tax asset of $1.8$1.6 million. In addition,
NEENAH, INC. AND SUBSIDIARIES
NOTES TO CONSOLIDATED FINANCIAL STATEMENTS (Continued)
(Dollars in millions, except as noted)
As of December 31, 2020 and 2019, the Company had $1.4$66.5 million and $48.8 million, respectively, of undistributed earnings (net of foreign taxes) of foreign subsidiaries. Except for immaterial foreign currency exchange considerations, the Company will be able to repatriate these foreign earnings without U.S. federal Alternative Minimum Tax Credit carryovers, whichtaxation due to previously taxed income under the Tax Act are fully refundable by no later than 2021GILTI provisions.
The Company or one of its subsidiaries files income tax returns in the U.S. federal jurisdiction, various U.S. state jurisdictions and foreign jurisdictions. The Company is no longer subject to U.S. federal examination for years before 2015,2017, to state and local examinations for years before 20142016 and to non-U.S. income tax examinations for years before 2012.2014. The following is a tabular reconciliation of the total amounts of uncertain tax positions as of and for the years ended December 31, 2018, 20172020, 2019 and 2016:2018:
| | | | | | | | | | | | | | | | | | | | |
| | For the Years Ended
December 31, |
| | | 2020 | | 2019 | | 2018 |
| Balance at January 1, | | $ | 7.8 | | | $ | 10.1 | | | $ | 10.0 | |
| Increases in prior period tax positions | | 1.1 | | | 0.7 | | | 0.1 | |
| Decreases in prior period tax positions | | (0.2) | | | (1.2) | | | 0 | |
| Increases in current period tax positions | | 0.6 | | | 0.6 | | | 0.8 | |
| Decreases due to lapse of statutes of limitations | | (1.3) | | | (1.5) | | | (0.6) | |
| Increases due to change in tax rates | | 0 | | | 0 | | | 0.1 | |
| Decreases due to settlements with tax authorities | | 0 | | | (0.9) | | | (0.2) | |
| Increases (decreases) from foreign exchange rate changes | | 0 | | | 0 | | | (0.1) | |
| Balance at December 31, | | $ | 8.0 | | | $ | 7.8 | | | $ | 10.1 | |
|
| | | | | | | | | | | | |
| | | For the Years Ended
December 31, |
| | | 2018 | | 2017 | | 2016 |
| Balance at January 1, | | $ | 10.0 |
| | $ | 10.3 |
| | $ | 12.9 |
|
| Increases in prior period tax positions | | 0.1 |
| | 0.4 |
| | — |
|
| Decreases in prior period tax positions | | — |
| | (1.0 | ) | | (2.6 | ) |
| Increases in current period tax positions | | 0.8 |
| | 0.7 |
| | 0.6 |
|
| Decreases due to lapse of statute of limitations | | (0.6 | ) | | (1.0 | ) | | (0.3 | ) |
| Increases due to change in tax rates | | 0.1 |
| | 0.4 |
| | — |
|
| Decreases due to settlements | | (0.2 | ) | | — |
| | — |
|
| Increases (decreases) from foreign exchange rate changes | | (0.1 | ) | | 0.2 |
| | (0.3 | ) |
| Balance at December 31, | | $ | 10.1 |
|
| $ | 10.0 |
|
| $ | 10.3 |
|
The $8.0 million of reserves for uncertain tax positions as of December 31, 2020 were reflected on the consolidated balance sheets as follows: $7.7 million netted against deferred income tax assets and $0.3 million in other noncurrent obligations. The $7.8 million of reserves for uncertain tax positions as of December 31, 2019 were reflected on the consolidated balance sheets as follows: $7.3 million netted against deferred income tax assets and $0.5 million in other noncurrent obligations. The $10.1 million of reserves for uncertain tax positions as of December 31, 2018 were reflected on the consolidated balance sheetsbalances as follows: $7.9 million netted against deferred income tax assets and $2.2 million in other noncurrent obligations. The $10.0 million of reserves for uncertain tax positions as of December 31, 2017 were reflected on the consolidated balance sheets as follows: $2.3 million netted against deferred income tax assets, $5.3 million netted against (added to) deferred income tax liabilities and $2.4 million in other noncurrent obligations. The $10.3 million of reserves for uncertain tax positions as of December 31, 2016 were reflected on the consolidated balances as follows: $7.6 million netted against deferred income tax assets, $1.2 million netted against (added to) deferred income tax liabilities and $1.5 million in other noncurrent obligations.
If recognized, $10.0$6.1 million of the benefit for uncertain tax positions at December 31, 20182020 would favorably affect the Company's effective tax rate in future periods. The Company files income tax returns and is subject to examination by various taxing jurisdictions. The Company records uncertain tax positions in accordance with ASC 740 on the basis of a two-step process in which (1) it is determined whether it is more likely than not that the tax positions will be sustained on the basis of the technical merits of the position, and (2) for those tax positions that meet the more-likely-than-not recognition threshold, the Company recognizes the largest amount of tax benefit that is more than 50 percent likely to be realized upon ultimate settlement with the related tax authority.
The Company does not expect that facts and circumstances such as the expiration of the statutestatutes of limitations or the settlement of audits in the next 12 months will result in liabilities for uncertain income tax positions that are materially different than the amounts that were accrued as of December 31, 2018.2020.
The Company recognizes accrued interest and penalties related to uncertain income tax positions in the Provision for income taxes on the consolidated statements of operations. As of December 31, 20182020 and 2017,2019, the Company had less than $0.1 million and $0.1 million, respectively, accrued for interest and penalties related to uncertain income tax positions.
As a result of the Tax Act,December 31, 2020 and 2019, the Company recorded $2.2had $5.3 million and $5.2 million of foreign tax credits, during 2018,all of which the Company believes will expire unutilized. Therefore, as of December 31, 2018,2020 and 2019, the Company recorded a full valuation allowance of an equal to the amount againstof this deferred income tax asset. As of December 31, 20182020 and 2017,2019, the Company also had a valuation allowance of $0.5$6.4 million and $0.4$0.7 million, respectively, against the gross value of its state tax credits and NOLs. In determining the need for
NEENAH, INC. AND SUBSIDIARIES
NOTES TO CONSOLIDATED FINANCIAL STATEMENTS (Continued)
(Dollars in millions, except as noted)
tax credits and NOLs. Including the federal benefit of state taxes, the net valuation allowance reflected on the consolidated balance sheets was $5.1 million and $0.5 million as of December 31, 2020 and 2019, respectively. In determining the need for a valuation allowance, the Company considers many factors, including specific taxing jurisdictions, sources of taxable income, income tax strategies and forecasted earnings for the entities in each jurisdiction. A valuation allowance is recognized if, based on the weight of available evidence, the Company concludes that it is more likely than not that some portion or all of the deferred income tax asset will not be realized.
Note 7.6. Debt
Long-term debt consisted of the following:
| | | | | | | | | | | | | | |
| | | December 31, |
| | | 2020 | | 2019 |
| Term Loan B Credit Facility (variable rates) due June 2027 | | $ | 199.0 | | | $ | 0 | |
| 2021 Senior Notes (5.25% fixed rate) due May 2021 | | 0 | | | 175.0 | |
| Global Revolving Credit Facility (variable rates) due December 2023 | | 0 | | | 21.6 | |
| Second German Loan Agreement (2.45% fixed rate) due in quarterly installments ending September 2022 | | 2.4 | | | 3.5 | |
| Third German Loan Agreement (1.45% fixed rate) due in quarterly installments ending September 2022 | | 2.6 | | | 3.7 | |
| Deferred financing costs | | (9.6) | | | (3.0) | |
| Total Debt | | 194.4 | | | 200.8 | |
| Less: Debt payable within one year | | 4.9 | | | 2.6 | |
| Long-term debt | | $ | 189.5 | | | $ | 198.2 | |
|
| | | | | | | | |
| | | December 31, |
| | | 2018 | | 2017 |
| 2021 Senior Notes (5.25% fixed rate) due May 2021 | | $ | 175.0 |
| | $ | 175.0 |
|
| Global Revolving Credit Facilities (variable rates) due December 2023 | | 57.9 |
| | 76.9 |
|
| Second German Loan Agreement (2.45% fixed rate) due in quarterly installments ending September 2022 | | 4.8 |
| | 6.4 |
|
| Third German Loan Agreement (1.45% fixed rate) due in quarterly installments ending March 2023 | | 4.9 |
| | — |
|
| Deferred financing costs | | (3.5 | ) | | (2.8 | ) |
| Total Debt | | 239.1 |
| | 255.5 |
|
| Less: Debt payable within one year | | 2.3 |
| | 1.4 |
|
| Long-term debt | | $ | 236.8 |
| | $ | 254.1 |
|
Unsecured 2021 Senior Notes
In May 2013, the Company completed an underwritten offering of eight-year senior unsecured notes (the "2021 Senior Notes") at a face amount of $175 million. The 2021 Senior Notes bearbore interest at a rate of 5.25%, payable in arrears on May 15 and November 15 of each year, commencing on November 15, 2013, and were scheduled to mature on May 15, 2021. On June 30, 2020, the Company initiated the calling of the 2021 Senior Notes for redemption in full and recorded a debt extinguishment charge of $1.9 million related to the write-off of the remaining deferred financing costs associated with the 2021 Senior Notes. The redemption and satisfaction of the 2021 Senior Notes was completed on July 16, 2020.
Term Loan B Credit Facility
On June 30, 2020, the Company entered into a Term Loan Credit Agreement (the “Term Loan Credit Agreement”) by and among the Company, as borrower, certain of its domestic subsidiaries, as guarantors (the “Guarantors”, and together with the Company, the “Term Loan Parties”), a syndicate of banks, financial institutions and other entities as lenders (the “TLB Lenders”), and JPMorgan Chase Bank, N.A., as administrative agent for the Term Loan B Lenders. The Term Loan Credit Agreement provides a seven-year Term Loan B credit facility (the "Term B Facility") in the initial principal amount of $200 million (the "Term Loan B".) The Term Loan B was executed in a single $200 million draw on the closing date. Proceeds from this offeringunder the Term B Facility were used to redeem in full the remaining $70 million outstanding principal amount of ten-year 7.375%2021 Senior Notes, repay borrowings under the Company’s senior unsecured notes, originally issued on November 30, 2004, to repay approximately $56 million in outstandingsecured revolving credit agreement borrowingsfacility, pay fees and expenses of the transaction and for general corporate purposes. The 2021 Senior Notes are fully and unconditionally guaranteed by substantially all ofUnder the Company's domestic subsidiaries (the "Guarantors"). The 2021 Senior Notes were sold in a private placement transaction, have not been registered under the Securities Act of 1933, as amended, and may not be offered or sold absent registration or an applicable exemption from registration requirements.
The 2021 Senior Notes rank equally in right of payment with all the Company's existing and future senior unsecured indebtedness. The guarantees of the 2021 Senior Notes are senior unsecured obligations of the Guarantors and rank equally in right of payment with all existing and future senior unsecured indebtedness of the Guarantors. The 2021 Senior Notes and the guarantees of the 2021 Senior Notes are effectively subordinated to the Company's and the Guarantors' existing and future secured indebtedness (to the extent of the value of the collateral) and are structurally subordinated to all indebtedness and other obligations of the Company's subsidiaries that do not guarantee the 2021 Senior Notes, including the trade creditors of such non-guarantor subsidiaries.
Terms, Covenants and Events of Default. The 2021 Senior Notes contain terms, covenants and events of default with which the Company must comply, which the Company believes are ordinary and standard for notes of this nature. Among other things, the 2021 Senior Notes contain covenants restricting the Company's ability to incur certain additional debt, make specified restricted payments, pay dividends, authorize or issue capital stock, enter into transactions with the Company's affiliates, consolidate or merge with or acquire another business, sell certain of the Company's assets or liquidate, dissolve or wind-up the Company. As of December 31, 2018, the Company was in compliance with all terms of the indenture forTerm Loan Credit Agreement, and subject to certain conditions and adjustments, the 2021 Senior Notes.
Company may from time to time solicit the Term Loan B Lenders or new lenders to provide incremental term loan financings under the Term B Facility up to $125 million in the aggregate (each an "Incremental Term Facility"). The
NEENAH, INC. AND SUBSIDIARIES
NOTES TO CONSOLIDATED FINANCIAL STATEMENTS (Continued)
(Dollars in millions, except as noted)
proceeds of an Incremental Term Facility may be used for general corporate purposes of the Company and its subsidiaries, including permitted acquisitions, investments and other uses not prohibited by the Term Loan Credit Agreement.
The obligations under the Term Loan Credit Agreement are jointly and severally guaranteed by the Guarantors and are secured by all or substantially all of the assets of the Term Loan Parties, including (i) a first- priority security interest in substantially all of the tangible and intangible non-current assets of the Term Loan Parties (collectively, the “TLB Priority Collateral”), and (ii) a second-priority security interest in substantially all of the current assets of the Term Loan Parties comprising priority collateral of the lenders under the Company’s secured revolving credit facility (together with the TLB Priority Collateral, the “Collateral”). Under the terms of the Term Loan Credit Agreement, borrowings under the Term B Facility will bear interest, as selected by the Company, at a per annum rate equal to either (a) the reserve-adjusted LIBOR rate for interest periods of one, two or three months, plus an applicable rate of 4.00% per annum, or (b) the Alternate Base Rate, plus an applicable rate of 2.00% per annum. “Alternate Base Rate” will be equal to the greatest of (1) the prime rate as quoted from time to time in The Wall Street Journal or published by the Federal Reserve Board, (2) the overnight bank funding rate established by the Federal Reserve Bank of New York, plus 50 basis points, and (3) one-month reserve-adjusted LIBOR plus 100 basis points. The Alternate Base Rate is subject to a “floor” of 2.0%, and the adjusted LIBOR rate is subject to a “floor” of 1.0%. As of December 31, 2020, the weighted-average interest rate on outstanding Term Loan borrowings was 5.0% per annum. The Term Loan B is repayable in equal quarterly installments commencing on September 30, 2020 in an aggregate annual amount equal to 1% of the original principal amount of the Term B Facility (subject to certain reductions in connection with debt prepayments and debt buybacks). The entire unpaid principal balance of the Term Loan B, together with all accrued and unpaid interest thereon, will be due and payable at maturity on June 30, 2027.
The Company is required to make mandatory prepayments of the Term Loan B, commencing with the fiscal year ending December 31, 2021, based on certain secured leverage ratios levels, among other requirements, as per below:
| | | | | | | | |
| Secured leverage ratio levels | | Mandatory prepayments |
| < 1.50 | | No prepayments required |
| 1.50 - 2.50 | | 25% of Excess Cash Flow |
| > 2.50 | | 50% of Excess Cash Flow |
“Secured Leverage Ratio” means the ratio, for the four most recent fiscal quarters, of the net secured indebtedness of the Company as of the last day of such period to EBITDA for such period. “Excess Cash Flow” means consolidated net income, plus or minus adjustments for specified items including, among others:(i) increases or decreases in working capital, (ii) certain capital expenditures, (iii) scheduled principal payments and voluntary prepayments of certain funded indebtedness, (iv) to the extent not deducted in calculating consolidated net income, interest expense and any premium, make-whole or penalty payments in respect of indebtedness, (v) taxes, to the extent not deducted in calculating consolidated net income, (vi) permitted acquisitions and certain other permitted investments, and (vii) up to $8.75 million per fiscal quarter of regularly scheduled quarterly cash dividends paid by the Company. The Term Loan Credit Agreement contains covenants and events of default which the Company believes are customary for agreements of this nature.
Under the most restrictive terms of the 2021 Senior Notes, the Company isTerm Loan Credit Agreement, we are permitted to pay cash dividends of up to $25 million in a calendar year, but not permitted toand repurchase shares of the Company'sour common stock.stock in an aggregate amount not to exceed $8,750,000 per fiscal quarter. However, as long as the nettotal leverage ratio (net debt/EBITDA) undercalculated in accordance with the 2021 Senior Notes is below 2.5x, the CompanyTerm Loan Credit Agreement does not exceed 2.5 to 1.0, we can pay dividends or repurchase shares without limitation. In the event the nettotal leverage ratio exceeds 2.5x, the Company2.5 to 1.0 but is less than or equal to 3.5 to 1.0, we may still pay dividends or repurchase shares of our common stock in an aggregate amount in excess of $25 million or repurchase shares$8,750,000 per fiscal quarter by utilizing certain "restricted payment baskets" as defineddescribed in the indenture forTerm Loan Credit Agreement. In addition, we would be permitted to pay cash dividends and repurchase shares of, our common stock in excess of $8,750,000 per fiscal quarter if the 2021 Senior Notes.aggregate amount of such payments, together with the amount of redemptions or prepayments of certain indebtedness, is less than or equal to the greater of (i) $65 million and (ii) 9% of our consolidated tangible assets. As of December 31, 2018,2020, since the Company'sour total leverage ratio was less than 2.5x,2.5 to 1.0, none of these covenants were restrictive to the Company'sour ability to pay dividends on or repurchase shares of the Company'sour common stock.
NEENAH, INC. AND SUBSIDIARIES
NOTES TO CONSOLIDATED FINANCIAL STATEMENTS (Continued)
(Dollars in millions, except as noted)
Amended and Restated Secured Global Revolving Credit Facility
In December 2018, the Company amended and restated its existing credit facility by entering into the Fourth Amended and Restated Credit Agreement (the "Fourth Amended Credit Agreement") by and among the Company and certain of its domestic subsidiaries as the(the "Domestic Borrowers"), Neenah Services GmbH & Co. KG and certain of its German subsidiaries as the(the "German Borrowers"), certain other subsidiaries as the "German Guarantors", the financial institutions signatory to the Fourth Amended Credit Agreement as lenders (the "Lenders"), and JPMorgan Chase Bank, N.A., as agent for the Lenders (the "Administrative Agent").
The Fourth Amended Credit Agreement, among other things: (1) increased the maximum principal amount of the existing credit facility for the Domestic Borrowers to $150 million (the "U.S. Revolving Credit Facility"); (2) maintains the secured, multicurrency, revolving credit facility for the German Borrowers in the maximum principal amount of $75 million (the "German Revolving Credit Facility," and together with the U.S. Revolving Credit Facility, the "Global Revolving Credit Facilities"Facility"); (3) caused the Company and the other Domestic Borrowers to guarantee, among other things, the obligations of the German Borrowers arising under the German Revolving Credit Facility; (4) provides for the Global Revolving Credit FacilitiesFacility to mature on December 10, 2023; and (5) modifies the accordion feature permitting one or more increases in the Global Revolving Credit FacilitiesFacility in an aggregate principal amount not exceeding $125 million, such that the aggregate commitments under the Global Revolving Credit FacilitiesFacility do not exceed $350 million. In addition, the Domestic Borrowers may request letters of credit under the U.S. Revolving Credit Facility in an aggregate face amount not to exceed $20 million outstanding at any time, and the German Borrowers may request letters of credit under the German Revolving Credit Facility in an aggregate face amount not to exceed $5 million outstanding at any time.
On June 30, 2020, the Company amended the Fourth Amended Credit Agreement by entering into a Third Amendment (the "Third Amendment") to among other things, (a) remove the applicable components of the TLB Priority Collateral from the borrowing base calculation under the U.S. Revolving Credit Facility, (b) permit the pledging of the Collateral under the Term B Facility and subordinate liens of the Fourth Amended and Restated Credit Agreement lenders on TLB Priority Collateral to the first position liens on TLB Priority Collateral under the Term B Facility, (c) reduce the U.S. Revolving Credit Facility amount from $150 million to $125 million, (d) reduce the German Revolving Credit Facility amount from $75 million to $50 million, and (e) adjust certain reporting and financial covenant activation and deactivation thresholds.
Proceeds of borrowings under the Global Revolving Credit FacilitiesFacility may be used to finance working capital needs, permitted acquisitions, permitted investments (including certain inter-company loans), certain dividends, distributions and other restricted payments, and for other general corporate purposes.
The consolidated statements of cash flows present borrowings and repayments under the Global Revolving Credit FacilitiesFacility and the predecessor revolving bank credit facility using a gross approach. This approach presents not only discrete borrowings for transactions such as a business acquisition, but also reflects all borrowings and repayments that occur as part of daily management of cash receipts and disbursements. For the yearyears ended December 31, 2020, 2019, and 2018 all of the borrowings related to the daily cash management. For the year ended December 31, 2017, $31 million was borrowed in conjunction with the Coldenhove Acquisition and the remaining $293 million included borrowings for daily cash management. For the year ended December 31, 2016, all of the borrowings related to daily cash management.
The right of the Domestic Borrowers to borrow and obtain letters of credit under the U.S. Revolving Credit Facility is subject to, among other things, the borrowing base of the Domestic Borrowers on a consolidated basis (the "Domestic Borrowing Base"). The right of the German Borrowers to borrow and obtain letters of credit under the German Revolving Credit Facility is similarly subject to a borrowing base requirement (the "German Borrowing Base"). The German Borrowing Base is initially determined on a combined basis for all German Borrowers. Under certain circumstances (including the occurrence of an event of default resulting from an act or omission of any German Borrower or German Guarantor), the Administrative Agent may require the German Borrowing Base to be determined separately for each of the German Borrowers. At its option the Company may, from time to time, allocate a portion of the Domestic Borrowing Base to the German Borrowing Base (resulting in a corresponding reduction of the Domestic Borrowing Base); however, the
NEENAH, INC. AND SUBSIDIARIES
NOTES TO CONSOLIDATED FINANCIAL STATEMENTS (Continued)
(Dollars in millions, except as noted)
principal amount of borrowings and the outstanding letter of credit exposure under the German Revolving Credit Facility may not at any time exceed the German Revolving Credit Facility commitment amount then in effect.
The guarantees of the German Guarantors are limited solely to the German Revolving Credit Facility obligations. Under the terms of the Fourth Amended Credit Agreement and related loan documentation, neither the German Borrowers nor the
NEENAH, INC. AND SUBSIDIARIES
NOTES TO CONSOLIDATED FINANCIAL STATEMENTS (Continued)
(Dollars in millions, except as noted)
German Guarantors (collectively, the "German Loan Parties") will be liable for any obligations relating to the U.S. Revolving Credit Facility. The Global Revolving Credit Facilities areFacility is secured by liens on all or substantially all of the assets of the Domestic Borrowers. The German Revolving Credit Facility is secured by liens on all or substantially all of the assets of the German Borrowers and certain assets of the German Guarantors. Any liens granted by the German Loan Parties secure only the German Revolving Credit Facility obligations.
Terms, Covenants and Events of Default. In general, borrowings under the Global Revolving Credit FacilitiesFacility will bear interest at LIBOR (which cannot be less than zero percent)0) plus an applicable margin ranging from 1.25% to 1.75%, depending on the amount of availability under the Fourth Amended Credit Agreement. In addition, the Company may elect an Alternate Borrowing Ratealternate borrowing rate ("ABR") for borrowings under the Global Revolving Credit Facilities.Facility. ABR borrowings under the Global Revolving Credit FacilitiesFacility will bear interest at the highest interest rate shown in the following table:
| | | | | | | | | | | | | | |
| | | | |
| | | | Applicable Margin |
| | Applicable MarginU.S. Revolving
Credit Facility | | German Revolving
Credit Facility |
| | U.S. Revolving
Credit Facility
| | German Revolving
Credit Facility
|
| Prime rate | | 0.00%0%-0.25% | | Not applicable |
| Federal funds rate +0.50% | | 0.00%0%-0.25% | | Not applicable |
Monthly LIBOR (which cannot be less than zero percent)0) +1.00% | | 0.00%0%-0.25% | | Not applicable |
Overnight LIBOR (which cannot be less than zero percent)0) | | Not applicable | | 1.25%-1.75% |
The Company is also required to pay a monthly commitment fee on the unused amounts available under the Global Revolving Credit FacilitiesFacility at a per annum rate of 0.25%.
If specified excess availability (i.e., aggregate availability, plus any excess of the aggregate borrowing base over the aggregate commitments under the Global Revolving Credit FacilitiesFacility as then in effect, subject to certain limitations) under the Global Revolving Credit Facility is less than the greater of (i) $20 $15 million and (ii) 10% of the maximum aggregate commitments under the Global Revolving Credit FacilitiesFacility as then in effect, the Company is required to comply with a fixed charge coverage ratio (as defined in the Fourth Amended Credit Agreement) of not less than 1.1 to 1.0 for the preceding four-quarter period, tested as of the end of each quarter. Such compliance, once required, would no longer be necessary once (x) specified excess availability under the Global Revolving Credit FacilitiesFacility exceeds the greater of (i) 17.5% of the aggregate commitment for the Global Revolving Credit FacilitiesFacility and (ii) $35$25 million for 60 consecutive days and (y) no default or event of default has occurred and is continuing during such 60-day period. As of December 31, 2018,2020, specified excess availability under the Global Revolving Credit FacilitiesFacility exceeded the minimum required amount, and the Company is not required to comply with such fixed charge coverage ratio.
The Fourth Amended Credit Agreement contains affirmative, reporting and negative covenants, events of default and other terms which the Company believes are ordinary and standard for agreements of this nature, with which the Company and its subsidiaries must comply during the term of the agreement. Among other things, such covenants restrict the ability of the Company and its subsidiaries to incur certain debt, incur or create certain liens, make specified restricted payments, authorize or issue capital stock, enter into transactions with their affiliates, consolidate, merge with or acquire another business, sell certain of their assets, or dissolve or wind up.
In addition, if thethe specified excess availability under the Global Revolving Credit FacilitiesFacility is less than the greater of (i) $25$20 million and (ii) 12.5% of the maximum aggregate commitments under the Global Revolving Credit FacilitiesFacility as then in effect, the Company will be subject to increased reporting obligations and controls until such time as availability is more than the greater of (a) $35$25 million and (b) 17.5% of the maximum aggregate commitments under the Global Revolving Credit FacilitiesFacility as then in effect.
Under the most restrictive terms of the Fourth Amended and Restated Credit Agreement, we are permitted to pay cash dividends on, orand repurchase shares of, our common stock up to the amount availablewithout limitation, as long as our specified excess availability under the Fourth Amended and
Restated Credit Agreement exceeds the greater of (i) $20 million and (ii) 12.5% of our aggregate
NEENAH, INC. AND SUBSIDIARIES
NOTES TO CONSOLIDATED FINANCIAL STATEMENTS (Continued)
(Dollars in millions, except as noted)
Restated Credit Agreement, as long as the availabilitycommitments under the Fourth Amended and RestatedGlobal Revolving Credit Agreement exceeds $28 million.Facility (approximately $22 million as of December 31, 2020), on a pro forma basis after giving effect to such dividend or stock repurchase (as the case may be). If our specified excess availability, on a pro forma basis, is less than the availability is below $28 million,applicable threshold, we are restricted from payingsubject to certain restrictions on the amount of cash dividends or repurchasing shares.we are permitted to declare and the amount of share repurchases we are permitted to execute. As of December 31, 2018,2020, the Company's availability exceeded $28 million,the applicable threshold, so this restriction did not apply.
The Fourth Amended Credit Agreement also contains events of default customary for financings of this type, including failure to pay principal or interest, materially false representations or warranties, failure to observe covenants and certain other terms of the Fourth Amended Credit Agreement, cross-defaults to certain other indebtedness, bankruptcy, insolvency, various ERISA and foreign pension violations, the incurrenceoccurrence of material judgments and changes in control.
Availability under the Global Revolving Credit FacilitiesFacility varies over time depending on the value of the Company's inventory, receivables and (in the case of the German Revolving Credit Facility) various capital assets. As of December 31, 2018,2020, the Company had $57.9 million of0 borrowings and $0.6$0.3 million in letters of credit outstanding under the Global Revolving Credit FacilitiesFacility and $154.0$138.6 million of available credit (based on exchanges rates at December 31, 2018)2020). As of December 31, 20182020 and 2017,2019, the weighted-average interest rate on outstanding Revolver borrowings was 2.9 percent and 2.71.3 percent per annum, respectively.annum.
Other Debt
In January 2013, Neenah Germany entered into a project financing agreement for the construction of a melt blown machine (the "Second German Loan Agreement"). The agreementSecond German Loan Agreement provided €9.0 million of construction financing which is secured by the melt blown machine. The loan matures in September 2022 and principal is repaid in 32 equal quarterly installments beginning in December 2014.installments. The interest rate on amounts outstanding is 2.45% and is payable quarterly. At December 31, 2018, €4.22020, €2.0 million ($4.82.4 million, based on exchange rates at December 31, 2018)2020) was outstanding under the Second German Loan Agreement.
In May 2018, Neenah Germany entered into a project financing agreement for the construction of a regenerative thermal oxidizer ("RTO") (the "Third German Loan Agreement"). The purposes of the project were to increase the capacity of the existing saturators and ensure compliance with new European air emission standards. The agreementThird German Loan Agreement provided €5.0 million of financing and is secured by the asset. The loan matures in March 2023September 2022 and principal is repaid in 16 equal quarterly installments beginning in June 2019.installments. The interest rate on amounts outstanding is 1.45% and is payable quarterly. In the fourth quarter 2018, the Company received a subsidy from the German government of $0.9 million due to completion of the RTO project in the form of a principal reduction. At December 31, 2018, €4.32020, €2.1 million ($4.92.6 million, based on exchange rates at December 31, 2018)2020) was outstanding under the Third German Loan Agreement.
Principal Payments
The following table presents the Company's required debt payments:
| | | | | | | | | | | | | | | | | | | | | | | | | | | | | | | | | | | | | | | | | | | | |
| | 2021 | | 2022 | | 2023 | | 2024 | | 2025 | | Thereafter | | Total |
| Debt payments | | $ | 4.9 | | | $ | 4.1 | | | $ | 2.0 | | | $ | 2.0 | | | $ | 2.0 | | | $ | 189.0 | | | $ | 204.0 | |
|
| | | | | | | | | | | | | | | | | | | | | | | | | | | | |
| | | 2019 | | 2020 | | 2021 | | 2022 | | 2023 | | Thereafter | | Total |
| Debt payments | | $ | 2.3 |
| | $ | 2.4 |
| | $ | 177.4 |
| | $ | 2.0 |
| | $ | 58.5 |
| | $ | — |
| | $ | 242.6 |
|
NEENAH, INC. AND SUBSIDIARIES
NOTES TO CONSOLIDATED FINANCIAL STATEMENTS (Continued)
(Dollars in millions, except as noted)
Note 8.7. Pension and Other Postretirement Benefits
Pension Plans
Substantially all active employees of the Company's U.S. operations participate in defined benefit pension plans and/or defined contribution retirement plans. The Company also has defined benefit plans and/or alternative retirement plans for substantially all its employees in Germany, the U.K, and the Netherlands. In addition, the Company maintains a SERP which is a non-qualified defined benefit plan. The Company provides benefits under the SERP to the extent necessary to fulfill the intent of its defined benefit retirement plans without regard to the limitations set by the Internal Revenue Code on qualified defined benefit plans.
NEENAH, INC. AND SUBSIDIARIES
NOTES TO CONSOLIDATED FINANCIAL STATEMENTS (Continued)
(Dollars in millions, except as noted)
The Company's policy is to recognize settlement losses for deferred vested pension benefit payments regardless of whether the amount exceeded the sum of expected service cost and interest costs of the pension plan for the respective calendar year. During 2020, 2019, and 2018, the Company recorded a $0.3 million, $0.1 million, and a $0.8 million settlement losslosses in the SERP, and afor total paymentpayments of $1.2 million, $0.5 million, $2.2 million. During 2017, the Company recorded a $0.6 million, settlement loss in the SERP and a total payment of $1.3 million. During 2016, the Company offered a lump sum payout option to all eligible U.S. participants with a deferred vested pension benefit (the participant had a vested pension benefit but was no longer an employee of the Company). For the year ended December 31, 2016, 265 individuals elected the option and the Company paid a total of $8.1 million in lump-sum payments and recognized a settlement loss of $0.8 million.respectively.
The Company's funding policy for its U.S. qualified defined benefit plans and its U.K. defined benefit plan is to contribute assets in compliance with regulatory requirements to fund the projected benefit obligation. There is no legal or governmental obligation to fund Neenah Germany's benefit plans and as such the Neenah Germany defined benefit plans are currently unfunded. As of December 31, 2018,2020, Neenah Germany had investments of $1.6$2.5 million that were restricted to the payment of certain post-retirement employee benefits. As of December 31, 2018, $0.52020, $0.7 million and $1.1$1.8 million of such investments are classified as Prepaid and other current assets and Other assets, respectively, on the consolidated balance sheet. The Neenah Coldenhove retirement benefit obligations are administered by a third-party insurance company, and funding for these benefits comes from premiums paid. Nonqualified plans providing pension benefits in excess of limitations imposed by taxing authorities are not funded; however, the Company holds $3.6$4.3 million of marketable securities that are designated for the payment of benefits under the SERP as of December 31, 2018,2020, classified as Other Assets on the consolidated balance sheet.
During the year ended December 31, 2020 and 2019, the Company's funded status of its pension benefits decreased $8.8 million and $2.8 million, respectively, from the prior year, due primarily to lower discount rates partly offset by higher than expected investment returns.
During October 2019, the Company reached an agreement with the union members of the Christelijke Nationale Vakbond ("CNV") and the Federatie Nederlandse Vakvereniging ("FNV") that affected employees in the Netherlands. In accordance with the new agreements, effective December 31, 2019, the Neenah Coldenhove defined benefit pension plan is closed to new entrants, and the defined benefit pension plan was replaced by a new defined contribution plan. All new employees will participate in the new defined contribution plan, and current employees will have their benefit frozen at current levels under the defined benefit plan and will begin participation in the new defined contribution plan. The Company recognized a curtailment gain of $1.6 million in the fourth quarter of 2019 due to these changes.
During November 2019, the Company ratified a new collective bargaining agreement with the USW that affected hourly employees at the Appleton Mill. In accordance with the new agreement, effective February 2020, the current defined benefit pension plan at this location will be closed to new entrants, and the defined benefit pension plan will be replaced by a new defined contribution plan. All new hourly employees will participate in the new defined contribution plan, and certain hourly employees (30 of 115 employees at this location) with less than 25 years of service will have their benefit frozen at current levels under the defined benefit plan and will begin participation in the new defined contribution plan. Hourly employees with over 25 years of service will continue to participate in the respective defined benefit plan. There were no curtailment or amendment charges recognized due to this change.
During December 2018, the Company signed new collective bargaining agreements with the USW that affected hourly employees at the Munising Mill, Whiting Mill, Neenah Mill, and Neenah Finishing Center. In accordance with the new agreements, effective March 2019, the current defined benefit pension plans at these locations will be closed to new entrants, and the defined benefit pension plans will be replaced by a new defined contribution plan. All new hourly employees will participate in the new defined contribution plan, and certain hourly employees (375 of 690 employees at these locations) with less than 25 years of service will have their benefit frozen at current levels under the defined benefit plan and will begin participation in the new defined contribution plan. Hourly employees with over 25 years of service and
NEENAH, INC. AND SUBSIDIARIES
NOTES TO CONSOLIDATED FINANCIAL STATEMENTS (Continued)
(Dollars in millions, except as noted)
certain other hourly employees will continue to participate in their respective defined benefit plans. There were no curtailment or amendment charges recognized due to these changes.
The Company uses the fair value of pension plan assets to determine pension expense, rather than averaging gains and losses over a period of years. Investment gains or losses represent the difference between the expected return calculated using the fair value of the assets and the actual return based on the fair value of assets. The Company's pension obligations are measured annually as of December 31.
Multi-Employer Plan
Prior to July 1, 2018,Historically, the hourly employees of the Lowville, New York facility were covered by a multi-employer defined benefit plan. The Company's expense under this plan was less than $0.1 million for the year ended December 31, 2018. The Company has contributed to the multi-employerPACE Industry Union-Management Pension Fund (the “PIUMPF"), a multiemployer pension plan under a collective bargaining agreement which provides retirement benefits for certain union employees.plan. The risksamount of participating in a multi-employer plan are different from single employer plans, as assets contributed are availableour annual contributions to provide benefits to all participants ofthe PIUMPF was negotiated with the plan (includingand the bargaining unit representing our employees of other employers) and unfunded obligations arecovered by the responsibility of all remaining employers.plan.
In JuneEffective July 1, 2018, the Company and representatives of the United Steelworkers Union (the "USW") of the Lowville mill reached an agreement to withdrawwithdrew from the Pace Industry Union-Management Pension Fund (“PIUMPF”), effective July 1, 2018. As a result, the CompanyPIUMPF and recorded an estimated withdrawal liability of $1.0 million, which assumesassumed payment of $0.1 million per year over 20 years, discounted at a credit adjusted risk-free rate of 5.7%. In additionFor the year ended December 31, 2018, the Company's contributions to the withdrawal liability, PIUMPF may also demand payment fromplan were less than $0.1 million and less than 5% of total plan contributions. On July 1, 2018, when the Company of a pro-rata share ofwithdrew, the fund's accumulated funding deficiency. Based on the latest information available from PIUMPF, the Company estimates the demand of accumulated funding deficiency to beplan was in the range of $1.0 to $1.25 million. The Company reserves the right to challenge any such demand and believes this demand is unenforceable. As such, the Company has not recorded a liability for this amount as of December
NEENAH, INC. AND SUBSIDIARIES
NOTES TO CONSOLIDATED FINANCIAL STATEMENTS (Continued)
(Dollars in millions, except as noted)
31, 2018. The most recent Pension Protection Act zone status available for the PIUMPF is as of year-end December 31, 2017. The zone status in the following table is based on information that the Company received from the plan and is certified by the plan's actuary.red zone. Among other factors, plans in the red zone are generally less than 65% funded, plans infunded.
In October 2019, the yellow zone are less than 80% funded, and plans in the green zone are at least 80% funded. InformationCompany received a billing from PIUMPF for the multi-employer pension plan inwithdrawal liability, which confirmed the $1.0 million liability, and the Company began making monthly payments. In addition to the withdrawal liability, PIUMPF also demanded immediate payment of $1.3 million for the Company's pro-rata share of the fund's accumulated funding deficiency, which the Company participated prior to July 1, 2018 is shown inchallenged. During the table below. The "FIP/RP Status Pending/Implemented" column indicatesfourth quarter of 2020, the Company reached a financial improvement plan ("FIP") or a rehabilitation plan ("RP") is either pending or has been implemented for the plan. For the year ended December 31, 2017, the Company's contributionssettlement with PIUMPF and paid $1.2 million related to the plan were less than 5% of total plan contributions. The Company withdrew from the plan effective July 1, 2018.accumulated funding deficiency.
|
| | | | | | | | | | | |
Pension Fund | EIN/Pension
Plan Number
| | Pension
Zone
Status
2017
| | FIP/RP Status
Pending or
Implemented
| | Contributions
2018
| | Surcharge
Imposed
| | Expiration Date of
Collective
Bargaining
Agreement
|
PACE Industry Union Management Pension Fund | 11-6166763 | | Red | | Implemented | | $0.1 million | | Yes | | 11/9/2021 |
Other Postretirement Benefit Plans
The Company maintains postretirement health care and life insurance benefit plans for certain active employees of the Company and former employees of the Canadian pulp operations. The Canadian plans are generally noncontributory for employees who were eligible to retire on or before December 31, 1992 and contributory for most employees who became eligible to retire on or after January 1, 1993. The Company does not provide a subsidized benefit to non-union U.S. employees hired after 2003 or collectively bargained employees after 2005. The Company's obligations for postretirement benefits other than pensions are measured annually as of December 31.
NEENAH, INC. AND SUBSIDIARIES
NOTES TO CONSOLIDATED FINANCIAL STATEMENTS (Continued)
(Dollars in millions, except as noted)
The following table reconciles the benefit obligations, plan assets, funded status and net liability information of the Company's pension and other postretirement benefit plans.
| | | | | Pension Benefits | | Postretirement
Benefits Other
than Pensions | | | Pension Benefits | | Postretirement
Benefits Other
than Pensions |
| | | Year Ended December 31, | | | Year Ended December 31, |
| | | 2018 | | 2017 | | 2018 | | 2017 | | | 2020 | | 2019 | | 2020 | | 2019 |
| Change in Benefit Obligation: | | |
| | |
| | |
| | |
| Change in Benefit Obligation: | | | | | | | | |
| Benefit obligation at beginning of year | | $ | 463.9 |
| | $ | 370.9 |
| | $ | 44.0 |
| | $ | 40.7 |
| Benefit obligation at beginning of year | | $ | 482.4 | | | $ | 430.7 | | | $ | 39.7 | | | $ | 42.4 | |
| Service cost | | 6.7 |
| | 5.5 |
| | 1.1 |
| | 1.2 |
| Service cost | | 4.6 | | | 5.0 | | | 1.0 | | | 1.2 | |
| Interest cost | | 15.8 |
| | 15.0 |
| | 1.4 |
| | 1.4 |
| Interest cost | | 14.1 | | | 16.2 | | | 1.0 | | | 1.5 | |
| Currency | | (4.6 | ) | | 6.8 |
| | (0.3 | ) | | 0.6 |
| Currency | | 9.7 | | | (1.2) | | | 0.3 | | | 0.1 | |
| Actuarial (gain) loss | | (29.3 | ) | | 33.3 |
| | 1.1 |
| | 3.9 |
| Actuarial (gain) loss | | 44.6 | | | 55.0 | | | 2.5 | | | (0.7) | |
| Benefit payments from plans | | (20.3 | ) | | (18.1 | ) | | (4.9 | ) | | (3.8 | ) | Benefit payments from plans | | (22.3) | | | (21.1) | | | (4.7) | | | (4.8) | |
| Plan curtailment (a) | | Plan curtailment (a) | | 0 | | | (2.8) | | | 0 | | | 0 | |
| Settlement payments | | (2.2 | ) | | (1.5 | ) | | — |
| | — |
| Settlement payments | | (1.6) | | | (0.5) | | | 0 | | | 0 | |
| Net transfer in (1) | | — |
| | 51.7 |
| | — |
| | — |
| |
| | Other | | 0.7 |
| | 0.3 |
| | — |
| | — |
| Other | | 0 | | | 1.1 | | | 0 | | | 0 | |
| Benefit obligation at end of year | | $ | 430.7 |
| | $ | 463.9 |
| | $ | 42.4 |
| | $ | 44.0 |
| Benefit obligation at end of year | | $ | 531.5 | | | $ | 482.4 | | | $ | 39.8 | | | $ | 39.7 | |
| Change in Plan Assets: | | |
| | |
| | |
| | |
| Change in Plan Assets: | | | | | | | | |
| Fair value of plan assets at beginning of year | | $ | 400.4 |
| | $ | 318.1 |
| | $ | — |
| | $ | — |
| Fair value of plan assets at beginning of year | | $ | 424.1 | | | $ | 375.2 | | | $ | 0 | | | $ | 0 | |
| Actual gain (loss) on plan assets | | (18.9 | ) | | 38.5 |
| | — |
| | — |
| Actual gain (loss) on plan assets | | 51.9 | | | 62.1 | | | 0 | | | 0 | |
| Employer contributions | | 18.2 |
| | 14.3 |
| | — |
| | — |
| Employer contributions | | 6.8 | | | 8.3 | | | 0 | | | 0 | |
| Currency | | (2.7 | ) | | 2.2 |
| | — |
| | — |
| Currency | | 5.5 | | | (0.5) | | | 0 | | | 0 | |
| Benefit payments | | (20.3 | ) | | (18.1 | ) | | — |
| | — |
| Benefit payments | | (22.3) | | | (21.1) | | | 0 | | | 0 | |
| Settlement payments | | (2.2 | ) | | (1.5 | ) | | — |
| | — |
| Settlement payments | | (1.6) | | | (0.5) | | | 0 | | | 0 | |
| Net transfers in (1) | | — |
| | 46.8 |
| | — |
| | — |
| |
| | Other | | 0.7 |
| | 0.1 |
| | — |
| | — |
| Other | | 0 | | | 0.6 | | | 0 | | | 0 | |
| Fair value of plan assets at end of year | | $ | 375.2 |
| | $ | 400.4 |
| | $ | — |
| | $ | — |
| Fair value of plan assets at end of year | | $ | 464.4 | | | $ | 424.1 | | | $ | 0 | | | $ | 0 | |
| Reconciliation of Funded Status | | |
| | |
| | |
| | |
| Reconciliation of Funded Status | | | | | | | | |
| Fair value of plan assets | | $ | 375.2 |
| | $ | 400.4 |
| | $ | — |
| | $ | — |
| Fair value of plan assets | | $ | 464.4 | | | $ | 424.1 | | | $ | 0 | | | $ | 0 | |
| Projected benefit obligation | | 430.7 |
| | 463.9 |
| | 42.4 |
| | 44.0 |
| Projected benefit obligation | | 531.5 | | | 482.4 | | | 39.8 | | | 39.7 | |
| Net liability recognized in statement of financial position | | $ | (55.5 | ) | | $ | (63.5 | ) | | $ | (42.4 | ) | | $ | (44.0 | ) | Net liability recognized in statement of financial position | | $ | (67.1) | | | $ | (58.3) | | | $ | (39.8) | | | $ | (39.7) | |
| Amounts recognized in statement of financial position consist of: | | |
| | |
| | |
| | |
| Amounts recognized in statement of financial position consist of: | | | | | | | | |
| Current liabilities | | $ | (1.7 | ) | | $ | (3.7 | ) | | $ | (5.2 | ) | | $ | (5.3 | ) | Current liabilities | | $ | (5.1) | | | $ | (1.2) | | | $ | (6.0) | | | $ | (5.6) | |
| Noncurrent liabilities | | (53.8 | ) | | (59.8 | ) | | (37.2 | ) | | (38.7 | ) | Noncurrent liabilities | | (62.0) | | | (57.1) | | | (33.8) | | | (34.1) | |
| Net amount recognized | | $ | (55.5 | ) | | $ | (63.5 | ) | | $ | (42.4 | ) | | $ | (44.0 | ) | Net amount recognized | | $ | (67.1) | | | $ | (58.3) | | | $ | (39.8) | | | $ | (39.7) | |
_______________________
| |
(1) | For the year ended December 31, 2017, the Company acquired $51.7 million of pension liabilities and $46.8 million of pension assets in conjunction with the Coldenhove Acquisition. |
(a)For the year ended December 31, 2019, the Company recognized a curtailment gain of $1.6 million related to the Neenah Coldenhove pension plan. See discussion earlier in this Note.
NEENAH, INC. AND SUBSIDIARIES
NOTES TO CONSOLIDATED FINANCIAL STATEMENTS (Continued)
(Dollars in millions, except as noted)
Amounts recognized in accumulated other comprehensive income (loss) consist of:
| | | | | | | | | | | | | | | | | | | | | | | | | | |
| | | Pension
Benefits | | Postretirement
Benefits Other
than Pensions |
| | | December 31, |
| | | 2020 | | 2019 | | 2020 | | 2019 |
| Accumulated actuarial loss | | $ | 126.8 | | | $ | 117.8 | | | $ | 8.8 | | | $ | 7.2 | |
| Prior service cost | | 0.6 | | | 0.9 | | | 0 | | | 0 | |
| Total recognized in AOCI | | $ | 127.4 | | | $ | 118.7 | | | $ | 8.8 | | | $ | 7.2 | |
|
| | | | | | | | | | | | | | | | |
| | | Pension
Benefits | | Postretirement
Benefits Other
than Pensions |
| | | December 31, |
| | | 2018 | | 2017 | | 2018 | | 2017 |
| Accumulated actuarial loss | | $ | 110.1 |
| | $ | 105.9 |
| | $ | 8.7 |
| | $ | 8.6 |
|
| Prior service cost | | 0.7 |
| | 0.8 |
| | — |
| | (0.2 | ) |
| Total recognized in AOCI | | $ | 110.8 |
| | $ | 106.7 |
| | $ | 8.7 |
| | $ | 8.4 |
|
Summary disaggregated information about the pension plans follows:
| | | | | | | | | | | | | | | | | | | | | | | | | | | | | | | | | | | | | | |
| | | December 31, |
| | | Assets Exceed
ABO | | ABO Exceed
Assets | | Total |
| | | 2020 | | 2019 | | 2020 | | 2019 | | 2020 | | 2019 |
| Projected benefit obligation | | $ | 0 | | | $ | 0 | | | $ | 531.5 | | | $ | 482.4 | | | $ | 531.5 | | | $ | 482.4 | |
| Accumulated benefit obligation | | 0 | | | 0 | | | 527.9 | | | 478.3 | | | 527.9 | | | 478.3 | |
| Fair value of plan assets | | 0 | | | 0 | | | 464.4 | | | 424.1 | | | 464.4 | | | 424.1 | |
|
| | | | | | | | | | | | | | | | | | | | | | | | |
| | | December 31, |
| | | Assets Exceed ABO | | ABO Exceed Assets | | Total |
| | | 2018 | | 2017 | | 2018 | | 2017 | | 2018 | | 2017 |
| Projected benefit obligation | | $ | 130.3 |
| | $ | — |
| | $ | 300.4 |
| | $ | 463.9 |
| | $ | 430.7 |
| | $ | 463.9 |
|
| Accumulated benefit obligation | | 125.4 |
| | — |
| | 298.5 |
| | 451.4 |
| | 423.9 |
| | 451.4 |
|
| Fair value of plan assets | | 128.8 |
| | — |
| | 246.4 |
| | 400.4 |
| | 375.2 |
| | 400.4 |
|
Components of Net Periodic Benefit Cost
| | | | | Pension Benefits | | Postretirement Benefits
Other than Pensions | | | Pension Benefits | | Postretirement Benefits
Other than Pensions |
| | | Year Ended December 31, | | | Year Ended December 31, |
| | | 2018 | | 2017 | | 2016 | | 2018 | | 2017 | | 2016 | | | 2020 | | 2019 | | 2018 | | 2020 | | 2019 | | 2018 |
| Service cost | | $ | 6.7 |
| | $ | 5.5 |
| | $ | 4.9 |
| | $ | 1.1 |
| | $ | 1.2 |
| | $ | 1.3 |
| Service cost | | $ | 4.6 | | | $ | 5.0 | | | $ | 6.7 | | | $ | 1.0 | | | $ | 1.2 | | | $ | 1.1 | |
| Interest cost | | 15.8 |
| | 15.0 |
| | 15.9 |
| | 1.4 |
| | 1.4 |
| | 1.6 |
| Interest cost | | 14.1 | | | 16.2 | | | 15.8 | | | 1.0 | | | 1.5 | | | 1.4 | |
| Expected return on plan assets (a) | | (21.0 | ) | | (19.9 | ) | | (18.9 | ) | | — |
| | — |
| | — |
| Expected return on plan assets (a) | | (20.7) | | | (21.1) | | | (21.0) | | | 0 | | | 0 | | | 0 | |
| Recognized net actuarial loss | | 5.2 |
| | 5.6 |
| | 6.6 |
| | 0.8 |
| | 0.3 |
| | 0.6 |
| Recognized net actuarial loss | | 5.4 | | | 4.9 | | | 5.2 | | | 0.9 | | | 0.9 | | | 0.8 | |
| Amortization of prior service cost (credit) | | 0.2 |
| | 0.2 |
| | 0.2 |
| | (0.2 | ) | | (0.2 | ) | | (0.2 | ) | Amortization of prior service cost (credit) | | 0.3 | | | 0.2 | | | 0.2 | | | 0 | | | 0 | | | (0.2) | |
| Curtailment gain | | Curtailment gain | | 0 | | | (1.6) | | | 0 | | | 0 | | | 0 | | | 0 | |
| Amount of settlement loss recognized | | 0.8 |
| | 0.6 |
| | 0.8 |
| | — |
| | — |
| | — |
| Amount of settlement loss recognized | | 0.3 | | | 0.1 | | | 0.8 | | | 0 | | | 0 | | | 0 | |
| Net periodic benefit cost | | $ | 7.7 |
| | $ | 7.0 |
| | $ | 9.5 |
| | $ | 3.1 |
| | $ | 2.7 |
| | $ | 3.3 |
| Net periodic benefit cost | | $ | 4.0 | | | $ | 3.7 | | | $ | 7.7 | | | $ | 2.9 | | | $ | 3.6 | | | $ | 3.1 | |
|
_______________________
| |
(a) | The expected return on plan assets, excluding the Dutch plan assets, is determined by multiplying the fair value of plan assets at the prior year-end (adjusted for estimated current year cash benefit payments and contributions) by the expected long-term rate of return. The Dutch pension plan is funded through an insurance contract, and the expected return on plan assets is calculated based on the discount rate of the insured obligations. |
(a)The expected return on plan assets, excluding the Neenah Coldenhove plan assets, is determined by multiplying the fair value of plan assets at the prior year-end (adjusted for estimated current year cash benefit payments and contributions) by the expected long-term rate of return. The Neenah Coldenhove pension plan is funded through an insurance contract, and the expected return on plan assets is calculated based on the discount rate of the insured obligations.
NEENAH, INC. AND SUBSIDIARIES
NOTES TO CONSOLIDATED FINANCIAL STATEMENTS (Continued)
(Dollars in millions, except as noted)
Other Changes in Plan Assets and Benefit Obligations Recognized in Other Comprehensive Income (Loss)
| | | | | | | | | | | | | | | | | | | | | | | | | | | | | | | | | | | | | | |
| | | Pension Benefits | | Postretirement Benefits
Other than Pensions |
| | | Year Ended December 31, |
| | | 2020 | | 2019 | | 2018 | | 2020 | | 2019 | | 2018 |
| Net periodic benefit expense | | $ | 4.0 | | | $ | 3.7 | | | $ | 7.7 | | | $ | 2.9 | | | $ | 3.6 | | | $ | 3.1 | |
| Accumulated actuarial gain (loss) | | 9.0 | | | 7.7 | | | 4.2 | | | 1.6 | | | (1.5) | | | 0.1 | |
| Prior service cost (credit) | | (0.3) | | | 0.2 | | | (0.1) | | | 0 | | | 0 | | | 0.2 | |
| Total recognized in other comprehensive income (loss) | | 8.7 | | | 7.9 | | | 4.1 | | | 1.6 | | | (1.5) | | | 0.3 | |
| Total recognized in net periodic benefit cost and other comprehensive income (loss) | | $ | 12.7 | | | $ | 11.6 | | | $ | 11.8 | | | $ | 4.5 | | | $ | 2.1 | | | $ | 3.4 | |
|
| | | | | | | | | | | | | | | | | | | | | | | | |
| | | Pension Benefits | | Postretirement Benefits
Other than Pensions |
| | | Year Ended December 31, |
| | | 2018 | | 2017 | | 2016 | | 2018 | | 2017 | | 2016 |
| Net periodic benefit expense | | $ | 7.7 |
| | $ | 7.0 |
| | $ | 9.5 |
| | $ | 3.1 |
| | $ | 2.7 |
| | $ | 3.3 |
|
| Accumulated actuarial gain (loss) | | 4.2 |
| | 10.1 |
| | 11.7 |
| | 0.1 |
| | 3.7 |
| | (0.9 | ) |
| Prior service cost (credit) | | (0.1 | ) | | (0.1 | ) | | (0.3 | ) | | 0.2 |
| | 0.2 |
| | 0.1 |
|
| Total recognized in other comprehensive income (loss) | | 4.1 |
| | 10.0 |
| | 11.4 |
| | 0.3 |
| | 3.9 |
| | (0.8 | ) |
| Total recognized in net periodic benefit cost and other comprehensive income (loss) | | $ | 11.8 |
| | $ | 17.0 |
| | $ | 20.9 |
| | $ | 3.4 |
| | $ | 6.6 |
| | $ | 2.5 |
|
The estimated net actuarial loss and prior service cost for the defined benefit pension plans expected to be amortized from AOCI into net periodic benefit cost over the next fiscal year are $5.6 million and $0.2 million, respectively. The estimated net actuarial loss and prior service (credit) for postretirement benefits other than pensions expected to be amortized from AOCI into net periodic benefit cost over the next fiscal year is $0.8 million and $0.0 million, respectively.
Weighted-Average Assumptions Used to Determine Benefit Obligations at December 31
| | | | | | | | | | | | | | | | | | | | | | | | | | |
| | | Pension
Benefits | | Postretirement
Benefits
Other than
Pensions |
| | | 2020 | | 2019 | | 2020 | | 2019 |
| Discount rate | | 2.28 | % | | 2.98 | % | | 1.67 | % | | 2.68 | % |
| Rate of compensation increase | | 1.54 | % | | 2.05 | % | | 0 | % | | 0 | % |
| Initial healthcare cost trend rate | | — | % | | — | % | | 5.25 | % | | 6.10 | % |
| Ultimate healthcare cost trend rate | | — | % | | — | % | | 4.00 | % | | 4.50 | % |
| Ultimate year | | — | | | — | | | 2045 | | 2037 |
|
| | | | | | | | | | | | |
| | | Pension Benefits | | Postretirement Benefits Other than Pensions |
| | | 2018 | | 2017 | | 2018 | | 2017 |
| Discount rate | | 3.94 | % | | 3.49 | % | | 3.84 | % | | 3.27 | % |
| Rate of compensation increase | | 2.34 | % | | 2.40 | % | | — | % | | — | % |
| Initial healthcare cost trend rate | | — | % | | — | % | | 6.80 | % | | 6.80 | % |
| Ultimate healthcare cost trend rate | | — | % | | — | % | | 4.50 | % | | 4.50 | % |
| Ultimate year | | — |
| | — |
| | 2037 |
| | 2037 |
|
| | | | | | | | | | | | | | | | | | | | | | | | | | | | | | | | | | | | | | |
| | | Pension Benefits | | Postretirement
Benefits Other than
Pensions |
| | | Year Ended December 31, |
| | | 2020 | | 2019 | | 2018 | | 2020 | | 2019 | | 2018 |
| Discount rate | | 2.98 | % | | 3.78 | % | | 3.65 | % | | 2.68 | % | | 3.84 | % | | 3.42 | % |
| Expected long-term return on plan assets (a) | | 5.42 | % | | 5.91 | % | | 5.78 | % | | 0 | % | | 0 | % | | 0 | % |
| Rate of compensation increase | | 2.05 | % | | 2.33 | % | | 2.44 | % | | 2.50 | % | | 2.50 | % | | 2.50 | % |
| Initial healthcare cost trend rate | | — | % | | — | % | | — | % | | 6.10 | % | | 6.50 | % | | 6.80 | % |
| Ultimate healthcare cost trend rate | | — | % | | — | % | | — | % | | 4.50 | % | | 4.50 | % | | 4.50 | % |
| Ultimate year | | — | | | — | | | — | | | 2037 | | 2037 | | 2037 |
_______________________
(a)The expected long-term return on plan assets does not include the Neenah Coldenhove plan assets. The Neenah Coldenhove pension plan is funded through an insurance contract, and the expected return on plan assets is calculated based on the discount rate of the insured obligations.
NEENAH, INC. AND SUBSIDIARIES
NOTES TO CONSOLIDATED FINANCIAL STATEMENTS (Continued)
(Dollars in millions, except as noted)
Weighted-Average Assumptions Used to Determine Net Periodic Benefit Cost for Years Ended December 31
|
| | | | | | | | | | | | | | | | | | |
| | | Pension Benefits | | Postretirement Benefits Other than Pensions |
| | | Year Ended December 31, |
| | | 2018 | | 2017 | | 2016 | | 2018 | | 2017 | | 2016 |
| Discount rate | | 3.65 | % | | 4.18 | % | | 4.54 | % | | 3.42 | % | | 3.89 | % | | 4.07 | % |
| Expected long-term return on plan assets (a) | | 5.78 | % | | 6.31 | % | | 6.20 | % | | — | % | | — | % | | — | % |
| Rate of compensation increase | | 2.44 | % | | 2.49 | % | | 2.18 | % | | 2.50 | % | | — | % | | — | % |
| Initial healthcare cost trend rate | | — | % | | — | % | | — | % | | 6.80 | % | | 7.00 | % | | 7.30 | % |
| Ultimate healthcare cost trend rate | | — | % | | — | % | | — | % | | 4.50 | % | | 4.50 | % | | 4.50 | % |
| Ultimate year | | — |
| | — |
| | — |
| | 2037 |
| | 2037 |
| | 2037 |
|
_______________________
| |
(a) | The expected long-term return on plan assets does not include the Dutch plan assets. The Dutch pension plan is funded through an insurance contract, and the expected return on plan assets is calculated based on the discount rate of the insured obligations. |
Expected Long-Term Rate of Return and Investment Strategies
The expected long-term rate of return on pension fund assets held by the Company's pension trusts was determined based on several factors, including input from pension investment consultants and projected long-term returns of broad equity and bond indices. Also considered were the plans' historical compounded annual returns. It is anticipated that, on average, the managed pension plan assets will generate a return of 5 to 6 percent. The expected long-term rate of return on the assets in the plans was based on an asset allocation assumption of approximately 33 percent with equity managers, with expected long-term rates of return of approximately 8 to 10 percent, 8 percent with hedge funds,funds/other, with expected long-term rates of return of approximately 65 to 87 percent, and 5859 percent with fixed income managers, with an expected long-term rate of return of about 3 to 5 percent. The actual asset allocation is regularly reviewed and periodically rebalanced to the targeted allocation when considered appropriate.
Plan Assets
Pension plan asset allocations are as follows:
| | | | | | | | | | | | | | |
| | | Percentage of Plan
Assets At
December 31, |
| | | 2020 | | 2019 |
| Asset Category (a) | | | | |
| Equity securities | | 36 | % | | 33 | % |
| Hedge fund / Other | | 8 | % | | 8 | % |
| Debt securities / Fixed Income | | 56 | % | | 59 | % |
| Cash and money-market funds | | 0 | % | | 0 | % |
| Total | | 100 | % | | 100 | % |
|
| | | | | | |
| | | Percentage of Plan
Assets At
December 31, |
| | | 2018 | | 2017 |
| Asset Category (a) | | |
| | |
|
| Equity securities | | 33 | % | | 35 | % |
| Hedge fund | | 8 | % | | 8 | % |
| Debt securities | | 58 | % | | 57 | % |
| Cash and money-market funds | | 1 | % | | — | % |
| Total | | 100 | % | | 100 | % |
(a)The asset categories do not include the insurance contract related to the DutchNeenah Coldenhove pension plan.
NEENAH, INC. AND SUBSIDIARIES
NOTES TO CONSOLIDATED FINANCIAL STATEMENTS (Continued)
(Dollars in millions, except as noted)
The Company's investment objective for pension plan assets is to ensure, over the long-term life of the pension plans, an adequate pool of assets to support the benefit obligations to participants, retirees, and beneficiaries. Specifically, these objectives include the desire to: (a) invest assets in a manner such that future assets are available to fund liabilities, (b) maintain liquidity sufficient to pay current benefits when due and (c) diversify, over time, among asset classes so assets earn a reasonable return with acceptable risk to capital.
The weighted average target investment allocation and permissible allocation range for plan assets by category are as follows:
|
| | | | | | | | | | | | | |
| | Strategic Target | | Permitted Range |
| Asset Category | | |
| | |
| Equity securities | | 3533 | % | | 30-40%28%-38% |
| Hedge fund / Other | | 8 | % | | 3-12%3%-13% |
| Debt securities / Fixed Income | | 5759 | % | | 52-62%54%-64% |
As of December 31, 2018,2020, no company or group of companies in a single industry represented more than 5 percent of plan assets.
NEENAH, INC. AND SUBSIDIARIES
NOTES TO CONSOLIDATED FINANCIAL STATEMENTS (Continued)
(Dollars in millions, except as noted)
The Company's investment assumptions are established by an investment committee composed of members of senior management and are validated periodically against actual investment returns. As of December 31, 2018,2020, the Company's investment assumptions are as follows:
| |
(a) | The plan should be substantially fully invested in debt and equity securities at all times because substantial cash holdings will reduce long-term rates of return; |
| |
(b) | Equity investments will provide greater long-term returns than fixed income investments, although with greater short-term volatility; |
| |
(c) | It is prudent to diversify plan investments across major asset classes; |
| |
(d) | Allocating a portion of plan assets to foreign equities will increase portfolio diversification, decrease portfolio risk and provide the potential for long-term returns; |
| |
(e) | Investment managers with active mandates can reduce portfolio risk below market risk and potentially add value through security selection strategies, and a portion of plan assets should be allocated to such active mandates; |
| |
(f) | A component of passive, indexed management can benefit the plans through greater diversification and lower cost, and a portion of the plan assets should be allocated to such passive mandates, and |
| |
(g) | It is appropriate to retain more than one investment manager, given the size of the plans, provided that such managers offer asset class or style diversification. |
(1)The plan should be substantially fully invested in debt and equity securities at all times because substantial cash holdings will reduce long-term rates of return;
(2)Equity investments will provide greater long-term returns than fixed income investments, although with greater short-term volatility;
(3)It is prudent to diversify plan investments across major asset classes;
(4)Allocating a portion of plan assets to foreign equities will increase portfolio diversification, decrease portfolio risk and provide the potential for long-term returns;
(5)Investment managers with active mandates can reduce portfolio risk below market risk and potentially add value through security selection strategies, and a portion of plan assets should be allocated to such active mandates;
(6)A component of passive, indexed management can benefit the plans through greater diversification and lower cost, and a portion of the plan assets should be allocated to such passive mandates, and
(7)It is appropriate to retain more than one investment manager, given the size of the plans, provided that such managers offer asset class or style diversification.
For the years ended December 31, 2020, 2019 and 2018, 2017 and 2016, no0 plan assets were invested in the Company's securities.
Cash Flows
At December 31, 2018,2020, the Company expects to make aggregate contributions to qualified and nonqualified defined benefit pension trusts and payments ofto pay pension benefits for unfunded pension and other postretirement benefit plans in 20192021 of approximately $9.4$12 million (based on exchange rates at December 31, 2018)2020).
NEENAH, INC. AND SUBSIDIARIES
NOTES TO CONSOLIDATED FINANCIAL STATEMENTS (Continued)
(Dollars in millions, except as noted)
Future Benefit Payments
The following benefit payments, which reflect expected future service, as appropriate, are expected to be paid:
| | | | | | | | | | | | | | |
| | Pension Plans | | Postretirement Benefits
Other than Pensions |
| 2021 | | $ | 26.8 | | | $ | 6.0 | |
| 2022 | | 23.8 | | | 4.8 | |
| 2023 | | 24.6 | | | 4.5 | |
| 2024 | | 25.5 | | | 4.1 | |
| 2025 | | 25.7 | | | 3.7 | |
| Years 2026-2030 | | 131.7 | | | 12.3 | |
|
| | | | | | | | |
| | | Pension Plans | | Postretirement Benefits Other than Pensions |
| 2019 | | $ | 21.5 |
| | $ | 5.2 |
|
| 2020 | | 21.7 |
| | 4.9 |
|
| 2021 | | 26.9 |
| | 5.3 |
|
| 2022 | | 23.0 |
| | 5.3 |
|
| 2023 | | 24.1 |
| | 5.0 |
|
| Years 2024-2028 | | 128.3 |
| | 17.6 |
|
Health Care Cost Trends
Assumed health care cost trend rates affect the amounts reported for postretirement health care benefit plans. A one percentage-point change in assumed health care cost trend rates would have the following effects:
|
| | | | | | | | |
| | | One Percentage- Point |
| | | Increase | | Decrease |
| Effect on total of service and interest cost components | | $ | — |
| | $ | — |
|
| Effect on post-retirement benefit other than pension obligation | | 0.3 |
| | (0.3 | ) |
Defined Contribution Retirement Plans
Company contributions to defined contribution retirement plans are based on various factors for covered employees. Contributions to these plans, all of which were charged to expense, were $1.8 million in 2020, $2.0 million in 2019 and $2.3 million in 2018, $2.5 million in 2017 and $2.7 million in 2016.2018. In addition, the Company maintains a supplemental retirement contribution plan (the "SRCP") which is a non-qualified, unfunded defined contribution plan. The Company provides benefits under the SRCP to the extent necessary to fulfill the intent of its defined contribution retirement plans without regard to the limitations set by the Internal Revenue Code on qualified defined contribution plans. For the years ended December 31, 2018, 20172020, 2019 and 2016,2018, the Company recognized expense related to the SRCP of $0.0$0.4 million, $0.4 million and $0.4$0.0 million, respectively. At both
NEENAH, INC. AND SUBSIDIARIES
NOTES TO CONSOLIDATED FINANCIAL STATEMENTS (Continued)
(Dollars in millions, except as noted)
December 31, 20182020 and December 31, 2017,2019, the unfunded obligation of the SRCP was $2.0 million and $1.7 million.million, respectively.
Investment Plans
The Company provides voluntary contribution investment plans to substantially all North American employees. Under the plans, the Company matches a portion of employee contributions. For the years ended December 31, 2018, 20172020, 2019 and 2016,2018, costs charged to expense for Company matching contributions under these plans were $4.0$4.6 million, $3.7$4.7 million and $3.1$4.0 million, respectively.
NEENAH, INC. AND SUBSIDIARIES
NOTES TO CONSOLIDATED FINANCIAL STATEMENTS (Continued)
(Dollars in millions, except as noted)
Note 9.8. Stock Compensation Plans
The Company established the 2004 Omnibus Stock and Incentive Plan (the "2004 Omnibus Plan") in December 2004 and reserved 3,500,000 shares of $0.01 par value common stock ("Common Stock") for issuance under the Omnibus Plan. Pursuant to the terms of the 2004 Omnibus Plan, the compensation committee of the Company's Board of Directors may grant various types of equity-based compensation awards, including incentive and nonqualified stock options, SARs, restricted stock, RSUs, Performance Units, in addition to certain cash-based awards. All grants under the Omnibus Plan will be made at fair market value and no grant may be repriced. In general, the options expire 10 years from the date of grant and vest over a 3-year service period.
At the 2018 Annual Meeting of Stockholders, the Company's stockholders approved an amendment and restatement of the 2004 Omnibus Plan (as amended and restated the "2018 Omnibus Plan"). The amendment and restatement authorized the Company to reserve an additional 800,000 shares of Common Stock for future issuance. As of December 31, 2018,2020, the Company had 1,260,000879,000 shares of Common Stock reserved for future issuance under the 2018 Omnibus Plan. As of December 31, 2018,2020, the number of shares available for future issuance was reduced by approximately 174,00053,610 shares for outstanding SARs where the closing market price for the Company's common stock was greater than the exercise price of the SAR. The Company accounts for stock-based compensation pursuant to the fair value recognition provisions of ASC Topic 718, Compensation — Stock Compensation ("ASC Topic 718").
Valuation and Expense Information Under ASC Topic 718
Substantially all stock-based compensation expense has been recorded in Selling, general and administrative expenses on the consolidated statements of operations. The following table summarizes stock-based compensation costs and related income tax benefits.
| | | | | | | | | | | | | | | | | | | | |
| | | Year Ended December 31, |
| | | 2020 | | 2019 | | 2018 |
| Stock-based compensation expense | | $ | 4.2 | | | $ | 5.6 | | | $ | 4.0 | |
| Income tax benefit | | (1.1) | | | (1.4) | | | (1.0) | |
| Stock-based compensation, net of income tax benefit | | $ | 3.1 | | | $ | 4.2 | | | $ | 3.0 | |
|
| | | | | | | | | | | | |
| | | Year Ended December 31, |
| | | 2018 | | 2017 | | 2016 |
| Stock-based compensation expense | | $ | 4.0 |
| | $ | 6.4 |
| | $ | 5.8 |
|
| Income tax benefit | | (1.0 | ) | | (2.5 | ) | | (2.2 | ) |
| Stock-based compensation, net of income tax benefit | | $ | 3.0 |
| | $ | 3.9 |
| | $ | 3.6 |
|
NEENAH, INC. AND SUBSIDIARIES
NOTES TO CONSOLIDATED FINANCIAL STATEMENTS (Continued)
(Dollars in millions, except as noted)
The following table summarizes total compensation costs related to the Company's equity awards and amounts recognized in the year ended December 31, 2018.2020.
| | | | | | | | | | | | | | |
| | | Stock Options | | Performance
Shares and RSUs |
| Unrecognized compensation cost — December 31, 2019 | | $ | 0.2 | | | $ | 2.4 | |
| Grant date fair value current year grants | | 0 | | | 7.4 | |
| Shares forfeited | | 0 | | | (1.8) | |
| Compensation expense recognized | | (0.2) | | | (4.1) | |
| Unrecognized compensation cost — December 31, 2020 | | $ | 0 | | | $ | 3.9 | |
| Expected amortization period (in years) | | 0.6 | | 1.8 |
|
| | | | | | | | |
| | | Stock Options | | Performance
Shares and RSUs |
| Unrecognized compensation cost — December 31, 2017 | | $ | 0.6 |
| | $ | 2.3 |
|
| Grant date fair value current year grants | | 1.5 |
| | 2.3 |
|
| Compensation expense recognized | | (1.5 | ) | | (2.5 | ) |
| Unrecognized compensation cost — December 31, 2018 | | $ | 0.6 |
| | $ | 2.1 |
|
| Expected amortization period (in years) | | 1.7 |
| | 1.5 |
|
Stock Options/SARs
The Company grants nonqualified stock options to certain non-U.S. employees and Stock Appreciation Rights (SARs, and collectively 'stock options') to certain U.S. employees. Upon exercise, the holder of a SAR receives common shares equal to the number of SARs exercised multiplied by a fraction where the numerator is equal to the market price at the time of
NEENAH, INC. AND SUBSIDIARIES
NOTES TO CONSOLIDATED FINANCIAL STATEMENTS (Continued)
(Dollars in millions, except as noted)
exercise minus the exercise price of the SAR and the denominator is equal to the market price at the time of exercise. The SARs can only be settled for shares of Common Stock and the Company does not receive any cash proceeds upon exercise.
The following tables present information regarding stock options awarded during the years ended December 31, 2018, 20172019 and 2016.2018. There were 0 stock options awarded during the year ended December 31, 2020.
| | | | | | | | | | | | | | | | |
| | | | 2019 | | 2018 |
| Stock options granted | | | | 1,272 | | | 108,420 | |
| Per share weighted-average exercise price | | | | $ | 66.59 | | | $ | 93.22 | |
| Per share weighted-average grant date fair value | | | | $ | 10.32 | | | $ | 15.00 | |
|
| | | | | | | | | | | | |
| | | 2018 | | 2017 | | 2016 |
| Nonqualified stock options granted | | 108,420 |
| | 144,089 |
| | 113,935 |
|
| Per share weighted-average exercise price | | $ | 93.22 |
| | $ | 82.11 |
| | $ | 58.03 |
|
| Per share weighted-average grant date fair value | | $ | 15.00 |
| | $ | 13.54 |
| | $ | 13.51 |
|
The weighted-average grant date fair value for stock options granted for the years ended December 31, 2018, 20172019 and 20162018 was estimated using the Black-Scholes option valuation model with the following assumptions:
| | | | | | | | | | | | | | | | |
| | | | 2019 | | 2018 |
| Expected term in years | | | | 5.0 | | 5.7 |
| Risk free interest rate | | | | 1.8 | % | | 2.5 | % |
| Volatility | | | | 23.1 | % | | 21.5 | % |
| Dividend yield | | | | 3.0 | % | | 3.0 | % |
|
| | | | | | | | | |
| | | 2018 | | 2017 | | 2016 |
| Expected term in years | | 5.7 |
| | 5.8 |
| | 5.8 |
|
| Risk free interest rate | | 2.5 | % | | 2.1 | % | | 1.8 | % |
| Volatility | | 21.5 | % | | 22.9 | % | | 32.1 | % |
| Dividend yield | | 3.0 | % | | 3.0 | % | | 3.0 | % |
Expected volatility and the expected term were estimated by reference to the historical stock price performance of the Company and historical data for the Company's stock option awards, respectively. The risk-free interest rate was based on the yield on U.S. Treasury bonds with a remaining term approximately equal to the expected term of the stock option awards. Forfeitures were estimated at the date of grant.
The following table summarizes stock option activity under the Omnibus Plan for the year ended December 31, 2018:
|
| | | | | | | |
| | | Number of
Stock Options | | Weighted-Average
Exercise Price |
| Options outstanding — December 31, 2017 | | 464,958 |
| | $ | 55.60 |
|
| Add: Options granted | | 108,420 |
| | $ | 93.22 |
|
| Less: Options exercised | | 104,771 |
| | $ | 38.73 |
|
| Less: Options forfeited/cancelled | | 17,526 |
| | $ | 83.89 |
|
| Options outstanding — December 31, 2018 | | 451,081 |
| | $ | 67.46 |
|
NEENAH, INC. AND SUBSIDIARIES
NOTES TO CONSOLIDATED FINANCIAL STATEMENTS (Continued)
(Dollars in millions, except as noted)
The following table summarizes stock option activity under the Omnibus Plan for the year ended December 31, 2020:
| | | | | | | | | | | | | | |
| | | Number of
Stock Options | | Weighted-Average
Exercise Price |
| Options outstanding — December 31, 2019 | | 416,548 | | | $ | 70.08 | |
| Add: Options granted | | 0 | | | $ | 0 | |
| Less: Options exercised | | 13,434 | | | $ | 32.89 | |
| Less: Options forfeited/cancelled | | 22,270 | | | $ | 80.49 | |
| Options outstanding — December 31, 2020 | | 380,844 | | | $ | 70.99 | |
The status of outstanding and exercisable stock options as of December 31, 2018,2020, summarized by exercise price follows:
|
| | | | | | | | | | | | | | | | | | | | | | | | |
| | | Options Vested or Expected to Vest | | Options Exercisable |
| | | | | | | | | | | | | | | |
| Exercise Price | | Number of
Options | | Weighted-
Average
Remaining
Contractual
Life (Years) | | Weighted-
Average
Exercise
Price | | Aggregate
Intrinsic
Value (a) | | Number of
Options | | Weighted-
Average
Exercise
Price | | Aggregate
Intrinsic
Value (a) |
| $8.04 — $13.38 | | 10,250 |
| | 0.8 | | $ | 11.19 |
| | $ | 0.5 |
| | 10,250 |
| | $ | 11.19 |
| | $ | 0.5 |
|
| $18.90 — $31.23 | | 49,027 |
| | 3.2 | | $ | 26.02 |
| | 1.6 |
| | 49,027 |
| | $ | 26.02 |
| | 1.6 |
|
| $42.82 — $74.20 | | 160,837 |
| | 6.5 | | $ | 55.74 |
| | 0.6 |
| | 127,836 |
| | $ | 55.10 |
| | 0.5 |
|
| $74.70 — $93.35 | | 230,967 |
| | 8.5 | | $ | 86.92 |
| | — |
| | 53,790 |
| | $ | 82.23 |
| | — |
|
| | | 451,081 |
| | 7.0 | | $ | 67.46 |
| | $ | 2.7 |
| | 240,903 |
| | $ | 53.37 |
| | $ | 2.6 |
|
| | | | | | | | | | | | | | | | | | | | | | | | | | | | | | | | | | | | | | | | | | | | |
| | | Options Vested or Expected to Vest | | Options Exercisable |
| | | | | | | | | | | | | | | |
| Exercise Price | | Number of
Options | | Weighted-
Average
Remaining
Contractual
Life (Years) | | Weighted-
Average
Exercise
Price | | Aggregate
Intrinsic
Value (a) | | Number of
Options | | Weighted-
Average
Exercise
Price | | Aggregate
Intrinsic
Value (a) |
| $19.25 — $31.23 | | 31,884 | | | 1.6 | | $ | 27.86 | | | $ | 0.9 | | | 31,884 | | | $ | 27.86 | | | $ | 0.9 | |
| $42.82 — $64.23 | | 132,516 | | | 4.4 | | $ | 55.70 | | | 0.3 | | | 131,386 | | | $ | 55.81 | | | 0.3 | |
| $66.59 — $93.35 | | 216,444 | | | 6.5 | | $ | 86.70 | | | 0 | | | 199,381 | | | $ | 86.29 | | | 0 | |
| | 380,844 | | | 5.4 | | $ | 70.99 | | | $ | 1.2 | | | 362,651 | | | $ | 70.11 | | | $ | 1.2 | |
_______________________
| |
(a) | Represents the total pre-tax intrinsic value as of December 31, 2018 that option holders would have received had they exercised their options as of such date. The pre-tax intrinsic value is based on the closing market price for the Company's common stock of $58.92 on December 31, 2018.
|
(a)Represents the total pre-tax intrinsic value as of December 31, 2020 that option holders would have received had they exercised their options as of such date. The pre-tax intrinsic value is based on the closing market price for the Company's common stock of $55.32 on December 31, 2020.
The aggregate pre-tax intrinsic value of stock options exercised for the years ended December 31, 2020, 2019 and 2018 2017 and 2016 was $5.2$0.3 million, $11.5$1.2 million and $4.7$5.2 million, respectively.
The following table summarizes the status of the Company's unvested stock options as of December 31, 20182020 and activity for the year then ended:
| | | | | | | | | | | | | | |
| | | Number of
Stock Options | | Weighted-Average
Grant Date
Fair Value |
| Outstanding — December 31, 2019 | | 98,519 | | | $ | 14.41 | |
| Add: Options granted | | 0 | | | $ | 0 | |
| Less: Options vested | | 77,961 | | | $ | 14.30 | |
| Less: Options forfeited | | 2,365 | | | $ | 15.03 | |
| Outstanding — December 31, 2020 | | 18,193 | | | $ | 14.48 | |
|
| | | | | | | |
| | | Number of
Stock Options | | Weighted-Average
Grant Date
Fair Value |
| Outstanding — December 31, 2017 | | 223,014 |
| | $ | 13.87 |
|
| Add: Options granted | | 108,420 |
| | $ | 15.00 |
|
| Less: Options vested | | 103,924 |
| | $ | 14.19 |
|
| Less: Options forfeited | | 17,332 |
| | $ | 13.63 |
|
| Outstanding — December 31, 2018 | | 210,178 |
| | $ | 14.21 |
|
As of December 31, 2018,2020, certain participants met age and service requirements that allowed their options to qualify for accelerated vesting upon retirement. As of December 31, 2018,2020, there were approximately 146,0008,439 stock options subject to accelerated vesting that such participants would have been eligible to exercise if they had retired as of such date. The
NEENAH, INC. AND SUBSIDIARIES
NOTES TO CONSOLIDATED FINANCIAL STATEMENTS (Continued)
(Dollars in millions, except as noted)
aggregate grant date fair value of options subject to accelerated vesting was $2.1$0.1 million. For the year ended December 31, 2018,2020, stock-based compensation expense for such options was $0.9less than $0.1 million. For the year ended December 31, 2018,2020, the aggregate grant date fair value of options vested, including options subject to accelerated vesting, was $1.5$1.1 million. Stock options that reflect accelerated vesting for expense recognition become exercisable according to the contract terms of the stock option grant.
PSUs/RSUs
For the year ended December 31, 2018,2020, the Company granted target awards of 40,74744,206 PSUs. The measurement period for three fourths of the PSUs is January 1, 20182020 through December 31, 2018, and for the remaining fourth of the PSUs is
NEENAH, INC. AND SUBSIDIARIES
NOTES TO CONSOLIDATED FINANCIAL STATEMENTS (Continued)
(Dollars in millions, except as noted)
January 1, 2018 through December 31, 2020. The PSUs vest on December 31, 2020.2022. Common Stock equal to not less than 40 percent and not more than 200 percent of the PSUs target will be awarded based on the Company’s return on invested capital, consolidated revenue growth, EPSfree cash flow and total return to shareholders relative to the companies in the Russell 2000® Value small cap index. The Company’s return on invested capital, consolidated revenue growth and EPSfree cash flow are adjusted for certain items as further described in the Performance Share Unit Award Agreement.
As of December 31, 2018,2020, the Company expects that Common Stock equal to approximately 40100 percent of the PSU targets will be earned. The market price on the date of grant for the PSUs was $93.21$63.07 per share. At the end of the measurement period, the PSUs convert into RSUs,shares of Common Stock, at the determined rate mentioned above, that are entitled to dividends but do not have voting rights.above. The Company is recognizing stock-based compensation expense pro-rata over the vesting term of the PSUs/RSUs. For further discussion on participating securities refer to Note 3, "Earnings Per Share".
For the year ended December 31, 2018,2020, the Company awarded 8,45614,184 RSUs to non-employee members of the Board of Directors and 2,03086,234 RSUs to employees. The weighted-average grant date fair value of such awards was $82.29$56.39 per share and the awards vest one year from the date of grant for the Board of Directors grants and three years from the date of grantin equal amounts at December 31, 2020, 2021 and 2022 for the employee grants. During the vesting period, the holders of the RSUs are entitled to dividends, but the RSUs do not have voting rights and are forfeited in the event the holder is no longer an employee or member of the Board of Directors on the vesting date.date as further described in the Restricted Stock Unit Award Agreement.
NEENAH, INC. AND SUBSIDIARIES
NOTES TO CONSOLIDATED FINANCIAL STATEMENTS (Continued)
(Dollars in millions, except as noted)
The following table summarizes the activity of the Company's unvested stock-based awards (other than stock options) for the years ended December 31, 2020, 2019 and 2018:
| | | | | | | | | | | | | | | | | | | | | | | | | | |
| | | RSUs | | Weighted-Average
Grant Date
Fair Value | | PSUs | | Weighted-Average
Grant Date
Fair Value |
| Outstanding — December 31, 2017 | | 88,799 | | | $ | 53.33 | | | 41,377 | | | $ | 81.85 | |
| Shares granted (a) | | 10,618 | | | $ | 82.29 | | | 40,747 | | | $ | 93.21 | |
| Shares vested | | (72,190) | | | $ | 60.24 | | | 0 | | | $ | 0 | |
| Performance Shares vested | | 33,928 | | | $ | 88.40 | | | (31,421) | | | $ | 81.85 | |
| Shares expired or cancelled | | (7,695) | | | $ | 84.45 | | | (3,482) | | | $ | 84.45 | |
| Outstanding — December 31, 2018 | | 53,460 | | | $ | 67.53 | | | 47,221 | | | $ | 93.21 | |
| Shares granted (a) | | 46,556 | | | $ | 67.04 | | | 49,730 | | | $ | 69.05 | |
| Shares vested | | (63,595) | | | $ | 72.91 | | | 0 | | | $ | 0 | |
| Performance Shares vested | | 10,354 | | | $ | 93.21 | | | (25,833) | | | $ | 93.21 | |
| Shares expired or cancelled | | (2,113) | | | $ | 69.35 | | | (4,927) | | | $ | 85.67 | |
| Outstanding — December 31, 2019 | | 44,662 | | | $ | 65.23 | | | 66,191 | | | $ | 75.62 | |
| Shares granted (a) | | 100,418 | | | $ | 56.39 | | | 44,206 | | | $ | 63.07 | |
| Shares vested | | (61,767) | | | $ | 68.28 | | | 0 | | | $ | 0 | |
| Performance Shares vested | | 21,101 | | | $ | 69.22 | | | (37,804) | | | $ | 75.60 | |
| Shares expired or cancelled | | (22,210) | | | $ | 64.16 | | | (18,545) | | | $ | 83.30 | |
| Outstanding — December 31, 2020 (b) | | 82,204 | | | $ | 53.45 | | | 54,048 | | | $ | 62.73 | |
_______________________
(a)For the years ended December 31, 2020, 2019 and 2018, 2017includes 72 RSUs, 43 RSUs and 2016:132 RSUs, respectively, that were granted in lieu of cash dividends. Such dividends-in-kind vest concurrently with the underlying RSUs.
|
| | | | | | | | | | | | | | |
| | | RSUs | | Weighted-Average
Grant Date
Fair Value | | PSUs | | Weighted-Average
Grant Date
Fair Value |
| Outstanding — December 31, 2015 | | 118,838 |
| | $ | 43.29 |
| | 43,050 |
| | $ | 78.32 |
|
| Shares granted (a) | | 10,047 |
| | $ | 68.25 |
| | 54,364 |
| | $ | 73.82 |
|
| Shares vested | | (110,749 | ) | | $ | 42.96 |
| | — |
| | $ | — |
|
| Performance Shares vested | | 62,874 |
| | $ | 53.63 |
| | (43,050 | ) | | $ | 78.32 |
|
| Shares expired or cancelled | | (291 | ) | | $ | 40.65 |
| | (858 | ) | | $ | 75.98 |
|
| Outstanding — December 31, 2016 | | 80,719 |
| | $ | 54.91 |
| | 53,506 |
| | $ | 73.79 |
|
| Shares granted (a) | | 10,318 |
| | $ | 76.84 |
| | 41,883 |
| | $ | 81.85 |
|
| Shares vested | | (72,451 | ) | | $ | 55.26 |
| | — |
| | $ | — |
|
| Performance Shares vested | | 73,838 |
| | $ | 52.11 |
| | (53,506 | ) | | $ | 73.79 |
|
| Shares expired or cancelled | | (3,625 | ) | | $ | 50.48 |
| | (506 | ) | | $ | 81.85 |
|
| Outstanding — December 31, 2017 | | 88,799 |
| | $ | 53.33 |
| | 41,377 |
| | $ | 81.85 |
|
| Shares granted (a) | | 10,618 |
| | $ | 82.29 |
| | 40,747 |
| | $ | 93.21 |
|
| Shares vested | | (72,190 | ) | | $ | 60.24 |
| | — |
| | $ | — |
|
| Performance Shares vested | | 33,928 |
| | $ | 88.40 |
| | (31,421 | ) | | $ | 81.85 |
|
| Shares expired or cancelled | | (7,695 | ) | | $ | 84.45 |
| | (3,482 | ) | | $ | 84.45 |
|
| Outstanding — December 31, 2018 (b) | | 53,460 |
| | $ | 67.53 |
| | 47,221 |
| | $ | 93.21 |
|
___________________________(b)The aggregate pre-tax intrinsic value of outstanding RSUs as of December 31, 2020 was $4.5 million.
| |
(a) | For the years ended December 31, 2018, 2017 and 2016, includes 132 RSUs, 226 RSUs and 312 RSUs, respectively, that were granted in lieu of cash dividends. Such dividends-in-kind vest concurrently with the underlying RSUs. |
| |
(b) | The aggregate pre-tax intrinsic value of outstanding RSUs as of December 31, 2018 was $3.1 million. |
NEENAH, INC. AND SUBSIDIARIES
NOTES TO CONSOLIDATED FINANCIAL STATEMENTS (Continued)
(Dollars in millions, except as noted)
The aggregate pre-tax intrinsic value of restricted stock and RSUs that vested for the years ended December 31, 2020, 2019 and 2018 2017was $3.4 million, $4.2 million and 2016 was $4.4 million, $6.3 million and $9.3 million, respectively.
Excess Tax Benefits
Excess tax benefits represent the difference between the tax deduction the Company will receive on its tax return for compensation recognized by employees upon the vesting or exercise of stock-based awards and the tax benefit recognized for the grant date fair value of such awards. For the years ended December 31, 2018, 20172020, 2019 and 2016,2018, the Company recognized excess tax benefits (deficit) related to the exercise or vesting of stock-based awards of $1.2$(0.4) million, $4.5$0.1 million and $3.1$1.2 million, respectively.
Note 10.9. Stockholders' Equity
Common Stock
The Company has authorized 100 million shares of Common Stock. Holders of the Company's Common Stock are entitled to one1 vote per share.
NEENAH, INC. AND SUBSIDIARIES
NOTES TO CONSOLIDATED FINANCIAL STATEMENTS (Continued)
(Dollars in millions, except as noted)
In November 2018,2020, the Company's Board of Directors authorized a program, effective January 1, 2019,2021, that would allow the Company to repurchase up to $25 million of its outstanding Common Stock over the next 12 months (the "2019 Stock"Stock Purchase Plan"). Purchases by the Company under the 2019 Stock Purchase Plan would be made from time to time in the open market or in privately negotiated transactions in accordance with the requirements of applicable law. The timing and amount of any purchases will depend on share price, market conditions and other factors. The 2019 Stock Purchase Plan does not require the Company to purchase any specific number of shares and may be suspended or discontinued at any time. The 2019 Stock Purchase Plan is expected to be funded using cash on hand or borrowings under the Company's bank credit facility. The Company also had $25 million repurchase programs in place during the preceding two years that expired in December 20182020 (the “2018“2020 Stock Purchase Plan”) and December 20172019 (the “2017“2019 Stock Purchase Plan”), respectively.
The following table shows shares purchased under the respective stock purchase plans:
| | | | | | | | | | | | | | | | | | | | | | | | | | | | | | | | | | | | | | |
| | | Year Ended December 31, |
| | | 2020 | | 2019 | | 2018 |
| | | Shares | | $ | | Shares | | $ | | Shares | | $ |
| 2020 Stock Purchase Plan | | 59,577 | | | $ | 3.6 | | | | | | | | | |
| 2019 Stock Purchase Plan | | | | | | 79,676 | | | $ | 4.9 | | | | | |
| 2018 Stock Purchase Plan | | | | | | | | | | 124,434 | | | $ | 9.3 | |
| | | | | | | | | | | | |
|
| | | | | | | | | | | | | | | | | | | | | |
| | | Year Ended December 31, |
| | | 2018 | | 2017 | | 2016 |
| | | Shares | | $ | | Shares | | $ | | Shares | | $ |
| 2018 Stock Purchase Plan | | 124,434 |
| | $ | 9.3 |
| | | | | | | | |
| 2017 Stock Purchase Plan | |
|
| |
|
| | — |
| | $ | — |
| |
|
| |
|
|
| 2016 Stock Purchase Plan | |
|
| |
|
| | 85,354 |
| | $ | 6.8 |
| | 91,542 |
| | $ | 7.4 |
|
| 2015 Stock Purchase Plan | |
|
| |
|
| |
|
| |
|
| | 93,600 |
| | $ | 5.2 |
|
As of December 31, 2018,2020, under the terms of the Fourth Amended and Restated Credit Agreement and the 2021 Senior Notes, the Company has limitations on its ability to repurchase shares of its Common Stock, as further discussed in Note 7,6, "Debt."
For the years ended December 31, 2018, 20172020, 2019 and 2016,2018, the Company acquired 25,89022,064 shares, 28,00017,774 shares and 46,00025,890 shares of Common Stock, respectively, at a cost of $1.5$1.2 million, $2.5$1.3 million and $3.8$1.5 million, respectively, for shares surrendered by employees to pay taxes due on vested restricted stock awards and SARs exercised.
NEENAH, INC. AND SUBSIDIARIES
NOTES TO CONSOLIDATED FINANCIAL STATEMENTS (Continued)
(Dollars in millions, except as noted)
Preferred Stock
The Company has authorized 20 million shares of $0.01 par value preferred stock. The preferred stock may be issued in one1 or more series and with such designations and preferences for each series as shall be stated in the resolutions providing for the designation and issue of each such series adopted by the Board of Directors of the Company. The Board of Directors is authorized by the Company's articles of incorporation to determine the voting, dividend, redemption and liquidation preferences pertaining to each such series. NoNaN shares of preferred stock have been issued by the Company.
Other Comprehensive Income (Loss)
Comprehensive income (loss) includes, in addition to net income (loss), gains and losses recorded directly into stockholders' equity on the consolidated balance sheet. These gains and losses are referred to as other comprehensive income (loss) ("OCI") items. AOCI consists of foreign currency translation gains and (losses), deferred gains and (losses) on "available-for-sale" securities, and adjustments related to pensions and other post-retirement benefits.benefits, and, prior to 2018, deferred gains and (losses) on "available-for-sale" securities. The Company does not provide income taxes for foreign currency translation adjustments related to indefinite investments in foreign subsidiaries.
The components of accumulated other comprehensive income (loss), net of applicable income taxes are as follows:
|
| | | | | | | | |
| | | December 31, |
| | | 2018 | | 2017 |
| Net loss from pension and other postretirement benefit liabilities, net of income tax benefits of $29.9 million and $28.8 million, respectively (a) | | $ | (89.6 | ) | | $ | (86.3 | ) |
| Unrealized foreign currency translation losses, net of income tax benefit of $0.3 and $0.4, respectively | | (15.5 | ) | | (7.5 | ) |
| Unrealized loss on "available-for-sale" securities, net of income tax benefit of $0.1 million as of December 31, 2017 (b) | | — |
| | (0.3 | ) |
| AOCI | | $ | (105.1 | ) | | $ | (94.1 | ) |
_________________
(a) In conjunction with the Tax Act, the Company early adopted in the fourth quarter of 2017 ASU 2018-02, Reclassification of Certain Tax Effects From Accumulated Other Comprehensive Income (Topic 740) and accordingly reclassified $10.9 million from AOCI to retained earnings to address the stranded tax effects resulting from the effect of lower tax rates in the Tax Act on items with AOCI.
(b) The Company adopted ASU 2016-01, Financial Instruments-Overall: Recognition and Measurement of Financial Assets and Financial Liabilities as of January 1, 2018. As a result of the adoption, the Company reclassified $0.3 million of unrealized losses (net of $0.1 million income tax effect) on "available-for-sale" securities to beginning retained earnings.
NEENAH, INC. AND SUBSIDIARIES
NOTES TO CONSOLIDATED FINANCIAL STATEMENTS (Continued)
(Dollars in millions, except as noted)
The components of accumulated other comprehensive income (loss), net of applicable income taxes are as follows:
| | | | | | | | | | | | | | |
| | | December 31, |
| | | 2020 | | 2019 |
| Net loss from pension and other postretirement benefit liabilities, net of income tax benefits of $34.2 million and $31.6 million, respectively | | $ | (102.0) | | | $ | (94.3) | |
| Unrealized foreign currency translation losses, net of income tax benefit (expense) of $(0.4) million and $0.3 million, respectively | | (1.7) | | | (19.0) | |
| AOCI | | $ | (103.7) | | | $ | (113.3) | |
The following table presents changes in accumulated other comprehensive income (loss):
| | | | | | | | | | | | | | | | | | | | | | | | | | | | | | | | | | | | | | | | | | | | | | | | | | | | | | | | |
| | | Year Ended December 31, |
| | | 2020 | | 2019 | | 2018 |
| | | Pretax
Amount | | Tax
Effect | | Net
Amount | | Pretax
Amount | | Tax
Effect | | Net
Amount | | Pretax
Amount | | Tax
Effect | | Net
Amount |
| Unrealized foreign currency translation gains (losses) | | $ | 18.0 | | | $ | (0.7) | | | $ | 17.3 | | | $ | (3.5) | | | $ | 0 | | | $ | (3.5) | | | $ | (7.9) | | | $ | (0.1) | | | $ | (8.0) | |
| Adjustment to pension and other benefit liabilities (a) | | (10.3) | | | 2.6 | | | (7.7) | | | (6.4) | | | 1.7 | | | (4.7) | | | (4.4) | | | 1.1 | | | (3.3) | |
| Other comprehensive income (loss) | | $ | 7.7 | | | $ | 1.9 | | | $ | 9.6 | | | $ | (9.9) | | | $ | 1.7 | | | $ | (8.2) | | | $ | (12.3) | | | $ | 1.0 | | | $ | (11.3) | |
|
| | | | | | | | | | | | | | | | | | | | | | | | | | | | | | | | | | | | |
| | | Year Ended December 31, |
| | | 2018 | | 2017 | | 2016 |
| | | Pretax
Amount | | Tax
Effect | | Net
Amount | | Pretax
Amount | | Tax
Effect | | Net
Amount | | Pretax
Amount | | Tax
Effect | | Net
Amount |
| Unrealized foreign currency translation gains (losses) | | $ | (7.9 | ) | | $ | (0.1 | ) | | $ | (8.0 | ) | | $ | 20.0 |
| | $ | — |
| | $ | 20.0 |
| | $ | (7.1 | ) | | $ | 0.4 |
| | $ | (6.7 | ) |
| Adjustment to pension and other benefit liabilities (a) | | (4.4 | ) | | 1.1 |
| | $ | (3.3 | ) | | (13.8 | ) | | 2.9 |
| | (10.9 | ) | | (10.0 | ) | | 3.0 |
| | (7.0 | ) |
| Unrealized loss on "available-for-sale" securities (b) | | — |
| | — |
| | — |
| | (0.4 | ) | | 0.1 |
| | (0.3 | ) | | — |
| | — |
| | — |
|
| Other comprehensive income (loss) | | $ | (12.3 | ) | | $ | 1.0 |
| | $ | (11.3 | ) | | $ | 5.8 |
| | $ | 3.0 |
| | $ | 8.8 |
| | $ | (17.1 | ) | | $ | 3.4 |
| | $ | (13.7 | ) |
For the years ended December 31, 2018, 20172020, 2019 and 2016,2018, the Company reclassified $6.6 million, $6.0 million $5.9 million and $7.2$6.0 million, respectively, of costs from AOCI to otherOther expense, net on the consolidated statements of operations. For the years ended December 31, 2018, 20172020, 2019 and 2016,2018, the Company recognized an income tax benefit of $1.7 million, $1.5 million $2.3 million and $2.8$1.5 million, respectively, related to such reclassifications classified as Provision for income taxes on the consolidated statements of operations.
For the year ended December 31, 2018, 2017,2020, 2019 and 2016,2018, the Company reclassified $0.8costs of $0.3 million, $0.6$1.3 million, and $0.8 million, respectively, of costs from AOCI to the pension and SERP plan settlement chargerelated adjustments on the Consolidated Statements of Operations. For the years ended December 31, 2018, 2017,2020, 2019 and 2016,2018, the Company recognized an income tax benefit of $0.2$0.1 million, $0.2$0.3 million, and $0.2 million, respectively, related to such reclassifications classified as Provisionprovision for income taxes on the consolidated statementsConsolidated Statements of operations.Operations.
NEENAH, INC. AND SUBSIDIARIES
NOTES TO CONSOLIDATED FINANCIAL STATEMENTS (Continued)
(Dollars in millions, except as noted)
Note 11. Commitments10. Leases
Effective January 1, 2019, the Company adopted ASU 2016-02, Leases (Topic 842) using the modified retrospective transition option. The Company also elected the package of transition provisions available for expired or existing contracts, which allowed us to carry forward our historical assessments of (1) whether contracts are or contain leases, (2) lease classification and (3) initial direct costs. The most significant impact was recognition of right-of-use ("ROU") assets of $16 million and lease liabilities of $17 million as of January 1, 2019. The adoption of this standard did not have a significant effect related to existing leases and, as a result, no cumulative-effect adjustment was needed. The Company also completed the implementation of new processes to assist in the ongoing lease data collection and analysis, and updated its accounting policies and internal controls in connection with the adoption of the new standard.
The future minimum obligations underCompany has operating leases havingfor corporate offices, warehouses and certain equipment, with remaining lease terms of up to ten years, some of which include options to extend the leases for up to five years. The Company determines if an arrangement is a noncancelable termlease at inception. Operating leases with terms greater than 12 months are included in excess of"Lease Right-of-Use Assets", "Lease liabilities payable within one year asyear" and "Noncurrent Lease Liabilities" on the Consolidated Balance Sheets. As of December 31, 2017,2020 and 2019, the Company did not have any material finance leases.
Operating lease ROU assets and lease liabilities are recognized based on the present value of the future minimum lease payments over the lease term at commencement date. As most of the Company’s leases do not provide an implicit rate, the Company uses its incremental borrowing rate based on the information available at commencement date in determining the present value of future payments. Lease terms may include options to extend or terminate the lease when it is reasonably certain that the Company will exercise that option. Lease expense for minimum lease payments is recognized on a straight-line basis over the lease term.
The Company’s lease agreements contain lease and non-lease components, which are accounted for as a single lease component. Additionally, for certain equipment leases, the Company applies a portfolio approach to effectively account for the operating lease ROU assets and liabilities.
The components of lease expense were as follows:
| | | | | | | | | | | | | | |
| | | Year Ended December 31, |
| | 2020 | | 2019 |
| Operating lease cost | | $ | 4.0 | | | $ | 3.1 | |
| | | | |
| | | | |
| | | | |
| | | | |
| | | | |
| | | | |
| Short-term lease cost | | $ | 1.3 | | | $ | 1.5 | |
| Variable lease cost (a) | | $ | 1.2 | | | $ | 2.1 | |
|
| | | | |
| 2019 | | $ | 3.0 |
|
| 2020 | | 2.5 |
|
| 2021 | | 2.3 |
|
| 2022 | | 2.1 |
|
| 2023 | | 1.9 |
|
| Thereafter | | 9.6 |
|
| Future minimum lease obligations | | $ | 21.4 |
|
(a)The variable lease costs consist mainly of a warehouse lease where the cost is determined based on the square footage used each month.
For the years ended December 31, 2018, 20172020 and 20162019, the Company paid $4.0 million and $3.1 million, respectively, for amounts included in the measurement of operating lease liabilities. For the years ended December 31, 2020 and 2019, new ROU assets of $9.3 million and $0.4 million, respectively, were obtained in exchange for operating lease liabilities.
NEENAH, INC. AND SUBSIDIARIES
NOTES TO CONSOLIDATED FINANCIAL STATEMENTS (Continued)
(Dollars in millions, except as noted)
As of December 31, 2020, the weighted average remaining lease term and weighted average discount rate for operating leases were 7.6 years and 4.5%, respectively.
Maturities of lease liabilities were as follows:
| | | | | | | | | | |
| Year Ending December 31, | | Operating Leases | | |
| 2021 | | $ | 4.1 | | | |
| 2022 | | 3.8 | | | |
| 2023 | | 3.4 | | | |
| 2024 | | 2.9 | | | |
| 2025 | | 2.5 | | | |
| Thereafter | | 9.4 | | | |
| Total lease payments | | 26.1 | | | |
| Less: Imputed interest | | 4.5 | | | |
| Total lease liabilities | | $ | 21.6 | | | |
Under the previous accounting standard, ASC Topic 840, Leases, the rent expense under operating leases was $7.2 million, $6.8 million and $6.4 million, respectively.
Purchase Commitments
The Company has certain minimum purchase commitments that extend beyond December 31, 2018. Commitments under these contracts are approximately $6.2 million, $0.7 million, $0.2 million, and $0.2 million for the years ended December 31, 2019, 2020, 2021, and 2022 respectively. Such purchase commitments for the year ended December 31, 2019 are primarily for coal and corn starch contracts. Although the Company is primarily liable for payments on the above-mentioned leases and purchase commitments, management believes exposure to losses, if any, under these arrangements is not material.2018 rent was $7.2 million.
NEENAH, INC. AND SUBSIDIARIES
NOTES TO CONSOLIDATED FINANCIAL STATEMENTS (Continued)
(Dollars in millions, except as noted)
Note 12.11. Commitments, Contingencies, and Legal Matters
Litigation
The Company is involved in certain legal actions and claims arising in the ordinary course of business. While the outcome of these legal actions and claims cannot be predicted with certainty, it is the opinion of management that the outcome of any such claim which is pending or threatened, either individually or on a combined basis, will not have a material effect on the consolidated financial condition, results of operations or liquidity of the Company.
Income Taxes
The Company periodically undergoes examination by the Internal Revenue Service (the "IRS") as well as various state and foreign jurisdictions. These tax authorities routinely challenge certain deductions and credits reported by the Company on its income tax returns. No significant tax audit findings are being contested at this time with either the IRS or any state or foreign tax authority.
Environmental, Health and Safety Matters
The Company is subject to federal, state and local laws, regulations and ordinances relating to various environmental, health and safety matters. The Company is in compliance with, or is taking actions designed to ensure compliance with, these laws, regulations and ordinances. However, the nature of the Company's business exposes it to the risk of claims with respect to environmental, health and safety matters, and there can be no assurance that material costs or liabilities will not be incurred in connection with such claims. Except for certain orders issued by environmental, health and safety regulatory agencies, with which management believes the Company is in compliance and which management believes are immaterial to the results of operations of the Company's business, Neenah is not currently named as a party in any judicial or administrative proceeding relating to environmental, health and safety matters.
While the Company has incurred in the past several years, and will continue to incur, capital and operating expenditures in order to comply with environmental, health and safety laws, regulations and ordinances, management believes that the Company's future cost of compliance with environmental, health and safety laws, regulations and ordinances, and its exposure to liability for environmental, health and safety claims will not have a material effect on its financial condition, results of operations or liquidity. However, future events, such as changes in existing laws and regulations or contamination of sites owned, operated or used for waste disposal by the Company (including currently unknown contamination and contamination caused by prior owners and operators of such sites or other waste generators) may give rise to additional costs which could have a material effect on the Company's financial condition, results of operations or liquidity.
The Company incurs capital expenditures necessary to meet legal requirements and otherwise relating to the protection of the environment at its facilities in the United States and internationally. The Company's anticipated capital expenditures for environmental projects are not expected to have a material effect on the Company's financial condition, results of operations or liquidity.
Employees and Labor Relations
As of December 31, 2018,2020, the Company had approximately 2,6412,239 regular full-time employees of whom 1,180906 hourly and 580476 salaried employees were located in the United States and 434509 hourly and 447348 salaried employees were located in Europe. All of the Company's U.S. hourly union employees are represented by the USW. Approximately 50 percent of salaried employees and 80 percent of hourlyUnited Steelworkers Union (the "USW"). Certain employees of Neenah Germany are eligible to be represented by the Mining, Chemicals and Energy Trade Union, Industriegewerkschaft Bergbau, Chemie and Energie (the "IG BCE"). In June 2017, the IG BCE and a national trade association representing all employers in the industry signed a collective bargaining agreement covering union employees of Neenah Germany that expires in February 2019. Under German law union membership is voluntary and does not need to be disclosed to the Company. As a result, the number of employees covered by the collective bargaining agreement with the IG BCE that expires at the end of February 2019 cannot be determined. As of December 31, 2018, 113 employees are covered under collective bargaining agreements that will expire in the next 12 months, not including the employees covered by the collective bargaining arrangement with the IG BCE. In Netherlands, most of our employees are eligible
NEENAH, INC. AND SUBSIDIARIES
NOTES TO CONSOLIDATED FINANCIAL STATEMENTS (Continued)
(Dollars in millions, except as noted)
to be represented by the Christelijke Nationale Vakbond ("CNV") and the Federatie Nederlandse Vakvereniging ("FNV"). Under DutchNetherlands law, the union membership is voluntary and does not need to be disclosed to the Company. The collective bargaining arrangement with CNV and FNV will expire in April 2020.2021. Hourly union employees at the Company's Bolton, England manufacturing facility are represented by Unite the Union ("UNITE"). As of December 31, 2020, 85 employees are covered under collective bargaining agreements that will expire in the next 12 months, not including the employees covered by the collective bargaining arrangements with the CNV and FNV.
The following table shows the status of the Company's bargaining agreements as of December 31, 2018.
NEENAH, INC. AND SUBSIDIARIES
NOTES TO CONSOLIDATED FINANCIAL STATEMENTS (Continued)
(Dollars in millions, except as noted)
|
| | | | | | | | | | | | | | | | | | | |
| Contract Expiration Date | | Location | | Union | | Number of Employees |
February 2019April 2021 | | Neenah GermanyEerbeek, Netherlands | | IG BCECNV, FNV | | (a) |
| November 2021 | | Lowville, NY | | USW | | 85 |
| January 2022 | | Whiting, WI | | USW | | 197 |
May 20192022 | | Appleton, WI | | USW | | 11382 |
April 2020June 2022 | | Eerbeek, NetherlandsNeenah, WI | | CNV, FNVUSW | | (a)183 |
January 2021July 2022 | | Whiting, WIMunising, MI | | USW | | 211173 |
June 2021September 2022 | | Neenah, WIWeidach and Bruckmühl, Germany | | USWIG BCE | | 270 |
July 2021 | | Munising, MI | | USW | | 209 |
November 2021 | | Lowville, NY | | USW | | 105(a) |
_______________________
(a)Under GermanGermany and DutchNetherlands laws, union membership is voluntary and does not need to be disclosed to the Company. As a result, the number of employees covered by the collective bargaining agreement with the IG BCE, and the CNV and FNV cannot be determined.
Purchase Commitments
Note 13. Discontinued Operations
On OctoberThe Company has certain minimum purchase commitments that extend beyond December 31, 2015, the Company sold the Lahnstein Mill to a privately-owned enterprise specializing in equity holdings in German medium-sized companies,2020. Commitments under these contracts are approximately $1.5 million, $0.8 million, $0.2 million, and $0.2 million for net cash proceeds of approximately $5.4 million. The buyer acquired all the assets and liabilities of the Lahnstein Mill, including pension and related liabilities of approximately $21 million. The Lahnstein Mill, which had annual sales of approximately €50 million, had been operating as a stand-alone business, manufacturing non-woven wallcoverings and various other specialty papers. The sale focused the Company's portfolio on targeted growth markets such as filtration, premium fine papers and packaging and other performance materials.
For the years ended December 31, 20182021, 2022, 2023, and 2016, discontinued operations reported2024 respectively. Such purchase commitments for the year ended December 31, 2021 are primarily for utilities and information technology contracts. Although the Company is primarily liable for payments on the consolidated statements of operations includes additionalabove-mentioned purchase commitments, management believes exposure to losses, on sale arising from final adjustmentsif any, under these arrangements is not material.
Note 12. Asset Restructuring and Impairment Costs
In 2020, the Company recorded non-cash asset restructuring and impairment losses, and associated severance costs, totaling $57.8 million. During the three months ended June 30, 2020, due to the transaction price.adverse impacts of COVID-19, the Company recorded restructuring and impairment costs of $55.3 million, of which $52.3 million related to a non-cash impairment loss for long-lived assets used primarily in the Technical Products segment. The other charge of $3.0 million arose from accelerated depreciation due to the idling of assets and related employee termination benefits for a workforce reduction in the Fine Paper and Packaging segment.
The following table presents selected financial information for discontinued operations:pandemic triggered the evaluation of the carrying values of long-lived assets in the Technical Products segment, with the largest impact resulting from changes in the duration of the ramp-up of net sales of the Company's U.S. transportation filtration asset. As a result of the change in forecast of net sales and profitability, the Company determined that indicators of impairment in the carrying value of the property, plant and equipment were present at June 30, 2020. Accordingly, based on the applicable accounting guidance, the Company tested the recoverability of those long-lived assets using undiscounted estimates of the future cash flows from the use of those assets. The recoverability tests indicated that the long-lived assets
|
| | | | | | | | | | | | |
| | | For the Year ended December 31, |
| | | 2018 | | 2017 | | 2016 |
| Loss on sale | | $ | (0.8 | ) | | $ | — |
| | $ | (0.6 | ) |
| Loss before income taxes | | (0.8 | ) | | — |
| | (0.6 | ) |
| Income tax benefit | | — |
| | — |
| | (0.2 | ) |
| Loss from discontinued operations | | $ | (0.8 | ) | | $ | — |
| | $ | (0.4 | ) |
NEENAH, INC. AND SUBSIDIARIES
NOTES TO CONSOLIDATED FINANCIAL STATEMENTS (Continued)
(Dollars in millions, except as noted)
were impaired at June 30, 2020. As a result, the Company determined the fair value of the long-lived assets principally on a probability-weighting of the discounted cash flows expected under multiple operating scenarios, based in part on the Company's current and future evaluation of economic conditions, as well as current and future plans. The Company used a credit-adjusted risk-free rate of 9.5% based on the expected rate of return from the highest and best use of similar assets by a market participant. An impairment charge of $51.0 million was recorded in the Technical Products segment to reduce the carrying value of the assets to their indicated fair values. These fair value calculations are highly subjective and require management to make assumptions and apply judgments to estimates regarding the timing and amount of future cash flows, probabilities related to various cash flow scenarios, and appropriate discount rates based on the perceived risks, among others. While the Company believes its assumptions and judgments about future cash flows are reasonable, future impairment charges may be required if the expected cash flow estimates do not occur or if events change requiring the Company to significantly revise its estimates. Long-lived assets are measured at fair value on a nonrecurring basis using Level 3 inputs.
Note 14. Sale
The Company also tested its indefinite-lived intangible assets (brand names) for impairment using the applicable accounting guidance and as a result recorded an impairment loss of Brattleboro Mill$0.9 million and Impairment Loss$0.4 million in the Fine Paper and Packaging and Technical Products segments, respectively. The Company performed a quantitative analyses of goodwill and other indefinite-lived intangibles, noting that there was 0 impairment as of November 30, 2020.
During the three months ended June 30, 2020, the adverse impacts of COVID-19 led to additional actions taken to consolidate the Company's operational footprint with the idling of a fine paper machine and other smaller assets and reallocating their volume, optimizing and eliminating certain product brands and SKUs and restructuring parts of its workforce. During the three months ended June 30, 2020, the Company recorded accelerated depreciation of $2.6 million related to the idling of the manufacturing assets and $0.4 million of employee termination benefit costs.
During the three months ended December 31, 2020, the Company fully impaired its $2.5 million joint venture investment in India with AIM Filtertech and is in the process of exiting this investment.
In 2019, the second quarterCompany recorded $4.7 million of accelerated depreciation and spare parts inventory reserves related to an idled paper machine in the Fine Paper and Packaging segment.
In 2018, as a result of a broad scope review of various initiatives to improve margins and optimize the portfolio of products and manufacturing footprint in the Fine Paper and Packaging segment, the Company determined that the Brattleboro mill was not a strategic part of the Fine Paper and Packaging manufacturing footprint, given the nature of the office supply category. Historically, the Brattleboro mill has manufactured products primarily for the office supply category, and more recently has been adversely impacted by manufacturing inefficiencies due to changes in input costs, product category, and grade complexity.footprint. Following the review, the Company initiated a process to sell the Brattleboro mill, its business operations and associated research and office facilities ("disposal group"). The contemplated disposal transaction did not constitute a strategic shift in the business that would have a major effect on operations of the Company.
Upon classifying the disposal group as assets held for sale, the Company tested the individual assets of the disposal group for impairment. The disposal group was measured at fair value (a Level 3 measurement, using unobservable estimates), less costs to sell. During the three months ended June 30, 2018, the Company recorded an estimated non-cash impairment loss of $32.0 million. Through the end of third quarter 2018, the Company was in active negotiations with a potential purchaser of the Brattleboro mill and its business operations. In early October 2018, negotiations with this potential purchaser ceased and management assessed its options related to the mill, including closure, while not precluding additional purchase offers for this business.
facilities. On December 31, 2018, the Company completed the sale of the Brattleboro mill to Long Falls Paperboard, LLC for a purchase price of $5.0 million. In conjunction with the sale, the Company adjusted its previous estimate of therecorded an impairment loss toof $31.1 million, of which $24.4 million, $1.1 million and $5.6 million was reported within the Fine Paper and Packaging, Technical Products and Other business segments, respectively.
Subsequent Event
Following the dispositionA summary of the Brattleboro mill which will eliminate a significant portion ofasset restructuring and impairment costs incurred during the products of the Other business segment,years ended December 31, 2020, 2019, and 2018 is as follows:
| | | | | | | | | | | | | | | | | | | | |
| | | For the Year Ended December 31, |
| | | 2020 | | 2019 | | 2018 |
| Impairment losses | | $ | 54.8 | | | $ | 0 | | | $ | 31.1 | |
| Restructuring charges from idled assets | | 2.6 | | | 4.7 | | | 0 | |
| Severance costs | | 0.4 | | | 0 | | | 0 | |
| Total | | $ | 57.8 | | | $ | 4.7 | | | $ | 31.1 | |
NEENAH, INC. AND SUBSIDIARIES
NOTES TO CONSOLIDATED FINANCIAL STATEMENTS (Continued)
(Dollars in January 2019 the Company realigned the remaining products manufactured in the Other business segment to be managedmillions, except as part of the Technical Products business segment. As a result, beginning in the first quarter of 2019, the Company will present the net sales and operating income of this remaining portion of the Other business segment within the Technical Products business segment and will recast the comparable historical information.noted)
Note 15.13. Business Segment and Geographic Information
The Company's reportable operating segments consist of Technical Products, Fine Paper and Packaging and, in 2018 only, Other.
The Technical Products segment is an aggregation of the Company's filtration andCompany’s performance materials and filtration businesses which are similar in terms of economic characteristics, nature of products, processes, customer class and product distribution methods.
The technical products businesssegment is an international producer of fiber-formed, coated and/or saturated specialized media that deliversdeliver high performance benefits to customers. Included in this segment are filtration media ("Filtration"), tape and abrasives backings products, ("Backings"), digital image transfer papers, durable label and other specialty substrate products ("Specialty"Performance Materials"), and filtration media for transportation, water and other end use applications ("Filtration"). During the three months ended March 31, 2020, the Company aggregated the backings and specialties revenues into Performance Materials and recast the prior year period disclosure based on the economic similarity of the products per ASC Topic 280, Segment Reporting, and changes in the internal management of these products.
The following table presents sales by product category for the technical products business:
| | | | | | | | | | | | | | | | | | | | |
| | Year Ended December 31, |
| | | 2020 | | 2019 | | 2018 |
| Filtration | | 46 | % | | 42 | % | | 40 | % |
| Performance Materials | | 54 | % | | 58 | % | | 60 | % |
| Total | | 100 | % | | 100 | % | | 100 | % |
|
| | | | | | | | | |
| | | Year Ended December 31, |
| | | 2018 | | 2017 | | 2016 |
| Filtration | | 41 | % | | 44 | % | | 42 | % |
| Backings | | 28 | % | | 32 | % | | 31 | % |
| Specialty | | 31 | % | | 24 | % | | 27 | % |
| Total | | 100 | % | | 100 | % | | 100 | % |
NEENAH, INC. AND SUBSIDIARIES
NOTES TO CONSOLIDATED FINANCIAL STATEMENTS (Continued)
(DollarsFollowing the disposition of the Brattleboro mill which eliminated a significant portion of the products of the Other business segment, in millions, exceptJanuary 2019 the Company realigned the remaining products manufactured in the Other business segment to be managed as noted)
part of the Technical Products business segment. As a result, the Company recast the comparable 2018 information and presented the $15.6 million of net sales for the year ended December 31, 2018, of this remaining portion of the Other business segment within the Technical Products business segment. The 2018 operating income (loss) of the Other business segment was immaterial and was not recast. The Company also recast the 2018 depreciation and amortization and capital expenditures by segment and presented $0.7 million of depreciation and amortization, and $0.0 million of capital expenditures of this remaining portion of the Other business segment within the Technical Products business segment. The Company presented the net sales for the years ended December 31, 2018 of the remaining portion of the Other business segment into Performance Materials products category in the table above.
The fine paper and packaging business is a leading supplier of premium printing and other high-end specialty papers ("Graphic Imaging"), and premium packaging ("Packaging") and specialty office papers ("Filing/Office") primarily in North America. The following table presents sales by product category for the fine paper and packaging business:
| | | | | | | | | | | | | | | | | | | | |
| | | Year Ended December 31, |
| | | 2020 | | 2019 | | 2018 |
| Graphic Imaging | | 74 | % | | 79 | % | | 78 | % |
| Packaging | | 26 | % | | 21 | % | | 18 | % |
| Filing/Office | | 0 | % | | 0 | % | | 4 | % |
| Total | | 100 | % | | 100 | % | | 100 | % |
|
| | | | | | | | | |
| | | Year Ended December 31, |
| | | 2018 | | 2017 | | 2016 |
| Graphic Imaging | | 78 | % | | 80 | % | | 81 | % |
| Packaging | | 18 | % | | 16 | % | | 14 | % |
| Filing/Office | | 4 | % | | 4 | % | | 5 | % |
| Total | | 100 | % | | 100 | % | | 100 | % |
Each segment employs different technologies and marketing strategies. Disclosure of segment information is on the same basis that management uses internally for evaluating segment performance and allocating resources. Transactions between segments are eliminated in consolidation. The costs of shared services, and other administrative functions managed on a common basis, are allocated to the segments based on usage, where possible, or other factors based on the nature of the
NEENAH, INC. AND SUBSIDIARIES
NOTES TO CONSOLIDATED FINANCIAL STATEMENTS (Continued)
(Dollars in millions, except as noted)
activity. General corporate expenses that do not directly support the operations of the business segments are shown as Unallocated corporate costs. The accounting policies of the reportable operating segments are the same as those described in Note 2, "Summary of Significant Accounting Policies."
Business Segments |
| | | | | | | | | | | | |
| | | Year Ended December 31, |
| | | 2018 | | 2017 | | 2016 |
| Net sales | | |
| | |
| | |
|
| Technical Products | | $ | 567.6 |
| | $ | 502.1 |
| | $ | 466.4 |
|
| Fine Paper and Packaging | | 445.8 |
| | 455.3 |
| | 452.1 |
|
| Other | | 21.5 |
| | 22.5 |
| | 23.0 |
|
| Consolidated | | $ | 1,034.9 |
| | $ | 979.9 |
| | $ | 941.5 |
|
|
| | | | | | | | | | | | |
| | | Year Ended December 31, |
| | | 2018 | | 2017 | | 2016 |
| Operating income (loss) | | |
| | |
| | |
|
| Technical Products (a) | | $ | 50.9 |
| | $ | 55.3 |
| | $ | 65.6 |
|
| Fine Paper and Packaging (b) | | 29.4 |
| | 69.5 |
| | 70.7 |
|
| Other (c) | | (6.4 | ) | | (0.4 | ) | | (1.1 | ) |
| Unallocated corporate costs (d) | | (19.8 | ) | | (20.1 | ) | | (21.1 | ) |
| Consolidated | | $ | 54.1 |
| | $ | 104.3 |
| | $ | 114.1 |
|
| | | | | | | | | | | | | | | | | | | | |
| | | Year Ended December 31, |
| | | 2020 | | 2019 | | 2018 |
| Net sales | | | | | | |
| Technical Products | | $ | 508.9 | | | $ | 541.6 | | | $ | 583.2 | |
| Fine Paper and Packaging | | 283.7 | | | 396.9 | | | 445.8 | |
| Other | | 0 | | | 0 | | | 5.9 | |
| Consolidated | | $ | 792.6 | | | $ | 938.5 | | | $ | 1,034.9 | |
| | | | | | | | | | | | | | | | | | | | |
| | | Year Ended December 31, |
| | | 2020 | | 2019 | | 2018 |
| Operating income (loss) | | | | | | |
| Technical Products (a) | | $ | (4.8) | | | $ | 44.6 | | | $ | 50.9 | |
| Fine Paper and Packaging (b) | | 23.3 | | | 53.2 | | | 29.4 | |
| Other (c) | | 0 | | | 0 | | | (6.4) | |
| Unallocated corporate costs (d) | | (24.6) | | | (19.5) | | | (19.8) | |
| Consolidated | | $ | (6.1) | | | $ | 78.3 | | | $ | 54.1 | |
_______________________
| |
(a) | Operating income for the year ended December 31, 2018 included non-cash impairment loss, restructuring and integration costs, and pension settlement charges of $2.5 million, offset by favorable acquisition adjustments of $3.9 million. |
(a)Operating income for the year ended December 31, 2020 included impairment costs of $54.1 million, other restructuring and non-routine costs of $0.7 million, COVID-19 costs of $1.4 million, and pension settlements of $0.8 million. Operating income for the year ended December 31, 2019 included restructuring and other non-routine costs of $0.3 million and a curtailment gain of $1.5 million related to the Neenah Coldenhove pension plan. Operating income for the year ended December 31, 2018 included non-cash impairment loss, restructuring and integration costs, and pension settlement charges of $2.5 million, offset by favorable acquisition adjustments of $3.9 million.
(b)Operating income for the year ended December 31, 2020 included asset restructuring costs of $3.7 million, other restructuring and non-routine costs of $2.2 million, COVID-19 costs of $1.5 million, and pension settlements of $0.4 million. Operating income for the year ended December 31, 2019 included $5.7 million of non-routine costs, primarily related to idled paper machine costs due to the consolidation of the fine paper manufacturing footprint. Operating income for the year ended December 31, 2018 included non-cash impairment loss, restructuring costs, and pension settlement charges of $24.6 million, offset by favorable insurance settlement of $0.3 million.
(c)Operating income for the year ended December 31, 2018 included non-cash impairment loss, restructuring costs, and a pension settlement charge of $6.0 million, offset by favorable insurance settlement of $0.1 million.
(d)Unallocated corporate costs for the year ended December 31, 2020 included $5.6 million of one-time costs related to restructuring, loss on debt extinguishment, acquisition, SERP settlements and other non-routine charges. Unallocated corporate costs for the year ended December 31, 2019 included costs of $0.3 million, consisting of restructuring and other non-routine costs and a SERP settlement charge. Unallocated corporate costs for the year ended December 31, 2018 included restructuring costs and pension settlement charge of $1.9 million.
NEENAH, INC. AND SUBSIDIARIES
NOTES TO CONSOLIDATED FINANCIAL STATEMENTS (Continued)
(Dollars in millions, except as noted)
| |
(b) | Operating income for the year ended December 31, 2018 included non-cash impairment loss, restructuring costs, and pension settlement charges of $24.6 million, offset by favorable insurance settlement of $0.3 million. Operating income for the year ended December 31, 2017 included a favorable insurance settlement of $2.9 million. Operating income for the year ended December 31, 2016 included integration costs of $1.8 million. |
| |
(c) | Operating income for the year ended December 31, 2018 included non-cash impairment loss, restructuring costs, and a pension settlement charge of $6.0 million, offset by favorable insurance settlement of $0.1 million. Operating income for the year ended December 31, 2017 included a favorable insurance settlement of $0.3 million. Operating income for the years ended December 31, 2016 included integration costs of $1.1 million. |
| |
(d) | Unallocated corporate costs for the year ended December 31, 2018 included restructuring costs and pension settlement charge of $1.9 million. Unallocated corporate costs for the year ended December 31, 2017 included acquisition and integration costs of $1.3 million and $0.6 million from pension plan and SERP settlement costs. December 31, 2016 included $2.7 million of pre-operating costs related to conversion of a fine paper machine to filtration and $0.8 million for a pension plan settlement charge. |
| | | | | | | | | | | | | | | | | | | | |
| | | Year Ended December 31, |
| | | 2020 | | 2019 | | 2018 |
| Depreciation and amortization | | | | | | |
| Technical Products | | $ | 23.7 | | | $ | 24.1 | | | $ | 24.4 | |
| Fine Paper and Packaging | | 10.8 | | | 13.2 | | | 9.9 | |
| Other | | 0 | | | 0 | | | 0.2 | |
| Corporate | | 2.2 | | | 1.6 | | | 1.6 | |
| | | | | | |
| | | | | | |
| Consolidated | | $ | 36.7 | | | $ | 38.9 | | | $ | 36.1 | |
| | | | | | | | | | | | | | | | | | | | |
| | | Year Ended December 31, |
| | | 2020 | | 2019 | | 2018 |
| Capital expenditures | | | | | | |
| Technical Products | | $ | 13.4 | | | $ | 13.1 | | | $ | 28.0 | |
| Fine Paper and Packaging | | 4.6 | | | 7.7 | | | 8.7 | |
| Corporate | | 0.8 | | | 0.6 | | | 1.4 | |
| | | | | | |
| | | | | | |
| Consolidated | | $ | 18.8 | | | $ | 21.4 | | | $ | 38.1 | |
| | | | | | | | | | | | | | |
| | | December 31, |
| | | 2020 | | 2019 |
| Total Assets (a) | | | | |
| Technical Products | | $ | 552.0 | | | $ | 573.8 | |
| Fine Paper and Packaging | | 192.4 | | | 217.7 | |
| Corporate and other (b) | | 62.2 | | | 36.3 | |
| | | | |
| Total | | $ | 806.6 | | | $ | 827.8 | |
_______________________
(a)Segment identifiable assets are those that are directly used in the segments operations.
(b)Corporate assets are primarily deferred income taxes, lease ROU assets, and cash.
Geographic Information | | | | | | | | | | | | | | | | | | | | |
| | | Year Ended December 31, |
| | | 2020 | | 2019 | | 2018 |
| Net sales | | | | | | |
| United States | | $ | 533.1 | | | $ | 673.0 | | | $ | 744.4 | |
| Germany | | 203.9 | | | 196.3 | | | 216.5 | |
| Rest of Europe | | 55.6 | | | 69.2 | | | 74.0 | |
| Consolidated | | $ | 792.6 | | | $ | 938.5 | | | $ | 1,034.9 | |
Net sales are attributed to geographic areas based on the physical location of the selling entities.
|
| | | | | | | | | | | | |
| | | Year Ended December 31, |
| | | 2018 | | 2017 | | 2016 |
| Depreciation and amortization | | |
| | |
| | |
|
| Technical Products | | $ | 23.7 |
| | $ | 19.4 |
| | $ | 18.1 |
|
| Fine Paper and Packaging | | 9.9 |
| | 11.0 |
| | 11.1 |
|
| Other | | 0.9 |
| | 1.2 |
| | 1.3 |
|
| Corporate | | 1.6 |
| | 1.7 |
| | 1.5 |
|
| Consolidated | | $ | 36.1 |
| | $ | 33.3 |
| | $ | 32.0 |
|
|
| | | | | | | | | | | | |
| | | Year Ended December 31, |
| | | 2018 | | 2017 | | 2016 |
| Capital expenditures | | |
| | |
| | |
|
| Technical Products | | $ | 28.0 |
| | $ | 28.6 |
| | $ | 57.9 |
|
| Fine Paper and Packaging | | 8.7 |
| | 12.5 |
| | 7.6 |
|
| Other | | — |
| | 1.1 |
| | 0.3 |
|
| Corporate | | 1.4 |
| | 0.5 |
| | 2.7 |
|
| Consolidated | | $ | 38.1 |
| | $ | 42.7 |
| | $ | 68.5 |
|
NEENAH, INC. AND SUBSIDIARIES
NOTES TO CONSOLIDATED FINANCIAL STATEMENTS (Continued)
(Dollars in millions, except as noted)
| | | | | | | | | | | | | | |
| | | December 31, |
| | | 2020 | | 2019 |
| Long-Lived Assets | | | | |
| United States | | $ | 314.4 | | | $ | 364.2 | |
| Germany | | 160.8 | | | 153.3 | |
| Rest of Europe | | 60.1 | | | 57.6 | |
| Total | | $ | 535.3 | | | $ | 575.1 | |
|
| | | | | | | | |
| | | December 31, |
| | | 2018 | | 2017 |
| Total Assets (a) | | |
| | |
|
| Technical Products | | $ | 586.4 |
| | $ | 613.0 |
|
| Fine Paper and Packaging | | 234.7 |
| | 261.6 |
|
| Corporate and other (b) | | 40.1 |
| | 29.8 |
|
| Total | | 861.2 |
| | 904.4 |
|
_______________________
| |
(a) | Segment identifiable assets are those that are directly used in the segments operations. |
| |
(b) | Corporate assets are primarily cash and income taxes. |
|
| | | | | | | | | | | | |
| | | Year Ended December 31, |
| | | 2018 | | 2017 | | 2016 |
| Net sales | | |
| | |
| | |
|
| United States | | $ | 744.4 |
| | $ | 748.9 |
| | $ | 727.6 |
|
| Germany | | 216.5 |
| | 210.3 |
| | 201.2 |
|
| Rest of Europe | | 74.0 |
| | 20.7 |
| | 12.7 |
|
| Consolidated | | $ | 1,034.9 |
| | $ | 979.9 |
| | $ | 941.5 |
|
Net sales are attributed to geographic areas based on the physical location of the selling entities.
|
| | | | | | | | |
| | | December 31, |
| | | 2018 | | 2017 |
| Long-Lived Assets | | |
| | |
|
| United States | | $ | 366.3 |
| | $ | 393.1 |
|
| Germany | | 157.9 |
| | 164.6 |
|
| Rest of Europe | | 59.1 |
| | 61.5 |
|
| Total | | $ | 583.3 |
| | $ | 619.2 |
|
Long-lived assets consist of property and equipment, lease ROU assets, deferred income taxes, goodwill, intangibles and other assets.
Concentrations
For the years ended December 31, 2020 and 2019, sales to the technical products business' largest customer represented approximately 9 percent and 8 percent of consolidated net sales, respectively, and approximately 15 percent and 14 percent of net sales for the technical products segment, respectively. For the year ended December 31, 2018, there were no customers sales to which constituted over 10 percent of segment net sales for technical products. For the years ended December 31, 2020 and 2019, sales to the largest customer of fine paper and packaging business represented approximately 6 percent and 8 percent of consolidated net sales, respectively, and approximately 18 percent of net sales of the fine paper and packaging business for each of the years. For the year ended December 31, 2018, sales to CNGthe two largest customers of fine paper and Veritivpackaging business represented approximately 7 percent and 5 percent, respectively, of consolidated net sales and approximately 16 percent and 12 percent, respectively, of net sales of the fine paper and packaging business. For the year ended December 31, 2017, sales to Veritiv and CNG each represented approximately 7 percent of consolidated net sales and approximately 15 percent of net sales of the fine paper and packaging business. For the year ended December 31, 2016 sales to Veritiv represented approximately 8 percent of consolidated net sales and approximately 15 percent of net sales of the fine paper and packaging business. Except for certain specialty latex grades and specialty softwood pulp used by Technical Products, management is not aware of any
NEENAH, INC. AND SUBSIDIARIES
NOTES TO CONSOLIDATED FINANCIAL STATEMENTS (Continued)
(Dollars in millions, except as noted)
significant concentration of business transacted with a particular supplier that could, if suddenly eliminated, have a material effect on its operations.
Note 16.14. Supplemental Data
Supplemental Statement of Operations Data
Summary of Advertising and Research and Development Expenses
|
| | | | | | | | | | | | |
| | | Year Ended December 31, |
| | | 2018 | | 2017 | | 2016 |
| Advertising expense (a) | | $ | 4.7 |
| | $ | 6.0 |
| | $ | 6.2 |
|
| Research and development expense | | 9.2 |
| | 8.9 |
| | 9.4 |
|
| | | | | | | | | | | | | | | | | | | | |
| | | Year Ended December 31, |
| | | 2020 | | 2019 | | 2018 |
| Advertising expense (a) | | $ | 3.0 | | | $ | 4.9 | | | $ | 4.7 | |
| Research and development expense (a) | | 7.6 | | | 8.7 | | | 9.2 | |
_______________________
| |
(a) | Advertising expense and research and development expense are recorded in Selling, general and administrative expenses on the consolidated statements of operations. |
(a)Advertising expense and research and development expense are recorded in Selling, general and administrative expenses on the consolidated statements of operations.
Supplemental Balance Sheet Data
Summary of Accounts Receivable — net
|
| | | | | | | | |
| | | December 31, |
| | | 2018 | | 2017 |
| From customers | | $ | 116.1 |
| | $ | 117.0 |
|
| Less allowance for doubtful accounts and sales discounts | | (1.3 | ) | | (1.3 | ) |
| Total | | $ | 114.8 |
| | $ | 115.7 |
|
Summary of Inventories
|
| | | | | | | | |
| | | December 31, |
| | | 2018 | | 2017 |
| Inventories by Major Class: | | |
| | |
|
| Raw materials | | $ | 35.6 |
| | $ | 36.2 |
|
| Work in progress | | 30.1 |
| | 35.0 |
|
| Finished goods | | 78.3 |
| | 79.2 |
|
| Supplies and other | | 3.0 |
| | 3.6 |
|
| | | 147.0 |
| | 154.0 |
|
| Excess of FIFO over LIFO cost | | (15.4 | ) | | (10.5 | ) |
| Total | | $ | 131.6 |
| | $ | 143.5 |
|
NEENAH, INC. AND SUBSIDIARIES
NOTES TO CONSOLIDATED FINANCIAL STATEMENTS (Continued)
(Dollars in millions, except as noted)
Supplemental Balance Sheet Data
Summary of Accounts Receivable, net
| | | | | | | | | | | | | | |
| | | December 31, |
| | | 2020 | | 2019 |
| From customers | | $ | 101.7 | | | $ | 104.1 | |
| Less allowance for doubtful accounts and sales discounts | | (1.5) | | | (1.5) | |
| Total | | $ | 100.2 | | | $ | 102.6 | |
Summary of Inventories
| | | | | | | | | | | | | | |
| | | December 31, |
| | | 2020 | | 2019 |
| Inventories by Major Class: | | | | |
| Raw materials | | $ | 28.9 | | | $ | 32.8 | |
| Work in progress | | 20.1 | | | 26.4 | |
| Finished goods | | 61.0 | | | 67.3 | |
| Supplies and other | | 5.3 | | | 5.2 | |
| | 115.3 | | | 131.7 | |
| Excess of FIFO over LIFO cost | | (6.4) | | | (8.9) | |
| Total | | $ | 108.9 | | | $ | 122.8 | |
The first-in, first-out ("FIFO") value of inventories valued on the LIFO method was $109.1$88.5 million and $120.1$102.2 million at December 31, 20182020 and 2017,2019, respectively. For the yearyears ended December 31, 20182020 and 2017,2019, income from continuing operations before income taxes was reduced by $0.6less than $0.1 million, and $0.5 million, respectively, due to a decrease in certain LIFO inventory quantities.
Summary of Prepaid and Other Current Assets
|
| | | | | | | | |
| | | December 31, |
| | | 2018 | | 2017 |
| Prepaid and other current assets | | $ | 12.2 |
| | $ | 11.3 |
|
| Spare parts | | 6.6 |
| | 6.9 |
|
| Receivable for income taxes | | 2.8 |
| | 3.3 |
|
| Total | | $ | 21.6 |
| | $ | 21.5 |
|
Summary of Property, Plant and Equipment — Net | | | | | | | | | | | | | | |
| | | December 31, |
| | | 2020 | | 2019 |
| Prepaid and other current assets | | $ | 10.6 | | | $ | 9.9 | |
| Spare parts | | 6.4 | | | 6.4 | |
| Receivable for income taxes | | 8.1 | | | 2.0 | |
| Total | | $ | 25.1 | | | $ | 18.3 | |
|
| | | | | | | | |
| | | December 31, |
| | | 2018 | | 2017 |
| Land and land improvements | | $ | 19.0 |
| | $ | 20.2 |
|
| Buildings | | 156.0 |
| | 157.7 |
|
| Machinery and equipment | | 650.3 |
| | 650.8 |
|
| Construction in progress | | 14.9 |
| | 21.8 |
|
| | | 840.2 |
| | 850.5 |
|
| Less accumulated depreciation | | 444.0 |
| | 425.3 |
|
| Net Property, Plant and Equipment | | $ | 396.2 |
| | $ | 425.2 |
|
Depreciation expense for the years ended December 31, 2018, 2017 and 2016 was $32.6 million, $28.3 million and $27.1 million, respectively. Interest expense capitalized as part of the costs of capital projects was $0.2 million, $0.0 million and $0.8 million, respectively, for the years ended December 31, 2018, 2017 and 2016.
Summary of Accrued Expenses |
| | | | | | | | |
| | | December 31, |
| | | 2018 | | 2017 |
| Accrued salaries and employee benefits | | $ | 23.9 |
| | $ | 29.6 |
|
| Amounts due to customers | | 9.6 |
| | 7.2 |
|
| Accrued income taxes | | 5.3 |
| | 4.2 |
|
| Accrued utilities | | 3.9 |
| | 3.7 |
|
| Accrued interest | | 1.2 |
| | 1.3 |
|
| Other | | 11.3 |
| | 11.5 |
|
| Total | | $ | 55.2 |
| | $ | 57.5 |
|
NEENAH, INC. AND SUBSIDIARIES
NOTES TO CONSOLIDATED FINANCIAL STATEMENTS (Continued)
(Dollars in millions, except as noted)
Summary of Property, Plant and Equipment, net
| | | | | | | | | | | | | | |
| | | December 31, |
| | | 2020 | | 2019 |
| Land and land improvements | | $ | 20.5 | | | $ | 19.4 | |
| Buildings | | 160.0 | | | 165.4 | |
| Machinery and equipment | | 614.9 | | | 651.0 | |
| Construction in progress | | 17.4 | | | 14.8 | |
| | 812.8 | | | 850.6 | |
| Less accumulated depreciation | | 483.4 | | | 470.0 | |
| Net Property, Plant and Equipment | | $ | 329.4 | | | $ | 380.6 | |
Depreciation expense for the years ended December 31, 2020, 2019 and 2018 was $31.5 million, $33.9 million and $32.6 million, respectively. Interest expense capitalized as part of the costs of capital projects was $0.3 million, $0.2 million and $0.2 million, respectively, for the years ended December 31, 2020, 2019 and 2018.
Summary of Accrued Expenses | | | | | | | | | | | | | | |
| | | December 31, |
| | | 2020 | | 2019 |
| Accrued salaries and employee benefits | | $ | 34.0 | | | $ | 26.2 | |
| Amounts due to customers | | 8.4 | | | 8.9 | |
| Accrued income taxes | | 5.5 | | | 0.5 | |
| Accrued utilities | | 3.4 | | | 3.0 | |
| Other | | 10.6 | | | 8.4 | |
| Total | | $ | 61.9 | | | $ | 47.0 | |
Summary of Noncurrent Employee Benefits
|
| | | | | | | | |
| | | December 31, |
| | | 2018 | | 2017 |
| Pension benefits | | $ | 54.0 |
| | $ | 59.8 |
|
| Post-employment benefits other than pensions (a) | | 38.9 |
| | 40.5 |
|
| Total | | $ | 92.9 |
| | $ | 100.3 |
|
| | | | | | | | | | | | | | |
| | | December 31, |
| | | 2020 | | 2019 |
| Pension benefits | | $ | 62.0 | | | $ | 57.1 | |
| Post-employment benefits other than pensions (a) | | 34.8 | | | 36.0 | |
| Total | | $ | 96.8 | | | $ | 93.1 | |
_______________________
| |
(a) | Includes $1.7 million of SRCP benefits and $0.2 million of other long-term liabilities as of December 31, 2018 and $1.8 million of SRCP benefits as of December 31, 2017. |
(a)Post-employment benefits other than pensions included $0.8 million of SRCP benefits and $0.2 million of other long-term benefits as of December 31, 2020. As of December 31, 2019, $1.7 million of SRCP benefits and $0.2 million of other long-term benefits were included.
Supplemental Cash Flow Data
Supplemental Disclosure of Cash Flow Information
|
| | | | | | | | | | | | |
| | | Year Ended December 31, |
| | | 2018 | | 2017 | | 2016 |
| Cash paid during the year for interest, net of interest expense capitalized | | $ | 11.9 |
| | $ | 11.3 |
| | $ | 10.0 |
|
| Cash paid during the year for income taxes, net of refunds | | 7.6 |
| | 7.6 |
| | 15.0 |
|
| Non-cash investing activities: | | |
| | |
| | |
|
| Liability for equipment acquired | | 3.4 |
| | 5.4 |
| | 11.1 |
|
Net Cash Provided by (Used in) Changes in Operating Working Capital, Net of Effect of Acquisitions
|
| | | | | | | | | | | | |
| | | Year Ended December 31, |
| | | 2018 | | 2017 | | 2016 |
| Accounts receivable | | $ | (0.9 | ) | | $ | (10.2 | ) | | $ | 1.5 |
|
| Inventories | | 3.8 |
| | (11.7 | ) | | 4.3 |
|
| Income taxes receivable/payable | | (1.8 | ) | | 4.5 |
| | (1.5 | ) |
| Prepaid and other current assets | | (1.8 | ) | | (0.4 | ) | | — |
|
| Accounts payable | | 0.3 |
| | 10.6 |
| | (2.7 | ) |
| Accrued expenses | | (0.6 | ) | | (4.2 | ) | | (2.8 | ) |
| Other | | — |
| | (0.4 | ) | | — |
|
| Total | | $ | (1.0 | ) | | $ | (11.8 | ) | | $ | (1.2 | ) |
NEENAH, INC. AND SUBSIDIARIES
NOTES TO CONSOLIDATED FINANCIAL STATEMENTS (Continued)
(Dollars in millions, except as noted)
Note 17. Unaudited QuarterlySupplemental Cash Flow Data
Supplemental Disclosure of Cash Flow Information
| | | | | | | | | | | | | | | | | | | | |
| | | Year Ended December 31, |
| | | 2020 | | 2019 | | 2018 |
| Cash paid during the year for interest, net of interest expense capitalized | | $ | 12.3 | | | $ | 10.9 | | | $ | 11.9 | |
| Cash paid during the year for income taxes, net of refunds | | 3.6 | | | 13.3 | | | 7.6 | |
| Non-cash investing activities: | | | | | | |
| Liability for equipment acquired | | 3.3 | | | 3.2 | | | 3.4 | |
Net Cash Provided by (Used in) Changes in Operating Working Capital, Net of Effect of Acquisitions
| | | | | | | | | | | | | | | | | | | | |
| | | Year Ended December 31, |
| | | 2020 | | 2019 | | 2018 |
| Accounts receivable | | $ | 4.5 | | | $ | 11.6 | | | $ | (0.9) | |
| Inventories | | 15.7 | | | 8.2 | | | 3.8 | |
| Income taxes receivable/payable | | (1.4) | | | (5.4) | | | (1.8) | |
| Prepaid and other current assets | | (0.2) | | | 2.4 | | | (1.8) | |
| Accounts payable | | (3.6) | | | (14.0) | | | 0.3 | |
| Accrued expenses | | 3.2 | | | (3.4) | | | (0.6) | |
| | | | | | |
| Total | | $ | 18.2 | | | $ | (0.6) | | | $ | (1.0) | |
|
| | | | | | | | | | | | | | | | | | | | |
| | | 2018 Quarters |
| | | First (a) | | Second (b) | | Third (c) | | Fourth (d) | | Year |
| Net Sales | | $ | 266.5 |
| | $ | 271.3 |
| | $ | 256.2 |
| | $ | 240.9 |
| | $ | 1,034.9 |
|
| Gross Profit | | 52.4 |
| | 55.1 |
| | 41.3 |
| | 34.6 |
| | 183.4 |
|
| Operating Income (Loss) | | 24.1 |
| | (4.3 | ) | | 16.5 |
| | 17.8 |
| | 54.1 |
|
| Income (Loss) From Continuing Operations | | 16.2 |
| | (4.8 | ) | | 12.9 |
| | 12.9 |
| | 37.2 |
|
| Earnings (Loss) Per Common Share From Continuing Operations: | | |
| | |
| | |
| | | | |
|
| Basic | | $ | 0.96 |
| | $ | (0.29 | ) | | $ | 0.76 |
| | $ | 0.77 |
| | $ | 2.20 |
|
| Diluted | | $ | 0.95 |
| | $ | (0.29 | ) | | $ | 0.75 |
| | $ | 0.76 |
| | $ | 2.17 |
|
F-54
_______________________
| |
(a) | Income from continuing operations includes an unfavorable prior year tax adjustment of $0.9 million related to one-time taxes on foreign earnings under the Tax Act and an after-tax SERP settlement charge of $0.6 million. |
| |
(b) | Operating loss includes an impairment loss of $32.0 million, pension settlement charges of $1.0 million and integration and restructuring charges of $0.3 million. |
| |
(c) | Operating income includes a favorable acquisition-related adjustment of $3.1 million, a favorable insurance settlement of $0.4 million, and unfavorable adjustments to the impairment loss of $2.0 million and $2.2 million of integration and restructuring charges. |
| |
(d) | Operating income includes favorable adjustments to the impairment loss of $2.9 million and $0.4 million to integration and restructuring costs and a favorable acquisition-related adjustment of $0.8 million. Income from continuing operations includes a favorable tax adjustment related to a Netherlands tax rate change of $0.7 million. |
|
| | | | | | | | | | | | | | | | | | | | |
| | | 2017 Quarters |
| | | First | | Second (e) | | Third (f) | | Fourth (g) | | Year |
| Net Sales | | $ | 242.1 |
| | $ | 248.7 |
| | $ | 245.1 |
| | $ | 244.0 |
| | $ | 979.9 |
|
| Gross Profit | | 52.7 |
| | 54.1 |
| | 48.4 |
| | 45.0 |
| | 200.2 |
|
| Operating Income | | 27.0 |
| | 29.2 |
| | 29.0 |
| | 19.1 |
| | 104.3 |
|
| Income From Continuing Operations | | 17.6 |
| | 25.0 |
| | 18.8 |
| | 18.9 |
| | 80.3 |
|
| Earnings Per Common Share From Continuing Operations: | | |
| | |
| | |
| | |
| | |
|
| Basic | | $ | 1.04 |
| | $ | 1.47 |
| | $ | 1.11 |
| | $ | 1.11 |
| | $ | 4.74 |
|
| Diluted | | $ | 1.03 |
| | $ | 1.46 |
| | $ | 1.10 |
| | $ | 1.10 |
| | $ | 4.68 |
|
_______________________
| |
(e) | Income from continuing operations includes a prior year tax adjustment of $4.1 million related to the Company's assertion of indefinite reinvestment of undistributed earnings of foreign subsidiaries. |
| |
(f) | Operating income includes proceeds of a representations and warranties insurance settlement related to the FiberMark acquisition of $3.2 million, less acquisition costs of $0.9 million. |
| |
(g) | Includes acquisition/integration costs of $0.4 million and pension/SERP settlement charges of $0.6 million. Also, income from continuing operations includes net tax benefits of $5.9 million, primarily from the Tax Act. |
SCHEDULE II
NEENAH, INC. AND SUBSIDIARIES
SCHEDULE OF VALUATION AND QUALIFYING ACCOUNTS
(Dollars in millions)
| | | | | | | | | | | | | | | | | | | | | | | | | | | | | | | | |
| Description | | Balance at
Beginning
of Period | | Charged to
Costs and
Expenses | | Charged
to Other
Accounts | | Write-offs
and
Reclassifications | | Balance at
End of Period |
| December 31, 2020 | | | | | | | | | | |
| Allowances deducted from assets to which they apply | | | | | | | | | | |
| Allowance for doubtful accounts receivable | | $ | 1.0 | | | $ | 0.5 | | | $ | 0 | | | $ | (0.4) | | | $ | 1.1 | |
| Allowance for sales discounts | | 0.4 | | | (0.1) | | | 0 | | | 0 | | | 0.3 | |
| Valuation allowance for deferred income tax assets | | 5.8 | | | 4.6 | | | 0 | | | 0 | | | 10.4 | |
| | | | | | | | | | |
| December 31, 2019 | | | | | | | | | | |
| Allowances deducted from assets to which they apply | | | | | | | | | | |
| Allowance for doubtful accounts receivable | | $ | 0.8 | | | $ | 0.5 | | | $ | 0 | | | $ | (0.3) | | | $ | 1.0 | |
| Allowance for sales discounts | | 0.5 | | | 0 | | | (0.1) | | | 0 | | | 0.4 | |
| Valuation allowance for deferred income tax assets | | 2.7 | | | 0 | | | 3.1 | | | 0 | | | 5.8 | |
| | | | | | | | | | |
| December 31, 2018 | | | | | | | | | | |
| Allowances deducted from assets to which they apply | | | | | | | | | | |
| Allowance for doubtful accounts receivable | | $ | 0.8 | | | $ | 0.1 | | | $ | 0 | | | $ | (0.1) | | | $ | 0.8 | |
| Allowance for sales discounts | | 0.5 | | | 0 | | | 0 | | | 0 | | | 0.5 | |
| Valuation allowance for deferred income tax assets | | 0.4 | | | 0.1 | | | 2.2 | | | 0 | | | 2.7 | |
| | | | | | | | | | |
|
| | | | | | | | | | | | | | | | | | | | |
| Description | | Balance at Beginning of Period | | Charged to Costs and Expenses | | Charged to Other Accounts | | Write-offs and Reclassifications | | Balance at End of Period |
| December 31, 2018 | | |
| | |
| | |
| | |
| | |
|
| Allowances deducted from assets to which they apply | | |
| | |
| | |
| | |
| | |
|
| Allowance for doubtful accounts | | $ | 0.8 |
| | $ | 0.1 |
| | $ | — |
| | $ | (0.1 | ) | | $ | 0.8 |
|
| Allowance for sales discounts | | 0.5 |
| | — |
| | — |
| | — |
| | 0.5 |
|
| Valuation allowance — deferred income taxes | | 0.4 |
| | 0.1 |
| | 2.2 |
| | — |
| | 2.7 |
|
| | | | | | | | | | | |
| December 31, 2017 | | |
| | |
| | |
| | |
| | |
|
| Allowances deducted from assets to which they apply | | |
| | |
| | |
| | |
| | |
|
| Allowance for doubtful accounts | | $ | 1.0 |
| | $ | 0.2 |
| | $ | — |
| | $ | (0.4 | ) | | $ | 0.8 |
|
| Allowance for sales discounts | | 0.5 |
| | — |
| | — |
| | — |
| | 0.5 |
|
| Valuation allowance — deferred income taxes | | 3.5 |
| | — |
| | — |
| | (3.1 | ) | | 0.4 |
|
| | | | | | | | | | | |
| December 31, 2016 | | |
| | |
| | |
| | |
| | |
|
| Allowances deducted from assets to which they apply | | |
| | |
| | |
| | |
| | |
|
| Allowance for doubtful accounts | | $ | 1.1 |
| | $ | (0.1 | ) | | $ | — |
| | $ | — |
| | $ | 1.0 |
|
| Allowance for sales discounts | | 0.6 |
| | (0.1 | ) | | — |
| | — |
| | 0.5 |
|
| Valuation allowance — deferred income taxes | | 3.0 |
| | 0.1 |
| | — |
| | 0.4 |
| | 3.5 |
|