| ANNUAL REPORT PURSUANT TO SECTION 13 OR 15(d) | |
| OF THE SECURITIES EXCHANGE ACT OF 1934. |
| Spirit Realty Capital, Inc. | Maryland | 20-1676382 | ||
| Spirit Realty, L.P. | Delaware | 20-1127940 | ||
(State or other jurisdiction of incorporation or organization) | (I.R.S. Employer Identification Number) | |||
| (972) 476-1900 | ||||
| (Address of principal executive offices; zip code) | (Registrant’s telephone number, including area code) | |||
| Title of each class: | Name of exchange on which registered: | |||
| Spirit Realty Capital, Inc. | Common Stock, $0.01 par value | New York Stock Exchange | ||
| Spirit Realty, L.P. | None | None | ||
| Spirit Realty Capital, Inc. | None | |
| Spirit Realty, L.P. | None | |
| Large accelerated filer | x | Accelerated filer | o | ||||
| Non-accelerated filer | o | Smaller reporting company | o | ||||
| Large accelerated filer | o | Accelerated filer | x | Non-accelerated filer | o | Smaller reporting company | o |
| PART I | ||
| Item 1. | Business | |
| Item 1A. | Risk Factors | |
| Item 1B. | Unresolved Staff Comments | |
| Item 2. | Properties | |
| Item 3. | Legal Proceedings | |
| Item 4. | Mine Safety Disclosure | |
| PART II | ||
| Item 5. | Market for Registrant’s Common Equity, Related Stockholder Matters and Issuer Purchases of Equity Securities | |
| Item 6. | Selected Financial Data | |
| Item 7. | Management’s Discussion and Analysis of Financial Condition and Results of Operations | |
| Item 7A. | Quantitative and Qualitative Disclosures About Market Risk | |
| Item 8. | Financial Statements and Supplementary Data | |
| Item 9. | Changes in and Disagreements with Accountants on Accounting and Financial Disclosure | |
| Item 9A. | Controls and Procedures, As Restated | |
| Item 9B. | Other Information | |
| PART III | ||
| Item 10. | Directors, Executive Officers and Corporate Governance | |
| Item 11. | Executive Compensation | |
| Item 12. | Security Ownership of Certain Beneficial Owners and Management and Related Stockholder Matters | |
| Item 13. | Certain Relationships and Related Transactions, and Director Independence | |
| Item 14. | Principal Accountant Fees and Services | |
| PART IV | ||
| Item 15. | Exhibits, Financial Statement Schedules | |
| SIGNATURES | ||
| Definitions: | |
| 1031 Exchange | Tax-deferred like-kind exchange of properties held for business or investment purposes, pursuant to Section 1031 of the Code |
| 2013 Credit Facility | $400.0 million secured credit facility pursuant to the credit agreement between the Operating Partnership and certain lenders dated July 17, 2013 |
| 2015 Credit Facility | $800.0 million unsecured credit facility pursuant to the Credit Agreement |
| 2019 Notes | $402.5 million convertible notes of the Corporation due in 2019 |
| 2021 Notes | $345.0 million convertible notes of the Corporation due in 2021 |
| 401(k) Plan | Defined contribution retirement savings plan qualified under Section 401(k) of the Code |
| ACM | Asbestos-Containing Materials |
| ADA | Americans with Disabilities Act |
| Additional Collateral Deposit | A cash reserve deposit or letter of credit in the amount of $8.0 million required pursuant to an amendment of a certain CMBS loan agreement |
| AFFO | Adjusted Funds From Operations |
| Amended Incentive Award Plan | Amended and Restated Spirit Realty Capital, Inc. and Spirit Realty, L.P. 2012 Incentive Award Plan |
| AOCL | Accumulated Other Comprehensive Loss |
| ASC | Accounting Standards Codification |
| ASU | Accounting Standards Update |
| ATM Program | At the Market equity distribution program, pursuant to which the Corporation may offer and sell registered shares of common stock from time to time |
| CMBS | Commercial Mortgage Backed Securities |
| Code | Internal Revenue Code of 1986, as amended |
| Cole II | Cole Credit Property Trust II, Inc. |
| Cole II Merger | Acquisition on July 17, 2013 of Cole II by the Company, in which the Company merged with and into the Cole II legal entity |
| Collateral Pools | Pools of collateral assets that are pledged to the indenture trustee for the benefit of the noteholders and secure obligations of issuers under the Spirit Master Funding Program |
| Company | The Corporation and its consolidated subsidiaries |
| Convertible Notes | The 2019 Notes and 2021 Notes, together |
| Corporation | Spirit Realty Capital, Inc., a Maryland corporation |
| CPI | Consumer Price Index |
| Credit Agreement | 2015 credit facility agreement between the Operating Partnership and certain lenders dated March 31, 2015, as amended or otherwise modified from time to time |
| EBITDA | Earnings Before Interest, Taxes, Depreciation and Amortization |
| EBITDAR | Earnings Before Interest, Taxes, Depreciation, Amortization and Rent |
| EDF | Expected Default Frequency |
| Excess Cash | Rent received in excess of debt service obligations |
| Exchange Act | Securities Exchange Act of 1934, as amended |
| FASB | Financial Accounting Standards Board |
| FFO | Funds From Operations |
| Fitch | Fitch Ratings |
| GAAP | Generally Accepted Accounting Principles in the United States |
| IASB | International Accounting Standards Board |
| IFRS | International Financial Reporting Standards |
| IPO | Initial Public Offering |
| Definitions: | |
| IRS | Internal Revenue Service |
| LIBOR | London Interbank Offered Rate |
| Line of Credit | $40.0 million secured revolving credit facility pursuant to the loan agreement between an indirect wholly-owned subsidiary of the Corporation and a certain lender dated March 27, 2013, as amended |
| Master Trust 2013 | The net-lease mortgage securitization trust established in 2013 under the Spirit Master Funding Program |
| Master Trust 2014 | The net-lease mortgage securitization trust established in 2005 and amended and restated in 2014 under the Spirit Master Funding Program |
| Master Trust Exchange Costs | Legal, accounting and financial advisory services costs incurred in connection with the Exchange Offer |
| Master Trust Notes | The Master Trust 2013 and Master Trust 2014, together |
| Master Trust Release | Proceeds from the sale of assets securing the Master Trust Notes held in restricted accounts until a qualifying substitution is made |
| Merger | The transaction in which the Corporation's prior legal entity merged into the Cole II legal entity |
| Merger Exchange Ratio | Merger exchange ratio of 1.9048 |
| MGCL | Maryland General Corporation Law |
| Moody's | Moody's Investor Services |
| NAREIT | National Association of Real Estate Investment Trusts |
| Normalized Rental Revenue | Total rental revenues and earned income from direct financing leases from our owned properties during the final month of the reporting period, adjusted to exclude amounts from properties sold during that period and to include a full month of rental revenues for properties acquired during that period. |
| NYSE | New York Stock Exchange |
| OP Holdings | Spirit General OP Holdings, LLC |
| Operating Partnership | Spirit Realty, L.P., a Delaware limited partnership |
| PATH Act | Protecting Americans from Tax Hikes Act of 2015 |
| REIT | Real Estate Investment Trust |
| Revolving Credit Facilities | The 2013 Credit Facility, the 2015 Credit Facility and Line of Credit, together |
| S&P | Standard & Poor's Rating Services |
| SEC | Securities and Exchange Commission |
| Securities Act | Securities Act of 1933, as amended |
| Senior Unsecured Notes | $300 million aggregate principal amount of senior notes issued in August 2016 |
| Shopko | Specialty Retail Shops Holding Corp. and certain of its affiliates |
| Spirit Master Funding Program | The Company's asset-backed securitization program that comprises Master Trust 2013 and Master Trust 2014 |
| Term Loan | $420.0 million senior unsecured term facility pursuant to the Term Loan Agreement |
| Term Loan Agreement | Term loan agreement between the Operating Partnership and certain lenders dated November 3, 2015, as amended or otherwise modified from time to time |
| Total Debt | Principal debt outstanding before discounts, premiums or deferred financing costs |
| TRS | Taxable REIT Subsidiaries |
| TSR | Total Shareholder Return |
| U.S. | United States |

| ◦ | Leases for Operationally Essential Real Estate with Relatively Long Terms. We seek to own properties that are operationally essential to our tenants, thereby reducing the risk that the tenant would choose not to renew an expiring lease or reject a lease in bankruptcy. In addition, we seek to enter into leases with relatively long terms, typically with non-cancelable initial terms of 15 to 20 years and tenant renewal options for additional terms with attractive rent escalation provisions. |
| ◦ |
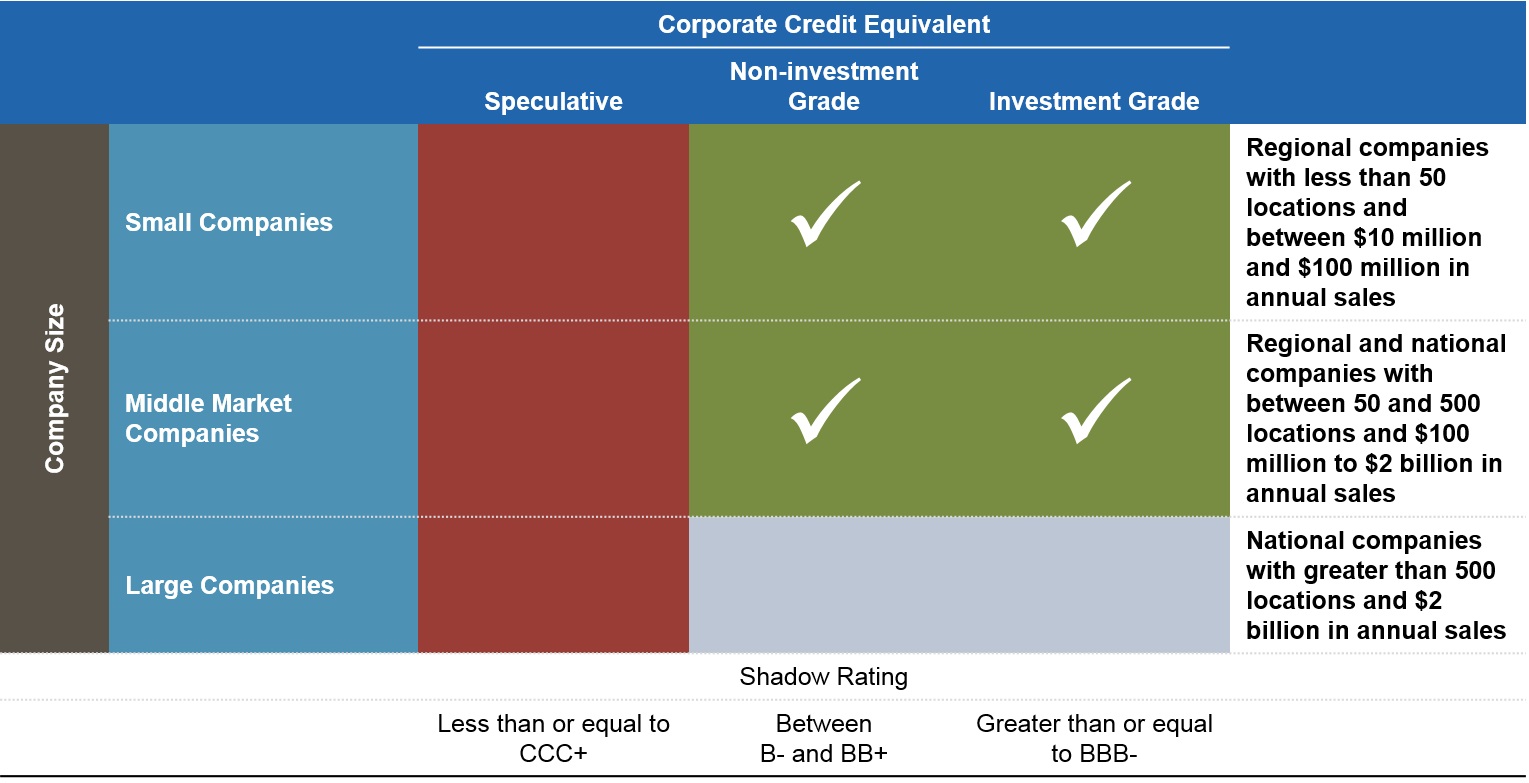
| ◦ | Active Management and Monitoring of Risks Related to Our Investments. When monitoring existing investments or evaluating new investments, we typically consider two broad categories of risk: (1) tenant financial distress risk; and (2) lease renewal risk. We seek to measure these risks through various processes, including the use of a credit modeling product that we license from Moody’s Analytics that estimates the performance of the leased properties relative to rental payments due under the leases and a review of current market data and our historical recovery rates on re-leased properties and property dispositions. Our underwriting and risk management processes are designed to structure new investments |
| ◦ | Portfolio Diversification. We monitor and manage the diversification of our real estate investment portfolio in order to reduce the risks associated with adverse developments affecting a particular tenant, property, industry or region. Our strategy emphasizes a portfolio that (1) derives no more than 10% of its annual rent from any single tenant |
Tenant (2) | Number of Properties | Total Square Footage (in thousands) | Percent of Total Revenue (1) | ||||||
| Specialty Retail Shops Holding Corp. (Shopko) | 181 | 13,502 | 14.0 | % | |||||
| Walgreen Company | 67 | 969 | 3.7 | ||||||
| 84 Properties, LLC | 109 | 4,118 | 3.1 | ||||||
| Cajun Global, LLC (Church's Chicken) | 201 | 257 | 2.3 | ||||||
| Academy Sports + Outdoors | 8 | 1,852 | 2.0 | ||||||
| Alimentation Couche-Tard, Inc. (Circle K) | 83 | 251 | 2.0 | ||||||
| CVS Caremark | 37 | 413 | 1.6 | ||||||
| CarMax, Inc. | 9 | 368 | 1.4 | ||||||
| Carmike Cinemas, Inc. | 13 | 625 | 1.3 | ||||||
| Rite Aid Corp | 30 | 357 | 1.3 | ||||||
| Other | 1,626 | 34,249 | 67.3 | ||||||
| Total | 2,364 | 56,961 | 100.0 | % | |||||
(1) Total revenue for the quarter ended December 31, 2014. | |||||||||
(2) Tenants represent legal entities ultimately responsible for obligations under the lease agreements. Other tenants may operate certain of the same business concepts or brands set forth above, but represent distinct tenant credits. | |||||||||
Tenant (1) | Number of Properties | Total Square Feet (in thousands) | Percent of Normalized Rental Revenue | |||||
| Shopko | 116 | 7,798 | 8.2 | % | ||||
| Walgreen Company | 49 | 722 | 2.7 | |||||
| AMC Entertainment, Inc. | 17 | 862 | 2.3 | |||||
| Cajun Global, LLC | 192 | 271 | 2.2 | |||||
| AB Acquisition, LLC | 23 | 1,030 | 2.1 | |||||
| Alimentation Couche-Tard, Inc. | 83 | 250 | 1.9 | |||||
| Academy, LTD | 6 | 2,769 | 1.9 | |||||
| Regal Entertainment Group | 15 | 656 | 1.5 | |||||
| GPM Investments, LLC | 105 | 272 | 1.5 | |||||
| CVS Caremark Corporation | 36 | 405 | 1.5 | |||||
| Other | 1,853 | 35,823 | 74.2 | |||||
| Vacant | 46 | 2,029 | — | |||||
| Total | 2,541 | 52,887 | 100.0 | % | ||||
| Industry | Number of Properties | Total Square Footage (in thousands) | Percent of Total Rent (1) | Number of Properties | Total Square Feet (in thousands) | Percent of Normalized Rental Revenue | ||||||||||||
| General Merchandise | 228 | 14,841 | 15.9 | % | 156 | 9,224 | 9.9 | % | ||||||||||
| Restaurants - Casual Dining | 389 | 2,505 | 9.8 | 339 | 2,041 | 8.9 | ||||||||||||
| Restaurants - Quick Service | 546 | 1,473 | 7.5 | 588 | 1,359 | 8.1 | ||||||||||||
| Movie Theaters | 60 | 3,012 | 7.4 | |||||||||||||||
| Convenience Stores | 347 | 1,100 | 7.0 | |||||||||||||||
| Grocery | 66 | 3,127 | 6.2 | |||||||||||||||
| Drug Stores / Pharmacies | 134 | 1,739 | 6.8 | 111 | 1,560 | 5.3 | ||||||||||||
| Convenience Stores / Car Washes | 210 | 743 | 6.5 | |||||||||||||||
| Medical / Other Office | 122 | 1,293 | 4.8 | |||||||||||||||
| Sporting Goods | 29 | 4,209 | 4.2 | |||||||||||||||
| Health and Fitness | 45 | 1,800 | 4.0 | |||||||||||||||
| Automotive Parts and Service | 185 | 1,338 | 3.7 | |||||||||||||||
| Entertainment | 23 | 1,129 | 2.9 | |||||||||||||||
| Home Furnishings | 33 | 2,305 | 2.8 | |||||||||||||||
| Education | 54 | 821 | 2.6 | |||||||||||||||
| Building Materials | 177 | 5,750 | 5.6 | 64 | 2,291 | 2.5 | ||||||||||||
| Movie Theatres | 44 | 2,178 | 5.1 | |||||||||||||||
| Medical / Other Office | 98 | 1,071 | 3.9 | |||||||||||||||
| Apparel | 13 | 2,321 | 2.5 | |||||||||||||||
| Specialty Retail | 30 | 1,630 | 2.4 | |||||||||||||||
| Automotive Dealers | 23 | 665 | 2.3 | |||||||||||||||
| Home Improvement | 13 | 1,656 | 2.0 | |||||||||||||||
| Distribution | 17 | 4,077 | 3.8 | 13 | 1,372 | 1.9 | ||||||||||||
| Automotive Parts & Service | 151 | 1,280 | 3.2 | |||||||||||||||
| Grocery | 49 | 1,846 | 3.1 | |||||||||||||||
| Apparel | 11 | 2,261 | 2.9 | |||||||||||||||
| Home Furnishings | 31 | 1,922 | 2.6 | |||||||||||||||
| Health & Fitness | 24 | 933 | 2.5 | |||||||||||||||
| Education | 41 | 1,054 | 2.4 | |||||||||||||||
| Home Improvement | 10 | 1,492 | 2.3 | |||||||||||||||
| Sporting Goods | 23 | 1,223 | 2.3 | |||||||||||||||
| Automotive Dealers | 22 | 657 | 2.3 | |||||||||||||||
| Entertainment | 10 | 661 | 1.9 | |||||||||||||||
| Car Washes | 37 | 217 | 1.6 | |||||||||||||||
| Manufacturing | 27 | 4,094 | 1.7 | 19 | 2,662 | 1.4 | ||||||||||||
| Specialty Retail | 23 | 870 | 1.7 | |||||||||||||||
| Dollar Stores | 83 | 859 | 1.3 | |||||||||||||||
| Consumer Electronics | 16 | 1,270 | 1.5 | 10 | 529 | 1.1 | ||||||||||||
| Pet Supplies & Service | 5 | 1,126 | 1.0 | |||||||||||||||
| Pet Supplies and Service | 4 | 1,016 | * | |||||||||||||||
| Wholesale Clubs | 4 | 393 | * | |||||||||||||||
| Office Supplies | 20 | 546 | 1.0 | 17 | 400 | * | ||||||||||||
| Financial Services | 4 | 422 | * | 4 | 372 | * | ||||||||||||
| Wholesale Clubs | 3 | 355 | * | |||||||||||||||
| Dollar Stores | 41 | 449 | * | |||||||||||||||
| Other | 10 | 123 | * | 3 | 157 | * | ||||||||||||
| Vacant | 46 | 2,029 | — | |||||||||||||||
| Total | 2,364 | 56,961 | 100.0 | % | 2,541 | 52,887 | 100.0 | % | ||||||||||
| * Less than 1% | ||||||||||||||||||
(1) Total rental revenue for the month ended December 31, 2014 for properties owned at December 31, 2014. | ||||||||||||||||||
| Asset Type | Number of Properties | Total Square Footage (in thousands) | Percent of Total Rent (1) | Number of Properties | Total Square Feet (in thousands) | Percent of Normalized Rental Revenue | |||||||||||
| Retail | 2,170 | 43,426 | 85.7 | % | 2,345 | 39,553 | 86.0 | % | |||||||||
| Industrial | 80 | 11,376 | 8.2 | 73 | 11,069 | 8.0 | |||||||||||
| Office | 114 | 2,159 | 6.1 | 123 | 2,265 | 6.0 | |||||||||||
| Total | 2,364 | 56,961 | 100.0 | % | 2,541 | 52,887 | 100.0 | % | |||||||||
(1) Total rental revenue for the month ended December 31, 2014 for properties owned at December 31, 2014. | |||||||||||||||||
| Location | Number of Properties | Total Square Footage (in thousands) | Percent of Total Rent (1) | Number of Properties | Total Square Feet (in thousands) | Percent of Normalized Rental Revenue | ||||||||||||
| Texas | 270 | 6,101 | 12.0 | % | 313 | 6,475 | 12.5 | % | ||||||||||
| Georgia | 187 | 3,378 | 6.3 | |||||||||||||||
| Illinois | 126 | 3,694 | 6.7 | 118 | 3,626 | 5.8 | ||||||||||||
| Florida | 151 | 1,439 | 5.3 | |||||||||||||||
| California | 59 | 1,483 | 5.2 | |||||||||||||||
| Ohio | 129 | 2,417 | 4.6 | |||||||||||||||
| Wisconsin | 63 | 5,047 | 5.5 | 52 | 3,464 | 4.1 | ||||||||||||
| Georgia | 167 | 1,944 | 4.9 | |||||||||||||||
| Florida | 136 | 2,195 | 4.9 | |||||||||||||||
| Ohio | 127 | 2,144 | 4.3 | |||||||||||||||
| California | 49 | 1,065 | 3.5 | |||||||||||||||
| Missouri | 74 | 1,272 | 3.0 | |||||||||||||||
| Minnesota | 52 | 1,704 | 2.9 | 56 | 2,276 | 3.4 | ||||||||||||
| Michigan | 140 | 1,921 | 3.4 | |||||||||||||||
| Tennessee | 118 | 1,772 | 2.9 | 109 | 1,403 | 2.9 | ||||||||||||
| Indiana | 80 | 1,493 | 2.8 | 81 | 1,253 | 2.7 | ||||||||||||
| Missouri | 91 | 1,389 | 2.7 | |||||||||||||||
| North Carolina | 66 | 1,517 | 2.7 | 71 | 1,408 | 2.7 | ||||||||||||
| Alabama | 110 | 830 | 2.5 | |||||||||||||||
| Arizona | 57 | 753 | 2.5 | |||||||||||||||
| South Carolina | 47 | 1,024 | 2.7 | 46 | 962 | 2.1 | ||||||||||||
| Michigan | 82 | 1,759 | 2.6 | |||||||||||||||
| Alabama | 103 | 818 | 2.5 | |||||||||||||||
| Nebraska | 21 | 1,972 | 2.4 | |||||||||||||||
| Pennsylvania | 71 | 1,657 | 2.3 | |||||||||||||||
| Arizona | 51 | 799 | 2.2 | |||||||||||||||
| Kansas | 40 | 973 | 2.1 | |||||||||||||||
| Virginia | 47 | 1,546 | 2.0 | 61 | 1,371 | 2.0 | ||||||||||||
| Colorado | 29 | 774 | 1.6 | 33 | 1,040 | 1.9 | ||||||||||||
| Utah | 16 | 1,494 | 1.5 | |||||||||||||||
| Pennsylvania | 55 | 1,119 | 1.8 | |||||||||||||||
| Kansas | 40 | 852 | 1.7 | |||||||||||||||
| Nevada | 6 | 1,039 | 1.6 | |||||||||||||||
| New Mexico | 39 | 548 | 1.6 | |||||||||||||||
| Oklahoma | 53 | 536 | 1.5 | 68 | 559 | 1.5 | ||||||||||||
| New York | 39 | 738 | 1.5 | |||||||||||||||
| Kentucky | 49 | 635 | 1.5 | |||||||||||||||
| Washington | 25 | 726 | 1.5 | |||||||||||||||
| Arkansas | 52 | 618 | 1.2 | |||||||||||||||
| New Jersey | 15 | 895 | 1.2 | |||||||||||||||
| Massachusetts | 4 | 1,125 | 1.1 | |||||||||||||||
| Oregon | 14 | 453 | 1.1 | |||||||||||||||
| Idaho | 17 | 1,235 | 1.5 | 16 | 679 | 1.1 | ||||||||||||
| New York | 45 | 945 | 1.4 | |||||||||||||||
| Washington | 22 | 950 | 1.4 | |||||||||||||||
| Massachusetts | 8 | 1,390 | 1.3 | |||||||||||||||
| Nevada | 5 | 1,039 | 1.3 | |||||||||||||||
| Location | Number of Properties | Total Square Footage (in thousands) | Percent of Total Rent (1) | Number of Properties | Total Square Feet (in thousands) | Percent of Normalized Rental Revenue | ||||||||||||
| New Mexico | 33 | 330 | 1.2 | |||||||||||||||
| Iowa | 39 | 732 | 1.2 | 35 | 638 | 1.0 | ||||||||||||
| Kentucky | 45 | 952 | 1.2 | |||||||||||||||
| Oregon | 13 | 364 | 1.0 | |||||||||||||||
| Mississippi | 34 | 410 | * | 46 | 422 | 1.0 | ||||||||||||
| Arkansas | 35 | 643 | * | |||||||||||||||
| New Hampshire | 16 | 640 | * | |||||||||||||||
| Louisiana | 30 | 315 | * | 28 | 224 | * | ||||||||||||
| New Hampshire | 16 | 852 | * | |||||||||||||||
| Maryland | 19 | 242 | * | |||||||||||||||
| Nebraska | 14 | 521 | * | |||||||||||||||
| Connecticut | 5 | 686 | * | |||||||||||||||
| South Dakota | 11 | 522 | * | 9 | 395 | * | ||||||||||||
| Montana | 7 | 430 | * | |||||||||||||||
| West Virginia | 28 | 568 | * | 18 | 297 | * | ||||||||||||
| Maryland | 22 | 409 | * | |||||||||||||||
| New Jersey | 13 | 463 | * | |||||||||||||||
| Montana | 7 | 512 | * | |||||||||||||||
| Utah | 9 | 806 | * | |||||||||||||||
| North Dakota | 5 | 250 | * | 5 | 236 | * | ||||||||||||
| Maine | 26 | 79 | * | 26 | 79 | * | ||||||||||||
| Wyoming | 9 | 185 | * | |||||||||||||||
| Rhode Island | 4 | 128 | * | 4 | 117 | * | ||||||||||||
| Connecticut | 2 | 171 | * | |||||||||||||||
| Wyoming | 9 | 186 | * | |||||||||||||||
| Alaska | 1 | 38 | * | |||||||||||||||
| Delaware | 3 | 86 | * | 1 | 50 | * | ||||||||||||
| Virgin Islands | 1 | 5 | * | |||||||||||||||
| Vermont | 2 | 42 | * | 2 | 2 | * | ||||||||||||
| Virgin Islands | 1 | 38 | * | |||||||||||||||
| Alaska | 1 | 50 | * | |||||||||||||||
| Total properties owned | 2,364 | 56,961 | 100.0 | % | ||||||||||||||
| * Less than 1% | ||||||||||||||||||
(1) Total rental revenue for the month ended December 31, 2014 for properties owned at December 31, 2014. | ||||||||||||||||||
| Total | 2,541 | 52,887 | 100.0 | % | ||||||||||||||
| Leases Expiring In: | Number of Properties | Expiring Annual Rent (in thousands) (1) | Total Square Footage (in thousands) | Percent of Total Expiring Annual Rent | Number of Properties | Normalized Rental Revenue Annualized (in thousands) (1) | Total Square Feet (in thousands) | Percent of Expiring Annual Rental Revenue | |||||||||||||||||
| 2015 | 47 | $ | 14,194 | 2,439 | 2.4 | % | |||||||||||||||||||
| 2016 | 47 | 22,746 | 2,390 | 3.8 | |||||||||||||||||||||
| 2017 | 63 | 19,515 | 2,021 | 3.3 | 69 | $ | 3,052 | 23,501 | 3.6 | % | |||||||||||||||
| 2018 | 77 | 24,271 | 2,141 | 4.0 | 70 | 1,885 | 22,184 | 3.4 | |||||||||||||||||
| 2019 | 117 | 22,900 | 2,376 | 3.8 | 106 | 1,920 | 19,868 | 3.1 | |||||||||||||||||
| 2020 | 74 | 25,957 | 1,685 | 4.3 | 74 | 1,674 | 20,669 | 3.2 | |||||||||||||||||
| 2021 | 193 | 43,345 | 4,839 | 7.2 | 188 | 3,905 | 47,012 | 7.3 | |||||||||||||||||
| 2022 | 103 | 25,163 | 1,997 | 4.2 | 97 | 2,148 | 26,296 | 4.1 | |||||||||||||||||
| 2023 | 89 | 34,832 | 3,274 | 5.8 | 109 | 3,440 | 34,444 | 5.3 | |||||||||||||||||
| 2024 | 64 | 18,795 | 874 | 3.1 | 58 | 1,207 | 21,106 | 3.3 | |||||||||||||||||
| 2025 and thereafter | 1,453 | 347,633 | 30,978 | 58.1 | |||||||||||||||||||||
| 2025 | 78 | 2,116 | 37,254 | 5.8 | |||||||||||||||||||||
| 2026 | 200 | 5,311 | 47,094 | 7.3 | |||||||||||||||||||||
| Thereafter | 1,446 | 24,200 | 346,502 | 53.6 | |||||||||||||||||||||
| Vacant | 37 | — | 1,947 | — | 46 | 2,029 | — | — | |||||||||||||||||
| Total owned properties | 2,364 | $ | 599,351 | 56,961 | 100.0 | % | 2,541 | $ | 52,887 | 645,930 | 100.0 | % | |||||||||||||
(1) Total rental revenue for the month ended December 31, 2014 for properties owned at December 31, 2014 multiplied by twelve. | |||||||||||||||||||||||||
| Price Per Share | ||||||||||||
of Common Stock (1) | Distributions | |||||||||||
| High | Low | Declared (1) | ||||||||||
| 2014 | ||||||||||||
| First quarter | $ | 11.43 | $ | 9.83 | $ | 0.16625 | ||||||
| Second quarter | 11.49 | 10.62 | 0.16625 | |||||||||
| Third quarter | 12.02 | 10.92 | 0.16625 | |||||||||
| Fourth quarter | 12.02 | 11.06 | 0.17000 | |||||||||
| Total | $ | 0.66875 | ||||||||||
| 2013 | ||||||||||||
| First quarter | $ | 10.78 | $ | 9.06 | $ | 0.16406 | ||||||
| Second quarter | 12.11 | 8.94 | 0.16406 | |||||||||
| Third quarter | 10.05 | 8.53 | 0.16406 | |||||||||
| Fourth quarter | 10.50 | 9.12 | 0.16625 | |||||||||
| Total | $ | 0.65843 | ||||||||||
Price Per Share of Common Stock | Dividends | ||||||||||
| High | Low | Declared | |||||||||
| 2016 | |||||||||||
| First quarter | $ | 11.25 | $ | 9.10 | $ | 0.17500 | |||||
| Second quarter | 12.77 | 10.87 | 0.17500 | ||||||||
| Third quarter | 13.88 | 12.78 | 0.17500 | ||||||||
| Fourth quarter | 13.10 | 10.26 | 0.18000 | ||||||||
| Total | $ | 0.70500 | |||||||||
| 2015 | |||||||||||
| First quarter | $ | 12.99 | $ | 11.66 | $ | 0.17000 | |||||
| Second quarter | 12.40 | 9.67 | 0.17000 | ||||||||
| Third quarter | 10.55 | 9.04 | 0.17000 | ||||||||
| Fourth quarter | 10.40 | 9.33 | 0.17500 | ||||||||
| Total | $ | 0.68500 | |||||||||
| Distributions Declared | |||
| 2016 | |||
| First quarter | $ | 0.17500 | |
| Second quarter | 0.17500 | ||
| Third quarter | 0.17500 | ||
| Fourth quarter | 0.18000 | ||
| Total | $ | 0.70500 | |
| 2015 | |||
| First quarter | $ | 0.17000 | |
| Second quarter | 0.17000 | ||
| Third quarter | 0.17000 | ||
| Fourth quarter | 0.17500 | ||
| Total | $ | 0.68500 | |
| Period Ended | Period Ended | |||||||||||||||||||||||||||||||||||
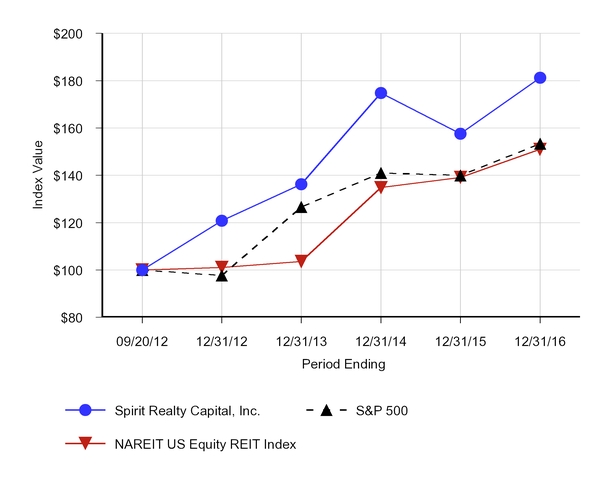
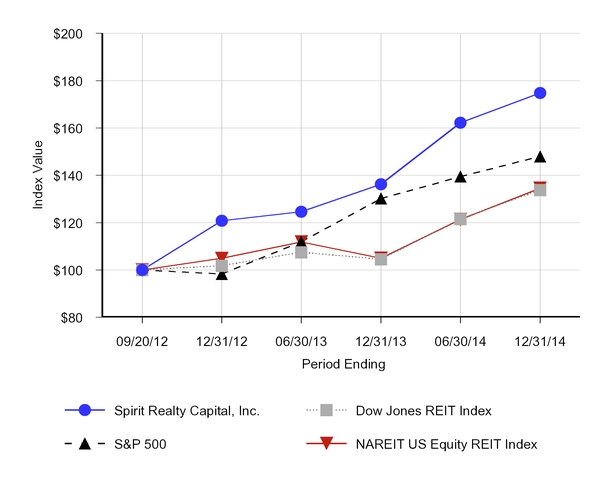
| Index: | 9/20/2012 | 12/31/2012 | 6/30/2013 | 12/31/2013 | 6/30/2014 | 12/31/2014 | 9/20/2012 | 12/31/2012 | 12/31/2013 | 12/31/2014 | 12/31/2015 | 12/31/2016 | ||||||||||||||||||||||||
| Spirit Realty Capital, Inc. | $ | 100 | $ | 121 | $ | 125 | $ | 136 | $ | 162 | $ | 175 | $ | 100 | $ | 121 | $ | 136 | $ | 175 | $ | 158 | $ | 181 | ||||||||||||
| S&P 500 | $ | 100 | $ | 98 | $ | 112 | $ | 130 | $ | 139 | $ | 148 | $ | 100 | $ | 98 | $ | 127 | $ | 141 | $ | 140 | $ | 153 | ||||||||||||
| NAREIT US Equity REIT Index | $ | 100 | $ | 105 | $ | 112 | $ | 105 | $ | 121 | $ | 135 | $ | 100 | $ | 101 | $ | 104 | $ | 135 | $ | 139 | $ | 151 | ||||||||||||
| Dow Jones REIT Index | $ | 100 | $ | 102 | $ | 107 | $ | 104 | $ | 122 | $ | 134 | ||||||||||||||||||||||||
| (Dollars in thousands, except share and per share data) | |||||||||||||||||||
| Years Ended December 31, | |||||||||||||||||||
2014 (1) | 2013 (1) | 2012 | 2011 | 2010 | |||||||||||||||
| Operating Data: | |||||||||||||||||||
| Revenues: | |||||||||||||||||||
| Rentals | $ | 574,456 | $ | 404,402 | $ | 266,567 | $ | 255,672 | $ | 255,148 | |||||||||
| Interest income on loans receivable | 7,239 | 5,928 | 5,696 | 6,772 | 9,572 | ||||||||||||||
| Earned income from direct financing leases | 3,343 | 1,572 | — | — | — | ||||||||||||||
| Tenant reimbursement income | 13,085 | 5,637 | — | — | — | ||||||||||||||
| Interest income and other | 4,748 | 1,928 | 852 | 786 | 14,473 | ||||||||||||||
| Total revenues | 602,871 | 419,467 | 273,115 | 263,230 | 279,193 | ||||||||||||||
| Expenses: | |||||||||||||||||||
| General and administrative | 44,252 | 35,146 | 36,252 | 27,854 | 19,575 | ||||||||||||||
| Litigation | — | — | — | — | 22,282 | ||||||||||||||
| Finance restructuring charges | 13,022 | 717 | — | — | — | ||||||||||||||
| Merger costs | — | 56,644 | — | — | — | ||||||||||||||
| Property costs | 23,383 | 11,760 | 5,176 | 4,693 | 2,631 | ||||||||||||||
| Real estate acquisition costs | 3,631 | 1,718 | 1,054 | 553 | — | ||||||||||||||
| Interest | 220,070 | 179,267 | 156,220 | 169,343 | 172,500 | ||||||||||||||
| Depreciation and amortization | 247,966 | 164,054 | 104,984 | 103,179 | 103,409 | ||||||||||||||
| Impairments (recoveries) | 36,019 | (185 | ) | 8,918 | 5,646 | 20,291 | |||||||||||||
| Total expenses | 588,343 | 449,121 | 312,604 | 311,268 | 340,688 | ||||||||||||||
| Income (loss) from continuing operations before other expense and income tax expense | 14,528 | (29,654 | ) | (39,489 | ) | (48,038 | ) | (61,495 | ) | ||||||||||
| Other (expense) income: | |||||||||||||||||||
| Loss on debt extinguishment | (64,750 | ) | (2,405 | ) | (32,522 | ) | — | — | |||||||||||
| Gain on debt repurchases | — | — | — | — | 9,455 | ||||||||||||||
| Loss on sale of loans receivable | — | — | — | — | (12,565 | ) | |||||||||||||
| Total other expense | (64,750 | ) | (2,405 | ) | (32,522 | ) | — | (3,110 | ) | ||||||||||
| Loss from continuing operations before income tax expense | (50,222 | ) | (32,059 | ) | (72,011 | ) | (48,038 | ) | (64,605 | ) | |||||||||
| Income tax expense (benefit) | 673 | 1,113 | 504 | (60 | ) | 239 | |||||||||||||
| Loss from continuing operations | (50,895 | ) | (33,172 | ) | (72,515 | ) | (47,978 | ) | (64,844 | ) | |||||||||
Discontinued operations: (2) | |||||||||||||||||||
| Income (loss) from discontinued operations | 3,368 | (2,077 | ) | (369 | ) | (13,149 | ) | (21,302 | ) | ||||||||||
| Gain (loss) on dispositions of assets | 488 | 36,926 | (3,349 | ) | (2,736 | ) | (391 | ) | |||||||||||
| Income (loss) from discontinued operations | 3,856 | 34,849 | (3,718 | ) | (15,885 | ) | (21,693 | ) | |||||||||||
| (Loss) income before dispositions of assets | (47,039 | ) | 1,677 | (76,233 | ) | (63,863 | ) | (86,537 | ) | ||||||||||
| Gain on dispositions of assets | 13,240 | — | — | — | — | ||||||||||||||
| Net (loss) income | (33,799 | ) | 1,677 | (76,233 | ) | (63,863 | ) | (86,537 | ) | ||||||||||
| Less: preferred dividends | — | — | (63 | ) | (16 | ) | (15 | ) | |||||||||||
| Net (loss) income attributable to common stockholders | $ | (33,799 | ) | $ | 1,677 | $ | (76,296 | ) | $ | (63,879 | ) | $ | (86,552 | ) | |||||
| Net (loss) income per share of common stock—basic and diluted: | |||||||||||||||||||
| Continuing operations | $ | (0.10 | ) | $ | (0.14 | ) | $ | (0.92 | ) | $ | (0.97 | ) | $ | (1.32 | ) | ||||
| Discontinued operations | 0.01 | 0.14 | (0.05 | ) | (0.33 | ) | (0.44 | ) | |||||||||||
| Net (loss) income per share attributable to common stockholders—basic and diluted | $ | (0.09 | ) | $ | 0.00 | $ | (0.97 | ) | $ | (1.30 | ) | $ | (1.76 | ) | |||||
| Weighted average common shares outstanding: | |||||||||||||||||||
Basic and diluted common shares (3) | 386,809,746 | 255,020,565 | 78,625,102 | 49,265,701 | 49,265,701 | ||||||||||||||
(1) As a result of the Merger completed on July 17, 2013, Operating Data includes the results of operations from the acquired properties for less than half a year in 2013 and for a full year in 2014. | |||||||||||||||||||
(2) Includes gains, losses and results of operations from all property dispositions and from properties classified as held for sale at the end of the period for all periods prior to 2014. During 2014, only those properties classified as held for sale as of December 31, 2013 are reported as discontinued operations and will continue to be reported as such until they are disposed of. | |||||||||||||||||||
(3) Historical weighted average number of shares of common stock outstanding (basic and diluted) have been adjusted for the Merger Exchange Ratio. No potentially dilutive securities were included as their effect would be anti-dilutive on results from continuing operations. | |||||||||||||||||||
| Years Ended December 31, | |||||||||||||||||||
2016 (1) | 2015 (1) | 2014 (1) | 2013 (1) | 2012 | |||||||||||||||
| (Dollars in thousands, except share and per share data) | |||||||||||||||||||
| Operating Data: | |||||||||||||||||||
| Revenues: | |||||||||||||||||||
| Rentals | $ | 648,363 | $ | 634,151 | $ | 574,456 | $ | 404,402 | $ | 266,567 | |||||||||
| Interest income on loans receivable | 5,253 | 6,948 | 7,239 | 5,928 | 5,696 | ||||||||||||||
| Earned income from direct financing leases | 2,742 | 3,024 | 3,343 | 1,572 | — | ||||||||||||||
| Tenant reimbursement income | 14,125 | 15,952 | 13,085 | 5,637 | — | ||||||||||||||
| Other income | 15,491 | 7,260 | 4,748 | 1,928 | 852 | ||||||||||||||
| Total revenues | 685,974 | 667,335 | 602,871 | 419,467 | 273,115 | ||||||||||||||
| Expenses: | |||||||||||||||||||
| General and administrative | 52,615 | 47,730 | 42,637 | 35,146 | 36,252 | ||||||||||||||
| Restructuring charges | 6,341 | 7,056 | — | — | — | ||||||||||||||
| Finance restructuring costs | — | — | 13,022 | 717 | — | ||||||||||||||
| Merger costs | — | — | — | 56,644 | — | ||||||||||||||
| Property costs | 30,839 | 27,715 | 23,383 | 11,760 | 5,176 | ||||||||||||||
| Real estate acquisition costs | 3,229 | 2,739 | 3,631 | 1,718 | 1,054 | ||||||||||||||
| Interest | 196,586 | 222,901 | 220,070 | 179,267 | 156,220 | ||||||||||||||
| Depreciation and amortization | 262,276 | 260,633 | 247,966 | 164,054 | 104,984 | ||||||||||||||
| Impairments (recoveries) | 88,275 | 70,695 | 37,598 | (185 | ) | 8,918 | |||||||||||||
| Total expenses | 640,161 | 639,469 | 588,307 | 449,121 | 312,604 | ||||||||||||||
| Income (loss) from continuing operations before other expense and income tax expense | 45,813 | 27,866 | 14,564 | (29,654 | ) | (39,489 | ) | ||||||||||||
| Other expense: | |||||||||||||||||||
| Gain (loss) on debt extinguishment | 233 | (3,162 | ) | (64,750 | ) | (2,405 | ) | (32,522 | ) | ||||||||||
| Total other income (expense) | 233 | (3,162 | ) | (64,750 | ) | (2,405 | ) | (32,522 | ) | ||||||||||
| Income (loss) from continuing operations before income tax expense | 46,046 | 24,704 | (50,186 | ) | (32,059 | ) | (72,011 | ) | |||||||||||
| Income tax expense | (965 | ) | (601 | ) | (673 | ) | (1,113 | ) | (504 | ) | |||||||||
| Income (loss) from continuing operations | 45,081 | 24,103 | (50,859 | ) | (33,172 | ) | (72,515 | ) | |||||||||||
Discontinued operations: (2) | |||||||||||||||||||
| Income (loss) from discontinued operations | — | 98 | 3,368 | (4,530 | ) | (369 | ) | ||||||||||||
| Gain (loss) on disposition of assets | — | 590 | 325 | 36,086 | (3,349 | ) | |||||||||||||
| Income (loss) from discontinued operations | — | 688 | 3,693 | 31,556 | (3,718 | ) | |||||||||||||
| (Dollars in thousands) | |||||||||||||||||||
| Years Ended December 31, | |||||||||||||||||||
2014 (1) | 2013 (1) | 2012 | 2011 | 2010 | |||||||||||||||
| Balance Sheet Data (end of period): | |||||||||||||||||||
| Gross investments including related lease intangibles | $ | 8,044,363 | $ | 7,235,732 | $ | 3,654,925 | $ | 3,582,870 | $ | 3,610,834 | |||||||||
| Net investments | 7,317,560 | 6,743,439 | 3,119,608 | 2,867,302 | 2,979,496 | ||||||||||||||
| Cash and cash equivalents | 176,181 | 66,588 | 73,568 | 49,536 | 88,341 | ||||||||||||||
| Total assets | 8,017,001 | 7,231,045 | 3,247,677 | 3,231,561 | 3,396,842 | ||||||||||||||
| Debt obligations, net | 4,369,634 | 3,778,218 | 1,894,878 | 2,627,146 | 2,730,994 | ||||||||||||||
| Total liabilities | 4,698,900 | 4,113,011 | 1,994,234 | 2,705,201 | 2,806,741 | ||||||||||||||
Total stockholders' equity (2) | 3,318,101 | 3,118,034 | 1,253,443 | 526,360 | 590,101 | ||||||||||||||
| Other Data: | |||||||||||||||||||
FFO (3) | $ | 236,490 | $ | 139,487 | $ | 52,830 | $ | 69,766 | $ | 70,548 | |||||||||
AFFO (3) | $ | 320,785 | $ | 208,853 | $ | 119,248 | $ | 99,574 | $ | 113,206 | |||||||||
| Number of properties in investment portfolio | 2,509 | 2,186 | 1,207 | 1,153 | 1,161 | ||||||||||||||
| Owned properties occupancy at period end (based on number of properties) | 98 | % | 99 | % | 99 | % | 98 | % | 96 | % | |||||||||
| Income (loss) before gain on disposition of assets | 45,081 | 24,791 | (47,166 | ) | (1,616 | ) | (76,233 | ) | |||||||||||
| Gain on disposition of assets | 52,365 | 68,421 | 10,221 | — | — | ||||||||||||||
| Net income (loss) | 97,446 | 93,212 | (36,945 | ) | (1,616 | ) | (76,233 | ) | |||||||||||
| Less: preferred dividends | — | — | — | — | (63 | ) | |||||||||||||
| Net income (loss) attributable to common stockholders | $ | 97,446 | $ | 93,212 | $ | (36,945 | ) | $ | (1,616 | ) | $ | (76,296 | ) | ||||||
| Net income (loss) per share of common stock—basic: | |||||||||||||||||||
| Continuing operations | $ | 0.21 | $ | 0.21 | $ | (0.11 | ) | $ | (0.14 | ) | $ | (0.92 | ) | ||||||
| Discontinued operations | — | — | 0.01 | 0.13 | (0.05 | ) | |||||||||||||
| Net income (loss) per share attributable to common stockholders—basic | $ | 0.21 | $ | 0.21 | $ | (0.10 | ) | $ | (0.01 | ) | $ | (0.97 | ) | ||||||
| Net income (loss) per share of common stock—diluted: | |||||||||||||||||||
| Continuing operations | $ | 0.21 | $ | 0.21 | $ | (0.11 | ) | $ | (0.14 | ) | $ | (0.92 | ) | ||||||
| Discontinued operations | — | — | 0.01 | 0.13 | (0.05 | ) | |||||||||||||
| Net income (loss) per share attributable to common stockholders—diluted | $ | 0.21 | $ | 0.21 | $ | (0.10 | ) | $ | (0.01 | ) | $ | (0.97 | ) | ||||||
| Weighted average shares of common stock outstanding: | |||||||||||||||||||
Basic common shares (3) | 469,217,776 | 432,222,953 | 386,809,746 | 255,020,565 | 78,625,102 | ||||||||||||||
Diluted common shares (3) | 469,246,265 | 432,545,625 | 386,809,746 | 255,020,565 | 78,625,102 | ||||||||||||||
Dividends declared per common share issued (4) | $ | 0.70500 | $ | 0.68500 | $ | 0.66875 | $ | 0.65843 | $ | 0.17480 | |||||||||
(1) As a result of the Merger completed on July 17, 2013, Operating Data includes the results of operations from the acquired properties for a full year in 2016, 2015 and 2014 and for less than half a year in 2013. | |||||||||||||||||||
(2) Includes gains, losses and results of operations from all property dispositions and from properties classified as held for sale at the end of the period for all periods prior to 2014. During 2015 and 2014, only those properties classified as held for sale as of December 31, 2013 were reported as discontinued operations. | |||||||||||||||||||
(3) Historical weighted average number of shares of common stock outstanding (basic and diluted) have been adjusted for the Merger Exchange Ratio. No potentially dilutive securities were included as their effect would be anti-dilutive on results from continuing operations. | |||||||||||||||||||
(4) Dividends declared per common share issued for the years ended December 31, 2013 and 2012 have been adjusted for the Merger. | |||||||||||||||||||
| Years Ended December 31, | |||||||||||||||||||
2016 (1) | 2015 (1) | 2014 (1) | 2013 (1) | 2012 | |||||||||||||||
| (Dollars in thousands) | |||||||||||||||||||
| Balance Sheet Data (end of period): | |||||||||||||||||||
| Gross investments, including related lease intangibles | $ | 8,247,654 | $ | 8,302,688 | $ | 8,043,497 | $ | 7,235,732 | $ | 3,654,925 | |||||||||
| Net investments | 7,272,655 | 7,425,719 | 7,316,694 | 6,743,439 | 3,119,608 | ||||||||||||||
| Cash and cash equivalents | 10,059 | 21,790 | 176,181 | 66,588 | 73,568 | ||||||||||||||
Total assets (3) | 7,677,971 | 7,891,039 | 7,964,230 | 7,207,775 | 3,245,938 | ||||||||||||||
Total debt, net (3) | 3,664,628 | 4,092,787 | 4,323,302 | 3,758,241 | 1,893,139 | ||||||||||||||
Total liabilities (3) | 3,995,863 | 4,429,165 | 4,652,568 | 4,093,034 | 1,992,495 | ||||||||||||||
Total stockholders' equity (2) | 3,682,108 | 3,461,874 | 3,311,662 | 3,114,741 | 1,253,443 | ||||||||||||||
| Other Data: | |||||||||||||||||||
FFO (4) | $ | 394,952 | $ | 354,686 | $ | 238,105 | $ | 139,487 | $ | 52,830 | |||||||||
AFFO (4) | $ | 412,999 | $ | 378,050 | $ | 322,400 | $ | 208,853 | $ | 119,248 | |||||||||
| Number of properties in investment portfolio | 2,615 | 2,629 | 2,509 | 2,186 | 1,207 | ||||||||||||||
| Owned properties occupancy at period end (based on number of properties) | 98 | % | 99 | % | 98 | % | 99 | % | 99 | % | |||||||||
| (Dollars in thousands) | Years Ended December 31, | |||||||||||||||||||||||||||||||||||||
| Years Ended December 31, | 2016 | 2015 | 2014 | 2013 | 2012 | |||||||||||||||||||||||||||||||||
| 2014 | 2013 | 2012 | 2011 | 2010 | (Dollars in thousands) | |||||||||||||||||||||||||||||||||
Net (loss) income attributable to common stockholders (1) | $ | (33,799 | ) | $ | 1,677 | $ | (76,296 | ) | $ | (63,879 | ) | $ | (86,552 | ) | ||||||||||||||||||||||||
Net income (loss) attributable to common stockholders (1) | $ | 97,446 | $ | 93,212 | $ | (36,945 | ) | $ | (1,616 | ) | $ | (76,296 | ) | |||||||||||||||||||||||||
| Add/(less): | ||||||||||||||||||||||||||||||||||||||
| Portfolio depreciation and amortization | ||||||||||||||||||||||||||||||||||||||
| Continuing operations | 247,587 | 163,874 | 104,929 | 103,086 | 103,237 | 261,799 | 260,257 | 247,587 | 163,874 | 104,929 | ||||||||||||||||||||||||||||
| Discontinued operations | — | 3,545 | 7,116 | 8,691 | 10,239 | — | — | — | 3,545 | 7,116 | ||||||||||||||||||||||||||||
| Portfolio impairment | ||||||||||||||||||||||||||||||||||||||
| Portfolio impairments | ||||||||||||||||||||||||||||||||||||||
| Continuing operations | 36,013 | 183 | 9,098 | 2,546 | 18,771 | 88,072 | 70,197 | 37,592 | 183 | 9,098 | ||||||||||||||||||||||||||||
| Discontinued operations | 417 | 7,134 | 4,634 | 16,586 | 24,462 | — | 34 | 417 | 9,587 | 4,634 | ||||||||||||||||||||||||||||
Realized (gain) loss on sales of real estate (2) | (13,728 | ) | (36,926 | ) | 3,349 | 2,736 | 391 | (52,365 | ) | (69,014 | ) | (10,546 | ) | (36,086 | ) | 3,349 | ||||||||||||||||||||||
| Total adjustments | 270,289 | 137,810 | 129,126 | 133,645 | 157,100 | 297,506 | 261,474 | 275,050 | 141,103 | 129,126 | ||||||||||||||||||||||||||||
| Funds from operations (FFO) attributable to common stockholders | $ | 236,490 | $ | 139,487 | $ | 52,830 | $ | 69,766 | $ | 70,548 | ||||||||||||||||||||||||||||
| FFO | $ | 394,952 | $ | 354,686 | $ | 238,105 | $ | 139,487 | $ | 52,830 | ||||||||||||||||||||||||||||
| Add/(less): | ||||||||||||||||||||||||||||||||||||||
| Loss (gain) on debt extinguishment | ||||||||||||||||||||||||||||||||||||||
| (Gain) loss on debt extinguishment | ||||||||||||||||||||||||||||||||||||||
| Continuing operations | 64,750 | 2,405 | 32,522 | — | — | (233 | ) | 3,162 | 64,750 | 2,405 | 32,522 | |||||||||||||||||||||||||||
| Discontinued operations | — | (1,028 | ) | — | — | — | — | — | — | (1,028 | ) | — | ||||||||||||||||||||||||||
| Restructuring charges | 6,341 | 7,056 | — | — | — | |||||||||||||||||||||||||||||||||
| Loss on derivative instruments related to term note extinguishment | — | — | 8,688 | 1,025 | — | 3,629 | — | — | — | 8,688 | ||||||||||||||||||||||||||||
| Expenses incurred to secure lenders’ consents to the IPO | — | — | 4,743 | 374 | — | — | — | — | — | 4,743 | ||||||||||||||||||||||||||||
| Expenses incurred to amend term note | — | — | — | 7,226 | — | — | — | — | — | — | ||||||||||||||||||||||||||||
| Litigation | — | — | — | 151 | 22,282 | — | — | — | — | — | ||||||||||||||||||||||||||||
Cole II Merger related costs (3) | — | — | — | 66,700 | — | |||||||||||||||||||||||||||||||||
| Master Trust Exchange Costs | — | — | 13,022 | 717 | — | |||||||||||||||||||||||||||||||||
| Real estate acquisition costs | 3,229 | 2,739 | 3,631 | 1,718 | 1,054 | |||||||||||||||||||||||||||||||||
| Non-cash interest expense | 15,380 | 10,367 | 5,175 | 8,840 | 16,495 | |||||||||||||||||||||||||||||||||
| Non-cash revenues | (26,333 | ) | (20,930 | ) | (16,732 | ) | (18,755 | ) | (3,015 | ) | ||||||||||||||||||||||||||||
| Accrued interest and fees on defaulted loans | 4,740 | 7,649 | 3,103 | — | — | |||||||||||||||||||||||||||||||||
Swap termination costs (4) | 1,724 | — | — | — | — | |||||||||||||||||||||||||||||||||
| Non-cash compensation expense | 9,570 | 13,321 | 11,346 | 8,769 | 5,931 | |||||||||||||||||||||||||||||||||
| Total adjustments to FFO | 18,047 | 23,364 | 84,295 | 69,366 | 66,418 | |||||||||||||||||||||||||||||||||
AFFO (8) | $ | 412,999 | $ | 378,050 | $ | 322,400 | $ | 208,853 | $ | 119,248 | ||||||||||||||||||||||||||||
| FFO per share of common stock | ||||||||||||||||||||||||||||||||||||||
Diluted (5) (6) | $ | 0.84 | $ | 0.82 | $ | 0.61 | $ | 0.54 | $ | 0.57 | ||||||||||||||||||||||||||||
| AFFO per share of common stock | ||||||||||||||||||||||||||||||||||||||
Diluted (5) (7) | $ | 0.88 | $ | 0.87 | $ | 0.83 | $ | 0.81 | $ | 1.14 | ||||||||||||||||||||||||||||
| Weighted average shares of common stock outstanding: | ||||||||||||||||||||||||||||||||||||||
| Basic | 469,217,776 | 432,222,953 | 386,809,746 | 255,020,565 | 78,625,102 | |||||||||||||||||||||||||||||||||
| Diluted | 469,246,265 | 432,545,625 | 387,585,580 | 255,210,757 | 112,509,283 | |||||||||||||||||||||||||||||||||
Cole II merger related costs (5) | — | 66,700 | — | — | — | ||||||||||||||
| Finance restructuring charges | 13,022 | 717 | — | — | — | ||||||||||||||
| Real estate acquisition costs | 3,631 | 1,718 | 1,054 | 553 | — | ||||||||||||||
| Non-cash interest expense | 5,175 | 8,840 | 16,495 | 22,704 | 19,554 | ||||||||||||||
| Non-cash revenues | (16,732 | ) | (18,755 | ) | (3,015 | ) | (2,225 | ) | (2,288 | ) | |||||||||
| Accrued interest on defaulted loans | 3,103 | — | — | — | — | ||||||||||||||
| Non-cash compensation expense | 11,346 | 8,769 | 5,931 | — | — | ||||||||||||||
| Other expense (income) | — | — | — | — | 3,110 | ||||||||||||||
| Total adjustments to FFO | 84,295 | 69,366 | 66,418 | 29,808 | 42,658 | ||||||||||||||
| Adjusted funds from operations (AFFO) attributable to common stockholders | $ | 320,785 | $ | 208,853 | $ | 119,248 | $ | 99,574 | $ | 113,206 | |||||||||
| FFO per share of common stock | |||||||||||||||||||
Diluted (3) | $ | 0.61 | $ | 0.54 | $ | 0.57 | $ | 1.42 | $ | 1.43 | |||||||||
| AFFO per share of common stock | |||||||||||||||||||
Diluted (4) | $ | 0.82 | $ | 0.81 | $ | 1.14 | $ | 2.02 | $ | 2.30 | |||||||||
| Weighted average shares of common stock outstanding: | |||||||||||||||||||
| Basic | 386,809,746 | 255,020,565 | 78,625,102 | 49,265,701 | 49,265,701 | ||||||||||||||
| Diluted | 387,585,580 | 255,210,757 | 112,509,283 | 49,265,701 | 49,265,701 | ||||||||||||||
(1) Amount is net of distributions paid to preferred stockholders. | |||||||||||||||||||
(2) Includes amounts related to discontinued operations. | |||||||||||||||||||
(3) FFO per share for the years ended December 31, 2014 and 2013 deducts dividends paid to participating stockholders of $1,099 and $1,291, respectively, in its computation. Earnings per share for 2012 adds back cash and non-cash interest savings under the "if converted method" of $11,578 for assumed conversion of the term note in the computation of diluted earnings per share. | |||||||||||||||||||
(4) AFFO per share for the years ended December 31, 2014 and 2013 deducts dividends paid to participating stockholders of $1,099 and $1,291, respectively, in its computation. Earnings per share for 2012 adds back cash interest savings under the "if converted method" of $9,020 for assumed conversion of the term note in the computation of diluted earnings per share. | |||||||||||||||||||
(5) Includes $10.1 million of interest expense charges related to the Merger. | |||||||||||||||||||
| Contractual rent from date of rejection through either sale or December 31, 2016 | $ | 1.3 | ||
| Three months of prepaid rent for the 3 stores subsequently sold | 0.5 | |||
| Total included in AFFO | $ | 1.8 | ||
| December 31, | |||||||
| 2016 | 2015 | ||||||
| (in thousands) | |||||||
| Revolving credit facilities | $ | 86,000 | $ | — | |||
| Term loan, net | 418,471 | 322,902 | |||||
| Senior unsecured notes | 295,112 | — | |||||
| Mortgages and notes payable, net | 2,162,403 | 3,079,787 | |||||
| Convertible notes, net | 702,642 | 690,098 | |||||
| 3,664,628 | 4,092,787 | ||||||
| Add/(less): | |||||||
| Unamortized debt discount, net | 52,894 | 52,203 | |||||
| Unamortized deferred financing costs | 37,111 | 41,577 | |||||
| Cash and cash equivalents | (10,059 | ) | (21,790 | ) | |||
| Cash reserves on deposit with lenders as additional security classified as other assets | (11,757 | ) | (24,660 | ) | |||
| Total adjustments | 68,189 | 47,330 | |||||
Adjusted Debt (1) | $ | 3,732,817 | $ | 4,140,117 | |||
| Three Months Ended December 31, | |||||||
| 2016 | 2015 | ||||||
| (Dollars in thousands) | |||||||
| Net income attributable to common stockholders | $ | 988 | $ | 6,301 | |||
Add/(less): (2) | |||||||
| Interest | 46,744 | 54,147 | |||||
| Depreciation and amortization | 68,049 | 65,173 | |||||
| Income tax (benefit) expense | 33 | (106 | ) | ||||
| Total adjustments | 114,826 | 119,214 | |||||
| EBITDA | $ | 115,814 | $ | 125,515 | |||
Add/(less): (2) | |||||||
| Restructuring charges | 615 | 6,956 | |||||
| Other non-routine costs in G&A associated with headquarter relocation | 187 | — | |||||
| Real estate acquisition costs | 1,137 | 617 | |||||
| Impairments | 46,379 | 13,691 | |||||
| Realized gain on sales of real estate | (13,144 | ) | (2,131 | ) | |||
| Loss on debt extinguishment | 93 | 5,651 | |||||
| Total adjustments to EBITDA | 35,267 | 24,784 | |||||
Adjusted EBITDA (3) | $ | 151,081 | $ | 150,299 | |||
Annualized Adjusted EBITDA (4) | $ | 604,324 | $ | 601,196 | |||
Adjusted Debt / Annualized Adjusted EBITDA (5) | 6.2 | 6.9 | |||||
| December 31, | ||||||||
| 2014 | 2013 | |||||||
| Revolving credit facilities | $ | 15,181 | $ | 35,120 | ||||
| Mortgages and notes payable, net | 3,658,496 | 3,743,098 | ||||||
| Convertible Notes | 695,957 | — | ||||||
| 4,369,634 | 3,778,218 | |||||||
| Add/(less): | ||||||||
| Preferred stock | — | — | ||||||
| Unamortized debt discount/(premium) | 51,586 | (1,669 | ) | |||||
| Cash and cash equivalents | (176,181 | ) | (66,588 | ) | ||||
| Cash collateral deposits for the benefit of lenders classified as other assets | (29,483 | ) | (16,927 | ) | ||||
| Total adjustments | (154,078 | ) | (85,184 | ) | ||||
Adjusted Debt (1) | $ | 4,215,556 | $ | 3,693,034 | ||||
| Three Months Ended December 31, | ||||||||
| 2014 | 2013 | |||||||
| Net income (loss) attributable to common stockholders | $ | 34,113 | $ | 43,586 | ||||
| Add/(less): | ||||||||
| Interest | 56,144 | 52,890 | ||||||
Depreciation and amortization (2) | 63,380 | 59,263 | ||||||
| Income tax expense | 87 | 168 | ||||||
| Total adjustments | 119,611 | 112,321 | ||||||
| Earnings before interest, income tax, and depreciation and amortization expenses ("EBITDA") | $ | 153,724 | $ | 155,907 | ||||
Add/(less): (2) | ||||||||
| Merger related costs | — | 16 | ||||||
| Finance restructuring costs | — | 717 | ||||||
| Real estate acquisition costs | 1,259 | 1,030 | ||||||
| Impairments | (5,631 | ) | 1,282 | |||||
| Losses / (gains) on sales of assets | (11,557 | ) | (35,700 | ) | ||||
| Losses on debt extinguishment | 254 | 2,405 | ||||||
| Total adjustments to EBITDA | (15,675 | ) | (30,250 | ) | ||||
Adjusted EBITDA (3) | $ | 138,049 | $ | 125,657 | ||||
Annualized Adjusted EBITDA (4) | $ | 552,196 | $ | 502,628 | ||||
Leverage (5) (Adjusted Debt / Annualized Adjusted EBITDA) | 7.6 | 7.3 | ||||||
(1) Adjusted Debt represents interest bearing debt (reported in accordance with GAAP) adjusted to include preferred stock and exclude unamortized debt discount, as further reduced for cash and cash equivalents and cash collateral deposits retained by lenders. We believe that including preferred stock in Adjusted Debt is appropriate because it is an equity security that has properties of a debt instrument not possessed by common stock. Additionally, by excluding unamortized debt discount, cash and cash equivalents, and cash collateral deposits retained by lenders, the result provides an estimate of the contractual amount of borrowed capital to be repaid which we believe is a beneficial disclosure to investors. | ||||||||
(2) Adjustments include all amounts charged to continuing and discontinued operations. | ||||||||
| ◦ | Issued |
| ◦ |
| ◦ |
| ◦ |
| ◦ |
| ◦ | Extinguished |
| ◦ | Unencumbered assets totaled $4.8 billion at December 31, 2016, or approximately 58.8% of |
| Years Ended December 31, | Years Ended December 31, | ||||||||||||||||||||||||||||
| 2014 | 2013 | Change | % | 2016 | 2015 | Change | % Change | ||||||||||||||||||||||
| (in thousands) | (in thousands) | ||||||||||||||||||||||||||||
| Revenues: | |||||||||||||||||||||||||||||
| Rentals | $ | 574,456 | $ | 404,402 | $ | 170,054 | 42.1 | % | $ | 648,363 | $ | 634,151 | $ | 14,212 | 2.2 | % | |||||||||||||
| Interest income on loans receivable | 7,239 | 5,928 | 1,311 | 22.1 | % | 5,253 | 6,948 | (1,695 | ) | (24.4 | )% | ||||||||||||||||||
| Earned income from direct financing leases | 3,343 | 1,572 | 1,771 | 112.7 | % | 2,742 | 3,024 | (282 | ) | (9.3 | )% | ||||||||||||||||||
| Tenant reimbursement income | 13,085 | 5,637 | 7,448 | 132.1 | % | 14,125 | 15,952 | (1,827 | ) | (11.5 | )% | ||||||||||||||||||
| Interest income and other | 4,748 | 1,928 | 2,820 | 146.3 | % | ||||||||||||||||||||||||
| Other income | 15,491 | 7,260 | 8,231 | NM | |||||||||||||||||||||||||
| Total revenues | 602,871 | 419,467 | 183,404 | 43.7 | % | 685,974 | 667,335 | 18,639 | 2.8 | % | |||||||||||||||||||
| Expenses: | |||||||||||||||||||||||||||||
| General and administrative | 44,252 | 35,146 | 9,106 | 25.9 | % | 52,615 | 47,730 | 4,885 | 10.2 | % | |||||||||||||||||||
| Finance restructuring charges | 13,022 | 717 | 12,305 | NM | |||||||||||||||||||||||||
| Merger costs | — | 56,644 | (56,644 | ) | NM | ||||||||||||||||||||||||
| Restructuring charges | 6,341 | 7,056 | (715 | ) | (10.1 | )% | |||||||||||||||||||||||
| Property costs | 23,383 | 11,760 | 11,623 | 98.8 | % | 30,839 | 27,715 | 3,124 | 11.3 | % | |||||||||||||||||||
| Real estate acquisition costs | 3,631 | 1,718 | 1,913 | 111.4 | % | 3,229 | 2,739 | 490 | 17.9 | % | |||||||||||||||||||
| Interest | 220,070 | 179,267 | 40,803 | 22.8 | % | 196,586 | 222,901 | (26,315 | ) | (11.8 | )% | ||||||||||||||||||
| Depreciation and amortization | 247,966 | 164,054 | 83,912 | 51.1 | % | 262,276 | 260,633 | 1,643 | 0.6 | % | |||||||||||||||||||
| Impairment (recoveries) | 36,019 | (185 | ) | 36,204 | NM | ||||||||||||||||||||||||
| Impairment | 88,275 | 70,695 | 17,580 | 24.9 | % | ||||||||||||||||||||||||
| Total expenses | 588,343 | 449,121 | 139,222 | 31.0 | % | 640,161 | 639,469 | 692 | 0.1 | % | |||||||||||||||||||
| Income (loss) from continuing operations before other expense and income tax expense | 14,528 | (29,654 | ) | 44,182 | 149.0 | % | |||||||||||||||||||||||
| Other expense: | |||||||||||||||||||||||||||||
| Loss on debt extinguishment | (64,750 | ) | (2,405 | ) | (62,345 | ) | NM | ||||||||||||||||||||||
| Total other expense | (64,750 | ) | (2,405 | ) | (62,345 | ) | NM | ||||||||||||||||||||||
| Loss from continuing operations before income tax expense | (50,222 | ) | (32,059 | ) | (18,163 | ) | (56.7 | )% | |||||||||||||||||||||
| Income from continuing operations before other income (expense) and income tax expense | 45,813 | 27,866 | 17,947 | 64.4 | % | ||||||||||||||||||||||||
| Other income (expense): | |||||||||||||||||||||||||||||
| Gain (loss) on debt extinguishment | 233 | (3,162 | ) | 3,395 | NM | ||||||||||||||||||||||||
| Total other income (expense) | 233 | (3,162 | ) | 3,395 | NM | ||||||||||||||||||||||||
| Income from continuing operations before income tax expense | 46,046 | 24,704 | 21,342 | NM | |||||||||||||||||||||||||
| Income tax expense | 673 | 1,113 | (440 | ) | (39.5 | )% | (965 | ) | (601 | ) | (364 | ) | (60.6 | )% | |||||||||||||||
| Loss from continuing operations | $ | (50,895 | ) | $ | (33,172 | ) | $ | (17,723 | ) | (53.4 | )% | ||||||||||||||||||
| Income from continuing operations | $ | 45,081 | $ | 24,103 | $ | 20,978 | NM | ||||||||||||||||||||||
| Gain on disposition of assets | $ | 52,365 | $ | 68,421 | $ | (16,056 | ) | (23.5 | )% | ||||||||||||||||||||
| Years Ended December 31, | |||||||
| 2014 | 2013 | ||||||
| (in thousands) | |||||||
Interest expense – revolving credit facilities (1) | $ | 3,597 | $ | 3,037 | |||
| Interest expense – mortgages and notes payable | 196,246 | 157,903 | |||||
| Interest expense – Convertible Notes | 15,046 | — | |||||
| Interest expense – other | 6 | 475 | |||||
Amortization of deferred financing costs (2) | 5,899 | 13,188 | |||||
| Amortization of net losses related to interest rate swaps | 125 | 11 | |||||
| Amortization of debt (premium)/discount, net | (849 | ) | 4,653 | ||||
| Total interest expense | $ | 220,070 | $ | 179,267 | |||
(1) Includes interest expense associated with non-utilization fees of approximately $1.2 million and $0.7 million for the years ended December 31, 2014 and 2013, respectively. | |||||||
(2) Includes $9.5 million arising from financing commitments related to the Merger for the year ended December 31, 2013. | |||||||
| Years Ended December 31, | |||||||
| 2016 | 2015 | ||||||
| (in thousands) | |||||||
| Interest expense – Revolving Credit Facilities (1) | $ | 3,314 | $ | 2,698 | |||
| Interest expense – Term Loan | 5,218 | 888 | |||||
| Interest expense – mortgages and notes payable | 143,233 | 184,439 | |||||
Interest expense – Convertible Notes (2) | 24,509 | 24,509 | |||||
| Interest expense – Unsecured Senior Notes | 4,932 | — | |||||
| Non-cash interest expense: | |||||||
| Amortization of deferred financing costs | 9,070 | 7,937 | |||||
| Amortization of net losses related to interest rate swaps | 93 | 108 | |||||
| Amortization of debt discount/(premium), net | 6,217 | 2,322 | |||||
| Total interest expense | $ | 196,586 | $ | 222,901 | |||
| Years Ended December 31, | Years Ended December 31, | |||||||||||||
| 2014 | 2013 | 2016 | 2015 | |||||||||||
| (in thousands) | (in thousands) | |||||||||||||
| Depreciation of real estate assets | $ | 194,383 | $ | 130,285 | $ | 215,443 | $ | 210,395 | ||||||
| Other depreciation | 379 | 180 | 475 | 375 | ||||||||||
| Amortization of lease intangibles | 53,204 | 33,589 | 46,358 | 49,863 | ||||||||||
| Total depreciation and amortization | $ | 247,966 | $ | 164,054 | $ | 262,276 | $ | 260,633 | ||||||
| Years Ended December 31, | |||||||
| 2016 | 2015 | ||||||
| (in thousands) | |||||||
| Real estate and intangible asset impairment | $ | 80,390 | $ | 68,531 | |||
| Write-off of lease intangibles due to lease terminations, net | 7,683 | 1,666 | |||||
| Loans receivable impairment | 176 | 324 | |||||
| Total impairments from real estate investment net assets | 88,249 | 70,521 | |||||
| Other impairment | 26 | 174 | |||||
| Total impairment loss | $ | 88,275 | $ | 70,695 | |||
| Years Ended December 31, | ||||||||||||||
| 2015 | 2014 | Change | % Change | |||||||||||
| (in thousands) | ||||||||||||||
| Revenues: | ||||||||||||||
| Rentals | $ | 634,151 | $ | 574,456 | $ | 59,695 | 10.4 | % | ||||||
| Interest income on loans receivable | 6,948 | 7,239 | (291 | ) | (4.0 | )% | ||||||||
| Earned income from direct financing leases | 3,024 | 3,343 | (319 | ) | (9.5 | )% | ||||||||
| Tenant reimbursement income | 15,952 | 13,085 | 2,867 | 21.9 | % | |||||||||
| Other income | 7,260 | 4,748 | 2,512 | 52.9 | % | |||||||||
| Total revenues | 667,335 | 602,871 | 64,464 | 10.7 | % | |||||||||
| Expenses: | ||||||||||||||
| General and administrative | 47,730 | 42,637 | 5,093 | 11.9 | % | |||||||||
| Restructuring charges | 7,056 | — | 7,056 | NM | ||||||||||
| Finance restructuring costs | — | 13,022 | (13,022 | ) | (100.0 | )% | ||||||||
| Property costs | 27,715 | 23,383 | 4,332 | 18.5 | % | |||||||||
| Real estate acquisition costs | 2,739 | 3,631 | (892 | ) | (24.6 | )% | ||||||||
| Interest | 222,901 | 220,070 | 2,831 | 1.3 | % | |||||||||
| Depreciation and amortization | 260,633 | 247,966 | 12,667 | 5.1 | % | |||||||||
| Impairment | 70,695 | 37,598 | 33,097 | 88.0 | % | |||||||||
| Total expenses | 639,469 | 588,307 | 51,162 | 8.7 | % | |||||||||
| Income from continuing operations before other expense and income tax expense | 27,866 | 14,564 | 13,302 | 91.3 | % | |||||||||
| Other expense: | ||||||||||||||
| Loss on debt extinguishment | (3,162 | ) | (64,750 | ) | 61,588 | �� | 95.1 | % | ||||||
| Total other expense | (3,162 | ) | (64,750 | ) | 61,588 | 95.1 | % | |||||||
| Income (loss) from continuing operations before income tax expense | 24,704 | (50,186 | ) | 74,890 | NM | |||||||||
| Income tax expense | (601 | ) | (673 | ) | 72 | 10.7 | % | |||||||
| Income (loss) from continuing operations | $ | 24,103 | $ | (50,859 | ) | $ | 74,962 | NM | ||||||
| Gain on disposition of assets | $ | 68,421 | $ | 10,221 | $ | 58,200 | NM | |||||||
| Years Ended December 31, | |||||||
| 2015 | 2014 | ||||||
| (in thousands) | |||||||
| Interest expense – Revolving Credit Facilities (1) | $ | 2,698 | $ | 3,597 | |||
| Interest expense – Term Loan | 888 | — | |||||
| Interest expense – mortgages and notes payable | 184,439 | 196,246 | |||||
Interest expense – Convertible Notes (2) | 24,509 | 15,046 | |||||
| Interest expense – other | — | 6 | |||||
| Non-cash interest expense: | |||||||
| Amortization of deferred financing costs | 7,937 | 5,899 | |||||
| Amortization of net losses related to interest rate swaps | 108 | 125 | |||||
| Amortization of debt discount/(premium), net | 2,322 | (849 | ) | ||||
| Total interest expense | $ | 222,901 | $ | 220,070 | |||
| Years Ended December 31, | |||||||
| 2015 | 2014 | ||||||
| (in thousands) | |||||||
| Depreciation of real estate assets | $ | 210,395 | $ | 194,383 | |||
| Other depreciation | 375 | 379 | |||||
| Amortization of lease intangibles | 49,863 | 53,204 | |||||
| Total depreciation and amortization | $ | 260,633 | $ | 247,966 | |||
| Years Ended December 31, | Years Ended December 31, | |||||||||||||
| 2014 | 2013 | 2015 | 2014 | |||||||||||
| (in thousands) | (in thousands) | |||||||||||||
| Real estate and intangible asset impairment | $ | 40,311 | $ | 182 | $ | 68,531 | $ | 41,890 | ||||||
| Write-off of lease intangibles due to lease terminations, net | (4,820 | ) | — | 1,666 | (4,820 | ) | ||||||||
| Loan receivable impairment recovery | — | (367 | ) | |||||||||||
| Loans receivable impairment | 324 | — | ||||||||||||
| Total impairments from real estate investment net assets | 70,521 | 37,070 | ||||||||||||
| Other impairment | 528 | — | 174 | 528 | ||||||||||
| Total impairment loss (recovery) | $ | 36,019 | $ | (185 | ) | |||||||||
| Total impairment loss | $ | 70,695 | $ | 37,598 | ||||||||||
| Years Ended December 31, | |||||||||||||||
| 2013 | 2012 | Change | % | ||||||||||||
| (in thousands) | |||||||||||||||
| Revenues: | |||||||||||||||
| Rentals | $ | 404,402 | $ | 266,567 | $ | 137,835 | 51.7 | % | |||||||
| Interest income on loans receivable | 5,928 | 5,696 | 232 | 4.1 | % | ||||||||||
| Earned income from direct financing leases | 1,572 | — | 1,572 | NM | |||||||||||
| Tenant reimbursement income | 5,637 | — | 5,637 | NM | |||||||||||
| Interest income and other | 1,928 | 852 | 1,076 | 126.3 | % | ||||||||||
| Total revenues | 419,467 | 273,115 | 146,352 | 53.6 | % | ||||||||||
| Expenses: | |||||||||||||||
| General and administrative | 35,146 | 36,252 | (1,106 | ) | (3.1 | )% | |||||||||
| Finance restructuring charges | 717 | — | 717 | NM | |||||||||||
| Merger costs | 56,644 | — | 56,644 | NM | |||||||||||
| Property costs | 11,760 | 5,176 | 6,584 | 127.2 | % | ||||||||||
| Real estate acquisition costs | 1,718 | 1,054 | 664 | 63.0 | % | ||||||||||
| Interest | 179,267 | 156,220 | 23,047 | 14.8 | % | ||||||||||
| Depreciation and amortization | 164,054 | 104,984 | 59,070 | 56.3 | % | ||||||||||
| Impairment (recoveries) | (185 | ) | 8,918 | (9,103 | ) | (102.1 | )% | ||||||||
| Total expenses | 449,121 | 312,604 | 136,517 | 43.7 | % | ||||||||||
| Loss from continuing operations before other expense and income tax expense | (29,654 | ) | (39,489 | ) | 9,835 | 24.9 | % | ||||||||
| Other expense: | |||||||||||||||
| Loss on debt extinguishment | (2,405 | ) | (32,522 | ) | 30,117 | 92.6 | % | ||||||||
| Total other expense | (2,405 | ) | (32,522 | ) | 30,117 | 92.6 | % | ||||||||
| Loss from continuing operations before income tax expense | (32,059 | ) | (72,011 | ) | 39,952 | 55.5 | % | ||||||||
| Income tax expense | 1,113 | 504 | 609 | 120.8 | % | ||||||||||
| Loss from continuing operations | (33,172 | ) | (72,515 | ) | 39,343 | 54.3 | % | ||||||||
| Years Ended December 31, | |||||||
| 2013 | 2012 | ||||||
| (in thousands) | |||||||
| Interest expense – term note payable | $ | — | $ | 19,925 | |||
Interest expense – revolving credit facilities (1) | 3,037 | 108 | |||||
| Interest expense – mortgages and notes payable | 157,903 | 119,196 | |||||
| Interest expense – other | 475 | 10 | |||||
Amortization of deferred financing costs (2) | 13,188 | 2,819 | |||||
| Amortization of net losses related to interest rate swap | 11 | 3,415 | |||||
| Amortization of debt (premium) or discount, net | 4,653 | 10,747 | |||||
| Total interest expense | $ | 179,267 | $ | 156,220 | |||
(1) Includes interest expense associated with non-utilization fees of approximately $0.7 million and $0.1 million for the years ended December 31, 2013 and 2012, respectively. | |||||||
(2) Includes $9.5 million arising from financing commitments related to the Merger for the year ended December 31, 2013. | |||||||
| Years Ended December 31, | |||||||
| 2013 | 2012 | ||||||
| (in thousands) | |||||||
| Depreciation of real estate assets | $ | 130,285 | $ | 86,905 | |||
| Other depreciation | 180 | 54 | |||||
| Amortization of lease intangibles | 33,589 | 18,025 | |||||
| $ | 164,054 | $ | 104,984 | ||||
| Years Ended December 31, | |||||||
| 2013 | 2012 | ||||||
| (in thousands) | |||||||
| Real estate and intangible asset impairment | $ | 182 | $ | 7,267 | |||
| Write-off of lease intangibles due to lease terminations | — | 1,831 | |||||
| Loan receivable impairment (recovery) expense | (367 | ) | (180 | ) | |||
| Total impairment (recovery) loss | $ | (185 | ) | $ | 8,918 | ||
Stated Rates (1) | Remaining Term | December 31, 2016 | December 31, 2015 | |||||||||
| (in Years) | (in Thousands) | |||||||||||
| Series 2014-1 Class A1 | 5.1 | % | 3.5 | $ | 53,919 | $ | 65,027 | |||||
| Series 2014-1 Class A2 | 5.4 | % | 3.5 | 253,300 | 253,300 | |||||||
| Series 2014-2 | 5.8 | % | 4.2 | 226,283 | 229,674 | |||||||
| Series 2014-3 | 5.7 | % | 5.2 | 311,820 | 312,276 | |||||||
| Series 2014-4 Class A1 | 3.5 | % | 3.1 | 150,000 | 150,000 | |||||||
| Series 2014-4 Class A2 | 4.6 | % | 13.1 | 360,000 | 360,000 | |||||||
| Total Master Trust 2014 notes | 5.1 | % | 6.5 | 1,355,322 | 1,370,277 | |||||||
| Series 2013-1 Class A | 3.9 | % | 2.0 | 125,000 | 125,000 | |||||||
| Series 2013-2 Class A | 5.3 | % | 7.0 | 192,384 | 196,817 | |||||||
| Total Master Trust 2013 notes | 4.7 | % | 5.0 | 317,384 | 321,817 | |||||||
| Total Master Trust Notes | 1,672,706 | 1,692,094 | ||||||||||
| Debt discount, net | (18,787 | ) | (22,909 | ) | ||||||||
| Deferred financing costs, net | (16,376 | ) | (19,345 | ) | ||||||||
| Total Master Trust Notes, net | $ | 1,637,543 | $ | 1,649,840 | ||||||||
| Industry | Properties | Net Book Value | Monthly Base Rent | Principal Outstanding | Monthly Debt Service | Stated Interest Rate | Maturity Date | ||||||||||||||||
| Building Materials | 109 | $ | 199,022 | $ | 1,493 | $ | 139,389 | $ | 916 | 6.17 | % | May 5, 2017 | |||||||||||
| Year of Maturity | Number of Loans | Number of Properties | Stated Interest Rate Range | Weighted Average Stated Rate | Scheduled Principal | Balloon | Total | |||||||||||||||
| 2017 | 18 | 15 | 5.51%-6.52% | 5.72 | % | $ | 4,222 | $ | 161,373 | $ | 165,595 | |||||||||||
| 2018 | 4 | 10 | 3.90%-4.65% | 4.03 | % | 3,853 | 57,779 | 61,632 | ||||||||||||||
| 2019 | 1 | 5 | 4.61%-4.61% | 3.32 | % | 3,905 | 10,000 | 13,905 | ||||||||||||||
| 2020 | — | — | — | — | 4,100 | — | 4,100 | |||||||||||||||
| 2021 | — | — | — | — | 4,365 | — | 4,365 | |||||||||||||||
| Thereafter | 6 | 100 | 4.67%-6.00% | 5.77 | % | 11,891 | 240,380 | 252,271 | ||||||||||||||
| Total | 29 | 130 | 5.37 | % | 32,336 | 469,532 | 501,868 | |||||||||||||||
| Industry | Properties | Net Book Value | Monthly Base Rent | Outstanding Principal | Restricted Cash (3) | Stated Rate | Default Rate | Accrued Interest | |||||||||||||||||||||
| Drug Stores / Pharmacies | 1 | $ | 1,032 | $ | — | $ | 1,247 | $ | 78 | 5.67 | % | 9.67 | % | $ | 61 | (1) | |||||||||||||
| Home Furnishings | 1 | 3,315 | 36 | 17,026 | 3,537 | 6.88 | % | 10.88 | % | 1,168 | (1) | ||||||||||||||||||
| Sporting Goods | 1 | 3,375 | — | 4,133 | 609 | 5.52 | % | 9.52 | % | 260 | (1) | ||||||||||||||||||
| Manufacturing | 9 | 39,034 | 83 | 53,184 | 9,497 | 5.85 | % | 9.85 | % | 1,614 | (1) | ||||||||||||||||||
| 12 | $46,756 | $ | 119 | $ | 75,590 | $ | 13,721 | 6.06 | % | (2) | 10.06 | % | (2) | $ | 3,103 | ||||||||||||||
(1) Interest accrued or capitalized to principal that remains unpaid. | |||||||||||||||||||||||||||||
(2) Weighted average interest rate. | |||||||||||||||||||||||||||||
(3) Represents restricted cash controlled by the lender that may be applied to reduce the outstanding principal balance. | |||||||||||||||||||||||||||||
| Industry | Properties | Net Book Value | Monthly Base Rent | Pre-Default Outstanding Principal | Capitalized Interest (1) | Total Debt Outstanding | Restricted Cash (2) | Stated Rate | Default Rate | Accrued Interest (1) | ||||||||||||||||||||||||||
| Sporting Goods | 1 | $ | 6,351 | $ | — | $ | 6,321 | $ | 30 | $ | 6,351 | $ | 376 | 5.62 | % | 10.62 | % | $ | 58 | |||||||||||||||||
| Manufacturing | 3 | 20,206 | — | 10,730 | 9,476 | 20,206 | — | 5.85 | % | 9.85 | % | 216 | ||||||||||||||||||||||||
| 4 | $ | 26,557 | $ | — | $ | 17,051 | $ | 9,506 | $ | 26,557 | $ | 376 | 5.80 | % | 10.04 | % | $ | 274 | ||||||||||||||||||
Scheduled Principal | Balloon Payment | Total | |||||||||
| 2015 | $ | 31,552 | $ | 321,372 | $ | 352,924 | |||||
| 2016 | 30,167 | 289,045 | 319,212 | ||||||||
| 2017 | 29,667 | 839,977 | 869,644 | ||||||||
| 2018 | 43,750 | 248,851 | 292,601 | ||||||||
| 2019 | 45,771 | 452,000 | 497,771 | ||||||||
| Thereafter | 289,752 | 1,799,316 | 2,089,068 | ||||||||
| $ | 470,659 | $ | 3,950,561 | $ | 4,421,220 | ||||||
| Total | 2017 | 2018 | 2019 | 2020 | 2021 | Thereafter | |||||||||||||||||||||
| Term Loan | $ | 420,000 | $ | — | $ | 420,000 | $ | — | $ | — | $ | — | $ | — | |||||||||||||
| 2015 Credit Facility | 86,000 | — | — | 86,000 | — | — | — | ||||||||||||||||||||
| Master Trust Notes | 1,672,706 | 21,893 | 163,262 | 40,420 | 448,202 | 236,046 | 762,883 | ||||||||||||||||||||
CMBS - fixed-rate (1) | 528,427 | 192,154 | 61,632 | 13,905 | 4,100 | 4,365 | 252,271 | ||||||||||||||||||||
| Convertible Notes | 747,500 | — | — | 402,500 | — | 345,000 | — | ||||||||||||||||||||
| Unsecured Senior Notes | 300,000 | — | — | — | — | — | 300,000 | ||||||||||||||||||||
| $ | 3,754,633 | $ | 214,047 | $ | 644,894 | $ | 542,825 | $ | 452,302 | $ | 585,411 | $ | 1,315,154 | ||||||||||||||
| Payment due by period | Payment due by period | |||||||||||||||||||||||||||||||||||||||
| More than | More than | |||||||||||||||||||||||||||||||||||||||
| Less than 1 | 1-3 years | 3-5 years | 5 years | Less than 1 | 1-3 years | 3-5 years | 5 years | |||||||||||||||||||||||||||||||||
| Contractual Obligations | Total | Year (2015) | (2016-2017) | (2018-2019) | (after 2019) | Total | Year (2017) | (2018-2019) | (2020-2021) | (after 2021) | ||||||||||||||||||||||||||||||
| Debt - Principal | $ | 4,421,220 | $ | 352,924 | $ | 1,188,856 | $ | 790,372 | $ | 2,089,068 | $ | 3,754,633 | $ | 214,047 | $ | 1,187,719 | $ | 1,037,713 | $ | 1,315,154 | ||||||||||||||||||||
Debt - Interest (1) | 1,077,028 | 211,465 | 351,678 | 242,257 | 271,628 | |||||||||||||||||||||||||||||||||||
Debt - Interest (1) (3) | 796,059 | 158,651 | 273,111 | 180,096 | 184,201 | |||||||||||||||||||||||||||||||||||
Acquisitions Under Contract (2) | 288,738 | 288,738 | — | — | — | 45,598 | 45,598 | — | — | — | ||||||||||||||||||||||||||||||
| Capital Improvements | 4,235 | 4,235 | — | — | — | 53,085 | 52,759 | 326 | — | — | ||||||||||||||||||||||||||||||
| Operating Lease Obligations | 23,979 | 1,743 | 3,584 | 3,814 | 14,838 | 38,918 | 2,912 | 6,047 | 6,009 | 23,950 | ||||||||||||||||||||||||||||||
| Total | $ | 5,815,200 | $ | 859,105 | $ | 1,544,118 | $ | 1,036,443 | $ | 2,375,534 | $ | 4,688,293 | $ | 473,967 | $ | 1,467,203 | $ | 1,223,818 | $ | 1,523,305 | ||||||||||||||||||||
(1) Excludes interest on defaulted mortgage loans. | ||||||||||||||||||||||||||||||||||||||||
(2) Contracts contain standard cancellation clauses contingent on results of due diligence. | ||||||||||||||||||||||||||||||||||||||||
| Years Ended | |||||||||||
| December 31, | |||||||||||
| 2016 | 2015 | Change | |||||||||
| Net cash provided by operating activities | $ | 361,409 | $ | 371,986 | $ | (10,577 | ) | ||||
| Net cash used in investing activities | (117,251 | ) | (385,696 | ) | 268,445 | ||||||
| Net cash used in financing activities | (255,889 | ) | (140,681 | ) | (115,208 | ) | |||||
| Net (decrease) increase in cash and cash equivalents | $ | (11,731 | ) | $ | (154,391 | ) | $ | 142,660 | |||
| Years Ended | |||||||||||
| December 31, | |||||||||||
| 2015 | 2014 | Change | |||||||||
| Net cash provided by operating activities | $ | 371,986 | $ | 218,571 | $ | 153,415 | |||||
| Net cash used in investing activities | (385,696 | ) | (878,030 | ) | 492,334 | ||||||
| Net cash provided by financing activities | (140,681 | ) | 769,052 | (909,733 | ) | ||||||
| Net increase (decrease) in cash and cash equivalents | $ | (154,391 | ) | $ | 109,593 | $ | (263,984 | ) | |||
| Carrying Value | Estimated Fair Value | ||||||
| Revolving credit facilities | $ | 15,181 | $ | 15,254 | |||
| Mortgages and notes payable, net | 3,658,496 | 3,899,950 | |||||
Convertible Notes, net (1) | 695,957 | 729,231 | |||||
(1) The carrying value of the Convertible Notes is net of an embedded conversion premium totaling $51.5 million. | |||||||
| Carrying Value | Estimated Fair Value | ||||||
| 2015 Credit Facility | $ | 86,000 | $ | 87,718 | |||
Term Loan, net (1) | 418,471 | 428,441 | |||||
Senior Unsecured Notes, net (1) | 295,112 | 283,473 | |||||
Mortgages and notes payable, net (1) | 2,162,403 | 2,282,142 | |||||
Convertible Notes, net (1) | 702,642 | 784,175 | |||||
| December 31, 2014 | December 31, 2013 | December 31, 2016 | December 31, 2015 | |||||||||||
| Assets | ||||||||||||||
| Investments: | ||||||||||||||
| Real estate investments: | ||||||||||||||
| Land and improvements | $ | 2,614,630 | $ | 2,330,510 | $ | 2,704,010 | $ | 2,710,888 | ||||||
| Buildings and improvements | 4,579,166 | 4,188,783 | 4,775,221 | 4,816,481 | ||||||||||
| Total real estate investments | 7,193,796 | 6,519,293 | 7,479,231 | 7,527,369 | ||||||||||
| Less: accumulated depreciation | (752,210 | ) | (590,067 | ) | (940,005 | ) | (860,954 | ) | ||||||
| 6,441,586 | 5,929,226 | 6,539,226 | 6,666,415 | |||||||||||
| Loans receivable, net | 109,425 | 117,721 | 66,578 | 104,003 | ||||||||||
| Intangible lease assets, net | 590,073 | 618,121 | 470,276 | 526,718 | ||||||||||
| Real estate assets under direct financing leases, net | 56,564 | 58,760 | 36,005 | 44,324 | ||||||||||
| Real estate assets held for sale, net | 119,912 | 19,611 | 160,570 | 84,259 | ||||||||||
| Net investments | 7,317,560 | 6,743,439 | 7,272,655 | 7,425,719 | ||||||||||
| Cash and cash equivalents | 176,181 | 66,588 | 10,059 | 21,790 | ||||||||||
| Deferred costs and other assets, net | 231,839 | 129,597 | 140,917 | 179,180 | ||||||||||
| Goodwill | 291,421 | 291,421 | 254,340 | 264,350 | ||||||||||
| Total assets | $ | 8,017,001 | $ | 7,231,045 | $ | 7,677,971 | $ | 7,891,039 | ||||||
| Liabilities and stockholders’ equity | ||||||||||||||
| Liabilities: | ||||||||||||||
| Revolving credit facilities | $ | 15,181 | $ | 35,120 | $ | 86,000 | $ | — | ||||||
| Term loan, net | 418,471 | 322,902 | ||||||||||||
| Senior unsecured notes | 295,112 | — | ||||||||||||
| Mortgages and notes payable, net | 3,658,496 | 3,743,098 | 2,162,403 | 3,079,787 | ||||||||||
| Convertible Notes, net | 695,957 | — | ||||||||||||
| Convertible notes, net | 702,642 | 690,098 | ||||||||||||
| Total debt, net | 3,664,628 | 4,092,787 | ||||||||||||
| Intangible lease liabilities, net | 205,968 | 220,114 | 182,320 | 193,903 | ||||||||||
| Accounts payable, accrued expenses and other liabilities | 123,298 | 114,679 | 148,915 | 142,475 | ||||||||||
| Total liabilities | 4,698,900 | 4,113,011 | 3,995,863 | 4,429,165 | ||||||||||
| Commitments and contingencies (see Note 10) | ||||||||||||||
| Commitments and contingencies (see Note 8) | ||||||||||||||
| Stockholders’ equity: | ||||||||||||||
| Common stock, $0.01 par value; 411,824,039 issued shares and 411,350,440 outstanding shares at December 31, 2014 and 370,570,565 issued shares and 370,363,803 outstanding shares at December 31, 2013 | 4,118 | 3,706 | ||||||||||||
| Common stock, $0.01 par value, 750,000,000 shares authorized: 483,624,120 shares and 441,819,964 shares issued and outstanding at December 31, 2016 and December 31, 2015, respectively | 4,836 | 4,418 | ||||||||||||
| Capital in excess of par value | 4,361,320 | 3,859,823 | 5,177,086 | 4,721,323 | ||||||||||
| Accumulated deficit | (1,041,392 | ) | (742,915 | ) | (1,499,814 | ) | (1,262,839 | ) | ||||||
| Accumulated other comprehensive loss | (1,083 | ) | (638 | ) | — | (1,028 | ) | |||||||
| Treasury stock, at cost | (4,862 | ) | (1,942 | ) | ||||||||||
| Total stockholders’ equity | 3,318,101 | 3,118,034 | 3,682,108 | 3,461,874 | ||||||||||
| Total liabilities and stockholders’ equity | $ | 8,017,001 | $ | 7,231,045 | $ | 7,677,971 | $ | 7,891,039 | ||||||
| Years Ended December 31, | |||||||||||
| 2014 | 2013 | 2012 | |||||||||
| Revenues: | |||||||||||
| Rentals | $ | 574,456 | $ | 404,402 | $ | 266,567 | |||||
| Interest income on loans receivable | 7,239 | 5,928 | 5,696 | ||||||||
| Earned income from direct financing leases | 3,343 | 1,572 | — | ||||||||
| Tenant reimbursement income | 13,085 | 5,637 | — | ||||||||
| Interest income and other | 4,748 | 1,928 | 852 | ||||||||
| Total revenues | 602,871 | 419,467 | 273,115 | ||||||||
| Expenses: | |||||||||||
| General and administrative | 44,252 | 35,146 | 36,252 | ||||||||
| Finance restructuring charges | 13,022 | 717 | — | ||||||||
| Merger costs | — | 56,644 | — | ||||||||
| Property costs | 23,383 | 11,760 | 5,176 | ||||||||
| Real estate acquisition costs | 3,631 | 1,718 | 1,054 | ||||||||
| Interest | 220,070 | 179,267 | 156,220 | ||||||||
| Depreciation and amortization | 247,966 | 164,054 | 104,984 | ||||||||
| Impairments (recoveries) | 36,019 | (185 | ) | 8,918 | |||||||
| Total expenses | 588,343 | 449,121 | 312,604 | ||||||||
| Income (loss) from continuing operations before other expense and income tax expense | 14,528 | (29,654 | ) | (39,489 | ) | ||||||
| Other expense: | |||||||||||
| Loss on debt extinguishment | (64,750 | ) | (2,405 | ) | (32,522 | ) | |||||
| Total other expense | (64,750 | ) | (2,405 | ) | (32,522 | ) | |||||
| Loss from continuing operations before income tax expense | (50,222 | ) | (32,059 | ) | (72,011 | ) | |||||
| Income tax expense | 673 | 1,113 | 504 | ||||||||
| Loss from continuing operations | (50,895 | ) | (33,172 | ) | (72,515 | ) | |||||
| Discontinued operations: | |||||||||||
| Income (loss) from discontinued operations | 3,368 | (2,077 | ) | (369 | ) | ||||||
| Gain (loss) on dispositions of assets | 488 | 36,926 | (3,349 | ) | |||||||
| Income (loss) from discontinued operations | 3,856 | 34,849 | (3,718 | ) | |||||||
| (Loss) income before dispositions of assets | (47,039 | ) | 1,677 | (76,233 | ) | ||||||
| Gain on dispositions of assets | 13,240 | — | — | ||||||||
| Net (loss) income | (33,799 | ) | 1,677 | (76,233 | ) | ||||||
| Less: preferred dividends | — | — | (63 | ) | |||||||
| Net (loss) income attributable to common stockholders | $ | (33,799 | ) | $ | 1,677 | $ | (76,296 | ) | |||
| Net (loss) income per share of common stock—basic and diluted: | |||||||||||
| Continuing operations | $ | (0.10 | ) | $ | (0.14 | ) | $ | (0.92 | ) | ||
| Discontinued operations | 0.01 | 0.14 | (0.05 | ) | |||||||
| Net (loss) income per share attributable to common stockholders - basic and diluted | $ | (0.09 | ) | $ | 0.00 | $ | (0.97 | ) | |||
| Weighted average common shares outstanding: | |||||||||||
| Basic and diluted | 386,809,746 | 255,020,565 | 78,625,102 | ||||||||
| Years Ended December 31, | |||||||||||
| 2016 | 2015 | 2014 | |||||||||
| Revenues: | |||||||||||
| Rentals | $ | 648,363 | $ | 634,151 | $ | 574,456 | |||||
| Interest income on loans receivable | 5,253 | 6,948 | 7,239 | ||||||||
| Earned income from direct financing leases | 2,742 | 3,024 | 3,343 | ||||||||
| Tenant reimbursement income | 14,125 | 15,952 | 13,085 | ||||||||
| Other income | 15,491 | 7,260 | 4,748 | ||||||||
| Total revenues | 685,974 | 667,335 | 602,871 | ||||||||
| Expenses: | �� | ||||||||||
| General and administrative | 52,615 | 47,730 | 42,637 | ||||||||
| Restructuring charges | 6,341 | 7,056 | — | ||||||||
| Finance restructuring costs | — | — | 13,022 | ||||||||
| Property costs | 30,839 | 27,715 | 23,383 | ||||||||
| Real estate acquisition costs | 3,229 | 2,739 | 3,631 | ||||||||
| Interest | 196,586 | 222,901 | 220,070 | ||||||||
| Depreciation and amortization | 262,276 | 260,633 | 247,966 | ||||||||
| Impairments | 88,275 | 70,695 | 37,598 | ||||||||
| Total expenses | 640,161 | 639,469 | 588,307 | ||||||||
| Income from continuing operations before other income (expense) and income tax expense | 45,813 | 27,866 | 14,564 | ||||||||
| Other income (expense): | |||||||||||
| Gain (loss) on debt extinguishment | 233 | (3,162 | ) | (64,750 | ) | ||||||
| Total other income (expense) | 233 | (3,162 | ) | (64,750 | ) | ||||||
| Income (loss) from continuing operations before income tax expense | 46,046 | 24,704 | (50,186 | ) | |||||||
| Income tax expense | (965 | ) | (601 | ) | (673 | ) | |||||
| Income (loss) from continuing operations | 45,081 | 24,103 | (50,859 | ) | |||||||
| Discontinued operations: | |||||||||||
| Income from discontinued operations | — | 98 | 3,368 | ||||||||
| Gain on disposition of assets | — | 590 | 325 | ||||||||
| Income from discontinued operations | — | 688 | 3,693 | ||||||||
| Income (loss) before gain on disposition of assets | 45,081 | 24,791 | (47,166 | ) | |||||||
| Gain on disposition of assets | 52,365 | 68,421 | 10,221 | ||||||||
| Net income (loss) attributable to common stockholders | $ | 97,446 | $ | 93,212 | $ | (36,945 | ) | ||||
| Net income (loss) per share of common stock—basic: | |||||||||||
| Continuing operations | $ | 0.21 | $ | 0.21 | $ | (0.11 | ) | ||||
| Discontinued operations | — | — | 0.01 | ||||||||
| Net income (loss) per share attributable to common stockholders—basic | $ | 0.21 | $ | 0.21 | $ | (0.10 | ) | ||||
| Net income (loss) per share of common stock—diluted: | |||||||||||
| Continuing operations | $ | 0.21 | $ | 0.21 | $ | (0.11 | ) | ||||
| Discontinued operations | — | — | 0.01 | ||||||||
| Net income (loss) per share attributable to common stockholders—diluted | $ | 0.21 | $ | 0.21 | $ | (0.10 | ) | ||||
| Weighted average shares of common stock outstanding: | |||||||||||
| Basic | 469,217,776 | 432,222,953 | 386,809,746 | ||||||||
| Diluted | 469,246,265 | 432,545,625 | 386,809,746 | ||||||||
| Years Ended December 31, | |||||||||||
| 2014 | 2013 | 2012 | |||||||||
| Net (loss) income | $ | (33,799 | ) | $ | 1,677 | $ | (76,233 | ) | |||
| Other comprehensive (loss) income: | |||||||||||
| Change in net unrealized losses on cash flow hedges | (1,760 | ) | (314 | ) | (902 | ) | |||||
| Net cash flow hedge losses reclassified to operations | 1,315 | 447 | 7,683 | ||||||||
| Total comprehensive (loss) income | $ | (34,244 | ) | $ | 1,810 | $ | (69,452 | ) | |||
| Years Ended December 31, | |||||||||||
| 2016 | 2015 | 2014 | |||||||||
| Net income (loss) attributable to common stockholders | $ | 97,446 | $ | 93,212 | $ | (36,945 | ) | ||||
| Other comprehensive income (loss): | |||||||||||
| Change in net unrealized losses on cash flow hedges | (1,137 | ) | (1,190 | ) | (1,760 | ) | |||||
| Net cash flow hedge losses reclassified to operations | 2,165 | 1,245 | 1,315 | ||||||||
| Total comprehensive income (loss) | $ | 98,474 | $ | 93,267 | $ | (37,390 | ) | ||||
| Common Stock | Treasury Stock | Common Stock | Accumulated Deficit | Total Stockholders’ Equity | ||||||||||||||||||||||||||||||||||||||||||||||||||||||
| Series A Cumulative Preferred Shares | Series A Cumulative Preferred Value | Shares | Par Value | Capital in Excess of Par Value | Accumulated Deficit | Accumulated Other Comprehensive Loss | Shares | Value | Total Stockholders’ Equity | Shares | Par Value | Capital in Excess of Par Value | AOCL | |||||||||||||||||||||||||||||||||||||||||||||
| Balances, December 31, 2011 | 125 | $ | 84 | 49,265,701 | $ | 493 | $ | 1,003,831 | $ | (470,496 | ) | $ | (7,552 | ) | — | $ | — | $ | 526,360 | |||||||||||||||||||||||||||||||||||||||
| Net loss | — | — | — | — | — | (76,233 | ) | — | — | — | (76,233 | ) | ||||||||||||||||||||||||||||||||||||||||||||||
| Other comprehensive income | — | — | — | — | — | — | 6,781 | — | — | 6,781 | ||||||||||||||||||||||||||||||||||||||||||||||||
| Issuance of common stock | — | — | 63,525,058 | 635 | 454,679 | — | — | — | — | 455,314 | ||||||||||||||||||||||||||||||||||||||||||||||||
| Issuance of common stock for TLC debt conversion | — | — | 46,182,406 | 462 | 363,217 | — | — | — | — | 363,679 | ||||||||||||||||||||||||||||||||||||||||||||||||
| Issuance of restricted common stock | — | — | 2,651,979 | 26 | (26 | ) | — | — | — | — | — | |||||||||||||||||||||||||||||||||||||||||||||||
| Preferred stock redemption | (125 | ) | (84 | ) | — | — | — | (55 | ) | — | — | — | (139 | ) | ||||||||||||||||||||||||||||||||||||||||||||
| Dividends declared on common stock | — | — | — | — | — | (28,242 | ) | — | — | — | (28,242 | ) | ||||||||||||||||||||||||||||||||||||||||||||||
| Stock-based compensation, net | — | — | — | — | 5,931 | — | — | — | — | 5,931 | ||||||||||||||||||||||||||||||||||||||||||||||||
| Dividends paid on preferred stock | — | — | — | — | — | (8 | ) | — | — | — | (8 | ) | ||||||||||||||||||||||||||||||||||||||||||||||
| Balances, December 31, 2012 | — | — | 161,625,144 | 1,616 | 1,827,632 | (575,034 | ) | (771 | ) | — | — | 1,253,443 | ||||||||||||||||||||||||||||||||||||||||||||||
| Common shares issued in connection with merger | — | — | 208,570,007 | 2,086 | 2,023,426 | — | — | — | — | 2,025,512 | ||||||||||||||||||||||||||||||||||||||||||||||||
| Net income | — | — | — | — | — | 1,677 | — | — | — | 1,677 | ||||||||||||||||||||||||||||||||||||||||||||||||
| Other comprehensive income | — | — | — | — | — | — | 133 | — | — | 133 | ||||||||||||||||||||||||||||||||||||||||||||||||
| Dividends declared on common stock | — | — | — | — | — | (169,395 | ) | — | — | — | (169,395 | ) | ||||||||||||||||||||||||||||||||||||||||||||||
| Repurchase of common shares | — | — | — | — | — | — | — | (206,762 | ) | (1,942 | ) | (1,942 | ) | |||||||||||||||||||||||||||||||||||||||||||||
| Stock-based compensation, net | — | — | 375,414 | 4 | 8,765 | (163 | ) | — | — | — | 8,606 | |||||||||||||||||||||||||||||||||||||||||||||||
| Balances, December 31, 2013 | — | — | 370,570,565 | 3,706 | 3,859,823 | (742,915 | ) | (638 | ) | (206,762 | ) | (1,942 | ) | 3,118,034 | 370,363,803 | $ | 3,704 | $ | 3,859,823 | $ | (748,148 | ) | $ | (638 | ) | $ | 3,114,741 | |||||||||||||||||||||||||||||||
| Net loss | — | — | — | — | — | (33,799 | ) | — | — | — | (33,799 | ) | — | — | — | (36,945 | ) | — | (36,945 | ) | ||||||||||||||||||||||||||||||||||||||
| Other comprehensive loss | — | — | — | — | — | — | (445 | ) | — | — | (445 | ) | — | — | — | — | (445 | ) | (445 | ) | ||||||||||||||||||||||||||||||||||||||
| Dividends declared on common stock | — | — | — | — | — | (264,113 | ) | — | — | — | (264,113 | ) | — | — | — | (264,113 | ) | — | (264,113 | ) | ||||||||||||||||||||||||||||||||||||||
| Repurchase of common shares | — | — | — | — | — | — | — | (266,837 | ) | (2,920 | ) | (2,920 | ) | |||||||||||||||||||||||||||||||||||||||||||||
| Issuance of common shares | — | — | 40,808,577 | 408 | 434,576 | — | — | — | — | 434,984 | ||||||||||||||||||||||||||||||||||||||||||||||||
| Embedded conversion premium of convertible notes, net | — | — | — | — | 55,131 | — | — | — | — | 55,131 | ||||||||||||||||||||||||||||||||||||||||||||||||
| Tax withholdings related to net stock settlements | (266,837 | ) | (3 | ) | — | (2,917 | ) | — | (2,920 | ) | ||||||||||||||||||||||||||||||||||||||||||||||||
| Issuance of shares of common stock, net | 40,808,577 | 408 | 434,576 | — | — | 434,984 | ||||||||||||||||||||||||||||||||||||||||||||||||||||
| Embedded conversion premium of Convertible Notes, net | — | — | 55,131 | — | — | 55,131 | ||||||||||||||||||||||||||||||||||||||||||||||||||||
| Exercise of stock options | — | — | 20,000 | — | 183 | — | — | — | — | 183 | 20,000 | — | 183 | — | — | 183 | ||||||||||||||||||||||||||||||||||||||||||
| Stock-based compensation, net | — | — | 424,897 | 4 | 11,607 | (565 | ) | — | — | — | 11,046 | 424,897 | 4 | 11,607 | (565 | ) | — | 11,046 | ||||||||||||||||||||||||||||||||||||||||
| Balances, December 31, 2014 | — | $ | — | 411,824,039 | $ | 4,118 | $ | 4,361,320 | $ | (1,041,392 | ) | $ | (1,083 | ) | (473,599 | ) | $ | (4,862 | ) | $ | 3,318,101 | 411,350,440 | 4,113 | 4,361,320 | (1,052,688 | ) | (1,083 | ) | 3,311,662 | |||||||||||||||||||||||||||||
| Net income | — | — | — | 93,212 | — | 93,212 | ||||||||||||||||||||||||||||||||||||||||||||||||||||
| Other comprehensive income | — | — | — | — | 55 | 55 | ||||||||||||||||||||||||||||||||||||||||||||||||||||
| Dividends declared on common stock | — | — | — | (298,531 | ) | — | (298,531 | ) | ||||||||||||||||||||||||||||||||||||||||||||||||||
| Tax withholdings related to net stock settlements | (426,158 | ) | (4 | ) | — | (4,268 | ) | — | (4,272 | ) | ||||||||||||||||||||||||||||||||||||||||||||||||
| Issuance of shares of common stock, net | 29,610,100 | 296 | 346,915 | — | — | 347,211 | ||||||||||||||||||||||||||||||||||||||||||||||||||||
| Exercise of stock options | 5,000 | — | 46 | — | — | 46 | ||||||||||||||||||||||||||||||||||||||||||||||||||||
| Stock-based compensation, net | 1,280,582 | 13 | 13,042 | (564 | ) | — | 12,491 | |||||||||||||||||||||||||||||||||||||||||||||||||||
| Balances, December 31, 2015 | 441,819,964 | 4,418 | 4,721,323 | (1,262,839 | ) | (1,028 | ) | 3,461,874 | ||||||||||||||||||||||||||||||||||||||||||||||||||
| Net income | — | — | — | 97,446 | — | 97,446 | ||||||||||||||||||||||||||||||||||||||||||||||||||||
| Other comprehensive income | — | — | — | — | 1,028 | 1,028 | ||||||||||||||||||||||||||||||||||||||||||||||||||||
| Dividends declared on common stock | — | — | — | (333,180 | ) | — | (333,180 | ) | ||||||||||||||||||||||||||||||||||||||||||||||||||
| Tax withholdings related to net stock settlements | (72,835 | ) | (1 | ) | — | (752 | ) | — | (753 | ) | ||||||||||||||||||||||||||||||||||||||||||||||||
| Issuance of shares of common stock, net | 40,835,360 | 408 | 446,205 | — | — | 446,613 | ||||||||||||||||||||||||||||||||||||||||||||||||||||
| Stock-based compensation, net | 1,041,631 | 11 | 9,558 | (489 | ) | — | 9,080 | |||||||||||||||||||||||||||||||||||||||||||||||||||
| Balances, December 31, 2016 | 483,624,120 | $ | 4,836 | $ | 5,177,086 | $ | (1,499,814 | ) | $ | — | $ | 3,682,108 | ||||||||||||||||||||||||||||||||||||||||||||||
| Years Ended December 31, | |||||||||||
| 2014 | 2013 | 2012 | |||||||||
| Operating activities | |||||||||||
| Net (loss) income | $ | (33,799 | ) | $ | 1,677 | $ | (76,233 | ) | |||
| Adjustments to reconcile net (loss) income to net cash provided by operating activities: | |||||||||||
| Depreciation and amortization | 247,966 | 167,599 | 112,100 | ||||||||
| Impairments | 36,436 | 6,949 | 13,552 | ||||||||
| Amortization of deferred financing costs | 5,899 | 13,188 | 2,819 | ||||||||
| Derivative net settlements, amortization and other interest rate hedge losses | (114 | ) | (289 | ) | 11,465 | ||||||
| Payments to terminate interest rate swap | — | (376 | ) | — | |||||||
| Amortization of debt (premium) discounts | (849 | ) | 4,653 | 10,900 | |||||||
| Stock-based compensation expense | 11,346 | 8,769 | 5,931 | ||||||||
| Loss on debt extinguishment, net | 64,750 | 1,377 | 32,522 | ||||||||
| Debt extinguishment costs | (59,576 | ) | — | — | |||||||
| (Gains) losses on dispositions of real estate and other assets, net | (13,728 | ) | (37,174 | ) | 3,529 | ||||||
| Non-cash revenue | (16,732 | ) | (18,755 | ) | (3,283 | ) | |||||
| Other | 260 | (53 | ) | 216 | |||||||
| Changes in operating assets and liabilities: | |||||||||||
| Deferred costs and other assets | (25,466 | ) | (7,255 | ) | 418 | ||||||
| Accounts payable, accrued expenses and other liabilities | 2,178 | (2,206 | ) | (2,163 | ) | ||||||
| Net cash provided by operating activities | 218,571 | 138,104 | 111,773 | ||||||||
| Investing activities | |||||||||||
| Acquisitions/improvements of real estate | (936,448 | ) | (401,422 | ) | (163,779 | ) | |||||
| Investments in loans receivable | — | — | (3,743 | ) | |||||||
| Collections of principal on loans receivable and real estate assets under direct financing leases | 6,085 | 15,260 | 17,343 | ||||||||
| Proceeds from dispositions of real estate and other assets | 104,292 | 205,816 | 45,998 | ||||||||
| Cash acquired in connection with merger | — | 7,347 | — | ||||||||
| Transfers of sale proceeds and loan principal collections (to) from restricted account | (51,959 | ) | 13,406 | (5,133 | ) | ||||||
| Net cash used in investing activities | (878,030 | ) | (159,593 | ) | (109,314 | ) | |||||
| Financing activities | |||||||||||
| Borrowings under credit facilities | 875,722 | 386,705 | — | ||||||||
| Repayments under credit facilities | (895,661 | ) | (351,585 | ) | — | ||||||
| Repayment of line of credit previously belonging to Cole II | — | (324,111 | ) | — | |||||||
| Borrowings under mortgages and notes payable | 518,846 | 620,290 | 44,210 | ||||||||
| Borrowings under Convertible Notes | 747,500 | — | — | ||||||||
| Repayments under mortgages and notes payable | (610,973 | ) | (127,572 | ) | (46,929 | ) | |||||
| Repayments/repurchases of term note payable | — | — | (398,983 | ) | |||||||
| Deferred financing costs | (30,772 | ) | (34,399 | ) | (3,436 | ) | |||||
| Proceeds from issuance of common stock, net of offering costs | 434,984 | (518 | ) | 457,115 | |||||||
| Offering costs paid on equity component of Convertible Notes | (1,609 | ) | — | — | |||||||
| Purchase of treasury stock | (2,920 | ) | (1,942 | ) | — | ||||||
| Consent fees paid to lenders | — | (5,449 | ) | (10,672 | ) | ||||||
| Years Ended December 31, | |||||||||||
| 2016 | 2015 | 2014 | |||||||||
| Operating activities | |||||||||||
| Net income (loss) attributable to common stockholders | $ | 97,446 | $ | 93,212 | $ | (36,945 | ) | ||||
| Adjustments to reconcile net income (loss) attributable to common stockholders to net cash provided by operating activities: | |||||||||||
| Depreciation and amortization | 262,276 | 260,633 | 247,966 | ||||||||
| Impairments | 88,275 | 70,729 | 38,015 | ||||||||
| Amortization of deferred financing costs | 9,070 | 7,937 | 5,899 | ||||||||
| Payments to terminate interest rate swap | (1,724 | ) | — | — | |||||||
| Derivative net settlements, amortization and terminations | 1,811 | (132 | ) | (114 | ) | ||||||
| Amortization of debt discounts (premium) | 6,217 | 2,322 | (849 | ) | |||||||
| Stock-based compensation expense | 9,570 | 13,321 | 11,346 | ||||||||
| (Gain) loss on debt extinguishment, net | (233 | ) | 3,162 | 64,750 | |||||||
| Debt extinguishment costs | (26,219 | ) | (8,112 | ) | (59,576 | ) | |||||
| Gains on dispositions of real estate and other assets, net | (52,365 | ) | (69,011 | ) | (10,546 | ) | |||||
| Non-cash revenue | (26,333 | ) | (20,930 | ) | (16,732 | ) | |||||
| Other | (594 | ) | 151 | (1,355 | ) | ||||||
| Changes in operating assets and liabilities: | |||||||||||
| Deferred costs and other assets, net | (6,561 | ) | (604 | ) | (25,466 | ) | |||||
| Accounts payable, accrued expenses and other liabilities | 6,308 | 13,382 | 2,178 | ||||||||
| Accrued restructuring charges | (5,535 | ) | 5,926 | — | |||||||
| Net cash provided by operating activities | 361,409 | 371,986 | 218,571 | ||||||||
| Investing activities | |||||||||||
| Acquisitions of real estate | (655,835 | ) | (875,983 | ) | (958,038 | ) | |||||
| Capitalized real estate expenditures | (27,078 | ) | (10,269 | ) | (5,087 | ) | |||||
| Investments in loans receivable | (5,073 | ) | (4,020 | ) | — | ||||||
| Collections of principal on loans receivable and real estate assets under direct financing leases | 8,410 | 6,822 | 6,085 | ||||||||
| Proceeds from dispositions of real estate and other assets | 524,776 | 496,646 | 110,185 | ||||||||
| Transfers of net sales proceeds from (to) restricted accounts pursuant to 1031 Exchanges | 39,869 | (39,869 | ) | 20,784 | |||||||
| Transfers of net sales proceeds (to) from Master Trust Release | (2,320 | ) | 40,977 | (51,959 | ) | ||||||
| Net cash used in investing activities | (117,251 | ) | (385,696 | ) | (878,030 | ) | |||||
| Years Ended December 31, | |||||||||||
| 2014 | 2013 | 2012 | |||||||||
| Proceeds from exercise of stock options | 183 | — | — | ||||||||
| Redemption of preferred stock | — | — | (139 | ) | |||||||
| Dividends paid/distributions to equity owners | (255,771 | ) | (136,091 | ) | (8 | ) | |||||
| Transfers to escrow deposits with lenders | (10,477 | ) | (10,819 | ) | (19,585 | ) | |||||
| Net cash provided by financing activities | 769,052 | 14,509 | 21,573 | ||||||||
| Net increase (decrease) in cash and cash equivalents | 109,593 | (6,980 | ) | 24,032 | |||||||
| Cash and cash equivalents, beginning of period | 66,588 | 73,568 | 49,536 | ||||||||
| Cash and cash equivalents, end of period | $ | 176,181 | $ | 66,588 | $ | 73,568 | |||||
| Years Ended December 31, | |||||||||||
| 2016 | 2015 | 2014 | |||||||||
| Financing activities | |||||||||||
| Borrowings under Revolving Credit Facilities | 1,080,000 | 798,000 | 875,722 | ||||||||
| Repayments under Revolving Credit Facilities | (994,000 | ) | (813,181 | ) | (895,661 | ) | |||||
| Borrowings under mortgages and notes payable | — | — | 518,846 | ||||||||
| Repayments under mortgages and notes payable | (863,836 | ) | (512,486 | ) | (610,973 | ) | |||||
| Borrowings under Convertible Notes | — | — | 747,500 | ||||||||
| Borrowings under Term Loan | 796,000 | 325,000 | — | ||||||||
| Repayments under Term Loan | (701,000 | ) | — | — | |||||||
| Borrowings under Senior Unsecured Notes | 298,134 | — | — | ||||||||
| Deferred financing costs | (4,352 | ) | (6,150 | ) | (30,772 | ) | |||||
| Proceeds from issuance of common stock, net of offering costs | 446,613 | 347,211 | 434,984 | ||||||||
| Offering costs paid on equity component of Convertible Notes | — | — | (1,609 | ) | |||||||
| Repurchase of shares of common stock | (753 | ) | (4,272 | ) | (2,920 | ) | |||||
| Proceeds from exercise of stock options | — | 46 | 183 | ||||||||
| Distributions paid | (323,640 | ) | (292,262 | ) | (255,771 | ) | |||||
| Transfers to (from) reserve/escrow deposits with lenders | 10,945 | 17,413 | (10,477 | ) | |||||||
| Net cash (used in) provided by financing activities | (255,889 | ) | (140,681 | ) | 769,052 | ||||||
| Net (decrease) increase in cash and cash equivalents | (11,731 | ) | (154,391 | ) | 109,593 | ||||||
| Cash and cash equivalents, beginning of year | 21,790 | 176,181 | 66,588 | ||||||||
| Cash and cash equivalents, end of year | $ | 10,059 | $ | 21,790 | $ | 176,181 | |||||
| December 31, 2016 | December 31, 2015 | ||||||
| Assets | |||||||
| Investments: | |||||||
| Real estate investments: | |||||||
| Land and improvements | $ | 2,704,010 | $ | 2,710,888 | |||
| Buildings and improvements | 4,775,221 | 4,816,481 | |||||
| Total real estate investments | 7,479,231 | 7,527,369 | |||||
| Less: accumulated depreciation | (940,005 | ) | (860,954 | ) | |||
| 6,539,226 | 6,666,415 | ||||||
| Loans receivable, net | 66,578 | 104,003 | |||||
| Intangible lease assets, net | 470,276 | 526,718 | |||||
| Real estate assets under direct financing leases, net | 36,005 | 44,324 | |||||
| Real estate assets held for sale, net | 160,570 | 84,259 | |||||
| Net investments | 7,272,655 | 7,425,719 | |||||
| Cash and cash equivalents | 10,059 | 21,790 | |||||
| Deferred costs and other assets, net | 140,917 | 179,180 | |||||
| Goodwill | 254,340 | 264,350 | |||||
| Total assets | $ | 7,677,971 | $ | 7,891,039 | |||
| Liabilities and stockholders’ equity | |||||||
| Liabilities: | |||||||
| Revolving credit facilities | $ | 86,000 | $ | — | |||
| Term loan, net | 418,471 | 322,902 | |||||
| Senior unsecured notes | 295,112 | — | |||||
| Mortgages and notes payable, net | 2,162,403 | 3,079,787 | |||||
| Notes payable to Spirit Realty Capital, Inc., net | 702,642 | 690,098 | |||||
| Total debt, net | 3,664,628 | 4,092,787 | |||||
| Intangible lease liabilities, net | 182,320 | 193,903 | |||||
| Accounts payable, accrued expenses and other liabilities | 148,915 | 142,475 | |||||
| Total liabilities | 3,995,863 | 4,429,165 | |||||
| Commitments and contingencies (see Note 8) | |||||||
| Partners' Capital | |||||||
| Partnership units | |||||||
| General partner's capital, 3,988,218 units issued and outstanding as of both December 31, 2016 and December 31, 2015 | 26,586 | 28,574 | |||||
| Limited partners' capital, 479,635,902 and 437,831,746 units issued and outstanding as of December 31, 2016 and December 31, 2015, respectively | 3,655,522 | 3,433,300 | |||||
| Total partners' capital | 3,682,108 | 3,461,874 | |||||
| Total liabilities and partners' capital | $ | 7,677,971 | $ | 7,891,039 | |||
| Years Ended December 31, | |||||||||||
| 2016 | 2015 | 2014 | |||||||||
| Revenues: | |||||||||||
| Rentals | $ | 648,363 | $ | 634,151 | $ | 574,456 | |||||
| Interest income on loans receivable | 5,253 | 6,948 | 7,239 | ||||||||
| Earned income from direct financing leases | 2,742 | 3,024 | 3,343 | ||||||||
| Tenant reimbursement income | 14,125 | 15,952 | 13,085 | ||||||||
| Other income | 15,491 | 7,260 | 4,748 | ||||||||
| Total revenues | 685,974 | 667,335 | 602,871 | ||||||||
| Expenses: | |||||||||||
| General and administrative | 52,615 | 47,730 | 42,637 | ||||||||
| Restructuring charges | 6,341 | 7,056 | — | ||||||||
| Finance restructuring costs | — | — | 13,022 | ||||||||
| Property costs | 30,839 | 27,715 | 23,383 | ||||||||
| Real estate acquisition costs | 3,229 | 2,739 | 3,631 | ||||||||
| Interest | 196,586 | 222,901 | 220,070 | ||||||||
| Depreciation and amortization | 262,276 | 260,633 | 247,966 | ||||||||
| Impairments | 88,275 | 70,695 | 37,598 | ||||||||
| Total expenses | 640,161 | 639,469 | 588,307 | ||||||||
| Income from continuing operations before other income (expense) and income tax expense | 45,813 | 27,866 | 14,564 | ||||||||
| Other income (expense): | |||||||||||
| Gain (loss) on debt extinguishment | 233 | (3,162 | ) | (64,750 | ) | ||||||
| Total other income (expense) | 233 | (3,162 | ) | (64,750 | ) | ||||||
| Income (loss) from continuing operations before income tax expense | 46,046 | 24,704 | (50,186 | ) | |||||||
| Income tax expense | (965 | ) | (601 | ) | (673 | ) | |||||
| Income (loss) from continuing operations | 45,081 | 24,103 | (50,859 | ) | |||||||
| Discontinued operations: | |||||||||||
| Income from discontinued operations | — | 98 | 3,368 | ||||||||
| Gain on disposition of assets | — | 590 | 325 | ||||||||
| Income from discontinued operations | — | 688 | 3,693 | ||||||||
| Income (loss) before gain on disposition of assets | 45,081 | 24,791 | (47,166 | ) | |||||||
| Gain on disposition of assets | 52,365 | 68,421 | 10,221 | ||||||||
| Net income (loss) | $ | 97,446 | $ | 93,212 | $ | (36,945 | ) | ||||
| Net income (loss) attributable to the general partner | 825 | 855 | (378 | ) | |||||||
| Net income (loss) attributable to the limited partners | 96,621 | 92,357 | (36,567 | ) | |||||||
| Net income (loss) per partnership unit - basic: | |||||||||||
| Continuing operations | $ | 0.21 | $ | 0.21 | $ | (0.11 | ) | ||||
| Discontinued operations | — | — | 0.01 | ||||||||
| Net income (loss) per partnership unit - basic | $ | 0.21 | $ | 0.21 | $ | (0.10 | ) | ||||
| Net income (loss) per partnership unit - diluted: | |||||||||||
| Continuing operations | $ | 0.21 | $ | 0.21 | $ | (0.11 | ) | ||||
| Discontinued operations | — | — | 0.01 | ||||||||
| Net income (loss) per partnership unit —diluted | $ | 0.21 | $ | 0.21 | $ | (0.10 | ) | ||||
| Weighted average partnership units outstanding: | |||||||||||
| Basic | 469,217,776 | 432,222,953 | 386,809,746 | ||||||||
| Diluted | 469,246,265 | 432,545,625 | 386,809,746 | ||||||||
| Years Ended December 31, | |||||||||||
| 2016 | 2015 | 2014 | |||||||||
| Net income (loss) | $ | 97,446 | $ | 93,212 | $ | (36,945 | ) | ||||
| Other comprehensive income (loss): | |||||||||||
| Change in net unrealized losses on cash flow hedges | (1,137 | ) | (1,190 | ) | (1,760 | ) | |||||
| Net cash flow hedge losses reclassified to operations | 2,165 | 1,245 | 1,315 | ||||||||
| Total comprehensive income (loss) | $ | 98,474 | $ | 93,267 | $ | (37,390 | ) | ||||
General Partner's Capital (1) | Limited Partners' Capital (2) | Total Partnership Capital | |||||||||||||||
| Units | Amount | Units | Amount | ||||||||||||||
| Balances, December 31, 2013 | 3,988,218 | $ | 33,541 | 366,375,585 | $ | 3,081,200 | $ | 3,114,741 | |||||||||
| Net loss | — | (378 | ) | — | (36,567 | ) | (36,945 | ) | |||||||||
| Other comprehensive loss | — | (5 | ) | — | (440 | ) | (445 | ) | |||||||||
| Partnership distributions declared | — | (2,702 | ) | — | (261,411 | ) | (264,113 | ) | |||||||||
| Tax withholdings related to net partnership unit settlements | — | — | (266,837 | ) | (2,920 | ) | (2,920 | ) | |||||||||
| Contributions from partners | — | — | 40,808,577 | 434,984 | 434,984 | ||||||||||||
| Embedded conversion premium of Convertible Notes, net | — | — | — | 55,131 | 55,131 | ||||||||||||
| Exercise of partnership units | — | — | 20,000 | 183 | 183 | ||||||||||||
| Stock-based compensation | — | — | 424,897 | 11,046 | 11,046 | ||||||||||||
| Balances, December 31, 2014 | 3,988,218 | $ | 30,456 | 407,362,222 | $ | 3,281,206 | $ | 3,311,662 | |||||||||
| Net income | — | 855 | — | 92,357 | 93,212 | ||||||||||||
| Other comprehensive income | — | 1 | — | 54 | 55 | ||||||||||||
| Partnership distributions declared | — | (2,738 | ) | — | (295,793 | ) | (298,531 | ) | |||||||||
| Tax withholdings related to net partnership unit settlements | — | — | (426,158 | ) | (4,272 | ) | (4,272 | ) | |||||||||
| Contributions from partners | — | — | 29,610,100 | 347,211 | 347,211 | ||||||||||||
| Exercise of stock options | — | — | 5,000 | 46 | 46 | ||||||||||||
| Stock-based compensation | — | — | 1,280,582 | 12,491 | 12,491 | ||||||||||||
| Balances, December 31, 2015 | 3,988,218 | $ | 28,574 | 437,831,746 | $ | 3,433,300 | $ | 3,461,874 | |||||||||
| Net income | — | 825 | — | 96,621 | 97,446 | ||||||||||||
| Other comprehensive income | — | 9 | — | 1,019 | 1,028 | ||||||||||||
| Partnership distributions declared | — | (2,822 | ) | — | (330,358 | ) | (333,180 | ) | |||||||||
| Tax withholdings related to net partnership unit settlements | — | — | (72,835 | ) | (753 | ) | (753 | ) | |||||||||
| Contributions from partners | — | — | 40,835,360 | 446,613 | 446,613 | ||||||||||||
| Stock-based compensation | — | — | 1,041,631 | 9,080 | 9,080 | ||||||||||||
| Balances, December 31, 2016 | 3,988,218 | $ | 26,586 | 479,635,902 | $ | 3,655,522 | $ | 3,682,108 | |||||||||
| Years Ended December 31, | |||||||||||
| 2016 | 2015 | 2014 | |||||||||
| Operating activities | |||||||||||
| Net income (loss) | $ | 97,446 | $ | 93,212 | $ | (36,945 | ) | ||||
| Adjustments to reconcile net income (loss) to net cash provided by operating activities: | |||||||||||
| Depreciation and amortization | 262,276 | 260,633 | 247,966 | ||||||||
| Impairments | 88,275 | 70,729 | 38,015 | ||||||||
| Amortization of deferred financing costs | 9,070 | 7,937 | 5,899 | ||||||||
| Payments to terminate interest rate swap | (1,724 | ) | — | — | |||||||
| Derivative net settlements, amortization and terminations | 1,811 | (132 | ) | (114 | ) | ||||||
| Amortization of debt discounts (premium) | 6,217 | 2,322 | (849 | ) | |||||||
| Stock-based compensation expense | 9,570 | 13,321 | 11,346 | ||||||||
| (Gain) loss on debt extinguishment, net | (233 | ) | 3,162 | 64,750 | |||||||
| Debt extinguishment costs | (26,219 | ) | (8,112 | ) | (59,576 | ) | |||||
| Gains on dispositions of real estate and other assets, net | (52,365 | ) | (69,011 | ) | (10,546 | ) | |||||
| Non-cash revenue | (26,333 | ) | (20,930 | ) | (16,732 | ) | |||||
| Other | (594 | ) | 151 | (1,355 | ) | ||||||
| Changes in operating assets and liabilities: | |||||||||||
| Deferred costs and other assets, net | (6,561 | ) | (604 | ) | (25,466 | ) | |||||
| Accounts payable, accrued expenses and other liabilities | 6,308 | 13,382 | 2,178 | ||||||||
| Accrued restructuring charges | (5,535 | ) | 5,926 | — | |||||||
| Net cash provided by operating activities | 361,409 | 371,986 | 218,571 | ||||||||
| Investing activities | |||||||||||
| Acquisitions of real estate | (655,835 | ) | (875,983 | ) | (958,038 | ) | |||||
| Capitalized real estate expenditures | (27,078 | ) | (10,269 | ) | (5,087 | ) | |||||
| Investments in loans receivable | (5,073 | ) | (4,020 | ) | — | ||||||
| Collections of principal on loans receivable and real estate assets under direct financing leases | 8,410 | 6,822 | 6,085 | ||||||||
| Proceeds from dispositions of real estate and other assets | 524,776 | 496,646 | 110,185 | ||||||||
| Transfers of net sales proceeds from (to) restricted accounts pursuant to 1031 Exchanges | 39,869 | (39,869 | ) | 20,784 | |||||||
| Transfers of net sales proceeds (to) from Master Trust Release | (2,320 | ) | 40,977 | (51,959 | ) | ||||||
| Net cash used in investing activities | (117,251 | ) | (385,696 | ) | (878,030 | ) | |||||
| Years Ended December 31, | |||||||||||
| 2016 | 2015 | 2014 | |||||||||
| Financing activities | |||||||||||
| Borrowings under Revolving Credit Facilities | 1,080,000 | 798,000 | 875,722 | ||||||||
| Repayments under Revolving Credit Facilities | (994,000 | ) | (813,181 | ) | (895,661 | ) | |||||
| Borrowings under mortgages and notes payable | — | — | 518,846 | ||||||||
| Repayments under mortgages and notes payable | (863,836 | ) | (512,486 | ) | (610,973 | ) | |||||
| Borrowings under notes payable to affiliate | — | — | 747,500 | ||||||||
| Borrowings under Term Loan | 796,000 | 325,000 | — | ||||||||
| Repayments under Term Loan | (701,000 | ) | — | — | |||||||
| Borrowings under Senior Unsecured Notes | 298,134 | — | — | ||||||||
| Deferred financing costs | (4,352 | ) | (6,150 | ) | (30,772 | ) | |||||
| Proceeds from issuance of common stock, net of offering costs | 446,613 | 347,211 | 434,984 | ||||||||
| Offering costs paid on equity component of notes payable to affiliate | — | — | (1,609 | ) | |||||||
| Repurchase of partnership units | (753 | ) | (4,272 | ) | (2,920 | ) | |||||
| Proceeds from exercise of partnership units | — | 46 | 183 | ||||||||
| Distributions paid | (323,640 | ) | (292,262 | ) | (255,771 | ) | |||||
| Transfers to (from) reserve/escrow deposits with lenders | 10,945 | 17,413 | (10,477 | ) | |||||||
| Net cash (used in) provided by financing activities | (255,889 | ) | (140,681 | ) | 769,052 | ||||||
| Net (decrease) increase in cash and cash equivalents | (11,731 | ) | (154,391 | ) | 109,593 | ||||||
| Cash and cash equivalents, beginning of year | 21,790 | 176,181 | 66,588 | ||||||||
| Cash and cash equivalents, end of year | $ | 10,059 | $ | 21,790 | $ | 176,181 | |||||
| Consolidated | |||
| Balance as of December 31, 2013 | 288,128 | ||
| Goodwill allocated to disposition of real estate assets | (2,280 | ) | |
| Balance as of December 31, 2014 | 285,848 | ||
| Goodwill allocated to disposition of real estate assets | (21,498 | ) | |
| Balance as of December 31, 2015 | 264,350 | ||
| Goodwill allocated to disposition of real estate assets | (10,010 | ) | |
| Balance as of December 31, 2016 | $ | 254,340 | |
| December 31, 2014 | December 31, 2013 | December 31, 2016 | December 31, 2015 | |||||||||||
Collateral deposits (1) | $ | 29,483 | $ | 21,816 | $ | 1,374 | $ | 14,475 | ||||||
Tenant improvements, repairs, and leasing commissions (2) | 13,427 | 10,297 | 9,739 | 8,362 | ||||||||||
Master trust release / title company escrow (3) | 53,069 | 21,893 | ||||||||||||
Master Trust Release (3) | 14,412 | 12,091 | ||||||||||||
| 1031 Exchange proceeds, net | — | 39,869 | ||||||||||||
Loan impounds (4) | 794 | 2,018 | 670 | 1,025 | ||||||||||
Other (5) | 3,571 | 2,667 | 644 | 1,823 | ||||||||||
| $ | 100,344 | $ | 58,691 | $ | 26,839 | $ | 77,645 | |||||||
| Cole II shares outstanding | 208,570,007 | ||
| Inverse of exchange ratio | 0.525 | ||
| 109,499,254 | |||
| Spirit Realty Capital share price | $ | 18.50 | |
| Consideration paid | $ | 2,025,737 | |
| Assets | |||
| Investments: | |||
| Real estate investments: | |||
| Land and improvements | $ | 944,060 | |
| Buildings and improvements | 2,203,859 | ||
| Real estate investments under direct financing leases, net | 58,765 | ||
| Loans receivable, net | 81,433 | ||
| Intangible lease assets | 482,321 | ||
| Net investments | 3,770,438 | ||
| Cash and cash equivalents | 7,347 | ||
| Deferred costs and other assets, net | 13,608 | ||
| Total assets | $ | 3,791,393 | |
| Liabilities | |||
| Revolving credit facilities | $ | 324,111 | |
| Mortgages and notes payable, net | 1,512,029 | ||
| Intangible lease liabilities | 190,330 | ||
| Accounts payable, accrued expenses and other liabilities | 30,607 | ||
| Total liabilities | $ | 2,057,077 | |
| Fair value of net assets acquired | $ | 1,734,316 | |
| Years Ended December 31, | ||||||||
| 2013 | 2012 | |||||||
| Total revenues | $ | 556,647 | $ | 532,560 | ||||
| Income from continuing operations | 64,018 | 16,876 | ||||||
| Years Ended December 31, | ||||||||
| 2013 | 2012 | |||||||
| Pro forma Merger adjustments | $ | 69,666 | $ | (5,485 | ) | |||
Number of Properties Owned or Financed | Investments (1) | |||||
| (in thousands) | ||||||
| Balance, December 31, 2012 | 1,207 | $ | 3,654,925 | |||
| Acquisitions/improvements and loan originations - Non-merger | 194 | 422,458 | ||||
| Acquisitions/improvements and loan originations - Cole/Merger | 816 | 3,580,108 | ||||
Dispositions of real estate (2) (3) (Note 13) | (22 | ) | (396,717 | ) | ||
| Principal payments and payoffs | (9 | ) | (15,254 | ) | ||
| Impairments | — | (7,233 | ) | |||
| Loan premium amortization and other | — | (2,555 | ) | |||
| Balance, December 31, 2013 | 2,186 | 7,235,732 | ||||
Acquisitions/improvements (4) | 361 | 973,653 | ||||
Dispositions of real estate (2) (Note 13) | (38 | ) | (117,755 | ) | ||
| Principal payments and payoffs | — | (5,771 | ) | |||
| Impairments | — | (35,908 | ) | |||
| Write off of gross lease intangibles | — | (2,748 | ) | |||
| Loan premium amortization and other | — | (2,840 | ) | |||
| Balance, December 31, 2014 | 2,509 | $ | 8,044,363 | |||
| Number of Properties | Dollar Amount of Investments | |||||||||||||||||||
| Owned | Financed | Total | Owned | Financed | Total | |||||||||||||||
| (In Thousands) | ||||||||||||||||||||
| Gross balance, December 31, 2014 | 2,364 | 145 | 2,509 | $ | 7,934,072 | $ | 109,425 | $ | 8,043,497 | |||||||||||
Acquisitions/improvements (1) | 232 | — | 232 | 886,252 | 4,020 | 890,272 | ||||||||||||||
Dispositions of real estate (2) | (110 | ) | — | (110 | ) | (543,935 | ) | — | (543,935 | ) | ||||||||||
| Principal payments and payoffs | — | (1 | ) | (1 | ) | — | (6,650 | ) | (6,650 | ) | ||||||||||
| Impairments | — | — | — | (70,231 | ) | (324 | ) | (70,555 | ) | |||||||||||
| Write-off of gross lease intangibles | — | — | — | (7,302 | ) | — | (7,302 | ) | ||||||||||||
| Loan premium amortization and other | (1 | ) | — | (1 | ) | (171 | ) | (2,468 | ) | (2,639 | ) | |||||||||
| Gross balance, December 31, 2015 | 2,485 | 144 | 2,629 | 8,198,685 | 104,003 | 8,302,688 | ||||||||||||||
Acquisitions/improvements (1) | 269 | — | 269 | 711,510 | — | 711,510 | ||||||||||||||
Dispositions of real estate (2) | (213 | ) | — | (213 | ) | (598,662 | ) | — | (598,662 | ) | ||||||||||
| Principal payments and payoffs | — | (70 | ) | (70 | ) | — | (34,955 | ) | (34,955 | ) | ||||||||||
| Impairments | — | — | — | (88,073 | ) | (176 | ) | (88,249 | ) | |||||||||||
| Write-off of gross lease intangibles | — | — | — | (42,307 | ) | — | (42,307 | ) | ||||||||||||
| Loan premium amortization and other | — | — | — | (77 | ) | (2,294 | ) | (2,371 | ) | |||||||||||
| Gross balance, December 31, 2016 | 2,541 | 74 | 2,615 | $ | 8,181,076 | $ | 66,578 | $ | 8,247,654 | |||||||||||
| Accumulated depreciation and amortization | (1,158,608 | ) | — | (1,158,608 | ) | |||||||||||||||
| Other non-real estate assets held for sale | 1,289 | — | 1,289 | |||||||||||||||||
| Net balance, December 31, 2016 | $ | 7,023,757 | $ | 66,578 | $ | 7,090,335 | ||||||||||||||
(1) |
(2) | The total accumulated depreciation and amortization associated with dispositions of real estate was |
| December 31, 2014 | December 31, 2016 | |||||
| 2015 | $ | 598,921 | ||||
| 2016 | 579,275 | |||||
| 2017 | 564,242 | $ | 617,717 | |||
| 2018 | 549,285 | 610,284 | ||||
| 2019 | 529,080 | 590,490 | ||||
| 2020 | 570,766 | |||||
| 2021 | 541,961 | |||||
| Thereafter | 4,312,351 | 4,183,771 | ||||
| Total future minimum rentals | $ | 7,133,154 | $ | 7,114,989 | ||
| December 31, 2016 | December 31, 2015 | ||||||
| Mortgage loans - principal | $ | 55,410 | $ | 90,096 | |||
| Mortgage loans - premium, net of amortization | 7,194 | 9,986 | |||||
| Mortgages loans, net | 62,604 | 100,082 | |||||
| Other note receivables - principal | 4,474 | 4,245 | |||||
| Allowance for loan losses | (500 | ) | (324 | ) | |||
| Other note receivables | 3,974 | 3,921 | |||||
| Total loans receivable, net | $ | 66,578 | $ | 104,003 | |||
| December 31, 2014 | December 31, 2013 | ||||||
| Mortgage - principal | $ | 96,594 | $ | 102,315 | |||
| Mortgage - premium | 12,452 | 14,976 | |||||
| Mortgages, net | 109,046 | 117,291 | |||||
| Other note - principal | 379 | 430 | |||||
| Total loans receivable, net | $ | 109,425 | $ | 117,721 | |||
| December 31, 2016 | December 31, 2015 | ||||||
| In-place leases | $ | 624,723 | $ | 649,182 | |||
| Above-market leases | 88,873 | 98,056 | |||||
| Less: accumulated amortization | (243,320 | ) | (220,520 | ) | |||
| Intangible lease assets, net | $ | 470,276 | $ | 526,718 | |||
| Below-market leases | $ | 236,008 | $ | 238,039 | |||
| Less: accumulated amortization | (53,688 | ) | (44,136 | ) | |||
| Intangible lease liabilities, net | $ | 182,320 | $ | 193,903 | |||
| 2017 | $ | 32,860 | |
| 2018 | 33,261 | ||
| 2019 | 30,998 | ||
| 2020 | 28,811 | ||
| 2021 | 26,261 | ||
| Thereafter | 135,765 | ||
| Total future minimum rentals | $ | 287,956 | |
| December 31, 2016 | December 31, 2015 | ||||||
| Minimum lease payments receivable | $ | 9,456 | $ | 12,702 | |||
| Estimated residual value of leased assets | 35,640 | 43,789 | |||||
| Unearned income | (9,091 | ) | (12,167 | ) | |||
| Real estate assets under direct financing leases, net | $ | 36,005 | $ | 44,324 | |||
| December 31, 2014 | December 31, 2013 | ||||||
| Minimum lease payments receivable | $ | 15,897 | $ | 19,555 | |||
| Estimated residual value of leased assets | 55,858 | 57,739 | |||||
| Unearned income | (15,191 | ) | (18,534 | ) | |||
| Real estate assets under direct financing leases, net | $ | 56,564 | $ | 58,760 | |||
Number of Properties | Carrying Value | |||||
| Balance, December 31, 2012 | 7 | $ | 5,898 | |||
| Transfers from real estate investments | 15 | 94,732 | ||||
Sales (Note 13) | (11 | ) | (81,019 | ) | ||
| Balance, December 31, 2013 | 11 | 19,611 | ||||
| Transfers from real estate investments | 36 | 155,641 | ||||
Sales (Note 13) | (23 | ) | (55,340 | ) | ||
Balance, December 31, 2014 (1) | 24 | $ | 119,912 | |||
| December 31, 2014 | December 31, 2013 | ||||||
| Assets | |||||||
| Land and improvements | $ | 5,351 | $ | 10,003 | |||
| Buildings and improvements | 5,798 | 14,178 | |||||
| Total real estate investments | 11,149 | 24,181 | |||||
| Less: Accumulated depreciation | (2,167 | ) | (4,819 | ) | |||
| Intangible lease assets, net | 460 | 697 | |||||
| Total assets | $ | 9,442 | $ | 20,059 | |||
| Liabilities | |||||||
| Intangible lease liabilities, net | $ | 448 | $ | 448 | |||
| Total liabilities | $ | 448 | $ | 448 | |||
| Number of Properties | Carrying Value | |||||
| (In Thousands) | ||||||
| Balance, December 31, 2014 | 24 | $ | 119,046 | |||
| Transfers from real estate investments | 60 | 192,311 | ||||
| Sales | (48 | ) | (227,098 | ) | ||
| Transfers to real estate investments held and used | — | — | ||||
| Balance, December 31, 2015 | 36 | 84,259 | ||||
| Transfers from real estate investments | 72 | 223,457 | ||||
| Sales | (59 | ) | (126,100 | ) | ||
| Transfers to real estate investments held and used | (5 | ) | (21,046 | ) | ||
| Balance, December 31, 2016 | 44 | 160,570 | ||||
| Years Ended December 31, | Years Ended December 31, | |||||||||||||||||||||
| 2014 | 2013 | 2012 | 2016 | 2015 | 2014 | |||||||||||||||||
| Real estate and intangible asset impairment | $ | 40,728 | $ | 6,829 | $ | 10,923 | $ | 80,390 | $ | 68,565 | $ | 42,307 | ||||||||||
| Write-off of lease intangibles due to lease terminations, net | (4,820 | ) | 487 | 2,809 | 7,683 | 1,666 | (4,820 | ) | ||||||||||||||
| Loans receivable (recovery) / impairment | — | (367 | ) | (180 | ) | |||||||||||||||||
| Loans receivable impairment | 176 | 324 | — | |||||||||||||||||||
| Total impairments from real estate investment net assets | 88,249 | 70,555 | 37,487 | |||||||||||||||||||
| Other impairment | 528 | — | — | 26 | 174 | 528 | ||||||||||||||||
| Total impairment loss in continuing and discontinued operations | $ | 36,436 | $ | 6,949 | $ | 13,552 | $ | 88,275 | $ | 70,729 | $ | 38,015 | ||||||||||
| December 31, 2014 | December 31, 2013 | ||||||
| In-place leases | $ | 676,665 | $ | 663,027 | |||
| Above-market leases | 100,568 | 95,118 | |||||
| Less: accumulated amortization | (187,160 | ) | (140,024 | ) | |||
| Intangible lease assets, net | $ | 590,073 | $ | 618,121 | |||
| Below-market leases | $ | 237,593 | $ | 243,237 | |||
| Less: accumulated amortization | (31,625 | ) | (23,123 | ) | |||
| Intangible lease liabilities, net | $ | 205,968 | $ | 220,114 | |||
2016 Weighted Average Effective Interest Rates (1) | 2016 Weighted Average Stated Rates (2) | 2016 Weighted Average Maturity (3) | December 31, 2016 | December 31, 2015 | |||||||||||
| (In Thousands) | |||||||||||||||
| 2015 Credit Facility | 4.17 | % | 2.10 | % | 2.2 | $ | 86,000 | $ | — | ||||||
| Term Loan | 2.25 | % | 1.91 | % | 1.8 | 420,000 | 325,000 | ||||||||
| Master Trust Notes | 5.59 | % | 5.03 | % | 6.2 | 1,672,706 | 1,692,094 | ||||||||
| CMBS - fixed-rate | 5.21 | % | 5.70 | % | 3.8 | 528,427 | 1,360,215 | ||||||||
CMBS - variable-rate (4) | — | — | — | — | 61,758 | ||||||||||
| Convertible Notes | 5.31 | % | 3.28 | % | 3.3 | 747,500 | 747,500 | ||||||||
| Unsecured Senior Notes | 4.60 | % | 4.45 | % | 9.7 | 300,000 | — | ||||||||
| Total debt | 5.13 | % | 4.46 | % | 5.0 | 3,754,633 | 4,186,567 | ||||||||
| Debt discount, net | (52,894 | ) | (52,203 | ) | |||||||||||
Deferred financing costs, net (5) | (37,111 | ) | (41,577 | ) | |||||||||||
| Total debt, net | $ | 3,664,628 | $ | 4,092,787 | |||||||||||
2014 Weighted Average Effective Interest Rates (1) | 2014 Weighted Average Stated Rates (2) | 2014 Weighted Average Maturity (3) | December 31, 2014 | December 31, 2013 | |||||||||||
| (In Thousands) | |||||||||||||||
| Revolving credit facilities | 4.84 | % | 3.58 | % | 1.6 | $ | 15,181 | $ | 35,120 | ||||||
| Master Trust Notes | 5.62 | % | 5.04 | % | 8.2 | 1,710,380 | 1,241,437 | ||||||||
| CMBS - fixed-rate | 5.34 | % | 5.85 | % | 3.2 | 1,836,181 | 2,387,532 | ||||||||
CMBS - variable-rate (4) | 3.50 | % | 3.28 | % | 2.7 | 110,685 | 111,018 | ||||||||
| Convertible Notes | 4.82 | % | 3.28 | % | 5.3 | 747,500 | — | ||||||||
| Unsecured fixed rate promissory note | 9.12 | % | 7.00 | % | 7.0 | 1,293 | 1,442 | ||||||||
| 4,421,220 | 3,776,549 | ||||||||||||||
| Unamortized net debt (discount) premium | (51,586 | ) | 1,669 | ||||||||||||
| Total debt, net | $ | 4,369,634 | $ | 3,778,218 | |||||||||||
(1) The effective interest rates include amortization of debt discount, amortization of deferred financing costs, and related debt insurer premiums and non-utilization fees, where applicable, calculated for the three months ended December 31, 2014. | |||||||||||||||
(2) Represents the weighted average stated interest rate based on the outstanding principal balance as of December 31, 2014. | |||||||||||||||
(3) Represents the weighted average maturity based on the outstanding principal balance as of December 31, 2014. | |||||||||||||||
(4) Variable-rate notes are predominantly hedged with interest rate swaps (see Note 7). | |||||||||||||||
Stated Rates (1) | Maturity | December 31, 2016 | December 31, 2015 | |||||||||
| (in Years) | (in Thousands) | |||||||||||
| Series 2014-1 Class A1 | 5.1 | % | 3.5 | $ | 53,919 | $ | 65,027 | |||||
| Series 2014-1 Class A2 | 5.4 | % | 3.5 | 253,300 | 253,300 | |||||||
| Series 2014-2 | 5.8 | % | 4.2 | 226,283 | 229,674 | |||||||
| Series 2014-3 | 5.7 | % | 5.2 | 311,820 | 312,276 | |||||||
| Series 2014-4 Class A1 | 3.5 | % | 3.1 | 150,000 | 150,000 | |||||||
| Series 2014-4 Class A2 | 4.6 | % | 13.1 | 360,000 | 360,000 | |||||||
| Total Master Trust 2014 notes | 5.1 | % | 6.5 | 1,355,322 | 1,370,277 | |||||||
| Series 2013-1 Class A | 3.9 | % | 2.0 | 125,000 | 125,000 | |||||||
| Series 2013-2 Class A | 5.3 | % | 7.0 | 192,384 | 196,817 | |||||||
| Total Master Trust 2013 notes | 4.7 | % | 5.0 | 317,384 | 321,817 | |||||||
| Total Master Trust Notes | 1,672,706 | 1,692,094 | ||||||||||
| Debt discount, net | (18,787 | ) | (22,909 | ) | ||||||||
| Deferred financing costs, net | (16,376 | ) | (19,345 | ) | ||||||||
| Total Master Trust Notes, net | $ | 1,637,543 | $ | 1,649,840 | ||||||||
| Industry | Properties | Net Book Value | Monthly Base Rent | Outstanding Principal | Restricted Cash (3) | Stated Rate | Default Rate | Accrued Interest | |||||||||||||||||||||
| Drug Stores / Pharmacies | 1 | $ | 1,032 | $ | — | $ | 1,247 | $ | 78 | 5.67 | % | 9.67 | % | $ | 61 | (1) | |||||||||||||
| Home Furnishings | 1 | 3,315 | 36 | 17,026 | 3,537 | 6.88 | % | 10.88 | % | 1,168 | (1) | ||||||||||||||||||
| Sporting Goods | 1 | 3,375 | — | 4,133 | 609 | 5.52 | % | 9.52 | % | 260 | (1) | ||||||||||||||||||
| Manufacturing | 9 | 39,034 | 83 | 53,184 | 9,497 | 5.85 | % | 9.85 | % | 1,614 | (1) | ||||||||||||||||||
| 12 | $46,756 | $ | 119 | $ | 75,590 | $ | 13,721 | 6.06 | % | (2) | 10.06 | % | (2) | $ | 3,103 | ||||||||||||||
| (1) Interest accrued or capitalized to principal that remains unpaid. | |||||||||||||||||||||||||||||
| (2) Weighted average interest rate. | |||||||||||||||||||||||||||||
| (3) Represents restricted cash controlled by the lender that may be applied to reduce amounts owed. | |||||||||||||||||||||||||||||
Scheduled Principal | Balloon Payment | Total | Scheduled Principal | Balloon Payment | Total (2) | |||||||||||||||||
| 2015 | $ | 31,552 | $ | 321,372 | $ | 352,924 | ||||||||||||||||
| 2016 | 30,167 | 289,045 | 319,212 | |||||||||||||||||||
| 2017 | 29,667 | 839,977 | 869,644 | |||||||||||||||||||
2017 (1) | $ | 26,115 | $ | 187,932 | $ | 214,047 | ||||||||||||||||
| 2018 | 43,750 | 248,851 | 292,601 | 42,115 | 602,779 | 644,894 | ||||||||||||||||
| 2019 | 45,771 | 452,000 | 497,771 | 44,325 | 498,500 | 542,825 | ||||||||||||||||
| 2020 | 39,096 | 413,206 | 452,302 | |||||||||||||||||||
| 2021 | 30,658 | 554,753 | 585,411 | |||||||||||||||||||
| Thereafter | 289,752 | 1,799,316 | 2,089,068 | 219,133 | 1,096,021 | 1,315,154 | ||||||||||||||||
| $ | 470,659 | $ | 3,950,561 | $ | 4,421,220 | |||||||||||||||||
| Total | $ | 401,442 | $ | 3,353,191 | $ | 3,754,633 | ||||||||||||||||
| Years Ended December 31, | |||||||||||
| 2014 | 2013 | 2012 | |||||||||
| Interest expense – revolving credit facilities | $ | 3,597 | $ | 3,037 | $ | 108 | |||||
| Interest expense – mortgages and notes payable | 196,246 | 157,903 | 119,196 | ||||||||
| Interest expense – Convertible Notes | 15,046 | — | — | ||||||||
| Interest expense – other | 6 | 475 | 10 | ||||||||
| Interest expense – term note payable | — | — | 19,925 | ||||||||
Amortization of deferred financing costs (1) | 5,899 | 13,188 | 2,819 | ||||||||
| Amortization of net losses related to interest rate swaps | 125 | 11 | 3,415 | ||||||||
| Amortization of debt (premium)/discount | (849 | ) | 4,653 | 10,747 | |||||||
| Total interest expense | $ | 220,070 | $ | 179,267 | $ | 156,220 | |||||
(1) Includes $9.5 million arising from financing commitments related to the Merger for the year ended December 31, 2013. | |||||||||||
| Years Ended December 31, | |||||||||||
| 2016 | 2015 | 2014 | |||||||||
Interest expense – Revolving Credit Facilities (1) | $ | 3,314 | $ | 2,698 | $ | 3,597 | |||||
| Interest expense – Term Loan | 5,218 | 888 | — | ||||||||
| Interest expense – mortgages and notes payable | 143,233 | 184,439 | 196,246 | ||||||||
Interest expense – Convertible Notes (2) | 24,509 | 24,509 | 15,046 | ||||||||
| Interest expense – Unsecured Senior Notes | 4,932 | — | — | ||||||||
| Interest expense – other | — | — | 6 | ||||||||
| Non-cash interest expense: | |||||||||||
| Amortization of deferred financing costs | 9,070 | 7,937 | 5,899 | ||||||||
| Amortization of net losses related to interest rate swaps | 93 | 108 | 125 | ||||||||
| Amortization of debt discount/(premium), net | 6,217 | 2,322 | (849 | ) | |||||||
| Total interest expense | $ | 196,586 | $ | 222,901 | $ | 220,070 | |||||
| Fair Value of Liability | |||||||||||||||||||||
| Derivatives Designated as Hedging Instruments | Balance Sheet Location | Notional Amount | Fixed Interest Rate | Effective Date | Maturity Date | December 31, 2014 | December 31, 2013 | ||||||||||||||
| Interest Rate Swap | Accounts payable, accrued expenses and other liabilities | $ | 10,833 | 4.62 | % | 06/28/12 | 07/06/17 | $ | (46 | ) | $ | (42 | ) | ||||||||
| Interest Rate Swap | Accounts payable, accrued expenses and other liabilities | $ | 6,668 | 5.75 | % | 07/17/13 | 03/01/16 | (180 | ) | (326 | ) | ||||||||||
| Interest Rate Swap | Accounts payable, accrued expenses and other liabilities | $ | 32,400 | 3.15 | % | 07/17/13 | 09/05/15 | (93 | ) | (178 | ) | ||||||||||
Interest Rate Swaps (1) | Accounts payable, accrued expenses and other liabilities | $ | 61,758 | 5.14 | % | 01/02/14 | 12/13/18 | (803 | ) | (246 | ) | ||||||||||
| $ | (1,122 | ) | $ | (792 | ) | ||||||||||||||||
(1) Represents a tranche of eight individual interest rate swap agreements with notional amounts ranging from $7.6 million to $7.9 million. The swap agreements contain the same payment terms, stated interest rate, effective date, and maturity date. | |||||||||||||||||||||
| Fair Value of Liability | ||||||||||||||||||||
| Derivatives Designated as Hedging Instruments | Balance Sheet Location | Notional Amount | Fixed Interest Rate | Effective Date | Maturity Date | December 31, 2016 | December 31, 2015 | |||||||||||||
Interest Rate Swaps (1) | Accounts payable, accrued expenses and other liabilities | $ | 61,758 | 5.14% | 01/02/14 | 12/13/18 | — | (934 | ) | |||||||||||
| $ | — | $ | (934 | ) | ||||||||||||||||
Amount of Loss Recognized in AOCL on Derivative (Effective Portion) | Amount of Loss Recognized in AOCL on Derivative (Effective Portion) | |||||||||||||||||||||||
| Years Ended December 31, | Years Ended December 31, | |||||||||||||||||||||||
| Derivatives in Cash Flow Hedging Relationships | 2014 | 2013 | 2012 | 2016 | 2015 | 2014 | ||||||||||||||||||
| Interest rate swaps | $ | (1,760 | ) | $ | (314 | ) | $ | (902 | ) | $ | (1,137 | ) | $ | (1,190 | ) | $ | (1,760 | ) | ||||||
Amount of Loss Reclassified from AOCL into Operations (Effective Portion) | ||||||||||||||||||||||||
Amount of Loss Reclassified from AOCL into Operations (Effective Portion) | Years Ended December 31, | |||||||||||||||||||||||
| Years Ended December 31, | ||||||||||||||||||||||||
| Location of Loss Reclassified from AOCL into Operations | 2014 | 2013 | 2012 | 2016 | 2015 | 2014 | ||||||||||||||||||
| Interest expense | $ | (1,315 | ) | $ | (425 | ) | $ | (3,646 | ) | $ | (459 | ) | $ | (1,169 | ) | $ | (1,315 | ) | ||||||
| General and administrative expense | — | (22 | ) | (4,037 | ) | |||||||||||||||||||
Amount of Loss Recognized in Operations on Derivative (Ineffective Portion) | ||||||||||||||||||||||||
Amount of Gain Recognized in Operations on Derivative (Ineffective Portion) | Years Ended December 31, | |||||||||||||||||||||||
| Location of (Loss) or Gain Recognized in Operations on Derivatives | 2016 | 2015 | 2014 | |||||||||||||||||||||
General and administrative expense (1) | $ | (1,706 | ) | $ | (78 | ) | $ | — | ||||||||||||||||
| Years Ended December 31, | Amount of Loss Recognized in Operations on Derivative | |||||||||||||||||||||||
| Location of Gain Recognized in Operations on Derivatives | 2014 | 2013 | 2012 | |||||||||||||||||||||
| Derivatives Not Designated as Hedging Instruments | Years Ended December 31, | |||||||||||||||||||||||
| Location of Loss Recognized in Operations on Derivatives | 2016 | 2015 | 2014 | |||||||||||||||||||||
| General and administrative expense | $ | — | $ | 10 | $ | — | $ | (18 | ) | $ | — | $ | — | |||||||||||
| Years Ended December 31, | Years Ended December 31, | |||||||||||||||||||||
| 2014 | 2013 | 2012 | 2016 | 2015 | 2014 | |||||||||||||||||
| REIT state income tax | $ | 673 | $ | 723 | $ | 504 | ||||||||||||||||
| State income tax | $ | 899 | $ | 601 | $ | 673 | ||||||||||||||||
| REIT state built-in gain tax expense | — | 390 | — | 47 | — | — | ||||||||||||||||
| Federal income tax | $ | 19 | $ | — | $ | — | ||||||||||||||||
| Total income tax expense | $ | 673 | $ | 1,113 | $ | 504 | $ | 965 | $ | 601 | $ | 673 | ||||||||||
| Years Ended December 31, | ||||||||||||||||||||||
| 2014 | 2013 | 2012 | Year Ended December 31, 2016 | Year Ended December 31, 2015 | Year Ended December 31, 2014 | |||||||||||||||||
| Ordinary income | $ | — | $ | — | $ | 63 | $ | 0.52 | $ | 0.42 | $ | — | ||||||||||
| Return of capital | — | — | 1,112 | 0.15 | 0.26 | 0.58 | ||||||||||||||||
| $ | — | $ | — | $ | 1,175 | |||||||||||||||||
| Capital gain | 0.03 | — | — | |||||||||||||||||||
| Total | $ | 0.70 | $ | 0.68 | $ | 0.58 | ||||||||||||||||
Spirit (1) | Pre-Merger Spirit (2) | ||||||||||||||
| Year Ended December 31, 2014 | Year Ended December 31, 2013 | For the Period January 1, 2013 - July 17, 2013 | Year Ended December 31, 2012 | ||||||||||||
| Ordinary income | $ | — | $ | 0.29 | $ | 0.12 | $ | 0.23 | |||||||
| Return of capital | 0.58 | — | 0.66 | — | |||||||||||
| Capital gain | — | 0.32 | — | — | |||||||||||
| $ | 0.58 | $ | 0.61 | $ | 0.78 | $ | 0.23 | ||||||||
| Declaration Date | Dividend Per Share (1) | Record Date | Total Amount (2) | Payment Date | ||||||||
| (in thousands) | ||||||||||||
| March 18, 2014 | $ | 0.16625 | March 31, 2014 | $ | 61,628 | April 15, 2014 | ||||||
| June 16, 2014 | 0.16625 | June 30, 2014 | 66,299 | July 15, 2014 | ||||||||
| September 16, 2014 | 0.16625 | September 30, 2014 | 66,259 | October 15, 2014 | ||||||||
| December 15, 2014 | 0.17000 | December 31, 2014 | 69,927 | January 15, 2015 | ||||||||
| Total | $ | 0.66875 | $ | 264,113 | ||||||||
| Declaration Date | Dividend Per Share (1) | Record Date | Total Amount (2) | Payment Date | ||||||||
| (in thousands) | ||||||||||||
| March 14, 2013 | $ | 0.16406 | April 1, 2013 | $ | 26,501 | April 16, 2013 | ||||||
| June 17, 2013 | 0.16406 | June 28, 2013 | 26,514 | July 16, 2013 | ||||||||
| July 1, 2013 | 0.02853 | July 16, 2013 | 4,622 | July 19, 2013 | ||||||||
| September 5, 2013 | 0.13553 | September 30, 2013 | 50,190 | October 15, 2013 | ||||||||
| December 17, 2013 | 0.16625 | December 31, 2013 | 61,568 | January 15, 2014 | ||||||||
| Total | $ | 0.65843 | $ | 169,395 | ||||||||
| Declaration Date | Dividend Per Share | Record Date | Total Amount (1) | Payment Date | ||||||||
| (in Thousands) | ||||||||||||
| 2016 | ||||||||||||
| March 15, 2016 | $ | 0.17500 | March 31, 2016 | $ | 77,596 | April 15, 2016 | ||||||
| June 15, 2016 | 0.17500 | June 30, 2016 | 83,940 | July 15, 2016 | ||||||||
| September 15, 2016 | 0.17500 | September 30, 2016 | 84,604 | October 14, 2016 | ||||||||
| December 15, 2016 | 0.18000 | December 30, 2016 | 87,040 | January 13, 2017 | ||||||||
| Total | $ | 0.70500 | $ | 333,180 | ||||||||
| 2015 | ||||||||||||
| March 16, 2015 | $ | 0.17000 | March 31, 2015 | $ | 71,123 | April 15, 2015 | ||||||
| June 15, 2015 | 0.17000 | June 30, 2015 | 75,054 | July 15, 2015 | ||||||||
| September 15, 2015 | 0.17000 | September 30, 2015 | 75,039 | October 15, 2015 | ||||||||
| December 15, 2015 | 0.17500 | December 31, 2015 | 77,315 | January 15, 2016 | ||||||||
| Total | $ | 0.68500 | $ | 298,531 | ||||||||
| Ground Leases | Office and Equipment Leases | Total | Ground Leases | Office and Equipment Leases | Total | |||||||||||||||||
| 2015 | $ | 1,159 | $ | 584 | $ | 1,743 | ||||||||||||||||
| 2016 | 1,161 | 593 | 1,754 | |||||||||||||||||||
| 2017 | 1,225 | 605 | 1,830 | $ | 1,515 | $ | 1,397 | $ | 2,912 | |||||||||||||
| 2018 | 1,283 | 616 | 1,899 | 1,521 | 1,500 | 3,021 | ||||||||||||||||
| 2019 | 1,293 | 622 | 1,915 | 1,521 | 1,505 | 3,026 | ||||||||||||||||
| 2020 | 1,521 | 1,516 | 3,037 | |||||||||||||||||||
| 2021 | 1,441 | 1,531 | 2,972 | |||||||||||||||||||
| Thereafter | 12,344 | 2,494 | 14,838 | 15,929 | 8,021 | 23,950 | ||||||||||||||||
| Total | $ | 18,465 | $ | 5,514 | $ | 23,979 | $ | 23,448 | $ | 15,470 | $ | 38,918 | ||||||||||
| Fair Value Hierarchy Level | Fair Value Hierarchy Level | |||||||||||||||||||||||||||||
| Fair Value | Level 1 | Level 2 | Level 3 | Fair Value | Level 1 | Level 2 | Level 3 | |||||||||||||||||||||||
| December 31, 2014 | ||||||||||||||||||||||||||||||
| December 31, 2016 | ||||||||||||||||||||||||||||||
| Derivatives: | ||||||||||||||||||||||||||||||
| Interest rate swaps financial liabilities | $ | (1,122 | ) | $ | — | $ | (1,122 | ) | $ | — | $ | — | $ | — | $ | — | $ | — | ||||||||||||
| December 31, 2013 | ||||||||||||||||||||||||||||||
| December 31, 2015 | ||||||||||||||||||||||||||||||
| Derivatives: | ||||||||||||||||||||||||||||||
| Interest rate swaps financial liabilities | $ | (792 | ) | $ | — | $ | (792 | ) | $ | — | $ | (934 | ) | $ | — | $ | (934 | ) | $ | — | ||||||||||
| Fair Value Hierarchy Level | Impairment Charges | Fair Value Hierarchy Level | Impairment Charges | |||||||||||||||||||||||||||||||||||||||||||
| Description | Fair Value | Dispositions | Level 1 | Level 2 | Level 3 | Fair Value | Dispositions | Level 1 | Level 2 | Level 3 | ||||||||||||||||||||||||||||||||||||
| December 31, 2014 | ||||||||||||||||||||||||||||||||||||||||||||||
| December 31, 2016 | ||||||||||||||||||||||||||||||||||||||||||||||
| Retail | 33,766 | (4,168 | ) | 37,934 | (37,445 | ) | ||||||||||||||||||||||||||||||||||||||||
| Industrial | 2,394 | (1,347 | ) | 3,741 | (5,948 | ) | ||||||||||||||||||||||||||||||||||||||||
| Office | 8,538 | 8,538 | (10,121 | ) | ||||||||||||||||||||||||||||||||||||||||||
| Long-lived assets held and used | $ | 37,278 | $ | — | $ | — | $ | — | $ | 37,278 | $ | (20,679 | ) | $ | 44,698 | $ | (5,515 | ) | $ | — | $ | — | $ | 50,213 | $ | (53,514 | ) | |||||||||||||||||||
| Lease intangible assets | 10,013 | — | — | — | 10,013 | 4,317 | 6,384 | — | — | — | 6,384 | (9,116 | ) | |||||||||||||||||||||||||||||||||
| Other assets | 27 | — | — | 27 | (198 | ) | ||||||||||||||||||||||||||||||||||||||||
| Long-lived assets held for sale | 65,958 | (26,721 | ) | — | — | 92,679 | (20,074 | ) | 24,493 | (36,907 | ) | — | — | 61,400 | (25,447 | ) | ||||||||||||||||||||||||||||||
| $ | (36,436 | ) | (88,275 | ) | ||||||||||||||||||||||||||||||||||||||||||
| December 31, 2013 | ||||||||||||||||||||||||||||||||||||||||||||||
| December 31, 2015 | ||||||||||||||||||||||||||||||||||||||||||||||
| Retail | 29,626 | (3,207 | ) | — | — | 32,833 | (20,727 | ) | ||||||||||||||||||||||||||||||||||||||
| Industrial | 9,598 | — | — | — | 9,598 | (16,182 | ) | |||||||||||||||||||||||||||||||||||||||
| Office | 21,074 | — | — | — | 21,074 | (14,093 | ) | |||||||||||||||||||||||||||||||||||||||
| Long-lived assets held and used | $ | 60,298 | $ | (3,207 | ) | $ | — | $ | — | $ | 63,505 | $ | (51,002 | ) | ||||||||||||||||||||||||||||||||
| Lease intangible assets | $ | — | $ | — | $ | — | $ | — | $ | — | $ | (182 | ) | 3,843 | — | — | — | 3,843 | (3,825 | ) | ||||||||||||||||||||||||||
| Other assets | — | — | — | — | — | (324 | ) | |||||||||||||||||||||||||||||||||||||||
| Long-lived assets held for sale | 11,198 | (26,832 | ) | — | — | 38,030 | (7,134 | ) | 15,957 | (33,563 | ) | — | — | 49,520 | (15,578 | ) | ||||||||||||||||||||||||||||||
| $ | (7,316 | ) | $ | (70,729 | ) | |||||||||||||||||||||||||||||||||||||||||
| December 31, 2016 | December 31, 2015 | ||||||||||||||||
| Range | Weighted Average | Square Footage | Range | Weighted Average | Square Footage | ||||||||||||
| Long-lived assets held and used by asset type | |||||||||||||||||
| Retail | $17.17 - $502.23 | $ | 58.78 | 290,770 | $41.21 - $168.30 | $ | 79.90 | 153,008 | |||||||||
| Industrial | $26.43 | $ | 26.43 | 104,864 | $17.77 - $22.00 | $ | 19.40 | 375,076 | |||||||||
| Office | $35.00 | $ | 35.00 | 135,675 | $58.17 - $133.61 | $ | 104.53 | 204,936 | |||||||||
| December 31, 2016 | December 31, 2015 | ||||||||||||||||
| Range | Weighted Average | Square Footage | Range | Weighted Average | Square Footage | ||||||||||||
| Long-lived assets held and used by asset type | |||||||||||||||||
| Retail | $15.40 - $170.02 | $ | 40.80 | 516,916 | $65.85 - $161.61 | $ | 114.12 | 204,269 | |||||||||
| Industrial | $9.09 | $ | 9.09 | 149,627 | $12.17 | $ | 12.17 | 369,655 | |||||||||
| Office | $56.81 | $ | 56.81 | 34,992 | — | $ | — | — | |||||||||
| December 31, 2014 | December 31, 2013 | ||||||||||||||
Carrying Value | Estimated Fair Value | Carrying Value | Estimated Fair Value | ||||||||||||
| Loans receivable, net | $ | 109,425 | $ | 115,747 | $ | 117,721 | $ | 131,587 | |||||||
| Revolving credit facilities | 15,181 | 15,254 | 35,120 | 34,911 | |||||||||||
Convertible Notes, net (1) | 695,957 | 729,231 | — | — | |||||||||||
| Mortgages and notes payable | 3,658,496 | 3,899,950 | 3,743,098 | 3,892,621 | |||||||||||
| December 31, 2016 | December 31, 2015 | ||||||||||||||
Carrying Value | Estimated Fair Value | Carrying Value | Estimated Fair Value | ||||||||||||
| Loans receivable, net | $ | 66,578 | $ | 71,895 | $ | 104,003 | $ | 110,019 | |||||||
Revolving Credit Facilities, net (1) | 86,000 | 87,718 | — | — | |||||||||||
Term Loan, net (2) | 418,471 | 428,441 | 322,902 | 338,366 | |||||||||||
| Senior Unsecured Notes | 295,112 | 283,473 | — | — | |||||||||||
Convertible Notes, net (2) | 702,642 | 784,175 | 690,098 | 713,095 | |||||||||||
Mortgages and notes payable, net (2) | 2,162,403 | 2,282,142 | 3,079,787 | 3,220,239 | |||||||||||
| Years Ended December 31, | Years Ended December 31, | |||||||||||||||||||||
| 2014 | 2013 | 2012 | 2016 | 2015 | 2014 | |||||||||||||||||
| Revenues | ||||||||||||||||||||||
| Revenues: | ||||||||||||||||||||||
| Rent | $ | 1,206 | $ | 8,304 | $ | 12,622 | $ | — | $ | 447 | $ | 1,206 | ||||||||||
| Non-cash rent | (80 | ) | 21 | 80 | — | — | (80 | ) | ||||||||||||||
| Other | 2,972 | 433 | 9 | — | 17 | 2,972 | ||||||||||||||||
| Total Revenues | 4,098 | 8,758 | 12,711 | |||||||||||||||||||
| Total revenues | — | 464 | 4,098 | |||||||||||||||||||
| Expenses: | ||||||||||||||||||||||
| General and administrative | 15 | 9 | 214 | — | 4 | 15 | ||||||||||||||||
| Property costs | 298 | 1,009 | 472 | — | 328 | 298 | ||||||||||||||||
| Interest | — | 241 | 644 | — | — | — | ||||||||||||||||
| Depreciation and amortization | — | 3,545 | 7,116 | — | — | — | ||||||||||||||||
| Impairments | 417 | 7,134 | 4,634 | — | 34 | 417 | ||||||||||||||||
| Total expenses | 730 | 11,938 | 13,080 | — | 366 | 730 | ||||||||||||||||
| Gain (loss) from discontinued operations before other income | 3,368 | (3,180 | ) | (369 | ) | — | 98 | 3,368 | ||||||||||||||
| Other income: | ||||||||||||||||||||||
| Gain on debt extinguishment | — | 1,028 | — | — | — | — | ||||||||||||||||
| Other | — | 75 | — | — | — | — | ||||||||||||||||
| Total other income | — | 1,103 | — | — | — | — | ||||||||||||||||
| Income (loss) from discontinued operations | 3,368 | (2,077 | ) | (369 | ) | — | 98 | 3,368 | ||||||||||||||
| Gain (loss) on dispositions of real estate | 488 | 36,926 | (3,349 | ) | ||||||||||||||||||
| Gain on disposition of assets | — | 590 | 325 | |||||||||||||||||||
| Total discontinued operations | $ | 3,856 | $ | 34,849 | $ | (3,718 | ) | $ | — | $ | 688 | $ | 3,693 | |||||||||
Number of properties disposed of during period | 6 | 22 | 41 | — | 2 | 6 | ||||||||||||||||
| Year Ended December 31, | ||||||||||||
| 2014 | 2013 | 2012 | ||||||||||
| Supplemental Disclosures of Non-Cash Investing and Financing Activities: | ||||||||||||
| Real estate properties acquired under 1031 exchange | (26,677 | ) | (20,184 | ) | — | |||||||
| Real estate properties sold under 1031 exchange | 5,893 | 40,968 | — | |||||||||
| Net assets acquired in Merger in exchange for common stock | $ | — | $ | (1,734,315 | ) | $ | — | |||||
| Common stock registered in exchange for net assets acquired | — | 2,025,737 | — | |||||||||
| Reduction of debt through sale of certain real estate properties | (5,001 | ) | (149,156 | ) | (3,472 | ) | ||||||
| Debt assumed through real estate property acquisition | 10,528 | — | — | |||||||||
| Reduction of term note indebtedness through common stock share conversion | — | — | (330,017 | ) | ||||||||
| Reduction of debt net of assets surrendered to lender | — | (1,069 | ) | — | ||||||||
Accrued interest capitalized to principal (1) | 2,598 | — | — | |||||||||
| Accrued performance share dividend rights | (565 | ) | (163 | ) | — | |||||||
| Financing of a tenant lease settlement | — | (650 | ) | — | ||||||||
| Supplemental Cash Flow Disclosures: | ||||||||||||
| Interest paid | 209,032 | $ | 154,919 | $ | 143,966 | |||||||
| Taxes paid | 2,416 | 1,549 | 708 | |||||||||
(1) Accrued and overdue interest on certain CMBS notes that have been intentionally placed in default. | ||||||||||||
| Years Ended December 31, | ||||||||||||
| 2016 | 2015 | 2014 | ||||||||||
| Supplemental Disclosures of Non-Cash Investing and Financing Activities: | ||||||||||||
| Reduction and assumption of debt through sale of certain real estate properties | $ | 7,208 | $ | 30,555 | $ | 5,001 | ||||||
| Net real estate and other collateral assets surrendered to lender | 30,381 | 7,384 | — | |||||||||
| Reduction of debt in exchange for collateral assets | 47,025 | 7,904 | — | |||||||||
| Real estate acquired in exchange for loans receivable | 26,609 | — | — | |||||||||
| Debt assumed through real estate property acquisition | — | — | 10,528 | |||||||||
Accrued interest capitalized to principal (1) | 4,332 | 6,035 | 2,598 | |||||||||
| Accrued performance share dividend rights | 489 | 564 | 565 | |||||||||
| Supplemental Cash Flow Disclosures: | ||||||||||||
| Interest paid | $ | 182,105 | $ | 206,115 | $ | 209,032 | ||||||
| Taxes paid, net of refunds | 914 | 1,919 | 2,416 | |||||||||
| 2014 | 2013 | 2016 | 2015 | 2014 | |||||||||||||||||||||||||||||
| Number of Shares | Weighted Average Price (1) | Number of Shares | Weighted Average Price (1) | Number of Shares | Weighted Average Price (1) (per share) | Number of Shares | Weighted Average Price (1) (per share) | Number of Shares | Weighted Average Price (1) (per share) | ||||||||||||||||||||||||
| Outstanding non-vested shares, beginning of year | 1,777,652 | $ | 8.41 | 2,203,783 | $ | 8.19 | 771,003 | $ | 11.29 | 1,299,807 | $ | 9.12 | 1,777,652 | $ | 8.41 | ||||||||||||||||||
| Shares granted | 372,974 | $ | 10.85 | 363,501 | $ | 9.21 | 948,793 | 12.58 | 495,688 | 11.87 | 372,974 | 10.85 | |||||||||||||||||||||
| Shares vested | (846,102 | ) | $ | 8.37 | (754,709 | ) | $ | 8.19 | (562,581 | ) | 11.10 | (1,005,088 | ) | 8.77 | (846,102 | ) | 8.37 | ||||||||||||||||
| Shares forfeited | (4,717 | ) | $ | 10.60 | (34,923 | ) | $ | 8.01 | (122,600 | ) | 11.56 | (19,404 | ) | 11.53 | (4,717 | ) | 10.60 | ||||||||||||||||
| Outstanding non-vested shares, end of year | 1,299,807 | $ | 9.12 | 1,777,652 | $ | 8.41 | 1,034,615 | $ | 12.55 | 771,003 | $ | 11.29 | 1,299,807 | $ | 9.12 | ||||||||||||||||||
(1) Grant date fair value | |||||||||||||||||||||||||||||||||
| 2016 | 2015 | 2014 | ||||||||||||||||||
| Number of Target Shares | Weighted Average Fair Value (per share) | Number of Target Shares | Weighted Average Fair Value (per share) | Number of Target Shares | Weighted Average Fair Value (per share) | |||||||||||||||
| Outstanding non-vested awards, beginning of year | 472,725 | $ | 14.28 | 610,797 | $ | 13.49 | 367,914 | $ | 13.45 | |||||||||||
Grants at target (1) | 400,800 | 16.06 | 279,199 | 14.78 | 242,883 | 13.56 | ||||||||||||||
Earned (below) above performance target (2) | (42,640 | ) | 13.56 | 387,027 | 13.45 | — | — | |||||||||||||
Vested (3) | (215,438 | ) | 14.36 | (804,298 | ) | 13.46 | — | — | ||||||||||||
| Forfeited | (121,147 | ) | $ | 15.05 | — | $ | — | — | $ | — | ||||||||||
| Outstanding non-vested awards, end of year | 494,300 | $ | 15.30 | 472,725 | $ | 14.28 | 610,797 | $ | 13.49 | |||||||||||
| Years Ended December 31, | |||||||||||
| 2014 | 2013 | 2012 | |||||||||
| Basic and diluted (loss) income: | |||||||||||
| Loss from continuing operations | $ | (50,895 | ) | $ | (33,172 | ) | $ | (72,515 | ) | ||
| Gain on disposition of assets | 13,240 | — | — | ||||||||
| Less: income attributable to unvested restricted stock | (1,099 | ) | (1,291 | ) | (380 | ) | |||||
| Less: preferred dividends | — | — | (63 | ) | |||||||
| Loss used in basic and diluted loss per share from continuing operations | (38,754 | ) | (34,463 | ) | (72,958 | ) | |||||
| Income (loss) from discontinued operations | 3,856 | 34,849 | (3,718 | ) | |||||||
| Net (loss) income attributable to common stockholders used in basic and diluted (loss) income per share | $ | (34,898 | ) | $ | 386 | $ | (76,676 | ) | |||
| Basic and diluted weighted average shares of common stock outstanding: | |||||||||||
| Weighted average shares of common stock outstanding | 388,604,270 | 257,153,935 | 80,828,885 | ||||||||
| Less: unvested weighted average shares of restricted stock | (1,794,524 | ) | (2,133,370 | ) | (2,203,783 | ) | |||||
| Weighted average number of shares outstanding used in basic and diluted (loss) income per share | 386,809,746 | 255,020,565 | 78,625,102 | ||||||||
Potentially dilutive shares of common stock (1) | |||||||||||
| Unvested shares of restricted stock | 731,444 | 704,306 | 67,556 | ||||||||
| Unvested performance shares | 770,688 | 189,530 | — | ||||||||
| Stock options | 5,146 | 662 | — | ||||||||
| Convertible term note debt | — | — | 33,816,625 | ||||||||
| Total | 1,507,278 | 894,498 | 33,884,181 | ||||||||
(1) Due to a loss from continuing operations for all periods presented, no potentially dilutive securities were included in computing loss per share of common stock as their effect would be anti-dilutive. | |||||||||||
| Years Ended December 31, | |||||||||||
| 2016 | 2015 | 2014 | |||||||||
| Basic and diluted income (loss): | |||||||||||
| Income (loss) from continuing operations | $ | 45,081 | $ | 24,103 | $ | (50,859 | ) | ||||
| Gain on disposition of assets | 52,365 | 68,421 | 10,221 | ||||||||
| Less: income attributable to unvested restricted stock | (614 | ) | (696 | ) | (1,099 | ) | |||||
| Income (loss) used in basic and diluted income (loss) per share from continuing operations | 96,832 | 91,828 | (41,737 | ) | |||||||
| Income from discontinued operations | — | 688 | 3,693 | ||||||||
| Net income (loss) attributable to common stockholders used in basic and diluted income (loss) per share | $ | 96,832 | $ | 92,516 | $ | (38,044 | ) | ||||
| Basic weighted average shares of common stock outstanding: | |||||||||||
| Weighted average shares of common stock outstanding | 470,023,674 | 433,361,726 | 388,604,270 | ||||||||
| Less: unvested weighted average shares of restricted stock | (805,898 | ) | (1,138,773 | ) | (1,794,524 | ) | |||||
| Weighted average number of shares outstanding used in basic income (loss) per share | 469,217,776 | 432,222,953 | 386,809,746 | ||||||||
| Net income (loss) per share attributable to common stockholders-basic | $ | 0.21 | $ | 0.21 | $ | (0.10 | ) | ||||
Diluted weighted average shares of common stock (1) | |||||||||||
| Stock options | 3,835 | 3,384 | — | ||||||||
| Unvested performance shares | 24,654 | 319,288 | — | ||||||||
| Weighted average number of shares of common stock used in diluted income (loss) per share | 469,246,265 | 432,545,625 | 386,809,746 | ||||||||
| Net income (loss) per share attributable to common stockholders-diluted | $ | 0.21 | $ | 0.21 | $ | (0.10 | ) | ||||
| Potentially dilutive shares of common stock | |||||||||||
| Unvested shares of restricted stock | 119,633 | 339,541 | 731,444 | ||||||||
| Unvested performance shares | — | — | 770,688 | ||||||||
| Stock options | — | — | 5,146 | ||||||||
| Total | 119,633 | 339,541 | 1,507,278 | ||||||||
| Employee Separation/Relocation Costs | Other Restructuring Costs | Total | |||||||||
| Beginning balance, as of December 31, 2015 | $ | 5,754 | $ | 172 | $ | 5,926 | |||||
| Accruals | 2,701 | 3,060 | 5,761 | ||||||||
| Payments | (8,085 | ) | (3,211 | ) | (11,296 | ) | |||||
| Ending balance, as of December 31, 2016 | $ | 370 | $ | 21 | $ | 391 | |||||
| First | Second | Third | Fourth | ||||||||||||||||
| Quarter | Quarter | Quarter | Quarter | Year | |||||||||||||||
| 2014 | (unaudited) | ||||||||||||||||||
| Total revenues | $ | 143,972 | $ | 151,789 | $ | 152,295 | $ | 154,815 | $ | 602,871 | |||||||||
| Depreciation and amortization | 60,549 | 61,968 | 62,069 | 63,380 | 247,966 | ||||||||||||||
| Interest | 54,399 | 55,992 | 53,535 | 56,144 | 220,070 | ||||||||||||||
| Other expenses | 19,554 | 58,023 | 31,175 | 12,228 | 120,980 | ||||||||||||||
| (Loss) gain on debt extinguishment | — | (64,708 | ) | 212 | (254 | ) | (64,750 | ) | |||||||||||
| Income (loss) from continuing operations | 9,470 | (88,902 | ) | 5,728 | 22,809 | (50,895 | ) | ||||||||||||
| Income (loss) from discontinued operations | 3,047 | 371 | 691 | (253 | ) | 3,856 | |||||||||||||
| Net income (loss) | 14,239 | (89,821 | ) | 7,670 | 34,113 | (33,799 | ) | ||||||||||||
| Net income (loss) attributable to common stockholders | 14,239 | (89,821 | ) | 7,670 | 34,113 | (33,799 | ) | ||||||||||||
| Net income (loss) per common share: | |||||||||||||||||||
| Basic | $ | 0.04 | $ | (0.24 | ) | $ | 0.02 | $ | 0.08 | $ | (0.09 | ) | |||||||
| Diluted | $ | 0.04 | N/A | $ | 0.02 | $ | 0.08 | N/A | |||||||||||
| Dividends declared per common share | $ | 0.16625 | $ | 0.16625 | $ | 0.16625 | $ | 0.17000 | $ | 0.66875 | |||||||||
| 2013 | |||||||||||||||||||
| Total revenues | $ | 70,968 | $ | 72,414 | $ | 136,847 | $ | 139,238 | $ | 419,467 | |||||||||
| Depreciation and amortization expense | 26,939 | 29,700 | 48,243 | 59,172 | 164,054 | ||||||||||||||
| Interest expense | 36,439 | 39,552 | 50,386 | 52,890 | 179,267 | ||||||||||||||
| Other expenses | 14,608 | 14,510 | 61,357 | 16,438 | 106,913 | ||||||||||||||
| Loss on debt extinguishment | — | — | — | (2,405 | ) | (2,405 | ) | ||||||||||||
| (Loss) income from continuing operations | (7,018 | ) | (11,348 | ) | (23,139 | ) | 8,333 | (33,172 | ) | ||||||||||
| (Loss) Income from discontinued operations | (1,314 | ) | (321 | ) | 1,231 | 35,253 | 34,849 | ||||||||||||
| Net (loss) income | (8,332 | ) | (11,669 | ) | (21,908 | ) | 43,586 | 1,677 | |||||||||||
| Net (loss) income attributable to common stockholders | (8,332 | ) | (11,669 | ) | (21,908 | ) | 43,586 | 1,677 | |||||||||||
Net (loss) income per common share: (1) | |||||||||||||||||||
| Basic | $ | (0.05 | ) | $ | (0.07 | ) | $ | (0.07 | ) | $ | 0.12 | $ | — | ||||||
| Diluted | N/A | N/A | N/A | $ | 0.12 | N/A | |||||||||||||
Dividends declared per common share (1) | $ | 0.16406 | $ | 0.16406 | $ | 0.16406 | $ | 0.16625 | $ | 0.65843 | |||||||||
| First | Second | Third | Fourth | ||||||||||||||||
| Quarter | Quarter | Quarter | Quarter | Year | |||||||||||||||
| 2016 | (Unaudited) | ||||||||||||||||||
| Total revenues | $ | 168,357 | $ | 171,726 | $ | 172,508 | $ | 173,383 | $ | 685,974 | |||||||||
| Depreciation and amortization | 64,664 | 64,263 | 65,300 | 68,049 | 262,276 | ||||||||||||||
| Interest | 53,017 | 49,172 | 47,653 | 46,744 | 196,586 | ||||||||||||||
| Other expenses | 32,381 | 37,463 | 41,767 | 70,653 | 182,264 | ||||||||||||||
| (Loss) gain on debt extinguishment | (5,341 | ) | 14,016 | (8,349 | ) | (93 | ) | 233 | |||||||||||
| Income (loss) from continuing operations | 12,954 | 34,844 | 9,439 | (12,156 | ) | 45,081 | |||||||||||||
| Income (loss) from discontinued operations | — | — | — | — | — | ||||||||||||||
| Gain on disposition of assets | 10,146 | 11,115 | 17,960 | 13,144 | 52,365 | ||||||||||||||
| Net income attributable to common stockholders and partners | 23,100 | 45,959 | 27,399 | 988 | 97,446 | ||||||||||||||
| Net income per share attributable to common stockholders and partners: | |||||||||||||||||||
| Basic | $ | 0.05 | $ | 0.10 | $ | 0.06 | $ | — | $ | 0.21 | |||||||||
| Diluted | $ | 0.05 | $ | 0.10 | $ | 0.06 | $ | — | $ | 0.21 | |||||||||
| Dividends declared per common share and partnership unit | $ | 0.17500 | $ | 0.17500 | $ | 0.17500 | $ | 0.18000 | $ | 0.70500 | |||||||||
First | Second | Third | Fourth | ||||||||||||||||
| Quarter | Quarter | Quarter | Quarter | Year | |||||||||||||||
| 2015 | (Unaudited) | ||||||||||||||||||
| Total revenues | $ | 162,287 | $ | 167,934 | $ | 168,425 | $ | 168,689 | $ | 667,335 | |||||||||
| Depreciation and amortization | 66,296 | 64,671 | 64,493 | 65,173 | 260,633 | ||||||||||||||
| Interest | 57,914 | 56,167 | 54,673 | 54,147 | 222,901 | ||||||||||||||
| Other expenses | 23,662 | 52,771 | 40,548 | 39,555 | 156,536 | ||||||||||||||
| (Loss) gain on debt extinguishment | (1,230 | ) | 3,377 | 342 | (5,651 | ) | (3,162 | ) | |||||||||||
| Income (loss) from continuing operations | 13,185 | (2,298 | ) | 9,053 | 4,163 | 24,103 | |||||||||||||
| Income (loss) from discontinued operations | 227 | 494 | (41 | ) | 8 | 688 | |||||||||||||
| Gain on disposition of assets | 9,151 | 51,739 | 5,991 | 2,130 | 69,011 | ||||||||||||||
| Net income attributable to common stockholders and partners | 22,563 | 49,345 | 15,003 | 6,301 | 93,212 | ||||||||||||||
| Net income per share attributable to common stockholders and partners: | |||||||||||||||||||
| Basic | $ | 0.05 | $ | 0.11 | $ | 0.03 | $ | 0.02 | $ | 0.21 | |||||||||
| Diluted | $ | 0.05 | $ | 0.11 | $ | 0.03 | $ | 0.02 | $ | 0.21 | |||||||||
| Dividends declared per common share and partnership unit | $ | 0.17000 | $ | 0.17000 | $ | 0.17000 | $ | 0.17500 | $ | 0.68500 | |||||||||
Exhibit No. | Description |
| 1.1 | Equity Distribution Agreement among Spirit Realty Capital, Inc. and the persons named therein, dated |
| 2.1 | Agreement and Plan of Merger, dated as of January 22, 2013, as amended by the First Amendment to Agreement and Plan of Merger, dated as of May 8, 2013, by and among Spirit Realty Capital, Inc. (f/k/a Cole Credit Property Trust II, Inc.), a Maryland corporation, Spirit Realty Capital, Inc., a Maryland corporation, Cole Operating Partnership II, LP, a Delaware limited partnership and Spirit Realty, L.P., a Delaware limited partnership. Previously filed by Spirit Realty Capital, Inc. as an exhibit to the Company’s Form 8-K filed with the Securities and Exchange Commission on January 22, 2013 and Exhibit 2.1 to the Company’s Form 8-K filed with the Securities and Exchange Commission on May 9, 2013, respectively. |
| 2.2 | Articles of Merger by and between Spirit Realty Capital, Inc. (f/k/a Cole Credit Property Trust II, Inc.), a Maryland corporation, and Spirit Realty Capital, Inc., a Maryland corporation and the Amended and Restated Charter of Spirit Realty Capital, Inc. (f/k/a Cole Credit Property Trust II, Inc.) filed as Exhibit (Incorporated by reference to Exhibit 3.1 to the Company’s Current Report on Form 8-K (File No. 000-51963), filed on July 17, 2013). |
| 3.1 | Articles of Restatement of Spirit Realty Capital, Inc. filed Exhibit 3.1 to the Company's Registration Statement on Form S-3 on November 8, 2013 and incorporated herein by reference. |
| 3.2 | Articles of Amendment of Spirit Realty Capital, Inc. filed as Exhibit 3.1 to the Company's Form 8-K on May 13, 2014 and incorporated herein by reference. |
| 3.3 | |
| 4.1 | Form of Certificate for Common Stock of Spirit Realty Capital, Inc. filed as Exhibit 4.1 to the Registration Statement on Form S-4 on March 29, 2013 and incorporated herein by reference. |
| 4.2 | Second Amended and Restated Master Indenture among Spirit Master Funding, LLC, Spirit Master Funding II, LLC, Spirit Master Funding III, LLC and Citibank, N.A., dated May 20, 2014 filed as Exhibit 4.1 to the Company's Form 8-K on May 20, 2014 and incorporated herein by reference. |
| 4.3 | Amendment No. 1 to the Second Amended and Restated Master Indenture among Spirit Master Funding, LLC, Spirit Master Funding II, LLC, Spirit Master Funding III, LLC and Citibank, N.A., dated November 26, 2014 filed as Exhibit 4.1 to the Company's Form 8-K on December 1, 2014 and incorporated herein by reference. |
| 4.4 | Series 2014-1 Indenture Supplement among Spirit Master Funding, LLC, Spirit Master Funding II, LLC, Spirit Master Funding III, LLC and Citibank, N.A., dated May 20, 2014 filed as Exhibit 4.2 to the Company's Form 8-K on May 20, 2014 and incorporated herein by reference. |
| 4.5 | Series 2014-2 Indenture Supplement among Spirit Master Funding, LLC, Spirit Master Funding II, LLC, Spirit Master Funding III, LLC and Citibank, N.A., dated May 20, 2014 filed as Exhibit 4.3 to the Company's Form 8-K on May 20, 2014 and incorporated herein by reference. |
| 4.6 | Series 2014-3 Indenture Supplement among Spirit Master Funding, LLC, Spirit Master Funding II, LLC, Spirit Master Funding III, LLC and Citibank, N.A., dated May 20, 2014 filed as Exhibit 4.3 to the Company's Form 8-K on May 20, 2014 and incorporated herein by reference. |
| 4.7 | Series 2014-4 Indenture Supplement among Spirit Master Funding, LLC, Spirit Master Funding II, LLC, Spirit Master Funding III, LLC, Spirit Master Funding VI, LLC, Spirit Master Funding VIII, LLC and Citibank, N.A., dated November 26, 2014 filed as Exhibit 4.2 to the Company's Form 8-K on December 1, 2014 and incorporated herein by reference. |
| 4.8 | Master Indenture, between Citibank, N.A. and Spirit Master Funding VII, LLC, dated as of December 23, 2013. Previously filed by Spirit Realty Capital, Inc. as Exhibit 10.21 to the Company's Annual Report on Form 10-K on March 4, 2014 and incorporated herein by reference. |
| 4.9 | Series 2013-1 Supplement, between Citibank, N.A. and Spirit Master Funding VII, LLC, dated as of December 23, |
Exhibit No. | Description |
| 4.10 | Series 2013-2 Supplement, between Citibank, N.A. and Spirit Master Funding VII, LLC, dated as of December 23, |
| 4.11 | Indenture, dated May 20, 2014, between the Company and Wilmington Trust, National Association, filed as Exhibit 4.1 to the Company's Form 8-K on May 20, 2014 and incorporated herein by reference. |
| 4.12 | First Supplemental Indenture, dated May 20, 2014, by and between Spirit Realty Capital, Inc. and Wilmington Trust, National Association (including the form of 2.875% Convertible Senior Note due 2019) filed as Exhibit 4.2 to the Company's Form 8-K on May 20, 2014 and incorporated herein by reference. |
| 4.13 | Second Supplemental Indenture, dated May 20, 2014, by and between Spirit Realty Capital, Inc. and Wilmington Trust, National Association (including the form of 3.75% Convertible Senior Note due 2021) filed as Exhibit 4.3 to the Company's Form 8-K on May 20, 2014 and incorporated herein by reference. |
| 4.14 | Indenture, dated as of August 18, 2016, among Spirit Realty, L.P., as issuer, and U.S. Bank, National Association, as trustee, filed as Exhibit 4.1 of the Company's Form 8-K on August 19, 2016 and incorporated herein by reference. |
| 4.15 | First Supplemental Indenture, dated as of August 18, 2016, among Spirit Realty, L.P., as issuer, Spirit Realty Capital, Inc., as guarantor, and U.S. Bank, National Association, as trustee, including the form of the Notes and the guarantee filed as Exhibit 4.2 of the Company's Form 8-K on August 19, 2016 and incorporated herein by reference. |
| 4.16 | Registration Rights Agreement, dated August 18, 2016, among the Issuer, the Guarantor and J.P. Morgan Securities LLC, Wells Fargo Securities, LLC, Merrill Lynch, Pierce, Fenner & Smith Incorporated and Morgan Stanley & Co. LLC filed as Exhibit 4.3 of the Company's Form 8-K on August 19, 2016 and incorporated herein by reference. |
| 10.1 | Amended and Restated Spirit Realty Capital, Inc. and Spirit Realty, L.P. 2012 Incentive Award Plan filed |
| 10.2 | Form of 2012 Incentive Award Plan Restricted Stock Award Grant Notice and Agreement filed as Exhibit 10.9 to the Company’s Form 8-K on July 17, 2013 and incorporated herein by reference. |
| 10.3 | Form of 2012 Incentive Award Plan Stock Payment Award Grant Notice and Agreement filed as Exhibit 10.9 to the Company’s Form 8-K on July 17, 2013 and incorporated herein by reference. |
| 10.4 | Form of Performance Share Award Agreement. Previously filed by Spirit Realty Capital, Inc. as an exhibit to the Company’s Form 8-K filed with the Securities and Exchange Commission on July 17, 2013. |
| 10.5 | Credit Agreement, by and among Deutsche Bank Securities Inc., Deutsche Bank AG New York Branch, Spirit Realty, L.P. and various lenders, dated as of July 17, 2013 filed as Exhibit 10.01 to the Company’s Form 8-K on July 17, 2013 and incorporated herein by reference. |
| 10.6 | Guaranty, by and among Spirit Realty Capital, |
| 10.7 | Security Agreement, by and among Spirit Realty Capital, Inc., Spirit General OP Holdings, LLC, Spirit Realty, L.P., Spirit Master Funding IV, LLC, Spirit Master Funding V, LLC, Deutsche Bank Securities Inc. and various lenders, dated as of July 17, 2013 filed as Exhibit 10.3 to the Company’s Form 8-K on July 17, 2013 and incorporated herein by reference. |
| 10.8 | Omnibus Collateral Assignment of Material Agreements, Permits and Licenses, by and among Spirit Realty Capital, Inc., Spirit General OP Holdings, LLC, Spirit Realty, L.P., Spirit Master Funding IV, LLC, Spirit Master Funding V, LLC, Deutsche Bank Securities Inc. and various lenders, dated as of July 17, 2013. Previously filed by Spirit Realty Capital, Inc. as an exhibit to the Company’s Form 8-K filed with the Securities and Exchange Commission on July 17, 2013. |
Exhibit No. | Description |
| 10.9 | Loan Agreement, between German American Capital Corporation and Spirit SPE Loan Portfolio 2013-2, LLC, dated as of July 17, 2013 filed as Exhibit 10.4 to the Company’s Form 8-K on July 17, 2013 and incorporated herein by reference. |
| 10.10 | Guaranty of Recourse Obligations of Borrower, by Spirit Realty, L.P. in favor of German American Capital Corporation, dated as of July 17, 2013 filed as Exhibit 10.6 to the Company’s Form 8-K on July 17, 2013 and incorporated herein by reference. |
| 10.11 | Loan Agreement, between Barclays Bank PLC and Spirit SPE Loan Portfolio 2013-3, LLC, dated as of July 17, 2013 filed as Exhibit 10.7 to the Company’s Form 8-K on July 17, 2013 and incorporated herein by reference. |
| 10.12 | Guaranty of Recourse Obligations of Borrower by Spirit Realty, L.P. in favor of Barclays Bank PLC, dated as of July 17, 2013 filed as Exhibit 10.8 to the Company’s Form 8-K on July 17, 2013 and incorporated herein by reference. |
| 10.13 | Second Amended and Restated Property Management and Servicing Agreement dated May 20, 2014, by and among Spirit Realty, L.P., Spirit Master Funding, LLC, Spirit Master Funding II, LLC, Spirit Master Funding III, LLC and Midland Loan Services, a division of PNC Bank, National Association filed as Exhibit 1.1 of the Company's Form 8-K on May 20, 2014 and incorporated herein by reference. |
| 10.14 | Amendment No. 1 to the Second Amended and Restated Property Management and Servicing Agreement dated November 26, 2014, by and among Spirit Realty, L.P., Spirit Master Funding, LLC, Spirit Master Funding II, LLC, Spirit Master Funding III, LLC and Midland Loan Services, a division of PNC Bank, National Association filed as Exhibit 1.2 of the Company's Form 8-K on December 1, 2014 and incorporated herein by reference. |
| 10.15 | Property Management and Servicing Agreement, between Midland Loan Services, Spirit Master Funding VII, LLC and Spirit Realty, L.P., dated as of December 23, 2013 filed as Exhibit 10.24 to its Annual Report on Form 10-K filed on March 4, 2014 and incorporated herein by reference. |
| 10.16 | Defeasance, Assignment, Assumption and Release Agreement dated June 5, 2014 by and among Spirit SPE Portfolio 2006-1, LLC and Spirit SPE Portfolio 2006-2, LLC, U.S. Bank, National Association as Trustee for the Lender, Midland Loan Servicer, a division of PNC Bank, National Association as servicer and U.S. Bank, National Association as Securities Intermediary and Custodian filed as Exhibit 1.1 of the Company's Form 8-K on June 6, 2014 and incorporated herein by reference. |
| 10.17 | First Amended and Restated Agreement of Limited Partnership of Spirit Realty, L.P. on September 12, 2014. |
| 10.18 | Amended and Restated Master Lease between Spirit SPE Portfolio 2006-1, LLC and Spirit SPE Portfolio 2006-2, LLC, and Shopko Stores Operating CO., LLC, dated December 15, 2014 filed as Exhibit 1.2 of the Company's Form 8-K on December 1, 2014 and incorporated herein by reference. |
| 10.19 | Form of Indemnification Agreement of Spirit Realty Capital, Inc. filed as Exhibit 10.1 of the Company's Form 8-K on July 17, 2013 and incorporated herein by reference. |
| 10.20 | Amended and Restated Employment Agreement among Spirit Realty Capital, Inc. and Thomas H. Nolan, Jr., dated as of July 17, 2013 filed as Exhibit 10.2 of the Company's Form 8-K on July 17, 2013 and incorporated herein by reference. |
| 10.21 | Amended and Restated Employment Agreement among Spirit Realty Capital, Inc. and Michael A. Bender, dated as of July 17, 2013 filed as Exhibit 10.3 of the Company's Form 8-K on July 17, 2013 and incorporated herein by reference. |
| 10.23 | Transition and |
| 10.25 | Director Compensation Program of Spirit Realty Capital, Inc. filed as Exhibit 10.10 of the Company's Form 8-K on July 17, 2013 and incorporated herein by reference. |
Exhibit No. | Description |
| 10.26 | Employment Agreement among Spirit Realty Capital, Inc. and Phillip D. Joseph, Jr., dated as of March 25, 2015 filed as Exhibit 10.1 of the Company's Form 8-K on March 25, 2015 and incorporated herein by reference. |
| 10.27 | Employment Letter Agreement between Spirit Realty Capital, Inc. and Philip D. Joseph, Jr. dated as of October 14, 2015 filed as Exhibit 10.27 of the Company's Annual Report on Form 10-K on February 26, 2016 and incorporated herein by reference. |
| 10.28 | First Amended and Restated Employment Agreement among Spirit Realty Capital, Inc. and Phillip D. Joseph, Jr, dated as of February 23, 2016 filed within as Exhibit 10.28 of the Company's Annual Report on Form 10-K on February 26, 2016 and incorporated herein by reference. |
| 10.29 | Credit Agreement among Spirit Realty L.P., Wells Fargo Bank, N.A., as the administrative agent, and the various financial institutions as are or may become parties thereto, dated as of March 31, 2015, filed as Exhibit 10.1 to the Company's Form 8-K on March 31, 2015 and incorporated herein by reference. |
| 10.30 | Second Amended and Restated Employment Agreement among Spirit Realty Capital, Inc. and Thomas H. Nolan, Jr., dated as of August 27, 2015 filed as Exhibit 10.1 of the Company's Form 8-K on August 28, 2015 and incorporated herein by reference. |
| 10.31 | Third Amended and Restated Employment Agreement among Spirit Realty Capital, Inc. and Gregg A. Seibert, dated as of August 27, 2015 filed as Exhibit 10.2 of the Company's Form 8-K on August 28, 2015 and incorporated herein by reference. |
| 10.32 | Second Amended and Restated Employment Agreement among Spirit Realty Capital, Inc. and Mark Manheimer, dated as of August 27, 2015 filed as Exhibit 10.3 of the Company's Form 8-K on August 28, 2015 and incorporated herein by reference. |
| 10.33 | Term Loan Agreement among Spirit Realty L.P., various financial institutions, as lenders, and Bank of America, N.A., as the administrative agent, dated as of November 3, 2015, filed as Exhibit 10.1 to the Company's Form 8-K on November 6, 2015 and incorporated herein by reference. |
| 10.34 | First Amendment to the Credit Agreement among Spirit Realty L.P., various financial institutions, as lenders, and Wells Fargo Bank, N.A., as the administrative agent, dated as of November 3, 2015, filed within as Exhibit 10.34 to the Company's Annual Report Form 10-K on February 26, 2016 and incorporated herein by reference. |
| 10.35 | Credit Agreement Guaranty dated as of March 31, 2015 in favor of Wells Fargo Bank National Association, the Administrative Agent for the lenders, and among Spirit Realty, L.P., filed within as Exhibit 10.35 of the Company's Annual Report on Form 10-K on February 26, 2016 and incorporated herein by reference. |
| 10.36 | The 2016 executive cash bonus program, was approved by the Compensation Committee of the Board of Directors of Spirit Realty Capital, Inc.on February 18, 2016 and is filed within as Exhibit 10.36 of the Company's Annual Report on Form 10-K on February 26, 2016 and incorporated herein by reference. |
| 10.37 | Employment Agreement, dated June 3, 2016, between Boyd Messmann and Spirit Realty Capital, Inc. filed as Exhibit 10.1 of the Company's Form 18-K on June 6, 2016 and incorporated herein by reference. |
| 10.38 | Employment Agreement, dated September 7, 2016, between Jackson Hsieh and Spirit Realty Capital, Inc. filed as Exhibit 10.1 of the Company's Form 18-K on July 7, 2016 and incorporated herein by reference. |
| 10.39 | Director Compensation Program of Spirit Realty Capital, Inc. as of January 1, 2015 filed as Exhibit 10.25 of the Company's Form 10-Q on August 4, 2016 and incorporated herein by reference. |
| 14.1 | Code of Business Conduct and Ethics of Spirit Realty Capital, Inc. filed as Exhibit 14.1 to its Annual Report on Form 10-K on March 5, 2013 and incorporated herein by reference. |
| 16.1 | Deloitte & Touche LLP’s Response Letter to the Securities and Exchange Commission dated as of July 17, 2013 filed as Exhibit 16.1 to the Company’s Form 8-K filed with the Securities and Exchange Commission on July 17, 2013. |
| 21.1* | List of Subsidiaries of Spirit Realty Capital, Inc. as of |
Exhibit No. | Description |
| 23.1* | Consent of Ernst & Young LLP the Company's Independent Registered Accounting Firm |
| 31.1* | Certification of Chief Executive Officer pursuant to Rule 13a-14(a) or Rule 15d-14(a) under the Exchange Act, as adopted pursuant to Section 302 of the Sarbanes-Oxley Act of |
| 31.2* | Certification of Chief Financial Officer pursuant to Rule 13a-14(a) or Rule 15d-14(a) under the Exchange Act, as adopted pursuant to Section 302 of the Sarbanes-Oxley Act of |
| 31.3* | Certification of Chief Executive Officer pursuant to Rule 13a-14(a) or Rule 15d-14(a) under the Exchange Act, as adopted pursuant to Section 302 of the Sarbanes-Oxley Act of 2002 for Spirit Realty, L.P. |
| 31.4* | Certification of Chief Financial Officer pursuant to Rule 13a-14(a) or Rule 15d-14(a) under the Exchange Act, as adopted pursuant to Section 302 of the Sarbanes-Oxley Act of 2002 for Spirit Realty, L.P. |
| 32.1* | Certification of Chief Executive Officer and Chief Financial Officer pursuant to 18 U.S.C. Section 1350, as adopted pursuant to Section 906 of the Sarbanes-Oxley Act of |
| 32.2* | Certification of Chief Executive Officer and Chief Financial Officer pursuant to 18 U.S.C. Section 1350, as adopted pursuant to Section 906 of the Sarbanes-Oxley Act of 2002 for Spirit Realty, L.P. |
| 101.1** | The following financial information from Spirit Realty Capital, Inc.'s Annual Report on Form 10-K for the year ended December 31, |
| * | Filed herewith. |
| ** | Pursuant to applicable securities laws and regulations, these interactive data files are deemed not filed or part of a registration statement or prospectus for purposes of sections 11 or 12 of the Securities Act, are deemed not filed for purposes of section 18 of the Exchange Act and otherwise are not subject to liability under these sections. |
| Initial Cost to Company | Cost Capitalized Subsequent to Acquisition including impairment | Gross Amount at December 31, | Life in which depreciation in latest Statement of Operations is computed | ||||||||||||||||||||||
| Description | Encumbrances | Land and Improvements | Buildings and Improvements | Improvements/ Land | Improvements/ building | Land and Improvements | Buildings and Improvements | Total | Final Accum | Date of Construction | Date Acquired | ||||||||||||||
| General Merchandise | ||||||||||||||||||||||||||||||||||||||||||
| Aberdeen, SD | (b) | $ | 3,857 | $ | 3,348 | $ | — | $ | — | $ | 3,857 | $ | 3,348 | $ | 7,205 | $ | (1,199 | ) | 1984 | 05/31/06 | 15 to 30 years | |||||||||||||||||||||
| Ainsworth, NE | (a) | 360 | 1,829 | — | — | 360 | 1,829 | 2,189 | (349 | ) | 2007 | 12/11/07 | 12 to 47 years | |||||||||||||||||||||||||||||
| Alamogordo, NM | (a) | 476 | 560 | — | — | 476 | 560 | 1,036 | (46 | ) | 2006 | 07/17/13 | 8 to 40 Years | |||||||||||||||||||||||||||||
| Albany, MO | (c ) | 66 | 410 | — | — | 66 | 410 | 476 | (122 | ) | 1990 | 05/31/06 | 15 to 30 years | |||||||||||||||||||||||||||||
| Albert Lea, MN | (b) | 2,526 | 3,141 | — | — | 2,526 | 3,141 | 5,667 | (1,444 | ) | 1985 | 05/31/06 | 15 to 20 years | |||||||||||||||||||||||||||||
| Allegan, MI | (c ) | 741 | 1,198 | — | — | 741 | 1,198 | 1,939 | (436 | ) | 2000 | 05/31/06 | 15 to 30 years | |||||||||||||||||||||||||||||
| Alpena, AR | (b) | 359 | 600 | — | — | 359 | 600 | 959 | (2 | ) | 2014 | 12/15/14 | 14 to 40 Years | |||||||||||||||||||||||||||||
| Anderson, SC | 8,160 | 4,770 | 6,883 | — | — | 4,770 | 6,883 | 11,653 | (882 | ) | 1993 | 07/17/13 | 7 to 21 Years | |||||||||||||||||||||||||||||
| Anderson, SC | (a) | 351 | 966 | — | 351 | 966 | 1,317 | (45 | ) | 1992 | 07/17/13 | 10 to 41 Years | ||||||||||||||||||||||||||||||
| Appleton, WI | (b) | 4,898 | 5,804 | — | — | 4,898 | 5,804 | 10,702 | (1,761 | ) | 1971 | 05/31/06 | 15 to 30 years | |||||||||||||||||||||||||||||
| Arcadia, WI | (c ) | 673 | 983 | — | — | 673 | 983 | 1,656 | (447 | ) | 2000 | 05/31/06 | 15 to 30 years | |||||||||||||||||||||||||||||
| Archbold, OH | (c ) | 631 | 1,229 | — | — | 631 | 1,229 | 1,860 | (446 | ) | 2000 | 05/31/06 | 15 to 30 years | |||||||||||||||||||||||||||||
| Ashland, WI | (c ) | 462 | 791 | — | — | 462 | 791 | 1,253 | (400 | ) | 1975 | 05/31/06 | 15 to 20 years | |||||||||||||||||||||||||||||
| Attica, IN | (c ) | 550 | 1,116 | — | — | 550 | 1,116 | 1,666 | (413 | ) | 1999 | 05/31/06 | 15 to 30 years | |||||||||||||||||||||||||||||
| Austin, MN | (b) | 4,246 | 4,444 | — | — | 4,246 | 4,444 | 8,690 | (1,493 | ) | 1983 | 05/31/06 | 15 to 30 years | |||||||||||||||||||||||||||||
| Avoca, AR | (b) | 247 | 642 | — | — | 247 | 642 | 889 | (2 | ) | 2014 | 12/15/14 | 14 to 40 Years | |||||||||||||||||||||||||||||
| Baton Rouge, LA | (a) | 328 | 996 | — | 328 | 996 | 1,324 | (53 | ) | 1999 | 07/17/13 | 10 to 40 Years | ||||||||||||||||||||||||||||||
| Bay City, TX | (b) | 1,192 | 3,250 | — | — | 1,192 | 3,250 | 4,442 | (363 | ) | 1990 | 07/17/13 | 3 to 20 Years | |||||||||||||||||||||||||||||
| Beeville, TX | (a) | 101 | 1,814 | — | 101 | 1,814 | 1,915 | (63 | ) | 2004 | 07/17/13 | 10 to 45 Years | ||||||||||||||||||||||||||||||
| Bellevue, NE | (b) | 3,269 | 3,482 | — | — | 3,269 | 3,482 | 6,751 | (1,194 | ) | 1984 | 05/31/06 | 15 to 30 years | |||||||||||||||||||||||||||||
| Beloit, WI | (b) | 3,191 | 4,414 | — | — | 3,191 | 4,414 | 7,605 | (1,992 | ) | 1978 | 05/31/06 | 15 to 20 years | |||||||||||||||||||||||||||||
| Belvidere, IL | (b) | 3,061 | 3,609 | — | — | 3,061 | 3,609 | 6,670 | (1,239 | ) | 1995 | 05/31/06 | 15 to 30 years | |||||||||||||||||||||||||||||
| Bethany, MO | (c ) | 648 | 379 | — | — | 648 | 379 | 1,027 | (251 | ) | 1974 | 05/31/06 | 15 to 20 years | |||||||||||||||||||||||||||||
| Billings, MT | (b) | 3,035 | 4,509 | (259 | ) | — | 2,776 | 4,509 | 7,285 | (1,435 | ) | 1990 | 05/31/06 | 15 to 30 years | ||||||||||||||||||||||||||||
| Bloomfield, IN | (c ) | 639 | 940 | — | — | 639 | 940 | 1,579 | (382 | ) | 1999 | 05/31/06 | 15 to 30 years | |||||||||||||||||||||||||||||
| Boise, ID | (b) | 5,017 | 12,407 | — | — | 5,017 | 12,407 | 17,424 | (5,062 | ) | 1992 | 05/31/06 | 15 to 30 years | |||||||||||||||||||||||||||||
| Boise, ID | (b) | 2,036 | 5,555 | — | — | 2,036 | 5,555 | 7,591 | (1,693 | ) | 1989 | 05/31/06 | 15 to 30 years | |||||||||||||||||||||||||||||
| Borger, TX | (b) | 907 | 3,243 | — | — | 907 | 3,243 | 4,150 | (305 | ) | 1991 | 07/17/13 | 3 to 25 Years | |||||||||||||||||||||||||||||
| Brigham City, UT | (b) | 1,814 | 2,540 | — | — | 1,814 | 2,540 | 4,354 | (856 | ) | 1990 | 05/31/06 | 15 to 30 years | |||||||||||||||||||||||||||||
| Burlington, IA | (b) | 1,117 | 1,825 | — | — | 1,117 | 1,825 | 2,942 | (787 | ) | 1985 | 05/31/06 | 15 to 20 years | |||||||||||||||||||||||||||||
| Burlington, KS | (c ) | 371 | 565 | — | — | 371 | 565 | 936 | (286 | ) | 1990 | 05/31/06 | 15 to 20 years | |||||||||||||||||||||||||||||
| General Merchandise | |||||||||||||||||||||||||||||||||||||||||
| Aberdeen, SD | (c) | $ | 3,857 | $ | 3,348 | $ | — | $ | — | $ | 3,857 | $ | 3,348 | $ | 7,205 | $ | (1,505 | ) | 1984 | 05/31/06 | 15 to 30 Years | ||||||||||||||||||||
| Ainsworth, NE | (a) | 360 | 1,829 | — | — | 360 | 1,829 | 2,189 | (448 | ) | 2007 | 12/08/09 | 12 to 47 Years | ||||||||||||||||||||||||||||
| Alamogordo, NM | (a) | 476 | 560 | — | — | 476 | 560 | 1,036 | (111 | ) | 2006 | 07/17/13 | 8 to 40 Years | ||||||||||||||||||||||||||||
| Albany, MO | (c) | 66 | 410 | — | — | 66 | 410 | 476 | (155 | ) | 1990 | 05/31/06 | 15 to 30 Years | ||||||||||||||||||||||||||||
| Allegan, MI | (c) | 741 | 1,198 | — | — | 741 | 1,198 | 1,939 | (553 | ) | 2000 | 05/31/06 | 15 to 30 Years | ||||||||||||||||||||||||||||
| Anderson, SC | (c) | 4,771 | 6,883 | — | — | 4,771 | 6,883 | 11,654 | (2,124 | ) | 1993 | 07/17/13 | 7 to 21 Years | ||||||||||||||||||||||||||||
| Anderson, SC | (a) | 351 | 966 | — | — | 351 | 966 | 1,317 | (108 | ) | 1992 | 07/17/13 | 10 to 41 Years | ||||||||||||||||||||||||||||
| Appleton, WI | (c) | 4,898 | 5,804 | — | — | 4,898 | 5,804 | 10,702 | (2,209 | ) | 1971 | 05/31/06 | 15 to 30 Years | ||||||||||||||||||||||||||||
| Arcadia, WI | (c) | 673 | 983 | — | — | 673 | 983 | 1,656 | (563 | ) | 2000 | 05/31/06 | 15 to 30 Years | ||||||||||||||||||||||||||||
| Archbold, OH | (c) | 631 | 1,229 | (216 | ) | (567 | ) | 415 | 662 | 1,078 | — | 2000 | 05/31/06 | 15 to 30 Years | |||||||||||||||||||||||||||
| Attica, IN | (c) | 550 | 1,116 | — | — | 550 | 1,116 | 1,666 | (524 | ) | 1999 | 05/31/06 | 15 to 30 Years | ||||||||||||||||||||||||||||
| Austin, MN | (c) | 4,246 | 4,444 | — | — | 4,246 | 4,444 | 8,690 | (1,890 | ) | 1983 | 05/31/06 | 15 to 30 Years | ||||||||||||||||||||||||||||
| Baton Rouge, LA | (a) | 328 | 996 | — | — | 328 | 996 | 1,324 | (127 | ) | 1999 | 07/17/13 | 10 to 40 Years | ||||||||||||||||||||||||||||
| Bay City, TX | (c) | 1,192 | 3,250 | — | — | 1,192 | 3,250 | 4,442 | (874 | ) | 1990 | 07/17/13 | 3 to 20 Years | ||||||||||||||||||||||||||||
| Beeville, TX | (a) | 101 | 1,814 | — | — | 101 | 1,814 | 1,915 | (152 | ) | 2004 | 07/17/13 | 10 to 45 Years | ||||||||||||||||||||||||||||
| Bellevue, NE | (c) | 3,269 | 3,482 | — | — | 3,269 | 3,482 | 6,751 | (1,517 | ) | 1984 | 05/31/06 | 15 to 30 Years | ||||||||||||||||||||||||||||
| Beloit, WI | (c) | 3,191 | 4,414 | — | — | 3,191 | 4,414 | 7,605 | (2,523 | ) | 1978 | 05/31/06 | 15 to 25 Years | ||||||||||||||||||||||||||||
| Belvidere, IL | (c) | 3,061 | 3,609 | — | — | 3,061 | 3,609 | 6,670 | (1,569 | ) | 1995 | 05/31/06 | 15 to 30 Years | ||||||||||||||||||||||||||||
| Bloomfield, IN | (c) | 639 | 940 | (204 | ) | (425 | ) | 435 | 515 | 950 | — | 1999 | 05/31/06 | 15 to 30 Years | |||||||||||||||||||||||||||
| Borger, TX | (c) | 907 | 3,243 | (724 | ) | (2,027 | ) | 183 | 1,216 | 1,399 | — | 1991 | 07/17/13 | 3 to 25 Years | |||||||||||||||||||||||||||
| Burlington, KS | (c) | 371 | 565 | — | — | 371 | 565 | 936 | (362 | ) | 1990 | 05/31/06 | 15 to 20 Years | ||||||||||||||||||||||||||||
| Calumet City, IL | (a) | 393 | 949 | — | — | 393 | 949 | 1,342 | (136 | ) | 1977 | 07/17/13 | 9 to 32 Years | ||||||||||||||||||||||||||||
| Carrollton, MO | (c) | 352 | 345 | — | — | 352 | 345 | 697 | (268 | ) | 1994 | 07/21/11 | 9 to 20 Years | ||||||||||||||||||||||||||||
| Centerville, TN | (c) | 420 | 776 | — | — | 420 | 776 | 1,196 | (383 | ) | 2000 | 05/31/06 | 15 to 30 Years | ||||||||||||||||||||||||||||
| Charlotte, NC | (a) | 371 | 598 | — | — | 371 | 598 | 969 | (123 | ) | 1957 | 07/17/13 | 8 to 25 Years | ||||||||||||||||||||||||||||
| Chiefland, FL | (a) | 376 | 1,206 | — | — | 376 | 1,206 | 1,582 | (141 | ) | 2007 | 07/17/13 | 10 to 47 Years | ||||||||||||||||||||||||||||
| Clanton, AL | (a) | 350 | 816 | — | — | 350 | 816 | 1,166 | (98 | ) | 2007 | 07/17/13 | 10 to 46 Years | ||||||||||||||||||||||||||||
| Clare, MI | (c) | 1,219 | 760 | — | — | 1,219 | 760 | 1,979 | (558 | ) | 2000 | 05/31/06 | 15 to 30 Years | ||||||||||||||||||||||||||||
| Clarion, IA | (c) | 365 | 812 | — | — | 365 | 812 | 1,177 | (379 | ) | 2000 | 05/31/06 | 15 to 30 Years | ||||||||||||||||||||||||||||
| Clintonville, WI | (c) | 495 | 1,089 | — | — | 495 | 1,089 | 1,584 | (631 | ) | 1978 | 05/31/06 | 15 to 25 Years | ||||||||||||||||||||||||||||
| De Pere, WI | (c) | 264 | 1,681 | — | — | 264 | 1,681 | 1,945 | (603 | ) | 2000 | 05/31/06 | 15 to 30 Years | ||||||||||||||||||||||||||||
| Initial Cost to Company | Cost Capitalized Subsequent to Acquisition including impairment | Gross Amount at December 31, | Life in which depreciation in latest Statement of Operations is computed | ||||||||||||||||||||||
| Description | Encumbrances | Land and Improvements | Buildings and Improvements | Improvements/ Land | Improvements/ building | Land and Improvements | Buildings and Improvements | Total | Final Accum | Date of Construction | Date Acquired | ||||||||||||||
| Calumet City, IL | (a) | 393 | 949 | — | 393 | 949 | 1,342 | (56 | ) | 1977 | 07/17/13 | 9 to 32 Years | ||||||||||||||||||||||||||||||
| Cameron, OK | (b) | 312 | 710 | — | — | 312 | 710 | 1,022 | (2 | ) | 2014 | 12/15/14 | 14 to 40 Years | |||||||||||||||||||||||||||||
| Carrollton, MO | (c ) | 352 | 345 | — | — | 352 | 345 | 697 | (227 | ) | 1994 | 07/21/11 | 10 to 20 years | |||||||||||||||||||||||||||||
| Center Ridge, AR | (b) | 313 | 595 | — | — | 313 | 595 | 908 | (2 | ) | 2014 | 12/15/14 | 14 to 40 Years | |||||||||||||||||||||||||||||
| Centerville, TN | (c ) | 420 | 776 | — | — | 420 | 776 | 1,196 | (301 | ) | 2000 | 05/31/06 | 15 to 30 years | |||||||||||||||||||||||||||||
| Charlotte, NC | (a) | 371 | 598 | — | 371 | 598 | 969 | (51 | ) | 1957 | 07/17/13 | 8 to 25 Years | ||||||||||||||||||||||||||||||
| Chiefland, FL | (a) | 376 | 1,206 | — | 376 | 1,206 | 1,582 | (58 | ) | 2007 | 07/17/13 | 10 to 47 Years | ||||||||||||||||||||||||||||||
| Clanton, AL | (a) | 350 | 816 | — | 350 | 816 | 1,166 | (41 | ) | 2007 | 07/17/13 | 10 to 46 Years | ||||||||||||||||||||||||||||||
| Clare, MI | (c ) | 1,219 | 760 | — | — | 1,219 | 760 | 1,979 | (439 | ) | 2000 | 05/31/06 | 15 to 30 years | |||||||||||||||||||||||||||||
| Clarion, IA | (c ) | 365 | 812 | — | — | 365 | 812 | 1,177 | (300 | ) | 2000 | 05/31/06 | 15 to 30 years | |||||||||||||||||||||||||||||
| Clintonville, WI | (c ) | 495 | 1,089 | — | — | 495 | 1,089 | 1,584 | (501 | ) | 1978 | 05/31/06 | 15 to 20 years | |||||||||||||||||||||||||||||
| Coeur d'Alene, ID | (b) | 7,247 | 4,907 | — | — | 7,247 | 4,907 | 12,154 | (2,185 | ) | 1987 | 05/31/06 | 15 to 20 years | |||||||||||||||||||||||||||||
| De Pere, WI | (b) | 2,805 | 3,593 | — | — | 2,805 | 3,593 | 6,398 | (1,486 | ) | 1967 | 05/31/06 | 15 to 20 years | |||||||||||||||||||||||||||||
| De Pere, WI | (b) | 264 | 1,681 | — | — | 264 | 1,681 | 1,945 | (479 | ) | 2000 | 05/31/06 | 15 to 30 years | |||||||||||||||||||||||||||||
| De Pere, WI | (b) | 4,961 | 8,243 | — | — | 4,961 | 8,243 | 13,204 | (4,733 | ) | 1987 | 05/31/06 | 15 to 20 years | |||||||||||||||||||||||||||||
| De Pere, WI | (b) | 1,275 | 2,113 | — | — | 1,275 | 2,113 | 3,388 | (626 | ) | 2005 | 05/31/06 | 15 to 40 years | |||||||||||||||||||||||||||||
| Delavan, WI | (b) | 1,752 | 4,387 | (118 | ) | — | 1,634 | 4,387 | 6,021 | (1,396 | ) | 1995 | 05/31/06 | 15 to 30 years | ||||||||||||||||||||||||||||
| Detroit Lakes, MN | (c ) | 811 | 1,392 | — | — | 811 | 1,392 | 2,203 | (648 | ) | 1974 | 05/31/06 | 15 to 20 years | |||||||||||||||||||||||||||||
| Dixon, IL | (b) | 1,502 | 2,810 | — | — | 1,502 | 2,810 | 4,312 | (952 | ) | 1993 | 05/31/06 | 15 to 30 years | |||||||||||||||||||||||||||||
| Dowagiac, MI | (c ) | 762 | 984 | — | — | 762 | 984 | 1,746 | (389 | ) | 2000 | 05/31/06 | 15 to 30 years | |||||||||||||||||||||||||||||
| Duluth, MN | (b) | 4,722 | 6,955 | — | — | 4,722 | 6,955 | 11,677 | (2,133 | ) | 1993 | 05/31/06 | 15 to 30 years | |||||||||||||||||||||||||||||
| Dyersville, IA | (c ) | 381 | 1,082 | — | — | 381 | 1,082 | 1,463 | (372 | ) | 2000 | 05/31/06 | 15 to 30 years | |||||||||||||||||||||||||||||
| Eau Claire, WI | (b) | 3,652 | 5,217 | — | — | 3,652 | 5,217 | 8,869 | (1,678 | ) | 1978 | 05/31/06 | 15 to 30 years | |||||||||||||||||||||||||||||
| Escanaba, MI | (b) | 3,030 | 3,321 | — | — | 3,030 | 3,321 | 6,351 | (1,452 | ) | 1971 | 05/31/06 | 15 to 20 years | |||||||||||||||||||||||||||||
| Essex, MD | (a) | 294 | 1,973 | — | — | 294 | 1,973 | 2,267 | (71 | ) | 1988 | 07/17/13 | 10 to 45 Years | |||||||||||||||||||||||||||||
| Estherville, IA | (c ) | 630 | 463 | — | — | 630 | 463 | 1,093 | (296 | ) | 1976 | 05/31/06 | 15 to 20 years | |||||||||||||||||||||||||||||
| Fairmont, MN | (b) | 2,393 | 3,546 | — | — | 2,393 | 3,546 | 5,939 | (1,138 | ) | 1984 | 05/31/06 | 15 to 30 years | |||||||||||||||||||||||||||||
| Fairview Heights, IL | (b) | 1,418 | 2,383 | — | — | 1,418 | 2,383 | 3,801 | (483 | ) | 1979 | 07/17/13 | 3 to 10 Years | |||||||||||||||||||||||||||||
| Fergus Falls, MN | (c ) | 738 | 1,175 | — | — | 738 | 1,175 | 1,913 | (514 | ) | 1986 | 05/31/06 | 15 to 20 years | |||||||||||||||||||||||||||||
| Fond du Lac, WI | (b) | 4,110 | 5,210 | — | — | 4,110 | 5,210 | 9,320 | (1,582 | ) | 1985 | 05/31/06 | 15 to 30 years | |||||||||||||||||||||||||||||
| Forrest City, AR | (a) | 331 | 860 | — | — | 331 | 860 | 1,191 | (39 | ) | 2002 | 07/17/13 | 10 to 45 Years | |||||||||||||||||||||||||||||
| Fort Atkinson, WI | (b) | 1,005 | 2,873 | — | — | 1,005 | 2,873 | 3,878 | (919 | ) | 1984 | 05/31/06 | 15 to 30 years | |||||||||||||||||||||||||||||
| Fountain Valley, CA | (b) | 9,471 | 13,326 | — | — | 9,471 | 13,326 | 22,797 | (14 | ) | 1968 | 12/30/14 | 11 to 30 Years | |||||||||||||||||||||||||||||
| Freeport, IL | (b) | 1,941 | 2,431 | — | — | 1,941 | 2,431 | 4,372 | (956 | ) | 1994 | 05/31/06 | 15 to 30 years | |||||||||||||||||||||||||||||
| Gallatin, MO | (c ) | 57 | 405 | — | — | 57 | 405 | 462 | (125 | ) | 1990 | 05/31/06 | 15 to 30 years | |||||||||||||||||||||||||||||
| Glasgow, MT | (c ) | 772 | 1,623 | — | — | 772 | 1,623 | 2,395 | (588 | ) | 1998 | 05/31/06 | 15 to 30 years | |||||||||||||||||||||||||||||
| Denver, CO | (c) | 7,839 | 9,299 | — | — | 7,839 | 9,299 | 17,138 | (2,756 | ) | 1991 | 07/17/13 | 5 to 17 Years | ||||||||||||||||||||||||||||
| Dixon, IL | (c) | 1,502 | 2,810 | — | — | 1,502 | 2,810 | 4,312 | (1,205 | ) | 1993 | 05/31/06 | 15 to 30 Years | ||||||||||||||||||||||||||||
| Dowagiac, MI | (c) | 762 | 984 | — | — | 762 | 984 | 1,746 | (494 | ) | 2000 | 05/31/06 | 15 to 30 Years | ||||||||||||||||||||||||||||
| Duluth, MN | (c) | 4,722 | 6,955 | — | — | 4,722 | 6,955 | 11,677 | (2,693 | ) | 1993 | 05/31/06 | 15 to 30 Years | ||||||||||||||||||||||||||||
| Dyersville, IA | (c) | 381 | 1,082 | — | — | 381 | 1,082 | 1,463 | (470 | ) | 2000 | 05/31/06 | 15 to 30 Years | ||||||||||||||||||||||||||||
| Escanaba, MI | (c) | 3,030 | 3,321 | — | — | 3,030 | 3,321 | 6,351 | (1,823 | ) | 1971 | 05/31/06 | 15 to 28 Years | ||||||||||||||||||||||||||||
| Essex, MD | (a) | 294 | 1,973 | — | — | 294 | 1,973 | 2,267 | (172 | ) | 1998 | 07/17/13 | 10 to 45 Years | ||||||||||||||||||||||||||||
| Estherville, IA | (c) | 630 | 463 | (273 | ) | (301 | ) | 357 | 162 | 519 | — | 1976 | 05/31/06 | 15 to 20 Years | |||||||||||||||||||||||||||
| Fairmont, MN | (c) | 2,393 | 3,546 | — | — | 2,393 | 3,546 | 5,939 | (1,430 | ) | 1984 | 05/31/06 | 15 to 30 Years | ||||||||||||||||||||||||||||
| Fairview Heights, IL | (c) | 1,418 | 2,383 | — | 521 | 1,418 | 2,904 | 4,322 | (1,141 | ) | 1990 | 07/17/13 | 3 to 10 Years | ||||||||||||||||||||||||||||
| Fergus Falls, MN | (c) | 738 | 1,175 | — | — | 738 | 1,175 | 1,913 | (653 | ) | 1986 | 05/31/06 | 15 to 20 Years | ||||||||||||||||||||||||||||
| Flagstaff, AZ | (c) | 1,474 | 1,321 | (175 | ) | 257 | 1,299 | 1,578 | 2,877 | — | 2001 | 11/02/15 | 15 to 30 Years | ||||||||||||||||||||||||||||
| Foley, AL | (c) | 1,240 | 2,983 | — | — | 1,240 | 2,983 | 4,223 | (309 | ) | 1994 | 05/08/15 | 9 to 20 Years | ||||||||||||||||||||||||||||
| Fond du Lac, WI | (c) | 4,110 | 5,210 | — | — | 4,110 | 5,210 | 9,320 | (1,985 | ) | 1985 | 05/31/06 | 15 to 30 Years | ||||||||||||||||||||||||||||
| Forrest City, AR | (a) | 331 | 860 | — | — | 331 | 860 | 1,191 | (95 | ) | 2002 | 07/17/13 | 10 to 45 Years | ||||||||||||||||||||||||||||
| Fort Atkinson, WI | (c) | 1,005 | 2,873 | — | — | 1,005 | 2,873 | 3,878 | (1,162 | ) | 1984 | 05/31/06 | 15 to 30 Years | ||||||||||||||||||||||||||||
| Fountain Valley, CA | (c) | 9,470 | 13,326 | — | — | 9,470 | 13,326 | 22,796 | (1,168 | ) | 1968 | 12/30/14 | 11 to 30 Years | ||||||||||||||||||||||||||||
| Freeport, IL | (c) | 1,941 | 2,431 | — | — | 1,941 | 2,431 | 4,372 | (1,197 | ) | 1994 | 05/31/06 | 15 to 30 Years | ||||||||||||||||||||||||||||
| Gallatin, MO | (c) | 57 | 405 | — | — | 57 | 405 | 462 | (159 | ) | 1990 | 05/31/06 | 15 to 30 Years | ||||||||||||||||||||||||||||
| Glasgow, MT | (c) | 772 | 1,623 | — | — | 772 | 1,623 | 2,395 | (741 | ) | 1998 | 05/31/06 | 15 to 30 Years | ||||||||||||||||||||||||||||
| Glenwood, MN | (c) | 775 | 1,404 | — | — | 775 | 1,404 | 2,179 | (531 | ) | 1996 | 05/31/06 | 15 to 40 Years | ||||||||||||||||||||||||||||
| Gothenburg, NE | (a) | 391 | 1,798 | — | — | 391 | 1,798 | 2,189 | (441 | ) | 2007 | 12/08/09 | 12 to 47 Years | ||||||||||||||||||||||||||||
| Grafton, WI | (c) | 2,952 | 4,206 | — | — | 2,952 | 4,206 | 7,158 | (1,794 | ) | 1989 | 05/31/06 | 15 to 30 Years | ||||||||||||||||||||||||||||
| Green Bay, WI | (c) | 6,155 | 6,298 | — | — | 6,155 | 6,298 | 12,453 | (2,396 | ) | 1979 | 05/31/06 | 15 to 30 Years | ||||||||||||||||||||||||||||
| Green Bay, WI | (c) | 8,699 | 12,160 | — | — | 8,699 | 12,160 | 20,859 | (6,150 | ) | 2000 | 05/31/06 | 15 to 28 Years | ||||||||||||||||||||||||||||
| Green Bay, WI | (c) | 4,788 | 4,605 | — | — | 4,788 | 4,605 | 9,393 | (2,571 | ) | 1966 | 05/31/06 | 15 to 28 Years | ||||||||||||||||||||||||||||
| Greenfield, OH | (c) | 555 | 1,041 | — | — | 555 | 1,041 | 1,596 | (492 | ) | 2000 | 05/31/06 | 15 to 30 Years | ||||||||||||||||||||||||||||
| Griffin, GA | (a) | 459 | 1,322 | — | — | 459 | 1,322 | 1,781 | (141 | ) | 2007 | 07/17/13 | 10 to 49 Years | ||||||||||||||||||||||||||||
| Grovetown, GA | (a) | 425 | 933 | — | — | 425 | 933 | 1,358 | (115 | ) | 2007 | 07/17/13 | 10 to 45 Years | ||||||||||||||||||||||||||||
| Harrisonville, MO | (a) | 316 | 466 | — | — | 316 | 466 | 782 | (101 | ) | 1996 | 07/17/13 | 8 to 33 Years | ||||||||||||||||||||||||||||
| Hart, MI | (c) | 565 | 1,377 | — | — | 565 | 1,377 | 1,942 | (580 | ) | 1999 | 05/31/06 | 15 to 30 Years | ||||||||||||||||||||||||||||
| Hartsville, SC | (a) | 536 | 813 | — | — | 536 | 813 | 1,349 | (160 | ) | 2007 | 07/17/13 | 10 to 37 Years | ||||||||||||||||||||||||||||
| Havana, IL | (c) | 526 | 813 | — | — | 526 | 813 | 1,339 | (402 | ) | 2000 | 05/31/06 | 15 to 30 Years | ||||||||||||||||||||||||||||
| Helena, MT | (c) | 3,176 | 5,583 | (724 | ) | — | 2,452 | 5,583 | 8,035 | (2,163 | ) | 1992 | 05/31/06 | 15 to 30 Years | |||||||||||||||||||||||||||
| Hodgenville, KY | (c) | 709 | 838 | (370 | ) | (527 | ) | 339 | 311 | 650 | — | 1999 | 05/31/06 | 15 to 30 Years | |||||||||||||||||||||||||||
| Houghton, MI | (c) | 1,963 | 4,025 | — | — | 1,963 | 4,025 | 5,988 | (1,805 | ) | 1994 | 05/31/06 | 15 to 30 Years | ||||||||||||||||||||||||||||
| Jacksonville, IL | (c) | 3,603 | 3,569 | — | — | 3,603 | 3,569 | 7,172 | (1,956 | ) | 1996 | 05/31/06 | 15 to 30 Years | ||||||||||||||||||||||||||||
| Initial Cost to Company | Cost Capitalized Subsequent to Acquisition including impairment | Gross Amount at December 31, | Life in which depreciation in latest Statement of Operations is computed | ||||||||||||||||||||||
| Description | Encumbrances | Land and Improvements | Buildings and Improvements | Improvements/ Land | Improvements/ building | Land and Improvements | Buildings and Improvements | Total | Final Accum | Date of Construction | Date Acquired | ||||||||||||||
| Glenwood, MN | (c ) | 775 | 1,404 | — | — | 775 | 1,404 | 2,179 | (421 | ) | 1996 | 05/31/06 | 15 to 40 years | |||||||||||||||||||||||||||||
| Gothenburg, NE | (a) | 391 | 1,798 | — | — | 391 | 1,798 | 2,189 | (344 | ) | 2007 | 12/11/07 | 12 to 47 years | |||||||||||||||||||||||||||||
| Grafton, WI | (b) | 2,952 | 4,206 | — | — | 2,952 | 4,206 | 7,158 | (1,417 | ) | 1989 | 05/31/06 | 15 to 30 years | |||||||||||||||||||||||||||||
| Grand Island, NE | (b) | 3,401 | 5,497 | — | — | 3,401 | 5,497 | 8,898 | (1,870 | ) | 1983 | 05/31/06 | 15 to 30 years | |||||||||||||||||||||||||||||
| Great Falls, MT | (b) | 2,998 | 4,929 | — | — | 2,998 | 4,929 | 7,927 | (2,158 | ) | 1985 | 05/31/06 | 15 to 20 years | |||||||||||||||||||||||||||||
| Green Bay, WI | (b) | 6,155 | 6,298 | — | — | 6,155 | 6,298 | 12,453 | (1,909 | ) | 1979 | 05/31/06 | 15 to 30 years | |||||||||||||||||||||||||||||
| Green Bay, WI | (b) | 8,698 | 12,160 | — | — | 8,698 | 12,160 | 20,858 | (4,884 | ) | 2000 | 05/31/06 | 15 to 20 years | |||||||||||||||||||||||||||||
| Green Bay, WI | (b) | 1,269 | 1,937 | — | — | 1,269 | 1,937 | 3,206 | (577 | ) | 2005 | 05/31/06 | 15 to 40 years | |||||||||||||||||||||||||||||
| Green Bay, WI | (b) | 4,788 | 4,605 | — | — | 4,788 | 4,605 | 9,393 | (2,044 | ) | 1966 | 05/31/06 | 15 to 20 years | |||||||||||||||||||||||||||||
| Greenfield, OH | (c ) | 555 | 1,041 | — | — | 555 | 1,041 | 1,596 | (387 | ) | 2000 | 05/31/06 | 15 to 30 years | |||||||||||||||||||||||||||||
| Griffin, GA | (a) | 459 | 1,322 | — | — | 459 | 1,322 | 1,781 | (59 | ) | 2007 | 07/17/13 | 10 to 49 Years | |||||||||||||||||||||||||||||
| Grovetown, GA | (a) | 425 | 933 | — | — | 425 | 933 | 1,358 | (48 | ) | 2007 | 07/17/13 | 10 to 45 Years | |||||||||||||||||||||||||||||
| Harrisonville, MO | (a) | 316 | 466 | — | — | 316 | 466 | 782 | (42 | ) | 1996 | 07/17/13 | 8 to 33 Years | |||||||||||||||||||||||||||||
| Hart, MI | (c ) | 565 | 1,377 | — | — | 565 | 1,377 | 1,942 | (460 | ) | 1999 | 05/31/06 | 15 to 30 years | |||||||||||||||||||||||||||||
| Hartsville, SC | (a) | 536 | 813 | — | — | 536 | 813 | 1,349 | (66 | ) | 2007 | 07/17/13 | 10 to 37 Years | |||||||||||||||||||||||||||||
| Havana, IL | (c ) | 526 | 813 | — | — | 526 | 813 | 1,339 | (317 | ) | 2000 | 05/31/06 | 15 to 30 years | |||||||||||||||||||||||||||||
| Helena, MT | (b) | 3,176 | 5,583 | (724 | ) | — | 2,452 | 5,583 | 8,035 | (1,727 | ) | 1992 | 05/31/06 | 15 to 30 years | ||||||||||||||||||||||||||||
| Hodgenville, KY | (c ) | 709 | 838 | — | — | 709 | 838 | 1,547 | (355 | ) | 1999 | 05/31/06 | 15 to 30 years | |||||||||||||||||||||||||||||
| Houghton, MI | (b) | 1,963 | 4,025 | — | — | 1,963 | 4,025 | 5,988 | (1,429 | ) | 1994 | 05/31/06 | 15 to 30 years | |||||||||||||||||||||||||||||
| Hutchinson, MN | (b) | 2,793 | 4,108 | — | — | 2,793 | 4,108 | 6,901 | (1,299 | ) | 1991 | 05/31/06 | 15 to 30 years | |||||||||||||||||||||||||||||
| Idaho Falls, ID | (b) | 1,721 | 3,231 | — | — | 1,721 | 3,231 | 4,952 | (1,420 | ) | 1986 | 05/31/06 | 15 to 20 years | |||||||||||||||||||||||||||||
| Jacksonville, IL | (b) | 3,603 | 3,569 | — | — | 3,603 | 3,569 | 7,172 | (1,553 | ) | 1996 | 05/31/06 | 15 to 30 years | |||||||||||||||||||||||||||||
| Janesville, WI | (b) | 3,166 | 4,808 | — | — | 3,166 | 4,808 | 7,974 | (2,063 | ) | 1980 | 05/31/06 | 15 to 20 years | |||||||||||||||||||||||||||||
| Kennewick, WA | (b) | 4,044 | 5,347 | — | — | 4,044 | 5,347 | 9,391 | (1,742 | ) | 1989 | 05/31/06 | 15 to 30 years | |||||||||||||||||||||||||||||
| Kenosha, WI | (b) | 3,079 | 4,259 | — | — | 3,079 | 4,259 | 7,338 | (1,916 | ) | 1980 | 05/31/06 | 15 to 20 years | |||||||||||||||||||||||||||||
| Keota, OK | (b) | 215 | 687 | — | — | 215 | 687 | 902 | (2 | ) | 2014 | 12/15/14 | 14 to 40 Years | |||||||||||||||||||||||||||||
| Kewaunee, WI | (c ) | 872 | 758 | — | — | 872 | 758 | 1,630 | (403 | ) | 2000 | 05/31/06 | 15 to 30 years | |||||||||||||||||||||||||||||
| Kimberly, WI | (b) | 3,550 | 4,749 | — | — | 3,550 | 4,749 | 8,299 | (1,987 | ) | 1979 | 05/31/06 | 15 to 20 years | |||||||||||||||||||||||||||||
| Kingsford, MI | (b) | 3,736 | 3,570 | — | — | 3,736 | 3,570 | 7,306 | (1,601 | ) | 1970 | 05/31/06 | 15 to 20 years | |||||||||||||||||||||||||||||
| La Crosse, WI | (b) | 2,896 | 3,810 | — | — | 2,896 | 3,810 | 6,706 | (1,657 | ) | 1978 | 05/31/06 | 15 to 20 years | |||||||||||||||||||||||||||||
| Lake Hallie, WI | (b) | 2,627 | 3,965 | — | — | 2,627 | 3,965 | 6,592 | (1,531 | ) | 1982 | 05/31/06 | 15 to 30 years | |||||||||||||||||||||||||||||
| Lancaster, WI | (c ) | 581 | 1,018 | — | — | 581 | 1,018 | 1,599 | (386 | ) | 1999 | 05/31/06 | 15 to 30 years | |||||||||||||||||||||||||||||
| Lander, WY | (c ) | 289 | 589 | — | — | 289 | 589 | 878 | (280 | ) | 1974 | 05/31/06 | 15 to 20 years | |||||||||||||||||||||||||||||
| Largo, FL | (a) | 758 | 1,025 | — | — | 758 | 1,025 | 1,783 | (52 | ) | 1999 | 07/17/13 | 9 to 36 Years | |||||||||||||||||||||||||||||
| Layton, UT | (b) | 2,950 | 3,408 | — | — | 2,950 | 3,408 | 6,358 | (1,145 | ) | 1988 | 05/31/06 | 15 to 30 years | |||||||||||||||||||||||||||||
| Lewiston, ID | (b) | 409 | 2,999 | — | — | 409 | 2,999 | 3,408 | (1,323 | ) | 1987 | 05/31/06 | 15 to 20 years | |||||||||||||||||||||||||||||
| Liberty, KY | (c ) | 474 | 945 | — | — | 474 | 945 | 1,419 | (342 | ) | 2000 | 05/31/06 | 15 to 30 years | |||||||||||||||||||||||||||||
| Lincoln, NE | (b) | 4,186 | 4,150 | — | — | 4,186 | 4,150 | 8,336 | (1,298 | ) | 1983 | 05/31/06 | 15 to 30 years | |||||||||||||||||||||||||||||
| Livingston, TN | (c ) | 429 | 822 | — | — | 429 | 822 | 1,251 | (311 | ) | 2000 | 05/31/06 | 15 to 30 years | |||||||||||||||||||||||||||||
| Janesville, WI | (c) | 3,166 | 4,808 | — | — | 3,166 | 4,808 | 7,974 | (2,595 | ) | 1980 | 05/31/06 | 15 to 28 Years | ||||||||||||||||||||||||||||
| Kennewick, WA | (c) | 4,044 | 5,347 | — | — | 4,044 | 5,347 | 9,391 | (2,195 | ) | 1989 | 05/31/06 | 15 to 30 Years | ||||||||||||||||||||||||||||
| Kenosha, WI | (c) | 3,079 | 4,259 | — | — | 3,079 | 4,259 | 7,338 | (2,427 | ) | 1980 | 05/31/06 | 15 to 25 Years | ||||||||||||||||||||||||||||
| Kewaunee, WI | (c) | 872 | 758 | — | — | 872 | 758 | 1,630 | (512 | ) | 2000 | 05/31/06 | 15 to 30 Years | ||||||||||||||||||||||||||||
| Kimberly, WI | (c) | 3,550 | 4,749 | — | — | 3,550 | 4,749 | 8,299 | (2,499 | ) | 1979 | 05/31/06 | 15 to 28 Years | ||||||||||||||||||||||||||||
| Kingsford, MI | (c) | 3,736 | 3,570 | — | — | 3,736 | 3,570 | 7,306 | (2,009 | ) | 1970 | 05/31/06 | 15 to 28 Years | ||||||||||||||||||||||||||||
| La Crosse, WI | (c) | 2,896 | 3,810 | — | — | 2,896 | 3,810 | 6,706 | (2,099 | ) | 1978 | 05/31/06 | 15 to 25 Years | ||||||||||||||||||||||||||||
| Lake Hallie, WI | (c) | 2,627 | 3,965 | — | — | 2,627 | 3,965 | 6,592 | (1,930 | ) | 1982 | 05/31/06 | 15 to 30 Years | ||||||||||||||||||||||||||||
| Lancaster, WI | (c) | 581 | 1,018 | — | — | 581 | 1,018 | 1,599 | (487 | ) | 1999 | 05/31/06 | 15 to 30 Years | ||||||||||||||||||||||||||||
| Lander, WY | (c) | 289 | 589 | — | — | 289 | 589 | 878 | (356 | ) | 1974 | 05/31/06 | 15 to 20 Years | ||||||||||||||||||||||||||||
| Largo, FL | (a) | 758 | 1,025 | — | — | 758 | 1,025 | 1,783 | (125 | ) | 1999 | 07/17/13 | 9 to 36 Years | ||||||||||||||||||||||||||||
| Lewiston, ID | (c) | 409 | 2,999 | — | — | 409 | 2,999 | 3,408 | (1,677 | ) | 1987 | 05/31/06 | 15 to 25 Years | ||||||||||||||||||||||||||||
| Logan, UT | (c) | 454 | 3,453 | — | — | 454 | 3,453 | 3,907 | (1,925 | ) | 1989 | 05/31/06 | 15 to 20 Years | ||||||||||||||||||||||||||||
| Madison, SD | (c) | 1,060 | 1,015 | — | — | 1,060 | 1,015 | 2,075 | (689 | ) | 1975 | 05/31/06 | 15 to 25 Years | ||||||||||||||||||||||||||||
| Manistique, MI | (c) | 659 | 1,223 | — | — | 659 | 1,223 | 1,882 | (571 | ) | 2000 | 05/31/06 | 15 to 30 Years | ||||||||||||||||||||||||||||
| Manitowoc, WI | (c) | 2,573 | 4,011 | — | — | 2,573 | 4,011 | 6,584 | (2,251 | ) | 1977 | 05/31/06 | 15 to 28 Years | ||||||||||||||||||||||||||||
| Mankato, MN | (c) | 6,167 | 4,861 | — | — | 6,167 | 4,861 | 11,028 | (2,626 | ) | 1971 | 05/31/06 | 15 to 28 Years | ||||||||||||||||||||||||||||
| Mansfield, TX | (a) | 859 | 599 | — | — | 859 | 599 | 1,458 | (106 | ) | 2007 | 07/17/13 | 10 to 34 Years | ||||||||||||||||||||||||||||
| Marinette, WI | (c) | 1,452 | 3,736 | — | — | 1,452 | 3,736 | 5,188 | (1,527 | ) | 1990 | 05/31/06 | 15 to 30 Years | ||||||||||||||||||||||||||||
| Marion, KY | (c) | 724 | 765 | — | — | 724 | 765 | 1,489 | (443 | ) | 2000 | 05/31/06 | 15 to 30 Years | ||||||||||||||||||||||||||||
| Marquette, MI | (c) | 4,423 | 5,774 | — | — | 4,423 | 5,774 | 10,197 | (3,136 | ) | 1969 | 05/31/06 | 15 to 25 Years | ||||||||||||||||||||||||||||
| Marshall, MN | (c) | 4,152 | 2,872 | — | — | 4,152 | 2,872 | 7,024 | (1,762 | ) | 1972 | 05/31/06 | 15 to 28 Years | ||||||||||||||||||||||||||||
| Marshfield, WI | (c) | 3,272 | 4,406 | — | — | 3,272 | 4,406 | 7,678 | (2,324 | ) | 1968 | 05/31/06 | 15 to 28 Years | ||||||||||||||||||||||||||||
| Mason City, IA | (c) | 2,186 | 3,888 | — | — | 2,186 | 3,888 | 6,074 | (2,122 | ) | 1985 | 05/31/06 | 15 to 28 Years | ||||||||||||||||||||||||||||
| Memphis, MO | (c) | 448 | 313 | — | — | 448 | 313 | 761 | (244 | ) | 1983 | 05/31/06 | 15 to 20 Years | ||||||||||||||||||||||||||||
| Mineral Wells, TX | (a) | 448 | 878 | — | — | 448 | 878 | 1,326 | (114 | ) | 2008 | 07/17/13 | 10 to 42 Years | ||||||||||||||||||||||||||||
| Minerva, OH | (c) | 1,103 | 902 | — | — | 1,103 | 902 | 2,005 | (585 | ) | 2000 | 05/31/06 | 15 to 30 Years | ||||||||||||||||||||||||||||
| Missoula, MT | (c) | 4,123 | 5,253 | — | — | 4,123 | 5,253 | 9,376 | (2,755 | ) | 1987 | 05/31/06 | 15 to 28 Years | ||||||||||||||||||||||||||||
| Mitchell, SD | (c) | 3,918 | 3,126 | — | — | 3,918 | 3,126 | 7,044 | (1,779 | ) | 1973 | 05/31/06 | 15 to 28 Years | ||||||||||||||||||||||||||||
| Monmouth, IL | (c) | 2,037 | 1,166 | — | — | 2,037 | 1,166 | 3,203 | (912 | ) | 1971 | 05/31/06 | 15 to 25 Years | ||||||||||||||||||||||||||||
| Monroe, WI | (c) | 1,526 | 4,027 | — | — | 1,526 | 4,027 | 5,553 | (1,619 | ) | 1994 | 05/31/06 | 15 to 30 Years | ||||||||||||||||||||||||||||
| Monticello, IL | (c) | 641 | 1,172 | — | — | 641 | 1,172 | 1,813 | (545 | ) | 1999 | 05/31/06 | 15 to 30 Years | ||||||||||||||||||||||||||||
| Montpelier, OH | (c) | 557 | 1,130 | (146 | ) | (464 | ) | 411 | 666 | 1,077 | — | 2000 | 05/31/06 | 15 to 30 Years | |||||||||||||||||||||||||||
| Mount Ayr, IA | (c) | 228 | 666 | — | — | 228 | 666 | 894 | (281 | ) | 1995 | 05/31/06 | 15 to 30 Years | ||||||||||||||||||||||||||||
| Mount Carmel, IL | (c) | 972 | 1,602 | — | — | 972 | 1,602 | 2,574 | (973 | ) | 2000 | 05/31/06 | 15 to 20 Years | ||||||||||||||||||||||||||||
| Murfreesboro, TN | (c) | 3,413 | 6,727 | — | — | 3,413 | 6,727 | 10,140 | (700 | ) | 1985 | 02/25/15 | 9 to 20 Years | ||||||||||||||||||||||||||||
| Navasota, TX | (a) | 322 | 868 | — | — | 322 | 868 | 1,190 | (113 | ) | 2007 | 07/17/13 | 10 to 44 Years | ||||||||||||||||||||||||||||
| New London, WI | (c) | 1,008 | 2,094 | — | — | 1,008 | 2,094 | 3,102 | (711 | ) | 1991 | 07/17/13 | 3 to 18 Years | ||||||||||||||||||||||||||||
| Initial Cost to Company | Cost Capitalized Subsequent to Acquisition including impairment | Gross Amount at December 31, | Life in which depreciation in latest Statement of Operations is computed | ||||||||||||||||||||||
| Description | Encumbrances | Land and Improvements | Buildings and Improvements | Improvements/ Land | Improvements/ building | Land and Improvements | Buildings and Improvements | Total | Final Accum | Date of Construction | Date Acquired | ||||||||||||||
| Logan, UT | (b) | 454 | 3,453 | — | — | 454 | 3,453 | 3,907 | (1,516 | ) | 1989 | 05/31/06 | 15 to 20 years | |||||||||||||||||||||||||||||
| Loogootee, IN | (c ) | 571 | 973 | — | — | 571 | 973 | 1,544 | (375 | ) | 1999 | 05/31/06 | 15 to 30 years | |||||||||||||||||||||||||||||
| Madison, SD | (c ) | 1,060 | 1,015 | — | — | 1,060 | 1,015 | 2,075 | (546 | ) | 1975 | 05/31/06 | 15 to 20 years | |||||||||||||||||||||||||||||
| Madison, WI | (b) | 4,072 | 5,777 | — | — | 4,072 | 5,777 | 9,849 | (1,802 | ) | 1988 | 05/31/06 | 15 to 30 years | |||||||||||||||||||||||||||||
| Madison, WI | (b) | 2,836 | 4,522 | — | — | 2,836 | 4,522 | 7,358 | (1,694 | ) | 1982 | 05/31/06 | 15 to 30 years | |||||||||||||||||||||||||||||
| Madison, WI | (b) | 5,632 | 5,299 | (1,125 | ) | — | 4,507 | 5,299 | 9,806 | (1,706 | ) | 1980 | 05/31/06 | 15 to 30 years | ||||||||||||||||||||||||||||
| Manistique, MI | (c ) | 659 | 1,223 | — | — | 659 | 1,223 | 1,882 | (453 | ) | 2000 | 05/31/06 | 15 to 30 years | |||||||||||||||||||||||||||||
| Manitowoc, WI | (b) | 2,573 | 4,011 | — | — | 2,573 | 4,011 | 6,584 | (1,789 | ) | 1977 | 05/31/06 | 15 to 20 years | |||||||||||||||||||||||||||||
| Mankato, MN | (b) | 6,167 | 4,861 | — | — | 6,167 | 4,861 | 11,028 | (2,087 | ) | 1971 | 05/31/06 | 15 to 20 years | |||||||||||||||||||||||||||||
| Mansfield, TX | (a) | 859 | 599 | — | — | 859 | 599 | 1,458 | (44 | ) | 2007 | 07/17/13 | 10 to 34 Years | |||||||||||||||||||||||||||||
| Marinette, WI | (b) | 1,452 | 3,736 | — | — | 1,452 | 3,736 | 5,188 | (1,214 | ) | 1990 | 05/31/06 | 15 to 30 years | |||||||||||||||||||||||||||||
| Marion, KY | (c ) | 724 | 765 | — | — | 724 | 765 | 1,489 | (349 | ) | 2000 | 05/31/06 | 15 to 30 years | |||||||||||||||||||||||||||||
| Marquette, MI | (b) | 4,423 | 5,774 | — | — | 4,423 | 5,774 | 10,197 | (2,476 | ) | 1969 | 05/31/06 | 15 to 20 years | |||||||||||||||||||||||||||||
| Marshall, MN | (b) | 4,152 | 2,872 | — | — | 4,152 | 2,872 | 7,024 | (1,402 | ) | 1972 | 05/31/06 | 15 to 20 years | |||||||||||||||||||||||||||||
| Marshfield, WI | (b) | 3,272 | 4,406 | — | — | 3,272 | 4,406 | 7,678 | (1,849 | ) | 1968 | 05/31/06 | 15 to 20 years | |||||||||||||||||||||||||||||
| Mason City, IA | (b) | 2,186 | 3,888 | — | — | 2,186 | 3,888 | 6,074 | (1,688 | ) | 1985 | 05/31/06 | 15 to 20 years | |||||||||||||||||||||||||||||
| Memphis, MO | (c ) | 448 | 313 | — | — | 448 | 313 | 761 | (192 | ) | 1983 | 05/31/06 | 15 to 20 years | |||||||||||||||||||||||||||||
| Menasha, WI | (b) | 3,137 | 3,245 | — | — | 3,137 | 3,245 | 6,382 | (1,111 | ) | 1981 | 05/31/06 | 15 to 30 years | |||||||||||||||||||||||||||||
| Mesa, AZ | (b) | 734 | — | — | — | 734 | — | 734 | — | 1955 | 11/13/14 | 0 to 0 Years | ||||||||||||||||||||||||||||||
| Mineral Wells, TX | (a) | 448 | 878 | — | — | 448 | 878 | 1,326 | (47 | ) | 2008 | 07/17/13 | 10 to 42 Years | |||||||||||||||||||||||||||||
| Minerva, OH | (c ) | 1,103 | 902 | — | — | 1,103 | 902 | 2,005 | (461 | ) | 2000 | 05/31/06 | 15 to 30 years | |||||||||||||||||||||||||||||
| Missoula, MT | (b) | 4,123 | 5,253 | — | — | 4,123 | 5,253 | 9,376 | (2,190 | ) | 1987 | 05/31/06 | 15 to 20 years | |||||||||||||||||||||||||||||
| Mitchell, IN | (c ) | 554 | 791 | — | — | 554 | 791 | 1,345 | (330 | ) | 2000 | 05/31/06 | 15 to 30 years | |||||||||||||||||||||||||||||
| Mitchell, SD | (b) | 3,918 | 3,126 | — | — | 3,918 | 3,126 | 7,044 | (1,414 | ) | 1973 | 05/31/06 | 15 to 20 years | |||||||||||||||||||||||||||||
| Monmouth, IL | (b) | 2,037 | 1,166 | — | — | 2,037 | 1,166 | 3,203 | (721 | ) | 1971 | 05/31/06 | 15 to 20 years | |||||||||||||||||||||||||||||
| Monona, WI | (b) | 2,982 | 4,700 | — | — | 2,982 | 4,700 | 7,682 | (1,564 | ) | 1981 | 05/31/06 | 15 to 30 years | |||||||||||||||||||||||||||||
| Monroe, WI | (b) | 1,526 | 4,027 | — | — | 1,526 | 4,027 | 5,553 | (1,284 | ) | 1994 | 05/31/06 | 15 to 30 years | |||||||||||||||||||||||||||||
| Monticello, IL | (c ) | 641 | 1,172 | — | — | 641 | 1,172 | 1,813 | (430 | ) | 1999 | 05/31/06 | 15 to 30 years | |||||||||||||||||||||||||||||
| Montpelier, OH | (c ) | 557 | 1,130 | — | — | 557 | 1,130 | 1,687 | (409 | ) | 2000 | 05/31/06 | 15 to 30 years | |||||||||||||||||||||||||||||
| Morgantown, KY | (c ) | 518 | 871 | — | — | 518 | 871 | 1,389 | (330 | ) | 1999 | 05/31/06 | 15 to 30 years | |||||||||||||||||||||||||||||
| Mount Ayr, IA | (c ) | 228 | 666 | — | — | 228 | 666 | 894 | (221 | ) | 1995 | 05/31/06 | 15 to 30 years | |||||||||||||||||||||||||||||
| Mount Carmel, IL | (c ) | 972 | 1,602 | — | — | 972 | 1,602 | 2,574 | (767 | ) | 2000 | 05/31/06 | 15 to 20 years | |||||||||||||||||||||||||||||
| Munfordville, KY | (c ) | 672 | 766 | — | — | 672 | 766 | 1,438 | (335 | ) | 2000 | 05/31/06 | 15 to 30 years | |||||||||||||||||||||||||||||
| Nampa, ID | (b) | 2,080 | 4,014 | — | — | 2,080 | 4,014 | 6,094 | (1,747 | ) | 1986 | 05/31/06 | 15 to 20 years | |||||||||||||||||||||||||||||
| Navasota, TX | (a) | 322 | 868 | — | — | 322 | 868 | 1,190 | (47 | ) | 2007 | 07/17/13 | 10 to 44 Years | |||||||||||||||||||||||||||||
| Neenah, WI | (b) | 2,944 | 5,595 | (38 | ) | — | 2,906 | 5,595 | 8,501 | (1,719 | ) | 1990 | 05/31/06 | 15 to 30 years | ||||||||||||||||||||||||||||
| New London, WI | 1,778 | 1,008 | 2,094 | — | — | 1,008 | 2,094 | 3,102 | (295 | ) | 1991 | 07/17/13 | 3 to 28 Years | |||||||||||||||||||||||||||||
| Newaygo, MI | (c ) | 633 | 1,155 | — | — | 633 | 1,155 | 1,788 | (418 | ) | 2000 | 05/31/06 | 15 to 30 years | |||||||||||||||||||||||||||||
| Norfolk, NE | (b) | 2,701 | 2,912 | — | — | 2,701 | 2,912 | 5,613 | (1,158 | ) | 1984 | 05/31/06 | 15 to 30 years | |||||||||||||||||||||||||||||
| Newaygo, MI | (c) | 633 | 1,155 | — | — | 633 | 1,155 | 1,788 | (531 | ) | 2000 | 05/31/06 | 15 to 30 Years | ||||||||||||||||||||||||||||
| Norfolk, NE | (c) | 2,701 | 2,912 | — | — | 2,701 | 2,912 | 5,613 | (1,467 | ) | 1984 | 05/31/06 | 15 to 30 Years | ||||||||||||||||||||||||||||
| Oconto, WI | (c) | 496 | 1,176 | — | — | 496 | 1,176 | 1,672 | (552 | ) | 2000 | 05/31/06 | 15 to 30 Years | ||||||||||||||||||||||||||||
| Ogden, UT | (c) | 2,448 | 3,864 | — | — | 2,448 | 3,864 | 6,312 | (1,567 | ) | 1988 | 05/31/06 | 15 to 30 Years | ||||||||||||||||||||||||||||
| Okeechobee, FL | (a) | 409 | 1,298 | — | — | 409 | 1,298 | 1,707 | (135 | ) | 2006 | 07/17/13 | 10 to 47 Years | ||||||||||||||||||||||||||||
| Omaha, NE | (c) | 5,477 | 3,986 | (3,807 | ) | (3,126 | ) | 1,670 | 860 | 2,530 | — | 1984 | 05/31/06 | 15 to 30 Years | |||||||||||||||||||||||||||
| Onalaska, WI | (c) | 2,468 | 4,392 | — | — | 2,468 | 4,392 | 6,860 | (1,768 | ) | 1989 | 05/31/06 | 15 to 30 Years | ||||||||||||||||||||||||||||
| O'Neill, NE | (a) | 400 | 1,752 | — | — | 400 | 1,752 | 2,152 | (479 | ) | 1972 | 12/08/09 | 12 to 47 Years | ||||||||||||||||||||||||||||
| Osceola, IA | (c) | 322 | 422 | — | — | 322 | 422 | 744 | (254 | ) | 1978 | 05/31/06 | 15 to 20 Years | ||||||||||||||||||||||||||||
| Oshkosh, WI | (c) | 3,595 | 4,384 | — | — | 3,595 | 4,384 | 7,979 | (1,756 | ) | 1984 | 05/31/06 | 15 to 30 Years | ||||||||||||||||||||||||||||
| Peoria, IL | (c) | 2,407 | 5,452 | — | — | 2,407 | 5,452 | 7,859 | (657 | ) | 2006 | 07/17/13 | 2 to 40 Years | ||||||||||||||||||||||||||||
| Perry, IA | (c) | 651 | 1,015 | — | — | 651 | 1,015 | 1,666 | (515 | ) | 1998 | 05/31/06 | 15 to 30 Years | ||||||||||||||||||||||||||||
| Powell, WY | (c) | 1,264 | 859 | — | — | 1,264 | 859 | 2,123 | (567 | ) | 1985 | 05/31/06 | 15 to 25 Years | ||||||||||||||||||||||||||||
| Quincy, IL | (c) | 3,510 | 4,916 | — | — | 3,510 | 4,916 | 8,426 | (2,677 | ) | 1986 | 05/31/06 | 15 to 28 Years | ||||||||||||||||||||||||||||
| Racine, WI | (c) | 3,076 | 5,305 | — | — | 3,076 | 5,305 | 8,381 | (2,722 | ) | 1979 | 05/31/06 | 15 to 25 Years | ||||||||||||||||||||||||||||
| Rawlins, WY | (c) | 430 | 581 | — | — | 430 | 581 | 1,011 | (391 | ) | 1971 | 05/31/06 | 15 to 20 Years | ||||||||||||||||||||||||||||
| Rensselaer, NY | (a) | 705 | 657 | — | — | 705 | 657 | 1,362 | (367 | ) | 1971 | 07/17/13 | 3 to 13 Years | ||||||||||||||||||||||||||||
| Rice Lake, WI | (c) | 1,535 | 3,407 | — | — | 1,535 | 3,407 | 4,942 | (1,503 | ) | 1995 | 05/31/06 | 15 to 30 Years | ||||||||||||||||||||||||||||
| River Falls, WI | (c) | 1,787 | 4,283 | — | — | 1,787 | 4,283 | 6,070 | (1,744 | ) | 1994 | 05/31/06 | 15 to 30 Years | ||||||||||||||||||||||||||||
| Rochester, MN | (c) | 6,466 | 4,232 | — | — | 6,466 | 4,232 | 10,698 | (2,429 | ) | 1981 | 05/31/06 | 15 to 28 Years | ||||||||||||||||||||||||||||
| Rochester, MN | (c) | 6,189 | 4,511 | — | — | 6,189 | 4,511 | 10,700 | (2,524 | ) | 1981 | 05/31/06 | 15 to 20 Years | ||||||||||||||||||||||||||||
| Rockville, IN | (c) | 628 | 939 | — | — | 628 | 939 | 1,567 | (476 | ) | 1999 | 05/31/06 | 15 to 30 Years | ||||||||||||||||||||||||||||
| Rome, NY | (a) | 436 | 699 | — | — | 436 | 699 | 1,135 | (127 | ) | 1996 | 07/17/13 | 10 to 28 Years | ||||||||||||||||||||||||||||
| Rothschild, WI | (c) | 2,685 | 4,231 | — | — | 2,685 | 4,231 | 6,916 | (2,366 | ) | 1977 | 05/31/06 | 15 to 29 Years | ||||||||||||||||||||||||||||
| Sandersville, GA | (a) | 503 | 751 | — | — | 503 | 751 | 1,254 | (106 | ) | 2006 | 07/17/13 | 10 to 45 Years | ||||||||||||||||||||||||||||
| Sheboygan, WI | (c) | 2,973 | 4,340 | — | — | 2,973 | 4,340 | 7,313 | (1,969 | ) | 1993 | 05/31/06 | 15 to 30 Years | ||||||||||||||||||||||||||||
| Shreveport, LA | (a) | 374 | 490 | — | — | 374 | 490 | 864 | (124 | ) | 2001 | 07/17/13 | 10 to 31 Years | ||||||||||||||||||||||||||||
| Sioux Falls, SD | (c) | 4,907 | 4,023 | — | — | 4,907 | 4,023 | 8,930 | (2,260 | ) | 1987 | 05/31/06 | 15 to 28 Years | ||||||||||||||||||||||||||||
| Somerville, TN | (c) | 345 | 537 | — | — | 345 | 537 | 882 | (297 | ) | 2000 | 05/31/06 | 15 to 30 Years | ||||||||||||||||||||||||||||
| Spencer, IN | (c) | 971 | 2,483 | — | — | 971 | 2,483 | 3,454 | (572 | ) | 1987 | 07/17/13 | 4 to 22 Years | ||||||||||||||||||||||||||||
| Spokane, WA | (c) | 1,014 | 3,005 | — | — | 1,014 | 3,005 | 4,019 | (1,422 | ) | 1987 | 05/31/06 | 15 to 29 Years | ||||||||||||||||||||||||||||
| St. Cloud, MN | (c) | 3,749 | 4,884 | — | — | 3,749 | 4,884 | 8,633 | (2,673 | ) | 1985 | 05/31/06 | 15 to 20 Years | ||||||||||||||||||||||||||||
| St. Cloud, MN | (c) | 5,033 | 6,589 | — | — | 5,033 | 6,589 | 11,622 | (2,597 | ) | 1991 | 05/31/06 | 15 to 30 Years | ||||||||||||||||||||||||||||
| Stevens Point, WI | (c) | 1,383 | 5,401 | — | — | 1,383 | 5,401 | 6,784 | (2,612 | ) | 1985 | 05/31/06 | 15 to 25 Years | ||||||||||||||||||||||||||||
| Sturgis, SD | (c) | 402 | 717 | — | — | 402 | 717 | 1,119 | (432 | ) | 1984 | 05/31/06 | 15 to 25 Years | ||||||||||||||||||||||||||||
| Sullivan, IL | (c) | 557 | 879 | — | — | 557 | 879 | 1,436 | (442 | ) | 1999 | 05/31/06 | 15 to 30 Years | ||||||||||||||||||||||||||||
| Sweetwater, TX | (a) | 415 | 1,097 | — | — | 415 | 1,097 | 1,512 | (128 | ) | 2006 | 07/17/13 | 10 to 47 Years | ||||||||||||||||||||||||||||
| Thermopolis, WY | (a) | 589 | 1,600 | — | — | 589 | 1,600 | 2,189 | (402 | ) | 2007 | 12/08/09 | 12 to 47 Years | ||||||||||||||||||||||||||||
| Tuscola, IL | (c) | 724 | 897 | — | — | 724 | 897 | 1,621 | (491 | ) | 2000 | 05/31/06 | 15 to 30 Years | ||||||||||||||||||||||||||||
| Initial Cost to Company | Cost Capitalized Subsequent to Acquisition including impairment | Gross Amount at December 31, | Life in which depreciation in latest Statement of Operations is computed | ||||||||||||||||||||||
| Description | Encumbrances | Land and Improvements | Buildings and Improvements | Improvements/ Land | Improvements/ building | Land and Improvements | Buildings and Improvements | Total | Final Accum | Date of Construction | Date Acquired | ||||||||||||||
| North Platte, NE | (b) | 2,734 | 3,378 | — | — | 2,734 | 3,378 | 6,112 | (1,063 | ) | 1985 | 05/31/06 | 15 to 30 years | |||||||||||||||||||||||||||||
| Oconto, WI | (c ) | 496 | 1,176 | — | — | 496 | 1,176 | 1,672 | (435 | ) | 2000 | 05/31/06 | 15 to 30 years | |||||||||||||||||||||||||||||
| Ogden, UT | (b) | 2,448 | 3,864 | — | — | 2,448 | 3,864 | 6,312 | (1,234 | ) | 1988 | 05/31/06 | 15 to 30 years | |||||||||||||||||||||||||||||
| Okeechobee, FL | (a) | 409 | 1,298 | — | — | 409 | 1,298 | 1,707 | (56 | ) | 2006 | 07/17/13 | 10 to 47 Years | |||||||||||||||||||||||||||||
| Omaha, NE | (c ) | 1,024 | 7,113 | — | — | 1,024 | 7,113 | 8,137 | (2,197 | ) | 1966 | 05/31/06 | 15 to 30 years | |||||||||||||||||||||||||||||
| Omaha, NE | (b) | 5,320 | 4,086 | — | — | 5,320 | 4,086 | 9,406 | (1,354 | ) | 1985 | 05/31/06 | 15 to 30 years | |||||||||||||||||||||||||||||
| Omaha, NE | (b) | 5,477 | 3,986 | — | — | 5,477 | 3,986 | 9,463 | (1,315 | ) | 1984 | 05/31/06 | 15 to 30 years | |||||||||||||||||||||||||||||
| Omaha, NE | (b) | 7,431 | 14,273 | — | — | 7,431 | 14,273 | 21,704 | (6,242 | ) | 2000 | 05/31/06 | 15 to 30 years | |||||||||||||||||||||||||||||
| Onalaska, WI | (b) | 2,468 | 4,392 | — | — | 2,468 | 4,392 | 6,860 | (1,408 | ) | 1989 | 05/31/06 | 15 to 30 years | |||||||||||||||||||||||||||||
| O'Neill, NE | (a) | 400 | 1,752 | — | — | 400 | 1,752 | 2,152 | (376 | ) | 1972 | 08/24/07 | 12 to 47 years | |||||||||||||||||||||||||||||
| Osceola, IA | (c ) | 322 | 422 | — | — | 322 | 422 | 744 | (200 | ) | 1978 | 05/31/06 | 15 to 20 years | |||||||||||||||||||||||||||||
| Oshkosh, WI | (b) | 3,594 | 4,384 | — | — | 3,594 | 4,384 | 7,978 | (1,399 | ) | 1984 | 05/31/06 | 15 to 30 years | |||||||||||||||||||||||||||||
| Papillion, NE | (c ) | 10,113 | 13,578 | — | — | 10,113 | 13,578 | 23,691 | (720 | ) | 2007 | 07/17/13 | 10 to 41 Years | |||||||||||||||||||||||||||||
| Park Rapids, MN | (c ) | 877 | 1,089 | — | — | 877 | 1,089 | 1,966 | (520 | ) | 1981 | 05/31/06 | 15 to 20 years | |||||||||||||||||||||||||||||
| Peoria, IL | 4,950 | 2,407 | 5,452 | — | — | 2,407 | 5,452 | 7,859 | (274 | ) | 2006 | 07/17/13 | 2 to 40 Years | |||||||||||||||||||||||||||||
| Perry, IA | (c ) | 651 | 1,015 | — | — | 651 | 1,015 | 1,666 | (408 | ) | 1998 | 05/31/06 | 15 to 30 years | |||||||||||||||||||||||||||||
| Petersburg, IN | (c ) | 799 | 678 | — | — | 799 | 678 | 1,477 | (348 | ) | 1999 | 05/31/06 | 15 to 30 years | |||||||||||||||||||||||||||||
| Pocatello, ID | (b) | 2,317 | 4,274 | — | — | 2,317 | 4,274 | 6,591 | (1,870 | ) | 1986 | 05/31/06 | 15 to 20 years | |||||||||||||||||||||||||||||
| Port Washington, WI | (b) | 436 | 1,427 | — | — | 436 | 1,427 | 1,863 | (427 | ) | 1982 | 05/31/06 | 15 to 40 years | |||||||||||||||||||||||||||||
| Powell, WY | (c ) | 1,264 | 859 | — | — | 1,264 | 859 | 2,123 | (450 | ) | 1985 | 05/31/06 | 15 to 20 years | |||||||||||||||||||||||||||||
| Provo, UT | (b) | 2,145 | 2,966 | — | — | 2,145 | 2,966 | 5,111 | (991 | ) | 1988 | 05/31/06 | 15 to 30 years | |||||||||||||||||||||||||||||
| Pullman, WA | (b) | 2,237 | 4,295 | — | — | 2,237 | 4,295 | 6,532 | (1,401 | ) | 1996 | 05/31/06 | 15 to 30 years | |||||||||||||||||||||||||||||
| Quincy, IL | (b) | 3,510 | 4,916 | — | — | 3,510 | 4,916 | 8,426 | (2,125 | ) | 1986 | 05/31/06 | 15 to 20 years | |||||||||||||||||||||||||||||
| Quinton, OK | (b) | 245 | 683 | — | — | 245 | 683 | 928 | (2 | ) | 2014 | 12/15/14 | 14 to 40 Years | |||||||||||||||||||||||||||||
| Racine, WI | (b) | 3,076 | 5,305 | — | — | 3,076 | 5,305 | 8,381 | (2,149 | ) | 1979 | 05/31/06 | 15 to 20 years | |||||||||||||||||||||||||||||
| Rapid City, SD | (b) | 4,725 | 4,164 | — | — | 4,725 | 4,164 | 8,889 | (1,457 | ) | 1988 | 05/31/06 | 15 to 30 years | |||||||||||||||||||||||||||||
| Rawlins, WY | (c ) | 430 | 581 | — | — | 430 | 581 | 1,011 | (308 | ) | 1971 | 05/31/06 | 15 to 20 years | |||||||||||||||||||||||||||||
| Redding, CA | (b) | 7,043 | 5,255 | — | — | 7,043 | 5,255 | 12,298 | (1,688 | ) | 1989 | 05/31/06 | 15 to 30 years | |||||||||||||||||||||||||||||
| Rensselaer, NY | (a) | 705 | 657 | — | — | 705 | 657 | 1,362 | (154 | ) | 1971 | 07/17/13 | 3 to 13 Years | |||||||||||||||||||||||||||||
| Rice Lake, WI | (b) | 1,535 | 3,407 | — | — | 1,535 | 3,407 | 4,942 | (1,194 | ) | 1995 | 05/31/06 | 15 to 30 years | |||||||||||||||||||||||||||||
| River Falls, WI | (b) | 1,787 | 4,283 | — | — | 1,787 | 4,283 | 6,070 | (1,384 | ) | 1994 | 05/31/06 | 15 to 30 years | |||||||||||||||||||||||||||||
| Rochester, MN | (b) | 6,466 | 4,232 | — | — | 6,466 | 4,232 | 10,698 | (1,932 | ) | 1981 | 05/31/06 | 15 to 20 years | |||||||||||||||||||||||||||||
| Rochester, MN | (b) | 6,189 | 4,511 | — | — | 6,189 | 4,511 | 10,700 | (1,988 | ) | 1981 | 05/31/06 | 15 to 20 years | |||||||||||||||||||||||||||||
| Rockville, IN | (c ) | 628 | 939 | — | — | 628 | 939 | 1,567 | (375 | ) | 1999 | 05/31/06 | 15 to 30 years | |||||||||||||||||||||||||||||
| Rome, NY | (a) | 436 | 699 | — | — | 436 | 699 | 1,135 | (52 | ) | 1996 | 07/17/13 | 10 to 28 Years | |||||||||||||||||||||||||||||
| Rothschild, WI | (b) | 2,685 | 4,231 | — | — | 2,685 | 4,231 | 6,916 | (1,875 | ) | 1977 | 05/31/06 | 15 to 20 years | |||||||||||||||||||||||||||||
| Salt Lake City, UT | (b) | 3,260 | 3,937 | — | — | 3,260 | 3,937 | 7,197 | (1,305 | ) | 1991 | 05/31/06 | 15 to 30 years | |||||||||||||||||||||||||||||
| Sandersville, GA | (a) | 503 | 751 | — | — | 503 | 751 | 1,254 | (44 | ) | 2006 | 07/17/13 | 10 to 45 Years | |||||||||||||||||||||||||||||
| Twin Falls, ID | (c) | 2,038 | 3,696 | — | — | 2,038 | 3,696 | 5,734 | (2,053 | ) | 1986 | 05/31/06 | 15 to 20 Years | ||||||||||||||||||||||||||||
| Union Gap, WA | (c) | 481 | 4,079 | — | — | 481 | 4,079 | 4,560 | (2,222 | ) | 1991 | 05/31/06 | 15 to 29 Years | ||||||||||||||||||||||||||||
| Washington, IA | (c) | 719 | 865 | (181 | ) | (479 | ) | 538 | 386 | 924 | — | 1973 | 05/31/06 | 15 to 20 Years | |||||||||||||||||||||||||||
| Washington, IL | (c) | 1,195 | 1,441 | (391 | ) | (517 | ) | 804 | 924 | 1,728 | — | 1989 | 07/17/13 | 2 to 10 Years | |||||||||||||||||||||||||||
| Watertown, SD | (c) | 3,064 | 3,519 | — | — | 3,064 | 3,519 | 6,583 | (1,448 | ) | 1985 | 05/31/06 | 15 to 30 Years | ||||||||||||||||||||||||||||
| Watertown, WI | (c) | 3,124 | 4,436 | — | — | 3,124 | 4,436 | 7,560 | (2,400 | ) | 1972 | 05/31/06 | 15 to 25 Years | ||||||||||||||||||||||||||||
| Waukon, IA | (c) | 604 | 971 | — | — | 604 | 971 | 1,575 | (477 | ) | 1998 | 05/31/06 | 15 to 30 Years | ||||||||||||||||||||||||||||
| Whiteville, NC | (c) | 1,119 | 1,676 | — | — | 1,119 | 1,676 | 2,795 | (559 | ) | 1988 | 07/17/13 | 7 to 30 Years | ||||||||||||||||||||||||||||
| Wichita, KS | (a) | 236 | 741 | — | — | 236 | 741 | 977 | (81 | ) | 1990 | 07/17/13 | 10 to 42 Years | ||||||||||||||||||||||||||||
| Wilton, NY | (a) | 1,348 | 2,165 | — | — | 1,348 | 2,165 | 3,513 | (530 | ) | 2000 | 07/17/13 | 8 to 27 Years | ||||||||||||||||||||||||||||
| Wisconsin Rapids, WI | (c) | 3,689 | 4,806 | — | — | 3,689 | 4,806 | 8,495 | (2,581 | ) | 1969 | 05/31/06 | 15 to 28 Years | ||||||||||||||||||||||||||||
| Woodsfield, OH | (c) | 691 | 1,009 | — | — | 691 | 1,009 | 1,700 | (519 | ) | 2000 | 05/31/06 | 15 to 30 Years | ||||||||||||||||||||||||||||
| Worthington, MN | (c) | 2,861 | 3,767 | — | — | 2,861 | 3,767 | 6,628 | (1,562 | ) | 1984 | 05/31/06 | 15 to 30 Years | ||||||||||||||||||||||||||||
| Restaurants - Casual Dining | |||||||||||||||||||||||||||||||||
| Addison, TX | (a) | 1,615 | 2,476 | — | — | 1,615 | 2,476 | 4,091 | (986 | ) | 1998 | 07/01/05 | 15 to 30 Years | ||||||||||||||||||||
| Adrian, MI | (c) | 652 | 1,233 | — | — | 652 | 1,233 | 1,885 | (111 | ) | 1991 | 12/23/14 | 15 to 30 Years | ||||||||||||||||||||
| Albany, GA | (a) | 1,073 | 1,719 | (505 | ) | (838 | ) | 568 | 881 | 1,449 | — | 2003 | 07/17/13 | 12 to 33 Years | |||||||||||||||||||
| Albany, GA | (c) | 744 | 1,340 | — | — | 744 | 1,340 | 2,084 | (121 | ) | 1971 | 12/23/14 | 15 to 30 Years | ||||||||||||||||||||
| Albany, OR | (c) | 913 | 1,951 | — | — | 913 | 1,951 | 2,864 | (248 | ) | 2005 | 07/17/13 | 12 to 35 Years | ||||||||||||||||||||
| Albuquerque, NM | (a) | 120 | 1,336 | — | — | 120 | 1,336 | 1,456 | (419 | ) | 1999 | 07/01/05 | 30 to 30 Years | ||||||||||||||||||||
| Albuquerque, NM | (a) | 1,036 | 1,655 | — | — | 1,036 | 1,655 | 2,691 | (734 | ) | 1994 | 07/01/05 | 15 to 30 Years | ||||||||||||||||||||
| Albuquerque, NM | (a) | 1,473 | 2,947 | — | — | 1,473 | 2,947 | 4,420 | (570 | ) | 2011 | 07/17/13 | 10 to 33 Years | ||||||||||||||||||||
| Alcoa, TN | (a) | 228 | 219 | — | — | 228 | 219 | 447 | (113 | ) | 1982 | 11/02/07 | 15 to 30 Years | ||||||||||||||||||||
| Alcoa, TN | (a) | 483 | 318 | — | — | 483 | 318 | 801 | (169 | ) | 1978 | 11/02/07 | 15 to 30 Years | ||||||||||||||||||||
| Alexandria, VA | (a) | 1,024 | 202 | — | 12 | 1,024 | 214 | 1,238 | (147 | ) | 1979 | 12/19/06 | 11 to 20 Years | ||||||||||||||||||||
| Alvin, TX | (a) | 256 | 585 | — | — | 256 | 585 | 841 | (590 | ) | 1997 | 12/30/04 | 10 to 15 Years | ||||||||||||||||||||
| Apple Valley, MN | (a) | 1,119 | 1,055 | — | — | 1,119 | 1,055 | 2,174 | (469 | ) | 1999 | 09/24/04 | 15 to 30 Years | ||||||||||||||||||||
| Appleton, WI | (a) | 727 | 1,329 | — | 9 | 727 | 1,338 | 2,065 | (617 | ) | 1993 | 12/29/06 | 7 to 30 Years | ||||||||||||||||||||
| Ardmore, OK | (a) | 1,332 | 1,466 | (704 | ) | (677 | ) | 628 | 789 | 1,417 | (700 | ) | 1986 | 02/26/07 | 14 to 30 Years | ||||||||||||||||||
| Arkansas city, KS | (a) | 239 | 975 | — | — | 239 | 975 | 1,214 | (111 | ) | 1987 | 06/04/14 | 15 to 30 Years | ||||||||||||||||||||
| Arlington, TX | (a) | 2,064 | 2,043 | — | — | 2,064 | 2,043 | 4,107 | (803 | ) | 1995 | 07/01/05 | 15 to 30 Years | ||||||||||||||||||||
| Arlington, TX | (a) | 1,301 | 1,032 | — | — | 1,301 | 1,032 | 2,333 | (716 | ) | 1978 | 02/26/07 | 14 to 20 Years | ||||||||||||||||||||
| Ashland, OH | (a) | 294 | 642 | — | — | 294 | 642 | 936 | (147 | ) | 1971 | 03/18/13 | 13 to 20 Years | ||||||||||||||||||||
| Initial Cost to Company | Cost Capitalized Subsequent to Acquisition including impairment | Gross Amount at December 31, | Life in which depreciation in latest Statement of Operations is computed | ||||||||||||||||||||||
| Description | Encumbrances | Land and Improvements | Buildings and Improvements | Improvements/ Land | Improvements/ building | Land and Improvements | Buildings and Improvements | Total | Final Accum | Date of Construction | Date Acquired | ||||||||||||||
| Scottsville, KY | (c ) | 544 | 840 | — | — | 544 | 840 | 1,384 | (327 | ) | 1999 | 05/31/06 | 15 to 30 years | |||||||||||||||||||||||||||||
| Sheboygan, WI | (b) | 2,973 | 4,340 | — | — | 2,973 | 4,340 | 7,313 | (1,563 | ) | 1993 | 05/31/06 | 15 to 30 years | |||||||||||||||||||||||||||||
| Shreveport, LA | (a) | 374 | 490 | — | — | 374 | 490 | 864 | (51 | ) | 2001 | 07/17/13 | 10 to 31 Years | |||||||||||||||||||||||||||||
| Sioux Falls, SD | (b) | 4,907 | 4,023 | — | — | 4,907 | 4,023 | 8,930 | (1,796 | ) | 1987 | 05/31/06 | 15 to 20 years | |||||||||||||||||||||||||||||
| Smithville, TN | (c ) | 570 | 733 | (15 | ) | — | 555 | 733 | 1,288 | (321 | ) | 2000 | 05/31/06 | 15 to 30 years | ||||||||||||||||||||||||||||
| Somerville, TN | (c ) | 345 | 537 | — | — | 345 | 537 | 882 | (234 | ) | 2000 | 05/31/06 | 15 to 30 years | |||||||||||||||||||||||||||||
| Spencer, IN | 1,325 | 971 | 2,483 | — | — | 971 | 2,483 | 3,454 | (237 | ) | 1987 | 07/17/13 | 4 to 24 Years | |||||||||||||||||||||||||||||
| Spokane, WA | (b) | 1,014 | 3,005 | — | — | 1,014 | 3,005 | 4,019 | (1,133 | ) | 1987 | 05/31/06 | 15 to 20 years | |||||||||||||||||||||||||||||
| Spokane, WA | (b) | 3,437 | 5,047 | — | — | 3,437 | 5,047 | 8,484 | (1,627 | ) | 1995 | 05/31/06 | 15 to 30 years | |||||||||||||||||||||||||||||
| St. Cloud, MN | (b) | 3,749 | 4,884 | — | — | 3,749 | 4,884 | 8,633 | (2,105 | ) | 1985 | 05/31/06 | 15 to 20 years | |||||||||||||||||||||||||||||
| St. Cloud, MN | (b) | 5,033 | 6,589 | — | — | 5,033 | 6,589 | 11,622 | (2,065 | ) | 1991 | 05/31/06 | 15 to 30 years | |||||||||||||||||||||||||||||
| St. Croix, VI | 4,035 | 2,132 | 5,992 | — | — | 2,132 | 5,992 | 8,124 | (321 | ) | 2005 | 07/17/13 | 8 to 37 Years | |||||||||||||||||||||||||||||
| Stevens Point, WI | (b) | 1,383 | 5,401 | — | — | 1,383 | 5,401 | 6,784 | (2,062 | ) | 1985 | 05/31/06 | 15 to 20 years | |||||||||||||||||||||||||||||
| Sturgis, SD | (c ) | 402 | 717 | — | — | 402 | 717 | 1,119 | (343 | ) | 1984 | 05/31/06 | 15 to 20 years | |||||||||||||||||||||||||||||
| Sullivan, IL | (c ) | 557 | 879 | — | — | 557 | 879 | 1,436 | (349 | ) | 1999 | 05/31/06 | 15 to 30 years | |||||||||||||||||||||||||||||
| Sweetwater, TX | (a) | 415 | 1,097 | — | — | 415 | 1,097 | 1,512 | (53 | ) | 2006 | 07/17/13 | 10 to 47 Years | |||||||||||||||||||||||||||||
| Thermopolis, WY | (a) | 589 | 1,600 | — | — | 589 | 1,600 | 2,189 | (313 | ) | 2007 | 12/11/07 | 12 to 47 years | |||||||||||||||||||||||||||||
| Tuscola, IL | (c ) | 724 | 897 | — | — | 724 | 897 | 1,621 | (386 | ) | 2000 | 05/31/06 | 15 to 30 years | |||||||||||||||||||||||||||||
| Union Gap, WA | (b) | 481 | 4,079 | — | — | 481 | 4,079 | 4,560 | (1,763 | ) | 1991 | 05/31/06 | 15 to 20 years | |||||||||||||||||||||||||||||
| Vermillion, SD | (c ) | 756 | 993 | — | — | 756 | 993 | 1,749 | (477 | ) | 1984 | 05/31/06 | 15 to 20 years | |||||||||||||||||||||||||||||
| Wahpeton, ND | (c ) | 1,202 | 1,418 | — | — | 1,202 | 1,418 | 2,620 | (713 | ) | 1971 | 05/31/06 | 15 to 20 years | |||||||||||||||||||||||||||||
| Walla Walla, WA | (b) | 2,283 | 1,955 | — | — | 2,283 | 1,955 | 4,238 | (683 | ) | 1989 | 05/31/06 | 15 to 30 years | |||||||||||||||||||||||||||||
| Washington, IA | (c ) | 719 | 865 | — | — | 719 | 865 | 1,584 | (444 | ) | 1973 | 05/31/06 | 15 to 20 years | |||||||||||||||||||||||||||||
| Washington, IL | (b) | 1,195 | 1,441 | — | — | 1,195 | 1,441 | 2,636 | (362 | ) | 1989 | 07/17/13 | 2 to 10 Years | |||||||||||||||||||||||||||||
| Watertown, SD | (b) | 3,064 | 3,519 | — | — | 3,064 | 3,519 | 6,583 | (1,153 | ) | 1985 | 05/31/06 | 15 to 30 years | |||||||||||||||||||||||||||||
| Watertown, WI | (b) | 3,124 | 4,436 | — | — | 3,124 | 4,436 | 7,560 | (1,895 | ) | 1972 | 05/31/06 | 15 to 20 years | |||||||||||||||||||||||||||||
| Waukon, IA | (c ) | 604 | 971 | — | — | 604 | 971 | 1,575 | (378 | ) | 1998 | 05/31/06 | 15 to 30 years | |||||||||||||||||||||||||||||
| West Bountiful, UT | (b) | 2,952 | 3,897 | — | — | 2,952 | 3,897 | 6,849 | (1,271 | ) | 1991 | 05/31/06 | 15 to 30 years | |||||||||||||||||||||||||||||
| West Jordan, UT | (b) | 2,848 | 3,969 | — | — | 2,848 | 3,969 | 6,817 | (1,327 | ) | 1988 | 05/31/06 | 15 to 30 years | |||||||||||||||||||||||||||||
| West Valley City, UT | (b) | 2,780 | 4,005 | — | — | 2,780 | 4,005 | 6,785 | (1,366 | ) | 1989 | 05/31/06 | 15 to 30 years | |||||||||||||||||||||||||||||
| Western Grove, AR | (b) | 391 | 595 | — | — | 391 | 595 | 986 | (2 | ) | 2014 | 12/15/14 | 14 to 40 Years | |||||||||||||||||||||||||||||
| Whiteville, NC | (b) | 1,119 | 1,676 | — | — | 1,119 | 1,676 | 2,795 | (232 | ) | 1988 | 07/17/13 | 7 to 30 Years | |||||||||||||||||||||||||||||
| Wichita, KS | (a) | 236 | 741 | — | — | 236 | 741 | 977 | (34 | ) | 2005 | 07/17/13 | 10 to 42 Years | |||||||||||||||||||||||||||||
| Wilburton, OK | (b) | 522 | 887 | — | — | 522 | 887 | 1,409 | (3 | ) | 2014 | 12/15/14 | 14 to 40 Years | |||||||||||||||||||||||||||||
| Wilton, NY | (a) | 1,348 | 2,165 | — | — | 1,348 | 2,165 | 3,513 | (220 | ) | 1987 | 07/17/13 | 8 to 27 Years | |||||||||||||||||||||||||||||
| Winona, MN | (b) | 3,413 | 4,436 | — | — | 3,413 | 4,436 | 7,849 | (2,030 | ) | 1986 | 05/31/06 | 15 to 20 years | |||||||||||||||||||||||||||||
| Ashtabula, OH | (a) | 865 | 244 | — | — | 865 | 244 | 1,109 | (160 | ) | 1975 | 02/06/07 | 15 to 30 Years | ||||||||||||||||||||
| Athens, TN | (a) | 197 | 341 | — | 176 | 197 | 517 | 714 | (231 | ) | 1977 | 11/02/07 | 15 to 30 Years | ||||||||||||||||||||
| Augusta, GA | (c) | 1,494 | 2,019 | — | — | 1,494 | 2,019 | 3,513 | (233 | ) | 2005 | 07/17/13 | 13 to 40 Years | ||||||||||||||||||||
| Aurora, CO | (c) | 1,017 | 1,743 | — | — | 1,017 | 1,743 | 2,760 | (212 | ) | 1998 | 07/17/13 | 13 to 35 Years | ||||||||||||||||||||
| Aurora, CO | (c) | 1,521 | 1,498 | — | — | 1,521 | 1,498 | 3,019 | (225 | ) | 1992 | 07/17/13 | 9 to 32 Years | ||||||||||||||||||||
| Aurora, CO | (c) | 1,151 | 1,742 | — | — | 1,151 | 1,742 | 2,893 | (127 | ) | 1974 | 12/23/14 | 15 to 40 Years | ||||||||||||||||||||
| Austintown, OH | (a) | 1,106 | 450 | — | — | 1,106 | 450 | 1,556 | (230 | ) | 1991 | 02/06/07 | 15 to 30 Years | ||||||||||||||||||||
| Avon, IN | (a) | 899 | 615 | — | — | 899 | 615 | 1,514 | (81 | ) | 2014 | 10/31/14 | 14 to 30 Years | ||||||||||||||||||||
| Battle Creek, MI | (a) | 423 | 560 | — | — | 423 | 560 | 983 | (85 | ) | 1997 | 12/24/13 | 15 to 30 Years | ||||||||||||||||||||
| Beachwood, OH | (c) | 1,080 | 1,773 | — | — | 1,080 | 1,773 | 2,853 | (132 | ) | 1977 | 12/23/14 | 15 to 40 Years | ||||||||||||||||||||
| Beaumont, TX | (a) | 1,435 | 1,541 | — | — | 1,435 | 1,541 | 2,976 | (685 | ) | 1997 | 06/29/07 | 15 to 40 Years | ||||||||||||||||||||
| Bellflower, CA | (a) | 1,284 | 1,636 | — | — | 1,284 | 1,636 | 2,920 | (139 | ) | 1970 | 12/19/14 | 15 to 30 Years | ||||||||||||||||||||
| Bellflower, CA | (a) | 1,273 | 1,501 | — | — | 1,273 | 1,501 | 2,774 | (92 | ) | 1981 | 12/19/14 | 15 to 50 Years | ||||||||||||||||||||
| Benson, AZ | (c) | 313 | 336 | — | — | 313 | 336 | 649 | (44 | ) | 1996 | 03/20/15 | 15 to 20 Years | ||||||||||||||||||||
| Berkley, MI | (a) | 390 | 540 | — | — | 390 | 540 | 930 | (58 | ) | 1927 | 10/31/14 | 14 to 30 Years | ||||||||||||||||||||
| Bessemer, AL | (a) | 622 | 983 | — | 64 | 622 | 1,047 | 1,669 | (178 | ) | 2002 | 03/29/13 | 8 to 29 Years | ||||||||||||||||||||
| Birch Run, MI | (c) | 1,852 | 1,290 | — | — | 1,852 | 1,290 | 3,142 | (199 | ) | 2014 | 12/24/14 | 14 to 30 Years | ||||||||||||||||||||
| Birmingham, AL | (a) | 321 | 739 | — | 50 | 321 | 789 | 1,110 | (133 | ) | 1977 | 03/29/13 | 8 to 29 Years | ||||||||||||||||||||
| Birmingham, AL | (a) | 512 | 983 | — | 65 | 512 | 1,048 | 1,560 | (179 | ) | 2002 | 03/29/13 | 8 to 29 Years | ||||||||||||||||||||
| Blakely, GA | (a) | 288 | 744 | — | — | 288 | 744 | 1,032 | (470 | ) | 1987 | 06/25/04 | 15 to 20 Years | ||||||||||||||||||||
| Bloomington, IL | (a) | 393 | 629 | — | — | 393 | 629 | 1,022 | (85 | ) | 1986 | 12/24/13 | 15 to 30 Years | ||||||||||||||||||||
| Bloomington, IL | (c) | 662 | 1,029 | — | — | 662 | 1,029 | 1,691 | (94 | ) | 1975 | 12/23/14 | 15 to 30 Years | ||||||||||||||||||||
| Boise, ID | (a) | 809 | 601 | (400 | ) | (259 | ) | 409 | 342 | 751 | (225 | ) | 1998 | 06/25/04 | 15 to 30 Years | ||||||||||||||||||
| Bowie, MD | (a) | 333 | 173 | — | 200 | 333 | 373 | 706 | (220 | ) | 1983 | 11/27/06 | 15 to 20 Years | ||||||||||||||||||||
| Bowie, MD | (a) | 1,501 | 615 | — | — | 1,501 | 615 | 2,116 | (301 | ) | 2004 | 12/31/07 | 15 to 40 Years | ||||||||||||||||||||
| Bowling Green, KY | (a) | 934 | 3,135 | (579 | ) | (1,941 | ) | 355 | 1,194 | 1,549 | (26 | ) | 1997 | 07/17/13 | 10 to 34 Years | ||||||||||||||||||
| Boyne City, MI | (c) | 69 | 938 | — | — | 69 | 938 | 1,007 | (37 | ) | 1997 | 11/09/15 | 15 to 30 Years | ||||||||||||||||||||
| Bradford, PA | (a) | 368 | 255 | — | — | 368 | 255 | 623 | (151 | ) | 1977 | 02/06/07 | 15 to 30 Years | ||||||||||||||||||||
| Bradley, IL | (c) | 1,610 | 1,783 | — | — | 1,610 | 1,783 | 3,393 | (179 | ) | 1991 | 12/23/14 | 15 to 30 Years | ||||||||||||||||||||
| Brandon, FL | (c) | 1,358 | 614 | — | — | 1,358 | 614 | 1,972 | (118 | ) | 2004 | 11/05/14 | 14 to 20 Years | ||||||||||||||||||||
| Branson, MO | (a) | 1,497 | 1,684 | — | — | 1,497 | 1,684 | 3,181 | (802 | ) | 1994 | 09/23/05 | 15 to 30 Years | ||||||||||||||||||||
| Bridgeton, MO | (a) | 314 | 1,160 | — | — | 314 | 1,160 | 1,474 | (134 | ) | 1994 | 12/24/13 | 15 to 30 Years | ||||||||||||||||||||
| Broken Arrow, OK | (a) | 1,081 | 226 | — | — | 1,081 | 226 | 1,307 | (27 | ) | 2006 | 12/24/13 | 15 to 40 Years | ||||||||||||||||||||
| Broken Arrow, OK | (a) | 1,636 | 1,620 | — | — | 1,636 | 1,620 | 3,256 | (197 | ) | 2006 | 07/21/14 | 14 to 30 Years | ||||||||||||||||||||
| Brooklyn, OH | (c) | 1,226 | 672 | — | — | 1,226 | 672 | 1,898 | (313 | ) | 2001 | 02/06/07 | 10 to 25 Years | ||||||||||||||||||||
| Bryan, TX | (a) | 739 | 700 | — | — | 739 | 700 | 1,439 | (439 | ) | 1988 | 12/30/04 | 15 to 20 Years | ||||||||||||||||||||
| Burlington, IA | (a) | 304 | 588 | — | — | 304 | 588 | 892 | (284 | ) | 1996 | 09/23/05 | 15 to 30 Years | ||||||||||||||||||||
| Burlington, IA | (a) | 318 | 484 | — | — | 318 | 484 | 802 | (240 | ) | 2006 | 12/04/06 | 15 to 30 Years | ||||||||||||||||||||
| Initial Cost to Company | Cost Capitalized Subsequent to Acquisition including impairment | Gross Amount at December 31, | Life in which depreciation in latest Statement of Operations is computed | ||||||||||||||||||||||
| Description | Encumbrances | Land and Improvements | Buildings and Improvements | Improvements/ Land | Improvements/ building | Land and Improvements | Buildings and Improvements | Total | Final Accum | Date of Construction | Date Acquired | ||||||||||||||
| Wisconsin Rapids, WI | (b) | 3,689 | 4,806 | — | — | 3,689 | 4,806 | 8,495 | (2,051 | ) | 1969 | 05/31/06 | 15 to 20 years | |||||||||||||||||||||||||||||
| Woodsfield, OH | (c ) | 691 | 1,009 | — | — | 691 | 1,009 | 1,700 | (408 | ) | 2000 | 05/31/06 | 15 to 30 years | |||||||||||||||||||||||||||||
| Worthington, MN | (b) | 2,861 | 3,767 | — | — | 2,861 | 3,767 | 6,628 | (1,233 | ) | 1984 | 05/31/06 | 15 to 30 years | |||||||||||||||||||||||||||||
| Yakima, WA | (b) | 2,789 | 5,033 | — | — | 2,789 | 5,033 | 7,822 | (1,600 | ) | 1988 | 05/31/06 | 15 to 30 years | |||||||||||||||||||||||||||||
| Restaurants - Casual Dining | ||||||||||||||||||||||||||||||||||
| Addison, IL | 5,600 | 4,690 | 6,692 | — | — | 4,690 | 6,692 | 11,382 | (671 | ) | 2006 | 07/17/13 | 7 to 24 Years | |||||||||||||||||||||
| Addison, TX | (a) | 1,615 | 2,476 | — | — | 1,615 | 2,476 | 4,091 | (777 | ) | 1998 | 09/30/04 | 15 to 30 years | |||||||||||||||||||||
| Adrian, MI | (b) | 652 | 1,233 | — | — | 652 | 1,233 | 1,885 | — | 1991 | 12/23/14 | 15 to 30 Years | ||||||||||||||||||||||
| Albany, GA | (a) | 1,073 | 1,719 | — | — | 1,073 | 1,719 | 2,792 | (110 | ) | 2003 | 07/17/13 | 12 to 33 Years | |||||||||||||||||||||
| Albany, GA | (b) | 744 | 1,340 | — | — | 744 | 1,340 | 2,084 | — | 1971 | 12/23/14 | 15 to 30 Years | ||||||||||||||||||||||
| Albany, OR | (c ) | 913 | 1,951 | — | — | 913 | 1,951 | 2,864 | (103 | ) | 2005 | 07/17/13 | 12 to 35 Years | |||||||||||||||||||||
| Albuquerque, NM | (a) | 1,473 | 2,947 | — | — | 1,473 | 2,947 | 4,420 | (236 | ) | 2011 | 07/17/13 | 10 to 33 Years | |||||||||||||||||||||
| Albuquerque, NM | (a) | 120 | 1,336 | — | — | 120 | 1,336 | 1,456 | (330 | ) | 1999 | 12/30/04 | 30 to 30 years | |||||||||||||||||||||
| Albuquerque, NM | (a) | 1,036 | 1,655 | — | — | 1,036 | 1,655 | 2,691 | (578 | ) | 1994 | 12/30/04 | 15 to 30 years | |||||||||||||||||||||
| Alcoa, TN | (a) | 228 | 219 | — | — | 228 | 219 | 447 | (88 | ) | 1982 | 11/02/07 | 15 to 30 years | |||||||||||||||||||||
| Alcoa, TN | (a) | 483 | 318 | — | — | 483 | 318 | 801 | (132 | ) | 1978 | 11/02/07 | 15 to 30 years | |||||||||||||||||||||
| Alexandria, VA | (a) | 1,024 | 202 | — | 12 | 1,024 | 214 | 1,238 | (114 | ) | 1979 | 12/19/06 | 15 to 20 years | |||||||||||||||||||||
| Alvin, TX | (a) | 256 | 585 | — | — | 256 | 585 | 841 | (465 | ) | 1997 | 12/30/04 | 10 to 15 years | |||||||||||||||||||||
| Appleton, WI | (a) | 727 | 1,329 | — | 9 | 727 | 1,338 | 2,065 | (499 | ) | 1993 | 12/29/06 | 8 to 30 years | |||||||||||||||||||||
| Ardmore, OK | (a) | 1,332 | 1,466 | — | — | 1,332 | 1,466 | 2,798 | (591 | ) | 1986 | 02/26/07 | 14 to 30 years | |||||||||||||||||||||
| Arkansas city, KS | (a) | 239 | 975 | — | — | 239 | 975 | 1,214 | (25 | ) | 1987 | 06/04/14 | 15 to 30 Years | |||||||||||||||||||||
| Arlington, TX | (a) | 2,064 | 2,043 | — | — | 2,064 | 2,043 | 4,107 | (632 | ) | 1995 | 09/30/04 | 15 to 30 years | |||||||||||||||||||||
| Ashland, OH | (a) | 294 | 642 | — | — | 294 | 642 | 936 | (69 | ) | 1971 | 03/18/13 | 13 to 20 Years | |||||||||||||||||||||
| Ashtabula, OH | (a) | 865 | 244 | — | — | 865 | 244 | 1,109 | (126 | ) | 1975 | 02/06/07 | 15 to 30 years | |||||||||||||||||||||
| Athens, TN | (a) | 197 | 341 | — | 176 | 197 | 517 | 714 | (168 | ) | 1977 | 11/02/07 | 15 to 30 years | |||||||||||||||||||||
| Augusta, GA | (c ) | 1,494 | 2,019 | — | — | 1,494 | 2,019 | 3,513 | (97 | ) | 2005 | 07/17/13 | 13 to 40 Years | |||||||||||||||||||||
| Aurora, CO | (c ) | 1,017 | 1,743 | — | — | 1,017 | 1,743 | 2,760 | (88 | ) | 1998 | 07/17/13 | 13 to 35 Years | |||||||||||||||||||||
| Aurora, CO | (c ) | 1,521 | 1,498 | — | — | 1,521 | 1,498 | 3,019 | (93 | ) | 1992 | 07/17/13 | 9 to 32 Years | |||||||||||||||||||||
| Aurora, CO | (b) | 1,151 | 1,742 | — | — | 1,151 | 1,742 | 2,893 | — | 1974 | 12/23/14 | 15 to 40 Years | ||||||||||||||||||||||
| Austell, GA | (a) | 838 | 216 | — | — | 838 | 216 | 1,054 | (172 | ) | 1962 | 02/28/06 | 15 to 20 years | |||||||||||||||||||||
| Austintown, OH | (a) | 1,106 | 450 | — | — | 1,106 | 450 | 1,556 | (181 | ) | 1991 | 02/06/07 | 15 to 30 years | |||||||||||||||||||||
| Avon, IN | (b) | 899 | 615 | — | — | 899 | 615 | 1,514 | (6 | ) | 2014 | 10/31/14 | 14 to 30 Years | |||||||||||||||||||||
| Battle Creek, MI | (a) | 423 | 560 | — | — | 423 | 560 | 983 | (28 | ) | 1997 | 12/24/13 | 15 to 30 Years | |||||||||||||||||||||
| Beachwood, OH | (b) | 1,080 | 1,773 | — | — | 1,080 | 1,773 | 2,853 | — | 1977 | 12/23/14 | 15 to 40 Years | ||||||||||||||||||||||
| Burr Ridge, IL | (a) | 759 | 977 | 16 | 1,584 | 775 | 2,561 | 3,336 | (1,027 | ) | 1997 | 06/25/04 | 15 to 30 Years | ||||||||||||||||||||
| Calera, AL | (a) | 560 | 912 | — | 84 | 560 | 996 | 1,556 | (183 | ) | 2008 | 03/29/13 | 8 to 29 Years | ||||||||||||||||||||
| Canfield, OH | (a) | 449 | 644 | 92 | — | 541 | 644 | 1,185 | (290 | ) | 1973 | 02/06/07 | 15 to 30 Years | ||||||||||||||||||||
| Canton, MI | (a) | 2,071 | 1,224 | — | — | 2,071 | 1,224 | 3,295 | (675 | ) | 1996 | 06/25/04 | 15 to 30 Years | ||||||||||||||||||||
| Canton, MI | (c) | 914 | 890 | — | — | 914 | 890 | 1,804 | (65 | ) | 2014 | 06/17/15 | 15 to 40 Years | ||||||||||||||||||||
| Canton, OH | (a) | 1,325 | 781 | — | — | 1,325 | 781 | 2,106 | (342 | ) | 1989 | 02/06/07 | 15 to 30 Years | ||||||||||||||||||||
| Carrollton, GA | (a) | 985 | 725 | — | — | 985 | 725 | 1,710 | (130 | ) | 1995 | 07/17/13 | 11 to 33 Years | ||||||||||||||||||||
| Casper, WY | (a) | 54 | 762 | — | — | 54 | 762 | 816 | (274 | ) | 1969 | 12/29/06 | 15 to 30 Years | ||||||||||||||||||||
| Chanhassen, MN | (a) | 1,439 | 784 | — | — | 1,439 | 784 | 2,223 | (138 | ) | 1953 | 05/22/14 | 15 to 30 Years | ||||||||||||||||||||
| Charleston, IL | (a) | 272 | 220 | — | — | 272 | 220 | 492 | (233 | ) | 1986 | 09/23/05 | 10 to 15 Years | ||||||||||||||||||||
| Chatsworth, GA | (a) | 213 | 558 | — | — | 213 | 558 | 771 | (232 | ) | 1979 | 11/02/07 | 15 to 30 Years | ||||||||||||||||||||
| Chattanooga, TN | (a) | 352 | 246 | — | — | 352 | 246 | 598 | (179 | ) | 1984 | 11/02/07 | 15 to 30 Years | ||||||||||||||||||||
| Cheyenne, WY | (a) | 277 | 2,041 | — | — | 277 | 2,041 | 2,318 | (1,015 | ) | 1928 | 12/29/06 | 15 to 20 Years | ||||||||||||||||||||
| Chicago, IL | (a) | 1,675 | 1,112 | — | — | 1,675 | 1,112 | 2,787 | (470 | ) | 1999 | 12/29/06 | 15 to 30 Years | ||||||||||||||||||||
| Cincinnati, OH | (a) | 1,614 | 4,134 | — | — | 1,614 | 4,134 | 5,748 | (378 | ) | 2013 | 01/15/14 | 9 to 40 Years | ||||||||||||||||||||
| Claremont, CA | (a) | 2,764 | 2,919 | — | — | 2,764 | 2,919 | 5,683 | (240 | ) | 2011 | 12/19/14 | 15 to 40 Years | ||||||||||||||||||||
| Clarion, PA | (a) | 426 | 653 | — | — | 426 | 653 | 1,079 | (304 | ) | 1976 | 02/06/07 | 15 to 30 Years | ||||||||||||||||||||
| Clearwater, FL | (a) | 2,226 | 858 | — | — | 2,226 | 858 | 3,084 | (376 | ) | 2004 | 12/31/07 | 15 to 40 Years | ||||||||||||||||||||
| Cleveland, OH | (a) | 875 | 138 | — | — | 875 | 138 | 1,013 | (26 | ) | 1995 | 12/24/13 | 15 to 30 Years | ||||||||||||||||||||
| Clinton Township, MI | (c) | 1,377 | 911 | — | — | 1,377 | 911 | 2,288 | (108 | ) | 2003 | 11/05/14 | 14 to 30 Years | ||||||||||||||||||||
| Clinton, MD | (a) | 300 | 193 | — | 200 | 300 | 393 | 693 | (179 | ) | 1980 | 11/27/06 | 13 to 20 Years | ||||||||||||||||||||
| Clinton, TN | (a) | 417 | 293 | — | — | 417 | 293 | 710 | (171 | ) | 1994 | 11/02/07 | 15 to 30 Years | ||||||||||||||||||||
| Clovis, NM | (c) | 861 | 2,172 | — | — | 861 | 2,172 | 3,033 | (268 | ) | 2005 | 07/17/13 | 13 to 40 Years | ||||||||||||||||||||
| Colby, KS | (a) | 269 | 567 | — | — | 269 | 567 | 836 | (73 | ) | 1987 | 06/04/14 | 15 to 30 Years | ||||||||||||||||||||
| Colonial Heights, VA | (a) | 1,948 | 500 | 37 | 1,463 | 1,985 | 1,963 | 3,948 | (129 | ) | 1989 | 10/25/13 | 15 to 40 Years | ||||||||||||||||||||
| Colonie, NY | (a) | 1,322 | 991 | (350 | ) | (261 | ) | 972 | 730 | 1,702 | (403 | ) | 1994 | 12/31/07 | 15 to 40 Years | ||||||||||||||||||
| Colorado Springs, CO | (a) | 674 | 519 | — | — | 674 | 519 | 1,193 | (117 | ) | 1989 | 11/19/12 | 5 to 30 Years | ||||||||||||||||||||
| Colorado Springs, CO | (c) | 937 | 1,120 | — | — | 937 | 1,120 | 2,057 | (215 | ) | 1998 | 07/17/13 | 8 to 25 Years | ||||||||||||||||||||
| Columbus, GA | (c) | 1,199 | 1,911 | — | — | 1,199 | 1,911 | 3,110 | (228 | ) | 2005 | 07/17/13 | 13 to 40 Years | ||||||||||||||||||||
| Columbus, GA | (c) | 2,102 | 1,717 | — | — | 2,102 | 1,717 | 3,819 | (187 | ) | 1993 | 07/17/13 | 13 to 40 Years | ||||||||||||||||||||
| Columbus, GA | (c) | 876 | 1,243 | — | — | 876 | 1,243 | 2,119 | (115 | ) | 2003 | 12/23/14 | 15 to 30 Years | ||||||||||||||||||||
| Conroe, TX | (a) | 942 | 3,274 | (575 | ) | (2,006 | ) | 367 | 1,268 | 1,635 | (29 | ) | 1993 | 07/17/13 | 11 to 32 Years | ||||||||||||||||||
| Corry, PA | (a) | 411 | 279 | — | — | 411 | 279 | 690 | (183 | ) | 1977 | 02/06/07 | 15 to 30 Years | ||||||||||||||||||||
| Council Bluffs, IA | (c) | 1,070 | 703 | — | — | 1,070 | 703 | 1,773 | (77 | ) | 1995 | 12/23/14 | 15 to 30 Years | ||||||||||||||||||||
| Creston, IA | (a) | 103 | 180 | — | — | 103 | 180 | 283 | (200 | ) | 1974 | 12/15/05 | 10 to 15 Years | ||||||||||||||||||||
| Crossville, TN | (a) | 220 | 288 | — | 176 | 220 | 464 | 684 | (215 | ) | 1978 | 11/02/07 | 15 to 30 Years | ||||||||||||||||||||
| Initial Cost to Company | Cost Capitalized Subsequent to Acquisition including impairment | Gross Amount at December 31, | Life in which depreciation in latest Statement of Operations is computed | ||||||||||||||||||||||
| Description | Encumbrances | Land and Improvements | Buildings and Improvements | Improvements/ Land | Improvements/ building | Land and Improvements | Buildings and Improvements | Total | Final Accum | Date of Construction | Date Acquired | ||||||||||||||
| Beaumont, TX | (a) | 1,435 | 1,541 | — | — | 1,435 | 1,541 | 2,976 | (539 | ) | 1997 | 06/29/07 | 15 to 40 years | |||||||||||||||||||||
| Beebe, AR | (b) | 211 | 107 | — | — | 211 | 107 | 318 | (9 | ) | 1986 | 03/31/14 | 1 to 20 Years | |||||||||||||||||||||
| Bellflower, CA | (a) | 1,284 | 1,636 | — | — | 1,284 | 1,636 | 2,920 | — | 1970 | 12/19/14 | 15 to 30 Years | ||||||||||||||||||||||
| Bellflower, CA | (a) | 1,273 | 1,501 | — | — | 1,273 | 1,501 | 2,774 | — | 1981 | 12/19/14 | 15 to 50 Years | ||||||||||||||||||||||
| Berkley, MI | (b) | 390 | 540 | — | — | 390 | 540 | 930 | (5 | ) | 1927 | 10/31/14 | 14 to 30 Years | |||||||||||||||||||||
| Bessemer, AL | (a) | 622 | 983 | — | 64 | 622 | 1,047 | 1,669 | (83 | ) | 2002 | 03/29/13 | 8 to 29 Years | |||||||||||||||||||||
| Birch Run, MI | (b) | 1,852 | 1,290 | — | — | 1,852 | 1,290 | 3,142 | — | 2014 | 12/24/14 | 14 to 30 Years | ||||||||||||||||||||||
| Birmingham, AL | (a) | 321 | 740 | — | 50 | 321 | 790 | 1,111 | (62 | ) | 1977 | 03/29/13 | 8 to 29 Years | |||||||||||||||||||||
| Birmingham, AL | (a) | 512 | 983 | — | 65 | 512 | 1,048 | 1,560 | (84 | ) | 2002 | 03/29/13 | 8 to 29 Years | |||||||||||||||||||||
| Blakely, GA | (a) | 288 | 744 | — | — | 288 | 744 | 1,032 | (370 | ) | 1987 | 06/25/04 | 15 to 20 years | |||||||||||||||||||||
| Bloomington, IL | (a) | 393 | 629 | — | — | 393 | 629 | 1,022 | (28 | ) | 1986 | 12/24/13 | 15 to 30 Years | |||||||||||||||||||||
| Bloomington, IL | (b) | 662 | 1,029 | — | — | 662 | 1,029 | 1,691 | — | 1975 | 12/23/14 | 15 to 30 Years | ||||||||||||||||||||||
| Boise, ID | (a) | 809 | 601 | (400 | ) | (259 | ) | 409 | 342 | 751 | (191 | ) | 1998 | 06/25/04 | 15 to 30 years | |||||||||||||||||||
| Bowie, MD | (a) | 333 | 173 | — | 200 | 333 | 373 | 706 | (146 | ) | 1983 | 11/27/06 | 15 to 20 years | |||||||||||||||||||||
| Bowie, MD | (a) | 1,501 | 615 | — | — | 1,501 | 615 | 2,116 | (234 | ) | 2004 | 12/31/07 | 15 to 40 years | |||||||||||||||||||||
| Bowling Green, KY | (a) | 934 | 3,134 | — | — | 934 | 3,134 | 4,068 | (173 | ) | 1997 | 07/17/13 | 10 to 34 Years | |||||||||||||||||||||
| Bradford, PA | (a) | 368 | 255 | — | — | 368 | 255 | 623 | (119 | ) | 1977 | 02/06/07 | 15 to 30 years | |||||||||||||||||||||
| Bradley, IL | (b) | 1,610 | 1,783 | — | — | 1,610 | 1,783 | 3,393 | — | 1991 | 12/23/14 | 15 to 30 Years | ||||||||||||||||||||||
| Brandon, FL | (b) | 1,358 | 614 | — | — | 1,358 | 614 | 1,972 | (9 | ) | 2004 | 11/05/14 | 14 to 20 Years | |||||||||||||||||||||
| Branson, MO | (a) | 1,497 | 1,684 | — | — | 1,497 | 1,684 | 3,181 | (632 | ) | 1994 | 09/23/05 | 15 to 30 years | |||||||||||||||||||||
| Bridgeton, MO | (a) | 314 | 1,160 | — | — | 314 | 1,160 | 1,474 | (45 | ) | 1994 | 12/24/13 | 15 to 30 Years | |||||||||||||||||||||
| Broken Arrow, OK | (a) | 1,081 | 226 | — | — | 1,081 | 226 | 1,307 | (9 | ) | 2006 | 12/24/13 | 15 to 40 Years | |||||||||||||||||||||
| Broken Arrow, OK | (a) | 1,636 | 1,620 | — | — | 1,636 | 1,620 | 3,256 | (34 | ) | 2006 | 07/21/14 | 14 to 30 Years | |||||||||||||||||||||
| Brooklyn, OH | (b) | 1,226 | 672 | — | — | 1,226 | 672 | 1,898 | (247 | ) | 2001 | 02/06/07 | 10 to 25 years | |||||||||||||||||||||
| Bryan, TX | (a) | 739 | 700 | — | — | 739 | 700 | 1,439 | (346 | ) | 1988 | 12/30/04 | 15 to 20 years | |||||||||||||||||||||
| Burlington, IA | (a) | 304 | 588 | — | — | 304 | 588 | 892 | (223 | ) | 1996 | 09/23/05 | 15 to 30 years | |||||||||||||||||||||
| Burlington, IA | (a) | 318 | 484 | — | — | 318 | 484 | 802 | (189 | ) | 2006 | 09/23/05 | 15 to 30 years | |||||||||||||||||||||
| Burr Ridge, IL | (a) | 759 | 977 | 16 | 1,584 | 775 | 2,561 | 3,336 | (713 | ) | 1997 | 06/25/04 | 15 to 30 years | |||||||||||||||||||||
| Calera, AL | (a) | 560 | 912 | — | 84 | 560 | 996 | 1,556 | (85 | ) | 2008 | 03/29/13 | 8 to 29 Years | |||||||||||||||||||||
| Canfield, OH | (a) | 449 | 644 | — | — | 449 | 644 | 1,093 | (229 | ) | 1973 | 02/06/07 | 15 to 30 years | |||||||||||||||||||||
| Canton, MI | (a) | 2,071 | 1,224 | — | — | 2,071 | 1,224 | 3,295 | (532 | ) | 1996 | 06/25/04 | 15 to 30 years | |||||||||||||||||||||
| Canton, OH | (a) | 1,325 | 781 | — | — | 1,325 | 781 | 2,106 | (269 | ) | 1989 | 02/06/07 | 15 to 30 years | |||||||||||||||||||||
| Carmel, IN | (b) | 851 | 646 | — | — | 851 | 646 | 1,497 | (6 | ) | 2014 | 10/31/14 | 14 to 30 Years | |||||||||||||||||||||
| Carrollton, GA | (a) | 985 | 725 | — | — | 985 | 725 | 1,710 | (54 | ) | 1995 | 07/17/13 | 11 to 33 Years | |||||||||||||||||||||
| Carrollton, GA | (a) | 508 | 603 | — | — | 508 | 603 | 1,111 | (184 | ) | 2000 | 02/28/06 | 15 to 40 years | |||||||||||||||||||||
| Cartersville, GA | (a) | 581 | 730 | — | — | 581 | 730 | 1,311 | (270 | ) | 1997 | 02/28/06 | 15 to 30 years | |||||||||||||||||||||
| Cartersville, GA | (a) | 439 | 451 | — | — | 439 | 451 | 890 | (199 | ) | 1990 | 02/28/06 | 15 to 30 years | |||||||||||||||||||||
| Casper, WY | (a) | 54 | 762 | — | — | 54 | 762 | 816 | (216 | ) | 1969 | 12/29/06 | 15 to 30 years | |||||||||||||||||||||
| Culpeper, VA | (a) | 367 | 169 | — | — | 367 | 169 | 536 | (115 | ) | 1977 | 12/19/06 | 15 to 20 Years | ||||||||||||||||||||
| Dallas, TX | (a) | 1,053 | 412 | — | — | 1,053 | 412 | 1,465 | (255 | ) | 1976 | 07/01/05 | 15 to 20 Years | ||||||||||||||||||||
| Dallas, TX | (a) | 1,366 | 1,699 | 227 | — | 1,593 | 1,699 | 3,292 | (642 | ) | 1997 | 07/01/05 | 15 to 30 Years | ||||||||||||||||||||
| Dallas, TX | (a) | 2,965 | 9,066 | — | — | 2,965 | 9,066 | 12,031 | (1,001 | ) | 1998 | 07/17/13 | 11 to 35 Years | ||||||||||||||||||||
| Danville, VA | (a) | 957 | 2,813 | — | — | 957 | 2,813 | 3,770 | (300 | ) | 2009 | 08/21/13 | 15 to 40 Years | ||||||||||||||||||||
| Dawsonville, GA | (a) | 925 | 828 | (187 | ) | (216 | ) | 738 | 612 | 1,350 | — | 2005 | 07/17/13 | 7 to 27 Years | |||||||||||||||||||
| Dayton, OH | (a) | 1,026 | 907 | — | — | 1,026 | 907 | 1,933 | (430 | ) | 2002 | 12/31/07 | 15 to 40 Years | ||||||||||||||||||||
| Dayton, TN | (a) | 308 | 291 | — | 176 | 308 | 467 | 775 | (214 | ) | 1979 | 11/02/07 | 15 to 30 Years | ||||||||||||||||||||
| De Witt, IA | (a) | 248 | 333 | — | — | 248 | 333 | 581 | (238 | ) | 1984 | 09/23/05 | 15 to 20 Years | ||||||||||||||||||||
| Decatur, AL | (a) | 1,157 | 1,725 | — | — | 1,157 | 1,725 | 2,882 | (302 | ) | 2004 | 07/17/13 | 10 to 30 Years | ||||||||||||||||||||
| Decorah, IA | (a) | 207 | 91 | — | — | 207 | 91 | 298 | (112 | ) | 1985 | 09/23/05 | 10 to 15 Years | ||||||||||||||||||||
| DeKalb, IL | (a) | 1,423 | 1,552 | — | — | 1,423 | 1,552 | 2,975 | (708 | ) | 1996 | 12/29/06 | 15 to 30 Years | ||||||||||||||||||||
| Dickinson, ND | (a) | 616 | 1,301 | — | — | 616 | 1,301 | 1,917 | (419 | ) | 2003 | 12/29/06 | 15 to 40 Years | ||||||||||||||||||||
| Dodge City, KS | (a) | 249 | 587 | — | — | 249 | 587 | 836 | (63 | ) | 1985 | 06/04/14 | 15 to 30 Years | ||||||||||||||||||||
| Downey, CA | (a) | 2,329 | 2,526 | — | — | 2,329 | 2,526 | 4,855 | (186 | ) | 1993 | 12/19/14 | 15 to 40 Years | ||||||||||||||||||||
| Dubuque, IA | (a) | 479 | 298 | — | — | 479 | 298 | 777 | (367 | ) | 1970 | 09/23/05 | 10 to 15 Years | ||||||||||||||||||||
| Duluth, GA | (c) | 1,913 | 4,576 | — | — | 1,913 | 4,576 | 6,489 | — | 1984 | 12/22/16 | 13 to 40 Years | |||||||||||||||||||||
| Duluth, MN | (a) | 74 | 423 | — | — | 74 | 423 | 497 | (134 | ) | 1915 | 05/24/05 | 15 to 30 Years | ||||||||||||||||||||
| Durham, NC | (c) | 1,477 | 1,661 | — | — | 1,477 | 1,661 | 3,138 | (157 | ) | 1978 | 12/23/14 | 15 to 30 Years | ||||||||||||||||||||
| Dyersville, IA | (a) | 267 | 513 | — | — | 267 | 513 | 780 | (356 | ) | 1983 | 09/23/05 | 14 to 20 Years | ||||||||||||||||||||
| Eagen, MN | (a) | 724 | 1,230 | — | — | 724 | 1,230 | 1,954 | (135 | ) | 1996 | 05/22/14 | 15 to 30 Years | ||||||||||||||||||||
| Edinboro, PA | (a) | 384 | 350 | — | — | 384 | 350 | 734 | (202 | ) | 1973 | 02/06/07 | 15 to 30 Years | ||||||||||||||||||||
| Effingham, IL | (a) | 357 | 228 | — | — | 357 | 228 | 585 | (279 | ) | 1973 | 09/23/05 | 10 to 15 Years | ||||||||||||||||||||
| El Paso, TX | (c) | 1,725 | 1,470 | — | — | 1,725 | 1,470 | 3,195 | (120 | ) | 2014 | 04/15/15 | 15 to 30 Years | ||||||||||||||||||||
| Elizabethton, TN | (a) | 727 | 482 | — | — | 727 | 482 | 1,209 | (71 | ) | 2006 | 12/24/13 | 15 to 40 Years | ||||||||||||||||||||
| Elk Rapids, MI | (c) | 227 | 947 | — | — | 227 | 947 | 1,174 | (41 | ) | 1998 | 11/09/15 | 15 to 30 Years | ||||||||||||||||||||
| Emmitsburg, MD | (a) | 141 | 182 | — | — | 141 | 182 | 323 | (104 | ) | 1981 | 11/27/06 | 15 to 20 Years | ||||||||||||||||||||
| Emporia, KS | (a) | 657 | 219 | — | — | 657 | 219 | 876 | (31 | ) | 1997 | 06/04/14 | 15 to 30 Years | ||||||||||||||||||||
| Ephrata, PA | (a) | 685 | 231 | — | — | 685 | 231 | 916 | (190 | ) | 1978 | 01/30/06 | 15 to 20 Years | ||||||||||||||||||||
| Erie, PA | (a) | 575 | 740 | — | — | 575 | 740 | 1,315 | (316 | ) | 1974 | 02/06/07 | 15 to 30 Years | ||||||||||||||||||||
| Erie, PA | (a) | 463 | 565 | — | — | 463 | 565 | 1,028 | (259 | ) | 1973 | 02/06/07 | 15 to 30 Years | ||||||||||||||||||||
| Erie, PA | (a) | 855 | 147 | — | — | 855 | 147 | 1,002 | (138 | ) | 1973 | 02/06/07 | 15 to 30 Years | ||||||||||||||||||||
| Evansville, IN | (a) | 270 | 231 | — | — | 270 | 231 | 501 | (73 | ) | 2000 | 06/25/04 | 30 to 30 Years | ||||||||||||||||||||
| Fairborn, OH | (a) | 923 | 468 | — | — | 923 | 468 | 1,391 | (269 | ) | 1998 | 06/25/04 | 15 to 30 Years | ||||||||||||||||||||
| Fairview Heights, IL | (a) | 1,020 | 826 | — | — | 1,020 | 826 | 1,846 | (470 | ) | 1972 | 12/31/07 | 15 to 30 Years | ||||||||||||||||||||
| Findlay, OH | (c) | 958 | 1,029 | — | — | 958 | 1,029 | 1,987 | (103 | ) | 1991 | 12/23/14 | 15 to 30 Years | ||||||||||||||||||||
| Florence, AL | (a) | 794 | 1,742 | — | — | 794 | 1,742 | 2,536 | (292 | ) | 1995 | 07/17/13 | 8 to 27 Years | ||||||||||||||||||||
| Fort Smith, AR | (a) | 1,503 | 1,323 | — | — | 1,503 | 1,323 | 2,826 | (874 | ) | 1993 | 09/23/05 | 15 to 20 Years | ||||||||||||||||||||
| Fort Wayne, IN | (a) | 989 | 2,057 | — | — | 989 | 2,057 | 3,046 | (741 | ) | 2001 | 11/10/05 | 15 to 30 Years | ||||||||||||||||||||
| Initial Cost to Company | Cost Capitalized Subsequent to Acquisition including impairment | Gross Amount at December 31, | Life in which depreciation in latest Statement of Operations is computed | ||||||||||||||||||||||
| Description | Encumbrances | Land and Improvements | Buildings and Improvements | Improvements/ Land | Improvements/ building | Land and Improvements | Buildings and Improvements | Total | Final Accum | Date of Construction | Date Acquired | ||||||||||||||
| Cedar Hill, TX | (a) | 620 | 501 | — | — | 620 | 501 | 1,121 | (216 | ) | 2005 | 12/29/06 | 15 to 30 years | |||||||||||||||||||||
| Chanhassen, MN | (a) | 1,439 | 784 | — | — | 1,439 | 784 | 2,223 | (31 | ) | 1953 | 05/22/14 | 15 to 30 Years | |||||||||||||||||||||
| Charleston, IL | (a) | 272 | 220 | — | — | 272 | 220 | 492 | (183 | ) | 1986 | 09/23/05 | 10 to 15 years | |||||||||||||||||||||
| Charleston, SC | (a) | 860 | 1,018 | — | — | 860 | 1,018 | 1,878 | (141 | ) | 1988 | 07/17/13 | 8 to 15 Years | |||||||||||||||||||||
| Charleston, SC | (b) | 1,620 | 866 | — | — | 1,620 | 866 | 2,486 | — | 1984 | 12/23/14 | 15 to 30 Years | ||||||||||||||||||||||
| Chatsworth, GA | (a) | 213 | 558 | — | — | 213 | 558 | 771 | (182 | ) | 1979 | 11/02/07 | 15 to 30 years | |||||||||||||||||||||
| Chesapeake, VA | (a) | 1,046 | 334 | — | 75 | 1,046 | 409 | 1,455 | (284 | ) | 1995 | 06/25/04 | 10 to 25 years | |||||||||||||||||||||
| Cheyenne, WY | (a) | 277 | 2,041 | — | — | 277 | 2,041 | 2,318 | (799 | ) | 1928 | 12/29/06 | 15 to 20 years | |||||||||||||||||||||
| Chicago, IL | (a) | 1,675 | 1,112 | — | — | 1,675 | 1,112 | 2,787 | (370 | ) | 1999 | 12/29/06 | 15 to 30 years | |||||||||||||||||||||
| Cincinnati, OH | (a) | 1,614 | 4,134 | — | — | 1,614 | 4,134 | 5,748 | (126 | ) | 2012 | 01/15/14 | 9 to 40 Years | |||||||||||||||||||||
| Claremont, CA | (a) | 2,764 | 2,919 | — | — | 2,764 | 2,919 | 5,683 | — | 2011 | 12/19/14 | 15 to 40 Years | ||||||||||||||||||||||
| Clarion, PA | (a) | 426 | 653 | — | — | 426 | 653 | 1,079 | (240 | ) | 1976 | 02/06/07 | 15 to 30 years | |||||||||||||||||||||
| Clear Lake, IA | (a) | 294 | 292 | — | — | 294 | 292 | 586 | (136 | ) | 1980 | 05/24/05 | 15 to 20 years | |||||||||||||||||||||
| Clearwater, FL | (a) | 2,226 | 858 | — | — | 2,226 | 858 | 3,084 | (293 | ) | 2004 | 12/31/07 | 15 to 40 years | |||||||||||||||||||||
| Cleveland, OH | (a) | 875 | 138 | — | — | 875 | 138 | 1,013 | (9 | ) | 1995 | 12/24/13 | 15 to 30 Years | |||||||||||||||||||||
| Clinton Township, MI | (b) | 1,377 | 911 | — | — | 1,377 | 911 | 2,288 | (8 | ) | 2003 | 11/05/14 | 14 to 30 Years | |||||||||||||||||||||
| Clinton, MD | (a) | 300 | 193 | — | 200 | 300 | 393 | 693 | (121 | ) | 1980 | 11/27/06 | 15 to 20 years | |||||||||||||||||||||
| Clinton, TN | (a) | 417 | 293 | — | — | 417 | 293 | 710 | (134 | ) | 1994 | 11/02/07 | 15 to 30 years | |||||||||||||||||||||
| Clovis, NM | (c ) | 861 | 2,172 | — | — | 861 | 2,172 | 3,033 | (111 | ) | 2005 | 07/17/13 | 13 to 40 Years | |||||||||||||||||||||
| Colby, KS | (a) | 269 | 567 | — | — | 269 | 567 | 836 | (16 | ) | 1989 | 06/04/14 | 15 to 30 Years | |||||||||||||||||||||
| Colonial Heights, VA | (a) | 1,948 | — | 37 | 1,963 | 1,985 | 1,963 | 3,948 | (26 | ) | 1989 | 10/25/13 | 0 to 0 Years | |||||||||||||||||||||
| Colonie, NY | (a) | 1,321 | 991 | (350 | ) | (261 | ) | 971 | 730 | 1,701 | (320 | ) | 1994 | 12/31/07 | 15 to 40 years | |||||||||||||||||||
| Colorado Springs, CO | (c ) | 937 | 1,120 | — | — | 937 | 1,120 | 2,057 | (89 | ) | 1998 | 07/17/13 | 8 to 25 Years | |||||||||||||||||||||
| Colorado Springs, CO | (b) | 1,335 | 1,233 | — | — | 1,335 | 1,233 | 2,568 | — | 1982 | 12/23/14 | 15 to 30 Years | ||||||||||||||||||||||
| Colorado Springs, CO | (a) | 674 | 519 | — | — | 674 | 519 | 1,193 | (60 | ) | 1989 | 11/19/12 | 6 to 30 years | |||||||||||||||||||||
| Columbia Heights, MN | (a) | 289 | 131 | — | — | 289 | 131 | 420 | (67 | ) | 1977 | 05/24/05 | 15 to 20 years | |||||||||||||||||||||
| Columbus, GA | (c ) | 1,199 | 1,911 | — | — | 1,199 | 1,911 | 3,110 | (95 | ) | 2006 | 07/17/13 | 13 to 40 Years | |||||||||||||||||||||
| Columbus, GA | (c ) | 2,102 | 1,717 | — | — | 2,102 | 1,717 | 3,819 | (78 | ) | 2005 | 07/17/13 | 13 to 40 Years | |||||||||||||||||||||
| Columbus, GA | (b) | 876 | 1,243 | — | — | 876 | 1,243 | 2,119 | — | 2003 | 12/23/14 | 15 to 30 Years | ||||||||||||||||||||||
| Columbus, OH | (b) | 1,528 | 1,742 | — | — | 1,528 | 1,742 | 3,270 | — | 2003 | 12/23/14 | 15 to 30 Years | ||||||||||||||||||||||
| Conroe, TX | (a) | 942 | 3,274 | — | — | 942 | 3,274 | 4,216 | (186 | ) | 1993 | 07/17/13 | 11 to 32 Years | |||||||||||||||||||||
| Corry, PA | (a) | 411 | 279 | — | — | 411 | 279 | 690 | (144 | ) | 1977 | 02/06/07 | 15 to 30 years | |||||||||||||||||||||
| Corydon, IN | (a) | 890 | 1,220 | — | — | 890 | 1,220 | 2,110 | (116 | ) | 1999 | 07/17/13 | 7 to 21 Years | |||||||||||||||||||||
| Council Bluffs, IA | (b) | 1,070 | 703 | — | — | 1,070 | 703 | 1,773 | — | 1995 | 12/23/14 | 15 to 30 Years | ||||||||||||||||||||||
| Creston, IA | (a) | 103 | 180 | — | — | 103 | 180 | 283 | (158 | ) | 1974 | 12/15/05 | 10 to 15 years | |||||||||||||||||||||
| Fountain Hills, AZ | (a) | 825 | 561 | — | — | 825 | 561 | 1,386 | (326 | ) | 1995 | 09/24/04 | 15 to 30 Years | ||||||||||||||||||||
| Fountain, CO | (c) | 861 | 2,226 | — | — | 861 | 2,226 | 3,087 | (248 | ) | 2005 | 07/17/13 | 12 to 38 Years | ||||||||||||||||||||
| Frederick, MD | (a) | 440 | 236 | — | 5 | 440 | 241 | 681 | (138 | ) | 1977 | 11/27/06 | 11 to 20 Years | ||||||||||||||||||||
| Fredericksburg, TX | (c) | 511 | 1,516 | — | — | 511 | 1,516 | 2,027 | (224 | ) | 1985 | 07/17/13 | 11 to 30 Years | ||||||||||||||||||||
| Ft Wayne, IN | (a) | 1,110 | 817 | — | — | 1,110 | 817 | 1,927 | (432 | ) | 2003 | 12/31/07 | 15 to 40 Years | ||||||||||||||||||||
| Gadsden, AL | (a) | 626 | 1,439 | (229 | ) | (506 | ) | 397 | 933 | 1,330 | (295 | ) | 2007 | 12/21/07 | 10 to 50 Years | ||||||||||||||||||
| Gainesville, FL | (c) | 1,489 | 1,241 | — | — | 1,489 | 1,241 | 2,730 | — | 2000 | 12/28/16 | 6 to 40 Years | |||||||||||||||||||||
| Gainesville, FL | (c) | 1,534 | 883 | — | — | 1,534 | 883 | 2,417 | — | 1984 | 12/28/16 | 6 to 30 Years | |||||||||||||||||||||
| Gallipolis, OH | (a) | 375 | 1,295 | — | — | 375 | 1,295 | 1,670 | (177 | ) | 1996 | 10/25/13 | 15 to 30 Years | ||||||||||||||||||||
| Gallup, NM | (c) | 937 | 2,277 | — | — | 937 | 2,277 | 3,214 | (268 | ) | 2004 | 07/17/13 | 13 to 40 Years | ||||||||||||||||||||
| Garden City, GA | (c) | 1,184 | 1,465 | — | — | 1,184 | 1,465 | 2,649 | (184 | ) | 1998 | 07/17/13 | 9 to 40 Years | ||||||||||||||||||||
| Garden City, KS | (a) | 246 | 924 | — | — | 246 | 924 | 1,170 | (110 | ) | 1984 | 12/24/13 | 15 to 30 Years | ||||||||||||||||||||
| Gardendale, AL | (a) | 438 | 841 | — | 57 | 438 | 898 | 1,336 | (152 | ) | 1996 | 03/29/13 | 8 to 29 Years | ||||||||||||||||||||
| Gaylord, MI | (a) | 1,003 | 1,477 | — | — | 1,003 | 1,477 | 2,480 | (185 | ) | 2014 | 11/05/14 | 14 to 30 Years | ||||||||||||||||||||
| Geneva, AL | (a) | 522 | 570 | — | — | 522 | 570 | 1,092 | (622 | ) | 1990 | 06/25/04 | 10 to 15 Years | ||||||||||||||||||||
| Geneva, NY | (a) | 177 | 139 | — | — | 177 | 139 | 316 | (164 | ) | 1975 | 08/27/09 | 8 to 13 Years | ||||||||||||||||||||
| Gilbert, AZ | (a) | 643 | 1,669 | — | — | 643 | 1,669 | 2,312 | (304 | ) | 2006 | 10/28/11 | 14 to 39 Years | ||||||||||||||||||||
| Glendale, AZ | (a) | 1,480 | 1,329 | — | — | 1,480 | 1,329 | 2,809 | (529 | ) | 1996 | 06/25/04 | 15 to 30 Years | ||||||||||||||||||||
| Glendale, AZ | (a) | 1,236 | 272 | — | — | 1,236 | 272 | 1,508 | (244 | ) | 1995 | 06/25/04 | 15 to 20 Years | ||||||||||||||||||||
| Golden, CO | (a) | 649 | 334 | — | — | 649 | 334 | 983 | (53 | ) | 1997 | 12/24/13 | 15 to 30 Years | ||||||||||||||||||||
| Grand Junction, CO | (c) | 1,363 | 1,990 | — | — | 1,363 | 1,990 | 3,353 | (241 | ) | 1995 | 07/17/13 | 10 to 40 Years | ||||||||||||||||||||
| Grand Rapids, MI | (a) | 986 | 524 | — | — | 986 | 524 | 1,510 | (74 | ) | 1985 | 10/31/14 | 14 to 30 Years | ||||||||||||||||||||
| Grandview, OH | (a) | 2,164 | 1,165 | — | — | 2,164 | 1,165 | 3,329 | (307 | ) | 1960 | 07/17/13 | 9 to 23 Years | ||||||||||||||||||||
| Greensboro, NC | (a) | 1,009 | 444 | — | — | 1,009 | 444 | 1,453 | (304 | ) | 2003 | 12/31/07 | 15 to 40 Years | ||||||||||||||||||||
| Grove City, PA | (a) | 531 | 495 | — | — | 531 | 495 | 1,026 | (246 | ) | 1976 | 02/06/07 | 15 to 30 Years | ||||||||||||||||||||
| Gurnee, IL | (a) | 586 | 619 | — | — | 586 | 619 | 1,205 | (383 | ) | 1995 | 06/25/04 | 15 to 20 Years | ||||||||||||||||||||
| Hagerstown, MD | (a) | 546 | 342 | — | 68 | 546 | 410 | 956 | (218 | ) | 1975 | 11/27/06 | 11 to 20 Years | ||||||||||||||||||||
| Hamilton, NY | (a) | 145 | 152 | — | — | 145 | 152 | 297 | (115 | ) | 1982 | 06/30/09 | 13 to 18 Years | ||||||||||||||||||||
| Hammond, IN | (a) | 976 | 1,080 | — | — | 976 | 1,080 | 2,056 | (149 | ) | 2014 | 12/24/14 | 14 to 30 Years | ||||||||||||||||||||
| Harriman, TN | (a) | 314 | 143 | — | 176 | 314 | 319 | 633 | (170 | ) | 1979 | 11/02/07 | 15 to 30 Years | ||||||||||||||||||||
| Harrisburg, PA | (a) | 762 | 241 | — | 176 | 762 | 417 | 1,179 | (294 | ) | 1977 | 01/30/06 | 15 to 20 Years | ||||||||||||||||||||
| Harrisburg, PA | (a) | 611 | 239 | — | — | 611 | 239 | 850 | (256 | ) | 1978 | 01/30/06 | 15 to 20 Years | ||||||||||||||||||||
| Harrisburg, PA | (a) | 423 | 307 | — | — | 423 | 307 | 730 | (171 | ) | 1973 | 01/30/06 | 15 to 20 Years | ||||||||||||||||||||
| Hermitage, PA | (c) | 604 | 717 | — | — | 604 | 717 | 1,321 | (334 | ) | 1978 | 02/06/07 | 10 to 25 Years | ||||||||||||||||||||
| Hilliard, OH | (a) | 1,149 | 1,291 | — | — | 1,149 | 1,291 | 2,440 | (604 | ) | 1997 | 09/24/04 | 15 to 30 Years | ||||||||||||||||||||
| Hiram, GA | (a) | 813 | 716 | — | — | 813 | 716 | 1,529 | (194 | ) | 1999 | 07/17/13 | 6 to 21 Years | ||||||||||||||||||||
| Hiram, GA | (a) | 1,255 | 1,766 | — | — | 1,255 | 1,766 | 3,021 | (376 | ) | 2003 | 01/16/15 | 9 to 15 Years | ||||||||||||||||||||
| Initial Cost to Company | Cost Capitalized Subsequent to Acquisition including impairment | Gross Amount at December 31, | Life in which depreciation in latest Statement of Operations is computed | ||||||||||||||||||||||
| Description | Encumbrances | Land and Improvements | Buildings and Improvements | Improvements/ Land | Improvements/ building | Land and Improvements | Buildings and Improvements | Total | Final Accum | Date of Construction | Date Acquired | ||||||||||||||
| Crossville, TN | (a) | 220 | 288 | — | 176 | 220 | 464 | 684 | (155 | ) | 1978 | 11/02/07 | 15 to 30 years | |||||||||||||||||||||
| Culpeper, VA | (a) | 367 | 169 | — | — | 367 | 169 | 536 | (91 | ) | 1977 | 12/19/06 | 15 to 20 years | |||||||||||||||||||||
| Dallas, TX | (a) | 2,965 | 9,066 | — | — | 2,965 | 9,066 | 12,031 | (415 | ) | 1998 | 07/17/13 | 11 to 35 Years | |||||||||||||||||||||
| Dallas, TX | (b) | 1,447 | 1,090 | — | — | 1,447 | 1,090 | 2,537 | — | 1995 | 12/23/14 | 15 to 30 Years | ||||||||||||||||||||||
| Dallas, TX | (a) | 1,053 | 412 | — | — | 1,053 | 412 | 1,465 | (201 | ) | 1976 | 09/30/04 | 15 to 20 years | |||||||||||||||||||||
| Dallas, TX | (a) | 1,366 | 1,699 | — | — | 1,366 | 1,699 | 3,065 | (506 | ) | 1997 | 09/30/04 | 15 to 30 years | |||||||||||||||||||||
| Danville, VA | (b) | 469 | 1,263 | — | — | 469 | 1,263 | 1,732 | — | 1995 | 12/23/14 | 15 to 40 Years | ||||||||||||||||||||||
| Danville, VA | (a) | 957 | 2,813 | — | — | 957 | 2,813 | 3,770 | (120 | ) | 2009 | 08/21/13 | 15 to 40 Years | |||||||||||||||||||||
| Dawsonville, GA | (a) | 925 | 828 | — | — | 925 | 828 | 1,753 | (67 | ) | 2005 | 07/17/13 | 7 to 27 Years | |||||||||||||||||||||
| Dayton, OH | (a) | 1,026 | 907 | — | — | 1,026 | 907 | 1,933 | (335 | ) | 2002 | 12/31/07 | 15 to 40 years | |||||||||||||||||||||
| Dayton, TN | (a) | 308 | 291 | — | 176 | 308 | 467 | 775 | (154 | ) | 1979 | 11/02/07 | 15 to 30 years | |||||||||||||||||||||
| De Witt, IA | (a) | 248 | 333 | — | — | 248 | 333 | 581 | (188 | ) | 1984 | 09/23/05 | 15 to 20 years | |||||||||||||||||||||
| Decatur, AL | (a) | 1,157 | 1,725 | — | — | 1,157 | 1,725 | 2,882 | (125 | ) | 2004 | 07/17/13 | 10 to 30 Years | |||||||||||||||||||||
| Decorah, IA | (a) | 207 | 91 | — | — | 207 | 91 | 298 | (88 | ) | 1985 | 09/23/05 | 10 to 15 years | |||||||||||||||||||||
| DeKalb, IL | (a) | 1,423 | 1,552 | — | — | 1,423 | 1,552 | 2,975 | (558 | ) | 1996 | 12/29/06 | 15 to 30 years | |||||||||||||||||||||
| Des Moines, IA | (a) | 137 | 196 | — | — | 137 | 196 | 333 | (103 | ) | 1966 | 09/23/05 | 15 to 20 years | |||||||||||||||||||||
| Dickinson, ND | (a) | 616 | 1,301 | — | — | 616 | 1,301 | 1,917 | (330 | ) | 2003 | 12/29/06 | 15 to 40 years | |||||||||||||||||||||
| Dodge City, KS | (a) | 249 | 587 | — | — | 249 | 587 | 836 | (14 | ) | 1985 | 06/04/14 | 15 to 30 Years | |||||||||||||||||||||
| Dothan, AL | (a) | 924 | 1,235 | — | — | 924 | 1,235 | 2,159 | (112 | ) | 1998 | 07/17/13 | 9 to 24 Years | |||||||||||||||||||||
| Douglassville, GA | (a) | 712 | 669 | — | — | 712 | 669 | 1,381 | (196 | ) | 2003 | 02/28/06 | 15 to 40 years | |||||||||||||||||||||
| Douglassville, GA | (a) | 764 | 941 | — | — | 764 | 941 | 1,705 | (305 | ) | 1990 | 02/28/06 | 15 to 30 years | |||||||||||||||||||||
| Douglasville, GA | (a) | 127 | — | — | — | 127 | — | 127 | — | (g) | 11/14/14 | 0 to 0 Years | ||||||||||||||||||||||
| Downey, CA | (a) | 2,329 | 2,526 | — | — | 2,329 | 2,526 | 4,855 | — | 1993 | 12/19/14 | 15 to 40 Years | ||||||||||||||||||||||
| Dubuque, IA | (a) | 479 | 298 | — | — | 479 | 298 | 777 | (289 | ) | 1970 | 09/23/05 | 10 to 15 years | |||||||||||||||||||||
| Duluth, MN | (a) | 74 | 423 | — | — | 74 | 423 | 497 | (106 | ) | 1915 | 05/24/05 | 15 to 30 years | |||||||||||||||||||||
| Durham, NC | (b) | 1,477 | 1,661 | — | — | 1,477 | 1,661 | 3,138 | — | 1978 | 12/23/14 | 15 to 30 Years | ||||||||||||||||||||||
| Dyersville, IA | (a) | 267 | 513 | — | — | 267 | 513 | 780 | (281 | ) | 1983 | 09/23/05 | 14 to 20 years | |||||||||||||||||||||
| Eagen, MN | (a) | 724 | 1,230 | — | — | 724 | 1,230 | 1,954 | (30 | ) | 1996 | 05/22/14 | 15 to 30 Years | |||||||||||||||||||||
| Eagle Pass, TX | (a) | 976 | 2,385 | — | — | 976 | 2,385 | 3,361 | (588 | ) | 2001 | 04/01/05 | 15 to 40 years | |||||||||||||||||||||
| Edinboro, PA | (a) | 384 | 350 | — | — | 384 | 350 | 734 | (159 | ) | 1973 | 02/06/07 | 15 to 30 years | |||||||||||||||||||||
| Edinburg, TX | (a) | 1,091 | 2,217 | — | — | 1,091 | 2,217 | 3,308 | (556 | ) | 2000 | 04/01/05 | 15 to 40 years | |||||||||||||||||||||
| Effingham, IL | (a) | 357 | 228 | — | — | 357 | 228 | 585 | (220 | ) | 1973 | 09/23/05 | 10 to 15 years | |||||||||||||||||||||
| El Paso, TX | (a) | 609 | 1,810 | — | — | 609 | 1,810 | 2,419 | (446 | ) | 1999 | 04/29/05 | 15 to 40 years | |||||||||||||||||||||
| Elizabethton, TN | (a) | 727 | 482 | — | — | 727 | 482 | 1,209 | (24 | ) | 2006 | 12/24/13 | 15 to 40 Years | |||||||||||||||||||||
| Elk River, MN | (a) | 314 | 255 | — | — | 314 | 255 | 569 | (96 | ) | 1988 | 05/24/05 | 15 to 30 years | |||||||||||||||||||||
| Emmitsburg, MD | (a) | 141 | 182 | — | — | 141 | 182 | 323 | (82 | ) | 1981 | 11/27/06 | 15 to 20 years | |||||||||||||||||||||
| Emporia, KS | (a) | 657 | 219 | — | — | 657 | 219 | 876 | (7 | ) | 1997 | 06/04/14 | 15 to 30 Years | |||||||||||||||||||||
| Ephrata, PA | (a) | 685 | 231 | — | — | 685 | 231 | 916 | (149 | ) | 1978 | 01/30/06 | 15 to 20 years | |||||||||||||||||||||
| Homewood, AL | (a) | 583 | 839 | — | — | 583 | 839 | 1,422 | (119 | ) | 2002 | 12/05/13 | 15 to 30 Years | ||||||||||||||||||||
| Houston, TX | (a) | 1,098 | 439 | — | — | 1,098 | 439 | 1,537 | (345 | ) | 1995 | 06/25/04 | 15 to 40 Years | ||||||||||||||||||||
| Houston, TX | (a) | 1,156 | 352 | (22 | ) | — | 1,134 | 352 | 1,486 | (286 | ) | 1995 | 06/25/04 | 15 to 30 Years | |||||||||||||||||||
| Houston, TX | (a) | 585 | 561 | — | — | 585 | 561 | 1,146 | (589 | ) | 1979 | 12/30/04 | 10 to 15 Years | ||||||||||||||||||||
| Houston, TX | (a) | 2,348 | 1,347 | — | — | 2,348 | 1,347 | 3,695 | (689 | ) | 1997 | 06/29/07 | 15 to 30 Years | ||||||||||||||||||||
| Huntington Park, CA | (a) | 1,822 | 1,211 | — | — | 1,822 | 1,211 | 3,033 | (119 | ) | 1957 | 12/19/14 | 15 to 30 Years | ||||||||||||||||||||
| Hutchinson, KS | (a) | 895 | 856 | — | — | 895 | 856 | 1,751 | (108 | ) | 1987 | 06/04/14 | 15 to 30 Years | ||||||||||||||||||||
| Hyattsville, MD | (a) | 702 | 245 | — | — | 702 | 245 | 947 | (166 | ) | 1985 | 11/27/06 | 15 to 20 Years | ||||||||||||||||||||
| Independence, IA | (a) | 223 | 473 | — | — | 223 | 473 | 696 | (518 | ) | 1976 | 09/23/05 | 10 to 15 Years | ||||||||||||||||||||
| Independence, MO | (a) | 1,450 | 1,967 | — | — | 1,450 | 1,967 | 3,417 | (670 | ) | 2002 | 06/29/07 | 15 to 40 Years | ||||||||||||||||||||
| Indiana, PA | (a) | 331 | 323 | — | — | 331 | 323 | 654 | (180 | ) | 1982 | 02/06/07 | 15 to 30 Years | ||||||||||||||||||||
| Indianapolis, IN | (a) | 1,971 | 2,295 | — | — | 1,971 | 2,295 | 4,266 | (645 | ) | 2003 | 11/10/05 | 15 to 40 Years | ||||||||||||||||||||
| Indianapolis, IN | (a) | 590 | 633 | — | — | 590 | 633 | 1,223 | (85 | ) | 2014 | 10/31/14 | 14 to 30 Years | ||||||||||||||||||||
| Indianapolis, IN | (c) | 703 | 1,223 | — | — | 703 | 1,223 | 1,926 | (118 | ) | 1974 | 12/23/14 | 15 to 30 Years | ||||||||||||||||||||
| Indianapolis, IN | (c) | 418 | 1,223 | — | — | 418 | 1,223 | 1,641 | (88 | ) | 1992 | 12/23/14 | 15 to 30 Years | ||||||||||||||||||||
| Jackson, MI | (a) | 599 | 354 | — | — | 599 | 354 | 953 | (59 | ) | 1997 | 12/24/13 | 15 to 30 Years | ||||||||||||||||||||
| Johnson City, TN | (c) | 1,331 | 2,304 | — | — | 1,331 | 2,304 | 3,635 | (380 | ) | 1996 | 07/17/13 | 12 to 30 Years | ||||||||||||||||||||
| Johnstown, PA | (a) | 865 | 938 | — | — | 865 | 938 | 1,803 | (324 | ) | 1998 | 07/17/13 | 8 to 20 Years | ||||||||||||||||||||
| Joliet, IL | (a) | 1,994 | 1,207 | — | — | 1,994 | 1,207 | 3,201 | (628 | ) | 1996 | 12/29/06 | 15 to 30 Years | ||||||||||||||||||||
| Kansas City, KS | (a) | 796 | 609 | — | — | 796 | 609 | 1,405 | (81 | ) | 2006 | 12/24/13 | 15 to 40 Years | ||||||||||||||||||||
| Kimball, TN | (a) | 367 | 283 | — | 176 | 367 | 459 | 826 | (217 | ) | 1987 | 11/02/07 | 15 to 30 Years | ||||||||||||||||||||
| Kingwood, TX | (a) | 936 | 387 | — | — | 936 | 387 | 1,323 | (300 | ) | 1994 | 06/25/04 | 15 to 30 Years | ||||||||||||||||||||
| Knoxville, TN | (a) | 296 | 343 | — | 176 | 296 | 519 | 815 | (223 | ) | 1978 | 11/02/07 | 15 to 30 Years | ||||||||||||||||||||
| Knoxville, TN | (a) | 172 | 700 | — | — | 172 | 700 | 872 | (251 | ) | 1991 | 11/02/07 | 15 to 30 Years | ||||||||||||||||||||
| LaFayette, GA | (a) | 246 | 434 | — | 176 | 246 | 610 | 856 | (257 | ) | 1991 | 11/02/07 | 15 to 30 Years | ||||||||||||||||||||
| Lake Charles, LA | (a) | 1,620 | 1,349 | — | — | 1,620 | 1,349 | 2,969 | (301 | ) | 1987 | 07/17/13 | 10 to 24 Years | ||||||||||||||||||||
| Lakeville, MN | (a) | 342 | 439 | — | — | 342 | 439 | 781 | (175 | ) | 1988 | 05/24/05 | 15 to 30 Years | ||||||||||||||||||||
| Lancaster, PA | (a) | 308 | 161 | — | — | 308 | 161 | 469 | (115 | ) | 1977 | 07/25/06 | 15 to 30 Years | ||||||||||||||||||||
| Lander, WY | (a) | 57 | 1,010 | — | — | 57 | 1,010 | 1,067 | (510 | ) | 1883 | 12/29/06 | 15 to 20 Years | ||||||||||||||||||||
| Lanham, MD | (a) | 302 | 193 | — | 200 | 302 | 393 | 695 | (182 | ) | 1980 | 11/27/06 | 13 to 20 Years | ||||||||||||||||||||
| Lawrence, KS | (a) | 478 | 209 | — | — | 478 | 209 | 687 | (23 | ) | 1974 | 06/04/14 | 15 to 30 Years | ||||||||||||||||||||
| Lebanon, PA | (a) | 616 | 316 | — | 176 | 616 | 492 | 1,108 | (305 | ) | 1980 | 01/30/06 | 15 to 20 Years | ||||||||||||||||||||
| Leeds, AL | (a) | 907 | 926 | — | 31 | 907 | 957 | 1,864 | (717 | ) | 2003 | 09/26/06 | 9 to 40 Years | ||||||||||||||||||||
| Lewis Center, OH | (a) | 626 | 560 | — | — | 626 | 560 | 1,186 | (274 | ) | 1998 | 06/25/04 | 15 to 30 Years | ||||||||||||||||||||
| Lewiston, ID | (c) | 1,080 | 866 | — | — | 1,080 | 866 | 1,946 | (97 | ) | 1996 | 12/23/14 | 15 to 30 Years | ||||||||||||||||||||
| Lexington, KY | (a) | 1,267 | 944 | — | — | 1,267 | 944 | 2,211 | (593 | ) | 1996 | 02/26/07 | 14 to 30 Years | ||||||||||||||||||||
| Initial Cost to Company | Cost Capitalized Subsequent to Acquisition including impairment | Gross Amount at December 31, | Life in which depreciation in latest Statement of Operations is computed | ||||||||||||||||||||||
| Description | Encumbrances | Land and Improvements | Buildings and Improvements | Improvements/ Land | Improvements/ building | Land and Improvements | Buildings and Improvements | Total | Final Accum | Date of Construction | Date Acquired | ||||||||||||||
| Erie, PA | (a) | 575 | 740 | — | — | 575 | 740 | 1,315 | (249 | ) | 1974 | 02/06/07 | 15 to 30 years | |||||||||||||||||||||
| Erie, PA | (a) | 463 | 565 | — | — | 463 | 565 | 1,028 | (204 | ) | 1973 | 02/06/07 | 15 to 30 years | |||||||||||||||||||||
| Erie, PA | (a) | 855 | 147 | — | — | 855 | 147 | 1,002 | (109 | ) | 1973 | 02/06/07 | 15 to 30 years | |||||||||||||||||||||
| Evansville, IN | (a) | 270 | 231 | — | — | 270 | 231 | 501 | (57 | ) | 1999 | 06/25/04 | 30 to 30 years | |||||||||||||||||||||
| Fairborn, OH | (a) | 923 | 468 | — | — | 923 | 468 | 1,391 | (212 | ) | 1998 | 06/25/04 | 15 to 30 years | |||||||||||||||||||||
| Fairfax, VA | 1,117 | 1,644 | 1,308 | — | — | 1,644 | 1,308 | 2,952 | (100 | ) | 1998 | 07/17/13 | 12 to 30 Years | |||||||||||||||||||||
| Fairview Heights, IL | (a) | 1,020 | 826 | — | — | 1,020 | 826 | 1,846 | (366 | ) | 1972 | 12/31/07 | 15 to 30 years | |||||||||||||||||||||
| Findlay, OH | (b) | 958 | 1,029 | — | — | 958 | 1,029 | 1,987 | — | 1991 | 12/23/14 | 15 to 30 Years | ||||||||||||||||||||||
| Florence, AL | (a) | 794 | 1,742 | — | — | 794 | 1,742 | 2,536 | (121 | ) | 1994 | 07/17/13 | 8 to 27 Years | |||||||||||||||||||||
| Floyd, GA | (a) | 973 | 415 | — | — | 973 | 415 | 1,388 | (141 | ) | 1993 | 02/28/06 | 15 to 30 years | |||||||||||||||||||||
| Forest City, IA | (a) | 251 | 244 | — | — | 251 | 244 | 495 | (160 | ) | 1985 | 05/24/05 | 15 to 20 years | |||||||||||||||||||||
| Fort Smith, AR | (a) | 1,503 | 1,323 | — | — | 1,503 | 1,323 | 2,826 | (688 | ) | 1993 | 09/23/05 | 15 to 20 years | |||||||||||||||||||||
| Fort Walton Beach, FL | (b) | 1,375 | 1,365 | — | — | 1,375 | 1,365 | 2,740 | — | 1989 | 12/23/14 | 15 to 30 Years | ||||||||||||||||||||||
| Fort Wayne, IN | (a) | 989 | 2,057 | — | — | 989 | 2,057 | 3,046 | (584 | ) | 2001 | 11/10/05 | 15 to 30 years | |||||||||||||||||||||
| Fountain Hills, AZ | (a) | 825 | 561 | — | — | 825 | 561 | 1,386 | (256 | ) | 1995 | 09/24/04 | 15 to 30 years | |||||||||||||||||||||
| Fountain, CO | (c ) | 861 | 2,226 | — | — | 861 | 2,226 | 3,087 | (103 | ) | 2005 | 07/17/13 | 12 to 38 Years | |||||||||||||||||||||
| Frederick, MD | (a) | 440 | 236 | — | 5 | 440 | 241 | 681 | (108 | ) | 1977 | 11/27/06 | 15 to 20 years | |||||||||||||||||||||
| Fredericksburg, TX | 1,504 | 511 | 1,516 | — | — | 511 | 1,516 | 2,027 | (93 | ) | 1985 | 07/17/13 | 11 to 30 Years | |||||||||||||||||||||
| Fredonia, NY | (a) | 262 | 312 | — | — | 262 | 312 | 574 | (311 | ) | 1973 | 12/29/06 | 10 to 15 years | |||||||||||||||||||||
| Ft Wayne, IN | (a) | 1,110 | 817 | — | — | 1,110 | 817 | 1,927 | (336 | ) | 2003 | 12/31/07 | 15 to 40 years | |||||||||||||||||||||
| Ft. Myers, FL | (b) | 2,417 | 707 | (43 | ) | (12 | ) | 2,374 | 695 | 3,069 | (292 | ) | 1994 | 12/31/07 | 15 to 40 years | |||||||||||||||||||
| Gadsden, AL | (a) | 626 | 1,439 | (229 | ) | (506 | ) | 397 | 933 | 1,330 | (236 | ) | 2007 | 12/21/07 | 10 to 50 years | |||||||||||||||||||
| Gallpolis, OH | (a) | 375 | 1,295 | — | — | 375 | 1,295 | 1,670 | (65 | ) | 1997 | 10/25/13 | 15 to 30 Years | |||||||||||||||||||||
| Gallup, NM | (c ) | 937 | 2,277 | — | — | 937 | 2,277 | 3,214 | (111 | ) | 2004 | 07/17/13 | 13 to 40 Years | |||||||||||||||||||||
| Garden City, GA | (c ) | 1,184 | 1,465 | — | — | 1,184 | 1,465 | 2,649 | (76 | ) | 1998 | 07/17/13 | 9 to 40 Years | |||||||||||||||||||||
| Garden City, KS | (a) | 246 | 924 | — | — | 246 | 924 | 1,170 | (37 | ) | 1984 | 12/24/13 | 15 to 30 Years | |||||||||||||||||||||
| Gardendale, AL | (a) | 438 | 841 | — | 57 | 438 | 898 | 1,336 | (71 | ) | 1996 | 03/29/13 | 8 to 29 Years | |||||||||||||||||||||
| Gaylord, MI | (b) | 1,003 | 1,478 | — | — | 1,003 | 1,478 | 2,481 | (14 | ) | 2014 | 11/05/14 | 14 to 30 Years | |||||||||||||||||||||
| Geneva, AL | (a) | 522 | 570 | — | — | 522 | 570 | 1,092 | (490 | ) | 1990 | 06/25/04 | 10 to 15 years | |||||||||||||||||||||
| Geneva, NY | (a) | 177 | 139 | — | — | 177 | 139 | 316 | (128 | ) | 1975 | 12/21/07 | 8 to 13 years | |||||||||||||||||||||
| Gilbert, AZ | (a) | 643 | 1,669 | — | — | 643 | 1,669 | 2,312 | (186 | ) | 2006 | 10/28/11 | 14 to 39 years | |||||||||||||||||||||
| Glendale, AZ | (a) | 1,480 | 1,329 | — | — | 1,480 | 1,329 | 2,809 | (417 | ) | 1996 | 06/25/04 | 15 to 30 years | |||||||||||||||||||||
| Glendale, AZ | (a) | 1,236 | 272 | — | — | 1,236 | 272 | 1,508 | (192 | ) | 1995 | 06/25/04 | 15 to 20 years | |||||||||||||||||||||
| Golden, CO | (a) | 649 | 334 | — | — | 649 | 334 | 983 | (18 | ) | 1997 | 12/24/13 | 15 to 30 Years | |||||||||||||||||||||
| Grand Junction, CO | (c ) | 1,363 | 1,990 | — | — | 1,363 | 1,990 | 3,353 | (100 | ) | 1995 | 07/17/13 | 10 to 40 Years | |||||||||||||||||||||
| Grand Rapids, MI | (b) | 986 | 524 | — | — | 986 | 524 | 1,510 | (6 | ) | 1985 | 10/31/14 | 14 to 30 Years | |||||||||||||||||||||
| Grandview, OH | (a) | 2,164 | 1,165 | — | — | 2,164 | 1,165 | 3,329 | (127 | ) | 1998 | 07/17/13 | 9 to 23 Years | |||||||||||||||||||||
| Lexington, NC | (a) | 910 | 1,059 | — | — | 910 | 1,059 | 1,969 | (170 | ) | 1998 | 10/25/13 | 15 to 30 Years | ||||||||||||||||||||
| Little Rock, AR | (a) | 699 | 1,700 | (344 | ) | (592 | ) | 355 | 1,108 | 1,463 | (887 | ) | 1972 | 02/26/07 | 14 to 20 Years | ||||||||||||||||||
| Little Rock, AR | (a) | 886 | — | — | — | 886 | — | 886 | — | (f) | 06/26/14 | (f) | |||||||||||||||||||||
| Littleton, CO | (c) | 696 | 1,943 | — | — | 696 | 1,943 | 2,639 | (218 | ) | 1990 | 07/17/13 | 11 to 40 Years | ||||||||||||||||||||
| Littleton, CO | (a) | 501 | 629 | — | — | 501 | 629 | 1,130 | (83 | ) | 1992 | 12/24/13 | 15 to 30 Years | ||||||||||||||||||||
| Longview, WA | (c) | 870 | 2,855 | — | — | 870 | 2,855 | 3,725 | (305 | ) | 2004 | 07/17/13 | 13 to 40 Years | ||||||||||||||||||||
| Loveland, CO | (c) | 602 | 1,913 | — | — | 602 | 1,913 | 2,515 | (197 | ) | 1997 | 07/17/13 | 12 to 40 Years | ||||||||||||||||||||
| Lufkin, TX | (a) | 927 | 790 | (448 | ) | (474 | ) | 479 | 316 | 795 | — | 1970 | 02/26/07 | 14 to 20 Years | |||||||||||||||||||
| Lynchburg, VA | (a) | 2,033 | 2,013 | — | — | 2,033 | 2,013 | 4,046 | (309 | ) | 2000 | 08/21/13 | 15 to 30 Years | ||||||||||||||||||||
| Macon, GA | (c) | 838 | 1,723 | — | — | 838 | 1,723 | 2,561 | (201 | ) | 1995 | 07/17/13 | 13 to 40 Years | ||||||||||||||||||||
| Macon, GA | (c) | 874 | 1,712 | — | — | 874 | 1,712 | 2,586 | (208 | ) | 1995 | 07/17/13 | 11 to 40 Years | ||||||||||||||||||||
| Madill, OK | (a) | 352 | 648 | — | — | 352 | 648 | 1,000 | (734 | ) | 1972 | 06/25/04 | 10 to 15 Years | ||||||||||||||||||||
| Manchester, IA | (a) | 351 | 495 | — | — | 351 | 495 | 846 | (541 | ) | 1977 | 09/23/05 | 10 to 15 Years | ||||||||||||||||||||
| Maple Grove, MN | (a) | 1,852 | 1,096 | — | — | 1,852 | 1,096 | 2,948 | (561 | ) | 1997 | 09/24/04 | 15 to 30 Years | ||||||||||||||||||||
| Maquoketa, IA | (a) | 184 | 90 | — | — | 184 | 90 | 274 | (138 | ) | 1973 | 09/23/05 | 10 to 15 Years | ||||||||||||||||||||
| Marietta, GA | (a) | 1,221 | 1,533 | — | — | 1,221 | 1,533 | 2,754 | (323 | ) | 2003 | 01/16/15 | 9 to 15 Years | ||||||||||||||||||||
| Mars, PA | (a) | 946 | 2,221 | — | — | 946 | 2,221 | 3,167 | (909 | ) | 1990 | 06/25/04 | 15 to 30 Years | ||||||||||||||||||||
| Mason, OH | (a) | 619 | 599 | — | — | 619 | 599 | 1,218 | (95 | ) | 1994 | 12/24/13 | 15 to 30 Years | ||||||||||||||||||||
| Mayfield, KY | (a) | 307 | 596 | — | — | 307 | 596 | 903 | (336 | ) | 1997 | 06/25/04 | 15 to 30 Years | ||||||||||||||||||||
| McAllen, TX | (a) | 1,819 | 1,188 | — | — | 1,819 | 1,188 | 3,007 | (669 | ) | 1997 | 06/29/07 | 15 to 30 Years | ||||||||||||||||||||
| Meadville, PA | (a) | 981 | 1,056 | — | — | 981 | 1,056 | 2,037 | (435 | ) | 1983 | 02/06/07 | 15 to 30 Years | ||||||||||||||||||||
| Meadville, PA | (c) | 652 | 1,284 | — | — | 652 | 1,284 | 1,936 | (132 | ) | 1991 | 12/23/14 | 15 to 30 Years | ||||||||||||||||||||
| Mechanicsburg, PA | (a) | 801 | 481 | — | — | 801 | 481 | 1,282 | (328 | ) | 1995 | 01/30/06 | 15 to 20 Years | ||||||||||||||||||||
| Melbourne, FL | (a) | 2,005 | 794 | — | — | 2,005 | 794 | 2,799 | (428 | ) | 1986 | 12/31/07 | 15 to 40 Years | ||||||||||||||||||||
| Memphis, TN | (a) | 817 | 1,637 | — | — | 817 | 1,637 | 2,454 | (348 | ) | 2005 | 01/16/15 | 9 to 15 Years | ||||||||||||||||||||
| Mendota, MN | (a) | 536 | 963 | — | — | 536 | 963 | 1,499 | (105 | ) | 1995 | 05/22/14 | 15 to 30 Years | ||||||||||||||||||||
| Mentor, OH | (a) | 873 | 790 | — | — | 873 | 790 | 1,663 | (385 | ) | 2003 | 12/31/07 | 15 to 40 Years | ||||||||||||||||||||
| Mesa, AZ | (a) | 1,318 | 234 | — | — | 1,318 | 234 | 1,552 | (236 | ) | 1995 | 06/25/04 | 15 to 20 Years | ||||||||||||||||||||
| Mesa, AZ | (a) | 676 | 911 | — | — | 676 | 911 | 1,587 | (202 | ) | 1978 | 10/28/11 | 14 to 39 Years | ||||||||||||||||||||
| Mesa, AZ | (c) | 422 | 1,002 | — | — | 422 | 1,002 | 1,424 | (127 | ) | 1990 | 06/14/13 | 15 to 40 Years | ||||||||||||||||||||
| Metairie, LA | (b) | 800 | 3,016 | — | — | 800 | 3,016 | 3,816 | (367 | ) | 1964 | 07/17/13 | 10 to 30 Years | ||||||||||||||||||||
| Middleburg Heights, OH | (a) | 1,456 | 793 | — | — | 1,456 | 793 | 2,249 | (349 | ) | 1987 | 02/06/07 | 15 to 30 Years | ||||||||||||||||||||
| Midlothian, VA | (a) | 823 | 1,151 | — | 246 | 823 | 1,397 | 2,220 | (503 | ) | 1994 | 11/28/06 | 15 to 30 Years | ||||||||||||||||||||
| Monroe, MI | (c) | 927 | 897 | — | — | 927 | 897 | 1,824 | (106 | ) | 1996 | 12/23/14 | 15 to 30 Years | ||||||||||||||||||||
| Monroeville, PA | (c) | 1,677 | 3,508 | — | — | 1,677 | 3,508 | 5,185 | — | 2009 | 12/22/16 | 12 to 30 Years | |||||||||||||||||||||
| Moody, AL | (a) | 518 | 800 | — | 57 | 518 | 857 | 1,375 | (152 | ) | 1997 | 03/29/13 | 8 to 29 Years | ||||||||||||||||||||
| Muskogee, OK | (a) | 968 | 1,259 | (448 | ) | (568 | ) | 520 | 691 | 1,211 | (663 | ) | 1984 | 02/26/07 | 14 to 30 Years | ||||||||||||||||||
| New Boston, OH | (a) | 599 | 1,498 | — | — | 599 | 1,498 | 2,097 | (197 | ) | 1996 | 10/25/13 | 15 to 30 Years | ||||||||||||||||||||
| Initial Cost to Company | Cost Capitalized Subsequent to Acquisition including impairment | Gross Amount at December 31, | Life in which depreciation in latest Statement of Operations is computed | ||||||||||||||||||||||
| Description | Encumbrances | Land and Improvements | Buildings and Improvements | Improvements/ Land | Improvements/ building | Land and Improvements | Buildings and Improvements | Total | Final Accum | Date of Construction | Date Acquired | ||||||||||||||
| Greensboro, NC | (a) | 1,009 | 444 | — | — | 1,009 | 444 | 1,453 | (236 | ) | 2003 | 12/31/07 | 15 to 40 years | |||||||||||||||||||||
| Grove City, PA | (a) | 531 | 495 | — | — | 531 | 495 | 1,026 | (194 | ) | 1976 | 02/06/07 | 15 to 30 years | |||||||||||||||||||||
| Gurnee, IL | (a) | 586 | 619 | — | — | 586 | 619 | 1,205 | (302 | ) | 1995 | 06/25/04 | 15 to 20 years | |||||||||||||||||||||
| Hagerstown, MD | (a) | 546 | 342 | — | 68 | 546 | 410 | 956 | (164 | ) | 1975 | 11/27/06 | 15 to 20 years | |||||||||||||||||||||
| Hamilton, NY | (a) | 145 | 152 | — | — | 145 | 152 | 297 | (90 | ) | 1982 | 12/21/07 | 13 to 18 years | |||||||||||||||||||||
| Hammond, IN | (b) | 976 | 1,080 | — | — | 976 | 1,080 | 2,056 | — | 2014 | 12/24/14 | 14 to 30 Years | ||||||||||||||||||||||
| Harriman, TN | (a) | 314 | 143 | — | 176 | 314 | 319 | 633 | (121 | ) | 1979 | 11/02/07 | 15 to 30 years | |||||||||||||||||||||
| Harrisburg, PA | (a) | 762 | 241 | — | 176 | 762 | 417 | 1,179 | (212 | ) | 1977 | 01/30/06 | 15 to 20 years | |||||||||||||||||||||
| Harrisburg, PA | (a) | 611 | 239 | — | — | 611 | 239 | 850 | (201 | ) | 1978 | 01/30/06 | 15 to 20 years | |||||||||||||||||||||
| Harrisburg, PA | (a) | 423 | 307 | — | — | 423 | 307 | 730 | (135 | ) | 1973 | 01/30/06 | 15 to 20 years | |||||||||||||||||||||
| Hermitage, PA | (b) | 604 | 717 | — | — | 604 | 717 | 1,321 | (263 | ) | 1978 | 02/06/07 | 10 to 25 years | |||||||||||||||||||||
| Hibbing, MN | (a) | 242 | 298 | — | — | 242 | 298 | 540 | (100 | ) | 1979 | 05/24/05 | 15 to 30 years | |||||||||||||||||||||
| Hickory, NC | (a) | 1,105 | 851 | — | — | 1,105 | 851 | 1,956 | (518 | ) | 1995 | 12/29/06 | 13 to 28 years | |||||||||||||||||||||
| Hilliard, OH | (a) | 1,149 | 1,291 | — | — | 1,149 | 1,291 | 2,440 | (476 | ) | 1997 | 09/24/04 | 15 to 30 years | |||||||||||||||||||||
| Hiram, GA | (a) | 813 | 716 | — | — | 813 | 716 | 1,529 | (80 | ) | 1999 | 07/17/13 | 6 to 21 Years | |||||||||||||||||||||
| Hiram, GA | (a) | 1,006 | 1,142 | — | — | 1,006 | 1,142 | 2,148 | (417 | ) | 1987 | 02/28/06 | 15 to 30 years | |||||||||||||||||||||
| Hodgkins, IL | (a) | 1,230 | 2,048 | — | — | 1,230 | 2,048 | 3,278 | (641 | ) | 1993 | 12/29/06 | 15 to 30 years | |||||||||||||||||||||
| Homewood, AL | (a) | 583 | 839 | — | — | 583 | 839 | 1,422 | (42 | ) | 2002 | 12/05/13 | 15 to 30 Years | |||||||||||||||||||||
| Hornell, NY | (a) | 306 | 344 | — | — | 306 | 344 | 650 | (339 | ) | 1978 | 12/29/06 | 10 to 15 years | |||||||||||||||||||||
| Houston, TX | (a) | 1,098 | 439 | — | — | 1,098 | 439 | 1,537 | (272 | ) | 1995 | 06/25/04 | 15 to 40 years | |||||||||||||||||||||
| Houston, TX | (a) | 1,156 | 352 | (22 | ) | — | 1,134 | 352 | 1,486 | (225 | ) | 1995 | 06/25/04 | 15 to 30 years | ||||||||||||||||||||
| Houston, TX | (a) | 585 | 561 | — | — | 585 | 561 | 1,146 | (464 | ) | 1979 | 12/30/04 | 10 to 15 years | |||||||||||||||||||||
| Houston, TX | (a) | 2,844 | 1,620 | — | — | 2,844 | 1,620 | 4,464 | (596 | ) | 1994 | 06/29/07 | 15 to 30 years | |||||||||||||||||||||
| Houston, TX | �� | (a) | 2,348 | 1,348 | — | — | 2,348 | 1,348 | 3,696 | (543 | ) | 1997 | 06/29/07 | 15 to 30 years | ||||||||||||||||||||
| Huntington Park, CA | (a) | 1,822 | 1,211 | — | — | 1,822 | 1,211 | 3,033 | — | 1957 | 12/19/14 | 15 to 30 Years | ||||||||||||||||||||||
| Hutchinson, KS | (a) | 895 | 856 | — | — | 895 | 856 | 1,751 | (24 | ) | 1995 | 06/04/14 | 15 to 30 Years | |||||||||||||||||||||
| Hyattsville, MD | (a) | 702 | 245 | — | — | 702 | 245 | 947 | (131 | ) | 1985 | 11/27/06 | 15 to 20 years | |||||||||||||||||||||
| Independence, IA | (a) | 223 | 473 | — | — | 223 | 473 | 696 | (408 | ) | 1976 | 09/23/05 | 10 to 15 years | |||||||||||||||||||||
| Independence, MO | (a) | 1,450 | 1,967 | — | — | 1,450 | 1,967 | 3,417 | (528 | ) | 2002 | 06/29/07 | 15 to 40 years | |||||||||||||||||||||
| Indiana, PA | (a) | 331 | 323 | — | — | 331 | 323 | 654 | (142 | ) | 1982 | 02/06/07 | 15 to 30 years | |||||||||||||||||||||
| Indianapolis, IN | (b) | 590 | 633 | — | — | 590 | 633 | 1,223 | (7 | ) | 2014 | 10/31/14 | 14 to 30 Years | |||||||||||||||||||||
| Indianapolis, IN | (b) | 703 | 1,223 | — | — | 703 | 1,223 | 1,926 | — | 1974 | 12/23/14 | 15 to 30 Years | ||||||||||||||||||||||
| Indianapolis, IN | (b) | 418 | 1,223 | — | — | 418 | 1,223 | 1,641 | — | 1992 | 12/23/14 | 15 to 30 Years | ||||||||||||||||||||||
| Indianapolis, IN | (a) | 1,971 | 2,295 | — | — | 1,971 | 2,295 | 4,266 | (508 | ) | 2003 | 11/10/05 | 15 to 40 years | |||||||||||||||||||||
| Jackson, MI | (a) | 599 | 354 | — | — | 599 | 354 | 953 | (20 | ) | 1997 | 12/24/13 | 15 to 30 Years | |||||||||||||||||||||
| Jacksonville, FL | (b) | 1,355 | 1,345 | — | — | 1,355 | 1,345 | 2,700 | — | 2003 | 12/23/14 | 15 to 30 Years | ||||||||||||||||||||||
| Johnson City, TN | 1,933 | 1,331 | 2,304 | — | — | 1,331 | 2,304 | 3,635 | (158 | ) | 1996 | 07/17/13 | 12 to 30 Years | |||||||||||||||||||||
| New Cumberland, PA | (a) | 634 | 278 | — | 176 | 634 | 454 | 1,088 | (296 | ) | 1990 | 01/30/06 | 15 to 20 Years | ||||||||||||||||||||
| Newport News, VA | (c) | 1,184 | 311 | — | — | 1,184 | 311 | 1,495 | (287 | ) | 1995 | 06/25/04 | 10 to 25 Years | ||||||||||||||||||||
| Newton, KS | (a) | 175 | 661 | — | — | 175 | 661 | 836 | (76 | ) | 1987 | 06/30/14 | 15 to 30 Years | ||||||||||||||||||||
| Norman, OK | (a) | 1,466 | 2,294 | — | — | 1,466 | 2,294 | 3,760 | (1,052 | ) | 1992 | 07/02/07 | 14 to 30 Years | ||||||||||||||||||||
| North Little Rock, AR | (a) | 1,398 | 1,289 | — | — | 1,398 | 1,289 | 2,687 | (799 | ) | 1993 | 09/23/05 | 15 to 20 Years | ||||||||||||||||||||
| Oak Ridge, TN | (c) | 988 | 1,019 | — | — | 988 | 1,019 | 2,007 | (95 | ) | 1994 | 12/23/14 | 15 to 30 Years | ||||||||||||||||||||
| Oklahoma City, OK | (a) | 479 | 1,877 | — | — | 479 | 1,877 | 2,356 | (289 | ) | 1904 | 12/02/13 | 20 to 20 Years | ||||||||||||||||||||
| Olean, NY | (a) | 355 | 663 | — | — | 355 | 663 | 1,018 | (301 | ) | 1977 | 02/06/07 | 15 to 30 Years | ||||||||||||||||||||
| Orange City, FL | (a) | 409 | 694 | — | — | 409 | 694 | 1,103 | (432 | ) | 1984 | 09/24/04 | 11 to 20 Years | ||||||||||||||||||||
| Orlando, FL | (a) | 2,006 | 571 | — | — | 2,006 | 571 | 2,577 | (297 | ) | 2002 | 12/31/07 | 15 to 40 Years | ||||||||||||||||||||
| Orlando, FL | (c) | 1,351 | 1,404 | — | — | 1,351 | 1,404 | 2,755 | — | 2002 | 12/28/16 | 8 to 40 Years | |||||||||||||||||||||
| Orlando, FL | (c) | 1,484 | 1,415 | — | — | 1,484 | 1,415 | 2,899 | — | 1998 | 12/28/16 | 6 to 40 Years | |||||||||||||||||||||
| Orlando, FL | (c) | 1,319 | 1,424 | — | — | 1,319 | 1,424 | 2,743 | — | 1997 | 12/28/16 | 7to 40 Years | |||||||||||||||||||||
| Ottawa, KS | (a) | 348 | 816 | — | — | 348 | 816 | 1,164 | (91 | ) | 1987 | 06/04/14 | 15 to 30 Years | ||||||||||||||||||||
| Overland Park, KS | (a) | 2,549 | 3,219 | — | — | 2,549 | 3,219 | 5,768 | (349 | ) | 1983 | 05/15/14 | 15 to 30 Years | ||||||||||||||||||||
| Oviedo, FL | (c) | 1,499 | 1,449 | — | — | 1,499 | 1,449 | 2,948 | — | 2006 | 12/28/16 | 7 to 40 Years | |||||||||||||||||||||
| Owensboro, KY | (a) | 250 | 502 | — | — | 250 | 502 | 752 | (158 | ) | 1991 | 06/25/04 | 30 to 30 Years | ||||||||||||||||||||
| Oxford, AL | (c) | 489 | 1,212 | — | — | 489 | 1,212 | 1,701 | (112 | ) | 1991 | 12/23/14 | 15 to 30 Years | ||||||||||||||||||||
| Paducah, KY | (c) | 1,485 | 2,407 | — | — | 1,485 | 2,407 | 3,892 | — | 2013 | 12/22/16 | 13 to 40 Years | |||||||||||||||||||||
| Paris, TX | (c) | 552 | 1,821 | — | — | 552 | 1,821 | 2,373 | (241 | ) | 1999 | 07/17/13 | 11 to 35 Years | ||||||||||||||||||||
| Pelham, AL | (a) | 605 | 922 | — | 57 | 605 | 979 | 1,584 | (169 | ) | 1998 | 03/29/13 | 8 to 29 Years | ||||||||||||||||||||
| Phoenix, AZ | (a) | 787 | 663 | — | — | 787 | 663 | 1,450 | (198 | ) | 1964 | 10/28/11 | 14 to 29 Years | ||||||||||||||||||||
| Picayune, MS | (a) | 1,250 | 1,409 | — | — | 1,250 | 1,409 | 2,659 | (257 | ) | 1999 | 07/17/13 | 7 to 29 Years | ||||||||||||||||||||
| Pico Rivera, CA | (a) | 2,785 | 3,126 | — | — | 2,785 | 3,126 | 5,911 | (231 | ) | 2014 | 12/19/14 | 15 to 40 Years | ||||||||||||||||||||
| Pittsburgh, PA | (a) | 1,289 | 1,871 | — | — | 1,289 | 1,871 | 3,160 | (751 | ) | 1992 | 06/25/04 | 15 to 30 Years | ||||||||||||||||||||
| Pittsburgh, PA | (a) | 1,481 | 676 | — | — | 1,481 | 676 | 2,157 | (355 | ) | 2006 | 12/31/07 | 15 to 40 Years | ||||||||||||||||||||
| Plano, TX | (a) | 2,418 | 1,529 | — | — | 2,418 | 1,529 | 3,947 | (607 | ) | 1998 | 06/29/07 | 15 to 40 Years | ||||||||||||||||||||
| Powell, TN | (a) | 252 | 377 | — | 176 | 252 | 553 | 805 | (244 | ) | 1982 | 11/02/07 | 15 to 30 Years | ||||||||||||||||||||
| Princeton, WV | (a) | 948 | 2,212 | — | — | 948 | 2,212 | 3,160 | (416 | ) | 2001 | 07/17/13 | 11 to 25 Years | ||||||||||||||||||||
| Queen Creek, AZ | (c) | 609 | 1,159 | — | — | 609 | 1,159 | 1,768 | (162 | ) | 2004 | 06/14/13 | 15 to 40 Years | ||||||||||||||||||||
| Rapid City, SD | (a) | 878 | 1,657 | — | — | 878 | 1,657 | 2,535 | (824 | ) | 1902 | 12/29/06 | 15 to 20 Years | ||||||||||||||||||||
| Rawlins, WY | (a) | 25 | 406 | — | — | 25 | 406 | 431 | (217 | ) | 1958 | 12/29/06 | 15 to 20 Years | ||||||||||||||||||||
| Reston, VA | (a) | 1,033 | 193 | — | — | 1,033 | 193 | 1,226 | (139 | ) | 1977 | 11/27/06 | 15 to 20 Years | ||||||||||||||||||||
| Richmond, VA | (a) | 1,253 | 1,410 | — | 29 | 1,253 | 1,439 | 2,692 | (528 | ) | 1977 | 11/28/06 | 15 to 30 Years | ||||||||||||||||||||
| Richmond, VA | (c) | 993 | 922 | — | — | 993 | 922 | 1,915 | (98 | ) | 2003 | 03/20/15 | 13 to 20 Years | ||||||||||||||||||||
| Ringgold, GA | (a) | 387 | 374 | — | — | 387 | 374 | 761 | (177 | ) | 1990 | 11/02/07 | 15 to 30 Years | ||||||||||||||||||||
| Riverside, CA | (a) | 1,988 | 1,211 | — | — | 1,988 | 1,211 | 3,199 | (136 | ) | 2002 | 12/19/14 | 15 to 30 Years | ||||||||||||||||||||
| Initial Cost to Company | Cost Capitalized Subsequent to Acquisition including impairment | Gross Amount at December 31, | Life in which depreciation in latest Statement of Operations is computed | ||||||||||||||||||||||
| Description | Encumbrances | Land and Improvements | Buildings and Improvements | Improvements/ Land | Improvements/ building | Land and Improvements | Buildings and Improvements | Total | Final Accum | Date of Construction | Date Acquired | ||||||||||||||
| Johnstown, PA | (a) | 865 | 938 | — | — | 865 | 938 | 1,803 | (134 | ) | 1998 | 07/17/13 | 8 to 20 Years | |||||||||||||||||||||
| Joliet, IL | (a) | 1,994 | 1,207 | — | — | 1,994 | 1,207 | 3,201 | (494 | ) | 1996 | 12/29/06 | 15 to 30 years | |||||||||||||||||||||
| Kansas City, KS | (a) | 796 | 609 | — | — | 796 | 609 | 1,405 | (27 | ) | 2006 | 12/24/13 | 15 to 40 Years | |||||||||||||||||||||
| Kennesaw, GA | (a) | 907 | 499 | — | — | 907 | 499 | 1,406 | (190 | ) | 2001 | 02/28/06 | 15 to 40 years | |||||||||||||||||||||
| Kimball, TN | (a) | 367 | 283 | — | 176 | 367 | 459 | 826 | (156 | ) | 1987 | 11/02/07 | 15 to 30 years | |||||||||||||||||||||
| Kingwood, TX | (a) | 936 | 387 | — | — | 936 | 387 | 1,323 | (237 | ) | 1994 | 06/25/04 | 15 to 30 years | |||||||||||||||||||||
| Knoxville, TN | (a) | 296 | 343 | — | 176 | 296 | 519 | 815 | (161 | ) | 1978 | 11/02/07 | 15 to 30 years | |||||||||||||||||||||
| Knoxville, TN | (a) | 172 | 700 | — | — | 172 | 700 | 872 | (196 | ) | 1991 | 11/02/07 | 15 to 30 years | |||||||||||||||||||||
| LaFayette, GA | (a) | 246 | 434 | — | 176 | 246 | 610 | 856 | (188 | ) | 1991 | 11/02/07 | 15 to 30 years | |||||||||||||||||||||
| Lake Charles, LA | (a) | 1,619 | 1,349 | — | — | 1,619 | 1,349 | 2,968 | (125 | ) | 1987 | 07/17/13 | 10 to 24 Years | |||||||||||||||||||||
| Lakeville, MN | (a) | 342 | 439 | — | — | 342 | 439 | 781 | (138 | ) | 1988 | 05/24/05 | 15 to 30 years | |||||||||||||||||||||
| Lancaster, PA | (a) | 308 | 161 | — | — | 308 | 161 | 469 | (91 | ) | 1977 | 07/25/06 | 15 to 30 years | |||||||||||||||||||||
| Lander, WY | (a) | 57 | 1,010 | — | — | 57 | 1,010 | 1,067 | (402 | ) | 1883 | 12/29/06 | 15 to 20 years | |||||||||||||||||||||
| Lanham, MD | (a) | 302 | 193 | — | 200 | 302 | 393 | 695 | (123 | ) | 1980 | 11/27/06 | 15 to 20 years | |||||||||||||||||||||
| Lawrence, KS | (a) | 478 | 209 | — | — | 478 | 209 | 687 | (5 | ) | 1972 | 06/04/14 | 15 to 30 Years | |||||||||||||||||||||
| Lebanon, PA | (a) | 616 | 316 | — | 176 | 616 | 492 | 1,108 | (220 | ) | 1980 | 01/30/06 | 15 to 20 years | |||||||||||||||||||||
| Leeds, AL | (a) | 907 | 926 | — | 31 | 907 | 957 | 1,864 | (565 | ) | 2003 | 09/26/06 | 9 to 40 years | |||||||||||||||||||||
| Lewis Center, OH | (a) | 626 | 560 | — | — | 626 | 560 | 1,186 | (216 | ) | 1998 | 06/25/04 | 15 to 30 years | |||||||||||||||||||||
| Lewiston, ID | (b) | 1,080 | 866 | — | — | 1,080 | 866 | 1,946 | — | 1996 | 12/23/14 | 15 to 30 Years | ||||||||||||||||||||||
| Lexington, KY | (a) | 1,267 | 944 | — | — | 1,267 | 944 | 2,211 | (467 | ) | 1996 | 02/26/07 | 14 to 30 years | |||||||||||||||||||||
| Lexington, NC | (a) | 910 | 1,059 | — | — | 910 | 1,059 | 1,969 | (63 | ) | 1998 | 10/25/13 | 15 to 30 Years | |||||||||||||||||||||
| Little Rock, AR | (a) | 886 | — | — | — | 886 | — | 886 | — | 2013 | 06/26/14 | 14 to 14 Years | ||||||||||||||||||||||
| Little Rock, AR | (a) | 699 | 1,700 | — | — | 699 | 1,700 | 2,399 | (740 | ) | 1972 | 02/26/07 | 14 to 20 years | |||||||||||||||||||||
| Littleton, CO | (c ) | 696 | 1,943 | — | — | 696 | 1,943 | 2,639 | (91 | ) | 1990 | 07/17/13 | 11 to 40 Years | |||||||||||||||||||||
| Littleton, CO | (a) | 501 | 629 | — | — | 501 | 629 | 1,130 | (28 | ) | 1992 | 12/24/13 | 15 to 30 Years | |||||||||||||||||||||
| Longview, WA | (c ) | 870 | 2,855 | — | — | 870 | 2,855 | 3,725 | (126 | ) | 2004 | 07/17/13 | 13 to 40 Years | |||||||||||||||||||||
| Loveland, CO | (c ) | 602 | 1,913 | — | — | 602 | 1,913 | 2,515 | (82 | ) | 1997 | 07/17/13 | 12 to 40 Years | |||||||||||||||||||||
| Lufkin, TX | (a) | 927 | 790 | — | — | 927 | 790 | 1,717 | (543 | ) | 1970 | 02/26/07 | 14 to 20 years | |||||||||||||||||||||
| Lynchburg, VA | (a) | 2,033 | 2,013 | — | — | 2,033 | 2,013 | 4,046 | (124 | ) | 2000 | 08/21/13 | 15 to 30 Years | |||||||||||||||||||||
| Mableton, GA | (a) | 454 | 826 | — | — | 454 | 826 | 1,280 | (243 | ) | 1987 | 02/28/06 | 15 to 30 years | |||||||||||||||||||||
| Mableton, GA | (a) | 634 | 578 | — | — | 634 | 578 | 1,212 | (188 | ) | 1981 | 02/28/06 | 15 to 30 years | |||||||||||||||||||||
| Macon, GA | (c ) | 838 | 1,723 | — | — | 838 | 1,723 | 2,561 | (83 | ) | 1998 | 07/17/13 | 13 to 40 Years | |||||||||||||||||||||
| Macon, GA | (c ) | 874 | 1,712 | — | — | 874 | 1,712 | 2,586 | (86 | ) | 1998 | 07/17/13 | 11 to 40 Years | |||||||||||||||||||||
| Madill, OK | (a) | 352 | 648 | — | — | 352 | 648 | 1,000 | (578 | ) | 1972 | 06/25/04 | 10 to 15 years | |||||||||||||||||||||
| Manchester, IA | (a) | 351 | 495 | — | — | 351 | 495 | 846 | (426 | ) | 1977 | 09/23/05 | 10 to 15 years | |||||||||||||||||||||
| Manhattan, KS | (a) | 816 | 388 | — | — | 816 | 388 | 1,204 | (10 | ) | 1991 | 06/04/14 | 15 to 30 Years | |||||||||||||||||||||
| Mansfield, TX | (a) | 472 | 760 | — | — | 472 | 760 | 1,232 | (305 | ) | 1991 | 12/29/06 | 15 to 30 years | |||||||||||||||||||||
| Maquoketa, IA | (a) | 184 | 90 | — | — | 184 | 90 | 274 | (109 | ) | 1973 | 09/23/05 | 10 to 15 years | |||||||||||||||||||||
| Marietta, GA | (a) | 3,908 | 8,630 | — | — | 3,908 | 8,630 | 12,538 | (2,657 | ) | 1992 | 10/15/04 | 15 to 30 years | |||||||||||||||||||||
| Roanoke, VA | (a) | 1,362 | 1,836 | — | — | 1,362 | 1,836 | 3,198 | (239 | ) | 2000 | 08/21/13 | 15 to 30 Years | ||||||||||||||||||||
| Rock Falls, IL | (a) | 314 | 631 | — | — | 314 | 631 | 945 | (293 | ) | 1995 | 09/23/05 | 15 to 30 Years | ||||||||||||||||||||
| Rockford, IL | (c) | 1,348 | 2,842 | — | — | 1,348 | 2,842 | 4,190 | — | 1977 | 12/22/16 | 13 to 40 Years | |||||||||||||||||||||
| Salem, IL | (a) | 271 | 218 | — | — | 271 | 218 | 489 | (113 | ) | 2000 | 07/28/04 | 15 to 30 Years | ||||||||||||||||||||
| Salina, KS | (c) | 764 | 1,100 | — | — | 764 | 1,100 | 1,864 | (111 | ) | 1994 | 12/23/14 | 15 to 30 Years | ||||||||||||||||||||
| San Antonio, TX | (a) | 1,204 | 519 | — | — | 1,204 | 519 | 1,723 | (48 | ) | 1993 | 09/26/13 | 30 to 30 Years | ||||||||||||||||||||
| Sanford, FL | (c) | 1,405 | 1,191 | — | — | 1,405 | 1,191 | 2,596 | — | 1987 | 12/28/16 | 6 to 30 Years | |||||||||||||||||||||
| Santa Ana, CA | (a) | 2,112 | 1,501 | — | — | 2,112 | 1,501 | 3,613 | (137 | ) | 1976 | 12/19/14 | 15 to 30 Years | ||||||||||||||||||||
| Santa Fe, NM | (c) | 2,120 | 2,033 | — | — | 2,120 | 2,033 | 4,153 | (236 | ) | 1997 | 07/17/13 | 13 to 40 Years | ||||||||||||||||||||
| Sarasota, FL | (a) | 2,758 | 412 | — | — | 2,758 | 412 | 3,170 | (136 | ) | 2000 | 07/17/13 | 12 to 25 Years | ||||||||||||||||||||
| Savannah, GA | (c) | 1,112 | 1,727 | — | — | 1,112 | 1,727 | 2,839 | (206 | ) | 1993 | 07/17/13 | 13 to 40 Years | ||||||||||||||||||||
| Shawnee, OK | (a) | 621 | 1,399 | — | — | 621 | 1,399 | 2,020 | (169 | ) | 1984 | 07/29/05 | 15 to 30 Years | ||||||||||||||||||||
| Shelbyville, IN | (c) | 549 | 752 | — | — | 549 | 752 | 1,301 | (258 | ) | 2006 | 12/21/07 | 15 to 50 Years | ||||||||||||||||||||
| Sherman, TX | (a) | 1,013 | 1,286 | (415 | ) | (542 | ) | 598 | 744 | 1,342 | (730 | ) | 1994 | 02/26/07 | 14 to 30 Years | ||||||||||||||||||
| Shreveport, LA | (a) | 759 | 964 | (446 | ) | (727 | ) | 313 | 237 | 550 | — | 1964 | 02/26/07 | 14 to 20 Years | |||||||||||||||||||
| Silver Spring, MD | (a) | 1,008 | 251 | — | — | 1,008 | 251 | 1,259 | (183 | ) | 1983 | 11/27/06 | 15 to 20 Years | ||||||||||||||||||||
| Sioux Falls, SD | (a) | 639 | 206 | — | — | 639 | 206 | 845 | (30 | ) | 1994 | 12/24/13 | 15 to 30 Years | ||||||||||||||||||||
| Soddy Daisy, TN | (a) | 316 | 405 | — | — | 316 | 405 | 721 | (193 | ) | 1989 | 11/02/07 | 15 to 30 Years | ||||||||||||||||||||
| Springfield, IL | (a) | 1,115 | 772 | — | — | 1,115 | 772 | 1,887 | (364 | ) | 1996 | 12/31/07 | 15 to 40 Years | ||||||||||||||||||||
| Springfield, MO | (a) | 1,655 | 1,467 | — | — | 1,655 | 1,467 | 3,122 | (773 | ) | 1993 | 09/23/05 | 15 to 30 Years | ||||||||||||||||||||
| Stillwater, MN | (a) | 1,051 | 1,051 | — | — | 1,051 | 1,051 | 2,102 | (587 | ) | 1998 | 09/24/04 | 15 to 30 Years | ||||||||||||||||||||
| Stillwater, OK | (a) | 647 | 687 | — | — | 647 | 687 | 1,334 | (85 | ) | 1987 | 06/04/14 | 15 to 30 Years | ||||||||||||||||||||
| Stillwater, OK | (c) | 611 | 1,447 | — | — | 611 | 1,447 | 2,058 | (109 | ) | 1995 | 12/23/14 | 15 to 30 Years | ||||||||||||||||||||
| Sweetwater, TN | (a) | 231 | 307 | — | — | 231 | 307 | 538 | (154 | ) | 1979 | 11/02/07 | 15 to 30 Years | ||||||||||||||||||||
| Syracuse, NY | (c) | 734 | 1,518 | — | — | 734 | 1,518 | 2,252 | (146 | ) | 1981 | 12/23/14 | 15 to 30 Years | ||||||||||||||||||||
| Taylorville, IL | (a) | 154 | 352 | — | — | 154 | 352 | 506 | (357 | ) | 1980 | 09/23/05 | 10 to 15 Years | ||||||||||||||||||||
| Thornton, CO | (a) | 943 | 128 | — | — | 943 | 128 | 1,071 | (21 | ) | 1996 | 12/24/13 | 15 to 30 Years | ||||||||||||||||||||
| Thurmont, MD | (a) | 857 | 307 | — | 68 | 857 | 375 | 1,232 | (217 | ) | 1985 | 11/27/06 | 11 to 20 Years | ||||||||||||||||||||
| Tifton, GA | (c) | 642 | 1,009 | — | — | 642 | 1,009 | 1,651 | (80 | ) | 1995 | 12/23/14 | 15 to 40 Years | ||||||||||||||||||||
| Tilton, NH | (c) | 1,565 | — | — | — | 1,565 | — | 1,565 | — | (f) | 07/17/13 | (f) | |||||||||||||||||||||
| Tipton, IA | (a) | 240 | 408 | — | — | 240 | 408 | 648 | (485 | ) | 1991 | 09/23/05 | 10 to 15 Years | ||||||||||||||||||||
| Titusville, PA | (a) | 247 | 438 | — | — | 247 | 438 | 685 | (205 | ) | 1976 | 04/29/11 | 11 to 26 Years | ||||||||||||||||||||
| Topeka, KS | (a) | 1,224 | 905 | — | — | 1,224 | 905 | 2,129 | (135 | ) | 1988 | 06/04/14 | 15 to 30 Years | ||||||||||||||||||||
| Torrance, CA | (a) | 3,509 | 2,754 | — | — | 3,509 | 2,754 | 6,263 | (205 | ) | 1998 | 12/19/14 | 15 to 40 Years | ||||||||||||||||||||
| Traverse City, MI | (c) | 651 | 1,255 | — | — | 651 | 1,255 | 1,906 | (64 | ) | 2004 | 11/09/15 | 15 to 30 Years | ||||||||||||||||||||
| Trenton, GA | (a) | 300 | 227 | — | — | 300 | 227 | 527 | (141 | ) | 1991 | 11/02/07 | 15 to 30 Years | ||||||||||||||||||||
| Trussville, AL | (a) | 909 | 892 | — | 57 | 909 | 949 | 1,858 | (185 | ) | 2000 | 03/29/13 | 8 to 29 Years | ||||||||||||||||||||
| Trussville, AL | (b) | 1,222 | 1,769 | (1,029 | ) | (1,498 | ) | 193 | 271 | 464 | (3 | ) | 2007 | 07/17/13 | 12 to 38 Years | ||||||||||||||||||
| Trussville, AL | (a) | 796 | 256 | — | — | 796 | 256 | 1,052 | (51 | ) | 1998 | 12/24/13 | 15 to 30 Years | ||||||||||||||||||||
| Initial Cost to Company | Cost Capitalized Subsequent to Acquisition including impairment | Gross Amount at December 31, | Life in which depreciation in latest Statement of Operations is computed | ||||||||||||||||||||||
| Description | Encumbrances | Land and Improvements | Buildings and Improvements | Improvements/ Land | Improvements/ building | Land and Improvements | Buildings and Improvements | Total | Final Accum | Date of Construction | Date Acquired | ||||||||||||||
| Marietta, GA | (a) | 797 | 428 | — | — | 797 | 428 | 1,225 | (194 | ) | 1990 | 02/28/06 | 15 to 30 years | |||||||||||||||||||||
| Mars, PA | (a) | 946 | 2,221 | — | — | 946 | 2,221 | 3,167 | (716 | ) | 1990 | 06/25/04 | 15 to 30 years | |||||||||||||||||||||
| Mason, OH | (a) | 619 | 599 | — | — | 619 | 599 | 1,218 | (32 | ) | 1994 | 12/24/13 | 15 to 30 Years | |||||||||||||||||||||
| Maumee, OH | (a) | 1,505 | 1,817 | (754 | ) | (667 | ) | 751 | 1,150 | 1,901 | (570 | ) | 1997 | 09/24/04 | 15 to 30 years | |||||||||||||||||||
| Mayfield, KY | (a) | 307 | 596 | — | — | 307 | 596 | 903 | (265 | ) | 1997 | 06/25/04 | 15 to 30 years | |||||||||||||||||||||
| McAllen, TX | (a) | 1,819 | 1,188 | — | — | 1,819 | 1,188 | 3,007 | (527 | ) | 1997 | 06/29/07 | 15 to 30 years | |||||||||||||||||||||
| Meadville, PA | (b) | 652 | 1,284 | — | — | 652 | 1,284 | 1,936 | — | 1991 | 12/23/14 | 15 to 30 Years | ||||||||||||||||||||||
| Meadville, PA | (a) | 981 | 1,056 | — | — | 981 | 1,056 | 2,037 | (342 | ) | 1983 | 02/06/07 | 15 to 30 years | |||||||||||||||||||||
| Mechanicsburg, PA | (a) | 801 | 481 | — | — | 801 | 481 | 1,282 | (258 | ) | 1995 | 01/30/06 | 15 to 20 years | |||||||||||||||||||||
| Melbourne, FL | (a) | 2,005 | 794 | — | — | 2,005 | 794 | 2,799 | (333 | ) | 1986 | 12/31/07 | 15 to 40 years | |||||||||||||||||||||
| Mendota, MN | (a) | 536 | 963 | — | — | 536 | 963 | 1,499 | (24 | ) | 1995 | 05/22/14 | 15 to 30 Years | |||||||||||||||||||||
| Mentor, OH | (a) | 873 | 790 | — | — | 873 | 790 | 1,663 | (300 | ) | 2003 | 12/31/07 | 15 to 40 years | |||||||||||||||||||||
| Mesa, AZ | (a) | 1,318 | 234 | — | — | 1,318 | 234 | 1,552 | (186 | ) | 1995 | 06/25/04 | 15 to 20 years | |||||||||||||||||||||
| Mesa, AZ | (a) | 676 | 911 | — | — | 676 | 911 | 1,587 | (124 | ) | 1978 | 10/28/11 | 14 to 39 years | |||||||||||||||||||||
| Mesa, AZ | (b) | 422 | 1,002 | — | — | 422 | 1,002 | 1,424 | (56 | ) | 1990 | 06/14/13 | 15 to 40 Years | |||||||||||||||||||||
| Mesa, AZ | (b) | 255 | 805 | — | — | 255 | 805 | 1,060 | (42 | ) | 1986 | 06/14/13 | 15 to 40 Years | |||||||||||||||||||||
| Metairie, LA | (c ) | 800 | 3,016 | — | — | 800 | 3,016 | 3,816 | (152 | ) | 1972 | 07/17/13 | 10 to 30 Years | |||||||||||||||||||||
| Middleburg Heights, OH | (a) | 1,456 | 793 | — | — | 1,456 | 793 | 2,249 | (274 | ) | 1987 | 02/06/07 | 15 to 30 years | |||||||||||||||||||||
| Midlothian, VA | (a) | 823 | 1,151 | — | 246 | 823 | 1,397 | 2,220 | (365 | ) | 1994 | 11/28/06 | 15 to 30 years | |||||||||||||||||||||
| Milwaukee, WI | (a) | 867 | 1,867 | (525 | ) | (1,045 | ) | 342 | 822 | 1,164 | (477 | ) | 2001 | 12/29/06 | 13 to 30 years | |||||||||||||||||||
| Monroe, MI | (b) | 927 | 897 | — | — | 927 | 897 | 1,824 | — | 1996 | 12/23/14 | 15 to 30 Years | ||||||||||||||||||||||
| Moody, AL | (a) | 518 | 801 | — | 57 | 518 | 858 | 1,376 | (71 | ) | 1997 | 03/29/13 | 8 to 29 Years | |||||||||||||||||||||
| Morrow, GA | (a) | 652 | 450 | — | — | 652 | 450 | 1,102 | (167 | ) | 1995 | 02/28/06 | 15 to 30 years | |||||||||||||||||||||
| Muskogee, OK | (a) | 968 | 1,259 | — | — | 968 | 1,259 | 2,227 | (558 | ) | 1984 | 02/26/07 | 14 to 30 years | |||||||||||||||||||||
| New Boston, OH | (a) | 599 | 1,498 | — | — | 599 | 1,498 | 2,097 | (72 | ) | 1995 | 10/25/13 | 15 to 30 Years | |||||||||||||||||||||
| New Cumberland, PA | (a) | 634 | 278 | — | 176 | 634 | 454 | 1,088 | (215 | ) | 1990 | 01/30/06 | 15 to 20 years | |||||||||||||||||||||
| Newport News, VA | (b) | 1,184 | 311 | — | — | 1,184 | 311 | 1,495 | (226 | ) | 1995 | 06/25/04 | 10 to 25 years | |||||||||||||||||||||
| Newton, KS | (a) | 175 | 661 | — | — | 175 | 661 | 836 | (15 | ) | 1986 | 06/30/14 | 15 to 30 Years | |||||||||||||||||||||
| Norcross, GA | (a) | 678 | 402 | — | — | 678 | 402 | 1,080 | (189 | ) | 1982 | 02/28/06 | 15 to 20 years | |||||||||||||||||||||
| Norman, OK | (a) | 1,466 | 2,294 | — | — | 1,466 | 2,294 | 3,760 | (829 | ) | 1992 | 07/02/07 | 15 to 30 years | |||||||||||||||||||||
| North Little Rock, AR | (a) | 1,398 | 1,289 | — | — | 1,398 | 1,289 | 2,687 | (629 | ) | 1993 | 09/23/05 | 15 to 20 years | |||||||||||||||||||||
| Oak Ridge, TN | (b) | 988 | 1,019 | — | — | 988 | 1,019 | 2,007 | — | 1994 | 12/23/14 | 15 to 30 Years | ||||||||||||||||||||||
| Oklahoma City, OK | (a) | 481 | 2,315 | — | — | 481 | 2,315 | 2,796 | (84 | ) | 1920 | 12/02/13 | 30 to 30 Years | |||||||||||||||||||||
| Oklahoma City, OK | (a) | 479 | 1,877 | — | — | 479 | 1,877 | 2,356 | (102 | ) | 1904 | 12/02/13 | 20 to 20 Years | |||||||||||||||||||||
| Olean, NY | (a) | 355 | 663 | — | — | 355 | 663 | 1,018 | (237 | ) | 1977 | 02/06/07 | 15 to 30 years | |||||||||||||||||||||
| Tullahoma, TN | (c) | 520 | 886 | — | — | 520 | 886 | 1,406 | (74 | ) | 1996 | 12/23/14 | 15 to 40 Years | ||||||||||||||||||||
| Tulsa, OK | (a) | 983 | 1,232 | (497 | ) | (573 | ) | 486 | 659 | 1,145 | (611 | ) | 1976 | 02/26/07 | 14 to 30 Years | ||||||||||||||||||
| Tulsa, OK | (a) | 1,540 | 1,997 | — | — | 1,540 | 1,997 | 3,537 | (726 | ) | 2002 | 07/02/07 | 14 to 40 Years | ||||||||||||||||||||
| Tulsa, OK | (a) | 1,465 | 1,728 | — | — | 1,465 | 1,728 | 3,193 | (198 | ) | 2013 | 07/21/14 | 14 to 30 Years | ||||||||||||||||||||
| Tupelo, MS | (a) | 1,131 | 1,175 | (371 | ) | (435 | ) | 760 | 740 | 1,500 | — | 1995 | 07/17/13 | 7 to 26 Years | |||||||||||||||||||
| Union Gap, WA | (c) | 522 | 2,218 | — | — | 522 | 2,218 | 2,740 | (220 | ) | 2004 | 07/17/13 | 13 to 40 Years | ||||||||||||||||||||
| Upper Marlboro, MD | (a) | 290 | 172 | — | — | 290 | 172 | 462 | (137 | ) | 1983 | 11/27/06 | 15 to 20 Years | ||||||||||||||||||||
| Vandalia, IL | (a) | 409 | 202 | — | — | 409 | 202 | 611 | (331 | ) | 1977 | 09/23/05 | 10 to 15 Years | ||||||||||||||||||||
| Vinton, IA | (a) | 121 | 114 | — | — | 121 | 114 | 235 | (168 | ) | 1978 | 09/23/05 | 10 to 15 Years | ||||||||||||||||||||
| Walkersville, MD | (a) | 381 | 238 | — | 68 | 381 | 306 | 687 | (161 | ) | 1985 | 11/27/06 | 11 to 20 Years | ||||||||||||||||||||
| Walla Walla, WA | (c) | 665 | 2,072 | — | — | 665 | 2,072 | 2,737 | (278 | ) | 2005 | 07/17/13 | 11 to 35 Years | ||||||||||||||||||||
| Warner Robins, GA | (c) | 1,228 | 1,714 | — | — | 1,228 | 1,714 | 2,942 | (212 | ) | 1994 | 07/17/13 | 11 to 40 Years | ||||||||||||||||||||
| Warren, OH | (a) | 973 | 640 | — | — | 973 | 640 | 1,613 | (293 | ) | 1999 | 02/06/07 | 15 to 30 Years | ||||||||||||||||||||
| Warren, PA | (a) | 383 | 427 | — | — | 383 | 427 | 810 | (235 | ) | 1970 | 02/06/07 | 15 to 30 Years | ||||||||||||||||||||
| Warrenton, VA | (a) | 378 | 254 | — | — | 378 | 254 | 632 | (170 | ) | 1985 | 12/19/06 | 14 to 20 Years | ||||||||||||||||||||
| Warwick, RI | (a) | 1,593 | 1,314 | — | — | 1,593 | 1,314 | 2,907 | (542 | ) | 1990 | 12/31/07 | 15 to 40 Years | ||||||||||||||||||||
| Waterford, MI | (c) | 761 | 1,958 | — | — | 761 | 1,958 | 2,719 | (130 | ) | 1997 | 02/10/15 | 15 to 40 Years | ||||||||||||||||||||
| Wesley Chapel, FL | (c) | 2,672 | 1,725 | — | — | 2,672 | 1,725 | 4,397 | (95 | ) | 2015 | 08/18/15 | 14 to 40 Years | ||||||||||||||||||||
| Whittier, CA | (a) | 1,439 | 1,874 | — | — | 1,439 | 1,874 | 3,313 | (132 | ) | 1991 | 12/19/14 | 15 to 40 Years | ||||||||||||||||||||
| Wichita Falls, TX | (a) | 851 | 1,077 | (271 | ) | (317 | ) | 580 | 760 | 1,340 | (839 | ) | 1976 | 02/26/07 | 14 to 20 Years | ||||||||||||||||||
| Winfield, KS | (a) | 239 | 866 | — | — | 239 | 866 | 1,105 | (104 | ) | 1995 | 06/04/14 | 15 to 30 Years | ||||||||||||||||||||
| Winston-Salem, NC | (c) | 1,707 | 1,873 | — | — | 1,707 | 1,873 | 3,580 | — | 1998 | 12/22/16 | 13 to 40 Years | |||||||||||||||||||||
| Woodbury, MN | (a) | 555 | 411 | (146 | ) | (86 | ) | 409 | 325 | 734 | (139 | ) | 1987 | 05/24/05 | 15 to 30 Years | ||||||||||||||||||
| Woodbury, MN | (a) | 3,165 | 1,707 | — | — | 3,165 | 1,707 | 4,872 | (241 | ) | 1995 | 05/22/14 | 15 to 30 Years | ||||||||||||||||||||
| Youngstown, OH | (a) | 1,560 | 557 | — | — | 1,560 | 557 | 2,117 | (268 | ) | 1985 | 02/06/07 | 15 to 30 Years | ||||||||||||||||||||
| Zanesville, OH | (c) | 1,088 | 2,218 | — | — | 1,088 | 2,218 | 3,306 | — | 1992 | 12/22/16 | 11 to 30 Years | |||||||||||||||||||||
| Restaurants - Quick Service | |||||||||||||||||||||||||||||||||
| Aberdeen, NC | (a) | 564 | 338 | — | — | 564 | 338 | 902 | (51 | ) | 1994 | 09/17/13 | 15 to 30 Years | ||||||||||||||||||||
| Abilene, TX | (c) | 198 | 311 | — | — | 198 | 311 | 509 | (60 | ) | 1975 | 07/17/13 | 10 to 26 Years | ||||||||||||||||||||
| Abilene, TX | (c) | 1,132 | 1,292 | — | — | 1,132 | 1,292 | 2,424 | (31 | ) | 1979 | 06/30/16 | 5 to 30 Years | ||||||||||||||||||||
| Abilene, TX | (c) | 510 | 818 | — | — | 510 | 818 | 1,328 | (20 | ) | 1977 | 06/30/16 | 5 to 30 Years | ||||||||||||||||||||
| Adairsville, GA | (a) | 557 | 318 | — | — | 557 | 318 | 875 | (177 | ) | 1986 | 09/29/06 | 15 to 20 Years | ||||||||||||||||||||
| Akron, OH | (a) | 247 | 198 | — | — | 247 | 198 | 445 | (137 | ) | 1971 | 05/25/05 | 15 to 20 Years | ||||||||||||||||||||
| Akron, OH | (a) | 218 | 273 | — | — | 218 | 273 | 491 | (165 | ) | 1976 | 05/25/05 | 15 to 20 Years | ||||||||||||||||||||
| Initial Cost to Company | Cost Capitalized Subsequent to Acquisition including impairment | Gross Amount at December 31, | Life in which depreciation in latest Statement of Operations is computed | ||||||||||||||||||||||
| Description | Encumbrances | Land and Improvements | Buildings and Improvements | Improvements/ Land | Improvements/ building | Land and Improvements | Buildings and Improvements | Total | Final Accum | Date of Construction | Date Acquired | ||||||||||||||
| Orange City, FL | (a) | 409 | 694 | — | — | 409 | 694 | 1,103 | (346 | ) | 1984 | 09/24/04 | 11 to 20 years | |||||||||||||||||||||
| Orlando, FL | (a) | 2,006 | 571 | — | — | 2,006 | 571 | 2,577 | (231 | ) | 2002 | 12/31/07 | 15 to 40 years | |||||||||||||||||||||
| Ottawa, KS | (a) | 348 | 816 | — | — | 348 | 816 | 1,164 | (21 | ) | 1987 | 06/04/14 | 15 to 30 Years | |||||||||||||||||||||
| Overland Park, KS | (a) | 2,549 | 3,219 | — | — | 2,549 | 3,219 | 5,768 | (87 | ) | 1983 | 05/15/14 | 15 to 30 Years | |||||||||||||||||||||
| Overland Park, KS | (a) | 953 | 886 | — | — | 953 | 886 | 1,839 | (71 | ) | 1989 | 08/22/13 | 15 to 20 Years | |||||||||||||||||||||
| Owensboro, KY | (a) | 250 | 502 | — | — | 250 | 502 | 752 | (124 | ) | 2000 | 06/25/04 | 30 to 30 years | |||||||||||||||||||||
| Oxford, AL | (b) | 489 | 1,212 | — | — | 489 | 1,212 | 1,701 | — | 1991 | 12/23/14 | 15 to 30 Years | ||||||||||||||||||||||
| Paducah, KY | (a) | 1,508 | 959 | — | — | 1,508 | 959 | 2,467 | (467 | ) | 1984 | 02/26/07 | 14 to 30 years | |||||||||||||||||||||
| Pana, IL | (a) | 168 | 128 | — | — | 168 | 128 | 296 | (117 | ) | 1985 | 09/23/05 | 10 to 15 years | |||||||||||||||||||||
| Paris, TX | 1,790 | 552 | 1,821 | — | — | 552 | 1,821 | 2,373 | (100 | ) | 1999 | 07/17/13 | 11 to 35 Years | |||||||||||||||||||||
| Pasadena, TX | (a) | 847 | 832 | — | — | 847 | 832 | 1,679 | (687 | ) | 1973 | 12/30/04 | 10 to 15 years | |||||||||||||||||||||
| Pasadena, TX | (a) | 810 | 739 | — | — | 810 | 739 | 1,549 | (621 | ) | 1977 | 12/30/04 | 10 to 15 years | |||||||||||||||||||||
| Pelham, AL | (a) | 605 | 922 | — | 57 | 605 | 979 | 1,584 | (79 | ) | 1998 | 03/29/13 | 8 to 29 Years | |||||||||||||||||||||
| Phoenix, AZ | (a) | 787 | 663 | — | — | 787 | 663 | 1,450 | (121 | ) | 1964 | 10/28/11 | 14 to 29 years | |||||||||||||||||||||
| Picayune, MS | (a) | 1,250 | 1,409 | — | — | 1,250 | 1,409 | 2,659 | (107 | ) | 1999 | 07/17/13 | 7 to 29 Years | |||||||||||||||||||||
| Pico Rivera, CA | (a) | 2,785 | 3,126 | — | — | 2,785 | 3,126 | 5,911 | — | 2014 | 12/19/14 | 15 to 40 Years | ||||||||||||||||||||||
| Pittsburgh, PA | (a) | 1,289 | 1,871 | — | — | 1,289 | 1,871 | 3,160 | (592 | ) | 1992 | 06/25/04 | 15 to 30 years | |||||||||||||||||||||
| Pittsburgh, PA | (a) | 1,481 | 676 | — | — | 1,481 | 676 | 2,157 | (276 | ) | 2006 | 12/31/07 | 15 to 40 years | |||||||||||||||||||||
| Plano, TX | (a) | 2,418 | 1,529 | — | — | 2,418 | 1,529 | 3,947 | (478 | ) | 1998 | 06/29/07 | 15 to 40 years | |||||||||||||||||||||
| Port Richey, FL | (b) | 774 | 1,579 | — | — | 774 | 1,579 | 2,353 | — | 1994 | 12/23/14 | 15 to 30 Years | ||||||||||||||||||||||
| Powell, TN | (a) | 252 | 377 | — | 176 | 252 | 553 | 805 | (179 | ) | 1982 | 11/02/07 | 15 to 30 years | |||||||||||||||||||||
| Princeton, WV | (a) | 948 | 2,212 | — | — | 948 | 2,212 | 3,160 | (173 | ) | 2001 | 07/17/13 | 11 to 25 Years | |||||||||||||||||||||
| Queen Creek, AZ | (b) | 609 | 1,159 | — | — | 609 | 1,159 | 1,768 | (72 | ) | 2004 | 06/14/13 | 15 to 40 Years | |||||||||||||||||||||
| Rapid City, SD | (a) | 878 | 1,657 | — | — | 878 | 1,657 | 2,535 | (649 | ) | 1902 | 12/29/06 | 15 to 20 years | |||||||||||||||||||||
| Rawlins, WY | (a) | 25 | 406 | — | — | 25 | 406 | 431 | (171 | ) | 1958 | 12/29/06 | 15 to 20 years | |||||||||||||||||||||
| Redding, CA | (b) | 1,406 | 1,854 | — | — | 1,406 | 1,854 | 3,260 | — | 1991 | 12/23/14 | 15 to 30 Years | ||||||||||||||||||||||
| Reston, VA | (a) | 1,033 | 193 | — | — | 1,033 | 193 | 1,226 | (110 | ) | 1977 | 11/27/06 | 15 to 20 years | |||||||||||||||||||||
| Richmond, VA | (a) | 1,253 | 1,410 | — | 29 | 1,253 | 1,439 | 2,692 | (411 | ) | 1977 | 11/28/06 | 15 to 30 years | |||||||||||||||||||||
| Ringgold, GA | (a) | 387 | 374 | — | — | 387 | 374 | 761 | (138 | ) | 1990 | 11/02/07 | 15 to 30 years | |||||||||||||||||||||
| Rio Grande City, TX | (a) | 634 | 1,364 | — | — | 634 | 1,364 | 1,998 | (372 | ) | 1999 | 04/01/05 | 15 to 40 years | |||||||||||||||||||||
| Riverside, CA | (a) | 1,988 | 1,211 | — | — | 1,988 | 1,211 | 3,199 | — | 2002 | 12/19/14 | 15 to 30 Years | ||||||||||||||||||||||
| Roanoke, VA | (a) | 1,362 | 1,836 | — | — | 1,362 | 1,836 | 3,198 | (96 | ) | 1996 | 08/21/13 | 15 to 30 Years | |||||||||||||||||||||
| Rock Falls, IL | (a) | 314 | 631 | — | — | 314 | 631 | 945 | (231 | ) | 1995 | 09/23/05 | 15 to 30 years | |||||||||||||||||||||
| Salem, IL | (a) | 271 | 218 | — | — | 271 | 218 | 489 | (89 | ) | 2000 | 07/28/04 | 15 to 30 years | |||||||||||||||||||||
| Salina, KS | (b) | 764 | 1,100 | — | — | 764 | 1,100 | 1,864 | — | 1994 | 12/23/14 | 15 to 30 Years | ||||||||||||||||||||||
| San Antonio, TX | (a) | 1,204 | — | — | 519 | 1,204 | 519 | 1,723 | (13 | ) | (g) | 09/26/13 | 12 to 12 Years | |||||||||||||||||||||
| Santa Ana, CA | (a) | 2,112 | 1,501 | — | — | 2,112 | 1,501 | 3,613 | — | 1976 | 12/19/14 | 15 to 30 Years | ||||||||||||||||||||||
| Santa Fe, NM | (c ) | 2,120 | 2,033 | — | — | 2,120 | 2,033 | 4,153 | (98 | ) | 1997 | 07/17/13 | 13 to 40 Years | |||||||||||||||||||||
| Akron, OH | (a) | 310 | 394 | — | — | 310 | 394 | 704 | (233 | ) | 1982 | 05/25/05 | 15 to 20 Years | ||||||||||||||||||||
| Alamo, TX | (c) | 1,745 | 715 | — | — | 1,745 | 715 | 2,460 | (87 | ) | 1984 | 07/17/13 | 9 to 35 Years | ||||||||||||||||||||
| Albermarle, NC | (a) | 639 | 310 | — | — | 639 | 310 | 949 | (50 | ) | 1993 | 09/17/13 | 15 to 30 Years | ||||||||||||||||||||
| Albuquerque, NM | (c) | 265 | 575 | — | — | 265 | 575 | 840 | (121 | ) | 1980 | 07/17/13 | 11 to 26 Years | ||||||||||||||||||||
| Albuquerque, NM | (c) | 466 | 591 | — | — | 466 | 591 | 1,057 | (94 | ) | 1976 | 07/17/13 | 11 to 35 Years | ||||||||||||||||||||
| Albuquerque, NM | (c) | 267 | 439 | — | — | 267 | 439 | 706 | (104 | ) | 1975 | 07/17/13 | 11 to 25 Years | ||||||||||||||||||||
| Albuquerque, NM | (c) | 293 | 300 | — | — | 293 | 300 | 593 | (89 | ) | 1976 | 07/17/13 | 11 to 25 Years | ||||||||||||||||||||
| Altus, OK | (c) | 70 | 413 | — | — | 70 | 413 | 483 | (75 | ) | 1980 | 07/17/13 | 7 to 25 Years | ||||||||||||||||||||
| Altus, OK | (a) | 103 | 237 | — | — | 103 | 237 | 340 | (50 | ) | 2007 | 07/17/13 | 4 to 28 Years | ||||||||||||||||||||
| Amarillo, TX | (a) | 538 | 615 | — | — | 538 | 615 | 1,153 | (33 | ) | 1985 | 12/29/15 | 15 to 30 Years | ||||||||||||||||||||
| Americus, GA | (c) | 282 | 406 | — | — | 282 | 406 | 688 | (98 | ) | 1978 | 07/17/13 | 11 to 23 Years | ||||||||||||||||||||
| Anderson, IN | (a) | 363 | 700 | — | — | 363 | 700 | 1,063 | (183 | ) | 1995 | 07/17/13 | 8 to 17 Years | ||||||||||||||||||||
| Apopka, FL | (a) | 1,038 | 482 | — | — | 1,038 | 482 | 1,520 | (581 | ) | 1977 | 06/25/04 | 10 to 15 Years | ||||||||||||||||||||
| Arlington, TX | (c) | 449 | 128 | — | — | 449 | 128 | 577 | (10 | ) | 1978 | 06/30/16 | 5 to 10 Years | ||||||||||||||||||||
| Arlington, TX | (c) | 540 | 1,205 | — | — | 540 | 1,205 | 1,745 | (26 | ) | 1981 | 06/30/16 | 5 to 30 Years | ||||||||||||||||||||
| Artesia, NM | (a) | 435 | 1,106 | — | — | 435 | 1,106 | 1,541 | (139 | ) | 1984 | 04/16/14 | 15 to 30 Years | ||||||||||||||||||||
| Atlanta, GA | (a) | 513 | 483 | — | — | 513 | 483 | 996 | (101 | ) | 2002 | 02/02/12 | 15 to 30 Years | ||||||||||||||||||||
| Atlanta, GA | (c) | 336 | 346 | — | — | 336 | 346 | 682 | (102 | ) | 1981 | 07/17/13 | 11 to 22 Years | ||||||||||||||||||||
| Atlanta, GA | (c) | 554 | 258 | — | — | 554 | 258 | 812 | (84 | ) | 1980 | 07/17/13 | 11 to 23 Years | ||||||||||||||||||||
| Atlanta, GA | (c) | 683 | 5 | — | — | 683 | 5 | 688 | (49 | ) | 1975 | 07/17/13 | 11 to 23 Years | ||||||||||||||||||||
| Atlanta, GA | (c) | 394 | 268 | — | — | 394 | 268 | 662 | (105 | ) | 1975 | 07/17/13 | 11 to 16 Years | ||||||||||||||||||||
| Atlanta, GA | (a) | 309 | 867 | — | — | 309 | 867 | 1,176 | (111 | ) | 1994 | 12/24/13 | 15 to 30 Years | ||||||||||||||||||||
| Auburn, CA | (a) | 579 | 299 | — | — | 579 | 299 | 878 | (140 | ) | 1992 | 12/29/06 | 15 to 30 Years | ||||||||||||||||||||
| Aurora, IL | (a) | 286 | 726 | — | — | 286 | 726 | 1,012 | (344 | ) | 1998 | 12/29/06 | 15 to 30 Years | ||||||||||||||||||||
| Austell, GA | (a) | 838 | 216 | — | — | 838 | 216 | 1,054 | (218 | ) | 1962 | 02/28/06 | 15 to 20 Years | ||||||||||||||||||||
| Austin, TX | (c) | 531 | 794 | — | — | 531 | 794 | 1,325 | (106 | ) | 1967 | 07/17/13 | 11 to 32 Years | ||||||||||||||||||||
| Austin, TX | (c) | 904 | 477 | — | — | 904 | 477 | 1,381 | (68 | ) | 1976 | 07/17/13 | 11 to 35 Years | ||||||||||||||||||||
| Austin, TX | (c) | 418 | 872 | — | — | 418 | 872 | 1,290 | (109 | ) | 1986 | 07/17/13 | 11 to 35 Years | ||||||||||||||||||||
| Austin, TX | (c) | 689 | 634 | — | — | 689 | 634 | 1,323 | (108 | ) | 2003 | 07/17/13 | 11 to 35 Years | ||||||||||||||||||||
| Balch Springs, TX | (c) | 329 | 576 | — | — | 329 | 576 | 905 | (114 | ) | 1986 | 07/17/13 | 11 to 31 Years | ||||||||||||||||||||
| Bartlett, TN | (a) | 411 | — | — | — | 411 | — | 411 | — | (f) | 10/30/13 | (f) | |||||||||||||||||||||
| Bartonville, IL | (a) | 410 | 856 | — | — | 410 | 856 | 1,266 | (178 | ) | 1980 | 12/21/12 | 15 to 30 Years | ||||||||||||||||||||
| Baton Rouge, LA | (a) | 565 | 286 | — | — | 565 | 286 | 851 | (227 | ) | 1991 | 06/25/04 | 15 to 20 Years | ||||||||||||||||||||
| Initial Cost to Company | Cost Capitalized Subsequent to Acquisition including impairment | Gross Amount at December 31, | Life in which depreciation in latest Statement of Operations is computed | ||||||||||||||||||||||
| Description | Encumbrances | Land and Improvements | Buildings and Improvements | Improvements/ Land | Improvements/ building | Land and Improvements | Buildings and Improvements | Total | Final Accum | Date of Construction | Date Acquired | ||||||||||||||
| Sarasota, FL | (a) | 2,758 | 412 | — | — | 2,758 | 412 | 3,170 | (56 | ) | 2000 | 07/17/13 | 12 to 25 Years | |||||||||||||||||||||
| Sauk Centre, MN | (a) | 219 | 138 | — | — | 219 | 138 | 357 | (82 | ) | 1979 | 05/24/05 | 15 to 20 years | |||||||||||||||||||||
| Sauk Rapids, MN | (a) | 240 | 126 | — | — | 240 | 126 | 366 | (67 | ) | 1978 | 05/24/05 | 15 to 20 years | |||||||||||||||||||||
| Savannah, GA | (c ) | 1,112 | 1,727 | — | — | 1,112 | 1,727 | 2,839 | (86 | ) | 1993 | 07/17/13 | 13 to 40 Years | |||||||||||||||||||||
| Shawnee, OK | (a) | 621 | 1,399 | — | — | 621 | 1,399 | 2,020 | (56 | ) | 1993 | 12/30/13 | 15 to 30 Years | |||||||||||||||||||||
| Shelbyville, IN | (b) | 549 | 752 | — | — | 549 | 752 | 1,301 | (201 | ) | 2006 | 12/21/07 | 15 to 50 years | |||||||||||||||||||||
| Sherman, TX | (a) | 1,013 | 1,286 | — | — | 1,013 | 1,286 | 2,299 | (610 | ) | 1994 | 02/26/07 | 14 to 30 years | |||||||||||||||||||||
| Shreveport, LA | (a) | 759 | 964 | — | — | 759 | 964 | 1,723 | (446 | ) | 1964 | 02/26/07 | 14 to 20 years | |||||||||||||||||||||
| Silver Spring, MD | (a) | 1,008 | 251 | — | — | 1,008 | 251 | 1,259 | (144 | ) | 1983 | 11/27/06 | 15 to 20 years | |||||||||||||||||||||
| Sioux Falls, SD | (a) | 639 | 206 | — | — | 639 | 206 | 845 | (10 | ) | 1994 | 12/24/13 | 15 to 30 Years | |||||||||||||||||||||
| Soddy Daisy, TN | (a) | 316 | 405 | — | — | 316 | 405 | 721 | (151 | ) | 1989 | 11/02/07 | 15 to 30 years | |||||||||||||||||||||
| Springfield, IL | (a) | 1,115 | 772 | — | — | 1,115 | 772 | 1,887 | (283 | ) | 1996 | 12/31/07 | 15 to 40 years | |||||||||||||||||||||
| Springfield, MO | (a) | 1,655 | 1,467 | — | — | 1,655 | 1,467 | 3,122 | (609 | ) | 1993 | 09/23/05 | 15 to 30 years | |||||||||||||||||||||
| Stillwater, OK | (a) | 647 | 687 | — | — | 647 | 687 | 1,334 | (19 | ) | 1991 | 06/04/14 | 15 to 30 Years | |||||||||||||||||||||
| Stillwater, OK | (b) | 611 | 1,447 | — | — | 611 | 1,447 | 2,058 | — | 1995 | 12/23/14 | 15 to 30 Years | ||||||||||||||||||||||
| Sweetwater, TN | (a) | 231 | 307 | — | — | 231 | 307 | 538 | (121 | ) | 1979 | 11/02/07 | 15 to 30 years | |||||||||||||||||||||
| Syracuse, NY | (b) | 734 | 1,518 | — | — | 734 | 1,518 | 2,252 | — | 1981 | 12/23/14 | 15 to 30 Years | ||||||||||||||||||||||
| Taylorville, IL | (a) | 154 | 352 | — | — | 154 | 352 | 506 | (281 | ) | 1980 | 09/23/05 | 10 to 15 years | |||||||||||||||||||||
| Thornton, CO | (a) | 943 | 128 | — | — | 943 | 128 | 1,071 | (7 | ) | 1996 | 12/24/13 | 15 to 30 Years | |||||||||||||||||||||
| Thurmont, MD | (a) | 857 | 307 | — | 68 | 857 | 375 | 1,232 | (163 | ) | 1985 | 11/27/06 | 15 to 20 years | |||||||||||||||||||||
| Tifton, GA | (b) | 642 | 1,009 | — | — | 642 | 1,009 | 1,651 | — | 1995 | 12/23/14 | 15 to 40 Years | ||||||||||||||||||||||
| Tilton, NH | (c ) | 1,565 | — | — | — | 1,565 | — | 1,565 | — | (g) | 07/17/13 | 23 to 23 Years | ||||||||||||||||||||||
| Tipton, IA | (a) | 240 | 408 | — | — | 240 | 408 | 648 | (382 | ) | 1991 | 09/23/05 | 10 to 15 years | |||||||||||||||||||||
| Titusville, PA | (a) | 247 | 438 | — | — | 247 | 438 | 685 | (161 | ) | 1976 | 02/06/07 | 11 to 26 years | |||||||||||||||||||||
| Topeka, KS | (a) | 1,224 | 905 | — | — | 1,224 | 905 | 2,129 | (30 | ) | 1988 | 06/04/14 | 15 to 30 Years | |||||||||||||||||||||
| Torrance, CA | (a) | 3,509 | 2,754 | — | — | 3,509 | 2,754 | 6,263 | — | 1998 | 12/19/14 | 15 to 40 Years | ||||||||||||||||||||||
| Trenton, GA | (a) | 300 | 227 | — | — | 300 | 227 | 527 | (111 | ) | 1991 | 11/02/07 | 15 to 30 years | |||||||||||||||||||||
| Trussville, AL | (c ) | 1,222 | 1,770 | — | — | 1,222 | 1,770 | 2,992 | (99 | ) | 2007 | 07/17/13 | 12 to 38 Years | |||||||||||||||||||||
| Trussville, AL | (a) | 796 | 256 | — | — | 796 | 256 | 1,052 | (17 | ) | 1998 | 12/24/13 | 15 to 30 Years | |||||||||||||||||||||
| Trussville, AL | (a) | 909 | 892 | — | 57 | 909 | 949 | 1,858 | (86 | ) | 2000 | 03/29/13 | 8 to 29 Years | |||||||||||||||||||||
| Tullahoma, TN | (b) | 520 | 886 | — | — | 520 | 886 | 1,406 | — | 1996 | 12/23/14 | 15 to 40 Years | ||||||||||||||||||||||
| Tulsa, OK | (a) | 1,465 | 1,728 | — | — | 1,465 | 1,728 | 3,193 | (34 | ) | 2013 | 07/21/14 | 14 to 30 Years | |||||||||||||||||||||
| Tulsa, OK | (a) | 983 | 1,232 | — | — | 983 | 1,232 | 2,215 | (515 | ) | 1976 | 02/26/07 | 14 to 30 years | |||||||||||||||||||||
| Tulsa, OK | (a) | 1,540 | 1,997 | — | — | 1,540 | 1,997 | 3,537 | (572 | ) | 2002 | 07/02/07 | 15 to 40 years | |||||||||||||||||||||
| Tupelo, MS | (a) | 1,131 | 1,175 | — | — | 1,131 | 1,175 | 2,306 | (101 | ) | 1995 | 07/17/13 | 7 to 26 Years | |||||||||||||||||||||
| Two Harbors, MN | (a) | 136 | 248 | — | — | 136 | 248 | 384 | (68 | ) | 1984 | 05/24/05 | 15 to 30 years | |||||||||||||||||||||
| Union Gap, WA | (c ) | 522 | 2,218 | — | — | 522 | 2,218 | 2,740 | (91 | ) | 2004 | 07/17/13 | 13 to 40 Years | |||||||||||||||||||||
| Baton Rouge, LA | (a) | 594 | 417 | — | — | 594 | 417 | 1,011 | (299 | ) | 1979 | 06/25/04 | 15 to 20 Years | ||||||||||||||||||||
| Baton Rouge, LA | (a) | 391 | 599 | — | — | 391 | 599 | 990 | (355 | ) | 1980 | 09/24/04 | 15 to 20 Years | ||||||||||||||||||||
| Baton Rouge, LA | (a) | 747 | 558 | — | — | 747 | 558 | 1,305 | (401 | ) | 1984 | 09/24/04 | 15 to 20 Years | ||||||||||||||||||||
| Baton Rouge, LA | (a) | 472 | 642 | — | — | 472 | 642 | 1,114 | (289 | ) | 1987 | 09/24/04 | 15 to 30 Years | ||||||||||||||||||||
| Bay Minette, AL | (a) | 583 | 754 | — | — | 583 | 754 | 1,337 | (90 | ) | 2000 | 09/22/14 | 15 to 30 Years | ||||||||||||||||||||
| Beaumont, TX | (c) | 581 | 284 | — | — | 581 | 284 | 865 | (45 | ) | 2001 | 08/31/15 | 15 to 20 Years | ||||||||||||||||||||
| Beaumont, TX | (c) | 777 | 246 | — | — | 777 | 246 | 1,023 | (46 | ) | 2000 | 08/31/15 | 15 to 20 Years | ||||||||||||||||||||
| Beaumont, TX | (c) | 758 | 325 | — | — | 758 | 325 | 1,083 | (49 | ) | 2007 | 08/31/15 | 15 to 30 Years | ||||||||||||||||||||
| Bedford, TX | (c) | 694 | 516 | — | — | 694 | 516 | 1,210 | (19 | ) | 1977 | 06/30/16 | 5 to 20 Years | ||||||||||||||||||||
| Beeville, TX | (c) | 120 | 488 | — | — | 120 | 488 | 608 | (95 | ) | 1972 | 07/17/13 | 9 to 25 Years | ||||||||||||||||||||
| Bellefontaine, OH | (a) | 388 | 778 | (12 | ) | — | 376 | 778 | 1,154 | (433 | ) | 1989 | 12/29/06 | 15 to 20 Years | |||||||||||||||||||
| Bentonville, AR | (a) | 635 | 900 | — | — | 635 | 900 | 1,535 | (396 | ) | 2004 | 07/07/05 | 15 to 30 Years | ||||||||||||||||||||
| Birmingham, AL | (c) | 192 | 656 | — | — | 192 | 656 | 848 | (150 | ) | 1981 | 07/17/13 | 7 to 19 Years | ||||||||||||||||||||
| Birmingham, AL | (c) | 120 | 151 | — | — | 120 | 151 | 271 | (56 | ) | 1970 | 07/17/13 | 6 to 15 Years | ||||||||||||||||||||
| Birmingham, AL | (c) | 119 | 158 | — | — | 119 | 158 | 277 | (54 | ) | 1970 | 07/17/13 | 5 to 15 Years | ||||||||||||||||||||
| Birmingham, AL | (c) | 107 | 508 | — | — | 107 | 508 | 615 | (111 | ) | 1983 | 07/17/13 | 7 to 19 Years | ||||||||||||||||||||
| Birmingham, AL | (c) | 131 | 526 | — | — | 131 | 526 | 657 | (119 | ) | 1984 | 07/17/13 | 7 to 19 Years | ||||||||||||||||||||
| Bloomsburg, PA | (c) | 698 | 823 | — | — | 698 | 823 | 1,521 | (80 | ) | 1993 | 11/18/14 | 15 to 30 Years | ||||||||||||||||||||
| Blue Springs, MO | (c) | 688 | 119 | 101 | (119 | ) | 789 | — | 789 | — | (f) | 08/27/09 | (f) | ||||||||||||||||||||
| Bolingbrook, IL | (a) | 762 | 821 | — | — | 762 | 821 | 1,583 | (488 | ) | 1994 | 09/23/05 | 15 to 20 Years | ||||||||||||||||||||
| Boone, NC | (a) | 750 | 379 | — | — | 750 | 379 | 1,129 | (213 | ) | 2006 | 12/29/06 | 15 to 30 Years | ||||||||||||||||||||
| Bowling Green, KY | (c) | 756 | 205 | — | — | 756 | 205 | 961 | (65 | ) | 2007 | 07/17/13 | 4 to 39 Years | ||||||||||||||||||||
| Brazil, IN | (a) | 391 | 903 | — | — | 391 | 903 | 1,294 | (142 | ) | 1996 | 07/17/13 | 8 to 33 Years | ||||||||||||||||||||
| Bristol, TN | (a) | 484 | 134 | — | — | 484 | 134 | 618 | (223 | ) | 1991 | 07/01/05 | 15 to 20 Years | ||||||||||||||||||||
| Bristol, TN | (a) | 474 | 282 | — | — | 474 | 282 | 756 | (143 | ) | 1985 | 12/21/12 | 10 to 15 Years | ||||||||||||||||||||
| Bristol, VA | (a) | 492 | 366 | — | — | 492 | 366 | 858 | (136 | ) | 1982 | 12/21/12 | 15 to 20 Years | ||||||||||||||||||||
| Bristol, VA | (a) | 369 | 564 | — | — | 369 | 564 | 933 | (152 | ) | 1991 | 12/21/12 | 15 to 20 Years | ||||||||||||||||||||
| Broken Arrow, OK | (c) | 849 | 1,020 | — | — | 849 | 1,020 | 1,869 | (26 | ) | 1986 | 06/30/16 | 5 to 30 Years | ||||||||||||||||||||
| Brownsville, TX | (c) | 795 | 556 | — | — | 795 | 556 | 1,351 | (72 | ) | 1977 | 07/17/13 | 10 to 35 Years | ||||||||||||||||||||
| Brownsville, TX | (c) | 667 | 785 | — | — | 667 | 785 | 1,452 | (100 | ) | 1985 | 07/17/13 | 10 to 35 Years | ||||||||||||||||||||
| Brownsville, TX | (c) | 369 | 679 | — | — | 369 | 679 | 1,048 | (97 | ) | 1972 | 07/17/13 | 11 to 35 Years | ||||||||||||||||||||
| Brownsville, TX | (c) | 267 | 652 | — | — | 267 | 652 | 919 | (81 | ) | 2000 | 07/17/13 | 10 to 35 Years | ||||||||||||||||||||
| Brownsville, TX | (c) | 430 | 656 | — | — | 430 | 656 | 1,086 | (133 | ) | 1985 | 07/17/13 | 11 to 29 Years | ||||||||||||||||||||
| Brownsville, TX | (c) | 571 | 930 | — | — | 571 | 930 | 1,501 | (140 | ) | 2002 | 07/17/13 | 11 to 35 Years | ||||||||||||||||||||
| Initial Cost to Company | Cost Capitalized Subsequent to Acquisition including impairment | Gross Amount at December 31, | Life in which depreciation in latest Statement of Operations is computed | ||||||||||||||||||||||
| Description | Encumbrances | Land and Improvements | Buildings and Improvements | Improvements/ Land | Improvements/ building | Land and Improvements | Buildings and Improvements | Total | Final Accum | Date of Construction | Date Acquired | ||||||||||||||
| Upper Marlboro, MD | (a) | 290 | 172 | — | — | 290 | 172 | 462 | (108 | ) | 1983 | 11/27/06 | 15 to 20 years | |||||||||||||||||||||
| Vandalia, IL | (a) | 409 | 202 | — | — | 409 | 202 | 611 | (261 | ) | 1977 | 09/23/05 | 10 to 15 years | |||||||||||||||||||||
| Villa Rica, GA | (a) | 807 | 629 | — | — | 807 | 629 | 1,436 | (250 | ) | 1999 | 02/28/06 | 15 to 30 years | |||||||||||||||||||||
| Vinton, IA | (a) | 121 | 114 | — | — | 121 | 114 | 235 | (132 | ) | 1978 | 09/23/05 | 10 to 15 years | |||||||||||||||||||||
| Walkersville, MD | (a) | 381 | 238 | — | 68 | 381 | 306 | 687 | (118 | ) | 1985 | 11/27/06 | 15 to 20 years | |||||||||||||||||||||
| Walla Walla, WA | (c ) | 665 | 2,072 | — | — | 665 | 2,072 | 2,737 | (115 | ) | 2005 | 07/17/13 | 11 to 35 Years | |||||||||||||||||||||
| Warner Robins, GA | (c ) | 1,228 | 1,714 | — | — | 1,228 | 1,714 | 2,942 | (88 | ) | 1994 | 07/17/13 | 11 to 40 Years | |||||||||||||||||||||
| Warren, OH | (a) | 973 | 640 | — | — | 973 | 640 | 1,613 | (231 | ) | 1999 | 02/06/07 | 15 to 30 years | |||||||||||||||||||||
| Warren, PA | (a) | 383 | 427 | — | — | 383 | 427 | 810 | (185 | ) | 1970 | 02/06/07 | 15 to 30 years | |||||||||||||||||||||
| Warrenton, VA | (a) | 378 | 254 | — | — | 378 | 254 | 632 | (134 | ) | 1985 | 12/19/06 | 15 to 20 years | |||||||||||||||||||||
| Warwick, RI | (a) | 1,593 | 1,314 | — | — | 1,593 | 1,314 | 2,907 | (421 | ) | 1990 | 12/31/07 | 15 to 40 years | |||||||||||||||||||||
| Weslaco, TX | (a) | 900 | 2,306 | — | — | 900 | 2,306 | 3,206 | (572 | ) | 2001 | 04/01/05 | 15 to 40 years | |||||||||||||||||||||
| Whittier, CA | (a) | 1,439 | 1,874 | — | — | 1,439 | 1,874 | 3,313 | — | 1991 | 12/19/14 | 15 to 40 Years | ||||||||||||||||||||||
| Wichita Falls, TX | (a) | 851 | 1,077 | — | — | 851 | 1,077 | 1,928 | (692 | ) | 1976 | 02/26/07 | 14 to 20 years | |||||||||||||||||||||
| Winfield, KS | (a) | 239 | 866 | — | — | 239 | 866 | 1,105 | (23 | ) | 1998 | 06/04/14 | 15 to 30 Years | |||||||||||||||||||||
| Woodbury, MN | (a) | 3,165 | 1,707 | — | — | 3,165 | 1,707 | 4,872 | (54 | ) | 1995 | 05/22/14 | 15 to 30 Years | |||||||||||||||||||||
| Woodbury, MN | (a) | 555 | 411 | — | — | 555 | 411 | 966 | (134 | ) | 1987 | 05/24/05 | 15 to 30 years | |||||||||||||||||||||
| Youngstown, OH | (a) | 1,560 | 557 | — | — | 1,560 | 557 | 2,117 | (211 | ) | 1985 | 02/06/07 | 15 to 30 years | |||||||||||||||||||||
| Yukon, OK | (a) | 555 | 373 | — | — | 555 | 373 | 928 | (186 | ) | 2003 | 09/30/04 | 15 to 30 years | |||||||||||||||||||||
| Brunswick, GA | (a) | 774 | 614 | — | — | 774 | 614 | 1,388 | (371 | ) | 1999 | 09/24/04 | 15 to 20 Years | ||||||||||||||||||||
| Bryan, TX | (c) | 441 | 766 | — | — | 441 | 766 | 1,207 | (90 | ) | 1972 | 07/17/13 | 10 to 35 Years | ||||||||||||||||||||
| Buckhannon, WV | (a) | 438 | 529 | — | — | 438 | 529 | 967 | (142 | ) | 1978 | 12/21/12 | 15 to 20 Years | ||||||||||||||||||||
| Buffalo, NY | (a) | 737 | 629 | — | — | 737 | 629 | 1,366 | (244 | ) | 1993 | 11/10/05 | 15 to 30 Years | ||||||||||||||||||||
| Buffalo, NY | (a) | 821 | 694 | — | — | 821 | 694 | 1,515 | (273 | ) | 1976 | 11/10/05 | 15 to 30 Years | ||||||||||||||||||||
| Calhoun, GA | (a) | 503 | 713 | — | — | 503 | 713 | 1,216 | (149 | ) | 1988 | 02/02/12 | 15 to 30 Years | ||||||||||||||||||||
| Canton, OH | (a) | 215 | 483 | — | — | 215 | 483 | 698 | (251 | ) | 1974 | 05/25/05 | 15 to 20 Years | ||||||||||||||||||||
| Carrollton, GA | (a) | 508 | 603 | — | — | 508 | 603 | 1,111 | (233 | ) | 2000 | 02/28/06 | 15 to 40 Years | ||||||||||||||||||||
| Carrollton, GA | (a) | 613 | 503 | — | — | 613 | 503 | 1,116 | (144 | ) | 1988 | 02/02/12 | 15 to 20 Years | ||||||||||||||||||||
| Carrollton, KY | (a) | 229 | 730 | — | — | 229 | 730 | 959 | (294 | ) | 1990 | 06/30/09 | 13 to 28 Years | ||||||||||||||||||||
| Carrolton, TX | (c) | 361 | 415 | — | — | 361 | 415 | 776 | (99 | ) | 1997 | 07/17/13 | 11 to 25 Years | ||||||||||||||||||||
| Cartersville, GA | (a) | 581 | 730 | — | — | 581 | 730 | 1,311 | (343 | ) | 1997 | 02/28/06 | 15 to 30 Years | ||||||||||||||||||||
| Cartersville, GA | (a) | 439 | 451 | — | — | 439 | 451 | 890 | (252 | ) | 1990 | 02/28/06 | 15 to 30 Years | ||||||||||||||||||||
| Cedar Hill, TX | (a) | 620 | 501 | — | — | 620 | 501 | 1,121 | (274 | ) | 2005 | 12/29/06 | 15 to 30 Years | ||||||||||||||||||||
| Celina, TX | (c) | 411 | 199 | — | — | 411 | 199 | 610 | (12 | ) | 2003 | 07/25/16 | 13 to 20 Years | ||||||||||||||||||||
| Champlin, MN | (c) | 710 | 408 | — | — | 710 | 408 | 1,118 | (61 | ) | 2004 | 03/20/15 | 8 to 20 Years | ||||||||||||||||||||
| Chattanooga, TN | (a) | 482 | 682 | — | — | 482 | 682 | 1,164 | (327 | ) | 1997 | 06/25/04 | 15 to 30 Years | ||||||||||||||||||||
| Chattanooga, TN | (a) | 600 | 389 | — | — | 600 | 389 | 989 | (176 | ) | 1995 | 09/29/06 | 15 to 30 Years | ||||||||||||||||||||
| Chattanooga, TN | (c) | 175 | 271 | — | — | 175 | 271 | 446 | (59 | ) | 2007 | 07/17/13 | 3 to 26 Years | ||||||||||||||||||||
| Cheektowaga, NY | (a) | 561 | 549 | — | — | 561 | 549 | 1,110 | (231 | ) | 1985 | 11/10/05 | 15 to 30 Years | ||||||||||||||||||||
| Chicago, IL | (a) | 313 | 275 | — | — | 313 | 275 | 588 | (154 | ) | 1982 | 05/25/05 | 15 to 20 Years | ||||||||||||||||||||
| Chicago, IL | (a) | 340 | 220 | — | — | 340 | 220 | 560 | (144 | ) | 1975 | 05/25/05 | 15 to 20 Years | ||||||||||||||||||||
| Chicago, IL | (a) | 242 | 244 | — | — | 242 | 244 | 486 | (158 | ) | 1970 | 05/25/05 | 15 to 20 Years | ||||||||||||||||||||
| Chicago, IL | (a) | 242 | 256 | — | — | 242 | 256 | 498 | (151 | ) | 1974 | 05/25/05 | 15 to 20 Years | ||||||||||||||||||||
| Chicago, IL | (a) | 532 | 279 | — | — | 532 | 279 | 811 | (167 | ) | 1982 | 05/25/05 | 15 to 20 Years | ||||||||||||||||||||
| Chicago, IL | (a) | 289 | 260 | — | — | 289 | 260 | 549 | (150 | ) | 1982 | 05/25/05 | 15 to 20 Years | ||||||||||||||||||||
| Chicago, IL | (a) | 976 | 271 | — | — | 976 | 271 | 1,247 | (309 | ) | 1987 | 09/23/05 | 10 to 15 Years | ||||||||||||||||||||
| Christiansburg, VA | (a) | 666 | 168 | — | — | 666 | 168 | 834 | (279 | ) | 1994 | 07/01/05 | 15 to 20 Years | ||||||||||||||||||||
| Claremore, OK | (c) | 903 | 932 | — | — | 903 | 932 | 1,835 | (23 | ) | 1985 | 06/30/16 | 5 to 30 Years | ||||||||||||||||||||
| Cleburne, TX | (c) | 129 | 482 | — | — | 129 | 482 | 611 | (92 | ) | 1997 | 07/17/13 | 9 to 25 Years | ||||||||||||||||||||
| Cleveland, TN | (a) | 501 | 459 | — | — | 501 | 459 | 960 | (185 | ) | 2004 | 12/29/06 | 15 to 40 Years | ||||||||||||||||||||
| College Park, GA | (c) | 839 | 1,439 | — | — | 839 | 1,439 | 2,278 | (91 | ) | 2007 | 07/01/15 | 15 to 30 Years | ||||||||||||||||||||
| Collierville, TN | (a) | 539 | — | — | — | 539 | — | 539 | — | (f) | 10/30/13 | (f) | |||||||||||||||||||||
| Restaurants - Quick Service | |||||||||||||||||||||||||||||||||
| Aberdeen, VA | (a) | 564 | 338 | — | — | 564 | 338 | 902 | (20 | ) | 1994 | 09/17/13 | 15 to 30 Years | ||||||||||||||||||||
| Abilene, TX | (c ) | 198 | 311 | — | — | 198 | 311 | 509 | (25 | ) | 1975 | 07/17/13 | 10 to 26 Years | ||||||||||||||||||||
| Adairsville, GA | (a) | 557 | 318 | — | — | 557 | 318 | 875 | (139 | ) | 1986 | 09/29/06 | 15 to 20 years | ||||||||||||||||||||
| Akron, OH | (a) | 247 | 198 | — | — | 247 | 198 | 445 | (108 | ) | 1971 | 05/25/05 | 15 to 20 years | ||||||||||||||||||||
| Akron, OH | (a) | 218 | 273 | — | — | 218 | 273 | 491 | (130 | ) | 1976 | 05/25/05 | 15 to 20 years | ||||||||||||||||||||
| Akron, OH | (a) | 310 | 394 | — | — | 310 | 394 | 704 | (183 | ) | 1982 | 05/25/05 | 15 to 20 years | ||||||||||||||||||||
| Alamo, TX | (c ) | 1,745 | 715 | — | — | 1,745 | 715 | 2,460 | (36 | ) | 1984 | 07/17/13 | 9 to 35 Years | ||||||||||||||||||||
| Albermarle, NC | (a) | 639 | 310 | — | — | 639 | 310 | 949 | (19 | ) | 1993 | 09/17/13 | 15 to 30 Years | ||||||||||||||||||||
| Albuquerque, NM | (c ) | 265 | 575 | — | — | 265 | 575 | 840 | (50 | ) | 1980 | 07/17/13 | 11 to 26 Years | ||||||||||||||||||||
| Albuquerque, NM | (c ) | 466 | 591 | — | — | 466 | 591 | 1,057 | (39 | ) | 1976 | 07/17/13 | 11 to 35 Years | ||||||||||||||||||||
| Albuquerque, NM | (c ) | 267 | 439 | — | — | 267 | 439 | 706 | (43 | ) | 1975 | 07/17/13 | 11 to 25 Years | ||||||||||||||||||||
| Albuquerque, NM | (c ) | 293 | 300 | — | — | 293 | 300 | 593 | (37 | ) | 1976 | 07/17/13 | 11 to 25 Years | ||||||||||||||||||||
| Altus, OK | (c ) | 70 | 413 | — | — | 70 | 413 | 483 | (31 | ) | 2007 | 07/17/13 | 7 to 25 Years | ||||||||||||||||||||
| Initial Cost to Company | Cost Capitalized Subsequent to Acquisition including impairment | Gross Amount at December 31, | Life in which depreciation in latest Statement of Operations is computed | ||||||||||||||||||||||
| Description | Encumbrances | Land and Improvements | Buildings and Improvements | Improvements/ Land | Improvements/ building | Land and Improvements | Buildings and Improvements | Total | Final Accum | Date of Construction | Date Acquired | ||||||||||||||
| Altus, OK | (a) | 103 | 237 | — | — | 103 | 237 | 340 | (21 | ) | 1980 | 07/17/13 | 4 to 28 Years | ||||||||||||||||||||
| Americus, GA | (c ) | 282 | 406 | — | — | 282 | 406 | 688 | (41 | ) | 1978 | 07/17/13 | 11 to 23 Years | ||||||||||||||||||||
| Anderson, IN | (a) | 363 | 700 | — | — | 363 | 700 | 1,063 | (76 | ) | 1995 | 07/17/13 | 8 to 17 Years | ||||||||||||||||||||
| Apopka, FL | (a) | 1,038 | 482 | — | — | 1,038 | 482 | 1,520 | (458 | ) | 1977 | 06/25/04 | 10 to 15 years | ||||||||||||||||||||
| Apple Valley, MN | (a) | 1,119 | 1,055 | — | — | 1,119 | 1,055 | 2,174 | (369 | ) | 1999 | 09/24/04 | 15 to 30 years | ||||||||||||||||||||
| Arlington, TX | (c ) | 168 | 188 | — | — | 168 | 188 | 356 | (25 | ) | 1968 | 07/17/13 | 9 to 21 Years | ||||||||||||||||||||
| Artesia, NM | (a) | 435 | 1,106 | — | — | 435 | 1,106 | 1,541 | (35 | ) | 1984 | 04/16/14 | 15 to 30 Years | ||||||||||||||||||||
| Athens, TN | (a) | 388 | 748 | — | — | 388 | 748 | 1,136 | (277 | ) | 1994 | 06/25/04 | 15 to 30 years | ||||||||||||||||||||
| Atlanta, GA | (c ) | 336 | 346 | — | — | 336 | 346 | 682 | (42 | ) | 1981 | 07/17/13 | 11 to 22 Years | ||||||||||||||||||||
| Atlanta, GA | (c ) | 554 | 258 | — | — | 554 | 258 | 812 | (35 | ) | 1980 | 07/17/13 | 11 to 23 Years | ||||||||||||||||||||
| Atlanta, GA | (c ) | 683 | 5 | — | — | 683 | 5 | 688 | (20 | ) | 1975 | 07/17/13 | 11 to 23 Years | ||||||||||||||||||||
| Atlanta, GA | (c ) | 394 | 268 | — | — | 394 | 268 | 662 | (44 | ) | 1975 | 07/17/13 | 11 to 21 Years | ||||||||||||||||||||
| Atlanta, GA | (a) | 309 | 867 | — | — | 309 | 867 | 1,176 | (37 | ) | 1994 | 12/24/13 | 15 to 30 Years | ||||||||||||||||||||
| Atlanta, GA | (a) | 513 | 483 | — | — | 513 | 483 | 996 | (60 | ) | 2002 | 02/02/12 | 15 to 30 years | ||||||||||||||||||||
| Atlanta, GA | (a) | 488 | 653 | — | — | 488 | 653 | 1,141 | (77 | ) | 1995 | 02/02/12 | 15 to 30 years | ||||||||||||||||||||
| Auburn, CA | (a) | 579 | 299 | — | — | 579 | 299 | 878 | (111 | ) | 1992 | 12/29/06 | 15 to 30 years | ||||||||||||||||||||
| Aurora, IL | (a) | 286 | 726 | — | — | 286 | 726 | 1,012 | (271 | ) | 1998 | 12/29/06 | 15 to 30 years | ||||||||||||||||||||
| Austin, TX | (c ) | 699 | 417 | — | — | 699 | 417 | 1,116 | (35 | ) | 1975 | 07/17/13 | 11 to 29 Years | ||||||||||||||||||||
| Austin, TX | (c ) | 531 | 794 | — | — | 531 | 794 | 1,325 | (44 | ) | 1967 | 07/17/13 | 11 to 32 Years | ||||||||||||||||||||
| Austin, TX | (c ) | 904 | 477 | — | — | 904 | 477 | 1,381 | (28 | ) | 1976 | 07/17/13 | 11 to 35 Years | ||||||||||||||||||||
| Austin, TX | (c ) | 418 | 872 | — | — | 418 | 872 | 1,290 | (45 | ) | 1986 | 07/17/13 | 11 to 35 Years | ||||||||||||||||||||
| Austin, TX | (c ) | 689 | 634 | — | — | 689 | 634 | 1,323 | (45 | ) | 2003 | 07/17/13 | 11 to 35 Years | ||||||||||||||||||||
| Balch Springs, TX | (c ) | 329 | 576 | — | — | 329 | 576 | 905 | (47 | ) | 1986 | 07/17/13 | 11 to 31 Years | ||||||||||||||||||||
| Bartlett, TN | (a) | 411 | — | — | — | 411 | — | 411 | — | (f) | 10/30/13 | 12 to 12 Years | |||||||||||||||||||||
| Bartonville, IL | (a) | 410 | 856 | — | — | 410 | 856 | 1,266 | (89 | ) | 1980 | 12/21/12 | 15 to 30 years | ||||||||||||||||||||
| Baton Rouge, LA | (a) | 565 | 286 | — | — | 565 | 286 | 851 | (179 | ) | 1979 | 06/25/04 | 15 to 20 years | ||||||||||||||||||||
| Baton Rouge, LA | (a) | 391 | 599 | — | — | 391 | 599 | 990 | (279 | ) | 1991 | 06/25/04 | 15 to 20 years | ||||||||||||||||||||
| Baton Rouge, LA | (a) | 594 | 417 | — | — | 594 | 417 | 1,011 | (236 | ) | 1984 | 09/24/04 | 15 to 20 years | ||||||||||||||||||||
| Baton Rouge, LA | (a) | 747 | 558 | — | — | 747 | 558 | 1,305 | (316 | ) | 1987 | 09/24/04 | 15 to 20 years | ||||||||||||||||||||
| Baton Rouge, LA | (a) | 472 | 642 | — | — | 472 | 642 | 1,114 | (227 | ) | 1983 | 09/24/04 | 15 to 30 years | ||||||||||||||||||||
| Bay Minette, AL | (b) | 583 | 754 | — | — | 583 | 754 | 1,337 | (10 | ) | 1996 | 09/22/14 | 15 to 30 Years | ||||||||||||||||||||
| Beeville, TX | (c ) | 120 | 488 | — | — | 120 | 488 | 608 | (39 | ) | 1972 | 07/17/13 | 9 to 25 Years | ||||||||||||||||||||
| Columbia, MO | (a) | 339 | 1,126 | — | — | 339 | 1,126 | 1,465 | (136 | ) | 1985 | 12/24/13 | 15 to 30 Years | ||||||||||||||||||||
| Columbus, GA | (c) | 640 | 403 | — | — | 640 | 403 | 1,043 | (101 | ) | 1983 | 07/17/13 | 11 to 23 Years | ||||||||||||||||||||
| Columbus, GA | (c) | 342 | 49 | — | — | 342 | 49 | 391 | (54 | ) | 1978 | 07/17/13 | 9 to 23 Years | ||||||||||||||||||||
| Columbus, OH | (a) | 268 | 354 | — | — | 268 | 354 | 622 | (217 | ) | 1975 | 05/25/05 | 15 to 20 Years | ||||||||||||||||||||
| Columbus, OH | (a) | 294 | 262 | — | — | 294 | 262 | 556 | (177 | ) | 1976 | 05/25/05 | 15 to 20 Years | ||||||||||||||||||||
| Commerce, GA | (a) | 219 | 797 | — | — | 219 | 797 | 1,016 | (104 | ) | 1990 | 12/24/13 | 15 to 30 Years | ||||||||||||||||||||
| Concord, NC | (a) | 244 | 310 | — | — | 244 | 310 | 554 | (46 | ) | 1993 | 09/17/13 | 15 to 30 Years | ||||||||||||||||||||
| Concord, NC | (a) | 855 | 348 | — | — | 855 | 348 | 1,203 | (66 | ) | 2004 | 09/17/13 | 15 to 30 Years | ||||||||||||||||||||
| Copperas Cove, TX | (c) | 186 | 249 | — | — | 186 | 249 | 435 | (54 | ) | 1973 | 07/17/13 | 11 to 23 Years | ||||||||||||||||||||
| Cordele, GA | (c) | 459 | 181 | — | — | 459 | 181 | 640 | (53 | ) | 1980 | 07/17/13 | 11 to 35 Years | ||||||||||||||||||||
| Covington, GA | (a) | 526 | 665 | — | — | 526 | 665 | 1,191 | (131 | ) | 2001 | 02/02/12 | 15 to 30 Years | ||||||||||||||||||||
| Covington, TN | (c) | 343 | 152 | — | — | 343 | 152 | 495 | (68 | ) | 2007 | 07/17/13 | 3 to 24 Years | ||||||||||||||||||||
| Crawfordsville, IN | (a) | 557 | 624 | — | — | 557 | 624 | 1,181 | (293 | ) | 1998 | 09/23/05 | 15 to 30 Years | ||||||||||||||||||||
| Creedmoor, NC | (a) | 451 | 367 | — | — | 451 | 367 | 818 | (80 | ) | 2006 | 09/17/13 | 15 to 30 Years | ||||||||||||||||||||
| Crossville, TN | (a) | 353 | 382 | — | — | 353 | 382 | 735 | (117 | ) | 1977 | 09/01/05 | 15 to 40 Years | ||||||||||||||||||||
| Cumming, GA | (a) | 967 | 844 | — | — | 967 | 844 | 1,811 | (409 | ) | 1986 | 09/24/04 | 15 to 30 Years | ||||||||||||||||||||
| Cumming, GA | (a) | 408 | 827 | — | — | 408 | 827 | 1,235 | (113 | ) | 1988 | 12/24/13 | 15 to 30 Years | ||||||||||||||||||||
| Dallas, TX | (c) | 88 | 215 | — | — | 88 | 215 | 303 | (60 | ) | 1980 | 07/17/13 | 9 to 19 Years | ||||||||||||||||||||
| Dallas, TX | (c) | 249 | 431 | — | — | 249 | 431 | 680 | (63 | ) | 1985 | 07/17/13 | 9 to 33 Years | ||||||||||||||||||||
| Dallas, TX | (c) | 164 | 431 | — | — | 164 | 431 | 595 | (99 | ) | 1968 | 07/17/13 | 10 to 18 Years | ||||||||||||||||||||
| Dallas, TX | (c) | 174 | 450 | — | — | 174 | 450 | 624 | (83 | ) | 1969 | 07/17/13 | 10 to 26 Years | ||||||||||||||||||||
| Dallas, TX | (c) | 236 | 339 | — | — | 236 | 339 | 575 | (68 | ) | 1971 | 07/17/13 | 10 to 23 Years | ||||||||||||||||||||
| Dallas, TX | (c) | 315 | 209 | — | — | 315 | 209 | 524 | (49 | ) | 1999 | 07/17/13 | 10 to 25 Years | ||||||||||||||||||||
| Dallas, TX | (c) | 392 | 501 | — | — | 392 | 501 | 893 | (84 | ) | 1985 | 07/17/13 | 11 to 30 Years | ||||||||||||||||||||
| Dallas, TX | (c) | 526 | 203 | — | — | 526 | 203 | 729 | (14 | ) | 1987 | 06/30/16 | 5 to 10 Years | ||||||||||||||||||||
| Danville, IL | (a) | 619 | 672 | — | — | 619 | 672 | 1,291 | (349 | ) | 1995 | 12/29/06 | 15 to 30 Years | ||||||||||||||||||||
| Davenport, IA | (a) | 441 | 646 | — | — | 441 | 646 | 1,087 | (165 | ) | 2002 | 10/03/11 | 15 to 30 Years | ||||||||||||||||||||
| Dayton, OH | (a) | 526 | 598 | — | — | 526 | 598 | 1,124 | (359 | ) | 1982 | 12/08/09 | 12 to 17 Years | ||||||||||||||||||||
| Dayton, OH | (c) | 467 | 237 | — | — | 467 | 237 | 704 | (21 | ) | 1984 | 08/21/15 | 15 to 20 Years | ||||||||||||||||||||
| Decatur, GA | (a) | 677 | 539 | — | — | 677 | 539 | 1,216 | (109 | ) | 1989 | 02/02/12 | 15 to 30 Years | ||||||||||||||||||||
| Decatur, GA | (c) | 459 | 133 | — | — | 459 | 133 | 592 | (54 | ) | 1974 | 07/17/13 | 11 to 20 Years | ||||||||||||||||||||
| Decatur, GA | (c) | 566 | 49 | — | — | 566 | 49 | 615 | (89 | ) | 1979 | 07/17/13 | 3 to 11 Years | ||||||||||||||||||||
| Decatur, GA | (c) | 554 | 49 | — | — | 554 | 49 | 603 | (49 | ) | 1977 | 07/17/13 | 7 to 25 Years | ||||||||||||||||||||
| Decatur, GA | (c) | 570 | 30 | — | — | 570 | 30 | 600 | (47 | ) | 1981 | 07/17/13 | 7 to 25 Years | ||||||||||||||||||||
| Decatur, IL | (a) | 940 | 126 | — | — | 940 | 126 | 1,066 | (344 | ) | 1992 | 09/23/05 | 15 to 20 Years | ||||||||||||||||||||
| Initial Cost to Company | Cost Capitalized Subsequent to Acquisition including impairment | Gross Amount at December 31, | Life in which depreciation in latest Statement of Operations is computed | ||||||||||||||||||||||
| Description | Encumbrances | Land and Improvements | Buildings and Improvements | Improvements/ Land | Improvements/ building | Land and Improvements | Buildings and Improvements | Total | Final Accum | Date of Construction | Date Acquired | ||||||||||||||
| Bellefontaine, OH | (a) | 388 | 778 | (12 | ) | — | 376 | 778 | 1,154 | (341 | ) | 1989 | 12/29/06 | 15 to 20 years | |||||||||||||||||||
| Bentonville, AR | (a) | 635 | 900 | — | — | 635 | 900 | 1,535 | (312 | ) | 2004 | 07/07/05 | 15 to 30 years | ||||||||||||||||||||
| Birmingham, AL | (c ) | 192 | 656 | — | — | 192 | 656 | 848 | (62 | ) | 1981 | 07/17/13 | 7 to 21 Years | ||||||||||||||||||||
| Birmingham, AL | (c ) | 120 | 151 | — | — | 120 | 151 | 271 | (23 | ) | 1970 | 07/17/13 | 6 to 21 Years | ||||||||||||||||||||
| Birmingham, AL | (c ) | 119 | 158 | — | — | 119 | 158 | 277 | (23 | ) | 1970 | 07/17/13 | 5 to 21 Years | ||||||||||||||||||||
| Birmingham, AL | (c ) | 107 | 508 | — | — | 107 | 508 | 615 | (46 | ) | 1983 | 07/17/13 | 7 to 21 Years | ||||||||||||||||||||
| Birmingham, AL | (c ) | 131 | 526 | — | — | 131 | 526 | 657 | (49 | ) | 1984 | 07/17/13 | 7 to 19 Years | ||||||||||||||||||||
| Bloomingdale, IL | (a) | 426 | 1,956 | — | — | 426 | 1,956 | 2,382 | (553 | ) | 1992 | 12/29/06 | 15 to 30 years | ||||||||||||||||||||
| Bloomsburg, PA | (b) | 698 | 823 | — | — | 698 | 823 | 1,521 | (3 | ) | 1993 | 11/18/14 | 15 to 30 Years | ||||||||||||||||||||
| Blue Springs, MO | (b) | 688 | 119 | 101 | (119 | ) | 789 | — | 789 | — | 1994 | 09/23/05 | 38 to 38 years | ||||||||||||||||||||
| Bolingbrook, IL | (a) | 762 | 821 | — | — | 762 | 821 | 1,583 | (385 | ) | 1994 | 09/23/05 | 15 to 20 years | ||||||||||||||||||||
| Boone, NC | (a) | 750 | 379 | — | — | 750 | 379 | 1,129 | (167 | ) | 2006 | 12/29/06 | 15 to 30 years | ||||||||||||||||||||
| Bowling Green, KY | (b) | 756 | 205 | — | — | 756 | 205 | 961 | (27 | ) | 2007 | 07/17/13 | 4 to 39 Years | ||||||||||||||||||||
| Brazil, IN | (a) | 391 | 903 | — | — | 391 | 903 | 1,294 | (59 | ) | 1996 | 07/17/13 | 8 to 33 Years | ||||||||||||||||||||
| Bristol, TN | (a) | 484 | 134 | — | — | 484 | 134 | 618 | (176 | ) | 1991 | 11/23/04 | 15 to 20 years | ||||||||||||||||||||
| Bristol, TN | (a) | 474 | 282 | — | — | 474 | 282 | 756 | (71 | ) | 1985 | 12/21/12 | 10 to 15 years | ||||||||||||||||||||
| Bristol, VA | (a) | 492 | 366 | — | — | 492 | 366 | 858 | (68 | ) | 1982 | 12/21/12 | 15 to 20 years | ||||||||||||||||||||
| Bristol, VA | (a) | 369 | 564 | — | — | 369 | 564 | 933 | (76 | ) | 1991 | 12/21/12 | 15 to 20 years | ||||||||||||||||||||
| Brownsville, TX | (c ) | 795 | 556 | — | — | 795 | 556 | 1,351 | (30 | ) | 1977 | 07/17/13 | 10 to 35 Years | ||||||||||||||||||||
| Brownsville, TX | (c ) | 667 | 785 | — | — | 667 | 785 | 1,452 | (41 | ) | 1985 | 07/17/13 | 10 to 35 Years | ||||||||||||||||||||
| Brownsville, TX | (c ) | 369 | 679 | — | — | 369 | 679 | 1,048 | (40 | ) | 1972 | 07/17/13 | 11 to 35 Years | ||||||||||||||||||||
| Brownsville, TX | (c ) | 267 | 652 | — | — | 267 | 652 | 919 | (34 | ) | 2000 | 07/17/13 | 10 to 35 Years | ||||||||||||||||||||
| Brownsville, TX | (c ) | 430 | 656 | — | — | 430 | 656 | 1,086 | (55 | ) | 1985 | 07/17/13 | 11 to 29 Years | ||||||||||||||||||||
| Brownsville, TX | (c ) | 571 | 930 | — | — | 571 | 930 | 1,501 | (58 | ) | 2002 | 07/17/13 | 11 to 35 Years | ||||||||||||||||||||
| Brunswick, GA | (a) | 774 | 614 | — | — | 774 | 614 | 1,388 | (292 | ) | 1999 | 09/24/04 | 15 to 20 years | ||||||||||||||||||||
| Bryan, TX | (c ) | 441 | 766 | — | — | 441 | 766 | 1,207 | (37 | ) | 1972 | 07/17/13 | 10 to 35 Years | ||||||||||||||||||||
| Buckhannon, WV | (a) | 438 | 529 | — | — | 438 | 529 | 967 | (71 | ) | 1978 | 12/21/12 | 15 to 20 years | ||||||||||||||||||||
| Deerfield Beach, FL | (a) | 668 | 295 | — | — | 668 | 295 | 963 | (160 | ) | 1970 | 09/24/04 | 15 to 30 Years | ||||||||||||||||||||
| Denham Springs, LA | (a) | 419 | 594 | — | — | 419 | 594 | 1,013 | (363 | ) | 1983 | 09/24/04 | 15 to 20 Years | ||||||||||||||||||||
| Denton, TX | (c) | 693 | 884 | — | — | 693 | 884 | 1,577 | (22 | ) | 1995 | 06/30/16 | 5 to 30 Years | ||||||||||||||||||||
| Detroit, MI | (a) | 425 | 200 | — | — | 425 | 200 | 625 | (139 | ) | 1977 | 05/25/05 | 15 to 20 Years | ||||||||||||||||||||
| Detroit, MI | (a) | 351 | 209 | — | — | 351 | 209 | 560 | (140 | ) | 1977 | 05/25/05 | 15 to 20 Years | ||||||||||||||||||||
| Detroit, MI | (a) | 426 | 223 | — | — | 426 | 223 | 649 | (155 | ) | 1979 | 05/25/05 | 15 to 20 Years | ||||||||||||||||||||
| Detroit, MI | (a) | 413 | 235 | — | — | 413 | 235 | 648 | (157 | ) | 1977 | 05/25/05 | 15 to 20 Years | ||||||||||||||||||||
| Detroit, MI | (a) | 301 | 219 | — | — | 301 | 219 | 520 | (141 | ) | 1972 | 05/25/05 | 15 to 20 Years | ||||||||||||||||||||
| Detroit, MI | (a) | 270 | 305 | — | — | 270 | 305 | 575 | (171 | ) | 1976 | 05/25/05 | 15 to 20 Years | ||||||||||||||||||||
| Detroit, MI | (a) | 271 | 157 | — | — | 271 | 157 | 428 | (108 | ) | 1978 | 05/25/05 | 15 to 20 Years | ||||||||||||||||||||
| Detroit, MI | (a) | 385 | 258 | — | — | 385 | 258 | 643 | (176 | ) | 1979 | 05/25/05 | 15 to 20 Years | ||||||||||||||||||||
| Detroit, MI | (a) | 428 | 189 | — | — | 428 | 189 | 617 | (130 | ) | 1979 | 05/25/05 | 15 to 20 Years | ||||||||||||||||||||
| Detroit, MI | (a) | 614 | 688 | — | — | 614 | 688 | 1,302 | (421 | ) | 1987 | 02/13/09 | 13 to 18 Years | ||||||||||||||||||||
| D'Iberville, MS | (a) | 597 | 995 | — | — | 597 | 995 | 1,592 | (106 | ) | 2005 | 07/14/14 | 15 to 30 Years | ||||||||||||||||||||
| Donna, TX | (c) | 1,091 | 540 | — | — | 1,091 | 540 | 1,631 | (80 | ) | 1984 | 07/17/13 | 10 to 35 Years | ||||||||||||||||||||
| Douglasville, GA | (a) | 712 | 669 | — | — | 712 | 669 | 1,381 | (249 | ) | 2003 | 02/28/06 | 15 to 40 Years | ||||||||||||||||||||
| Douglasville, GA | (a) | 764 | 941 | — | — | 764 | 941 | 1,705 | (387 | ) | 1990 | 02/28/06 | 15 to 30 Years | ||||||||||||||||||||
| Douglasville, GA | (a) | 127 | — | — | — | 127 | — | 127 | — | (f) | 11/14/14 | (f) | |||||||||||||||||||||
| Durham, NC | (a) | 1,253 | — | — | — | 1,253 | — | 1,253 | — | (f) | 07/17/13 | (f) | |||||||||||||||||||||
| Eagle Pass, TX | (c) | 597 | 385 | — | — | 597 | 385 | 982 | (65 | ) | 1977 | 07/17/13 | 9 to 35 Years | ||||||||||||||||||||
| East Aurora, NY | (a) | 424 | 584 | (129 | ) | (329 | ) | 295 | 255 | 550 | — | 1982 | 11/10/05 | 15 to 20 Years | |||||||||||||||||||
| East Ellijay, GA | (a) | 562 | 354 | — | — | 562 | 354 | 916 | (244 | ) | 1984 | 12/29/05 | 15 to 20 Years | ||||||||||||||||||||
| East Point, GA | (c) | 429 | 245 | — | — | 429 | 245 | 674 | (97 | ) | 1977 | 07/17/13 | 11 to 19 Years | ||||||||||||||||||||
| East St. Louis, IL | (a) | 117 | 334 | — | — | 117 | 334 | 451 | (143 | ) | 1990 | 05/25/05 | 15 to 30 Years | ||||||||||||||||||||
| Edinburg, TX | (c) | 624 | 888 | — | — | 624 | 888 | 1,512 | (115 | ) | 1985 | 07/17/13 | 11 to 35 Years | ||||||||||||||||||||
| Effingham, IL | (a) | 539 | 575 | — | — | 539 | 575 | 1,114 | (280 | ) | 1985 | 09/23/05 | 15 to 30 Years | ||||||||||||||||||||
| Elizabethton, TN | (a) | 655 | 129 | — | — | 655 | 129 | 784 | (226 | ) | 1993 | 07/01/05 | 15 to 20 Years | ||||||||||||||||||||
| Elizabethton, TN | (a) | 735 | 278 | — | — | 735 | 278 | 1,013 | (101 | ) | 1971 | 12/21/12 | 15 to 20 Years | ||||||||||||||||||||
| Elmwood Park, IL | (a) | 650 | 380 | — | — | 650 | 380 | 1,030 | (228 | ) | 1993 | 09/23/05 | 15 to 20 Years | ||||||||||||||||||||
| Elsa, TX | (c) | 1,159 | 141 | — | — | 1,159 | 141 | 1,300 | (41 | ) | 1984 | 07/17/13 | 11 to 35 Years | ||||||||||||||||||||
| Emporia, KS | (a) | 508 | 1,175 | — | — | 508 | 1,175 | 1,683 | (153 | ) | 1969 | 12/24/13 | 15 to 30 Years | ||||||||||||||||||||
| Englewood, OH | (c) | 235 | 345 | — | — | 235 | 345 | 580 | (22 | ) | 1988 | 08/21/15 | 15 to 30 Years | ||||||||||||||||||||
| Enid, OK | (c) | 40 | 55 | — | — | 40 | 55 | 95 | (5 | ) | 1985 | 06/30/16 | 9 to 10 Years | ||||||||||||||||||||
| Escanaba, MI | (a) | 772 | 767 | — | 300 | 772 | 1,067 | 1,839 | (579 | ) | 1984 | 12/29/05 | 3 to 20 Years | ||||||||||||||||||||
| Initial Cost to Company | Cost Capitalized Subsequent to Acquisition including impairment | Gross Amount at December 31, | Life in which depreciation in latest Statement of Operations is computed | ||||||||||||||||||||||
| Description | Encumbrances | Land and Improvements | Buildings and Improvements | Improvements/ Land | Improvements/ building | Land and Improvements | Buildings and Improvements | Total | Final Accum | Date of Construction | Date Acquired | ||||||||||||||
| Buffalo, NY | (a) | 737 | 629 | — | — | 737 | 629 | 1,366 | (192 | ) | 1993 | 11/10/05 | 15 to 30 years | ||||||||||||||||||||
| Buffalo, NY | (a) | 821 | 694 | — | — | 821 | 694 | 1,515 | (215 | ) | 1976 | 11/10/05 | 15 to 30 years | ||||||||||||||||||||
| Calhoun, GA | (a) | 503 | 713 | — | — | 503 | 713 | 1,216 | (88 | ) | 1988 | 02/02/12 | 15 to 30 years | ||||||||||||||||||||
| Canton, OH | (a) | 215 | 483 | — | — | 215 | 483 | 698 | (197 | ) | 1974 | 05/25/05 | 15 to 20 years | ||||||||||||||||||||
| Carrollton, GA | (a) | 613 | 503 | — | — | 613 | 503 | 1,116 | (85 | ) | 1988 | 02/02/12 | 15 to 20 years | ||||||||||||||||||||
| Carrollton, KY | (a) | 229 | 730 | — | — | 229 | 730 | 959 | (231 | ) | 1990 | 12/29/06 | 13 to 28 years | ||||||||||||||||||||
| Carrolton, TX | (c ) | 361 | 415 | — | — | 361 | 415 | 776 | (41 | ) | 1997 | 07/17/13 | 11 to 25 Years | ||||||||||||||||||||
| Chattanooga, TN | (b) | 175 | 271 | — | — | 175 | 271 | 446 | (24 | ) | 2007 | 07/17/13 | 3 to 26 Years | ||||||||||||||||||||
| Chattanooga, TN | (a) | 482 | 682 | — | — | 482 | 682 | 1,164 | (258 | ) | 1997 | 06/25/04 | 15 to 30 years | ||||||||||||||||||||
| Chattanooga, TN | (a) | 600 | 389 | — | — | 600 | 389 | 989 | (139 | ) | 1995 | 09/29/06 | 15 to 30 years | ||||||||||||||||||||
| Cheektowaga, NY | (a) | 561 | 549 | — | — | 561 | 549 | 1,110 | (182 | ) | 1985 | 11/10/05 | 15 to 30 years | ||||||||||||||||||||
| Chicago, IL | (a) | 313 | 275 | — | — | 313 | 275 | 588 | (121 | ) | 1982 | 05/25/05 | 15 to 20 years | ||||||||||||||||||||
| Chicago, IL | (a) | 340 | 220 | — | — | 340 | 220 | 560 | (113 | ) | 1975 | 05/25/05 | 15 to 20 years | ||||||||||||||||||||
| Chicago, IL | (a) | 242 | 244 | — | — | 242 | 244 | 486 | (124 | ) | 1970 | 05/25/05 | 15 to 20 years | ||||||||||||||||||||
| Chicago, IL | (a) | 242 | 256 | — | — | 242 | 256 | 498 | (119 | ) | 1974 | 05/25/05 | 15 to 20 years | ||||||||||||||||||||
| Chicago, IL | (a) | 532 | 279 | — | — | 532 | 279 | 811 | (131 | ) | 1982 | 05/25/05 | 15 to 20 years | ||||||||||||||||||||
| Chicago, IL | (a) | 289 | 260 | — | — | 289 | 260 | 549 | (118 | ) | 1982 | 05/25/05 | 15 to 20 years | ||||||||||||||||||||
| Chicago, IL | (a) | 976 | 271 | — | — | 976 | 271 | 1,247 | (244 | ) | 1987 | 09/23/05 | 10 to 15 years | ||||||||||||||||||||
| Chickasha, OK | (a) | 511 | 811 | (126 | ) | (165 | ) | 385 | 646 | 1,031 | (364 | ) | 1982 | 09/23/05 | 15 to 20 years | ||||||||||||||||||
| Christiansburg, VA | (a) | 666 | 168 | — | — | 666 | 168 | 834 | (220 | ) | 1994 | 11/23/04 | 15 to 20 years | ||||||||||||||||||||
| Cleburne, TX | (c ) | 129 | 482 | — | — | 129 | 482 | 611 | (38 | ) | 1997 | 07/17/13 | 9 to 25 Years | ||||||||||||||||||||
| Cleveland, TN | (a) | 501 | 459 | — | — | 501 | 459 | 960 | (145 | ) | 2004 | 12/29/06 | 15 to 40 years | ||||||||||||||||||||
| Clovis, NM | (a) | 501 | 1,655 | — | — | 501 | 1,655 | 2,156 | (49 | ) | 1998 | 04/16/14 | 15 to 30 Years | ||||||||||||||||||||
| Collierville, TN | (a) | 539 | — | — | — | 539 | — | 539 | — | (f) | 10/30/13 | 12 to 12 Years | |||||||||||||||||||||
| Columbia, MO | (a) | 339 | 1,126 | — | — | 339 | 1,126 | 1,465 | (45 | ) | 1985 | 12/24/13 | 15 to 30 Years | ||||||||||||||||||||
| Columbus, GA | (c ) | 640 | 403 | — | — | 640 | 403 | 1,043 | (42 | ) | 1983 | 07/17/13 | 11 to 23 Years | ||||||||||||||||||||
| Columbus, GA | (c ) | 342 | 49 | — | — | 342 | 49 | 391 | (22 | ) | 1978 | 07/17/13 | 9 to 23 Years | ||||||||||||||||||||
| Columbus, OH | (a) | 268 | 354 | — | — | 268 | 354 | 622 | (171 | ) | 1975 | 05/25/05 | 15 to 20 years | ||||||||||||||||||||
| Columbus, OH | (a) | 294 | 262 | — | — | 294 | 262 | 556 | (139 | ) | 1976 | 05/25/05 | 15 to 20 years | ||||||||||||||||||||
| Commerce, GA | (a) | 219 | 797 | — | — | 219 | 797 | 1,016 | (35 | ) | 1980 | 12/24/13 | 15 to 30 Years | ||||||||||||||||||||
| Concord, NC | (a) | 244 | 310 | — | — | 244 | 310 | 554 | (18 | ) | 1993 | 09/17/13 | 15 to 30 Years | ||||||||||||||||||||
| Concord, NC | (a) | 855 | 348 | — | — | 855 | 348 | 1,203 | (25 | ) | 2004 | 09/17/13 | 15 to 30 Years | ||||||||||||||||||||
| Conyers, GA | (a) | 463 | 557 | — | — | 463 | 557 | 1,020 | (52 | ) | 2008 | 02/02/12 | 15 to 40 years | ||||||||||||||||||||
| Conyers, GA | (a) | 509 | 706 | — | — | 509 | 706 | 1,215 | (82 | ) | 1984 | 02/02/12 | 15 to 30 years | ||||||||||||||||||||
| Euless, TX | (c) | 674 | 277 | — | — | 674 | 277 | 951 | (14 | ) | 1979 | 06/30/16 | 5 to 20 Years | ||||||||||||||||||||
| Eureka, IL | (a) | 307 | 338 | — | — | 307 | 338 | 645 | (191 | ) | 1980 | 12/21/12 | 10 to 15 Years | ||||||||||||||||||||
| Eustis, FL | (a) | 451 | 377 | — | — | 451 | 377 | 828 | (412 | ) | 1969 | 12/30/04 | 10 to 15 Years | ||||||||||||||||||||
| Fayetteville, AR | (a) | 1,019 | 1,150 | — | — | 1,019 | 1,150 | 2,169 | (119 | ) | 2014 | 06/23/14 | 15 to 40 Years | ||||||||||||||||||||
| Fayetteville, NC | (a) | 470 | 629 | — | — | 470 | 629 | 1,099 | (282 | ) | 1999 | 09/29/06 | 15 to 30 Years | ||||||||||||||||||||
| Fayetteville, NC | (a) | 489 | 612 | — | — | 489 | 612 | 1,101 | (259 | ) | 1987 | 09/29/06 | 15 to 30 Years | ||||||||||||||||||||
| Fayetteville, NC | (a) | 607 | 1,020 | — | — | 607 | 1,020 | 1,627 | (490 | ) | 1996 | 09/29/06 | 15 to 30 Years | ||||||||||||||||||||
| Ferguson, MO | (a) | 293 | 212 | — | — | 293 | 212 | 505 | (148 | ) | 1974 | 05/25/05 | 15 to 20 Years | ||||||||||||||||||||
| Flint, MI | (a) | 340 | 258 | — | — | 340 | 258 | 598 | (174 | ) | 1979 | 05/25/05 | 15 to 20 Years | ||||||||||||||||||||
| Florence, KY | (a) | 524 | 209 | — | — | 524 | 209 | 733 | (167 | ) | 1992 | 09/24/04 | 15 to 30 Years | ||||||||||||||||||||
| Floresville, TX | (c) | 109 | 555 | — | — | 109 | 555 | 664 | (101 | ) | 1985 | 07/17/13 | 9 to 25 Years | ||||||||||||||||||||
| Flowood, MS | (a) | 338 | 848 | — | — | 338 | 848 | 1,186 | (84 | ) | 1994 | 07/31/14 | 15 to 30 Years | ||||||||||||||||||||
| Floyd, GA | (a) | 973 | 415 | — | — | 973 | 415 | 1,388 | (179 | ) | 1993 | 02/28/06 | 15 to 30 Years | ||||||||||||||||||||
| Forest Hill, TX | (c) | 784 | 294 | — | — | 784 | 294 | 1,078 | (17 | ) | 1999 | 06/30/16 | 5 to 20 Years | ||||||||||||||||||||
| Forsyth, GA | (a) | 495 | 1,007 | — | — | 495 | 1,007 | 1,502 | (423 | ) | 1984 | 01/12/06 | 15 to 30 Years | ||||||||||||||||||||
| Forsythe, GA | (a) | 249 | 936 | — | — | 249 | 936 | 1,185 | (122 | ) | 1983 | 12/24/13 | 15 to 30 Years | ||||||||||||||||||||
| Fort Lauderdale, FL | (a) | 601 | 121 | — | — | 601 | 121 | 722 | (201 | ) | 1984 | 09/24/04 | 10 to 15 Years | ||||||||||||||||||||
| Fort Pierce, FL | (a) | 667 | 184 | — | — | 667 | 184 | 851 | (138 | ) | 1999 | 09/24/04 | 15 to 30 Years | ||||||||||||||||||||
| Fort Wayne, IN | (a) | 660 | 204 | — | — | 660 | 204 | 864 | (284 | ) | 1982 | 09/23/05 | 10 to 15 Years | ||||||||||||||||||||
| Fort Worth, TX | (c) | 157 | 263 | — | — | 157 | 263 | 420 | (71 | ) | 1965 | 07/17/13 | 11 to 20 Years | ||||||||||||||||||||
| Fort Worth, TX | (c) | 164 | 573 | — | — | 164 | 573 | 737 | (95 | ) | 1965 | 07/17/13 | 11 to 25 Years | ||||||||||||||||||||
| Fort Worth, TX | (c) | 200 | 643 | — | — | 200 | 643 | 843 | (102 | ) | 1979 | 07/17/13 | 11 to 30 Years | ||||||||||||||||||||
| Fort Worth, TX | (c) | 356 | 572 | — | — | 356 | 572 | 928 | (86 | ) | 1970 | 07/17/13 | 11 to 35 Years | ||||||||||||||||||||
| Fort Worth, TX | (c) | 187 | 539 | — | — | 187 | 539 | 726 | (80 | ) | 1984 | 07/17/13 | 11 to 35 Years | ||||||||||||||||||||
| Fort Worth, TX | (c) | 331 | 450 | — | — | 331 | 450 | 781 | (15 | ) | 1977 | 06/30/16 | 5 to 20 Years | ||||||||||||||||||||
| Fort Worth, TX | (c) | 377 | 193 | — | — | 377 | 193 | 570 | (13 | ) | 1978 | 06/30/16 | 5 to 10 Years | ||||||||||||||||||||
| Fort Worth, TX | (c) | 335 | 257 | — | — | 335 | 257 | 592 | (12 | ) | 1985 | 06/30/16 | 5 to 20 Years | ||||||||||||||||||||
| Fort Worth, TX | (c) | 681 | 928 | — | — | 681 | 928 | 1,609 | (24 | ) | 1999 | 06/30/16 | 5 to 30 Years | ||||||||||||||||||||
| Ft Madison, IA | (a) | 191 | 620 | — | — | 191 | 620 | 811 | (115 | ) | 1980 | 12/21/12 | 15 to 30 Years | ||||||||||||||||||||
| Ft. Valley, GA | (c) | 353 | 379 | — | — | 353 | 379 | 732 | (106 | ) | 1985 | 07/17/13 | 11 to 23 Years | ||||||||||||||||||||
| Garland, TX | (c) | 141 | 455 | — | — | 141 | 455 | 596 | (83 | ) | 1986 | 07/17/13 | 10 to 25 Years | ||||||||||||||||||||
| Garland, TX | (c) | 532 | 442 | — | — | 532 | 442 | 974 | (11 | ) | 1979 | 06/30/16 | 5 to 30 Years | ||||||||||||||||||||
| Garner, NC | (a) | 600 | 765 | — | — | 600 | 765 | 1,365 | (356 | ) | 1995 | 09/29/06 | 15 to 30 Years | ||||||||||||||||||||
| Gary, IN | (a) | 109 | 410 | — | — | 109 | 410 | 519 | (226 | ) | 1980 | 05/25/05 | 15 to 20 Years | ||||||||||||||||||||
| Gary, IN | (a) | 210 | 318 | — | — | 210 | 318 | 528 | (217 | ) | 1979 | 05/25/05 | 15 to 20 Years | ||||||||||||||||||||
| Gary, IN | (a) | 161 | 493 | — | — | 161 | 493 | 654 | (286 | ) | 1973 | 05/25/05 | 15 to 20 Years | ||||||||||||||||||||
| Gilman, IL | (a) | 219 | 414 | — | — | 219 | 414 | 633 | (283 | ) | 1998 | 09/23/05 | 15 to 20 Years | ||||||||||||||||||||
| Initial Cost to Company | Cost Capitalized Subsequent to Acquisition including impairment | Gross Amount at December 31, | Life in which depreciation in latest Statement of Operations is computed | ||||||||||||||||||||||
| Description | Encumbrances | Land and Improvements | Buildings and Improvements | Improvements/ Land | Improvements/ building | Land and Improvements | Buildings and Improvements | Total | Final Accum | Date of Construction | Date Acquired | ||||||||||||||
| Copperas Cove, TX | (c ) | 186 | 249 | — | — | 186 | 249 | 435 | (22 | ) | 1973 | 07/17/13 | 11 to 23 Years | ||||||||||||||||||||
| Cordele, GA | (c ) | 459 | 181 | — | — | 459 | 181 | 640 | (22 | ) | 1980 | 07/17/13 | 11 to 35 Years | ||||||||||||||||||||
| Council Bluffs, IA | (a) | 393 | 484 | — | — | 393 | 484 | 877 | (54 | ) | 2008 | 10/03/11 | 15 to 40 years | ||||||||||||||||||||
| Covington, GA | (a) | 526 | 665 | — | — | 526 | 665 | 1,191 | (78 | ) | 2001 | 02/02/12 | 15 to 30 years | ||||||||||||||||||||
| Covington, TN | (b) | 343 | 152 | — | — | 343 | 152 | 495 | (28 | ) | 2007 | 07/17/13 | 3 to 24 Years | ||||||||||||||||||||
| Crawfordsville, IN | (a) | 557 | 624 | — | — | 557 | 624 | 1,181 | (230 | ) | 1998 | 09/23/05 | 15 to 30 years | ||||||||||||||||||||
| Creedmoor, NC | (a) | 451 | 367 | — | — | 451 | 367 | 818 | (31 | ) | 2006 | 09/17/13 | 15 to 30 Years | ||||||||||||||||||||
| Crossville, TN | (a) | 353 | 382 | — | — | 353 | 382 | 735 | (92 | ) | 1977 | 09/01/05 | 15 to 40 years | ||||||||||||||||||||
| Cumming, GA | (a) | 408 | 827 | — | — | 408 | 827 | 1,235 | (38 | ) | 1988 | 12/24/13 | 15 to 30 Years | ||||||||||||||||||||
| Cumming, GA | (a) | 967 | 844 | — | — | 967 | 844 | 1,811 | (322 | ) | 1986 | 09/24/04 | 15 to 30 years | ||||||||||||||||||||
| Dallas, TX | (c ) | 88 | 215 | — | — | 88 | 215 | 303 | (25 | ) | 1980 | 07/17/13 | 9 to 21 Years | ||||||||||||||||||||
| Dallas, TX | (c ) | 249 | 431 | — | — | 249 | 431 | 680 | (26 | ) | 1985 | 07/17/13 | 9 to 33 Years | ||||||||||||||||||||
| Dallas, TX | (c ) | 164 | 431 | — | — | 164 | 431 | 595 | (41 | ) | 1968 | 07/17/13 | 10 to 21 Years | ||||||||||||||||||||
| Dallas, TX | (c ) | 174 | 450 | — | — | 174 | 450 | 624 | (34 | ) | 1969 | 07/17/13 | 10 to 26 Years | ||||||||||||||||||||
| Dallas, TX | (c ) | 236 | 339 | — | — | 236 | 339 | 575 | (28 | ) | 1971 | 07/17/13 | 10 to 23 Years | ||||||||||||||||||||
| Dallas, TX | (c ) | 315 | 209 | — | — | 315 | 209 | 524 | (20 | ) | 1999 | 07/17/13 | 10 to 25 Years | ||||||||||||||||||||
| Dallas, TX | (c ) | 392 | 501 | — | — | 392 | 501 | 893 | (35 | ) | 1985 | 07/17/13 | 11 to 30 Years | ||||||||||||||||||||
| Danville, IL | (a) | 619 | 672 | — | — | 619 | 672 | 1,291 | (275 | ) | 1995 | 12/29/06 | 15 to 30 years | ||||||||||||||||||||
| Daphne, AL | (a) | 695 | 302 | — | — | 695 | 302 | 997 | (160 | ) | 1982 | 09/24/04 | 15 to 20 years | ||||||||||||||||||||
| Davenport, IA | (a) | 393 | 405 | — | — | 393 | 405 | 798 | (86 | ) | 1989 | 10/03/11 | 15 to 20 years | ||||||||||||||||||||
| Davenport, IA | (a) | 291 | 633 | — | — | 291 | 633 | 924 | (90 | ) | 1992 | 10/03/11 | 15 to 30 years | ||||||||||||||||||||
| Davenport, IA | (a) | 441 | 646 | — | — | 441 | 646 | 1,087 | (102 | ) | 2002 | 10/03/11 | 15 to 30 years | ||||||||||||||||||||
| Dayton, OH | (a) | 526 | 598 | — | — | 526 | 598 | 1,124 | (283 | ) | 1982 | 03/07/07 | 12 to 17 years | ||||||||||||||||||||
| Decatur, GA | (c ) | 459 | 133 | — | — | 459 | 133 | 592 | (22 | ) | 1974 | 07/17/13 | 11 to 21 Years | ||||||||||||||||||||
| Decatur, GA | (c ) | 566 | 49 | — | — | 566 | 49 | 615 | (37 | ) | 1979 | 07/17/13 | 3 to 11 Years | ||||||||||||||||||||
| Decatur, GA | (c ) | 554 | 49 | — | — | 554 | 49 | 603 | (20 | ) | 1977 | 07/17/13 | 7 to 25 Years | ||||||||||||||||||||
| Decatur, GA | (c ) | 570 | 30 | — | — | 570 | 30 | 600 | (19 | ) | 1981 | 07/17/13 | 7 to 25 Years | ||||||||||||||||||||
| Decatur, GA | (a) | 677 | 539 | — | — | 677 | 539 | 1,216 | (65 | ) | 1989 | 02/02/12 | 15 to 30 years | ||||||||||||||||||||
| Decatur, IL | (a) | 940 | 126 | — | — | 940 | 126 | 1,066 | (271 | ) | 1992 | 09/23/05 | 15 to 20 years | ||||||||||||||||||||
| Deerfield Beach, FL | (a) | 668 | 295 | — | — | 668 | 295 | 963 | (124 | ) | 1970 | 09/24/04 | 15 to 30 years | ||||||||||||||||||||
| Denham Springs, LA | (a) | 419 | 594 | — | — | 419 | 594 | 1,013 | (286 | ) | 1983 | 09/24/04 | 15 to 20 years | ||||||||||||||||||||
| Detroit, MI | (a) | 425 | 200 | — | — | 425 | 200 | 625 | (109 | ) | 1977 | 05/25/05 | 15 to 20 years | ||||||||||||||||||||
| Detroit, MI | (a) | 351 | 209 | — | — | 351 | 209 | 560 | (111 | ) | 1977 | 05/25/05 | 15 to 20 years | ||||||||||||||||||||
| Detroit, MI | (a) | 426 | 223 | — | — | 426 | 223 | 649 | (122 | ) | 1979 | 05/25/05 | 15 to 20 years | ||||||||||||||||||||
| Graceville, FL | (a) | 279 | 1,036 | — | — | 279 | 1,036 | 1,315 | (139 | ) | 1985 | 12/24/13 | 15 to 30 Years | ||||||||||||||||||||
| Grand Prairie, TX | (c) | 335 | 527 | — | — | 335 | 527 | 862 | (78 | ) | 1980 | 07/17/13 | 10 to 35 Years | ||||||||||||||||||||
| Grand Prairie, TX | (c) | 147 | 535 | — | — | 147 | 535 | 682 | (86 | ) | 1985 | 07/17/13 | 11 to 30 Years | ||||||||||||||||||||
| Grapevine, TX | (c) | 636 | 414 | — | — | 636 | 414 | 1,050 | (14 | ) | 1979 | 06/30/16 | 5 to 20 Years | ||||||||||||||||||||
| Grapevine, TX | (c) | 755 | 677 | — | — | 755 | 677 | 1,432 | (25 | ) | 1999 | 06/30/16 | 5 to 20 Years | ||||||||||||||||||||
| Greensboro, AL | (c) | 100 | 663 | — | — | 100 | 663 | 763 | (94 | ) | 1986 | 07/17/13 | 7 to 35 Years | ||||||||||||||||||||
| Greenville, TN | (a) | 289 | 311 | — | — | 289 | 311 | 600 | (320 | ) | 1972 | 09/01/05 | 10 to 15 Years | ||||||||||||||||||||
| Greenville, TN | (a) | 735 | 517 | — | — | 735 | 517 | 1,252 | (104 | ) | 2010 | 03/29/13 | 15 to 30 Years | ||||||||||||||||||||
| Greenville, TX | (a) | 223 | 304 | — | — | 223 | 304 | 527 | (170 | ) | 1985 | 12/29/05 | 15 to 20 Years | ||||||||||||||||||||
| Greenville, TX | (c) | 325 | 441 | — | — | 325 | 441 | 766 | (61 | ) | 1972 | 07/17/13 | 10 to 35 Years | ||||||||||||||||||||
| Greenville, TX | (c) | 429 | 919 | — | — | 429 | 919 | 1,348 | (19 | ) | 1985 | 06/30/16 | 5 to 30 Years | ||||||||||||||||||||
| Griffin, GA | (c) | 215 | 492 | — | — | 215 | 492 | 707 | (98 | ) | 1978 | 07/17/13 | 11 to 25 Years | ||||||||||||||||||||
| Griffin, GA | (a) | 249 | 876 | — | — | 249 | 876 | 1,125 | (110 | ) | 1979 | 12/24/13 | 15 to 30 Years | ||||||||||||||||||||
| Gulfport, MS | (c) | 540 | 429 | — | — | 540 | 429 | 969 | (56 | ) | 1971 | 07/17/13 | 11 to 35 Years | ||||||||||||||||||||
| Gunter, TX | (c) | 248 | 250 | — | — | 248 | 250 | 498 | (10 | ) | 2004 | 07/25/16 | 13 to 20 Years | ||||||||||||||||||||
| Haltom City, TX | (c) | 571 | 425 | — | — | 571 | 425 | 996 | (66 | ) | 2007 | 07/17/13 | 11 to 35 Years | ||||||||||||||||||||
| Haltom City, TX | (c) | 689 | 804 | — | — | 689 | 804 | 1,493 | (21 | ) | 1998 | 06/30/16 | 5 to 30 Years | ||||||||||||||||||||
| Hampton, GA | (a) | 568 | 648 | — | — | 568 | 648 | 1,216 | (128 | ) | 2002 | 02/02/12 | 15 to 30 Years | ||||||||||||||||||||
| Harlingen, TX | (c) | 923 | 753 | — | — | 923 | 753 | 1,676 | (93 | ) | 1985 | 07/17/13 | 10 to 35 Years | ||||||||||||||||||||
| Harlingen, TX | (c) | 226 | 519 | — | — | 226 | 519 | 745 | (89 | ) | 1973 | 07/17/13 | 11 to 30 Years | ||||||||||||||||||||
| Harriman, TN | (a) | 387 | 502 | — | — | 387 | 502 | 889 | (263 | ) | 1976 | 09/01/05 | 15 to 20 Years | ||||||||||||||||||||
| Harrisburg, NC | (a) | 489 | 291 | — | — | 489 | 291 | 780 | (60 | ) | 2004 | 09/17/13 | 15 to 30 Years | ||||||||||||||||||||
| Harrisonville, MO | (a) | 369 | 1,195 | — | — | 369 | 1,195 | 1,564 | (151 | ) | 1981 | 12/24/13 | 15 to 30 Years | ||||||||||||||||||||
| Harvey, IL | (a) | 361 | 269 | (80 | ) | — | 281 | 269 | 550 | (346 | ) | 1978 | 05/25/05 | 15 to 20 Years | |||||||||||||||||||
| Hattiesburg, MS | (a) | 845 | 995 | — | — | 845 | 995 | 1,840 | (107 | ) | 2010 | 07/14/14 | 15 to 40 Years | ||||||||||||||||||||
| Havana, IL | (a) | 439 | 297 | — | — | 439 | 297 | 736 | (184 | ) | 1980 | 12/21/12 | 10 to 15 Years | ||||||||||||||||||||
| Hawkinsville, GA | (a) | 169 | 946 | — | — | 169 | 946 | 1,115 | (119 | ) | 1986 | 12/24/13 | 15 to 30 Years | ||||||||||||||||||||
| Henderson, KY | (a) | 656 | 1,058 | — | — | 656 | 1,058 | 1,714 | (135 | ) | 1992 | 07/17/13 | 7 to 35 Years | ||||||||||||||||||||
| Hickory, NC | (a) | 292 | 818 | — | — | 292 | 818 | 1,110 | (287 | ) | 2000 | 09/29/06 | 15 to 40 Years | ||||||||||||||||||||
| Hickory, NC | (a) | 1,105 | 851 | — | — | 1,105 | 851 | 1,956 | (652 | ) | 1995 | 12/29/06 | 13 to 28 Years | ||||||||||||||||||||
| Hidalgo, TX | (c) | 352 | 1,043 | — | — | 352 | 1,043 | 1,395 | (141 | ) | 2001 | 07/17/13 | 10 to 31 Years | ||||||||||||||||||||
| Hiram, GA | (a) | 1,006 | 1,142 | — | — | 1,006 | 1,142 | 2,148 | (530 | ) | 1987 | 02/28/06 | 15 to 30 Years | ||||||||||||||||||||
| Hobbs, NM | (c) | 706 | 534 | — | — | 706 | 534 | 1,240 | (91 | ) | 1974 | 07/17/13 | 11 to 35 Years | ||||||||||||||||||||
| Holly Springs, MS | (a) | 116 | — | — | — | 116 | — | 116 | — | (f) | 10/30/13 | (f) | |||||||||||||||||||||
| Initial Cost to Company | Cost Capitalized Subsequent to Acquisition including impairment | Gross Amount at December 31, | Life in which depreciation in latest Statement of Operations is computed | ||||||||||||||||||||||
| Description | Encumbrances | Land and Improvements | Buildings and Improvements | Improvements/ Land | Improvements/ building | Land and Improvements | Buildings and Improvements | Total | Final Accum | Date of Construction | Date Acquired | ||||||||||||||
| Detroit, MI | (a) | 413 | 235 | — | — | 413 | 235 | 648 | (124 | ) | 1977 | 05/25/05 | 15 to 20 years | ||||||||||||||||||||
| Detroit, MI | (a) | 301 | 219 | — | — | 301 | 219 | 520 | (111 | ) | 1972 | 05/25/05 | 15 to 20 years | ||||||||||||||||||||
| Detroit, MI | (a) | 270 | 305 | — | — | 270 | 305 | 575 | (134 | ) | 1976 | 05/25/05 | 15 to 20 years | ||||||||||||||||||||
| Detroit, MI | (a) | 271 | 157 | — | — | 271 | 157 | 428 | (85 | ) | 1978 | 05/25/05 | 15 to 20 years | ||||||||||||||||||||
| Detroit, MI | (a) | 385 | 258 | — | — | 385 | 258 | 643 | (139 | ) | 1979 | 05/25/05 | 15 to 20 years | ||||||||||||||||||||
| Detroit, MI | (a) | 428 | 189 | — | — | 428 | 189 | 617 | (103 | ) | 1979 | 05/25/05 | 15 to 20 years | ||||||||||||||||||||
| Detroit, MI | (a) | 614 | 688 | — | — | 614 | 688 | 1,302 | (328 | ) | 1987 | 12/21/07 | 13 to 18 years | ||||||||||||||||||||
| D'Iberville, MS | (b) | 597 | 995 | — | — | 597 | 995 | 1,592 | (18 | ) | 2005 | 07/14/14 | 15 to 30 Years | ||||||||||||||||||||
| Donna, TX | (c ) | 1,091 | 540 | — | — | 1,091 | 540 | 1,631 | (33 | ) | 1984 | 07/17/13 | 10 to 35 Years | ||||||||||||||||||||
| Douglasville, GA | (a) | 452 | 570 | — | — | 452 | 570 | 1,022 | (64 | ) | 1974 | 02/02/12 | 15 to 30 years | ||||||||||||||||||||
| Durham, NC | (a) | 1,253 | — | — | — | 1,253 | — | 1,253 | — | (f) | 07/17/13 | 26 to 26 Years | |||||||||||||||||||||
| Eagle Pass, TX | (c ) | 597 | 385 | — | — | 597 | 385 | 982 | (27 | ) | 1977 | 07/17/13 | 9 to 35 Years | ||||||||||||||||||||
| East Aurora, NY | (a) | 424 | 584 | — | — | 424 | 584 | 1,008 | (268 | ) | 1982 | 11/10/05 | 15 to 20 years | ||||||||||||||||||||
| East Ellijay, GA | (a) | 562 | 354 | — | — | 562 | 354 | 916 | (192 | ) | 1984 | 12/29/05 | 15 to 20 years | ||||||||||||||||||||
| East Moline, IL | (a) | 415 | 471 | — | — | 415 | 471 | 886 | (95 | ) | 1982 | 10/03/11 | 15 to 20 years | ||||||||||||||||||||
| East Point, GA | (c ) | 429 | 245 | — | — | 429 | 245 | 674 | (40 | ) | 1977 | 07/17/13 | 11 to 21 Years | ||||||||||||||||||||
| East St. Louis, IL | (a) | 117 | 334 | — | — | 117 | 334 | 451 | (112 | ) | 1990 | 05/25/05 | 15 to 30 years | ||||||||||||||||||||
| Edinburg, TX | (c ) | 624 | 888 | — | — | 624 | 888 | 1,512 | (48 | ) | 1985 | 07/17/13 | 11 to 35 Years | ||||||||||||||||||||
| Effingham, IL | (a) | 539 | 575 | — | — | 539 | 575 | 1,114 | (221 | ) | 1985 | 09/23/05 | 15 to 30 years | ||||||||||||||||||||
| Elizabethton, TN | (a) | 655 | 129 | — | — | 655 | 129 | 784 | (178 | ) | 1993 | 12/15/04 | 15 to 20 years | ||||||||||||||||||||
| Elizabethton, TN | (a) | 735 | 278 | — | — | 735 | 278 | 1,013 | (51 | ) | 1971 | 12/21/12 | 15 to 20 years | ||||||||||||||||||||
| Elmwood Park, IL | (a) | 650 | 380 | — | — | 650 | 380 | 1,030 | (179 | ) | 1993 | 09/23/05 | 15 to 20 years | ||||||||||||||||||||
| Elsa, TX | (c ) | 1,159 | 141 | — | — | 1,159 | 141 | 1,300 | (17 | ) | 1984 | 07/17/13 | 11 to 35 Years | ||||||||||||||||||||
| Emporia, KS | (a) | 508 | 1,175 | — | — | 508 | 1,175 | 1,683 | (51 | ) | 1969 | 12/24/13 | 15 to 30 Years | ||||||||||||||||||||
| Escanaba, MI | (a) | 772 | 767 | — | — | 772 | 767 | 1,539 | (369 | ) | 1984 | 12/29/05 | 15 to 20 years | ||||||||||||||||||||
| Eureka, IL | (a) | 307 | 338 | — | — | 307 | 338 | 645 | (95 | ) | 1980 | 12/21/12 | 10 to 15 years | ||||||||||||||||||||
| Eustis, FL | (a) | 451 | 377 | — | — | 451 | 377 | 828 | (324 | ) | 1969 | 12/30/04 | 10 to 15 years | ||||||||||||||||||||
| Fayetteville, AR | (a) | 1,019 | 1,150 | — | — | 1,019 | 1,150 | 2,169 | (24 | ) | 2014 | 06/23/14 | 15 to 40 Years | ||||||||||||||||||||
| Fayetteville, NC | (a) | 470 | 629 | — | — | 470 | 629 | 1,099 | (222 | ) | 1999 | 09/29/06 | 15 to 30 years | ||||||||||||||||||||
| Fayetteville, NC | (a) | 489 | 612 | — | — | 489 | 612 | 1,101 | (204 | ) | 1987 | 09/29/06 | 15 to 30 years | ||||||||||||||||||||
| Fayetteville, NC | (a) | 607 | 1,020 | — | — | 607 | 1,020 | 1,627 | (386 | ) | 1996 | 09/29/06 | 15 to 30 years | ||||||||||||||||||||
| Hope Mills, NC | (a) | 408 | 930 | — | — | 408 | 930 | 1,338 | (369 | ) | 1990 | 09/29/06 | 15 to 30 Years | ||||||||||||||||||||
| Horn Lake, MS | (a) | 231 | — | — | — | 231 | — | 231 | — | (f) | 10/30/13 | (f) | |||||||||||||||||||||
| Houston, TX | (a) | 592 | 302 | — | — | 592 | 302 | 894 | (178 | ) | 1979 | 09/28/06 | 15 to 20 Years | ||||||||||||||||||||
| Houston, TX | (a) | 1,329 | — | — | — | 1,329 | — | 1,329 | — | (f) | 07/17/13 | (f) | |||||||||||||||||||||
| Hudson, NC | (a) | 794 | 616 | — | — | 794 | 616 | 1,410 | (279 | ) | 1998 | 09/29/06 | 15 to 40 Years | ||||||||||||||||||||
| Hurst, TX | (c) | 505 | 66 | — | — | 505 | 66 | 571 | (6 | ) | 1978 | 06/30/16 | 5 to 10 Years | ||||||||||||||||||||
| Independence, MO | (a) | 396 | 1,074 | — | — | 396 | 1,074 | 1,470 | (240 | ) | 1984 | 10/03/11 | 15 to 30 Years | ||||||||||||||||||||
| Independence, MO | (a) | 279 | 936 | — | — | 279 | 936 | 1,215 | (118 | ) | 1979 | 12/24/13 | 15 to 30 Years | ||||||||||||||||||||
| Indianapolis, IN | (a) | 460 | 587 | — | — | 460 | 587 | 1,047 | (251 | ) | 1998 | 09/24/04 | 15 to 30 Years | ||||||||||||||||||||
| Indianapolis, IN | (a) | 258 | 262 | — | — | 258 | 262 | 520 | (184 | ) | 1970 | 05/25/05 | 15 to 20 Years | ||||||||||||||||||||
| Indianapolis, IN | (a) | 266 | 310 | — | — | 266 | 310 | 576 | (197 | ) | 1971 | 05/25/05 | 15 to 20 Years | ||||||||||||||||||||
| Indianapolis, IN | (a) | 170 | 749 | — | — | 170 | 749 | 919 | (386 | ) | 1983 | 05/25/05 | 15 to 20 Years | ||||||||||||||||||||
| Indianapolis, IN | (a) | 449 | 153 | — | — | 449 | 153 | 602 | (140 | ) | 1968 | 05/25/05 | 15 to 20 Years | ||||||||||||||||||||
| Indianapolis, IN | (a) | 370 | 150 | — | — | 370 | 150 | 520 | (125 | ) | 1970 | 05/25/05 | 15 to 20 Years | ||||||||||||||||||||
| Irving, TX | (c) | 463 | 338 | — | — | 463 | 338 | 801 | (47 | ) | 1967 | 07/17/13 | 10 to 35 Years | ||||||||||||||||||||
| Irving, TX | (c) | 481 | 358 | — | — | 481 | 358 | 839 | (13 | ) | 1978 | 06/30/16 | 5 to 20 Years | ||||||||||||||||||||
| Jackson, GA | (a) | 467 | 729 | — | — | 467 | 729 | 1,196 | (168 | ) | 1992 | 02/02/12 | 15 to 30 Years | ||||||||||||||||||||
| Jackson, MS | (c) | 215 | 476 | — | — | 215 | 476 | 691 | (88 | ) | 1977 | 07/17/13 | 11 to 25 Years | ||||||||||||||||||||
| Jackson, MS | (c) | 996 | 610 | — | — | 996 | 610 | 1,606 | (97 | ) | 1978 | 07/17/13 | 11 to 35 Years | ||||||||||||||||||||
| Jackson, MS | (c) | 195 | 582 | — | — | 195 | 582 | 777 | (89 | ) | 2000 | 07/17/13 | 11 to 30 Years | ||||||||||||||||||||
| Jackson, MS | (c) | 447 | 555 | — | — | 447 | 555 | 1,002 | (95 | ) | 1998 | 07/17/13 | 11 to 35 Years | ||||||||||||||||||||
| Jacksonville, FL | (a) | 480 | 631 | — | — | 480 | 631 | 1,111 | (294 | ) | 1998 | 09/24/04 | 15 to 30 Years | ||||||||||||||||||||
| Jacksonville, FL | (a) | 872 | 509 | — | — | 872 | 509 | 1,381 | (331 | ) | 1984 | 09/24/04 | 15 to 20 Years | ||||||||||||||||||||
| Jacksonville, FL | (a) | 487 | 871 | — | — | 487 | 871 | 1,358 | (460 | ) | 1985 | 12/30/04 | 15 to 20 Years | ||||||||||||||||||||
| Jamestown, NY | (a) | 508 | 573 | — | — | 508 | 573 | 1,081 | (339 | ) | 1988 | 11/10/05 | 15 to 20 Years | ||||||||||||||||||||
| Johnson City, TN | (a) | 718 | 450 | — | — | 718 | 450 | 1,168 | (165 | ) | 1983 | 12/21/12 | 15 to 20 Years | ||||||||||||||||||||
| Joliet, IL | (a) | 245 | 193 | — | — | 245 | 193 | 438 | (140 | ) | 1985 | 05/25/05 | 15 to 20 Years | ||||||||||||||||||||
| Jonesboro, GA | (c) | 680 | 1,736 | — | — | 680 | 1,736 | 2,416 | (102 | ) | 2006 | 07/01/15 | 15 to 30 Years | ||||||||||||||||||||
| Jonesborough, TN | (a) | 576 | 329 | — | — | 576 | 329 | 905 | (108 | ) | 1987 | 12/21/12 | 15 to 20 Years | ||||||||||||||||||||
| Kannapolix, NC | (a) | 244 | 291 | — | — | 244 | 291 | 535 | (54 | ) | 2001 | 09/17/13 | 15 to 30 Years | ||||||||||||||||||||
| Kansas City, KS | (a) | 349 | 425 | — | — | 349 | 425 | 774 | (96 | ) | 1977 | 10/03/11 | 14 to 29 Years | ||||||||||||||||||||
| Kansas City, KS | (a) | 594 | 904 | — | — | 594 | 904 | 1,498 | (213 | ) | 1999 | 10/03/11 | 15 to 30 Years | ||||||||||||||||||||
| Kansas City, KS | (a) | 289 | 1,066 | — | — | 289 | 1,066 | 1,355 | (134 | ) | 1980 | 12/24/13 | 15 to 30 Years | ||||||||||||||||||||
| Kansas City, MO | (c) | 312 | 574 | — | — | 312 | 574 | 886 | (91 | ) | 1996 | 07/17/13 | 10 to 30 Years | ||||||||||||||||||||
| Kansas City, MO | (c) | 348 | 730 | — | — | 348 | 730 | 1,078 | (101 | ) | 1996 | 07/17/13 | 10 to 35 Years | ||||||||||||||||||||
| Kansas City, MO | (c) | 462 | 673 | — | — | 462 | 673 | 1,135 | (95 | ) | 1996 | 07/17/13 | 10 to 35 Years | ||||||||||||||||||||
| Initial Cost to Company | Cost Capitalized Subsequent to Acquisition including impairment | Gross Amount at December 31, | Life in which depreciation in latest Statement of Operations is computed | ||||||||||||||||||||||
| Description | Encumbrances | Land and Improvements | Buildings and Improvements | Improvements/ Land | Improvements/ building | Land and Improvements | Buildings and Improvements | Total | Final Accum | Date of Construction | Date Acquired | ||||||||||||||
| Ferguson, MO | (a) | 293 | 212 | — | — | 293 | 212 | 505 | (117 | ) | 1974 | 05/25/05 | 15 to 20 years | ||||||||||||||||||||
| Flint, MI | (a) | 340 | 258 | — | — | 340 | 258 | 598 | (137 | ) | 1979 | 05/25/05 | 15 to 20 years | ||||||||||||||||||||
| Florence, KY | (a) | 524 | 209 | — | — | 524 | 209 | 733 | (131 | ) | 1992 | 09/24/04 | 15 to 30 years | ||||||||||||||||||||
| Floresville, TX | (c ) | 109 | 555 | — | — | 109 | 555 | 664 | (42 | ) | 1985 | 07/17/13 | 9 to 25 Years | ||||||||||||||||||||
| Flowood, MS | (b) | 338 | 848 | — | — | 338 | 848 | 1,186 | (15 | ) | 1994 | 07/31/14 | 15 to 30 Years | ||||||||||||||||||||
| Forsyth, GA | (a) | 495 | 1,007 | — | — | 495 | 1,007 | 1,502 | (333 | ) | 1984 | 01/12/06 | 15 to 30 years | ||||||||||||||||||||
| Forsythe, GA | (a) | 249 | 936 | — | — | 249 | 936 | 1,185 | (41 | ) | 1983 | 12/24/13 | 15 to 30 Years | ||||||||||||||||||||
| Fort Lauderdale, FL | (a) | 601 | 121 | — | — | 601 | 121 | 722 | (158 | ) | 1984 | 09/24/04 | 10 to 15 years | ||||||||||||||||||||
| Fort Pierce, FL | (a) | 667 | 184 | — | — | 667 | 184 | 851 | (109 | ) | 1999 | 09/24/04 | 15 to 30 years | ||||||||||||||||||||
| Fort Wayne, IN | (a) | 660 | 204 | — | — | 660 | 204 | 864 | (223 | ) | 1982 | 09/23/05 | 10 to 15 years | ||||||||||||||||||||
| Fort Worth, TX | (c ) | 157 | 263 | — | — | 157 | 263 | 420 | (30 | ) | 1965 | 07/17/13 | 11 to 20 Years | ||||||||||||||||||||
| Fort Worth, TX | (c ) | 164 | 573 | — | — | 164 | 573 | 737 | (39 | ) | 1965 | 07/17/13 | 11 to 25 Years | ||||||||||||||||||||
| Fort Worth, TX | (c ) | 200 | 643 | — | — | 200 | 643 | 843 | (42 | ) | 1979 | 07/17/13 | 11 to 30 Years | ||||||||||||||||||||
| Fort Worth, TX | (c ) | 356 | 572 | — | — | 356 | 572 | 928 | (36 | ) | 1970 | 07/17/13 | 11 to 35 Years | ||||||||||||||||||||
| Fort Worth, TX | (c ) | 187 | 539 | — | — | 187 | 539 | 726 | (33 | ) | 1984 | 07/17/13 | 11 to 35 Years | ||||||||||||||||||||
| Ft Madison, IA | (a) | 191 | 620 | — | — | 191 | 620 | 811 | (57 | ) | 1980 | 12/21/12 | 15 to 30 years | ||||||||||||||||||||
| Ft. Valley, GA | (c ) | 353 | 379 | — | — | 353 | 379 | 732 | (44 | ) | 1985 | 07/17/13 | 11 to 23 Years | ||||||||||||||||||||
| Garland, TX | (c ) | 141 | 455 | — | — | 141 | 455 | 596 | (34 | ) | 1986 | 07/17/13 | 10 to 25 Years | ||||||||||||||||||||
| Garner, NC | (a) | 600 | 765 | — | — | 600 | 765 | 1,365 | (281 | ) | 1995 | 09/29/06 | 15 to 30 years | ||||||||||||||||||||
| Gary, IN | (a) | 109 | 410 | — | — | 109 | 410 | 519 | (178 | ) | 1980 | 05/25/05 | 15 to 20 years | ||||||||||||||||||||
| Gary, IN | (a) | 210 | 318 | — | — | 210 | 318 | 528 | (171 | ) | 1979 | 05/25/05 | 15 to 20 years | ||||||||||||||||||||
| Gary, IN | (a) | 161 | 493 | — | — | 161 | 493 | 654 | (225 | ) | 1973 | 05/25/05 | 15 to 20 years | ||||||||||||||||||||
| Gilman, IL | (a) | 219 | 414 | — | — | 219 | 414 | 633 | (223 | ) | 1998 | 09/23/05 | 15 to 20 years | ||||||||||||||||||||
| Graceville, FL | (a) | 279 | 1,036 | — | — | 279 | 1,036 | 1,315 | (46 | ) | 1985 | 12/24/13 | 15 to 30 Years | ||||||||||||||||||||
| Grand Prairie, TX | (c ) | 335 | 527 | — | — | 335 | 527 | 862 | (32 | ) | 1980 | 07/17/13 | 10 to 35 Years | ||||||||||||||||||||
| Grand Prairie, TX | (c ) | 147 | 535 | — | — | 147 | 535 | 682 | (36 | ) | 1985 | 07/17/13 | 11 to 30 Years | ||||||||||||||||||||
| Greensboro, AL | (c ) | 100 | 663 | — | — | 100 | 663 | 763 | (39 | ) | 1986 | 07/17/13 | 7 to 35 Years | ||||||||||||||||||||
| Greenville, TN | (a) | 289 | 311 | — | — | 289 | 311 | 600 | (252 | ) | 1972 | 09/01/05 | 10 to 15 years | ||||||||||||||||||||
| Greenville, TN | (a) | 735 | 517 | — | — | 735 | 517 | 1,252 | (49 | ) | 2010 | 03/29/13 | 15 to 30 Years | ||||||||||||||||||||
| Greenville, TX | (c ) | 325 | 441 | — | — | 325 | 441 | 766 | (25 | ) | 1972 | 07/17/13 | 10 to 35 Years | ||||||||||||||||||||
| Greenville, TX | (a) | 223 | 304 | — | — | 223 | 304 | 527 | (134 | ) | 1985 | 12/29/05 | 15 to 20 years | ||||||||||||||||||||
| Griffin, GA | (c ) | 215 | 492 | — | — | 215 | 492 | 707 | (40 | ) | 1978 | 07/17/13 | 11 to 25 Years | ||||||||||||||||||||
| Griffin, GA | (a) | 249 | 877 | — | — | 249 | 877 | 1,126 | (37 | ) | 1979 | 12/24/13 | 15 to 30 Years | ||||||||||||||||||||
| Gulfport, MS | (c ) | 540 | 429 | — | — | 540 | 429 | 969 | (23 | ) | 1971 | 07/17/13 | 11 to 35 Years | ||||||||||||||||||||
| Haltom City, TX | (c ) | 571 | 425 | — | — | 571 | 425 | 996 | (27 | ) | 2007 | 07/17/13 | 11 to 35 Years | ||||||||||||||||||||
| Kansas City, MO | (c) | 135 | 616 | — | — | 135 | 616 | 751 | (106 | ) | 1996 | 07/17/13 | 10 to 25 Years | ||||||||||||||||||||
| Kansas City, MO | (c) | 310 | 580 | — | — | 310 | 580 | 890 | (92 | ) | 1996 | 07/17/13 | 10 to 31 Years | ||||||||||||||||||||
| Kansas City, MO | (c) | 189 | 837 | — | — | 189 | 837 | 1,026 | (144 | ) | 1996 | 07/17/13 | 9 to 25 Years | ||||||||||||||||||||
| Kansas City, MO | (a) | 538 | 936 | — | — | 538 | 936 | 1,474 | (126 | ) | 1979 | 12/24/13 | 15 to 30 Years | ||||||||||||||||||||
| Kansas City, MO | (c) | 772 | 18 | — | 916 | 772 | 934 | 1,706 | (23 | ) | 1995 | 09/19/14 | 40 to 40 Years | ||||||||||||||||||||
| Keene, TX | (c) | 343 | 260 | — | — | 343 | 260 | 603 | (11 | ) | 2005 | 07/25/16 | 13 to 30 Years | ||||||||||||||||||||
| Kennesaw, GA | (a) | 907 | 499 | — | — | 907 | 499 | 1,406 | (241 | ) | 2001 | 02/28/06 | 15 to 40 Years | ||||||||||||||||||||
| Kilgore, TX | (c) | 140 | 415 | — | — | 140 | 415 | 555 | (97 | ) | 1985 | 07/17/13 | 11 to 20 Years | ||||||||||||||||||||
| Killeen, TX | (c) | 289 | 513 | — | — | 289 | 513 | 802 | (72 | ) | 1974 | 07/17/13 | 9 to 35 Years | ||||||||||||||||||||
| Kingsport, TN | (a) | 592 | 200 | — | — | 592 | 200 | 792 | (324 | ) | 1992 | 07/01/05 | 15 to 20 Years | ||||||||||||||||||||
| Kingsport, TN | (a) | 384 | 877 | — | — | 384 | 877 | 1,261 | (168 | ) | 1992 | 12/21/12 | 15 to 30 Years | ||||||||||||||||||||
| Kingsport, TN | (c) | 307 | 766 | — | — | 307 | 766 | 1,073 | (113 | ) | 2007 | 07/17/13 | 4 to 32 Years | ||||||||||||||||||||
| Kingston, PA | (c) | 521 | 635 | — | — | 521 | 635 | 1,156 | (56 | ) | 1978 | 11/18/14 | 15 to 30 Years | ||||||||||||||||||||
| Kingsville, TX | (c) | 263 | 461 | — | — | 263 | 461 | 724 | (67 | ) | 1977 | 07/17/13 | 9 to 35 Years | ||||||||||||||||||||
| Kingwood, WV | (a) | 618 | 677 | — | — | 618 | 677 | 1,295 | (183 | ) | 1979 | 12/21/12 | 15 to 20 Years | ||||||||||||||||||||
| Kirby, TX | (c) | 224 | 262 | — | — | 224 | 262 | 486 | (69 | ) | 1985 | 07/17/13 | 9 to 18 Years | ||||||||||||||||||||
| Knoxville, TN | (a) | 635 | 227 | — | — | 635 | 227 | 862 | (286 | ) | 1995 | 07/01/05 | 15 to 20 Years | ||||||||||||||||||||
| Knoxville, TN | (a) | 547 | 230 | — | — | 547 | 230 | 777 | (358 | ) | 1987 | 07/01/05 | 10 to 15 Years | ||||||||||||||||||||
| Knoxville, TN | (a) | 332 | 185 | — | — | 332 | 185 | 517 | (120 | ) | 1977 | 09/01/05 | 15 to 20 Years | ||||||||||||||||||||
| La Feria, TX | (c) | 369 | 941 | — | — | 369 | 941 | 1,310 | (118 | ) | 2003 | 07/17/13 | 11 to 35 Years | ||||||||||||||||||||
| La Vista, NE | (a) | 499 | 664 | — | — | 499 | 664 | 1,163 | (144 | ) | 1992 | 10/03/11 | 15 to 30 Years | ||||||||||||||||||||
| Lafayette, LA | (a) | 300 | 779 | — | — | 300 | 779 | 1,079 | (97 | ) | 1972 | 10/30/13 | 15 to 30 Years | ||||||||||||||||||||
| LaGrange, GA | (c) | 555 | 44 | — | — | 555 | 44 | 599 | (135 | ) | 1978 | 07/17/13 | 7 to 30 Years | ||||||||||||||||||||
| Lake Worth, TX | (c) | 427 | 872 | — | — | 427 | 872 | 1,299 | (19 | ) | 1983 | 06/30/16 | 5 to 30 Years | ||||||||||||||||||||
| Laredo, TX | (c) | 272 | 713 | — | — | 272 | 713 | 985 | (85 | ) | 1966 | 07/17/13 | 11 to 35 Years | ||||||||||||||||||||
| Laredo, TX | (c) | 727 | 698 | — | — | 727 | 698 | 1,425 | (88 | ) | 1968 | 07/17/13 | 11 to 35 Years | ||||||||||||||||||||
| Lauderdale Lakes, FL | (a) | 411 | 346 | — | — | 411 | 346 | 757 | (149 | ) | 1998 | 12/29/06 | 15 to 30 Years | ||||||||||||||||||||
| Laurel, MS | (c) | 690 | 290 | — | — | 690 | 290 | 980 | (74 | ) | 1971 | 07/17/13 | 11 to 24 Years | ||||||||||||||||||||
| Laurel, MS | (a) | 543 | 754 | — | — | 543 | 754 | 1,297 | (88 | ) | 1993 | 09/22/14 | 15 to 30 Years | ||||||||||||||||||||
| Lavon, TX | (c) | 404 | 212 | — | — | 404 | 212 | 616 | (12 | ) | 2003 | 07/25/16 | 13 to 20 Years | ||||||||||||||||||||
| Lees Summit, MO | (a) | 590 | 69 | 55 | (69 | ) | 645 | — | 645 | — | (f) | 09/23/05 | (f) | ||||||||||||||||||||
| Lees Summit, MO | (a) | 319 | 906 | — | — | 319 | 906 | 1,225 | (119 | ) | 1985 | 12/24/13 | 15 to 30 Years | ||||||||||||||||||||
| Leonard, TX | (c) | 323 | 465 | — | — | 323 | 465 | 788 | (14 | ) | 2005 | 07/25/16 | 13 to 30 Years | ||||||||||||||||||||
| Lewisville, TX | (c) | 913 | 470 | — | — | 913 | 470 | 1,383 | (84 | ) | 1976 | 07/17/13 | 8 to 35 Years | ||||||||||||||||||||
| Lexington, KY | (a) | 636 | 362 | — | — | 636 | 362 | 998 | (396 | ) | 1978 | 12/30/04 | 10 to 15 Years | ||||||||||||||||||||
| Lexington, KY | (a) | 713 | 451 | — | — | 713 | 451 | 1,164 | (495 | ) | 1976 | 01/26/05 | 10 to 15 Years | ||||||||||||||||||||
| Lillington, NC | (a) | 419 | 687 | — | — | 419 | 687 | 1,106 | (249 | ) | 1992 | 09/29/06 | 15 to 40 Years | ||||||||||||||||||||
| Initial Cost to Company | Cost Capitalized Subsequent to Acquisition including impairment | Gross Amount at December 31, | Life in which depreciation in latest Statement of Operations is computed | ||||||||||||||||||||||
| Description | Encumbrances | Land and Improvements | Buildings and Improvements | Improvements/ Land | Improvements/ building | Land and Improvements | Buildings and Improvements | Total | Final Accum | Date of Construction | Date Acquired | ||||||||||||||
| Hampton, GA | (a) | 568 | 648 | — | — | 568 | 648 | 1,216 | (76 | ) | 2002 | 02/02/12 | 15 to 30 years | ||||||||||||||||||||
| Harlingen, TX | (c ) | 923 | 753 | — | — | 923 | 753 | 1,676 | (39 | ) | 1985 | 07/17/13 | 10 to 35 Years | ||||||||||||||||||||
| Harlingen, TX | (c ) | 226 | 519 | — | — | 226 | 519 | 745 | (37 | ) | 1973 | 07/17/13 | 11 to 30 Years | ||||||||||||||||||||
| Harriman, TN | (a) | 387 | 502 | — | — | 387 | 502 | 889 | (207 | ) | 1976 | 09/01/05 | 15 to 20 years | ||||||||||||||||||||
| Harrisburg, NC | (a) | 489 | 291 | — | — | 489 | 291 | 780 | (23 | ) | 2004 | 09/17/13 | 15 to 30 Years | ||||||||||||||||||||
| Harrisonville, MO | (a) | 369 | 1,195 | — | — | 369 | 1,195 | 1,564 | (50 | ) | 1981 | 12/24/13 | 15 to 30 Years | ||||||||||||||||||||
| Harvey, IL | (a) | 361 | 269 | (80 | ) | — | 281 | 269 | 550 | (310 | ) | 1978 | 05/25/05 | 15 to 20 years | |||||||||||||||||||
| Hattiesburg, MS | (b) | 845 | 995 | — | — | 845 | 995 | 1,840 | (18 | ) | 1999 | 07/14/14 | 15 to 40 Years | ||||||||||||||||||||
| Havana, IL | (a) | 439 | 297 | — | — | 439 | 297 | 736 | (92 | ) | 1980 | 12/21/12 | 10 to 15 years | ||||||||||||||||||||
| Hawkinsville, GA | (a) | 169 | 946 | — | — | 169 | 946 | 1,115 | (40 | ) | 1986 | 12/24/13 | 15 to 30 Years | ||||||||||||||||||||
| Henderson, KY | (a) | 656 | 1,058 | — | — | 656 | 1,058 | 1,714 | (56 | ) | 1992 | 07/17/13 | 7 to 35 Years | ||||||||||||||||||||
| Hickory, NC | (a) | 292 | 818 | — | — | 292 | 818 | 1,110 | (226 | ) | 2000 | 09/29/06 | 15 to 40 years | ||||||||||||||||||||
| Hidalgo, TX | (c ) | 352 | 1,043 | — | — | 352 | 1,043 | 1,395 | (59 | ) | 2001 | 07/17/13 | 10 to 31 Years | ||||||||||||||||||||
| Hobbs, NM | (c ) | 706 | 534 | — | — | 706 | 534 | 1,240 | (38 | ) | 1974 | 07/17/13 | 11 to 35 Years | ||||||||||||||||||||
| Holly Springs, MS | (a) | 116 | — | — | — | 116 | — | 116 | — | (f) | 10/30/13 | 12 to 12 Years | |||||||||||||||||||||
| Hope Mills, NC | (a) | 408 | 930 | — | — | 408 | 930 | 1,338 | (291 | ) | 1990 | 09/29/06 | 15 to 30 years | ||||||||||||||||||||
| Horn Lake, MS | (a) | 231 | — | — | — | 231 | — | 231 | — | (f) | 10/30/13 | 12 to 12 Years | |||||||||||||||||||||
| Houston, TX | (a) | 1,329 | — | — | — | 1,329 | — | 1,329 | — | (f) | 07/17/13 | 20 to 20 Years | |||||||||||||||||||||
| Houston, TX | (a) | 592 | 302 | — | — | 592 | 302 | 894 | (140 | ) | 1979 | 09/28/06 | 15 to 20 years | ||||||||||||||||||||
| Hudson, NC | (a) | 794 | 616 | — | — | 794 | 616 | 1,410 | (220 | ) | 1998 | 09/29/06 | 15 to 40 years | ||||||||||||||||||||
| Independence, MO | (a) | 279 | 936 | — | — | 279 | 936 | 1,215 | (39 | ) | 1979 | 12/24/13 | 15 to 30 Years | ||||||||||||||||||||
| Independence, MO | (a) | 396 | 1,074 | — | — | 396 | 1,074 | 1,470 | (148 | ) | 1984 | 10/03/11 | 15 to 30 years | ||||||||||||||||||||
| Indianapolis, IN | (a) | 460 | 587 | — | — | 460 | 587 | 1,047 | (198 | ) | 1998 | 09/24/04 | 15 to 30 years | ||||||||||||||||||||
| Indianapolis, IN | (a) | 258 | 262 | — | — | 258 | 262 | 520 | (145 | ) | 1970 | 05/25/05 | 15 to 20 years | ||||||||||||||||||||
| Indianapolis, IN | (a) | 266 | 310 | — | — | 266 | 310 | 576 | (155 | ) | 1971 | 05/25/05 | 15 to 20 years | ||||||||||||||||||||
| Indianapolis, IN | (a) | 170 | 749 | — | — | 170 | 749 | 919 | (304 | ) | 1983 | 05/25/05 | 15 to 20 years | ||||||||||||||||||||
| Indianapolis, IN | (a) | 449 | 153 | — | — | 449 | 153 | 602 | (110 | ) | 1968 | 05/25/05 | 15 to 20 years | ||||||||||||||||||||
| Indianapolis, IN | (a) | 370 | 150 | — | — | 370 | 150 | 520 | (98 | ) | 1970 | 05/25/05 | 15 to 20 years | ||||||||||||||||||||
| Irving, TX | (c ) | 463 | 338 | — | — | 463 | 338 | 801 | (20 | ) | 1967 | 07/17/13 | 10 to 35 Years | ||||||||||||||||||||
| Jackson, GA | (a) | 467 | 729 | — | — | 467 | 729 | 1,196 | (98 | ) | 1992 | 02/02/12 | 15 to 30 years | ||||||||||||||||||||
| Jackson, MS | (c ) | 215 | 476 | — | — | 215 | 476 | 691 | (37 | ) | 1977 | 07/17/13 | 11 to 25 Years | ||||||||||||||||||||
| Jackson, MS | (c ) | 996 | 610 | — | — | 996 | 610 | 1,606 | (40 | ) | 1978 | 07/17/13 | 11 to 35 Years | ||||||||||||||||||||
| Jackson, MS | (c ) | 195 | 582 | — | — | 195 | 582 | 777 | (37 | ) | 2000 | 07/17/13 | 11 to 30 Years | ||||||||||||||||||||
| Lincoln, IL | (a) | 203 | 616 | — | — | 203 | 616 | 819 | (360 | ) | 1990 | 09/23/05 | 15 to 20 Years | ||||||||||||||||||||
| Little Elm, TX | (c) | 620 | 244 | — | — | 620 | 244 | 864 | (14 | ) | 2001 | 07/25/16 | 13 to 20 Years | ||||||||||||||||||||
| Little Rock, AR | (a) | 917 | 847 | — | — | 917 | 847 | 1,764 | (389 | ) | 2004 | 07/07/05 | 15 to 30 Years | ||||||||||||||||||||
| Little Rock, AR | (c) | 99 | 500 | — | — | 99 | 500 | 599 | (77 | ) | 1970 | 07/17/13 | 8 to 30 Years | ||||||||||||||||||||
| Little Rock, AR | (c) | 332 | 432 | — | — | 332 | 432 | 764 | (61 | ) | 1971 | 07/17/13 | 9 to 35 Years | ||||||||||||||||||||
| Little Rock, AR | (c) | 263 | 492 | — | — | 263 | 492 | 755 | (71 | ) | 1975 | 07/17/13 | 9 to 35 Years | ||||||||||||||||||||
| Lone Tree, CO | (a) | 1,717 | 1,117 | — | — | 1,717 | 1,117 | 2,834 | (594 | ) | 2000 | 12/23/08 | 13 to 38 Years | ||||||||||||||||||||
| Longview, TX | (c) | 149 | 552 | — | — | 149 | 552 | 701 | (81 | ) | 1985 | 07/17/13 | 9 to 35 Years | ||||||||||||||||||||
| Louisville, KY | (a) | 334 | 251 | — | — | 334 | 251 | 585 | (143 | ) | 1991 | 09/24/04 | 15 to 20 Years | ||||||||||||||||||||
| Louisville, KY | (a) | 1,010 | 577 | — | — | 1,010 | 577 | 1,587 | (276 | ) | 1994 | 11/10/05 | 15 to 30 Years | ||||||||||||||||||||
| Louisville, KY | (a) | 854 | 514 | — | — | 854 | 514 | 1,368 | (249 | ) | 1994 | 11/10/05 | 15 to 30 Years | ||||||||||||||||||||
| Lubbock, TX | (a) | 687 | 856 | — | — | 687 | 856 | 1,543 | (390 | ) | 2003 | 07/07/05 | 15 to 30 Years | ||||||||||||||||||||
| Lubbock, TX | (c) | 325 | 794 | — | — | 325 | 794 | 1,119 | (114 | ) | 2004 | 07/17/13 | 11 to 34 Years | ||||||||||||||||||||
| Mableton, GA | (a) | 454 | 826 | — | — | 454 | 826 | 1,280 | (308 | ) | 1987 | 02/28/06 | 15 to 30 Years | ||||||||||||||||||||
| Mableton, GA | (a) | 634 | 578 | — | — | 634 | 578 | 1,212 | (239 | ) | 1981 | 02/28/06 | 15 to 30 Years | ||||||||||||||||||||
| Macon, GA | (c) | 291 | 628 | — | — | 291 | 628 | 919 | (85 | ) | 1983 | 07/17/13 | 10 to 35 Years | ||||||||||||||||||||
| Macon, GA | (c) | 195 | 347 | — | — | 195 | 347 | 542 | (74 | ) | 1976 | 07/17/13 | 9 to 25 Years | ||||||||||||||||||||
| Macon, GA | (c) | 185 | 553 | — | — | 185 | 553 | 738 | (89 | ) | 1980 | 07/17/13 | 11 to 30 Years | ||||||||||||||||||||
| Madison, GA | (a) | 892 | 739 | — | — | 892 | 739 | 1,631 | (329 | ) | 1989 | 01/12/06 | 15 to 40 Years | ||||||||||||||||||||
| Madisonville, KY | (a) | 1,198 | 819 | — | — | 1,198 | 819 | 2,017 | (384 | ) | 1990 | 09/24/04 | 15 to 30 Years | ||||||||||||||||||||
| Mansfield, OH | (a) | 225 | 327 | — | — | 225 | 327 | 552 | (184 | ) | 1972 | 05/25/05 | 15 to 20 Years | ||||||||||||||||||||
| Mansfield, TX | (a) | 472 | 760 | — | — | 472 | 760 | 1,232 | (387 | ) | 1991 | 12/29/06 | 15 to 30 Years | ||||||||||||||||||||
| Maplewood, MO | (a) | 180 | 225 | — | — | 180 | 225 | 405 | (139 | ) | 1980 | 05/25/05 | 15 to 20 Years | ||||||||||||||||||||
| Marietta, GA | (a) | 797 | 428 | — | — | 797 | 428 | 1,225 | (247 | ) | 1990 | 02/28/06 | 15 to 30 Years | ||||||||||||||||||||
| Marietta, GA | (c) | 350 | 173 | — | — | 350 | 173 | 523 | (66 | ) | 1976 | 07/17/13 | 11 to 20 Years | ||||||||||||||||||||
| Marion, IN | (a) | 503 | 153 | — | — | 503 | 153 | 656 | (133 | ) | 1990 | 09/24/04 | 15 to 20 Years | ||||||||||||||||||||
| Marlin, TX | (c) | 81 | 327 | — | — | 81 | 327 | 408 | (73 | ) | 1985 | 07/17/13 | 8 to 25 Years | ||||||||||||||||||||
| Martinsburg, WV | (a) | 887 | 992 | — | — | 887 | 992 | 1,879 | (442 | ) | 1999 | 12/29/05 | 15 to 30 Years | ||||||||||||||||||||
| Martinsville, IN | (a) | 940 | 1,128 | — | — | 940 | 1,128 | 2,068 | (164 | ) | 1986 | 07/17/13 | 4 to 35 Years | ||||||||||||||||||||
| Maryville, TN | (a) | 810 | 306 | — | — | 810 | 306 | 1,116 | (270 | ) | 1993 | 07/01/05 | 15 to 20 Years | ||||||||||||||||||||
| Maryville, TN | (c) | 421 | 380 | — | — | 421 | 380 | 801 | (85 | ) | 2007 | 07/17/13 | 4 to 26 Years | ||||||||||||||||||||
| Mayfield, KY | (a) | 316 | 603 | — | — | 316 | 603 | 919 | (303 | ) | 1986 | 12/08/09 | 12 to 27 Years | ||||||||||||||||||||
| McAllen, TX | (c) | 747 | 408 | — | — | 747 | 408 | 1,155 | (58 | ) | 1992 | 07/17/13 | 10 to 35 Years | ||||||||||||||||||||
| McAllen, TX | (c) | 601 | 539 | — | — | 601 | 539 | 1,140 | (80 | ) | 1985 | 07/17/13 | 11 to 35 Years | ||||||||||||||||||||
| McDonough, GA | (a) | 938 | 697 | — | — | 938 | 697 | 1,635 | (355 | ) | 1985 | 09/24/04 | 15 to 30 Years | ||||||||||||||||||||
| McDonough, GA | (a) | 179 | 806 | — | 1 | 179 | 807 | 986 | (101 | ) | 1989 | 12/24/13 | 15 to 30 Years | ||||||||||||||||||||
| McDonough, GA | (a) | 418 | 847 | — | — | 418 | 847 | 1,265 | (119 | ) | 1995 | 12/24/13 | 15 to 30 Years | ||||||||||||||||||||
| McKinney, TX | (c) | 1,289 | 467 | — | — | 1,289 | 467 | 1,756 | (23 | ) | 2000 | 06/30/16 | 5 to 20 Years | ||||||||||||||||||||
| Mebane, NC | (a) | 846 | 682 | — | — | 846 | 682 | 1,528 | (290 | ) | 1993 | 09/29/06 | 15 to 30 Years | ||||||||||||||||||||
| Melissa, TX | (c) | 715 | 609 | — | — | 715 | 609 | 1,324 | (19 | ) | 2004 | 07/25/16 | 13 to 30 Years | ||||||||||||||||||||
| Initial Cost to Company | Cost Capitalized Subsequent to Acquisition including impairment | Gross Amount at December 31, | Life in which depreciation in latest Statement of Operations is computed | ||||||||||||||||||||||
| Description | Encumbrances | Land and Improvements | Buildings and Improvements | Improvements/ Land | Improvements/ building | Land and Improvements | Buildings and Improvements | Total | Final Accum | Date of Construction | Date Acquired | ||||||||||||||
| Jackson, MS | (c ) | 447 | 555 | — | — | 447 | 555 | 1,002 | (40 | ) | 1998 | 07/17/13 | 11 to 35 Years | ||||||||||||||||||||
| Jacksonville, FL | (a) | 480 | 631 | — | — | 480 | 631 | 1,111 | (232 | ) | 1998 | 09/24/04 | 15 to 30 years | ||||||||||||||||||||
| Jacksonville, FL | (a) | 930 | 910 | — | — | 930 | 910 | 1,840 | (321 | ) | 1986 | 09/24/04 | 15 to 30 years | ||||||||||||||||||||
| Jacksonville, FL | (a) | 872 | 509 | — | — | 872 | 509 | 1,381 | (261 | ) | 1984 | 09/24/04 | 15 to 20 years | ||||||||||||||||||||
| Jacksonville, FL | (a) | 487 | 871 | — | — | 487 | 871 | 1,358 | (362 | ) | 1985 | 12/30/04 | 15 to 20 years | ||||||||||||||||||||
| Jacksonville, FL | (a) | 431 | 802 | — | — | 431 | 802 | 1,233 | (290 | ) | 1979 | 03/31/04 | 9 to 30 years | ||||||||||||||||||||
| Jamestown, NY | (a) | 508 | 573 | — | — | 508 | 573 | 1,081 | (267 | ) | 1988 | 11/10/05 | 15 to 20 years | ||||||||||||||||||||
| Johnson City, TN | (a) | 718 | 450 | — | — | 718 | 450 | 1,168 | (82 | ) | 1983 | 12/21/12 | 15 to 20 years | ||||||||||||||||||||
| Joliet, IL | (a) | 245 | 193 | — | — | 245 | 193 | 438 | (111 | ) | 1985 | 05/25/05 | 15 to 20 years | ||||||||||||||||||||
| Jonesborough, TN | (a) | 576 | 329 | — | — | 576 | 329 | 905 | (54 | ) | 1987 | 12/21/12 | 15 to 20 years | ||||||||||||||||||||
| Kannapolix, NC | (a) | 244 | 291 | — | — | 244 | 291 | 535 | (21 | ) | 2001 | 09/17/13 | 15 to 30 Years | ||||||||||||||||||||
| Kansas City, KS | (c ) | 312 | 574 | — | — | 312 | 574 | 886 | (38 | ) | 1996 | 07/17/13 | 10 to 30 Years | ||||||||||||||||||||
| Kansas City, KS | (a) | 349 | 425 | — | — | 349 | 425 | 774 | (60 | ) | 1999 | 10/03/11 | 14 to 29 years | ||||||||||||||||||||
| Kansas City, KS | (a) | 594 | 904 | — | — | 594 | 904 | 1,498 | (132 | ) | 1977 | 10/03/11 | 15 to 30 years | ||||||||||||||||||||
| Kansas City, MO | (c ) | 348 | 730 | — | — | 348 | 730 | 1,078 | (42 | ) | 1996 | 07/17/13 | 10 to 35 Years | ||||||||||||||||||||
| Kansas City, MO | (c ) | 462 | 673 | — | — | 462 | 673 | 1,135 | (40 | ) | 1996 | 07/17/13 | 10 to 35 Years | ||||||||||||||||||||
| Kansas City, MO | (c ) | 135 | 616 | — | — | 135 | 616 | 751 | (44 | ) | 1996 | 07/17/13 | 10 to 25 Years | ||||||||||||||||||||
| Kansas City, MO | (c ) | 310 | 580 | — | — | 310 | 580 | 890 | (38 | ) | 1996 | 07/17/13 | 10 to 31 Years | ||||||||||||||||||||
| Kansas City, MO | (c ) | 189 | 837 | — | — | 189 | 837 | 1,026 | (60 | ) | 1996 | 07/17/13 | 9 to 25 Years | ||||||||||||||||||||
| Kansas City, MO | (a) | 538 | 936 | — | — | 538 | 936 | 1,474 | (42 | ) | 2014 | 09/19/14 | 15 to 30 Years | ||||||||||||||||||||
| Memphis, TN | (c) | 208 | 302 | — | — | 208 | 302 | 510 | (65 | ) | 2007 | 07/17/13 | 3 to 24 Years | ||||||||||||||||||||
| Memphis, TN | (c) | 128 | 232 | — | — | 128 | 232 | 360 | (60 | ) | 1971 | 07/17/13 | 8 to 20 Years | ||||||||||||||||||||
| Memphis, TN | (c) | 156 | 351 | — | — | 156 | 351 | 507 | (75 | ) | 1971 | 07/17/13 | 7 to 25 Years | ||||||||||||||||||||
| Memphis, TN | (c) | 288 | 278 | — | — | 288 | 278 | 566 | (89 | ) | 1976 | 07/17/13 | 6 to 20 Years | ||||||||||||||||||||
| Memphis, TN | (c) | 206 | 471 | — | — | 206 | 471 | 677 | (89 | ) | 1979 | 07/17/13 | 10 to 25 Years | ||||||||||||||||||||
| Memphis, TN | (c) | 163 | 295 | — | — | 163 | 295 | 458 | (65 | ) | 1979 | 07/17/13 | 10 to 25 Years | ||||||||||||||||||||
| Memphis, TN | (c) | 212 | 245 | — | — | 212 | 245 | 457 | (75 | ) | 1971 | 07/17/13 | 7 to 25 Years | ||||||||||||||||||||
| Memphis, TN | (c) | 180 | 316 | — | — | 180 | 316 | 496 | (76 | ) | 1971 | 07/17/13 | 7 to 20 Years | ||||||||||||||||||||
| Memphis, TN | (c) | 264 | 592 | — | — | 264 | 592 | 856 | (89 | ) | 1971 | 07/17/13 | 11 to 35 Years | ||||||||||||||||||||
| Memphis, TN | (c) | 426 | 608 | — | — | 426 | 608 | 1,034 | (100 | ) | 1971 | 07/17/13 | 11 to 32 Years | ||||||||||||||||||||
| Memphis, TN | (a) | 320 | — | — | — | 320 | — | 320 | — | (f) | 10/30/13 | (f) | |||||||||||||||||||||
| Mercedes, TX | (c) | 535 | 575 | — | — | 535 | 575 | 1,110 | (81 | ) | 1982 | 07/17/13 | 11 to 35 Years | ||||||||||||||||||||
| Mesquite, TX | (c) | 234 | 459 | — | — | 234 | 459 | 693 | (89 | ) | 2001 | 07/17/13 | 11 to 28 Years | ||||||||||||||||||||
| Miami, FL | (a) | 602 | 14 | — | — | 602 | 14 | 616 | (183 | ) | 1978 | 09/24/04 | 10 to 15 Years | ||||||||||||||||||||
| Miami, FL | (a) | 596 | 105 | — | — | 596 | 105 | 701 | (153 | ) | 1978 | 09/24/04 | 10 to 15 Years | ||||||||||||||||||||
| Miamisburg, OH | (c) | 140 | 262 | — | — | 140 | 262 | 402 | (22 | ) | 1970 | 08/21/15 | 15 to 20 Years | ||||||||||||||||||||
| Midland, TX | (c) | 195 | 432 | — | — | 195 | 432 | 627 | (60 | ) | 1972 | 07/17/13 | 9 to 35 Years | ||||||||||||||||||||
| Midland, TX | (c) | 769 | 893 | — | — | 769 | 893 | 1,662 | (37 | ) | 1982 | 12/29/15 | 15 to 30 Years | ||||||||||||||||||||
| Midwest City, OK | (c) | 318 | 623 | — | — | 318 | 623 | 941 | (87 | ) | 1985 | 07/17/13 | 9 to 35 Years | ||||||||||||||||||||
| Milan, IL | (a) | 161 | 533 | — | — | 161 | 533 | 694 | (107 | ) | 1997 | 10/03/11 | 15 to 30 Years | ||||||||||||||||||||
| Mission, TX | (c) | 577 | 598 | — | — | 577 | 598 | 1,175 | (85 | ) | 1981 | 07/17/13 | 9 to 35 Years | ||||||||||||||||||||
| Moncks Corner, SC | (a) | 573 | 466 | — | — | 573 | 466 | 1,039 | (332 | ) | 1998 | 09/24/04 | 15 to 20 Years | ||||||||||||||||||||
| Monroe, GA | (a) | 618 | 787 | — | — | 618 | 787 | 1,405 | (113 | ) | 1977 | 12/24/13 | 15 to 30 Years | ||||||||||||||||||||
| Montgomery, AL | (c) | 288 | 623 | — | — | 288 | 623 | 911 | (84 | ) | 1998 | 07/17/13 | 9 to 35 Years | ||||||||||||||||||||
| Montgomery, AL | (c) | 177 | 516 | — | — | 177 | 516 | 693 | (131 | ) | 1984 | 07/17/13 | 9 to 19 Years | ||||||||||||||||||||
| Montgomery, AL | (c) | 247 | 376 | — | — | 247 | 376 | 623 | (96 | ) | 1999 | 07/17/13 | 10 to 24 Years | ||||||||||||||||||||
| Montgomery, AL | (c) | 455 | 579 | — | — | 455 | 579 | 1,034 | (101 | ) | 1972 | 07/17/13 | 11 to 33 Years | ||||||||||||||||||||
| Montgomery, AL | (c) | 313 | 601 | — | — | 313 | 601 | 914 | (133 | ) | 1999 | 07/17/13 | 10 to 27 Years | ||||||||||||||||||||
| Mooresville, IN | (a) | 560 | 549 | — | — | 560 | 549 | 1,109 | (371 | ) | 1998 | 09/23/05 | 15 to 20 Years | ||||||||||||||||||||
| Morristown, TN | (a) | 588 | 781 | — | — | 588 | 781 | 1,369 | (304 | ) | 1987 | 09/01/05 | 15 to 30 Years | ||||||||||||||||||||
| Morrow, GA | (a) | 652 | 450 | — | — | 652 | 450 | 1,102 | (212 | ) | 1995 | 02/28/06 | 15 to 30 Years | ||||||||||||||||||||
| Morrow, GA | (a) | 530 | 568 | — | — | 530 | 568 | 1,098 | (100 | ) | 2006 | 02/02/12 | 15 to 40 Years | ||||||||||||||||||||
| Moultrie, GA | (a) | 437 | 563 | — | — | 437 | 563 | 1,000 | (105 | ) | 2012 | 03/29/13 | 15 to 30 Years | ||||||||||||||||||||
| Moultrie, GA | (a) | 359 | 827 | — | — | 359 | 827 | 1,186 | (105 | ) | 1997 | 12/24/13 | 15 to 30 Years | ||||||||||||||||||||
| Mount Carmel, TN | (a) | 499 | 536 | — | — | 499 | 536 | 1,035 | (130 | ) | 1988 | 12/21/12 | 15 to 30 Years | ||||||||||||||||||||
| Mount Pleasant, MI | (a) | 485 | 642 | — | — | 485 | 642 | 1,127 | (279 | ) | 1997 | 12/29/05 | 15 to 30 Years | ||||||||||||||||||||
| Mount Pleasant, MI | (a) | 657 | 854 | — | — | 657 | 854 | 1,511 | (343 | ) | 2010 | 02/13/09 | 13 to 38 Years | ||||||||||||||||||||
| Kansas City, MO | (a) | 289 | 1,066 | — | — | 289 | 1,066 | 1,355 | (45 | ) | 1980 | 12/24/13 | 15 to 30 Years | ||||||||||||||||||||
| Kansas City, MO | (b) | 772 | — | — | — | 772 | — | 772 | — | 2014 | 09/19/14 | 0 to 0 Years | |||||||||||||||||||||
| Kansas City, MO | (a) | 245 | 447 | — | — | 245 | 447 | 692 | (58 | ) | 1985 | 10/03/11 | 14 to 29 years | ||||||||||||||||||||
| Kansas City, MO | (a) | 334 | 654 | — | — | 334 | 654 | 988 | (97 | ) | 1985 | 10/03/11 | 15 to 30 years | ||||||||||||||||||||
| Kennesaw, GA | (a) | 487 | 334 | — | — | 487 | 334 | 821 | (56 | ) | 1991 | 02/02/12 | 15 to 20 years | ||||||||||||||||||||
| Kilgore, TX | (c ) | 140 | 415 | — | — | 140 | 415 | 555 | (40 | ) | 1985 | 07/17/13 | 11 to 21 Years | ||||||||||||||||||||
| Initial Cost to Company | Cost Capitalized Subsequent to Acquisition including impairment | Gross Amount at December 31, | Life in which depreciation in latest Statement of Operations is computed | ||||||||||||||||||||||
| Description | Encumbrances | Land and Improvements | Buildings and Improvements | Improvements/ Land | Improvements/ building | Land and Improvements | Buildings and Improvements | Total | Final Accum | Date of Construction | Date Acquired | ||||||||||||||
| Killeen, TX | (c ) | 289 | 513 | — | — | 289 | 513 | 802 | (30 | ) | 1974 | 07/17/13 | 9 to 35 Years | ||||||||||||||||||||
| Kingsport, TN | (b) | 307 | 766 | — | — | 307 | 766 | 1,073 | (47 | ) | 2008 | 07/17/13 | 4 to 32 Years | ||||||||||||||||||||
| Kingsport, TN | (a) | 592 | 200 | — | — | 592 | 200 | 792 | (255 | ) | 1992 | 11/23/04 | 15 to 20 years | ||||||||||||||||||||
| Kingsport, TN | (a) | 384 | 877 | — | — | 384 | 877 | 1,261 | (84 | ) | 1992 | 12/21/12 | 15 to 30 years | ||||||||||||||||||||
| Kingston, PA | (b) | 521 | 635 | — | — | 521 | 635 | 1,156 | (2 | ) | 1978 | 11/18/14 | 15 to 30 Years | ||||||||||||||||||||
| Kingsville, TX | (c ) | 263 | 461 | — | — | 263 | 461 | 724 | (28 | ) | 1977 | 07/17/13 | 9 to 35 Years | ||||||||||||||||||||
| Kingwood, WV | (a) | 618 | 677 | — | — | 618 | 677 | 1,295 | (92 | ) | 1979 | 12/21/12 | 15 to 20 years | ||||||||||||||||||||
| Kirby, TX | (c ) | 224 | 262 | — | — | 224 | 262 | 486 | (28 | ) | 1985 | 07/17/13 | 9 to 21 Years | ||||||||||||||||||||
| Knoxville, TN | (a) | 635 | 227 | — | — | 635 | 227 | 862 | (225 | ) | 1995 | 11/23/04 | 15 to 20 years | ||||||||||||||||||||
| Knoxville, TN | (a) | 547 | 230 | — | — | 547 | 230 | 777 | (282 | ) | 1987 | 11/23/04 | 10 to 15 years | ||||||||||||||||||||
| Knoxville, TN | (a) | 332 | 185 | — | — | 332 | 185 | 517 | (94 | ) | 1977 | 09/01/05 | 15 to 20 years | ||||||||||||||||||||
| Knoxville, TN | (a) | 561 | 305 | — | — | 561 | 305 | 866 | (133 | ) | 1975 | 09/01/05 | 15 to 20 years | ||||||||||||||||||||
| La Feria, TX | (c ) | 369 | 941 | — | — | 369 | 941 | 1,310 | (49 | ) | 2003 | 07/17/13 | 11 to 35 Years | ||||||||||||||||||||
| La Mesa, CA | (a) | 1,312 | 360 | — | — | 1,312 | 360 | 1,672 | (328 | ) | 1984 | 07/28/04 | 10 to 15 years | ||||||||||||||||||||
| La Vista, NE | (a) | 499 | 664 | — | — | 499 | 664 | 1,163 | (89 | ) | 1992 | 10/03/11 | 15 to 30 years | ||||||||||||||||||||
| Lafayette, LA | (a) | 300 | 779 | — | — | 300 | 779 | 1,079 | (36 | ) | 1972 | 10/30/13 | 15 to 30 Years | ||||||||||||||||||||
| LaGrange, GA | (c ) | 555 | 44 | — | — | 555 | 44 | 599 | (56 | ) | 1978 | 07/17/13 | 7 to 30 Years | ||||||||||||||||||||
| Laredo, TX | (c ) | 272 | 713 | — | — | 272 | 713 | 985 | (35 | ) | 1966 | 07/17/13 | 11 to 35 Years | ||||||||||||||||||||
| Laredo, TX | (c ) | 727 | 698 | — | — | 727 | 698 | 1,425 | (37 | ) | 1968 | 07/17/13 | 11 to 35 Years | ||||||||||||||||||||
| Lauderdale Lakes, FL | (a) | 411 | 346 | — | — | 411 | 346 | 757 | (118 | ) | 1998 | 12/29/06 | 15 to 30 years | ||||||||||||||||||||
| Laurel, MS | (c ) | 690 | 290 | — | — | 690 | 290 | 980 | (31 | ) | 1971 | 07/17/13 | 11 to 24 Years | ||||||||||||||||||||
| Laurel, MS | (b) | 543 | 754 | — | — | 543 | 754 | 1,297 | (10 | ) | 1993 | 09/22/14 | 15 to 30 Years | ||||||||||||||||||||
| Lees Summit, MO | (a) | 319 | 906 | — | — | 319 | 906 | 1,225 | (40 | ) | 1985 | 12/24/13 | 15 to 30 Years | ||||||||||||||||||||
| Lees Summit, MO | (a) | 590 | 69 | 55 | (69 | ) | 645 | — | 645 | — | 1995 | 09/23/05 | 20 to 20 years | ||||||||||||||||||||
| Lewisville, TX | (c ) | 913 | 470 | — | — | 913 | 470 | 1,383 | (35 | ) | 1976 | 07/17/13 | 8 to 35 Years | ||||||||||||||||||||
| Lexington, KY | (a) | 636 | 362 | — | — | 636 | 362 | 998 | (312 | ) | 1978 | 12/30/04 | 10 to 15 years | ||||||||||||||||||||
| Lexington, KY | (a) | 713 | 451 | — | — | 713 | 451 | 1,164 | (390 | ) | 1976 | 01/26/05 | 10 to 15 years | ||||||||||||||||||||
| Lillington, NC | (a) | 419 | 687 | — | — | 419 | 687 | 1,106 | (196 | ) | 1992 | 09/29/06 | 15 to 40 years | ||||||||||||||||||||
| Lincoln, IL | (a) | 203 | 616 | — | — | 203 | 616 | 819 | (283 | ) | 1990 | 09/23/05 | 15 to 20 years | ||||||||||||||||||||
| Little Rock, AR | (c ) | 99 | 500 | — | — | 99 | 500 | 599 | (32 | ) | 1970 | 07/17/13 | 8 to 30 Years | ||||||||||||||||||||
| Little Rock, AR | (c ) | 332 | 432 | — | — | 332 | 432 | 764 | (25 | ) | 1971 | 07/17/13 | 9 to 35 Years | ||||||||||||||||||||
| Little Rock, AR | (c ) | 263 | 492 | — | — | 263 | 492 | 755 | (30 | ) | 1975 | 07/17/13 | 9 to 35 Years | ||||||||||||||||||||
| Little Rock, AR | (a) | 917 | 847 | — | — | 917 | 847 | 1,764 | (306 | ) | 2004 | 07/07/05 | 15 to 30 years | ||||||||||||||||||||
| Lone Tree, CO | (a) | 1,717 | 1,117 | — | — | 1,717 | 1,117 | 2,834 | (466 | ) | 2000 | 09/25/07 | 13 to 38 years | ||||||||||||||||||||
| Longview, TX | (c ) | 149 | 552 | — | — | 149 | 552 | 701 | (34 | ) | 1985 | 07/17/13 | 9 to 35 Years | ||||||||||||||||||||
| Louisville, KY | (a) | 334 | 251 | — | — | 334 | 251 | 585 | (113 | ) | 1991 | 09/24/04 | 15 to 20 years | ||||||||||||||||||||
| Louisville, KY | (a) | 1,010 | 577 | — | — | 1,010 | 577 | 1,587 | (217 | ) | 1994 | 11/10/05 | 15 to 30 years | ||||||||||||||||||||
| Louisville, KY | (a) | 854 | 514 | — | — | 854 | 514 | 1,368 | (196 | ) | 1994 | 11/10/05 | 15 to 30 years | ||||||||||||||||||||
| Muskogee, OK | (c) | 853 | 767 | — | — | 853 | 767 | 1,620 | (20 | ) | 1985 | 06/30/16 | 5 to 30 Years | ||||||||||||||||||||
| Naperville, IL | (c) | 976 | — | 27 | — | 1,003 | — | 1,003 | — | (f) | 06/30/16 | (f) | |||||||||||||||||||||
| Nappanee, IN | (a) | 301 | 413 | — | — | 301 | 413 | 714 | (279 | ) | 2005 | 12/21/07 | 15 to 20 Years | ||||||||||||||||||||
| Nashville, TN | (a) | 264 | — | — | — | 264 | — | 264 | — | (f) | 10/30/13 | (f) | |||||||||||||||||||||
| Nashville, TN | (a) | 538 | — | — | — | 538 | — | 538 | — | (f) | 10/30/13 | (f) | |||||||||||||||||||||
| New Albany, IN | (a) | 497 | 278 | — | — | 497 | 278 | 775 | (172 | ) | 1992 | 09/24/04 | 15 to 30 Years | ||||||||||||||||||||
| New Braunfels, TX | (c) | 302 | 526 | — | — | 302 | 526 | 828 | (97 | ) | 1973 | 07/17/13 | 10 to 27 Years | ||||||||||||||||||||
| New Castle, PA | (a) | 573 | 1,042 | — | — | 573 | 1,042 | 1,615 | (222 | ) | 1999 | 07/17/13 | 7 to 25 Years | ||||||||||||||||||||
| Niagara Falls, NY | (a) | 1,359 | 551 | — | — | 1,359 | 551 | 1,910 | (276 | ) | 1979 | 11/10/05 | 15 to 30 Years | ||||||||||||||||||||
| Nogales, AZ | (c) | 207 | 448 | — | — | 207 | 448 | 655 | (86 | ) | 1976 | 07/17/13 | 11 to 25 Years | ||||||||||||||||||||
| Norcross, GA | (a) | 678 | 402 | — | — | 678 | 402 | 1,080 | (240 | ) | 1982 | 02/28/06 | 15 to 20 Years | ||||||||||||||||||||
| Norfolk, VA | (c) | 373 | 517 | — | — | 373 | 517 | 890 | (131 | ) | 1988 | 07/17/13 | 7 to 20 Years | ||||||||||||||||||||
| Normal, IL | (a) | 394 | 240 | — | — | 394 | 240 | 634 | (122 | ) | 1980 | 12/21/12 | 10 to 15 Years | ||||||||||||||||||||
| Normandy, MO | (a) | 265 | 329 | (6 | ) | — | 259 | 329 | 588 | (203 | ) | 1978 | 05/25/05 | 15 to 20 Years | |||||||||||||||||||
| North Canton, OH | (a) | 484 | 497 | (14 | ) | — | 470 | 497 | 967 | (306 | ) | 1989 | 12/29/06 | 15 to 20 Years | |||||||||||||||||||
| North Little Rock, AR | (c) | 128 | 351 | — | — | 128 | 351 | 479 | (66 | ) | 1999 | 07/17/13 | 10 to 28 Years | ||||||||||||||||||||
| Oak Ridge, TN | (a) | 669 | 548 | — | — | 669 | 548 | 1,217 | (207 | ) | 1976 | 09/01/05 | 15 to 30 Years | ||||||||||||||||||||
| Odessa, TX | (c) | 597 | 443 | — | — | 597 | 443 | 1,040 | (71 | ) | 1979 | 07/17/13 | 10 to 35 Years | ||||||||||||||||||||
| Odessa, TX | (c) | 670 | 563 | — | — | 670 | 563 | 1,233 | (84 | ) | 1972 | 07/17/13 | 10 to 35 Years | ||||||||||||||||||||
| Odessa, TX | (c) | 500 | 941 | — | — | 500 | 941 | 1,441 | (38 | ) | 1982 | 12/29/15 | 15 to 30 Years | ||||||||||||||||||||
| Oklahoma City, OK | (c) | 223 | 469 | — | — | 223 | 469 | 692 | (110 | ) | 1998 | 07/17/13 | 8 to 22 Years | ||||||||||||||||||||
| Oklahoma City, OK | (c) | 200 | 428 | — | — | 200 | 428 | 628 | (85 | ) | 1971 | 07/17/13 | 9 to 25 Years | ||||||||||||||||||||
| Oklahoma City, OK | (a) | 541 | 842 | (398 | ) | (614 | ) | 143 | 228 | 371 | (61 | ) | 2007 | 07/17/13 | 4 to 33 Years | ||||||||||||||||||
| Oklahoma City, OK | (c) | 474 | 516 | — | — | 474 | 516 | 990 | (19 | ) | 1984 | 06/30/16 | 5 to 20 Years | ||||||||||||||||||||
| Oklahoma City, OK | (c) | 467 | 273 | — | — | 467 | 273 | 740 | (17 | ) | 1986 | 06/30/16 | 5 to 10 Years | ||||||||||||||||||||
| Oklahoma City, OK | (c) | 375 | 605 | — | — | 375 | 605 | 980 | (14 | ) | 1986 | 06/30/16 | 5 to 30 Years | ||||||||||||||||||||
| Omaha, NE | (a) | 539 | 380 | — | — | 539 | 380 | 919 | (62 | ) | 2006 | 10/03/11 | 15 to 40 Years | ||||||||||||||||||||
| Opelousas, LA | (a) | 419 | 659 | — | — | 419 | 659 | 1,078 | (91 | ) | 1968 | 10/30/13 | 15 to 30 Years | ||||||||||||||||||||
| Orange, TX | (c) | 541 | 335 | — | — | 541 | 335 | 876 | (43 | ) | 2007 | 08/31/15 | 15 to 30 Years | ||||||||||||||||||||
| Orland Park, IL | (c) | 999 | — | — | — | 999 | — | 999 | — | (f) | 09/12/16 | (f) | |||||||||||||||||||||
| Orlando, FL | (a) | 1,249 | 729 | — | — | 1,249 | 729 | 1,978 | (498 | ) | 1985 | 06/25/04 | 15 to 20 Years | ||||||||||||||||||||
| Orlando, FL | (a) | 642 | 178 | — | — | 642 | 178 | 820 | (237 | ) | 1967 | 12/30/04 | 10 to 15 Years | ||||||||||||||||||||
| Oshkosh, WI | (a) | 765 | 829 | (40 | ) | 300 | 725 | 1,129 | 1,854 | (570 | ) | 1984 | 12/29/05 | 15 to 20 Years | |||||||||||||||||||
| Overland, MO | (a) | 278 | 494 | — | — | 278 | 494 | 772 | (276 | ) | 1972 | 05/25/05 | 15 to 20 Years | ||||||||||||||||||||
| Initial Cost to Company | Cost Capitalized Subsequent to Acquisition including impairment | Gross Amount at December 31, | Life in which depreciation in latest Statement of Operations is computed | ||||||||||||||||||||||
| Description | Encumbrances | Land and Improvements | Buildings and Improvements | Improvements/ Land | Improvements/ building | Land and Improvements | Buildings and Improvements | Total | Final Accum | Date of Construction | Date Acquired | ||||||||||||||
| Lubbock, TX | (c ) | 79 | 341 | — | — | 79 | 341 | 420 | (28 | ) | 1986 | 07/17/13 | 9 to 27 Years | ||||||||||||||||||||
| Lubbock, TX | (c ) | 325 | 794 | — | — | 325 | 794 | 1,119 | (47 | ) | 2004 | 07/17/13 | 11 to 34 Years | ||||||||||||||||||||
| Lubbock, TX | (a) | 687 | 856 | — | — | 687 | 856 | 1,543 | (308 | ) | 2003 | 07/07/05 | 15 to 30 years | ||||||||||||||||||||
| Macon, GA | �� | (c ) | 291 | 628 | — | — | 291 | 628 | 919 | (35 | ) | 1983 | 07/17/13 | 10 to 35 Years | |||||||||||||||||||
| Macon, GA | (c ) | 195 | 347 | — | — | 195 | 347 | 542 | (31 | ) | 1976 | 07/17/13 | 9 to 25 Years | ||||||||||||||||||||
| Macon, GA | (c ) | 185 | 553 | — | — | 185 | 553 | 738 | (37 | ) | 1980 | 07/17/13 | 11 to 30 Years | ||||||||||||||||||||
| Madison, GA | (a) | 892 | 739 | — | — | 892 | 739 | 1,631 | (259 | ) | 1989 | 01/12/06 | 15 to 40 years | ||||||||||||||||||||
| Madisonville, KY | (a) | 1,198 | 819 | — | — | 1,198 | 819 | 2,017 | (302 | ) | 1990 | 09/24/04 | 15 to 30 years | ||||||||||||||||||||
| Mansfield, PA | (a) | 225 | 327 | — | — | 225 | 327 | 552 | (145 | ) | 1972 | 05/25/05 | 15 to 20 years | ||||||||||||||||||||
| Mansfield, TX | (b) | 760 | 700 | — | — | 760 | 700 | 1,460 | (4 | ) | 2002 | 11/18/14 | 15 to 30 Years | ||||||||||||||||||||
| Maple Grove, MN | (a) | 1,852 | 1,096 | — | — | 1,852 | 1,096 | 2,948 | (442 | ) | 1997 | 09/24/04 | 15 to 30 years | ||||||||||||||||||||
| Maplewood, MO | (a) | 180 | 225 | — | — | 180 | 225 | 405 | (109 | ) | 1980 | 05/25/05 | 15 to 20 years | ||||||||||||||||||||
| Marietta, GA | (c ) | 350 | 173 | — | — | 350 | 173 | 523 | (27 | ) | 1976 | 07/17/13 | 11 to 21 Years | ||||||||||||||||||||
| Marion, IN | (a) | 503 | 153 | — | — | 503 | 153 | 656 | (105 | ) | 1990 | 09/24/04 | 15 to 20 years | ||||||||||||||||||||
| Marlin, TX | (c ) | 81 | 327 | — | — | 81 | 327 | 408 | (30 | ) | 1985 | 07/17/13 | 8 to 25 Years | ||||||||||||||||||||
| Martinsburg, WV | (a) | 887 | 992 | — | — | 887 | 992 | 1,879 | (348 | ) | 1999 | 12/29/05 | 15 to 30 years | ||||||||||||||||||||
| Martinsville, IN | (a) | 940 | 1,128 | — | — | 940 | 1,128 | 2,068 | (68 | ) | 1986 | 07/17/13 | 4 to 35 Years | ||||||||||||||||||||
| Maryville, TN | (b) | 421 | 380 | — | — | 421 | 380 | 801 | (35 | ) | 2007 | 07/17/13 | 4 to 26 Years | ||||||||||||||||||||
| Maryville, TN | (a) | 810 | 306 | — | — | 810 | 306 | 1,116 | (212 | ) | 1993 | 11/23/04 | 15 to 20 years | ||||||||||||||||||||
| Mayfield, KY | (a) | 316 | 603 | — | — | 316 | 603 | 919 | (239 | ) | 1986 | 09/29/06 | 12 to 27 years | ||||||||||||||||||||
| McAllen, TX | (c ) | 747 | 408 | — | — | 747 | 408 | 1,155 | (24 | ) | 1992 | 07/17/13 | 10 to 35 Years | ||||||||||||||||||||
| McAllen, TX | (c ) | 601 | 539 | — | — | 601 | 539 | 1,140 | (33 | ) | 1985 | 07/17/13 | 11 to 35 Years | ||||||||||||||||||||
| McDonough, GA | (a) | 179 | 807 | — | — | 179 | 807 | 986 | (34 | ) | 1989 | 12/24/13 | 15 to 30 Years | ||||||||||||||||||||
| McDonough, GA | (a) | 418 | 847 | — | — | 418 | 847 | 1,265 | (40 | ) | 1995 | 12/24/13 | 15 to 30 Years | ||||||||||||||||||||
| McDonough, GA | (a) | 938 | 697 | — | — | 938 | 697 | 1,635 | (280 | ) | 1985 | 09/24/04 | 15 to 30 years | ||||||||||||||||||||
| Mebane, NC | (a) | 846 | 682 | — | — | 846 | 682 | 1,528 | (228 | ) | 1993 | 09/29/06 | 15 to 30 years | ||||||||||||||||||||
| Memphis, TN | (b) | 208 | 302 | — | — | 208 | 302 | 510 | (27 | ) | 2007 | 07/17/13 | 3 to 24 Years | ||||||||||||||||||||
| Memphis, TN | (c ) | 103 | 120 | — | — | 103 | 120 | 223 | (20 | ) | 1976 | 07/17/13 | 6 to 21 Years | ||||||||||||||||||||
| Memphis, TN | (c ) | 128 | 232 | — | — | 128 | 232 | 360 | (25 | ) | 1999 | 07/17/13 | 8 to 20 Years | ||||||||||||||||||||
| Memphis, TN | (c ) | 156 | 351 | — | — | 156 | 351 | 507 | (31 | ) | 1971 | 07/17/13 | 7 to 25 Years | ||||||||||||||||||||
| Memphis, TN | (c ) | 288 | 278 | — | — | 288 | 278 | 566 | (37 | ) | 1976 | 07/17/13 | 6 to 20 Years | ||||||||||||||||||||
| Memphis, TN | (c ) | 206 | 471 | — | — | 206 | 471 | 677 | (37 | ) | 1979 | 07/17/13 | 10 to 25 Years | ||||||||||||||||||||
| Memphis, TN | (c ) | 163 | 295 | — | — | 163 | 295 | 458 | (27 | ) | 1979 | 07/17/13 | 10 to 25 Years | ||||||||||||||||||||
| Memphis, TN | (c ) | 212 | 245 | — | — | 212 | 245 | 457 | (31 | ) | 1971 | 07/17/13 | 7 to 25 Years | ||||||||||||||||||||
| Memphis, TN | (c ) | 119 | 261 | — | — | 119 | 261 | 380 | (25 | ) | 1980 | 07/17/13 | 8 to 20 Years | ||||||||||||||||||||
| Memphis, TN | (c ) | 180 | 316 | — | — | 180 | 316 | 496 | (32 | ) | 1971 | 07/17/13 | 7 to 21 Years | ||||||||||||||||||||
| Memphis, TN | (c ) | 264 | 592 | — | — | 264 | 592 | 856 | (37 | ) | 1971 | 07/17/13 | 11 to 35 Years | ||||||||||||||||||||
| Memphis, TN | (c ) | 426 | 608 | — | — | 426 | 608 | 1,034 | (41 | ) | 1971 | 07/17/13 | 11 to 32 Years | ||||||||||||||||||||
| Memphis, TN | (a) | 320 | — | — | — | 320 | — | 320 | — | (g) | 10/30/13 | 12 to 12 Years | |||||||||||||||||||||
| Parkersburg, WV | (a) | 416 | 658 | — | 75 | 416 | 733 | 1,149 | (447 | ) | 1986 | 03/07/07 | 4 to 20 Years | ||||||||||||||||||||
| Parkersburg, WV | (a) | 457 | 309 | — | — | 457 | 309 | 766 | (163 | ) | 1999 | 12/21/12 | 10 to 15 Years | ||||||||||||||||||||
| Parma Heights, OH | (a) | 598 | 535 | — | — | 598 | 535 | 1,133 | (210 | ) | 2004 | 08/27/09 | 13 to 38 Years | ||||||||||||||||||||
| Paxton, IL | (a) | 324 | 658 | — | — | 324 | 658 | 982 | (456 | ) | 1986 | 12/29/05 | 15 to 20 Years | ||||||||||||||||||||
| Pearson, GA | (a) | 159 | 817 | — | — | 159 | 817 | 976 | (106 | ) | 1994 | 12/24/13 | 15 to 30 Years | ||||||||||||||||||||
| Pensacola, FL | (a) | 860 | 291 | — | — | 860 | 291 | 1,151 | (393 | ) | 1977 | 07/28/04 | 10 to 15 Years | ||||||||||||||||||||
| Peoria, IL | (a) | 154 | 320 | — | — | 154 | 320 | 474 | (196 | ) | 1976 | 05/25/05 | 15 to 20 Years | ||||||||||||||||||||
| Peoria, IL | (a) | 383 | 270 | — | — | 383 | 270 | 653 | (141 | ) | 1980 | 12/21/12 | 10 to 15 Years | ||||||||||||||||||||
| Peoria, IL | (a) | 282 | 435 | — | — | 282 | 435 | 717 | (123 | ) | 1980 | 12/21/12 | 15 to 20 Years | ||||||||||||||||||||
| Pharr, TX | (c) | 694 | 441 | — | — | 694 | 441 | 1,135 | (90 | ) | 1997 | 07/17/13 | 10 to 26 Years | ||||||||||||||||||||
| Phenix City, AL | (c) | 493 | 497 | — | — | 493 | 497 | 990 | (62 | ) | 1978 | 07/17/13 | 8 to 35 Years | ||||||||||||||||||||
| Philippi, WV | (a) | 405 | 232 | — | — | 405 | 232 | 637 | (133 | ) | 1986 | 12/21/12 | 10 to 15 Years | ||||||||||||||||||||
| Phoenix, AZ | (c) | 523 | 97 | — | — | 523 | 97 | 620 | (46 | ) | 1976 | 07/17/13 | 9 to 16 Years | ||||||||||||||||||||
| Phoenix, AZ | (c) | 321 | 276 | — | — | 321 | 276 | 597 | (74 | ) | 1975 | 07/17/13 | 10 to 20 Years | ||||||||||||||||||||
| Phoenix, AZ | (c) | 384 | 528 | — | — | 384 | 528 | 912 | (90 | ) | 1974 | 07/17/13 | 11 to 27 Years | ||||||||||||||||||||
| Phoenix, AZ | (c) | 368 | 267 | — | — | 368 | 267 | 635 | (56 | ) | 1974 | 07/17/13 | 11 to 23 Years | ||||||||||||||||||||
| Phoenix, AZ | (c) | 415 | 403 | — | — | 415 | 403 | 818 | (69 | ) | 1975 | 07/17/13 | 8 to 27 Years | ||||||||||||||||||||
| Phoenix, AZ | (c) | 599 | 412 | — | — | 599 | 412 | 1,011 | (67 | ) | 1980 | 07/17/13 | 10 to 35 Years | ||||||||||||||||||||
| Phoenix, AZ | (c) | 400 | 120 | — | — | 400 | 120 | 520 | (50 | ) | 1977 | 07/17/13 | 11 to 13 Years | ||||||||||||||||||||
| Pilot Point, TX | (c) | 446 | 436 | — | — | 446 | 436 | 882 | (16 | ) | 2000 | 07/25/16 | 13 to 30 Years | ||||||||||||||||||||
| Pine Bluff, AR | (c) | 854 | 431 | — | — | 854 | 431 | 1,285 | (58 | ) | 1971 | 07/17/13 | 7 to 35 Years | ||||||||||||||||||||
| Pineville, LA | (a) | 558 | 1,044 | — | — | 558 | 1,044 | 1,602 | (442 | ) | 1996 | 06/25/04 | 11 to 30 Years | ||||||||||||||||||||
| Pleasanton, TX | (c) | 230 | 1,052 | — | — | 230 | 1,052 | 1,282 | (136 | ) | 1985 | 07/17/13 | 11 to 35 Years | ||||||||||||||||||||
| Ponca City, OK | (c) | 93 | 249 | — | — | 93 | 249 | 342 | (52 | ) | 2007 | 07/17/13 | 4 to 28 Years | ||||||||||||||||||||
| Port Allen, LA | (a) | 521 | 575 | — | — | 521 | 575 | 1,096 | (311 | ) | 1997 | 09/24/04 | 15 to 30 Years | ||||||||||||||||||||
| Port Arthur, TX | (c) | 188 | 256 | — | — | 188 | 256 | 444 | (28 | ) | 1976 | 08/31/15 | 15 to 20 Years | ||||||||||||||||||||
| Port Arthur, TX | (c) | 384 | 266 | — | — | 384 | 266 | 650 | (41 | ) | 2002 | 08/31/15 | 15 to 20 Years | ||||||||||||||||||||
| Port Arthur, TX | (c) | 403 | 344 | — | — | 403 | 344 | 747 | (46 | ) | 2004 | 08/31/15 | 15 to 20 Years | ||||||||||||||||||||
| Port Isabel, TX | (c) | 348 | 672 | — | — | 348 | 672 | 1,020 | (102 | ) | 2004 | 07/17/13 | 11 to 31 Years | ||||||||||||||||||||
| Port Lavaca, TX | (c) | 339 | 594 | — | — | 339 | 594 | 933 | (97 | ) | 1985 | 07/17/13 | 11 to 28 Years | ||||||||||||||||||||
| Portsmouth, VA | (c) | 574 | 419 | — | — | 574 | 419 | 993 | (93 | ) | 1988 | 07/17/13 | 10 to 25 Years | ||||||||||||||||||||
| Powell, TN | (c) | 411 | 353 | — | — | 411 | 353 | 764 | (82 | ) | 2007 | 07/17/13 | 4 to 26 Years | ||||||||||||||||||||
| Princeton, IN | (a) | 340 | 906 | — | — | 340 | 906 | 1,246 | (262 | ) | 1992 | 07/17/13 | 7 to 15 Years | ||||||||||||||||||||
| Prosper, TX | (c) | 990 | 435 | — | — | 990 | 435 | 1,425 | (18 | ) | 2004 | 07/25/16 | 13 to 30 Years | ||||||||||||||||||||
| Pulaski, VA | (a) | 444 | 236 | — | — | 444 | 236 | 680 | (295 | ) | 1994 | 07/01/05 | 15 to 20 Years | ||||||||||||||||||||
| Quincy, FL | (a) | 1,015 | 416 | — | — | 1,015 | 416 | 1,431 | (427 | ) | 1989 | 09/24/04 | 15 to 20 Years | ||||||||||||||||||||
| Quitman, GA | (a) | 259 | 936 | — | — | 259 | 936 | 1,195 | (118 | ) | 1985 | 12/24/13 | 15 to 30 Years | ||||||||||||||||||||
| Radford, VA | (a) | 499 | 248 | — | — | 499 | 248 | 747 | (347 | ) | 1995 | 07/01/05 | 15 to 20 Years | ||||||||||||||||||||
| Initial Cost to Company | Cost Capitalized Subsequent to Acquisition including impairment | Gross Amount at December 31, | Life in which depreciation in latest Statement of Operations is computed | ||||||||||||||||||||||
| Description | Encumbrances | Land and Improvements | Buildings and Improvements | Improvements/ Land | Improvements/ building | Land and Improvements | Buildings and Improvements | Total | Final Accum | Date of Construction | Date Acquired | ||||||||||||||
| Mercedes, TX | (c ) | 535 | 575 | — | — | 535 | 575 | 1,110 | (34 | ) | 1982 | 07/17/13 | 11 to 35 Years | ||||||||||||||||||||
| Mesquite, TX | (c ) | 234 | 459 | — | — | 234 | 459 | 693 | (37 | ) | 2001 | 07/17/13 | 11 to 28 Years | ||||||||||||||||||||
| Miami, FL | (a) | 602 | 14 | — | — | 602 | 14 | 616 | (144 | ) | 1978 | 09/24/04 | 10 to 15 years | ||||||||||||||||||||
| Miami, FL | (a) | 596 | 105 | — | — | 596 | 105 | 701 | (121 | ) | 1978 | 09/24/04 | 10 to 15 years | ||||||||||||||||||||
| Midland, TX | (c ) | 195 | 432 | — | — | 195 | 432 | 627 | (25 | ) | 1972 | 07/17/13 | 9 to 35 Years | ||||||||||||||||||||
| Midwest City, OK | (c ) | 318 | 623 | — | — | 318 | 623 | 941 | (36 | ) | 1985 | 07/17/13 | 9 to 35 Years | ||||||||||||||||||||
| Milan, IL | (a) | 161 | 533 | — | — | 161 | 533 | 694 | (66 | ) | 1997 | 10/03/11 | 15 to 30 years | ||||||||||||||||||||
| Mission, TX | (c ) | 577 | 598 | — | — | 577 | 598 | 1,175 | (35 | ) | 1981 | 07/17/13 | 9 to 35 Years | ||||||||||||||||||||
| Mobile, AL | (a) | 587 | 487 | — | — | 587 | 487 | 1,074 | (216 | ) | 1985 | 09/24/04 | 15 to 20 years | ||||||||||||||||||||
| Moline, IL | (a) | 424 | 520 | — | — | 424 | 520 | 944 | (65 | ) | 2009 | 10/03/11 | 15 to 40 years | ||||||||||||||||||||
| Moncks Corner, SC | (a) | 573 | 466 | — | — | 573 | 466 | 1,039 | (262 | ) | 1998 | 09/24/04 | 15 to 20 years | ||||||||||||||||||||
| Monroe, GA | (a) | 618 | 787 | — | — | 618 | 787 | 1,405 | (38 | ) | 1977 | 12/24/13 | 15 to 30 Years | ||||||||||||||||||||
| Montgomery, AL | (c ) | 288 | 623 | — | — | 288 | 623 | 911 | (35 | ) | 1998 | 07/17/13 | 9 to 35 Years | ||||||||||||||||||||
| Montgomery, AL | (c ) | 177 | 516 | — | — | 177 | 516 | 693 | (54 | ) | 1984 | 07/17/13 | 9 to 21 Years | ||||||||||||||||||||
| Montgomery, AL | (c ) | 247 | 376 | — | — | 247 | 376 | 623 | (40 | ) | 1999 | 07/17/13 | 10 to 24 Years | ||||||||||||||||||||
| Montgomery, AL | (c ) | 455 | 579 | — | — | 455 | 579 | 1,034 | (42 | ) | 1972 | 07/17/13 | 11 to 33 Years | ||||||||||||||||||||
| Montgomery, AL | (c ) | 313 | 601 | — | — | 313 | 601 | 914 | (55 | ) | 1999 | 07/17/13 | 10 to 27 Years | ||||||||||||||||||||
| Mooresville, IN | (a) | 560 | 549 | — | — | 560 | 549 | 1,109 | (293 | ) | 1998 | 09/23/05 | 15 to 20 years | ||||||||||||||||||||
| Morristown, TN | (a) | 588 | 781 | — | — | 588 | 781 | 1,369 | (239 | ) | 1987 | 09/01/05 | 15 to 30 years | ||||||||||||||||||||
| Morristown, TN | (a) | 436 | 290 | — | — | 436 | 290 | 726 | (141 | ) | 1976 | 09/01/05 | 15 to 20 years | ||||||||||||||||||||
| Morrow, GA | (a) | 530 | 568 | — | — | 530 | 568 | 1,098 | (59 | ) | 2006 | 02/02/12 | 15 to 40 years | ||||||||||||||||||||
| Moultrie, GA | (a) | 359 | 827 | — | — | 359 | 827 | 1,186 | (35 | ) | 1997 | 12/24/13 | 15 to 30 Years | ||||||||||||||||||||
| Moultrie, GA | (a) | 437 | 563 | — | — | 437 | 563 | 1,000 | (49 | ) | 2012 | 03/29/13 | 15 to 30 Years | ||||||||||||||||||||
| Mount Carmel, TN | (a) | 499 | 536 | — | — | 499 | 536 | 1,035 | (65 | ) | 1988 | 12/21/12 | 15 to 30 years | ||||||||||||||||||||
| Mount Pleasant, MI | (a) | 485 | 642 | — | — | 485 | 642 | 1,127 | (220 | ) | 1997 | 12/29/05 | 15 to 30 years | ||||||||||||||||||||
| Mount Pleasant, MI | (a) | 657 | 854 | — | — | 657 | 854 | 1,511 | (272 | ) | 2010 | 12/29/06 | 13 to 38 years | ||||||||||||||||||||
| Nappanee, IN | (a) | 301 | 413 | — | — | 301 | 413 | 714 | (217 | ) | 2005 | 12/21/07 | 15 to 20 years | ||||||||||||||||||||
| Nashville, TN | (a) | 264 | — | — | — | 264 | — | 264 | — | (g) | 10/30/13 | 12 to 12 Years | |||||||||||||||||||||
| Nashville, TN | (a) | 538 | — | — | — | 538 | — | 538 | — | (g) | 10/30/13 | 12 to 12 Years | |||||||||||||||||||||
| New Albany, IN | (a) | 497 | 278 | — | — | 497 | 278 | 775 | (135 | ) | 1992 | 09/24/04 | 15 to 30 years | ||||||||||||||||||||
| New Braunfels, TX | (c ) | 302 | 526 | — | — | 302 | 526 | 828 | (40 | ) | 1973 | 07/17/13 | 10 to 27 Years | ||||||||||||||||||||
| New Castle, PA | (a) | 573 | 1,042 | — | — | 573 | 1,042 | 1,615 | (92 | ) | 1999 | 07/17/13 | 7 to 25 Years | ||||||||||||||||||||
| New Orleans, LA | (a) | 312 | 240 | — | — | 312 | 240 | 552 | (116 | ) | 1991 | 09/24/04 | 15 to 30 years | ||||||||||||||||||||
| Niagara Falls, NY | (a) | 1,359 | 551 | — | — | 1,359 | 551 | 1,910 | (217 | ) | 1979 | 11/10/05 | 15 to 30 years | ||||||||||||||||||||
| Nogales, AZ | (c ) | 207 | 448 | — | — | 207 | 448 | 655 | (36 | ) | 1976 | 07/17/13 | 11 to 25 Years | ||||||||||||||||||||
| Raleigh, NC | (a) | 639 | 320 | — | — | 639 | 320 | 959 | (77 | ) | 2008 | 09/17/13 | 15 to 30 Years | ||||||||||||||||||||
| Raymondville, TX | (c) | 660 | 455 | — | — | 660 | 455 | 1,115 | (81 | ) | 1984 | 07/17/13 | 9 to 35 Years | ||||||||||||||||||||
| Red Bank, TN | (a) | 610 | 557 | — | — | 610 | 557 | 1,167 | (349 | ) | 1997 | 06/25/04 | 15 to 30 Years | ||||||||||||||||||||
| Richland Hills, TX | (c) | 229 | 199 | — | — | 229 | 199 | 428 | (48 | ) | 1999 | 07/17/13 | 10 to 25 Years | ||||||||||||||||||||
| Rio Grand City, TX | (c) | 1,746 | 554 | — | — | 1,746 | 554 | 2,300 | (79 | ) | 1984 | 07/17/13 | 12 to 35 Years | ||||||||||||||||||||
| Riverdale, GA | (c) | 742 | 1,789 | — | — | 742 | 1,789 | 2,531 | (91 | ) | 2010 | 09/17/15 | 15 to 30 Years | ||||||||||||||||||||
| Robinson, IL | (a) | 250 | 1,021 | — | — | 250 | 1,021 | 1,271 | (157 | ) | 1994 | 07/17/13 | 7 to 33 Years | ||||||||||||||||||||
| Rochester, MN | (a) | 561 | 83 | 66 | (83 | ) | 627 | — | 627 | — | (f) | 09/23/05 | (f) | ||||||||||||||||||||
| Rock Hill, SC | (a) | 373 | 722 | — | — | 373 | 722 | 1,095 | (414 | ) | 1978 | 12/29/05 | 15 to 20 Years | ||||||||||||||||||||
| Rockwell, NC | (a) | 385 | 385 | — | — | 385 | 385 | 770 | (89 | ) | 2006 | 09/17/13 | 15 to 30 Years | ||||||||||||||||||||
| Rogers, AR | (c) | 334 | 884 | — | — | 334 | 884 | 1,218 | (77 | ) | 2005 | 09/30/14 | 15 to 30 Years | ||||||||||||||||||||
| Rogersville, TN | (a) | 384 | 964 | — | — | 384 | 964 | 1,348 | (183 | ) | 1986 | 12/21/12 | 15 to 30 Years | ||||||||||||||||||||
| Rolesville, NC | (a) | 526 | 320 | — | — | 526 | 320 | 846 | (73 | ) | 2007 | 09/17/13 | 15 to 30 Years | ||||||||||||||||||||
| Rolla, MO | (a) | 229 | 857 | — | — | 229 | 857 | 1,086 | (110 | ) | 1978 | 12/24/13 | 15 to 30 Years | ||||||||||||||||||||
| Roma, TX | (c) | 478 | 855 | — | — | 478 | 855 | 1,333 | (123 | ) | 1985 | 07/17/13 | 11 to 35 Years | ||||||||||||||||||||
| Romeoville, IL | (a) | 789 | 713 | (62 | ) | — | 727 | 713 | 1,440 | (405 | ) | 1999 | 09/23/05 | 15 to 20 Years | |||||||||||||||||||
| Roswell, GA | (a) | 513 | 559 | — | — | 513 | 559 | 1,072 | (93 | ) | 2006 | 02/02/12 | 15 to 40 Years | ||||||||||||||||||||
| Roswell, NM | (c) | 343 | 321 | — | — | 343 | 321 | 664 | (96 | ) | 1974 | 07/17/13 | 11 to 23 Years | ||||||||||||||||||||
| Saint Ann, MO | (a) | 588 | 613 | — | — | 588 | 613 | 1,201 | (425 | ) | 1985 | 09/23/05 | 15 to 20 Years | ||||||||||||||||||||
| Saint Cloud, FL | (a) | 1,193 | 557 | — | — | 1,193 | 557 | 1,750 | (357 | ) | 1983 | 06/25/04 | 15 to 20 Years | ||||||||||||||||||||
| Salisbury, NC | (a) | 357 | 338 | — | — | 357 | 338 | 695 | (59 | ) | 2002 | 09/17/13 | 15 to 30 Years | ||||||||||||||||||||
| San Antonio, TX | (a) | 517 | 373 | — | — | 517 | 373 | 890 | (200 | ) | 2002 | 09/25/06 | 15 to 30 Years | ||||||||||||||||||||
| San Antonio, TX | (a) | 349 | 429 | — | — | 349 | 429 | 778 | (261 | ) | 1983 | 09/25/06 | 15 to 20 Years | ||||||||||||||||||||
| San Antonio, TX | (a) | 428 | 339 | — | — | 428 | 339 | 767 | (185 | ) | 2001 | 09/25/06 | 15 to 30 Years | ||||||||||||||||||||
| San Antonio, TX | (a) | 539 | 300 | — | — | 539 | 300 | 839 | (200 | ) | 2001 | 09/25/06 | 15 to 30 Years | ||||||||||||||||||||
| San Antonio, TX | (c) | 205 | 1,042 | — | — | 205 | 1,042 | 1,247 | (205 | ) | 1976 | 07/17/13 | 10 to 20 Years | ||||||||||||||||||||
| San Antonio, TX | (c) | 685 | 257 | — | — | 685 | 257 | 942 | (44 | ) | 1976 | 07/17/13 | 9 to 35 Years | ||||||||||||||||||||
| San Antonio, TX | (c) | 592 | 336 | — | — | 592 | 336 | 928 | (56 | ) | 1968 | 07/17/13 | 9 to 35 Years | ||||||||||||||||||||
| San Antonio, TX | (c) | 79 | 347 | — | — | 79 | 347 | 426 | (47 | ) | 1977 | 07/17/13 | 9 to 33 Years | ||||||||||||||||||||
| San Antonio, TX | (c) | 395 | 414 | — | — | 395 | 414 | 809 | (86 | ) | 1984 | 07/17/13 | 11 to 25 Years | ||||||||||||||||||||
| San Antonio, TX | (c) | 544 | 521 | — | — | 544 | 521 | 1,065 | (77 | ) | 1967 | 07/17/13 | 11 to 33 Years | ||||||||||||||||||||
| San Antonio, TX | (c) | 375 | 282 | — | — | 375 | 282 | 657 | (72 | ) | 1965 | 07/17/13 | 9 to 21 Years | ||||||||||||||||||||
| San Antonio, TX | (c) | 373 | 170 | — | — | 373 | 170 | 543 | (47 | ) | 1993 | 07/17/13 | 9 to 20 Years | ||||||||||||||||||||
| San Antonio, TX | (c) | 331 | 449 | — | — | 331 | 449 | 780 | (87 | ) | 1983 | 07/17/13 | 10 to 25 Years | ||||||||||||||||||||
| San Antonio, TX | (c) | 283 | 573 | — | — | 283 | 573 | 856 | (107 | ) | 1971 | 07/17/13 | 11 to 33 Years | ||||||||||||||||||||
| San Antonio, TX | (c) | 369 | 226 | — | — | 369 | 226 | 595 | (47 | ) | 1986 | 07/17/13 | 10 to 25 Years | ||||||||||||||||||||
| San Antonio, TX | (c) | 397 | 700 | — | — | 397 | 700 | 1,097 | (98 | ) | 1984 | 07/17/13 | 11 to 35 Years | ||||||||||||||||||||
| San Antonio, TX | (c) | 403 | 61 | — | — | 403 | 61 | 464 | (130 | ) | 1971 | 07/17/13 | 9 to 17 Years | ||||||||||||||||||||
| Initial Cost to Company | Cost Capitalized Subsequent to Acquisition including impairment | Gross Amount at December 31, | Life in which depreciation in latest Statement of Operations is computed | ||||||||||||||||||||||
| Description | Encumbrances | Land and Improvements | Buildings and Improvements | Improvements/ Land | Improvements/ building | Land and Improvements | Buildings and Improvements | Total | Final Accum | Date of Construction | Date Acquired | ||||||||||||||
| Norfolk, VA | (c ) | 373 | 517 | — | — | 373 | 517 | 890 | (54 | ) | 1988 | 07/17/13 | 7 to 21 Years | ||||||||||||||||||||
| Norfolk, VA | (c ) | 354 | 192 | — | — | 354 | 192 | 546 | (27 | ) | 1988 | 07/17/13 | 9 to 20 Years | ||||||||||||||||||||
| Normal, IL | (a) | 394 | 240 | — | — | 394 | 240 | 634 | (61 | ) | 1980 | 12/21/12 | 10 to 15 years | ||||||||||||||||||||
| Normandy, MO | (a) | 265 | 329 | (6 | ) | — | 259 | 329 | 588 | (160 | ) | 1978 | 05/25/05 | 15 to 20 years | |||||||||||||||||||
| North Canton, OH | (a) | 484 | 497 | (14 | ) | — | 470 | 497 | 967 | (241 | ) | 1989 | 12/29/06 | 15 to 20 years | |||||||||||||||||||
| North Little Rock, AR | (c ) | 128 | 351 | — | — | 128 | 351 | 479 | (27 | ) | 1999 | 07/17/13 | 10 to 28 Years | ||||||||||||||||||||
| Oak Ridge, TN | (a) | 419 | 634 | — | — | 419 | 634 | 1,053 | (226 | ) | 1995 | 06/25/04 | 15 to 30 years | ||||||||||||||||||||
| Oak Ridge, TN | (a) | 669 | 548 | — | — | 669 | 548 | 1,217 | (163 | ) | 1976 | 09/01/05 | 15 to 30 years | ||||||||||||||||||||
| Odessa, TX | (c ) | 597 | 443 | — | — | 597 | 443 | 1,040 | (30 | ) | 1979 | 07/17/13 | 10 to 35 Years | ||||||||||||||||||||
| Odessa, TX | (c ) | 670 | 563 | — | — | 670 | 563 | 1,233 | (35 | ) | 1972 | 07/17/13 | 10 to 35 Years | ||||||||||||||||||||
| Oklahoma City, OK | (c ) | 223 | 469 | — | — | 223 | 469 | 692 | (46 | ) | 1998 | 07/17/13 | 8 to 22 Years | ||||||||||||||||||||
| Oklahoma City, OK | (c ) | 200 | 428 | — | — | 200 | 428 | 628 | (35 | ) | 1971 | 07/17/13 | 9 to 25 Years | ||||||||||||||||||||
| Oklahoma City, OK | (a) | 541 | 843 | (398 | ) | (614 | ) | 143 | 229 | 372 | (40 | ) | 2007 | 07/17/13 | 4 to 33 Years | ||||||||||||||||||
| Omaha, NE | (a) | 476 | 408 | — | — | 476 | 408 | 884 | (53 | ) | 1994 | 10/03/11 | 15 to 30 years | ||||||||||||||||||||
| Omaha, NE | (a) | 539 | 380 | — | — | 539 | 380 | 919 | (38 | ) | 2006 | 10/03/11 | 15 to 40 years | ||||||||||||||||||||
| Opelousas, LA | (a) | 419 | 659 | — | — | 419 | 659 | 1,078 | (33 | ) | 1981 | 10/30/13 | 15 to 30 Years | ||||||||||||||||||||
| Orlando, FL | (a) | 1,249 | 729 | — | — | 1,249 | 729 | 1,978 | (392 | ) | 1985 | 06/25/04 | 15 to 20 years | ||||||||||||||||||||
| Orlando, FL | (a) | 642 | 178 | — | — | 642 | 178 | 820 | (186 | ) | 1967 | 12/30/04 | 10 to 15 years | ||||||||||||||||||||
| Oshkosh, WI | (a) | 765 | 829 | (40 | ) | — | 725 | 829 | 1,554 | (434 | ) | 1984 | 12/29/05 | 15 to 20 years | |||||||||||||||||||
| Overland, MO | (a) | 278 | 494 | — | — | 278 | 494 | 772 | (217 | ) | 1972 | 05/25/05 | 15 to 20 years | ||||||||||||||||||||
| Palatine, IL | (a) | 772 | 505 | — | — | 772 | 505 | 1,277 | (250 | ) | 1972 | 09/29/06 | 15 to 20 years | ||||||||||||||||||||
| Parkersburg, WV | (a) | 416 | 658 | — | 75 | 416 | 733 | 1,149 | (368 | ) | 1986 | 03/07/07 | 4 to 20 years | ||||||||||||||||||||
| Parkersburg, WV | (a) | 457 | 309 | — | — | 457 | 309 | 766 | (82 | ) | 1999 | 12/21/12 | 10 to 15 years | ||||||||||||||||||||
| Parma Heights, OH | (a) | 598 | 535 | — | — | 598 | 535 | 1,133 | (162 | ) | 2004 | 06/12/08 | 13 to 38 years | ||||||||||||||||||||
| Paxton, IL | (a) | 324 | 658 | — | — | 324 | 658 | 982 | (359 | ) | 1986 | 12/29/05 | 15 to 20 years | ||||||||||||||||||||
| Pearson, GA | (a) | 159 | 817 | — | — | 159 | 817 | 976 | (35 | ) | 1994 | 12/24/13 | 15 to 30 Years | ||||||||||||||||||||
| Pensacola, FL | (a) | 860 | 291 | — | — | 860 | 291 | 1,151 | (309 | ) | 1977 | 07/28/04 | 10 to 15 years | ||||||||||||||||||||
| Peoria, IL | (a) | 154 | 320 | — | — | 154 | 320 | 474 | (155 | ) | 1976 | 05/25/05 | 15 to 20 years | ||||||||||||||||||||
| Peoria, IL | (a) | 383 | 270 | — | — | 383 | 270 | 653 | (70 | ) | 1980 | 12/21/12 | 10 to 15 years | ||||||||||||||||||||
| Peoria, IL | (a) | 282 | 435 | — | — | 282 | 435 | 717 | (61 | ) | 1980 | 12/21/12 | 15 to 20 years | ||||||||||||||||||||
| Pharr, TX | (c ) | 694 | 441 | — | — | 694 | 441 | 1,135 | (37 | ) | 1997 | 07/17/13 | 10 to 26 Years | ||||||||||||||||||||
| Phenix City, AL | (c ) | 493 | 497 | — | — | 493 | 497 | 990 | (26 | ) | 1978 | 07/17/13 | 8 to 35 Years | ||||||||||||||||||||
| Philippi, WV | (a) | 405 | 232 | — | — | 405 | 232 | 637 | (67 | ) | 1986 | 12/21/12 | 10 to 15 years | ||||||||||||||||||||
| Phoenix, AZ | (c ) | 523 | 97 | — | — | 523 | 97 | 620 | (19 | ) | 1976 | 07/17/13 | 9 to 16 Years | ||||||||||||||||||||
| Phoenix, AZ | (c ) | 321 | 276 | — | — | 321 | 276 | 597 | (31 | ) | 1975 | 07/17/13 | 10 to 20 Years | ||||||||||||||||||||
| San Antonio, TX | (c) | 279 | 261 | — | — | 279 | 261 | 540 | (54 | ) | 1976 | 07/17/13 | 11 to 32 Years | ||||||||||||||||||||
| San Benito, TX | (c) | 1,641 | 688 | — | — | 1,641 | 688 | 2,329 | (88 | ) | 1977 | 07/17/13 | 9 to 35 Years | ||||||||||||||||||||
| Sandusky, OH | (a) | 922 | 406 | (314 | ) | (89 | ) | 608 | 317 | 925 | (132 | ) | 1987 | 08/27/09 | 14 to 29 Years | ||||||||||||||||||
| Sapulpa, OK | (c) | 855 | 1,030 | — | — | 855 | 1,030 | 1,885 | (25 | ) | 1987 | 06/30/16 | 5 to 30 Years | ||||||||||||||||||||
| Sedalia, MO | (a) | 751 | 662 | — | — | 751 | 662 | 1,413 | (352 | ) | 1983 | 12/29/06 | 15 to 30 Years | ||||||||||||||||||||
| Seven Hills, OH | (a) | 496 | 488 | — | — | 496 | 488 | 984 | (209 | ) | 1977 | 08/27/09 | 13 to 28 Years | ||||||||||||||||||||
| Seymour, TN | (a) | 365 | 440 | — | — | 365 | 440 | 805 | (86 | ) | 2007 | 07/17/13 | 6 to 27 Years | ||||||||||||||||||||
| Siler City, NC | (a) | 686 | 385 | — | — | 686 | 385 | 1,071 | (99 | ) | 2005 | 09/17/13 | 15 to 30 Years | ||||||||||||||||||||
| Parkersburg, WV | (a) | 383 | 404 | — | — | 383 | 404 | 787 | (111 | ) | 1986 | 12/21/12 | 15 to 20 Years | ||||||||||||||||||||
| South Charleston, WV | (a) | 524 | 541 | — | — | 524 | 541 | 1,065 | (134 | ) | 1993 | 12/21/12 | 15 to 20 Years | ||||||||||||||||||||
| South Hill, VA | (a) | 564 | 320 | — | — | 564 | 320 | 884 | (81 | ) | 2007 | 09/17/13 | 15 to 30 Years | ||||||||||||||||||||
| Southlake, TX | (c) | 30 | 58 | — | — | 30 | 58 | 88 | (5 | ) | 1999 | 06/30/16 | 9 to 10 Years | ||||||||||||||||||||
| Spencer, IN | (a) | 136 | 1,040 | — | — | 136 | 1,040 | 1,176 | (187 | ) | 1999 | 07/17/13 | 8 to 22 Years | ||||||||||||||||||||
| Springfield, IL | (a) | 1,072 | 642 | — | — | 1,072 | 642 | 1,714 | (486 | ) | 1988 | 09/23/05 | 15 to 20 Years | ||||||||||||||||||||
| Springfield, IL | (a) | 571 | 630 | — | — | 571 | 630 | 1,201 | (320 | ) | 1997 | 09/23/05 | 15 to 30 Years | ||||||||||||||||||||
| Springfield, MO | (a) | 439 | 719 | — | — | 439 | 719 | 1,158 | (336 | ) | 2004 | 12/29/06 | 15 to 40 Years | ||||||||||||||||||||
| Springville, NY | (a) | 678 | 586 | — | — | 678 | 586 | 1,264 | (262 | ) | 1988 | 11/10/05 | 15 to 30 Years | ||||||||||||||||||||
| St. Louis, MO | (a) | 503 | 651 | — | — | 503 | 651 | 1,154 | (386 | ) | 1976 | 09/24/04 | 15 to 20 Years | ||||||||||||||||||||
| St. Louis, MO | (a) | 828 | 351 | — | — | 828 | 351 | 1,179 | (300 | ) | 1986 | 09/24/04 | 15 to 20 Years | ||||||||||||||||||||
| St. Louis, MO | (a) | 290 | 211 | — | — | 290 | 211 | 501 | (152 | ) | 1973 | 05/25/05 | 15 to 20 Years | ||||||||||||||||||||
| St. Louis, MO | (a) | 231 | 337 | — | — | 231 | 337 | 568 | (195 | ) | 1972 | 05/25/05 | 15 to 20 Years | ||||||||||||||||||||
| St. Louis, MO | (a) | 189 | 227 | — | — | 189 | 227 | 416 | (145 | ) | 1972 | 05/25/05 | 15 to 20 Years | ||||||||||||||||||||
| St. Louis, MO | (a) | 464 | 218 | — | — | 464 | 218 | 682 | (174 | ) | 1978 | 05/25/05 | 15 to 20 Years | ||||||||||||||||||||
| St. Paul, TX | (c) | 509 | 192 | — | — | 509 | 192 | 701 | (13 | ) | 2003 | 07/25/16 | 13 to 20 Years | ||||||||||||||||||||
| Statesboro, GA | (a) | 779 | 777 | — | — | 779 | 777 | 1,556 | (410 | ) | 1985 | 09/24/04 | 15 to 20 Years | ||||||||||||||||||||
| Sterling Heights, MI | (a) | 866 | 960 | — | — | 866 | 960 | 1,826 | (406 | ) | 2000 | 12/29/05 | 15 to 30 Years | ||||||||||||||||||||
| Stillwater, OK | (c) | 218 | 1,262 | — | — | 218 | 1,262 | 1,480 | (160 | ) | 2007 | 07/17/13 | 4 to 32 Years | ||||||||||||||||||||
| Stillwater, OK | (c) | 1,314 | 1,111 | — | — | 1,314 | 1,111 | 2,425 | (85 | ) | 2015 | 03/31/15 | 15 to 40 Years | ||||||||||||||||||||
| Stockbridge, GA | (a) | 388 | 353 | — | — | 388 | 353 | 741 | (72 | ) | 2001 | 02/02/12 | 15 to 30 Years | ||||||||||||||||||||
| Stone Mountain, GA | (a) | 379 | 487 | — | — | 379 | 487 | 866 | (95 | ) | 1986 | 02/02/12 | 15 to 30 Years | ||||||||||||||||||||
| Sun City, AZ | (a) | 771 | 372 | — | — | 771 | 372 | 1,143 | (237 | ) | 1986 | 12/29/06 | 15 to 20 Years | ||||||||||||||||||||
| Sweetwater, TN | (a) | 602 | 550 | — | 250 | 602 | 800 | 1,402 | (244 | ) | 1999 | 12/29/06 | 15 to 40 Years | ||||||||||||||||||||
| Talladega, AL | (c) | 247 | 245 | — | — | 247 | 245 | 492 | (91 | ) | 1998 | 07/17/13 | 11 to 21 Years | ||||||||||||||||||||
| Tempe, AZ | (a) | 480 | 361 | — | — | 480 | 361 | 841 | (191 | ) | 2003 | 09/25/06 | 15 to 30 Years | ||||||||||||||||||||
| Temple, TX | (c) | 705 | 493 | — | — | 705 | 493 | 1,198 | (67 | ) | 1983 | 07/17/13 | 10 to 35 Years | ||||||||||||||||||||
| Texarkana, TX | (a) | 265 | 747 | — | — | 265 | 747 | 1,012 | (102 | ) | 2013 | 11/04/13 | 14 to 30 Years | ||||||||||||||||||||
| The Village, OK | (c) | 211 | 650 | — | — | 211 | 650 | 861 | (83 | ) | 1978 | 07/17/13 | 9 to 35 Years | ||||||||||||||||||||
| Initial Cost to Company | Cost Capitalized Subsequent to Acquisition including impairment | Gross Amount at December 31, | Life in which depreciation in latest Statement of Operations is computed | ||||||||||||||||||||||
| Description | Encumbrances | Land and Improvements | Buildings and Improvements | Improvements/ Land | Improvements/ building | Land and Improvements | Buildings and Improvements | Total | Final Accum | Date of Construction | Date Acquired | ||||||||||||||
| Phoenix, AZ | (c ) | 384 | 528 | — | — | 384 | 528 | 912 | (37 | ) | 1974 | 07/17/13 | 11 to 27 Years | ||||||||||||||||||||
| Phoenix, AZ | (c ) | 368 | 267 | — | — | 368 | 267 | 635 | (23 | ) | 1974 | 07/17/13 | 11 to 23 Years | ||||||||||||||||||||
| Phoenix, AZ | (c ) | 415 | 403 | — | — | 415 | 403 | 818 | (29 | ) | 1975 | 07/17/13 | 8 to 27 Years | ||||||||||||||||||||
| Phoenix, AZ | (c ) | 599 | 412 | — | — | 599 | 412 | 1,011 | (28 | ) | 1980 | 07/17/13 | 10 to 35 Years | ||||||||||||||||||||
| Phoenix, AZ | (c ) | 400 | 120 | — | — | 400 | 120 | 520 | (21 | ) | 1977 | 07/17/13 | 11 to 13 Years | ||||||||||||||||||||
| Pine Bluff, AR | (c ) | 854 | 431 | — | — | 854 | 431 | 1,285 | (24 | ) | 1971 | 07/17/13 | 7 to 35 Years | ||||||||||||||||||||
| Pineville, LA | (a) | 558 | 1,044 | — | — | 558 | 1,044 | 1,602 | (354 | ) | 1996 | 06/25/04 | 11 to 30 years | ||||||||||||||||||||
| Pleasanton, TX | (c ) | 230 | 1,052 | — | — | 230 | 1,052 | 1,282 | (57 | ) | 1985 | 07/17/13 | 11 to 35 Years | ||||||||||||||||||||
| Ponca City, OK | (b) | 93 | 249 | — | — | 93 | 249 | 342 | (22 | ) | 2007 | 07/17/13 | 4 to 28 Years | ||||||||||||||||||||
| Port Allen, LA | (a) | 521 | 575 | — | — | 521 | 575 | 1,096 | (245 | ) | 1997 | 09/24/04 | 15 to 30 years | ||||||||||||||||||||
| Port Isabel, TX | (c ) | 348 | 672 | — | — | 348 | 672 | 1,020 | (42 | ) | 2004 | 07/17/13 | 11 to 31 Years | ||||||||||||||||||||
| Port Lavaca, TX | (c ) | 339 | 594 | — | — | 339 | 594 | 933 | (40 | ) | 1985 | 07/17/13 | 11 to 28 Years | ||||||||||||||||||||
| Portales, NM | (a) | 388 | 1,012 | — | — | 388 | 1,012 | 1,400 | (31 | ) | 1993 | 04/16/14 | 15 to 30 Years | ||||||||||||||||||||
| Portsmouth, VA | (c ) | 574 | 419 | — | — | 574 | 419 | 993 | (39 | ) | 1988 | 07/17/13 | 10 to 25 Years | ||||||||||||||||||||
| Powell, TN | (b) | 411 | 353 | — | — | 411 | 353 | 764 | (34 | ) | 2007 | 07/17/13 | 4 to 26 Years | ||||||||||||||||||||
| Princeton, IN | (a) | 340 | 906 | — | — | 340 | 906 | 1,246 | (109 | ) | 1992 | 07/17/13 | 7 to 15 Years | ||||||||||||||||||||
| Pulaski, VA | (a) | 444 | 236 | — | — | 444 | 236 | 680 | (232 | ) | 1994 | 11/23/04 | 15 to 20 years | ||||||||||||||||||||
| Quincy, FL | (a) | 1,015 | 416 | — | — | 1,015 | 416 | 1,431 | (336 | ) | 1989 | 09/24/04 | 15 to 20 years | ||||||||||||||||||||
| Quitman, GA | (a) | 259 | 936 | — | — | 259 | 936 | 1,195 | (39 | ) | 1985 | 12/24/13 | 15 to 30 Years | ||||||||||||||||||||
| Radford, VA | (a) | 499 | 248 | — | — | 499 | 248 | 747 | (273 | ) | 1995 | 11/23/04 | 15 to 20 years | ||||||||||||||||||||
| Raleigh, NC | (a) | 639 | 320 | — | — | 639 | 320 | 959 | (30 | ) | 2008 | 09/17/13 | 15 to 30 Years | ||||||||||||||||||||
| Raymondville, TX | (c ) | 660 | 455 | — | — | 660 | 455 | 1,115 | (33 | ) | 1984 | 07/17/13 | 9 to 35 Years | ||||||||||||||||||||
| Red Bank, TN | (a) | 610 | 557 | — | — | 610 | 557 | 1,167 | (275 | ) | 1997 | 06/25/04 | 15 to 30 years | ||||||||||||||||||||
| Richland Hills, TX | (c ) | 229 | 199 | — | — | 229 | 199 | 428 | (20 | ) | 1999 | 07/17/13 | 10 to 25 Years | ||||||||||||||||||||
| Rio Grand City, TX | (c ) | 1,746 | 554 | — | — | 1,746 | 554 | 2,300 | (33 | ) | 1984 | 07/17/13 | 12 to 35 Years | ||||||||||||||||||||
| Robinson, IL | (a) | 250 | 1,021 | — | — | 250 | 1,021 | 1,271 | (65 | ) | 1994 | 07/17/13 | 7 to 33 Years | ||||||||||||||||||||
| Rochester, MN | (a) | 561 | 83 | 66 | (83 | ) | 627 | — | 627 | — | 1996 | 09/23/05 | 20 to 20 years | ||||||||||||||||||||
| Rock Hill, SC | (a) | 373 | 722 | — | — | 373 | 722 | 1,095 | (326 | ) | 1978 | 12/29/05 | 15 to 20 years | ||||||||||||||||||||
| Rock Island, IL | (a) | 195 | 531 | — | — | 195 | 531 | 726 | (71 | ) | 1994 | 10/03/11 | 15 to 30 years | ||||||||||||||||||||
| Rockwell, NC | (a) | 385 | 385 | — | — | 385 | 385 | 770 | (34 | ) | 2006 | 09/17/13 | 15 to 30 Years | ||||||||||||||||||||
| Rogers, AR | (b) | 334 | 884 | — | — | 334 | 884 | 1,218 | (9 | ) | 2005 | 09/30/14 | 15 to 30 Years | ||||||||||||||||||||
| Rogersville, TN | (a) | 384 | 964 | — | — | 384 | 964 | 1,348 | (91 | ) | 1986 | 12/21/12 | 15 to 30 years | ||||||||||||||||||||
| Rolesville, NC | (a) | 526 | 320 | — | — | 526 | 320 | 846 | (28 | ) | 2007 | 09/17/13 | 15 to 30 Years | ||||||||||||||||||||
| Rolla, MO | (a) | 229 | 857 | — | — | 229 | 857 | 1,086 | (37 | ) | 1978 | 12/24/13 | 15 to 30 Years | ||||||||||||||||||||
| Roma, TX | (c ) | 478 | 855 | — | — | 478 | 855 | 1,333 | (51 | ) | 1985 | 07/17/13 | 11 to 35 Years | ||||||||||||||||||||
| Romeoville, IL | (a) | 789 | 713 | — | — | 789 | 713 | 1,502 | (319 | ) | 1999 | 09/23/05 | 15 to 20 years | ||||||||||||||||||||
| Roswell, GA | (a) | 513 | 559 | — | — | 513 | 559 | 1,072 | (55 | ) | 2006 | 02/02/12 | 15 to 40 years | ||||||||||||||||||||
| Roswell, NM | (c ) | 343 | 321 | — | — | 343 | 321 | 664 | (40 | ) | 1974 | 07/17/13 | 11 to 23 Years | ||||||||||||||||||||
| Thomasville, GA | (a) | 408 | 837 | — | — | 408 | 837 | 1,245 | (108 | ) | 1985 | 12/24/13 | 15 to 30 Years | ||||||||||||||||||||
| Tipp City, OH | (a) | 789 | 332 | — | — | 789 | 332 | 1,121 | (252 | ) | 1991 | 12/29/06 | 15 to 20 Years | ||||||||||||||||||||
| Tooele, UT | (a) | 552 | 624 | — | — | 552 | 624 | 1,176 | (430 | ) | 1988 | 09/24/04 | 15 to 20 Years | ||||||||||||||||||||
| Trenton, MO | (a) | 309 | 1,175 | — | — | 309 | 1,175 | 1,484 | (147 | ) | 1976 | 12/24/13 | 15 to 30 Years | ||||||||||||||||||||
| Trotwood, OH | (c) | 281 | 219 | — | — | 281 | 219 | 500 | (23 | ) | 1971 | 08/21/15 | 15 to 20 Years | ||||||||||||||||||||
| Tucson, AZ | (c) | 262 | 193 | — | — | 262 | 193 | 455 | (61 | ) | 1983 | 07/17/13 | 11 to 23 Years | ||||||||||||||||||||
| Tucson, AZ | (c) | 191 | 552 | — | — | 191 | 552 | 743 | (72 | ) | 1981 | 07/17/13 | 11 to 35 Years | ||||||||||||||||||||
| Tucson, AZ | (c) | 349 | 479 | — | — | 349 | 479 | 828 | (72 | ) | 1976 | 07/17/13 | 11 to 35 Years | ||||||||||||||||||||
| Tucson, AZ | (c) | 221 | 434 | — | — | 221 | 434 | 655 | (72 | ) | 1980 | 07/17/13 | 11 to 27 Years | ||||||||||||||||||||
| Tulsa, OK | (c) | 767 | 466 | — | — | 767 | 466 | 1,233 | (74 | ) | 1976 | 07/17/13 | 8 to 35 Years | ||||||||||||||||||||
| Tulsa, OK | (c) | 315 | 717 | — | — | 315 | 717 | 1,032 | (95 | ) | 1976 | 07/17/13 | 10 to 35 Years | ||||||||||||||||||||
| Tulsa, OK | (c) | 835 | 967 | — | — | 835 | 967 | 1,802 | (21 | ) | 1978 | 06/30/16 | 5 to 30 Years | ||||||||||||||||||||
| Tulsa, OK | (c) | 760 | 381 | — | — | 760 | 381 | 1,141 | (14 | ) | 1984 | 06/30/16 | 5 to 20 Years | ||||||||||||||||||||
| Tulsa, OK | (c) | — | 20 | — | — | — | 20 | 20 | (1 | ) | 1982 | 06/30/16 | 10 to 10 Years | ||||||||||||||||||||
| Tyler, TX | (c) | 227 | 527 | — | — | 227 | 527 | 754 | (71 | ) | 1976 | 07/17/13 | 11 to 35 Years | ||||||||||||||||||||
| Tyler, TX | (c) | 355 | 663 | — | — | 355 | 663 | 1,018 | (28 | ) | 1980 | 12/29/15 | 15 to 30 Years | ||||||||||||||||||||
| Universal City, TX | (c) | 408 | 369 | — | — | 408 | 369 | 777 | (84 | ) | 1989 | 07/17/13 | 9 to 25 Years | ||||||||||||||||||||
| Vicksburg, MS | (c) | 278 | 333 | — | — | 278 | 333 | 611 | (77 | ) | 1972 | 07/17/13 | 11 to 25 Years | ||||||||||||||||||||
| Victoria, TX | (c) | 129 | 490 | — | — | 129 | 490 | 619 | (87 | ) | 1985 | 07/17/13 | 11 to 28 Years | ||||||||||||||||||||
| Victoria, TX | (c) | 367 | 182 | — | — | 367 | 182 | 549 | (48 | ) | 1984 | 07/17/13 | 11 to 22 Years | ||||||||||||||||||||
| Villa Rica, GA | (a) | 807 | 629 | — | — | 807 | 629 | 1,436 | (317 | ) | 1999 | 02/28/06 | 15 to 30 Years | ||||||||||||||||||||
| Vincennes, IN | (a) | 389 | 1,425 | — | — | 389 | 1,425 | 1,814 | (207 | ) | 2000 | 07/17/13 | 8 to 30 Years | ||||||||||||||||||||
| Waco, TX | (c) | 365 | 542 | — | — | 365 | 542 | 907 | (67 | ) | 1969 | 07/17/13 | 10 to 35 Years | ||||||||||||||||||||
| Warner Robins, GA | (a) | 229 | 887 | — | — | 229 | 887 | 1,116 | (121 | ) | 1978 | 12/24/13 | 15 to 30 Years | ||||||||||||||||||||
| Warren, MI | (a) | 488 | 215 | — | — | 488 | 215 | 703 | (146 | ) | 1979 | 05/25/05 | 15 to 20 Years | ||||||||||||||||||||
| Washington Park, IL | (a) | 119 | 324 | — | — | 119 | 324 | 443 | (188 | ) | 1980 | 05/25/05 | 15 to 20 Years | ||||||||||||||||||||
| Washington, IL | (a) | 264 | 460 | — | — | 264 | 460 | 724 | (127 | ) | 1980 | 12/21/12 | 15 to 20 Years | ||||||||||||||||||||
| Washington, IN | (a) | 272 | 949 | — | — | 272 | 949 | 1,221 | (151 | ) | 1995 | 07/17/13 | 8 to 33 Years | ||||||||||||||||||||
| Watertown, WI | (a) | 267 | 338 | — | — | 267 | 338 | 605 | (182 | ) | 1986 | 06/30/09 | 13 to 18 Years | ||||||||||||||||||||
| Waynesburg, PA | (a) | 323 | 918 | — | — | 323 | 918 | 1,241 | (177 | ) | 1982 | 12/21/12 | 15 to 30 Years | ||||||||||||||||||||
| Weatherford, TX | (c) | 260 | 886 | — | 21 | 260 | 907 | 1,167 | (16 | ) | 2015 | 07/28/16 | 18 to 30 Years | ||||||||||||||||||||
| Weslaco, TX | (c) | 860 | 513 | — | — | 860 | 513 | 1,373 | (72 | ) | 1990 | 07/17/13 | 11 to 35 Years | ||||||||||||||||||||
| Weslaco, TX | (c) | 291 | 786 | — | — | 291 | 786 | 1,077 | (133 | ) | 1970 | 07/17/13 | 11 to 25 Years | ||||||||||||||||||||
| Westchester, IL | (a) | 765 | 437 | — | — | 765 | 437 | 1,202 | (240 | ) | 1986 | 09/29/06 | 15 to 20 Years | ||||||||||||||||||||
| Weston, WV | (a) | 158 | 695 | — | — | 158 | 695 | 853 | (119 | ) | 1981 | 12/21/12 | 15 to 30 Years | ||||||||||||||||||||
| Williamsport, PA | (c) | 864 | 979 | — | — | 864 | 979 | 1,843 | (87 | ) | 1966 | 11/18/14 | 15 to 30 Years | ||||||||||||||||||||
| Winchester, TN | (a) | 400 | 291 | — | 250 | 400 | 541 | 941 | (183 | ) | 1993 | 12/29/06 | 15 to 20 Years | ||||||||||||||||||||
| Winter Springs, FL | (a) | 523 | 446 | — | — | 523 | 446 | 969 | (312 | ) | 1988 | 12/30/04 | 15 to 20 Years | ||||||||||||||||||||
| Initial Cost to Company | Cost Capitalized Subsequent to Acquisition including impairment | Gross Amount at December 31, | Life in which depreciation in latest Statement of Operations is computed | ||||||||||||||||||||||
| Description | Encumbrances | Land and Improvements | Buildings and Improvements | Improvements/ Land | Improvements/ building | Land and Improvements | Buildings and Improvements | Total | Final Accum | Date of Construction | Date Acquired | ||||||||||||||
| Saint Ann, MO | (a) | 588 | 613 | — | — | 588 | 613 | 1,201 | (335 | ) | 1985 | 09/23/05 | 15 to 20 years | ||||||||||||||||||||
| Saint Cloud, FL | (a) | 1,193 | 557 | — | — | 1,193 | 557 | 1,750 | (281 | ) | 1983 | 06/25/04 | 15 to 20 years | ||||||||||||||||||||
| Salisbury, NC | (a) | 357 | 338 | — | — | 357 | 338 | 695 | (23 | ) | 2002 | 09/17/13 | 15 to 30 Years | ||||||||||||||||||||
| San Antonio, TX | (c ) | 205 | 1,042 | — | — | 205 | 1,042 | 1,247 | (85 | ) | 1976 | 07/17/13 | 10 to 21 Years | ||||||||||||||||||||
| San Antonio, TX | (c ) | 685 | 257 | — | — | 685 | 257 | 942 | (18 | ) | 1976 | 07/17/13 | 9 to 35 Years | ||||||||||||||||||||
| San Antonio, TX | (c ) | 592 | 336 | — | — | 592 | 336 | 928 | (23 | ) | 1968 | 07/17/13 | 9 to 35 Years | ||||||||||||||||||||
| San Antonio, TX | (c ) | 119 | 353 | — | — | 119 | 353 | 472 | (23 | ) | 1970 | 07/17/13 | 10 to 30 Years | ||||||||||||||||||||
| San Antonio, TX | (c ) | 79 | 347 | — | — | 79 | 347 | 426 | (20 | ) | 1977 | 07/17/13 | 9 to 33 Years | ||||||||||||||||||||
| San Antonio, TX | (c ) | 395 | 414 | — | — | 395 | 414 | 809 | (36 | ) | 1984 | 07/17/13 | 11 to 25 Years | ||||||||||||||||||||
| San Antonio, TX | (c ) | 144 | 538 | — | — | 144 | 538 | 682 | (47 | ) | 1984 | 07/17/13 | 8 to 20 Years | ||||||||||||||||||||
| San Antonio, TX | (c ) | 544 | 521 | — | — | 544 | 521 | 1,065 | (32 | ) | 1967 | 07/17/13 | 11 to 33 Years | ||||||||||||||||||||
| San Antonio, TX | (c ) | 375 | 282 | — | — | 375 | 282 | 657 | (30 | ) | 1965 | 07/17/13 | 9 to 21 Years | ||||||||||||||||||||
| San Antonio, TX | (c ) | 373 | 170 | — | — | 373 | 170 | 543 | (20 | ) | 1993 | 07/17/13 | 9 to 21 Years | ||||||||||||||||||||
| San Antonio, TX | (c ) | 331 | 449 | — | — | 331 | 449 | 780 | (36 | ) | 1983 | 07/17/13 | 10 to 25 Years | ||||||||||||||||||||
| San Antonio, TX | (c ) | 283 | 573 | — | — | 283 | 573 | 856 | (44 | ) | 1971 | 07/17/13 | 11 to 33 Years | ||||||||||||||||||||
| San Antonio, TX | (c ) | 369 | 226 | — | — | 369 | 226 | 595 | (20 | ) | 1986 | 07/17/13 | 10 to 25 Years | ||||||||||||||||||||
| San Antonio, TX | (c ) | 397 | 700 | — | — | 397 | 700 | 1,097 | (41 | ) | 1984 | 07/17/13 | 11 to 35 Years | ||||||||||||||||||||
| San Antonio, TX | (c ) | 403 | 61 | — | — | 403 | 61 | 464 | (54 | ) | 1971 | 07/17/13 | 9 to 21 Years | ||||||||||||||||||||
| San Antonio, TX | (c ) | 279 | 261 | — | — | 279 | 261 | 540 | (23 | ) | 1976 | 07/17/13 | 11 to 32 Years | ||||||||||||||||||||
| San Antonio, TX | (c ) | 466 | 270 | — | — | 466 | 270 | 736 | (34 | ) | 1970 | 07/17/13 | 10 to 21 Years | ||||||||||||||||||||
| San Antonio, TX | (a) | 517 | 373 | — | — | 517 | 373 | 890 | (157 | ) | 2002 | 09/25/06 | 15 to 30 years | ||||||||||||||||||||
| San Antonio, TX | (a) | 349 | 429 | — | — | 349 | 429 | 778 | (206 | ) | 1983 | 09/25/06 | 15 to 20 years | ||||||||||||||||||||
| San Antonio, TX | (a) | 428 | 339 | — | — | 428 | 339 | 767 | (146 | ) | 2001 | 09/25/06 | 15 to 30 years | ||||||||||||||||||||
| San Antonio, TX | (a) | 539 | 300 | — | — | 539 | 300 | 839 | (157 | ) | 2001 | 09/25/06 | 15 to 30 years | ||||||||||||||||||||
| San Benito, TX | (c ) | 1,641 | 688 | — | — | 1,641 | 688 | 2,329 | (36 | ) | 1977 | 07/17/13 | 9 to 35 Years | ||||||||||||||||||||
| Sandusky, OH | (a) | 922 | 406 | (314 | ) | (89 | ) | 608 | 317 | 925 | (100 | ) | 1987 | 06/12/08 | 14 to 29 years | ||||||||||||||||||
| Sedalia, MO | (b) | 283 | 641 | — | — | 283 | 641 | 924 | (35 | ) | 2006 | 07/17/13 | 3 to 48 Years | ||||||||||||||||||||
| Sedalia, MO | (a) | 751 | 662 | — | — | 751 | 662 | 1,413 | (277 | ) | 1983 | 12/29/06 | 15 to 30 years | ||||||||||||||||||||
| Seven Hills, OH | (a) | 496 | 488 | — | — | 496 | 488 | 984 | (161 | ) | 1977 | 06/12/08 | 13 to 28 years | ||||||||||||||||||||
| Seymour, TN | (a) | 365 | 440 | — | — | 365 | 440 | 805 | (36 | ) | 2007 | 07/17/13 | 6 to 27 Years | ||||||||||||||||||||
| Shawnee, OK | (b) | 130 | 1,182 | — | — | 130 | 1,182 | 1,312 | (67 | ) | 2006 | 07/17/13 | 3 to 32 Years | ||||||||||||||||||||
| Siler City, NC | (a) | 686 | 385 | — | — | 686 | 385 | 1,071 | (38 | ) | 2005 | 09/17/13 | 15 to 30 Years | ||||||||||||||||||||
| So. Parkersburg, WV | (a) | 383 | 404 | — | — | 383 | 404 | 787 | (55 | ) | 1986 | 12/21/12 | 15 to 20 years | ||||||||||||||||||||
| South Charleston, WV | (a) | 524 | 541 | — | — | 524 | 541 | 1,065 | (67 | ) | 1993 | 12/21/12 | 15 to 20 years | ||||||||||||||||||||
| South Hill, NC | (a) | 564 | 320 | — | — | 564 | 320 | 884 | (31 | ) | 2007 | 09/17/13 | 15 to 30 Years | ||||||||||||||||||||
| Spencer, IN | (a) | 136 | 1,040 | — | — | 136 | 1,040 | 1,176 | (77 | ) | 1999 | 07/17/13 | 8 to 22 Years | ||||||||||||||||||||
| Springfield, IL | (a) | 1,072 | 642 | — | — | 1,072 | 642 | 1,714 | (383 | ) | 1988 | 09/23/05 | 15 to 20 years | ||||||||||||||||||||
| Springfield, IL | (a) | 571 | 630 | — | — | 571 | 630 | 1,201 | (252 | ) | 1997 | 09/23/05 | 15 to 30 years | ||||||||||||||||||||
| Wytheville, VA | (a) | 446 | 172 | — | — | 446 | 172 | 618 | (210 | ) | 1995 | 07/01/05 | 15 to 20 Years | ||||||||||||||||||||
| Xenia, OH | (c) | 384 | 288 | — | — | 384 | 288 | 672 | (26 | ) | 1985 | 08/21/15 | 15 to 20 Years | ||||||||||||||||||||
| Yukon, OK | (a) | 555 | 373 | — | — | 555 | 373 | 928 | (236 | ) | 2003 | 07/01/05 | 15 to 30 Years | ||||||||||||||||||||
| Zebulon, NC | (a) | 780 | 395 | — | — | 780 | 395 | 1,175 | (92 | ) | 2006 | 09/17/13 | 15 to 30 Years | ||||||||||||||||||||
| Movie Theatres | |||||||||||||||||||||||||||||||||
| Anderson, SC | (c) | 5,248 | 6,437 | — | — | 5,248 | 6,437 | 11,685 | (786 | ) | 2000 | 09/25/14 | 15 to 30 Years | ||||||||||||||||||||
| Arnold, MO | (a) | 3,275 | 3,014 | — | — | 3,275 | 3,014 | 6,289 | (945 | ) | 1999 | 07/17/13 | 5 to 21 Years | ||||||||||||||||||||
| Avon, IN | (c) | 3,388 | 2,967 | — | — | 3,388 | 2,967 | 6,355 | (351 | ) | 1995 | 03/01/16 | 4 to 30 Years | ||||||||||||||||||||
| Batavia, IL | (a) | 4,705 | 7,561 | — | — | 4,705 | 7,561 | 12,266 | (2,636 | ) | 1995 | 06/30/09 | 11 to 38 Years | ||||||||||||||||||||
| Bixby, OK | (a) | 5,585 | 10,101 | — | — | 5,585 | 10,101 | 15,686 | (4,380 | ) | 1998 | 07/01/05 | 14 to 30 Years | ||||||||||||||||||||
| Bowie, MD | (c) | 7,138 | 5,935 | — | 23 | 7,138 | 5,958 | 13,096 | (39 | ) | 1998 | 11/23/16 | 8 to 40 Years | ||||||||||||||||||||
| Carrollton, GA | (c) | 1,879 | 5,868 | — | — | 1,879 | 5,868 | 7,747 | (404 | ) | 2005 | 12/30/14 | 15 to 40 Years | ||||||||||||||||||||
| Cedar Rapids, IA | (a) | 2,521 | 5,461 | — | — | 2,521 | 5,461 | 7,982 | (1,797 | ) | 1998 | 07/01/05 | 15 to 40 Years | ||||||||||||||||||||
| Chubbock, ID | (a) | 1,845 | 2,691 | — | — | 1,845 | 2,691 | 4,536 | (234 | ) | 2004 | 12/23/14 | 10 to 30 Years | ||||||||||||||||||||
| Colorado Springs, CO | (a) | 1,892 | 1,732 | — | — | 1,892 | 1,732 | 3,624 | (936 | ) | 1995 | 09/30/05 | 14 to 30 Years | ||||||||||||||||||||
| Columbia, SC | (a) | 2,115 | 2,091 | — | — | 2,115 | 2,091 | 4,206 | (862 | ) | 1996 | 09/30/05 | 15 to 30 Years | ||||||||||||||||||||
| Covina, CA | (c) | 5,566 | 26,922 | — | — | 5,566 | 26,922 | 32,488 | (6,844 | ) | 1997 | 06/23/04 | 13 to 40 Years | ||||||||||||||||||||
| Danville, VA | (c) | 1,349 | 6,406 | — | — | 1,349 | 6,406 | 7,755 | (410 | ) | 2002 | 12/30/14 | 15 to 40 Years | ||||||||||||||||||||
| Dawsonville, GA | (c) | 1,859 | 4,207 | — | — | 1,859 | 4,207 | 6,066 | (313 | ) | 2005 | 12/30/14 | 15 to 40 Years | ||||||||||||||||||||
| Delano, MN | (c) | 397 | 1,052 | — | — | 397 | 1,052 | 1,449 | (29 | ) | 1984 | 07/29/16 | 6 to 20 Years | ||||||||||||||||||||
| Dickson City, PA | (a) | 4,198 | 5,269 | — | — | 4,198 | 5,269 | 9,467 | (770 | ) | 2010 | 09/29/14 | 13 to 30 Years | ||||||||||||||||||||
| Downey, CA | (c) | 1,767 | 12,172 | — | — | 1,767 | 12,172 | 13,939 | (524 | ) | 1997 | 09/30/15 | 15 to 30 Years | ||||||||||||||||||||
| Durham, NC | (a) | 1,630 | 2,685 | — | — | 1,630 | 2,685 | 4,315 | (1,335 | ) | 1994 | 09/30/05 | 13 to 30 Years | ||||||||||||||||||||
| East Bethel, MN | (c) | 545 | 1,768 | — | — | 545 | 1,768 | 2,313 | (53 | ) | 1990 | 07/29/16 | 6 to 20 Years | ||||||||||||||||||||
| Fenton, MO | (a) | 2,792 | 5,982 | — | — | 2,792 | 5,982 | 8,774 | (577 | ) | 2008 | 09/29/14 | 13 to 40 Years | ||||||||||||||||||||
| Fort Wayne, IN | (a) | 2,697 | 9,849 | 681 | — | 3,378 | 9,849 | 13,227 | (3,190 | ) | 2005 | 11/30/05 | 15 to 40 Years | ||||||||||||||||||||
| Gainesville, GA | (c) | 2,278 | 8,684 | — | — | 2,278 | 8,684 | 10,962 | (538 | ) | 1996 | 12/30/14 | 15 to 40 Years | ||||||||||||||||||||
| Gibsonton, FL | (c) | 4,970 | 4,014 | — | 3,916 | 4,970 | 7,930 | 12,900 | (138 | ) | 2016 | 11/05/15 | 15 to 15 Years | ||||||||||||||||||||
| Greensboro, NC | (a) | 2,359 | 2,431 | — | — | 2,359 | 2,431 | 4,790 | (1,039 | ) | 1996 | 09/30/05 | 15 to 30 Years | ||||||||||||||||||||
| Griffin, GA | (c) | 1,239 | 3,188 | — | — | 1,239 | 3,188 | 4,427 | (303 | ) | 2005 | 12/30/14 | 15 to 30 Years | ||||||||||||||||||||
| Hinesville, GA | (c) | 2,049 | 5,216 | — | — | 2,049 | 5,216 | 7,265 | (342 | ) | 2001 | 12/30/14 | 15 to 40 Years | ||||||||||||||||||||
| Johnston, IA | (b) | 3,046 | 10,213 | — | — | 3,046 | 10,213 | 13,259 | (3,783 | ) | 1998 | 06/23/04 | 15 to 30 Years | ||||||||||||||||||||
| Kansas City, MO | (a) | 2,543 | 7,943 | — | — | 2,543 | 7,943 | 10,486 | (2,171 | ) | 2003 | 07/01/05 | 14 to 50 Years | ||||||||||||||||||||
| Lakeville, MN | (c) | 2,843 | 2,843 | — | 2,216 | 2,843 | 5,059 | 7,902 | (87 | ) | 1998 | 07/29/16 | 6 to 30 Years | ||||||||||||||||||||
| Lebanon, PA | (a) | 747 | 4,295 | — | — | 747 | 4,295 | 5,042 | (366 | ) | 2006 | 09/29/14 | 13 to 30 Years | ||||||||||||||||||||
| Lees Summit, MO | (a) | 3,517 | 9,735 | — | — | 3,517 | 9,735 | 13,252 | (3,188 | ) | 1999 | 07/01/05 | 14 to 40 Years | ||||||||||||||||||||
| Longview, TX | (a) | 1,432 | 2,946 | — | — | 1,432 | 2,946 | 4,378 | (1,248 | ) | 1995 | 09/30/05 | 15 to 30 Years | ||||||||||||||||||||
| Initial Cost to Company | Cost Capitalized Subsequent to Acquisition including impairment | Gross Amount at December 31, | Life in which depreciation in latest Statement of Operations is computed | ||||||||||||||||||||||
| Description | Encumbrances | Land and Improvements | Buildings and Improvements | Improvements/ Land | Improvements/ building | Land and Improvements | Buildings and Improvements | Total | Final Accum | Date of Construction | Date Acquired | ||||||||||||||
| Springfield, MO | (a) | 439 | 719 | — | — | 439 | 719 | 1,158 | (264 | ) | 2004 | 12/29/06 | 15 to 40 years | ||||||||||||||||||||
| Springville, NY | (a) | 678 | 586 | — | — | 678 | 586 | 1,264 | (206 | ) | 1988 | 11/10/05 | 15 to 30 years | ||||||||||||||||||||
| St. Louis, MO | (a) | 290 | 211 | — | — | 290 | 211 | 501 | (120 | ) | 1973 | 05/25/05 | 15 to 20 years | ||||||||||||||||||||
| St. Louis, MO | (a) | 231 | 337 | — | — | 231 | 337 | 568 | (154 | ) | 1972 | 05/25/05 | 15 to 20 years | ||||||||||||||||||||
| St. Louis, MO | (a) | 189 | 227 | — | — | 189 | 227 | 416 | (114 | ) | 1972 | 05/25/05 | 15 to 20 years | ||||||||||||||||||||
| St. Louis, MO | (a) | 464 | 218 | — | — | 464 | 218 | 682 | (137 | ) | 1978 | 05/25/05 | 15 to 20 years | ||||||||||||||||||||
| St. Louis, MO | (a) | 503 | 651 | — | — | 503 | 651 | 1,154 | (304 | ) | 1976 | 09/24/04 | 15 to 20 years | ||||||||||||||||||||
| St. Louis, MO | (a) | 828 | 351 | — | — | 828 | 351 | 1,179 | (236 | ) | 1986 | 09/24/04 | 15 to 20 years | ||||||||||||||||||||
| Statesboro, GA | (a) | 779 | 777 | — | — | 779 | 777 | 1,556 | (323 | ) | 1985 | 09/24/04 | 15 to 20 years | ||||||||||||||||||||
| Sterling Heights, MI | (a) | 866 | 960 | — | — | 866 | 960 | 1,826 | (320 | ) | 2000 | 12/29/05 | 15 to 30 years | ||||||||||||||||||||
| Stillwater, MN | (a) | 1,051 | 1,051 | — | — | 1,051 | 1,051 | 2,102 | (463 | ) | 1998 | 09/24/04 | 15 to 30 years | ||||||||||||||||||||
| Stillwater, OK | (b) | 218 | 1,262 | — | — | 218 | 1,262 | 1,480 | (66 | ) | 2007 | 07/17/13 | 4 to 32 Years | ||||||||||||||||||||
| Stockbridge, GA | (a) | 388 | 353 | — | — | 388 | 353 | 741 | (43 | ) | 2001 | 02/02/12 | 15 to 30 years | ||||||||||||||||||||
| Stone Mountain, GA | (a) | 379 | 487 | — | — | 379 | 487 | 866 | (56 | ) | 1986 | 02/02/12 | 15 to 30 years | ||||||||||||||||||||
| Sun City, AZ | (a) | 771 | 372 | — | — | 771 | 372 | 1,143 | (187 | ) | 1986 | 12/29/06 | 15 to 20 years | ||||||||||||||||||||
| Sweetwater, TN | (a) | 602 | 550 | — | — | 602 | 550 | 1,152 | (192 | ) | 1999 | 12/29/06 | 15 to 40 years | ||||||||||||||||||||
| Talladega, AL | (c ) | 247 | 245 | — | — | 247 | 245 | 492 | (38 | ) | 1998 | 07/17/13 | 11 to 21 Years | ||||||||||||||||||||
| Tempe, AZ | (a) | 480 | 361 | — | — | 480 | 361 | 841 | (150 | ) | 2003 | 09/25/06 | 15 to 30 years | ||||||||||||||||||||
| Temple, TX | (c ) | 705 | 493 | — | — | 705 | 493 | 1,198 | (28 | ) | 1983 | 07/17/13 | 10 to 35 Years | ||||||||||||||||||||
| Texarkana, TX | (a) | 265 | 747 | — | — | 265 | 747 | 1,012 | (38 | ) | 2013 | 11/04/13 | 14 to 30 Years | ||||||||||||||||||||
| The Village, OK | (c ) | 211 | 650 | — | — | 211 | 650 | 861 | (35 | ) | 1978 | 07/17/13 | 9 to 35 Years | ||||||||||||||||||||
| Thomasville, GA | (a) | 408 | 837 | — | — | 408 | 837 | 1,245 | (36 | ) | 1990 | 12/24/13 | 15 to 30 Years | ||||||||||||||||||||
| Tipp City, OH | (a) | 789 | 332 | — | — | 789 | 332 | 1,121 | (198 | ) | 1991 | 12/29/06 | 15 to 20 years | ||||||||||||||||||||
| Tooele, UT | (a) | 552 | 624 | — | — | 552 | 624 | 1,176 | (339 | ) | 1988 | 09/24/04 | 15 to 20 years | ||||||||||||||||||||
| Trenton, MO | (a) | 309 | 1,175 | — | — | 309 | 1,175 | 1,484 | (49 | ) | 1976 | 12/24/13 | 15 to 30 Years | ||||||||||||||||||||
| Tucson, AZ | (c ) | 262 | 193 | — | — | 262 | 193 | 455 | (25 | ) | 1983 | 07/17/13 | 11 to 23 Years | ||||||||||||||||||||
| Tucson, AZ | (c ) | 191 | 552 | — | — | 191 | 552 | 743 | (30 | ) | 1981 | 07/17/13 | 11 to 35 Years | ||||||||||||||||||||
| Tucson, AZ | (c ) | 349 | 479 | — | — | 349 | 479 | 828 | (30 | ) | 1976 | 07/17/13 | 11 to 35 Years | ||||||||||||||||||||
| Tucson, AZ | (c ) | 221 | 434 | — | — | 221 | 434 | 655 | (30 | ) | 1980 | 07/17/13 | 11 to 27 Years | ||||||||||||||||||||
| Tulsa, OK | (c ) | 767 | 466 | — | — | 767 | 466 | 1,233 | (31 | ) | 1976 | 07/17/13 | 8 to 35 Years | ||||||||||||||||||||
| Tulsa, OK | (c ) | 315 | 717 | — | — | 315 | 717 | 1,032 | (40 | ) | 1976 | 07/17/13 | 10 to 35 Years | ||||||||||||||||||||
| Tyler, TX | (c ) | 227 | 527 | — | — | 227 | 527 | 754 | (30 | ) | 1976 | 07/17/13 | 11 to 35 Years | ||||||||||||||||||||
| Universal City, TX | (c ) | 408 | 369 | — | — | 408 | 369 | 777 | (35 | ) | 1989 | 07/17/13 | 9 to 25 Years | ||||||||||||||||||||
| Vicksburg, MS | (c ) | 278 | 333 | — | — | 278 | 333 | 611 | (32 | ) | 1972 | 07/17/13 | 11 to 25 Years | ||||||||||||||||||||
| Victoria, TX | (c ) | 129 | 490 | — | — | 129 | 490 | 619 | (36 | ) | 1985 | 07/17/13 | 11 to 28 Years | ||||||||||||||||||||
| Victoria, TX | (c ) | 367 | 182 | — | — | 367 | 182 | 549 | (20 | ) | 1984 | 07/17/13 | 11 to 22 Years | ||||||||||||||||||||
| Vincennes, IN | (a) | 389 | 1,425 | — | — | 389 | 1,425 | 1,814 | (86 | ) | 2000 | 07/17/13 | 8 to 30 Years | ||||||||||||||||||||
| Waco, TX | (c ) | 365 | 542 | — | — | 365 | 542 | 907 | (28 | ) | 1969 | 07/17/13 | 10 to 35 Years | ||||||||||||||||||||
| Martinsburg, WV | (a) | 2,450 | 3,528 | — | — | 2,450 | 3,528 | 5,978 | (1,622 | ) | 1998 | 09/30/05 | 12 to 30 Years | ||||||||||||||||||||
| Massillon, OH | (a) | 1,767 | 2,667 | — | 1,600 | 1,767 | 4,267 | 6,034 | (372 | ) | 2005 | 09/29/14 | 13 to 30 Years | ||||||||||||||||||||
| Missoula, MT | (a) | 2,333 | 3,406 | — | — | 2,333 | 3,406 | 5,739 | (1,184 | ) | 1998 | 06/23/04 | 15 to 40 Years | ||||||||||||||||||||
| Monrovia, CA | (c) | 2,448 | 17,849 | — | — | 2,448 | 17,849 | 20,297 | (748 | ) | 2000 | 09/30/15 | 15 to 30 Years | ||||||||||||||||||||
| Monticello, MN | (c) | 1,161 | 3,155 | — | — | 1,161 | 3,155 | 4,316 | (87 | ) | 2004 | 07/29/16 | 6 to 30 Years | ||||||||||||||||||||
| Mooresville, NC | (c) | 5,087 | 6,800 | — | — | 5,087 | 6,800 | 11,887 | (637 | ) | 1999 | 09/25/14 | 15 to 30 Years | ||||||||||||||||||||
| Nitro, WV | (a) | 1,816 | 3,068 | — | — | 1,816 | 3,068 | 4,884 | (397 | ) | 2005 | 09/29/14 | 13 to 30 Years | ||||||||||||||||||||
| Noblesville, IN | (a) | 1,760 | — | 2,338 | 10,172 | 4,098 | 10,172 | 14,270 | (3,421 | ) | 2008 | 06/30/09 | 14 to 39 Years | ||||||||||||||||||||
| Omaha, NE | (c) | 2,254 | 4,249 | — | — | 2,254 | 4,249 | 6,503 | (369 | ) | 2006 | 03/26/15 | 12 to 30 Years | ||||||||||||||||||||
| Overland Park, KS | (a) | 4,935 | 12,281 | — | — | 4,935 | 12,281 | 17,216 | (2,924 | ) | 2004 | 08/01/09 | 10 to 57 Years | ||||||||||||||||||||
| Phoenix, AZ | (a) | 2,652 | 11,495 | — | — | 2,652 | 11,495 | 14,147 | (2,920 | ) | 1997 | 07/01/05 | 12 to 40 Years | ||||||||||||||||||||
| Plymouth, MN | (c) | 2,516 | 4,090 | — | 2,099 | 2,516 | 6,189 | 8,705 | (70 | ) | 1988 | 07/29/16 | 6 to 30 Years | ||||||||||||||||||||
| Portage, IN | (a) | 4,621 | 8,300 | — | — | 4,621 | 8,300 | 12,921 | (3,214 | ) | 2007 | 06/30/09 | 13 to 38 Years | ||||||||||||||||||||
| Raleigh, NC | (a) | 3,636 | 8,833 | — | — | 3,636 | 8,833 | 12,469 | (3,428 | ) | 1988 | 06/10/10 | 9 to 27 Years | ||||||||||||||||||||
| Redlands, CA | (c) | 4,443 | 17,859 | — | — | 4,443 | 17,859 | 22,302 | (793 | ) | 1997 | 09/30/15 | 15 to 30 Years | ||||||||||||||||||||
| Rogers, MN | (c) | 2,337 | 2,383 | — | 552 | 2,337 | 2,935 | 5,272 | (66 | ) | 2006 | 07/29/16 | 6 to 30 Years | ||||||||||||||||||||
| Saginaw, MI | (a) | 2,538 | — | — | 8,358 | 2,538 | 8,358 | 10,896 | (781 | ) | 2013 | 12/02/13 | 15 to 50 Years | ||||||||||||||||||||
| Simpsonville, SC | (a) | 1,862 | 5,453 | — | — | 1,862 | 5,453 | 7,315 | (537 | ) | 2010 | 09/29/14 | 13 to 40 Years | ||||||||||||||||||||
| South Bend, IN | (c) | 4,352 | 9,411 | — | — | 4,352 | 9,411 | 13,763 | (550 | ) | 1997 | 01/04/16 | 6 to 30 Years | ||||||||||||||||||||
| Surprise, AZ | (a) | 2,918 | 7,122 | — | — | 2,918 | 7,122 | 10,040 | (305 | ) | 2008 | 11/10/15 | 13 to 40 Years | ||||||||||||||||||||
| Valdosta, GA | (c) | 3,038 | 13,801 | — | — | 3,038 | 13,801 | 16,839 | (817 | ) | 2001 | 12/30/14 | 15 to 40 Years | ||||||||||||||||||||
| Waconia, MN | (c) | 249 | 1,464 | — | — | 249 | 1,464 | 1,713 | (31 | ) | 1989 | 07/29/16 | 6 to 20 Years | ||||||||||||||||||||
| Warner Robins, GA | (c) | 2,598 | 8,324 | — | — | 2,598 | 8,324 | 10,922 | (531 | ) | 2010 | 12/30/14 | 15 to 40 Years | ||||||||||||||||||||
| WhiteBear Township, MN | (c) | 2,773 | 5,476 | — | 107 | 2,773 | 5,583 | 8,356 | (148 | ) | 1995 | 07/29/16 | 6 to 20 Years | ||||||||||||||||||||
| Wilmington, NC | (a) | 1,552 | 2,934 | — | — | 1,552 | 2,934 | 4,486 | (1,198 | ) | 1997 | 09/30/05 | 15 to 30 Years | ||||||||||||||||||||
| Winston-Salem, NC | (a) | 1,567 | 2,140 | — | — | 1,567 | 2,140 | 3,707 | (1,070 | ) | 1993 | 10/28/05 | 13 to 30 Years | ||||||||||||||||||||
| Woodstock, GA | (c) | 2,798 | 5,057 | — | — | 2,798 | 5,057 | 7,855 | (421 | ) | 1997 | 12/30/14 | 15 to 30 Years | ||||||||||||||||||||
| Yukon, OK | (b) | 1,082 | 3,538 | — | — | 1,082 | 3,538 | 4,620 | (518 | ) | 2007 | 07/17/13 | 8 to 33 Years | ||||||||||||||||||||
| Convenience Stores | |||||||||||||||||||||||||||||||||
| Akron, OH | (c) | 424 | 1,139 | — | — | 424 | 1,139 | 1,563 | (188 | ) | 1995 | 07/17/13 | 13 to 30 Years | ||||||||||||||||||||
| Akron, OH | (c) | 587 | 1,073 | — | — | 587 | 1,073 | 1,660 | (197 | ) | 1998 | 07/17/13 | 13 to 32 Years | ||||||||||||||||||||
| Akron, OH | (c) | 500 | 2,058 | — | — | 500 | 2,058 | 2,558 | (278 | ) | 1999 | 07/17/13 | 15 to 33 Years | ||||||||||||||||||||
| Akron, OH | (c) | 337 | 1,149 | — | — | 337 | 1,149 | 1,486 | (160 | ) | 2001 | 07/17/13 | 15 to 35 Years | ||||||||||||||||||||
| Akron, OH | (c) | 595 | 1,031 | — | — | 595 | 1,031 | 1,626 | (188 | ) | 1995 | 07/17/13 | 14 to 30 Years | ||||||||||||||||||||
| Akron, OH | (c) | 554 | 824 | — | — | 554 | 824 | 1,378 | (136 | ) | 1969 | 07/17/13 | 14 to 38 Years | ||||||||||||||||||||
| Akron, OH | (c) | 517 | 1,122 | — | — | 517 | 1,122 | 1,639 | (199 | ) | 1994 | 07/17/13 | 13 to 29 Years | ||||||||||||||||||||
| Initial Cost to Company | Cost Capitalized Subsequent to Acquisition including impairment | Gross Amount at December 31, | Life in which depreciation in latest Statement of Operations is computed | ||||||||||||||||||||||
| Description | Encumbrances | Land and Improvements | Buildings and Improvements | Improvements/ Land | Improvements/ building | Land and Improvements | Buildings and Improvements | Total | Final Accum | Date of Construction | Date Acquired | ||||||||||||||
| Warner Robins, GA | (a) | 229 | 887 | — | — | 229 | 887 | 1,116 | (40 | ) | 1978 | 12/24/13 | 15 to 30 Years | ||||||||||||||||||||
| Warren, MI | (a) | 488 | 215 | — | — | 488 | 215 | 703 | (115 | ) | 1979 | 05/25/05 | 15 to 20 years | ||||||||||||||||||||
| Washington Park, IL | (a) | 119 | 324 | — | — | 119 | 324 | 443 | (148 | ) | 1980 | 05/25/05 | 15 to 20 years | ||||||||||||||||||||
| Washington, IL | (a) | 264 | 460 | — | — | 264 | 460 | 724 | (64 | ) | 1980 | 12/21/12 | 15 to 20 years | ||||||||||||||||||||
| Washington, IN | (a) | 272 | 949 | — | — | 272 | 949 | 1,221 | (63 | ) | 1995 | 07/17/13 | 8 to 33 Years | ||||||||||||||||||||
| Watertown, WI | (a) | 267 | 338 | — | — | 267 | 338 | 605 | (137 | ) | 1986 | 12/21/07 | 13 to 18 years | ||||||||||||||||||||
| Waynesburg, PA | (a) | 323 | 918 | — | — | 323 | 918 | 1,241 | (88 | ) | 1982 | 12/21/12 | 15 to 30 years | ||||||||||||||||||||
| Weslaco, TX | (c ) | 860 | 513 | — | — | 860 | 513 | 1,373 | (30 | ) | 1990 | 07/17/13 | 11 to 35 Years | ||||||||||||||||||||
| Weslaco, TX | (c ) | 291 | 786 | — | — | 291 | 786 | 1,077 | (55 | ) | 1970 | 07/17/13 | 11 to 25 Years | ||||||||||||||||||||
| Westchester, IL | (a) | 765 | 437 | — | — | 765 | 437 | 1,202 | (189 | ) | 1986 | 09/29/06 | 15 to 20 years | ||||||||||||||||||||
| Weston, WV | (a) | 158 | 695 | — | — | 158 | 695 | 853 | (59 | ) | 1981 | 12/21/12 | 15 to 30 years | ||||||||||||||||||||
| Williamsport, PA | (b) | 864 | 979 | — | — | 864 | 979 | 1,843 | (3 | ) | 1966 | 11/18/14 | 15 to 30 Years | ||||||||||||||||||||
| Winchester, TN | (a) | 400 | 291 | — | — | 400 | 291 | 691 | (145 | ) | 1993 | 12/29/06 | 15 to 20 years | ||||||||||||||||||||
| Winter Springs, FL | (a) | 523 | 446 | — | — | 523 | 446 | 969 | (245 | ) | 1988 | 12/30/04 | 15 to 20 years | ||||||||||||||||||||
| Wytheville, VA | (a) | 446 | 172 | — | — | 446 | 172 | 618 | (166 | ) | 1995 | 11/23/04 | 15 to 20 years | ||||||||||||||||||||
| Zebulon, NC | (a) | 780 | 395 | — | — | 780 | 395 | 1,175 | (35 | ) | 2006 | 09/17/13 | 15 to 30 Years | ||||||||||||||||||||
| Akron, OH | (c) | 283 | 1,160 | — | — | 283 | 1,160 | 1,443 | (168 | ) | 1997 | 07/17/13 | 14 to 32 Years | ||||||||||||||||||||
| Akron, OH | (c) | 434 | 1,198 | — | — | 434 | 1,198 | 1,632 | (206 | ) | 1994 | 07/17/13 | 14 to 29 Years | ||||||||||||||||||||
| Akron, OH | (c) | 343 | 1,193 | — | — | 343 | 1,193 | 1,536 | (183 | ) | 1991 | 07/17/13 | 15 to 31 Years | ||||||||||||||||||||
| Akron, OH | (c) | 513 | 1,251 | — | — | 513 | 1,251 | 1,764 | (199 | ) | 1996 | 07/17/13 | 15 to 31 Years | ||||||||||||||||||||
| Akron, OH | (c) | 321 | 1,179 | — | — | 321 | 1,179 | 1,500 | (185 | ) | 1994 | 07/17/13 | 13 to 29 Years | ||||||||||||||||||||
| Akron, OH | (c) | 402 | 1,263 | — | — | 402 | 1,263 | 1,665 | (177 | ) | 2000 | 07/17/13 | 13 to 34 Years | ||||||||||||||||||||
| Akron, OH | (c) | 291 | 1,230 | — | — | 291 | 1,230 | 1,521 | (215 | ) | 1950 | 07/17/13 | 12 to 25 Years | ||||||||||||||||||||
| Albuquerque, NM | (c) | 699 | 777 | — | — | 699 | 777 | 1,476 | (241 | ) | 1994 | 07/17/13 | 9 to 35 Years | ||||||||||||||||||||
| Allegan, MI | (c) | 392 | 224 | — | — | 392 | 224 | 616 | (15 | ) | 1965 | 05/19/16 | 17 to 30 Years | ||||||||||||||||||||
| Alma, MI | (c) | 235 | 437 | — | — | 235 | 437 | 672 | (14 | ) | 2006 | 05/19/16 | 17 to 30 Years | ||||||||||||||||||||
| Alpena, MI | (c) | 392 | 336 | — | — | 392 | 336 | 728 | (14 | ) | 1998 | 05/19/16 | 17 to 40 Years | ||||||||||||||||||||
| Alpena, MI | (c) | 471 | 561 | — | — | 471 | 561 | 1,032 | (18 | ) | 1999 | 05/19/16 | 17 to 40 Years | ||||||||||||||||||||
| Altavista, VA | (c) | 358 | 1,401 | — | — | 358 | 1,401 | 1,759 | (84 | ) | 1981 | 06/30/15 | 15 to 30 Years | ||||||||||||||||||||
| Altavista, VA | (c) | 467 | 745 | — | — | 467 | 745 | 1,212 | (54 | ) | 1984 | 06/30/15 | 15 to 30 Years | ||||||||||||||||||||
| Anniston, AL | (c) | 490 | 210 | — | — | 490 | 210 | 700 | (14 | ) | 1960 | 07/11/16 | 15 to 20 Years | ||||||||||||||||||||
| Apopka, FL | (c) | 477 | 389 | — | — | 477 | 389 | 866 | (76 | ) | 1989 | 12/19/13 | 15 to 30 Years | ||||||||||||||||||||
| Apopka, FL | (c) | 1,357 | 748 | — | — | 1,357 | 748 | 2,105 | (99 | ) | 1997 | 10/28/15 | 15 to 30 Years | ||||||||||||||||||||
| Apple Valley, CA | (c) | 782 | 662 | — | — | 782 | 662 | 1,444 | (251 | ) | 1985 | 05/02/14 | 10 to 15 Years | ||||||||||||||||||||
| Asheville, NC | (a) | 278 | 776 | — | 168 | 278 | 944 | 1,222 | (180 | ) | 2000 | 01/01/14 | 8 to 29 Years | ||||||||||||||||||||
| Asheville, NC | (a) | 247 | 497 | — | 87 | 247 | 584 | 831 | (121 | ) | 1986 | 01/01/14 | 8 to 29 Years | ||||||||||||||||||||
| Ashland, NH | (c) | 398 | 157 | — | — | 398 | 157 | 555 | (53 | ) | 1970 | 06/28/12 | 15 to 20 Years | ||||||||||||||||||||
| Auburn, AL | (c) | 757 | 1,199 | — | — | 757 | 1,199 | 1,956 | (243 | ) | 1990 | 07/17/13 | 10 to 25 Years | ||||||||||||||||||||
| Auburn, AL | (c) | 2,188 | 945 | — | 85 | 2,188 | 1,030 | 3,218 | (47 | ) | 2001 | 07/11/16 | 15 to 40 Years | ||||||||||||||||||||
| Auburn, ME | (c) | 371 | 444 | — | — | 371 | 444 | 815 | (94 | ) | 1996 | 06/28/12 | 15 to 30 Years | ||||||||||||||||||||
| Auburn, ME | (c) | 287 | 222 | — | — | 287 | 222 | 509 | (67 | ) | 1968 | 06/28/12 | 15 to 20 Years | ||||||||||||||||||||
| Augusta, GA | (c) | 400 | 1,540 | — | — | 400 | 1,540 | 1,940 | (217 | ) | 1981 | 07/17/13 | 13 to 30 Years | ||||||||||||||||||||
| Augusta, ME | (c) | 318 | 322 | — | — | 318 | 322 | 640 | (69 | ) | 1997 | 06/28/12 | 15 to 28 Years | ||||||||||||||||||||
| Bangor, ME | (c) | 327 | 141 | — | — | 327 | 141 | 468 | (75 | ) | 1973 | 06/28/12 | 15 to 15 Years | ||||||||||||||||||||
| Barberton, OH | (c) | 255 | 1,244 | — | — | 255 | 1,244 | 1,499 | (205 | ) | 1991 | 07/17/13 | 12 to 26 Years | ||||||||||||||||||||
| Barberton, OH | (c) | 884 | 1,885 | — | — | 884 | 1,885 | 2,769 | (301 | ) | 1981 | 07/17/13 | 13 to 34 Years | ||||||||||||||||||||
| Barberton, OH | (c) | 321 | 1,219 | — | — | 321 | 1,219 | 1,540 | (180 | ) | 1983 | 07/17/13 | 14 to 31 Years | ||||||||||||||||||||
| Bartlett, NH | (c) | 325 | 399 | — | — | 325 | 399 | 724 | (85 | ) | 1998 | 06/28/12 | 15 to 32 Years | ||||||||||||||||||||
| Barton, VT | (c) | 307 | 609 | — | — | 307 | 609 | 916 | (69 | ) | 1975 | 01/24/14 | 14 to 40 Years | ||||||||||||||||||||
| Baton Rouge, LA | (c) | 260 | 859 | — | — | 260 | 859 | 1,119 | (159 | ) | 1976 | 07/17/13 | 7 to 25 Years | ||||||||||||||||||||
| Baton Rouge, LA | (c) | 330 | 997 | — | — | 330 | 997 | 1,327 | (159 | ) | 1970 | 07/17/13 | 8 to 30 Years | ||||||||||||||||||||
| Baton Rouge, LA | (c) | 481 | 913 | — | — | 481 | 913 | 1,394 | (172 | ) | 1977 | 07/17/13 | 8 to 30 Years | ||||||||||||||||||||
| Beattyville, KY | (c) | 278 | 795 | — | — | 278 | 795 | 1,073 | (51 | ) | 1981 | 06/30/15 | 15 to 30 Years | ||||||||||||||||||||
| Beaufort, SC | (c) | 850 | 1,337 | — | — | 850 | 1,337 | 2,187 | (228 | ) | 1997 | 07/17/13 | 12 to 34 Years | ||||||||||||||||||||
| Drug Stores / Pharmacies | ||||||||||||||||||||||||||||||||||
| Akron, OH | (b) | 401 | 3,153 | 67 | — | 468 | 3,153 | 3,621 | (152 | ) | 1994 | 7/17/2013 | 1 to 37 Years | |||||||||||||||||||||
| Albany, GA | (c ) | 961 | 3,314 | — | — | 961 | 3,314 | 4,275 | (142 | ) | 2008 | 7/17/2013 | 12 to 43 Years | |||||||||||||||||||||
| Alliance, OH | (b) | 556 | 1,317 | — | — | 556 | 1,317 | 1,873 | (114 | ) | 1996 | 7/17/2013 | 3 to 31 Years | |||||||||||||||||||||
| Alpharetta, GA | (c ) | 968 | 2,614 | — | — | 968 | 2,614 | 3,582 | (124 | ) | 1998 | 7/17/2013 | 5 to 40 Years | |||||||||||||||||||||
| Antioch, TN | 4,425 | 1,985 | 4,351 | — | — | 1,985 | 4,351 | 6,336 | (179 | ) | 2002 | 7/17/2013 | 14 to 43 Years | |||||||||||||||||||||
| Atlanta, GA | (c ) | 1,316 | 2,266 | — | — | 1,316 | 2,266 | 3,582 | (115 | ) | 2006 | 7/17/2013 | 14 to 42 Years | |||||||||||||||||||||
| Austin, MN | 3,531 | 485 | 3,606 | — | — | 485 | 3,606 | 4,091 | (153 | ) | 2002 | 7/17/2013 | 11 to 42 Years | |||||||||||||||||||||
| Azle, TX | (c ) | 1,213 | 3,504 | — | — | 1,213 | 3,504 | 4,717 | (141 | ) | 2008 | 7/17/2013 | 15 to 43 Years | |||||||||||||||||||||
| Batesville, MS | (c ) | 421 | 3,932 | — | — | 421 | 3,932 | 4,353 | (154 | ) | 2007 | 7/17/2013 | 10 to 42 Years | |||||||||||||||||||||
| Bath, NY | (c ) | 658 | 3,123 | — | — | 658 | 3,123 | 3,781 | (131 | ) | 2008 | 7/17/2013 | 12 to 43 Years | |||||||||||||||||||||
| Beverly Hills, TX | (d) | 1,142 | 2,559 | — | — | 1,142 | 2,559 | 3,701 | (128 | ) | 2007 | 7/17/2013 | 5 to 40 Years | |||||||||||||||||||||
| Brainerd, MN | 2,814 | 543 | 4,411 | — | — | 543 | 4,411 | 4,954 | (194 | ) | 2000 | 7/17/2013 | 7 to 42 Years | |||||||||||||||||||||
| Brentwood, TN | 2,700 | 2,933 | 2,584 | — | — | 2,933 | 2,584 | 5,517 | (210 | ) | 2006 | 7/17/2013 | 11 to 38 Years | |||||||||||||||||||||
| Bridgetown, OH | 3,043 | 1,015 | 3,769 | — | — | 1,015 | 3,769 | 4,784 | (161 | ) | 1998 | 7/17/2013 | 5 to 43 Years | |||||||||||||||||||||
| Broadview, IL | 31,500 | 12,393 | 32,192 | — | — | 12,393 | 32,192 | 44,585 | (2,570 | ) | 1994 | 7/17/2013 | 2 to 30 Years | |||||||||||||||||||||
| Bryan, TX | 4,111 | 1,049 | 5,633 | — | — | 1,049 | 5,633 | 6,682 | (226 | ) | 2001 | 7/17/2013 | 6 to 40 Years | |||||||||||||||||||||
| Buffalo, NY | (a) | 681 | 925 | — | — | 681 | 925 | 1,606 | (205 | ) | 1993 | 12/15/2004 | 20 to 40 years | |||||||||||||||||||||
| Canton, IL | 4,429 | 703 | 4,098 | — | — | 703 | 4,098 | 4,801 | (172 | ) | 2006 | 7/17/2013 | 12 to 43 Years | |||||||||||||||||||||
| Carrolton, TX | (b) | 945 | 1,967 | — | — | 945 | 1,967 | 2,912 | (92 | ) | 1995 | 7/17/2013 | 1 to 39 Years | |||||||||||||||||||||
| Chino Valley, AZ | (c ) | 663 | 3,871 | — | — | 663 | 3,871 | 4,534 | (168 | ) | 2007 | 7/17/2013 | 10 to 42 Years | |||||||||||||||||||||
| Initial Cost to Company | Cost Capitalized Subsequent to Acquisition including impairment | Gross Amount at December 31, | Life in which depreciation in latest Statement of Operations is computed | ||||||||||||||||||||||
| Description | Encumbrances | Land and Improvements | Buildings and Improvements | Improvements/ Land | Improvements/ building | Land and Improvements | Buildings and Improvements | Total | Final Accum | Date of Construction | Date Acquired | ||||||||||||||
| Cincinnati, OH | 3,341 | 1,213 | 4,438 | — | — | 1,213 | 4,438 | 5,651 | (198 | ) | 2000 | 7/17/2013 | 6 to 42 Years | |||||||||||||||||||||
| Cincinnati, OH | (c ) | 1,527 | 4,307 | — | — | 1,527 | 4,307 | 5,834 | (183 | ) | 2000 | 7/17/2013 | 7 to 42 Years | |||||||||||||||||||||
| Cleveland, OH | (d) | 776 | 1,158 | — | — | 776 | 1,158 | 1,934 | (77 | ) | 1997 | 7/17/2013 | 5 to 30 Years | |||||||||||||||||||||
| Clinton, NY | 1,983 | 1,050 | 2,090 | — | — | 1,050 | 2,090 | 3,140 | (112 | ) | 2006 | 7/17/2013 | 11 to 42 Years | |||||||||||||||||||||
| Collierville, TN | 14,200 | 2,217 | 14,205 | — | — | 2,217 | 14,205 | 16,422 | (691 | ) | 2000 | 7/17/2013 | 5 to 45 Years | |||||||||||||||||||||
| Columbia, MO | (c ) | 1,047 | 5,242 | — | — | 1,047 | 5,242 | 6,289 | (193 | ) | 2002 | 7/17/2013 | 9 to 44 Years | |||||||||||||||||||||
| Columbia, TN | (d) | 842 | 1,864 | — | — | 842 | 1,864 | 2,706 | (98 | ) | 1998 | 7/17/2013 | 4 to 37 Years | |||||||||||||||||||||
| Columbia, TN | (d) | 1,109 | 1,683 | — | — | 1,109 | 1,683 | 2,792 | (91 | ) | 1998 | 7/17/2013 | 4 to 41 Years | |||||||||||||||||||||
| Columbus, MS | (c ) | 769 | 3,475 | — | — | 769 | 3,475 | 4,244 | (142 | ) | 2004 | 7/17/2013 | 11 to 41 Years | |||||||||||||||||||||
| Crossville, TN | (c ) | 1,890 | 3,680 | — | — | 1,890 | 3,680 | 5,570 | (160 | ) | 2001 | 7/17/2013 | 7 to 41 Years | |||||||||||||||||||||
| Dallas, TX | 2,175 | 735 | 3,328 | — | — | 735 | 3,328 | 4,063 | (142 | ) | 1996 | 7/17/2013 | 3 to 40 Years | |||||||||||||||||||||
| Decatur, IL | 4,003 | 968 | 3,300 | — | — | 968 | 3,300 | 4,268 | (163 | ) | 2005 | 7/17/2013 | 12 to 42 Years | |||||||||||||||||||||
| Defiance, OH | 2,321 | 645 | 2,452 | — | — | 645 | 2,452 | 3,097 | (131 | ) | 2005 | 7/17/2013 | 11 to 38 Years | |||||||||||||||||||||
| DeSoto, TX | (c ) | 1,007 | 2,313 | — | — | 1,007 | 2,313 | 3,320 | (116 | ) | 1997 | 7/17/2013 | 5 to 40 Years | |||||||||||||||||||||
| Easton, PA | 4,060 | 1,028 | 3,996 | — | — | 1,028 | 3,996 | 5,024 | (186 | ) | 2005 | 7/17/2013 | 12 to 41 Years | |||||||||||||||||||||
| Elmira, NY | 2,900 | 1,066 | 4,230 | — | — | 1,066 | 4,230 | 5,296 | (181 | ) | 2007 | 7/17/2013 | 12 to 43 Years | |||||||||||||||||||||
| Enterprise, AL | 2,043 | 1,163 | 1,612 | — | — | 1,163 | 1,612 | 2,775 | (99 | ) | 2005 | 7/17/2013 | 11 to 37 Years | |||||||||||||||||||||
| Essex, MD | (c ) | 1,985 | 4,351 | — | — | 1,985 | 4,351 | 6,336 | (179 | ) | 2007 | 7/17/2013 | 14 to 43 Years | |||||||||||||||||||||
| Evansville, IN | (c ) | 1,249 | 3,924 | — | — | 1,249 | 3,924 | 5,173 | (169 | ) | 2007 | 7/17/2013 | 12 to 44 Years | |||||||||||||||||||||
| Florence, SC | 1,706 | 744 | 2,070 | — | — | 744 | 2,070 | 2,814 | (98 | ) | 1998 | 7/17/2013 | 5 to 39 Years | |||||||||||||||||||||
| Florissant, MO | (c ) | 773 | 4,480 | — | — | 773 | 4,480 | 5,253 | (197 | ) | 2001 | 7/17/2013 | 7 to 42 Years | |||||||||||||||||||||
| Fort Worth, TX | 3,675 | 1,601 | 1,894 | — | — | 1,601 | 1,894 | 3,495 | (102 | ) | 1992 | 7/17/2013 | 6 to 39 Years | |||||||||||||||||||||
| Fredericksburg, VA | 2,979 | 1,426 | 2,077 | — | — | 1,426 | 2,077 | 3,503 | (116 | ) | 2007 | 7/17/2013 | 14 to 37 Years | |||||||||||||||||||||
| Fremont, OH | (d) | 504 | 1,405 | — | — | 504 | 1,405 | 1,909 | (90 | ) | 1997 | 7/17/2013 | 4 to 31 Years | |||||||||||||||||||||
| Gainesville, FL | 2,465 | 922 | 2,705 | — | — | 922 | 2,705 | 3,627 | (122 | ) | 1997 | 7/17/2013 | 4 to 40 Years | |||||||||||||||||||||
| Galloway, OH | 4,250 | 1,708 | 2,886 | — | — | 1,708 | 2,886 | 4,594 | (156 | ) | 2003 | 7/17/2013 | 11 to 40 Years | |||||||||||||||||||||
| Glassport, PA | 2,325 | 550 | 2,471 | — | — | 550 | 2,471 | 3,021 | (135 | ) | 2006 | 7/17/2013 | 11 to 37 Years | |||||||||||||||||||||
| Glenville Scotia, NY | 3,413 | 1,314 | 3,964 | — | — | 1,314 | 3,964 | 5,278 | (179 | ) | 2006 | 7/17/2013 | 12 to 43 Years | |||||||||||||||||||||
| Gulfport, MS | 2,611 | 441 | 4,208 | — | �� | 441 | 4,208 | 4,649 | (173 | ) | 2000 | 7/17/2013 | 12 to 40 Years | |||||||||||||||||||||
| Hamilton, OH | (d) | 738 | 2,429 | — | — | 738 | 2,429 | 3,167 | (120 | ) | 1999 | 7/17/2013 | 5 to 39 Years | |||||||||||||||||||||
| Hanover, PA | 4,115 | 1,637 | 4,240 | — | — | 1,637 | 4,240 | 5,877 | (203 | ) | 2006 | 7/17/2013 | 12 to 43 Years | |||||||||||||||||||||
| Harriman, TN | 2,500 | 1,951 | 3,250 | — | — | 1,951 | 3,250 | 5,201 | (152 | ) | 2007 | 7/17/2013 | 12 to 43 Years | |||||||||||||||||||||
| Hibbing, MN | (c ) | 385 | 3,492 | — | — | 385 | 3,492 | 3,877 | (152 | ) | 2007 | 7/17/2013 | 12 to 43 Years | |||||||||||||||||||||
| Houston, TX | 3,673 | 1,079 | 3,582 | — | — | 1,079 | 3,582 | 4,661 | (149 | ) | 2000 | 7/17/2013 | 6 to 40 Years | |||||||||||||||||||||
| Humble, TX | 4,395 | 1,539 | 3,560 | — | — | 1,539 | 3,560 | 5,099 | (161 | ) | 2003 | 7/17/2013 | 11 to 40 Years | |||||||||||||||||||||
| Indianapolis, IN | (c ) | 860 | 2,754 | — | — | 860 | 2,754 | 3,614 | (136 | ) | 1998 | 7/17/2013 | 10 to 40 Years | |||||||||||||||||||||
| Indianapolis, IN | (c ) | 733 | 2,882 | — | — | 733 | 2,882 | 3,615 | (138 | ) | 1997 | 7/17/2013 | 10 to 38 Years | |||||||||||||||||||||
| Jacksonville, FL | (c ) | 521 | 4,365 | — | — | 521 | 4,365 | 4,886 | (180 | ) | 2000 | 7/17/2013 | 7 to 40 Years | |||||||||||||||||||||
| Kansas City, MO | 2,990 | 634 | 4,341 | — | — | 634 | 4,341 | 4,975 | (183 | ) | 1997 | 7/17/2013 | 4 to 43 Years | |||||||||||||||||||||
| Bedford, OH | (c) | 750 | 680 | — | — | 750 | 680 | 1,430 | (148 | ) | 2000 | 07/17/13 | 15 to 33 Years | ||||||||||||||||||||
| Bedford, VA | (c) | 258 | 818 | — | — | 258 | 818 | 1,076 | (53 | ) | 1997 | 06/30/15 | 15 to 30 Years | ||||||||||||||||||||
| Belle Glade, FL | (c) | 978 | 1,184 | — | — | 978 | 1,184 | 2,162 | (101 | ) | 1960 | 10/30/14 | 15 to 40 Years | ||||||||||||||||||||
| Belle Isle, FL | (c) | 908 | 738 | — | — | 908 | 738 | 1,646 | (67 | ) | 1996 | 10/27/15 | 15 to 30 Years | ||||||||||||||||||||
| Belmont, NH | (c) | 315 | 218 | — | — | 315 | 218 | 533 | (45 | ) | 1969 | 01/24/14 | 14 to 30 Years | ||||||||||||||||||||
| Belmont, NH | (c) | 524 | 879 | — | — | 524 | 879 | 1,403 | (144 | ) | 2002 | 01/24/14 | 14 to 30 Years | ||||||||||||||||||||
| Bergman, AR | (c) | 404 | 549 | — | — | 404 | 549 | 953 | (9 | ) | 1996 | 09/30/16 | 14 to 40 Years | ||||||||||||||||||||
| Berlin, NH | (c) | 387 | 317 | — | — | 387 | 317 | 704 | (97 | ) | 1991 | 06/28/12 | 15 to 22 Years | ||||||||||||||||||||
| Berryville, AR | (c) | 314 | 381 | — | — | 314 | 381 | 695 | (6 | ) | 1996 | 09/30/16 | 14 to 40 Years | ||||||||||||||||||||
| Blairs, VA | (c) | 318 | 636 | — | — | 318 | 636 | 954 | (42 | ) | 1987 | 06/30/15 | 15 to 30 Years | ||||||||||||||||||||
| Bluffton, SC | (c) | 1,531 | 645 | — | — | 1,531 | 645 | 2,176 | (159 | ) | 1997 | 07/17/13 | 10 to 32 Years | ||||||||||||||||||||
| Bossier City, LA | (c) | 565 | 1,051 | (21 | ) | — | 544 | 1,051 | 1,595 | (192 | ) | 1987 | 07/17/13 | 9 to 25 Years | |||||||||||||||||||
| Branson, MO | (c) | 605 | 818 | — | — | 605 | 818 | 1,423 | (13 | ) | 1993 | 09/30/16 | 15 to 30 Years | ||||||||||||||||||||
| Branson, MO | (c) | 1,177 | 1,199 | — | — | 1,177 | 1,199 | 2,376 | (20 | ) | 1999 | 09/30/16 | 12 to 40 Years | ||||||||||||||||||||
| Brewer, ME | (c) | 238 | 260 | — | — | 238 | 260 | 498 | (73 | ) | 1967 | 06/28/12 | 15 to 25 Years | ||||||||||||||||||||
| Brookpark, OH | (c) | 623 | 978 | — | — | 623 | 978 | 1,601 | (172 | ) | 1998 | 07/17/13 | 13 to 32 Years | ||||||||||||||||||||
| Bucksport, ME | (c) | 1,203 | 587 | — | — | 1,203 | 587 | 1,790 | (105 | ) | 1995 | 01/24/14 | 14 to 40 Years | ||||||||||||||||||||
| Burton, MI | (c) | 336 | 1,323 | — | — | 336 | 1,323 | 1,659 | (34 | ) | 1969 | 05/19/16 | 17 to 30 Years | ||||||||||||||||||||
| Butler, MO | (c) | 919 | 1,076 | — | — | 919 | 1,076 | 1,995 | (20 | ) | 1996 | 09/30/16 | 15 to 30 Years | ||||||||||||||||||||
| Cadillac, MI | (c) | 370 | 404 | — | — | 370 | 404 | 774 | (17 | ) | 1971 | 05/19/16 | 17 to 30 Years | ||||||||||||||||||||
| Calais, ME | (c) | 187 | 213 | — | — | 187 | 213 | 400 | (68 | ) | 1968 | 06/28/12 | 15 to 20 Years | ||||||||||||||||||||
| Campton, KY | (c) | 189 | 735 | — | — | 189 | 735 | 924 | (47 | ) | 1996 | 06/30/15 | 15 to 30 Years | ||||||||||||||||||||
| Canton, OH | (c) | 362 | 1,159 | — | — | 362 | 1,159 | 1,521 | (205 | ) | 1990 | 07/17/13 | 12 to 26 Years | ||||||||||||||||||||
| Canton, OH | (c) | 1,037 | 1,557 | — | — | 1,037 | 1,557 | 2,594 | (291 | ) | 2000 | 07/17/13 | 15 to 34 Years | ||||||||||||||||||||
| Carlisle, KY | (c) | 209 | 586 | — | — | 209 | 586 | 795 | (40 | ) | 1989 | 06/30/15 | 15 to 30 Years | ||||||||||||||||||||
| Carlisle, KY | (c) | 298 | 874 | — | — | 298 | 874 | 1,172 | (61 | ) | 2005 | 06/30/15 | 15 to 30 Years | ||||||||||||||||||||
| Catlettsburg, KY | (a) | 9,344 | 3,989 | — | — | 9,344 | 3,989 | 13,333 | (4,046 | ) | 2001 | 07/01/05 | 13 to 40 Years | ||||||||||||||||||||
| Cave Creek, AZ | (c) | 2,711 | 2,201 | — | — | 2,711 | 2,201 | 4,912 | (927 | ) | 1998 | 07/02/07 | 15 to 40 Years | ||||||||||||||||||||
| Cedar Springs, MI | (c) | 191 | 348 | — | — | 191 | 348 | 539 | (12 | ) | 1965 | 05/19/16 | 17 to 30 Years | ||||||||||||||||||||
| Charleston, SC | (c) | 1,547 | 1,242 | — | — | 1,547 | 1,242 | 2,789 | (312 | ) | 1987 | 07/17/13 | 7 to 20 Years | ||||||||||||||||||||
| Charlotte, MI | (c) | 224 | 157 | — | — | 224 | 157 | 381 | (10 | ) | 1968 | 05/19/16 | 17 to 30 Years | ||||||||||||||||||||
| Charlotte, NC | (c) | 1,508 | 749 | (128 | ) | — | 1,380 | 749 | 2,129 | (159 | ) | 1996 | 07/17/13 | 9 to 35 Years | |||||||||||||||||||
| Charlotte, NC | (c) | 1,442 | 789 | — | — | 1,442 | 789 | 2,231 | (204 | ) | 1997 | 07/17/13 | 8 to 35 Years | ||||||||||||||||||||
| Charlotte, NC | (c) | 1,392 | 563 | — | — | 1,392 | 563 | 1,955 | (245 | ) | 1991 | 07/17/13 | 6 to 32 Years | ||||||||||||||||||||
| Clay City, KY | (c) | 397 | 884 | — | — | 397 | 884 | 1,281 | (72 | ) | 2002 | 06/30/15 | 15 to 30 Years | ||||||||||||||||||||
| Cleveland, MO | (c) | 701 | 894 | — | — | 701 | 894 | 1,595 | (133 | ) | 1994 | 11/18/14 | 15 to 20 Years | ||||||||||||||||||||
| Cleveland, OH | (c) | 804 | 1,513 | — | — | 804 | 1,513 | 2,317 | (237 | ) | 2002 | 07/17/13 | 13 to 35 Years | ||||||||||||||||||||
| Clinton, MO | (c) | 291 | 404 | — | — | 291 | 404 | 695 | (7 | ) | 1960 | 09/30/16 | 15 to 30 Years | ||||||||||||||||||||
| Coldwater, MI | (c) | 258 | 135 | — | — | 258 | 135 | 393 | (9 | ) | 1960 | 05/19/16 | 17 to 30 Years | ||||||||||||||||||||
| Columbia, SC | (c) | 1,061 | 1,073 | (428 | ) | (462 | ) | 633 | 611 | 1,244 | — | 1997 | 07/17/13 | 11 to 32 Years | |||||||||||||||||||
| Initial Cost to Company | Cost Capitalized Subsequent to Acquisition including impairment | Gross Amount at December 31, | Life in which depreciation in latest Statement of Operations is computed | ||||||||||||||||||||||
| Description | Encumbrances | Land and Improvements | Buildings and Improvements | Improvements/ Land | Improvements/ building | Land and Improvements | Buildings and Improvements | Total | Final Accum | Date of Construction | Date Acquired | ||||||||||||||
| Kansas City, MO | 2,438 | 532 | 3,549 | — | — | 532 | 3,549 | 4,081 | (165 | ) | 2000 | 7/17/2013 | 4 to 39 Years | |||||||||||||||||||||
| Kansas City, MO | 2,464 | 862 | 4,367 | — | — | 862 | 4,367 | 5,229 | (183 | ) | 2000 | 7/17/2013 | 6 to 42 Years | |||||||||||||||||||||
| Kansas City, MO | 3,035 | 518 | 4,234 | — | — | 518 | 4,234 | 4,752 | (178 | ) | 2000 | 7/17/2013 | 6 to 43 Years | |||||||||||||||||||||
| Kissimmee, FL | (b) | 1,508 | 2,153 | — | — | 1,508 | 2,153 | 3,661 | (125 | ) | 1995 | 7/17/2013 | 2 to 40 Years | |||||||||||||||||||||
| Knoxville, TN | (d) | 2,107 | 3,334 | — | — | 2,107 | 3,334 | 5,441 | (162 | ) | 2000 | 7/17/2013 | 6 to 40 Years | |||||||||||||||||||||
| Lake Worth, TX | (b) | 1,044 | 1,817 | — | — | 1,044 | 1,817 | 2,861 | (118 | ) | 1996 | 7/17/2013 | 2 to 30 Years | |||||||||||||||||||||
| Lakewood, OH | (b) | 522 | 2,053 | — | — | 522 | 2,053 | 2,575 | (105 | ) | 1996 | 7/17/2013 | 3 to 35 Years | |||||||||||||||||||||
| LaMarque, TX | (c ) | 464 | 3,139 | — | — | 464 | 3,139 | 3,603 | (150 | ) | 2000 | 7/17/2013 | 7 to 40 Years | |||||||||||||||||||||
| Lansing, MI | 1,041 | 196 | 1,487 | — | — | 196 | 1,487 | 1,683 | (83 | ) | 1950 | 7/17/2013 | 3 to 31 Years | |||||||||||||||||||||
| Lima, OH | 3,103 | 568 | 3,221 | — | — | 568 | 3,221 | 3,789 | (145 | ) | 2005 | 7/17/2013 | 12 to 43 Years | |||||||||||||||||||||
| Lincoln, IL | (c ) | 444 | 3,043 | — | — | 444 | 3,043 | 3,487 | (138 | ) | 2007 | 7/17/2013 | 11 to 43 Years | |||||||||||||||||||||
| Lincolnton, NC | 1,538 | 548 | 1,537 | — | — | 548 | 1,537 | 2,085 | (84 | ) | 1998 | 7/17/2013 | 4 to 37 Years | |||||||||||||||||||||
| Long Beach, MS | 3,662 | 502 | 3,718 | — | — | 502 | 3,718 | 4,220 | (149 | ) | 2005 | 7/17/2013 | 10 to 41 Years | |||||||||||||||||||||
| Mableton, GA | 1,247 | 338 | 1,543 | (148 | ) | (659 | ) | 190 | 884 | 1,074 | (42 | ) | 1994 | 7/17/2013 | 30 to 30 Years | |||||||||||||||||||
| Madeira, OH | (d) | 951 | 3,978 | — | — | 951 | 3,978 | 4,929 | (162 | ) | 1998 | 7/17/2013 | 5 to 44 Years | |||||||||||||||||||||
| Madison, MS | 2,809 | 745 | 3,323 | — | — | 745 | 3,323 | 4,068 | (148 | ) | 2004 | 7/17/2013 | 11 to 40 Years | |||||||||||||||||||||
| Maynard, MA | 5,596 | 1,683 | 3,984 | — | — | 1,683 | 3,984 | 5,667 | (159 | ) | 2005 | 7/17/2013 | 14 to 42 Years | |||||||||||||||||||||
| Mechanicville, NY | (d) | 654 | 3,120 | — | — | 654 | 3,120 | 3,774 | (141 | ) | 1997 | 7/17/2013 | 4 to 38 Years | |||||||||||||||||||||
| Memphis, TN | 5,058 | 961 | 5,389 | — | — | 961 | 5,389 | 6,350 | (212 | ) | 2002 | 7/17/2013 | 12 to 43 Years | |||||||||||||||||||||
| Millen, GA | (a) | 810 | 1,312 | — | — | 810 | 1,312 | 2,122 | (298 | ) | 1999 | 12/15/2004 | 20 to 40 years | |||||||||||||||||||||
| Mobile, AL | (c ) | 586 | 4,389 | — | — | 586 | 4,389 | 4,975 | (161 | ) | 2007 | 7/17/2013 | 13 to 44 Years | |||||||||||||||||||||
| Moundsville, WV | (a) | 706 | 1,002 | — | — | 706 | 1,002 | 1,708 | (225 | ) | 1993 | 12/15/2004 | 20 to 40 years | |||||||||||||||||||||
| Mount Pleasant, TX | (c ) | 1,192 | 4,578 | — | — | 1,192 | 4,578 | 5,770 | (201 | ) | 2009 | 7/17/2013 | 14 to 43 Years | |||||||||||||||||||||
| Myrtle Beach, SC | 4,788 | 828 | 4,024 | — | — | 828 | 4,024 | 4,852 | (172 | ) | 2004 | 7/17/2013 | 12 to 42 Years | |||||||||||||||||||||
| New Cumberland, PA | (c ) | 794 | 2,663 | — | — | 794 | 2,663 | 3,457 | (121 | ) | 2007 | 7/17/2013 | 12 to 43 Years | |||||||||||||||||||||
| Newton, IA | (c ) | 365 | 4,475 | — | — | 365 | 4,475 | 4,840 | (177 | ) | 2000 | 7/17/2013 | 7 to 44 Years | |||||||||||||||||||||
| Okeechobee, FL | 4,076 | 674 | 5,088 | — | — | 674 | 5,088 | 5,762 | (274 | ) | 2001 | 7/17/2013 | 9 to 30 Years | |||||||||||||||||||||
| Olivette, MO | (c ) | 1,816 | 5,917 | — | — | 1,816 | 5,917 | 7,733 | (259 | ) | 2001 | 7/17/2013 | 11 to 42 Years | |||||||||||||||||||||
| Oneida, NY | (a) | 1,315 | 1,411 | — | — | 1,315 | 1,411 | 2,726 | (316 | ) | 1999 | 12/15/2004 | 20 to 40 years | |||||||||||||||||||||
| Oneida, TN | 2,500 | 1,866 | 3,334 | — | — | 1,866 | 3,334 | 5,200 | (153 | ) | 2007 | 7/17/2013 | 13 to 43 Years | |||||||||||||||||||||
| Onley, VA | (c ) | 2,530 | 2,296 | — | — | 2,530 | 2,296 | 4,826 | (128 | ) | 2007 | 7/17/2013 | 12 to 43 Years | |||||||||||||||||||||
| Orlando, FL | 3,016 | 781 | 3,799 | — | — | 781 | 3,799 | 4,580 | (207 | ) | 2005 | 7/17/2013 | 10 to 30 Years | |||||||||||||||||||||
| Parkville, MO | 4,274 | 1,854 | 2,568 | — | — | 1,854 | 2,568 | 4,422 | (141 | ) | 2006 | 7/17/2013 | 11 to 38 Years | |||||||||||||||||||||
| Philadelphia, PA | (a) | 733 | 1,087 | — | — | 733 | 1,087 | 1,820 | (240 | ) | 1993 | 12/15/2004 | 20 to 40 years | |||||||||||||||||||||
| Philadelphia, PA | (a) | 1,613 | 1,880 | — | — | 1,613 | 1,880 | 3,493 | (409 | ) | 1999 | 2/2/2005 | 20 to 40 years | |||||||||||||||||||||
| Picayune, MS | 2,766 | 954 | 3,132 | — | — | 954 | 3,132 | 4,086 | (130 | ) | 2006 | 7/17/2013 | 10 to 42 Years | |||||||||||||||||||||
| Plains, PA | 3,380 | 1,502 | 2,611 | — | — | 1,502 | 2,611 | 4,113 | (143 | ) | 2006 | 7/17/2013 | 12 to 37 Years | |||||||||||||||||||||
| Columbia, SC | (c) | 1,261 | 985 | — | — | 1,261 | 985 | 2,246 | (194 | ) | 1993 | 07/17/13 | 10 to 28 Years | ||||||||||||||||||||
| Columbus, GA | (c) | 711 | 943 | — | — | 711 | 943 | 1,654 | (161 | ) | 1990 | 07/17/13 | 13 to 32 Years | ||||||||||||||||||||
| Columbus, GA | (c) | 574 | 1,039 | — | — | 574 | 1,039 | 1,613 | (163 | ) | 1984 | 07/17/13 | 13 to 32 Years | ||||||||||||||||||||
| Columbus, GA | (c) | 867 | 2,299 | — | — | 867 | 2,299 | 3,166 | (342 | ) | 1978 | 07/17/13 | 13 to 30 Years | ||||||||||||||||||||
| Columbus, GA | (c) | 1,465 | 2,088 | — | — | 1,465 | 2,088 | 3,553 | (336 | ) | 1995 | 07/17/13 | 11 to 34 Years | ||||||||||||||||||||
| Columbus, GA | (c) | 730 | 1,317 | — | — | 730 | 1,317 | 2,047 | (228 | ) | 1978 | 07/17/13 | 13 to 28 Years | ||||||||||||||||||||
| Concord, NH | (c) | 260 | 330 | — | — | 260 | 330 | 590 | (78 | ) | 1988 | 06/28/12 | 15 to 25 Years | ||||||||||||||||||||
| Connersville, IN | (c) | 336 | 179 | — | — | 336 | 179 | 515 | (10 | ) | 1993 | 05/19/16 | 17 to 30 Years | ||||||||||||||||||||
| Coopersville, MI | (c) | 998 | 572 | — | — | 998 | 572 | 1,570 | (27 | ) | 1968 | 05/19/16 | 17 to 30 Years | ||||||||||||||||||||
| Copley, OH | (c) | 379 | 999 | — | — | 379 | 999 | 1,378 | (183 | ) | 1993 | 07/17/13 | 12 to 28 Years | ||||||||||||||||||||
| Cuyahoga Falls, OH | (c) | 657 | 1,018 | — | — | 657 | 1,018 | 1,675 | (207 | ) | 1995 | 07/17/13 | 13 to 30 Years | ||||||||||||||||||||
| Cuyahoga Falls, OH | (c) | 958 | 1,416 | — | — | 958 | 1,416 | 2,374 | (256 | ) | 2002 | 07/17/13 | 15 to 35 Years | ||||||||||||||||||||
| Cuyahoga Falls, OH | (c) | 342 | 806 | — | — | 342 | 806 | 1,148 | (154 | ) | 1972 | 07/17/13 | 12 to 26 Years | ||||||||||||||||||||
| Cynthiana, KY | (c) | 119 | 596 | — | — | 119 | 596 | 715 | (37 | ) | 1985 | 06/30/15 | 15 to 30 Years | ||||||||||||||||||||
| Daleville, VA | (c) | 467 | 616 | — | — | 467 | 616 | 1,083 | (48 | ) | 1989 | 06/30/15 | 15 to 30 Years | ||||||||||||||||||||
| Danville, VA | (c) | 348 | 477 | — | — | 348 | 477 | 825 | (37 | ) | 1989 | 06/30/15 | 15 to 30 Years | ||||||||||||||||||||
| Eaton Rapids, MI | (c) | 291 | 448 | — | — | 291 | 448 | 739 | (18 | ) | 1945 | 05/19/16 | 17 to 30 Years | ||||||||||||||||||||
| Edmore, MI | (c) | 729 | 774 | — | — | 729 | 774 | 1,503 | (34 | ) | 1999 | 05/19/16 | 17 to 40 Years | ||||||||||||||||||||
| El Paso, TX | (c) | 1,143 | 1,029 | — | — | 1,143 | 1,029 | 2,172 | (438 | ) | 2000 | 07/17/13 | 4 to 27 Years | ||||||||||||||||||||
| El Paso, TX | (c) | 987 | 558 | — | — | 987 | 558 | 1,545 | (203 | ) | 1999 | 07/17/13 | 3 to 26 Years | ||||||||||||||||||||
| El Paso, TX | (c) | 1,090 | 1,203 | — | — | 1,090 | 1,203 | 2,293 | (330 | ) | 1999 | 07/17/13 | 6 to 35 Years | ||||||||||||||||||||
| Fairlawn, OH | (c) | 616 | 1,064 | — | — | 616 | 1,064 | 1,680 | (203 | ) | 1993 | 07/17/13 | 13 to 28 Years | ||||||||||||||||||||
| Fallon, NV | (c) | 1,262 | 1,321 | — | — | 1,262 | 1,321 | 2,583 | (177 | ) | 1985 | 10/31/14 | 15 to 40 Years | ||||||||||||||||||||
| Fayetteville, AR | (c) | 986 | 897 | — | — | 986 | 897 | 1,883 | (18 | ) | 1996 | 09/30/16 | 11 to 30 Years | ||||||||||||||||||||
| Fayetteville, AR | (c) | 1,760 | 953 | — | — | 1,760 | 953 | 2,713 | (14 | ) | 1996 | 09/30/16 | 16 to 40 Years | ||||||||||||||||||||
| Flemingsburg, KY | (c) | 1,073 | 1,212 | — | — | 1,073 | 1,212 | 2,285 | (96 | ) | 1997 | 06/30/15 | 15 to 30 Years | ||||||||||||||||||||
| Forest, VA | (c) | 248 | 834 | — | — | 248 | 834 | 1,082 | (54 | ) | 1995 | 06/30/15 | 15 to 30 Years | ||||||||||||||||||||
| Forsyth, MO | (c) | 370 | 572 | — | — | 370 | 572 | 942 | (9 | ) | 1950 | 09/30/16 | 14 to 30 Years | ||||||||||||||||||||
| Fort Mill, SC | (c) | 1,589 | 1,356 | — | — | 1,589 | 1,356 | 2,945 | (213 | ) | 1999 | 07/17/13 | 10 to 33 Years | ||||||||||||||||||||
| Fort Pierce, FL | (c) | 1,064 | 1,659 | — | — | 1,064 | 1,659 | 2,723 | (164 | ) | 1977 | 10/30/14 | 15 to 40 Years | ||||||||||||||||||||
| Fort Pierce, FL | (c) | 681 | 1,404 | — | — | 681 | 1,404 | 2,085 | (125 | ) | 1989 | 10/30/14 | 15 to 40 Years | ||||||||||||||||||||
| Frankfort, IN | (c) | 258 | 202 | — | — | 258 | 202 | 460 | (11 | ) | 1970 | 05/19/16 | 17 to 30 Years | ||||||||||||||||||||
| Franklin, IN | (c) | 303 | 213 | — | — | 303 | 213 | 516 | (11 | ) | 1969 | 05/19/16 | 17 to 30 Years | ||||||||||||||||||||
| Freeland, MI | (c) | 336 | 437 | — | — | 336 | 437 | 773 | (17 | ) | 1962 | 05/19/16 | 17 to 30 Years | ||||||||||||||||||||
| Freeport, ME | (c) | 503 | 343 | — | — | 503 | 343 | 846 | (84 | ) | 1991 | 06/28/12 | 15 to 26 Years | ||||||||||||||||||||
| Fremont, CA | (c) | 1,905 | 361 | — | — | 1,905 | 361 | 2,266 | (78 | ) | 1990 | 10/31/14 | 15 to 30 Years | ||||||||||||||||||||
| Fremont, MI | (c) | 269 | 269 | — | — | 269 | 269 | 538 | (13 | ) | 1971 | 05/19/16 | 17 to 30 Years | ||||||||||||||||||||
| Initial Cost to Company | Cost Capitalized Subsequent to Acquisition including impairment | Gross Amount at December 31, | Life in which depreciation in latest Statement of Operations is computed | ||||||||||||||||||||||
| Description | Encumbrances | Land and Improvements | Buildings and Improvements | Improvements/ Land | Improvements/ building | Land and Improvements | Buildings and Improvements | Total | Final Accum | Date of Construction | Date Acquired | ||||||||||||||
| Portsmouth, OH | (d) | 354 | 1,953 | — | — | 354 | 1,953 | 2,307 | (90 | ) | 1997 | 7/17/2013 | 5 to 38 Years | |||||||||||||||||||||
| Portsmouth, OH | (c ) | 219 | 2,049 | — | — | 219 | 2,049 | 2,268 | (85 | ) | 1997 | 7/17/2013 | 4 to 38 Years | |||||||||||||||||||||
| Richardson, TX | (c ) | 803 | 2,575 | — | — | 803 | 2,575 | 3,378 | (113 | ) | 1996 | 7/17/2013 | 3 to 40 Years | |||||||||||||||||||||
| Richland Hills, TX | (c ) | 997 | 2,951 | — | — | 997 | 2,951 | 3,948 | (131 | ) | 1997 | 7/17/2013 | 4 to 40 Years | |||||||||||||||||||||
| Richmond Hills, GA | (c ) | 688 | 4,081 | — | — | 688 | 4,081 | 4,769 | (168 | ) | 2009 | 7/17/2013 | 13 to 44 Years | |||||||||||||||||||||
| Richmond, VA | (b) | 1,885 | 2,752 | — | — | 1,885 | 2,752 | 4,637 | (120 | ) | 1997 | 7/17/2013 | 4 to 39 Years | |||||||||||||||||||||
| River Oaks, TX | (c ) | 829 | 2,871 | — | — | 829 | 2,871 | 3,700 | (137 | ) | 1996 | 7/17/2013 | 3 to 40 Years | |||||||||||||||||||||
| Rome, NY | (c ) | 1,135 | 3,104 | — | — | 1,135 | 3,104 | 4,239 | (133 | ) | 2007 | 7/17/2013 | 13 to 43 Years | |||||||||||||||||||||
| Roselle, NJ | 5,742 | 2,512 | 4,864 | — | — | 2,512 | 4,864 | 7,376 | (217 | ) | 2002 | 7/17/2013 | 12 to 41 Years | |||||||||||||||||||||
| Saco, ME | (d) | 898 | 1,702 | — | — | 898 | 1,702 | 2,600 | (123 | ) | 1997 | 7/17/2013 | 3 to 29 Years | |||||||||||||||||||||
| Saginaw, MI | (a) | 1,064 | 3,906 | — | — | 1,064 | 3,906 | 4,970 | (169 | ) | 2001 | 7/17/2013 | 7 to 41 Years | |||||||||||||||||||||
| San Antonio, TX | 4,060 | 841 | 3,909 | — | — | 841 | 3,909 | 4,750 | (158 | ) | 2004 | 7/17/2013 | 14 to 40 Years | |||||||||||||||||||||
| Saraland, AL | 5,079 | 741 | 4,593 | — | — | 741 | 4,593 | 5,334 | (190 | ) | 2003 | 7/17/2013 | 12 to 44 Years | |||||||||||||||||||||
| Seattle, WA | (c ) | 2,589 | 4,245 | — | — | 2,589 | 4,245 | 6,834 | (179 | ) | 2002 | 7/17/2013 | 9 to 43 Years | |||||||||||||||||||||
| Sharonville, OH | (d) | 2,542 | 1,940 | — | — | 2,542 | 1,940 | 4,482 | (128 | ) | 1998 | 7/17/2013 | 5 to 32 Years | |||||||||||||||||||||
| Shreveport, LA | 2,815 | 1,461 | 3,605 | — | — | 1,461 | 3,605 | 5,066 | (166 | ) | 1998 | 7/17/2013 | 6 to 40 Years | |||||||||||||||||||||
| Spartanburg, SC | 2,259 | 1,196 | 1,671 | — | — | 1,196 | 1,671 | 2,867 | (96 | ) | 1998 | 7/17/2013 | 2 to 34 Years | |||||||||||||||||||||
| St. Augustine, FL | (c ) | 1,048 | 2,905 | — | — | 1,048 | 2,905 | 3,953 | (131 | ) | 2008 | 7/17/2013 | 11 to 42 Years | |||||||||||||||||||||
| St. Clair Shores, MI | (a) | 1,169 | 761 | — | — | 1,169 | 761 | 1,930 | (227 | ) | 1991 | 5/2/2005 | 15 to 30 years | |||||||||||||||||||||
| St. Louis, MO | (c ) | 1,334 | 4,844 | — | — | 1,334 | 4,844 | 6,178 | (219 | ) | 2001 | 7/17/2013 | 8 to 43 Years | |||||||||||||||||||||
| St. Louis, MO | (c ) | 1,360 | 3,996 | — | — | 1,360 | 3,996 | 5,356 | (193 | ) | 2001 | 7/17/2013 | 8 to 41 Years | |||||||||||||||||||||
| The Colony, TX | (b) | 1,028 | 1,769 | — | — | 1,028 | 1,769 | 2,797 | (85 | ) | 1996 | 7/17/2013 | 1 to 40 Years | |||||||||||||||||||||
| Thomasville, GA | (a) | 931 | 1,933 | — | — | 931 | 1,933 | 2,864 | (405 | ) | 1999 | 12/15/2004 | 20 to 40 years | |||||||||||||||||||||
| Toledo, OH | 5,400 | 663 | 4,879 | — | — | 663 | 4,879 | 5,542 | (199 | ) | 2005 | 7/17/2013 | 11 to 43 Years | |||||||||||||||||||||
| Topeka, KS | 1,870 | 912 | 2,681 | — | — | 912 | 2,681 | 3,593 | (136 | ) | 1999 | 7/17/2013 | 6 to 38 Years | |||||||||||||||||||||
| Tulsa, OK | (b) | 741 | 3,179 | — | — | 741 | 3,179 | 3,920 | (142 | ) | 1994 | 7/17/2013 | 1 to 35 Years | |||||||||||||||||||||
| Uhrichsville, OH | (a) | 617 | 2,345 | — | — | 617 | 2,345 | 2,962 | (486 | ) | 2000 | 12/15/2004 | 20 to 40 years | |||||||||||||||||||||
| Waco, TX | (d) | 858 | 3,455 | — | — | 858 | 3,455 | 4,313 | (166 | ) | 2007 | 7/17/2013 | 5 to 35 Years | |||||||||||||||||||||
| Wauseon, OH | 2,142 | 1,000 | 2,034 | — | — | 1,000 | 2,034 | 3,034 | (116 | ) | 2005 | 7/17/2013 | 12 to 37 Years | |||||||||||||||||||||
| Waynesville, NC | 3,966 | 1,495 | 2,365 | — | — | 1,495 | 2,365 | 3,860 | (111 | ) | 2005 | 7/17/2013 | 12 to 42 Years | |||||||||||||||||||||
| Wichita Falls, TX | (b) | 503 | 2,530 | — | — | 503 | 2,530 | 3,033 | (118 | ) | 1995 | 7/17/2013 | 2 to 40 Years | |||||||||||||||||||||
| Wichita Falls, TX | (b) | 528 | 2,022 | — | — | 528 | 2,022 | 2,550 | (92 | ) | 1996 | 7/17/2013 | 1 to 40 Years | |||||||||||||||||||||
| Georgetown, KY | (c) | 725 | 805 | — | — | 725 | �� | 805 | 1,530 | (62 | ) | 1989 | 06/30/15 | 15 to 30 Years | |||||||||||||||||||
| Georgetown, KY | (c) | 815 | 934 | — | — | 815 | 934 | 1,749 | (70 | ) | 1998 | 06/30/15 | 15 to 30 Years | ||||||||||||||||||||
| Goose Creek, SC | (c) | 682 | 1,571 | — | — | 682 | 1,571 | 2,253 | (329 | ) | 1983 | 07/17/13 | 7 to 20 Years | ||||||||||||||||||||
| Gorham, NH | (c) | 723 | 358 | — | — | 723 | 358 | 1,081 | (126 | ) | 1975 | 06/28/12 | 15 to 18 Years | ||||||||||||||||||||
| Grand Haven, MI | (c) | 661 | 628 | — | — | 661 | 628 | 1,289 | (24 | ) | 1992 | 05/19/16 | 17 to 30 Years | ||||||||||||||||||||
| Grand Rapids, MI | (c) | 224 | 123 | — | — | 224 | 123 | 347 | (7 | ) | 1957 | 05/19/16 | 17 to 30 Years | ||||||||||||||||||||
| Grandtham, NH | (c) | 576 | 394 | — | — | 576 | 394 | 970 | (80 | ) | 1989 | 01/24/14 | 14 to 30 Years | ||||||||||||||||||||
| Grayling, MI | (c) | 2,052 | 549 | — | — | 2,052 | 549 | 2,601 | (40 | ) | 1988 | 05/19/16 | 17 to 30 Years | ||||||||||||||||||||
| Greenville, AL | (c) | 1,278 | 490 | — | — | 1,278 | 490 | 1,768 | (34 | ) | 1991 | 07/11/16 | 15 to 30 Years | ||||||||||||||||||||
| Greenville, MI | (c) | 437 | 628 | — | 194 | 437 | 822 | 1,259 | (23 | ) | 1968 | 05/19/16 | 17 to 30 Years | ||||||||||||||||||||
| Gresham, OR | (c) | 879 | 643 | — | — | 879 | 643 | 1,522 | (92 | ) | 1990 | 10/28/14 | 15 to 30 Years | ||||||||||||||||||||
| Gretna, VA | (c) | 268 | 798 | — | — | 268 | 798 | 1,066 | (56 | ) | 1978 | 06/30/15 | 15 to 30 Years | ||||||||||||||||||||
| Gretna, VA | (c) | 159 | 1,083 | — | — | 159 | 1,083 | 1,242 | (65 | ) | 1996 | 06/30/15 | 15 to 30 Years | ||||||||||||||||||||
| Hampden, ME | (c) | 987 | 424 | — | — | 987 | 424 | 1,411 | (139 | ) | 1997 | 01/24/14 | 14 to 30 Years | ||||||||||||||||||||
| Harrington, ME | (c) | 331 | 459 | — | — | 331 | 459 | 790 | (113 | ) | 1992 | 06/28/12 | 15 to 32 Years | ||||||||||||||||||||
| Harrison, AR | (c) | 2,309 | 2,040 | — | — | 2,309 | 2,040 | 4,349 | (45 | ) | 1996 | 09/30/16 | 15 to 30 Years | ||||||||||||||||||||
| Harrison, AR | (c) | 235 | 202 | — | — | 235 | 202 | 437 | (4 | ) | 1971 | 09/30/16 | 17 to 30 Years | ||||||||||||||||||||
| Harrison, AR | (c) | 224 | 717 | — | — | 224 | 717 | 941 | (9 | ) | 1980 | 09/30/16 | 12 to 30 Years | ||||||||||||||||||||
| Harrison, AR | (c) | 673 | 471 | — | — | 673 | 471 | 1,144 | (8 | ) | 1985 | 09/30/16 | 14 to 30 Years | ||||||||||||||||||||
| Harrison, AR | (c) | 392 | 336 | — | — | 392 | 336 | 728 | (8 | ) | 1982 | 09/30/16 | 12 to 30 Years | ||||||||||||||||||||
| Harrison, AR | (c) | 594 | 482 | — | — | 594 | 482 | 1,076 | (8 | ) | 1981 | 09/30/16 | 16 to 40 Years | ||||||||||||||||||||
| Harrodsburg, KY | (c) | 229 | 824 | — | — | 229 | 824 | 1,053 | (53 | ) | 1973 | 06/30/15 | 15 to 30 Years | ||||||||||||||||||||
| Hastings, MI | (c) | 392 | 437 | — | 190 | 392 | 627 | 1,019 | (22 | ) | 1964 | 05/19/16 | 17 to 30 Years | ||||||||||||||||||||
| Hazard, KY | (c) | 288 | 805 | — | — | 288 | 805 | 1,093 | (52 | ) | 1991 | 06/30/15 | 15 to 30 Years | ||||||||||||||||||||
| Hillsdale, MI | (c) | 325 | 157 | — | — | 325 | 157 | 482 | (10 | ) | 1968 | 05/19/16 | 17 to 30 Years | ||||||||||||||||||||
| Hockessin, DE | (c) | 1,921 | 2,477 | — | — | 1,921 | 2,477 | 4,398 | (346 | ) | 2001 | 07/17/13 | 8 to 46 Years | ||||||||||||||||||||
| Holland, MI | (c) | 235 | 325 | — | — | 235 | 325 | 560 | (12 | ) | 1957 | 05/19/16 | 17 to 30 Years | ||||||||||||||||||||
| Honea Path, SC | (a) | 1,268 | 1,134 | — | 175 | 1,268 | 1,309 | 2,577 | (367 | ) | 1996 | 01/01/14 | 8 to 29 Years | ||||||||||||||||||||
| Huntersville, NC | (c) | 1,539 | 924 | — | — | 1,539 | 924 | 2,463 | (266 | ) | 1996 | 07/17/13 | 8 to 35 Years | ||||||||||||||||||||
| Huntington Beach, CA | (c) | 2,035 | 155 | — | — | 2,035 | 155 | 2,190 | (77 | ) | 1962 | 10/31/14 | 15 to 30 Years | ||||||||||||||||||||
| Huntington Park, CA | (c) | 1,909 | 891 | — | — | 1,909 | 891 | 2,800 | (202 | ) | 1947 | 05/02/14 | 15 to 20 Years | ||||||||||||||||||||
| Huntsville, AR | (c) | 359 | 504 | — | — | 359 | 504 | 863 | (8 | ) | 2003 | 09/30/16 | 15 to 40 Years | ||||||||||||||||||||
| Hurt, VA | (c) | 685 | 1,023 | — | — | 685 | 1,023 | 1,708 | (80 | ) | 1973 | 06/30/15 | 15 to 30 Years | ||||||||||||||||||||
| Convenience Stores/Car Washes | |||||||||||||||||||||||||||||||||
| Akron, OH | (d) | 424 | 1,139 | — | — | 424 | 1,139 | 1,563 | (78 | ) | 1995 | 07/17/13 | 13 to 30 Years | ||||||||||||||||||||
| Akron, OH | (d) | 587 | 1,073 | — | — | 587 | 1,073 | 1,660 | (82 | ) | 1998 | 07/17/13 | 13 to 32 Years | ||||||||||||||||||||
| Indianapolis, IN | (c) | 426 | 191 | — | — | 426 | 191 | 617 | (12 | ) | 1973 | 05/19/16 | 17 to 30 Years | ||||||||||||||||||||
| Indianapolis, IN | (c) | 325 | 157 | — | — | 325 | 157 | 482 | (9 | ) | 1945 | 05/19/16 | 17 to 30 Years | ||||||||||||||||||||
| Indianapolis, IN | (c) | 247 | 146 | — | — | 247 | 146 | 393 | (8 | ) | 1972 | 05/19/16 | 17 to 30 Years | ||||||||||||||||||||
| Initial Cost to Company | Cost Capitalized Subsequent to Acquisition including impairment | Gross Amount at December 31, | Life in which depreciation in latest Statement of Operations is computed | ||||||||||||||||||||||
| Description | Encumbrances | Land and Improvements | Buildings and Improvements | Improvements/ Land | Improvements/ building | Land and Improvements | Buildings and Improvements | Total | Final Accum | Date of Construction | Date Acquired | ||||||||||||||
| Akron, OH | (d) | 500 | 2,058 | — | — | 500 | 2,058 | 2,558 | (115 | ) | 2000 | 07/17/13 | 15 to 33 Years | ||||||||||||||||||||
| Akron, OH | (d) | 337 | 1,149 | — | — | 337 | 1,149 | 1,486 | (66 | ) | 2001 | 07/17/13 | 15 to 35 Years | ||||||||||||||||||||
| Akron, OH | (d) | 595 | 1,031 | — | — | 595 | 1,031 | 1,626 | (78 | ) | 1995 | 07/17/13 | 14 to 30 Years | ||||||||||||||||||||
| Akron, OH | (d) | 554 | 824 | — | — | 554 | 824 | 1,378 | (56 | ) | 1969 | 07/17/13 | 14 to 38 Years | ||||||||||||||||||||
| Akron, OH | (d) | 517 | 1,122 | — | — | 517 | 1,122 | 1,639 | (82 | ) | 1994 | 07/17/13 | 13 to 29 Years | ||||||||||||||||||||
| Akron, OH | (d) | 283 | 1,160 | — | — | 283 | 1,160 | 1,443 | (70 | ) | 1997 | 07/17/13 | 14 to 32 Years | ||||||||||||||||||||
| Akron, OH | (d) | 434 | 1,198 | — | — | 434 | 1,198 | 1,632 | (85 | ) | 1994 | 07/17/13 | 14 to 29 Years | ||||||||||||||||||||
| Akron, OH | (d) | 343 | 1,193 | — | — | 343 | 1,193 | 1,536 | (76 | ) | 1991 | 07/17/13 | 15 to 31 Years | ||||||||||||||||||||
| Akron, OH | (d) | 513 | 1,251 | — | — | 513 | 1,251 | 1,764 | (82 | ) | 1996 | 07/17/13 | 15 to 31 Years | ||||||||||||||||||||
| Akron, OH | (d) | 321 | 1,179 | — | — | 321 | 1,179 | 1,500 | (77 | ) | 1994 | 07/17/13 | 13 to 29 Years | ||||||||||||||||||||
| Akron, OH | (d) | 402 | 1,263 | — | — | 402 | 1,263 | 1,665 | (73 | ) | 2000 | 07/17/13 | 13 to 34 Years | ||||||||||||||||||||
| Akron, OH | (d) | 291 | 1,230 | — | — | 291 | 1,230 | 1,521 | (89 | ) | 1950 | 07/17/13 | 12 to 28 Years | ||||||||||||||||||||
| Albuquerque, NM | (d) | 699 | 777 | — | — | 699 | 777 | 1,476 | (100 | ) | 1994 | 07/17/13 | 9 to 35 Years | ||||||||||||||||||||
| Albuquerque, NM | (a) | 2,472 | 2,117 | — | — | 2,472 | 2,117 | 4,589 | (86 | ) | 2005 | 05/13/14 | 15 to 30 Years | ||||||||||||||||||||
| Albuquerque, NM | (a) | 2,657 | 3,225 | — | — | 2,657 | 3,225 | 5,882 | (134 | ) | 1960 | 05/13/14 | 15 to 30 Years | ||||||||||||||||||||
| Albuquerque, NM | (a) | 1,179 | — | — | — | 1,179 | — | 1,179 | — | (g) | 05/13/14 | 0 to 0 Years | |||||||||||||||||||||
| Albuquerque, NM | (a) | 1,151 | 1,677 | — | — | 1,151 | 1,677 | 2,828 | (59 | ) | 1976 | 05/13/14 | 15 to 30 Years | ||||||||||||||||||||
| Albuquerque, NM | (a) | 1,563 | 2,700 | — | — | 1,563 | 2,700 | 4,263 | (78 | ) | 1994 | 05/13/14 | 15 to 30 Years | ||||||||||||||||||||
| Albuquerque, NM | (a) | 2,586 | 2,742 | — | — | 2,586 | 2,742 | 5,328 | (94 | ) | 2002 | 05/13/14 | 15 to 30 Years | ||||||||||||||||||||
| Apopka, FL | (b) | 477 | 389 | — | — | 477 | 389 | 866 | (25 | ) | 1989 | 12/19/13 | 15 to 30 Years | ||||||||||||||||||||
| Apple Valley, CA | (b) | 782 | 662 | — | — | 782 | 662 | 1,444 | (63 | ) | 1985 | 05/02/14 | 10 to 15 Years | ||||||||||||||||||||
| Asheville, NC | (a) | 278 | 776 | — | 168 | 278 | 944 | 1,222 | (82 | ) | 2000 | 05/08/13 | 8 to 29 Years | ||||||||||||||||||||
| Asheville, NC | (a) | 247 | 497 | — | 87 | 247 | 584 | 831 | (55 | ) | 1986 | 05/08/13 | 8 to 29 Years | ||||||||||||||||||||
| Ashland, NH | (d) | 398 | 157 | — | — | 398 | 157 | 555 | (29 | ) | 1970 | 06/28/12 | 15 to 20 years | ||||||||||||||||||||
| Auburn, AL | (d) | 757 | 1,199 | — | — | 757 | 1,199 | 1,956 | (101 | ) | 1990 | 07/17/13 | 10 to 28 Years | ||||||||||||||||||||
| Auburn, ME | (d) | 371 | 444 | — | — | 371 | 444 | 815 | (52 | ) | 1996 | 06/28/12 | 15 to 30 years | ||||||||||||||||||||
| Auburn, ME | (d) | 287 | 222 | — | — | 287 | 222 | 509 | (37 | ) | 1968 | 06/28/12 | 15 to 20 years | ||||||||||||||||||||
| Augusta, GA | (d) | 400 | 1,540 | — | — | 400 | 1,540 | 1,940 | (90 | ) | 1985 | 07/17/13 | 13 to 30 Years | ||||||||||||||||||||
| Augusta, ME | (d) | 318 | 322 | — | — | 318 | 322 | 640 | (38 | ) | 1997 | 06/28/12 | 15 to 28 years | ||||||||||||||||||||
| Bangor, ME | (d) | 327 | 141 | — | — | 327 | 141 | 468 | (41 | ) | 1973 | 06/28/12 | 15 to 15 years | ||||||||||||||||||||
| Barberton, OH | (d) | 255 | 1,244 | — | — | 255 | 1,244 | 1,499 | (85 | ) | 1991 | 07/17/13 | 12 to 29 Years | ||||||||||||||||||||
| Barberton, OH | (d) | 884 | 1,885 | — | — | 884 | 1,885 | 2,769 | (125 | ) | 2000 | 07/17/13 | 13 to 34 Years | ||||||||||||||||||||
| Barberton, OH | (d) | 321 | 1,219 | — | — | 321 | 1,219 | 1,540 | (75 | ) | 1996 | 07/17/13 | 14 to 31 Years | ||||||||||||||||||||
| Bartlett, NH | (d) | 325 | 399 | — | — | 325 | 399 | 724 | (47 | ) | 1998 | 06/28/12 | 15 to 32 years | ||||||||||||||||||||
| Barton, VT | (b) | 307 | 609 | — | — | 307 | 609 | 916 | (22 | ) | 1975 | 01/24/14 | 14 to 40 Years | ||||||||||||||||||||
| Inglewood, CA | (c) | 1,053 | 635 | — | 30 | 1,053 | 665 | 1,718 | (75 | ) | 1995 | 06/04/14 | 15 to 40 Years | ||||||||||||||||||||
| Inman, SC | (a) | 2,183 | 897 | — | 165 | 2,183 | 1,062 | 3,245 | (527 | ) | 1994 | 05/08/13 | 8 to 29 Years | ||||||||||||||||||||
| Irvine, KY | (c) | 219 | 666 | — | — | 219 | 666 | 885 | (48 | ) | 1987 | 06/30/15 | 15 to 30 Years | ||||||||||||||||||||
| Ithaca, MI | (c) | 538 | 381 | — | — | 538 | 381 | 919 | (20 | ) | 1994 | 05/19/16 | 17 to 30 Years | ||||||||||||||||||||
| Jackson, KY | (c) | 417 | 765 | — | — | 417 | 765 | 1,182 | (53 | ) | 1982 | 06/30/15 | 15 to 30 Years | ||||||||||||||||||||
| Jackson, MI | (c) | 684 | 1,188 | — | — | 684 | 1,188 | 1,872 | (38 | ) | 1963 | 05/19/16 | 17 to 30 Years | ||||||||||||||||||||
| Jackson, MI | (c) | 908 | 1,132 | — | — | 908 | 1,132 | 2,040 | (45 | ) | 1969 | 05/19/16 | 17 to 30 Years | ||||||||||||||||||||
| Jackson, MI | (c) | 247 | 179 | — | — | 247 | 179 | 426 | (11 | ) | 1965 | 05/19/16 | 17 to 30 Years | ||||||||||||||||||||
| Jacksonville, FL | (c) | 2,285 | 1,537 | — | — | 2,285 | 1,537 | 3,822 | (159 | ) | 2010 | 10/28/15 | 15 to 40 Years | ||||||||||||||||||||
| Kansas City, MO | (c) | 925 | 1,027 | — | — | 925 | 1,027 | 1,952 | (108 | ) | 1996 | 11/18/14 | 15 to 30 Years | ||||||||||||||||||||
| Kearney, MO | (c) | 529 | 925 | — | — | 529 | 925 | 1,454 | (91 | ) | 2001 | 11/18/14 | 15 to 30 Years | ||||||||||||||||||||
| Keene, NH | (c) | 553 | 289 | — | — | 553 | 289 | 842 | (60 | ) | 1960 | 01/24/14 | 14 to 30 Years | ||||||||||||||||||||
| Kent, OH | (c) | 258 | 917 | — | — | 258 | 917 | 1,175 | (147 | ) | 1994 | 07/17/13 | 13 to 29 Years | ||||||||||||||||||||
| Kent, WA | (c) | 1,450 | 381 | — | — | 1,450 | 381 | 1,831 | (82 | ) | 1987 | 10/28/14 | 15 to 30 Years | ||||||||||||||||||||
| Kissimmee, FL | (c) | 759 | 1,060 | — | 13 | 759 | 1,073 | 1,832 | (208 | ) | 2005 | 12/19/13 | 15 to 30 Years | ||||||||||||||||||||
| Kissimmee, FL | (c) | 2,115 | 1,602 | — | — | 2,115 | 1,602 | 3,717 | (112 | ) | 2006 | 10/27/15 | 15 to 40 Years | ||||||||||||||||||||
| Laconia, NH | (c) | 411 | 770 | — | — | 411 | 770 | 1,181 | (117 | ) | 1998 | 01/24/14 | 14 to 30 Years | ||||||||||||||||||||
| Lagrange, GA | (c) | 1,033 | 368 | — | — | 1,033 | 368 | 1,401 | (22 | ) | 1972 | 07/11/16 | 15 to 20 Years | ||||||||||||||||||||
| Lanett, AL | (c) | 299 | 844 | — | — | 299 | 844 | 1,143 | (157 | ) | 1974 | 07/17/13 | 10 to 25 Years | ||||||||||||||||||||
| Lanett, AL | (c) | 788 | 350 | — | — | 788 | 350 | 1,138 | (22 | ) | 1975 | 07/11/16 | 15 to 20 Years | ||||||||||||||||||||
| Lansing, MI | (c) | 336 | 168 | — | — | 336 | 168 | 504 | (13 | ) | 1978 | 05/19/16 | 17 to 30 Years | ||||||||||||||||||||
| Lansing, MI | (c) | 269 | 179 | — | — | 269 | 179 | 448 | (10 | ) | 1965 | 05/19/16 | 17 to 30 Years | ||||||||||||||||||||
| Laurens, SC | (a) | 505 | 622 | — | 118 | 505 | 740 | 1,245 | (178 | ) | 1992 | 01/01/14 | 8 to 29 Years | ||||||||||||||||||||
| Lead Hill, AR | (c) | 258 | 1,054 | — | — | 258 | 1,054 | 1,312 | (12 | ) | 1974 | 09/30/16 | 15 to 30 Years | ||||||||||||||||||||
| Lebo, KS | (c) | 1,951 | 762 | — | — | 1,951 | 762 | 2,713 | (144 | ) | 1976 | 11/18/14 | 15 to 20 Years | ||||||||||||||||||||
| Lewiston, ME | (c) | 460 | 341 | — | — | 460 | 341 | 801 | (97 | ) | 1994 | 06/28/12 | 15 to 28 Years | ||||||||||||||||||||
| Lincoln, AL | (c) | 1,785 | 1,312 | — | 2 | 1,785 | 1,314 | 3,099 | (50 | ) | 2001 | 07/11/16 | 15 to 40 Years | ||||||||||||||||||||
| Long Beach, CA | (c) | 1,049 | 635 | — | — | 1,049 | 635 | 1,684 | (96 | ) | 1959 | 05/02/14 | 15 to 30 Years | ||||||||||||||||||||
| Los Angeles, CA | (c) | 2,178 | 504 | — | — | 2,178 | 504 | 2,682 | (154 | ) | 1963 | 05/02/14 | 15 to 20 Years | ||||||||||||||||||||
| Lynchburg, VA | (c) | 467 | 1,391 | — | — | 467 | 1,391 | 1,858 | (85 | ) | 2006 | 06/30/15 | 15 to 30 Years | ||||||||||||||||||||
| Lynchburg, VA | (c) | 278 | 699 | — | — | 278 | 699 | 977 | (42 | ) | 1967 | 06/30/15 | 15 to 30 Years | ||||||||||||||||||||
| Lynchburg, VA | (c) | 517 | 1,142 | — | — | 517 | 1,142 | 1,659 | (77 | ) | 2000 | 06/30/15 | 15 to 30 Years | ||||||||||||||||||||
| Macon, GA | (c) | 470 | 1,226 | — | — | 470 | 1,226 | 1,696 | (251 | ) | 1974 | 07/17/13 | 7 to 35 Years | ||||||||||||||||||||
| Macon, GA | (c) | 471 | 1,066 | — | — | 471 | 1,066 | 1,537 | (271 | ) | 1993 | 07/17/13 | 5 to 35 Years | ||||||||||||||||||||
| Madison Heights, VA | (c) | 268 | 417 | — | — | 268 | 417 | 685 | (31 | ) | 1983 | 06/30/15 | 15 to 30 Years | ||||||||||||||||||||
| Madison, ME | (c) | 130 | 410 | — | — | 130 | 410 | 540 | (89 | ) | 1988 | 06/28/12 | 15 to 25 Years | ||||||||||||||||||||
| Manahawkin, NJ | (c) | 3,258 | 1,954 | — | — | 3,258 | 1,954 | 5,212 | (586 | ) | 2001 | 07/17/13 | 8 to 46 Years | ||||||||||||||||||||
| Manchester, ME | (c) | 279 | 285 | — | — | 279 | 285 | 564 | (88 | ) | 1990 | 06/28/12 | 15 to 20 Years | ||||||||||||||||||||
| Maple Heights, OH | (c) | 747 | 917 | — | — | 747 | 917 | 1,664 | (179 | ) | 1998 | 07/17/13 | 13 to 32 Years | ||||||||||||||||||||
| Initial Cost to Company | Cost Capitalized Subsequent to Acquisition including impairment | Gross Amount at December 31, | Life in which depreciation in latest Statement of Operations is computed | ||||||||||||||||||||||
| Description | Encumbrances | Land and Improvements | Buildings and Improvements | Improvements/ Land | Improvements/ building | Land and Improvements | Buildings and Improvements | Total | Final Accum | Date of Construction | Date Acquired | ||||||||||||||
| Baton Rouge, LA | (d) | 260 | 859 | — | — | 260 | 859 | 1,119 | (66 | ) | 1976 | 07/17/13 | 7 to 29 Years | ||||||||||||||||||||
| Baton Rouge, LA | (d) | 330 | 997 | — | — | 330 | 997 | 1,327 | (66 | ) | 1970 | 07/17/13 | 8 to 30 Years | ||||||||||||||||||||
| Baton Rouge, LA | (d) | 481 | 913 | — | — | 481 | 913 | 1,394 | (71 | ) | 1977 | 07/17/13 | 8 to 30 Years | ||||||||||||||||||||
| Beaufort, SC | (d) | 850 | 1,337 | — | — | 850 | 1,337 | 2,187 | (94 | ) | 1997 | 07/17/13 | 12 to 34 Years | ||||||||||||||||||||
| Bedford, OH | (d) | 750 | 680 | — | — | 750 | 680 | 1,430 | (61 | ) | 2000 | 07/17/13 | 15 to 33 Years | ||||||||||||||||||||
| Belle Glade, FL | (b) | 978 | 1,184 | — | — | 978 | 1,184 | 2,162 | (8 | ) | 1960 | 10/30/14 | 15 to 40 Years | ||||||||||||||||||||
| Belle Glade, FL | (b) | 356 | 1,125 | — | — | 356 | 1,125 | 1,481 | (10 | ) | 1977 | 10/30/14 | 15 to 40 Years | ||||||||||||||||||||
| Belmont, NH | (b) | 315 | 218 | — | — | 315 | 218 | 533 | (14 | ) | 1965 | 01/24/14 | 14 to 30 Years | ||||||||||||||||||||
| Belmont, NH | (b) | 524 | 879 | — | — | 524 | 879 | 1,403 | (45 | ) | 2002 | 01/24/14 | 14 to 30 Years | ||||||||||||||||||||
| Berlin, NH | (d) | 387 | 317 | — | — | 387 | 317 | 704 | (54 | ) | 1991 | 06/28/12 | 15 to 22 years | ||||||||||||||||||||
| Bluffton, SC | (d) | 1,531 | 645 | — | — | 1,531 | 645 | 2,176 | (66 | ) | 1997 | 07/17/13 | 10 to 32 Years | ||||||||||||||||||||
| Boise, ID | (a) | 2,155 | 2,488 | — | — | 2,155 | 2,488 | 4,643 | (251 | ) | 2004 | 05/15/13 | 15 to 30 Years | ||||||||||||||||||||
| Boise, ID | (a) | 217 | — | — | — | 217 | — | 217 | (3 | ) | (g) | 05/15/13 | 15 to 15 Years | ||||||||||||||||||||
| Bossier City, LA | (d) | 565 | 1,051 | (21 | ) | — | 544 | 1,051 | 1,595 | (80 | ) | 1987 | 07/17/13 | 9 to 25 Years | |||||||||||||||||||
| Brewer, ME | (d) | 238 | 260 | — | — | 238 | 260 | 498 | (41 | ) | 1967 | 06/28/12 | 15 to 25 years | ||||||||||||||||||||
| Brookpark, OH | (d) | 623 | 978 | — | — | 623 | 978 | 1,601 | (71 | ) | 1998 | 07/17/13 | 13 to 32 Years | ||||||||||||||||||||
| Bucksport, ME | (b) | 1,203 | 587 | — | — | 1,203 | 587 | 1,790 | (33 | ) | 1975 | 01/24/14 | 14 to 40 Years | ||||||||||||||||||||
| Calais, ME | (d) | 187 | 213 | — | — | 187 | 213 | 400 | (38 | ) | 1968 | 06/28/12 | 15 to 20 years | ||||||||||||||||||||
| Canton, OH | (d) | 362 | 1,159 | — | — | 362 | 1,159 | 1,521 | (85 | ) | 1992 | 07/17/13 | 12 to 28 Years | ||||||||||||||||||||
| Canton, OH | (d) | 1,037 | 1,557 | — | — | 1,037 | 1,557 | 2,594 | (121 | ) | 2000 | 07/17/13 | 15 to 34 Years | ||||||||||||||||||||
| Catlettsburg, KY | (a) | 9,344 | 3,989 | — | — | 9,344 | 3,989 | 13,333 | (3,187 | ) | 2001 | 12/23/03 | 15 to 40 years | ||||||||||||||||||||
| Cave Creek, AZ | (b) | 2,711 | 2,201 | — | — | 2,711 | 2,201 | 4,912 | (730 | ) | 1998 | 07/02/07 | 15 to 40 years | ||||||||||||||||||||
| Charleston, SC | (d) | 1,547 | 1,242 | — | — | 1,547 | 1,242 | 2,789 | (129 | ) | 1987 | 07/17/13 | 7 to 20 Years | ||||||||||||||||||||
| Charlotte, NC | (d) | 1,507 | 749 | — | — | 1,507 | 749 | 2,256 | (66 | ) | 1996 | 07/17/13 | 9 to 35 Years | ||||||||||||||||||||
| Charlotte, NC | (d) | 1,442 | 789 | — | — | 1,442 | 789 | 2,231 | (85 | ) | 1997 | 07/17/13 | 8 to 35 Years | ||||||||||||||||||||
| Charlotte, NC | (d) | 1,392 | 563 | — | — | 1,392 | 563 | 1,955 | (101 | ) | 1991 | 07/17/13 | 6 to 32 Years | ||||||||||||||||||||
| Cleveland, MO | (b) | 701 | 894 | — | — | 701 | 894 | 1,595 | (5 | ) | 1994 | 11/18/14 | 15 to 20 Years | ||||||||||||||||||||
| Cleveland, OH | (d) | 804 | 1,513 | — | — | 804 | 1,513 | 2,317 | (98 | ) | 2002 | 07/17/13 | 13 to 35 Years | ||||||||||||||||||||
| Columbia, SC | (d) | 1,061 | 1,073 | — | — | 1,061 | 1,073 | 2,134 | (77 | ) | 1997 | 07/17/13 | 11 to 32 Years | ||||||||||||||||||||
| Columbia, SC | (d) | 1,261 | 985 | — | — | 1,261 | 985 | 2,246 | (81 | ) | 1993 | 07/17/13 | 10 to 28 Years | ||||||||||||||||||||
| Columbus, GA | (d) | 711 | 943 | — | — | 711 | 943 | 1,654 | (67 | ) | 1990 | 07/17/13 | 13 to 32 Years | ||||||||||||||||||||
| Columbus, GA | (d) | 574 | 1,039 | — | — | 574 | 1,039 | 1,613 | (68 | ) | 1984 | 07/17/13 | 13 to 32 Years | ||||||||||||||||||||
| Columbus, GA | (d) | 867 | 2,299 | — | — | 867 | 2,299 | 3,166 | (142 | ) | 1978 | 07/17/13 | 13 to 30 Years | ||||||||||||||||||||
| Columbus, GA | (d) | 1,465 | 2,088 | — | — | 1,465 | 2,088 | 3,553 | (139 | ) | 1995 | 07/17/13 | 11 to 34 Years | ||||||||||||||||||||
| Columbus, GA | (d) | 730 | 1,317 | — | — | 730 | 1,317 | 2,047 | (95 | ) | 1978 | 07/17/13 | 13 to 28 Years | ||||||||||||||||||||
| Concord, NH | (d) | 260 | 330 | — | — | 260 | 330 | 590 | (43 | ) | 1988 | 06/28/12 | 15 to 25 years | ||||||||||||||||||||
| Copley, OH | (d) | 379 | 999 | — | — | 379 | 999 | 1,378 | (76 | ) | 1993 | 07/17/13 | 12 to 28 Years | ||||||||||||||||||||
| Cuyahoga Falls, OH | (d) | 657 | 1,018 | — | — | 657 | 1,018 | 1,675 | (86 | ) | 1995 | 07/17/13 | 13 to 30 Years | ||||||||||||||||||||
| Marquette, MI | (c) | 404 | 146 | — | — | 404 | 146 | 550 | (9 | ) | 1968 | 05/19/16 | 17 to 30 Years | ||||||||||||||||||||
| Marshfield, MO | (c) | 615 | 811 | — | — | 615 | 811 | 1,426 | (34 | ) | 1987 | 03/31/16 | 18 to 30 Years | ||||||||||||||||||||
| Martinez, GA | (c) | 626 | 996 | — | — | 626 | 996 | 1,622 | (412 | ) | 1985 | 07/17/13 | 3 to 35 Years | ||||||||||||||||||||
| Mason, MI | (c) | 258 | 157 | — | — | 258 | 157 | 415 | (10 | ) | 1971 | 05/19/16 | 17 to 30 Years | ||||||||||||||||||||
| McKee, KY | (c) | 119 | 973 | — | — | 119 | 973 | 1,092 | (55 | ) | 1983 | 06/30/15 | 15 to 30 Years | ||||||||||||||||||||
| Menominee, MI | (c) | 235 | 179 | — | — | 235 | 179 | 414 | (10 | ) | 1966 | 05/19/16 | 17 to 30 Years | ||||||||||||||||||||
| Merrillville, IN | (c) | 303 | 247 | — | — | 303 | 247 | 550 | (13 | ) | 1973 | 05/19/16 | 17 to 30 Years | ||||||||||||||||||||
| Midland, GA | (c) | 637 | 2,136 | — | — | 637 | 2,136 | 2,773 | (265 | ) | 1995 | 07/17/13 | 9 to 35 Years | ||||||||||||||||||||
| Midland, MI | (c) | 314 | 135 | — | — | 314 | 135 | 449 | (10 | ) | 1960 | 05/19/16 | 17 to 30 Years | ||||||||||||||||||||
| Midland, MI | (c) | 191 | 67 | — | — | 191 | 67 | 258 | (6 | ) | 1962 | 05/19/16 | 17 to 30 Years | ||||||||||||||||||||
| Mobile, AL | (c) | 552 | 1,664 | — | — | 552 | 1,664 | 2,216 | (315 | ) | 1987 | 07/17/13 | 11 to 24 Years | ||||||||||||||||||||
| Mobile, AL | (c) | 939 | 878 | — | — | 939 | 878 | 1,817 | (217 | ) | 1988 | 07/17/13 | 13 to 25 Years | ||||||||||||||||||||
| Moneta, VA | (c) | 437 | 934 | — | — | 437 | 934 | 1,371 | (71 | ) | 1999 | 06/30/15 | 15 to 30 Years | ||||||||||||||||||||
| Monroe, LA | (c) | 517 | 1,455 | — | — | 517 | 1,455 | 1,972 | (316 | ) | 1986 | 07/17/13 | 6 to 28 Years | ||||||||||||||||||||
| Montclair, CA | (c) | 4,957 | 4,136 | — | 375 | 4,957 | 4,511 | 9,468 | (581 | ) | 1989 | 10/31/14 | 15 to 40 Years | ||||||||||||||||||||
| Montgomery, AL | (c) | 648 | 228 | — | — | 648 | 228 | 876 | (16 | ) | 1965 | 07/11/16 | 15 to 20 Years | ||||||||||||||||||||
| Monticello, IN | (c) | 235 | 202 | — | — | 235 | 202 | 437 | (11 | ) | 1970 | 05/19/16 | 17 to 30 Years | ||||||||||||||||||||
| Mount Pleasant, SC | (c) | 1,328 | 1,073 | — | — | 1,328 | 1,073 | 2,401 | (170 | ) | 1978 | 07/17/13 | 7 to 30 Years | ||||||||||||||||||||
| Mountain Home, AR | (c) | 224 | 493 | — | 2 | 224 | 495 | 719 | (6 | ) | 1991 | 09/30/16 | 12 to 40 Years | ||||||||||||||||||||
| Mt Sterling, KY | (c) | 1,103 | 1,103 | — | — | 1,103 | 1,103 | 2,206 | (90 | ) | 2000 | 06/30/15 | 15 to 30 Years | ||||||||||||||||||||
| Muncie, IN | (c) | 448 | 135 | — | — | 448 | 135 | 583 | (12 | ) | 1983 | 05/19/16 | 17 to 30 Years | ||||||||||||||||||||
| Murphy, NC | (a) | 489 | 298 | — | 49 | 489 | 347 | 836 | (94 | ) | 1965 | 05/08/13 | 8 to 19 Years | ||||||||||||||||||||
| Muskegon, MI | (c) | 605 | 650 | — | — | 605 | 650 | 1,255 | (25 | ) | 1959 | 05/19/16 | 17 to 30 Years | ||||||||||||||||||||
| Muskegon, MI | (c) | 291 | 471 | — | — | 291 | 471 | 762 | (18 | ) | 1964 | 05/19/16 | 17 to 30 Years | ||||||||||||||||||||
| N. Augusta, SC | (c) | 1,065 | 894 | — | — | 1,065 | 894 | 1,959 | (146 | ) | 1999 | 07/17/13 | 12 to 33 Years | ||||||||||||||||||||
| Narberth, PA | (c) | 1,812 | 3,163 | — | — | 1,812 | 3,163 | 4,975 | (312 | ) | 2006 | 07/17/13 | 8 to 46 Years | ||||||||||||||||||||
| Neosho, MO | (c) | 504 | 628 | — | — | 504 | 628 | 1,132 | (10 | ) | 2002 | 09/30/16 | 14 to 40 Years | ||||||||||||||||||||
| Newport, NH | (c) | 519 | 581 | — | — | 519 | 581 | 1,100 | (132 | ) | 1998 | 06/28/12 | 15 to 30 Years | ||||||||||||||||||||
| Northfield, OH | (c) | 873 | 1,633 | — | — | 873 | 1,633 | 2,506 | (274 | ) | 1983 | 07/17/13 | 15 to 35 Years | ||||||||||||||||||||
| Norton Shores, MI | (c) | 325 | 291 | — | — | 325 | 291 | 616 | (15 | ) | 1962 | 05/19/16 | 17 to 30 Years | ||||||||||||||||||||
| Norton, OH | (c) | 581 | 1,460 | — | — | 581 | 1,460 | 2,041 | (220 | ) | 1984 | 07/17/13 | 13 to 35 Years | ||||||||||||||||||||
| Oakfield, ME | (c) | 273 | 229 | — | — | 273 | 229 | 502 | (78 | ) | 1993 | 06/28/12 | 15 to 25 Years | ||||||||||||||||||||
| Oakland, FL | (c) | 1,303 | 1,109 | — | — | 1,303 | 1,109 | 2,412 | (265 | ) | 2002 | 12/19/13 | 15 to 30 Years | ||||||||||||||||||||
| Okeechobee, FL | (c) | 468 | 936 | — | — | 468 | 936 | 1,404 | (88 | ) | 1976 | 10/30/14 | 15 to 40 Years | ||||||||||||||||||||
| Okeechobee, FL | (c) | 808 | 1,191 | — | — | 808 | 1,191 | 1,999 | (129 | ) | 1984 | 10/30/14 | 15 to 40 Years | ||||||||||||||||||||
| Okeechobee, FL | (c) | 386 | 1,764 | — | — | 386 | 1,764 | 2,150 | (129 | ) | 1975 | 10/30/14 | 15 to 40 Years | ||||||||||||||||||||
| Okeechobee, FL | (c) | 558 | 1,024 | — | — | 558 | 1,024 | 1,582 | (93 | ) | 1986 | 10/30/14 | 15 to 40 Years | ||||||||||||||||||||
| Ontario, CA | (c) | 1,307 | 1,307 | — | — | 1,307 | 1,307 | 2,614 | (163 | ) | 1964 | 05/02/14 | 15 to 30 Years | ||||||||||||||||||||
| Initial Cost to Company | Cost Capitalized Subsequent to Acquisition including impairment | Gross Amount at December 31, | Life in which depreciation in latest Statement of Operations is computed | ||||||||||||||||||||||
| Description | Encumbrances | Land and Improvements | Buildings and Improvements | Improvements/ Land | Improvements/ building | Land and Improvements | Buildings and Improvements | Total | Final Accum | Date of Construction | Date Acquired | ||||||||||||||
| Cuyahoga Falls, OH | (d) | 958 | 1,416 | — | — | 958 | 1,416 | 2,374 | (106 | ) | 2002 | 07/17/13 | 15 to 35 Years | ||||||||||||||||||||
| Cuyahoga Falls, OH | (d) | 342 | 806 | — | — | 342 | 806 | 1,148 | (64 | ) | 1972 | 07/17/13 | 12 to 26 Years | ||||||||||||||||||||
| El Paso, TX | (d) | 1,143 | 1,029 | — | — | 1,143 | 1,029 | 2,172 | (182 | ) | 1999 | 07/17/13 | 4 to 27 Years | ||||||||||||||||||||
| El Paso, TX | (d) | 987 | 558 | — | — | 987 | 558 | 1,545 | (85 | ) | 1999 | 07/17/13 | 3 to 26 Years | ||||||||||||||||||||
| El Paso, TX | (d) | 1,090 | 1,203 | — | — | 1,090 | 1,203 | 2,293 | (137 | ) | 1998 | 07/17/13 | 6 to 35 Years | ||||||||||||||||||||
| Fairlawn, OH | (d) | 616 | 1,064 | — | — | 616 | 1,064 | 1,680 | (84 | ) | 1993 | 07/17/13 | 13 to 28 Years | ||||||||||||||||||||
| Fallon, NV | (b) | 1,262 | 1,321 | — | — | 1,262 | 1,321 | 2,583 | (14 | ) | 1985 | 10/31/14 | 15 to 40 Years | ||||||||||||||||||||
| Fort Mill, SC | (d) | 1,589 | 1,356 | — | — | 1,589 | 1,356 | 2,945 | (88 | ) | 1999 | 07/17/13 | 10 to 33 Years | ||||||||||||||||||||
| Fort Pierce, FL | (b) | 1,064 | 1,659 | — | — | 1,064 | 1,659 | 2,723 | (13 | ) | 1977 | 10/30/14 | 15 to 40 Years | ||||||||||||||||||||
| Fort Pierce, FL | (b) | 681 | 1,404 | — | — | 681 | 1,404 | 2,085 | (10 | ) | 1989 | 10/30/14 | 15 to 40 Years | ||||||||||||||||||||
| Freeport, ME | (d) | 503 | 343 | — | — | 503 | 343 | 846 | (47 | ) | 1991 | 06/28/12 | 15 to 26 years | ||||||||||||||||||||
| Fremont, CA | (b) | 1,905 | 361 | — | — | 1,905 | 361 | 2,266 | (6 | ) | 1990 | 10/31/14 | 15 to 30 Years | ||||||||||||||||||||
| Goose Creek, SC | (d) | 682 | 1,571 | — | — | 682 | 1,571 | 2,253 | (136 | ) | 1983 | 07/17/13 | 7 to 28 Years | ||||||||||||||||||||
| Gorham, NH | (d) | 723 | 358 | — | — | 723 | 358 | 1,081 | (70 | ) | 1975 | 06/28/12 | 15 to 18 years | ||||||||||||||||||||
| Grandtham, NH | (b) | 576 | 394 | — | — | 576 | 394 | 970 | (25 | ) | 1989 | 01/24/14 | 14 to 30 Years | ||||||||||||||||||||
| Gresham, OR | (b) | 879 | 643 | — | — | 879 | 643 | 1,522 | (7 | ) | 1990 | 10/28/14 | 15 to 30 Years | ||||||||||||||||||||
| Hampden, ME | (b) | 987 | 424 | — | — | 987 | 424 | 1,411 | (44 | ) | 1997 | 01/24/14 | 14 to 30 Years | ||||||||||||||||||||
| Harrington, ME | (d) | 331 | 459 | — | — | 331 | 459 | 790 | (63 | ) | 1992 | 06/28/12 | 15 to 32 years | ||||||||||||||||||||
| Hockessin, DE | (c ) | 1,921 | 2,477 | — | — | 1,921 | 2,477 | 4,398 | (144 | ) | 2000 | 07/17/13 | 8 to 46 Years | ||||||||||||||||||||
| Honea Path, SC | (a) | 1,268 | 1,134 | — | 175 | 1,268 | 1,309 | 2,577 | (167 | ) | 1996 | 05/08/13 | 8 to 29 Years | ||||||||||||||||||||
| Houston, TX | (a) | 1,703 | 1,221 | — | — | 1,703 | 1,221 | 2,924 | (43 | ) | 1991 | 06/18/14 | 15 to 30 Years | ||||||||||||||||||||
| Huntersville, NC | (d) | 1,539 | 924 | — | — | 1,539 | 924 | 2,463 | (110 | ) | 1996 | 07/17/13 | 8 to 35 Years | ||||||||||||||||||||
| Huntington Beach, CA | (b) | 2,035 | 155 | — | — | 2,035 | 155 | 2,190 | (6 | ) | 1962 | 10/31/14 | 15 to 30 Years | ||||||||||||||||||||
| Huntington Park, CA | (b) | 1,909 | 891 | — | — | 1,909 | 891 | 2,800 | (50 | ) | 1947 | 05/02/14 | 15 to 20 Years | ||||||||||||||||||||
| Inglewood, CA | (b) | 1,053 | 635 | — | 30 | 1,053 | 665 | 1,718 | (16 | ) | 1995 | 06/04/14 | 15 to 40 Years | ||||||||||||||||||||
| Inman, SC | (a) | 2,183 | 897 | — | 165 | 2,183 | 1,062 | 3,245 | (239 | ) | 1994 | 05/08/13 | 8 to 29 Years | ||||||||||||||||||||
| Kansas City, MO | (b) | 925 | 1,027 | — | — | 925 | 1,027 | 1,952 | (4 | ) | 1996 | 11/18/14 | 15 to 30 Years | ||||||||||||||||||||
| Kearney, MO | (b) | 529 | 925 | — | — | 529 | 925 | 1,454 | (4 | ) | 2001 | 11/18/14 | 15 to 30 Years | ||||||||||||||||||||
| Keene, NH | (b) | 553 | 289 | — | — | 553 | 289 | 842 | (19 | ) | 2004 | 01/24/14 | 14 to 30 Years | ||||||||||||||||||||
| Kent, OH | (d) | 258 | 917 | — | — | 258 | 917 | 1,175 | (61 | ) | 1994 | 07/17/13 | 13 to 29 Years | ||||||||||||||||||||
| Kent, WA | (b) | 1,450 | 381 | — | — | 1,450 | 381 | 1,831 | (6 | ) | 1987 | 10/28/14 | 15 to 30 Years | ||||||||||||||||||||
| Kissimmee, FL | (b) | 759 | 1,060 | — | — | 759 | 1,060 | 1,819 | (70 | ) | 2005 | 12/19/13 | 15 to 30 Years | ||||||||||||||||||||
| Laconia, NH | (b) | 411 | 770 | — | — | 411 | 770 | 1,181 | (37 | ) | 1998 | 01/24/14 | 14 to 30 Years | ||||||||||||||||||||
| Lanett, AL | (d) | 299 | 844 | — | — | 299 | 844 | 1,143 | (65 | ) | 1974 | 07/17/13 | 10 to 25 Years | ||||||||||||||||||||
| Laurens, SC | (a) | 505 | 622 | — | 118 | 505 | 740 | 1,245 | (81 | ) | 1992 | 05/08/13 | 8 to 29 Years | ||||||||||||||||||||
| Lebo, KS | (b) | 1,951 | 762 | — | — | 1,951 | 762 | 2,713 | (6 | ) | 1976 | 11/18/14 | 15 to 20 Years | ||||||||||||||||||||
| Lewiston, ME | (d) | 460 | 341 | — | — | 460 | 341 | 801 | (54 | ) | 1994 | 06/28/12 | 15 to 28 years | ||||||||||||||||||||
| Opelika, AL | (c) | 960 | 1,716 | — | — | 960 | 1,716 | 2,676 | (363 | ) | 1988 | 07/17/13 | 10 to 25 Years | ||||||||||||||||||||
| Opelika, AL | (c) | 400 | 1,321 | — | — | 400 | 1,321 | 1,721 | (239 | ) | 1989 | 07/17/13 | 10 to 24 Years | ||||||||||||||||||||
| Orlando, FL | (c) | 1,167 | 982 | — | — | 1,167 | 982 | 2,149 | (211 | ) | 2001 | 12/19/13 | 15 to 30 Years | ||||||||||||||||||||
| Orlando, FL | (c) | 1,080 | 798 | — | — | 1,080 | 798 | 1,878 | (158 | ) | 2001 | 12/19/13 | 15 to 30 Years | ||||||||||||||||||||
| Orlando, FL | (c) | 1,303 | 496 | — | — | 1,303 | 496 | 1,799 | (133 | ) | 1994 | 12/19/13 | 15 to 30 Years | ||||||||||||||||||||
| Orlando, FL | (c) | 973 | 350 | — | — | 973 | 350 | 1,323 | (119 | ) | 1991 | 12/19/13 | 15 to 30 Years | ||||||||||||||||||||
| Orlando, FL | (c) | 1,128 | 496 | — | — | 1,128 | 496 | 1,624 | (139 | ) | 1995 | 12/19/13 | 15 to 30 Years | ||||||||||||||||||||
| Orlando, FL | (c) | 1,644 | 1,829 | — | — | 1,644 | 1,829 | 3,473 | (264 | ) | 2000 | 12/19/13 | 15 to 40 Years | ||||||||||||||||||||
| Orlando, FL | (c) | 1,255 | 1,333 | — | — | 1,255 | 1,333 | 2,588 | (240 | ) | 2001 | 12/19/13 | 15 to 40 Years | ||||||||||||||||||||
| Orlando, FL | (c) | 1,397 | 1,028 | — | — | 1,397 | 1,028 | 2,425 | (109 | ) | 1990 | 10/29/15 | 15 to 30 Years | ||||||||||||||||||||
| Oviedo, FL | (c) | 1,556 | 982 | — | — | 1,556 | 982 | 2,538 | (240 | ) | 2002 | 12/19/13 | 15 to 30 Years | ||||||||||||||||||||
| Oviedo, FL | (c) | 973 | 798 | — | — | 973 | 798 | 1,771 | (175 | ) | 1995 | 12/19/13 | 15 to 30 Years | ||||||||||||||||||||
| Oxnard, CA | (c) | 1,330 | 950 | — | 363 | 1,330 | 1,313 | 2,643 | (165 | ) | 1966 | 06/27/14 | 15 to 30 Years | ||||||||||||||||||||
| Oxnard, CA | (c) | 2,284 | 3,620 | — | — | 2,284 | 3,620 | 5,904 | (293 | ) | 2003 | 09/09/14 | 15 to 40 Years | ||||||||||||||||||||
| Panama City, FL | (c) | 630 | 298 | — | — | 630 | 298 | 928 | (17 | ) | 1951 | 07/11/16 | 15 to 20 Years | ||||||||||||||||||||
| Paris, KY | (c) | 129 | 636 | — | — | 129 | 636 | 765 | (39 | ) | 1988 | 06/30/15 | 15 to 30 Years | ||||||||||||||||||||
| Paris, KY | (c) | 209 | 576 | — | — | 209 | 576 | 785 | (40 | ) | 1992 | 06/30/15 | 15 to 30 Years | ||||||||||||||||||||
| Paris, ME | (c) | 139 | 153 | — | — | 139 | 153 | 292 | (55 | ) | 1954 | 06/28/12 | 15 to 17 Years | ||||||||||||||||||||
| Parma, OH | (c) | 437 | 1,166 | — | — | 437 | 1,166 | 1,603 | (160 | ) | 2002 | 07/17/13 | 15 to 35 Years | ||||||||||||||||||||
| Phenix City, AL | (c) | 554 | 1,392 | — | — | 554 | 1,392 | 1,946 | (228 | ) | 1999 | 07/17/13 | 13 to 33 Years | ||||||||||||||||||||
| Phoenix, AZ | (c) | 2,243 | 4,243 | — | — | 2,243 | 4,243 | 6,486 | (1,621 | ) | 2001 | 07/02/07 | 15 to 40 Years | ||||||||||||||||||||
| Phoenix, AZ | (c) | 1,212 | 380 | — | — | 1,212 | 380 | 1,592 | (76 | ) | 1985 | 03/20/15 | 7 to 40 Years | ||||||||||||||||||||
| Pine Mountain, GA | (c) | 454 | 1,627 | — | — | 454 | 1,627 | 2,081 | (239 | ) | 1999 | 07/17/13 | 10 to 37 Years | ||||||||||||||||||||
| Plainwell, MI | (c) | 785 | 235 | — | — | 785 | 235 | 1,020 | (22 | ) | 1998 | 05/19/16 | 17 to 30 Years | ||||||||||||||||||||
| Pomona, CA | (c) | 1,551 | 839 | — | 127 | 1,551 | 966 | 2,517 | (143 | ) | 1967 | 05/02/14 | 15 to 30 Years | ||||||||||||||||||||
| Pomona, CA | (c) | 1,078 | 864 | — | — | 1,078 | 864 | 1,942 | (111 | ) | 1999 | 06/04/14 | 15 to 40 Years | ||||||||||||||||||||
| Port Wentworth, GA | (c) | 1,627 | 1,131 | — | — | 1,627 | 1,131 | 2,758 | (513 | ) | 1991 | 07/17/13 | 4 to 35 Years | ||||||||||||||||||||
| Portland, OR | (c) | 516 | 272 | — | — | 516 | 272 | 788 | (45 | ) | 1991 | 10/28/14 | 15 to 30 Years | ||||||||||||||||||||
| Prattville, AL | (c) | 1,978 | 735 | — | — | 1,978 | 735 | 2,713 | (36 | ) | 1995 | 07/11/16 | 15 to 30 Years | ||||||||||||||||||||
| Presque Isle, ME | (c) | 708 | 390 | — | — | 708 | 390 | 1,098 | (107 | ) | 1995 | 01/24/14 | 14 to 30 Years | ||||||||||||||||||||
| Prosser, WA | (c) | 245 | 444 | — | — | 245 | 444 | 689 | (56 | ) | 1985 | 10/28/14 | 15 to 30 Years | ||||||||||||||||||||
| Ragland, AL | (c) | 385 | 595 | — | — | 385 | 595 | 980 | (15 | ) | 1986 | 07/11/16 | 15 to 30 Years | ||||||||||||||||||||
| Raymond, NH | (c) | 1,722 | 430 | — | — | 1,722 | 430 | 2,152 | (160 | ) | 1986 | 01/24/14 | 14 to 20 Years | ||||||||||||||||||||
| Reseda, CA | (c) | 2,064 | 1,013 | — | — | 2,064 | 1,013 | 3,077 | (132 | ) | 1997 | 05/02/14 | 15 to 40 Years | ||||||||||||||||||||
| Reseda, CA | (c) | 2,422 | 605 | — | — | 2,422 | 605 | 3,027 | (149 | ) | 1997 | 05/02/14 | 15 to 30 Years | ||||||||||||||||||||
| Ridgedale, MO | (c) | 1,199 | 1,177 | — | — | 1,199 | 1,177 | 2,376 | (20 | ) | 1995 | 09/30/16 | 13 to 30 Years | ||||||||||||||||||||
| Roanoke, VA | (c) | 238 | 497 | — | — | 238 | 497 | 735 | (32 | ) | 1988 | 06/30/15 | 15 to 30 Years | ||||||||||||||||||||
| Roanoke, VA | (c) | 616 | 534 | — | — | 616 | 534 | 1,150 | (46 | ) | 1988 | 06/30/15 | 15 to 30 Years | ||||||||||||||||||||
| Initial Cost to Company | Cost Capitalized Subsequent to Acquisition including impairment | Gross Amount at December 31, | Life in which depreciation in latest Statement of Operations is computed | ||||||||||||||||||||||
| Description | Encumbrances | Land and Improvements | Buildings and Improvements | Improvements/ Land | Improvements/ building | Land and Improvements | Buildings and Improvements | Total | Final Accum | Date of Construction | Date Acquired | ||||||||||||||
| Long Beach, CA | (b) | 1,049 | 635 | — | — | 1,049 | 635 | 1,684 | (24 | ) | 1959 | 05/02/14 | 15 to 30 Years | ||||||||||||||||||||
| Los Angeles, CA | (b) | 2,178 | 504 | — | — | 2,178 | 504 | 2,682 | (39 | ) | 1938 | 05/02/14 | 15 to 20 Years | ||||||||||||||||||||
| Macon, GA | (d) | 470 | 1,226 | — | — | 470 | 1,226 | 1,696 | (104 | ) | 1974 | 07/17/13 | 7 to 35 Years | ||||||||||||||||||||
| Macon, GA | (d) | 471 | 1,066 | — | — | 471 | 1,066 | 1,537 | (112 | ) | 1993 | 07/17/13 | 5 to 35 Years | ||||||||||||||||||||
| Madison, ME | (d) | 130 | 410 | — | — | 130 | 410 | 540 | (49 | ) | 1988 | 06/28/12 | 15 to 25 years | ||||||||||||||||||||
| Manahawkin, NJ | (c ) | 3,258 | 1,954 | — | — | 3,258 | 1,954 | 5,212 | (243 | ) | 2000 | 07/17/13 | 8 to 46 Years | ||||||||||||||||||||
| Manchester, ME | (d) | 279 | 285 | — | — | 279 | 285 | 564 | (49 | ) | 1990 | 06/28/12 | 15 to 20 years | ||||||||||||||||||||
| Maple Heights, OH | (d) | 747 | 917 | — | — | 747 | 917 | 1,664 | (74 | ) | 1998 | 07/17/13 | 13 to 32 Years | ||||||||||||||||||||
| Martinez, GA | (d) | 626 | 996 | — | — | 626 | 996 | 1,622 | (171 | ) | 1986 | 07/17/13 | 3 to 35 Years | ||||||||||||||||||||
| Meridian, ID | (a) | 1,924 | 2,170 | — | — | 1,924 | 2,170 | 4,094 | (233 | ) | 2006 | 05/15/13 | 15 to 30 Years | ||||||||||||||||||||
| Midland, GA | (d) | 637 | 2,136 | — | — | 637 | 2,136 | 2,773 | (110 | ) | 1995 | 07/17/13 | 9 to 35 Years | ||||||||||||||||||||
| Mobile, AL | (d) | 552 | 1,664 | — | — | 552 | 1,664 | 2,216 | (131 | ) | 1987 | 07/17/13 | 11 to 28 Years | ||||||||||||||||||||
| Mobile, AL | (d) | 939 | 878 | — | — | 939 | 878 | 1,817 | (90 | ) | 1988 | 07/17/13 | 13 to 28 Years | ||||||||||||||||||||
| Monroe, LA | (d) | 517 | 1,455 | — | — | 517 | 1,455 | 1,972 | (131 | ) | 1986 | 07/17/13 | 6 to 28 Years | ||||||||||||||||||||
| Montclair, CA | (b) | 4,957 | 4,136 | — | — | 4,957 | 4,136 | 9,093 | (45 | ) | 1989 | 10/31/14 | 15 to 40 Years | ||||||||||||||||||||
| Mount Pleasant, SC | (d) | 1,328 | 1,073 | — | — | 1,328 | 1,073 | 2,401 | (71 | ) | 1978 | 07/17/13 | 7 to 30 Years | ||||||||||||||||||||
| Murphy, NC | (a) | 489 | 298 | — | 49 | 489 | 347 | 836 | (43 | ) | 1965 | 05/08/13 | 8 to 19 Years | ||||||||||||||||||||
| N. Augusta, SC | (d) | 1,065 | 894 | — | — | 1,065 | 894 | 1,959 | (61 | ) | 1999 | 07/17/13 | 12 to 33 Years | ||||||||||||||||||||
| Nampa, ID | (a) | 3,240 | 2,343 | — | — | 3,240 | 2,343 | 5,583 | (272 | ) | 2010 | 05/15/13 | 15 to 30 Years | ||||||||||||||||||||
| Narberth, PA | (c ) | 1,812 | 3,163 | — | — | 1,812 | 3,163 | 4,975 | (129 | ) | 2000 | 07/17/13 | 8 to 46 Years | ||||||||||||||||||||
| Newport, NH | (d) | 519 | 581 | — | — | 519 | 581 | 1,100 | (73 | ) | 1998 | 06/28/12 | 15 to 30 years | ||||||||||||||||||||
| Northfield, OH | (d) | 873 | 1,633 | — | — | 873 | 1,633 | 2,506 | (113 | ) | 1983 | 07/17/13 | 15 to 35 Years | ||||||||||||||||||||
| Norton, OH | (d) | 581 | 1,460 | — | — | 581 | 1,460 | 2,041 | (91 | ) | 2001 | 07/17/13 | 13 to 35 Years | ||||||||||||||||||||
| Oakfield, ME | (d) | 273 | 229 | — | — | 273 | 229 | 502 | (43 | ) | 1993 | 06/28/12 | 15 to 25 years | ||||||||||||||||||||
| Oakland, FL | (b) | 1,303 | 1,109 | — | — | 1,303 | 1,109 | 2,412 | (88 | ) | 2002 | 12/19/13 | 15 to 30 Years | ||||||||||||||||||||
| Okeechobee, FL | (b) | 468 | 936 | — | — | 468 | 936 | 1,404 | (7 | ) | 1976 | 10/30/14 | 15 to 40 Years | ||||||||||||||||||||
| Okeechobee, FL | (b) | 808 | 1,191 | — | — | 808 | 1,191 | 1,999 | (10 | ) | 1984 | 10/30/14 | 15 to 40 Years | ||||||||||||||||||||
| Okeechobee, FL | (b) | 386 | 1,764 | — | — | 386 | 1,764 | 2,150 | (9 | ) | 1975 | 10/30/14 | 15 to 40 Years | ||||||||||||||||||||
| Okeechobee, FL | (b) | 558 | 1,024 | — | — | 558 | 1,024 | 1,582 | (7 | ) | 1986 | 10/30/14 | 15 to 40 Years | ||||||||||||||||||||
| Ontario, CA | (b) | 1,307 | 1,307 | — | — | 1,307 | 1,307 | 2,614 | (41 | ) | 1964 | 05/02/14 | 15 to 30 Years | ||||||||||||||||||||
| Opelika, AL | (d) | 960 | 1,716 | — | — | 960 | 1,716 | 2,676 | (150 | ) | 1988 | 07/17/13 | 10 to 29 Years | ||||||||||||||||||||
| Opelika, AL | (d) | 400 | 1,321 | — | — | 400 | 1,321 | 1,721 | (99 | ) | 1989 | 07/17/13 | 10 to 25 Years | ||||||||||||||||||||
| Orlando, FL | (b) | 1,167 | 982 | — | — | 1,167 | 982 | 2,149 | (70 | ) | 2001 | 12/19/13 | 15 to 30 Years | ||||||||||||||||||||
| Orlando, FL | (b) | 1,080 | 798 | — | — | 1,080 | 798 | 1,878 | (53 | ) | 2001 | 12/19/13 | 15 to 30 Years | ||||||||||||||||||||
| Orlando, FL | (b) | 1,303 | 496 | — | — | 1,303 | 496 | 1,799 | (44 | ) | 1994 | 12/19/13 | 15 to 30 Years | ||||||||||||||||||||
| Orlando, FL | (b) | 973 | 350 | — | — | 973 | 350 | 1,323 | (40 | ) | 1991 | 12/19/13 | 15 to 30 Years | ||||||||||||||||||||
| Orlando, FL | (b) | 1,128 | 496 | — | — | 1,128 | 496 | 1,624 | (46 | ) | 1995 | 12/19/13 | 15 to 30 Years | ||||||||||||||||||||
| Orlando, FL | (b) | 1,644 | 1,829 | — | — | 1,644 | 1,829 | 3,473 | (88 | ) | 2000 | 12/19/13 | 15 to 40 Years | ||||||||||||||||||||
| Orlando, FL | (b) | 1,255 | 1,333 | — | — | 1,255 | 1,333 | 2,588 | (80 | ) | 2001 | 12/19/13 | 15 to 40 Years | ||||||||||||||||||||
| Roanoke, VA | (c) | 397 | 785 | — | — | 397 | 785 | 1,182 | (54 | ) | 1986 | 06/30/15 | 15 to 30 Years | ||||||||||||||||||||
| Roanoke, VA | (c) | 397 | 685 | — | — | 397 | 685 | 1,082 | (49 | ) | 1997 | 06/30/15 | 15 to 30 Years | ||||||||||||||||||||
| Rockland, ME | (c) | 211 | 303 | — | — | 211 | 303 | 514 | (67 | ) | 1984 | 06/28/12 | 15 to 28 Years | ||||||||||||||||||||
| Roebuck, SC | (a) | 708 | 818 | — | 152 | 708 | 970 | 1,678 | (241 | ) | 1992 | 01/01/14 | 8 to 29 Years | ||||||||||||||||||||
| Rushville, IN | (c) | 179 | 112 | — | — | 179 | 112 | 291 | (7 | ) | 1978 | 05/19/16 | 17 to 30 Years | ||||||||||||||||||||
| Rustburg, VA | (c) | 527 | 775 | — | — | 527 | 775 | 1,302 | (64 | ) | 1990 | 06/30/15 | 15 to 30 Years | ||||||||||||||||||||
| Saginaw, MI | (c) | 1,177 | 594 | — | — | 1,177 | 594 | 1,771 | (31 | ) | 1989 | 05/19/16 | 17 to 30 Years | ||||||||||||||||||||
| Saginaw, MI | (c) | 224 | 135 | — | — | 224 | 135 | 359 | (8 | ) | 1960 | 05/19/16 | 17 to 30 Years | ||||||||||||||||||||
| Saginaw, MI | (c) | 359 | 191 | — | — | 359 | 191 | 550 | (9 | ) | 1969 | 05/19/16 | 17 to 30 Years | ||||||||||||||||||||
| St. Augustine, FL | (a) | 9,556 | 2,543 | — | — | 9,556 | 2,543 | 12,099 | (2,815 | ) | 2005 | 07/01/05 | 13 to 40 Years | ||||||||||||||||||||
| Salem, OR | (c) | 879 | 281 | — | — | 879 | 281 | 1,160 | (96 | ) | 1991 | 10/28/14 | 15 to 30 Years | ||||||||||||||||||||
| Salem, VA | (c) | 209 | 576 | — | — | 209 | 576 | 785 | (40 | ) | 1970 | 06/30/15 | 15 to 30 Years | ||||||||||||||||||||
| Salem, VA | (c) | 646 | 517 | — | — | 646 | 517 | 1,163 | (44 | ) | 1987 | 06/30/15 | 15 to 30 Years | ||||||||||||||||||||
| Salem, VA | (c) | 387 | 1,172 | — | — | 387 | 1,172 | 1,559 | (74 | ) | 1973 | 06/30/15 | 15 to 30 Years | ||||||||||||||||||||
| San Francisco, CA | (c) | 1,604 | 82 | — | — | 1,604 | 82 | 1,686 | (41 | ) | 1980 | 10/28/14 | 15 to 30 Years | ||||||||||||||||||||
| Sanford, ME | (c) | 807 | 579 | — | — | 807 | 579 | 1,386 | (122 | ) | 1997 | 06/28/12 | 15 to 28 Years | ||||||||||||||||||||
| Sault Ste Marie, MI | (c) | 1,760 | 561 | — | — | 1,760 | 561 | 2,321 | (36 | ) | 1993 | 05/19/16 | 17 to 30 Years | ||||||||||||||||||||
| Savannah, GA | (c) | 1,001 | 847 | — | — | 1,001 | 847 | 1,848 | (205 | ) | 1997 | 07/17/13 | 8 to 37 Years | ||||||||||||||||||||
| Savannah, GA | (c) | 831 | 869 | — | — | 831 | 869 | 1,700 | (169 | ) | 1990 | 07/17/13 | 14 to 30 Years | ||||||||||||||||||||
| Scottsdale, AZ | (c) | 4,416 | 2,384 | — | — | 4,416 | 2,384 | 6,800 | (1,096 | ) | 2000 | 07/02/07 | 15 to 40 Years | ||||||||||||||||||||
| Scottsdale, AZ | (c) | 2,765 | 2,196 | — | — | 2,765 | 2,196 | 4,961 | (1,006 | ) | 1995 | 07/02/07 | 15 to 40 Years | ||||||||||||||||||||
| Scottsdale, AZ | (c) | 5,123 | 2,683 | — | — | 5,123 | 2,683 | 7,806 | (1,563 | ) | 1991 | 07/02/07 | 15 to 40 Years | ||||||||||||||||||||
| Scottsdale, AZ | (c) | 3,437 | 2,373 | — | — | 3,437 | 2,373 | 5,810 | (1,383 | ) | 1996 | 07/02/07 | 15 to 40 Years | ||||||||||||||||||||
| Scottville, MI | (c) | 235 | 404 | — | — | 235 | 404 | 639 | (16 | ) | 1959 | 05/19/16 | 17 to 30 Years | ||||||||||||||||||||
| Seville, OH | (c) | 1,141 | 2,604 | — | — | 1,141 | 2,604 | 3,745 | (389 | ) | 2003 | 07/17/13 | 15 to 36 Years | ||||||||||||||||||||
| Sherman Mills, ME | (c) | 259 | 163 | — | — | 259 | 163 | 422 | (63 | ) | 1974 | 06/28/12 | 15 to 20 Years | ||||||||||||||||||||
| Shoreline, WA | (c) | 516 | 172 | — | — | 516 | 172 | 688 | (27 | ) | 1955 | 10/28/14 | 15 to 30 Years | ||||||||||||||||||||
| Shreveport, LA | (c) | 369 | 1,183 | — | — | 369 | 1,183 | 1,552 | (251 | ) | 1988 | 07/17/13 | 4 to 25 Years | ||||||||||||||||||||
| South Boston, VA | (c) | 378 | 705 | — | — | 378 | 705 | 1,083 | (45 | ) | 1988 | 06/30/15 | 15 to 30 Years | ||||||||||||||||||||
| South Boston, VA | (c) | 407 | 834 | — | — | 407 | 834 | 1,241 | (54 | ) | 1983 | 06/30/15 | 15 to 30 Years | ||||||||||||||||||||
| South Boston, VA | (c) | 894 | 1,232 | — | — | 894 | 1,232 | 2,126 | (88 | ) | 1997 | 06/30/15 | 15 to 30 Years | ||||||||||||||||||||
| South Boston, VA | (c) | 368 | 517 | — | — | 368 | 517 | 885 | (43 | ) | 1997 | 06/30/15 | 15 to 30 Years | ||||||||||||||||||||
| South Portland, ME | (c) | 661 | 194 | — | — | 661 | 194 | 855 | (91 | ) | 1970 | 06/28/12 | 15 to 15 Years | ||||||||||||||||||||
| South Portland, ME | (c) | 448 | 593 | — | — | 448 | 593 | 1,041 | (81 | ) | 1970 | 01/24/14 | 14 to 40 Years | ||||||||||||||||||||
| Initial Cost to Company | Cost Capitalized Subsequent to Acquisition including impairment | Gross Amount at December 31, | Life in which depreciation in latest Statement of Operations is computed | ||||||||||||||||||||||
| Description | Encumbrances | Land and Improvements | Buildings and Improvements | Improvements/ Land | Improvements/ building | Land and Improvements | Buildings and Improvements | Total | Final Accum | Date of Construction | Date Acquired | ||||||||||||||
| Oveido, FL | (b) | 1,556 | 982 | — | — | 1,556 | 982 | 2,538 | (80 | ) | 2002 | 12/19/13 | 15 to 30 Years | ||||||||||||||||||||
| Oviedo, FL | (b) | 973 | 798 | — | — | 973 | 798 | 1,771 | (58 | ) | 1995 | 12/19/13 | 15 to 30 Years | ||||||||||||||||||||
| Oxnard, CA | (b) | 1,330 | 950 | — | 363 | 1,330 | 1,313 | 2,643 | (29 | ) | 1966 | 06/27/14 | 15 to 30 Years | ||||||||||||||||||||
| Oxnard, CA | (b) | 2,284 | 3,620 | — | — | 2,284 | 3,620 | 5,904 | (42 | ) | 2003 | 09/09/14 | 15 to 40 Years | ||||||||||||||||||||
| Paris, ME | (d) | 139 | 153 | — | — | 139 | 153 | 292 | (31 | ) | 1954 | 06/28/12 | 15 to 17 years | ||||||||||||||||||||
| Parma, OH | (d) | 437 | 1,166 | — | — | 437 | 1,166 | 1,603 | (66 | ) | 2002 | 07/17/13 | 15 to 35 Years | ||||||||||||||||||||
| Phenix City, AL | (d) | 554 | 1,392 | — | — | 554 | 1,392 | 1,946 | (95 | ) | 1999 | 07/17/13 | 13 to 33 Years | ||||||||||||||||||||
| Phoenix, AZ | (b) | 2,243 | 4,243 | — | — | 2,243 | 4,243 | 6,486 | (1,277 | ) | 2001 | 07/02/07 | 15 to 40 years | ||||||||||||||||||||
| Pine Mountain, GA | (d) | 454 | 1,627 | — | — | 454 | 1,627 | 2,081 | (99 | ) | 1999 | 07/17/13 | 10 to 37 Years | ||||||||||||||||||||
| Pomona, CA | (b) | 1,551 | 839 | — | 128 | 1,551 | 967 | 2,518 | (34 | ) | 1967 | 05/02/14 | 15 to 30 Years | ||||||||||||||||||||
| Pomona, CA | (b) | 1,078 | 864 | — | — | 1,078 | 864 | 1,942 | (25 | ) | 1999 | 06/04/14 | 15 to 40 Years | ||||||||||||||||||||
| Port Wentworth, GA | (d) | 1,627 | 1,131 | — | — | 1,627 | 1,131 | 2,758 | (213 | ) | 1991 | 07/17/13 | 4 to 35 Years | ||||||||||||||||||||
| Portland, OR | (b) | 516 | 272 | — | — | 516 | 272 | 788 | (3 | ) | 1991 | 10/28/14 | 15 to 30 Years | ||||||||||||||||||||
| Presque Isle, ME | (b) | 708 | 390 | — | — | 708 | 390 | 1,098 | (34 | ) | 1995 | 01/24/14 | 14 to 30 Years | ||||||||||||||||||||
| Prosser, WA | (b) | 245 | 444 | — | — | 245 | 444 | 689 | (4 | ) | 1985 | 10/28/14 | 15 to 30 Years | ||||||||||||||||||||
| Raymond, NH | (b) | 1,722 | 430 | — | — | 1,722 | 430 | 2,152 | (50 | ) | 1986 | 01/24/14 | 14 to 20 Years | ||||||||||||||||||||
| Reseda, CA | (b) | 2,064 | 1,013 | — | — | 2,064 | 1,013 | 3,077 | (33 | ) | 2008 | 05/02/14 | 15 to 40 Years | ||||||||||||||||||||
| Reseda, CA | (b) | 2,422 | 605 | — | — | 2,422 | 605 | 3,027 | (37 | ) | 1997 | 05/02/14 | 15 to 30 Years | ||||||||||||||||||||
| Rockland, ME | (d) | 211 | 303 | — | — | 211 | 303 | 514 | (37 | ) | 1984 | 06/28/12 | 15 to 28 years | ||||||||||||||||||||
| Roebuck, SC | (a) | 708 | 818 | — | 152 | 708 | 970 | 1,678 | (109 | ) | 1992 | 05/08/13 | 8 to 29 Years | ||||||||||||||||||||
| Saint Augustine, FL | (a) | 9,556 | 2,543 | — | — | 9,556 | 2,543 | 12,099 | (2,217 | ) | 2001 | 12/23/03 | 15 to 40 years | ||||||||||||||||||||
| Salem, OR | (b) | 879 | 281 | — | — | 879 | 281 | 1,160 | (7 | ) | 1991 | 10/28/14 | 15 to 30 Years | ||||||||||||||||||||
| San Francisco, CA | (b) | 1,604 | 82 | — | — | 1,604 | 82 | 1,686 | (3 | ) | 1980 | 10/28/14 | 15 to 30 Years | ||||||||||||||||||||
| Sanford, ME | (d) | 807 | 579 | — | — | 807 | 579 | 1,386 | (68 | ) | 1997 | 06/28/12 | 15 to 28 years | ||||||||||||||||||||
| Savannah, GA | (d) | 1,001 | 847 | — | — | 1,001 | 847 | 1,848 | (85 | ) | 1997 | 07/17/13 | 8 to 37 Years | ||||||||||||||||||||
| Savannah, GA | (d) | 831 | 869 | — | — | 831 | 869 | 1,700 | (70 | ) | 1990 | 07/17/13 | 14 to 30 Years | ||||||||||||||||||||
| Scottsdale, AZ | (b) | 4,416 | 2,384 | — | — | 4,416 | 2,384 | 6,800 | (863 | ) | 2000 | 07/02/07 | 15 to 40 years | ||||||||||||||||||||
| Scottsdale, AZ | (b) | 2,765 | 2,196 | — | — | 2,765 | 2,196 | 4,961 | (792 | ) | 1995 | 07/02/07 | 15 to 40 years | ||||||||||||||||||||
| Scottsdale, AZ | (b) | 5,123 | 2,683 | — | — | 5,123 | 2,683 | 7,806 | (1,231 | ) | 1991 | 07/02/07 | 15 to 40 years | ||||||||||||||||||||
| Scottsdale, AZ | (b) | 3,437 | 2,373 | — | — | 3,437 | 2,373 | 5,810 | (1,089 | ) | 1996 | 07/02/07 | 15 to 40 years | ||||||||||||||||||||
| Seville, OH | (d) | 1,141 | 2,604 | — | — | 1,141 | 2,604 | 3,745 | (161 | ) | 2003 | 07/17/13 | 15 to 36 Years | ||||||||||||||||||||
| Sherman Mills, ME | (d) | 259 | 163 | — | — | 259 | 163 | 422 | (35 | ) | 1974 | 06/28/12 | 15 to 20 years | ||||||||||||||||||||
| Shoreline, WA | (b) | 516 | 172 | — | — | 516 | 172 | 688 | (2 | ) | 1955 | 10/28/14 | 15 to 30 Years | ||||||||||||||||||||
| Shreveport, LA | (d) | 369 | 1,183 | — | — | 369 | 1,183 | 1,552 | (104 | ) | 1988 | 07/17/13 | 4 to 28 Years | ||||||||||||||||||||
| South Portland, ME | (b) | 448 | 593 | — | — | 448 | 593 | 1,041 | (26 | ) | 1970 | 01/24/14 | 14 to 40 Years | ||||||||||||||||||||
| Sparta, MI | (c) | 291 | 650 | — | — | 291 | 650 | 941 | (20 | ) | 1993 | 05/19/16 | 17 to 30 Years | ||||||||||||||||||||
| Spiceland, IN | (a) | 9,649 | 3,063 | — | — | 9,649 | 3,063 | 12,712 | (3,527 | ) | 38534 | 07/01/05 | 13 to 40 Years | ||||||||||||||||||||
| Spring Lake, MI | (c) | 247 | 325 | — | 190 | 247 | 515 | 762 | (16 | ) | 1964 | 05/19/16 | 17 to 30 Years | ||||||||||||||||||||
| Springdale, AR | (c) | 2,119 | 1,401 | — | 157 | 2,119 | 1,558 | 3,677 | (25 | ) | 2010 | 09/30/16 | 17 to 40 Years | ||||||||||||||||||||
| Springdale, SC | (c) | 794 | 767 | — | — | 794 | 767 | 1,561 | (134 | ) | 1999 | 07/17/13 | 13 to 33 Years | ||||||||||||||||||||
| Springfield, MO | (c) | 431 | 732 | — | 86 | 431 | 818 | 1,249 | (32 | ) | 1988 | 03/31/16 | 18 to 30 Years | ||||||||||||||||||||
| Springfield, MO | (c) | 562 | 1,007 | — | — | 562 | 1,007 | 1,569 | (40 | ) | 1989 | 03/31/16 | 18 to 30 Years | ||||||||||||||||||||
| Springfield, MO | (c) | 327 | 732 | — | — | 327 | 732 | 1,059 | (28 | ) | 1987 | 03/31/16 | 18 to 30 Years | ||||||||||||||||||||
| St Johns, MI | (c) | 460 | 706 | — | — | 460 | 706 | 1,166 | (27 | ) | 2011 | 05/19/16 | 17 to 30 Years | ||||||||||||||||||||
| Stanton, CA | (c) | 985 | 566 | — | — | 985 | 566 | 1,551 | (78 | ) | 1966 | 10/31/14 | 15 to 30 Years | ||||||||||||||||||||
| Stevensville, MI | (c) | 482 | 191 | — | — | 482 | 191 | 673 | (16 | ) | 1960 | 05/19/16 | 17 to 30 Years | ||||||||||||||||||||
| Sumiton, AL | (c) | 1,138 | 420 | — | — | 1,138 | 420 | 1,558 | (28 | ) | 1970 | 07/11/16 | 15 to 20 Years | ||||||||||||||||||||
| Summerville, SC | (a) | 1,317 | 1,459 | (151 | ) | 208 | 1,166 | 1,667 | 2,833 | (309 | ) | 2001 | 05/08/13 | 8 to 29 Years | |||||||||||||||||||
| Swartz Creek, MI | (c) | 213 | 460 | — | — | 213 | 460 | 673 | (15 | ) | 1952 | 05/19/16 | 17 to 30 Years | ||||||||||||||||||||
| Sylacauga, AL | (c) | 560 | 438 | — | — | 560 | 438 | 998 | (20 | ) | 1948 | 07/11/16 | 15 to 20 Years | ||||||||||||||||||||
| Tacoma, WA | (c) | 326 | 290 | — | — | 326 | 290 | 616 | (46 | ) | 1987 | 10/28/14 | 15 to 30 Years | ||||||||||||||||||||
| Temple City, CA | (c) | 948 | 544 | — | 134 | 948 | 678 | 1,626 | (88 | ) | 1955 | 05/02/14 | 15 to 30 Years | ||||||||||||||||||||
| Three Rivers, MI | (c) | 1,256 | 1,401 | — | — | 1,256 | 1,401 | 2,657 | (55 | ) | 1982 | 05/19/16 | 17 to 30 Years | ||||||||||||||||||||
| Traverse City, MI | (c) | 482 | 179 | — | — | 482 | 179 | 661 | (9 | ) | 1971 | 05/19/16 | 17 to 30 Years | ||||||||||||||||||||
| Twinsburg, OH | (c) | 556 | 1,317 | — | — | 556 | 1,317 | 1,873 | (191 | ) | 2005 | 07/17/13 | 15 to 37 Years | ||||||||||||||||||||
| Union Gap, WA | (c) | 417 | 272 | — | — | 417 | 272 | 689 | (48 | ) | 1983 | 10/28/14 | 15 to 30 Years | ||||||||||||||||||||
| Vallejo, CA | (c) | 2,923 | 2,904 | — | — | 2,923 | 2,904 | 5,827 | (360 | ) | 1970 | 10/31/14 | 15 to 40 Years | ||||||||||||||||||||
| Valley, AL | (c) | 754 | 804 | — | — | 754 | 804 | 1,558 | (165 | ) | 1974 | 07/17/13 | 9 to 25 Years | ||||||||||||||||||||
| Valley, AL | (c) | 280 | 368 | — | — | 280 | 368 | 648 | (14 | ) | 1955 | 07/11/16 | 15 to 20 Years | ||||||||||||||||||||
| Ventura, CA | (c) | 2,473 | 909 | — | 169 | 2,473 | 1,078 | 3,551 | (183 | ) | 1971 | 05/02/14 | 15 to 30 Years | ||||||||||||||||||||
| Ventura, CA | (c) | 2,274 | 641 | — | — | 2,274 | 641 | 2,915 | (295 | ) | 1971 | 05/02/14 | 10 to 15 Years | ||||||||||||||||||||
| Vista, CA | (c) | 1,745 | 497 | — | — | 1,745 | 497 | 2,242 | (92 | ) | 1987 | 10/31/14 | 15 to 40 Years | ||||||||||||||||||||
| Waitsburg, WA | (c) | 190 | 344 | — | — | 190 | 344 | 534 | (45 | ) | 1980 | 10/28/14 | 15 to 30 Years | ||||||||||||||||||||
| Waldoboro, ME | (c) | 1,450 | 834 | — | — | 1,450 | 834 | 2,284 | (157 | ) | 1996 | 01/24/14 | 14 to 40 Years | ||||||||||||||||||||
| West Monroe, LA | (c) | 686 | 981 | — | — | 686 | 981 | 1,667 | (420 | ) | 1983 | 07/17/13 | 5 to 25 Years | ||||||||||||||||||||
| West Monroe, LA | (c) | 425 | 1,558 | — | — | 425 | 1,558 | 1,983 | (424 | ) | 1999 | 07/17/13 | 3 to 35 Years | ||||||||||||||||||||
| Willoughby, OH | (c) | 477 | 1,167 | — | — | 477 | 1,167 | 1,644 | (183 | ) | 1986 | 07/17/13 | 13 to 32 Years | ||||||||||||||||||||
| Winchester, KY | (c) | 755 | 775 | — | — | 755 | 775 | 1,530 | (63 | ) | 1981 | 06/30/15 | 15 to 30 Years | ||||||||||||||||||||
| Winter Park, FL | (c) | 992 | 1,021 | — | — | 992 | 1,021 | 2,013 | (170 | ) | 2004 | 12/19/13 | 15 to 40 Years | ||||||||||||||||||||
| Wiscasset, ME | (c) | 1,305 | 538 | — | — | 1,305 | 538 | 1,843 | (160 | ) | 1992 | 01/24/14 | 14 to 30 Years | ||||||||||||||||||||
| Woodburn, OR | (c) | 942 | 616 | — | — | 942 | 616 | 1,558 | (107 | ) | 1985 | 10/28/14 | 15 to 30 Years | ||||||||||||||||||||
| Wyoming, MI | (c) | 314 | 448 | — | — | 314 | 448 | 762 | (14 | ) | 1958 | 05/19/16 | 17 to 30 Years | ||||||||||||||||||||
| Initial Cost to Company | Cost Capitalized Subsequent to Acquisition including impairment | Gross Amount at December 31, | Life in which depreciation in latest Statement of Operations is computed | ||||||||||||||||||||||
| Description | Encumbrances | Land and Improvements | Buildings and Improvements | Improvements/ Land | Improvements/ building | Land and Improvements | Buildings and Improvements | Total | Final Accum | Date of Construction | Date Acquired | ||||||||||||||
| South Portland, ME | (d) | 661 | 194 | — | — | 661 | 194 | 855 | (51 | ) | 1970 | 06/28/12 | 15 to 15 years | ||||||||||||||||||||
| Spiceland, IN | (a) | 9,649 | 3,063 | — | — | 9,649 | 3,063 | 12,712 | (2,778 | ) | 2001 | 12/23/03 | 15 to 40 years | ||||||||||||||||||||
| Springdale, SC | (d) | 794 | 767 | — | — | 794 | 767 | 1,561 | (56 | ) | 1999 | 07/17/13 | 13 to 33 Years | ||||||||||||||||||||
| Stanton, CA | (b) | 985 | 566 | — | — | 985 | 566 | 1,551 | (6 | ) | 1966 | 10/31/14 | 15 to 30 Years | ||||||||||||||||||||
| Summerville, NC | (a) | 1,317 | 1,459 | — | 208 | 1,317 | 1,667 | 2,984 | (140 | ) | 2001 | 05/08/13 | 8 to 29 Years | ||||||||||||||||||||
| Tacoma, WA | (b) | 326 | 290 | — | — | 326 | 290 | 616 | (4 | ) | 1987 | 10/28/14 | 15 to 30 Years | ||||||||||||||||||||
| Temple City, CA | (b) | 948 | 544 | — | 134 | 948 | 678 | 1,626 | (20 | ) | 1955 | 05/02/14 | 15 to 30 Years | ||||||||||||||||||||
| Twinsburg, OH | (d) | 556 | 1,317 | — | — | 556 | 1,317 | 1,873 | (79 | ) | 1984 | 07/17/13 | 15 to 37 Years | ||||||||||||||||||||
| Union Gap, WA | (b) | 417 | 272 | — | — | 417 | 272 | 689 | (4 | ) | 1983 | 10/28/14 | 15 to 30 Years | ||||||||||||||||||||
| Vallejo, CA | (b) | 2,923 | 2,904 | — | — | 2,923 | 2,904 | 5,827 | (28 | ) | 1970 | 10/31/14 | 15 to 40 Years | ||||||||||||||||||||
| Valley, AL | (d) | 754 | 804 | — | — | 754 | 804 | 1,558 | (69 | ) | 1974 | 07/17/13 | 9 to 25 Years | ||||||||||||||||||||
| Ventura, CA | (b) | 2,473 | 909 | — | 169 | 2,473 | 1,078 | 3,551 | (43 | ) | 1967 | 05/02/14 | 15 to 30 Years | ||||||||||||||||||||
| Ventura, CA | (b) | 2,274 | 641 | — | — | 2,274 | 641 | 2,915 | (74 | ) | 1971 | 05/02/14 | 10 to 15 Years | ||||||||||||||||||||
| Vista, CA | (b) | 1,745 | 497 | — | — | 1,745 | 497 | 2,242 | (7 | ) | 1987 | 10/31/14 | 15 to 40 Years | ||||||||||||||||||||
| Waitsburg, WA | (b) | 190 | 344 | — | — | 190 | 344 | 534 | (3 | ) | 1980 | 10/28/14 | 15 to 30 Years | ||||||||||||||||||||
| Waldoboro, ME | (b) | 1,450 | 834 | — | — | 1,450 | 834 | 2,284 | (49 | ) | 1985 | 01/24/14 | 14 to 40 Years | ||||||||||||||||||||
| West Monroe, LA | (d) | 686 | 981 | — | — | 686 | 981 | 1,667 | (174 | ) | 1983 | 07/17/13 | 5 to 28 Years | ||||||||||||||||||||
| West Monroe, LA | (d) | 425 | 1,558 | — | — | 425 | 1,558 | 1,983 | (176 | ) | 1999 | 07/17/13 | 3 to 35 Years | ||||||||||||||||||||
| Willoughby, OH | (d) | 477 | 1,167 | — | — | 477 | 1,167 | 1,644 | (76 | ) | 1986 | 07/17/13 | 13 to 32 Years | ||||||||||||||||||||
| Winter Park, FL | (b) | 992 | 1,021 | — | — | 992 | 1,021 | 2,013 | (57 | ) | 2004 | 12/19/13 | 15 to 40 Years | ||||||||||||||||||||
| Wiscasset, ME | (b) | 1,305 | 538 | — | — | 1,305 | 538 | 1,843 | (50 | ) | 1992 | 01/24/14 | 14 to 30 Years | ||||||||||||||||||||
| Woodburn, OR | (b) | 942 | 616 | — | — | 942 | 616 | 1,558 | (8 | ) | 1985 | 10/28/14 | 15 to 30 Years | ||||||||||||||||||||
| Yakima, WA | (b) | 462 | 317 | — | — | 462 | 317 | 779 | (4 | ) | 1989 | 10/28/14 | 15 to 30 Years | ||||||||||||||||||||
| Yarmouth, ME | (b) | 950 | 278 | — | — | 950 | 278 | 1,228 | (25 | ) | 1990 | 01/24/14 | 14 to 40 Years | ||||||||||||||||||||
| Yakima, WA | (c) | 462 | 317 | — | — | 462 | 317 | 779 | (46 | ) | 1989 | 10/28/14 | 15 to 30 Years | ||||||||||||||||||||
| Yarmouth, ME | (c) | 950 | 278 | — | — | 950 | 278 | 1,228 | (78 | ) | 1990 | 01/24/14 | 14 to 40 Years | ||||||||||||||||||||
| Yellville, AR | (c) | 269 | 740 | — | — | 269 | 740 | 1,009 | (10 | ) | 1984 | 09/30/16 | 13 to 30 Years | ||||||||||||||||||||
| Zeeland, MI | (c) | 213 | 426 | — | — | 213 | 426 | 639 | (13 | ) | 1989 | 05/19/16 | 17 to 30 Years | ||||||||||||||||||||
| Building Materials | ||||||||||||||||||||||||||||||||||
| Abingdon, VA | (c ) | 401 | 814 | — | — | 401 | 814 | 1,215 | (263 | ) | 1979 | 10/14/10 | 15 to 30 years | |||||||||||||||||||||
| Aiken, SC | (a) | 108 | 265 | — | — | 108 | 265 | 373 | (110 | ) | 1985 | 12/30/04 | 15 to 20 years | |||||||||||||||||||||
| Alamogordo, NM | (c ) | 645 | 861 | — | — | 645 | 861 | 1,506 | (204 | ) | 1980 | 11/10/08 | 15 to 40 years | |||||||||||||||||||||
| Altoona, PA | (c ) | 342 | 545 | — | — | 342 | 545 | 887 | (174 | ) | 1993 | 11/10/08 | 15 to 30 years | |||||||||||||||||||||
| Ankeny, Ia | (c ) | 687 | 2,162 | — | — | 687 | 2,162 | 2,849 | (120 | ) | 2006 | 07/17/13 | 8 to 43 Years | |||||||||||||||||||||
| Arnold, MO | (c ) | 973 | 553 | — | — | 973 | 553 | 1,526 | (303 | ) | 1984 | 07/03/12 | 10 to 15 years | |||||||||||||||||||||
| Asheville, NC | (c ) | 2,013 | 2,307 | — | — | 2,013 | 2,307 | 4,320 | (842 | ) | 1988 | 07/03/12 | 15 to 30 years | |||||||||||||||||||||
| Ashland, KY | (c ) | 1,009 | 1,032 | — | — | 1,009 | 1,032 | 2,041 | (428 | ) | 1991 | 10/14/10 | 15 to 30 years | |||||||||||||||||||||
| Auburn, AL | (c ) | 884 | 1,530 | — | — | 884 | 1,530 | 2,414 | (114 | ) | 2007 | 07/17/13 | 10 to 32 Years | |||||||||||||||||||||
| Auburn, NY | (c ) | 397 | 786 | — | — | 397 | 786 | 1,183 | (258 | ) | 1962 | 11/10/08 | 15 to 30 years | |||||||||||||||||||||
| Bakersfield, CA | (c ) | 1,235 | 1,659 | — | — | 1,235 | 1,659 | 2,894 | (511 | ) | 1976 | 07/03/12 | 15 to 30 years | |||||||||||||||||||||
| Grocery | |||||||||||||||||||||||||||||||||
| Abilene, TX | (a) | 1,586 | 2,230 | — | — | 1,586 | 2,230 | 3,816 | (549 | ) | 1979 | 03/27/13 | 6 to 20 Years | ||||||||||||||||||||
| Alto, TX | (a) | 204 | 464 | — | — | 204 | 464 | 668 | (87 | ) | 1996 | 03/31/14 | 7 to 20 Years | ||||||||||||||||||||
| Amarillo, TX | (c) | 3,559 | 4,575 | — | — | 3,559 | 4,575 | 8,134 | (1,245 | ) | 1999 | 05/23/05 | 14 to 40 Years | ||||||||||||||||||||
| Amarillo, TX | (c) | 1,828 | 1,292 | — | — | 1,828 | 1,292 | 3,120 | (482 | ) | 1988 | 05/23/05 | 9 to 30 Years | ||||||||||||||||||||
| Amarillo, TX | (c) | 1,573 | 1,586 | — | — | 1,573 | 1,586 | 3,159 | (589 | ) | 1989 | 05/23/05 | 9 to 30 Years | ||||||||||||||||||||
| Amarillo, TX | (a) | 1,574 | 1,389 | — | — | 1,574 | 1,389 | 2,963 | (516 | ) | 1989 | 05/23/05 | 9 to 30 Years | ||||||||||||||||||||
| Ashland, OH | (c) | 2,596 | 8,200 | — | — | 2,596 | 8,200 | 10,796 | (364 | ) | 2000 | 10/14/15 | 15 to 40 Years | ||||||||||||||||||||
| Atascadero, CA | (c) | 3,677 | 8,920 | — | — | 3,677 | 8,920 | 12,597 | (641 | ) | 2000 | 04/06/15 | 15 to 30 Years | ||||||||||||||||||||
| Bald Knob, AR | (a) | 328 | 327 | — | — | 328 | 327 | 655 | (102 | ) | 1971 | 03/31/14 | 1 to 15 Years | ||||||||||||||||||||
| Bethany, MO | (c) | 648 | 379 | — | — | 648 | 379 | 1,027 | (319 | ) | 1974 | 05/31/06 | 15 to 20 Years | ||||||||||||||||||||
| Blairsville, GA | (c) | 1,652 | 3,102 | — | — | 1,652 | 3,102 | 4,754 | (359 | ) | 2001 | 09/30/14 | 10 to 30 Years | ||||||||||||||||||||
| Boise, ID | (b) | 1,470 | 2,280 | — | — | 1,470 | 2,280 | 3,750 | (430 | ) | 1982 | 12/17/13 | 4 to 20 Years | ||||||||||||||||||||
| Buffalo, TX | (a) | 522 | 987 | — | — | 522 | 987 | 1,509 | (130 | ) | 1990 | 03/31/14 | 7 to 30 Years | ||||||||||||||||||||
| Burkburnett, TX | (a) | 2,030 | 2,706 | — | — | 2,030 | 2,706 | 4,736 | (781 | ) | 1997 | 05/23/05 | 11 to 40 Years | ||||||||||||||||||||
| Chattanooga, TN | (c) | 1,817 | 5,281 | — | — | 1,817 | 5,281 | 7,098 | (527 | ) | 1969 | 09/30/14 | 10 to 30 Years | ||||||||||||||||||||
| Childress, TX | (c) | 747 | 934 | — | — | 747 | 934 | 1,681 | (290 | ) | 1997 | 05/23/05 | 7 to 40 Years | ||||||||||||||||||||
| Chula Vista, CA | (c) | 3,801 | 5,718 | — | — | 3,801 | 5,718 | 9,519 | (405 | ) | 1986 | 03/20/15 | 15 to 30 Years | ||||||||||||||||||||
| Cleveland, TX | (c) | 465 | 2,867 | — | — | 465 | 2,867 | 3,332 | (1,568 | ) | 1991 | 12/01/05 | 15 to 20 Years | ||||||||||||||||||||
| Collierville, TN | (c) | 2,217 | 14,205 | — | 8 | 2,217 | 14,213 | 16,430 | (1,669 | ) | 2002 | 07/17/13 | 3 to 45 Years | ||||||||||||||||||||
| Corrigan, TX | (c) | 395 | 630 | — | — | 395 | 630 | 1,025 | (399 | ) | 1971 | 12/01/05 | 15 to 20 Years | ||||||||||||||||||||
| Dallas, TX | (c) | 3,975 | — | — | — | 3,975 | — | 3,975 | — | (f) | 07/17/13 | (f) | |||||||||||||||||||||
| Dayton, TN | (c) | 1,122 | 6,767 | — | — | 1,122 | 6,767 | 7,889 | (514 | ) | 1999 | 09/30/14 | 10 to 40 Years | ||||||||||||||||||||
| Diboll, TX | (c) | 775 | 872 | — | — | 775 | 872 | 1,647 | (566 | ) | 1974 | 12/01/05 | 15 to 20 Years | ||||||||||||||||||||
| Dover, OH | (c) | 2,596 | 8,087 | — | — | 2,596 | 8,087 | 10,683 | (428 | ) | 1990 | 10/14/15 | 15 to 30 Years | ||||||||||||||||||||
| El Cajon, CA | (c) | 7,323 | 10,056 | — | — | 7,323 | 10,056 | 17,379 | (751 | ) | 1997 | 03/16/15 | 15 to 30 Years | ||||||||||||||||||||
| Eureka, CA | (c) | 3,108 | 12,817 | — | — | 3,108 | 12,817 | 15,925 | (1,380 | ) | 1960 | 07/17/13 | 3 to 40 Years | ||||||||||||||||||||
| Fort Smith, AR | (a) | 837 | 1,831 | — | — | 837 | 1,831 | 2,668 | (289 | ) | 1994 | 04/30/14 | 3 to 20 Years | ||||||||||||||||||||
| Groveton, TX | (a) | 264 | 540 | — | — | 264 | 540 | 804 | (79 | ) | 1996 | 03/31/14 | 7 to 30 Years | ||||||||||||||||||||
| Hallettsville, TX | (c) | 550 | 1,545 | — | — | 550 | 1,545 | 2,095 | (214 | ) | 2004 | 03/31/14 | 10 to 30 Years | ||||||||||||||||||||
| Hartsville, SC | (c) | 696 | 5,402 | — | — | 696 | 5,402 | 6,098 | (423 | ) | 1988 | 09/30/14 | 10 to 40 Years | ||||||||||||||||||||
| Indianapolis, IN | (c) | 1,640 | 8,063 | — | — | 1,640 | 8,063 | 9,703 | (1,026 | ) | 1999 | 07/17/13 | 7 to 33 Years | ||||||||||||||||||||
| LaGrange, GA | (b) | 972 | 8,435 | — | — | 972 | 8,435 | 9,407 | (1,345 | ) | 1998 | 07/17/13 | 4 to 25 Years | ||||||||||||||||||||
| Initial Cost to Company | Cost Capitalized Subsequent to Acquisition including impairment | Gross Amount at December 31, | Life in which depreciation in latest Statement of Operations is computed | ||||||||||||||||||||||
| Description | Encumbrances | Land and Improvements | Buildings and Improvements | Improvements/ Land | Improvements/ building | Land and Improvements | Buildings and Improvements | Total | Final Accum | Date of Construction | Date Acquired | ||||||||||||||
| Baldwinsville, NY | 1,520 | 1,105 | 2,008 | — | — | 1,105 | 2,008 | 3,113 | (169 | ) | 2005 | 07/17/13 | 11 to 37 Years | |||||||||||||||||||||
| Bardstown, KY | (c ) | 766 | 837 | — | — | 766 | 837 | 1,603 | (285 | ) | 2000 | 11/10/08 | 15 to 40 years | |||||||||||||||||||||
| Baton Rouge, LA | (c ) | 1,568 | 5,806 | — | — | 1,568 | 5,806 | 7,374 | (1,373 | ) | 2003 | 10/14/10 | 15 to 40 years | |||||||||||||||||||||
| Baytown, TX | 2,251 | 1,440 | 1,712 | — | — | 1,440 | 1,712 | 3,152 | (121 | ) | 2007 | 07/17/13 | 9 to 39 Years | |||||||||||||||||||||
| Beaver, WV | (c ) | 169 | 375 | — | — | 169 | 375 | 544 | (134 | ) | 1991 | 11/10/08 | 15 to 20 years | |||||||||||||||||||||
| Binghamton, NY | (c ) | 380 | 1,047 | — | — | 380 | 1,047 | 1,427 | (275 | ) | 1975 | 07/03/12 | 15 to 30 years | |||||||||||||||||||||
| Bowling Green, KY | (a) | 136 | 228 | — | — | 136 | 228 | 364 | (80 | ) | 1993 | 12/30/04 | 15 to 30 years | |||||||||||||||||||||
| Bradenton, FL | (c ) | 2,160 | 3,030 | — | — | 2,160 | 3,030 | 5,190 | (1,183 | ) | 2006 | 04/27/07 | 15 to 40 years | |||||||||||||||||||||
| Bridgeport, OH | (c ) | 360 | 544 | — | — | 360 | 544 | 904 | (230 | ) | 1984 | 11/10/08 | 15 to 20 years | |||||||||||||||||||||
| Buckhannon, WV | (c ) | 343 | 733 | — | — | 343 | 733 | 1,076 | (199 | ) | 1982 | 11/10/08 | 15 to 30 years | |||||||||||||||||||||
| Cambridge, MD | (c ) | 465 | 446 | — | — | 465 | 446 | 911 | (170 | ) | 1988 | 07/03/12 | 15 to 20 years | |||||||||||||||||||||
| Cambridge, OH | (c ) | 542 | 781 | — | — | 542 | 781 | 1,323 | (265 | ) | 1978 | 11/10/08 | 15 to 30 years | |||||||||||||||||||||
| Carroll, OH | (c ) | 1,144 | 4,557 | — | — | 1,144 | 4,557 | 5,701 | (345 | ) | 1976 | 07/17/13 | 3 to 30 Years | |||||||||||||||||||||
| Charlotte, NC | (c ) | 4,582 | 6,511 | — | — | 4,582 | 6,511 | 11,093 | (549 | ) | 2007 | 07/17/13 | 10 to 26 Years | |||||||||||||||||||||
| Charlottesville, VA | (c ) | 414 | 663 | — | — | 414 | 663 | 1,077 | (176 | ) | 1981 | 06/02/08 | 15 to 30 years | |||||||||||||||||||||
| Chattaroy, WV | (c ) | 107 | 227 | — | — | 107 | 227 | 334 | (139 | ) | 1982 | 11/10/08 | 10 to 15 years | |||||||||||||||||||||
| Clarkseville, DE | (c ) | 2,121 | 2,877 | (30 | ) | — | 2,091 | 2,877 | 4,968 | (1,012 | ) | 1970 | 10/14/10 | 15 to 40 years | ||||||||||||||||||||
| Clarksville, TN | (c ) | 1,145 | 1,972 | — | — | 1,145 | 1,972 | 3,117 | (671 | ) | 2005 | 04/27/07 | 15 to 40 years | |||||||||||||||||||||
| Clovis, NM | (a) | 1,704 | 1,342 | — | — | 1,704 | 1,342 | 3,046 | (150 | ) | 2007 | 07/17/13 | 9 to 33 Years | |||||||||||||||||||||
| Cohasset, MN | (c ) | 334 | 1,134 | — | — | 334 | 1,134 | 1,468 | (98 | ) | 2007 | 07/17/13 | 10 to 26 Years | |||||||||||||||||||||
| Columbus, OH | (c ) | 786 | 397 | — | — | 786 | 397 | 1,183 | (193 | ) | 1970 | 11/10/08 | 15 to 20 years | |||||||||||||||||||||
| Conroe, TX | (a) | 492 | 723 | — | — | 492 | 723 | 1,215 | (259 | ) | 1999 | 12/30/04 | 15 to 30 years | |||||||||||||||||||||
| Conyers, GA | (a) | 164 | 486 | — | — | 164 | 486 | 650 | (154 | ) | 1992 | 12/30/04 | 15 to 30 years | |||||||||||||||||||||
| Crockett, TX | (c ) | 835 | 1,591 | — | — | 835 | 1,591 | 2,426 | (131 | ) | 2006 | 07/17/13 | 8 to 36 Years | |||||||||||||||||||||
| Cumberland, MD | (c ) | 678 | 353 | — | — | 678 | 353 | 1,031 | (174 | ) | 1996 | 07/03/12 | 15 to 20 years | |||||||||||||||||||||
| Danville, IN | (c ) | 831 | 923 | — | — | 831 | 923 | 1,754 | (223 | ) | 1993 | 11/10/08 | 15 to 40 years | |||||||||||||||||||||
| Danville, KY | (c ) | 502 | 703 | — | — | 502 | 703 | 1,205 | (244 | ) | 1995 | 11/10/08 | 15 to 40 years | |||||||||||||||||||||
| Dayton, TN | (c ) | 437 | 816 | — | — | 437 | 816 | 1,253 | (196 | ) | 1999 | 06/11/08 | 15 to 40 years | |||||||||||||||||||||
| Denton, TX | (c ) | 2,308 | 1,888 | — | — | 2,308 | 1,888 | 4,196 | (603 | ) | 2005 | 04/27/07 | 15 to 40 years | |||||||||||||||||||||
| Depew, NY | (c ) | 398 | 1,108 | — | — | 398 | 1,108 | 1,506 | (416 | ) | 1960 | 11/10/08 | 15 to 20 years | |||||||||||||||||||||
| D'Iberville, MS | (a) | 250 | 339 | — | — | 250 | 339 | 589 | (155 | ) | 1984 | 12/30/04 | 15 to 20 years | |||||||||||||||||||||
| Douglassville, PA | (c ) | 440 | 447 | — | — | 440 | 447 | 887 | (228 | ) | 1979 | 11/10/08 | 15 to 20 years | |||||||||||||||||||||
| East Syracuse, NY | (c ) | 975 | 746 | — | — | 975 | 746 | 1,721 | (231 | ) | 1970 | 11/10/08 | 15 to 30 years | |||||||||||||||||||||
| Ellettsville, IN | (c ) | 894 | 1,872 | — | — | 894 | 1,872 | 2,766 | (125 | ) | 2010 | 07/17/13 | 11 to 47 Years | |||||||||||||||||||||
| Empire, OH | (c ) | 595 | 394 | — | — | 595 | 394 | 989 | (188 | ) | 1971 | 11/10/08 | 15 to 20 years | |||||||||||||||||||||
| Lake Oswego, OR | (c) | 4,257 | 5,891 | — | — | 4,257 | 5,891 | 10,148 | (299 | ) | 1965 | 03/18/15 | 15 to 40 Years | ||||||||||||||||||||
| Lancaster, CA | (b) | 1,569 | 4,271 | — | — | 1,569 | 4,271 | 5,840 | (561 | ) | 1983 | 12/17/13 | 5 to 30 Years | ||||||||||||||||||||
| Las Cruces, NM | (b) | 1,132 | 2,765 | — | — | 1,132 | 2,765 | 3,897 | (375 | ) | 1983 | 12/17/13 | 5 to 30 Years | ||||||||||||||||||||
| Levelland, TX | (c) | 1,651 | 2,158 | — | — | 1,651 | 2,158 | 3,809 | (623 | ) | 1997 | 05/23/05 | 11 to 40 Years | ||||||||||||||||||||
| Lompoc, CA | (c) | 2,743 | 8,316 | — | — | 2,743 | 8,316 | 11,059 | (527 | ) | 1992 | 06/15/15 | 15 to 30 Years | ||||||||||||||||||||
| Lorena, TX | (a) | 657 | 751 | — | — | 657 | 751 | 1,408 | (132 | ) | 1999 | 03/31/14 | 7 to 20 Years | ||||||||||||||||||||
| Lubbock, TX | (a) | 1,782 | 2,055 | — | — | 1,782 | 2,055 | 3,837 | (593 | ) | 1997 | 05/23/05 | 11 to 40 Years | ||||||||||||||||||||
| Lufkin, TX | (c) | 1,178 | 352 | — | — | 1,178 | 352 | 1,530 | (300 | ) | 1977 | 12/01/05 | 15 to 20 Years | ||||||||||||||||||||
| McGregor, TX | (a) | 748 | 795 | — | — | 748 | 795 | 1,543 | (152 | ) | 1999 | 03/31/14 | 7 to 20 Years | ||||||||||||||||||||
| Medina, OH | (c) | 4,892 | 10,983 | — | — | 4,892 | 10,983 | 15,875 | (616 | ) | 1990 | 10/14/15 | 15 to 30 Years | ||||||||||||||||||||
| Midland, TX | (b) | 1,498 | 3,096 | — | — | 1,498 | 3,096 | 4,594 | (573 | ) | 1983 | 12/17/13 | 5 to 20 Years | ||||||||||||||||||||
| Missoula, MT | (c) | 2,510 | 4,714 | — | — | 2,510 | 4,714 | 7,224 | (346 | ) | 1999 | 03/11/15 | 15 to 30 Years | ||||||||||||||||||||
| Missoula, MT | (c) | 3,008 | 5,168 | — | — | 3,008 | 5,168 | 8,176 | (366 | ) | 2008 | 03/12/15 | 15 to 30 Years | ||||||||||||||||||||
| Muleshoe, TX | (b) | 471 | 1,770 | — | — | 471 | 1,770 | 2,241 | (328 | ) | 1999 | 08/29/11 | 15 to 40 Years | ||||||||||||||||||||
| Navasota, TX | (c) | 781 | 1,499 | — | — | 781 | 1,499 | 2,280 | (635 | ) | 1992 | 12/01/05 | 15 to 30 Years | ||||||||||||||||||||
| Omaha, NE | (b) | 2,198 | 3,328 | — | — | 2,198 | 3,328 | 5,526 | (683 | ) | 1982 | 12/17/13 | 4 to 20 Years | ||||||||||||||||||||
| Palmdale, CA | (c) | 3,850 | 9,803 | — | — | 3,850 | 9,803 | 13,653 | (569 | ) | 2005 | 03/23/15 | 15 to 40 Years | ||||||||||||||||||||
| Perryton, TX | (a) | 1,029 | 597 | — | — | 1,029 | 597 | 1,626 | (212 | ) | 1997 | 05/23/05 | 7 to 40 Years | ||||||||||||||||||||
| Plainview, TX | (c) | 620 | 5,415 | — | — | 620 | 5,415 | 6,035 | (1,352 | ) | 2000 | 08/25/05 | 14 to 40 Years | ||||||||||||||||||||
| Port Angeles, WA | (c) | 2,227 | 7,361 | — | — | 2,227 | 7,361 | 9,588 | (549 | ) | 1995 | 02/17/15 | 15 to 30 Years | ||||||||||||||||||||
| Rogers, AR | (a) | 1,028 | 1,685 | — | — | 1,028 | 1,685 | 2,713 | (257 | ) | 1994 | 03/31/14 | 6 to 20 Years | ||||||||||||||||||||
| Silverdale, WA | (c) | 3,302 | 5,948 | — | — | 3,302 | 5,948 | 9,250 | (354 | ) | 1999 | 03/06/15 | 15 to 40 Years | ||||||||||||||||||||
| Snyder, TX | (c) | 2,062 | 2,963 | — | — | 2,062 | 2,963 | 5,025 | (809 | ) | 1999 | 05/23/05 | 14 to 40 Years | ||||||||||||||||||||
| St. Paul, MN | (a) | 1,262 | 1,016 | — | — | 1,262 | 1,016 | 2,278 | (118 | ) | 1980 | 03/31/14 | 15 to 30 Years | ||||||||||||||||||||
| Tigard, OR | (c) | 5,515 | 4,279 | — | — | 5,515 | 4,279 | 9,794 | (307 | ) | 1998 | 04/01/15 | 15 to 30 Years | ||||||||||||||||||||
| Timpson, TX | (c) | 253 | 312 | — | — | 253 | 312 | 565 | (217 | ) | 1978 | 12/01/05 | 15 to 20 Years | ||||||||||||||||||||
| Vernon, TX | (a) | 1,791 | 2,550 | — | — | 1,791 | 2,550 | 4,341 | (736 | ) | 1997 | 05/23/05 | 11 to 40 Years | ||||||||||||||||||||
| Wadsworth, OH | �� | (c) | 2,197 | 9,285 | — | — | 2,197 | 9,285 | 11,482 | (453 | ) | 1985 | 10/14/15 | 15 to 30 Years | |||||||||||||||||||
| Walla Walla, WA | (c) | 1,964 | 8,420 | — | — | 1,964 | 8,420 | 10,384 | (466 | ) | 1972 | 03/02/15 | 15 to 40 Years | ||||||||||||||||||||
| Westlake Village, CA | (c) | 6,449 | 6,129 | — | — | 6,449 | 6,129 | 12,578 | (407 | ) | 1998 | 04/20/15 | 15 to 30 Years | ||||||||||||||||||||
| Wichita Falls, TX | (c) | — | 6,259 | — | — | — | 6,259 | 6,259 | (3,116 | ) | 1997 | 05/23/05 | 13 to 20 Years | ||||||||||||||||||||
| Wooster, OH | (c) | 3,694 | 8,087 | — | — | 3,694 | 8,087 | 11,781 | (437 | ) | 1980 | 10/14/15 | 15 to 30 Years | ||||||||||||||||||||
| Drug Stores / Pharmacies | |||||||||||||||||||||||||||||||||
| Albany, GA | (c) | 961 | 3,314 | — | — | 961 | 3,314 | 4,275 | (342 | ) | 2008 | 7/17/2013 | 12 to 43 Years | ||||||||||||||||||||
| Alliance, OH | (c) | 556 | 1,317 | — | — | 556 | 1,317 | 1,873 | (274 | ) | 1996 | 7/17/2013 | 3 to 31 Years | ||||||||||||||||||||
| Alpharetta, GA | (b) | 968 | 2,614 | — | — | 968 | 2,614 | 3,582 | (300 | ) | 1998 | 7/17/2013 | 5 to 40 Years | ||||||||||||||||||||
| Amarillo, TX | (c) | 916 | 2,747 | — | — | 916 | 2,747 | 3,663 | (275 | ) | 1994 | 7/17/2013 | 20 to 20 Years | ||||||||||||||||||||
| Initial Cost to Company | Cost Capitalized Subsequent to Acquisition including impairment | Gross Amount at December 31, | Life in which depreciation in latest Statement of Operations is computed | ||||||||||||||||||||||
| Description | Encumbrances | Land and Improvements | Buildings and Improvements | Improvements/ Land | Improvements/ building | Land and Improvements | Buildings and Improvements | Total | Final Accum | Date of Construction | Date Acquired | ||||||||||||||
| Fairview, TN | 1,931 | 975 | 2,274 | — | — | 975 | 2,274 | 3,249 | (132 | ) | 2007 | 07/17/13 | 8 to 47 Years | |||||||||||||||||||||
| Fayetteville, NC | (c ) | 785 | 2,243 | — | — | 785 | 2,243 | 3,028 | (783 | ) | 2006 | 04/27/07 | 15 to 40 years | |||||||||||||||||||||
| Florence, SC | (a) | 221 | 174 | — | — | 221 | 174 | 395 | (166 | ) | 1974 | 12/30/04 | 10 to 15 years | |||||||||||||||||||||
| Fort Myers, FL | (a) | 1,021 | 583 | — | — | 1,021 | 583 | 1,604 | (284 | ) | 1999 | 12/30/04 | 15 to 40 years | |||||||||||||||||||||
| Fort Myers, FL | (a) | 641 | 1,069 | — | — | 641 | 1,069 | 1,710 | (430 | ) | 1999 | 12/30/04 | 15 to 30 years | |||||||||||||||||||||
| Fort Myers, FL | (c ) | 2,401 | 3,148 | — | — | 2,401 | 3,148 | 5,549 | (996 | ) | 1973 | 07/03/12 | 15 to 30 years | |||||||||||||||||||||
| Fortson, GA | (c ) | 1,120 | 1,006 | — | — | 1,120 | 1,006 | 2,126 | (412 | ) | 2002 | 10/14/10 | 15 to 40 years | |||||||||||||||||||||
| Fredericksburg, TX | 2,031 | 1,194 | 1,636 | — | — | 1,194 | 1,636 | 2,830 | (125 | ) | 2007 | 07/17/13 | 8 to 42 Years | |||||||||||||||||||||
| Georgetown, KY | (c ) | 769 | 885 | — | — | 769 | 885 | 1,654 | (323 | ) | 1998 | 06/11/08 | 15 to 40 years | |||||||||||||||||||||
| Georgetown, TX | (c ) | 1,587 | 3,114 | — | — | 1,587 | 3,114 | 4,701 | (834 | ) | 2006 | 04/27/07 | 15 to 40 years | |||||||||||||||||||||
| Great Falls, MT | (a) | 1,486 | 3,856 | — | — | 1,486 | 3,856 | 5,342 | (996 | ) | 2004 | 05/06/04 | 15 to 40 years | |||||||||||||||||||||
| Greensburg, PA | (c ) | 391 | 793 | — | — | 391 | 793 | 1,184 | (258 | ) | 1977 | 11/30/09 | 15 to 40 years | |||||||||||||||||||||
| Greenville, SC | (a) | 344 | 210 | — | — | 344 | 210 | 554 | (207 | ) | 1981 | 12/30/04 | 10 to 15 years | |||||||||||||||||||||
| Greenwood, IN | (c ) | 1,515 | 477 | — | — | 1,515 | 477 | 1,992 | (300 | ) | 1970 | 07/03/12 | 15 to 20 years | |||||||||||||||||||||
| Greer, SC | (a) | 268 | 236 | — | — | 268 | 236 | 504 | (125 | ) | 1993 | 12/30/04 | 15 to 30 years | |||||||||||||||||||||
| Grove City, PA | (c ) | 243 | 863 | — | — | 243 | 863 | 1,106 | (257 | ) | 1991 | 10/14/10 | 15 to 30 years | |||||||||||||||||||||
| Guilderland, NY | (c ) | 510 | 512 | — | — | 510 | 512 | 1,022 | (204 | ) | 1965 | 11/10/08 | 15 to 20 years | |||||||||||||||||||||
| Gulfport, MS | (a) | 384 | 453 | — | — | 384 | 453 | 837 | (403 | ) | 1970 | 12/30/04 | 10 to 15 years | |||||||||||||||||||||
| Gurnee, IL | (c ) | 2,036 | 2,523 | — | — | 2,036 | 2,523 | 4,559 | (762 | ) | 1998 | 07/03/12 | 15 to 30 years | |||||||||||||||||||||
| Hattiesburg, MS | (a) | 262 | 542 | — | — | 262 | 542 | 804 | (274 | ) | 1986 | 12/30/04 | 10 to 20 years | |||||||||||||||||||||
| Hendersonville, TN | (c ) | 1,555 | 2,341 | — | — | 1,555 | 2,341 | 3,896 | (782 | ) | 2006 | 04/27/07 | 15 to 40 years | |||||||||||||||||||||
| Hickory, NC | (a) | 199 | 262 | — | — | 199 | 262 | 461 | (150 | ) | 1989 | 12/30/04 | 15 to 20 years | |||||||||||||||||||||
| Highspire, PA | (c ) | 801 | 2,211 | — | — | 801 | 2,211 | 3,012 | (671 | ) | 2005 | 04/27/07 | 15 to 40 years | |||||||||||||||||||||
| Huntersville, NC | (c ) | 1,418 | 2,644 | — | — | 1,418 | 2,644 | 4,062 | (853 | ) | 2006 | 04/27/07 | 15 to 40 years | |||||||||||||||||||||
| Huntington, WV | (c ) | 907 | 1,275 | — | — | 907 | 1,275 | 2,182 | (463 | ) | 1985 | 10/14/10 | 15 to 30 years | |||||||||||||||||||||
| Indianapolis, IN | (a) | 607 | 520 | — | — | 607 | 520 | 1,127 | (270 | ) | 1990 | 12/30/04 | 15 to 20 years | |||||||||||||||||||||
| Indianapolis, IN | (c ) | 849 | 582 | — | — | 849 | 582 | 1,431 | (225 | ) | 1970 | 11/10/08 | 15 to 20 years | |||||||||||||||||||||
| Jacksonville, FL | (a) | 339 | 226 | — | — | 339 | 226 | 565 | (147 | ) | 1987 | 12/30/04 | 15 to 20 years | |||||||||||||||||||||
| Jacksonville, FL | (a) | 786 | 1,690 | — | — | 786 | 1,690 | 2,476 | (890 | ) | 1960 | 12/30/04 | 10 to 20 years | |||||||||||||||||||||
| Jacksonville, FL | (a) | 963 | 1,007 | — | — | 963 | 1,007 | 1,970 | (736 | ) | 2001 | 12/30/04 | 10 to 20 years | |||||||||||||||||||||
| Jefferson City, TN | (c ) | 1,059 | 1,517 | — | — | 1,059 | 1,517 | 2,576 | (460 | ) | 1999 | 07/03/12 | 15 to 30 years | |||||||||||||||||||||
| Jeffersonville, IN | (c ) | 717 | 730 | — | — | 717 | 730 | 1,447 | (258 | ) | 1945 | 07/03/12 | 15 to 20 years | |||||||||||||||||||||
| Keller, VA | (c ) | 244 | 959 | — | — | 244 | 959 | 1,203 | (240 | ) | 1995 | 10/14/10 | 15 to 40 years | |||||||||||||||||||||
| Knoxville, TN | (a) | 259 | 111 | — | — | 259 | 111 | 370 | (135 | ) | 1981 | 12/30/04 | 10 to 15 years | |||||||||||||||||||||
| Knoxville, TN | (c ) | 1,199 | 737 | — | — | 1,199 | 737 | 1,936 | (325 | ) | 1972 | 11/10/08 | 15 to 30 years | |||||||||||||||||||||
| La Grange, KY | (c ) | 1,524 | 1,871 | — | — | 1,524 | 1,871 | 3,395 | (115 | ) | 2008 | 07/17/13 | 10 to 48 Years | |||||||||||||||||||||
| La Grange, TX | (c ) | 822 | 1,953 | — | — | 822 | 1,953 | 2,775 | (139 | ) | 2006 | 07/17/13 | 8 to 40 Years | |||||||||||||||||||||
| Lakeland, FL | (a) | 1,098 | 1,281 | — | — | 1,098 | 1,281 | 2,379 | (690 | ) | 1984 | 12/30/04 | 15 to 20 years | |||||||||||||||||||||
| Atlanta, GA | (b) | 1,316 | 2,266 | — | — | 1,316 | 2,266 | 3,582 | (277 | ) | 2006 | 7/17/2013 | 14 to 42 Years | ||||||||||||||||||||
| Austin, MN | (c) | 485 | 3,606 | — | — | 485 | 3,606 | 4,091 | (369 | ) | 2004 | 7/17/2013 | 11 to 42 Years | ||||||||||||||||||||
| Azle, TX | (b) | 1,213 | 3,504 | — | — | 1,213 | 3,504 | 4,717 | (340 | ) | 2008 | 7/17/2013 | 15 to 43 Years | ||||||||||||||||||||
| Batesville, MS | (b) | 421 | 3,932 | — | — | 421 | 3,932 | 4,353 | (371 | ) | 2007 | 7/17/2013 | 10 to 42 Years | ||||||||||||||||||||
| Brentwood, TN | (c) | 2,933 | 2,584 | — | — | 2,933 | 2,584 | 5,517 | (507 | ) | 2006 | 7/17/2013 | 11 to 38 Years | ||||||||||||||||||||
| Bridgetown, OH | (c) | 1,015 | 3,769 | — | — | 1,015 | 3,769 | 4,784 | (389 | ) | 1999 | 7/17/2013 | 5 to 43 Years | ||||||||||||||||||||
| Bryan, TX | (c) | 1,049 | 5,633 | — | — | 1,049 | 5,633 | 6,682 | (544 | ) | 2001 | 7/17/2013 | 6 to 40 Years | ||||||||||||||||||||
| Buffalo, NY | (a) | 681 | 925 | — | — | 681 | 925 | 1,606 | (260 | ) | 1993 | 7/1/2005 | 19 to 40 Years | ||||||||||||||||||||
| Canton, IL | (c) | 703 | 4,098 | — | — | 703 | 4,098 | 4,801 | (414 | ) | 2006 | 7/17/2013 | 12 to 43 Years | ||||||||||||||||||||
| Carrolton, TX | (c) | 945 | 1,967 | — | — | 945 | 1,967 | 2,912 | (219 | ) | 1995 | 7/17/2013 | 1 to 39 Years | ||||||||||||||||||||
| Cincinnati, OH | (b) | 1,527 | 4,307 | — | — | 1,527 | 4,307 | 5,834 | (442 | ) | 2000 | 7/17/2013 | 7 to 42 Years | ||||||||||||||||||||
| Cleveland, OH | (c) | 776 | 1,158 | — | — | 776 | 1,158 | 1,934 | (185 | ) | 1998 | 7/17/2013 | 5 to 30 Years | ||||||||||||||||||||
| Clinton, NY | (c) | 1,050 | 2,090 | — | — | 1,050 | 2,090 | 3,140 | (269 | ) | 2005 | 7/17/2013 | 11 to 42 Years | ||||||||||||||||||||
| Columbia, MO | (b) | 1,047 | 5,242 | — | — | 1,047 | 5,242 | 6,289 | (466 | ) | 2002 | 7/17/2013 | 9 to 44 Years | ||||||||||||||||||||
| Columbia, TN | (c) | 842 | 1,864 | — | — | 842 | 1,864 | 2,706 | (235 | ) | 1997 | 7/17/2013 | 4 to 37 Years | ||||||||||||||||||||
| Columbia, TN | (c) | 1,109 | 1,683 | — | — | 1,109 | 1,683 | 2,792 | (220 | ) | 1997 | 7/17/2013 | 4 to 41 Years | ||||||||||||||||||||
| Columbus, MS | (b) | 769 | 3,475 | — | — | 769 | 3,475 | 4,244 | (343 | ) | 2004 | 7/17/2013 | 11 to 41 Years | ||||||||||||||||||||
| Crossville, TN | (b) | 1,890 | 3,680 | — | — | 1,890 | 3,680 | 5,570 | (385 | ) | 2001 | 7/17/2013 | 7 to 41 Years | ||||||||||||||||||||
| Dallas, TX | (c) | 735 | 3,328 | — | — | 735 | 3,328 | 4,063 | (342 | ) | 1996 | 7/17/2013 | 3 to 40 Years | ||||||||||||||||||||
| Defiance, OH | (c) | 645 | 2,452 | — | — | 645 | 2,452 | 3,097 | (315 | ) | 2005 | 7/17/2013 | 11 to 38 Years | ||||||||||||||||||||
| DeSoto, TX | (b) | 1,007 | 2,313 | — | — | 1,007 | 2,313 | 3,320 | (280 | ) | 1997 | 7/17/2013 | 5 to 40 Years | ||||||||||||||||||||
| Easton, PA | (c) | 1,028 | 3,996 | — | — | 1,028 | 3,996 | 5,024 | (449 | ) | 2006 | 7/17/2013 | 12 to 41 Years | ||||||||||||||||||||
| Elmira, NY | (c) | 1,066 | 4,230 | — | — | 1,066 | 4,230 | 5,296 | (435 | ) | 2007 | 7/17/2013 | 12 to 43 Years | ||||||||||||||||||||
| Enterprise, AL | (c) | 1,163 | 1,612 | — | — | 1,163 | 1,612 | 2,775 | (238 | ) | 2006 | 7/17/2013 | 11 to 37 Years | ||||||||||||||||||||
| Evansville, IN | (b) | 1,249 | 3,924 | — | — | 1,249 | 3,924 | 5,173 | (409 | ) | 2007 | 7/17/2013 | 12 to 44 Years | ||||||||||||||||||||
| Florence, SC | (b) | 744 | 2,070 | — | — | 744 | 2,070 | 2,814 | (237 | ) | 1998 | 7/17/2013 | 5 to 39 Years | ||||||||||||||||||||
| Fort Worth, TX | (b) | 1,601 | 1,894 | — | — | 1,601 | 1,894 | 3,495 | (246 | ) | 1999 | 7/17/2013 | 6 to 39 Years | ||||||||||||||||||||
| Fredericksburg, VA | (c) | 1,426 | 2,077 | — | — | 1,426 | 2,077 | 3,503 | (280 | ) | 2006 | 7/17/2013 | 14 to 37 Years | ||||||||||||||||||||
| Fremont, OH | (c) | 504 | 1,405 | — | — | 504 | 1,405 | 1,909 | (218 | ) | 1998 | 7/17/2013 | 4 to 31 Years | ||||||||||||||||||||
| Gainesville, FL | (c) | 922 | 2,705 | — | — | 922 | 2,705 | 3,627 | (295 | ) | 1998 | 7/17/2013 | 4 to 40 Years | ||||||||||||||||||||
| Glassport, PA | (c) | 550 | 2,471 | — | — | 550 | 2,471 | 3,021 | (325 | ) | 2006 | 7/17/2013 | 11 to 37 Years | ||||||||||||||||||||
| Glenville Scotia, NY | (c) | 1,314 | 3,964 | — | — | 1,314 | 3,964 | 5,278 | (431 | ) | 2006 | 7/17/2013 | 12 to 43 Years | ||||||||||||||||||||
| Gulfport, MS | (c) | 441 | 4,208 | — | — | 441 | 4,208 | 4,649 | (417 | ) | 2000 | 7/17/2013 | 12 to 40 Years | ||||||||||||||||||||
| Hamilton, OH | (c) | 738 | 2,429 | — | — | 738 | 2,429 | 3,167 | (288 | ) | 1998 | 7/17/2013 | 5 to 39 Years | ||||||||||||||||||||
| Harriman, TN | (c) | 1,951 | 3,250 | — | — | 1,951 | 3,250 | 5,201 | (368 | ) | 2007 | 7/17/2013 | 12 to 43 Years | ||||||||||||||||||||
| Houston, TX | (c) | 1,079 | 3,582 | — | — | 1,079 | 3,582 | 4,661 | (360 | ) | 2001 | 7/17/2013 | 6 to 40 Years | ||||||||||||||||||||
| Indianapolis, IN | (b) | 860 | 2,754 | — | — | 860 | 2,754 | 3,614 | (328 | ) | 1998 | 7/17/2013 | 10 to 40 Years | ||||||||||||||||||||
| Indianapolis, IN | (b) | 733 | 2,882 | — | — | 733 | 2,882 | 3,615 | (333 | ) | 1997 | 7/17/2013 | 10 to 38 Years | ||||||||||||||||||||
| Jacksonville, FL | (b) | 521 | 4,365 | — | — | 521 | 4,365 | 4,886 | (434 | ) | 2000 | 7/17/2013 | 7 to 40 Years | ||||||||||||||||||||
| Initial Cost to Company | Cost Capitalized Subsequent to Acquisition including impairment | Gross Amount at December 31, | Life in which depreciation in latest Statement of Operations is computed | ||||||||||||||||||||||
| Description | Encumbrances | Land and Improvements | Buildings and Improvements | Improvements/ Land | Improvements/ building | Land and Improvements | Buildings and Improvements | Total | Final Accum | Date of Construction | Date Acquired | ||||||||||||||
| Lawrenceville, GA | (a) | 500 | 237 | — | — | 500 | 237 | 737 | (150 | ) | 1996 | 12/30/04 | 15 to 30 years | |||||||||||||||||||||
| Lehighton, PA | (c ) | 645 | 593 | — | — | 645 | 593 | 1,238 | (210 | ) | 1996 | 07/03/12 | 15 to 30 years | |||||||||||||||||||||
| Lexington, KY | (c ) | 871 | 1,105 | — | — | 871 | 1,105 | 1,976 | (434 | ) | 1970 | 10/14/10 | 15 to 30 years | |||||||||||||||||||||
| Lexington, SC | (c ) | 1,250 | 2,153 | — | — | 1,250 | 2,153 | 3,403 | (625 | ) | 2006 | 04/27/07 | 15 to 40 years | |||||||||||||||||||||
| Lincoln, NE | (c ) | 1,822 | 2,158 | — | — | 1,822 | 2,158 | 3,980 | (681 | ) | 1985 | 11/10/08 | 15 to 30 years | |||||||||||||||||||||
| Livingston, TX | (c ) | 1,893 | 1,134 | — | — | 1,893 | 1,134 | 3,027 | (131 | ) | 2006 | 07/17/13 | 8 to 33 Years | |||||||||||||||||||||
| London, KY | (c ) | 698 | 701 | — | — | 698 | 701 | 1,399 | (284 | ) | 1979 | 11/10/08 | 15 to 20 years | |||||||||||||||||||||
| Loretto, PA | (c ) | 283 | 1,144 | — | — | 283 | 1,144 | 1,427 | (409 | ) | 1965 | 10/14/10 | 15 to 20 years | |||||||||||||||||||||
| Louisville, KY | (c ) | 737 | 758 | — | — | 737 | 758 | 1,495 | (294 | ) | 1963 | 11/10/08 | 15 to 30 years | |||||||||||||||||||||
| Louisville, KY | (c ) | 800 | 1,274 | — | — | 800 | 1,274 | 2,074 | (526 | ) | 1963 | 10/14/10 | 15 to 20 years | |||||||||||||||||||||
| Lowville, NY | (c ) | 791 | 1,659 | — | — | 791 | 1,659 | 2,450 | (106 | ) | 2010 | 07/17/13 | 12 to 42 Years | |||||||||||||||||||||
| Lubbock, TX | (c ) | 288 | 1,110 | — | — | 288 | 1,110 | 1,398 | (319 | ) | 1976 | 11/10/08 | 15 to 30 years | |||||||||||||||||||||
| Madison Heights, VA | (c ) | 536 | 1,228 | — | — | 536 | 1,228 | 1,764 | (321 | ) | 1981 | 07/03/12 | 15 to 30 years | |||||||||||||||||||||
| Madisonville, TN | (c ) | 418 | 815 | — | — | 418 | 815 | 1,233 | (196 | ) | 1999 | 06/11/08 | 15 to 40 years | |||||||||||||||||||||
| Malone, NY | (c ) | 793 | 1,677 | — | — | 793 | 1,677 | 2,470 | (121 | ) | 2010 | 07/17/13 | 11 to 42 Years | |||||||||||||||||||||
| Manassas, VA | (c ) | 3,591 | 2,021 | — | — | 3,591 | 2,021 | 5,612 | (484 | ) | 2005 | 04/27/07 | 15 to 40 years | |||||||||||||||||||||
| Marinette, WI | (c ) | 1,236 | 1,611 | — | — | 1,236 | 1,611 | 2,847 | (127 | ) | 2006 | 07/17/13 | 8 to 38 Years | |||||||||||||||||||||
| Martinsburg, WV | (a) | 173 | 20 | — | — | 173 | 20 | 193 | (36 | ) | 1972 | 12/30/04 | 10 to 15 years | |||||||||||||||||||||
| Martinsville, IN | (c ) | 385 | 289 | — | — | 385 | 289 | 674 | (107 | ) | 1990 | 07/03/12 | 15 to 30 years | |||||||||||||||||||||
| Mattoon, IL | (a) | 233 | 263 | — | — | 233 | 263 | 496 | (159 | ) | 1984 | 12/30/04 | 15 to 20 years | |||||||||||||||||||||
| Mechanicsville, MD | (c ) | 772 | 2,110 | — | — | 772 | 2,110 | 2,882 | (558 | ) | 1996 | 10/14/10 | 15 to 40 years | |||||||||||||||||||||
| Milesburg, PA | (c ) | 323 | 537 | — | — | 323 | 537 | 860 | (215 | ) | 1973 | 11/10/08 | 15 to 20 years | |||||||||||||||||||||
| Milton, WV | (c ) | 68 | 169 | — | — | 68 | 169 | 237 | (104 | ) | 1977 | 11/10/08 | 10 to 15 years | |||||||||||||||||||||
| Mishawaka, IN | (c ) | 357 | 397 | — | — | 357 | 397 | 754 | (176 | ) | 1979 | 07/03/12 | 10 to 15 years | |||||||||||||||||||||
| Moorefield, WV | (c ) | 572 | 310 | — | — | 572 | 310 | 882 | (89 | ) | 1996 | 11/10/08 | 15 to 40 years | |||||||||||||||||||||
| Morgantown, WV | (c ) | 930 | 307 | — | — | 930 | 307 | 1,237 | (116 | ) | 1994 | 11/10/08 | 15 to 30 years | |||||||||||||||||||||
| Moundsville, WV | (c ) | 712 | 310 | — | — | 712 | 310 | 1,022 | (102 | ) | 1969 | 11/10/08 | 15 to 30 years | |||||||||||||||||||||
| Mount Airy, MD | (c ) | 4,653 | 2,878 | — | — | 4,653 | 2,878 | 7,531 | (1,272 | ) | 1986 | 07/03/12 | 15 to 20 years | |||||||||||||||||||||
| Mountain Home, AR | (a) | 944 | 690 | — | — | 944 | 690 | 1,634 | (62 | ) | 1977 | 03/31/14 | 6 to 15 Years | |||||||||||||||||||||
| Mt Pleasant, PA | (c ) | 399 | 623 | — | — | 399 | 623 | 1,022 | (215 | ) | 1997 | 11/10/08 | 15 to 30 years | |||||||||||||||||||||
| Mt. Sterling, KY | (c ) | 1,785 | 1,051 | — | — | 1,785 | 1,051 | 2,836 | (121 | ) | 2011 | 07/17/13 | 12 to 38 Years | |||||||||||||||||||||
| Murfreesboro, TN | (c ) | 612 | 1,244 | — | — | 612 | 1,244 | 1,856 | (405 | ) | 1968 | 11/30/09 | 15 to 40 years | |||||||||||||||||||||
| Murrysville, PA | (c ) | 963 | 1,199 | — | — | 963 | 1,199 | 2,162 | (473 | ) | 1968 | 10/14/10 | 15 to 20 years | |||||||||||||||||||||
| Navasota, TX | 2,050 | 1,013 | 1,772 | — | — | 1,013 | 1,772 | 2,785 | (138 | ) | 2006 | 07/17/13 | 8 to 41 Years | |||||||||||||||||||||
| New Braunfels, TX | (c ) | 1,257 | 1,778 | — | — | 1,257 | 1,778 | 3,035 | (125 | ) | 2006 | 07/17/13 | 7 to 38 Years | |||||||||||||||||||||
| Kansas City, MO | (c) | 634 | 4,341 | — | — | 634 | 4,341 | 4,975 | (442 | ) | 1997 | 7/17/2013 | 4 to 43 Years | ||||||||||||||||||||
| Kansas City, MO | (c) | 532 | 3,549 | — | — | 532 | 3,549 | 4,081 | (398 | ) | 1998 | 7/17/2013 | 4 to 39 Years | ||||||||||||||||||||
| Kansas City, MO | (c) | 862 | 4,367 | — | — | 862 | 4,367 | 5,229 | (441 | ) | 2000 | 7/17/2013 | 6 to 42 Years | ||||||||||||||||||||
| Kansas City, MO | (c) | 518 | 4,234 | — | — | 518 | 4,234 | 4,752 | (429 | ) | 1999 | 7/17/2013 | 6 to 43 Years | ||||||||||||||||||||
| Kissimmee, FL | (c) | 1,508 | 2,153 | — | — | 1,508 | 2,153 | 3,661 | (284 | ) | 1995 | 7/17/2013 | 2 to 40 Years | ||||||||||||||||||||
| Knoxville, TN | (c) | 2,107 | 3,334 | — | — | 2,107 | 3,334 | 5,441 | (390 | ) | 2000 | 7/17/2013 | 6 to 40 Years | ||||||||||||||||||||
| Lake Worth, TX | (c) | 1,044 | 1,817 | — | — | 1,044 | 1,817 | 2,861 | (282 | ) | 1996 | 7/17/2013 | 2 to 30 Years | ||||||||||||||||||||
| LaMarque, TX | (b) | 464 | 3,139 | — | — | 464 | 3,139 | 3,603 | (361 | ) | 2000 | 7/17/2013 | 7 to 40 Years | ||||||||||||||||||||
| Lansing, MI | (c) | 196 | 1,487 | — | — | 196 | 1,487 | 1,683 | (198 | ) | 1996 | 7/17/2013 | 3 to 31 Years | ||||||||||||||||||||
| Lima, OH | (b) | 568 | 3,221 | — | — | 568 | 3,221 | 3,789 | (350 | ) | 2005 | 7/17/2013 | 12 to 43 Years | ||||||||||||||||||||
| Lincoln, IL | (b) | 444 | 3,043 | — | — | 444 | 3,043 | 3,487 | (334 | ) | 2007 | 7/17/2013 | 11 to 43 Years | ||||||||||||||||||||
| Lincolnton, NC | (c) | 548 | 1,537 | — | — | 548 | 1,537 | 2,085 | (202 | ) | 1998 | 7/17/2013 | 4 to 37 Years | ||||||||||||||||||||
| Madeira, OH | (c) | 951 | 3,978 | — | — | 951 | 3,978 | 4,929 | (391 | ) | 1998 | 7/17/2013 | 5 to 44 Years | ||||||||||||||||||||
| Madison, MS | (c) | 745 | 3,323 | — | — | 745 | 3,323 | 4,068 | (358 | ) | 2004 | 7/17/2013 | 11 to 40 Years | ||||||||||||||||||||
| Maynard, MA | (c) | 1,683 | 3,984 | — | — | 1,683 | 3,984 | 5,667 | (383 | ) | 2004 | 7/17/2013 | 14 to 42 Years | ||||||||||||||||||||
| Mechanicville, NY | (c) | 654 | 3,120 | — | — | 654 | 3,120 | 3,774 | (340 | ) | 1997 | 7/17/2013 | 4 to 38 Years | ||||||||||||||||||||
| Memphis, TN | (c) | 961 | 5,389 | — | — | 961 | 5,389 | 6,350 | (510 | ) | 2002 | 7/17/2013 | 12 to 43 Years | ||||||||||||||||||||
| Mobile, AL | (c) | 586 | 4,389 | — | — | 586 | 4,389 | 4,975 | (389 | ) | 2007 | 7/17/2013 | 13 to 44 Years | ||||||||||||||||||||
| Moundsville, WV | (a) | 706 | 1,002 | — | — | 706 | 1,002 | 1,708 | (286 | ) | 1993 | 7/1/2005 | 19 to 40 Years | ||||||||||||||||||||
| Mount Pleasant, TX | (c) | 1,192 | 4,578 | — | — | 1,192 | 4,578 | 5,770 | (485 | ) | 2009 | 7/17/2013 | 14 to 43 Years | ||||||||||||||||||||
| Myrtle Beach, SC | (c) | 828 | 4,024 | — | — | 828 | 4,024 | 4,852 | (414 | ) | 2004 | 7/17/2013 | 12 to 42 Years | ||||||||||||||||||||
| New Cumberland, PA | (b) | 794 | 2,663 | — | — | 794 | 2,663 | 3,457 | (291 | ) | 2007 | 7/17/2013 | 12 to 43 Years | ||||||||||||||||||||
| Newton, IA | (b) | 365 | 4,475 | — | — | 365 | 4,475 | 4,840 | (428 | ) | 2001 | 7/17/2013 | 7 to 44 Years | ||||||||||||||||||||
| Norwich, CT | (c) | 627 | 4,767 | — | 27 | 627 | 4,794 | 5,421 | (96 | ) | 1975 | 6/30/2016 | 4 to 30 Years | ||||||||||||||||||||
| Okeechobee, FL | (c) | 674 | 5,088 | — | — | 674 | 5,088 | 5,762 | (661 | ) | 2001 | 7/17/2013 | 9 to 30 Years | ||||||||||||||||||||
| Olivette, MO | (b) | 1,816 | 5,917 | — | — | 1,816 | 5,917 | 7,733 | (625 | ) | 2001 | 7/17/2013 | 11 to 42 Years | ||||||||||||||||||||
| Oneida, NY | (a) | 1,315 | 1,411 | — | — | 1,315 | 1,411 | 2,726 | (401 | ) | 1999 | 7/1/2005 | 19 to 40 Years | ||||||||||||||||||||
| Oneida, TN | (c) | 1,866 | 3,334 | — | — | 1,866 | 3,334 | 5,200 | (369 | ) | 2007 | 7/17/2013 | 13 to 43 Years | ||||||||||||||||||||
| Onley, VA | (c) | 2,530 | 2,296 | — | — | 2,530 | 2,296 | 4,826 | (310 | ) | 2007 | 7/17/2013 | 12 to 43 Years | ||||||||||||||||||||
| Orlando, FL | (c) | 781 | 3,799 | — | — | 781 | 3,799 | 4,580 | (500 | ) | 2005 | 7/17/2013 | 10 to 30 Years | ||||||||||||||||||||
| Parkville, MO | (c) | 1,854 | 2,568 | — | — | 1,854 | 2,568 | 4,422 | (341 | ) | 2006 | 7/17/2013 | 11 to 38 Years | ||||||||||||||||||||
| Philadelphia, PA | (a) | 733 | 1,087 | — | — | 733 | 1,087 | 1,820 | (305 | ) | 1993 | 7/1/2005 | 19 to 40 Years | ||||||||||||||||||||
| Philadelphia, PA | (a) | 1,613 | 1,880 | — | — | 1,613 | 1,880 | 3,493 | (519 | ) | 1999 | 7/1/2005 | 19 to 40 Years | ||||||||||||||||||||
| Plains, PA | (c) | 1,502 | 2,611 | — | — | 1,502 | 2,611 | 4,113 | (345 | ) | 2006 | 7/17/2013 | 12 to 37 Years | ||||||||||||||||||||
| Portsmouth, OH | (c) | 354 | 1,953 | — | — | 354 | 1,953 | 2,307 | (217 | ) | 1997 | 7/17/2013 | 5 to 38 Years | ||||||||||||||||||||
| Portsmouth, OH | (b) | 219 | 2,049 | — | — | 219 | 2,049 | 2,268 | (206 | ) | 1997 | 7/17/2013 | 4 to 38 Years | ||||||||||||||||||||
| Richardson, TX | (b) | 803 | 2,575 | — | — | 803 | 2,575 | 3,378 | (272 | ) | 1996 | 7/17/2013 | 3 to 40 Years | ||||||||||||||||||||
| Initial Cost to Company | Cost Capitalized Subsequent to Acquisition including impairment | Gross Amount at December 31, | Life in which depreciation in latest Statement of Operations is computed | ||||||||||||||||||||||
| Description | Encumbrances | Land and Improvements | Buildings and Improvements | Improvements/ Land | Improvements/ building | Land and Improvements | Buildings and Improvements | Total | Final Accum | Date of Construction | Date Acquired | ||||||||||||||
| New Castle, PA | (c ) | 494 | 855 | — | — | 494 | 855 | 1,349 | (279 | ) | 1995 | 10/14/10 | 15 to 30 years | |||||||||||||||||||||
| Niagra Falls, NY | (c ) | 289 | 807 | — | — | 289 | 807 | 1,096 | (283 | ) | 1981 | 10/14/10 | 15 to 20 years | |||||||||||||||||||||
| North Bluefield, WV | (c ) | 217 | 492 | — | — | 217 | 492 | 709 | (126 | ) | 1983 | 11/10/08 | 15 to 40 years | |||||||||||||||||||||
| Northport, AL | (c ) | 2,041 | 1,946 | — | — | 2,041 | 1,946 | 3,987 | (886 | ) | 2006 | 04/27/07 | 15 to 40 years | |||||||||||||||||||||
| Oakland, MD | (c ) | 804 | 809 | — | — | 804 | 809 | 1,613 | (332 | ) | 1993 | 11/10/08 | 15 to 40 years | |||||||||||||||||||||
| Ocala, FL | (b) | 2,260 | 4,709 | — | — | 2,260 | 4,709 | 6,969 | (346 | ) | 2006 | 07/17/13 | 8 to 46 Years | |||||||||||||||||||||
| Orchard Park, NY | (c ) | 304 | 1,488 | — | — | 304 | 1,488 | 1,792 | (493 | ) | 1966 | 10/14/10 | 15 to 20 years | |||||||||||||||||||||
| Oriskany, NY | (c ) | 618 | 749 | — | — | 618 | 749 | 1,367 | (272 | ) | 1965 | 07/03/12 | 15 to 20 years | |||||||||||||||||||||
| Parkersburg, WV | 1,793 | 966 | 1,843 | — | — | 966 | 1,843 | 2,809 | (132 | ) | 2005 | 07/17/13 | 7 to 37 Years | |||||||||||||||||||||
| Pataskala, OH | (c ) | 796 | 656 | — | — | 796 | 656 | 1,452 | (272 | ) | 1998 | 11/10/08 | 15 to 20 years | |||||||||||||||||||||
| Patchogue, NY | (c ) | 1,869 | 797 | — | — | 1,869 | 797 | 2,666 | (490 | ) | 1985 | 10/14/10 | 15 to 20 years | |||||||||||||||||||||
| Paw Paw, MI | (c ) | 1,517 | 1,619 | — | — | 1,517 | 1,619 | 3,136 | (151 | ) | 2006 | 07/17/13 | 8 to 33 Years | |||||||||||||||||||||
| Pearisburg, VA | (c ) | 195 | 688 | — | — | 195 | 688 | 883 | (193 | ) | 1985 | 10/14/10 | 15 to 30 years | |||||||||||||||||||||
| Piperton, TN | (c ) | 1,338 | 1,916 | — | — | 1,338 | 1,916 | 3,254 | (603 | ) | 2006 | 04/27/07 | 15 to 40 years | |||||||||||||||||||||
| Plant City, FL | (c ) | 2,192 | 3,280 | — | — | 2,192 | 3,280 | 5,472 | (1,284 | ) | 2004 | 10/14/10 | 15 to 30 years | |||||||||||||||||||||
| Pocahontas, AR | (a) | 361 | 471 | — | — | 361 | 471 | 832 | (30 | ) | 1986 | 03/31/14 | 7 to 20 Years | |||||||||||||||||||||
| Pompano Beach, FL | (a) | 1,144 | 337 | — | — | 1,144 | 337 | 1,481 | (180 | ) | 1990 | 12/30/04 | 15 to 30 years | |||||||||||||||||||||
| Port Richey, FL | (a) | 741 | 660 | — | — | 741 | 660 | 1,401 | (576 | ) | 1975 | 12/30/04 | 10 to 15 years | |||||||||||||||||||||
| Powhatan, VA | (b) | 4,342 | 2,963 | — | — | 4,342 | 2,963 | 7,305 | (523 | ) | 2007 | 07/17/13 | 10 to 31 Years | |||||||||||||||||||||
| Prior Lake, MN | 3,283 | 1,998 | 2,454 | — | — | 1,998 | 2,454 | 4,452 | (207 | ) | 1991 | 07/17/13 | 7 to 26 Years | |||||||||||||||||||||
| Pulaski, VA | (c ) | 882 | 1,040 | — | — | 882 | 1,040 | 1,922 | (324 | ) | 1979 | 07/03/12 | 15 to 30 years | |||||||||||||||||||||
| Raleigh, NC | (c ) | 1,066 | 2,497 | — | — | 1,066 | 2,497 | 3,563 | (794 | ) | 1975 | 10/14/10 | 15 to 30 years | |||||||||||||||||||||
| Ranson, WV | (c ) | 1,020 | 1,955 | — | — | 1,020 | 1,955 | 2,975 | (656 | ) | 2005 | 04/27/07 | 15 to 40 years | |||||||||||||||||||||
| Richland, MS | (c ) | 1,351 | 2,279 | — | — | 1,351 | 2,279 | 3,630 | (646 | ) | 2005 | 04/27/07 | 15 to 40 years | |||||||||||||||||||||
| Richmond, KY | (c ) | 732 | 720 | — | — | 732 | 720 | 1,452 | (263 | ) | 1976 | 11/10/08 | 15 to 30 years | |||||||||||||||||||||
| Richmond, VA | (c ) | 384 | 1,380 | — | — | 384 | 1,380 | 1,764 | (367 | ) | 1977 | 07/03/12 | 15 to 20 years | |||||||||||||||||||||
| Riverhead, NY | (c ) | 1,146 | 1,402 | — | — | 1,146 | 1,402 | 2,548 | (409 | ) | 1984 | 06/02/08 | 15 to 30 years | |||||||||||||||||||||
| Riviera Beach, FL | (a) | 500 | 170 | — | — | 500 | 170 | 670 | (111 | ) | 1987 | 12/30/04 | 15 to 20 years | |||||||||||||||||||||
| Roanoke, VA | (a) | 333 | 124 | — | — | 333 | 124 | 457 | (134 | ) | 1975 | 12/30/04 | 10 to 15 years | |||||||||||||||||||||
| Rockaway, NJ | (c ) | 1,826 | 948 | — | — | 1,826 | 948 | 2,774 | (470 | ) | 1974 | 07/03/12 | 15 to 20 years | |||||||||||||||||||||
| Rockford, MN | 2,228 | 1,298 | 2,652 | — | — | 1,298 | 2,652 | 3,950 | (168 | ) | 2006 | 07/17/13 | 9 to 43 Years | |||||||||||||||||||||
| Rome, NY | (d) | 1,326 | 1,110 | — | — | 1,326 | 1,110 | 2,436 | (108 | ) | 2003 | 07/17/13 | 9 to 34 Years | |||||||||||||||||||||
| Roswell, NM | (a) | 1,002 | 3,177 | — | — | 1,002 | 3,177 | 4,179 | (669 | ) | 2004 | 07/29/04 | 15 to 50 years | |||||||||||||||||||||
| Russellville, KY | (c ) | 293 | 541 | — | — | 293 | 541 | 834 | (199 | ) | 1995 | 11/10/08 | 15 to 30 years | |||||||||||||||||||||
| Salisbury, MD | (b) | 4,210 | 6,613 | — | — | 4,210 | 6,613 | 10,823 | (692 | ) | 2007 | 07/17/13 | 10 to 27 Years | |||||||||||||||||||||
| San Antonio, TX | (c ) | 1,403 | 2,195 | — | — | 1,403 | 2,195 | 3,598 | (755 | ) | 2004 | 04/27/07 | 15 to 40 years | |||||||||||||||||||||
| Sebring, FL | (a) | 318 | 291 | — | — | 318 | 291 | 609 | (154 | ) | 1982 | 12/30/04 | 15 to 20 years | |||||||||||||||||||||
| Richland Hills, TX | (b) | 997 | 2,951 | — | — | 997 | 2,951 | 3,948 | (317 | ) | 1997 | 7/17/2013 | 4 to 40 Years | ||||||||||||||||||||
| Richmond Hills, GA | (c) | 688 | 4,081 | — | — | 688 | 4,081 | 4,769 | (406 | ) | 2009 | 7/17/2013 | 13 to 44 Years | ||||||||||||||||||||
| River Oaks, TX | (b) | 829 | 2,871 | — | — | 829 | 2,871 | 3,700 | (331 | ) | 1996 | 7/17/2013 | 3 to 40 Years | ||||||||||||||||||||
| Rome, NY | (c) | 1,135 | 3,104 | — | — | 1,135 | 3,104 | 4,239 | (321 | ) | 2007 | 7/17/2013 | 13 to 43 Years | ||||||||||||||||||||
| Saco, ME | (c) | 898 | 1,702 | — | — | 898 | 1,702 | 2,600 | (297 | ) | 1997 | 7/17/2013 | 3 to 29 Years | ||||||||||||||||||||
| Saginaw, MI | (a) | 1,064 | 3,906 | — | — | 1,064 | 3,906 | 4,970 | (407 | ) | 2000 | 7/17/2013 | 7 to 41 Years | ||||||||||||||||||||
| San Antonio, TX | (c) | 841 | 3,909 | — | — | 841 | 3,909 | 4,750 | (382 | ) | 2004 | 7/17/2013 | 14 to 40 Years | ||||||||||||||||||||
| Seattle, WA | (b) | 2,589 | 4,245 | — | — | 2,589 | 4,245 | 6,834 | (432 | ) | 2002 | 7/17/2013 | 9 to 43 Years | ||||||||||||||||||||
| Shreveport, LA | (c) | 1,461 | 3,605 | — | — | 1,461 | 3,605 | 5,066 | (400 | ) | 1999 | 7/17/2013 | 6 to 40 Years | ||||||||||||||||||||
| Spartanburg, SC | (b) | 1,196 | 1,671 | — | — | 1,196 | 1,671 | 2,867 | (232 | ) | 1999 | 7/17/2013 | 5 to 34 Years | ||||||||||||||||||||
| St. Augustine, FL | (c) | 1,048 | 2,905 | — | — | 1,048 | 2,905 | 3,953 | (317 | ) | 2008 | 7/17/2013 | 11 to 42 Years | ||||||||||||||||||||
| St. Clair Shores, MI | (a) | 1,169 | 761 | — | — | 1,169 | 761 | 1,930 | (288 | ) | 1991 | 5/2/2005 | 15 to 30 Years | ||||||||||||||||||||
| The Colony, TX | (c) | 1,028 | 1,769 | — | — | 1,028 | 1,769 | 2,797 | (202 | ) | 1996 | 7/17/2013 | 1 to 40 Years | ||||||||||||||||||||
| Topeka, KS | (c) | 912 | 2,681 | — | — | 912 | 2,681 | 3,593 | (327 | ) | 1999 | 7/17/2013 | 6 to 38 Years | ||||||||||||||||||||
| Tulsa, OK | (c) | 741 | 3,179 | — | — | 741 | 3,179 | 3,920 | (339 | ) | 1994 | 7/17/2013 | 1 to 35 Years | ||||||||||||||||||||
| Uhrichsville, OH | (a) | 617 | 2,345 | — | — | 617 | 2,345 | 2,962 | (618 | ) | 2000 | 7/1/2005 | 19 to 40 Years | ||||||||||||||||||||
| Waco, TX | (c) | 858 | 3,455 | — | — | 858 | 3,455 | 4,313 | (401 | ) | 1998 | 7/17/2013 | 5 to 35 Years | ||||||||||||||||||||
| Wauseon, OH | (c) | 1,000 | 2,034 | — | — | 1,000 | 2,034 | 3,034 | (280 | ) | 2005 | 7/17/2013 | 12 to 37 Years | ||||||||||||||||||||
| Waynesville, NC | (c) | 1,495 | 2,365 | — | — | 1,495 | 2,365 | 3,860 | (269 | ) | 2005 | 7/17/2013 | 12 to 42 Years | ||||||||||||||||||||
| Wichita Falls, TX | (c) | 503 | 2,530 | — | — | 503 | 2,530 | 3,033 | (284 | ) | 1995 | 7/17/2013 | 2 to 40 Years | ||||||||||||||||||||
| Wichita Falls, TX | (c) | 528 | 2,022 | — | — | 528 | 2,022 | 2,550 | (219 | ) | 1995 | 7/17/2013 | 1 to 40 Years | ||||||||||||||||||||
| Medical / Other Office | |||||||||||||||||||||||||||||||||
| Anderson, IN | (a) | 411 | 1,673 | — | — | 411 | 1,673 | 2,084 | (133 | ) | 1981 | 03/31/14 | 15 to 40 Years | ||||||||||||||||||||
| Bath, NY | (c) | 72 | 707 | — | — | 72 | 707 | 779 | (45 | ) | 1970 | 04/30/15 | 15 to 30 Years | ||||||||||||||||||||
| Beaumont, TX | (a) | 438 | 1,976 | — | — | 438 | 1,976 | 2,414 | (222 | ) | 1985 | 03/31/14 | 15 to 30 Years | ||||||||||||||||||||
| Beavercreek, OH | (c) | 559 | 1,420 | — | — | 559 | 1,420 | 1,979 | (152 | ) | 1985 | 08/18/14 | 7 to 40 Years | ||||||||||||||||||||
| Belleville, IL | (a) | 140 | 431 | — | — | 140 | 431 | 571 | (67 | ) | 1979 | 03/31/14 | 15 to 20 Years | ||||||||||||||||||||
| Bellevue, NE | (a) | 560 | 446 | — | — | 560 | 446 | 1,006 | (35 | ) | 2008 | 08/07/15 | 5 to 40 Years | ||||||||||||||||||||
| Binghamton, NY | (c) | 328 | 2,214 | — | — | 328 | 2,214 | 2,542 | (133 | ) | 1985 | 04/30/15 | 15 to 30 Years | ||||||||||||||||||||
| Bonita Springs, FL | (a) | 317 | 1,619 | — | — | 317 | 1,619 | 1,936 | (217 | ) | 2003 | 08/30/12 | 15 to 50 Years | ||||||||||||||||||||
| Bonita Springs, FL | (a) | 738 | 4,022 | — | — | 738 | 4,022 | 4,760 | (520 | ) | 2006 | 08/30/12 | 15 to 50 Years | ||||||||||||||||||||
| Bonita Springs, FL | (a) | 376 | 940 | — | — | 376 | 940 | 1,316 | (147 | ) | 2006 | 08/30/12 | 15 to 50 Years | ||||||||||||||||||||
| Brandon, FL | (a) | 110 | 671 | — | — | 110 | 671 | 781 | (63 | ) | 1999 | 03/31/14 | 15 to 30 Years | ||||||||||||||||||||
| Initial Cost to Company | Cost Capitalized Subsequent to Acquisition including impairment | Gross Amount at December 31, | Life in which depreciation in latest Statement of Operations is computed | ||||||||||||||||||||||
| Description | Encumbrances | Land and Improvements | Buildings and Improvements | Improvements/ Land | Improvements/ building | Land and Improvements | Buildings and Improvements | Total | Final Accum | Date of Construction | Date Acquired | ||||||||||||||
| Selbyville, DE | (c ) | 919 | 1,434 | — | — | 919 | 1,434 | 2,353 | (538 | ) | 1970 | 10/14/10 | 15 to 20 years | |||||||||||||||||||||
| Seymour, IN | (c ) | 506 | 494 | — | — | 506 | 494 | 1,000 | (249 | ) | 1995 | 10/14/10 | 15 to 30 years | |||||||||||||||||||||
| Shallotte, NC | (c ) | 705 | 1,794 | — | — | 705 | 1,794 | 2,499 | (137 | ) | 2006 | 07/17/13 | 10 to 30 Years | |||||||||||||||||||||
| Somerset, KY | (c ) | 731 | 802 | — | — | 731 | 802 | 1,533 | (246 | ) | 1998 | 11/10/08 | 15 to 40 years | |||||||||||||||||||||
| Somerset, PA | (c ) | 257 | 604 | — | — | 257 | 604 | 861 | (190 | ) | 1979 | 11/10/08 | 15 to 30 years | |||||||||||||||||||||
| Spokane, WA | (a) | 518 | 193 | — | — | 518 | 193 | 711 | (132 | ) | 1998 | 12/30/04 | 15 to 30 years | |||||||||||||||||||||
| Statesville, NC | (a) | 614 | 355 | — | — | 614 | 355 | 969 | (328 | ) | 1976 | 12/30/04 | 10 to 15 years | |||||||||||||||||||||
| Tonawanda, NY | (c ) | 168 | 1,104 | — | — | 168 | 1,104 | 1,272 | (352 | ) | 1968 | 10/14/10 | 15 to 20 years | |||||||||||||||||||||
| Tontitown, AR | (a) | 230 | 92 | — | — | 230 | 92 | 322 | (65 | ) | 1987 | 12/30/04 | 15 to 20 years | |||||||||||||||||||||
| Troutville, VA | (c ) | 542 | 802 | — | — | 542 | 802 | 1,344 | (188 | ) | 1979 | 11/10/08 | 15 to 40 years | |||||||||||||||||||||
| Versailles, KY | (c ) | 825 | 1,059 | — | — | 825 | 1,059 | 1,884 | (418 | ) | 1978 | 10/14/10 | 15 to 30 years | |||||||||||||||||||||
| Watertown, NY | (c ) | 435 | 833 | — | — | 435 | 833 | 1,268 | (243 | ) | 1997 | 07/03/12 | 15 to 30 years | |||||||||||||||||||||
| Waynesboro, PA | (c ) | 248 | 801 | — | — | 248 | 801 | 1,049 | (223 | ) | 1996 | 11/10/08 | 15 to 30 years | |||||||||||||||||||||
| West Columbia, SC | (a) | 324 | 108 | — | — | 324 | 108 | 432 | (63 | ) | 1989 | 12/30/04 | 15 to 20 years | |||||||||||||||||||||
| West Columbia, SC | (a) | 262 | 598 | — | — | 262 | 598 | 860 | (278 | ) | 1984 | 12/30/04 | 10 to 20 years | |||||||||||||||||||||
| West Springfield, MA | (c ) | 1,443 | 1,467 | — | — | 1,443 | 1,467 | 2,910 | (825 | ) | 1983 | 10/14/10 | 10 to 17 years | |||||||||||||||||||||
| Wilmington, NC | (a) | 370 | 122 | — | — | 370 | 122 | 492 | (78 | ) | 1987 | 12/30/04 | 15 to 20 years | |||||||||||||||||||||
| Winchester, KY | (c ) | 720 | 646 | — | — | 720 | 646 | 1,366 | (248 | ) | 1983 | 11/10/08 | 15 to 30 years | |||||||||||||||||||||
| York, PA | (c ) | 1,213 | 670 | — | — | 1,213 | 670 | 1,883 | (370 | ) | 1970 | 07/03/12 | 10 to 15 years | |||||||||||||||||||||
| Yuma, AZ | (c ) | 1,623 | 2,721 | — | — | 1,623 | 2,721 | 4,344 | (772 | ) | 2006 | 04/27/07 | 15 to 40 years | |||||||||||||||||||||
| Brandon, MS | (a) | 200 | 281 | — | — | 200 | 281 | 481 | (42 | ) | 1986 | 03/31/14 | 15 to 30 Years | ||||||||||||||||||||
| Bullhead City, AZ | (a) | 147 | 489 | — | — | 147 | 489 | 636 | (49 | ) | 1970 | 09/30/13 | 15 to 50 Years | ||||||||||||||||||||
| Bullhead City, AZ | (a) | 57 | 946 | — | — | 57 | 946 | 1,003 | (69 | ) | 2005 | 04/08/14 | 15 to 40 Years | ||||||||||||||||||||
| Camp Hill, PA | (a) | 180 | 581 | — | — | 180 | 581 | 761 | (62 | ) | 1991 | 03/31/14 | 15 to 30 Years | ||||||||||||||||||||
| Camp Hill, PA | (a) | 140 | 641 | — | — | 140 | 641 | 781 | (66 | ) | 1990 | 03/31/14 | 15 to 30 Years | ||||||||||||||||||||
| Cape Coral, FL | (a) | 545 | 1,716 | — | — | 545 | 1,716 | 2,261 | (273 | ) | 2011 | 08/30/12 | 15 to 50 Years | ||||||||||||||||||||
| Cherry Hill, NJ | (c) | 4,078 | 6,076 | — | — | 4,078 | 6,076 | 10,154 | (29 | ) | 1998 | 11/23/16 | 13 to 30 Years | ||||||||||||||||||||
| Chicago, IL | (a) | 186 | 1,780 | — | — | 186 | 1,780 | 1,966 | (115 | ) | 2007 | 09/30/13 | 50 to 50 Years | ||||||||||||||||||||
| Clarksville, TN | (a) | 281 | 531 | — | — | 281 | 531 | 812 | (56 | ) | 1997 | 03/31/14 | 15 to 30 Years | ||||||||||||||||||||
| Clarksville, TN | (a) | 978 | 2,718 | — | — | 978 | 2,718 | 3,696 | (177 | ) | 2011 | 12/04/14 | 15 to 40 Years | ||||||||||||||||||||
| Clayton, GA | (a) | 70 | 311 | — | — | 70 | 311 | 381 | (36 | ) | 1963 | 03/31/14 | 15 to 30 Years | ||||||||||||||||||||
| Columbia, MO | (a) | 1,012 | 7,054 | — | — | 1,012 | 7,054 | 8,066 | (531 | ) | 2004 | 03/31/14 | 15 to 40 Years | ||||||||||||||||||||
| Columbia, SC | (b) | 3,378 | 35,153 | — | — | 3,378 | 35,153 | 38,531 | (2,780 | ) | 2003 | 12/31/13 | 15 to 40 Years | ||||||||||||||||||||
| Columbus, GA | (a) | 190 | 531 | — | — | 190 | 531 | 721 | (65 | ) | 1993 | 03/31/14 | 15 to 30 Years | ||||||||||||||||||||
| Corning, NY | (c) | 123 | 1,261 | — | — | 123 | 1,261 | 1,384 | (78 | ) | 1999 | 04/30/15 | 15 to 30 Years | ||||||||||||||||||||
| Crystal Lake, IL | (a) | 200 | 631 | — | — | 200 | 631 | 831 | (71 | ) | 2001 | 03/31/14 | 15 to 30 Years | ||||||||||||||||||||
| Dallas, TX | (a) | 1,633 | 21,835 | — | 2,019 | 1,633 | 23,854 | 25,487 | (5,087 | ) | 2005 | 08/29/05 | 15 to 50 Years | ||||||||||||||||||||
| Dallas, TX | (a) | 1,915 | 9,150 | — | — | 1,915 | 9,150 | 11,065 | (1,393 | ) | 2006 | 03/28/13 | 11 to 50 Years | ||||||||||||||||||||
| Debary, FL | (a) | 100 | 641 | — | — | 100 | 641 | 741 | (66 | ) | 1989 | 03/31/14 | 15 to 30 Years | ||||||||||||||||||||
| Defiance, OH | (a) | 130 | 491 | — | — | 130 | 491 | 621 | (56 | ) | 1959 | 03/31/14 | 15 to 30 Years | ||||||||||||||||||||
| Devine, TX | (a) | 240 | 481 | — | — | 240 | 481 | 721 | (61 | ) | 2002 | 03/31/14 | 15 to 30 Years | ||||||||||||||||||||
| Dothan, AL | (c) | 695 | 1,707 | — | — | 695 | 1,707 | 2,402 | — | 2012 | 12/21/16 | 1 to 40 Years | |||||||||||||||||||||
| Dunwoody, GA | (c) | 1,061 | 4,556 | — | 22 | 1,061 | 4,578 | 5,639 | (37 | ) | 1988 | 10/27/16 | 2 to 40 Years | ||||||||||||||||||||
| East Alton, IL | (a) | 170 | 80 | — | — | 170 | 80 | 250 | (20 | ) | 1960 | 03/31/14 | 15 to 20 Years | ||||||||||||||||||||
| Eastman, GA | (a) | 130 | 551 | — | — | 130 | 551 | 681 | (65 | ) | 1988 | 03/31/14 | 15 to 30 Years | ||||||||||||||||||||
| El Paso, TX | (a) | 890 | 3,555 | — | — | 890 | 3,555 | 4,445 | (55 | ) | 2015 | 06/20/16 | 11 to 50 Years | ||||||||||||||||||||
| Elizabethton, TN | (c) | 482 | 1,139 | — | — | 482 | 1,139 | 1,621 | (138 | ) | 2008 | 08/18/14 | 6 to 30 Years | ||||||||||||||||||||
| Elkhart, IN | (a) | 90 | 341 | — | — | 90 | 341 | 431 | (35 | ) | 1969 | 03/31/14 | 15 to 30 Years | ||||||||||||||||||||
| Elmira, NY | (c) | 185 | 3,902 | — | — | 185 | 3,902 | 4,087 | (230 | ) | 1985 | 04/30/15 | 15 to 30 Years | ||||||||||||||||||||
| Endicott, NY | (c) | 92 | 348 | — | — | 92 | 348 | 440 | (27 | ) | 2001 | 04/30/15 | 15 to 30 Years | ||||||||||||||||||||
| Evansville, IN | (a) | 130 | 391 | — | — | 130 | 391 | 521 | (45 | ) | 1986 | 03/31/14 | 15 to 30 Years | ||||||||||||||||||||
| Fairlea, WV | (c) | 298 | 1,280 | — | — | 298 | 1,280 | 1,578 | (138 | ) | 2009 | 08/18/14 | 10 to 40 Years | ||||||||||||||||||||
| Franklin, TX | (c) | 159 | 1,124 | — | 29 | 159 | 1,153 | 1,312 | (110 | ) | 2012 | 08/18/14 | 4 to 40 Years | ||||||||||||||||||||
| Ft. Myers, FL | (a) | 903 | 6,445 | — | — | 903 | 6,445 | 7,348 | (799 | ) | 1989 | 08/30/12 | 15 to 50 Years | ||||||||||||||||||||
| Ft. Wayne, IN | (a) | 150 | 1,022 | — | — | 150 | 1,022 | 1,172 | (81 | ) | 1965 | 03/31/14 | 15 to 40 Years | ||||||||||||||||||||
| Gahanna, OH | (a) | 411 | 982 | — | — | 411 | 982 | 1,393 | (112 | ) | 1998 | 03/31/14 | 15 to 40 Years | ||||||||||||||||||||
| Gainesville, FL | (a) | 180 | 711 | — | — | 180 | 711 | 891 | (69 | ) | 1941 | 03/31/14 | 15 to 30 Years | ||||||||||||||||||||
| Garland, TX | (c) | 1,256 | 4,516 | — | — | 1,256 | 4,516 | 5,772 | (87 | ) | 2016 | 03/30/16 | 50 to 50 Years | ||||||||||||||||||||
| Movie Theatres | |||||||||||||||||||||||||||||||||
| Anderson, SC | (b) | 5,248 | 6,437 | — | — | 5,248 | 6,437 | 11,685 | (87 | ) | 2000 | 09/25/14 | 15 to 30 Years | ||||||||||||||||||||
| Arnold, MO | (a) | 3,275 | 3,014 | — | — | 3,275 | 3,014 | 6,289 | (392 | ) | 1998 | 07/17/13 | 5 to 21 Years | ||||||||||||||||||||
| Batavia, IL | (a) | 4,705 | 7,561 | — | — | 4,705 | 7,561 | 12,266 | (2,077 | ) | 1995 | 02/24/06 | 13 to 38 years | ||||||||||||||||||||
| Bixby, OK | (a) | 5,585 | 10,101 | — | — | 5,585 | 10,101 | 15,686 | (3,449 | ) | 1998 | 11/30/04 | 15 to 30 years | ||||||||||||||||||||
| Carrollton, GA | (b) | 1,879 | 5,868 | — | — | 1,879 | 5,868 | 7,747 | — | 2005 | 12/30/14 | 15 to 40 Years | |||||||||||||||||||||
| Cedar Rapids, IA | (a) | 2,521 | 5,461 | — | — | 2,521 | 5,461 | 7,982 | (1,415 | ) | 1998 | 09/30/04 | 15 to 40 years | ||||||||||||||||||||
| Chubbock, ID | (b) | 1,845 | 2,691 | — | — | 1,845 | 2,691 | 4,536 | (1 | ) | 2004 | 12/23/14 | 10 to 30 Years | ||||||||||||||||||||
| Colorado Springs, CO | (a) | 1,892 | 1,732 | — | — | 1,892 | 1,732 | 3,624 | (738 | ) | 1995 | 09/30/05 | 15 to 30 years | ||||||||||||||||||||
| Columbia, SC | (a) | 2,115 | 2,091 | — | — | 2,115 | 2,091 | 4,206 | (679 | ) | 1996 | 09/30/05 | 15 to 30 years | ||||||||||||||||||||
| Covina, CA | (b) | 5,566 | 26,922 | — | — | 5,566 | 26,922 | 32,488 | (5,390 | ) | 1997 | 06/23/04 | 14 to 40 years | ||||||||||||||||||||
| Danville, VA | (b) | 1,349 | 6,406 | — | — | 1,349 | 6,406 | 7,755 | — | 2002 | 12/30/14 | 15 to 40 Years | |||||||||||||||||||||
| Dawsonville, GA | (b) | 1,859 | 4,207 | — | — | 1,859 | 4,207 | 6,066 | — | 2005 | 12/30/14 | 15 to 40 Years | |||||||||||||||||||||
| Dickson City, PA | (a) | 4,198 | 5,269 | — | — | 4,198 | 5,269 | 9,467 | (89 | ) | 2010 | 09/29/14 | 13 to 30 Years | ||||||||||||||||||||
| Durham, NC | (a) | 1,630 | 2,685 | — | — | 1,630 | 2,685 | 4,315 | (1,051 | ) | 1994 | 09/30/05 | 14 to 30 years | ||||||||||||||||||||
| Fenton, MO | (a) | 2,792 | 5,982 | — | — | 2,792 | 5,982 | 8,774 | (67 | ) | 2008 | 09/29/14 | 13 to 40 Years | ||||||||||||||||||||
| Initial Cost to Company | Cost Capitalized Subsequent to Acquisition including impairment | Gross Amount at December 31, | Life in which depreciation in latest Statement of Operations is computed | ||||||||||||||||||||||
| Description | Encumbrances | Land and Improvements | Buildings and Improvements | Improvements/ Land | Improvements/ building | Land and Improvements | Buildings and Improvements | Total | Final Accum | Date of Construction | Date Acquired | ||||||||||||||
| Fort Wayne, IN | (a) | 2,696 | 9,849 | 682 | — | 3,378 | 9,849 | 13,227 | (2,503 | ) | 2005 | 06/30/04 | 15 to 40 years | ||||||||||||||||||||
| Gainesville, GA | (b) | 2,278 | 8,684 | — | — | 2,278 | 8,684 | 10,962 | — | 1996 | 12/30/14 | 15 to 40 Years | |||||||||||||||||||||
| Goodyear, AZ | (a) | 3,881 | 4,392 | — | — | 3,881 | 4,392 | 8,273 | (1,163 | ) | 1998 | 12/15/05 | 12 to 37 years | ||||||||||||||||||||
| Greensboro, NC | (a) | 2,359 | 2,431 | — | — | 2,359 | 2,431 | 4,790 | (818 | ) | 1996 | 09/30/05 | 15 to 30 years | ||||||||||||||||||||
| Griffin, GA | (b) | 1,239 | 3,188 | — | — | 1,239 | 3,188 | 4,427 | — | 2005 | 12/30/14 | 15 to 30 Years | |||||||||||||||||||||
| Hinesville, GA | (b) | 2,049 | 5,216 | — | — | 2,049 | 5,216 | 7,265 | — | 2001 | 12/30/14 | 15 to 40 Years | |||||||||||||||||||||
| Johnston, IA | (c ) | 3,046 | 10,213 | — | — | 3,046 | 10,213 | 13,259 | (2,979 | ) | 1998 | 06/23/04 | 15 to 30 Years | ||||||||||||||||||||
| Kansas City, MO | (a) | 2,543 | 7,943 | — | — | 2,543 | 7,943 | 10,486 | (1,710 | ) | 2003 | 07/29/04 | 15 to 50 years | ||||||||||||||||||||
| Lebanon, PA | (a) | 747 | 4,295 | — | — | 747 | 4,295 | 5,042 | (42 | ) | 2005 | 09/29/14 | 13 to 30 Years | ||||||||||||||||||||
| Lees Summit, MO | (a) | 3,517 | 9,735 | — | — | 3,517 | 9,735 | 13,252 | (2,511 | ) | 1999 | 07/29/04 | 15 to 40 years | ||||||||||||||||||||
| Longview, TX | (a) | 1,432 | 2,946 | — | — | 1,432 | 2,946 | 4,378 | (983 | ) | 1995 | 09/30/05 | 15 to 30 years | ||||||||||||||||||||
| Martinsburg, WV | (a) | 2,450 | 3,528 | — | — | 2,450 | 3,528 | 5,978 | (1,277 | ) | 1998 | 09/30/05 | 13 to 30 years | ||||||||||||||||||||
| Massillon, OH | (a) | 1,767 | 2,667 | — | — | 1,767 | 2,667 | 4,434 | (41 | ) | 2005 | 09/29/14 | 13 to 30 Years | ||||||||||||||||||||
| Missoula, MT | (a) | 2,333 | 3,406 | — | — | 2,333 | 3,406 | 5,739 | (933 | ) | 1998 | 06/23/04 | 15 to 40 years | ||||||||||||||||||||
| Mooresville, NC | (b) | 5,087 | 6,800 | — | — | 5,087 | 6,800 | 11,887 | (71 | ) | 1999 | 09/25/14 | 15 to 30 Years | ||||||||||||||||||||
| Nitro, WV | (a) | 1,816 | 3,068 | — | — | 1,816 | 3,068 | 4,884 | (46 | ) | 2005 | 09/29/14 | 13 to 30 Years | ||||||||||||||||||||
| Noblesville, IN | (a) | 1,760 | — | 2,338 | 10,172 | 4,098 | 10,171 | 14,269 | (2,601 | ) | 2008 | 01/05/07 | 14 to 39 years | ||||||||||||||||||||
| Overland Park, KS | (a) | 4,935 | 12,281 | — | — | 4,935 | 12,281 | 17,216 | (2,303 | ) | 2004 | 12/15/05 | 12 to 57 years | ||||||||||||||||||||
| Phoenix, AZ | (a) | 2,652 | 11,495 | — | — | 2,652 | 11,495 | 14,147 | (2,300 | ) | 1997 | 05/17/04 | 13 to 40 years | ||||||||||||||||||||
| Portage, IN | (a) | 4,621 | 8,300 | — | — | 4,621 | 8,300 | 12,921 | (2,519 | ) | 2007 | 12/02/05 | 13 to 38 years | ||||||||||||||||||||
| Raleigh, NC | (a) | 3,636 | 8,833 | — | — | 3,636 | 8,833 | 12,469 | (2,700 | ) | 1988 | 06/23/04 | 12 to 27 years | ||||||||||||||||||||
| Saginaw, MI | (a) | 2,538 | — | — | 8,358 | 2,538 | 8,358 | 10,896 | (256 | ) | 2013 | 12/02/13 | 15 to 15 Years | ||||||||||||||||||||
| Simpsonville, SC | (a) | 1,862 | 5,453 | — | — | 1,862 | 5,453 | 7,315 | (62 | ) | 2010 | 09/29/14 | 13 to 40 Years | ||||||||||||||||||||
| Valdosta, GA | (b) | 3,038 | 13,801 | — | — | 3,038 | 13,801 | 16,839 | — | 2001 | 12/30/14 | 15 to 40 Years | |||||||||||||||||||||
| Warner Robins, GA | (b) | 2,598 | 8,324 | — | — | 2,598 | 8,324 | 10,922 | — | 2010 | 12/30/14 | 15 to 40 Years | |||||||||||||||||||||
| Wilmington, NC | (a) | 1,552 | 2,934 | — | — | 1,552 | 2,934 | 4,486 | (944 | ) | 1997 | 09/30/05 | 15 to 30 years | ||||||||||||||||||||
| Winston-Salem, NC | (a) | 1,567 | 2,140 | — | — | 1,567 | 2,140 | 3,707 | (843 | ) | 1993 | 10/28/05 | 13 to 30 years | ||||||||||||||||||||
| Woodstock, GA | (b) | 2,798 | 5,057 | — | — | 2,798 | 5,057 | 7,855 | — | 1997 | 12/30/14 | 15 to 30 Years | |||||||||||||||||||||
| Yukon, OK | (c ) | 1,082 | 3,538 | — | — | 1,082 | 3,538 | 4,620 | (215 | ) | 2007 | 07/17/13 | 8 to 33 Years | ||||||||||||||||||||
| Germantown, TN | (a) | 91 | 171 | — | — | 91 | 171 | 262 | (14 | ) | 1984 | 04/08/14 | 15 to 40 Years | ||||||||||||||||||||
| Glendale, AZ | (a) | 371 | 491 | — | — | 371 | 491 | 862 | (52 | ) | 1988 | 03/31/14 | 15 to 30 Years | ||||||||||||||||||||
| Grayson, KY | (c) | 658 | 3,171 | — | — | 658 | 3,171 | 3,829 | (279 | ) | 2013 | 08/18/14 | 9 to 40 Years | ||||||||||||||||||||
| Harlingen, TX | (c) | 1,734 | 520 | — | — | 1,734 | 520 | 2,254 | — | 2016 | 12/01/16 | 20 to 40 Years | |||||||||||||||||||||
| Hartsville, SC | (a) | 90 | 180 | — | — | 90 | 180 | 270 | (18 | ) | 1973 | 03/31/14 | 15 to 40 Years | ||||||||||||||||||||
| Jacksonville, FL | (a) | 57 | 365 | — | — | 57 | 365 | 422 | (36 | ) | 1986 | 04/08/14 | 15 to 30 Years | ||||||||||||||||||||
| Jacksonville, FL | (c) | 815 | 1,606 | — | — | 815 | 1,606 | 2,421 | (169 | ) | 1977 | 08/18/14 | 6 to 30 Years | ||||||||||||||||||||
| Kennewick, WA | (c) | 353 | 4,248 | — | — | 353 | 4,248 | 4,601 | (104 | ) | 2011 | 03/31/16 | 13 to 40 Years | ||||||||||||||||||||
| Largo, FL | (a) | 150 | 311 | — | — | 150 | 311 | 461 | (32 | ) | 1962 | 03/31/14 | 15 to 30 Years | ||||||||||||||||||||
| Las Cruces, NM | (c) | 808 | 6,045 | — | — | 808 | 6,045 | 6,853 | (702 | ) | 2008 | 07/17/13 | 4 to 52 Years | ||||||||||||||||||||
| Las Vegas, NV | (a) | 430 | 3,589 | — | — | 430 | 3,589 | 4,019 | (265 | ) | 2002 | 09/30/13 | 15 to 50 Years | ||||||||||||||||||||
| Lewisville, TX | (a) | 1,766 | 8,087 | — | — | 1,766 | 8,087 | 9,853 | (669 | ) | 2002 | 03/31/14 | 8 to 40 Years | ||||||||||||||||||||
| Lincoln, NE | (a) | 711 | 825 | — | — | 711 | 825 | 1,536 | (52 | ) | 2010 | 08/07/15 | 8 to 40 Years | ||||||||||||||||||||
| Litchfield, IL | (a) | 210 | 311 | — | — | 210 | 311 | 521 | (54 | ) | 1962 | 03/31/14 | 15 to 20 Years | ||||||||||||||||||||
| Litchfield, IL | (a) | 110 | 120 | — | — | 110 | 120 | 230 | (18 | ) | 1962 | 03/31/14 | 15 to 20 Years | ||||||||||||||||||||
| Livingston, TX | (c) | 1,505 | 7,616 | — | 32 | 1,505 | 7,648 | 9,153 | (164 | ) | 2014 | 03/30/16 | 40 to 40 Years | ||||||||||||||||||||
| Logansport, IN | (a) | 30 | 421 | — | — | 30 | 421 | 451 | (40 | ) | 1920 | 03/31/14 | 15 to 30 Years | ||||||||||||||||||||
| Longview, TX | (a) | 200 | 601 | — | — | 200 | 601 | 801 | (72 | ) | 2003 | 03/31/14 | 15 to 30 Years | ||||||||||||||||||||
| Marion, IN | (a) | 140 | 321 | — | — | 140 | 321 | 461 | (42 | ) | 1988 | 03/31/14 | 15 to 30 Years | ||||||||||||||||||||
| Marion, IN | (a) | 130 | 421 | — | — | 130 | 421 | 551 | (51 | ) | 1974 | 03/31/14 | 15 to 30 Years | ||||||||||||||||||||
| Maryville, IL | (a) | 301 | 401 | — | — | 301 | 401 | 702 | (51 | ) | 1995 | 03/31/14 | 15 to 30 Years | ||||||||||||||||||||
| Mechanicsburg, PA | (a) | 230 | 1,032 | 152 | — | 382 | 1,032 | 1,414 | (107 | ) | 1990 | 03/31/14 | 15 to 30 Years | ||||||||||||||||||||
| Melbourne, FL | (a) | 321 | 651 | — | — | 321 | 651 | 972 | (65 | ) | 1987 | 03/31/14 | 15 to 30 Years | ||||||||||||||||||||
| Memphis, TN | (a) | 91 | 490 | — | — | 91 | 490 | 581 | (49 | ) | 1987 | 04/08/14 | 15 to 30 Years | ||||||||||||||||||||
| Mesa, AZ | (a) | 372 | 1,398 | — | — | 372 | 1,398 | 1,770 | (110 | ) | 2003 | 09/30/13 | 15 to 50 Years | ||||||||||||||||||||
| Middleburg, FL | (c) | 521 | 2,589 | — | 65 | 521 | 2,654 | 3,175 | (277 | ) | 1988 | 08/18/14 | 7 to 30 Years | ||||||||||||||||||||
| Midland, TX | (a) | 3,074 | 2,033 | — | — | 3,074 | 2,033 | 5,107 | (42 | ) | 2015 | 06/20/16 | 11 to 50 Years | ||||||||||||||||||||
| Monroe, GA | (a) | 110 | 631 | — | — | 110 | 631 | 741 | (69 | ) | 2001 | 03/31/14 | 15 to 30 Years | ||||||||||||||||||||
| Monroe, MI | (c) | 728 | 3,440 | — | — | 728 | 3,440 | 4,168 | (404 | ) | 2002 | 08/18/14 | 9 to 30 Years | ||||||||||||||||||||
| Naples, FL | (a) | 1,351 | 5,368 | — | — | 1,351 | 5,368 | 6,719 | (663 | ) | 2002 | 08/30/12 | 15 to 50 Years | ||||||||||||||||||||
| Naples, FL | (a) | 1,829 | 4,522 | — | — | 1,829 | 4,522 | 6,351 | (668 | ) | 1978 | 08/30/12 | 15 to 40 Years | ||||||||||||||||||||
| Naples, FL | (a) | 1,057 | 3,845 | — | — | 1,057 | 3,845 | 4,902 | (489 | ) | 2012 | 10/31/12 | 15 to 50 Years | ||||||||||||||||||||
| New Port Richey, FL | (a) | 274 | 1,162 | — | — | 274 | 1,162 | 1,436 | (117 | ) | 2004 | 04/08/14 | 15 to 30 Years | ||||||||||||||||||||
| New Port Richey, FL | (a) | 456 | 1,151 | — | — | 456 | 1,151 | 1,607 | (131 | ) | 2004 | 04/08/14 | 15 to 30 Years | ||||||||||||||||||||
| North Myrtle Beach, SC | (a) | 581 | 601 | — | — | 581 | 601 | 1,182 | (84 | ) | 2004 | 03/31/14 | 15 to 30 Years | ||||||||||||||||||||
| Ocala, FL | (a) | 23 | 547 | — | — | 23 | 547 | 570 | (50 | ) | 1984 | 04/08/14 | 30 to 30 Years | ||||||||||||||||||||
| Oelwein, IA | (c) | 226 | 681 | — | — | 226 | 681 | 907 | (82 | ) | 1995 | 08/18/14 | 5 to 30 Years | ||||||||||||||||||||
| Medical/Other Office | ||||||||||||||||||||||||||||||||||
| Anderson, IN | (a) | 411 | 1,673 | — | — | 411 | 1,673 | 2,084 | (36 | ) | 1981 | 03/31/14 | 15 to 40 Years | |||||||||||||||||||||
| Beaumont, TX | (a) | 438 | 1,976 | — | — | 438 | 1,976 | 2,414 | (61 | ) | 1985 | 03/31/14 | 15 to 30 Years | |||||||||||||||||||||
| Beavercreek, OH | (b) | 559 | 1,420 | — | — | 559 | 1,420 | 1,979 | (23 | ) | 2006 | 08/18/14 | 7 to 40 Years | |||||||||||||||||||||
| Belleville, IL | (a) | 140 | 431 | — | — | 140 | 431 | 571 | (18 | ) | 1979 | 03/31/14 | 15 to 20 Years | |||||||||||||||||||||
| Bonita Springs, FL | (a) | 317 | 1,619 | — | — | 317 | 1,619 | 1,936 | (115 | ) | 2003 | 08/30/12 | 15 to 50 years | |||||||||||||||||||||
| Initial Cost to Company | Cost Capitalized Subsequent to Acquisition including impairment | Gross Amount at December 31, | Life in which depreciation in latest Statement of Operations is computed | ||||||||||||||||||||||
| Description | Encumbrances | Land and Improvements | Buildings and Improvements | Improvements/ Land | Improvements/ building | Land and Improvements | Buildings and Improvements | Total | Final Accum | Date of Construction | Date Acquired | ||||||||||||||
| Bonita Springs, FL | (a) | 738 | 4,022 | — | — | 738 | 4,022 | 4,760 | (277 | ) | 2006 | 08/30/12 | 15 to 50 years | |||||||||||||||||||||
| Bonita Springs, FL | (a) | 376 | 940 | — | — | 376 | 940 | 1,316 | (78 | ) | 2006 | 08/30/12 | 15 to 50 years | |||||||||||||||||||||
| Brandon, FL | (a) | 110 | 671 | — | — | 110 | 671 | 781 | (17 | ) | 1999 | 03/31/14 | 15 to 30 Years | |||||||||||||||||||||
| Brandon, MS | (a) | 200 | 281 | — | — | 200 | 281 | 481 | (12 | ) | 1986 | 03/31/14 | 15 to 30 Years | |||||||||||||||||||||
| Bullhead City, AZ | (a) | 57 | 946 | — | — | 57 | 946 | 1,003 | (19 | ) | 2005 | 04/08/14 | 15 to 40 Years | |||||||||||||||||||||
| Camp Hill, PA | (a) | 180 | 581 | — | — | 180 | 581 | 761 | (17 | ) | 1991 | 03/31/14 | 15 to 30 Years | |||||||||||||||||||||
| Camp Hill, PA | (a) | 140 | 641 | — | — | 140 | 641 | 781 | (18 | ) | 1990 | 03/31/14 | 15 to 30 Years | |||||||||||||||||||||
| Cape Coral, FL | (a) | 545 | 1,716 | — | — | 545 | 1,716 | 2,261 | (145 | ) | 2011 | 08/30/12 | 15 to 50 years | |||||||||||||||||||||
| Clarksville, TN | (a) | 281 | 531 | — | — | 281 | 531 | 812 | (15 | ) | 1997 | 03/31/14 | 15 to 30 Years | |||||||||||||||||||||
| Clarksville, TN | (b) | 978 | 2,718 | — | — | 978 | 2,718 | 3,696 | (7 | ) | 2011 | 12/04/14 | 15 to 40 Years | |||||||||||||||||||||
| Clayton, GA | (a) | 70 | 311 | — | — | 70 | 311 | 381 | (10 | ) | 1963 | 03/31/14 | 15 to 30 Years | |||||||||||||||||||||
| Columbia, MO | (a) | 1,012 | 7,054 | — | — | 1,012 | 7,054 | 8,066 | (145 | ) | 2004 | 03/31/14 | 15 to 40 Years | |||||||||||||||||||||
| Columbia, SC | 19,750 | 3,378 | 35,152 | — | — | 3,378 | 35,152 | 38,530 | (927 | ) | 2003 | 12/31/13 | 15 to 40 Years | |||||||||||||||||||||
| Columbus, GA | (a) | 190 | 531 | — | — | 190 | 531 | 721 | (18 | ) | 1993 | 03/31/14 | 15 to 30 Years | |||||||||||||||||||||
| Crystal Lake, IL | (a) | 200 | 631 | — | — | 200 | 631 | 831 | (19 | ) | 2001 | 03/31/14 | 15 to 30 Years | |||||||||||||||||||||
| Dallas, TX | (a) | 1,633 | 21,834 | — | 2,018 | 1,633 | 23,852 | 25,485 | (3,997 | ) | 2005 | 08/29/05 | 15 to 50 years | |||||||||||||||||||||
| Dallas, TX | (a) | 1,915 | 9,150 | — | — | 1,915 | 9,150 | 11,065 | (564 | ) | 2005 | 03/28/13 | 11 to 50 Years | |||||||||||||||||||||
| Debary, FL | (a) | 100 | 641 | — | — | 100 | 641 | 741 | (18 | ) | 1989 | 03/31/14 | 15 to 30 Years | |||||||||||||||||||||
| Defiance, OH | (a) | 130 | 491 | — | — | 130 | 491 | 621 | (15 | ) | 1959 | 03/31/14 | 15 to 30 Years | |||||||||||||||||||||
| Devine, TX | (a) | 240 | 481 | — | — | 240 | 481 | 721 | (17 | ) | 2002 | 03/31/14 | 15 to 30 Years | |||||||||||||||||||||
| �� | Douglasville, GA | (d) | 2,612 | 4,840 | — | 87 | 2,612 | 4,927 | 7,539 | (430 | ) | 2006 | 07/17/13 | 5 to 39 Years | ||||||||||||||||||||
| East Alton, IL | (a) | 170 | 80 | — | — | 170 | 80 | 250 | (6 | ) | 1960 | 03/31/14 | 15 to 20 Years | |||||||||||||||||||||
| Eastman, GA | (a) | 130 | 551 | — | — | 130 | 551 | 681 | (18 | ) | 1988 | 03/31/14 | 15 to 30 Years | |||||||||||||||||||||
| Elizabethton, TN | (b) | 482 | 1,139 | — | — | 482 | 1,139 | 1,621 | (21 | ) | 2008 | 08/18/14 | 6 to 30 Years | |||||||||||||||||||||
| Elkhart, IN | (a) | 90 | 341 | — | — | 90 | 341 | 431 | (10 | ) | 1969 | 03/31/14 | 15 to 30 Years | |||||||||||||||||||||
| Evansville, IN | (a) | 130 | 391 | — | — | 130 | 391 | 521 | (12 | ) | 1986 | 03/31/14 | 15 to 30 Years | |||||||||||||||||||||
| Fairlea, WV | (b) | 298 | 1,280 | — | — | 298 | 1,280 | 1,578 | (21 | ) | 2010 | 08/18/14 | 10 to 40 Years | |||||||||||||||||||||
| Franklin, TX | (b) | 159 | 1,124 | — | — | 159 | 1,124 | 1,283 | (16 | ) | 2012 | 08/18/14 | 4 to 40 Years | |||||||||||||||||||||
| Ft. Myers, FL | (a) | 903 | 6,445 | — | — | 903 | 6,445 | 7,348 | (425 | ) | 1989 | 08/30/12 | 15 to 50 years | |||||||||||||||||||||
| Ft. Wayne, IN | (a) | 150 | 1,022 | — | — | 150 | 1,022 | 1,172 | (22 | ) | 1965 | 03/31/14 | 15 to 40 Years | |||||||||||||||||||||
| Gahanna, OH | (a) | 411 | 982 | — | — | 411 | 982 | 1,393 | (30 | ) | 1998 | 03/31/14 | 15 to 40 Years | |||||||||||||||||||||
| Gainesville, FL | (a) | 180 | 711 | — | — | 180 | 711 | 891 | (19 | ) | 1941 | 03/31/14 | 15 to 30 Years | |||||||||||||||||||||
| Germantown, TN | (a) | 91 | 171 | — | — | 91 | 171 | 262 | (4 | ) | 1984 | 04/08/14 | 15 to 40 Years | |||||||||||||||||||||
| Glendale, AZ | (a) | 371 | 491 | — | — | 371 | 491 | 862 | (14 | ) | 1988 | 03/31/14 | 15 to 30 Years | |||||||||||||||||||||
| Grayson, KY | (b) | 658 | 3,171 | — | — | 658 | 3,171 | 3,829 | (42 | ) | 2011 | 08/18/14 | 9 to 40 Years | |||||||||||||||||||||
| Hartsville, SC | (a) | 90 | 180 | — | — | 90 | 180 | 270 | (5 | ) | 1973 | 03/31/14 | 15 to 40 Years | |||||||||||||||||||||
| Jacksonville, FL | (a) | 57 | 365 | — | — | 57 | 365 | 422 | (10 | ) | 1986 | 04/08/14 | 15 to 30 Years | |||||||||||||||||||||
| Jacksonville, FL | (b) | 815 | 1,606 | — | — | 815 | 1,606 | 2,421 | (25 | ) | 1977 | 08/18/14 | 6 to 30 Years | |||||||||||||||||||||
| Ogden, UT | (c) | 597 | 2,331 | — | — | 597 | 2,331 | 2,928 | (265 | ) | 1985 | 08/18/14 | 7 to 30 Years | ||||||||||||||||||||
| Okeechobee, FL | (a) | 190 | 521 | — | — | 190 | 521 | 711 | (53 | ) | 1990 | 03/31/14 | 15 to 30 Years | ||||||||||||||||||||
| Orange, TX | (a) | 389 | 2,090 | — | — | 389 | 2,090 | 2,479 | (36 | ) | 2015 | 06/20/16 | 10 to 50 Years | ||||||||||||||||||||
| Orlando, FL | (a) | 291 | 230 | — | — | 291 | 230 | 521 | (27 | ) | 1979 | 03/31/14 | 15 to 30 Years | ||||||||||||||||||||
| Osceola, IN | (a) | 291 | 671 | — | — | 291 | 671 | 962 | (79 | ) | 1996 | 03/31/14 | 15 to 40 Years | ||||||||||||||||||||
| Oxford, MS | (a) | 1,416 | 4,451 | — | — | 1,416 | 4,451 | 5,867 | (363 | ) | 2001 | 05/15/14 | 15 to 40 Years | ||||||||||||||||||||
| Pataskala, OH | (a) | 261 | 782 | — | — | 261 | 782 | 1,043 | (68 | ) | 1995 | 03/31/14 | 15 to 40 Years | ||||||||||||||||||||
| Phoenix, AZ | (a) | 352 | 2,435 | — | — | 352 | 2,435 | 2,787 | (171 | ) | 1973 | 09/30/13 | 15 to 50 Years | ||||||||||||||||||||
| Port Arthur, TX | (a) | 468 | 2,057 | — | — | 468 | 2,057 | 2,525 | (230 | ) | 1997 | 03/31/14 | 15 to 30 Years | ||||||||||||||||||||
| Raytown, MO | (a) | 80 | 631 | — | — | 80 | 631 | 711 | (67 | ) | 1989 | 03/31/14 | 15 to 30 Years | ||||||||||||||||||||
| Rio Rancho, NM | (a) | 301 | 461 | — | — | 301 | 461 | 762 | (55 | ) | 1992 | 03/31/14 | 15 to 30 Years | ||||||||||||||||||||
| Rogers, AR | (a) | 2,014 | 2,313 | — | — | 2,014 | 2,313 | 4,327 | (354 | ) | 1988 | 11/14/13 | 13 to 30 Years | ||||||||||||||||||||
| Round Rock, TX | (c) | 271 | 728 | — | — | 271 | 728 | 999 | (62 | ) | 1985 | 08/18/14 | 8 to 40 Years | ||||||||||||||||||||
| Sandy Springs, GA | (a) | 455 | 1,147 | — | — | 455 | 1,147 | 1,602 | (165 | ) | 1963 | 04/17/14 | 14 to 20 Years | ||||||||||||||||||||
| Schertz, TX | (a) | 2,596 | 9,944 | — | — | 2,596 | 9,944 | 12,540 | (770 | ) | 2013 | 05/16/14 | 13 to 40 Years | ||||||||||||||||||||
| Sherman, TX | (a) | 1,249 | 4,713 | — | — | 1,249 | 4,713 | 5,962 | (217 | ) | 2013 | 06/30/15 | 15 to 40 Years | ||||||||||||||||||||
| South Bend, IN | (a) | 341 | 321 | — | — | 341 | 321 | 662 | (57 | ) | 1955 | 03/31/14 | 15 to 20 Years | ||||||||||||||||||||
| Spartanburg, SC | (a) | 150 | 401 | — | — | 150 | 401 | 551 | (44 | ) | 1992 | 03/31/14 | 15 to 30 Years | ||||||||||||||||||||
| Springfield, IL | (a) | 451 | 1,162 | — | — | 451 | 1,162 | 1,613 | (132 | ) | 1992 | 03/31/14 | 15 to 30 Years | ||||||||||||||||||||
| Springfield, MO | (a) | 561 | 631 | — | — | 561 | 631 | 1,192 | (76 | ) | 1996 | 03/31/14 | 15 to 30 Years | ||||||||||||||||||||
| Springfield, MO | (c) | 2,025 | 3,911 | — | — | 2,025 | 3,911 | 5,936 | (459 | ) | 1990 | 09/23/14 | 7 to 30 Years | ||||||||||||||||||||
| St. John, MO | (c) | 1,733 | 3,095 | 91 | 365 | 1,824 | 3,460 | 5,284 | (600 | ) | 1996 | 07/17/13 | 1 to 43 Years | ||||||||||||||||||||
| Steubenville, OH | (c) | 363 | 3,726 | — | — | 363 | 3,726 | 4,089 | (264 | ) | 2009 | 08/18/14 | 14 to 40 Years | ||||||||||||||||||||
| Tyler, TX | (a) | 1,526 | 2,374 | — | — | 1,526 | 2,374 | 3,900 | (41 | ) | 2015 | 06/20/16 | 11 to 50 Years | ||||||||||||||||||||
| Vernon Hills, IL | (a) | 992 | 5,020 | — | — | 992 | 5,020 | 6,012 | (515 | ) | 1991 | 03/31/14 | 15 to 30 Years | ||||||||||||||||||||
| Vero Beach, FL | (a) | 220 | 731 | — | — | 220 | 731 | 951 | (74 | ) | 1974 | 03/31/14 | 15 to 30 Years | ||||||||||||||||||||
| Vicksburg, MS | (a) | 150 | 351 | — | — | 150 | 351 | 501 | (45 | ) | 1984 | 03/31/14 | 15 to 30 Years | ||||||||||||||||||||
| Waco, TX | (a) | 232 | 1,510 | — | — | 232 | 1,510 | 1,742 | (106 | ) | 1992 | 06/20/14 | 15 to 40 Years | ||||||||||||||||||||
| Warren, IN | (c) | 220 | 278 | — | — | 220 | 278 | 498 | (55 | ) | 2007 | 08/18/14 | 4 to 20 Years | ||||||||||||||||||||
| Watkins Glen, NY | (c) | 113 | 318 | — | — | 113 | 318 | 431 | (27 | ) | 2002 | 04/30/15 | 15 to 30 Years | ||||||||||||||||||||
| Waynesboro, PA | (a) | 100 | 601 | — | — | 100 | 601 | 701 | (49 | ) | 1957 | 03/31/14 | 15 to 40 Years | ||||||||||||||||||||
| Westfield, IN | (a) | 362 | 751 | — | — | 362 | 751 | 1,113 | (77 | ) | 1992 | 03/31/14 | 15 to 40 Years | ||||||||||||||||||||
| Wharton, TX | (c) | 192 | 1,090 | — | — | 192 | 1,090 | 1,282 | (96 | ) | 2009 | 08/18/14 | 15 to 40 Years | ||||||||||||||||||||
| Wittenberg, WI | (a) | 41 | 210 | — | — | 41 | 210 | 251 | (21 | ) | 1982 | 03/31/14 | 15 to 30 Years | ||||||||||||||||||||
| Wylie, TX | (a) | 210 | 912 | — | — | 210 | 912 | 1,122 | (96 | ) | 1986 | 03/31/14 | 15 to 30 Years | ||||||||||||||||||||
| York, PA | (a) | 100 | 481 | — | — | 100 | 481 | 581 | (50 | ) | 1984 | 03/31/14 | 15 to 30 Years | ||||||||||||||||||||
| Sporting Goods | |||||||||||||||||||||||||||||||||
| Initial Cost to Company | Cost Capitalized Subsequent to Acquisition including impairment | Gross Amount at December 31, | Life in which depreciation in latest Statement of Operations is computed | ||||||||||||||||||||||
| Description | Encumbrances | Land and Improvements | Buildings and Improvements | Improvements/ Land | Improvements/ building | Land and Improvements | Buildings and Improvements | Total | Final Accum | Date of Construction | Date Acquired | ||||||||||||||
| Largo, FL | (a) | 150 | 311 | — | — | 150 | 311 | 461 | (9 | ) | 1962 | 03/31/14 | 15 to 30 Years | |||||||||||||||||||||
| Las Cruces, NM | (c ) | 808 | 6,045 | — | — | 808 | 6,045 | 6,853 | (291 | ) | 1983 | 07/17/13 | 4 to 52 Years | |||||||||||||||||||||
| Lewisville, TX | (a) | 1,766 | 8,087 | — | — | 1,766 | 8,087 | 9,853 | (184 | ) | 2002 | 03/31/14 | 8 to 40 Years | |||||||||||||||||||||
| Litchfield, IL | (a) | 210 | 311 | — | — | 210 | 311 | 521 | (15 | ) | 1962 | 03/31/14 | 15 to 20 Years | |||||||||||||||||||||
| Litchfield, IL | (a) | 110 | 120 | — | — | 110 | 120 | 230 | (5 | ) | 1962 | 03/31/14 | 15 to 20 Years | |||||||||||||||||||||
| Logansport, IN | (a) | 30 | 421 | — | — | 30 | 421 | 451 | (11 | ) | 1920 | 03/31/14 | 15 to 30 Years | |||||||||||||||||||||
| Longview, TX | (a) | 200 | 601 | — | — | 200 | 601 | 801 | (20 | ) | 2003 | 03/31/14 | 15 to 30 Years | |||||||||||||||||||||
| Marion, IN | (a) | 140 | 321 | — | — | 140 | 321 | 461 | (12 | ) | 1988 | 03/31/14 | 15 to 30 Years | |||||||||||||||||||||
| Marion, IN | (a) | 130 | 421 | — | — | 130 | 421 | 551 | (14 | ) | 1974 | 03/31/14 | 15 to 30 Years | |||||||||||||||||||||
| Maryville, IL | (a) | 301 | 401 | — | — | 301 | 401 | 702 | (14 | ) | 1995 | 03/31/14 | 15 to 30 Years | |||||||||||||||||||||
| Mechanicsburg, PA | (a) | 230 | 1,032 | — | — | 230 | 1,032 | 1,262 | (29 | ) | 1990 | 03/31/14 | 15 to 30 Years | |||||||||||||||||||||
| Melbourne, FL | (a) | 321 | 651 | — | — | 321 | 651 | 972 | (18 | ) | 1987 | 03/31/14 | 15 to 30 Years | |||||||||||||||||||||
| Memphis, TN | (a) | 91 | 490 | — | — | 91 | 490 | 581 | (13 | ) | 1987 | 04/08/14 | 15 to 30 Years | |||||||||||||||||||||
| Middleburg, FL | (b) | 521 | 2,589 | — | — | 521 | 2,589 | 3,110 | (41 | ) | 1988 | 08/18/14 | 7 to 30 Years | |||||||||||||||||||||
| Monroe, GA | (a) | 110 | 631 | — | — | 110 | 631 | 741 | (19 | ) | 2001 | 03/31/14 | 15 to 30 Years | |||||||||||||||||||||
| Monroe, MI | (b) | 728 | 3,440 | — | — | 728 | 3,440 | 4,168 | (62 | ) | 1995 | 08/18/14 | 9 to 30 Years | |||||||||||||||||||||
| Naples, FL | (a) | 1,351 | 5,368 | — | — | 1,351 | 5,368 | 6,719 | (353 | ) | 2002 | 08/30/12 | 15 to 50 years | |||||||||||||||||||||
| Naples, FL | (a) | 1,829 | 4,522 | — | — | 1,829 | 4,522 | 6,351 | (356 | ) | 1978 | 08/30/12 | 15 to 40 years | |||||||||||||||||||||
| Naples, FL | (a) | 1,057 | 3,845 | — | — | 1,057 | 3,845 | 4,902 | (251 | ) | 2012 | 10/31/12 | 15 to 50 years | |||||||||||||||||||||
| New Port Richey, FL | (a) | 274 | 1,162 | — | — | 274 | 1,162 | 1,436 | (32 | ) | 2004 | 04/08/14 | 15 to 30 Years | |||||||||||||||||||||
| New Port Richey, FL | (a) | 456 | 1,151 | — | — | 456 | 1,151 | 1,607 | (36 | ) | 2004 | 04/08/14 | 15 to 30 Years | |||||||||||||||||||||
| North Myrtle Beach, SC | (a) | 581 | 601 | — | — | 581 | 601 | 1,182 | (23 | ) | 2004 | 03/31/14 | 15 to 30 Years | |||||||||||||||||||||
| Ocala, FL | (a) | 23 | 547 | — | — | 23 | 547 | 570 | (14 | ) | 1984 | 04/08/14 | 30 to 30 Years | |||||||||||||||||||||
| Oelwein, IA | (b) | 226 | 681 | — | — | 226 | 681 | 907 | (12 | ) | 2009 | 08/18/14 | 5 to 30 Years | |||||||||||||||||||||
| Ogden, UT | (b) | 597 | 2,331 | — | — | 597 | 2,331 | 2,928 | (40 | ) | 1997 | 08/18/14 | 7 to 30 Years | |||||||||||||||||||||
| Okeechobee, FL | (a) | 190 | 521 | — | — | 190 | 521 | 711 | (15 | ) | 1990 | 03/31/14 | 15 to 30 Years | |||||||||||||||||||||
| Orlando, FL | (a) | 291 | 230 | — | — | 291 | 230 | 521 | (7 | ) | 1979 | 03/31/14 | 15 to 30 Years | |||||||||||||||||||||
| Osceola, IN | (a) | 291 | 671 | — | — | 291 | 671 | 962 | (22 | ) | 1996 | 03/31/14 | 15 to 40 Years | |||||||||||||||||||||
| Oxford, MS | (a) | 1,416 | 4,451 | — | — | 1,416 | 4,451 | 5,867 | (91 | ) | 2001 | 05/15/14 | 15 to 40 Years | |||||||||||||||||||||
| Pataskala, OH | (a) | 261 | 782 | — | — | 261 | 782 | 1,043 | (19 | ) | 1995 | 03/31/14 | 15 to 40 Years | |||||||||||||||||||||
| Port Arthur, TX | (a) | 468 | 2,057 | — | — | 468 | 2,057 | 2,525 | (63 | ) | 1985 | 03/31/14 | 15 to 30 Years | |||||||||||||||||||||
| Raytown, MO | (a) | 80 | 631 | — | — | 80 | 631 | 711 | (18 | ) | 1989 | 03/31/14 | 15 to 30 Years | |||||||||||||||||||||
| Rio Rancho, NM | (a) | 301 | 461 | — | — | 301 | 461 | 762 | (15 | ) | 1992 | 03/31/14 | 15 to 30 Years | |||||||||||||||||||||
| Rogers, AR | (a) | 2,014 | 2,313 | — | — | 2,014 | 2,313 | 4,327 | (131 | ) | 1988 | 11/18/13 | 13 to 30 Years | |||||||||||||||||||||
| Round Rock, TX | (b) | 271 | 728 | — | — | 271 | 728 | 999 | (9 | ) | 1985 | 08/18/14 | 8 to 40 Years | |||||||||||||||||||||
| Sandy Springs, GA | (a) | 455 | 1,147 | — | — | 455 | 1,147 | 1,602 | (42 | ) | 1963 | 04/17/14 | 14 to 20 Years | |||||||||||||||||||||
| Schertz, TX | (a) | 2,596 | 9,944 | — | — | 2,596 | 9,944 | 12,540 | (176 | ) | 2013 | 05/16/14 | 13 to 40 Years | |||||||||||||||||||||
| Amherst, NY | (b) | 1,868 | 7,503 | (1,069 | ) | (4,385 | ) | 799 | 3,118 | 3,917 | (736 | ) | 1993 | 07/17/13 | 2 to 40 Years | ||||||||||||||||||
| Ankeny, IA | (b) | 3,913 | 3,671 | — | — | 3,913 | 3,671 | 7,584 | (730 | ) | 2003 | 10/15/12 | 15 to 30 Years | ||||||||||||||||||||
| Bend, OR | (a) | 1,516 | 4,850 | — | — | 1,516 | 4,850 | 6,366 | (484 | ) | 2000 | 08/15/13 | 10 to 50 Years | ||||||||||||||||||||
| Biloxi, MS | (c) | 3,274 | 627 | — | — | 3,274 | 627 | 3,901 | — | 2016 | 12/22/16 | 16 to 16 Years | |||||||||||||||||||||
| Colorado Springs, CO | (c) | 2,568 | 4,842 | — | — | 2,568 | 4,842 | 7,410 | (73 | ) | 2005 | 08/31/16 | 10 to 40 Years | ||||||||||||||||||||
| Greenville, TX | (a) | 2,229 | 5,181 | — | — | 2,229 | 5,181 | 7,410 | (19 | ) | 2016 | 12/07/16 | 14 to 40 Years | ||||||||||||||||||||
| Houston, TX | (c) | 2,060 | 1,248 | — | — | 2,060 | 1,248 | 3,308 | (47 | ) | 1995 | 07/17/13 | 40 to 40 Years | ||||||||||||||||||||
| Katy, TX | (c) | 13,144 | 96,194 | — | — | 13,144 | 96,194 | 109,338 | (11,000 | ) | 1976 | 07/17/13 | 8 to 34 Years | ||||||||||||||||||||
| Kenosha, WI | (a) | 3,421 | 7,407 | — | — | 3,421 | 7,407 | 10,828 | (2,431 | ) | 2004 | 07/01/05 | 14 to 40 Years | ||||||||||||||||||||
| Loveland, CO | (b) | 2,329 | 4,750 | — | — | 2,329 | 4,750 | 7,079 | (800 | ) | 2001 | 10/15/12 | 15 to 30 Years | ||||||||||||||||||||
| Lufkin, TX | (b) | 1,922 | 2,735 | — | — | 1,922 | 2,735 | 4,657 | (481 | ) | 2003 | 07/17/13 | 9 to 30 Years | ||||||||||||||||||||
| Macon, GA | (c) | 1,921 | 4,890 | — | — | 1,921 | 4,890 | 6,811 | (795 | ) | 2005 | 07/17/13 | 10 to 30 Years | ||||||||||||||||||||
| Mesa, AZ | (b) | 2,040 | 5,696 | — | — | 2,040 | 5,696 | 7,736 | (963 | ) | 2005 | 10/15/12 | 15 to 30 Years | ||||||||||||||||||||
| Midvale, UT | (b) | 2,931 | 4,844 | — | — | 2,931 | 4,844 | 7,775 | (842 | ) | 2002 | 10/15/12 | 15 to 30 Years | ||||||||||||||||||||
| Monticello, MN | (c) | 3,873 | 768 | — | — | 3,873 | 768 | 4,641 | — | 2016 | 12/29/16 | 15 to 30 Years | |||||||||||||||||||||
| N. Richland Hills, TX | (c) | 1,950 | 5,451 | — | — | 1,950 | 5,451 | 7,401 | (106 | ) | 1996 | 07/17/13 | 30 to 30 Years | ||||||||||||||||||||
| New Hartford, NY | (a) | 2,168 | 4,851 | — | — | 2,168 | 4,851 | 7,019 | (2,016 | ) | 2004 | 07/01/05 | 14 to 40 Years | ||||||||||||||||||||
| Newnan, GA | (c) | 2,938 | 4,472 | — | 318 | 2,938 | 4,790 | 7,728 | (320 | ) | 2014 | 07/03/14 | 15 to 40 Years | ||||||||||||||||||||
| Opelika, AL | (b) | 2,117 | 5,737 | — | — | 2,117 | 5,737 | 7,854 | (681 | ) | 2012 | 06/14/13 | 14 to 40 Years | ||||||||||||||||||||
| Phoenix, AZ | (b) | 2,098 | 5,338 | — | — | 2,098 | 5,338 | 7,436 | (920 | ) | 2003 | 10/15/12 | 15 to 30 Years | ||||||||||||||||||||
| Pocatello, ID | (b) | 3,682 | 10,658 | — | — | 3,682 | 10,658 | 14,340 | (1,659 | ) | 2006 | 07/17/13 | 5 to 38 Years | ||||||||||||||||||||
| Saukville, WI | (a) | 2,061 | 4,794 | — | — | 2,061 | 4,794 | 6,855 | (476 | ) | 2014 | 09/30/14 | 15 to 40 Years | ||||||||||||||||||||
| Soldotna, AK | (a) | 1,177 | 2,245 | — | — | 1,177 | 2,245 | 3,422 | (181 | ) | 1983 | 05/22/14 | 15 to 40 Years | ||||||||||||||||||||
| Thornton, CO | (b) | 2,836 | 5,069 | — | — | 2,836 | 5,069 | 7,905 | (948 | ) | 2003 | 10/15/12 | 15 to 30 Years | ||||||||||||||||||||
| Tulsa, OK | (c) | 4,569 | 87 | — | — | 4,569 | 87 | 4,656 | — | 2016 | 12/15/16 | 11 to 40 Years | |||||||||||||||||||||
| Tuscaloosa, AL | (b) | 3,321 | 4,053 | — | — | 3,321 | 4,053 | 7,374 | (401 | ) | 2013 | 09/30/13 | 14 to 50 Years | ||||||||||||||||||||
| Valdosta, GA | (b) | 2,930 | 5,012 | — | — | 2,930 | 5,012 | 7,942 | (644 | ) | 2012 | 06/14/13 | 14 to 40 Years | ||||||||||||||||||||
| Waite Park, MN | (c) | 4,919 | 25,384 | — | 54 | 4,919 | 25,438 | 30,357 | (683 | ) | 1979 | 06/09/16 | 4 to 40 Years | ||||||||||||||||||||
| Wentzville, MO | (c) | 2,040 | 5,133 | — | 1,264 | 2,040 | 6,397 | 8,437 | (161 | ) | 2015 | 03/27/15 | 39 to 40 Years | ||||||||||||||||||||
| Williston, ND | (c) | 2,190 | 4,132 | — | — | 2,190 | 4,132 | 6,322 | (167 | ) | 2015 | 08/24/15 | 15 to 50 Years | ||||||||||||||||||||
| Health and Fitness | |||||||||||||||||||||||||||||||||
| Albuquerque, NM | (c) | 1,915 | 3,724 | — | — | 1,915 | 3,724 | 5,639 | (243 | ) | 1995 | 04/23/15 | 15 to 30 Years | ||||||||||||||||||||
| Albuquerque, NM | (c) | 2,391 | 4,008 | — | — | 2,391 | 4,008 | 6,399 | (270 | ) | 2001 | 04/23/15 | 15 to 30 Years | ||||||||||||||||||||
| Albuquerque, NM | (c) | 4,732 | 6,845 | — | — | 4,732 | 6,845 | 11,577 | (394 | ) | 1972 | 04/23/15 | 15 to 40 Years | ||||||||||||||||||||
| Aurora, CO | (c) | 1,452 | 4,413 | — | — | 1,452 | 4,413 | 5,865 | (562 | ) | 1995 | 07/17/13 | 11 to 30 Years | ||||||||||||||||||||
| Aurora, IL | (a) | 668 | 2,615 | — | 23 | 668 | 2,638 | 3,306 | (12 | ) | 2006 | 11/29/16 | 9 to 30 Years | ||||||||||||||||||||
| Initial Cost to Company | Cost Capitalized Subsequent to Acquisition including impairment | Gross Amount at December 31, | Life in which depreciation in latest Statement of Operations is computed | ||||||||||||||||||||||
| Description | Encumbrances | Land and Improvements | Buildings and Improvements | Improvements/ Land | Improvements/ building | Land and Improvements | Buildings and Improvements | Total | Final Accum | Date of Construction | Date Acquired | ||||||||||||||
| South Bend, IN | (a) | 341 | 321 | — | — | 341 | 321 | 662 | (16 | ) | 1955 | 03/31/14 | 15 to 20 Years | |||||||||||||||||||||
| Spartanburg, SC | (a) | 150 | 401 | — | — | 150 | 401 | 551 | (12 | ) | 1992 | 03/31/14 | 15 to 30 Years | |||||||||||||||||||||
| Springfield, IL | (a) | 451 | 1,162 | — | — | 451 | 1,162 | 1,613 | (36 | ) | 1992 | 03/31/14 | 15 to 30 Years | |||||||||||||||||||||
| Springfield, MO | (a) | 561 | 631 | — | — | 561 | 631 | 1,192 | (21 | ) | 1996 | 03/31/14 | 15 to 30 Years | |||||||||||||||||||||
| Springfield, MO | (b) | 2,025 | 3,911 | — | — | 2,025 | 3,911 | 5,936 | (56 | ) | 1990 | 09/23/14 | 7 to 30 Years | |||||||||||||||||||||
| St. John, MO | 4,420 | 1,733 | 3,095 | — | — | 1,733 | 3,095 | 4,828 | (228 | ) | 1996 | 07/17/13 | 1 to 43 Years | |||||||||||||||||||||
| Steubenville, OH | (b) | 363 | 3,726 | — | — | 363 | 3,726 | 4,089 | (39 | ) | 2002 | 08/18/14 | 14 to 40 Years | |||||||||||||||||||||
| Vernon Hills, IL | (a) | 992 | 5,020 | — | — | 992 | 5,020 | 6,012 | (140 | ) | 1991 | 03/31/14 | 15 to 30 Years | |||||||||||||||||||||
| Vero Beach, FL | (a) | 220 | 731 | — | — | 220 | 731 | 951 | (20 | ) | 1974 | 03/31/14 | 15 to 30 Years | |||||||||||||||||||||
| Vicksburg, MS | (a) | 150 | 351 | — | — | 150 | 351 | 501 | (12 | ) | 1984 | 03/31/14 | 15 to 30 Years | |||||||||||||||||||||
| Waco, TX | (a) | 232 | 1,510 | — | — | 232 | 1,510 | 1,742 | (21 | ) | 1992 | 06/20/14 | 15 to 40 Years | |||||||||||||||||||||
| Warren, IN | (b) | 220 | 278 | — | — | 220 | 278 | 498 | (8 | ) | 1962 | 08/18/14 | 4 to 20 Years | |||||||||||||||||||||
| Waynesboro, PA | (a) | 100 | 601 | — | — | 100 | 601 | 701 | (13 | ) | 1957 | 03/31/14 | 15 to 40 Years | |||||||||||||||||||||
| Westfield, IN | (a) | 361 | 751 | — | — | 361 | 751 | 1,112 | (21 | ) | 1992 | 03/31/14 | 15 to 40 Years | |||||||||||||||||||||
| Wharton, TX | (b) | 192 | 1,090 | — | — | 192 | 1,090 | 1,282 | (14 | ) | 1995 | 08/18/14 | 15 to 40 Years | |||||||||||||||||||||
| Wittenberg, WI | (a) | 41 | 210 | — | — | 41 | 210 | 251 | (6 | ) | 1982 | 03/31/14 | 15 to 30 Years | |||||||||||||||||||||
| Wylie, TX | (a) | 210 | 912 | — | — | 210 | 912 | 1,122 | (26 | ) | 1986 | 03/31/14 | 15 to 30 Years | |||||||||||||||||||||
| York, PA | (a) | 100 | 481 | — | — | 100 | 481 | 581 | (14 | ) | 1984 | 03/31/14 | 15 to 30 Years | |||||||||||||||||||||
| Boise, ID | (c) | 1,335 | 4,982 | — | — | 1,335 | 4,982 | 6,317 | — | 2001 | 12/28/16 | 8 to 30 Years | |||||||||||||||||||||
| Boise, ID | (c) | 823 | 3,178 | — | — | 823 | 3,178 | 4,001 | — | 2003 | 12/28/16 | 10 to 40 Years | |||||||||||||||||||||
| Brooklyn Park, MN | (c) | 3,176 | 7,771 | — | — | 3,176 | 7,771 | 10,947 | (1,086 | ) | 2008 | 07/17/13 | 10 to 35 Years | ||||||||||||||||||||
| Burnsville, MN | (a) | 1,461 | 1,597 | — | 22 | 1,461 | 1,619 | 3,080 | (83 | ) | 1978 | 04/15/16 | 8 to 20 Years | ||||||||||||||||||||
| Chandler, AZ | (a) | 1,028 | 5,318 | — | — | 1,028 | 5,318 | 6,346 | (561 | ) | 2002 | 07/17/13 | 8 to 40 Years | ||||||||||||||||||||
| Chandler, AZ | (a) | 1,326 | 2,665 | — | — | 1,326 | 2,665 | 3,991 | (32 | ) | 2007 | 09/30/16 | 13 to 30 Years | ||||||||||||||||||||
| Chicago, IL | (a) | 1,009 | 2,965 | — | — | 1,009 | 2,965 | 3,974 | (300 | ) | 2007 | 12/09/13 | 14 to 40 Years | ||||||||||||||||||||
| Clifton, CO | (a) | 1,280 | 6,975 | — | — | 1,280 | 6,975 | 8,255 | (385 | ) | 1983 | 06/30/15 | 15 to 30 Years | ||||||||||||||||||||
| Clinton Township, MI | (a) | 5,430 | 7,254 | (2,799 | ) | (1,160 | ) | 2,631 | 6,094 | 8,725 | (752 | ) | 1999 | 01/09/07 | 15 to 30 Years | ||||||||||||||||||
| Eagle, ID | (c) | 1,428 | 5,591 | — | — | 1,428 | 5,591 | 7,019 | — | 1999 | 12/28/16 | 15 to 30 Years | |||||||||||||||||||||
| Farmington, NM | (c) | 2,242 | 6,696 | — | — | 2,242 | 6,696 | 8,938 | (341 | ) | 1999 | 04/23/15 | 15 to 40 Years | ||||||||||||||||||||
| Glendale, AZ | (a) | 1,402 | 2,879 | — | — | 1,402 | 2,879 | 4,281 | (34 | ) | 2008 | 09/30/16 | 13 to 30 Years | ||||||||||||||||||||
| Grand Junction, CO | (a) | 1,825 | 10,478 | — | — | 1,825 | 10,478 | 12,303 | (351 | ) | 2007 | 11/05/15 | 15 to 40 Years | ||||||||||||||||||||
| Greenwood, IN | (b) | 1,973 | 9,764 | — | — | 1,973 | 9,764 | 11,737 | (1,006 | ) | 2007 | 07/17/13 | 10 to 42 Years | ||||||||||||||||||||
| Keizer, OR | (a) | 1,208 | 4,089 | — | — | 1,208 | 4,089 | 5,297 | (1,230 | ) | 1988 | 12/01/05 | 15 to 40 Years | ||||||||||||||||||||
| Lancaster, CA | (c) | 6,982 | 9,255 | — | — | 6,982 | 9,255 | 16,237 | (699 | ) | 1987 | 05/07/15 | 9 to 30 Years | ||||||||||||||||||||
| League City, TX | (b) | 2,514 | 6,767 | — | — | 2,514 | 6,767 | 9,281 | (772 | ) | 2008 | 07/17/13 | 10 to 42 Years | ||||||||||||||||||||
| Louisville, KY | (c) | 2,205 | 3,551 | — | — | 2,205 | 3,551 | 5,756 | (279 | ) | 1995 | 11/02/15 | 9 to 20 Years | ||||||||||||||||||||
| Manteca, CA | (c) | 796 | 2,062 | — | — | 796 | 2,062 | 2,858 | (106 | ) | 2001 | 09/04/15 | 15 to 30 Years | ||||||||||||||||||||
| Matteson, IL | (c) | 4,587 | 6,328 | — | — | 4,587 | 6,328 | 10,915 | (896 | ) | 2007 | 07/17/13 | 10 to 34 Years | ||||||||||||||||||||
| Meridian, ID | (c) | 840 | 2,950 | — | — | 840 | 2,950 | 3,790 | — | 1993 | 12/28/16 | 8 to 30 Years | |||||||||||||||||||||
| Mesquite, TX | (c) | 601 | 1,770 | — | — | 601 | 1,770 | 2,371 | (95 | ) | 1986 | 01/15/16 | 8 to 30 Years | ||||||||||||||||||||
| Modesto, CA | (c) | 2,350 | 5,923 | — | — | 2,350 | 5,923 | 8,273 | (581 | ) | 1964 | 12/05/14 | 10 to 30 Years | ||||||||||||||||||||
| Naperville, IL | (b) | 5,015 | 6,946 | — | — | 5,015 | 6,946 | 11,961 | (887 | ) | 2007 | 07/17/13 | 9 to 38 Years | ||||||||||||||||||||
| O' Fallon, MO | (c) | 1,669 | 6,054 | — | — | 1,669 | 6,054 | 7,723 | (769 | ) | 2007 | 07/17/13 | 9 to 34 Years | ||||||||||||||||||||
| O'Fallon, IL | (c) | 2,243 | 5,002 | — | — | 2,243 | 5,002 | 7,245 | (682 | ) | 2005 | 07/17/13 | 6 to 37 Years | ||||||||||||||||||||
| Olathe, KS | (c) | 1,816 | 5,526 | — | — | 1,816 | 5,526 | 7,342 | (671 | ) | 2007 | 07/17/13 | 12 to 39 Years | ||||||||||||||||||||
| Pawtucket, RI | (a) | 946 | 3,093 | — | 26 | 946 | 3,119 | 4,065 | (84 | ) | 1980 | 06/28/16 | 4 to 30 Years | ||||||||||||||||||||
| Phoenix, AZ | (c) | 642 | 2,245 | — | — | 642 | 2,245 | 2,887 | (201 | ) | 1988 | 09/30/14 | 14 to 30 Years | ||||||||||||||||||||
| Rio Rancho, NM | (c) | 1,448 | 2,172 | — | — | 1,448 | 2,172 | 3,620 | (152 | ) | 1997 | 04/23/15 | 15 to 30 Years | ||||||||||||||||||||
| Sacramento, CA | (c) | 1,236 | 2,883 | — | — | 1,236 | 2,883 | 4,119 | (207 | ) | 1990 | 09/29/15 | 15 to 20 Years | ||||||||||||||||||||
| Saint Cloud, MN | (a) | 912 | 1,427 | — | — | 912 | 1,427 | 2,339 | (180 | ) | 1989 | 12/16/14 | 15 to 20 Years | ||||||||||||||||||||
| Salem, OR | (a) | 941 | 2,620 | 1,018 | 5,042 | 1,959 | 7,662 | 9,621 | (2,233 | ) | 1996 | 12/01/05 | 15 to 40 Years | ||||||||||||||||||||
| Salem, OR | (a) | 1,509 | 5,635 | — | — | 1,509 | 5,635 | 7,144 | (1,685 | ) | 2001 | 12/01/05 | 15 to 40 Years | ||||||||||||||||||||
| Salem, OR | (a) | 1,214 | 4,911 | — | — | 1,214 | 4,911 | 6,125 | (1,493 | ) | 1980 | 12/01/05 | 15 to 40 Years | ||||||||||||||||||||
| Salem, OR | (a) | 1,589 | 3,834 | — | — | 1,589 | 3,834 | 5,423 | (1,555 | ) | 1977 | 12/01/05 | 15 to 30 Years | ||||||||||||||||||||
| Sartell, MN | (a) | 3,092 | 3,765 | — | — | 3,092 | 3,765 | 6,857 | (464 | ) | 2001 | 12/16/14 | 15 to 30 Years | ||||||||||||||||||||
| Southaven, MS | (c) | 1,187 | 1,817 | — | — | 1,187 | 1,817 | 3,004 | (168 | ) | 2014 | 09/17/14 | 15 to 40 Years | ||||||||||||||||||||
| Distribution | ||||||||||||||||||||||||||||||||||
| Arlington, WA | 10,200 | 1,860 | 10,402 | — | — | 1,860 | 10,402 | 12,262 | (28 | ) | 2002 | 11/21/2014 | 7 to 40 Years | |||||||||||||||||||||
| Baton Rouge, LA | (c ) | 2,898 | 8,024 | — | — | 2,898 | 8,024 | 10,922 | (439 | ) | 2008 | 7/17/2013 | 9 to 43 Years | |||||||||||||||||||||
| Council Bluffs, IA | 2,185 | 1,555 | 1,434 | — | — | 1,555 | 1,434 | 2,989 | (190 | ) | 1999 | 7/17/2013 | 8 to 28 Years | |||||||||||||||||||||
| Coventry, RI | (b) | 1,596 | 1,408 | — | — | 1,596 | 1,408 | 3,004 | (185 | ) | 1998 | 7/17/2013 | 10 to 30 Years | |||||||||||||||||||||
| Edwardsville, KS | 12,880 | 12,781 | 13,501 | — | — | 12,781 | 13,501 | 26,282 | (1,537 | ) | 1999 | 7/17/2013 | 9 to 29 Years | |||||||||||||||||||||
| Front Royal, VA | (c ) | 7,258 | 35,710 | — | — | 7,258 | 35,710 | 42,968 | (2,462 | ) | 2007 | 7/17/2013 | 9 to 34 Years | |||||||||||||||||||||
| Hickory, NC | (b) | 1,095 | 2,835 | — | — | 1,095 | 2,835 | 3,930 | (573 | ) | 1963 | 7/17/2013 | 2 to 12 Years | |||||||||||||||||||||
| Huntsville, AL | (c ) | 5,115 | 6,701 | — | — | 5,115 | 6,701 | 11,816 | (658 | ) | 2008 | 7/17/2013 | 10 to 38 Years | |||||||||||||||||||||
| Katy, TX | 68,250 | 13,145 | 96,193 | — | — | 13,145 | 96,193 | 109,338 | (4,560 | ) | 1976 | 7/17/2013 | 8 to 34 Years | |||||||||||||||||||||
| Mishawaka, IN | (b) | 1,124 | 2,786 | 359 | — | 1,483 | 2,786 | 4,269 | (277 | ) | 1993 | 7/17/2013 | 1 to 34 Years | |||||||||||||||||||||
| Peoria, IL | 2,080 | 953 | 1,916 | — | 12 | 953 | 1,928 | 2,881 | (165 | ) | 1997 | 7/17/2013 | 3 to 30 Years | |||||||||||||||||||||
| Riverside, CA | (a) | 1,203 | 6,254 | — | — | 1,203 | 6,254 | 7,457 | (1,341 | ) | 2004 | 11/12/2004 | 15 to 40 years | |||||||||||||||||||||
| Rockford, IL | (b) | 1,407 | 3,708 | — | — | 1,407 | 3,708 | 5,115 | (284 | ) | 1994 | 7/17/2013 | 2 to 33 Years | |||||||||||||||||||||
| Sewell, NJ | (a) | 858 | 8,418 | — | 114 | 858 | 8,532 | 9,390 | (1,912 | ) | 2000 | 11/17/2006 | 6 to 50 years | |||||||||||||||||||||
| Tavares, FL | (a) | 1,075 | 5,098 | — | — | 1,075 | 5,098 | 6,173 | (1,288 | ) | 2004 | 9/7/2004 | 15 to 40 years | |||||||||||||||||||||
| Walker, MI | (c ) | 2,287 | 4,469 | — | 33 | 2,287 | 4,502 | 6,789 | (369 | ) | 2001 | 7/17/2013 | 4 to 34 Years | |||||||||||||||||||||
| Initial Cost to Company | Cost Capitalized Subsequent to Acquisition including impairment | Gross Amount at December 31, | Life in which depreciation in latest Statement of Operations is computed | ||||||||||||||||||||||
| Description | Encumbrances | Land and Improvements | Buildings and Improvements | Improvements/ Land | Improvements/ building | Land and Improvements | Buildings and Improvements | Total | Final Accum | Date of Construction | Date Acquired | ||||||||||||||
| Automotive parts and service | ||||||||||||||||||||||||||||||||||
| Acworth, GA | (a) | 823 | 976 | — | — | 823 | 976 | 1,799 | (25 | ) | 1999 | 03/28/14 | 15 to 40 Years | |||||||||||||||||||||
| Alabaster, AL | (a) | 631 | 1,010 | — | — | 631 | 1,010 | 1,641 | (187 | ) | 1995 | 12/22/06 | 40 to 40 years | |||||||||||||||||||||
| Albany, GA | (a) | 242 | 572 | — | — | 242 | 572 | 814 | (134 | ) | 1982 | 09/07/07 | 15 to 40 years | |||||||||||||||||||||
| Albany, GA | (a) | 281 | 575 | — | — | 281 | 575 | 856 | (193 | ) | 1997 | 09/07/07 | 15 to 30 years | |||||||||||||||||||||
| Albuquerque, NM | (a) | 885 | 2,998 | — | — | 885 | 2,998 | 3,883 | (145 | ) | 1990 | 07/17/13 | 7 to 35 Years | |||||||||||||||||||||
| Ann Arbor, MI | (a) | 684 | 413 | — | — | 684 | 413 | 1,097 | (13 | ) | 1984 | 06/23/14 | 15 to 20 Years | |||||||||||||||||||||
| Arlington Heights, IL | (a) | 1,530 | 5,354 | — | — | 1,530 | 5,354 | 6,884 | (257 | ) | 1995 | 07/17/13 | 9 to 36 Years | |||||||||||||||||||||
| Ashland, KY | (a) | 613 | 1,284 | — | — | 613 | 1,284 | 1,897 | (62 | ) | 2006 | 07/17/13 | 8 to 48 Years | |||||||||||||||||||||
| Atlanta, GA | (a) | 1,830 | 363 | — | — | 1,830 | 363 | 2,193 | (46 | ) | 1998 | 07/17/13 | 5 to 24 Years | |||||||||||||||||||||
| Auburn Hills, MI | (b) | 3,542 | 6,597 | — | — | 3,542 | 6,597 | 10,139 | (548 | ) | 1995 | 07/17/13 | 8 to 38 Years | |||||||||||||||||||||
| Auburn, AL | (a) | 354 | 1,182 | 30 | 78 | 384 | 1,260 | 1,644 | (324 | ) | 1987 | 12/22/06 | 15 to 30 years | |||||||||||||||||||||
| Auburn, AL | (a) | 676 | 647 | — | — | 676 | 647 | 1,323 | (230 | ) | 1995 | 09/07/07 | 15 to 30 years | |||||||||||||||||||||
| Battle Creek, MI | (a) | 211 | 419 | — | — | 211 | 419 | 630 | (13 | ) | 1981 | 06/23/14 | 15 to 20 Years | |||||||||||||||||||||
| Battle Creek, MI | (a) | 302 | 262 | — | — | 302 | 262 | 564 | (9 | ) | 1986 | 06/23/14 | 15 to 20 Years | |||||||||||||||||||||
| Battle Creek, MI | (a) | 594 | 262 | — | — | 594 | 262 | 856 | (15 | ) | 1986 | 06/23/14 | 15 to 20 Years | |||||||||||||||||||||
| Bessemer, AL | (a) | 358 | 1,197 | — | — | 358 | 1,197 | 1,555 | (222 | ) | 1988 | 12/22/06 | 40 to 40 years | |||||||||||||||||||||
| Birmingham, AL | (a) | 372 | 1,073 | — | — | 372 | 1,073 | 1,445 | (265 | ) | 1965 | 12/22/06 | 30 to 30 years | |||||||||||||||||||||
| Birmingham, AL | (a) | 607 | 1,379 | — | — | 607 | 1,379 | 1,986 | (256 | ) | 1988 | 12/22/06 | 40 to 40 years | |||||||||||||||||||||
| Birmingham, AL | (a) | 339 | 858 | — | — | 339 | 858 | 1,197 | (159 | ) | 1990 | 12/22/06 | 40 to 40 years | |||||||||||||||||||||
| Birmingham, AL | (a) | 343 | 901 | — | — | 343 | 901 | 1,244 | (167 | ) | 1989 | 12/22/06 | 40 to 40 years | |||||||||||||||||||||
| Birmingham, AL | (a) | 417 | 1,237 | — | — | 417 | 1,237 | 1,654 | (229 | ) | 1970 | 12/22/06 | 40 to 40 years | |||||||||||||||||||||
| Birmingham, AL | (a) | 334 | 1,119 | — | — | 334 | 1,119 | 1,453 | (207 | ) | 1989 | 12/22/06 | 40 to 40 years | |||||||||||||||||||||
| Birmingham, AL | (a) | 300 | 839 | — | — | 300 | 839 | 1,139 | (124 | ) | 1998 | 12/22/06 | 50 to 50 years | |||||||||||||||||||||
| Bloomfield, MI | (a) | 554 | 332 | — | — | 554 | 332 | 886 | (12 | ) | 1987 | 06/23/14 | 15 to 20 Years | |||||||||||||||||||||
| Bonita Springs, FL | (a) | 582 | 312 | — | 101 | 582 | 413 | 995 | (46 | ) | 1990 | 03/19/13 | 10 to 30 Years | |||||||||||||||||||||
| Bradenton, FL | (a) | 594 | 494 | — | 222 | 594 | 716 | 1,310 | (83 | ) | 1988 | 03/19/13 | 10 to 30 Years | |||||||||||||||||||||
| Charlotte, NC | (a) | 403 | 1,146 | — | — | 403 | 1,146 | 1,549 | (63 | ) | 2008 | 07/17/13 | 12 to 43 Years | |||||||||||||||||||||
| Chesterfield Twshp, MI | (a) | 181 | 302 | — | — | 181 | 302 | 483 | (10 | ) | 1990 | 06/23/14 | 15 to 20 Years | |||||||||||||||||||||
| Clarksville, IN | (a) | 1,055 | 1,758 | — | — | 1,055 | 1,758 | 2,813 | (120 | ) | 1993 | 07/17/13 | 8 to 30 Years | |||||||||||||||||||||
| Clarksville, TN | (a) | 658 | 1,243 | — | — | 658 | 1,243 | 1,901 | (39 | ) | 2000 | 03/31/14 | 14 to 30 Years | |||||||||||||||||||||
| Clawson, MI | (a) | 262 | 242 | — | — | 262 | 242 | 504 | (8 | ) | 1986 | 06/23/14 | 15 to 20 Years | |||||||||||||||||||||
| Clayton, NC | (a) | 684 | 1,254 | — | — | 684 | 1,254 | 1,938 | (40 | ) | 2001 | 03/31/14 | 7 to 30 Years | |||||||||||||||||||||
| Clearwater, FL | (a) | 463 | 443 | — | 131 | 463 | 574 | 1,037 | (58 | ) | 1989 | 03/19/13 | 10 to 30 Years | |||||||||||||||||||||
| Clinton Township, MI | (a) | 141 | 282 | — | — | 141 | 282 | 423 | (9 | ) | 1987 | 06/23/14 | 15 to 20 Years | |||||||||||||||||||||
| Colorado Springs, CO | (a) | 1,335 | 1,587 | — | — | 1,335 | 1,587 | 2,922 | (153 | ) | 1994 | 07/17/13 | 7 to 26 Years | |||||||||||||||||||||
| St. Peters, MO | (c) | 1,814 | 5,810 | — | — | 1,814 | 5,810 | 7,624 | (828 | ) | 2007 | 07/17/13 | 9 to 34 Years | ||||||||||||||||||||
| Taylorsville, UT | (c) | 1,496 | 3,593 | — | — | 1,496 | 3,593 | 5,089 | (227 | ) | 1988 | 11/20/15 | 12 to 20 Years | ||||||||||||||||||||
| West Chester, OH | (b) | 606 | 9,832 | — | — | 606 | 9,832 | 10,438 | (891 | ) | 2009 | 07/17/13 | 7 to 43 Years | ||||||||||||||||||||
| Automotive Parts and Service | |||||||||||||||||||||||||||||||||
| Acworth, GA | (a) | 823 | 976 | — | — | 823 | 976 | 1,799 | (93 | ) | 1999 | 03/28/14 | 15 to 40 Years | ||||||||||||||||||||
| Alabaster, AL | (a) | 631 | 1,010 | — | — | 631 | 1,010 | 1,641 | (238 | ) | 1995 | 12/22/06 | 40 to 40 Years | ||||||||||||||||||||
| Albany, GA | (a) | 242 | 572 | — | — | 242 | 572 | 814 | (170 | ) | 1982 | 09/07/07 | 15 to 40 Years | ||||||||||||||||||||
| Albany, GA | (a) | 281 | 575 | — | — | 281 | 575 | 856 | (246 | ) | 1997 | 09/07/07 | 15 to 30 Years | ||||||||||||||||||||
| Albuquerque, NM | (a) | 885 | 2,998 | — | — | 885 | 2,998 | 3,883 | (350 | ) | 1990 | 07/17/13 | 7 to 35 Years | ||||||||||||||||||||
| Alton, IL | (c) | 346 | 553 | — | — | 346 | 553 | 899 | (13 | ) | 1997 | 07/22/16 | 7 to 30 Years | ||||||||||||||||||||
| Ann Arbor, MI | (a) | 684 | 413 | — | — | 684 | 413 | 1,097 | (67 | ) | 1989 | 06/23/14 | 15 to 20 Years | ||||||||||||||||||||
| Arlington Heights, IL | (a) | 1,530 | 5,354 | — | — | 1,530 | 5,354 | 6,884 | (620 | ) | 1995 | 07/17/13 | 9 to 36 Years | ||||||||||||||||||||
| Ashland, KY | (a) | 613 | 1,284 | — | — | 613 | 1,284 | 1,897 | (150 | ) | 2006 | 07/17/13 | 8 to 48 Years | ||||||||||||||||||||
| Atlanta, GA | (a) | 1,830 | 363 | — | — | 1,830 | 363 | 2,193 | (111 | ) | 1998 | 07/17/13 | 5 to 24 Years | ||||||||||||||||||||
| Atmore, AL | (c) | 417 | 444 | — | — | 417 | 444 | 861 | (12 | ) | 1995 | 07/22/16 | 7 to 30 Years | ||||||||||||||||||||
| Auburn Hills, MI | (c) | 3,542 | 6,597 | 169 | — | 3,711 | 6,597 | 10,308 | (1,332 | ) | 1995 | 07/17/13 | 8 to 38 Years | ||||||||||||||||||||
| Auburn, AL | (a) | 354 | 1,182 | 30 | 78 | 384 | 1,260 | 1,644 | (412 | ) | 1987 | 12/22/06 | 15 to 30 Years | ||||||||||||||||||||
| Auburn, AL | (a) | 676 | 647 | — | — | 676 | 647 | 1,323 | (293 | ) | 1995 | 09/07/07 | 15 to 30 Years | ||||||||||||||||||||
| Augusta, GA | (c) | 482 | 750 | — | — | 482 | 750 | 1,232 | (14 | ) | 1998 | 07/22/16 | 7 to 40 Years | ||||||||||||||||||||
| Battle Creek, MI | (a) | 211 | 419 | — | — | 211 | 419 | 630 | (64 | ) | 1981 | 06/23/14 | 15 to 20 Years | ||||||||||||||||||||
| Battle Creek, MI | (a) | 302 | 262 | — | — | 302 | 262 | 564 | (44 | ) | 1987 | 06/23/14 | 15 to 20 Years | ||||||||||||||||||||
| Battle Creek, MI | (a) | 594 | 262 | — | — | 594 | 262 | 856 | (76 | ) | 1998 | 06/23/14 | 15 to 20 Years | ||||||||||||||||||||
| Bessemer, AL | (a) | 358 | 1,197 | — | — | 358 | 1,197 | 1,555 | (282 | ) | 1988 | 12/22/06 | 40 to 40 Years | ||||||||||||||||||||
| Birmingham, AL | (a) | 417 | 1,237 | — | — | 417 | 1,237 | 1,654 | (291 | ) | 1970 | 12/22/06 | 40 to 40 Years | ||||||||||||||||||||
| Birmingham, AL | (a) | 300 | 839 | — | — | 300 | 839 | 1,139 | (158 | ) | 1998 | 12/22/06 | 50 to 50 Years | ||||||||||||||||||||
| Birmingham, AL | (a) | 607 | 1,379 | — | — | 607 | 1,379 | 1,986 | (325 | ) | 1988 | 12/22/06 | 40 to 40 Years | ||||||||||||||||||||
| Birmingham, AL | (a) | 343 | 901 | — | — | 343 | 901 | 1,244 | (212 | ) | 1989 | 12/22/06 | 40 to 40 Years | ||||||||||||||||||||
| Birmingham, AL | (a) | 334 | 1,119 | — | — | 334 | 1,119 | 1,453 | (263 | ) | 1989 | 12/22/06 | 40 to 40 Years | ||||||||||||||||||||
| Birmingham, AL | (a) | 372 | 1,073 | — | — | 372 | 1,073 | 1,445 | (337 | ) | 1965 | 12/22/06 | 30 to 30 Years | ||||||||||||||||||||
| Birmingham, AL | (a) | 339 | 858 | — | — | 339 | 858 | 1,197 | (202 | ) | 1990 | 12/22/06 | 40 to 40 Years | ||||||||||||||||||||
| Blakeley, GA | (c) | 169 | 887 | — | — | 169 | 887 | 1,056 | (12 | ) | 1995 | 07/22/16 | 7 to 50 Years | ||||||||||||||||||||
| Bloomfield, MI | (a) | 554 | 332 | — | — | 554 | 332 | 886 | (58 | ) | 1987 | 06/23/14 | 15 to 20 Years | ||||||||||||||||||||
| Bonita Springs, FL | (a) | 582 | 312 | — | 101 | 582 | 413 | 995 | (99 | ) | 1990 | 03/19/13 | 10 to 30 Years | ||||||||||||||||||||
| Bradenton, FL | (a) | 594 | 493 | — | 222 | 594 | 715 | 1,309 | (178 | ) | 1988 | 03/19/13 | 10 to 30 Years | ||||||||||||||||||||
| Burlington, IA | (c) | 467 | 737 | — | — | 467 | 737 | 1,204 | (12 | ) | 1989 | 07/22/16 | 7 to 40 Years | ||||||||||||||||||||
| Camilla, GA | (c) | 419 | 412 | — | — | 419 | 412 | 831 | (10 | ) | 1995 | 07/22/16 | 7 to 30 Years | ||||||||||||||||||||
| Initial Cost to Company | Cost Capitalized Subsequent to Acquisition including impairment | Gross Amount at December 31, | Life in which depreciation in latest Statement of Operations is computed | ||||||||||||||||||||||
| Description | Encumbrances | Land and Improvements | Buildings and Improvements | Improvements/ Land | Improvements/ building | Land and Improvements | Buildings and Improvements | Total | Final Accum | Date of Construction | Date Acquired | ||||||||||||||
| Columbia Heights, MN | 1,038 | 510 | 1,314 | — | — | 510 | 1,314 | 1,824 | (60 | ) | 2005 | 07/17/13 | 7 to 43 Years | |||||||||||||||||||||
| Crestview, FL | (a) | 544 | 743 | — | — | 544 | 743 | 1,287 | (219 | ) | 1975 | 09/07/07 | 15 to 30 years | |||||||||||||||||||||
| Dacula, GA | (a) | 1,067 | 976 | — | — | 1,067 | 976 | 2,043 | (26 | ) | 2000 | 03/28/14 | 15 to 40 Years | |||||||||||||||||||||
| Dallas, TX | 3,290 | 3,975 | — | — | — | 3,975 | — | 3,975 | — | (g) | 07/17/13 | 17 to 17 Years | ||||||||||||||||||||||
| Decatur, AL | (a) | 187 | 1,174 | — | 98 | 187 | 1,272 | 1,459 | (195 | ) | 2000 | 12/22/06 | 20 to 50 years | |||||||||||||||||||||
| Decatur, AL | (a) | 84 | 803 | — | — | 84 | 803 | 887 | (119 | ) | 2001 | 12/22/06 | 50 to 50 years | |||||||||||||||||||||
| Dothan, AL | (a) | 162 | 659 | — | — | 162 | 659 | 821 | (191 | ) | 1996 | 09/07/07 | 15 to 30 years | |||||||||||||||||||||
| Duluth, MN | 860 | 207 | 1,462 | — | — | 207 | 1,462 | 1,669 | (54 | ) | 2006 | 07/17/13 | 7 to 48 Years | |||||||||||||||||||||
| Dunellen, NJ | (a) | 1,177 | 1,973 | — | — | 1,177 | 1,973 | 3,150 | (78 | ) | 2008 | 07/17/13 | 10 to 48 Years | |||||||||||||||||||||
| El Centro, CA | (a) | 1,295 | 1,504 | — | — | 1,295 | 1,504 | 2,799 | (106 | ) | 2006 | 07/17/13 | 9 to 33 Years | |||||||||||||||||||||
| Estero, FL | (a) | 334 | 571 | — | — | 334 | 571 | 905 | (32 | ) | 2004 | 10/28/13 | 9 to 30 Years | |||||||||||||||||||||
| Estero, FL | (a) | 394 | 399 | — | — | 394 | 399 | 793 | (26 | ) | 2008 | 10/28/13 | 9 to 30 Years | |||||||||||||||||||||
| Farmington Hills, MI | (a) | 382 | 282 | — | — | 382 | 282 | 664 | (10 | ) | 1987 | 06/23/14 | 15 to 20 Years | |||||||||||||||||||||
| Farragut, TN | (a) | 986 | 1,148 | — | — | 986 | 1,148 | 2,134 | (33 | ) | 2011 | 03/28/14 | 15 to 40 Years | |||||||||||||||||||||
| Fergus Falls, MN | 722 | 294 | 978 | — | — | 294 | 978 | 1,272 | (45 | ) | 2005 | 07/17/13 | 7 to 47 Years | |||||||||||||||||||||
| Florence, AL | (a) | 130 | 1,128 | — | — | 130 | 1,128 | 1,258 | (167 | ) | 1999 | 12/22/06 | 50 to 50 years | |||||||||||||||||||||
| Fort Myers, FL | (a) | 555 | 312 | — | 131 | 555 | 443 | 998 | (52 | ) | 1990 | 03/19/13 | 10 to 30 Years | |||||||||||||||||||||
| Frederick, MD | (a) | 1,571 | 2,529 | — | — | 1,571 | 2,529 | 4,100 | (133 | ) | 1987 | 07/17/13 | 9 to 40 Years | |||||||||||||||||||||
| Gardendale, AL | (a) | 586 | 1,274 | — | — | 586 | 1,274 | 1,860 | (236 | ) | 1989 | 12/22/06 | 40 to 40 years | |||||||||||||||||||||
| Grand Bay, AL | (a) | 226 | 1,242 | — | — | 226 | 1,242 | 1,468 | (52 | ) | 2005 | 07/17/13 | 7 to 47 Years | |||||||||||||||||||||
| Grand Forks, ND | 840 | 287 | 1,132 | — | — | 287 | 1,132 | 1,419 | (59 | ) | 2005 | 07/17/13 | 7 to 45 Years | |||||||||||||||||||||
| Greenfield, IN | (a) | 458 | 996 | — | — | 458 | 996 | 1,454 | (47 | ) | 2003 | 07/17/13 | 12 to 47 Years | |||||||||||||||||||||
| Greensboro, NC | (a) | 721 | 1,179 | — | — | 721 | 1,179 | 1,900 | (42 | ) | 2002 | 03/31/14 | 7 to 30 Years | |||||||||||||||||||||
| Gulf Breeze, FL | (a) | 296 | 457 | — | — | 296 | 457 | 753 | (137 | ) | 1993 | 09/07/07 | 15 to 30 years | |||||||||||||||||||||
| Hampton, VA | (a) | 1,662 | 2,974 | — | — | 1,662 | 2,974 | 4,636 | (186 | ) | 1993 | 07/17/13 | 9 to 35 Years | |||||||||||||||||||||
| Holland Township, MI | 1,231 | 493 | 1,212 | — | — | 493 | 1,212 | 1,705 | (51 | ) | 2006 | 07/17/13 | 7 to 47 Years | |||||||||||||||||||||
| Holland, MI | 1,193 | 542 | 1,384 | — | — | 542 | 1,384 | 1,926 | (61 | ) | 2006 | 07/17/13 | 7 to 47 Years | |||||||||||||||||||||
| Huntsville, AL | (a) | 184 | 1,037 | — | — | 184 | 1,037 | 1,221 | (154 | ) | 2001 | 12/22/06 | 50 to 50 years | |||||||||||||||||||||
| Huntsville, AL | (a) | 252 | 917 | — | — | 252 | 917 | 1,169 | (227 | ) | 1965 | 12/22/06 | 30 to 30 years | |||||||||||||||||||||
| Huntsville, AL | (a) | 374 | 1,295 | — | 109 | 374 | 1,404 | 1,778 | (264 | ) | 1997 | 12/22/06 | 20 to 40 years | |||||||||||||||||||||
| Huntsville, AL | (a) | 195 | 1,649 | — | — | 195 | 1,649 | 1,844 | (306 | ) | 1993 | 12/22/06 | 40 to 40 years | |||||||||||||||||||||
| Huntsville, AL | (a) | 295 | 893 | — | — | 295 | 893 | 1,188 | (166 | ) | 1994 | 12/22/06 | 40 to 40 years | |||||||||||||||||||||
| Hurley, MS | (a) | 265 | 1,052 | — | — | 265 | 1,052 | 1,317 | (52 | ) | 2005 | 07/17/13 | 7 to 45 Years | |||||||||||||||||||||
| Irvington, NJ | (a) | 1,605 | 1,912 | — | — | 1,605 | 1,912 | 3,517 | (89 | ) | 2006 | 07/17/13 | 7 to 47 Years | |||||||||||||||||||||
| Jackson, OH | (a) | 397 | 1,251 | — | — | 397 | 1,251 | 1,648 | (58 | ) | 2005 | 07/17/13 | 7 to 47 Years | |||||||||||||||||||||
| Kalamazoo, MI | (a) | 247 | 333 | — | — | 247 | 333 | 580 | (8 | ) | 1982 | 07/30/14 | 15 to 20 Years | |||||||||||||||||||||
| Kalamazoo, MI | (a) | 201 | 362 | — | — | 201 | 362 | 563 | (11 | ) | 1987 | 06/23/14 | 15 to 20 Years | |||||||||||||||||||||
| Castle Shannon, PA | (c) | 620 | 732 | — | — | 620 | 732 | 1,352 | (16 | ) | 1998 | 07/22/16 | 7 to 30 Years | ||||||||||||||||||||
| Charlotte, NC | (a) | 403 | 1,146 | — | — | 403 | 1,146 | 1,549 | (151 | ) | 2008 | 07/17/13 | 12 to 43 Years | ||||||||||||||||||||
| Chesterfield Twshp, MI | (a) | 181 | 302 | — | — | 181 | 302 | 483 | (51 | ) | 1990 | 06/23/14 | 15 to 20 Years | ||||||||||||||||||||
| Clarksville, IN | (a) | 1,055 | 1,758 | — | — | 1,055 | 1,758 | 2,813 | (289 | ) | 1993 | 07/17/13 | 8 to 30 Years | ||||||||||||||||||||
| Clarksville, TN | (a) | 658 | 1,243 | — | — | 658 | 1,243 | 1,901 | (143 | ) | 2000 | 03/31/14 | 14 to 30 Years | ||||||||||||||||||||
| Clawson, MI | (a) | 262 | 242 | — | — | 262 | 242 | 504 | (40 | ) | 1984 | 06/23/14 | 15 to 20 Years | ||||||||||||||||||||
| Clayton, NC | (a) | 684 | 1,254 | — | — | 684 | 1,254 | 1,938 | (147 | ) | 2001 | 03/31/14 | 7 to 30 Years | ||||||||||||||||||||
| Clearwater, FL | (a) | 463 | 443 | — | 131 | 463 | 574 | 1,037 | (125 | ) | 1989 | 03/19/13 | 10 to 30 Years | ||||||||||||||||||||
| Clinton Township, MI | (a) | 141 | 282 | — | — | 141 | 282 | 423 | (45 | ) | 1987 | 06/23/14 | 15 to 20 Years | ||||||||||||||||||||
| Clinton, MS | (c) | 569 | 693 | — | — | 569 | 693 | 1,262 | (15 | ) | 1998 | 07/22/16 | 7 to 30 Years | ||||||||||||||||||||
| College Park, GA | (c) | 386 | 506 | — | — | 386 | 506 | 892 | (13 | ) | 1998 | 07/22/16 | 7 to 30 Years | ||||||||||||||||||||
| Colorado Springs, CO | (a) | 1,335 | 1,587 | — | — | 1,335 | 1,587 | 2,922 | (368 | ) | 1994 | 07/17/13 | 7 to 26 Years | ||||||||||||||||||||
| Columbia Heights, MN | (c) | 510 | 1,314 | — | — | 510 | 1,314 | 1,824 | (144 | ) | 2006 | 07/17/13 | 7 to 43 Years | ||||||||||||||||||||
| Columbus, GA | (c) | 628 | 769 | — | — | 628 | 769 | 1,397 | (15 | ) | 1998 | 07/22/16 | 7 to 40 Years | ||||||||||||||||||||
| Conroe, TX | (c) | 2,056 | 2,306 | — | — | 2,056 | 2,306 | 4,362 | — | 2016 | 12/28/16 | 14 to 50 Years | |||||||||||||||||||||
| Covington, LA | (c) | 507 | 426 | — | — | 507 | 426 | 933 | (11 | ) | 1998 | 07/22/16 | 7 to 30 Years | ||||||||||||||||||||
| Crestview, FL | (a) | 544 | 743 | — | — | 544 | 743 | 1,287 | (278 | ) | 1975 | 09/07/07 | 15 to 30 Years | ||||||||||||||||||||
| Dacula, GA | (a) | 1,067 | 976 | — | — | 1,067 | 976 | 2,043 | (95 | ) | 2000 | 03/28/14 | 15 to 40 Years | ||||||||||||||||||||
| Dayton, OH | (c) | 317 | 572 | — | — | 317 | 572 | 889 | (12 | ) | 1998 | 07/22/16 | 7 to 30 Years | ||||||||||||||||||||
| Decatur, AL | (a) | 187 | 1,174 | — | 98 | 187 | 1,272 | 1,459 | (256 | ) | 2000 | 12/22/06 | 19 to 50 Years | ||||||||||||||||||||
| Decatur, AL | (a) | 84 | 803 | — | — | 84 | 803 | 887 | (151 | ) | 2001 | 12/22/06 | 50 to 50 Years | ||||||||||||||||||||
| Denmark, SC | (c) | 439 | 504 | — | — | 439 | 504 | 943 | (12 | ) | 1996 | 07/22/16 | 7 to 30 Years | ||||||||||||||||||||
| Dothan, AL | (a) | 162 | 659 | — | — | 162 | 659 | 821 | (242 | ) | 1996 | 09/07/07 | 15 to 30 Years | ||||||||||||||||||||
| Duluth, MN | (c) | 207 | 1,462 | — | — | 207 | 1,462 | 1,669 | (130 | ) | 2006 | 07/17/13 | 7 to 48 Years | ||||||||||||||||||||
| Dunellen, NJ | (a) | 1,177 | 1,973 | — | — | 1,177 | 1,973 | 3,150 | (188 | ) | 2008 | 07/17/13 | 10 to 48 Years | ||||||||||||||||||||
| El Centro, CA | (a) | 1,295 | 1,504 | — | — | 1,295 | 1,504 | 2,799 | (255 | ) | 1998 | 07/17/13 | 9 to 33 Years | ||||||||||||||||||||
| Estero, FL | (a) | 334 | 571 | — | — | 334 | 571 | 905 | (88 | ) | 2009 | 10/28/13 | 9 to 30 Years | ||||||||||||||||||||
| Estero, FL | (a) | 394 | 399 | — | — | 394 | 399 | 793 | (72 | ) | 2004 | 10/28/13 | 9 to 30 Years | ||||||||||||||||||||
| Farmington Hills, MI | (a) | 382 | 282 | — | — | 382 | 282 | 664 | (52 | ) | 1987 | 06/23/14 | 15 to 20 Years | ||||||||||||||||||||
| Farragut, TN | (a) | 986 | 1,148 | — | — | 986 | 1,148 | 2,134 | (122 | ) | 2011 | 03/28/14 | 15 to 40 Years | ||||||||||||||||||||
| Fergus Falls, MN | (c) | 294 | 978 | — | — | 294 | 978 | 1,272 | (109 | ) | 2005 | 07/17/13 | 7 to 47 Years | ||||||||||||||||||||
| Florence, AL | (a) | 130 | 1,128 | — | — | 130 | 1,128 | 1,258 | (212 | ) | 1999 | 12/22/06 | 50 to 50 Years | ||||||||||||||||||||
| Fort Lauderdale, FL | (c) | 772 | 1,005 | — | — | 772 | 1,005 | 1,777 | (18 | ) | 1996 | 07/22/16 | 7 to 40 Years | ||||||||||||||||||||
| Fort Myers, FL | (a) | 555 | 312 | — | 131 | 555 | 443 | 998 | (111 | ) | 1990 | 03/19/13 | 10 to 30 Years | ||||||||||||||||||||
| Frederick, MD | (a) | 1,571 | 2,529 | — | — | 1,571 | 2,529 | 4,100 | (320 | ) | 1987 | 07/17/13 | 9 to 40 Years | ||||||||||||||||||||
| Initial Cost to Company | Cost Capitalized Subsequent to Acquisition including impairment | Gross Amount at December 31, | Life in which depreciation in latest Statement of Operations is computed | ||||||||||||||||||||||
| Description | Encumbrances | Land and Improvements | Buildings and Improvements | Improvements/ Land | Improvements/ building | Land and Improvements | Buildings and Improvements | Total | Final Accum | Date of Construction | Date Acquired | ||||||||||||||
| Kalamazoo, MI | (a) | 312 | 262 | — | — | 312 | 262 | 574 | (9 | ) | 1984 | 06/23/14 | 15 to 20 Years | |||||||||||||||||||||
| Kalamazoo, MI | (a) | 60 | 211 | — | — | 60 | 211 | 271 | (6 | ) | 1986 | 06/23/14 | 15 to 20 Years | |||||||||||||||||||||
| Kalamazoo, MI | (a) | 171 | 332 | — | — | 171 | 332 | 503 | (12 | ) | 1979 | 06/23/14 | 15 to 20 Years | |||||||||||||||||||||
| Kalamazoo, MI | (a) | 352 | 262 | — | — | 352 | 262 | 614 | (11 | ) | 1987 | 06/23/14 | 15 to 20 Years | |||||||||||||||||||||
| Kalamazoo, MI | (a) | 503 | 342 | — | — | 503 | 342 | 845 | (19 | ) | 1987 | 06/23/14 | 15 to 20 Years | |||||||||||||||||||||
| Kalamzaoo, MI | (a) | 141 | 141 | — | — | 141 | 141 | 282 | (6 | ) | 1987 | 06/23/14 | 15 to 20 Years | |||||||||||||||||||||
| Kennesaw, GA | (a) | 874 | 1,270 | — | — | 874 | 1,270 | 2,144 | (33 | ) | 1999 | 03/28/14 | 15 to 40 Years | |||||||||||||||||||||
| Lakeland, FL | (a) | 1,204 | 1,917 | — | — | 1,204 | 1,917 | 3,121 | (107 | ) | 1991 | 07/17/13 | 7 to 38 Years | |||||||||||||||||||||
| Largo, FL | (a) | 416 | 494 | — | 111 | 416 | 605 | 1,021 | (59 | ) | 1989 | 03/19/13 | 10 to 30 Years | |||||||||||||||||||||
| Lawrenceville, GA | (a) | 722 | 976 | — | — | 722 | 976 | 1,698 | (26 | ) | 2000 | 03/28/14 | 15 to 40 Years | |||||||||||||||||||||
| Lincoln, NE | (a) | 1,318 | 1,604 | — | — | 1,318 | 1,604 | 2,922 | (615 | ) | 1972 | 07/13/07 | 11 to 26 years | |||||||||||||||||||||
| Livonia, MI | (a) | 252 | 262 | — | — | 252 | 262 | 514 | (9 | ) | 1986 | 06/23/14 | 15 to 20 Years | |||||||||||||||||||||
| Macomb Township, MI | (a) | 181 | 262 | — | — | 181 | 262 | 443 | (9 | ) | 1991 | 06/23/14 | 15 to 20 Years | |||||||||||||||||||||
| Madison Heights, MI | (a) | 352 | 493 | — | — | 352 | 493 | 845 | (16 | ) | 1989 | 06/23/14 | 15 to 20 Years | |||||||||||||||||||||
| Madison, AL | (a) | 211 | 1,401 | — | — | 211 | 1,401 | 1,612 | (260 | ) | 1997 | 12/22/06 | 40 to 40 years | |||||||||||||||||||||
| Madison, AL | (a) | 359 | 1,505 | — | — | 359 | 1,505 | 1,864 | (279 | ) | 1995 | 12/22/06 | 40 to 40 years | |||||||||||||||||||||
| Madison, TN | (a) | 662 | 1,567 | — | — | 662 | 1,567 | 2,229 | (40 | ) | 2000 | 03/31/14 | 14 to 40 Years | |||||||||||||||||||||
| Marianna, FL | (a) | 283 | 452 | — | — | 283 | 452 | 735 | (132 | ) | 1994 | 09/07/07 | 15 to 40 years | |||||||||||||||||||||
| Maryland Heights, MO | (a) | 522 | 1,155 | — | — | 522 | 1,155 | 1,677 | (55 | ) | 2005 | 07/17/13 | 7 to 47 Years | |||||||||||||||||||||
| Midwest City, OK | (a) | 353 | 815 | — | — | 353 | 815 | 1,168 | (45 | ) | 2007 | 07/17/13 | 9 to 44 Years | |||||||||||||||||||||
| Milton, FL | (a) | 137 | 577 | — | — | 137 | 577 | 714 | (168 | ) | 1986 | 09/07/07 | 15 to 30 years | |||||||||||||||||||||
| Mobile, AL | (a) | 155 | 500 | — | — | 155 | 500 | 655 | (148 | ) | 1984 | 09/07/07 | 15 to 30 years | |||||||||||||||||||||
| Mobile, AL | (a) | 167 | 601 | — | — | 167 | 601 | 768 | (179 | ) | 1990 | 09/07/07 | 15 to 30 years | |||||||||||||||||||||
| Mobile, AL | (a) | 89 | 501 | — | — | 89 | 501 | 590 | (141 | ) | 1982 | 11/30/07 | 15 to 30 years | |||||||||||||||||||||
| Mobile, AL | (a) | 157 | 508 | — | — | 157 | 508 | 665 | (151 | ) | 1982 | 09/07/07 | 15 to 30 years | |||||||||||||||||||||
| Montgomery, AL | (a) | 398 | 626 | — | — | 398 | 626 | 1,024 | (204 | ) | 1997 | 09/07/07 | 15 to 30 years | |||||||||||||||||||||
| Montgomery, AL | (a) | 241 | 628 | — | — | 241 | 628 | 869 | (187 | ) | 1997 | 09/07/07 | 15 to 30 years | |||||||||||||||||||||
| Montgomery, AL | (a) | 422 | 857 | — | — | 422 | 857 | 1,279 | (256 | ) | 1992 | 09/07/07 | 15 to 30 years | |||||||||||||||||||||
| Montgomery, AL | (a) | 303 | 636 | — | — | 303 | 636 | 939 | (194 | ) | 1996 | 09/07/07 | 15 to 30 years | |||||||||||||||||||||
| Montgomery, AL | (a) | 275 | 528 | — | — | 275 | 528 | 803 | (174 | ) | 1988 | 09/07/07 | 15 to 30 years | |||||||||||||||||||||
| Moultrie, GA | (a) | 179 | 271 | — | — | 179 | 271 | 450 | (132 | ) | 1983 | 09/07/07 | 15 to 20 years | |||||||||||||||||||||
| Naples, FL | (a) | 249 | 265 | — | — | 249 | 265 | 514 | (18 | ) | 1966 | 10/28/13 | 9 to 20 Years | |||||||||||||||||||||
| Naples, FL | (a) | 173 | 591 | — | — | 173 | 591 | 764 | (28 | ) | 2010 | 10/28/13 | 9 to 30 Years | |||||||||||||||||||||
| Naples, FL | (a) | 425 | 424 | — | — | 425 | 424 | 849 | (27 | ) | 1985 | 10/28/13 | 9 to 30 Years | |||||||||||||||||||||
| Naples, FL | (a) | 333 | 302 | — | 121 | 333 | 423 | 756 | (45 | ) | 1990 | 03/19/13 | 10 to 30 Years | |||||||||||||||||||||
| Nashville, TN | (a) | 828 | 1,405 | — | — | 828 | 1,405 | 2,233 | (48 | ) | 2000 | 03/31/14 | 14 to 30 Years | |||||||||||||||||||||
| New Boston, OH | (a) | 345 | 1,538 | — | — | 345 | 1,538 | 1,883 | (61 | ) | 2005 | 07/17/13 | 7 to 47 Years | |||||||||||||||||||||
| Gardendale, AL | (a) | 586 | 1,274 | — | — | 586 | 1,274 | 1,860 | (300 | ) | 1989 | 12/22/06 | 40 to 40 Years | ||||||||||||||||||||
| Gibsonton, FL | (c) | 526 | 448 | — | — | 526 | 448 | 974 | (14 | ) | 1999 | 07/22/16 | 7 to 30 Years | ||||||||||||||||||||
| Grand Bay, AL | (a) | 226 | 1,242 | — | — | 226 | 1,242 | 1,468 | (125 | ) | 2005 | 07/17/13 | 7 to 47 Years | ||||||||||||||||||||
| Grand Forks, ND | (c) | 287 | 1,132 | — | — | 287 | 1,132 | 1,419 | (142 | ) | 2005 | 07/17/13 | 7 to 45 Years | ||||||||||||||||||||
| Greenfield, IN | (a) | 458 | 996 | — | — | 458 | 996 | 1,454 | (113 | ) | 2003 | 07/17/13 | 7 to 47 Years | ||||||||||||||||||||
| Greensboro, NC | (a) | 721 | 1,179 | — | — | 721 | 1,179 | 1,900 | (153 | ) | 2002 | 03/31/14 | 7 to 30 Years | ||||||||||||||||||||
| Griffin, GA | (c) | 441 | 1,142 | — | — | 441 | 1,142 | 1,583 | (17 | ) | 1998 | 07/22/16 | 7 to 50 Years | ||||||||||||||||||||
| Gulf Breeze, FL | (a) | 296 | 457 | — | — | 296 | 457 | 753 | (174 | ) | 1993 | 09/07/07 | 15 to 30 Years | ||||||||||||||||||||
| Hampton, VA | (a) | 1,662 | 2,974 | — | — | 1,662 | 2,974 | 4,636 | (448 | ) | 1993 | 07/17/13 | 9 to 35 Years | ||||||||||||||||||||
| Hattiesburg, MS | (c) | 452 | 821 | — | — | 452 | 821 | 1,273 | (12 | ) | 1997 | 07/22/16 | 7 to 40 Years | ||||||||||||||||||||
| Hialeah, FL | (c) | 682 | 1,054 | — | — | 682 | 1,054 | 1,736 | (17 | ) | 1998 | 07/22/16 | 7 to 40 Years | ||||||||||||||||||||
| Holland Township, MI | (c) | 493 | 1,212 | — | — | 493 | 1,212 | 1,705 | (123 | ) | 2005 | 07/17/13 | 7 to 47 Years | ||||||||||||||||||||
| Holland, MI | (c) | 542 | 1,384 | — | — | 542 | 1,384 | 1,926 | (147 | ) | 2005 | 07/17/13 | 7 to 47 Years | ||||||||||||||||||||
| Huntsville, AL | (a) | 195 | 1,649 | — | — | 195 | 1,649 | 1,844 | (388 | ) | 1993 | 12/22/06 | 40 to 40 Years | ||||||||||||||||||||
| Huntsville, AL | (a) | 295 | 893 | — | — | 295 | 893 | 1,188 | (210 | ) | 1994 | 12/22/06 | 40 to 40 Years | ||||||||||||||||||||
| Huntsville, AL | (a) | 374 | 1,295 | — | 109 | 374 | 1,404 | 1,778 | (344 | ) | 1997 | 12/22/06 | 19 to 40 Years | ||||||||||||||||||||
| Huntsville, AL | (a) | 252 | 917 | — | — | 252 | 917 | 1,169 | (288 | ) | 1965 | 12/22/06 | 30 to 30 Years | ||||||||||||||||||||
| Huntsville, AL | (a) | 184 | 1,037 | — | — | 184 | 1,037 | 1,221 | (195 | ) | 2001 | 12/22/06 | 50 to 50 Years | ||||||||||||||||||||
| Hurley, MS | (a) | 265 | 1,052 | — | — | 265 | 1,052 | 1,317 | (125 | ) | 2006 | 07/17/13 | 7 to 45 Years | ||||||||||||||||||||
| Irvington, NJ | (a) | 1,605 | 1,912 | — | — | 1,605 | 1,912 | 3,517 | (215 | ) | 2006 | 07/17/13 | 7 to 47 Years | ||||||||||||||||||||
| Jackson, MS | (c) | 396 | 423 | — | — | 396 | 423 | 819 | (9 | ) | 1998 | 07/22/16 | 7 to 30 Years | ||||||||||||||||||||
| Jackson, OH | (a) | 397 | 1,251 | — | — | 397 | 1,251 | 1,648 | (139 | ) | 2005 | 07/17/13 | 7 to 47 Years | ||||||||||||||||||||
| Kalamazoo, MI | (a) | 201 | 362 | — | — | 201 | 362 | 563 | (55 | ) | 1987 | 06/23/14 | 15 to 20 Years | ||||||||||||||||||||
| Kalamazoo, MI | (a) | 312 | 262 | — | — | 312 | 262 | 574 | (44 | ) | 1984 | 06/23/14 | 15 to 20 Years | ||||||||||||||||||||
| Kalamazoo, MI | (a) | 60 | 211 | — | — | 60 | 211 | 271 | (31 | ) | 1986 | 06/23/14 | 15 to 20 Years | ||||||||||||||||||||
| Kalamazoo, MI | (a) | 171 | 332 | — | — | 171 | 332 | 503 | (58 | ) | 1979 | 06/23/14 | 15 to 20 Years | ||||||||||||||||||||
| Kalamazoo, MI | (a) | 352 | 262 | — | — | 352 | 262 | 614 | (53 | ) | 1987 | 06/23/14 | 15 to 20 Years | ||||||||||||||||||||
| Kalamazoo, MI | (a) | 503 | 342 | — | — | 503 | 342 | 845 | (93 | ) | 1989 | 06/23/14 | 15 to 20 Years | ||||||||||||||||||||
| Kalamazoo, MI | (a) | 247 | 333 | — | — | 247 | 333 | 580 | (49 | ) | 1982 | 07/30/14 | 15 to 20 Years | ||||||||||||||||||||
| Kalamzaoo, MI | (a) | 141 | 141 | — | — | 141 | 141 | 282 | (28 | ) | 1959 | 06/23/14 | 15 to 20 Years | ||||||||||||||||||||
| Kennesaw, GA | (a) | 874 | 1,270 | — | — | 874 | 1,270 | 2,144 | (121 | ) | 1999 | 03/28/14 | 15 to 40 Years | ||||||||||||||||||||
| Kingsland, GA | (c) | 1,037 | 997 | — | — | 1,037 | 997 | 2,034 | (16 | ) | 1998 | 07/22/16 | 7 to 40 Years | ||||||||||||||||||||
| Lakeland, FL | (a) | 1,204 | 1,917 | — | — | 1,204 | 1,917 | 3,121 | (258 | ) | 1991 | 07/17/13 | 7 to 38 Years | ||||||||||||||||||||
| Largo, FL | (a) | 416 | 493 | — | 111 | 416 | 604 | 1,020 | (127 | ) | 1989 | 03/19/13 | 10 to 30 Years | ||||||||||||||||||||
| Lawrenceville, GA | (a) | 722 | 976 | — | — | 722 | 976 | 1,698 | (95 | ) | 2000 | 03/28/14 | 15 to 40 Years | ||||||||||||||||||||
| Leesburg, GA | (c) | 435 | 494 | — | — | 435 | 494 | 929 | (16 | ) | 1999 | 07/22/16 | 7 to 30 Years | ||||||||||||||||||||
| Lincoln, NE | (a) | 1,318 | 1,604 | — | — | 1,318 | 1,604 | 2,922 | (781 | ) | 1972 | 04/29/11 | 11 to 26 Years | ||||||||||||||||||||
| Livonia, MI | (a) | 252 | 262 | — | — | 252 | 262 | 514 | (44 | ) | 1986 | 06/23/14 | 15 to 20 Years | ||||||||||||||||||||
| Initial Cost to Company | Cost Capitalized Subsequent to Acquisition including impairment | Gross Amount at December 31, | Life in which depreciation in latest Statement of Operations is computed | ||||||||||||||||||||||
| Description | Encumbrances | Land and Improvements | Buildings and Improvements | Improvements/ Land | Improvements/ building | Land and Improvements | Buildings and Improvements | Total | Final Accum | Date of Construction | Date Acquired | ||||||||||||||
| Niceville, FL | (a) | 458 | 454 | — | — | 458 | 454 | 912 | (118 | ) | 1996 | 09/07/07 | 15 to 40 years | |||||||||||||||||||||
| North Little Rock, AR | (a) | 244 | 311 | — | — | 244 | 311 | 555 | (12 | ) | 2001 | 03/31/14 | 2 to 30 Years | |||||||||||||||||||||
| Ocean Springs, MS | (a) | 145 | 186 | — | — | 145 | 186 | 331 | (13 | ) | 1997 | 07/17/13 | 15 to 30 Years | |||||||||||||||||||||
| Opelika, AL | (a) | 503 | 628 | — | — | 503 | 628 | 1,131 | (215 | ) | 1995 | 09/07/07 | 15 to 30 years | |||||||||||||||||||||
| Orem, UT | (a) | 1,224 | 2,132 | — | — | 1,224 | 2,132 | 3,356 | (115 | ) | 1990 | 07/17/13 | 9 to 40 Years | |||||||||||||||||||||
| Oxford, AL | (a) | 120 | 1,224 | — | — | 120 | 1,224 | 1,344 | (227 | ) | 1990 | 12/22/06 | 40 to 40 years | |||||||||||||||||||||
| Panama City, FL | (a) | 378 | 252 | — | — | 378 | 252 | 630 | (22 | ) | 1988 | 07/17/13 | 15 to 30 Years | |||||||||||||||||||||
| Pasadena, TX | (a) | 1,224 | 4,263 | — | — | 1,224 | 4,263 | 5,487 | (203 | ) | 1995 | 07/17/13 | 9 to 40 Years | |||||||||||||||||||||
| Pea Ridge, AR | (a) | 217 | — | — | — | 217 | — | 217 | — | 2007 | 03/31/14 | 13 to 13 Years | ||||||||||||||||||||||
| Penns Grove, NJ | (a) | 612 | 1,564 | — | — | 612 | 1,564 | 2,176 | (69 | ) | 2006 | 07/17/13 | 8 to 47 Years | |||||||||||||||||||||
| Pensacola, FL | (a) | 238 | 564 | — | — | 238 | 564 | 802 | (169 | ) | 1994 | 09/07/07 | 15 to 30 years | |||||||||||||||||||||
| Pensacola, FL | (a) | 104 | 333 | — | — | 104 | 333 | 437 | (107 | ) | 1968 | 09/07/07 | 15 to 30 years | |||||||||||||||||||||
| Pensacola, FL | (a) | 148 | 459 | — | — | 148 | 459 | 607 | (135 | ) | 1972 | 09/07/07 | 15 to 30 years | |||||||||||||||||||||
| Pensacola, FL | (a) | 195 | 569 | — | — | 195 | 569 | 764 | (175 | ) | 1983 | 09/07/07 | 15 to 30 years | |||||||||||||||||||||
| Pensacola, FL | (a) | 150 | 575 | — | — | 150 | 575 | 725 | (174 | ) | 1986 | 09/07/07 | 15 to 30 years | |||||||||||||||||||||
| Pinson, AL | (a) | 320 | 916 | — | — | 320 | 916 | 1,236 | (136 | ) | 2001 | 12/22/06 | 50 to 50 years | |||||||||||||||||||||
| Portage, MI | (a) | 423 | 262 | — | — | 423 | 262 | 685 | (9 | ) | 1985 | 06/23/14 | 15 to 20 Years | |||||||||||||||||||||
| Portland, ME | (a) | 650 | 566 | — | — | 650 | 566 | 1,216 | (222 | ) | 1993 | 03/07/07 | 13 to 28 years | |||||||||||||||||||||
| Rainsville, AL | (a) | 251 | 1,073 | — | — | 251 | 1,073 | 1,324 | (55 | ) | 2005 | 07/17/13 | 7 to 42 Years | |||||||||||||||||||||
| Sarasota, FL | (a) | 386 | 312 | — | 141 | 386 | 453 | 839 | (50 | ) | 1987 | 03/19/13 | 10 to 30 Years | |||||||||||||||||||||
| Sarasota, FL | (a) | 278 | 312 | — | 131 | 278 | 443 | 721 | (45 | ) | 1987 | 03/19/13 | 10 to 30 Years | |||||||||||||||||||||
| Scottsburg, IN | (a) | 238 | 665 | — | — | 238 | 665 | 903 | (34 | ) | 2006 | 07/17/13 | 8 to 43 Years | |||||||||||||||||||||
| Shelby Township, MI | (a) | 387 | 355 | — | — | 387 | 355 | 742 | (10 | ) | 1989 | 07/30/14 | 15 to 20 Years | |||||||||||||||||||||
| Spanish Fort, AL | (a) | 563 | 607 | — | — | 563 | 607 | 1,170 | (239 | ) | 1993 | 09/07/07 | 15 to 30 years | |||||||||||||||||||||
| St Clair Shores, MI | (a) | 242 | 272 | — | — | 242 | 272 | 514 | (9 | ) | 1986 | 06/23/14 | 15 to 20 Years | |||||||||||||||||||||
| St. Francis, WI | (a) | 532 | 1,557 | — | — | 532 | 1,557 | 2,089 | (76 | ) | 2006 | 07/17/13 | 8 to 48 Years | |||||||||||||||||||||
| Suwanee, GA | (a) | 480 | 1,350 | — | — | 480 | 1,350 | 1,830 | (67 | ) | 1985 | 10/21/13 | 13 to 30 Years | |||||||||||||||||||||
| Tamarac, FL | (a) | 1,407 | 2,660 | — | — | 1,407 | 2,660 | 4,067 | (131 | ) | 1997 | 07/17/13 | 7 to 39 Years | |||||||||||||||||||||
| Trenton, OH | (a) | 324 | 842 | — | — | 324 | 842 | 1,166 | (43 | ) | 2003 | 07/17/13 | 11 to 47 Years | |||||||||||||||||||||
| Troy, MI | (a) | 322 | 392 | — | — | 322 | 392 | 714 | (12 | ) | 1984 | 06/23/14 | 15 to 20 Years | |||||||||||||||||||||
| Troy, MI | (a) | 281 | 267 | — | — | 281 | 267 | 548 | (1 | ) | 1989 | 12/03/14 | 15 to 30 Years | |||||||||||||||||||||
| Valdosta, GA | (a) | 376 | 576 | — | — | 376 | 576 | 952 | (184 | ) | 1996 | 11/30/07 | 15 to 30 years | |||||||||||||||||||||
| Warren, AR | (a) | 217 | 375 | — | — | 217 | 375 | 592 | (15 | ) | 2007 | 03/31/14 | 13 to 30 Years | |||||||||||||||||||||
| Warren, MI | (a) | 409 | 344 | — | — | 409 | 344 | 753 | (9 | ) | 1986 | 07/30/14 | 15 to 20 Years | |||||||||||||||||||||
| Waterford, MI | (a) | 292 | 362 | — | — | 292 | 362 | 654 | (12 | ) | 1989 | 06/23/14 | 15 to 20 Years | |||||||||||||||||||||
| Waycross, GA | (a) | 380 | 142 | — | — | 380 | 142 | 522 | (14 | ) | 1956 | 12/10/13 | 15 to 30 Years | |||||||||||||||||||||
| West Warwick, RI | (a) | 1,323 | 2,917 | — | — | 1,323 | 2,917 | 4,240 | (153 | ) | 1993 | 07/17/13 | 9 to 41 Years | |||||||||||||||||||||
| Macomb Township, MI | (a) | 181 | 262 | — | — | 181 | 262 | 443 | (43 | ) | 1986 | 06/23/14 | 15 to 20 Years | ||||||||||||||||||||
| Madison Heights, MI | (a) | 352 | 493 | — | — | 352 | 493 | 845 | (78 | ) | 1984 | 06/23/14 | 15 to 20 Years | ||||||||||||||||||||
| Madison, AL | (a) | 359 | 1,505 | 40 | 456 | 399 | 1,961 | 2,360 | (363 | ) | 1995 | 12/22/06 | 15 to 40 Years | ||||||||||||||||||||
| Madison, AL | (a) | 211 | 1,401 | — | — | 211 | 1,401 | 1,612 | (330 | ) | 1997 | 12/22/06 | 40 to 40 Years | ||||||||||||||||||||
| Madison, TN | (a) | 662 | 1,567 | — | — | 662 | 1,567 | 2,229 | (145 | ) | 2000 | 03/31/14 | 14 to 40 Years | ||||||||||||||||||||
| Margate, FL | (c) | 480 | 507 | — | — | 480 | 507 | 987 | (10 | ) | 1991 | 07/22/16 | 7 to 40 Years | ||||||||||||||||||||
| Marianna, FL | (a) | 283 | 452 | — | — | 283 | 452 | 735 | (168 | ) | 1994 | 09/07/07 | 15 to 40 Years | ||||||||||||||||||||
| Maryland Heights, MO | (a) | 522 | 1,155 | — | — | 522 | 1,155 | 1,677 | (132 | ) | 2005 | 07/17/13 | 7 to 47 Years | ||||||||||||||||||||
| Midwest City, OK | (a) | 353 | 815 | — | — | 353 | 815 | 1,168 | (107 | ) | 2007 | 07/17/13 | 9 to 44 Years | ||||||||||||||||||||
| Milton, FL | (a) | 137 | 577 | — | — | 137 | 577 | 714 | (214 | ) | 1986 | 09/07/07 | 15 to 30 Years | ||||||||||||||||||||
| Mobile, AL | (a) | 157 | 508 | — | — | 157 | 508 | 665 | (192 | ) | 1982 | 09/07/07 | 15 to 30 Years | ||||||||||||||||||||
| Mobile, AL | (a) | 89 | 501 | — | — | 89 | 501 | 590 | (181 | ) | 1982 | 11/30/07 | 15 to 30 Years | ||||||||||||||||||||
| Montgomery, AL | (a) | 398 | 626 | — | — | 398 | 626 | 1,024 | (259 | ) | 1997 | 09/07/07 | 15 to 30 Years | ||||||||||||||||||||
| Montgomery, AL | (a) | 241 | 628 | — | — | 241 | 628 | 869 | (238 | ) | 1997 | 09/07/07 | 15 to 30 Years | ||||||||||||||||||||
| Montgomery, AL | (a) | 422 | 857 | — | — | 422 | 857 | 1,279 | (326 | ) | 1992 | 09/07/07 | 15 to 30 Years | ||||||||||||||||||||
| Montgomery, AL | (a) | 303 | 636 | — | — | 303 | 636 | 939 | (247 | ) | 1996 | 09/07/07 | 15 to 30 Years | ||||||||||||||||||||
| Montgomery, AL | (a) | 275 | 528 | — | — | 275 | 528 | 803 | (222 | ) | 1988 | 09/07/07 | 15 to 30 Years | ||||||||||||||||||||
| Moultrie, GA | (a) | 179 | 271 | — | — | 179 | 271 | 450 | (168 | ) | 1983 | 09/07/07 | 15 to 20 Years | ||||||||||||||||||||
| Naples, FL | (a) | 333 | 302 | — | 121 | 333 | 423 | 756 | (96 | ) | 1990 | 03/19/13 | 10 to 30 Years | ||||||||||||||||||||
| Naples, FL | (a) | 249 | 265 | — | — | 249 | 265 | 514 | (49 | ) | 1966 | 10/28/13 | 9 to 20 Years | ||||||||||||||||||||
| Naples, FL | (a) | 425 | 424 | — | — | 425 | 424 | 849 | (72 | ) | 2006 | 10/28/13 | 9 to 30 Years | ||||||||||||||||||||
| Nashville, TN | (a) | 828 | 1,405 | — | — | 828 | 1,405 | 2,233 | (176 | ) | 2000 | 03/31/14 | 14 to 30 Years | ||||||||||||||||||||
| Natchez, MS | (c) | 509 | 754 | — | — | 509 | 754 | 1,263 | (12 | ) | 1998 | 07/22/16 | 7 to 40 Years | ||||||||||||||||||||
| New Boston, OH | (a) | 345 | 1,538 | — | — | 345 | 1,538 | 1,883 | (148 | ) | 2005 | 07/17/13 | 7 to 47 Years | ||||||||||||||||||||
| New Smyrna Beach, FL | (c) | 774 | 818 | — | — | 774 | 818 | 1,592 | (14 | ) | 1999 | 07/22/16 | 7 to 40 Years | ||||||||||||||||||||
| Newton, MS | (c) | 336 | 443 | — | — | 336 | 443 | 779 | (10 | ) | 1998 | 07/22/16 | 7 to 30 Years | ||||||||||||||||||||
| Niceville, FL | (a) | 458 | 454 | — | — | 458 | 454 | 912 | (150 | ) | 1996 | 09/07/07 | 15 to 40 Years | ||||||||||||||||||||
| North Little Rock, AR | (a) | 244 | 310 | — | — | 244 | 310 | 554 | (42 | ) | 2001 | 03/31/14 | 2 to 30 Years | ||||||||||||||||||||
| Ocean Springs, MS | (a) | 145 | 186 | — | — | 145 | 186 | 331 | (31 | ) | 1988 | 07/17/13 | 15 to 30 Years | ||||||||||||||||||||
| Opelika, AL | (a) | 503 | 628 | — | — | 503 | 628 | 1,131 | (274 | ) | 1995 | 09/07/07 | 15 to 30 Years | ||||||||||||||||||||
| Orem, UT | (a) | 1,224 | 2,132 | — | — | 1,224 | 2,132 | 3,356 | (278 | ) | 1990 | 07/17/13 | 9 to 40 Years | ||||||||||||||||||||
| Oxford, AL | (a) | 120 | 1,224 | — | — | 120 | 1,224 | 1,344 | (288 | ) | 1990 | 12/22/06 | 40 to 40 Years | ||||||||||||||||||||
| Panama City, FL | (a) | 378 | 252 | — | — | 378 | 252 | 630 | (53 | ) | 1997 | 07/17/13 | 15 to 30 Years | ||||||||||||||||||||
| Pasadena, TX | (a) | 1,224 | 4,263 | — | — | 1,224 | 4,263 | 5,487 | (488 | ) | 1995 | 07/17/13 | 9 to 40 Years | ||||||||||||||||||||
| Pea Ridge, AR | (a) | 217 | — | — | — | 217 | — | 217 | — | (f) | 03/31/14 | (f) | |||||||||||||||||||||
| Initial Cost to Company | Cost Capitalized Subsequent to Acquisition including impairment | Gross Amount at December 31, | Life in which depreciation in latest Statement of Operations is computed | ||||||||||||||||||||||
| Description | Encumbrances | Land and Improvements | Buildings and Improvements | Improvements/ Land | Improvements/ building | Land and Improvements | Buildings and Improvements | Total | Final Accum | Date of Construction | Date Acquired | ||||||||||||||
| Wetumpka, AL | (a) | 185 | 332 | — | — | 185 | 332 | 517 | (7 | ) | 1996 | 06/24/14 | 12 to 30 Years | |||||||||||||||||||||
| Willingboro, NJ | (a) | 784 | 1,369 | — | — | 784 | 1,369 | 2,153 | (74 | ) | 2007 | 07/17/13 | 9 to 47 Years | |||||||||||||||||||||
| Woodstock, GA | (a) | 1,108 | 1,281 | — | — | 1,108 | 1,281 | 2,389 | (36 | ) | 1999 | 03/28/14 | 15 to 40 Years | |||||||||||||||||||||
| Ypislianti, MI | (a) | 1,107 | 745 | — | — | 1,107 | 745 | 1,852 | (22 | ) | 1999 | 06/23/14 | 15 to 30 Years | |||||||||||||||||||||
| Zeeland, MI | 1,057 | 490 | 1,136 | — | — | 490 | 1,136 | 1,626 | (52 | ) | 2006 | 07/17/13 | 7 to 47 Years | |||||||||||||||||||||
| Penns Grove, NJ | (a) | 612 | 1,564 | — | — | 612 | 1,564 | 2,176 | (166 | ) | 2006 | 07/17/13 | 8 to 47 Years | ||||||||||||||||||||
| Pensacola, FL | (a) | 238 | 564 | — | — | 238 | 564 | 802 | (216 | ) | 1994 | 09/07/07 | 15 to 30 Years | ||||||||||||||||||||
| Pensacola, FL | (a) | 104 | 333 | — | — | 104 | 333 | 437 | (137 | ) | 1968 | 09/07/07 | 15 to 30 Years | ||||||||||||||||||||
| Pensacola, FL | (a) | 148 | 459 | — | — | 148 | 459 | 607 | (172 | ) | 1972 | 09/07/07 | 15 to 30 Years | ||||||||||||||||||||
| Pensacola, FL | (a) | 195 | 569 | — | — | 195 | 569 | 764 | (222 | ) | 1983 | 09/07/07 | 15 to 30 Years | ||||||||||||||||||||
| Pensacola, FL | (a) | 150 | 575 | — | — | 150 | 575 | 725 | (222 | ) | 1986 | 09/07/07 | 15 to 30 Years | ||||||||||||||||||||
| Phoenix, AZ | (a) | 956 | 1,485 | — | — | 956 | 1,485 | 2,441 | (38 | ) | 2015 | 06/24/16 | 5 to 40 Years | ||||||||||||||||||||
| Pinson, AL | (a) | 320 | 916 | — | — | 320 | 916 | 1,236 | (173 | ) | 2001 | 12/22/06 | 50 to 50 Years | ||||||||||||||||||||
| Port Orange, FL | (a) | 599 | 967 | — | 35 | 599 | 1,002 | 1,601 | (23 | ) | 1997 | 06/24/16 | 30 to 30 Years | ||||||||||||||||||||
| Portage, MI | (a) | 423 | 262 | — | — | 423 | 262 | 685 | (46 | ) | 1985 | 06/23/14 | 15 to 20 Years | ||||||||||||||||||||
| Portland, ME | (a) | 650 | 566 | — | — | 650 | 566 | 1,216 | (282 | ) | 1993 | 06/30/09 | 13 to 28 Years | ||||||||||||||||||||
| Rainsville, AL | (a) | 251 | 1,073 | — | — | 251 | 1,073 | 1,324 | (133 | ) | 2005 | 07/17/13 | 7 to 42 Years | ||||||||||||||||||||
| Richmond Hill, GA | (c) | 418 | 701 | — | — | 418 | 701 | 1,119 | (14 | ) | 1995 | 07/22/16 | 7 to 30 Years | ||||||||||||||||||||
| Sarasota, FL | (a) | 386 | 312 | — | 141 | 386 | 453 | 839 | (108 | ) | 1987 | 03/19/13 | 10 to 30 Years | ||||||||||||||||||||
| Sarasota, FL | (a) | 278 | 312 | — | 131 | 278 | 443 | 721 | (97 | ) | 1987 | 03/19/13 | 10 to 30 Years | ||||||||||||||||||||
| Savannah, GA | (c) | 688 | 492 | — | — | 688 | 492 | 1,180 | (12 | ) | 1995 | 07/22/16 | 7 to 40 Years | ||||||||||||||||||||
| Scottsburg, IN | (a) | 238 | 665 | — | — | 238 | 665 | 903 | (83 | ) | 2006 | 07/17/13 | 8 to 43 Years | ||||||||||||||||||||
| Shelby Township, MI | (a) | 387 | 355 | — | — | 387 | 355 | 742 | (60 | ) | 1989 | 07/30/14 | 15 to 20 Years | ||||||||||||||||||||
| Spanish Fort, AL | (a) | 563 | 607 | — | — | 563 | 607 | 1,170 | (305 | ) | 1993 | 09/07/07 | 15 to 30 Years | ||||||||||||||||||||
| St Clair Shores, MI | (a) | 242 | 272 | — | — | 242 | 272 | 514 | (46 | ) | 1985 | 06/23/14 | 15 to 20 Years | ||||||||||||||||||||
| St. Francis, WI | (a) | 532 | 1,557 | — | — | 532 | 1,557 | 2,089 | (182 | ) | 2006 | 07/17/13 | 8 to 48 Years | ||||||||||||||||||||
| St. Louis, MO | (c) | 607 | 505 | — | — | 607 | 505 | 1,112 | (13 | ) | 1997 | 07/22/16 | 7 to 30 Years | ||||||||||||||||||||
| Suwanee, GA | (a) | 480 | 1,350 | — | — | 480 | 1,350 | 1,830 | (181 | ) | 1986 | 10/21/13 | 13 to 30 Years | ||||||||||||||||||||
| Tamarac, FL | (a) | 1,407 | 2,660 | — | — | 1,407 | 2,660 | 4,067 | (317 | ) | 1997 | 07/17/13 | 7 to 39 Years | ||||||||||||||||||||
| Tampa, FL | (c) | 721 | 1,055 | — | — | 721 | 1,055 | 1,776 | (17 | ) | 1997 | 07/22/16 | 7 to 40 Years | ||||||||||||||||||||
| Theodore, AL | (c) | 549 | 755 | — | — | 549 | 755 | 1,304 | (14 | ) | 1996 | 07/22/16 | 7 to 40 Years | ||||||||||||||||||||
| Trenton, OH | (a) | 324 | 842 | — | — | 324 | 842 | 1,166 | (104 | ) | 2003 | 07/17/13 | 7 to 47 Years | ||||||||||||||||||||
| Troy, MI | (a) | 322 | 392 | — | — | 322 | 392 | 714 | (61 | ) | 1984 | 06/23/14 | 15 to 20 Years | ||||||||||||||||||||
| Troy, MI | (a) | 281 | 267 | — | — | 281 | 267 | 548 | (26 | ) | 1989 | 12/03/14 | 15 to 30 Years | ||||||||||||||||||||
| Valdosta, GA | (a) | 376 | 576 | — | — | 376 | 576 | 952 | (236 | ) | 1996 | 11/30/07 | 15 to 30 Years | ||||||||||||||||||||
| Warren, AR | (a) | 217 | 375 | — | — | 217 | 375 | 592 | (56 | ) | 2006 | 03/31/14 | 13 to 30 Years | ||||||||||||||||||||
| Warren, MI | (a) | 409 | 344 | — | — | 409 | 344 | 753 | (54 | ) | 1986 | 07/30/14 | 15 to 20 Years | ||||||||||||||||||||
| Waterford, MI | (a) | 292 | 362 | — | — | 292 | 362 | 654 | (62 | ) | 1989 | 06/23/14 | 15 to 20 Years | ||||||||||||||||||||
| Waycross, GA | (a) | 380 | 142 | — | — | 380 | 142 | 522 | (41 | ) | 1998 | 12/10/13 | 15 to 30 Years | ||||||||||||||||||||
| Waynesboro, GA | (c) | 330 | 1,015 | — | — | 330 | 1,015 | 1,345 | (15 | ) | 1995 | 07/22/16 | 7 to 50 Years | ||||||||||||||||||||
| West Warwick, RI | (a) | 1,323 | 2,917 | — | — | 1,323 | 2,917 | 4,240 | (369 | ) | 1993 | 07/17/13 | 9 to 41 Years | ||||||||||||||||||||
| Wetumpka, AL | (a) | 185 | 332 | — | — | 185 | 332 | 517 | (34 | ) | 1995 | 06/24/14 | 12 to 30 Years | ||||||||||||||||||||
| Grocery | ||||||||||||||||||||||||||||||||||
| Abilene, TX | (a) | 1,586 | 2,230 | — | — | 1,586 | 2,230 | 3,816 | (256 | ) | 1979 | 03/27/13 | 6 to 26 Years | |||||||||||||||||||||
| Alto, TX | (a) | 204 | 464 | — | — | 204 | 464 | 668 | (24 | ) | 1996 | 03/31/14 | 7 to 20 Years | |||||||||||||||||||||
| Amarillo, TX | (f) | 3,559 | 4,575 | — | — | 3,559 | 4,575 | 8,134 | (981 | ) | 1999 | 05/23/05 | 15 to 40 years | |||||||||||||||||||||
| Amarillo, TX | (f) | 1,828 | 1,292 | — | — | 1,828 | 1,292 | 3,120 | (404 | ) | 1988 | 05/23/05 | 9 to 30 years | |||||||||||||||||||||
| Amarillo, TX | (f) | 1,573 | 1,586 | — | — | 1,573 | 1,586 | 3,159 | (492 | ) | 1989 | 05/23/05 | 9 to 30 years | |||||||||||||||||||||
| Amarillo, TX | (a) | 1,574 | 1,389 | — | — | 1,574 | 1,389 | 2,963 | (431 | ) | 1989 | 05/23/05 | 9 to 30 years | |||||||||||||||||||||
| Bald Knob, AR | (a) | 328 | 327 | — | — | 328 | 327 | 655 | (29 | ) | 1971 | 03/31/14 | 1 to 15 Years | |||||||||||||||||||||
| Blairsville, GA | (b) | 1,652 | 3,102 | — | — | 1,652 | 3,102 | 4,754 | (42 | ) | 2001 | 09/30/14 | 10 to 30 Years | |||||||||||||||||||||
| Boise, ID | (c ) | 1,470 | 2,280 | — | — | 1,470 | 2,280 | 3,750 | (144 | ) | 1982 | 12/17/13 | 4 to 20 Years | |||||||||||||||||||||
| Buffalo, TX | (a) | 522 | 987 | — | — | 522 | 987 | 1,509 | (35 | ) | 1978 | 03/31/14 | 7 to 30 Years | |||||||||||||||||||||
| Burkburnett, TX | (a) | 2,030 | 2,706 | — | — | 2,030 | 2,706 | 4,736 | (615 | ) | 1997 | 05/23/05 | 12 to 40 years | |||||||||||||||||||||
| Chattanooga, TN | (b) | 1,817 | 5,281 | — | — | 1,817 | 5,281 | 7,098 | (62 | ) | 1969 | 09/30/14 | 10 to 30 Years | |||||||||||||||||||||
| Childress, TX | (f) | 747 | 934 | — | — | 747 | 934 | 1,681 | (248 | ) | 1997 | 05/23/05 | 7 to 40 years | |||||||||||||||||||||
| Cleveland, TX | (c ) | 465 | 2,867 | — | — | 465 | 2,867 | 3,332 | (1,235 | ) | 1991 | 12/01/05 | 15 to 20 years | |||||||||||||||||||||
| Conway, AR | (a) | 906 | 1,521 | — | — | 906 | 1,521 | 2,427 | (64 | ) | 1984 | 03/31/14 | 2 to 20 Years | |||||||||||||||||||||
| Corrigan, TX | (c ) | 395 | 630 | — | — | 395 | 630 | 1,025 | (314 | ) | 1971 | 12/01/05 | 15 to 20 years | |||||||||||||||||||||
| Dayton, TN | (b) | 1,122 | 6,767 | — | — | 1,122 | 6,767 | 7,889 | (60 | ) | 1999 | 09/30/14 | 10 to 40 Years | |||||||||||||||||||||
| Diboll, TX | (c ) | 775 | 872 | — | — | 775 | 872 | 1,647 | (446 | ) | 1974 | 12/01/05 | 15 to 20 years | |||||||||||||||||||||
| Eureka, CA | (c ) | 3,108 | 12,817 | — | — | 3,108 | 12,817 | 15,925 | (573 | ) | 1960 | 07/17/13 | 3 to 40 Years | |||||||||||||||||||||
| Fort Smith, AR | (a) | 837 | 1,831 | — | — | 837 | 1,831 | 2,668 | (72 | ) | 1994 | 04/30/14 | 3 to 20 Years | |||||||||||||||||||||
| Groveton, TX | (a) | 264 | 540 | — | — | 264 | 540 | 804 | (22 | ) | 1996 | 03/31/14 | 7 to 30 Years | |||||||||||||||||||||
| Hallettsville, TX | (b) | 550 | 1,545 | — | — | 550 | 1,545 | 2,095 | (58 | ) | 2003 | 03/31/14 | 10 to 30 Years | |||||||||||||||||||||
| Hartsville, SC | (b) | 696 | 5,402 | — | — | 696 | 5,402 | 6,098 | (49 | ) | 1988 | 09/30/14 | 10 to 40 Years | |||||||||||||||||||||
| Indianapolis, IN | (c ) | 1,640 | 8,063 | — | — | 1,640 | 8,063 | 9,703 | (425 | ) | 1999 | 07/17/13 | 7 to 33 Years | |||||||||||||||||||||
| LaGrange, GA | (c ) | 972 | 8,435 | — | — | 972 | 8,435 | 9,407 | (558 | ) | 1998 | 07/17/13 | 4 to 25 Years | |||||||||||||||||||||
| Lancaster, CA | (c ) | 1,569 | 4,271 | — | — | 1,569 | 4,271 | 5,840 | (188 | ) | 1983 | 12/17/13 | 5 to 30 Years | |||||||||||||||||||||
| Las Cruces, NM | (c ) | 1,132 | 2,765 | — | — | 1,132 | 2,765 | 3,897 | (126 | ) | 1983 | 12/17/13 | 5 to 30 Years | |||||||||||||||||||||
| Levelland, TX | (f) | 1,651 | 2,158 | — | — | 1,651 | 2,158 | 3,809 | (491 | ) | 1997 | 05/23/05 | 12 to 40 years | |||||||||||||||||||||
| Lorena, TX | (a) | 657 | 751 | — | — | 657 | 751 | 1,408 | (36 | ) | 1998 | 03/31/14 | 7 to 20 Years | |||||||||||||||||||||
| Lubbock, TX | (a) | 1,782 | 2,055 | — | — | 1,782 | 2,055 | 3,837 | (467 | ) | 1997 | 05/23/05 | 12 to 40 years | |||||||||||||||||||||
| Lufkin, TX | (c ) | 1,178 | 352 | — | — | 1,178 | 352 | 1,530 | (236 | ) | 1977 | 12/01/05 | 15 to 20 years | |||||||||||||||||||||
| McGregor, TX | (a) | 748 | 795 | — | — | 748 | 795 | 1,543 | (42 | ) | 1997 | 03/31/14 | 7 to 20 Years | |||||||||||||||||||||
| Midland, TX | (c ) | 1,498 | 3,096 | — | — | 1,498 | 3,096 | 4,594 | (192 | ) | 1983 | 12/17/13 | 5 to 20 Years | |||||||||||||||||||||
| Initial Cost to Company | Cost Capitalized Subsequent to Acquisition including impairment | Gross Amount at December 31, | Life in which depreciation in latest Statement of Operations is computed | ||||||||||||||||||||||
| Description | Encumbrances | Land and Improvements | Buildings and Improvements | Improvements/ Land | Improvements/ building | Land and Improvements | Buildings and Improvements | Total | Final Accum | Date of Construction | Date Acquired | ||||||||||||||
| Muleshoe, TX | (c ) | 471 | 1,770 | — | — | 471 | 1,770 | 2,241 | (205 | ) | 1999 | 08/29/11 | 8 to 40 Years | |||||||||||||||||||||
| Nashville, AR | (b) | 519 | 697 | — | — | 519 | 697 | 1,216 | (35 | ) | 1995 | 03/31/14 | 1 to 20 Years | |||||||||||||||||||||
| Navasota, TX | (c ) | 781 | 1,499 | — | — | 781 | 1,499 | 2,280 | (500 | ) | 1992 | 12/01/05 | 15 to 30 years | |||||||||||||||||||||
| Northlake, IL | (a) | 1,669 | 4,007 | — | — | 1,669 | 4,007 | 5,676 | (113 | ) | 2001 | 03/28/14 | 15 to 30 Years | |||||||||||||||||||||
| Omaha, NE | (c ) | 2,198 | 3,328 | — | — | 2,198 | 3,328 | 5,526 | (229 | ) | 1982 | 12/17/13 | 4 to 20 Years | |||||||||||||||||||||
| Perryton, TX | (a) | 1,029 | 597 | — | — | 1,029 | 597 | 1,626 | (187 | ) | 1997 | 05/23/05 | 7 to 40 years | |||||||||||||||||||||
| Plainview, TX | 4,065 | 620 | 5,415 | — | — | 620 | 5,415 | 6,035 | (1,065 | ) | 2000 | 08/25/05 | 15 to 40 years | |||||||||||||||||||||
| Rogers, AR | (a) | 1,028 | 1,685 | — | — | 1,028 | 1,685 | 2,713 | (70 | ) | 1985 | 03/31/14 | 6 to 20 Years | |||||||||||||||||||||
| Snyder, TX | (f) | 2,062 | 2,963 | — | — | 2,062 | 2,963 | 5,025 | (637 | ) | 1999 | 05/23/05 | 14 to 40 years | |||||||||||||||||||||
| St. Paul, MN | (a) | 1,262 | 1,016 | — | — | 1,262 | 1,016 | 2,278 | (32 | ) | 1980 | 03/31/14 | 15 to 30 Years | |||||||||||||||||||||
| Timpson, TX | (c ) | 253 | 312 | — | — | 253 | 312 | 565 | (171 | ) | 1978 | 12/01/05 | 15 to 20 years | |||||||||||||||||||||
| Vernon, TX | (a) | 1,791 | 2,550 | — | — | 1,791 | 2,550 | 4,341 | (580 | ) | 1997 | 05/23/05 | 12 to 40 years | |||||||||||||||||||||
| West St. Paul, MN | (a) | 828 | 1,026 | — | — | 828 | 1,026 | 1,854 | (35 | ) | 1980 | 03/31/14 | 15 to 30 Years | |||||||||||||||||||||
| Wichita Falls, TX | (f) | — | 6,259 | — | — | — | 6,259 | 6,259 | (2,454 | ) | 1997 | 05/23/05 | 13 to 20 years | |||||||||||||||||||||
| Woodbury, MN | (a) | 1,213 | 1,706 | — | — | 1,213 | 1,706 | 2,919 | (52 | ) | 1976 | 03/31/14 | 15 to 30 Years | |||||||||||||||||||||
| Wiggins, MS | (c) | 279 | 630 | — | — | 279 | 630 | 909 | (12 | ) | 1965 | 07/22/16 | 7 to 30 Years | ||||||||||||||||||||
| Willingboro, NJ | (a) | 784 | 1,369 | — | — | 784 | 1,369 | 2,153 | (179 | ) | 2007 | 07/17/13 | 9 to 47 Years | ||||||||||||||||||||
| Woodstock, GA | (a) | 1,108 | 1,281 | — | — | 1,108 | 1,281 | 2,389 | (131 | ) | 1999 | 03/28/14 | 15 to 40 Years | ||||||||||||||||||||
| Ypislianti, MI | (a) | 1,107 | 745 | — | — | 1,107 | 745 | 1,852 | (109 | ) | 1999 | 06/23/14 | 15 to 30 Years | ||||||||||||||||||||
| Zeeland, MI | (c) | 490 | 1,136 | — | — | 490 | 1,136 | 1,626 | (125 | ) | 2005 | 07/17/13 | 7 to 47 Years | ||||||||||||||||||||
| Apparel | ||||||||||||||||||||||||||||||||||
| Canton, MA | 37,101 | 28,693 | 27,813 | — | — | 28,693 | 27,813 | 56,506 | (7,390 | ) | 1962 | 02/01/06 | 15 to 30 years | |||||||||||||||||||||
| Fort Smith, AR | 9,385 | 3,124 | 8,264 | — | — | 3,124 | 8,264 | 11,388 | (823 | ) | 2001 | 07/17/13 | 7 to 27 Years | |||||||||||||||||||||
| Grand Forks, ND | (c ) | 1,516 | 10,008 | — | — | 1,516 | 10,008 | 11,524 | (408 | ) | 2006 | 07/17/13 | 9 to 46 Years | |||||||||||||||||||||
| Lake Zurich, IL | 9,075 | 4,860 | 6,935 | — | — | 4,860 | 6,935 | 11,795 | (528 | ) | 2000 | 07/17/13 | 7 to 32 Years | |||||||||||||||||||||
| Lenexa, KS | (b) | 919 | 2,476 | — | — | 919 | 2,476 | 3,395 | (113 | ) | 2005 | 07/17/13 | 2 to 47 Years | |||||||||||||||||||||
| Olathe, KS | (c ) | 3,505 | 5,847 | — | 279 | 3,505 | 6,126 | 9,631 | (409 | ) | 1995 | 07/17/13 | 9 to 35 Years | |||||||||||||||||||||
| Tilton, NH | (c ) | 3,959 | — | — | — | 3,959 | — | 3,959 | — | (g) | 07/17/13 | 13 to 13 Years | ||||||||||||||||||||||
| Tilton, NH | (c ) | 7,421 | 19,607 | — | — | 7,421 | 19,607 | 27,028 | (1,768 | ) | 1998 | 07/17/13 | 8 to 27 Years | |||||||||||||||||||||
| Voorhees, NJ | (a) | 2,027 | 6,776 | — | — | 2,027 | 6,776 | 8,803 | (742 | ) | 1970 | 07/17/13 | 5 to 25 Years | |||||||||||||||||||||
| Wichita, KS | (c ) | 2,163 | 7,036 | — | — | 2,163 | 7,036 | 9,199 | (420 | ) | 1996 | 07/17/13 | 8 to 36 Years | |||||||||||||||||||||
| Entertainment | |||||||||||||||||||||||||||||||||
| Addison, IL | (c) | 4,690 | 6,692 | — | — | 4,690 | 6,692 | 11,382 | (1,618 | ) | 1995 | 07/17/13 | 7 to 24 Years | ||||||||||||||||||||
| Augusta, GA | (c) | 1,081 | 1,488 | — | — | 1,081 | 1,488 | 2,569 | (161 | ) | 1998 | 09/30/15 | 10 to 20 Years | ||||||||||||||||||||
| Austin, TX | (c) | 4,425 | 8,142 | — | — | 4,425 | 8,142 | 12,567 | (2,724 | ) | 2005 | 09/30/05 | 15 to 40 Years | ||||||||||||||||||||
| Baton Rouge, LA | (c) | 1,076 | 2,289 | — | — | 1,076 | 2,289 | 3,365 | (100 | ) | 2015 | 11/13/15 | 10 to 40 Years | ||||||||||||||||||||
| Beaverton, OR | (a) | 5,608 | 8,733 | — | — | 5,608 | 8,733 | 14,341 | (704 | ) | 2010 | 06/30/14 | 15 to 40 Years | ||||||||||||||||||||
| Brentwood, TN | (c) | 2,292 | 2,273 | — | 2 | 2,292 | 2,275 | 4,567 | (190 | ) | 1970 | 09/30/15 | 9 to 20 Years | ||||||||||||||||||||
| Clovis, CA | (c) | 1,117 | — | — | — | 1,117 | — | 1,117 | — | (f) | 12/06/16 | (f) | |||||||||||||||||||||
| Conroe, TX | (c) | 2,886 | 5,763 | — | — | 2,886 | 5,763 | 8,649 | (1,817 | ) | 2004 | 09/30/05 | 15 to 40 Years | ||||||||||||||||||||
| Flowood, MS | (c) | 900 | 1,137 | — | — | 900 | 1,137 | 2,037 | (90 | ) | 1995 | 11/13/15 | 9 to 20 Years | ||||||||||||||||||||
| Fort Worth, TX | (c) | 2,468 | 5,418 | — | — | 2,468 | 5,418 | 7,886 | (1,721 | ) | 2003 | 09/30/05 | 15 to 40 Years | ||||||||||||||||||||
| Grapevine, TX | (c) | 2,554 | 5,377 | — | — | 2,554 | 5,377 | 7,931 | (1,725 | ) | 2000 | 09/30/05 | 15 to 40 Years | ||||||||||||||||||||
| Jenison, MI | (c) | 1,111 | 2,207 | — | — | 1,111 | 2,207 | 3,318 | (721 | ) | 1999 | 07/17/13 | 3 to 22 Years | ||||||||||||||||||||
| Knoxville, TN | (c) | 1,509 | 2,016 | 188 | 3,021 | 1,697 | 5,037 | 6,734 | (107 | ) | 1987 | 12/10/15 | 40 to 60 Years | ||||||||||||||||||||
| Las Vegas, NV | (b) | 3,225 | 30,483 | — | — | 3,225 | 30,483 | 33,708 | (2,505 | ) | 2007 | 07/17/13 | 13 to 55 Years | ||||||||||||||||||||
| Lewisville, TX | (c) | 2,130 | 4,630 | — | — | 2,130 | 4,630 | 6,760 | (1,492 | ) | 1998 | 09/30/05 | 15 to 40 Years | ||||||||||||||||||||
| Marietta, GA | (a) | 3,908 | 8,630 | (74 | ) | — | 3,834 | 8,630 | 12,464 | (3,373 | ) | 1992 | 07/01/05 | 15 to 30 Years | |||||||||||||||||||
| Pflugerville, TX | (a) | 6,182 | 1,349 | — | — | 6,182 | 1,349 | 7,531 | (256 | ) | 2003 | 08/29/14 | 15 to 30 Years | ||||||||||||||||||||
| Plano, TX | (c) | 3,225 | 6,302 | — | — | 3,225 | 6,302 | 9,527 | (1,969 | ) | 2001 | 09/30/05 | 15 to 40 Years | ||||||||||||||||||||
| Rogers, AR | (c) | 635 | 2,376 | — | — | 635 | 2,376 | 3,011 | (117 | ) | 2014 | 09/30/15 | 9 to 40 Years | ||||||||||||||||||||
| Tampa, FL | (c) | 1,588 | 6,134 | — | — | 1,588 | 6,134 | 7,722 | (290 | ) | 1990 | 06/05/15 | 15 to 40 Years | ||||||||||||||||||||
| Vancouver, WA | (a) | 2,077 | 9,395 | — | — | 2,077 | 9,395 | 11,472 | (663 | ) | 2006 | 06/30/14 | 15 to 40 Years | ||||||||||||||||||||
| Wilmington, NC | (c) | 837 | 1,429 | — | — | 837 | 1,429 | 2,266 | (127 | ) | 2006 | 09/30/15 | 9 to 20 Years | ||||||||||||||||||||
| Home Furnishings | ||||||||||||||||||||||||||||||||||
| Abilene, TX | (a) | 1,316 | 2,649 | — | — | 1,316 | 2,649 | 3,965 | (725 | ) | 2000 | 05/19/05 | 15 to 40 years | |||||||||||||||||||||
| Alpharetta, GA | (b) | 2,819 | 3,139 | — | — | 2,819 | 3,139 | 5,958 | (152 | ) | 2000 | 07/17/13 | 5 to 43 Years | |||||||||||||||||||||
| Amarillo, TX | 4,026 | 1,481 | 4,999 | — | — | 1,481 | 4,999 | 6,480 | (304 | ) | 1980 | 07/17/13 | 9 to 36 Years | |||||||||||||||||||||
| Ashland, KY | (a) | 775 | 2,037 | — | — | 775 | 2,037 | 2,812 | (606 | ) | 1990 | 07/06/07 | 12 to 27 years | |||||||||||||||||||||
| Ashland, KY | (a) | 629 | 754 | — | — | 629 | 754 | 1,383 | (259 | ) | 1993 | 07/06/07 | 12 to 27 years | |||||||||||||||||||||
| Bensalem, PA | (a) | 1,653 | 3,085 | — | — | 1,653 | 3,085 | 4,738 | (976 | ) | 1987 | 01/03/07 | 15 to 30 years | |||||||||||||||||||||
| Chicago, IL | 17,026 | 4,893 | 1,000 | (2,352 | ) | (471 | ) | 2,541 | 529 | 3,070 | (70 | ) | 2007 | 07/17/13 | 10 to 48 Years | |||||||||||||||||||
| Chillicothe, OH | (a) | 499 | 2,296 | — | — | 499 | 2,296 | 2,795 | (678 | ) | 1995 | 07/06/07 | 12 to 27 years | |||||||||||||||||||||
| Collierville, TN | (b) | 1,114 | 6,726 | — | — | 1,114 | 6,726 | 7,840 | (418 | ) | 2012 | 07/17/13 | 9 to 49 Years | |||||||||||||||||||||
| Columbia, SC | (b) | 596 | 872 | — | 216 | 596 | 1,088 | 1,684 | (46 | ) | 1998 | 07/17/13 | 13 to 45 Years | |||||||||||||||||||||
| Home Furnishings | |||||||||||||||||||||||||||||||||
| Abilene, TX | (a) | 1,316 | 2,649 | — | — | 1,316 | 2,649 | 3,965 | (921 | ) | 2000 | 05/19/05 | 15 to 40 Years | ||||||||||||||||||||
| Alpharetta, GA | (c) | 2,819 | 3,139 | — | — | 2,819 | 3,139 | 5,958 | (368 | ) | 2000 | 07/17/13 | 5 to 43 Years | ||||||||||||||||||||
| Amarillo, TX | (c) | 1,481 | 4,999 | — | — | 1,481 | 4,999 | 6,480 | (733 | ) | 2001 | 07/17/13 | 9 to 36 Years | ||||||||||||||||||||
| Anderson, SC | (b) | 870 | 1,909 | — | — | 870 | 1,909 | 2,779 | (274 | ) | 2006 | 07/17/13 | 8 to 40 Years | ||||||||||||||||||||
| Ashland, KY | (a) | 775 | 2,037 | — | — | 775 | 2,037 | 2,812 | (770 | ) | 1990 | 08/27/09 | 12 to 27 Years | ||||||||||||||||||||
| Ashland, KY | (a) | 629 | 754 | — | — | 629 | 754 | 1,383 | (329 | ) | 1993 | 08/27/09 | 12 to 27 Years | ||||||||||||||||||||
| Bensalem, PA | (a) | 1,653 | 3,085 | — | — | 1,653 | 3,085 | 4,738 | (1,240 | ) | 1987 | 01/03/07 | 15 to 30 Years | ||||||||||||||||||||
| Chillicothe, OH | (a) | 499 | 2,296 | — | — | 499 | 2,296 | 2,795 | (861 | ) | 1995 | 08/27/09 | 12 to 27 Years | ||||||||||||||||||||
| Columbia, SC | (c) | 596 | 872 | — | 216 | 596 | 1,088 | 1,684 | (150 | ) | 1998 | 07/17/13 | 9 to 45 Years | ||||||||||||||||||||
| Douglasville, GA | (c) | 2,612 | 4,840 | — | 87 | 2,612 | 4,927 | 7,539 | (1,042 | ) | 2006 | 07/17/13 | 4 to 39 Years | ||||||||||||||||||||
| Eau Claire, WI | (a) | 1,597 | 6,964 | — | — | 1,597 | 6,964 | 8,561 | (2,766 | ) | 2004 | 04/08/05 | 15 to 30 Years | ||||||||||||||||||||
| El Paso, TX | (a) | 1,536 | 3,852 | — | — | 1,536 | 3,852 | 5,388 | (1,552 | ) | 1973 | 07/01/05 | 14 to 30 Years | ||||||||||||||||||||
| Fairless Hills, PA | (a) | 3,655 | 5,271 | — | — | 3,655 | 5,271 | 8,926 | (2,237 | ) | 1994 | 01/03/07 | 15 to 30 Years | ||||||||||||||||||||
| Fargo, ND | (c) | 2,095 | 8,525 | — | — | 2,095 | 8,525 | 10,620 | (1,065 | ) | 2005 | 07/17/13 | 8 to 32 Years | ||||||||||||||||||||
| Initial Cost to Company | Cost Capitalized Subsequent to Acquisition including impairment | Gross Amount at December 31, | Life in which depreciation in latest Statement of Operations is computed | ||||||||||||||||||||||
| Description | Encumbrances | Land and Improvements | Buildings and Improvements | Improvements/ Land | Improvements/ building | Land and Improvements | Buildings and Improvements | Total | Final Accum | Date of Construction | Date Acquired | ||||||||||||||
| Denver, CO | (c ) | 7,840 | 9,299 | — | — | 7,840 | 9,299 | 17,139 | (1,143 | ) | 1991 | 07/17/13 | 5 to 20 Years | |||||||||||||||||||||
| Eau Claire, WI | (a) | 1,597 | 6,964 | — | — | 1,597 | 6,964 | 8,561 | (2,178 | ) | 2004 | 04/08/05 | 15 to 30 years | |||||||||||||||||||||
| El Paso, TX | (a) | 1,536 | 3,852 | — | — | 1,536 | 3,852 | 5,388 | (1,223 | ) | 1973 | 10/29/04 | 15 to 30 years | |||||||||||||||||||||
| Fairless Hills, PA | (a) | 3,655 | 5,271 | — | — | 3,655 | 5,271 | 8,926 | (1,762 | ) | 1994 | 01/03/07 | 15 to 30 years | |||||||||||||||||||||
| Fargo, ND | 4,800 | 2,095 | 8,525 | — | — | 2,095 | 8,525 | 10,620 | (441 | ) | 2004 | 07/17/13 | 8 to 32 Years | |||||||||||||||||||||
| Glendale, AZ | (b) | 1,395 | 4,242 | — | — | 1,395 | 4,242 | 5,637 | (242 | ) | 2001 | 07/17/13 | 2 to 45 Years | |||||||||||||||||||||
| Hermantown, MN | (a) | 1,881 | 7,761 | — | — | 1,881 | 7,761 | 9,642 | (1,808 | ) | 2003 | 04/08/05 | 15 to 40 years | |||||||||||||||||||||
| Hurricane, WV | (a) | 727 | 3,005 | — | — | 727 | 3,005 | 3,732 | (856 | ) | 1998 | 07/06/07 | 12 to 27 years | |||||||||||||||||||||
| Independence, MO | (c ) | 2,157 | 2,597 | — | — | 2,157 | 2,597 | 4,754 | (263 | ) | 1999 | 07/17/13 | 7 to 21 Years | |||||||||||||||||||||
| Kentwood, MI | (b) | 1,145 | 4,085 | — | — | 1,145 | 4,085 | 5,230 | (188 | ) | 1986 | 07/17/13 | 4 to 38 Years | |||||||||||||||||||||
| Maple Shade, NJ | (b) | 1,942 | 3,792 | — | — | 1,942 | 3,792 | 5,734 | (375 | ) | 2007 | 07/17/13 | 5 to 25 Years | |||||||||||||||||||||
| Morrisville, PA | (a) | 1,345 | 8,288 | — | — | 1,345 | 8,288 | 9,633 | (2,171 | ) | 2004 | 01/03/07 | 15 to 40 years | |||||||||||||||||||||
| Newington, CT | (c ) | 1,778 | 4,496 | — | — | 1,778 | 4,496 | 6,274 | (191 | ) | 2006 | 07/17/13 | 8 to 45 Years | |||||||||||||||||||||
| Parkersburg, WV | (a) | 1,800 | 3,183 | — | — | 1,800 | 3,183 | 4,983 | (1,054 | ) | 1976 | 07/06/07 | 12 to 27 years | |||||||||||||||||||||
| Pocatello, ID | 17,250 | 3,682 | 10,658 | — | — | 3,682 | 10,658 | 14,340 | (688 | ) | 2006 | 07/17/13 | 5 to 38 Years | |||||||||||||||||||||
| Portsmouth, OH | (a) | 561 | 1,563 | — | — | 561 | 1,563 | 2,124 | (484 | ) | 1988 | 07/06/07 | 12 to 27 years | |||||||||||||||||||||
| Reading, PA | 4,257 | 449 | 3,222 | — | — | 449 | 3,222 | 3,671 | (118 | ) | 1997 | 07/17/13 | 8 to 40 Years | |||||||||||||||||||||
| South Point, OH | (a) | 848 | 2,948 | — | — | 848 | 2,948 | 3,796 | (859 | ) | 1990 | 07/06/07 | 12 to 27 years | |||||||||||||||||||||
| St. Louis, MO | (a) | 785 | 1,023 | — | — | 785 | 1,023 | 1,808 | (46 | ) | 1989 | 08/30/13 | 15 to 40 Years | |||||||||||||||||||||
| Staunton, VA | (b) | 578 | 2,063 | — | 264 | 578 | 2,327 | 2,905 | (213 | ) | 1988 | 07/17/13 | 5 to 20 Years | |||||||||||||||||||||
| Victoria, TX | 8,288 | 2,631 | 7,710 | — | — | 2,631 | 7,710 | 10,341 | (506 | ) | 2006 | 07/17/13 | 3 to 43 Years | |||||||||||||||||||||
| Glendale, AZ | (c) | 1,395 | 4,242 | — | — | 1,395 | 4,242 | 5,637 | (534 | ) | 2001 | 07/17/13 | 2 to 45 Years | ||||||||||||||||||||
| Hermantown, MN | (a) | 1,881 | 7,761 | — | — | 1,881 | 7,761 | 9,642 | (2,295 | ) | 2003 | 04/08/05 | 15 to 40 Years | ||||||||||||||||||||
| Horseheads, NY | (a) | 1,376 | 12,506 | — | — | 1,376 | 12,506 | 13,882 | (339 | ) | 2005 | 10/06/15 | 15 to 50 Years | ||||||||||||||||||||
| Houston, TX | (c) | 2,150 | 2,320 | — | 1,601 | 2,150 | 3,921 | 6,071 | (109 | ) | 1995 | 07/17/13 | 38 to 40 Years | ||||||||||||||||||||
| Hurricane, WV | (a) | 727 | 3,005 | — | — | 727 | 3,005 | 3,732 | (1,087 | ) | 1998 | 08/27/09 | 12 to 27 Years | ||||||||||||||||||||
| Independence, MO | (b) | 2,157 | 2,597 | — | — | 2,157 | 2,597 | 4,754 | (633 | ) | 1999 | 07/17/13 | 7 to 21 Years | ||||||||||||||||||||
| Johnson City, NY | (a) | 1,459 | 10,433 | — | — | 1,459 | 10,433 | 11,892 | (363 | ) | 1978 | 10/06/15 | 15 to 40 Years | ||||||||||||||||||||
| Kentwood, MI | (c) | 1,145 | 4,085 | — | — | 1,145 | 4,085 | 5,230 | (452 | ) | 1987 | 07/17/13 | 4 to 38 Years | ||||||||||||||||||||
| Maple Shade, NJ | (c) | 1,942 | 3,792 | — | — | 1,942 | 3,792 | 5,734 | (906 | ) | 1998 | 07/17/13 | 5 to 25 Years | ||||||||||||||||||||
| Morrisville, PA | (a) | 1,345 | 8,288 | — | — | 1,345 | 8,288 | 9,633 | (2,756 | ) | 2004 | 01/03/07 | 15 to 40 Years | ||||||||||||||||||||
| Newington, CT | (b) | 1,778 | 4,496 | — | — | 1,778 | 4,496 | 6,274 | (461 | ) | 2006 | 07/17/13 | 8 to 45 Years | ||||||||||||||||||||
| Parkersburg, WV | (a) | 1,800 | 3,183 | — | — | 1,800 | 3,183 | 4,983 | (1,338 | ) | 1976 | 08/27/09 | 12 to 27 Years | ||||||||||||||||||||
| Portsmouth, OH | (a) | 561 | 1,563 | — | — | 561 | 1,563 | 2,124 | (615 | ) | 1988 | 08/27/09 | 12 to 27 Years | ||||||||||||||||||||
| Reading, PA | (c) | 449 | 3,222 | — | — | 449 | 3,222 | 3,671 | (283 | ) | 1998 | 07/17/13 | 8 to 40 Years | ||||||||||||||||||||
| Salt Lake City, UT | (b) | 4,955 | 18,250 | (3,205 | ) | (11,979 | ) | 1,750 | 6,271 | 8,021 | (1,693 | ) | 1989 | 07/17/13 | 3 to 40 Years | ||||||||||||||||||
| South Point, OH | (a) | 848 | 2,948 | — | — | 848 | 2,948 | 3,796 | (1,091 | ) | 1990 | 08/27/09 | 12 to 27 Years | ||||||||||||||||||||
| St. Louis, MO | (a) | 785 | 1,023 | — | — | 785 | 1,023 | 1,808 | (114 | ) | 1996 | 08/30/13 | 15 to 40 Years | ||||||||||||||||||||
| Staunton, VA | (c) | 578 | 2,062 | — | 276 | 578 | 2,338 | 2,916 | (550 | ) | 1988 | 07/17/13 | 5 to 20 Years | ||||||||||||||||||||
| Health and Fitness | ||||||||||||||||||||||||||||||||||
| Aurora, CO | 4,777 | 1,452 | 4,413 | — | — | 1,452 | 4,413 | 5,865 | (233 | ) | 1995 | 07/17/13 | 11 to 30 Years | |||||||||||||||||||||
| Brooklyn Park, MN | (c ) | 3,176 | 7,771 | — | — | 3,176 | 7,771 | 10,947 | (450 | ) | 2008 | 07/17/13 | 10 to 35 Years | |||||||||||||||||||||
| Chandler, AZ | (a) | 1,028 | 5,318 | — | — | 1,028 | 5,318 | 6,346 | (233 | ) | 2001 | 07/17/13 | 8 to 40 Years | |||||||||||||||||||||
| Chicago, IL | (a) | 1,009 | 2,965 | — | — | 1,009 | 2,965 | 3,974 | (105 | ) | 2008 | 12/09/13 | 14 to 40 Years | |||||||||||||||||||||
| Clinton Township, MI | (a) | 5,430 | 7,254 | �� | (2,562 | ) | (1,160 | ) | 2,868 | 6,094 | 8,962 | (251 | ) | 1999 | 01/09/07 | 3 to 30 years | ||||||||||||||||||
| Greenwood, IN | (c ) | 1,973 | 9,764 | — | — | 1,973 | 9,764 | 11,737 | (417 | ) | 2007 | 07/17/13 | 10 to 42 Years | |||||||||||||||||||||
| Keizer, OR | (a) | 1,208 | 4,089 | — | — | 1,208 | 4,089 | 5,297 | (969 | ) | 1988 | 12/01/05 | 15 to 40 years | |||||||||||||||||||||
| League City, TX | (c ) | 2,514 | 6,767 | — | — | 2,514 | 6,767 | 9,281 | (320 | ) | 2008 | 07/17/13 | 10 to 42 Years | |||||||||||||||||||||
| Matteson, IL | (c ) | 4,587 | 6,328 | — | — | 4,587 | 6,328 | 10,915 | (372 | ) | 2007 | 07/17/13 | 10 to 34 Years | |||||||||||||||||||||
| Modesto, CA | (b) | 2,350 | 5,923 | — | — | 2,350 | 5,923 | 8,273 | (23 | ) | 1964 | 12/05/14 | 10 to 30 Years | |||||||||||||||||||||
| Naperville, IL | (c ) | 5,015 | 6,946 | — | — | 5,015 | 6,946 | 11,961 | (368 | ) | 2007 | 07/17/13 | 9 to 38 Years | |||||||||||||||||||||
| O' Fallon, MO | 5,425 | 1,669 | 6,054 | — | — | 1,669 | 6,054 | 7,723 | (319 | ) | 2007 | 07/17/13 | 9 to 34 Years | |||||||||||||||||||||
| O'Fallon, IL | 3,650 | 2,243 | 5,002 | — | — | 2,243 | 5,002 | 7,245 | (283 | ) | 2005 | 07/17/13 | 6 to 37 Years | |||||||||||||||||||||
| Olathe, KS | 4,817 | 1,816 | 5,526 | — | — | 1,816 | 5,526 | 7,342 | (278 | ) | 2007 | 07/17/13 | 12 to 39 Years | |||||||||||||||||||||
| Education | |||||||||||||||||||||||||||||||||
| Alpena, MI | (a) | 236 | 2,051 | (186 | ) | (1,751 | ) | 50 | 300 | 350 | — | 1936 | 03/17/06 | 13 to 20 Years | |||||||||||||||||||
| Arlington, TX | (a) | 365 | 532 | — | — | 365 | 532 | 897 | (126 | ) | 2006 | 07/17/13 | 10 to 33 Years | ||||||||||||||||||||
| Barrington, IL | (a) | 1,180 | 5,939 | — | — | 1,180 | 5,939 | 7,119 | (447 | ) | 2008 | 05/30/14 | 15 to 40 Years | ||||||||||||||||||||
| Burlington, NC | (c) | 306 | 533 | — | — | 306 | 533 | 839 | (2 | ) | 1971 | 12/13/16 | 7 to 20 Years | ||||||||||||||||||||
| Chattanoga, TN | (a) | 684 | 841 | — | 11 | 684 | 852 | 1,536 | (10 | ) | 1999 | 09/28/16 | 10 to 30 Years | ||||||||||||||||||||
| Chicago, IL | (a) | 5,057 | 5,939 | — | — | 5,057 | 5,939 | 10,996 | (416 | ) | 2009 | 05/30/14 | 15 to 40 Years | ||||||||||||||||||||
| Columbus, GA | (c) | 342 | 1,096 | — | 30 | 342 | 1,126 | 1,468 | (44 | ) | 2015 | 12/22/15 | 15 to 40 Years | ||||||||||||||||||||
| Columbus, OH | (a) | 417 | 5,100 | — | 849 | 417 | 5,949 | 6,366 | (2,248 | ) | 1980 | 03/17/06 | 13 to 30 Years | ||||||||||||||||||||
| Columbus, OH | (a) | 1,069 | 3,363 | 330 | 1,340 | 1,399 | 4,703 | 6,102 | (2,590 | ) | 2004 | 03/17/06 | 13 to 20 Years | ||||||||||||||||||||
| Cuyahoga Falls, OH | (a) | 279 | 727 | — | — | 279 | 727 | 1,006 | (158 | ) | 1974 | 07/17/13 | 8 to 25 Years | ||||||||||||||||||||
| Dalton, GA | (a) | 396 | 1,396 | — | — | 396 | 1,396 | 1,792 | (24 | ) | 1996 | 06/29/16 | 10 to 40 Years | ||||||||||||||||||||
| Denton, TX | (c) | 627 | 1,909 | — | — | 627 | 1,909 | 2,536 | (116 | ) | 2000 | 07/17/15 | 15 to 30 Years | ||||||||||||||||||||
| Duluth, GA | (a) | 2,289 | 4,274 | — | — | 2,289 | 4,274 | 6,563 | (1,704 | ) | 2007 | 12/23/08 | 13 to 48 Years | ||||||||||||||||||||
| East Point, GA | (c) | 411 | 1,279 | — | — | 411 | 1,279 | 1,690 | (4 | ) | 2016 | 12/13/16 | 14 to 40 Years | ||||||||||||||||||||
| Elon, NC | (c) | 486 | 846 | — | — | 486 | 846 | 1,332 | (3 | ) | 1998 | 12/02/16 | 4 to 30 Years | ||||||||||||||||||||
| Evans, GA | (c) | 508 | 640 | — | — | 508 | 640 | 1,148 | (64 | ) | 2003 | 11/14/14 | 15 to 30 Years | ||||||||||||||||||||
| Initial Cost to Company | Cost Capitalized Subsequent to Acquisition including impairment | Gross Amount at December 31, | Life in which depreciation in latest Statement of Operations is computed | ||||||||||||||||||||||
| Description | Encumbrances | Land and Improvements | Buildings and Improvements | Improvements/ Land | Improvements/ building | Land and Improvements | Buildings and Improvements | Total | Final Accum | Date of Construction | Date Acquired | ||||||||||||||
| Phoenix, AZ | (b) | 642 | 2,245 | — | — | 642 | 2,245 | 2,887 | (23 | ) | 1988 | 09/30/14 | 14 to 30 Years | |||||||||||||||||||||
| Saint Cloud, MN | (a) | 912 | 1,427 | — | — | 912 | 1,427 | 2,339 | — | 1989 | 12/16/14 | 15 to 20 Years | ||||||||||||||||||||||
| Salem, OR | (a) | 941 | 2,620 | 1,018 | 5,041 | 1,959 | 7,661 | 9,620 | (1,733 | ) | 1996 | 12/01/05 | 15 to 40 years | |||||||||||||||||||||
| Salem, OR | (a) | 1,509 | 5,635 | — | — | 1,509 | 5,635 | 7,144 | (1,327 | ) | 2001 | 12/01/05 | 15 to 40 years | |||||||||||||||||||||
| Salem, OR | (a) | 1,214 | 4,911 | — | — | 1,214 | 4,911 | 6,125 | (1,176 | ) | 1980 | 12/01/05 | 15 to 40 years | |||||||||||||||||||||
| Salem, OR | (a) | 1,589 | 3,834 | — | — | 1,589 | 3,834 | 5,423 | (1,225 | ) | 1977 | 12/01/05 | 15 to 30 years | |||||||||||||||||||||
| Sartell, MN | (a) | 3,092 | 3,765 | — | — | 3,092 | 3,765 | 6,857 | — | 2001 | 12/16/14 | 15 to 30 Years | ||||||||||||||||||||||
| Southaven, MS | (b) | 1,187 | 1,817 | — | — | 1,187 | 1,817 | 3,004 | (19 | ) | 2014 | 09/17/14 | 15 to 40 Years | |||||||||||||||||||||
| St. Peters, MO | 4,721 | 1,814 | 5,810 | — | — | 1,814 | 5,810 | 7,624 | (343 | ) | 2007 | 07/17/13 | 9 to 34 Years | |||||||||||||||||||||
| West Chester, OH | (c ) | 606 | 9,832 | — | — | 606 | 9,832 | 10,438 | (369 | ) | 2009 | 07/17/13 | 7 to 43 Years | |||||||||||||||||||||
| Fort Worth, TX | (c) | 392 | 871 | — | — | 392 | 871 | 1,263 | (65 | ) | 2006 | 07/17/15 | 15 to 30 Years | ||||||||||||||||||||
| Ft. Walton Beach, FL | (c) | 200 | 491 | — | — | 200 | 491 | 691 | (37 | ) | 1977 | 02/27/15 | 15 to 30 Years | ||||||||||||||||||||
| Grand Prairie, TX | (c) | 1,057 | 2,350 | — | — | 1,057 | 2,350 | 3,407 | (164 | ) | 2007 | 07/17/15 | 15 to 30 Years | ||||||||||||||||||||
| Grand Rapids, MI | (c) | 393 | 1,363 | — | — | 393 | 1,363 | 1,756 | (107 | ) | 2001 | 03/20/15 | 5 to 30 Years | ||||||||||||||||||||
| Greensboro, NC | (c) | 360 | 540 | — | — | 360 | 540 | 900 | (2 | ) | 1949 | 12/02/16 | 9 to 30 Years | ||||||||||||||||||||
| Hampton, GA | (c) | 391 | 460 | — | — | 391 | 460 | 851 | (28 | ) | 2005 | 12/22/15 | 15 to 30 Years | ||||||||||||||||||||
| Henderson, NV | (c) | 2,757 | 6,113 | — | — | 2,757 | 6,113 | 8,870 | (580 | ) | 2010 | 05/16/14 | 15 to 40 Years | ||||||||||||||||||||
| High Point, NC | (c) | 206 | 978 | — | — | 206 | 978 | 1,184 | (39 | ) | 1981 | 12/22/15 | 15 to 30 Years | ||||||||||||||||||||
| Humble, TX | (c) | 2,108 | 7,208 | — | — | 2,108 | 7,208 | 9,316 | (829 | ) | 2012 | 12/10/13 | 15 to 40 Years | ||||||||||||||||||||
| Lake Mary, FL | (c) | 1,209 | 1,733 | — | 851 | 1,209 | 2,584 | 3,793 | (172 | ) | 2005 | 09/19/14 | 15 to 40 Years | ||||||||||||||||||||
| Leawood, KS | (a) | 1,854 | 3,914 | — | — | 1,854 | 3,914 | 5,768 | (1,668 | ) | 1999 | 09/29/05 | 15 to 30 Years | ||||||||||||||||||||
| Lone Tree, CO | (a) | 2,020 | 3,748 | — | — | 2,020 | 3,748 | 5,768 | (1,534 | ) | 1999 | 09/29/05 | 15 to 30 Years | ||||||||||||||||||||
| Manchester Center, VT | (a) | 1,198 | 4,688 | (911 | ) | (3,475 | ) | 287 | 1,213 | 1,500 | — | 1935 | 12/07/05 | 14 to 40 Years | |||||||||||||||||||
| Marietta, GA | (a) | 538 | 792 | — | 11 | 538 | 803 | 1,341 | (10 | ) | 2009 | 09/28/16 | 11 to 30 Years | ||||||||||||||||||||
| McKinney, TX | (c) | 1,056 | 6,696 | — | 31 | 1,056 | 6,727 | 7,783 | (146 | ) | 2015 | 01/29/16 | 17 to 50 Years | ||||||||||||||||||||
| Mesquite, TX | (c) | 2,534 | 1,780 | — | — | 2,534 | 1,780 | 4,314 | (476 | ) | 1996 | 07/17/13 | 8 to 23 Years | ||||||||||||||||||||
| Modesto, CA | (a) | 386 | 664 | — | — | 386 | 664 | 1,050 | (142 | ) | 1986 | 07/17/13 | 9 to 22 Years | ||||||||||||||||||||
| Morrisville, NC | (c) | 544 | 1,378 | — | — | 544 | 1,378 | 1,922 | (96 | ) | 2010 | 02/19/15 | 15 to 40 Years | ||||||||||||||||||||
| Mt. Laurel, NJ | (a) | 1,404 | 5,655 | — | — | 1,404 | 5,655 | 7,059 | (1,409 | ) | 2007 | 05/01/09 | 13 to 48 Years | ||||||||||||||||||||
| Nashville, TN | (c) | 2,461 | 1,427 | — | — | 2,461 | 1,427 | 3,888 | (89 | ) | 1976 | 03/27/15 | 15 to 40 Years | ||||||||||||||||||||
| Norcross, GA | (c) | 831 | 624 | — | — | 831 | 624 | 1,455 | (75 | ) | 1985 | 03/30/15 | 15 to 20 Years | ||||||||||||||||||||
| Oklahoma City, OK | (a) | 290 | 341 | — | — | 290 | 341 | 631 | (90 | ) | 1985 | 07/17/13 | 11 to 19 Years | ||||||||||||||||||||
| Orlando, FL | (c) | 1,925 | 2,529 | — | — | 1,925 | 2,529 | 4,454 | (221 | ) | 2007 | 09/19/14 | 15 to 40 Years | ||||||||||||||||||||
| Phoenix, AZ | (a) | 1,841 | 3,582 | 265 | 22 | 2,106 | 3,604 | 5,710 | (1,279 | ) | 1975 | 07/01/05 | 3 to 40 Years | ||||||||||||||||||||
| Pittsburgh, PA | (a) | 457 | 693 | — | — | 457 | 693 | 1,150 | (226 | ) | 1985 | 07/17/13 | 5 to 15 Years | ||||||||||||||||||||
| Riverdale, GA | (a) | 663 | 1,336 | — | 32 | 663 | 1,368 | 2,031 | (27 | ) | 1998 | 06/29/16 | 10 to 40 Years | ||||||||||||||||||||
| Riverdale, GA | (a) | 436 | 525 | — | — | 436 | 525 | 961 | (11 | ) | 1965 | 06/29/16 | 10 to 40 Years | ||||||||||||||||||||
| Rochester, NY | (a) | 242 | 539 | — | — | 242 | 539 | 781 | (101 | ) | 1981 | 07/17/13 | 8 to 28 Years | ||||||||||||||||||||
| Romeoville, IL | (a) | 1,684 | 5,676 | — | — | 1,684 | 5,676 | 7,360 | (1,297 | ) | 2008 | 11/07/08 | 14 to 49 Years | ||||||||||||||||||||
| Sanford, FL | (c) | 1,028 | 1,310 | — | — | 1,028 | 1,310 | 2,338 | (140 | ) | 2003 | 09/19/14 | 15 to 40 Years | ||||||||||||||||||||
| Sanford, NC | (c) | 200 | 611 | — | — | 200 | 611 | 811 | (46 | ) | 2002 | 02/27/15 | 15 to 30 Years | ||||||||||||||||||||
| Stockbridge, GA | (c) | 533 | 1,236 | — | (16 | ) | 533 | 1,220 | 1,753 | (121 | ) | 2000 | 10/31/14 | 15 to 30 Years | |||||||||||||||||||
| The Woodlands, TX | (c) | 2,039 | 7,154 | — | — | 2,039 | 7,154 | 9,193 | (824 | ) | 2011 | 09/25/13 | 15 to 40 Years | ||||||||||||||||||||
| Warner Robins, GA | (c) | 431 | 620 | — | — | 431 | 620 | 1,051 | (69 | ) | 1995 | 02/27/15 | 15 to 20 Years | ||||||||||||||||||||
| Warrenville, IL | (a) | 2,542 | 3,813 | — | — | 2,542 | 3,813 | 6,355 | (1,701 | ) | 1999 | 09/29/05 | 15 to 30 Years | ||||||||||||||||||||
| Westmont, IL | (a) | 1,375 | 5,087 | — | — | 1,375 | 5,087 | 6,462 | (1,432 | ) | 2003 | 12/28/05 | 15 to 40 Years | ||||||||||||||||||||
| Education | |||||||||||||||||||||||||||||||||
| Alpena, MI | (a) | 236 | 2,051 | — | — | 236 | 2,051 | 2,287 | (922 | ) | 1936 | 12/17/04 | 15 to 20 years | ||||||||||||||||||||
| Anderson, SC | (c ) | 870 | 1,909 | — | — | 870 | 1,909 | 2,779 | (114 | ) | 2006 | 07/17/13 | 8 to 40 Years | ||||||||||||||||||||
| Arlington, TX | (a) | 365 | 532 | — | — | 365 | 532 | 897 | (52 | ) | 2006 | 07/17/13 | 10 to 33 Years | ||||||||||||||||||||
| Barrington, IL | (a) | 1,180 | 5,939 | — | — | 1,180 | 5,939 | 7,119 | (101 | ) | 2009 | 05/30/14 | 15 to 40 Years | ||||||||||||||||||||
| Chicago, IL | (a) | 5,057 | 5,939 | — | — | 5,057 | 5,939 | 10,996 | (94 | ) | 2009 | 05/30/14 | 15 to 40 Years | ||||||||||||||||||||
| Columbus, OH | (a) | 417 | 5,100 | — | 849 | 417 | 5,949 | 6,366 | (1,764 | ) | 1980 | 11/15/04 | 15 to 30 years | ||||||||||||||||||||
| Columbus, OH | (a) | 1,069 | 3,363 | 330 | 1,340 | 1,399 | 4,703 | 6,102 | (2,020 | ) | 2004 | 12/17/04 | 15 to 20 years | ||||||||||||||||||||
| Cummington, MA | (a) | 1,177 | 4,439 | — | — | 1,177 | 4,439 | 5,616 | (1,477 | ) | 1900 | 12/07/05 | 15 to 30 years | ||||||||||||||||||||
| Cuyahoga Falls, OH | (a) | 279 | 727 | — | — | 279 | 727 | 1,006 | (66 | ) | 1974 | 07/17/13 | 8 to 25 Years | ||||||||||||||||||||
| Duluth, GA | (a) | 2,289 | 4,274 | — | — | 2,289 | 4,274 | 6,563 | (1,336 | ) | 2007 | 09/27/07 | 13 to 48 years | ||||||||||||||||||||
| Evans, GA | (b) | 508 | 640 | — | — | 508 | 640 | 1,148 | (5 | ) | 2003 | 11/14/14 | 15 to 30 Years | ||||||||||||||||||||
| Grand Chute, WI | (c ) | 1,524 | 1,666 | — | — | 1,524 | 1,666 | 3,190 | (561 | ) | 2005 | 07/18/05 | 15 to 50 years | ||||||||||||||||||||
| Henderson, NV | (e) | 2,757 | 6,113 | — | — | 2,757 | 6,113 | 8,870 | (132 | ) | 2010 | 05/16/14 | 15 to 40 Years | ||||||||||||||||||||
| Hendersonville, NC | (a) | 692 | 2,469 | — | — | 692 | 2,469 | 3,161 | (894 | ) | 1956 | 12/07/05 | 15 to 30 years | ||||||||||||||||||||
| Humble, TX | (e) | 2,108 | 7,208 | — | — | 2,108 | 7,208 | 9,316 | (291 | ) | 2012 | 12/10/13 | 15 to 40 Years | ||||||||||||||||||||
| Lake Mary, FL | (b) | 1,209 | 1,733 | — | — | 1,209 | 1,733 | 2,942 | (19 | ) | 2005 | 09/19/14 | 15 to 40 Years | ||||||||||||||||||||
| Leawood, KS | (a) | 1,854 | 3,914 | — | — | 1,854 | 3,914 | 5,768 | (1,314 | ) | 1999 | 09/29/05 | 15 to 30 years | ||||||||||||||||||||
| Lone Tree, CO | (a) | 2,020 | 3,748 | — | — | 2,020 | 3,748 | 5,768 | (1,209 | ) | 1999 | 09/29/05 | 15 to 30 years | ||||||||||||||||||||
| Manchester Center, VT | (a) | 1,198 | 4,688 | — | — | 1,198 | 4,688 | 5,886 | (1,334 | ) | 1935 | 12/07/05 | 15 to 40 years | ||||||||||||||||||||
| Mesquite, TX | (b) | 2,534 | 1,780 | — | — | 2,534 | 1,780 | 4,314 | (197 | ) | 1996 | 07/17/13 | 8 to 23 Years | ||||||||||||||||||||
| Modesto, CA | (a) | 386 | 664 | — | — | 386 | 664 | 1,050 | (59 | ) | 1986 | 07/17/13 | 9 to 22 Years | ||||||||||||||||||||
| Mt. Laurel, NJ | (a) | 1,404 | 5,655 | — | — | 1,404 | 5,655 | 7,059 | (1,096 | ) | 2007 | 12/21/07 | 13 to 48 years | ||||||||||||||||||||
| Oklahoma City, OK | (a) | 290 | 341 | — | — | 290 | 341 | 631 | (37 | ) | 1985 | 07/17/13 | 11 to 22 Years | ||||||||||||||||||||
| Oklahoma City, OK | (a) | 277 | 473 | — | — | 277 | 473 | 750 | (44 | ) | 1986 | 07/17/13 | 11 to 20 Years | ||||||||||||||||||||
| Initial Cost to Company | Cost Capitalized Subsequent to Acquisition including impairment | Gross Amount at December 31, | Life in which depreciation in latest Statement of Operations is computed | ||||||||||||||||||||||
| Description | Encumbrances | Land and Improvements | Buildings and Improvements | Improvements/ Land | Improvements/ building | Land and Improvements | Buildings and Improvements | Total | Final Accum | Date of Construction | Date Acquired | ||||||||||||||
| Orlando, FL | (b) | 1,925 | 2,529 | — | — | 1,925 | 2,529 | 4,454 | (25 | ) | 2008 | 09/19/14 | 15 to 40 Years | ||||||||||||||||||||
| Phoenix, AZ | (c ) | 4,025 | 24,772 | — | — | 4,025 | 24,772 | 28,797 | (4,937 | ) | 2002 | 05/16/05 | 15 to 40 years | ||||||||||||||||||||
| Phoenix, AZ | (c ) | 2,381 | 9,051 | — | — | 2,381 | 9,051 | 11,432 | (1,906 | ) | 2002 | 05/16/05 | 15 to 40 years | ||||||||||||||||||||
| Phoenix, AZ | (a) | 1,912 | 1,673 | — | — | 1,912 | 1,673 | 3,585 | (568 | ) | 1978 | 02/10/05 | 15 to 30 years | ||||||||||||||||||||
| Phoenix, AZ | (a) | 1,840 | 3,582 | 266 | — | 2,106 | 3,582 | 5,688 | (973 | ) | 1975 | 02/10/05 | 15 to 40 years | ||||||||||||||||||||
| Pittsburgh, PA | (a) | 457 | 693 | — | — | 457 | 693 | 1,150 | (94 | ) | 1985 | 07/17/13 | 5 to 15 Years | ||||||||||||||||||||
| Prineville, OR | (a) | 571 | 4,457 | — | — | 571 | 4,457 | 5,028 | (1,480 | ) | 1940 | 12/22/05 | 15 to 30 years | ||||||||||||||||||||
| Rochester, NY | (a) | 242 | 539 | — | — | 242 | 539 | 781 | (42 | ) | 1981 | 07/17/13 | 8 to 28 Years | ||||||||||||||||||||
| Romeoville, IL | (a) | 1,684 | 5,676 | — | — | 1,684 | 5,676 | 7,360 | (992 | ) | 2008 | 06/23/08 | 14 to 49 years | ||||||||||||||||||||
| Sanford, FL | (b) | 1,028 | 1,310 | — | — | 1,028 | 1,310 | 2,338 | (16 | ) | 2003 | 09/19/14 | 15 to 40 Years | ||||||||||||||||||||
| Stockbridge, GA | (b) | 533 | 1,236 | — | — | 533 | 1,236 | 1,769 | (9 | ) | 2000 | 10/31/14 | 15 to 30 Years | ||||||||||||||||||||
| The Woodlands, TX | (e) | 2,039 | 7,154 | — | — | 2,039 | 7,154 | 9,193 | (317 | ) | 2011 | 09/25/13 | 15 to 40 Years | ||||||||||||||||||||
| Tucson, AZ | (a) | 983 | 3,782 | (7 | ) | — | 976 | 3,782 | 4,758 | (840 | ) | 1978 | 02/10/05 | 15 to 40 years | |||||||||||||||||||
| Warrenville, IL | (a) | 2,542 | 3,813 | — | — | 2,542 | 3,813 | 6,355 | (1,339 | ) | 1999 | 09/29/05 | 15 to 30 years | ||||||||||||||||||||
| Westmont, IL | (a) | 1,375 | 5,087 | — | — | 1,375 | 5,087 | 6,462 | (1,128 | ) | 2003 | 12/28/05 | 15 to 40 years | ||||||||||||||||||||
| Windermere, FL | (b) | 2,912 | 2,670 | — | — | 2,912 | 2,670 | 5,582 | (28 | ) | 2011 | 09/19/14 | 15 to 40 Years | ||||||||||||||||||||
| Winter Springs, FL | (b) | 534 | 746 | — | — | 534 | 746 | 1,280 | (10 | ) | 1987 | 09/19/14 | 15 to 30 Years | ||||||||||||||||||||
| Windermere, FL | (c) | 2,912 | 2,670 | — | — | 2,912 | 2,670 | 5,582 | (251 | ) | 2011 | 09/19/14 | 15 to 40 Years | ||||||||||||||||||||
| Winston-Salem, NC | (c) | 541 | 659 | — | — | 541 | 659 | 1,200 | (2 | ) | 1993 | 12/02/16 | 5 to 30 Years | ||||||||||||||||||||
| Winter Springs, FL | (c) | 534 | 746 | — | — | 534 | 746 | 1,280 | (94 | ) | 1987 | 09/19/14 | 15 to 30 Years | ||||||||||||||||||||
| Home Improvement | ||||||||||||||||||||||||||||||||||
| Bedford Park, IL | (c ) | 10,243 | 11,839 | — | — | 10,243 | 11,839 | 22,082 | (1,142 | ) | 1992 | 07/17/13 | 7 to 25 Years | |||||||||||||||||||||
| Blaine, MN | 3,185 | 1,728 | 3,437 | — | — | 1,728 | 3,437 | 5,165 | (168 | ) | 2006 | 07/17/13 | 8 to 43 Years | |||||||||||||||||||||
| Chester, NY | (d) | 6,433 | — | — | — | 6,433 | — | 6,433 | — | (g) | 07/17/13 | 20 to 20 Years | ||||||||||||||||||||||
| Cincinnati, OH | 13,800 | 6,087 | 10,984 | — | — | 6,087 | 10,984 | 17,071 | (858 | ) | 1998 | 07/17/13 | 4 to 28 Years | |||||||||||||||||||||
| Colma, CA | 19,300 | 21,066 | 13,597 | — | — | 21,066 | 13,597 | 34,663 | (765 | ) | 1995 | 07/17/13 | 2 to 33 Years | |||||||||||||||||||||
| Enterprise, AL | (b) | 1,924 | 5,083 | — | 261 | 1,924 | 5,344 | 7,268 | (506 | ) | 1995 | 07/17/13 | 1 to 27 Years | |||||||||||||||||||||
| Lakewood, CO | 6,757 | 3,822 | — | — | — | 3,822 | — | 3,822 | — | (g) | 07/17/13 | 18 to 18 Years | ||||||||||||||||||||||
| Lubbock, TX | (c ) | 2,644 | 10,009 | — | 371 | 2,644 | 10,380 | 13,024 | (610 | ) | 1996 | 07/17/13 | 2 to 36 Years | |||||||||||||||||||||
| Midland, TX | (c ) | 5,827 | 6,633 | — | 366 | 5,827 | 6,999 | 12,826 | (496 | ) | 1996 | 07/17/13 | 2 to 35 Years | |||||||||||||||||||||
| Tilton, NH | (c ) | 13,186 | — | — | — | 13,186 | — | 13,186 | — | (g) | 07/17/13 | 12 to 12 Years | ||||||||||||||||||||||
| Building Materials | |||||||||||||||||||||||||||||||||
| Aiken, SC | (a) | 108 | 265 | — | — | 108 | 265 | 373 | (139 | ) | 1985 | 05/01/05 | 15 to 20 Years | ||||||||||||||||||||
| Ankeny, IA | (c) | 687 | 2,162 | — | — | 687 | 2,162 | 2,849 | (289 | ) | 2006 | 07/17/13 | 8 to 43 Years | ||||||||||||||||||||
| Auburn, AL | (b) | 884 | 1,530 | — | — | 884 | 1,530 | 2,414 | (275 | ) | 2007 | 07/17/13 | 10 to 32 Years | ||||||||||||||||||||
| Baldwinsville, NY | (b) | 1,105 | 2,008 | — | — | 1,105 | 2,008 | 3,113 | (407 | ) | 2005 | 07/17/13 | 11 to 37 Years | ||||||||||||||||||||
| Baytown, TX | (c) | 1,440 | 1,712 | — | — | 1,440 | 1,712 | 3,152 | (293 | ) | 2007 | 07/17/13 | 9 to 39 Years | ||||||||||||||||||||
| Bowling Green, KY | (a) | 136 | 228 | — | — | 136 | 228 | 364 | (101 | ) | 1993 | 05/01/05 | 15 to 30 Years | ||||||||||||||||||||
| Carroll, OH | (c) | 1,144 | 4,557 | — | — | 1,144 | 4,557 | 5,701 | (831 | ) | 1976 | 07/17/13 | 3 to 30 Years | ||||||||||||||||||||
| Charlotte, NC | (c) | 4,582 | 6,511 | — | — | 4,582 | 6,511 | 11,093 | (1,325 | ) | 2007 | 07/17/13 | 10 to 26 Years | ||||||||||||||||||||
| Clovis, NM | (a) | 1,704 | 1,342 | — | — | 1,704 | 1,342 | 3,046 | (361 | ) | 2007 | 07/17/13 | 9 to 33 Years | ||||||||||||||||||||
| Cohasset, MN | (b) | 334 | 1,134 | — | — | 334 | 1,134 | 1,468 | (236 | ) | 2007 | 07/17/13 | 10 to 26 Years | ||||||||||||||||||||
| Conroe, TX | (a) | 492 | 723 | — | — | 492 | 723 | 1,215 | (329 | ) | 1999 | 07/01/05 | 14 to 30 Years | ||||||||||||||||||||
| Corpus Christi, TX | (c) | 1,790 | 1,267 | — | — | 1,790 | 1,267 | 3,057 | (260 | ) | 2014 | 09/30/14 | 11 to 30 Years | ||||||||||||||||||||
| Crockett, TX | (c) | 835 | 1,591 | — | — | 835 | 1,591 | 2,426 | (315 | ) | 2006 | 07/17/13 | 8 to 36 Years | ||||||||||||||||||||
| D'Iberville, MS | (a) | 250 | 339 | — | — | 250 | 339 | 589 | (197 | ) | 1984 | 05/01/05 | 15 to 20 Years | ||||||||||||||||||||
| Ellettsville, IN | (b) | 894 | 1,872 | — | — | 894 | 1,872 | 2,766 | (302 | ) | 2010 | 07/17/13 | 11 to 47 Years | ||||||||||||||||||||
| Fairview, TN | (b) | 975 | 2,274 | — | — | 975 | 2,274 | 3,249 | (318 | ) | 2007 | 07/17/13 | 8 to 47 Years | ||||||||||||||||||||
| Florence, SC | (a) | 221 | 174 | — | — | 221 | 174 | 395 | (211 | ) | 1974 | 05/01/05 | 10 to 15 Years | ||||||||||||||||||||
| Fort Myers, FL | (a) | 641 | 1,069 | — | — | 641 | 1,069 | 1,710 | (545 | ) | 1999 | 07/01/05 | 14 to 30 Years | ||||||||||||||||||||
| Sporting Goods | ||||||||||||||||||||||||||||||||||
| Amherst, NY | 6,321 | 1,868 | 7,503 | — | — | 1,868 | 7,503 | 9,371 | (366 | ) | 1986 | 07/17/13 | 2 to 40 Years | |||||||||||||||||||||
| Ankeny, IA | (c ) | 3,913 | 3,671 | — | — | 3,913 | 3,671 | 7,584 | (380 | ) | 2003 | 10/15/12 | 15 to 30 years | |||||||||||||||||||||
| Aurora, CO | 2,804 | 1,236 | 2,459 | — | — | 1,236 | 2,459 | 3,695 | (132 | ) | 2006 | 07/17/13 | 6 to 43 Years | |||||||||||||||||||||
| Bend, OR | (a) | 1,516 | 4,850 | — | — | 1,516 | 4,850 | 6,366 | (201 | ) | 2005 | 08/15/13 | 10 to 50 Years | |||||||||||||||||||||
| DePere, WI | 4,133 | 1,937 | 1,563 | — | — | 1,937 | 1,563 | 3,500 | (125 | ) | 2004 | 07/17/13 | 10 to 36 Years | |||||||||||||||||||||
| Houston, TX | (c ) | 2,150 | — | — | — | 2,150 | — | 2,150 | — | 1995 | 07/17/13 | 0 to 0 Years | ||||||||||||||||||||||
| Houston, TX | 4,625 | 6,876 | — | — | — | 6,876 | — | 6,876 | — | 1996 | 07/17/13 | 0 to 0 Years | ||||||||||||||||||||||
| Houston, TX | 3,045 | 2,060 | — | — | — | 2,060 | — | 2,060 | — | 1995 | 07/17/13 | 0 to 0 Years | ||||||||||||||||||||||
| Initial Cost to Company | Cost Capitalized Subsequent to Acquisition including impairment | Gross Amount at December 31, | Life in which depreciation in latest Statement of Operations is computed | ||||||||||||||||||||||
| Description | Encumbrances | Land and Improvements | Buildings and Improvements | Improvements/ Land | Improvements/ building | Land and Improvements | Buildings and Improvements | Total | Final Accum | Date of Construction | Date Acquired | ||||||||||||||
| Kenosha, WI | (a) | 3,421 | 7,407 | — | — | 3,421 | 7,407 | 10,828 | (1,915 | ) | 2004 | 09/30/04 | 15 to 40 years | |||||||||||||||||||||
| Loveland, CO | (c ) | 2,329 | 4,750 | — | — | 2,329 | 4,750 | 7,079 | (420 | ) | 2001 | 10/15/12 | 15 to 30 years | |||||||||||||||||||||
| Lufkin, TX | (c ) | 1,922 | 2,735 | — | — | 1,922 | 2,735 | 4,657 | (200 | ) | 2003 | 07/17/13 | 9 to 30 Years | |||||||||||||||||||||
| Macon, GA | 3,478 | 1,921 | 4,890 | — | — | 1,921 | 4,890 | 6,811 | (329 | ) | 2005 | 07/17/13 | 10 to 30 Years | |||||||||||||||||||||
| Mesa, AZ | (c ) | 2,040 | 5,696 | — | — | 2,040 | 5,696 | 7,736 | (506 | ) | 2005 | 10/15/12 | 15 to 30 years | |||||||||||||||||||||
| Midvale, UT | (c ) | 2,931 | 4,844 | — | — | 2,931 | 4,844 | 7,775 | (442 | ) | 2002 | 10/15/12 | 15 to 30 years | |||||||||||||||||||||
| N. Richland Hills, TX | 4,207 | 1,950 | — | — | — | 1,950 | — | 1,950 | — | 1996 | 07/17/13 | 0 to 0 Years | ||||||||||||||||||||||
| New Hartford, NY | (a) | 2,168 | 4,851 | — | — | 2,168 | 4,851 | 7,019 | (1,588 | ) | 2004 | 10/08/04 | 15 to 40 years | |||||||||||||||||||||
| Newnan, GA | (b) | 2,938 | 4,471 | — | — | 2,938 | 4,471 | 7,409 | (12 | ) | 2014 | 07/03/14 | 15 to 40 Years | |||||||||||||||||||||
| Opelika, AL | (c ) | 2,117 | 5,737 | — | — | 2,117 | 5,737 | 7,854 | (301 | ) | 2012 | 06/14/13 | 14 to 40 Years | |||||||||||||||||||||
| Phoenix, AZ | (c ) | 2,098 | 5,338 | — | — | 2,098 | 5,338 | 7,436 | (483 | ) | 2003 | 10/15/12 | 15 to 30 years | |||||||||||||||||||||
| Thornton, CO | (c ) | 2,836 | 5,069 | — | — | 2,836 | 5,069 | 7,905 | (498 | ) | 2003 | 10/15/12 | 15 to 30 years | |||||||||||||||||||||
| Tuscaloosa, AL | 4,033 | 3,321 | 4,053 | — | — | 3,321 | 4,053 | 7,374 | (155 | ) | 2013 | 09/30/13 | 14 to 50 Years | |||||||||||||||||||||
| Valdosta, GA | (c ) | 2,930 | 5,012 | — | — | 2,930 | 5,012 | 7,942 | (285 | ) | 2012 | 06/14/13 | 14 to 40 Years | |||||||||||||||||||||
| Fredericksburg, TX | (c) | 1,194 | 1,636 | — | — | 1,194 | 1,636 | 2,830 | (300 | ) | 2007 | 07/17/13 | 8 to 42 Years | ||||||||||||||||||||
| Front Royal, VA | (b) | 7,257 | 35,711 | — | — | 7,257 | 35,711 | �� | 42,968 | (5,939 | ) | 2007 | 07/17/13 | 9 to 34 Years | |||||||||||||||||||
| Greenville, SC | (a) | 344 | 210 | — | — | 344 | 210 | 554 | (255 | ) | 1981 | 05/01/05 | 9 to 15 Years | ||||||||||||||||||||
| Greer, SC | (a) | 268 | 236 | — | — | 268 | 236 | 504 | (159 | ) | 1993 | 05/01/05 | 15 to 30 Years | ||||||||||||||||||||
| Hickory, NC | (a) | 199 | 262 | — | — | 199 | 262 | 461 | (190 | ) | 1989 | 05/01/05 | 15 to 20 Years | ||||||||||||||||||||
| Indianapolis, IN | (a) | 607 | 520 | — | — | 607 | 520 | 1,127 | (343 | ) | 1990 | 05/01/05 | 15 to 20 Years | ||||||||||||||||||||
| Jacksonville, FL | (a) | 339 | 226 | — | — | 339 | 226 | 565 | (187 | ) | 1987 | 07/01/05 | 15 to 20 Years | ||||||||||||||||||||
| Jacksonville, FL | (a) | 963 | 1,007 | — | — | 963 | 1,007 | 1,970 | (917 | ) | 2001 | 07/01/05 | 9 to 20 Years | ||||||||||||||||||||
| Knoxville, TN | (a) | 259 | 111 | — | — | 259 | 111 | 370 | (171 | ) | 1981 | 05/01/05 | 10 to 15 Years | ||||||||||||||||||||
| La Grange, KY | (b) | 1,524 | 1,871 | — | — | 1,524 | 1,871 | 3,395 | (278 | ) | 2008 | 07/17/13 | 10 to 48 Years | ||||||||||||||||||||
| La Grange, TX | (c) | 822 | 1,953 | — | — | 822 | 1,953 | 2,775 | (335 | ) | 2006 | 07/17/13 | 8 to 40 Years | ||||||||||||||||||||
| Lakeland, FL | (a) | 1,098 | 1,281 | — | — | 1,098 | 1,281 | 2,379 | (876 | ) | 1984 | 07/01/05 | 14 to 20 Years | ||||||||||||||||||||
| Lawrenceville, GA | (a) | 500 | 237 | — | — | 500 | 237 | 737 | (191 | ) | 1996 | 05/01/05 | 15 to 30 Years | ||||||||||||||||||||
| Livingston, TX | (c) | 1,893 | 1,134 | — | — | 1,893 | 1,134 | 3,027 | (315 | ) | 2006 | 07/17/13 | 8 to 33 Years | ||||||||||||||||||||
| Lowville, NY | (b) | 791 | 1,659 | — | — | 791 | 1,659 | 2,450 | (256 | ) | 2010 | 07/17/13 | 12 to 42 Years | ||||||||||||||||||||
| Malone, NY | (b) | 793 | 1,677 | — | — | 793 | 1,677 | 2,470 | (291 | ) | 2010 | 07/17/13 | 11 to 42 Years | ||||||||||||||||||||
| Marinette, WI | (c) | 1,236 | 1,611 | — | — | 1,236 | 1,611 | 2,847 | (307 | ) | 2006 | 07/17/13 | 8 to 38 Years | ||||||||||||||||||||
| Martinsburg, WV | (a) | 173 | 20 | — | — | 173 | 20 | 193 | (46 | ) | 1972 | 05/01/05 | 10 to 15 Years | ||||||||||||||||||||
| Mattoon, IL | (a) | 233 | 263 | — | — | 233 | 263 | 496 | (202 | ) | 1984 | 05/01/05 | 15 to 20 Years | ||||||||||||||||||||
| Mountain Home, AR | (a) | 944 | 690 | — | — | 944 | 690 | 1,634 | (227 | ) | 1977 | 03/31/14 | 6 to 15 Years | ||||||||||||||||||||
| Mt. Sterling, KY | (c) | 1,785 | 1,051 | — | — | 1,785 | 1,051 | 2,836 | (292 | ) | 2011 | 07/17/13 | 12 to 38 Years | ||||||||||||||||||||
| Navasota, TX | (c) | 1,013 | 1,772 | — | — | 1,013 | 1,772 | 2,785 | (333 | ) | 2006 | 07/17/13 | 8 to 41 Years | ||||||||||||||||||||
| New Braunfels, TX | (c) | 1,257 | 1,778 | — | — | 1,257 | 1,778 | 3,035 | (300 | ) | 2006 | 07/17/13 | 7 to 38 Years | ||||||||||||||||||||
| Ocala, FL | (c) | 2,260 | 4,709 | — | — | 2,260 | 4,709 | 6,969 | (835 | ) | 2006 | 07/17/13 | 8 to 46 Years | ||||||||||||||||||||
| Parkersburg, WV | (c) | 966 | 1,843 | — | — | 966 | 1,843 | 2,809 | (318 | ) | 2005 | 07/17/13 | 7 to 37 Years | ||||||||||||||||||||
| Paw Paw, MI | (c) | 1,517 | 1,619 | — | — | 1,517 | 1,619 | 3,136 | (364 | ) | 2006 | 07/17/13 | 8 to 33 Years | ||||||||||||||||||||
| Pocahontas, AR | (a) | 361 | 471 | — | — | 361 | 471 | 832 | (110 | ) | 1986 | 03/31/14 | 7 to 20 Years | ||||||||||||||||||||
| Pompano Beach, FL | (a) | 1,144 | 337 | — | — | 1,144 | 337 | 1,481 | (228 | ) | 1990 | 07/01/05 | 15 to 30 Years | ||||||||||||||||||||
| Powhatan, VA | (c) | 4,342 | 2,963 | — | — | 4,342 | 2,963 | 7,305 | (1,260 | ) | 2007 | 07/17/13 | 10 to 31 Years | ||||||||||||||||||||
| Prior Lake, MN | (c) | 1,998 | 2,454 | — | — | 1,998 | 2,454 | 4,452 | (499 | ) | 1991 | 07/17/13 | 7 to 26 Years | ||||||||||||||||||||
| Riviera Beach, FL | (a) | 500 | 170 | — | — | 500 | 170 | 670 | (141 | ) | 1987 | 07/01/05 | 15 to 20 Years | ||||||||||||||||||||
| Roanoke, VA | (a) | 333 | 124 | — | — | 333 | 124 | 457 | (171 | ) | 1975 | 05/01/05 | 10 to 15 Years | ||||||||||||||||||||
| Rockford, MN | (c) | 1,298 | 2,652 | — | — | 1,298 | 2,652 | 3,950 | (404 | ) | 2007 | 07/17/13 | 9 to 43 Years | ||||||||||||||||||||
| Rome, NY | (c) | 1,326 | 1,110 | — | — | 1,326 | 1,110 | 2,436 | (261 | ) | 2007 | 07/17/13 | 9 to 34 Years | ||||||||||||||||||||
| Salisbury, MD | (c) | 4,210 | 6,613 | — | — | 4,210 | 6,613 | 10,823 | (1,669 | ) | 2007 | 07/17/13 | 10 to 27 Years | ||||||||||||||||||||
| Automotive Dealers | ||||||||||||||||||||||||||||||||||
| Caldwell, TX | (a) | 1,775 | 1,725 | — | — | 1,775 | 1,725 | 3,500 | (743 | ) | 2000 | 12/31/07 | 11 to 36 years | |||||||||||||||||||||
| Conroe, TX | (a) | 4,338 | 448 | 955 | 145 | 5,293 | 593 | 5,886 | (1,308 | ) | 2005 | 11/17/06 | 12 to 47 years | |||||||||||||||||||||
| Gettysburg, PA | (a) | 1,385 | 3,259 | — | — | 1,385 | 3,259 | 4,644 | (1,164 | ) | 2005 | 02/16/07 | 5 to 30 years | |||||||||||||||||||||
| Greenville, SC | 14,129 | 9,732 | 11,625 | — | — | 9,732 | 11,625 | 21,357 | (738 | ) | 1998 | 07/17/13 | 3 to 40 Years | |||||||||||||||||||||
| Greenville, SC | (a) | 2,561 | 1,526 | — | — | 2,561 | 1,526 | 4,087 | (1,027 | ) | 1999 | 12/28/05 | 15 to 30 years | |||||||||||||||||||||
| Huntsville, AL | (a) | 778 | 1,686 | — | — | 778 | 1,686 | 2,464 | (550 | ) | 1997 | 02/23/04 | 15 to 30 years | |||||||||||||||||||||
| Independence, MO | (b) | 1,058 | 1,297 | — | — | 1,058 | 1,297 | 2,355 | (13 | ) | 1968 | 11/25/14 | 4 to 15 Years | |||||||||||||||||||||
| Irving, TX | (a) | 7,348 | 970 | — | — | 7,348 | 970 | 8,318 | (1,789 | ) | 1960 | 06/01/06 | 12 to 27 years | |||||||||||||||||||||
| Irving, TX | (a) | 931 | 268 | — | — | 931 | 268 | 1,199 | (135 | ) | 1965 | 04/19/07 | 12 to 18 years | |||||||||||||||||||||
| Jacksonville, FL | (c ) | 6,155 | 10,957 | — | — | 6,155 | 10,957 | 17,112 | (2,122 | ) | 2005 | 06/30/05 | 15 to 40 years | |||||||||||||||||||||
| Jacksonville, FL | (a) | 3,170 | 938 | — | — | 3,170 | 938 | 4,108 | (462 | ) | 1989 | 12/28/05 | 15 to 30 years | |||||||||||||||||||||
| Kennesaw, GA | (b) | 3,560 | 23,582 | — | — | 3,560 | 23,582 | 27,142 | (948 | ) | 1998 | 07/17/13 | 8 to 45 Years | |||||||||||||||||||||
| Kennesaw, GA | (a) | 3,931 | 5,334 | — | — | 3,931 | 5,334 | 9,265 | (783 | ) | 1995 | 02/16/12 | 15 to 30 years | |||||||||||||||||||||
| Midlothian, VA | (c ) | 4,775 | 6,056 | — | — | 4,775 | 6,056 | 10,831 | (1,162 | ) | 2004 | 06/30/05 | 15 to 40 years | |||||||||||||||||||||
| Ontario, CA | (c ) | 7,981 | 6,937 | — | — | 7,981 | 6,937 | 14,918 | (1,322 | ) | 2005 | 06/30/05 | 15 to 40 years | |||||||||||||||||||||
| Pineville, NC | (c ) | 4,865 | 1,902 | — | — | 4,865 | 1,902 | 6,767 | (193 | ) | 2002 | 07/17/13 | 10 to 30 Years | |||||||||||||||||||||
| Plano, TX | (b) | 3,064 | 2,707 | — | — | 3,064 | 2,707 | 5,771 | (1,121 | ) | 1992 | 06/29/07 | 5 to 30 years | |||||||||||||||||||||
| Pompano Beach, FL | (c ) | 6,153 | 5,010 | — | — | 6,153 | 5,010 | 11,163 | (965 | ) | 2004 | 06/30/05 | 15 to 40 years | |||||||||||||||||||||
| Raleigh, NC | (a) | 4,163 | 4,017 | — | — | 4,163 | 4,017 | 8,180 | (499 | ) | 1994 | 07/17/13 | 4 to 25 Years | |||||||||||||||||||||
| Saukville, WI | (a) | 2,061 | 4,794 | — | — | 2,061 | 4,794 | 6,855 | (53 | ) | 2014 | 09/30/14 | 15 to 40 Years | |||||||||||||||||||||
| Tulsa, OK | (a) | 1,225 | 373 | — | — | 1,225 | 373 | 1,598 | (530 | ) | 1999 | 12/28/05 | 15 to 20 years | |||||||||||||||||||||
| Tulsa, OK | (a) | 1,808 | 4,539 | — | — | 1,808 | 4,539 | 6,347 | (1,548 | ) | 1992 | 05/26/06 | 10 to 30 years | |||||||||||||||||||||
| Initial Cost to Company | Cost Capitalized Subsequent to Acquisition including impairment | Gross Amount at December 31, | Life in which depreciation in latest Statement of Operations is computed | ||||||||||||||||||||||
| Description | Encumbrances | Land and Improvements | Buildings and Improvements | Improvements/ Land | Improvements/ building | Land and Improvements | Buildings and Improvements | Total | Final Accum | Date of Construction | Date Acquired | ||||||||||||||
| Entertainment | ||||||||||||||||||||||||||||||||||
| Austin, TX | (c ) | 4,425 | 8,142 | — | — | 4,425 | 8,142 | 12,567 | (2,146 | ) | 2005 | 09/30/05 | 15 to 40 years | |||||||||||||||||||||
| Beaverton, OR | (a) | 5,608 | 8,733 | — | — | 5,608 | 8,733 | 14,341 | (141 | ) | 2010 | 06/30/14 | 15 to 40 Years | |||||||||||||||||||||
| Conroe, TX | (c ) | 2,886 | 5,763 | — | — | 2,886 | 5,763 | 8,649 | (1,431 | ) | 2004 | 09/30/05 | 15 to 40 years | |||||||||||||||||||||
| Fort Worth, TX | (c ) | 2,468 | 5,418 | — | — | 2,468 | 5,418 | 7,886 | (1,355 | ) | 2003 | 09/30/05 | 15 to 40 years | |||||||||||||||||||||
| Grapevine, TX | (c ) | 2,554 | 5,377 | — | — | 2,554 | 5,377 | 7,931 | (1,359 | ) | 2000 | 09/30/05 | 15 to 40 years | |||||||||||||||||||||
| Las Vegas, NV | 41,315 | 3,225 | 30,482 | — | — | 3,225 | 30,482 | 33,707 | (1,039 | ) | 2007 | 07/17/13 | 13 to 55 Years | |||||||||||||||||||||
| Lewisville, TX | (c ) | 2,130 | 4,630 | — | — | 2,130 | 4,630 | 6,760 | (1,175 | ) | 1998 | 09/30/05 | 15 to 40 years | |||||||||||||||||||||
| Pflugerville, TX | (b) | 6,183 | 1,349 | — | — | 6,183 | 1,349 | 7,532 | (37 | ) | 2003 | 08/29/14 | 15 to 30 Years | |||||||||||||||||||||
| Plano, TX | (c ) | 3,225 | 6,302 | — | — | 3,225 | 6,302 | 9,527 | (1,551 | ) | 2001 | 09/30/05 | 15 to 40 years | |||||||||||||||||||||
| Vancouver, WA | (a) | 2,077 | 9,395 | — | — | 2,077 | 9,395 | 11,472 | (133 | ) | 2010 | 06/30/14 | 15 to 40 Years | |||||||||||||||||||||
| Sebring, FL | (a) | 318 | 291 | — | — | 318 | 291 | 609 | (195 | ) | 1982 | 07/01/05 | 15 to 20 Years | ||||||||||||||||||||
| Shallotte, NC | (b) | 705 | 1,794 | — | — | 705 | 1,794 | 2,499 | (330 | ) | 2006 | 07/17/13 | 10 to 30 Years | ||||||||||||||||||||
| Spokane, WA | (a) | 518 | 193 | — | — | 518 | 193 | 711 | (168 | ) | 1998 | 05/01/05 | 15 to 30 Years | ||||||||||||||||||||
| Statesville, NC | (a) | 614 | 355 | — | — | 614 | 355 | 969 | (406 | ) | 1976 | 05/01/05 | 9 to 15 Years | ||||||||||||||||||||
| Tontitown, AR | (a) | 230 | 92 | — | — | 230 | 92 | 322 | (82 | ) | 1987 | 05/01/05 | 15 to 20 Years | ||||||||||||||||||||
| West Columbia, SC | (a) | 324 | 108 | — | — | 324 | 108 | 432 | (80 | ) | 1989 | 05/01/05 | 15 to 20 Years | ||||||||||||||||||||
| West Columbia, SC | (a) | 262 | 598 | — | — | 262 | 598 | 860 | (343 | ) | 1984 | 05/01/05 | 9 to 20 Years | ||||||||||||||||||||
| Wilmington, NC | (a) | 370 | 122 | — | — | 370 | 122 | 492 | (100 | ) | 1987 | 05/01/05 | 15 to 20 Years | ||||||||||||||||||||
| Manufacturing | |||||||||||||||||||||||||||||||||
| Annapolis Junction, MD | (a) | 2,245 | 1,105 | (1,535 | ) | (547 | ) | 710 | 558 | 1,268 | (185 | ) | 1930 | 09/29/06 | 15 to 30 years | ||||||||||||||||||
| Avila, IN | (b) | 642 | 4,958 | — | — | 642 | 4,958 | 5,600 | — | 1990 | 12/17/14 | 15 to 30 Years | |||||||||||||||||||||
| Byron, IL | (a) | 734 | 4,334 | — | — | 734 | 4,334 | 5,068 | (1,769 | ) | 1965 | 12/29/06 | 10 to 20 years | ||||||||||||||||||||
| Dublin, VA | (a) | 491 | 1,401 | — | — | 491 | 1,401 | 1,892 | (661 | ) | 1985 | 12/11/06 | 15 to 20 years | ||||||||||||||||||||
| Edon, OH | (b) | 642 | 2,649 | — | — | 642 | 2,649 | 3,291 | (1,114 | ) | 1953 | 02/21/07 | 15 to 20 years | ||||||||||||||||||||
| Elk Grove Village, IL | (c ) | 3,001 | 5,264 | (1,604 | ) | (2,492 | ) | 1,397 | 2,772 | 4,169 | (1,099 | ) | 1970 | 12/28/06 | 10 to 30 years | ||||||||||||||||||
| Exton, PA | (c ) | 2,494 | 7,180 | (1,267 | ) | (3,313 | ) | 1,227 | 3,867 | 5,094 | (1,649 | ) | 1999 | 12/28/06 | 14 to 40 years | ||||||||||||||||||
| Fremont, IN | (a) | 427 | 2,176 | — | — | 427 | 2,176 | 2,603 | (649 | ) | 1960 | 02/21/07 | 15 to 30 years | ||||||||||||||||||||
| Grand Chute, WI | (c ) | 1,738 | 12,133 | (743 | ) | (4,524 | ) | 995 | 7,609 | 8,604 | (3,347 | ) | 1966 | 12/28/06 | 14 to 30 years | ||||||||||||||||||
| Houston, TX | (b) | 2,420 | 15,723 | — | — | 2,420 | 15,723 | 18,143 | (1,049 | ) | 1983 | 07/17/13 | 2 to 35 Years | ||||||||||||||||||||
| Lenexa, KS | (c ) | 1,463 | 5,110 | (15 | ) | (192 | ) | 1,448 | 4,918 | 6,366 | (1,613 | ) | 1985 | 12/28/06 | 12 to 30 years | ||||||||||||||||||
| Loudon, TN | (b) | 1,188 | 4,904 | — | — | 1,188 | 4,904 | 6,092 | (1,491 | ) | 1992 | 03/31/08 | 15 to 30 years | ||||||||||||||||||||
| Merced, CA | (b) | 3,456 | 9,007 | — | — | 3,456 | 9,007 | 12,463 | (2,347 | ) | 1998 | 03/31/08 | 15 to 30 years | ||||||||||||||||||||
| Meridian, CT | (b) | 1,766 | 7,848 | — | — | 1,766 | 7,848 | 9,614 | — | 1997 | 12/17/14 | 15 to 30 Years | |||||||||||||||||||||
| Minerva, OH | (b) | 649 | 3,920 | (217 | ) | (770 | ) | 432 | 3,150 | 3,582 | (1,436 | ) | 1919 | 02/21/07 | 8 to 20 years | ||||||||||||||||||
| Nashville, TN | (c ) | 459 | 3,261 | (91 | ) | (490 | ) | 368 | 2,771 | 3,139 | (849 | ) | 1960 | 12/28/06 | 14 to 30 years | ||||||||||||||||||
| New Castle, PA | (b) | 1,084 | 5,507 | — | — | 1,084 | 5,507 | 6,591 | (399 | ) | 1999 | 07/17/13 | 8 to 28 Years | ||||||||||||||||||||
| Pulaski, VA | (a) | 333 | 1,536 | — | — | 333 | 1,536 | 1,869 | (684 | ) | 1967 | 12/11/06 | 15 to 20 years | ||||||||||||||||||||
| Royal Oak, MI | (a) | 3,426 | 7,071 | — | — | 3,426 | 7,071 | 10,497 | (2,029 | ) | 1952 | 03/10/06 | 15 to 30 years | ||||||||||||||||||||
| Scottdale, PA | (c ) | 607 | 11,008 | (114 | ) | (1,331 | ) | 493 | 9,677 | 10,170 | (4,168 | ) | 1959 | 12/28/06 | 14 to 20 years | ||||||||||||||||||
| Shelbyville, KY | (c ) | 442 | 3,028 | — | — | 442 | 3,028 | 3,470 | (796 | ) | 1973 | 12/28/06 | 14 to 30 years | ||||||||||||||||||||
| Sidney, OH | (a) | 921 | 4,177 | — | — | 921 | 4,177 | 5,098 | (1,798 | ) | 1987 | 12/22/05 | 13 to 20 years | ||||||||||||||||||||
| Troy, MI | (a) | 1,128 | 947 | — | — | 1,128 | 947 | 2,075 | (276 | ) | 1952 | 03/10/06 | 15 to 30 years | ||||||||||||||||||||
| Westfield, MA | (c ) | 3,258 | 8,090 | (94 | ) | (260 | ) | 3,164 | 7,830 | 10,994 | (3,240 | ) | 1981 | 12/28/06 | 14 to 30 years | ||||||||||||||||||
| Winston-Salem, NC | (c ) | 927 | 3,455 | — | — | 927 | 3,455 | 4,382 | (248 | ) | 1987 | 07/17/13 | 5 to 40 Years | ||||||||||||||||||||
| Apparel | |||||||||||||||||||||||||||||||||
| Canton, MA | (c) | 28,693 | 27,813 | — | — | 28,693 | 27,813 | 56,506 | (9,384 | ) | 1962 | 02/01/06 | 15 to 30 Years | ||||||||||||||||||||
| Collierville, TN | (c) | 1,114 | 6,726 | — | — | 1,114 | 6,726 | 7,840 | (1,007 | ) | 2002 | 07/17/13 | 9 to 49 Years | ||||||||||||||||||||
| Fairview Heights, IL | (b) | 8,637 | 23,418 | — | 223 | 8,637 | 23,641 | 32,278 | (4,103 | ) | 1999 | 07/17/13 | 5 to 39 Years | ||||||||||||||||||||
| Grand Forks, ND | (c) | 1,516 | 10,008 | — | — | 1,516 | 10,008 | 11,524 | (983 | ) | 2006 | 07/17/13 | 9 to 46 Years | ||||||||||||||||||||
| Lake Zurich, IL | (b) | 4,860 | 6,935 | — | — | 4,860 | 6,935 | 11,795 | (1,275 | ) | 2000 | 07/17/13 | 7 to 32 Years | ||||||||||||||||||||
| Lenexa, KS | (c) | 919 | 2,476 | — | — | 919 | 2,476 | 3,395 | (270 | ) | 2005 | 07/17/13 | 2 to 47 Years | ||||||||||||||||||||
| Olathe, KS | (c) | 3,505 | 5,847 | — | 321 | 3,505 | 6,168 | 9,673 | (1,005 | ) | 1995 | 07/17/13 | 9 to 35 Years | ||||||||||||||||||||
| Sherwood, AR | (c) | 2,300 | 5,995 | — | — | 2,300 | 5,995 | 8,295 | (576 | ) | 2003 | 02/23/15 | 8 to 30 Years | ||||||||||||||||||||
| Tilton, NH | (c) | 3,959 | — | — | — | 3,959 | — | 3,959 | — | (f) | 07/17/13 | (f) | |||||||||||||||||||||
| Tilton, NH | (b) | 7,420 | 19,608 | — | — | 7,420 | 19,608 | 27,028 | (4,264 | ) | 1998 | 07/17/13 | 8 to 25 Years | ||||||||||||||||||||
| Topeka, KS | (c) | 542 | 2,251 | — | — | 542 | 2,251 | 2,793 | (216 | ) | 2006 | 07/17/13 | 3 to 48 Years | ||||||||||||||||||||
| Victoria, TX | (c) | 2,631 | 7,710 | — | 20 | 2,631 | 7,730 | 10,361 | (1,228 | ) | 2006 | 07/17/13 | 3 to 43 Years | ||||||||||||||||||||
| Voorhees, NJ | (a) | 2,027 | 6,776 | — | — | 2,027 | 6,776 | 8,803 | (1,789 | ) | 1970 | 07/17/13 | 5 to 20 Years | ||||||||||||||||||||
| Wichita, KS | (c) | 2,163 | 7,036 | — | — | 2,163 | 7,036 | 9,199 | (1,013 | ) | 1996 | 07/17/13 | 8 to 36 Years | ||||||||||||||||||||
| Specialty Retail | |||||||||||||||||||||||||||||||||
| Algonquin, IL | (a) | 4,171 | 5,613 | — | — | 4,171 | 5,613 | 9,784 | (1,755 | ) | 2007 | 04/30/09 | 13 to 38 Years | ||||||||||||||||||||
| Alpharetta, GA | (a) | 2,497 | 2,160 | — | — | 2,497 | 2,160 | 4,657 | (1,135 | ) | 1994 | 07/01/05 | 15 to 30 Years | ||||||||||||||||||||
| Alpharetta, GA | (a) | 4,079 | 1,948 | — | — | 4,079 | 1,948 | 6,027 | (1,431 | ) | 1983 | 07/01/05 | 15 to 20 Years | ||||||||||||||||||||
| Atlanta, GA | (a) | 4,863 | 815 | — | — | 4,863 | 815 | 5,678 | (710 | ) | 1970 | 07/01/05 | 15 to 20 Years | ||||||||||||||||||||
| Aurora, IL | (a) | 1,979 | 4,111 | — | — | 1,979 | 4,111 | 6,090 | (1,510 | ) | 1989 | 04/30/09 | 13 to 28 Years | ||||||||||||||||||||
| Avon, OH | (a) | 1,550 | 2,749 | — | — | 1,550 | 2,749 | 4,299 | (896 | ) | 2007 | 04/30/09 | 13 to 38 Years | ||||||||||||||||||||
| Batavia, IL | (a) | 1,857 | 3,441 | — | — | 1,857 | 3,441 | 5,298 | (1,343 | ) | 2001 | 04/30/09 | 13 to 28 Years | ||||||||||||||||||||
| Broomfield, CO | (c) | 4,538 | 4,675 | — | — | 4,538 | 4,675 | 9,213 | (141 | ) | 1995 | 08/01/16 | 9 to 20 Years | ||||||||||||||||||||
| Buford, GA | (c) | 1,940 | 4,704 | — | — | 1,940 | 4,704 | 6,644 | (93 | ) | 1984 | 08/01/16 | 8 to 30 Years | ||||||||||||||||||||
| Caldwell, ID | (c) | 470 | 1,739 | — | — | 470 | 1,739 | 2,209 | (63 | ) | 2009 | 07/31/15 | 15 to 50 Years | ||||||||||||||||||||
| Corpus Christi, TX | (c) | 3,734 | 4,949 | — | — | 3,734 | 4,949 | 8,683 | (166 | ) | 1986 | 08/01/16 | 8 to 20 Years | ||||||||||||||||||||
| Initial Cost to Company | Cost Capitalized Subsequent to Acquisition including impairment | Gross Amount at December 31, | Life in which depreciation in latest Statement of Operations is computed | ||||||||||||||||||||||
| Description | Encumbrances | Land and Improvements | Buildings and Improvements | Improvements/ Land | Improvements/ building | Land and Improvements | Buildings and Improvements | Total | Final Accum | Date of Construction | Date Acquired | ||||||||||||||
| Worcester, MA | (c ) | 3,731 | 5,193 | (1,248 | ) | (1,019 | ) | 2,483 | 4,174 | 6,657 | (2,870 | ) | 1971 | 12/28/06 | 13 to 20 years | ||||||||||||||||||
| Davenport, IA | (a) | 2,823 | 4,475 | — | — | 2,823 | 4,475 | 7,298 | (1,550 | ) | 2007 | 04/30/09 | 13 to 38 Years | ||||||||||||||||||||
| Downers Grove, IL | (a) | 1,772 | 2,227 | — | — | 1,772 | 2,227 | 3,999 | (943 | ) | 1994 | 04/30/09 | 13 to 28 Years | ||||||||||||||||||||
| Gurnee, IL | (a) | 767 | 1,632 | — | — | 767 | 1,632 | 2,399 | (699 | ) | 1999 | 04/30/09 | 13 to 28 Years | ||||||||||||||||||||
| Jenison, MI | (c) | 2,303 | 5,743 | — | 88 | 2,303 | 5,831 | 8,134 | (119 | ) | 1989 | 08/01/16 | 8 to 30 Years | ||||||||||||||||||||
| Joliet, IL | (a) | 1,700 | 5,698 | — | — | 1,700 | 5,698 | 7,398 | (1,653 | ) | 2004 | 04/30/09 | 13 to 38 Years | ||||||||||||||||||||
| Louisville, KY | (c) | 4,726 | 5,211 | — | — | 4,726 | 5,211 | 9,937 | (3 | ) | 1984 | 12/20/16 | 9 to 20 Years | ||||||||||||||||||||
| Loves Park, IL | (a) | 1,551 | 6,447 | — | — | 1,551 | 6,447 | 7,998 | (1,797 | ) | 2004 | 04/30/09 | 13 to 38 Years | ||||||||||||||||||||
| Lubbock, TX | (a) | 4,585 | 4,550 | — | — | 4,585 | 4,550 | 9,135 | (53 | ) | 1985 | 11/15/16 | 8 to 20 Years | ||||||||||||||||||||
| Marietta, GA | (a) | 4,675 | 854 | — | — | 4,675 | 854 | 5,529 | (737 | ) | 1996 | 07/01/05 | 15 to 30 Years | ||||||||||||||||||||
| Marietta, GA | (a) | 2,610 | 865 | — | — | 2,610 | 865 | 3,475 | (709 | ) | 1977 | 07/01/05 | 15 to 20 Years | ||||||||||||||||||||
| Merrillville, IN | (a) | 1,324 | 3,975 | — | — | 1,324 | 3,975 | 5,299 | (1,569 | ) | 1986 | 04/30/09 | 13 to 28 Years | ||||||||||||||||||||
| Mesa, AZ | (c) | 4,067 | 4,322 | — | — | 4,067 | 4,322 | 8,389 | (2 | ) | 2002 | 12/20/16 | 10 to 20 Years | ||||||||||||||||||||
| Mundelein, IL | (a) | 1,991 | 4,308 | — | — | 1,991 | 4,308 | 6,299 | (1,646 | ) | 2002 | 04/30/09 | 13 to 28 Years | ||||||||||||||||||||
| Peoria, IL | (a) | 2,497 | 4,401 | — | — | 2,497 | 4,401 | 6,898 | (1,473 | ) | 2004 | 04/30/09 | 13 to 38 Years | ||||||||||||||||||||
| Rapid City, SD | (c) | 575 | 2,568 | — | — | 575 | 2,568 | 3,143 | (326 | ) | 2001 | 07/17/13 | 2 to 45 Years | ||||||||||||||||||||
| Schaumburg, IL | (a) | 2,067 | 2,632 | — | — | 2,067 | 2,632 | 4,699 | (1,047 | ) | 2002 | 04/30/09 | 13 to 28 Years | ||||||||||||||||||||
| Spokane, WA | (c) | 970 | 1,945 | — | — | 970 | 1,945 | 2,915 | (83 | ) | 1994 | 07/31/15 | 15 to 40 Years | ||||||||||||||||||||
| Summerfield, FL | (c) | 3,059 | 3,949 | — | — | 3,059 | 3,949 | 7,008 | (86 | ) | 2004 | 08/29/16 | 13 to 30 Years | ||||||||||||||||||||
| Tinley Park, IL | (a) | 1,108 | 2,091 | — | — | 1,108 | 2,091 | 3,199 | (780 | ) | 1990 | 04/30/09 | 13 to 28 Years | ||||||||||||||||||||
| Specialty Retail | ||||||||||||||||||||||||||||||||||
| Algonquin, IL | (a) | 4,171 | 5,613 | — | — | 4,171 | 5,613 | 9,784 | (1,379 | ) | 2007 | 09/05/07 | 13 to 38 years | |||||||||||||||||||||
| Alpharetta, GA | (a) | 2,497 | 2,160 | — | — | 2,497 | 2,160 | 4,657 | (894 | ) | 1994 | 06/15/04 | 15 to 30 years | |||||||||||||||||||||
| Alpharetta, GA | (a) | 4,079 | 1,948 | — | — | 4,079 | 1,948 | 6,027 | (1,127 | ) | 1983 | 06/15/04 | 15 to 20 years | |||||||||||||||||||||
| Atlanta, GA | (a) | 4,863 | 815 | — | — | 4,863 | 815 | 5,678 | (559 | ) | 1970 | 06/15/04 | 15 to 20 years | |||||||||||||||||||||
| Aurora, IL | (a) | 1,979 | 4,111 | — | — | 1,979 | 4,111 | 6,090 | (1,186 | ) | 1989 | 09/05/07 | 13 to 28 years | |||||||||||||||||||||
| Avon, OH | (a) | 1,550 | 2,749 | — | — | 1,550 | 2,749 | 4,299 | (704 | ) | 2007 | 08/31/07 | 13 to 38 years | |||||||||||||||||||||
| Batavia, IL | (a) | 1,857 | 3,441 | — | — | 1,857 | 3,441 | 5,298 | (1,055 | ) | 2001 | 08/31/07 | 13 to 28 years | |||||||||||||||||||||
| Davenport, IA | (a) | 2,823 | 4,475 | — | — | 2,823 | 4,475 | 7,298 | (1,218 | ) | 2007 | 08/31/07 | 13 to 38 years | |||||||||||||||||||||
| Downers Grove, IL | (a) | 1,772 | 2,227 | — | — | 1,772 | 2,227 | 3,999 | (741 | ) | 1994 | 08/31/07 | 13 to 28 years | |||||||||||||||||||||
| Gurnee, IL | (a) | 767 | 1,632 | — | — | 767 | 1,632 | 2,399 | (549 | ) | 1999 | 08/31/07 | 13 to 28 years | |||||||||||||||||||||
| Joliet, IL | (a) | 1,700 | 5,698 | — | — | 1,700 | 5,698 | 7,398 | (1,299 | ) | 2004 | 08/31/07 | 13 to 38 years | |||||||||||||||||||||
| Loves Park, IL | (a) | 1,551 | 6,447 | — | — | 1,551 | 6,447 | 7,998 | (1,412 | ) | 2004 | 08/31/07 | 13 to 38 years | |||||||||||||||||||||
| Marietta, GA | (a) | 4,675 | 854 | — | — | 4,675 | 854 | 5,529 | (581 | ) | 1996 | 06/15/04 | 15 to 30 years | |||||||||||||||||||||
| Marietta, GA | (a) | 2,610 | 865 | — | — | 2,610 | 865 | 3,475 | (559 | ) | 1977 | 06/15/04 | 15 to 20 years | |||||||||||||||||||||
| Merrillville, IN | (a) | 1,324 | 3,975 | — | — | 1,324 | 3,975 | 5,299 | (1,233 | ) | 1986 | 08/31/07 | 13 to 28 years | |||||||||||||||||||||
| Mundelein, IL | (a) | 1,991 | 4,308 | — | — | 1,991 | 4,308 | 6,299 | (1,293 | ) | 2002 | 08/31/07 | 13 to 28 years | |||||||||||||||||||||
| Peoria, IL | (a) | 2,497 | 4,401 | — | — | 2,497 | 4,401 | 6,898 | (1,158 | ) | 2004 | 08/31/07 | 13 to 38 years | |||||||||||||||||||||
| Rapid City, SD | 4,393 | 575 | 2,568 | — | — | 575 | 2,568 | 3,143 | (136 | ) | 1999 | 07/17/13 | 2 to 45 Years | |||||||||||||||||||||
| San Antonio, TX | (b) | 1,724 | 2,403 | — | 625 | 1,724 | 3,028 | 4,752 | (122 | ) | 2002 | 07/17/13 | 3 to 41 Years | |||||||||||||||||||||
| Schaumburg, IL | (a) | 2,067 | 2,632 | — | — | 2,067 | 2,632 | 4,699 | (823 | ) | 2002 | 08/31/07 | 13 to 28 years | |||||||||||||||||||||
| Soldotna, AK | (a) | 1,177 | 2,245 | — | — | 1,177 | 2,245 | 3,422 | (41 | ) | 1983 | 05/22/14 | 15 to 40 Years | |||||||||||||||||||||
| Tinley Park, IL | (a) | 1,108 | 2,091 | — | — | 1,108 | 2,091 | 3,199 | (613 | ) | 1990 | 08/31/07 | 13 to 28 years | |||||||||||||||||||||
| Automotive Dealers | |||||||||||||||||||||||||||||||||
| Caldwell, TX | (a) | 1,775 | 1,725 | — | — | 1,775 | 1,725 | 3,500 | (955 | ) | 2000 | 04/29/11 | 11 to 36 Years | ||||||||||||||||||||
| Conroe, TX | (a) | 4,338 | 448 | 955 | 144 | 5,293 | 592 | 5,885 | (1,668 | ) | 2005 | 09/01/09 | 12 to 47 Years | ||||||||||||||||||||
| Denver, CO | (c) | 4,124 | 4,229 | — | — | 4,124 | 4,229 | 8,353 | (193 | ) | 1980 | 08/21/15 | 15 to 40 Years | ||||||||||||||||||||
| Gettysburg, PA | (a) | 1,385 | 3,259 | — | — | 1,385 | 3,259 | 4,644 | (1,438 | ) | 2005 | 02/16/07 | 5 to 30 Years | ||||||||||||||||||||
| Gladstone, MO | (c) | 1,100 | 774 | — | — | 1,100 | 774 | 1,874 | (91 | ) | 2005 | 03/11/15 | 4 to 40 Years | ||||||||||||||||||||
| Greenville, SC | (a) | 2,561 | 1,526 | — | — | 2,561 | 1,526 | 4,087 | (1,304 | ) | 1999 | 12/28/05 | 15 to 30 Years | ||||||||||||||||||||
| Consumer Electronics | ||||||||||||||||||||||||||||||||||
| Beaumont, TX | 8,592 | 778 | 9,297 | — | — | 778 | 9,297 | 10,075 | (738 | ) | 1971 | 07/17/13 | 3 to 25 Years | |||||||||||||||||||||
| Fairview Heights, IL | 35,432 | 8,638 | 23,417 | — | 208 | 8,638 | 23,625 | 32,263 | (1,685 | ) | 1998 | 07/17/13 | 6 to 39 Years | |||||||||||||||||||||
| Fayetteville, NC | (c ) | 1,560 | 6,893 | — | — | 1,560 | 6,893 | 8,453 | (324 | ) | 1999 | 07/17/13 | 6 to 41 Years | |||||||||||||||||||||
| Greensboro, NC | (c ) | 2,776 | 3,990 | — | — | 2,776 | 3,990 | 6,766 | (183 | ) | 2007 | 07/17/13 | 10 to 47 Years | |||||||||||||||||||||
| Grove City, OH | (c ) | 2,050 | 3,288 | — | — | 2,050 | 3,288 | 5,338 | (178 | ) | 2008 | 07/17/13 | 9 to 38 Years | |||||||||||||||||||||
| Kansas City, KS | (b) | 1,932 | 5,629 | — | — | 1,932 | 5,629 | 7,561 | (268 | ) | 2009 | 07/17/13 | 6 to 43 Years | |||||||||||||||||||||
| Las Cruces, NM | (b) | 1,328 | 2,616 | — | — | 1,328 | 2,616 | 3,944 | (134 | ) | 2002 | 07/17/13 | 8 to 41 Years | |||||||||||||||||||||
| Mt Juliet, TN | (c ) | 2,049 | 4,604 | — | — | 2,049 | 4,604 | 6,653 | (213 | ) | 2008 | 07/17/13 | 10 to 45 Years | |||||||||||||||||||||
| Salt Lake City, UT | 18,000 | 4,955 | 18,250 | — | — | 4,955 | 18,250 | 23,205 | (912 | ) | 1999 | 07/17/13 | 3 to 40 Years | |||||||||||||||||||||
| Santa Clara, CA | (d) | 2,873 | 8,252 | — | — | 2,873 | 8,252 | 11,125 | (370 | ) | 2002 | 07/17/13 | 5 to 48 Years | |||||||||||||||||||||
| Taunton, MA | (f) | 1,592 | 3,608 | — | — | 1,592 | 3,608 | 5,200 | (258 | ) | 2001 | 07/17/13 | 9 to 28 Years | |||||||||||||||||||||
| Topeka, KS | 2,000 | 542 | 2,251 | — | — | 542 | 2,251 | 2,793 | (91 | ) | 2006 | 07/17/13 | 3 to 48 Years | |||||||||||||||||||||
| Initial Cost to Company | Cost Capitalized Subsequent to Acquisition including impairment | Gross Amount at December 31, | Life in which depreciation in latest Statement of Operations is computed | ||||||||||||||||||||||
| Description | Encumbrances | Land and Improvements | Buildings and Improvements | Improvements/ Land | Improvements/ building | Land and Improvements | Buildings and Improvements | Total | Final Accum | Date of Construction | Date Acquired | ||||||||||||||
| Wayland, MI | (b) | 1,947 | 5,105 | — | — | 1,947 | 5,105 | 7,052 | (600 | ) | 2000 | 07/17/13 | 7 to 22 Years | |||||||||||||||||||||
| Wichita, KS | (c ) | 3,368 | 6,312 | — | — | 3,368 | 6,312 | 9,680 | (434 | ) | 1984 | 07/17/13 | 7 to 29 Years | |||||||||||||||||||||
| Greenville, SC | (c) | 9,731 | 11,625 | — | — | 9,731 | 11,625 | 21,356 | (1,777 | ) | 1999 | 07/17/13 | 3 to 40 Years | ||||||||||||||||||||
| Independence, MO | (c) | 1,058 | 1,297 | — | — | 1,058 | 1,297 | 2,355 | (321 | ) | 1968 | 11/25/14 | 4 to 15 Years | ||||||||||||||||||||
| Irving, TX | (a) | 7,348 | 970 | — | — | 7,348 | 970 | 8,318 | (2,271 | ) | 1960 | 09/01/09 | 12 to 27 Years | ||||||||||||||||||||
| Irving, TX | (a) | 931 | 268 | — | — | 931 | 268 | 1,199 | (172 | ) | 1965 | 09/01/09 | 12 to 17 Years | ||||||||||||||||||||
| Jacksonville, FL | (c) | 6,155 | 10,957 | — | — | 6,155 | 10,957 | 17,112 | (2,694 | ) | 2005 | 06/30/05 | 15 to 40 Years | ||||||||||||||||||||
| Jacksonville, FL | (a) | 3,170 | 938 | — | — | 3,170 | 938 | 4,108 | (587 | ) | 1989 | 12/28/05 | 15 to 30 Years | ||||||||||||||||||||
| Kansas City, MO | (c) | 1,310 | 1,824 | — | 6 | 1,310 | 1,830 | 3,140 | (125 | ) | 2001 | 12/18/15 | 15 to 20 Years | ||||||||||||||||||||
| Kansas City, MO | (c) | 620 | 1,280 | — | — | 620 | 1,280 | 1,900 | (92 | ) | 1978 | 12/31/15 | 15 to 20 Years | ||||||||||||||||||||
| Kennesaw, GA | (a) | 3,931 | 5,334 | — | — | 3,931 | 5,334 | 9,265 | (1,336 | ) | 1995 | 02/16/12 | 15 to 30 Years | ||||||||||||||||||||
| Midlothian, VA | (c) | 4,775 | 6,056 | — | — | 4,775 | 6,056 | 10,831 | (1,476 | ) | 2004 | 06/30/05 | 15 to 40 Years | ||||||||||||||||||||
| Ontario, CA | (c) | 7,981 | 6,937 | — | — | 7,981 | 6,937 | 14,918 | (1,678 | ) | 2005 | 06/30/05 | 15 to 40 Years | ||||||||||||||||||||
| Overland Park, KS | (c) | 1,390 | 320 | — | — | 1,390 | 320 | 1,710 | (30 | ) | 1967 | 03/11/16 | 7 to 20 Years | ||||||||||||||||||||
| Pineville, NC | (b) | 4,865 | 1,902 | — | — | 4,865 | 1,902 | 6,767 | (465 | ) | 2002 | 07/17/13 | 10 to 30 Years | ||||||||||||||||||||
| Plano, TX | (c) | 3,064 | 2,707 | — | — | 3,064 | 2,707 | 5,771 | (1,413 | ) | 1992 | 06/29/07 | 5 to 30 Years | ||||||||||||||||||||
| Pompano Beach, FL | (c) | 6,153 | 5,010 | — | — | 6,153 | 5,010 | 11,163 | (1,225 | ) | 2004 | 06/30/05 | 15 to 40 Years | ||||||||||||||||||||
| Raleigh, NC | (a) | 4,163 | 4,017 | — | — | 4,163 | 4,017 | 8,180 | (1,203 | ) | 1994 | 07/17/13 | 4 to 25 Years | ||||||||||||||||||||
| Tulsa, OK | (a) | 1,225 | 373 | — | — | 1,225 | 373 | 1,598 | (673 | ) | 1999 | 12/28/05 | 15 to 20 Years | ||||||||||||||||||||
| Pet Supplies & Service | ||||||||||||||||||||||||||||||||||
| Bridgeton, MO | (b) | 11,465 | 9,907 | — | — | 11,465 | 9,907 | 21,372 | (1,058 | ) | 1991 | 07/17/13 | 7 to 25 Years | |||||||||||||||||||||
| Chattanooga, TN | (c ) | 1,689 | 2,837 | — | — | 1,689 | 2,837 | 4,526 | (142 | ) | 1996 | 07/17/13 | 8 to 40 Years | |||||||||||||||||||||
| Daytona Beach, FL | (c ) | 775 | 3,880 | — | — | 775 | 3,880 | 4,655 | (166 | ) | 1996 | 07/17/13 | 8 to 42 Years | |||||||||||||||||||||
| Fredericksburg, VA | (c ) | 1,783 | 3,491 | — | — | 1,783 | 3,491 | 5,274 | (164 | ) | 1997 | 07/17/13 | 8 to 44 Years | |||||||||||||||||||||
| McCarran, NV | 22,000 | 8,334 | 37,762 | — | — | 8,334 | 37,762 | 46,096 | (2,091 | ) | 2008 | 07/17/13 | 8 to 40 Years | |||||||||||||||||||||
| Home Improvement | |||||||||||||||||||||||||||||||||
| Bedford Park, IL | (b) | 10,242 | 11,839 | — | — | 10,242 | 11,839 | 22,081 | (2,754 | ) | 1993 | 07/17/13 | 7 to 20 Years | ||||||||||||||||||||
| Blaine, MN | (c) | 1,728 | 3,437 | — | — | 1,728 | 3,437 | 5,165 | (406 | ) | 2006 | 07/17/13 | 8 to 43 Years | ||||||||||||||||||||
| Bridgeton, MO | (c) | 11,464 | 9,907 | — | — | 11,464 | 9,907 | 21,371 | (2,552 | ) | 1991 | 07/17/13 | 7 to 25 Years | ||||||||||||||||||||
| Broadview, IL | (c) | 12,392 | 32,193 | — | 154 | 12,392 | 32,347 | 44,739 | (5,698 | ) | 1994 | 07/17/13 | 2 to 30 Years | ||||||||||||||||||||
| Chester, NY | (c) | 6,432 | — | — | — | 6,432 | — | 6,432 | — | (f) | 07/17/13 | (f) | |||||||||||||||||||||
| Cincinnati, OH | (b) | 6,086 | 10,984 | — | — | 6,086 | 10,984 | 17,070 | (2,070 | ) | 1998 | 07/17/13 | 4 to 28 Years | ||||||||||||||||||||
| Colma, CA | (c) | 21,065 | 13,597 | — | — | 21,065 | 13,597 | 34,662 | (1,837 | ) | 1995 | 07/17/13 | 2 to 33 Years | ||||||||||||||||||||
| Enterprise, AL | (c) | 1,924 | 5,083 | — | 260 | 1,924 | 5,343 | 7,267 | (1,220 | ) | 1995 | 07/17/13 | 1 to 27 Years | ||||||||||||||||||||
| Lakewood, CO | (b) | 3,822 | — | — | — | 3,822 | — | 3,822 | — | (f) | 07/17/13 | (f) | |||||||||||||||||||||
| Lubbock, TX | (c) | 2,644 | 10,008 | — | 481 | 2,644 | 10,489 | 13,133 | (1,584 | ) | 1996 | 07/17/13 | 2 to 36 Years | ||||||||||||||||||||
| Midland, TX | (c) | 5,826 | 6,633 | — | 366 | 5,826 | 6,999 | 12,825 | (1,199 | ) | 1996 | 07/17/13 | 2 to 35 Years | ||||||||||||||||||||
| Rio Grande, NJ | (c) | 753 | 3,299 | — | — | 753 | 3,299 | 4,052 | (196 | ) | 2006 | 03/31/15 | 11 to 40 Years | ||||||||||||||||||||
| Tilton, NH | (c) | 13,185 | — | — | — | 13,185 | — | 13,185 | — | (f) | 07/17/13 | (f) | |||||||||||||||||||||
| Office Supplies | ||||||||||||||||||||||||||||||||||
| Alcoa, TN | (b) | 918 | 3,170 | — | — | 918 | 3,170 | 4,088 | (145 | ) | 1999 | 07/17/13 | 8 to 40 Years | |||||||||||||||||||||
| Angola, IN | (b) | 431 | 2,488 | — | — | 431 | 2,488 | 2,919 | (110 | ) | 1999 | 07/17/13 | 1 to 44 Years | |||||||||||||||||||||
| Balcones Heights, TX | (c ) | 1,888 | 2,117 | — | — | 1,888 | 2,117 | 4,005 | (105 | ) | 2009 | 07/17/13 | 11 to 46 Years | |||||||||||||||||||||
| Benton, AR | 2,130 | 1,236 | 1,926 | — | — | 1,236 | 1,926 | 3,162 | (108 | ) | 2001 | 07/17/13 | 3 to 38 Years | |||||||||||||||||||||
| Clarksville, IN | 2,900 | 991 | 3,161 | — | — | 991 | 3,161 | 4,152 | (126 | ) | 2006 | 07/17/13 | 3 to 48 Years | |||||||||||||||||||||
| Crossville, TN | (b) | 668 | 2,705 | — | — | 668 | 2,705 | 3,373 | (120 | ) | 2001 | 07/17/13 | 3 to 46 Years | |||||||||||||||||||||
| Dayton, OH | 2,130 | 710 | 2,417 | — | — | 710 | 2,417 | 3,127 | (106 | ) | 2005 | 07/17/13 | 8 to 47 Years | |||||||||||||||||||||
| Enterprise, AL | 1,850 | 675 | 2,239 | — | — | 675 | 2,239 | 2,914 | (107 | ) | 2006 | 07/17/13 | 8 to 43 Years | |||||||||||||||||||||
| Greenville, MS | (b) | 583 | 2,315 | — | — | 583 | 2,315 | 2,898 | (120 | ) | 2000 | 07/17/13 | 1 to 35 Years | |||||||||||||||||||||
| Greenville, SC | 2,955 | 742 | 3,026 | — | — | 742 | 3,026 | 3,768 | (111 | ) | 2007 | 07/17/13 | 3 to 48 Years | |||||||||||||||||||||
| Guntersville, AL | (b) | 1,039 | 2,535 | — | — | 1,039 | 2,535 | 3,574 | (112 | ) | 2001 | 07/17/13 | 2 to 46 Years | |||||||||||||||||||||
| Laurel, MS | (b) | 401 | 2,164 | — | — | 401 | 2,164 | 2,565 | (113 | ) | 2002 | 07/17/13 | 3 to 35 Years | |||||||||||||||||||||
| London, KY | (b) | 1,398 | 2,061 | — | — | 1,398 | 2,061 | 3,459 | (103 | ) | 2001 | 07/17/13 | 3 to 46 Years | |||||||||||||||||||||
| Moraine, OH | (b) | 781 | 2,649 | — | — | 781 | 2,649 | 3,430 | (120 | ) | 2006 | 07/17/13 | 2 to 43 Years | |||||||||||||||||||||
| Morrisville, NC | (c ) | 408 | 2,732 | — | — | 408 | 2,732 | 3,140 | (113 | ) | 2008 | 07/17/13 | 11 to 47 Years | |||||||||||||||||||||
| Orangeburg, SC | (b) | 621 | 2,208 | — | — | 621 | 2,208 | 2,829 | (100 | ) | 1999 | 07/17/13 | 12 to 45 Years | |||||||||||||||||||||
| Oxford, MS | 2,295 | 1,625 | 1,024 | — | — | 1,625 | 1,024 | 2,649 | (79 | ) | 2006 | 07/17/13 | 9 to 33 Years | |||||||||||||||||||||
| Peru, IL | (b) | 963 | 2,033 | — | — | 963 | 2,033 | 2,996 | (122 | ) | 1998 | 07/17/13 | 1 to 35 Years | |||||||||||||||||||||
| Warrensburg, MO | (b) | 651 | 2,261 | — | — | 651 | 2,261 | 2,912 | (121 | ) | 2001 | 07/17/13 | 3 to 38 Years | |||||||||||||||||||||
| Warsaw, IN | 1,850 | 590 | 2,504 | — | — | 590 | 2,504 | 3,094 | (117 | ) | 1998 | 07/17/13 | 11 to 44 Years | |||||||||||||||||||||
| Distribution | |||||||||||||||||||||||||||||||||
| Arlington, WA | (c) | 1,860 | 10,402 | — | — | 1,860 | 10,402 | 12,262 | (654 | ) | 2002 | 11/21/2014 | 7 to 40 Years | ||||||||||||||||||||
| Baton Rouge, LA | (b) | 2,898 | 8,024 | — | — | 2,898 | 8,024 | 10,922 | (1,059 | ) | 2008 | 7/17/2013 | 9 to 43 Years | ||||||||||||||||||||
| Dayton, NJ | (c) | 12,701 | 10,723 | — | — | 12,701 | 10,723 | 23,424 | (118 | ) | 1975 | 10/27/2016 | 7 to 30 Years | ||||||||||||||||||||
| Financial Services | |||||||||||||||||||||||||||||||||
| Cross Plains, WI | (b) | 1,117 | 1,479 | — | — | 1,117 | 1,479 | 2,596 | (260 | ) | 2007 | 07/17/13 | 1 to 22 Years | ||||||||||||||||||||
| Delray Beach, FL | (c ) | 3,831 | 16,789 | — | — | 3,831 | 16,789 | 20,620 | (592 | ) | 1975 | 07/17/13 | 8 to 50 Years | ||||||||||||||||||||
| Yuma, AZ | (c ) | 2,583 | 5,221 | — | — | 2,583 | 5,221 | 7,804 | (327 | ) | 2008 | 07/17/13 | 4 to 46 Years | ||||||||||||||||||||
| Initial Cost to Company | Cost Capitalized Subsequent to Acquisition including impairment | Gross Amount at December 31, | Life in which depreciation in latest Statement of Operations is computed | ||||||||||||||||||||||
| Description | Encumbrances | Land and Improvements | Buildings and Improvements | Improvements/ Land | Improvements/ building | Land and Improvements | Buildings and Improvements | Total | Final Accum | Date of Construction | Date Acquired | ||||||||||||||
| Wholesale Clubs | ||||||||||||||||||||||||||||||||||
| Ft Lauderdale, FL | (c ) | 6,776 | 18,649 | — | — | 6,776 | 18,649 | 25,425 | (921 | ) | 2007 | 07/17/13 | 12 to 37 Years | |||||||||||||||||||||
| Haverhill, MA | 9,100 | 3,192 | 15,353 | — | — | 3,192 | 15,353 | 18,545 | (876 | ) | 2006 | 07/17/13 | 11 to 32 Years | |||||||||||||||||||||
| Woodstock, GA | (c ) | 4,383 | 16,588 | — | — | 4,383 | 16,588 | 20,971 | (967 | ) | 2002 | 07/17/13 | 8 to 33 Years | |||||||||||||||||||||
| Edwardsville, KS | (c) | 12,780 | 13,501 | — | — | 12,780 | 13,501 | 26,281 | (3,707 | ) | 1999 | 7/17/2013 | 9 to 29 Years | ||||||||||||||||||||
| Hickory, NC | (c) | 1,356 | 5,406 | — | — | 1,356 | 5,406 | 6,762 | (427 | ) | 2006 | 5/11/2015 | 10 to 30 Years | ||||||||||||||||||||
| Huntsville, AL | (b) | 5,115 | 6,701 | — | — | 5,115 | 6,701 | 11,816 | (1,587 | ) | 2008 | 7/17/2013 | 10 to 38 Years | ||||||||||||||||||||
| Maxton, NC | (c) | 870 | 6,960 | — | — | 870 | 6,960 | 7,830 | (2 | ) | 2016 | 12/16/2016 | 9 to 40 Years | ||||||||||||||||||||
| Peoria, IL | (c) | 953 | 1,916 | — | 13 | 953 | 1,929 | 2,882 | (398 | ) | 1996 | 7/17/2013 | 3 to 30 Years | ||||||||||||||||||||
| Riverside, CA | (a) | 1,203 | 6,254 | — | — | 1,203 | 6,254 | 7,457 | (1,703 | ) | 2004 | 7/1/2005 | 14 to 40 Years | ||||||||||||||||||||
| Rockford, IL | (c) | 1,407 | 3,708 | (966 | ) | (2,399 | ) | 441 | 1,309 | 1,750 | — | 1994 | 7/17/2013 | 2 to 33 Years | |||||||||||||||||||
| South Windsor, CT | (c) | 1,590 | 6,774 | — | — | 1,590 | 6,774 | 8,364 | (627 | ) | 1982 | 5/5/2015 | 7 to 20 Years | ||||||||||||||||||||
| Tavares, FL | (a) | 1,075 | 5,098 | — | — | 1,075 | 5,098 | 6,173 | (1,635 | ) | 2004 | 7/1/2005 | 14 to 40 Years | ||||||||||||||||||||
| Walker, MI | (b) | 2,287 | 4,469 | (1,369 | ) | (2,527 | ) | 918 | 1,942 | 2,860 | (24 | ) | 2001 | 7/17/2013 | 4 to 34 Years | ||||||||||||||||||
| Dollar Stores | ||||||||||||||||||||||||||||||||||
| Adair, OK | (c ) | 264 | 855 | — | — | 264 | 855 | 1,119 | (32 | ) | 2012 | 10/29/13 | 13 to 40 Years | |||||||||||||||||||||
| Altus, OK | (c ) | 315 | 918 | — | — | 315 | 918 | 1,233 | (33 | ) | 2012 | 10/29/13 | 13 to 40 Years | |||||||||||||||||||||
| Ardmore, TN | 1,804 | 950 | 1,847 | — | — | 950 | 1,847 | 2,797 | (126 | ) | 2005 | 07/17/13 | 8 to 40 Years | |||||||||||||||||||||
| Atoka, OK | (c ) | 466 | 1,304 | — | — | 466 | 1,304 | 1,770 | (48 | ) | 2012 | 10/29/13 | 13 to 40 Years | |||||||||||||||||||||
| Cabot, AR | (a) | 132 | 404 | — | — | 132 | 404 | 536 | (32 | ) | 1970 | 03/31/14 | 1 to 15 Years | |||||||||||||||||||||
| Centre, AL | (c ) | 233 | 767 | — | — | 233 | 767 | 1,000 | (32 | ) | 2001 | 09/17/13 | 12 to 40 Years | |||||||||||||||||||||
| Claremore, OK | (c ) | 243 | 928 | — | — | 243 | 928 | 1,171 | (34 | ) | 2012 | 10/29/13 | 13 to 40 Years | |||||||||||||||||||||
| Cowarts, AL | (c ) | 396 | 836 | — | — | 396 | 836 | 1,232 | (34 | ) | 2011 | 09/17/13 | 12 to 40 Years | |||||||||||||||||||||
| Crossville, AL | (c ) | 264 | 849 | — | — | 264 | 849 | 1,113 | (35 | ) | 2011 | 09/17/13 | 12 to 40 Years | |||||||||||||||||||||
| Crossville, TN | 1,950 | 1,041 | 1,871 | — | — | 1,041 | 1,871 | 2,912 | (125 | ) | 2006 | 07/17/13 | 7 to 40 Years | |||||||||||||||||||||
| Crystal City, TX | (c ) | 295 | 939 | — | — | 295 | 939 | 1,234 | (34 | ) | 2012 | 10/29/13 | 13 to 40 Years | |||||||||||||||||||||
| De Soto, KS | (c ) | 301 | 1,049 | — | — | 301 | 1,049 | 1,350 | (45 | ) | 2012 | 10/29/13 | 13 to 40 Years | |||||||||||||||||||||
| Eastaboga, AL | (c ) | 223 | 937 | — | — | 223 | 937 | 1,160 | (37 | ) | 2001 | 09/17/13 | 12 to 40 Years | |||||||||||||||||||||
| Emporia, KS | (c ) | 292 | 1,176 | — | — | 292 | 1,176 | 1,468 | (46 | ) | 2012 | 10/29/13 | 13 to 40 Years | |||||||||||||||||||||
| Enterprise, TN | (c ) | 255 | 803 | — | — | 255 | 803 | 1,058 | (32 | ) | 2011 | 09/17/13 | 12 to 40 Years | |||||||||||||||||||||
| Fruita, CO | (c ) | 255 | 1,025 | — | — | 255 | 1,025 | 1,280 | (39 | ) | 2012 | 10/29/13 | 13 to 40 Years | |||||||||||||||||||||
| Gore, OK | (c ) | 182 | 924 | — | — | 182 | 924 | 1,106 | (36 | ) | 2012 | 10/29/13 | 13 to 40 Years | |||||||||||||||||||||
| Hill City, KS | (c ) | 243 | 815 | — | — | 243 | 815 | 1,058 | (36 | ) | 2012 | 10/29/13 | 13 to 40 Years | |||||||||||||||||||||
| Hobart, OK | (c ) | 230 | 910 | — | — | 230 | 910 | 1,140 | (36 | ) | 2012 | 10/29/13 | 13 to 40 Years | |||||||||||||||||||||
| Hobbs, NM | (c ) | 405 | 949 | — | — | 405 | 949 | 1,354 | (41 | ) | 2012 | 10/29/13 | 13 to 40 Years | |||||||||||||||||||||
| Jasper, AL | (c ) | 365 | 1,052 | — | — | 365 | 1,052 | 1,417 | (42 | ) | 2011 | 09/17/13 | 12 to 40 Years | |||||||||||||||||||||
| Ketchum, OK | (c ) | 297 | 760 | — | — | 297 | 760 | 1,057 | (35 | ) | 2012 | 10/29/13 | 13 to 40 Years | |||||||||||||||||||||
| La Cygne, KS | (c ) | 120 | 833 | — | — | 120 | 833 | 953 | (32 | ) | 2012 | 10/29/13 | 13 to 40 Years | |||||||||||||||||||||
| Las Cruces, NM | (c ) | 452 | 900 | — | — | 452 | 900 | 1,352 | (38 | ) | 2012 | 10/29/13 | 13 to 40 Years | |||||||||||||||||||||
| Livingston, TN | 1,856 | 1,073 | 1,889 | — | — | 1,073 | 1,889 | 2,962 | (138 | ) | 2006 | 07/17/13 | 7 to 40 Years | |||||||||||||||||||||
| Okay, OK | (c ) | 200 | 901 | — | — | 200 | 901 | 1,101 | (34 | ) | 2012 | 10/29/13 | 13 to 40 Years | |||||||||||||||||||||
| Ord, NE | (c ) | 222 | 1,010 | — | — | 222 | 1,010 | 1,232 | (39 | ) | 2012 | 10/29/13 | 13 to 40 Years | |||||||||||||||||||||
| Orrville, AL | (c ) | 192 | 826 | — | — | 192 | 826 | 1,018 | (36 | ) | 2011 | 09/17/13 | 12 to 40 Years | |||||||||||||||||||||
| Pagosa Springs, CO | (c ) | 253 | 1,031 | — | — | 253 | 1,031 | 1,284 | (38 | ) | 2012 | 10/29/13 | 13 to 40 Years | |||||||||||||||||||||
| Rehobeth, AL | (c ) | 259 | 774 | — | — | 259 | 774 | 1,033 | (31 | ) | 2011 | 09/17/13 | 12 to 40 Years | |||||||||||||||||||||
| Sand Springs, OK | (c ) | 396 | 1,039 | — | — | 396 | 1,039 | 1,435 | (40 | ) | 2012 | 10/29/13 | 13 to 40 Years | |||||||||||||||||||||
| Silt, CO | (c ) | 334 | 894 | — | — | 334 | 894 | 1,228 | (33 | ) | 2012 | 10/29/13 | 13 to 40 Years | |||||||||||||||||||||
| Spiro, OK | (c ) | 263 | 1,099 | — | — | 263 | 1,099 | 1,362 | (46 | ) | 2012 | 10/29/13 | 13 to 40 Years | |||||||||||||||||||||
| Car Washes | |||||||||||||||||||||||||||||||||
| Abilene, TX | (c) | 2,733 | 3,080 | — | — | 2,733 | 3,080 | 5,813 | (246 | ) | 1993 | 04/07/15 | 15 to 30 Years | ||||||||||||||||||||
| Albuquerque, NM | (a) | 2,472 | 2,117 | — | — | 2,472 | 2,117 | 4,589 | (345 | ) | 2005 | 05/13/14 | 15 to 30 Years | ||||||||||||||||||||
| Albuquerque, NM | (a) | 2,657 | 3,225 | — | — | 2,657 | 3,225 | 5,882 | (537 | ) | 1960 | 05/13/14 | 15 to 30 Years | ||||||||||||||||||||
| Albuquerque, NM | (a) | 1,179 | — | — | — | 1,179 | — | 1,179 | — | (f) | 05/13/14 | (f) | |||||||||||||||||||||
| Albuquerque, NM | (a) | 1,151 | 1,677 | — | — | 1,151 | 1,677 | 2,828 | (237 | ) | 1976 | 05/13/14 | 15 to 30 Years | ||||||||||||||||||||
| Albuquerque, NM | (a) | 1,563 | 2,700 | — | — | 1,563 | 2,700 | 4,263 | (313 | ) | 1994 | 05/13/14 | 15 to 30 Years | ||||||||||||||||||||
| Albuquerque, NM | (a) | 2,586 | 2,742 | — | — | 2,586 | 2,742 | 5,328 | (375 | ) | 2002 | 05/13/14 | 15 to 30 Years | ||||||||||||||||||||
| Arlington, TN | (c) | 868 | 1,487 | — | — | 868 | 1,487 | 2,355 | (83 | ) | 2010 | 09/30/15 | 15 to 30 Years | ||||||||||||||||||||
| Boise, ID | (a) | 2,155 | 2,488 | — | — | 2,155 | 2,488 | 4,643 | (552 | ) | 2004 | 05/15/13 | 15 to 30 Years | ||||||||||||||||||||
| Boise, ID | (a) | 217 | — | — | — | 217 | — | 217 | (7 | ) | 2013 | 05/15/13 | 15 to 15 Years | ||||||||||||||||||||
| Casselberry, FL | (c) | 1,042 | 2,406 | — | — | 1,042 | 2,406 | 3,448 | (93 | ) | 1988 | 02/09/16 | 13 to 30 Years | ||||||||||||||||||||
| Chandler, AZ | (c) | 1,293 | 1,951 | — | — | 1,293 | 1,951 | 3,244 | (23 | ) | 2006 | 09/29/16 | 21 to 30 Years | ||||||||||||||||||||
| Edgewater, MD | (c) | 4,720 | 1,460 | — | — | 4,720 | 1,460 | 6,180 | (162 | ) | 2005 | 01/21/15 | 15 to 30 Years | ||||||||||||||||||||
| Edmond, OK | (c) | 644 | 1,896 | — | — | 644 | 1,896 | 2,540 | (93 | ) | 2005 | 09/30/15 | 15 to 30 Years | ||||||||||||||||||||
| Glendale, AZ | (c) | 1,524 | 854 | — | — | 1,524 | 854 | 2,378 | (16 | ) | 1988 | 09/29/16 | 21 to 30 Years | ||||||||||||||||||||
| Houston, TX | (a) | 1,703 | 1,221 | — | — | 1,703 | 1,221 | 2,924 | (216 | ) | 1996 | 06/18/14 | 15 to 30 Years | ||||||||||||||||||||
| Madison, WI | (c) | 564 | 1,623 | — | — | 564 | 1,623 | 2,187 | (92 | ) | 1956 | 06/30/15 | 15 to 30 Years | ||||||||||||||||||||
| Madison, WI | (c) | 612 | 1,775 | — | — | 612 | 1,775 | 2,387 | (119 | ) | 1958 | 06/30/15 | 15 to 30 Years | ||||||||||||||||||||
| Madison, WI | (c) | 905 | 2,728 | — | — | 905 | 2,728 | 3,633 | (167 | ) | 1961 | 06/30/15 | 15 to 30 Years | ||||||||||||||||||||
| Meridian, ID | (a) | 1,924 | 2,170 | 536 | 20 | 2,460 | 2,190 | 4,650 | (515 | ) | 2006 | 05/15/13 | 15 to 30 Years | ||||||||||||||||||||
| Millersville, MD | (c) | 2,250 | 1,636 | — | — | 2,250 | 1,636 | 3,886 | (145 | ) | 2007 | 01/21/15 | 15 to 30 Years | ||||||||||||||||||||
| Nampa, ID | (a) | 3,240 | 2,343 | — | — | 3,240 | 2,343 | 5,583 | (598 | ) | 2010 | 05/15/13 | 15 to 30 Years | ||||||||||||||||||||
| Ocoee, FL | (c) | 2,128 | 1,775 | — | 18 | 2,128 | 1,793 | 3,921 | (60 | ) | 2009 | 05/03/16 | 17 to 30 Years | ||||||||||||||||||||
| Initial Cost to Company | Cost Capitalized Subsequent to Acquisition including impairment | Gross Amount at December 31, | Life in which depreciation in latest Statement of Operations is computed | ||||||||||||||||||||||
| Description | Encumbrances | Land and Improvements | Buildings and Improvements | Improvements/ Land | Improvements/ building | Land and Improvements | Buildings and Improvements | Total | Final Accum | Date of Construction | Date Acquired | ||||||||||||||
| Stigler, OK | (c ) | 610 | 809 | — | — | 610 | 809 | 1,419 | (37 | ) | 2012 | 10/29/13 | 13 to 40 Years | |||||||||||||||||||||
| Tallassee, AL | (c ) | 141 | 895 | — | — | 141 | 895 | 1,036 | (34 | ) | 2011 | 09/17/13 | 12 to 40 Years | |||||||||||||||||||||
| Temple, TX | (c ) | 414 | 897 | — | — | 414 | 897 | 1,311 | (36 | ) | 2012 | 10/29/13 | 13 to 40 Years | |||||||||||||||||||||
| Texarkana, AR | (a) | 303 | 201 | — | — | 303 | 201 | 504 | (12 | ) | 1998 | 03/31/14 | 4 to 20 Years | |||||||||||||||||||||
| Topeka, KS | (c ) | 313 | 882 | — | — | 313 | 882 | 1,195 | (36 | ) | 2012 | 10/29/13 | 13 to 40 Years | |||||||||||||||||||||
| Tornillo, TX | (c ) | 255 | 818 | — | — | 255 | 818 | 1,073 | (35 | ) | 2012 | 10/29/13 | 13 to 40 Years | |||||||||||||||||||||
| Walters, OK | (c ) | 173 | 1,042 | — | — | 173 | 1,042 | 1,215 | (39 | ) | 2012 | 10/29/13 | 13 to 40 Years | |||||||||||||||||||||
| Wetumpka, AL | (c ) | 303 | 784 | — | — | 303 | 784 | 1,087 | (33 | ) | 2011 | 09/17/13 | 12 to 40 Years | |||||||||||||||||||||
| Oklahoma City, OK | (c) | 545 | 1,995 | — | — | 545 | 1,995 | 2,540 | (97 | ) | 2005 | 09/30/15 | 15 to 30 Years | ||||||||||||||||||||
| Oklahoma City, OK | (c) | 1,004 | 1,933 | — | — | 1,004 | 1,933 | 2,937 | (106 | ) | 2005 | 09/30/15 | 15 to 30 Years | ||||||||||||||||||||
| Orlando, FL | (c) | 2,709 | 2,728 | — | 45 | 2,709 | 2,773 | 5,482 | (122 | ) | 2001 | 02/09/16 | 13 to 30 Years | ||||||||||||||||||||
| Orlando, FL | (c) | 1,629 | 1,895 | — | — | 1,629 | 1,895 | 3,524 | (89 | ) | 2005 | 02/09/16 | 13 to 30 Years | ||||||||||||||||||||
| Phoenix, AZ | (c) | 2,066 | 1,581 | — | — | 2,066 | 1,581 | 3,647 | (22 | ) | 2009 | 09/29/16 | 21 to 30 Years | ||||||||||||||||||||
| Phoenix, AZ | (c) | 1,143 | 439 | — | — | 1,143 | 439 | 1,582 | (8 | ) | 1970 | 09/29/16 | 21 to 30 Years | ||||||||||||||||||||
| Phoenix, AZ | (c) | 1,835 | 2,332 | — | 54 | 1,835 | 2,386 | 4,221 | (29 | ) | 1974 | 09/29/16 | 21 to 30 Years | ||||||||||||||||||||
| Rockford, IL | (c) | 706 | 2,669 | — | — | 706 | 2,669 | 3,375 | (151 | ) | 1959 | 06/30/15 | 15 to 30 Years | ||||||||||||||||||||
| Round Rock, TX | (c) | 1,167 | 1,549 | — | — | 1,167 | 1,549 | 2,716 | (123 | ) | 2009 | 05/07/15 | 15 to 30 Years | ||||||||||||||||||||
| Sherwood, AR | (c) | 1,128 | 1,388 | — | — | 1,128 | 1,388 | 2,516 | (91 | ) | 2010 | 09/30/15 | 15 to 30 Years | ||||||||||||||||||||
| Siloam Springs, AR | (c) | 991 | 1,884 | — | — | 991 | 1,884 | 2,875 | (101 | ) | 2005 | 09/30/15 | 15 to 30 Years | ||||||||||||||||||||
| Springdale, AR | (c) | 521 | 2,032 | — | — | 521 | 2,032 | 2,553 | (100 | ) | 2005 | 09/30/15 | 15 to 30 Years | ||||||||||||||||||||
| St. Paul, MN | (c) | 5,274 | 136 | — | — | 5,274 | 136 | 5,410 | (26 | ) | 1966 | 12/13/16 | 12 to 30 Years | ||||||||||||||||||||
| Texarkana, TX | (c) | 483 | 1,400 | — | — | 483 | 1,400 | 1,883 | (70 | ) | 2010 | 09/30/15 | 15 to 30 Years | ||||||||||||||||||||
| Manufacturing | |||||||||||||||||||||||||||||||||
| Annapolis Junction, MD | (a) | 2,245 | 1,105 | (1,535 | ) | (547 | ) | 710 | 558 | 1,268 | (231 | ) | 1930 | 09/29/06 | 15 to 30 Years | ||||||||||||||||||
| Avila, IN | (c) | 642 | 4,958 | — | — | 642 | 4,958 | 5,600 | (380 | ) | 1990 | 12/17/14 | 15 to 30 Years | ||||||||||||||||||||
| Byron, IL | (a) | 734 | 4,334 | — | — | 734 | 4,334 | 5,068 | (2,243 | ) | 1965 | 12/29/06 | 10 to 20 Years | ||||||||||||||||||||
| Dublin, VA | (a) | 491 | 1,401 | — | — | 491 | 1,401 | 1,892 | (839 | ) | 1985 | 12/11/06 | 15 to 20 Years | ||||||||||||||||||||
| Edon, OH | (c) | 642 | 2,649 | (268 | ) | (1,663 | ) | 374 | 986 | 1,360 | — | 1953 | 02/21/07 | 14 to 20 Years | |||||||||||||||||||
| Fremont, IN | (a) | 427 | 2,176 | — | — | 427 | 2,176 | 2,603 | (824 | ) | 1960 | 02/21/07 | 14 to 30 Years | ||||||||||||||||||||
| Fulton, NY | (c) | 445 | 6,113 | — | 35 | 445 | 6,148 | 6,593 | (32 | ) | 1983 | 10/27/16 | 7 to 40 Years | ||||||||||||||||||||
| Houston, TX | (c) | 2,421 | 15,723 | (1,504 | ) | (10,089 | ) | 917 | 5,634 | 6,551 | — | 1983 | 07/17/13 | 2 to 35 Years | |||||||||||||||||||
| Loudon, TN | (c) | 1,188 | 4,904 | — | — | 1,188 | 4,904 | 6,092 | (1,932 | ) | 1992 | 03/31/08 | 15 to 30 Years | ||||||||||||||||||||
| Merced, CA | (c) | 3,456 | 9,007 | — | — | 3,456 | 9,007 | 12,463 | (3,043 | ) | 1998 | 03/31/08 | 15 to 30 Years | ||||||||||||||||||||
| Meridian, CT | (c) | 1,766 | 7,848 | — | — | 1,766 | 7,848 | 9,614 | (637 | ) | 1997 | 12/17/14 | 15 to 30 Years | ||||||||||||||||||||
| Minerva, OH | (c) | 649 | 3,920 | (217 | ) | (770 | ) | 432 | 3,150 | 3,582 | (1,747 | ) | 1919 | 02/21/07 | 8 to 20 Years | ||||||||||||||||||
| New Castle, PA | (c) | 1,084 | 5,507 | — | — | 1,084 | 5,507 | 6,591 | (961 | ) | 1999 | 07/17/13 | 8 to 26 Years | ||||||||||||||||||||
| Pawcatuck, CT | (c) | 2,736 | 9,218 | — | 36 | 2,736 | 9,254 | 11,990 | (76 | ) | 1969 | 10/27/16 | 5 to 40 Years | ||||||||||||||||||||
| Pulaski, VA | (a) | 333 | 1,536 | — | — | 333 | 1,536 | 1,869 | (869 | ) | 1967 | 12/11/06 | 15 to 20 Years | ||||||||||||||||||||
| Royal Oak, MI | (a) | 3,426 | 7,071 | — | — | 3,426 | 7,071 | 10,497 | (2,577 | ) | 1952 | 03/10/06 | 15 to 30 Years | ||||||||||||||||||||
| Scottdale, PA | (b) | 607 | 11,008 | (203 | ) | (2,239 | ) | 404 | 8,769 | 9,173 | (5,123 | ) | 1959 | 12/28/06 | 14 to 20 Years | ||||||||||||||||||
| Sidney, OH | (a) | 921 | 4,177 | — | — | 921 | 4,177 | 5,098 | (2,283 | ) | 1987 | 12/22/05 | 12 to 20 Years | ||||||||||||||||||||
| Troy, MI | (a) | 1,128 | 947 | — | — | 1,128 | 947 | 2,075 | (351 | ) | 1952 | 03/10/06 | 15 to 30 Years | ||||||||||||||||||||
| Winston-Salem, NC | (b) | 927 | 3,455 | — | — | 927 | 3,455 | 4,382 | (597 | ) | 1987 | 07/17/13 | 5 to 40 Years | ||||||||||||||||||||
| Dollar Stores | |||||||||||||||||||||||||||||||||
| Adair, OK | (b) | 264 | 855 | — | — | 264 | 855 | 1,119 | (88 | ) | 2012 | 10/29/13 | 13 to 40 Years | ||||||||||||||||||||
| Alpena, AR | (c) | 359 | 600 | — | — | 359 | 600 | 959 | (61 | ) | 2014 | 12/15/14 | 14 to 40 Years | ||||||||||||||||||||
| Altus, OK | (b) | 315 | 918 | — | — | 315 | 918 | 1,233 | (91 | ) | 2012 | 10/29/13 | 13 to 40 Years | ||||||||||||||||||||
| Anderson, IN | (c) | 359 | 781 | — | — | 359 | 781 | 1,140 | (55 | ) | 2015 | 03/20/15 | 14 to 40 Years | ||||||||||||||||||||
| Ardmore, TN | (c) | 950 | 1,847 | — | — | 950 | 1,847 | 2,797 | (304 | ) | 2005 | 07/17/13 | 8 to 40 Years | ||||||||||||||||||||
| Atoka, OK | (b) | 466 | 1,304 | — | — | 466 | 1,304 | 1,770 | (130 | ) | 2012 | 10/29/13 | 13 to 40 Years | ||||||||||||||||||||
| Aztec, NM | (c) | 548 | 623 | — | — | 548 | 623 | 1,171 | (53 | ) | 2014 | 03/31/15 | 14 to 40 Years | ||||||||||||||||||||
| Bentonia, MS | (a) | 227 | 745 | — | — | 227 | 745 | 972 | (43 | ) | 2014 | 06/22/15 | 13 to 40 Years | ||||||||||||||||||||
| Birch Tree, MO | (c) | 252 | 659 | — | — | 252 | 659 | 911 | (55 | ) | 2014 | 03/31/15 | 14 to 40 Years | ||||||||||||||||||||
| Bloomfield, NM | (c) | 409 | 663 | — | — | 409 | 663 | 1,072 | (46 | ) | 2015 | 05/14/15 | 14 to 40 Years | ||||||||||||||||||||
| Buckatunna, MS | (c) | 199 | 798 | — | — | 199 | 798 | 997 | (38 | ) | 2014 | 09/24/15 | 13 to 40 Years | ||||||||||||||||||||
| Bulls Gap, TN | (c) | 467 | 762 | — | — | 467 | 762 | 1,229 | (54 | ) | 2014 | 03/20/15 | 14 to 40 Years | ||||||||||||||||||||
| Byng, OK | (a) | 205 | 646 | — | — | 205 | 646 | 851 | (37 | ) | 2015 | 07/14/15 | 14 to 40 Years | ||||||||||||||||||||
| Cabot, AR | (a) | 132 | 404 | — | — | 132 | 404 | 536 | (115 | ) | 1970 | 03/31/14 | 1 to 15 Years | ||||||||||||||||||||
| Cameron, OK | (c) | 312 | 710 | — | — | 312 | 710 | 1,022 | (52 | ) | 2014 | 12/15/14 | 14 to 40 Years | ||||||||||||||||||||
| Center Ridge, AR | (c) | 313 | 595 | — | — | 313 | 595 | 908 | (61 | ) | 2014 | 12/15/14 | 14 to 40 Years | ||||||||||||||||||||
| Centre, AL | (b) | 233 | 767 | — | — | 233 | 767 | 1,000 | (83 | ) | 2011 | 09/17/13 | 12 to 40 Years | ||||||||||||||||||||
| Claremore, OK | (b) | 243 | 928 | — | — | 243 | 928 | 1,171 | (92 | ) | 2012 | 10/29/13 | 13 to 40 Years | ||||||||||||||||||||
| Clear Lake, IA | (c) | 374 | 760 | — | — | 374 | 760 | 1,134 | (52 | ) | 2015 | 05/14/15 | 14 to 40 Years | ||||||||||||||||||||
| Clovis, NM | (c) | 311 | 659 | — | — | 311 | 659 | 970 | (46 | ) | 2015 | 05/14/15 | 14 to 40 Years | ||||||||||||||||||||
| Initial Cost to Company | Cost Capitalized Subsequent to Acquisition including impairment | Gross Amount at December 31, 2016 (d) | Life in which depreciation in latest Statement of Operations is computed | ||||||||||||||||||||||
| Description | Encumbrances (e) | Land and Improvements | Buildings and Improvements | Improvements/ Land | Improvements/ building | Land and Improvements | Buildings and Improvements | Total | Final Accum | Date of Construction | Date Acquired | ||||||||||||||
| Cowarts, AL | (b) | 396 | 836 | — | — | 396 | 836 | 1,232 | (89 | ) | 2011 | 09/17/13 | 12 to 40 Years | ||||||||||||||||||||
| Creal Springs, IL | (c) | 261 | 653 | — | — | 261 | 653 | 914 | (51 | ) | 2014 | 04/27/15 | 14 to 40 Years | ||||||||||||||||||||
| Crossville, TN | (c) | 1,041 | 1,871 | — | — | 1,041 | 1,871 | 2,912 | (301 | ) | 2006 | 07/17/13 | 7 to 40 Years | ||||||||||||||||||||
| Crossville, TN | (b) | 264 | 849 | — | — | 264 | 849 | 1,113 | (90 | ) | 2011 | 09/17/13 | 12 to 40 Years | ||||||||||||||||||||
| Crystal City, TX | (b) | 295 | 939 | — | — | 295 | 939 | 1,234 | (93 | ) | 2012 | 10/29/13 | 13 to 40 Years | ||||||||||||||||||||
| De Soto, KS | (b) | 301 | 1,049 | — | — | 301 | 1,049 | 1,350 | (122 | ) | 2012 | 10/29/13 | 13 to 40 Years | ||||||||||||||||||||
| Des Moines, IA | (c) | 354 | 807 | — | — | 354 | 807 | 1,161 | (61 | ) | 2014 | 03/20/15 | 8 to 40 Years | ||||||||||||||||||||
| Drexel, MO | (c) | 184 | 727 | — | — | 184 | 727 | 911 | (48 | ) | 2015 | 05/14/15 | 14 to 40 Years | ||||||||||||||||||||
| Duluth, MN | (c) | 422 | 869 | — | — | 422 | 869 | 1,291 | (59 | ) | 2015 | 05/12/15 | 9 to 40 Years | ||||||||||||||||||||
| Eastaboga, AL | (b) | 223 | 937 | — | — | 223 | 937 | 1,160 | (97 | ) | 2011 | 09/17/13 | 12 to 40 Years | ||||||||||||||||||||
| Emporia, KS | (b) | 292 | 1,176 | — | — | 292 | 1,176 | 1,468 | (124 | ) | 2012 | 10/29/13 | 13 to 40 Years | ||||||||||||||||||||
| Enterprise, AL | (b) | 255 | 803 | — | — | 255 | 803 | 1,058 | (84 | ) | 2011 | 09/17/13 | 12 to 40 Years | ||||||||||||||||||||
| Evart, MI | (c) | 306 | 703 | — | — | 306 | 703 | 1,009 | (51 | ) | 2014 | 03/20/15 | 14 to 40 Years | ||||||||||||||||||||
| Fruita, CO | (b) | 255 | 1,025 | — | — | 255 | 1,025 | 1,280 | (106 | ) | 2012 | 10/29/13 | 13 to 40 Years | ||||||||||||||||||||
| Gore, OK | (b) | 182 | 924 | — | — | 182 | 924 | 1,106 | (98 | ) | 2012 | 10/29/13 | 13 to 40 Years | ||||||||||||||||||||
| Hill City, KS | (b) | 243 | 815 | — | — | 243 | 815 | 1,058 | (98 | ) | 2012 | 10/29/13 | 13 to 40 Years | ||||||||||||||||||||
| Hobart, OK | (b) | 230 | 910 | — | — | 230 | 910 | 1,140 | (99 | ) | 2012 | 10/29/13 | 13 to 40 Years | ||||||||||||||||||||
| Hobbs, NM | (b) | 405 | 949 | — | — | 405 | 949 | 1,354 | (113 | ) | 2012 | 10/29/13 | 13 to 40 Years | ||||||||||||||||||||
| Hurley, MS | (a) | 412 | 1,084 | — | — | 412 | 1,084 | 1,496 | (62 | ) | 2013 | 06/22/15 | 13 to 40 Years | ||||||||||||||||||||
| Jasper, AL | (b) | 365 | 1,052 | — | — | 365 | 1,052 | 1,417 | (110 | ) | 2011 | 09/17/13 | 12 to 40 Years | ||||||||||||||||||||
| Keota, OK | (c) | 215 | 687 | — | — | 215 | 687 | 902 | (55 | ) | 2014 | 12/15/14 | 14 to 40 Years | ||||||||||||||||||||
| Ketchum, OK | (b) | 297 | 760 | — | — | 297 | 760 | 1,057 | (96 | ) | 2012 | 10/29/13 | 13 to 40 Years | ||||||||||||||||||||
| Kinross/Kincheloe, MI | (c) | 317 | 626 | — | — | 317 | 626 | 943 | (54 | ) | 2014 | 03/20/15 | 14 to 40 Years | ||||||||||||||||||||
| La Cygne, KS | (b) | 120 | 833 | — | — | 120 | 833 | 953 | (86 | ) | 2012 | 10/29/13 | 13 to 40 Years | ||||||||||||||||||||
| La Plata, MO | (c) | 283 | 653 | — | — | 283 | 653 | 936 | (51 | ) | 2014 | 04/27/15 | 14 to 40 Years | ||||||||||||||||||||
| Lakeview, IA | (c) | 251 | 568 | — | — | 251 | 568 | 819 | (42 | ) | 2015 | 04/27/15 | 14 to 40 Years | ||||||||||||||||||||
| Lakewood, OH | (c) | 522 | 2,053 | — | — | 522 | 2,053 | 2,575 | (251 | ) | 1996 | 07/17/13 | 3 to 35 Years | ||||||||||||||||||||
| Las Cruces, NM | (b) | 452 | 900 | — | — | 452 | 900 | 1,352 | (104 | ) | 2012 | 10/29/13 | 13 to 40 Years | ||||||||||||||||||||
| Laurel, MS | (a) | 432 | 705 | — | — | 432 | 705 | 1,137 | (48 | ) | 2012 | 06/22/15 | 11 to 40 Years | ||||||||||||||||||||
| Livingston, TN | (c) | 1,073 | 1,889 | — | — | 1,073 | 1,889 | 2,962 | (333 | ) | 2006 | 07/17/13 | 7 to 40 Years | ||||||||||||||||||||
| Los Lunas, NM | (c) | 282 | 740 | — | — | 282 | 740 | 1,022 | (57 | ) | 2015 | 05/14/15 | 14 to 40 Years | ||||||||||||||||||||
| Maben, MS | (c) | 263 | 734 | — | — | 263 | 734 | 997 | (41 | ) | 2014 | 09/24/15 | 13 to 40 Years | ||||||||||||||||||||
| Mansfield, OH | (c) | 288 | 825 | — | — | 288 | 825 | 1,113 | (52 | ) | 2014 | 04/28/15 | 9 to 40 Years | ||||||||||||||||||||
| Meridian, MS | (c) | 211 | 934 | — | — | 211 | 934 | 1,145 | (43 | ) | 2014 | 09/24/15 | 14 to 40 Years | ||||||||||||||||||||
| Mesa, AZ | (c) | 734 | 2 | 103 | 630 | 837 | 632 | 1,469 | (38 | ) | 1955 | 11/13/14 | 10 to 50 Years | ||||||||||||||||||||
| Nashville, AR | (c) | 519 | 697 | (153 | ) | (255 | ) | 366 | 442 | 808 | — | 1995 | 03/31/14 | 1 to 20 Years | |||||||||||||||||||
| Okay, OK | (b) | 200 | 901 | — | — | 200 | 901 | 1,101 | (93 | ) | 2012 | 10/29/13 | 13 to 40 Years | ||||||||||||||||||||
| Oppelo, AR | (a) | 354 | 553 | — | — | 354 | 553 | 907 | (42 | ) | 2015 | 07/14/15 | 14 to 40 Years | ||||||||||||||||||||
| Ord, NE | (b) | 222 | 1,010 | — | — | 222 | 1,010 | 1,232 | (107 | ) | 2012 | 10/29/13 | 13 to 40 Years | ||||||||||||||||||||
| Orrville, AL | (b) | 192 | 826 | — | — | 192 | 826 | 1,018 | (95 | ) | 2011 | 09/17/13 | 12 to 40 Years | ||||||||||||||||||||
| Initial Cost to Company | Cost Capitalized Subsequent to Acquisition including impairment | Gross Amount at December 31, 2016 (d) | Life in which depreciation in latest Statement of Operations is computed | ||||||||||||||||||||||
| Description | Encumbrances (e) | Land and Improvements | Buildings and Improvements | Improvements/ Land | Improvements/ building | Land and Improvements | Buildings and Improvements | Total | Final Accum | Date of Construction | Date Acquired | ||||||||||||||
| Otter Tail, MN | (c) | 338 | 791 | — | — | 338 | 791 | 1,129 | (52 | ) | 2014 | 03/20/15 | 14 to 40 Years | ||||||||||||||||||||
| Pagosa Springs, CO | (b) | 253 | 1,031 | — | — | 253 | 1,031 | 1,284 | (102 | ) | 2012 | 10/29/13 | 13 to 40 Years | ||||||||||||||||||||
| Pineville, MO | (c) | 253 | 699 | — | — | 253 | 699 | 952 | (58 | ) | 2014 | 03/31/15 | 14 to 40 Years | ||||||||||||||||||||
| Pleasant Hope, MO | (c) | 263 | 650 | — | — | 263 | 650 | 913 | (49 | ) | 2014 | 05/14/15 | 14 to 40 Years | ||||||||||||||||||||
| Quinton, OK | (c) | 245 | 683 | — | — | 245 | 683 | 928 | (52 | ) | 2014 | 12/15/14 | 14 to 40 Years | ||||||||||||||||||||
| Red Oak, OK | (a) | 245 | 675 | — | — | 245 | 675 | 920 | (37 | ) | 2015 | 07/14/15 | 14 to 40 Years | ||||||||||||||||||||
| Rehobeth, AL | (b) | 259 | 774 | — | — | 259 | 774 | 1,033 | (82 | ) | 2011 | 09/17/13 | 12 to 40 Years | ||||||||||||||||||||
| Salem, MO | (c) | 410 | 778 | — | — | 410 | 778 | 1,188 | (61 | ) | 2015 | 04/27/15 | 14 to 40 Years | ||||||||||||||||||||
| Sand Springs, OK | (b) | 396 | 1,039 | — | — | 396 | 1,039 | 1,435 | (109 | ) | 2012 | 10/29/13 | 13 to 40 Years | ||||||||||||||||||||
| Silt, CO | (b) | 334 | 894 | — | — | 334 | 894 | 1,228 | (89 | ) | 2012 | 10/29/13 | 13 to 40 Years | ||||||||||||||||||||
| Spiro, OK | (b) | 263 | 1,099 | — | — | 263 | 1,099 | 1,362 | (125 | ) | 2012 | 10/29/13 | 13 to 40 Years | ||||||||||||||||||||
| Stigler, OK | (b) | 610 | 809 | — | — | 610 | 809 | 1,419 | (99 | ) | 2012 | 10/29/13 | 13 to 40 Years | ||||||||||||||||||||
| Tallassee, AL | (b) | 141 | 895 | — | — | 141 | 895 | 1,036 | (87 | ) | 2011 | 09/17/13 | 12 to 40 Years | ||||||||||||||||||||
| Temple, TX | (b) | 414 | 897 | — | — | 414 | 897 | 1,311 | (98 | ) | 2012 | 10/29/13 | 13 to 40 Years | ||||||||||||||||||||
| Texarkana, AR | (a) | 303 | 201 | — | — | 303 | 201 | 504 | (43 | ) | 1988 | 03/31/14 | 4 to 20 Years | ||||||||||||||||||||
| Topeka, KS | (b) | 313 | 882 | — | — | 313 | 882 | 1,195 | (99 | ) | 2012 | 10/29/13 | 13 to 40 Years | ||||||||||||||||||||
| Tornillo, TX | (b) | 255 | 818 | — | — | 255 | 818 | 1,073 | (96 | ) | 2012 | 10/29/13 | 13 to 40 Years | ||||||||||||||||||||
| Walters, OK | (b) | 173 | 1,042 | — | — | 173 | 1,042 | 1,215 | (105 | ) | 2012 | 10/29/13 | 13 to 40 Years | ||||||||||||||||||||
| Western Grove, AR | (c) | 391 | 595 | — | — | 391 | 595 | 986 | (62 | ) | 2014 | 12/15/14 | 14 to 40 Years | ||||||||||||||||||||
| Wetumpka, AL | (b) | 303 | 784 | — | — | 303 | 784 | 1,087 | (87 | ) | 2011 | 09/17/13 | 12 to 40 Years | ||||||||||||||||||||
| Wilburton, OK | (c) | 522 | 887 | — | — | 522 | 887 | 1,409 | (73 | ) | 2014 | 12/15/14 | 14 to 40 Years | ||||||||||||||||||||
| Consumer Electronics | |||||||||||||||||||||||||||||||||
| Beaumont, TX | (b) | 778 | 9,297 | — | — | 778 | 9,297 | 10,075 | (1,780 | ) | 1971 | 07/17/13 | 3 to 25 Years | ||||||||||||||||||||
| Fayetteville, NC | (b) | 1,560 | 6,893 | — | — | 1,560 | 6,893 | 8,453 | (781 | ) | 1999 | 07/17/13 | 6 to 41 Years | ||||||||||||||||||||
| Great Falls, MT | (a) | 1,486 | 3,856 | (387 | ) | (1,447 | ) | 1,099 | 2,409 | 3,508 | — | 2004 | 07/01/05 | 13 to 40 Years | |||||||||||||||||||
| Greensboro, NC | (b) | 2,776 | 3,990 | — | — | 2,776 | 3,990 | 6,766 | (441 | ) | 2007 | 07/17/13 | 10 to 47 Years | ||||||||||||||||||||
| Grove City, OH | (b) | 2,050 | 3,288 | — | — | 2,050 | 3,288 | 5,338 | (429 | ) | 2008 | 07/17/13 | 9 to 38 Years | ||||||||||||||||||||
| Kansas City, KS | (c) | 1,932 | 5,629 | — | — | 1,932 | 5,629 | 7,561 | (646 | ) | 2009 | 07/17/13 | 6 to 43 Years | ||||||||||||||||||||
| Las Cruces, NM | (c) | 1,328 | 2,616 | — | — | 1,328 | 2,616 | 3,944 | (323 | ) | 2002 | 07/17/13 | 8 to 41 Years | ||||||||||||||||||||
| Mt Juliet, TN | (c) | 2,049 | 4,604 | — | — | 2,049 | 4,604 | 6,653 | (513 | ) | 2008 | 07/17/13 | 10 to 45 Years | ||||||||||||||||||||
| Roswell, NM | (a) | 1,002 | 3,177 | — | — | 1,002 | 3,177 | 4,179 | (849 | ) | 2004 | 07/01/05 | 14 to 50 Years | ||||||||||||||||||||
| Santa Clara, CA | (c) | 2,873 | 8,252 | — | — | 2,873 | 8,252 | 11,125 | (892 | ) | 2002 | 07/17/13 | 5 to 48 Years | ||||||||||||||||||||
| Wichita, KS | (c) | 3,368 | 6,312 | — | — | 3,368 | 6,312 | 9,680 | (1,046 | ) | 1984 | 07/17/13 | 7 to 29 Years | ||||||||||||||||||||
| Initial Cost to Company | Cost Capitalized Subsequent to Acquisition including impairment | Gross Amount at December 31, 2016 (d) | Life in which depreciation in latest Statement of Operations is computed | ||||||||||||||||||||||
| Description | Encumbrances (e) | Land and Improvements | Buildings and Improvements | Improvements/ Land | Improvements/ building | Land and Improvements | Buildings and Improvements | Total | Final Accum | Date of Construction | Date Acquired | ||||||||||||||
| Other | |||||||||||||||||||||||||||||||||||||||||||
| Bullhead City, NV | (a) | 147 | 489 | — | — | 147 | 489 | 636 | (19 | ) | 1970 | 09/30/13 | 15 to 50 Years | ||||||||||||||||||||||||||||||
| Chicago, IL | (a) | 186 | 1,780 | — | — | 186 | 1,780 | 1,966 | (44 | ) | 2007 | 09/30/13 | 50 to 50 Years | ||||||||||||||||||||||||||||||
| Corpus Christi, TX | (b) | 1,790 | 1,267 | — | — | 1,790 | 1,267 | 3,057 | (29 | ) | 2014 | 09/30/14 | 11 to 30 Years | ||||||||||||||||||||||||||||||
| Gillette, WY | (b) | 1,520 | 4,561 | — | — | 1,520 | 4,561 | 6,081 | — | 2001 | 12/30/14 | 15 to 40 Years | |||||||||||||||||||||||||||||||
| Henderson, CO | (b) | 3,240 | 5,720 | — | — | 3,240 | 5,720 | 8,960 | — | 1977 | 12/30/14 | 15 to 50 Years | |||||||||||||||||||||||||||||||
| Jenison, MI | (b) | 1,111 | 2,207 | — | — | 1,111 | 2,207 | 3,318 | (307 | ) | 1993 | 07/17/13 | 3 to 22 Years | ||||||||||||||||||||||||||||||
| Kings Mountain, NC | (b) | 1,774 | 5,902 | — | — | 1,774 | 5,902 | 7,676 | (357 | ) | 2007 | 07/17/13 | 4 to 52 Years | ||||||||||||||||||||||||||||||
| Las Vegas, NV | (a) | 430 | 3,589 | — | — | 430 | 3,589 | 4,019 | (102 | ) | 2002 | 09/30/13 | 15 to 50 Years | ||||||||||||||||||||||||||||||
| Mesa, AZ | (a) | 372 | 1,398 | — | — | 372 | 1,398 | 1,770 | (42 | ) | 2003 | 09/30/13 | 15 to 50 Years | ||||||||||||||||||||||||||||||
| Phoenix, AZ | (a) | 352 | 2,435 | — | — | 352 | 2,435 | 2,787 | (66 | ) | 1973 | 09/30/13 | 15 to 50 Years | ||||||||||||||||||||||||||||||
| $ | 795,107 | $ | 2,625,950 | $ | 4,558,426 | $ | (11,320 | ) | $ | 20,740 | $ | 2,614,630 | $ | 4,579,166 | $ | 7,193,796 | $ | (752,210 | ) | ||||||||||||||||||||||||
| Pet Supplies and Service | |||||||||||||||||||||||||||||||||
| Chattanooga, TN | (b) | 1,689 | 2,837 | — | — | 1,689 | 2,837 | 4,526 | (343 | ) | 1996 | 07/17/13 | 8 to 40 Years | ||||||||||||||||||||
| Daytona Beach, FL | (b) | 775 | 3,880 | — | — | 775 | 3,880 | 4,655 | (400 | ) | 1996 | 07/17/13 | 8 to 42 Years | ||||||||||||||||||||
| Fredericksburg, VA | (b) | 1,783 | 3,491 | — | — | 1,783 | 3,491 | 5,274 | (396 | ) | 1997 | 07/17/13 | 8 to 44 Years | ||||||||||||||||||||
| McCarran, NV | (c) | 8,333 | 37,763 | — | — | 8,333 | 37,763 | 46,096 | (5,042 | ) | 2008 | 07/17/13 | 8 to 40 Years | ||||||||||||||||||||
| Wholesale Clubs | |||||||||||||||||||||||||||||||||
| Ft Lauderdale, FL | (c) | 6,775 | 18,649 | — | — | 6,775 | 18,649 | 25,424 | (2,221 | ) | 2007 | 07/17/13 | 12 to 37 Years | ||||||||||||||||||||
| Haverhill, MA | (c) | 3,192 | 15,353 | — | — | 3,192 | 15,353 | 18,545 | (2,112 | ) | 2007 | 07/17/13 | 11 to 32 Years | ||||||||||||||||||||
| St. Croix, VI | (c) | 2,132 | 5,992 | — | — | 2,132 | 5,992 | 8,124 | (775 | ) | 2005 | 07/17/13 | 8 to 37 Years | ||||||||||||||||||||
| Woodstock, GA | (b) | 4,383 | 16,588 | — | — | 4,383 | 16,588 | 20,971 | (2,333 | ) | 2001 | 07/17/13 | 8 to 33 Years | ||||||||||||||||||||
| Office Supplies | |||||||||||||||||||||||||||||||||
| Alcoa, TN | (c) | 918 | 3,170 | — | — | 918 | 3,170 | 4,088 | (350 | ) | 1999 | 07/17/13 | 8 to 40 Years | ||||||||||||||||||||
| Angola, IN | (c) | 431 | 2,488 | (301 | ) | (1,668 | ) | 130 | 820 | 950 | — | 2000 | 07/17/13 | 1 to 44 Years | |||||||||||||||||||
| Balcones Heights, TX | (b) | 1,888 | 2,117 | — | — | 1,888 | 2,117 | 4,005 | (254 | ) | 2009 | 07/17/13 | 11 to 46 Years | ||||||||||||||||||||
| Benton, AR | (c) | 1,236 | 1,926 | — | — | 1,236 | 1,926 | 3,162 | (260 | ) | 2001 | 07/17/13 | 3 to 38 Years | ||||||||||||||||||||
| Clarksville, IN | (c) | 991 | 3,161 | — | — | 991 | 3,161 | 4,152 | (303 | ) | 2006 | 07/17/13 | 3 to 48 Years | ||||||||||||||||||||
| Crossville, TN | (c) | 668 | 2,705 | — | — | 668 | 2,705 | 3,373 | (288 | ) | 2001 | 07/17/13 | 3 to 46 Years | ||||||||||||||||||||
| Dayton, OH | (c) | 710 | 2,417 | — | — | 710 | 2,417 | 3,127 | (256 | ) | 2005 | 07/17/13 | 8 to 47 Years | ||||||||||||||||||||
| Enterprise, AL | (c) | 675 | 2,239 | — | — | 675 | 2,239 | 2,914 | (258 | ) | 2006 | 07/17/13 | 8 to 43 Years | ||||||||||||||||||||
| Greenville, MS | (c) | 583 | 2,315 | — | — | 583 | 2,315 | 2,898 | (288 | ) | 2000 | 07/17/13 | 1 to 35 Years | ||||||||||||||||||||
| Greenville, SC | (b) | 742 | 3,026 | — | — | 742 | 3,026 | 3,768 | (269 | ) | 2006 | 07/17/13 | 3 to 48 Years | ||||||||||||||||||||
| Guntersville, AL | (c) | 1,039 | 2,535 | — | — | 1,039 | 2,535 | 3,574 | (268 | ) | 2001 | 07/17/13 | 2 to 46 Years | ||||||||||||||||||||
| Laurel, MS | (c) | 401 | 2,164 | — | — | 401 | 2,164 | 2,565 | (272 | ) | 2002 | 07/17/13 | 3 to 35 Years | ||||||||||||||||||||
| London, KY | (c) | 1,398 | 2,061 | — | — | 1,398 | 2,061 | 3,459 | (248 | ) | 2001 | 07/17/13 | 3 to 46 Years | ||||||||||||||||||||
| Moraine, OH | (c) | 781 | 2,649 | (533 | ) | (1,797 | ) | 248 | 852 | 1,100 | — | 2006 | 07/17/13 | 2 to 43 Years | |||||||||||||||||||
| Morrisville, NC | (c) | 408 | 2,732 | — | — | 408 | 2,732 | 3,140 | (274 | ) | 2008 | 07/17/13 | 11 to 47 Years | ||||||||||||||||||||
| Orangeburg, SC | (c) | 621 | 2,208 | — | — | 621 | 2,208 | 2,829 | (239 | ) | 1999 | 07/17/13 | 12 to 45 Years | ||||||||||||||||||||
| Oxford, MS | (c) | 1,625 | 1,024 | — | — | 1,625 | 1,024 | 2,649 | (190 | ) | 2006 | 07/17/13 | 9 to 33 Years | ||||||||||||||||||||
| Peru, IL | (c) | 963 | 2,033 | — | — | 963 | 2,033 | 2,996 | (292 | ) | 1998 | 07/17/13 | 1 to 35 Years | ||||||||||||||||||||
| Warrensburg, MO | (c) | 651 | 2,261 | (460 | ) | (1,571 | ) | 191 | 690 | 881 | — | 2001 | 07/17/13 | 3 to 38 Years | |||||||||||||||||||
| Warsaw, IN | (b) | 590 | 2,504 | — | — | 590 | 2,504 | 3,094 | (280 | ) | 1998 | 07/17/13 | 11 to 44 Years | ||||||||||||||||||||
| Financial Services | |||||||||||||||||||||||||||||||||
| Columbia, SC | (c) | 2,095 | 16,191 | (627 | ) | (1,136 | ) | 1,468 | 15,055 | 16,523 | (6,596 | ) | 1988 | 09/09/05 | 5 to 29 Years | ||||||||||||||||||
| Cross Plains, WI | (c) | 1,118 | 1,479 | (271 | ) | (338 | ) | 847 | 1,141 | 1,988 | — | 1988 | 07/17/13 | 1 to 22 Years | |||||||||||||||||||
| Delray Beach, FL | (b) | 3,831 | 16,789 | — | — | 3,831 | 16,789 | 20,620 | (1,428 | ) | 1975 | 07/17/13 | 8 to 50 Years | ||||||||||||||||||||
| Kennesaw, GA | (c) | 3,560 | 23,583 | — | — | 3,560 | 23,583 | 27,143 | (2,287 | ) | 1996 | 07/17/13 | 8 to 45 Years | ||||||||||||||||||||
| Yuma, AZ | (b) | 2,583 | 5,221 | — | — | 2,583 | 5,221 | 7,804 | (789 | ) | 2007 | 07/17/13 | 4 to 46 Years | ||||||||||||||||||||
| Other | |||||||||||||||||||||||||||||||||||||||||
| Gillette, WY | (c) | 1,520 | 4,561 | — | — | 1,520 | 4,561 | 6,081 | (368 | ) | 2001 | 12/30/14 | 15 to 40 Years | ||||||||||||||||||||||||||||
| Initial Cost to Company | Cost Capitalized Subsequent to Acquisition including impairment | Gross Amount at December 31, 2016 (d) | Life in which depreciation in latest Statement of Operations is computed | ||||||||||||||||||||||
| Description | Encumbrances (e) | Land and Improvements | Buildings and Improvements | Improvements/ Land | Improvements/ building | Land and Improvements | Buildings and Improvements | Total | Final Accum | Date of Construction | Date Acquired | ||||||||||||||
| Henderson, CO | (c) | 3,240 | 5,720 | — | — | 3,240 | 5,720 | 8,960 | (425 | ) | 1977 | 12/30/14 | 15 to 50 Years | ||||||||||||||||||||||||||||
| $ | 2,730,491 | $ | 4,784,889 | $ | (26,481 | ) | $ | (9,668 | ) | $ | 2,704,010 | $ | 4,775,221 | $ | 7,479,231 | $ | (940,005 | ) | |||||||||||||||||||||||
| (a) | Represents properties collateralized with Master Trust Debt of | ||||||||||||||||||||||||
| (b) | Represents properties collateralized with | ||||||||||||||||||||||||
| (c) | |||||||||||||||||||||||||
| Represents unencumbered Properties. | |||||||||||||||||||||||||
| (e) | As of December 31, 2016 certain direct finance lease and held for sale properties had fixed CMBS encumbrances of $13,508 and are not included in the table above. | ||||||||||||||||||||||||
| (f) | Represents Land only properties with no depreciation and therefore date | ||||||||||||||||||||||||
| 2014 | 2013 | 2012 | 2016 | 2015 | 2014 | |||||||||||||||||
| Land, buildings, and improvements | ||||||||||||||||||||||
| Balance at the beginning of the year | $ | 6,519,293 | $ | 3,365,424 | $ | 3,272,728 | $ | 7,527,369 | $ | 7,193,796 | $ | 6,519,293 | ||||||||||
| Additions: | ||||||||||||||||||||||
| Acquisitions - Cole/Merger | — | 3,148,943 | — | — | — | — | ||||||||||||||||
| Acquisitions/capital expenditures/other additions - non-merger | 936,916 | 402,519 | 159,112 | 691,332 | 873,344 | 936,916 | ||||||||||||||||
| Deductions: | ||||||||||||||||||||||
| Dispositions of land, buildings, and improvements | (99,798 | ) | (371,960 | ) | (49,201 | ) | (508,961 | ) | (405,437 | ) | (99,798 | ) | ||||||||||
| Held for sale | (123,776 | ) | (19,611 | ) | (6,433 | ) | (150,529 | ) | (74,638 | ) | (123,776 | ) | ||||||||||
| Impairment | (38,839 | ) | (6,022 | ) | (10,782 | ) | (79,980 | ) | (59,696 | ) | (38,839 | ) | ||||||||||
| Gross Real Estate Balance at close of the year | $ | 7,193,796 | $ | 6,519,293 | $ | 3,365,424 | $ | 7,479,231 | $ | 7,527,369 | $ | 7,193,796 | ||||||||||
| Accumulated depreciation and amortization | ||||||||||||||||||||||
| Balance at the beginning of the year | $ | (590,067 | ) | $ | (490,938 | ) | $ | (405,426 | ) | $ | (860,954 | ) | $ | (752,210 | ) | $ | (590,067 | ) | ||||
| Additions: | ||||||||||||||||||||||
| Depreciation expense | (194,382 | ) | (130,285 | ) | (94,020 | ) | (221,993 | ) | (210,395 | ) | (194,382 | ) | ||||||||||
| Deductions: | ||||||||||||||||||||||
| Dispositions of land, buildings, and improvements | 13,528 | 26,335 | 7,414 | 127,787 | 80,965 | 13,528 | ||||||||||||||||
| Held for sale | 18,711 | 4,821 | 1,094 | 15,155 | 20,686 | 18,711 | ||||||||||||||||
| Balance at close of the year | (752,210 | ) | (590,067 | ) | (490,938 | ) | (940,005 | ) | (860,954 | ) | (752,210 | ) | ||||||||||
| Net Real Estate Investment | $ | 6,441,586 | $ | 5,929,226 | $ | 2,874,486 | $ | 6,539,226 | $ | 6,666,415 | $ | 6,441,586 | ||||||||||
| Mortgage | Stated Interest Rate | Final Maturity Date (1) | Periodic Payment Terms | Face Amount | Carrying Amount of Mortgages (4) | ||||||||||
| Automotive parts and service <3% | 8.60% - 9.35% | 1/1/2021 | 3/1/2021 | Principal & Interest (2) | $ | 30,588 | $ | 26,825 | |||||||
| Restaurants <3% | 9.00% - 10.47% | 10/31/2017 | 7/1/2028 | Principal & Interest (3) | 81,453 | 82,221 | |||||||||
| $ | 112,041 | $ | 109,046 | ||||||||||||
(1) Reflects current maturity of the investment and does not consider any options to extend beyond the current maturity | |||||||||||||||
(2) Balloon payments of $11.9 million at maturity | |||||||||||||||
(3) Balloon payments of $38.5 million at maturity | |||||||||||||||
(4) Carrying amount of restaurant and automotive parts and services mortgages acquired in the Cole II Merger include calculated premium balances which resulted in the aggregate carrying amounts of mortgages in excess of the initial recorded face amounts. | |||||||||||||||
| 2014 | 2013 | 2012 | |||||||||
| Reconciliation of Mortgage Loans on Real Estate | |||||||||||
| Balance January 1, | $ | 117,291 | $ | 44,916 | $ | 54,644 | |||||
| Additions during period | |||||||||||
| Mortgage loans acquired in Merger Transaction | — | 66,238 | — | ||||||||
| Premium on mortgage loans acquired in Merger | — | 15,195 | — | ||||||||
| New mortgage loans | — | 650 | — | ||||||||
| Other capitalized loan origination costs | — | — | — | ||||||||
| Deductions during period | |||||||||||
| Collections of principal | (5,720 | ) | (4,499 | ) | (9,529 | ) | |||||
| Sales | — | — | — | ||||||||
| Foreclosures | — | (3,863 | ) | — | |||||||
| Amortization of premium | (2,525 | ) | (1,334 | ) | (176 | ) | |||||
| Amortization of capitalized loan origination costs | — | (12 | ) | (23 | ) | ||||||
| Mortgage loans receivable December 31, | 109,046 | 117,291 | 44,916 | ||||||||
| Mortgage loan loss provisions | — | — | (4,840 | ) | |||||||
| 109,046 | 117,291 | 40,076 | |||||||||
| Equipment and other loans receivable | 379 | 430 | 12,043 | ||||||||
| Provision for other loan loss | — | — | (257 | ) | |||||||
| 379 | 430 | 11,786 | |||||||||
| Total loans receivable | $ | 109,425 | $ | 117,721 | $ | 51,862 | |||||
| Mortgage | Stated Interest Rate | Final Maturity Date (1) | Periodic Payment Terms | Face Amount | Carrying Amount of Mortgages | |||||||||||
| Automotive parts and service <3% | 8.60% - 9.35% | 1/1/2021 | 1/1/2021 | Principal & Interest (2) | $ | 10,588 | $ | 9,436 | ||||||||
| Restaurants <3% | 9.55% - 10.47% | 8/1/2020 | 7/1/2028 | Principal & Interest (3) | 58,296 | 53,168 | ||||||||||
| $ | 68,884 | $ | 62,604 | |||||||||||||
(1) Reflects current maturity of the investment and does not consider any options to extend beyond the current maturity | ||||||||||||||||
(2) Balloon payments of $5.1 million at maturity | ||||||||||||||||
(3) Balloon payments of $29.1 million at maturity | ||||||||||||||||
| 2016 | 2015 | 2014 | |||||||||
| Reconciliation of Mortgage Loans on Real Estate | |||||||||||
| Balance January 1, | $ | 100,082 | $ | 109,046 | $ | 117,291 | |||||
| Additions during period | |||||||||||
| Mortgage loans acquired in Merger Transaction | — | — | — | ||||||||
| Premium on mortgage loans acquired in Merger | — | — | — | ||||||||
| New mortgage loans | — | — | — | ||||||||
| Deductions during period | |||||||||||
| Collections of principal (inclusive of loans receivable exchanged for real estate acquired) | (34,686 | ) | (6,497 | ) | (5,720 | ) | |||||
| Foreclosures | — | — | — | ||||||||
| Amortization of premium | (2,792 | ) | (2,466 | ) | (2,525 | ) | |||||
| Amortization of capitalized loan origination costs | — | (1 | ) | — | |||||||
| Mortgage loans receivable December 31, | 62,604 | 100,082 | 109,046 | ||||||||
| Equipment and other loans receivable | 4,474 | 4,245 | 379 | ||||||||
| Provision for other loan loss | (500 | ) | (324 | ) | — | ||||||
| 3,974 | 3,921 | 379 | |||||||||
| Total loans receivable | $ | 66,578 | $ | 104,003 | $ | 109,425 | |||||
SPIRIT REALTY CAPITAL, INC. (Registrant) | ||
| By: | /s/ | |
| Name: | ||
| Title: | Chief | |
| Name | Title | Date |
| /s/ Thomas H. Nolan, Jr. | Chairman of the Board of Directors and Chief Executive Officer | February |
| /s/ | Chief Financial Officer, Executive Vice President and Treasurer | February |
| /s/ Prakash J. Parag | Chief Accounting Officer and Senior Vice President (Principal Accounting Officer) | February 23, 2017 |
| /s/ Kevin M. Charlton | Director | February |
| /s/ Todd A. Dunn | Director | February |
| /s/ David J. Gilbert | Director | February |
| /s/ Richard I. Gilchrist | Director | February |
| /s/ Diane M. Morefield | Director | February |
| /s/ Sheli Z. Rosenberg | Director | February |
| /s/ Thomas D. Senkbeil | Director | February |
| /s/ Nicholas P. Shepherd | Director | February |
SPIRIT REALTY, L.P. (Registrant) | ||
| By: | Spirit Realty Capital, Inc., in its capacity as sole member of Spirit General Holdings, LLC, as sole general partner and on behalf of Spirit Realty, L.P. | |
| By: | /s/ Prakash J. Parag | |
| Name: | Prakash J. Parag | |
| Title: | Chief Accounting Officer and Senior Vice President (Principal Accounting Officer) | |
| Name | Title | Date |
| /s/ Thomas H. Nolan, Jr. | Chairman of the Board of Directors and Chief Executive Officer (Principal Executive Officer) | February 23, 2017 |
| /s/ Phillip D. Joseph, Jr. | Chief Financial Officer, Executive Vice President and Treasurer (Principal Financial Officer) | February 23, 2017 |
| /s/ Prakash J. Parag | Chief Accounting Officer and Senior Vice President (Principal Accounting Officer) | February 23, 2017 |
| /s/ Kevin M. Charlton | Director | February 23, 2017 |
| /s/ Todd A. Dunn | Director | February 23, 2017 |
| /s/ David J. Gilbert | Director | February 23, 2017 |
| /s/ Richard I. Gilchrist | Director | February 23, 2017 |
| /s/ Diane M. Morefield | Director | February 23, 2017 |
| /s/ Sheli Z. Rosenberg | Director | February 23, 2017 |
| /s/ Thomas D. Senkbeil | Director | February 23, 2017 |
| /s/ Nicholas P. Shepherd | Director | February 23, 2017 |